


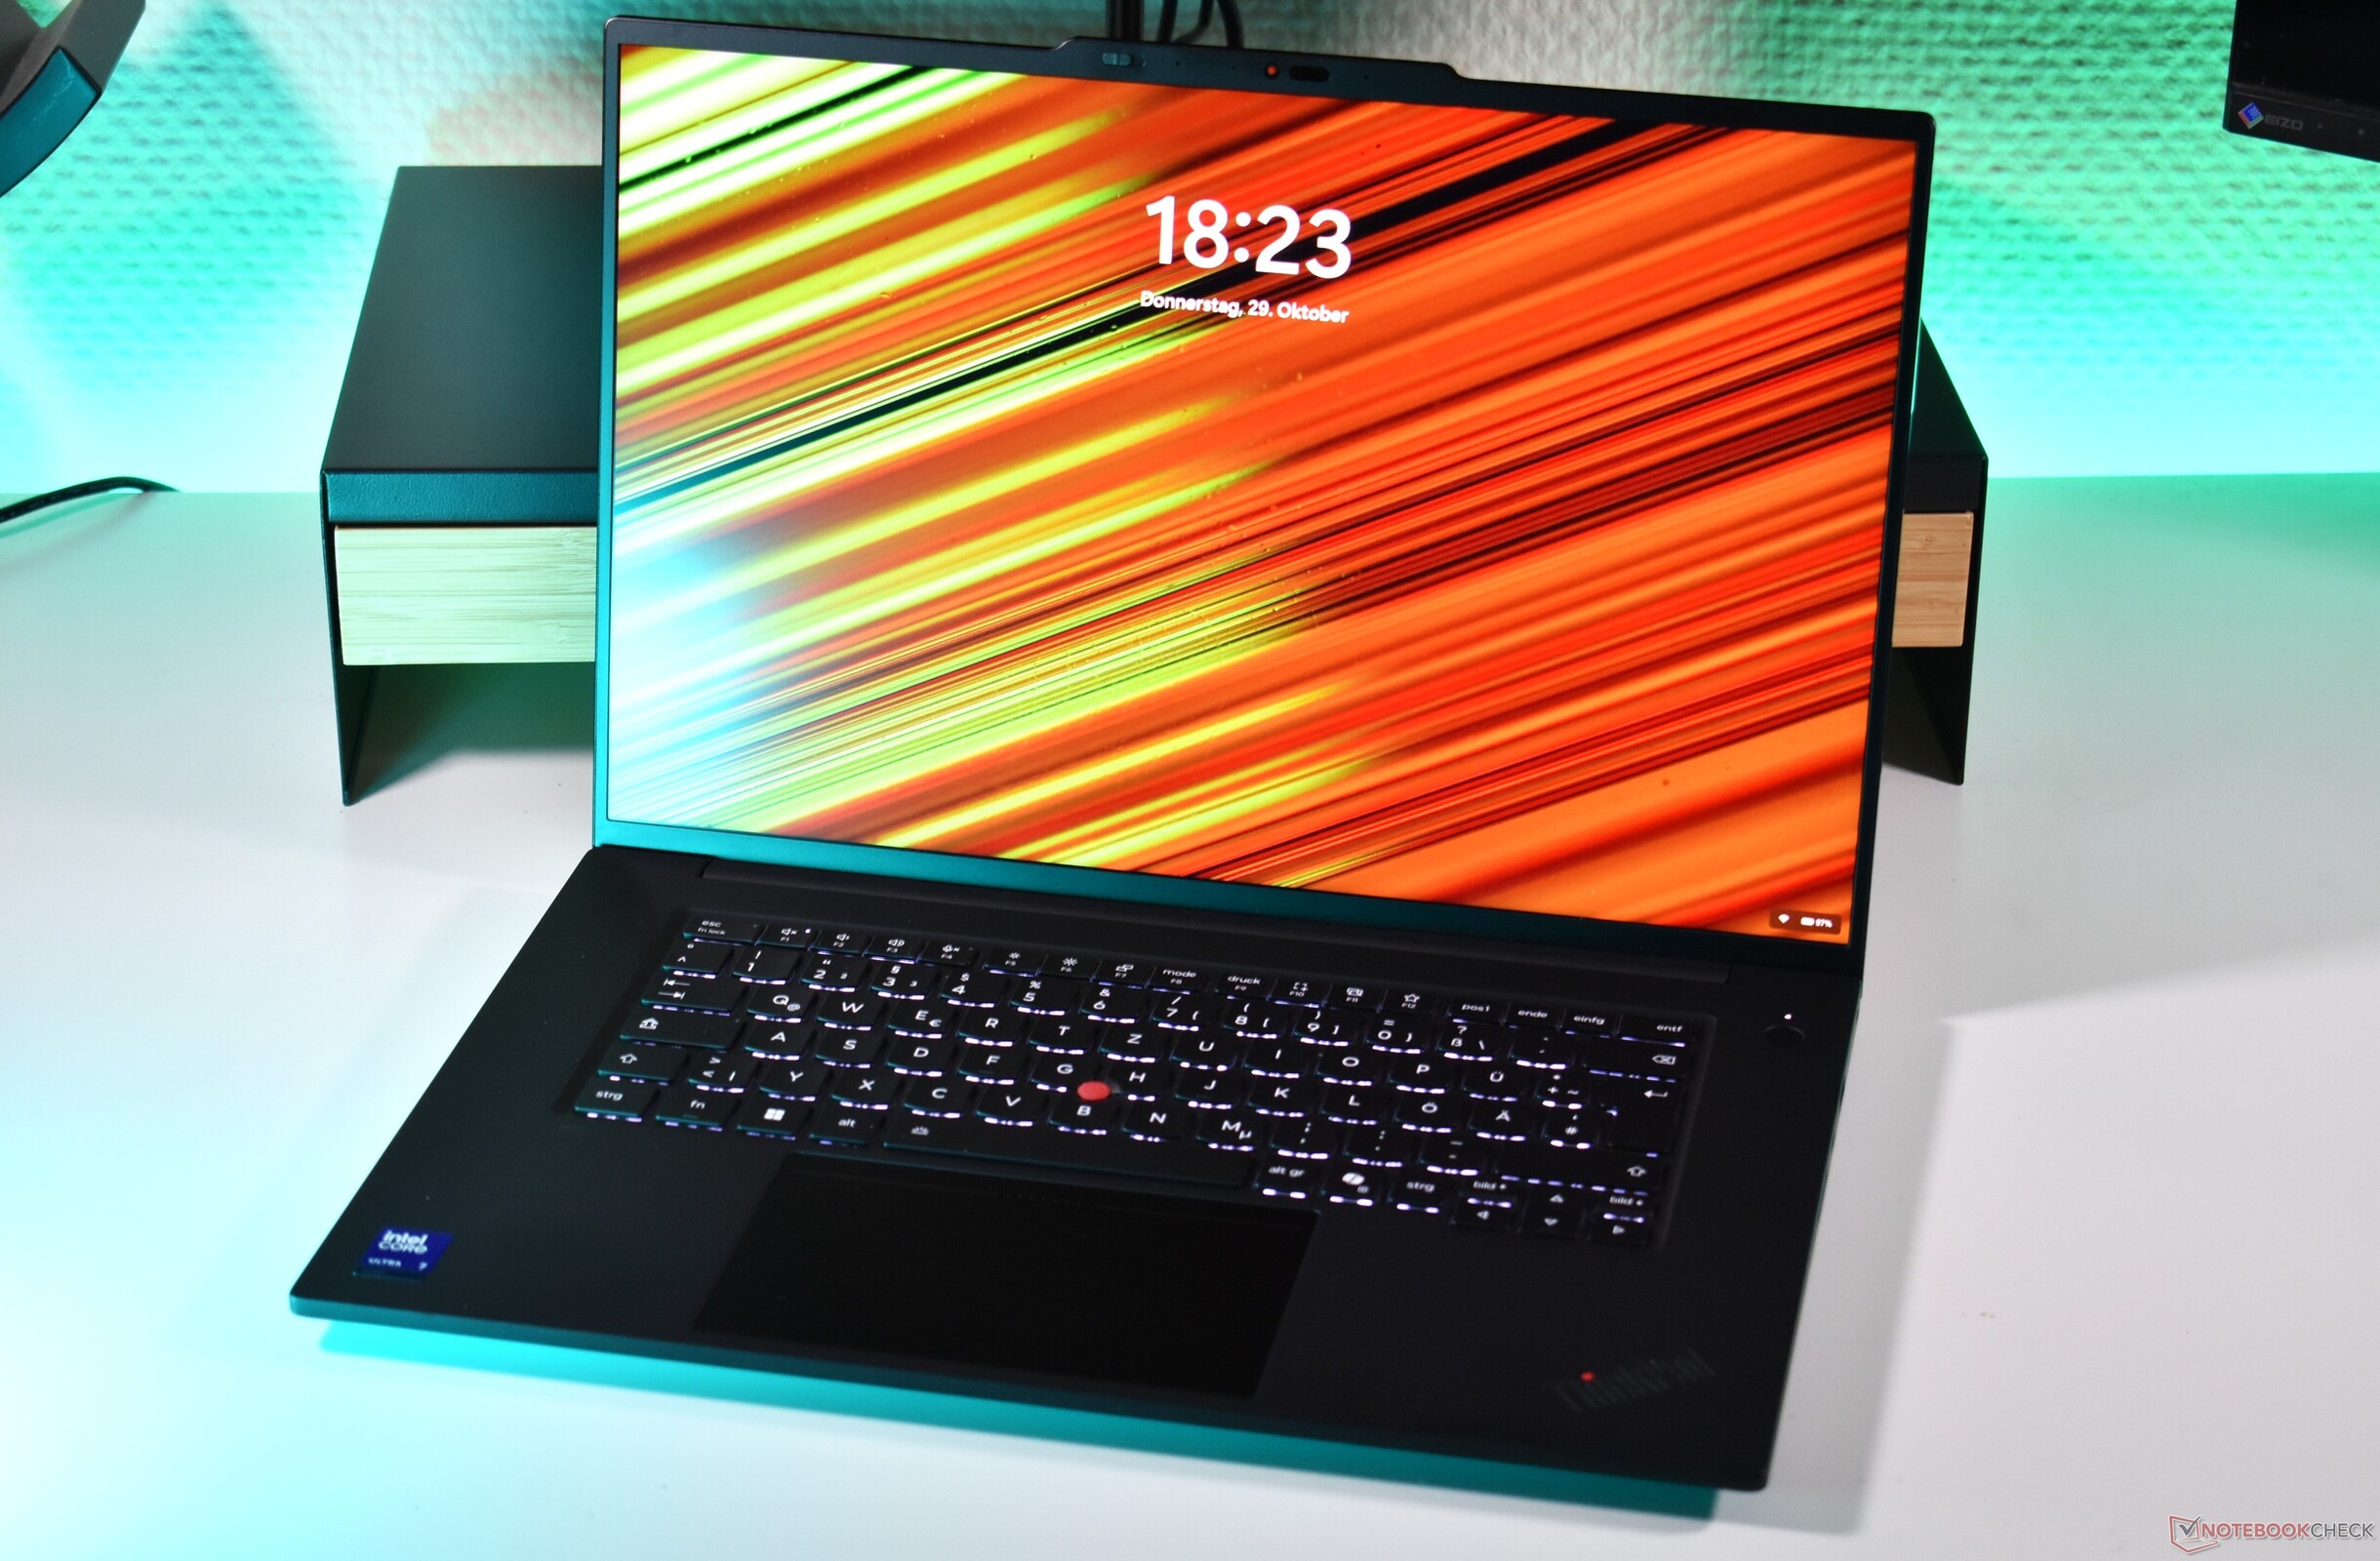
Verdict: 22 hrs battery life is extraordinary for the ThinkPad P1
Battery life has always been a sticky topic for the Lenovo ThinkPad P1 line, Lenovo's premium thin and light workstation laptop. This laptop series always used powerful Intel H class processors, as well as dedicated Nvidia GPUs, both of which guaranteed great performance - but also pretty poor battery life. Despite featuring big batteries, the older ThinkPad P1 models always achieved between five and ten hours of battery life in our Wi-Fi/websurfing (150 cd/m²). Not so the new Lenovo ThinkPad P1 Gen 9: With a Panther Lake H class CPU and Nvidia RTX Pro 2000 Blackwell, it still eked out over 22 hours of battery life - truly all day battery endurance.
This makes this new ThinkPad P1 Gen 9 the most versatile version of the P1 series yet. It still offers very strong performance, an extremely high quality chassis, best in class input devices, as well as a great port selection, upgradeability and connectivity - even 5G is finally optionally available again. There is little to fault here - the heat output on the chassis is a bit too high under load, and the keyboard should be user repairable. Also, it remains to be seen if the battery life is truly great even with the more high-res screens. The basic WUXGA of our review unit surely helped to increase the battery life.
Pros
Cons
Price and Availability
At the time of this review, the Lenovo ThinkPad P1 Gen 9 starts at around $3,200 in the US. As tested, the ThinkPad P1 costs roughly $5,100 at lenovo.com.
Specifications
Case, Connectivity and Input Devices

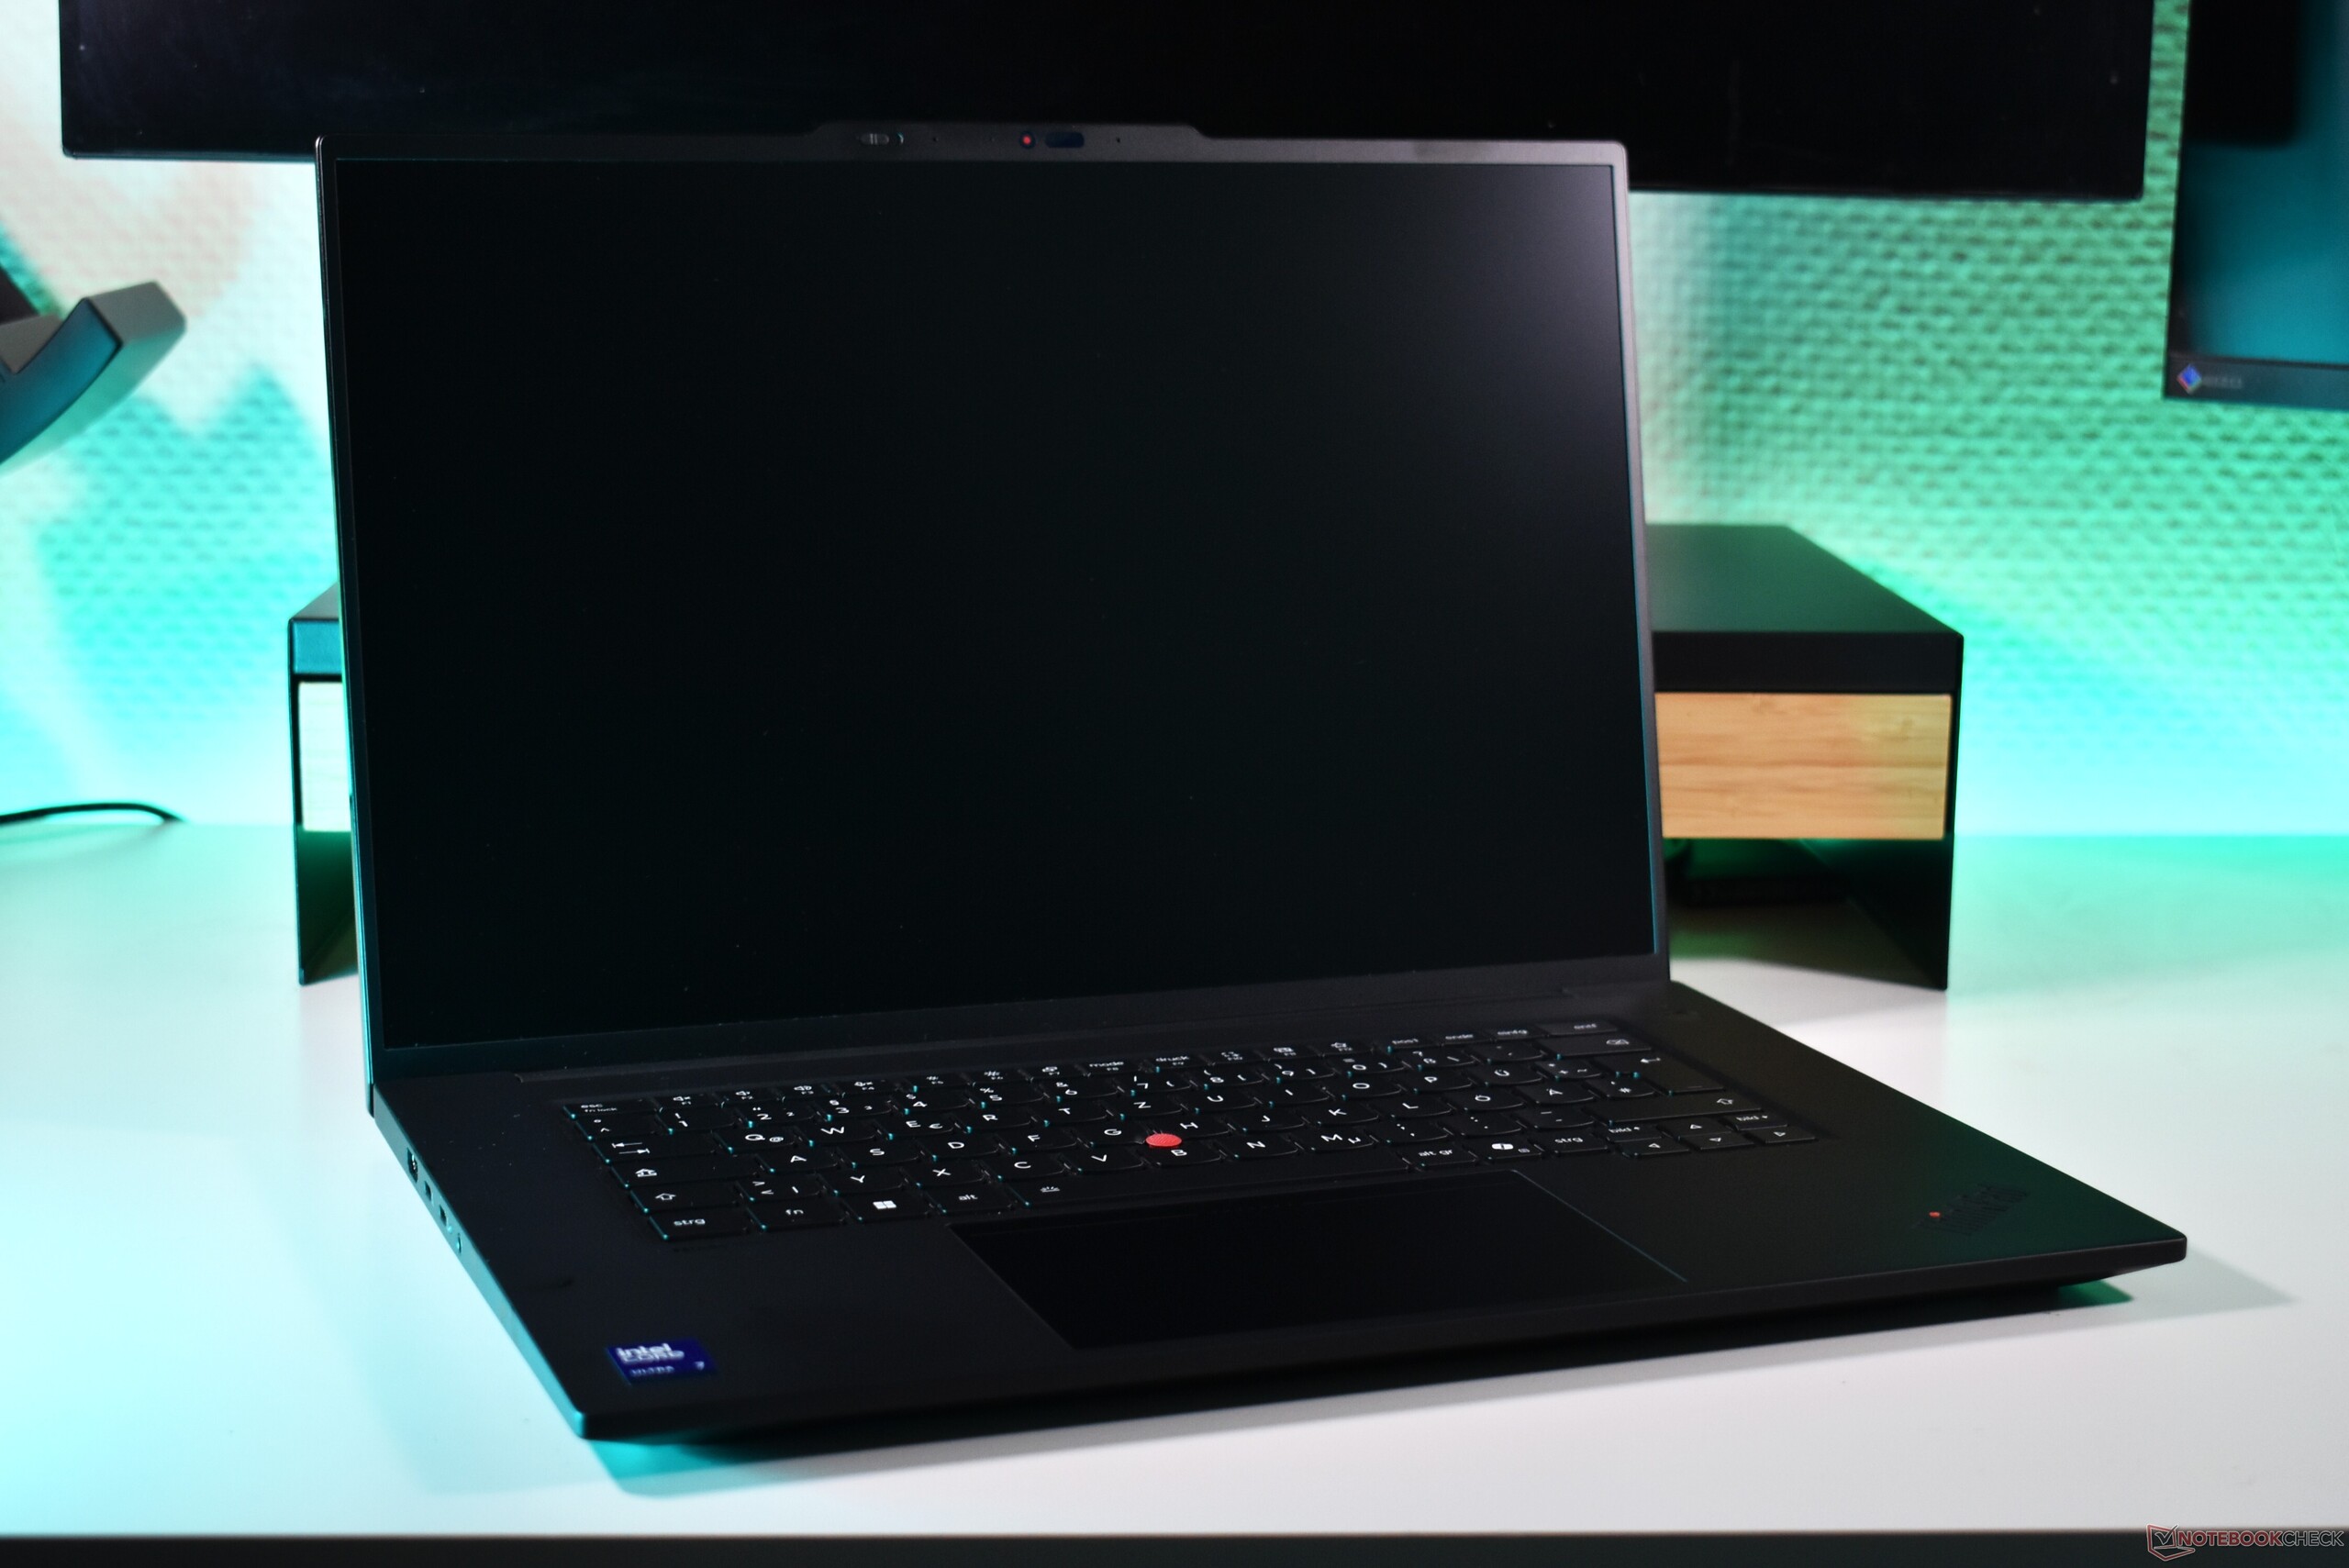
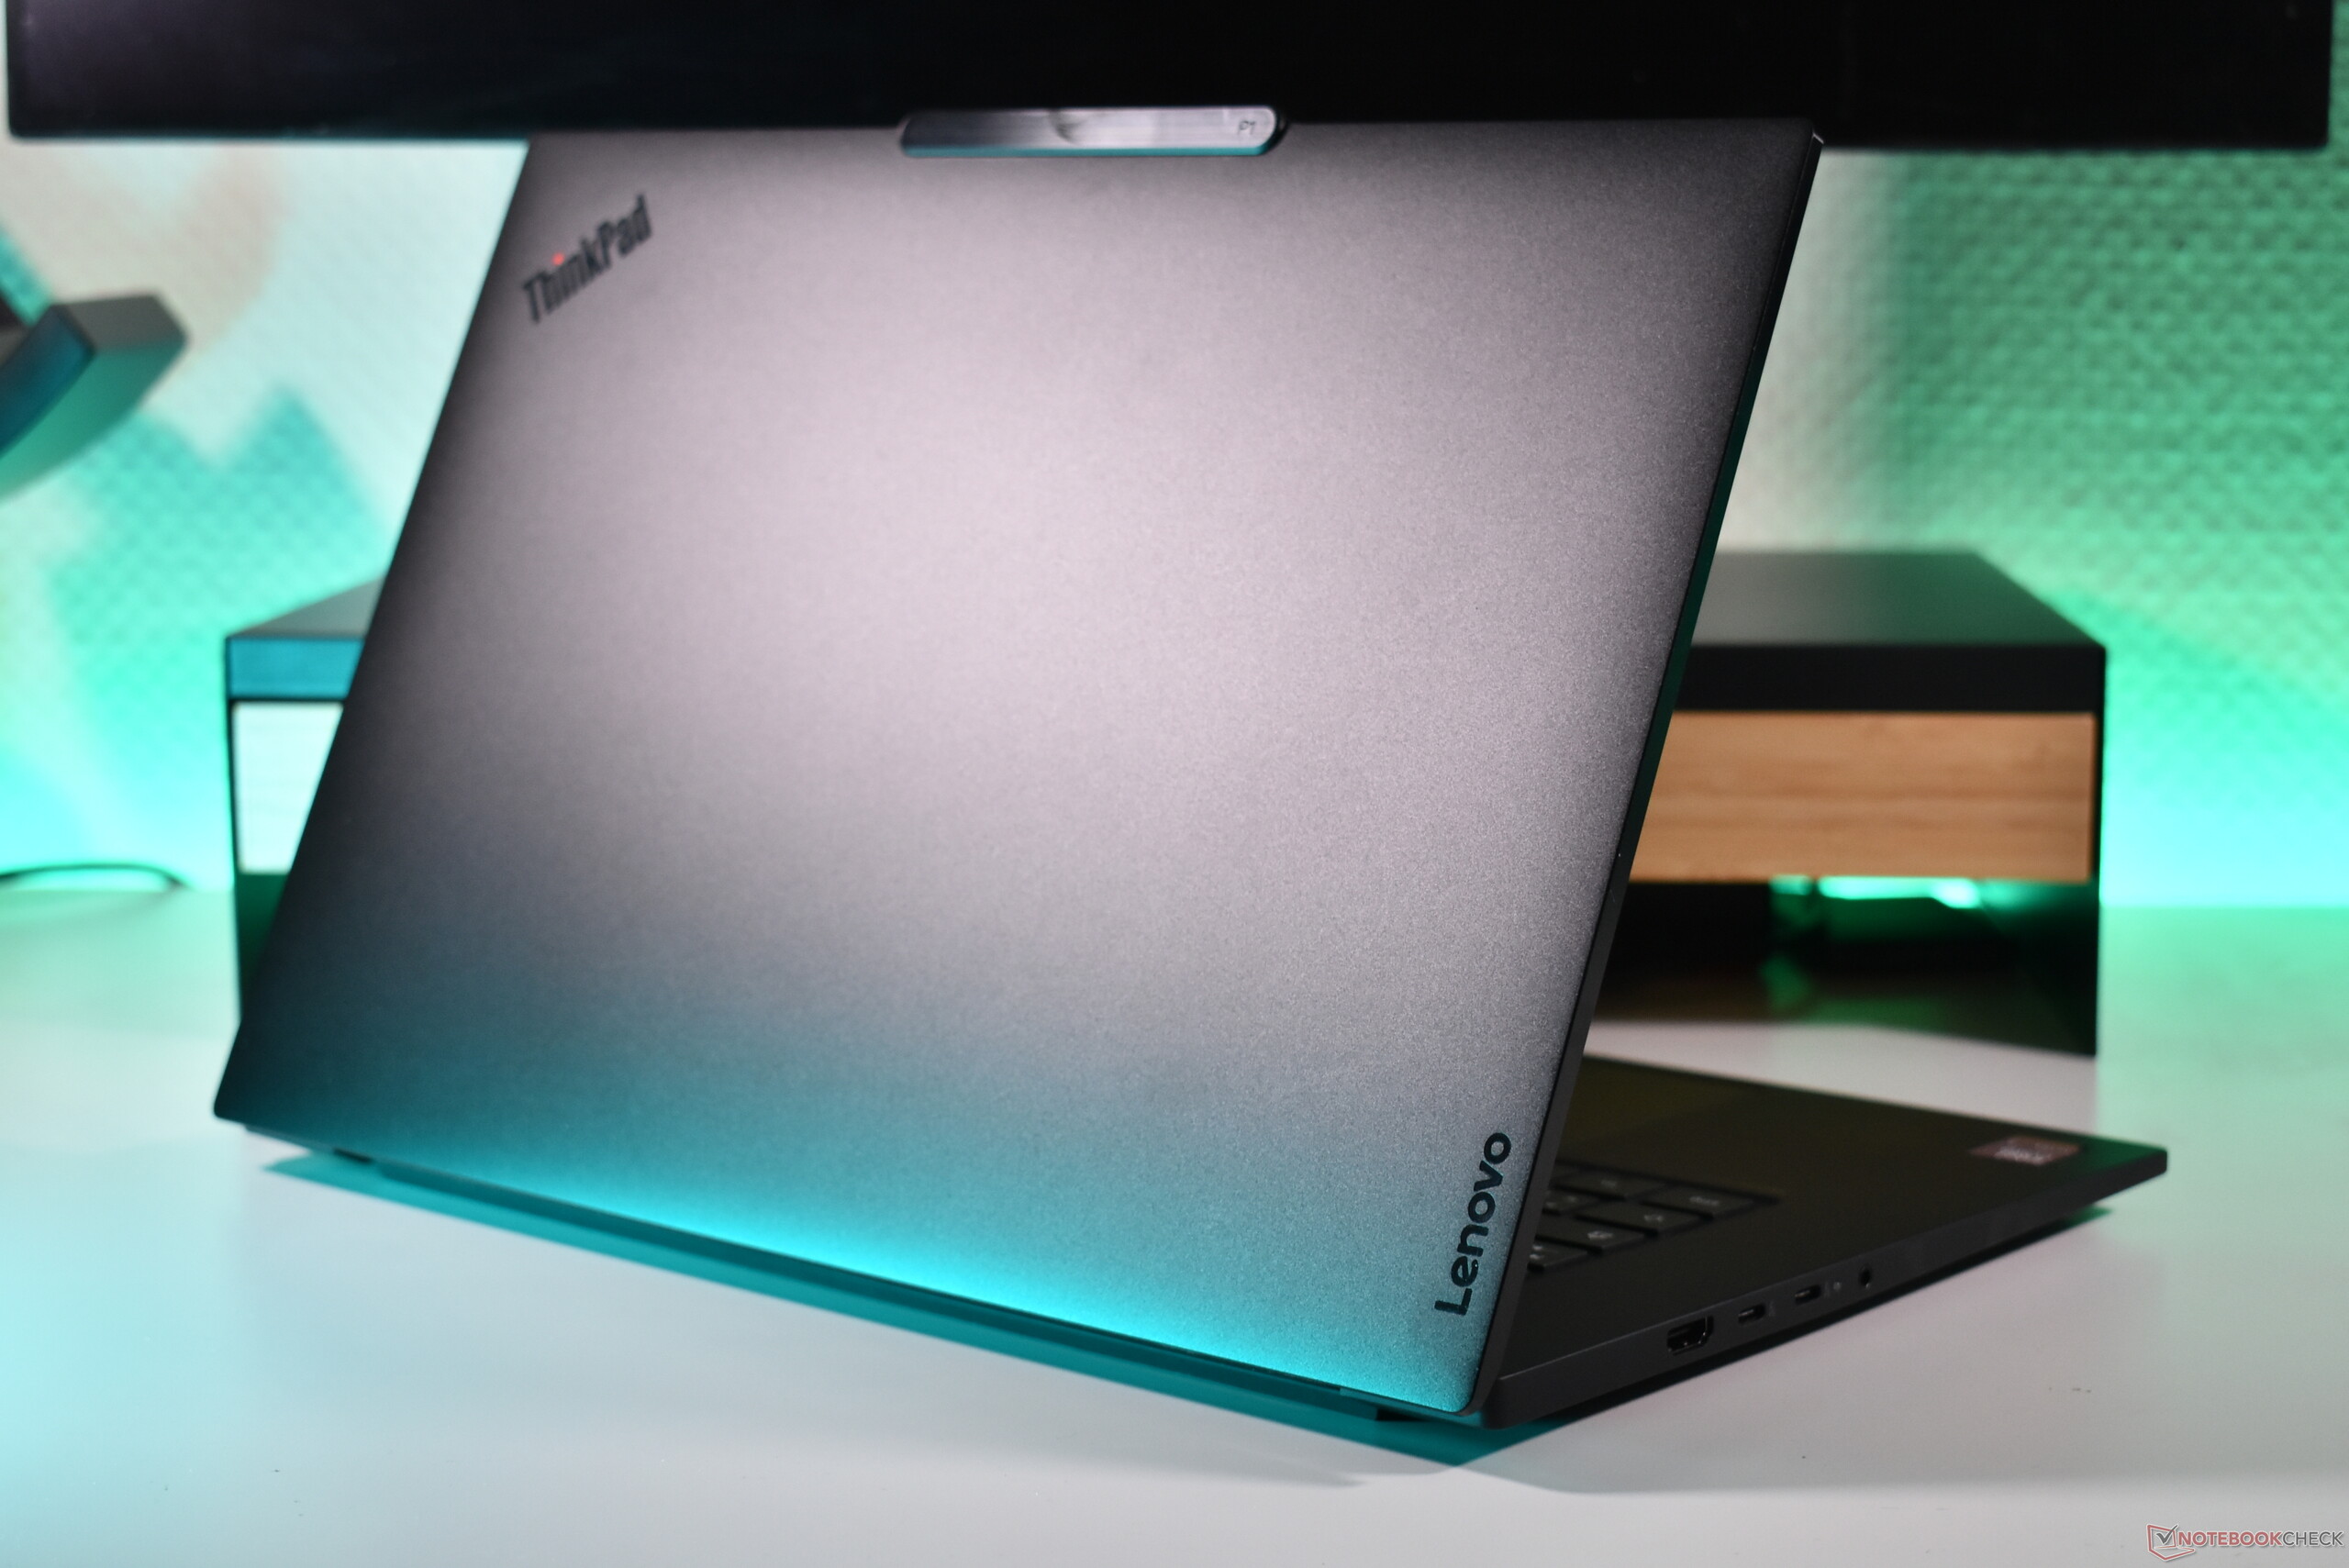
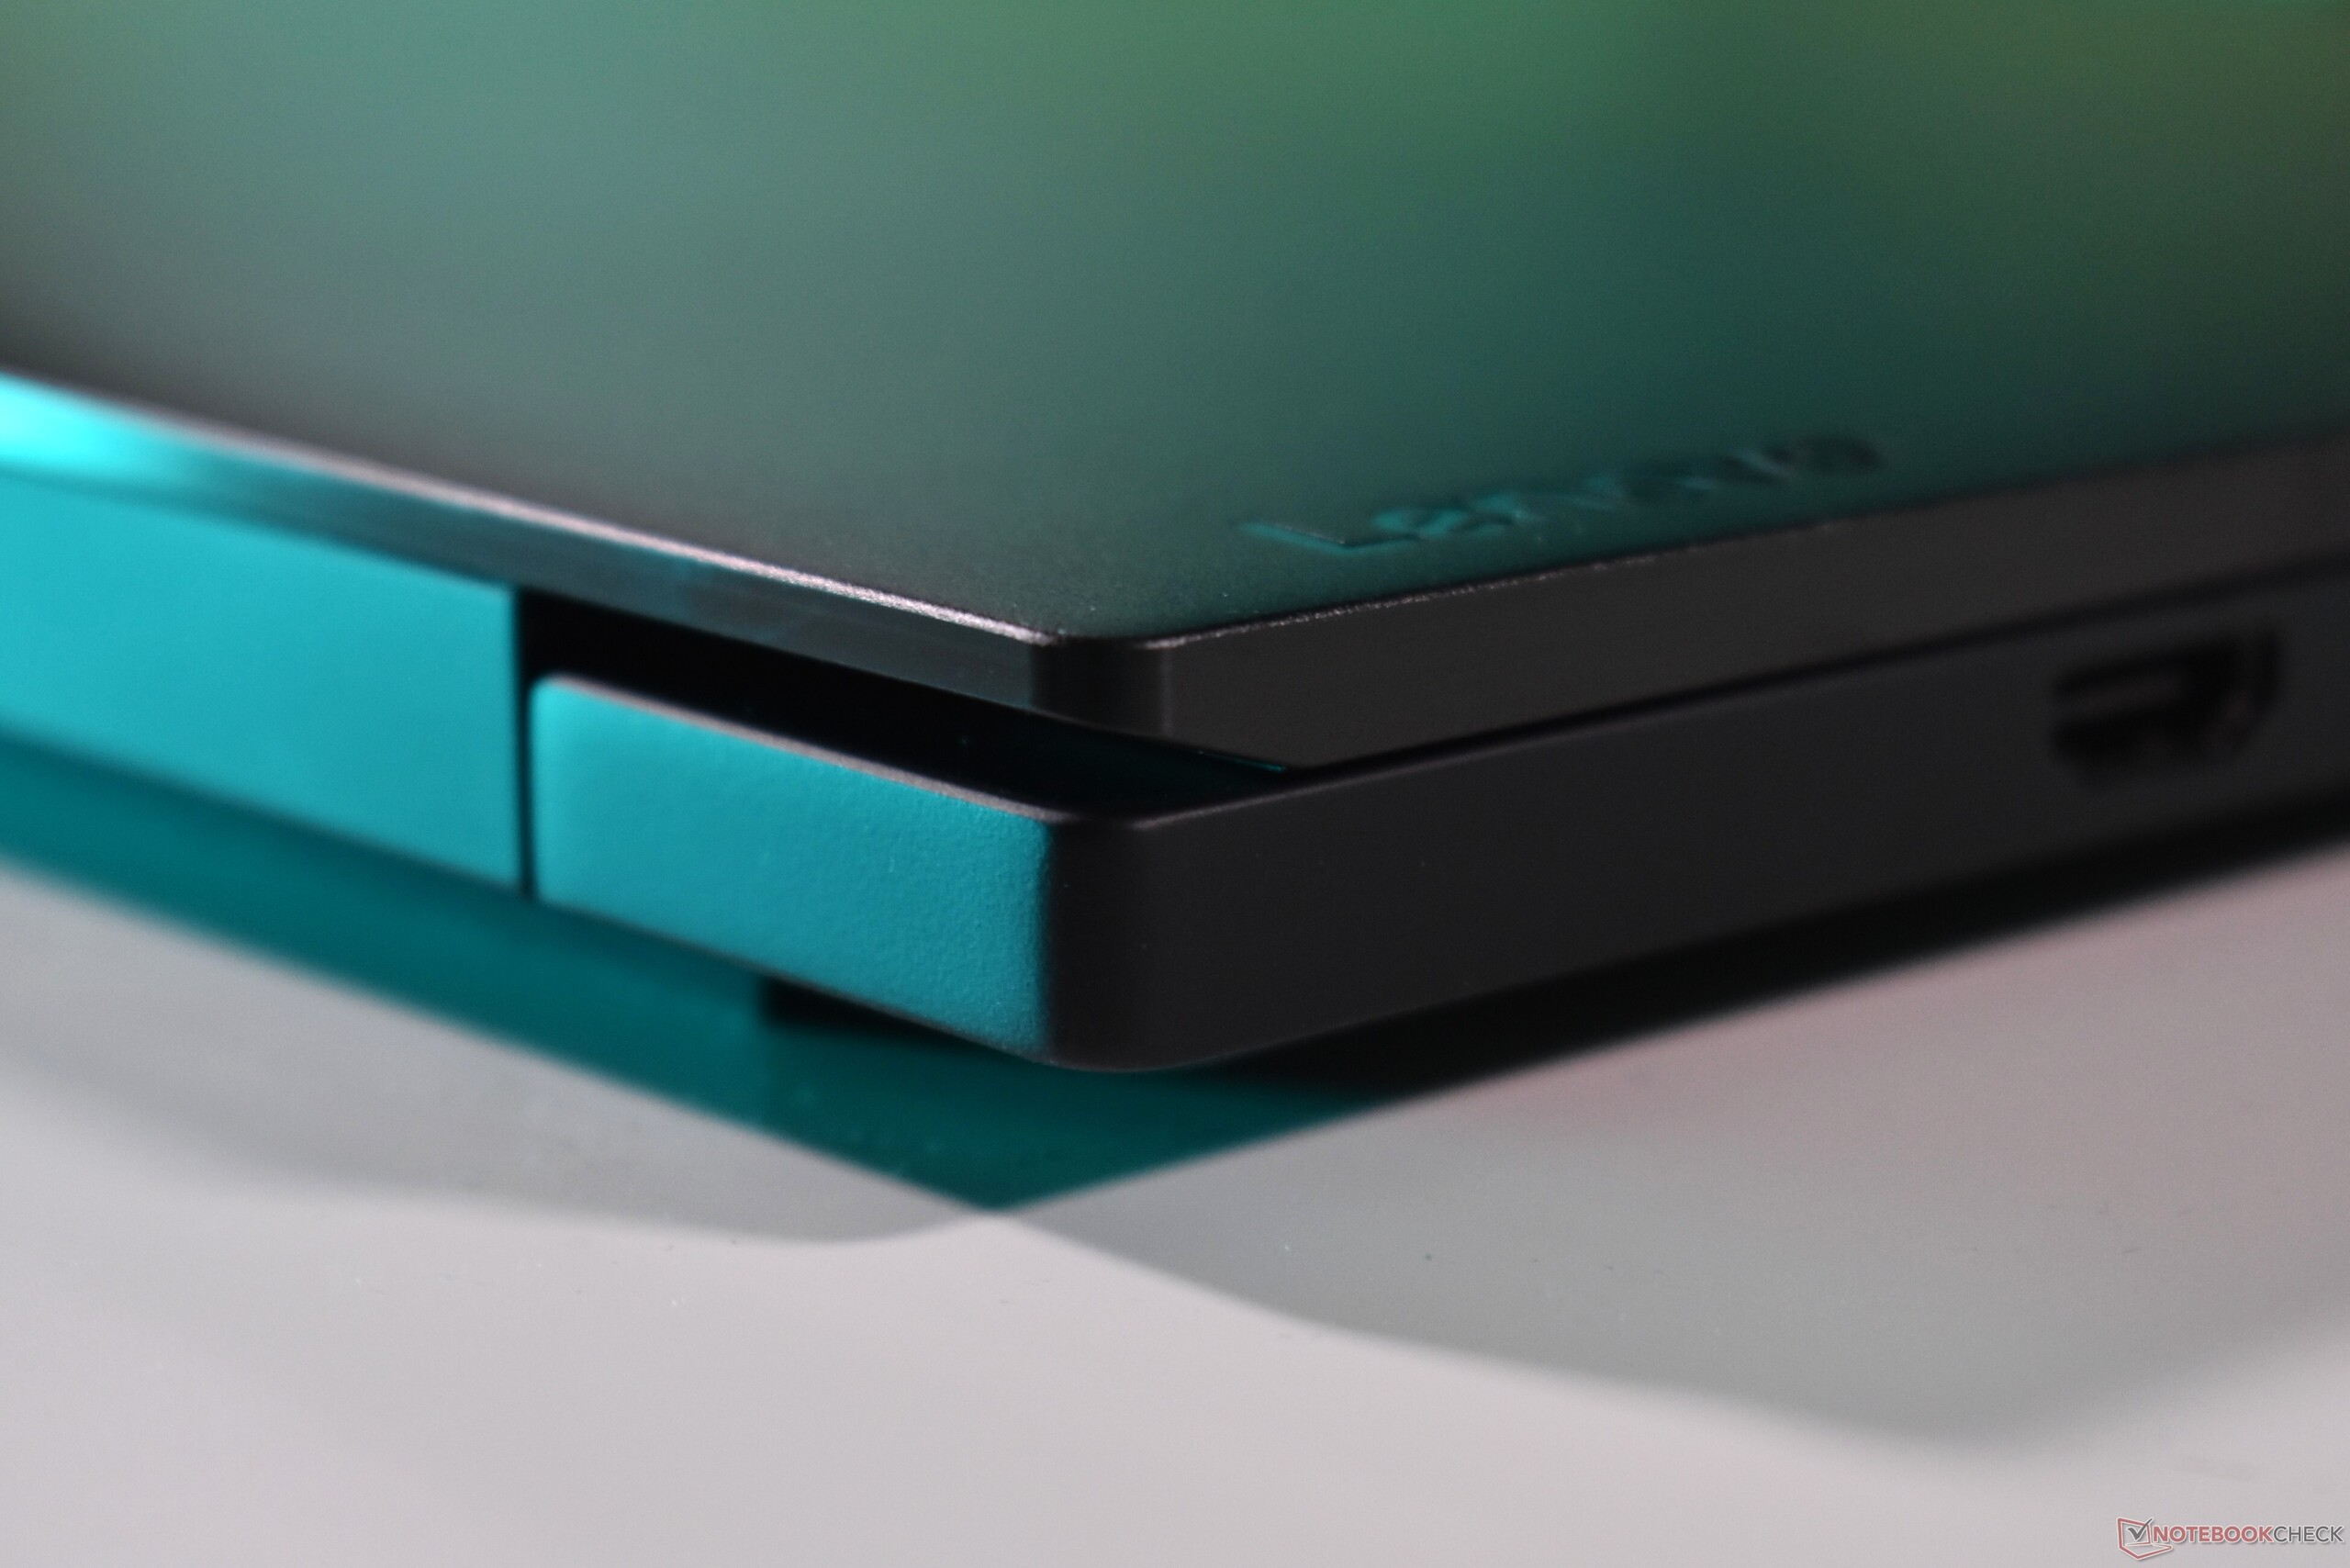
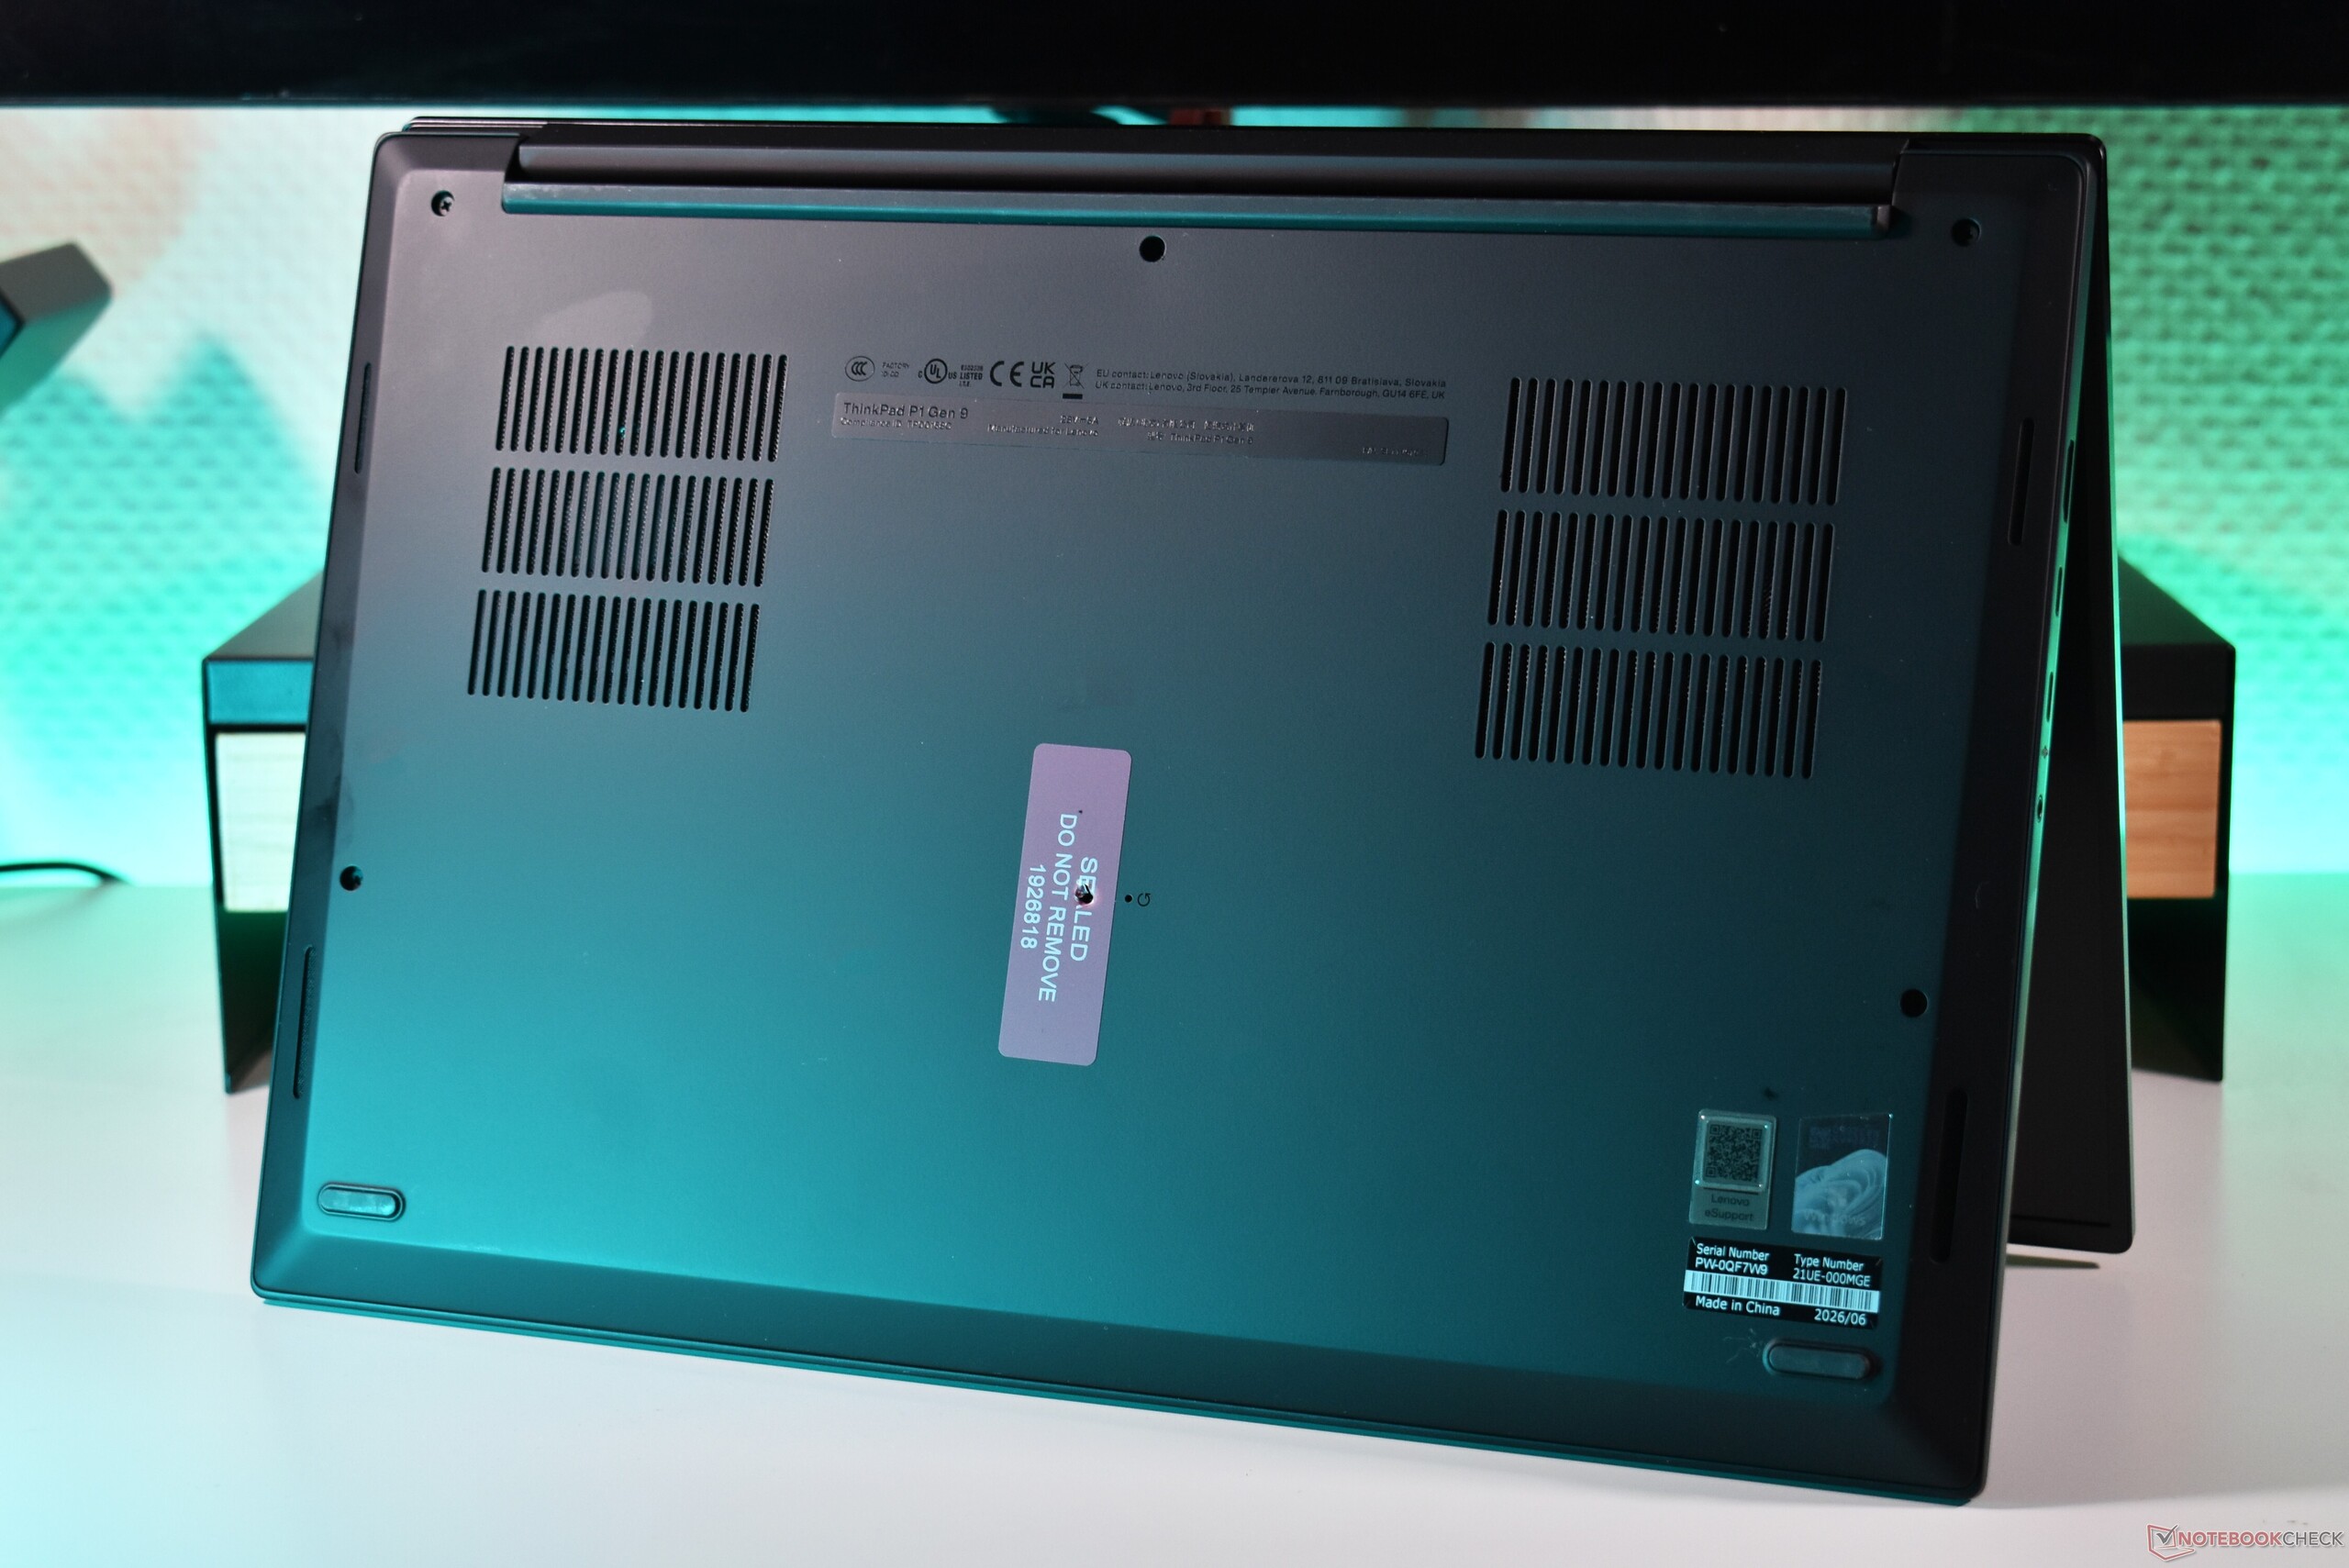
Lenovo did not change the chassis design of the ThinkPad P1 Gen 9, which is virtually identical to the earlier ThinkPad P1 Gen 7 and ThinkPad P1 Gen 8. This means that this premium workstation uses a combination of aluminum and magnesium for its build, with an anodized aluminum lid, magnesium palmrest and aluminum bottom cover. Build quality is extremely good in all regards: the device feels robust and high quality, and its screen does not wobble. One weakness: the black paint on the palmrest does get oily pretty easily.
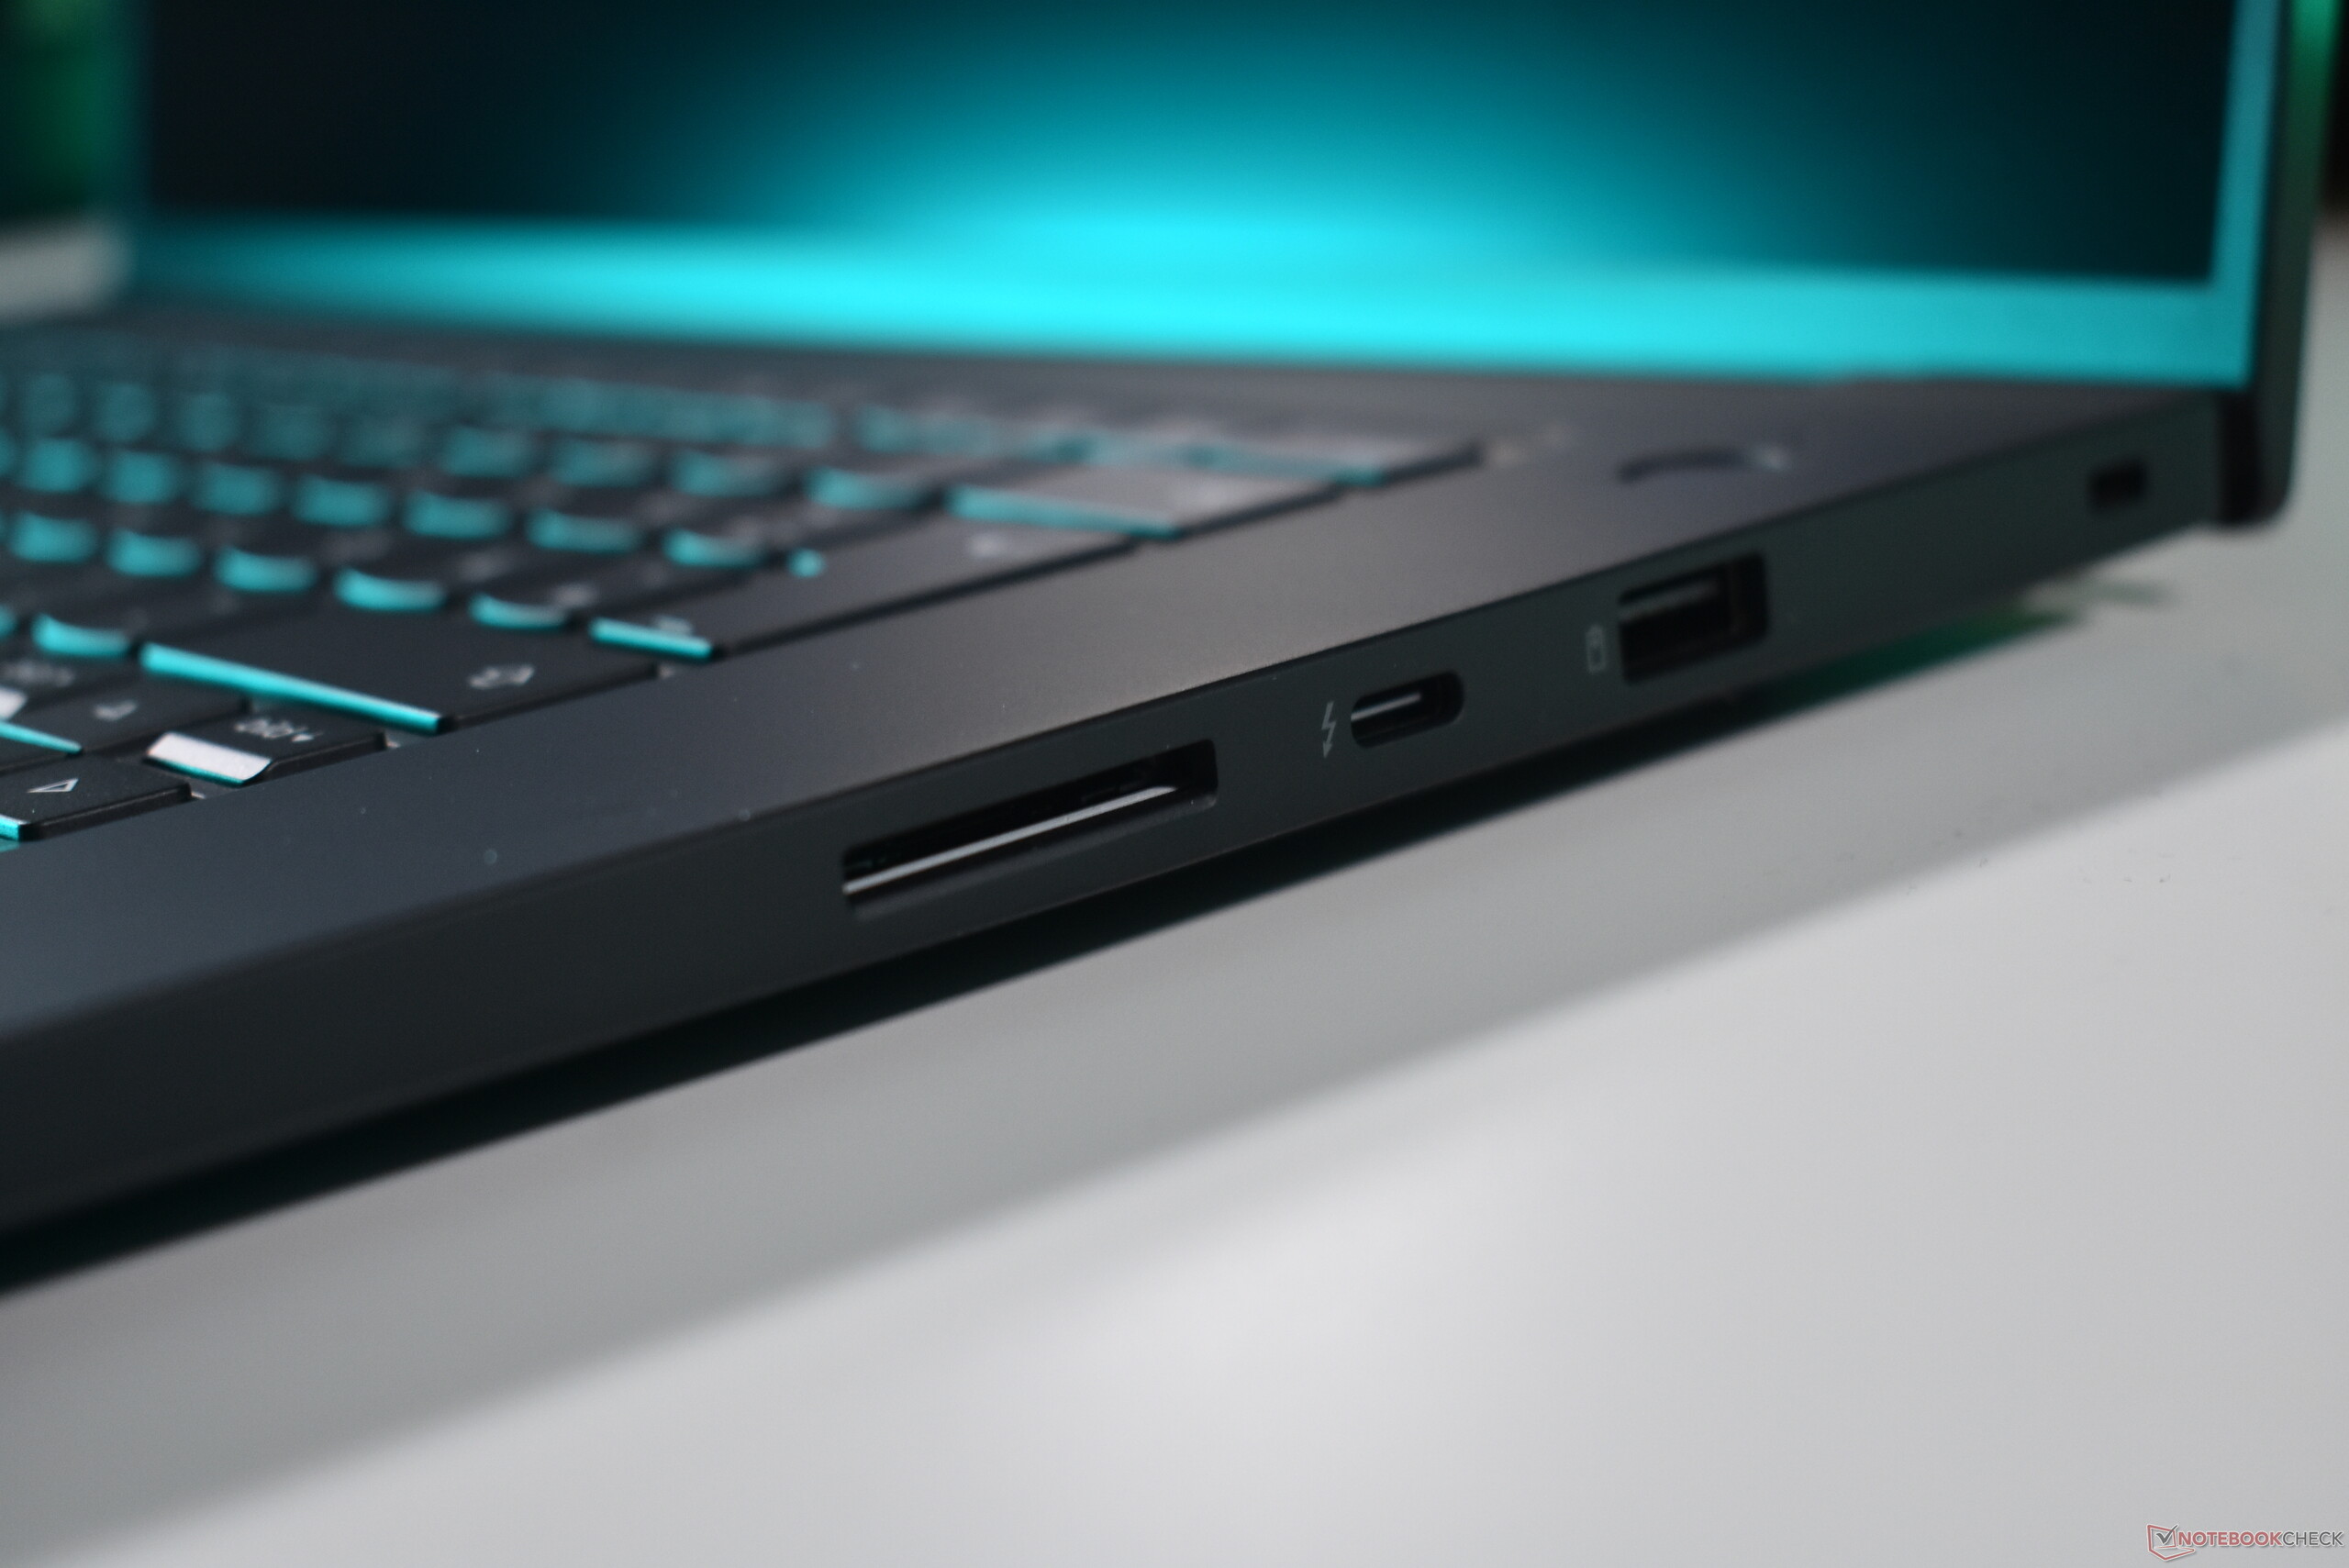
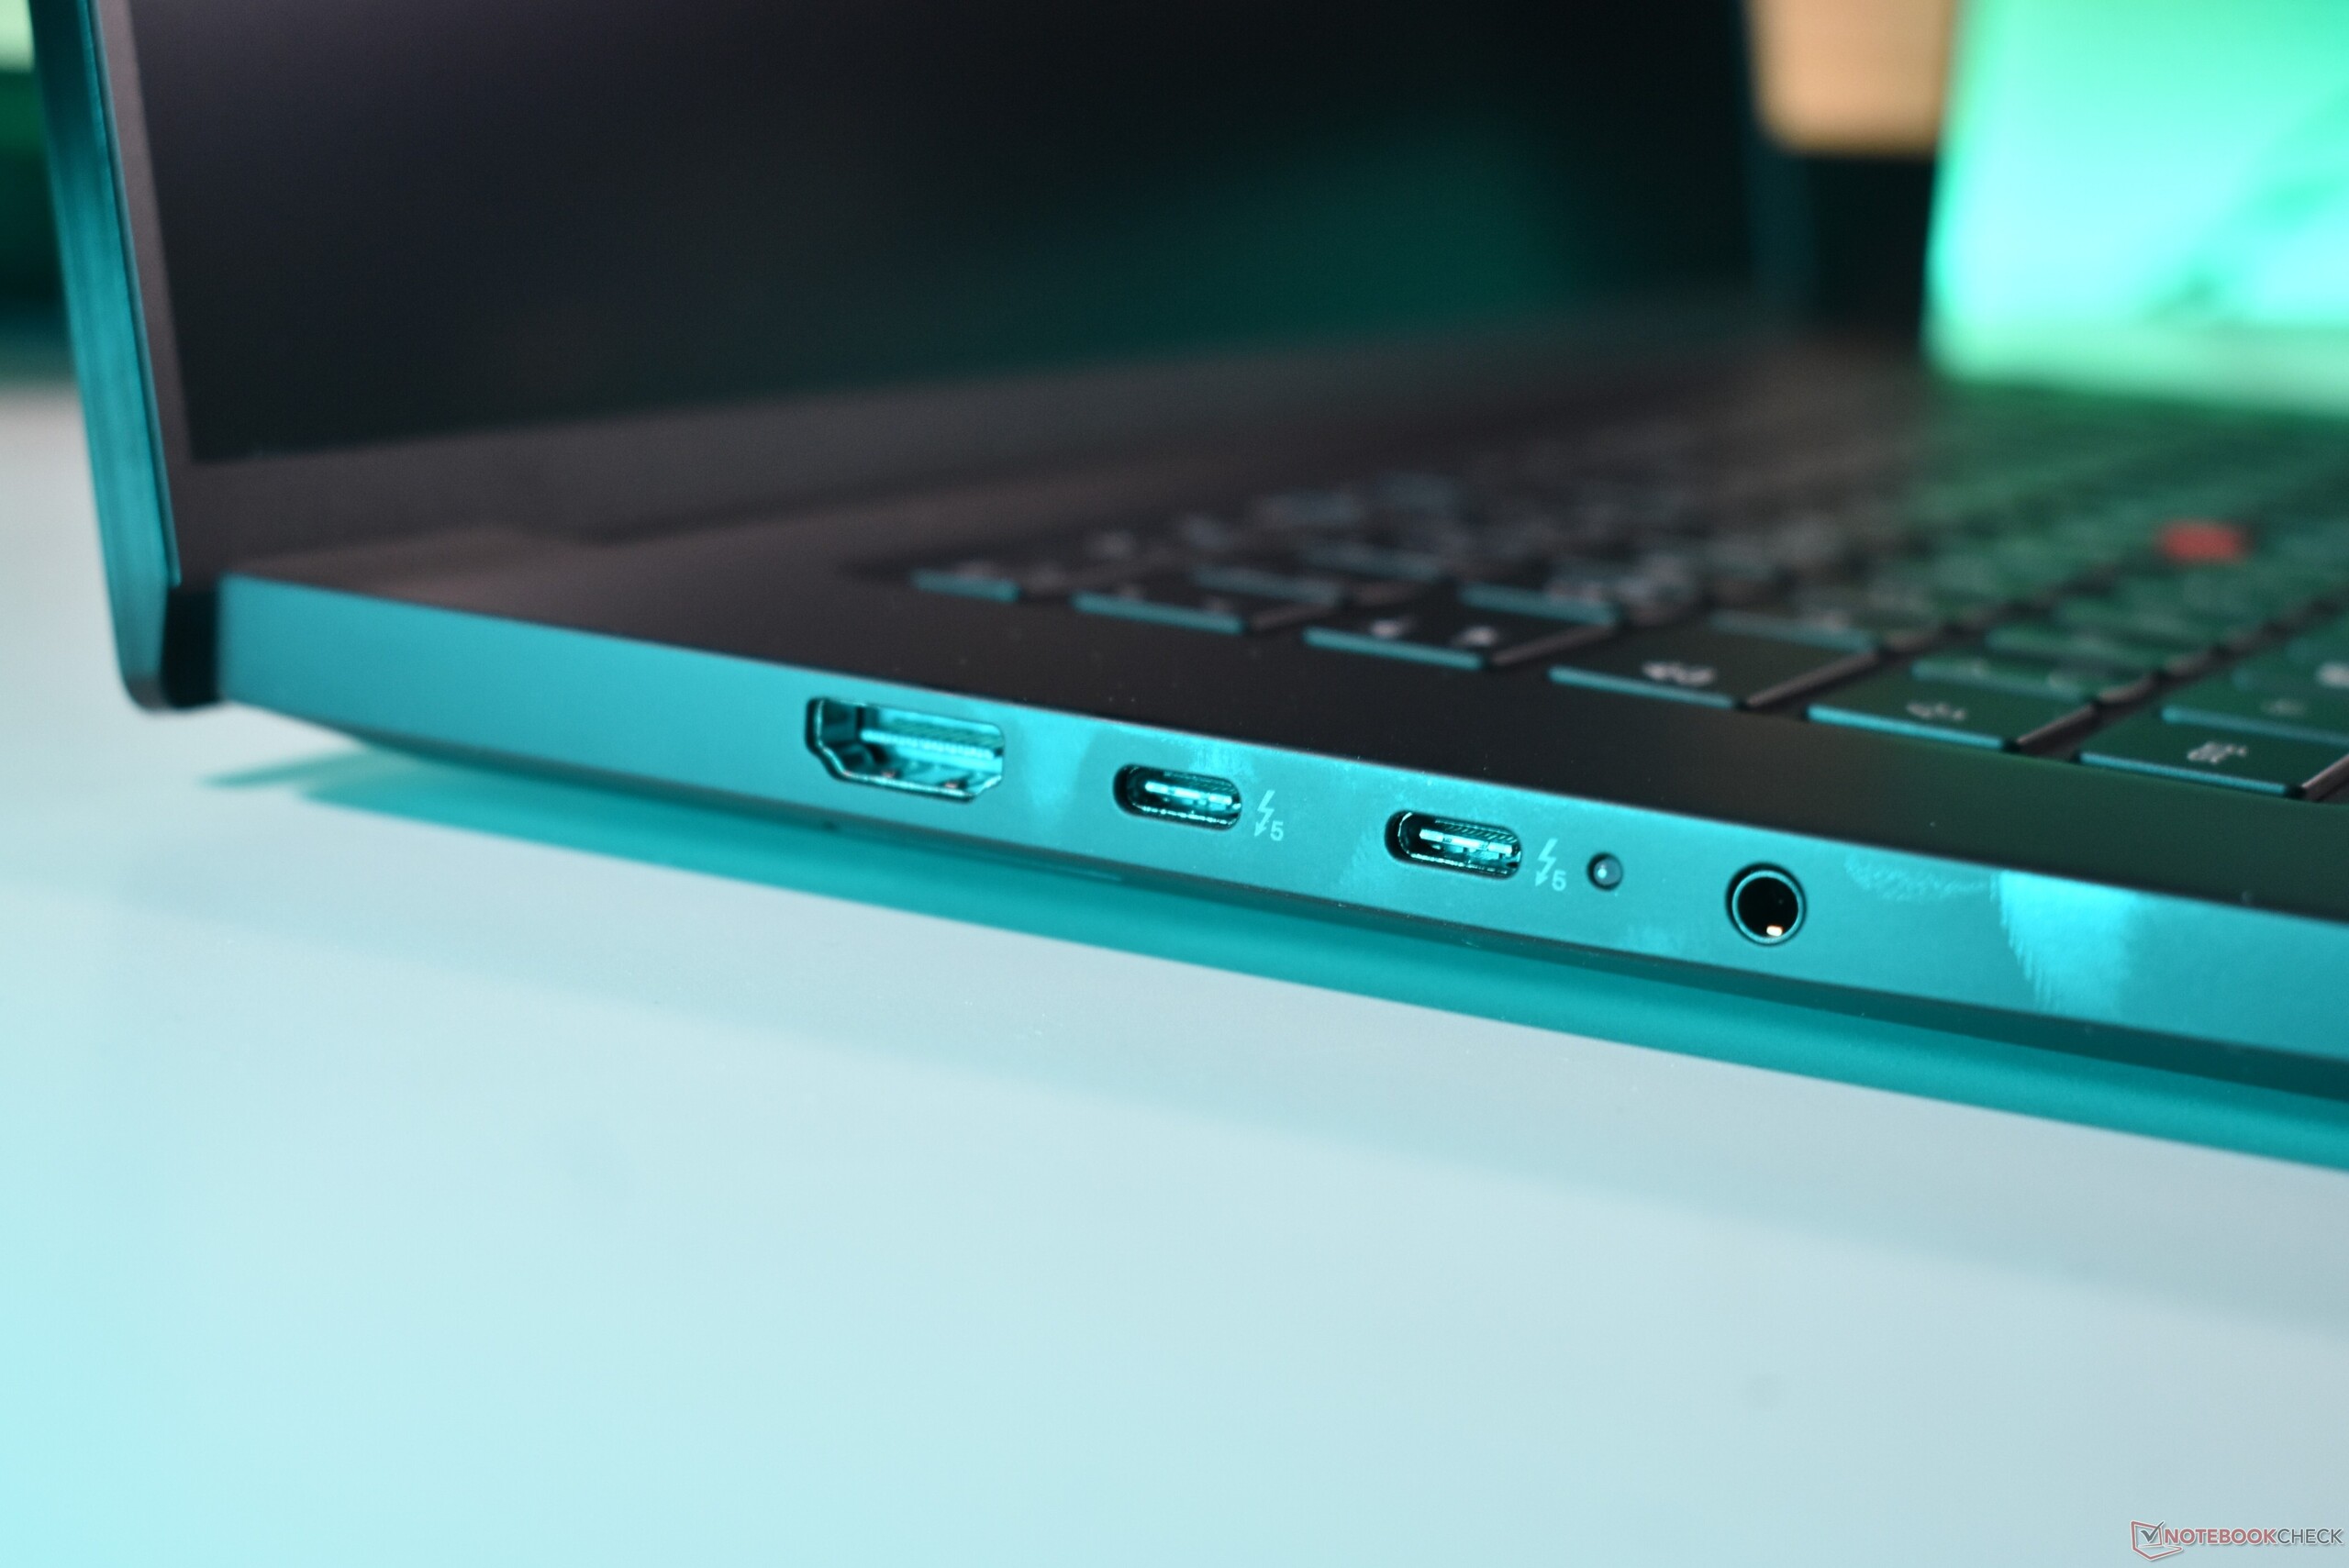
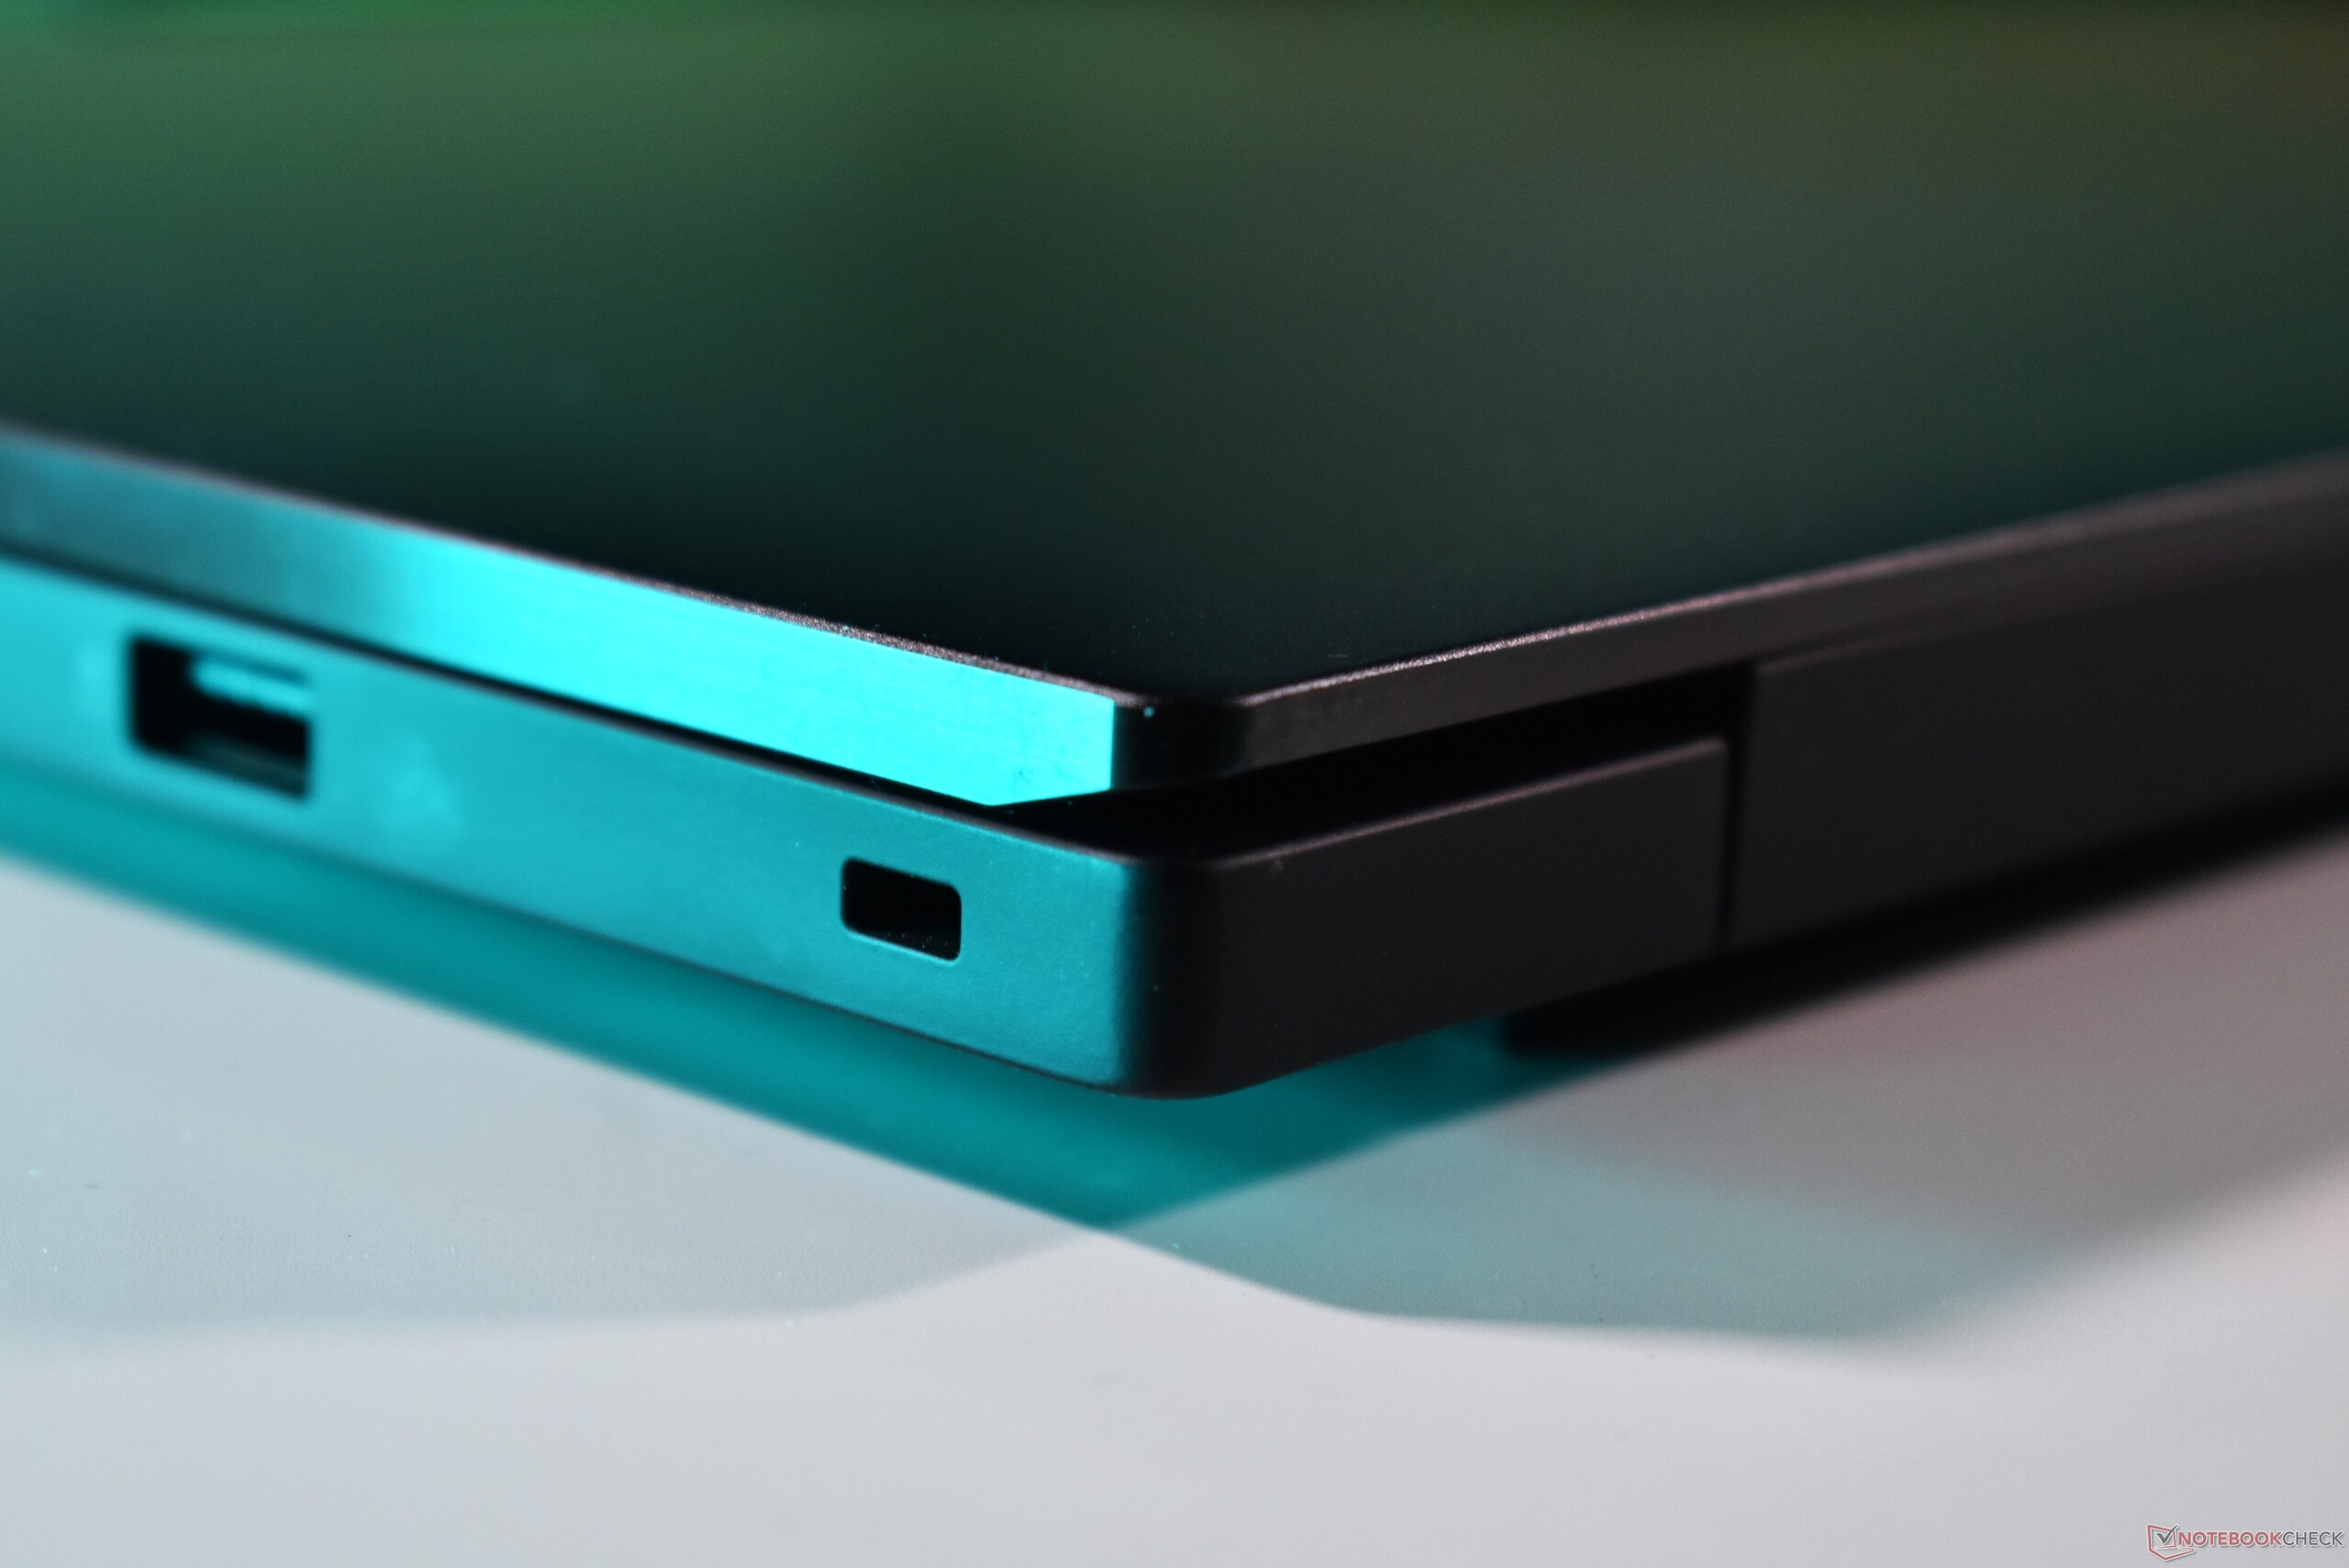
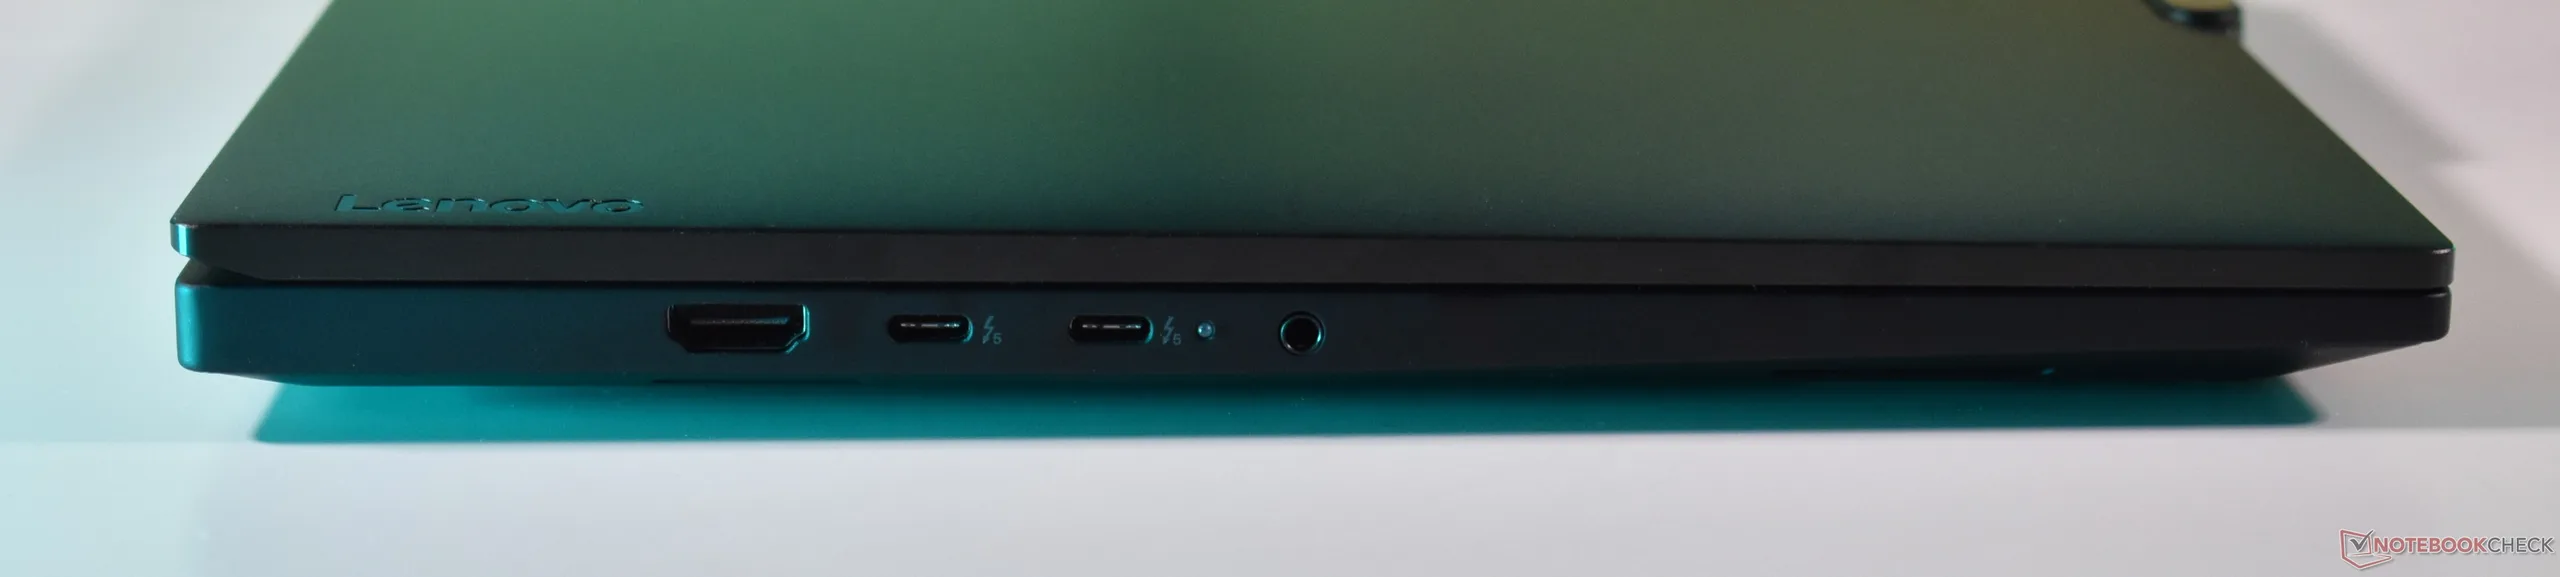
Port selection remains exactly the same as with the ThinkPad P1 G8, which means the ThinkPad laptop includes Thunderbolt 5. It also has a full-size SD card reader, which takes in SD cards fully.
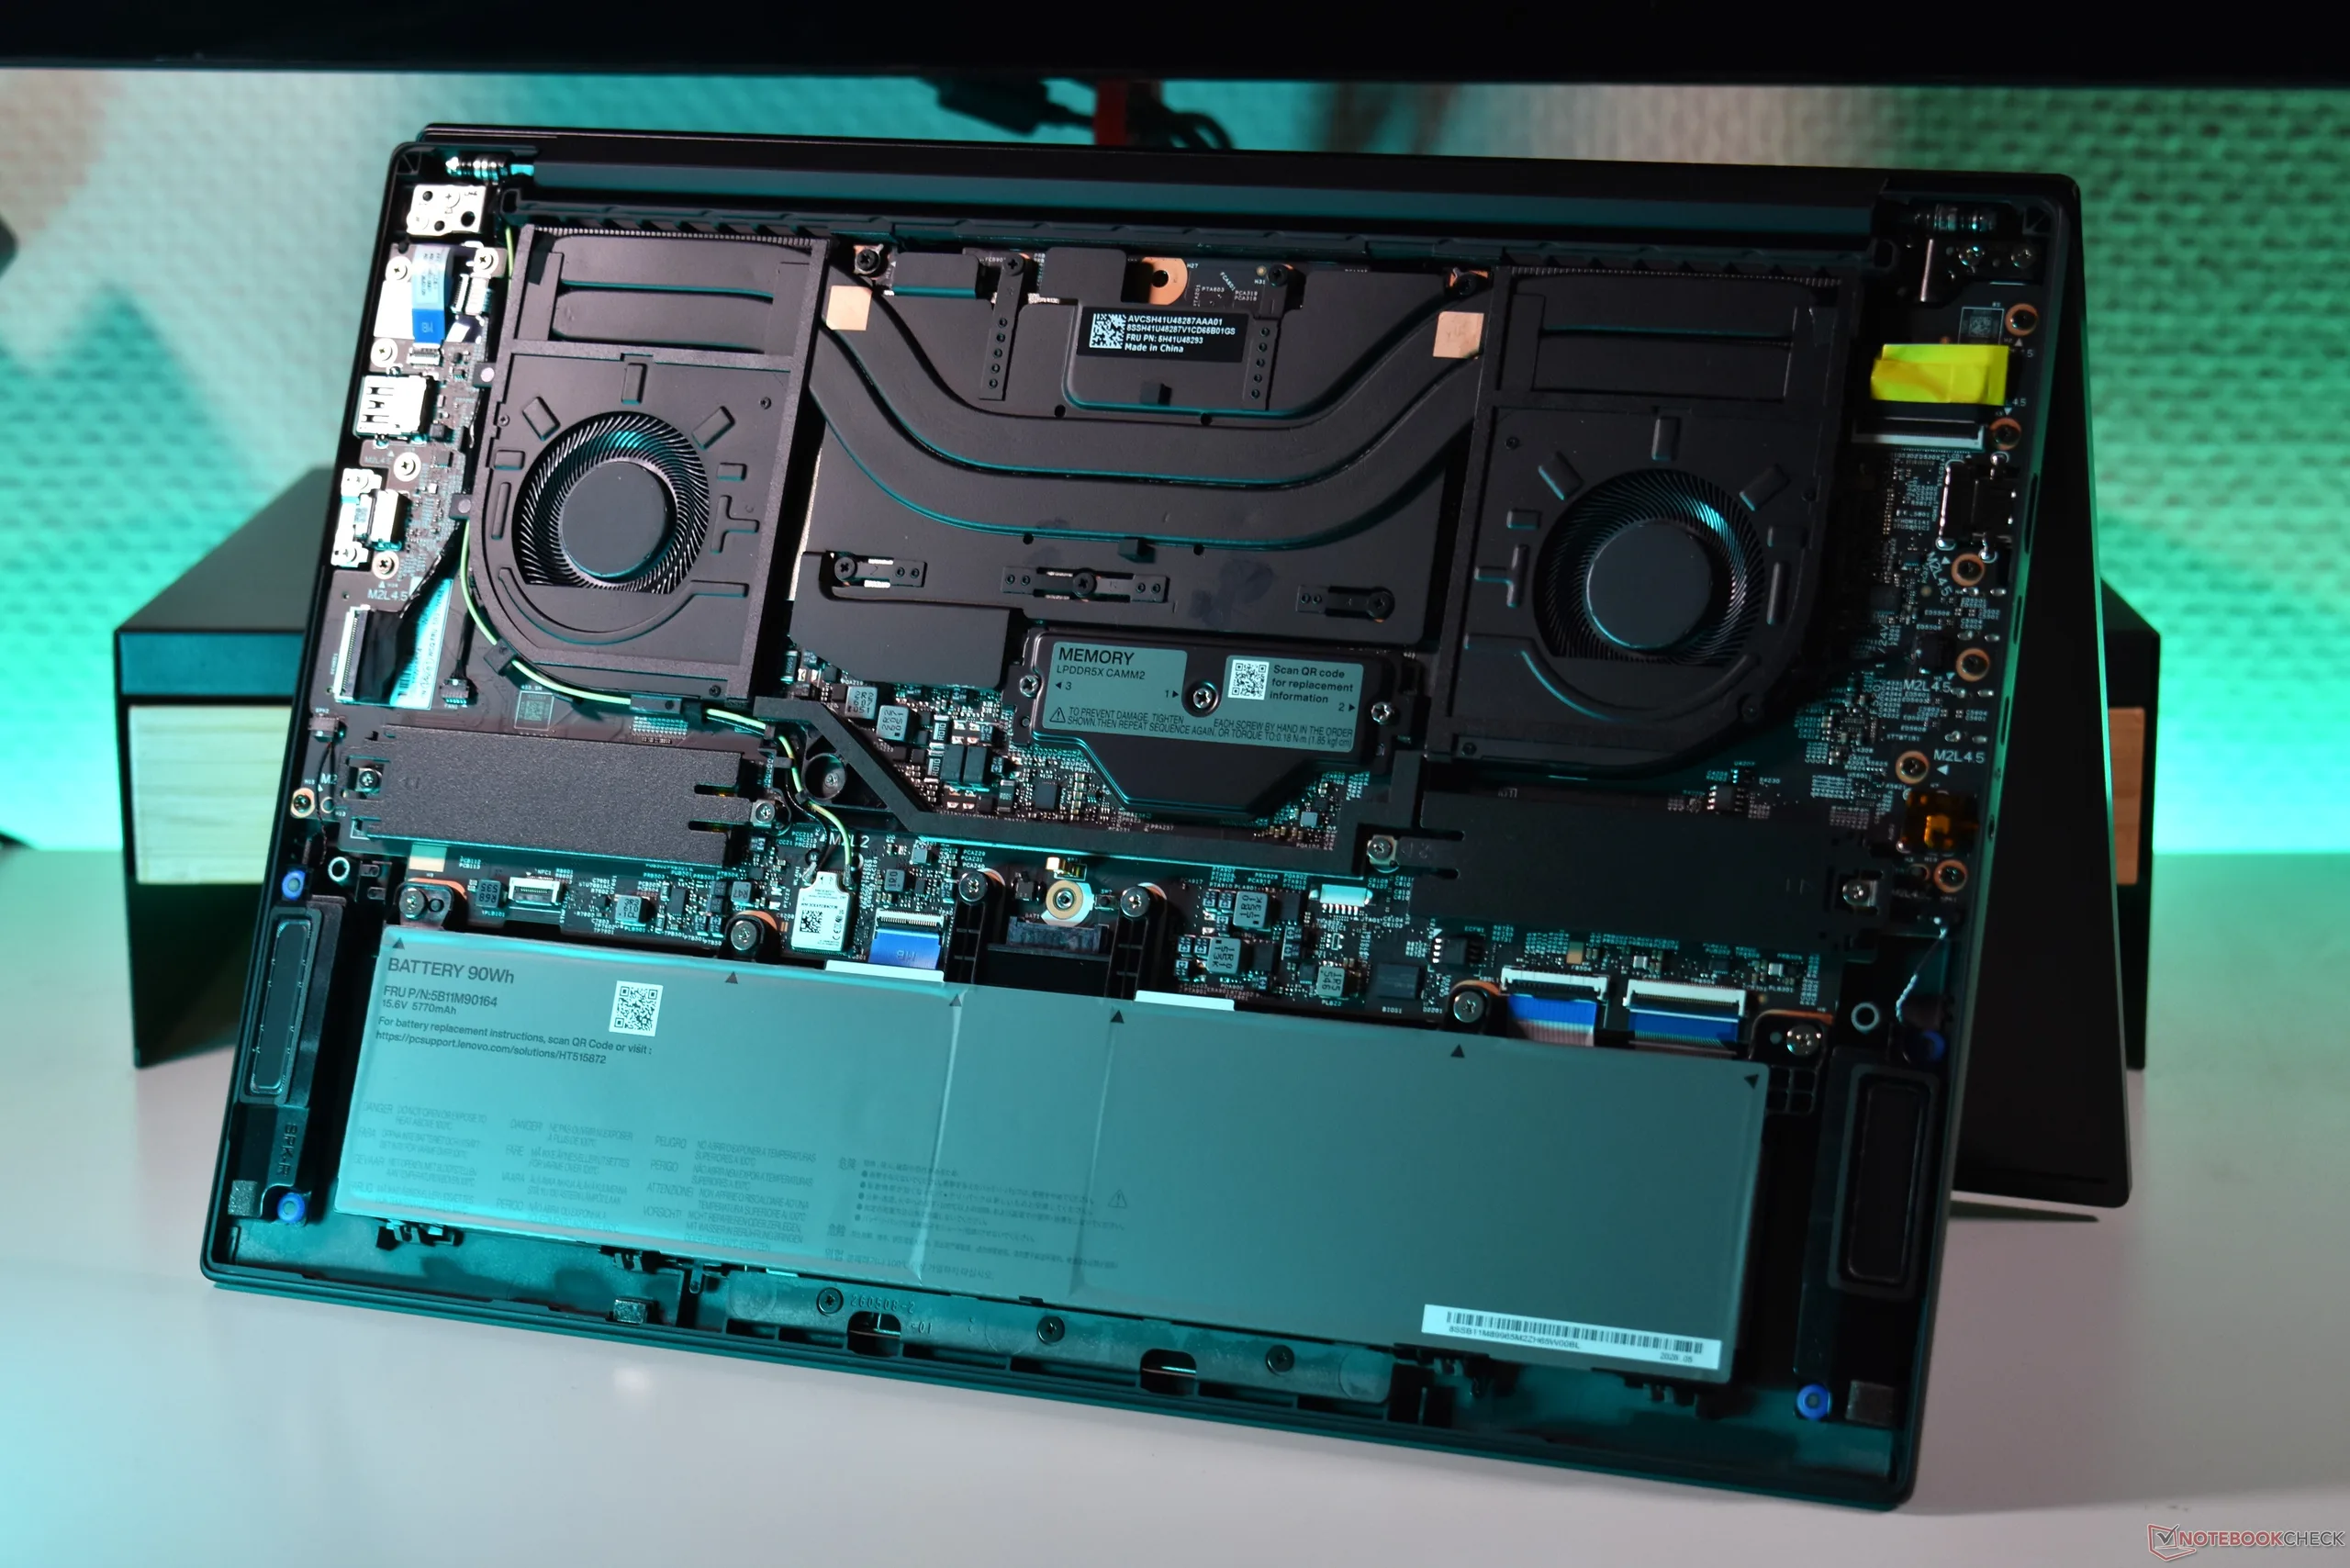
As a workstation, the ThinkPad P1 Gen 9 has more upgrade potential than most ThinkPads. This includes two M.2 2280 slots, so this is potentially a dual SSD machine, with support for RAID-modes as well. The RAM is also modular, in form of a LPCAMM2 module. Possible areas for improvement include the soldered Wi-Fi card, as well as a the keyboard, which is not user-replaceable.
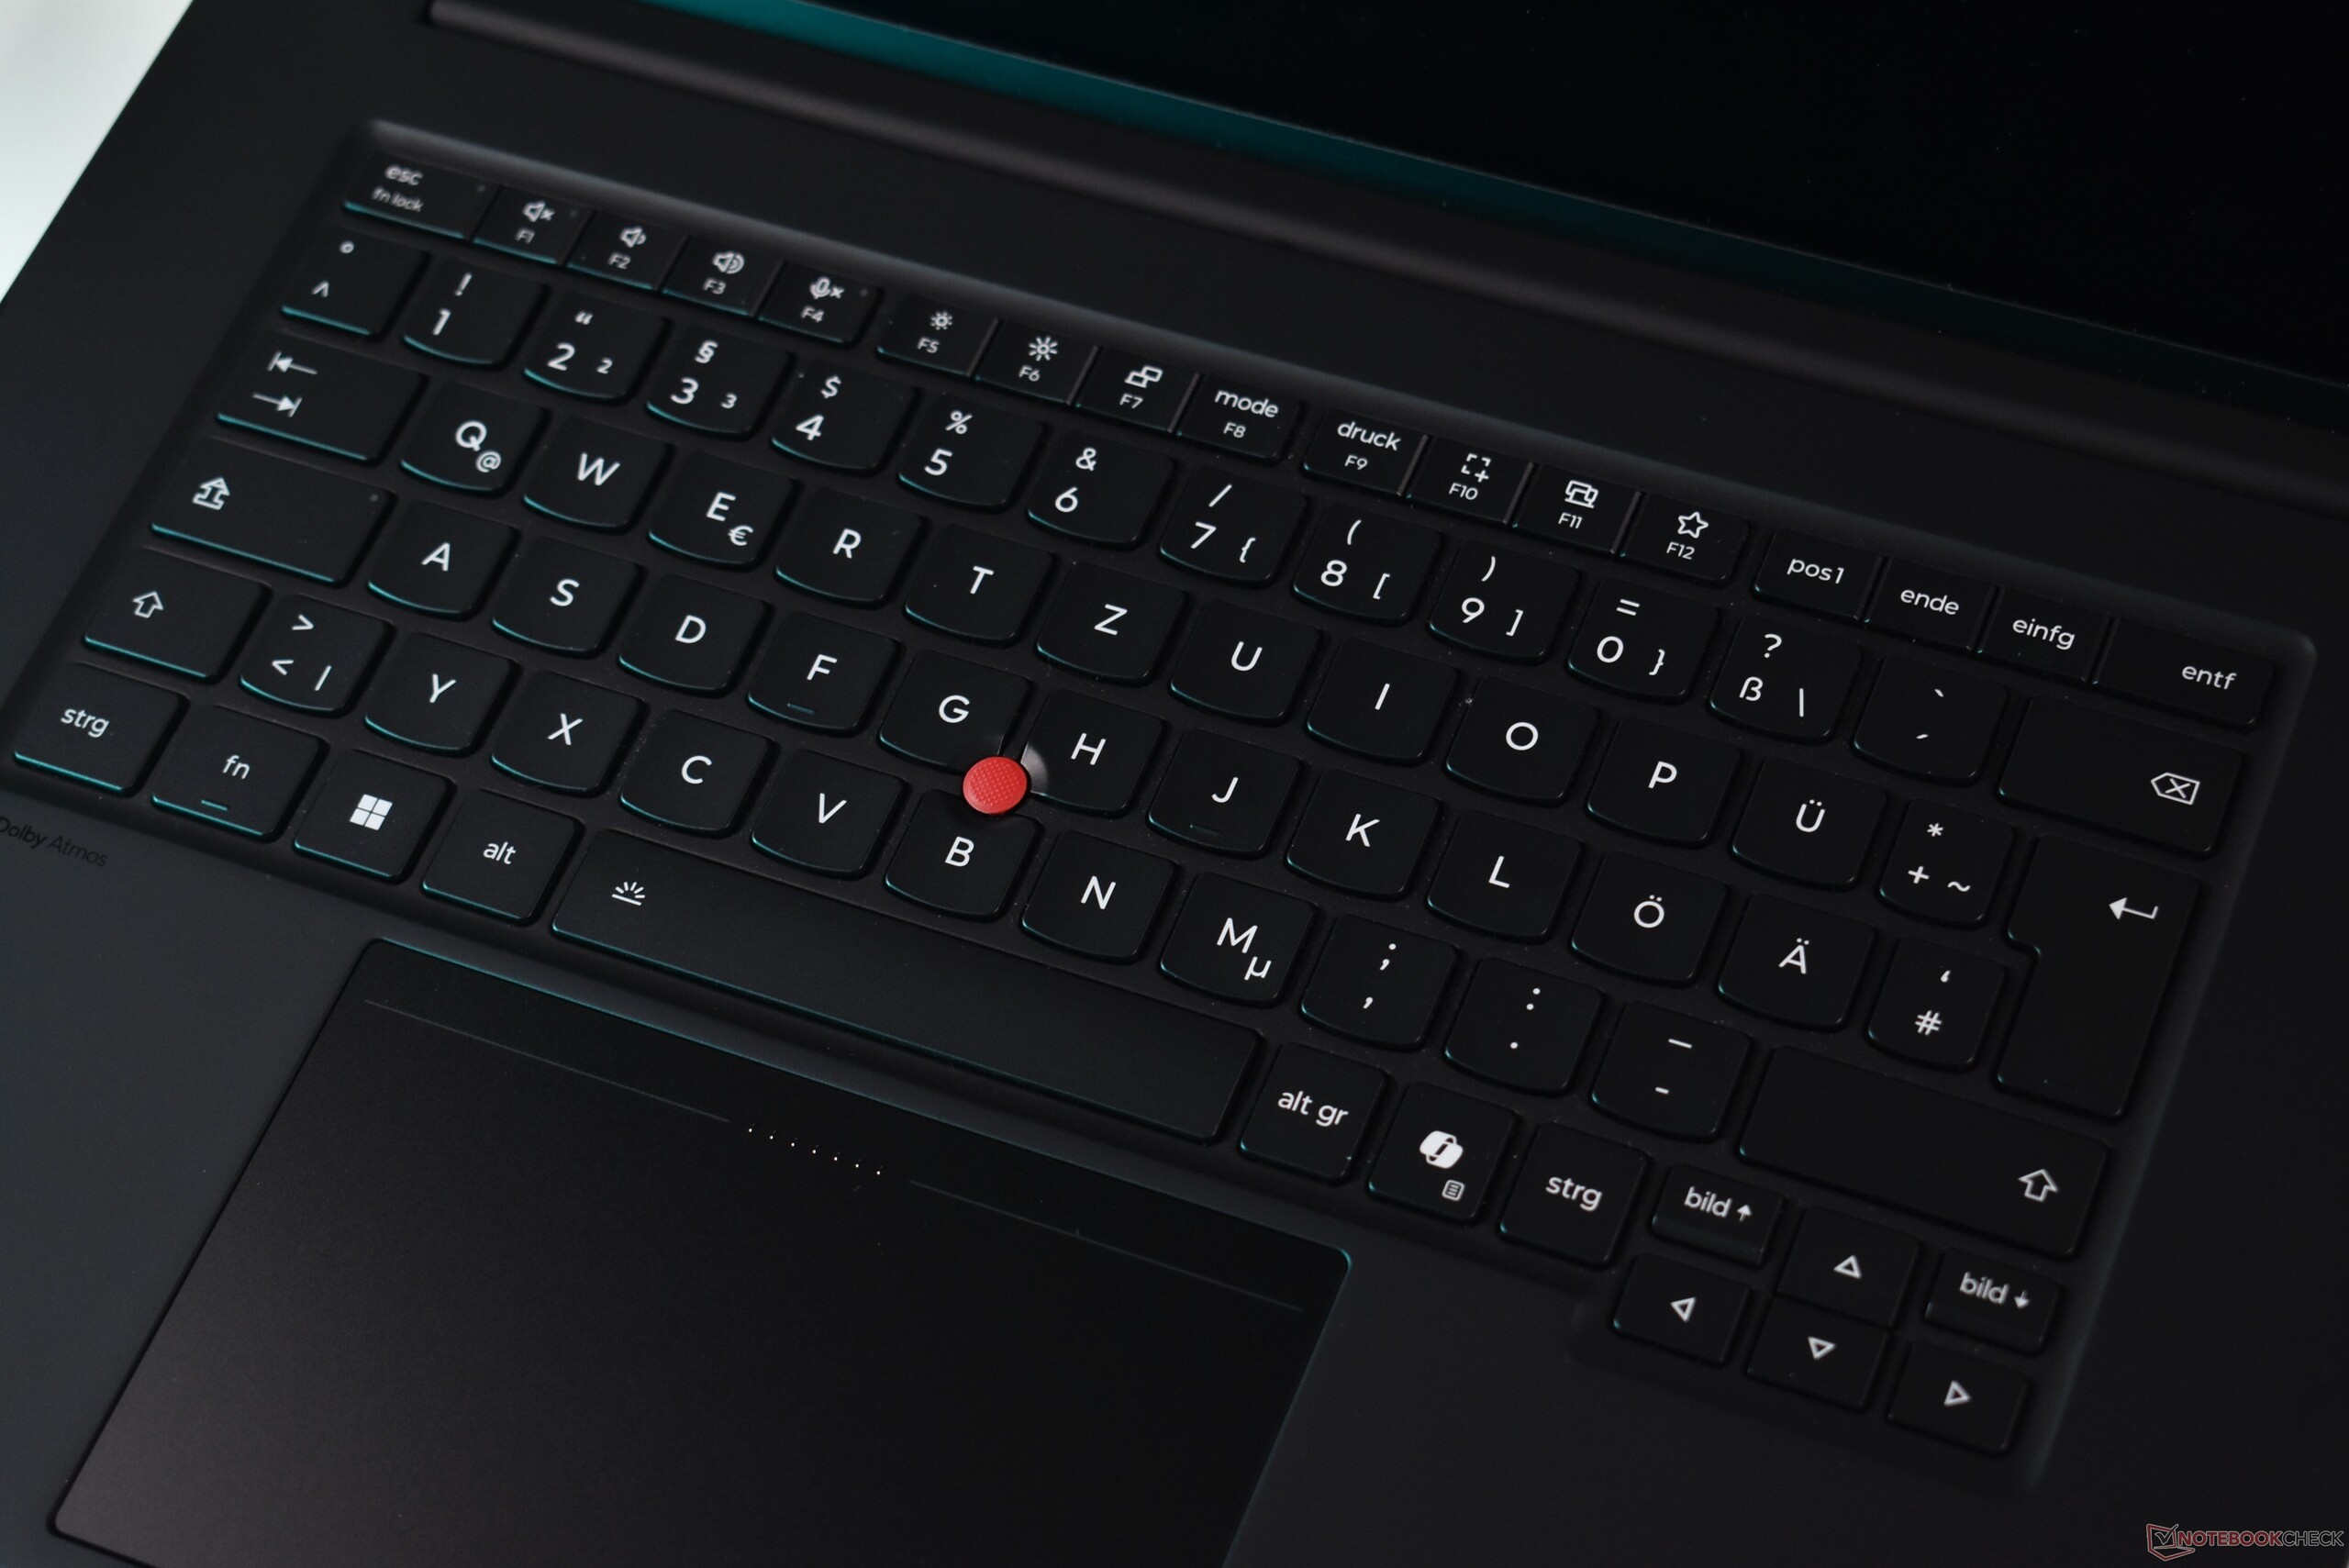
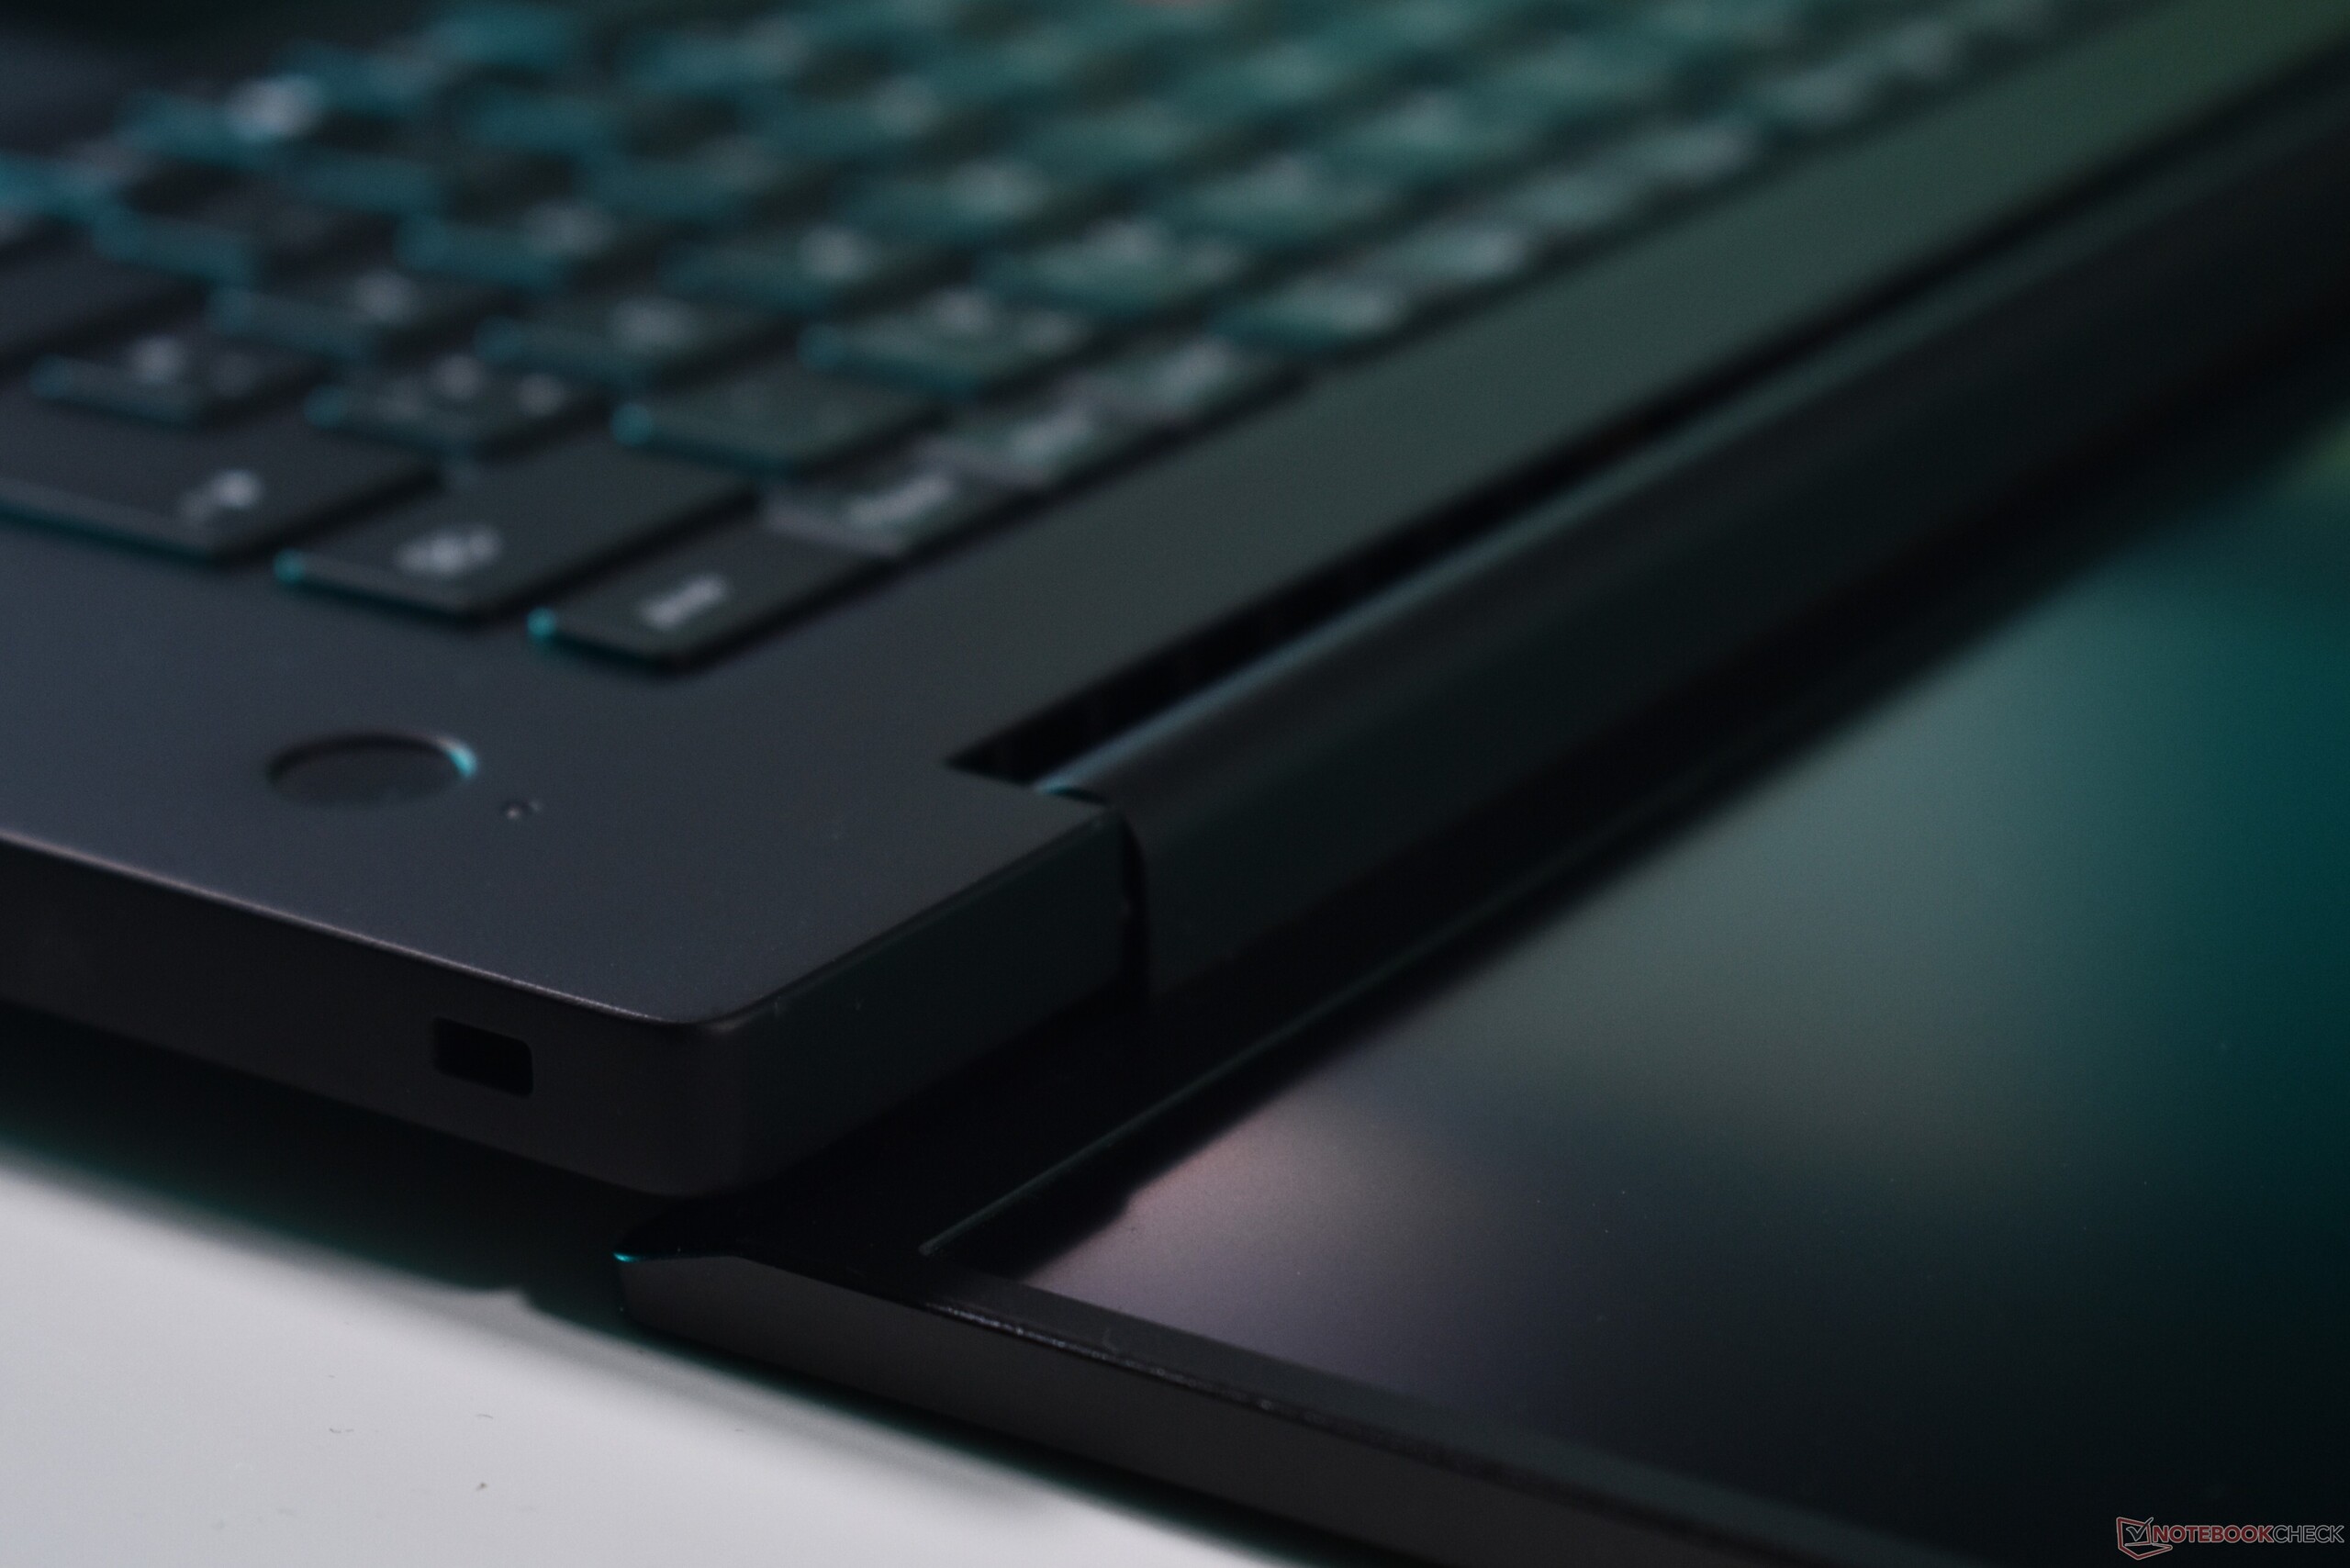
Regarding the keyboard: Lenovo makes some changes to it, adopting the new design of 2026 ThinkPads. This includes centered key-prints with a new font, as well as changes to the European ISO layout we are testing. Notably, the Enter key is a bit less wide on European keyboards, while the two German Umlaut keys Ü/Ä are a bit wider. The big haptic glass trackpad, on the other hand, remains unchanged. Overall, we love the input devices of this ThinkPad, as it is one of the best keyboards among current ThinkPads.

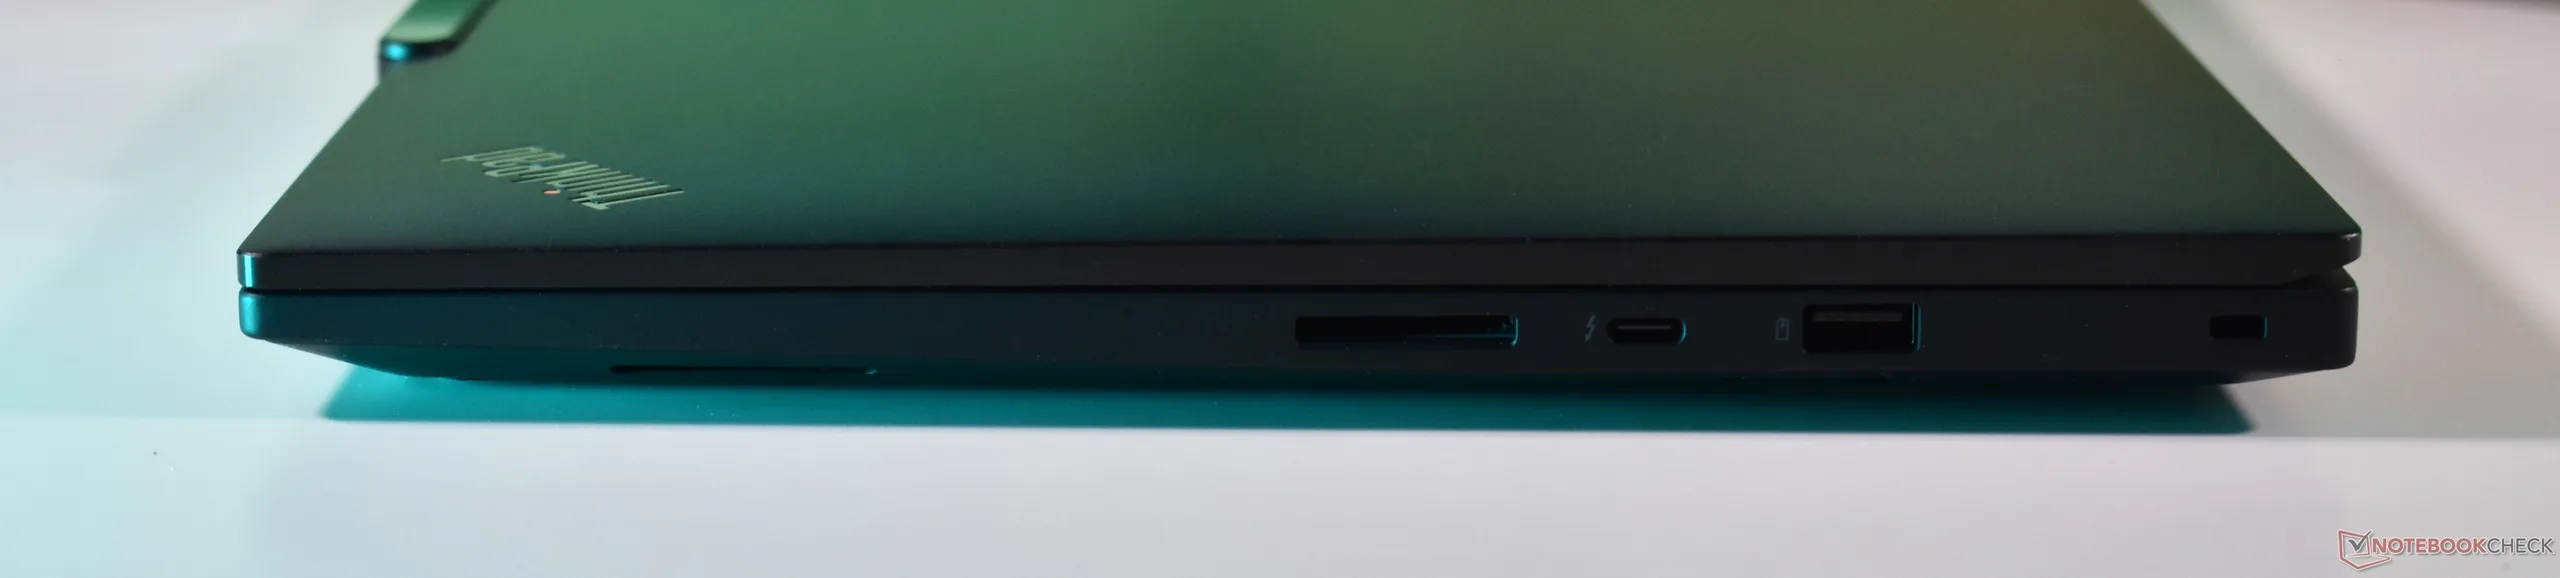
| SD Card Reader | |
| average JPG Copy Test (av. of 3 runs) | |
| HP ZBook X G1i 16 (Toshiba Exceria Pro SDXC 64 GB UHS-II) | |
| Average of class Workstation (33.3 - 681, n=11, last 2 years) | |
| Apple MacBook Pro 16 2026 M5 Pro (Angelbird AV Pro V60) | |
| Lenovo ThinkPad P1 Gen 8 (Toshiba Exceria Pro SDXC 64 GB UHS-II) | |
| Samsung Galaxy Book6 Ultra (Angelbird AV Pro V60) | |
| Lenovo ThinkPad P1 Gen 9 21UE000MGE (AV Pro V60) | |
| maximum AS SSD Seq Read Test (1GB) | |
| Average of class Workstation (82 - 1455, n=11, last 2 years) | |
| Apple MacBook Pro 16 2026 M5 Pro (Angelbird AV Pro V60) | |
| HP ZBook X G1i 16 (Toshiba Exceria Pro SDXC 64 GB UHS-II) | |
| Lenovo ThinkPad P1 Gen 8 (Toshiba Exceria Pro SDXC 64 GB UHS-II) | |
| Samsung Galaxy Book6 Ultra (Angelbird AV Pro V60) | |
| Lenovo ThinkPad P1 Gen 9 21UE000MGE (AV Pro V60) | |


Display
Lenovo offers a total of three 16-inch 16:10 screen options for the Lenovo ThinkPad P1 Gen 9:
- WUXGA (1,920 x 1,200), IPS, 500 cd/m², 100 % sRGB, matte
- 3.2K (3,200 x 2,000), Tandem OLED, 600 cd/m² (1500 cd/m² HDR Peak), 100 % DCI-P3, matte, 40-120 Hz VRR, Dolby Vision, Touch
- WQUXGA (3,840 x 2,400), IPS, 800 cd/m², matte, Dolby Vision
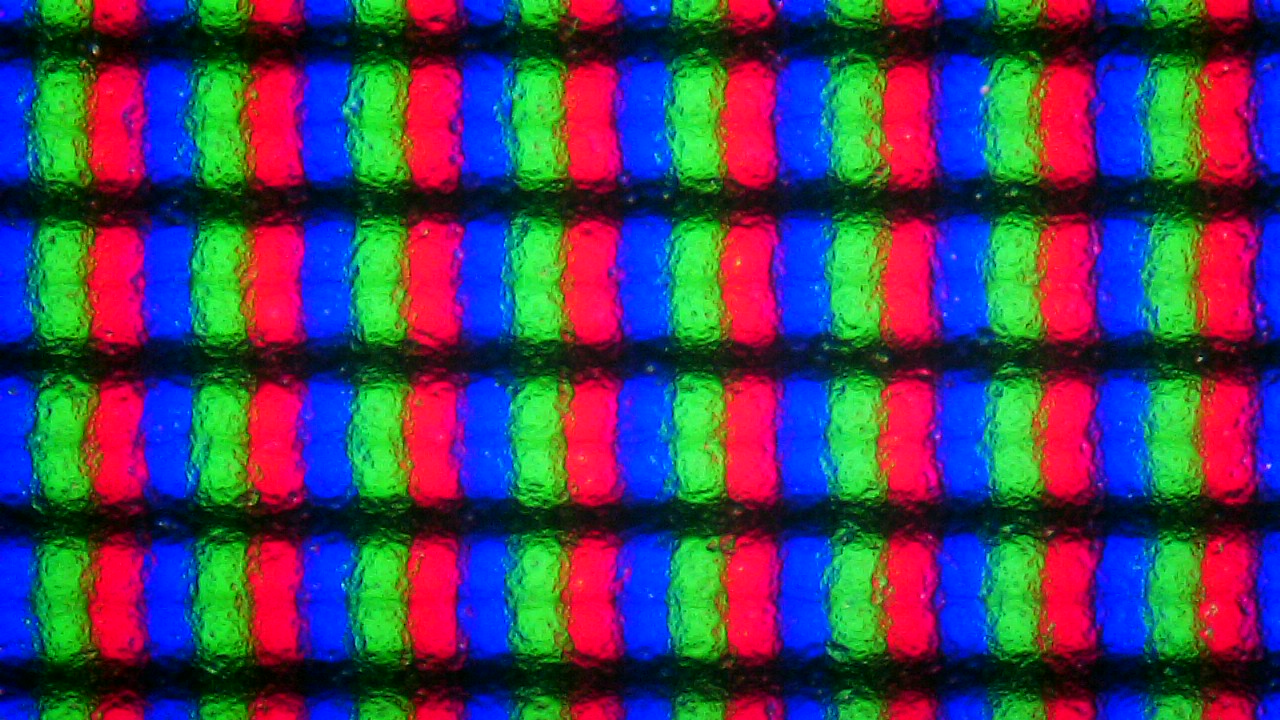
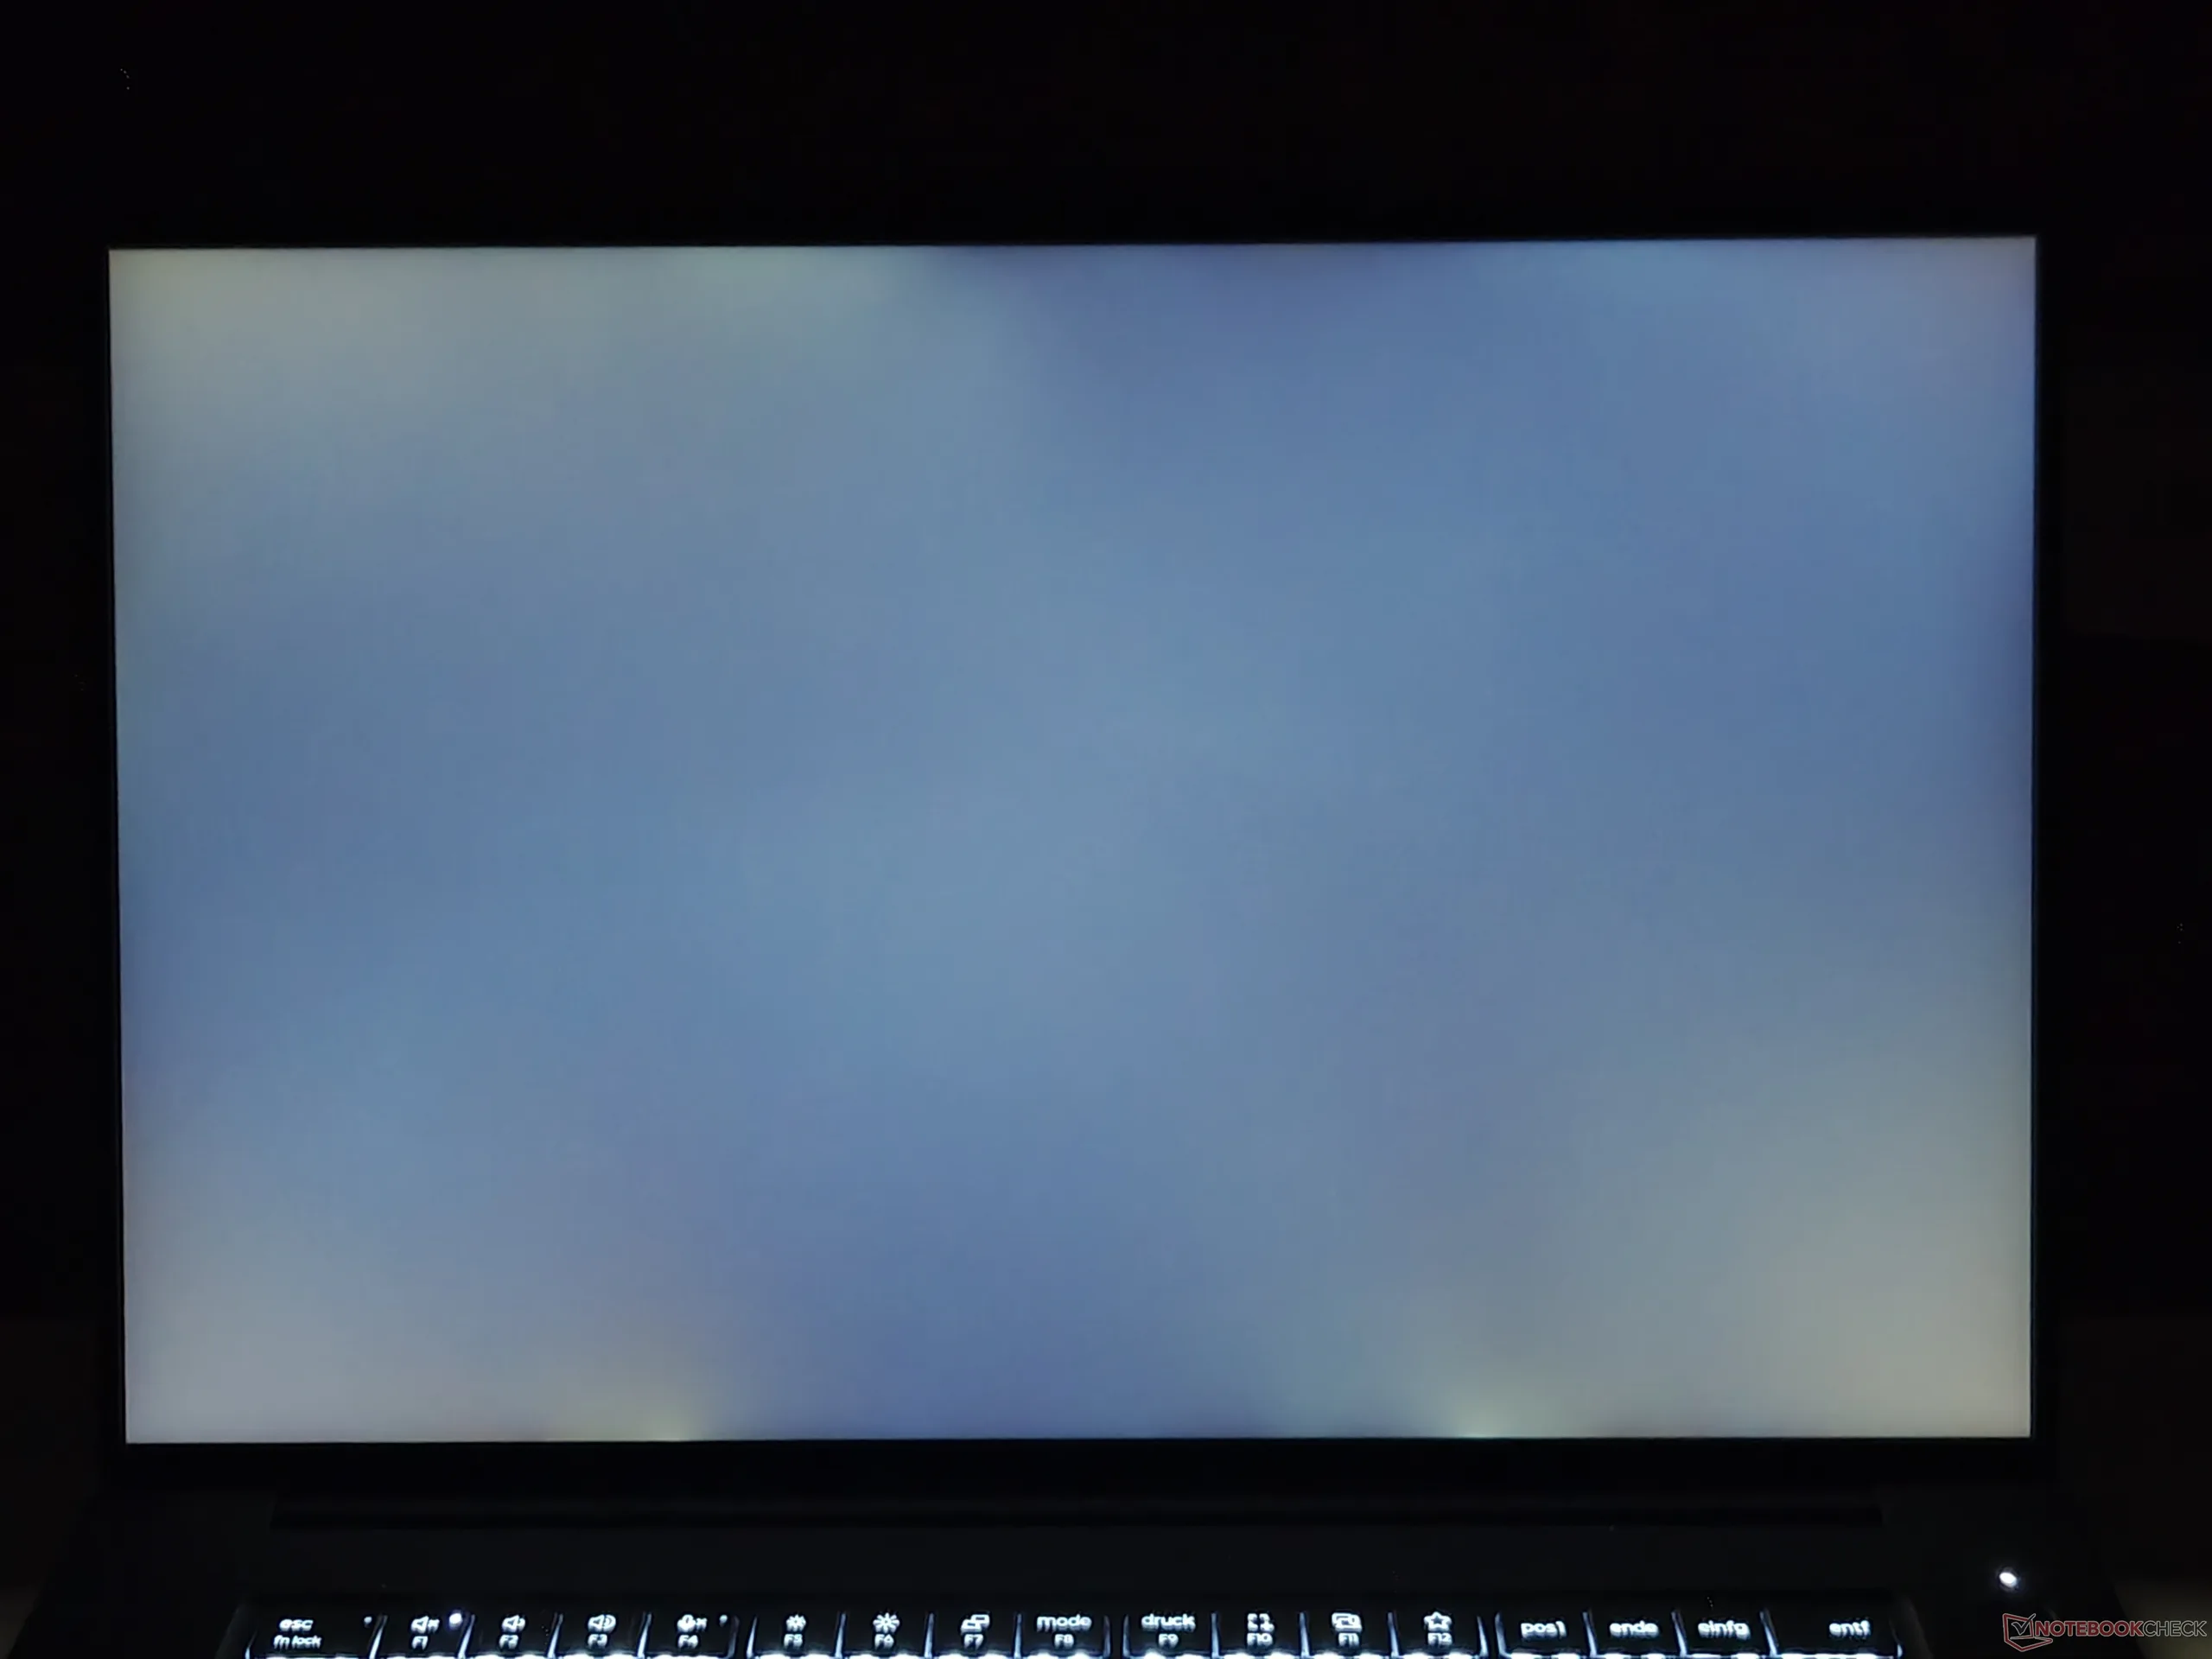
The basic panel in our review device almost hits the promised brightness, with an average brightness of 495 cd/m². Among the reviewed workstation- and multimedia laptops in our comparison, this is the lowest resolution panel. It does have one advantage, besides the lower price: it does not use PWM to regulate the brightness.
| |||||||||||||||||||||||||
Brightness Distribution: 89 %
Center on Battery: 527 cd/m²
Contrast: 1464:1 (Black: 0.36 cd/m²)
ΔE ColorChecker Calman: 3.6 | ∀{0.5-29.43 Ø4.68}
calibrated: 1
ΔE Greyscale Calman: 3.9 | ∀{0.09-98 Ø4.93}
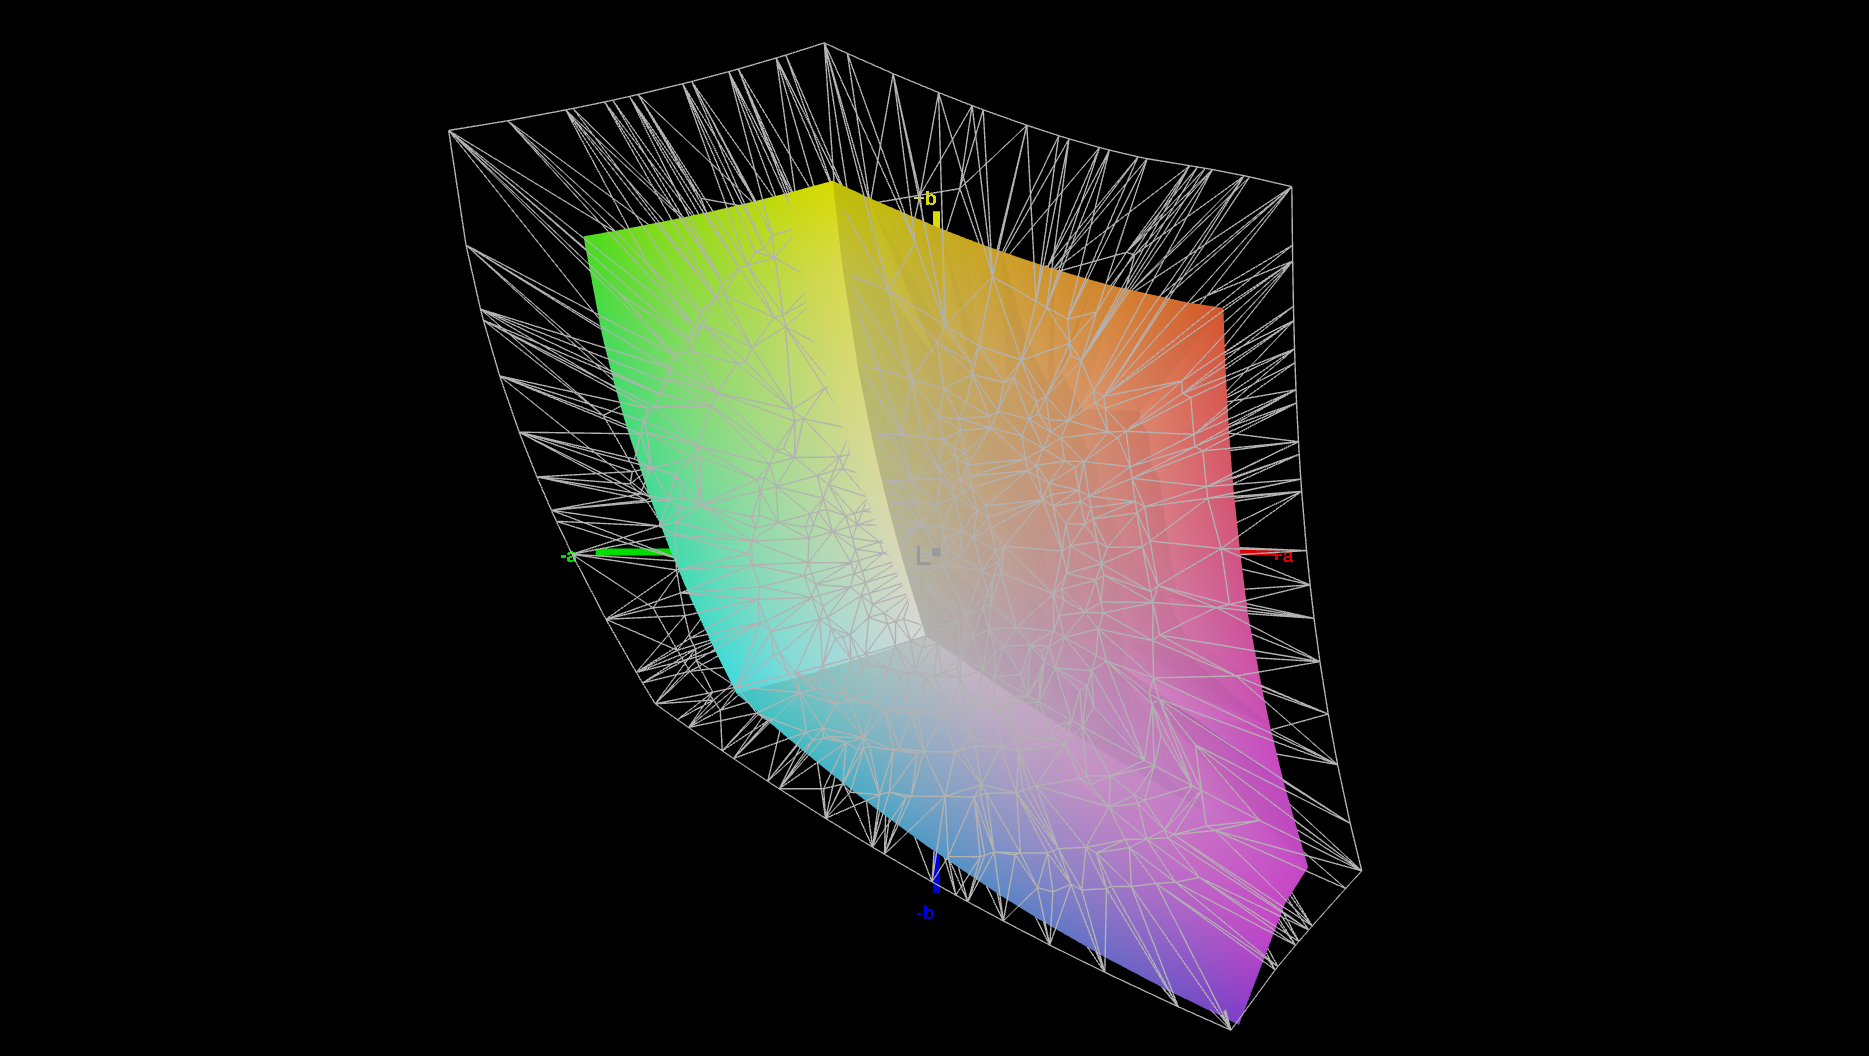
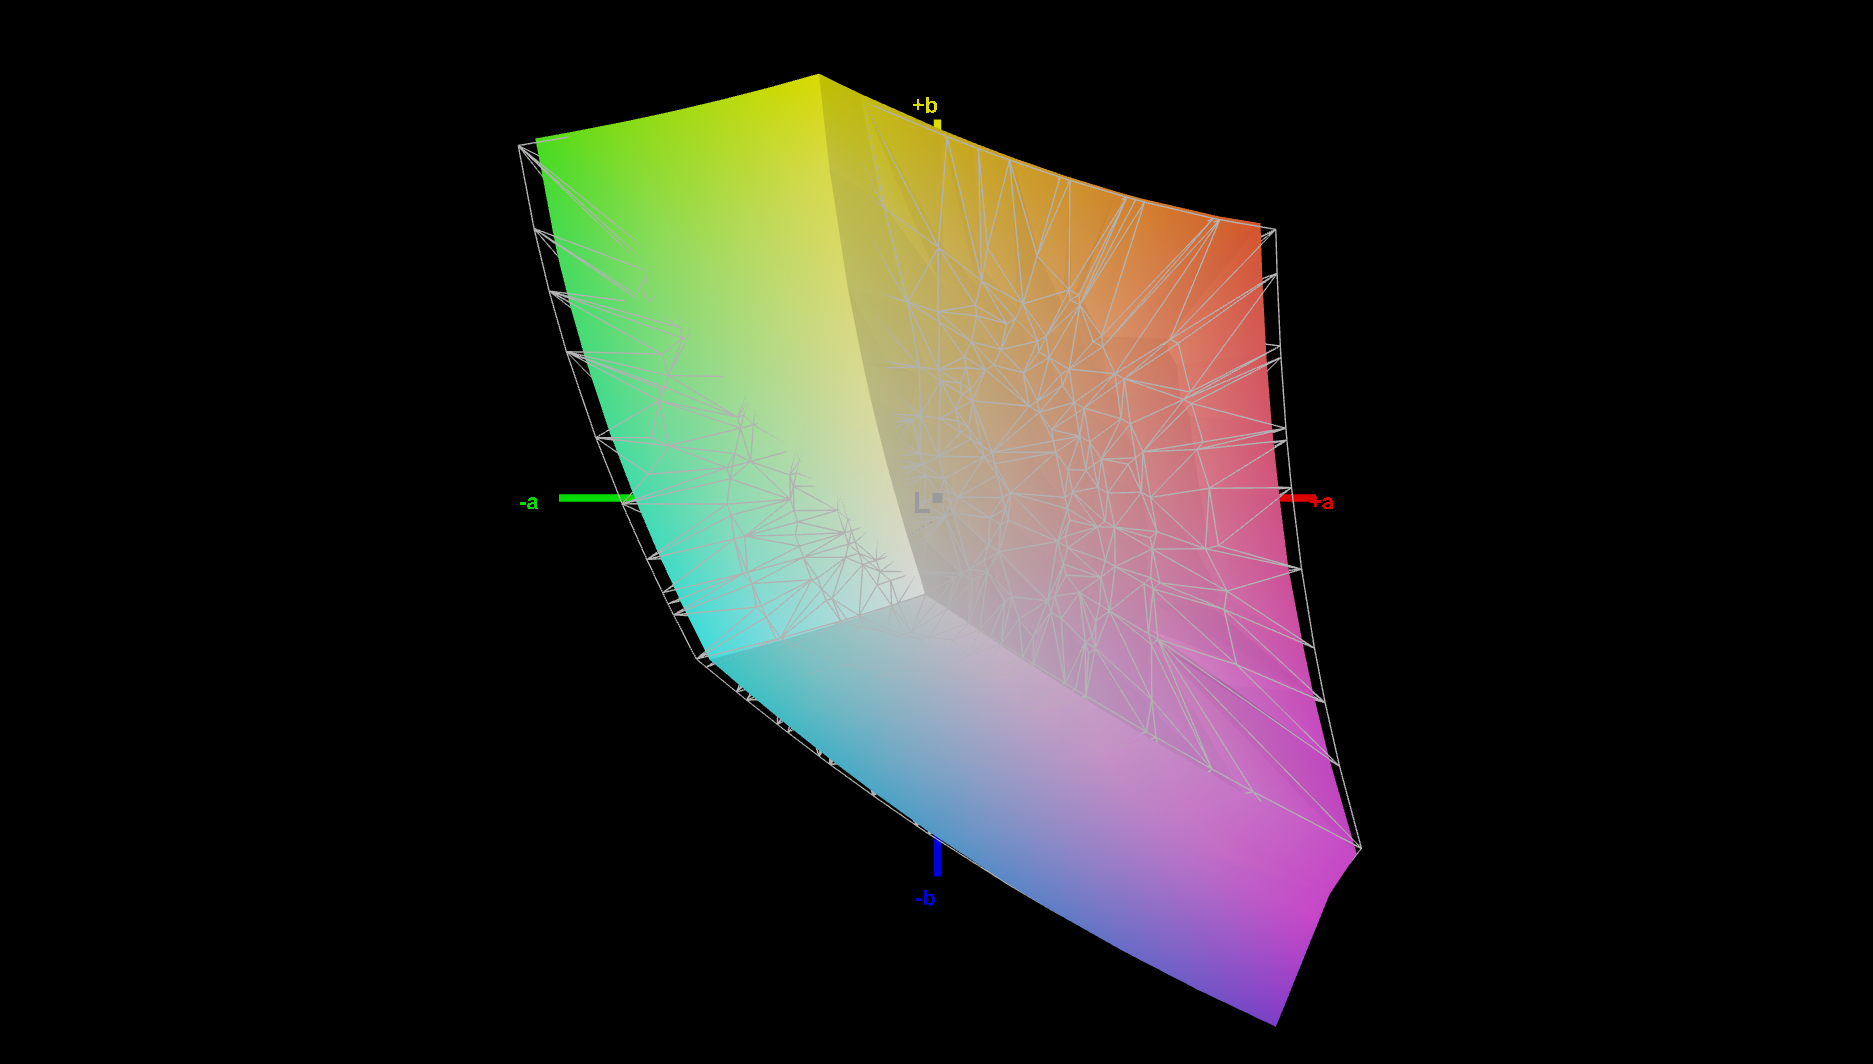
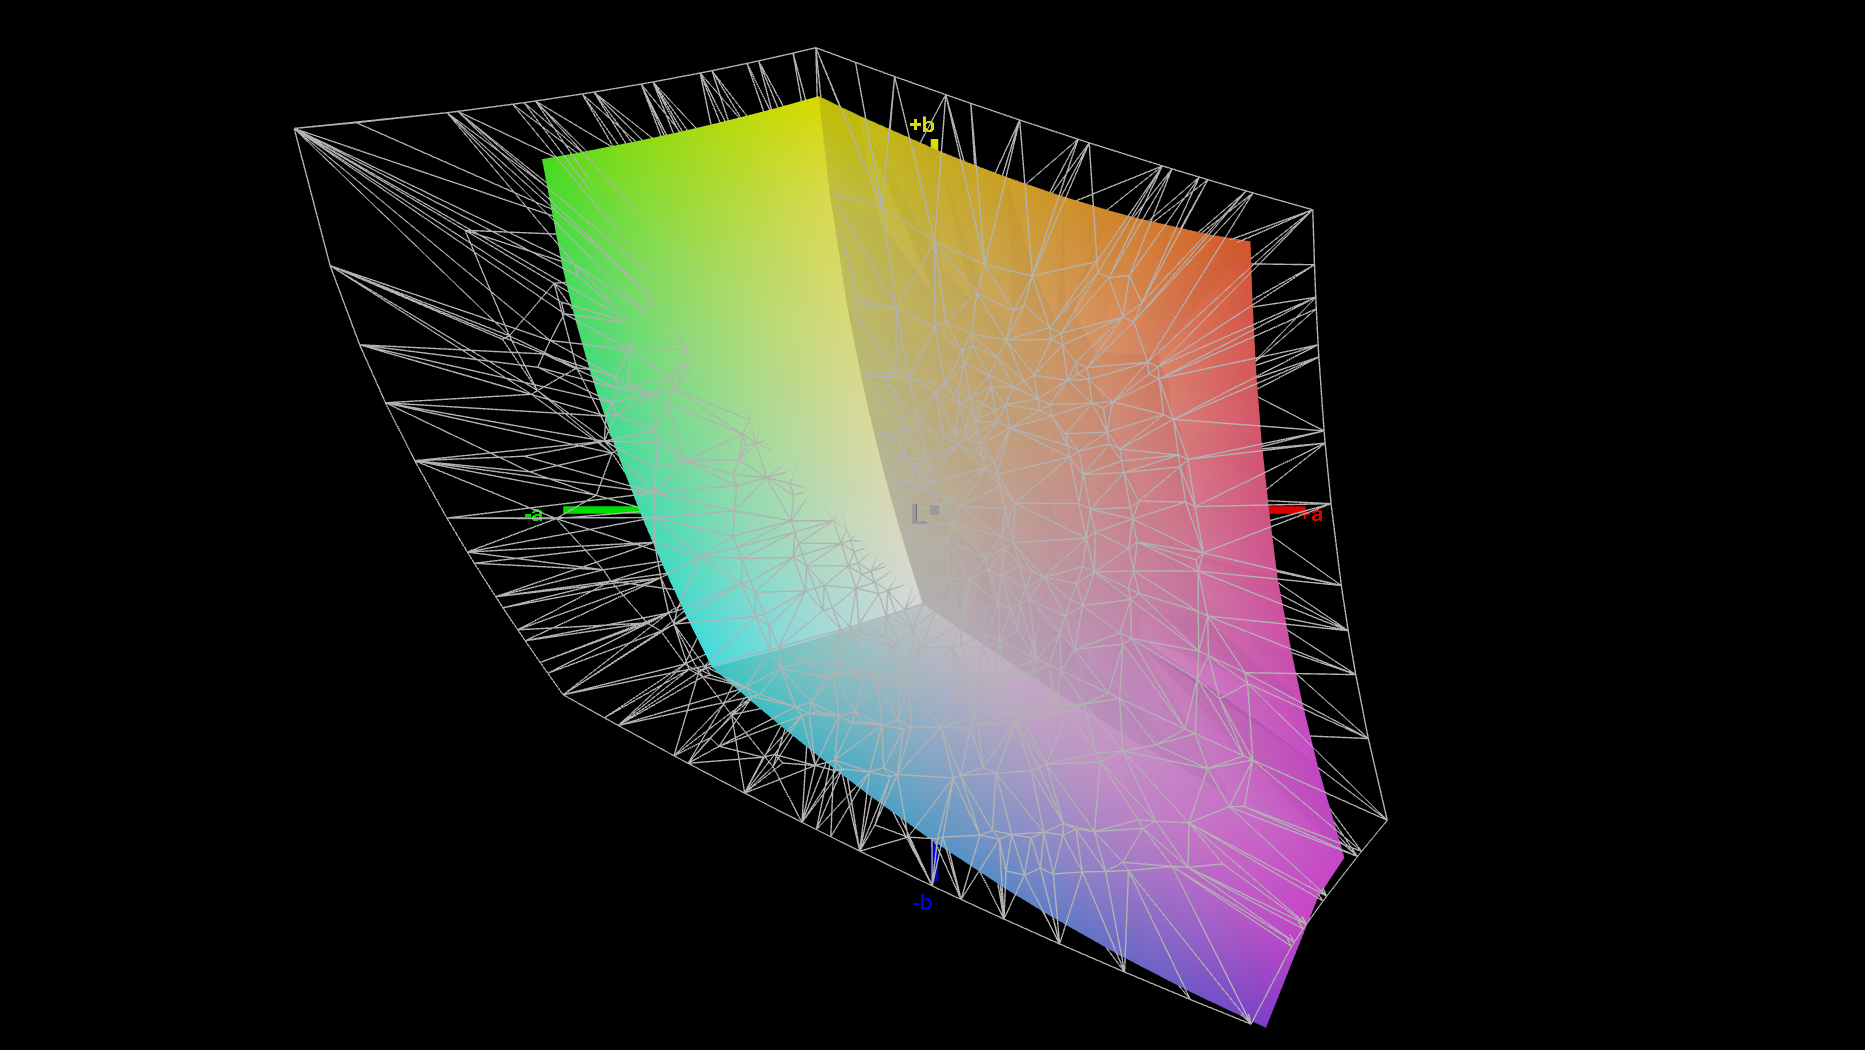
66.5% AdobeRGB 1998 (Argyll 3D)
96.2% sRGB (Argyll 3D)
64.7% Display P3 (Argyll 3D)
Gamma: 2.58
CCT: 6872 K
| Lenovo ThinkPad P1 Gen 9 21UE000MGE N160JCA-GT1, IP LED, 1920x1200, 16", 60 Hz | Lenovo ThinkPad P1 Gen 8 Samsung ATNA60KA02-0, Tandem OLED, 3200x2000, 16", 120 Hz | HP ZBook X G1i 16 LG Philips LGD07B3, IPS, 2560x1600, 16", 120 Hz | Dell XPS 16 Core Ultra X7 358H LG Philips 160WV1, OLED, 3200x2000, 16", 120 Hz | Samsung Galaxy Book6 Ultra ATNA60HR05-0, OLED, 2880x1800, 16", 120 Hz | |
|---|---|---|---|---|---|
| Display | 35% | 35% | 34% | 27% | |
| HDR Peak Brightness (cd/m²) | 518 | 1182 | |||
| Display P3 Coverage (%) | 64.7 | 98.8 53% | 97.2 50% | 99.5 54% | 97 50% |
| sRGB Coverage (%) | 96.2 | 100 4% | 100 4% | 100 4% | 99.9 4% |
| AdobeRGB 1998 Coverage (%) | 66.5 | 97.5 47% | 99.9 50% | 96.5 45% | 85.3 28% |
| Response Times | 97% | -51% | 97% | 98% | |
| Response Time Grey 50% / Grey 80% * (ms) | 27 ? | 0.57 ? 98% | 45.5 ? -69% | 0.65 ? 98% | 0.5 ? 98% |
| Response Time Black / White * (ms) | 19.6 ? | 0.73 ? 96% | 26.1 ? -33% | 0.87 ? 96% | 0.4 ? 98% |
| PWM Frequency (Hz) | 1199 | 26536 ? | 240.2 ? | 240 ? | |
| PWM Amplitude * (%) | 18 | 47 | 31 | 100 | |
| Screen | 32% | -13% | -1% | 33% | |
| Brightness middle (cd/m²) | 527 | 561.8 7% | 461.8 -12% | 395.4 -25% | 499 -5% |
| Brightness (cd/m²) | 495 | 566 14% | 427 -14% | 392 -21% | 505 2% |
| Brightness Distribution (%) | 89 | 99 11% | 88 -1% | 95 7% | 97 9% |
| Black Level * (cd/m²) | 0.36 | 0.46 -28% | |||
| Contrast (:1) | 1464 | 1004 -31% | |||
| Colorchecker dE 2000 * | 3.6 | 1.29 64% | 4.08 -13% | 3.69 -2% | 0.9 75% |
| Colorchecker dE 2000 max. * | 5.3 | 2.96 44% | 8.1 -53% | 7.94 -50% | 2.1 60% |
| Colorchecker dE 2000 calibrated * | 1 | 0.81 19% | 0.75 25% | 0.68 32% | |
| Greyscale dE 2000 * | 3.9 | 1.4 64% | 3.5 10% | 1.9 51% | 1.6 59% |
| Gamma | 2.58 85% | 2.23 99% | 2.15 102% | 2.28 96% | 2.22 99% |
| CCT | 6872 95% | 6319 103% | 6715 97% | 6274 104% | 6445 101% |
| Total Average (Program / Settings) | 55% /
43% | -10% /
-8% | 43% /
24% | 53% /
43% |
* ... smaller is better
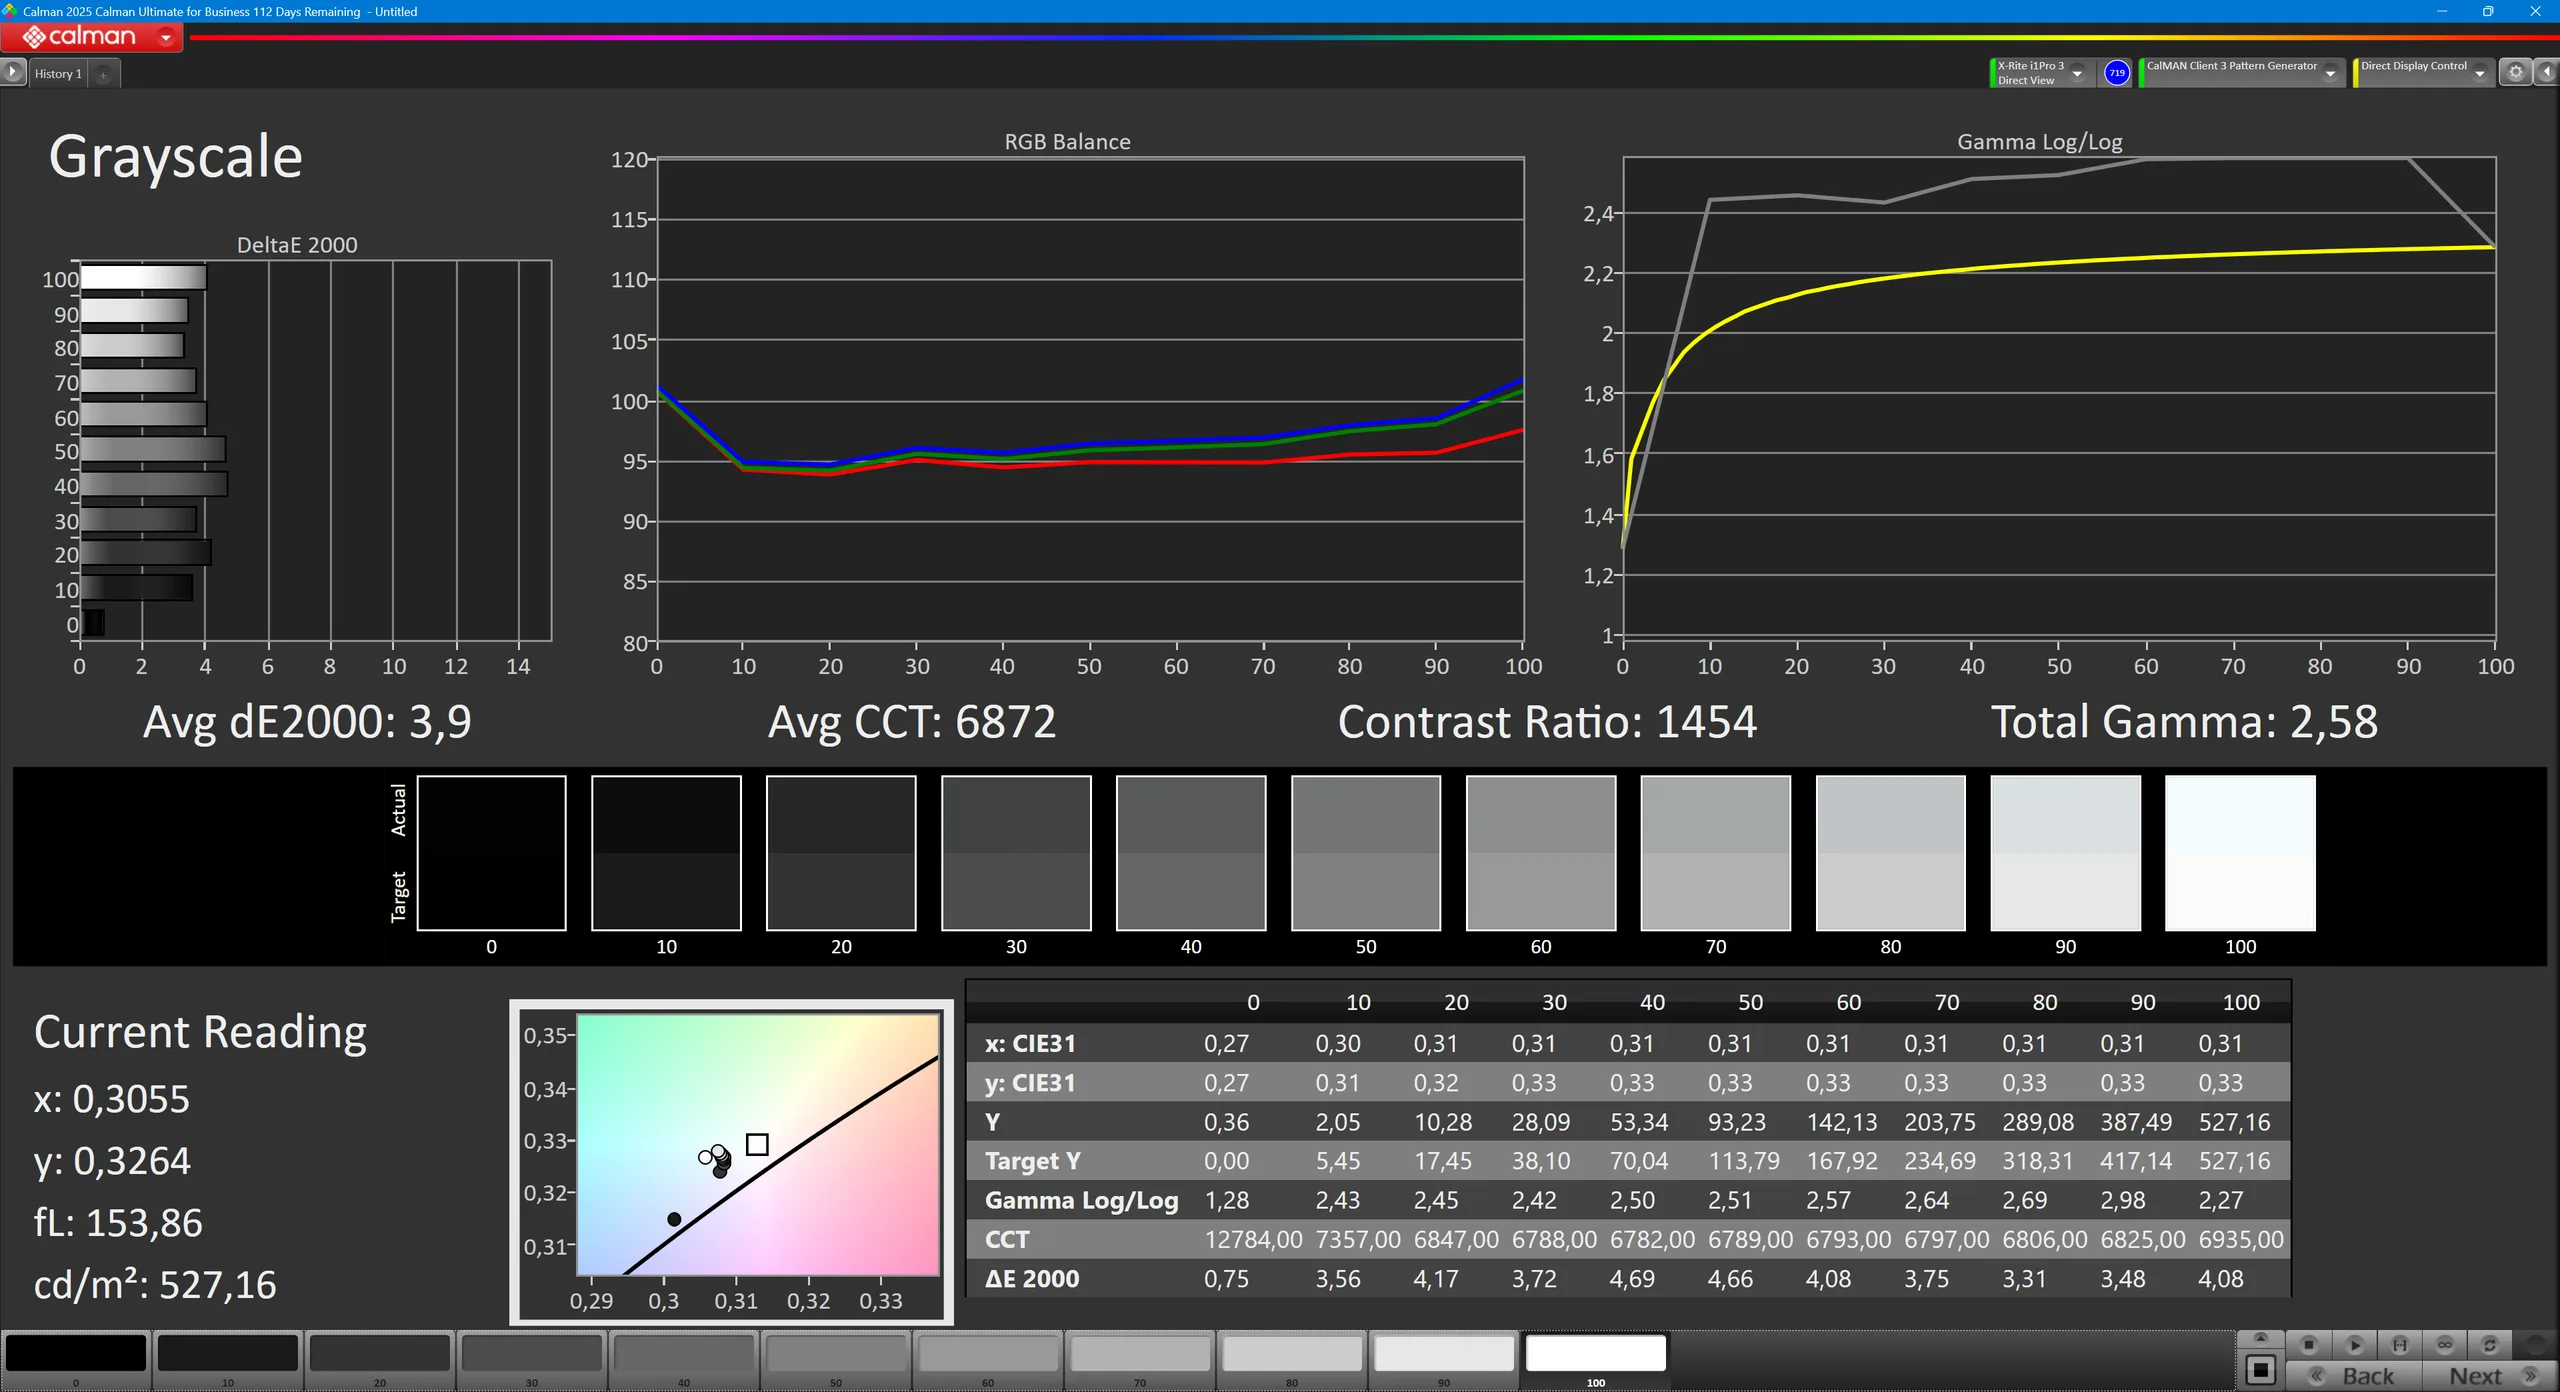
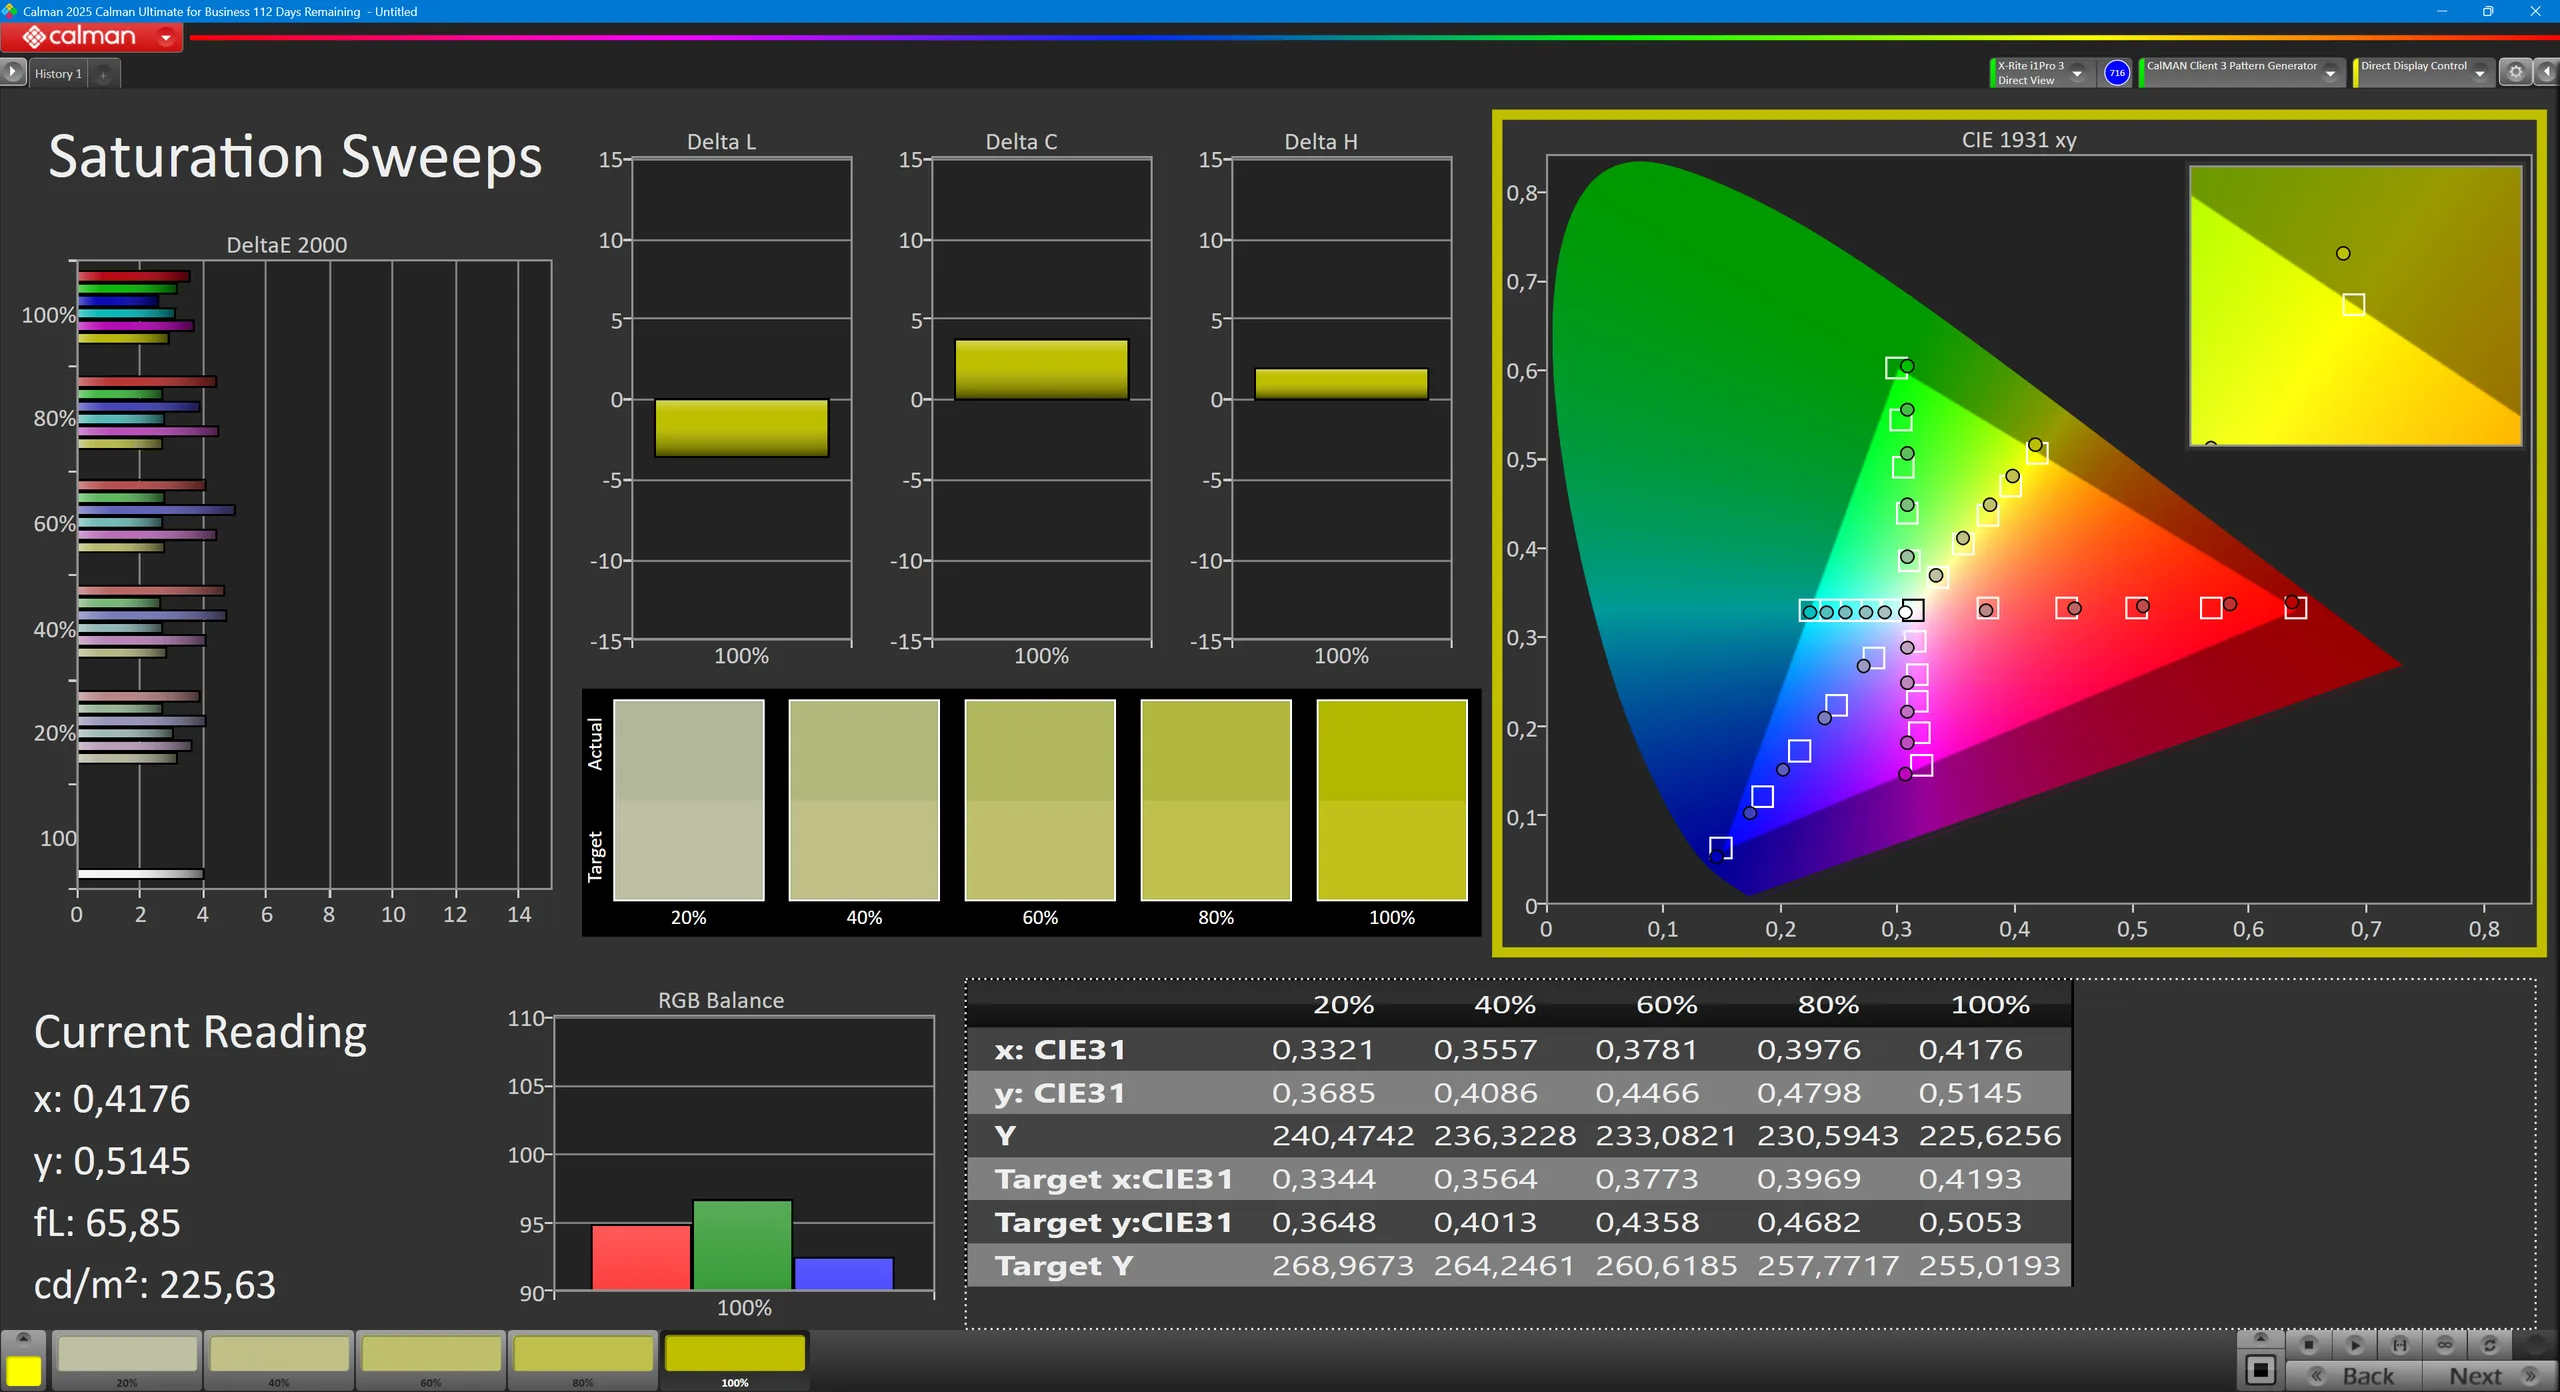

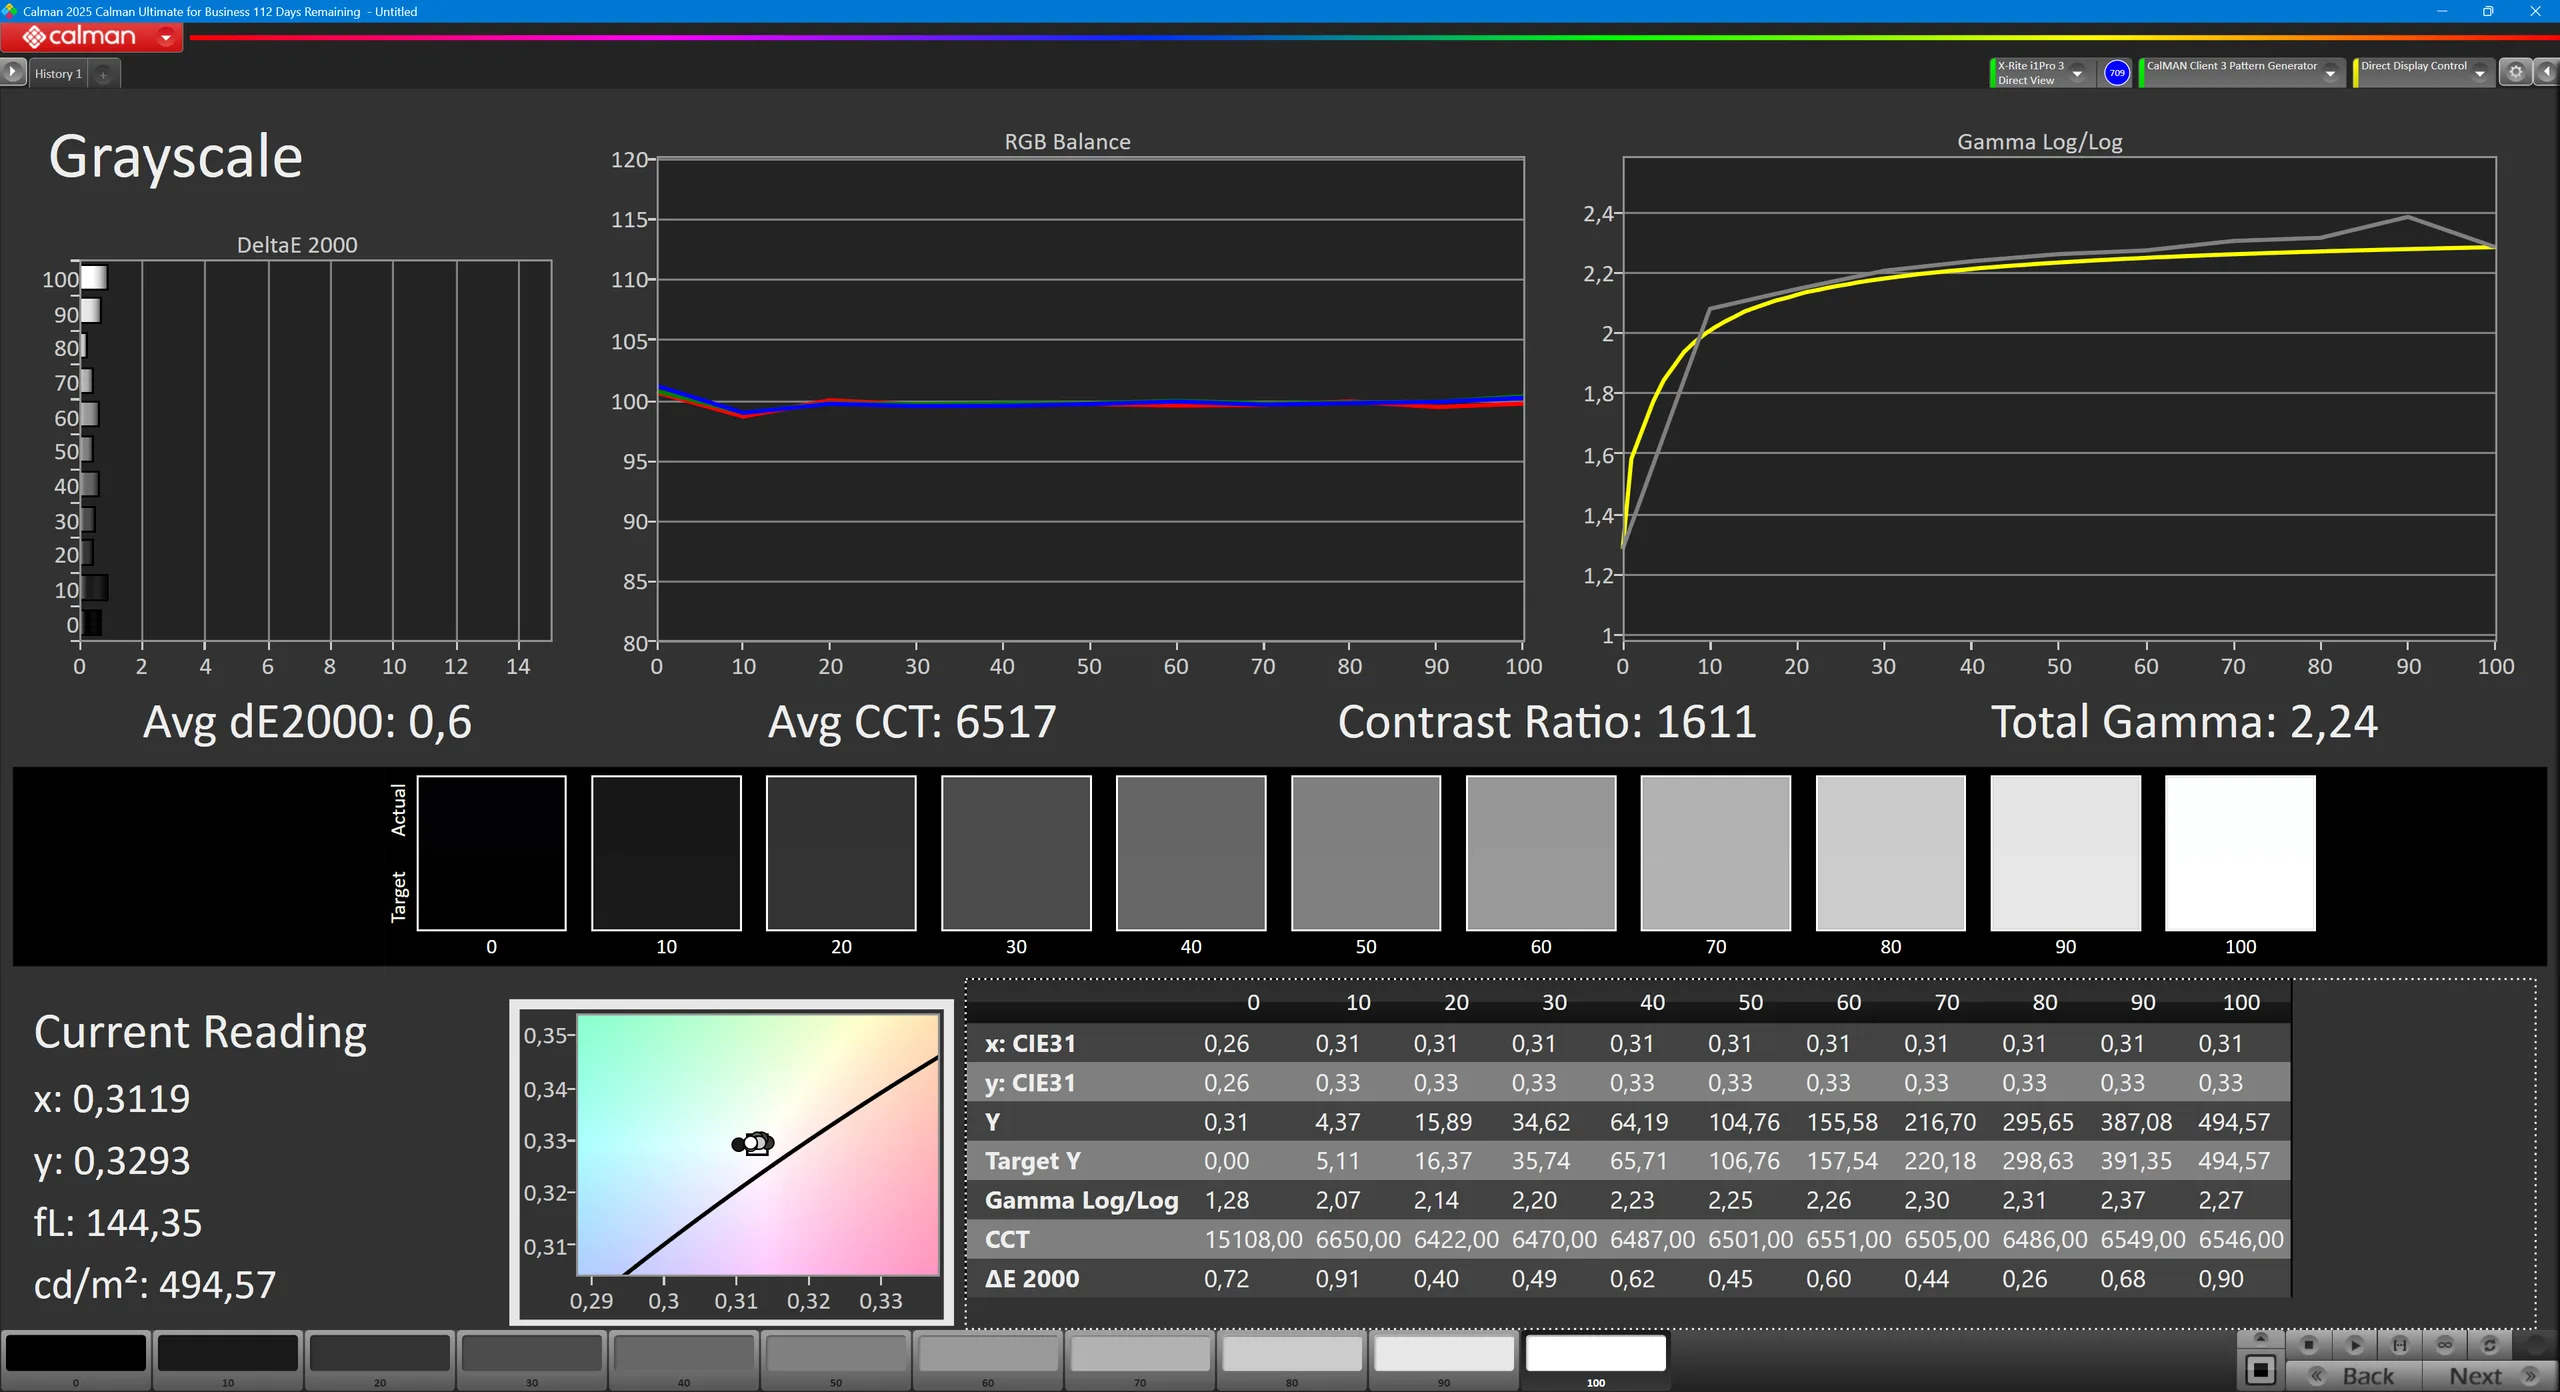

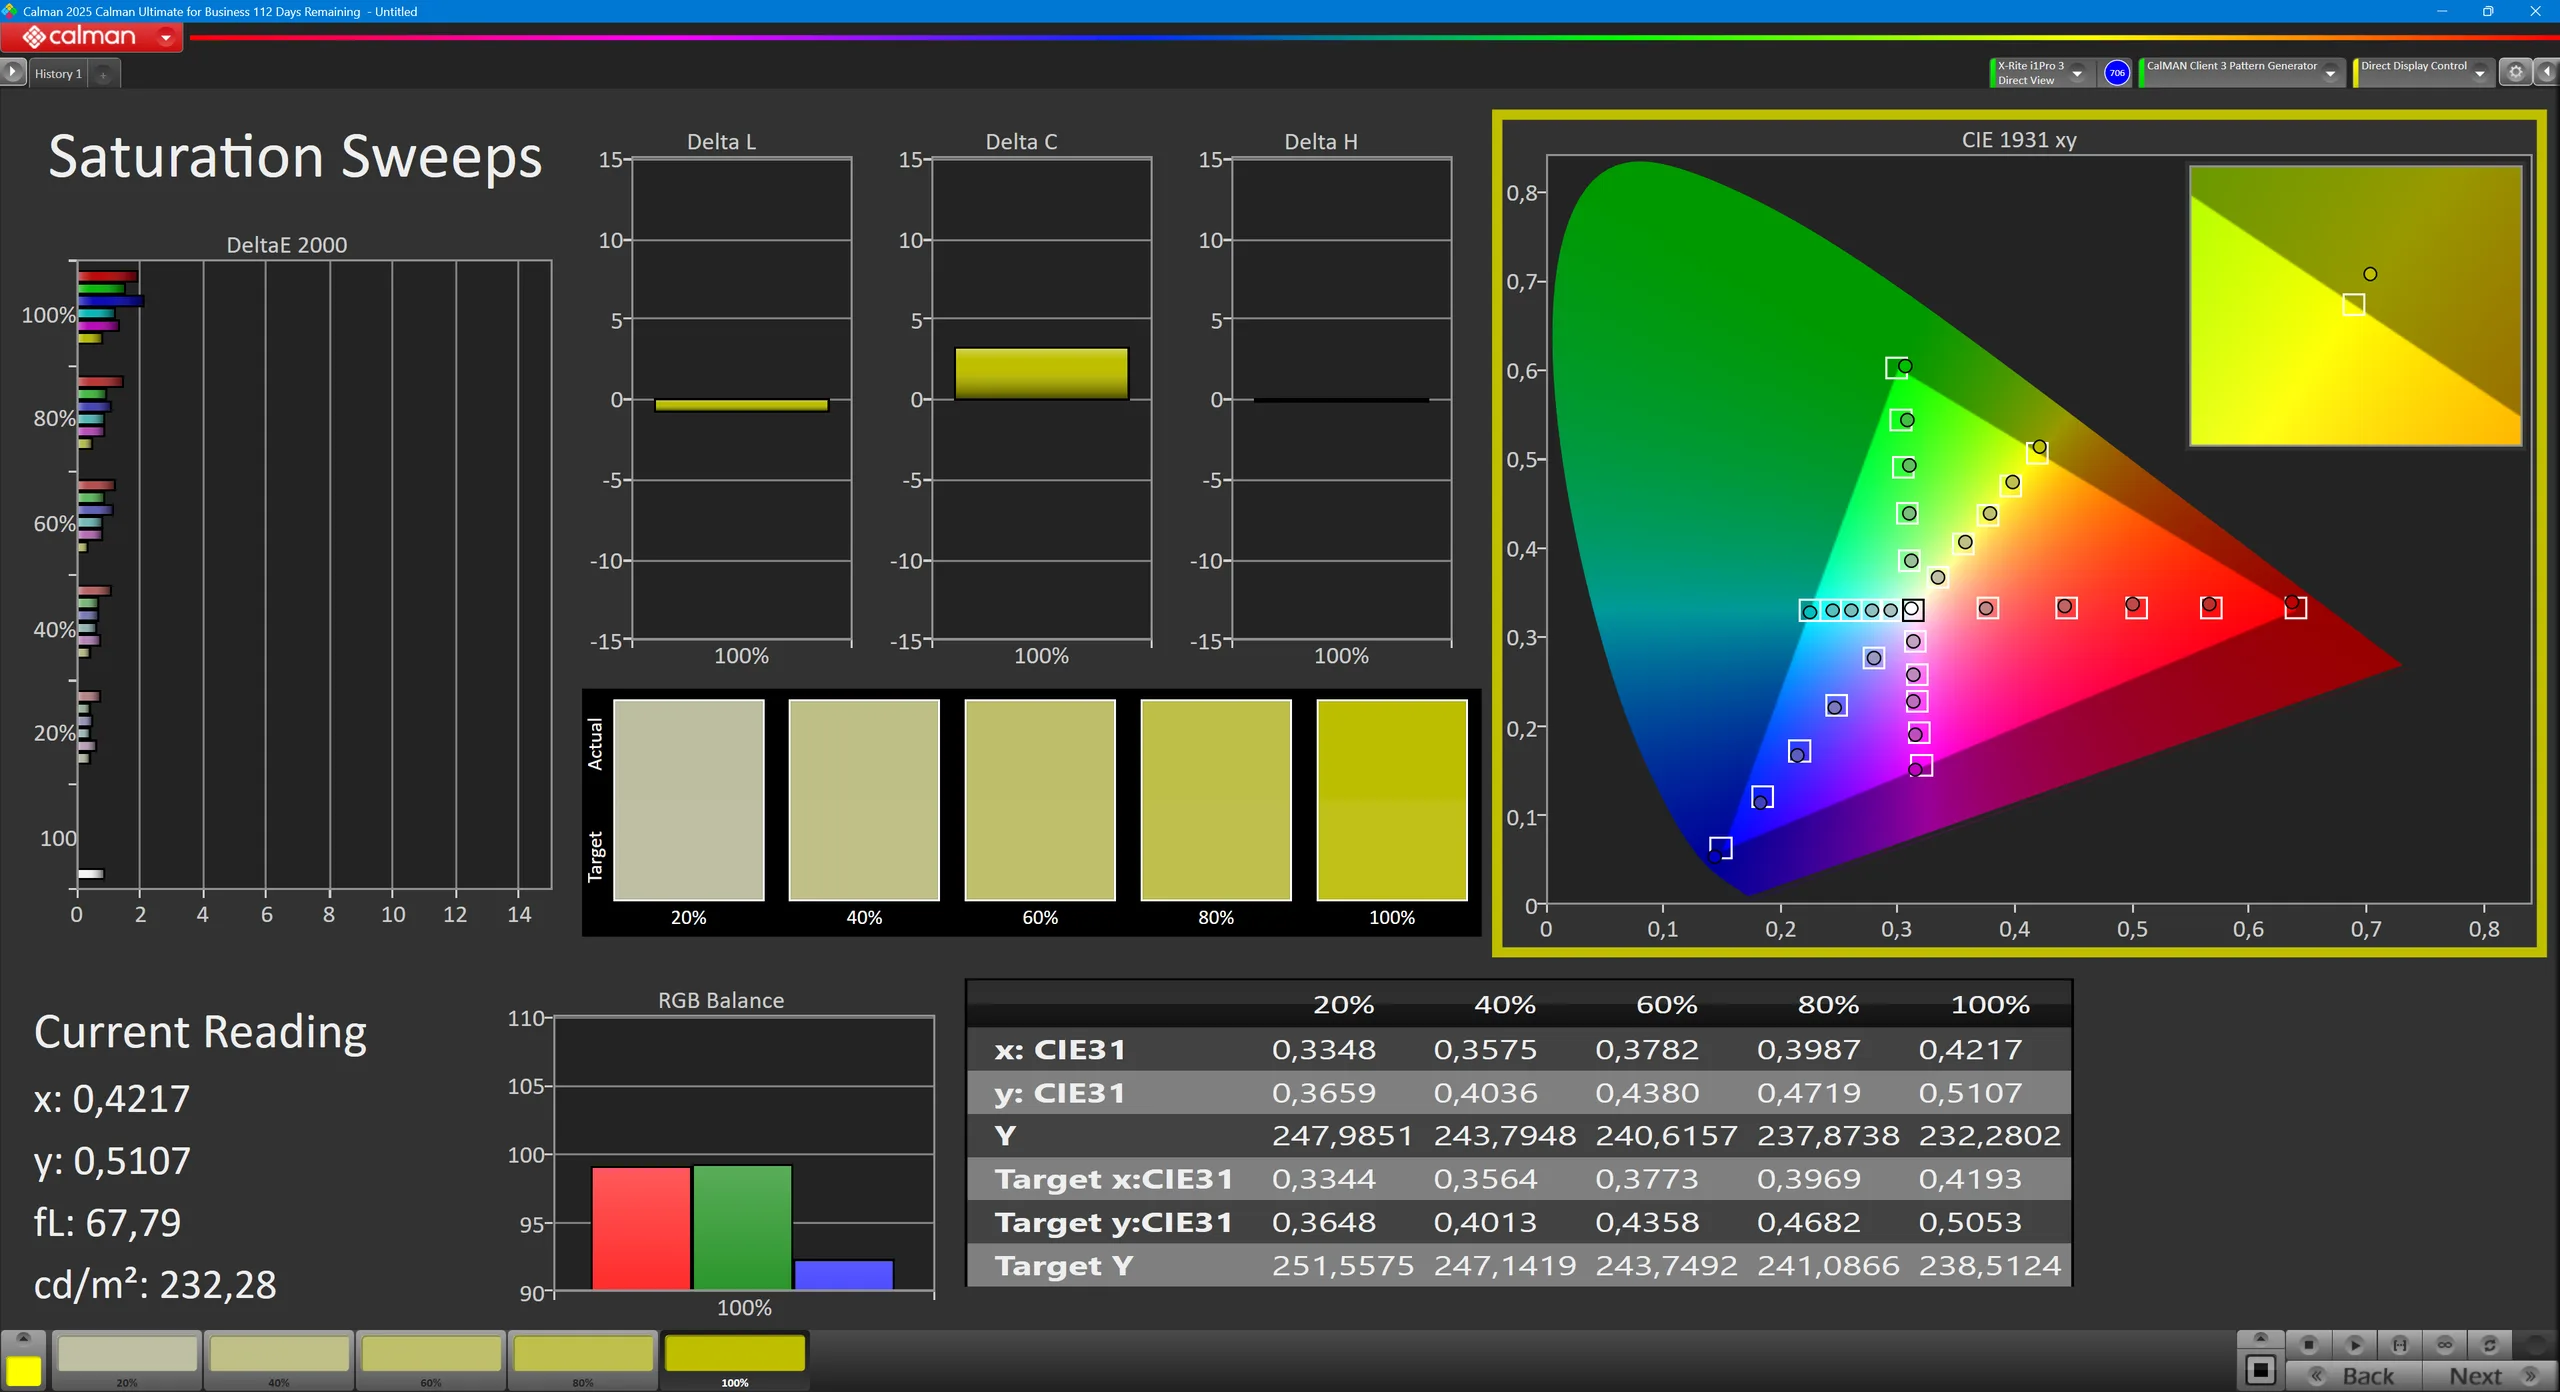
This is a pretty basic panel, but at least it covers almost 100 percent of the sRGB color gamut. This means it can be used for basic color work, and that color accuracy is also high after a calibration.
With almost 500 cd/m² of brightness and a matte surface, this screen is certainly useable outside the office and even in the sun.

Display Response Times
| ↔ Response Time Black to White | ||
|---|---|---|
| 19.6 ms ... rise ↗ and fall ↘ combined | ↗ 11.9 ms rise | 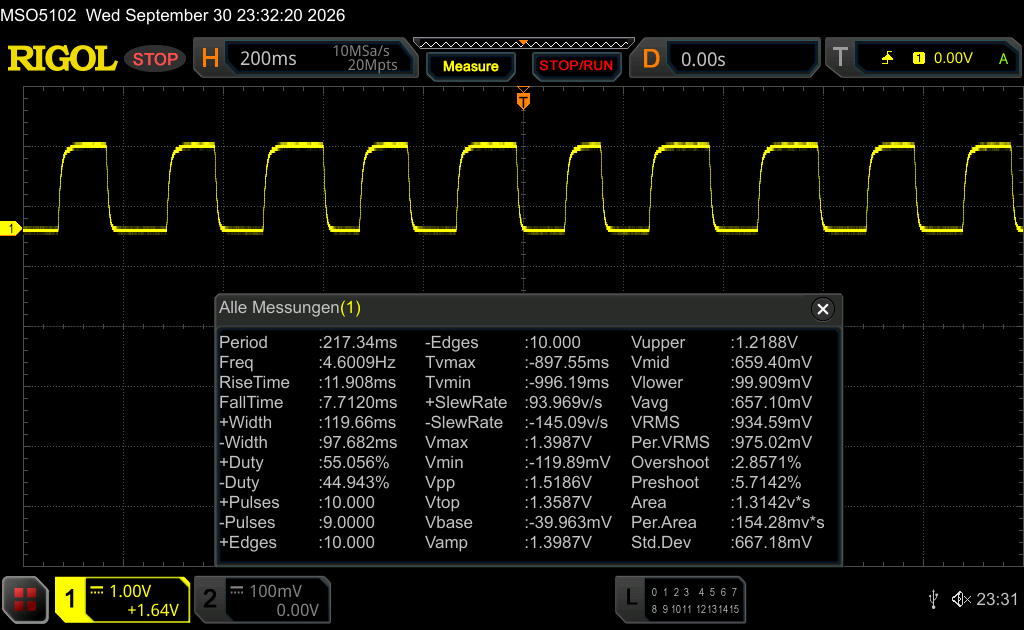 |
| ↘ 7.7 ms fall | ||
| The screen shows good response rates in our tests, but may be too slow for competitive gamers. In comparison, all tested devices range from 0.1 (minimum) to 240 (maximum) ms. » 44 % of all devices are better. This means that the measured response time is similar to the average of all tested devices (19.6 ms). | ||
| ↔ Response Time 50% Grey to 80% Grey | ||
| 27 ms ... rise ↗ and fall ↘ combined | ↗ 10 ms rise | 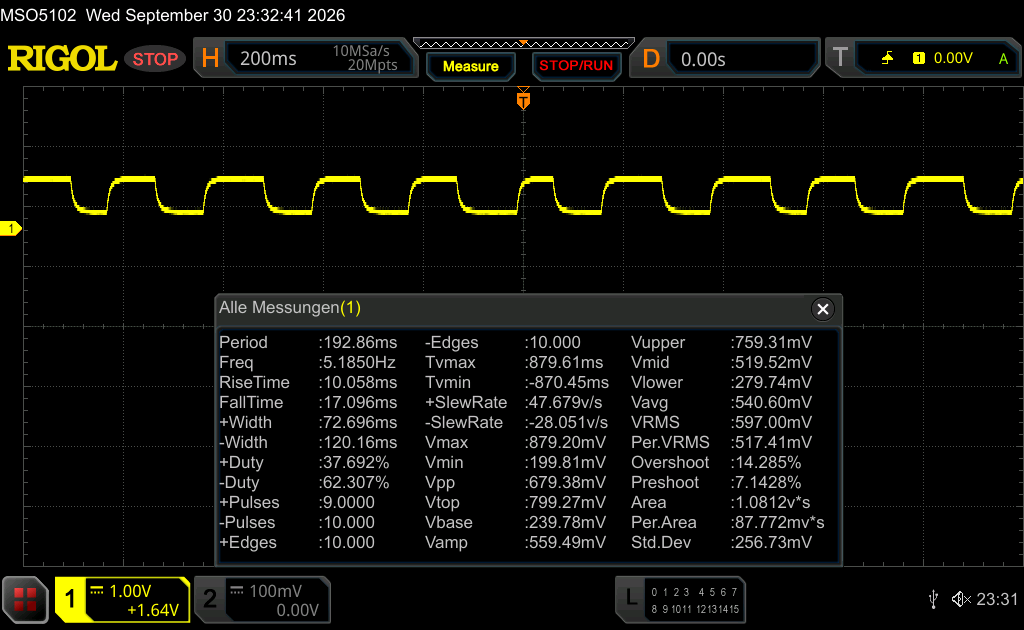 |
| ↘ 17 ms fall | ||
| The screen shows relatively slow response rates in our tests and may be too slow for gamers. In comparison, all tested devices range from 0.13 (minimum) to 636 (maximum) ms. » 37 % of all devices are better. This means that the measured response time is better than the average of all tested devices (30.6 ms). | ||
Screen Flickering / PWM (Pulse-Width Modulation)
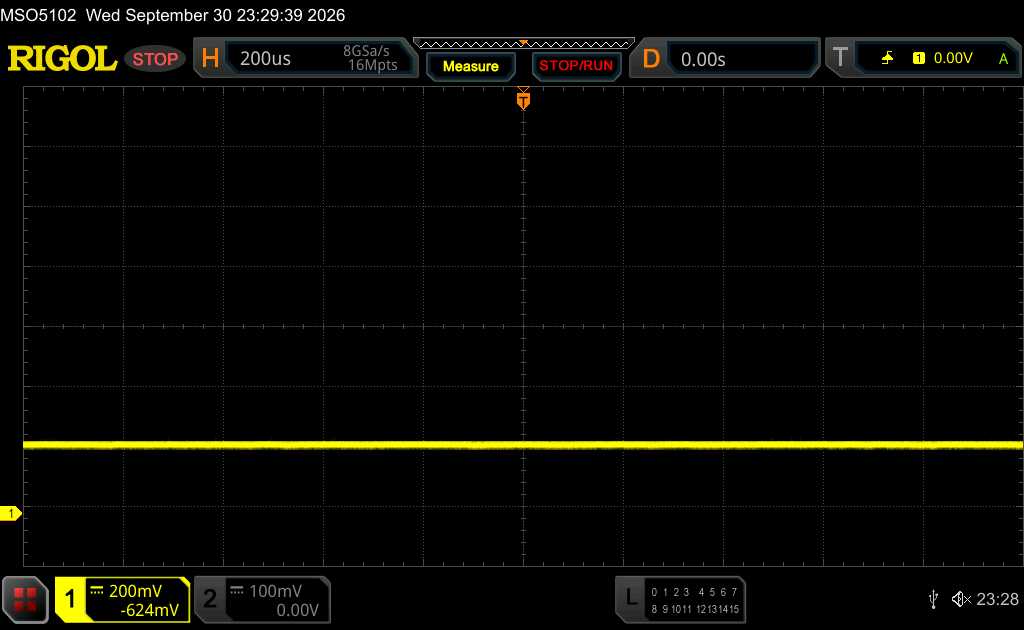
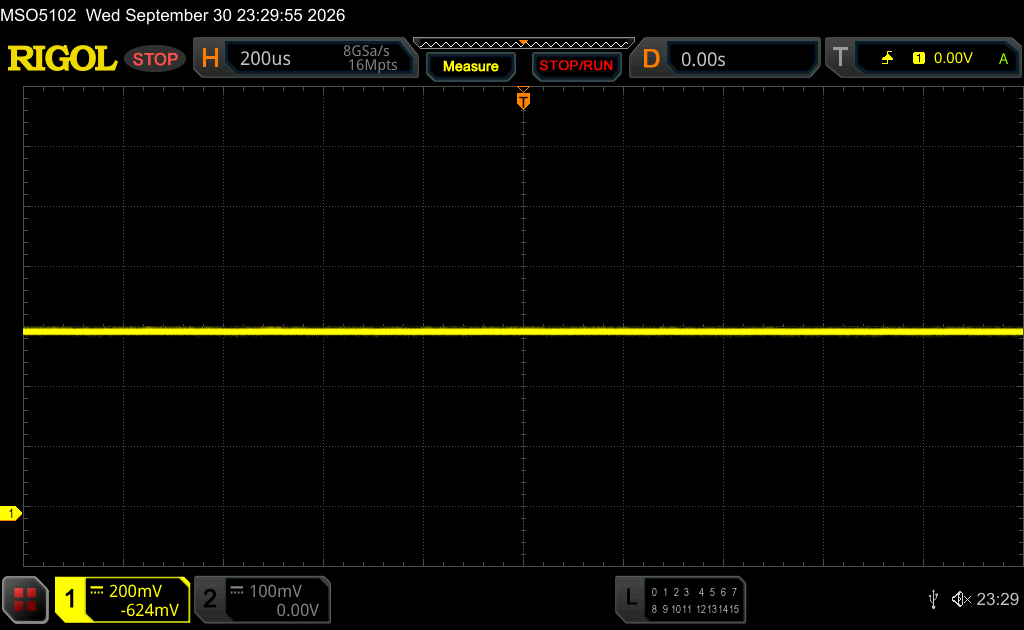
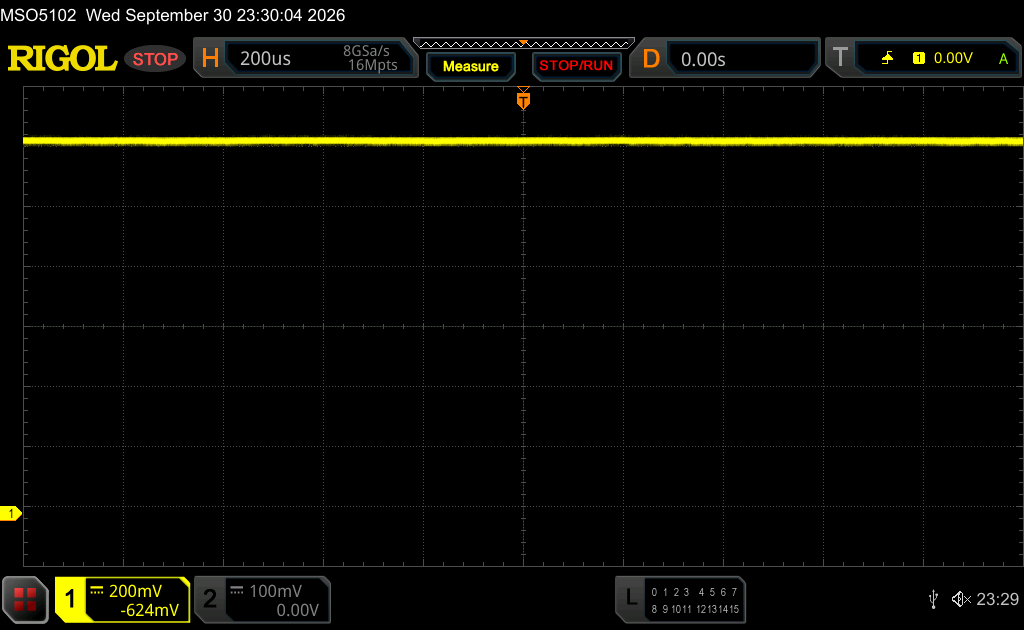
| Screen flickering / PWM not detected | 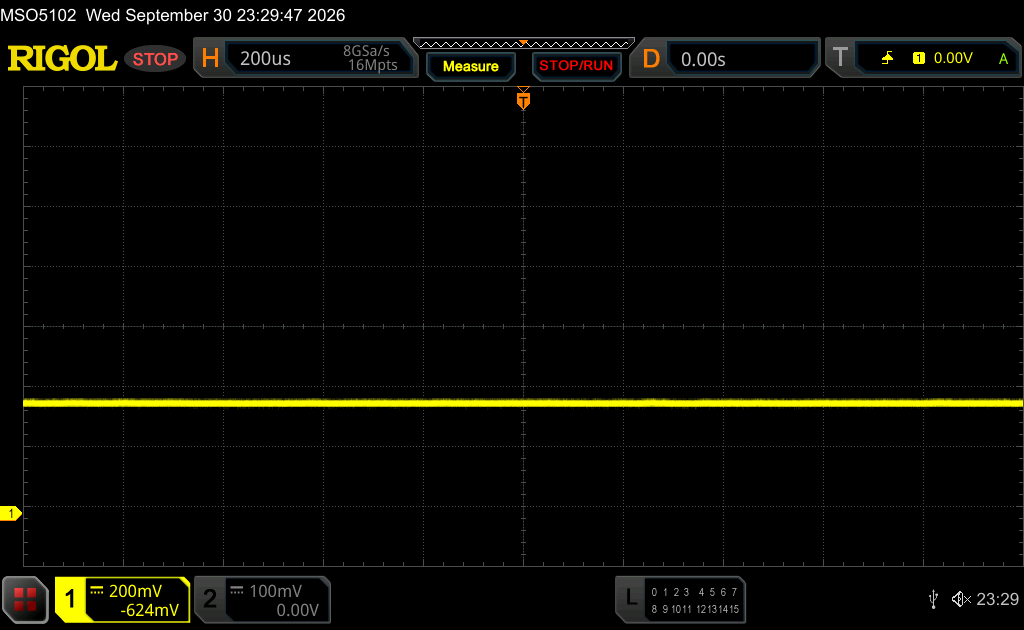 | ||
In comparison: 52 % of all tested devices do not use PWM to dim the display. If PWM was detected, an average of 7556 (minimum: 5 - maximum: 343500) Hz was measured. | |||


Performance
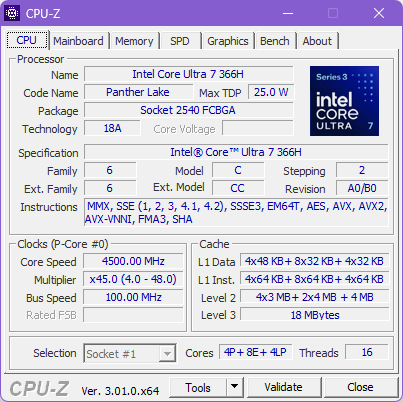
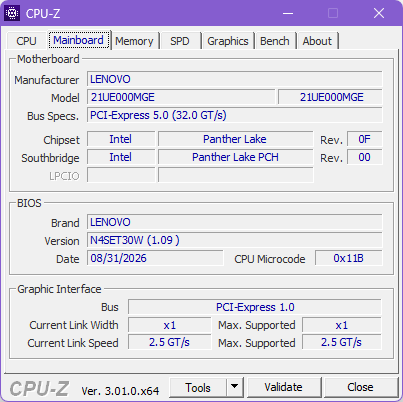
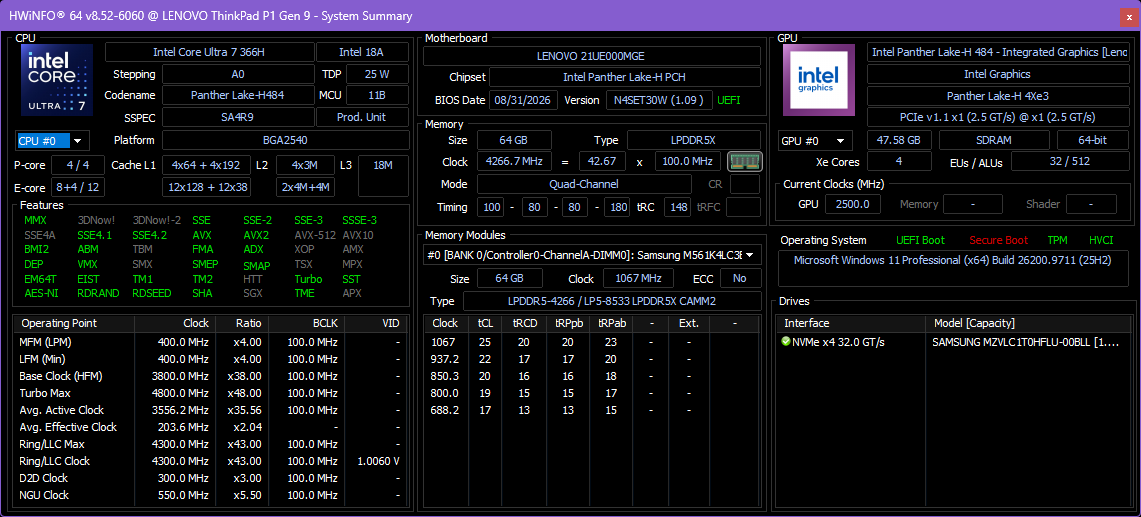
There are a total of six different CPUs offered in the ThinkPad P1 G9, all of which are from Intel (Core Ultra 7 356H, Ultra 7 366H, Ultra 9 386H, Ultra X7 368H, Ultra X9 388H). These CPUs are coupled with different GPUs: The CPUs with a six at the end can be configured with either the Nvidia RTX Pro 1000 Blackwell or RTX Pro 2000 Blackwell, while the CPUs with an eight at the end always come coupled with the integrated Intel ARC B390.
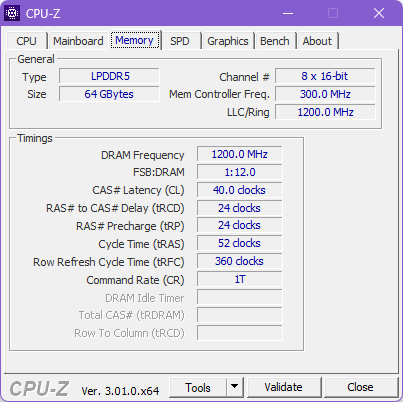
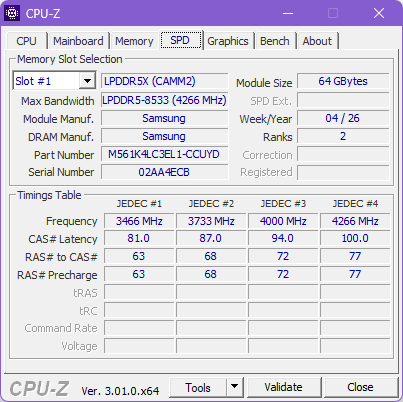
Compared to the older ThinkPad P1 G8, Lenovo has increased the maximum RAM of the single LPCAMM2 module from 64 to 96 GB LPDDR5X-8533 memory. And for the two M.2 2280 slots, one of which supports PCIe 5.0 speed, can take in up to 8 TB of SSD capacity in total (4 TB each).
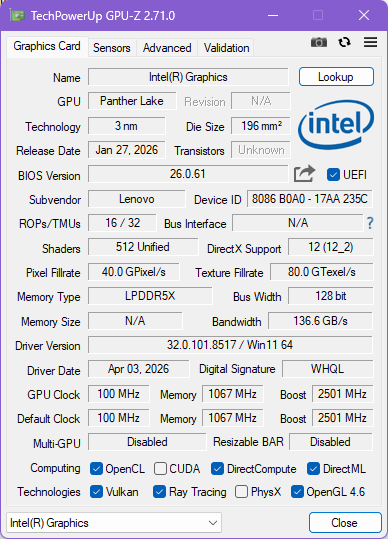
Testing Conditions
There are three Windows power modes, which determine how much power the system feeds to the processor under sustained load (PL1) or as a maximum (PL2):
- Best power efficiency: PL1 20 W / PL2 75 W
- Balanced: PL1 55 W / PL2 80 W
- Best performance: PL1 65 W / PL2 80 W
All benchmarks were performed in the "Best performance" mode.
Processor Performance
The Intel Core Ultra 7 366H is sixteen core CPU of Intel's "Panther Lake" series. The four P cores reach up to 4.8 GHz, while the eight E cores have a maximum clock rate of 3.8 GHz. Last but not least, the four small E cores come in with up to 3.4 GHz. More comparisons with other processors are possible with our CPU benchmark list.
CPU performance is pretty much unchanged compared to the older ThinkPad P1 Gen 8 and its Arrow Lake processor. This is a fast CPU, and it does not throttle much under load, either.
On battery power, the CPU scores only 17,925 points in Cinebench R23 Multicore, a performance loss of 18 percent.
Cinebench R15 Multi Loop
Cinebench R23: Multi Core | Single Core
Cinebench R20: CPU (Multi Core) | CPU (Single Core)
Cinebench R15: CPU Multi 64Bit | CPU Single 64Bit
Blender: v2.79 BMW27 CPU
7-Zip 18.03: 7z b 4 | 7z b 4 -mmt1
Geekbench 6.7: Multi-Core | Single-Core
Geekbench 5.5: Multi-Core | Single-Core
HWBOT x265 Benchmark v2.2: 4k Preset
LibreOffice : 20 Documents To PDF
R Benchmark 2.5: Overall mean
| CPU Performance rating | |
| Average of class Workstation | |
| HP ZBook X G1i 16 | |
| Samsung Galaxy Book6 Ultra | |
| Lenovo ThinkPad P1 Gen 9 21UE000MGE | |
| Lenovo ThinkPad P1 Gen 8 | |
| Dell XPS 16 Core Ultra X7 358H | |
| Average Intel Core Ultra 7 366H | |
| Cinebench R23 / Multi Core | |
| Average of class Workstation (14621 - 38520, n=21, last 2 years) | |
| Lenovo ThinkPad P1 Gen 8 | |
| HP ZBook X G1i 16 | |
| Lenovo ThinkPad P1 Gen 9 21UE000MGE | |
| Samsung Galaxy Book6 Ultra | |
| Average Intel Core Ultra 7 366H (16974 - 21193, n=5) | |
| Dell XPS 16 Core Ultra X7 358H | |
| Cinebench R23 / Single Core | |
| Dell XPS 16 Core Ultra X7 358H | |
| Average Intel Core Ultra 7 366H (2065 - 2089, n=5) | |
| Lenovo ThinkPad P1 Gen 9 21UE000MGE | |
| Samsung Galaxy Book6 Ultra | |
| Average of class Workstation (1712 - 2228, n=21, last 2 years) | |
| HP ZBook X G1i 16 | |
| Lenovo ThinkPad P1 Gen 8 | |
| Cinebench R20 / CPU (Multi Core) | |
| Average of class Workstation (5721 - 15043, n=21, last 2 years) | |
| Lenovo ThinkPad P1 Gen 8 | |
| HP ZBook X G1i 16 | |
| Lenovo ThinkPad P1 Gen 9 21UE000MGE | |
| Samsung Galaxy Book6 Ultra | |
| Dell XPS 16 Core Ultra X7 358H | |
| Average Intel Core Ultra 7 366H (6517 - 8270, n=5) | |
| Cinebench R20 / CPU (Single Core) | |
| Lenovo ThinkPad P1 Gen 9 21UE000MGE | |
| Average of class Workstation (671 - 857, n=21, last 2 years) | |
| Average Intel Core Ultra 7 366H (760 - 791, n=5) | |
| Dell XPS 16 Core Ultra X7 358H | |
| HP ZBook X G1i 16 | |
| Samsung Galaxy Book6 Ultra | |
| Lenovo ThinkPad P1 Gen 8 | |
| Cinebench R15 / CPU Multi 64Bit | |
| Average of class Workstation (2223 - 5810, n=21, last 2 years) | |
| HP ZBook X G1i 16 | |
| Lenovo ThinkPad P1 Gen 8 | |
| Lenovo ThinkPad P1 Gen 9 21UE000MGE | |
| Samsung Galaxy Book6 Ultra | |
| Dell XPS 16 Core Ultra X7 358H | |
| Average Intel Core Ultra 7 366H (2793 - 3259, n=5) | |
| Cinebench R15 / CPU Single 64Bit | |
| Samsung Galaxy Book6 Ultra | |
| HP ZBook X G1i 16 | |
| Dell XPS 16 Core Ultra X7 358H | |
| Lenovo ThinkPad P1 Gen 9 21UE000MGE | |
| Lenovo ThinkPad P1 Gen 8 | |
| Average of class Workstation (191.4 - 328, n=21, last 2 years) | |
| Average Intel Core Ultra 7 366H (291 - 305, n=5) | |
| Blender / v2.79 BMW27 CPU | |
| Dell XPS 16 Core Ultra X7 358H | |
| Average Intel Core Ultra 7 366H (161 - 211, n=5) | |
| Lenovo ThinkPad P1 Gen 8 | |
| HP ZBook X G1i 16 | |
| Samsung Galaxy Book6 Ultra | |
| Lenovo ThinkPad P1 Gen 9 21UE000MGE | |
| Average of class Workstation (91 - 225, n=21, last 2 years) | |
| 7-Zip 18.03 / 7z b 4 | |
| Average of class Workstation (51408 - 116969, n=21, last 2 years) | |
| Lenovo ThinkPad P1 Gen 9 21UE000MGE | |
| Samsung Galaxy Book6 Ultra | |
| HP ZBook X G1i 16 | |
| Lenovo ThinkPad P1 Gen 8 | |
| Dell XPS 16 Core Ultra X7 358H | |
| Average Intel Core Ultra 7 366H (61043 - 71004, n=5) | |
| 7-Zip 18.03 / 7z b 4 -mmt1 | |
| Dell XPS 16 Core Ultra X7 358H | |
| Samsung Galaxy Book6 Ultra | |
| Lenovo ThinkPad P1 Gen 9 21UE000MGE | |
| Average Intel Core Ultra 7 366H (6065 - 6404, n=5) | |
| HP ZBook X G1i 16 | |
| Average of class Workstation (5126 - 6792, n=21, last 2 years) | |
| Lenovo ThinkPad P1 Gen 8 | |
| Geekbench 6.7 / Multi-Core | |
| HP ZBook X G1i 16 | |
| Dell XPS 16 Core Ultra X7 358H | |
| Lenovo ThinkPad P1 Gen 8 | |
| Lenovo ThinkPad P1 Gen 9 21UE000MGE | |
| Samsung Galaxy Book6 Ultra | |
| Average Intel Core Ultra 7 366H (16080 - 16948, n=7) | |
| Average of class Workstation (12139 - 20887, n=21, last 2 years) | |
| Geekbench 6.7 / Single-Core | |
| HP ZBook X G1i 16 | |
| Dell XPS 16 Core Ultra X7 358H | |
| Average of class Workstation (2495 - 3065, n=21, last 2 years) | |
| Samsung Galaxy Book6 Ultra | |
| Average Intel Core Ultra 7 366H (2819 - 2866, n=6) | |
| Lenovo ThinkPad P1 Gen 9 21UE000MGE | |
| Lenovo ThinkPad P1 Gen 8 | |
| Geekbench 5.5 / Multi-Core | |
| Average of class Workstation (11542 - 25554, n=20, last 2 years) | |
| Lenovo ThinkPad P1 Gen 9 21UE000MGE | |
| Dell XPS 16 Core Ultra X7 358H | |
| Samsung Galaxy Book6 Ultra | |
| Average Intel Core Ultra 7 366H (15891 - 16949, n=4) | |
| Lenovo ThinkPad P1 Gen 8 | |
| HP ZBook X G1i 16 | |
| Geekbench 5.5 / Single-Core | |
| Dell XPS 16 Core Ultra X7 358H | |
| Lenovo ThinkPad P1 Gen 9 21UE000MGE | |
| Average Intel Core Ultra 7 366H (2085 - 2125, n=4) | |
| Samsung Galaxy Book6 Ultra | |
| Average of class Workstation (1848 - 2183, n=20, last 2 years) | |
| HP ZBook X G1i 16 | |
| Lenovo ThinkPad P1 Gen 8 | |
| HWBOT x265 Benchmark v2.2 / 4k Preset | |
| Average of class Workstation (17.8 - 40.5, n=21, last 2 years) | |
| Lenovo ThinkPad P1 Gen 8 | |
| HP ZBook X G1i 16 | |
| Samsung Galaxy Book6 Ultra | |
| Lenovo ThinkPad P1 Gen 9 21UE000MGE | |
| Dell XPS 16 Core Ultra X7 358H | |
| Average Intel Core Ultra 7 366H (19.2 - 24.6, n=5) | |
| LibreOffice / 20 Documents To PDF | |
| Lenovo ThinkPad P1 Gen 9 21UE000MGE | |
| Dell XPS 16 Core Ultra X7 358H | |
| Average of class Workstation (37.1 - 74.7, n=21, last 2 years) | |
| Samsung Galaxy Book6 Ultra | |
| Average Intel Core Ultra 7 366H (40.3 - 52.7, n=5) | |
| HP ZBook X G1i 16 | |
| Lenovo ThinkPad P1 Gen 8 | |
| R Benchmark 2.5 / Overall mean | |
| Lenovo ThinkPad P1 Gen 9 21UE000MGE | |
| Average of class Workstation (0.3974 - 0.603, n=21, last 2 years) | |
| Lenovo ThinkPad P1 Gen 8 | |
| Average Intel Core Ultra 7 366H (0.4144 - 0.4581, n=5) | |
| Samsung Galaxy Book6 Ultra | |
| HP ZBook X G1i 16 | |
| Dell XPS 16 Core Ultra X7 358H | |
* ... smaller is better
AIDA64: FP32 Ray-Trace | FPU Julia | CPU SHA3 | CPU Queen | FPU SinJulia | FPU Mandel | CPU AES | CPU ZLib | FP64 Ray-Trace | CPU PhotoWorxx | CPU CheckMate
| Performance rating | |
| Average of class Workstation | |
| Lenovo ThinkPad P1 Gen 8 -1! | |
| Lenovo ThinkPad P1 Gen 9 21UE000MGE -1! | |
| Samsung Galaxy Book6 Ultra -1! | |
| Average Intel Core Ultra 7 366H -1! | |
| Dell XPS 16 Core Ultra X7 358H -1! | |
| AIDA64 / FP32 Ray-Trace | |
| Average of class Workstation (16730 - 61611, n=21, last 2 years) | |
| Lenovo ThinkPad P1 Gen 8 (v6.92.6600) | |
| Lenovo ThinkPad P1 Gen 9 21UE000MGE (v8.20.8100) | |
| Samsung Galaxy Book6 Ultra (v8.20.8100) | |
| Average Intel Core Ultra 7 366H (14248 - 20583, n=5) | |
| Dell XPS 16 Core Ultra X7 358H (v8.20.8100) | |
| AIDA64 / FPU Julia | |
| Average of class Workstation (89740 - 186971, n=21, last 2 years) | |
| Lenovo ThinkPad P1 Gen 8 (v6.92.6600) | |
| Samsung Galaxy Book6 Ultra (v8.20.8100) | |
| Lenovo ThinkPad P1 Gen 9 21UE000MGE (v8.20.8100) | |
| Average Intel Core Ultra 7 366H (75534 - 107380, n=5) | |
| Dell XPS 16 Core Ultra X7 358H (v8.20.8100) | |
| AIDA64 / CPU SHA3 | |
| Average of class Workstation (3590 - 8975, n=21, last 2 years) | |
| Lenovo ThinkPad P1 Gen 8 (v6.92.6600) | |
| Samsung Galaxy Book6 Ultra (v8.20.8100) | |
| Lenovo ThinkPad P1 Gen 9 21UE000MGE (v8.20.8100) | |
| Average Intel Core Ultra 7 366H (3837 - 5249, n=5) | |
| Dell XPS 16 Core Ultra X7 358H (v8.20.8100) | |
| AIDA64 / CPU Queen | |
| Average of class Workstation (60778 - 137783, n=18, last 2 years) | |
| Lenovo ThinkPad P1 Gen 8 (v6.92.6600) | |
| AIDA64 / FPU SinJulia | |
| Average of class Workstation (7136 - 29343, n=21, last 2 years) | |
| Lenovo ThinkPad P1 Gen 8 (v6.92.6600) | |
| Lenovo ThinkPad P1 Gen 9 21UE000MGE (v8.20.8100) | |
| Samsung Galaxy Book6 Ultra (v8.20.8100) | |
| Average Intel Core Ultra 7 366H (6482 - 7136, n=5) | |
| Dell XPS 16 Core Ultra X7 358H (v8.20.8100) | |
| AIDA64 / FPU Mandel | |
| Average of class Workstation (44497 - 98153, n=21, last 2 years) | |
| Lenovo ThinkPad P1 Gen 8 (v6.92.6600) | |
| Samsung Galaxy Book6 Ultra (v8.20.8100) | |
| Lenovo ThinkPad P1 Gen 9 21UE000MGE (v8.20.8100) | |
| Average Intel Core Ultra 7 366H (40198 - 57706, n=5) | |
| Dell XPS 16 Core Ultra X7 358H (v8.20.8100) | |
| AIDA64 / CPU AES | |
| Average of class Workstation (68072 - 187841, n=21, last 2 years) | |
| Lenovo ThinkPad P1 Gen 8 (v6.92.6600) | |
| Lenovo ThinkPad P1 Gen 9 21UE000MGE (v8.20.8100) | |
| Samsung Galaxy Book6 Ultra (v8.20.8100) | |
| Average Intel Core Ultra 7 366H (57542 - 68072, n=5) | |
| Dell XPS 16 Core Ultra X7 358H (v8.20.8100) | |
| AIDA64 / CPU ZLib | |
| Average of class Workstation (917 - 2148, n=21, last 2 years) | |
| Lenovo ThinkPad P1 Gen 8 (v6.92.6600) | |
| Lenovo ThinkPad P1 Gen 9 21UE000MGE (v8.20.8100) | |
| Samsung Galaxy Book6 Ultra (v8.20.8100) | |
| Average Intel Core Ultra 7 366H (921 - 1219, n=5) | |
| Dell XPS 16 Core Ultra X7 358H (v8.20.8100) | |
| AIDA64 / FP64 Ray-Trace | |
| Average of class Workstation (8545 - 32891, n=21, last 2 years) | |
| Lenovo ThinkPad P1 Gen 8 (v6.92.6600) | |
| Samsung Galaxy Book6 Ultra (v8.20.8100) | |
| Lenovo ThinkPad P1 Gen 9 21UE000MGE (v8.20.8100) | |
| Average Intel Core Ultra 7 366H (7395 - 11027, n=5) | |
| Dell XPS 16 Core Ultra X7 358H (v8.20.8100) | |
| AIDA64 / CPU PhotoWorxx | |
| Dell XPS 16 Core Ultra X7 358H (v8.20.8100) | |
| Lenovo ThinkPad P1 Gen 9 21UE000MGE (v8.20.8100) | |
| Samsung Galaxy Book6 Ultra (v8.20.8100) | |
| Average Intel Core Ultra 7 366H (74842 - 83297, n=5) | |
| Lenovo ThinkPad P1 Gen 8 (v6.92.6600) | |
| Average of class Workstation (37482 - 93684, n=21, last 2 years) | |
| AIDA64 / CPU CheckMate | |
| Average of class Workstation (4591 - 7823, n=3, last 2 years) | |
| Samsung Galaxy Book6 Ultra (v8.20.8100) | |
| Lenovo ThinkPad P1 Gen 9 21UE000MGE (v8.20.8100) | |
| Average Intel Core Ultra 7 366H (4202 - 4591, n=5) | |
| Dell XPS 16 Core Ultra X7 358H (v8.20.8100) | |
System performance
PCMark 10: Score | Essentials | Productivity | Digital Content Creation
CrossMark: Overall | Productivity | Creativity | Responsiveness
WebXPRT 3: Overall
WebXPRT 4: Overall
Mozilla Kraken 1.1: Total
| Performance rating | |
| Apple MacBook Pro 16 2026 M5 Pro -4! | |
| Lenovo ThinkPad P1 Gen 9 21UE000MGE | |
| Average Intel Core Ultra 7 366H, NVIDIA RTX PRO 2000 Blackwell Generation Laptop | |
| Dell XPS 16 Core Ultra X7 358H | |
| Lenovo ThinkPad P1 Gen 8 | |
| Samsung Galaxy Book6 Ultra | |
| Average of class Workstation | |
| HP ZBook X G1i 16 -4! | |
| PCMark 10 / Score | |
| Dell XPS 16 Core Ultra X7 358H | |
| Lenovo ThinkPad P1 Gen 8 | |
| Lenovo ThinkPad P1 Gen 9 21UE000MGE | |
| Average Intel Core Ultra 7 366H, NVIDIA RTX PRO 2000 Blackwell Generation Laptop (n=1) | |
| Samsung Galaxy Book6 Ultra | |
| Average of class Workstation (6563 - 10409, n=17, last 2 years) | |
| PCMark 10 / Essentials | |
| Dell XPS 16 Core Ultra X7 358H | |
| Lenovo ThinkPad P1 Gen 8 | |
| Average of class Workstation (9622 - 11087, n=17, last 2 years) | |
| Lenovo ThinkPad P1 Gen 9 21UE000MGE | |
| Average Intel Core Ultra 7 366H, NVIDIA RTX PRO 2000 Blackwell Generation Laptop (n=1) | |
| Samsung Galaxy Book6 Ultra | |
| PCMark 10 / Productivity | |
| Lenovo ThinkPad P1 Gen 8 | |
| Lenovo ThinkPad P1 Gen 9 21UE000MGE | |
| Average Intel Core Ultra 7 366H, NVIDIA RTX PRO 2000 Blackwell Generation Laptop (n=1) | |
| Samsung Galaxy Book6 Ultra | |
| Dell XPS 16 Core Ultra X7 358H | |
| Average of class Workstation (8789 - 20616, n=17, last 2 years) | |
| PCMark 10 / Digital Content Creation | |
| Dell XPS 16 Core Ultra X7 358H | |
| Samsung Galaxy Book6 Ultra | |
| Lenovo ThinkPad P1 Gen 8 | |
| Lenovo ThinkPad P1 Gen 9 21UE000MGE | |
| Average Intel Core Ultra 7 366H, NVIDIA RTX PRO 2000 Blackwell Generation Laptop (n=1) | |
| Average of class Workstation (8108 - 15631, n=17, last 2 years) | |
| CrossMark / Overall | |
| Apple MacBook Pro 16 2026 M5 Pro | |
| Lenovo ThinkPad P1 Gen 9 21UE000MGE | |
| Average Intel Core Ultra 7 366H, NVIDIA RTX PRO 2000 Blackwell Generation Laptop (n=1) | |
| Dell XPS 16 Core Ultra X7 358H | |
| HP ZBook X G1i 16 | |
| Lenovo ThinkPad P1 Gen 8 | |
| Average of class Workstation (1307 - 2267, n=21, last 2 years) | |
| Samsung Galaxy Book6 Ultra | |
| CrossMark / Productivity | |
| Apple MacBook Pro 16 2026 M5 Pro | |
| Lenovo ThinkPad P1 Gen 9 21UE000MGE | |
| Average Intel Core Ultra 7 366H, NVIDIA RTX PRO 2000 Blackwell Generation Laptop (n=1) | |
| Dell XPS 16 Core Ultra X7 358H | |
| HP ZBook X G1i 16 | |
| Lenovo ThinkPad P1 Gen 8 | |
| Average of class Workstation (1130 - 2122, n=21, last 2 years) | |
| Samsung Galaxy Book6 Ultra | |
| CrossMark / Creativity | |
| Apple MacBook Pro 16 2026 M5 Pro | |
| Dell XPS 16 Core Ultra X7 358H | |
| Lenovo ThinkPad P1 Gen 9 21UE000MGE | |
| Average Intel Core Ultra 7 366H, NVIDIA RTX PRO 2000 Blackwell Generation Laptop (n=1) | |
| Samsung Galaxy Book6 Ultra | |
| HP ZBook X G1i 16 | |
| Average of class Workstation (1657 - 2725, n=21, last 2 years) | |
| Lenovo ThinkPad P1 Gen 8 | |
| CrossMark / Responsiveness | |
| Lenovo ThinkPad P1 Gen 9 21UE000MGE | |
| Average Intel Core Ultra 7 366H, NVIDIA RTX PRO 2000 Blackwell Generation Laptop (n=1) | |
| Apple MacBook Pro 16 2026 M5 Pro | |
| Dell XPS 16 Core Ultra X7 358H | |
| Lenovo ThinkPad P1 Gen 8 | |
| Average of class Workstation (993 - 2096, n=21, last 2 years) | |
| Samsung Galaxy Book6 Ultra | |
| HP ZBook X G1i 16 | |
| WebXPRT 3 / Overall | |
| Apple MacBook Pro 16 2026 M5 Pro | |
| Lenovo ThinkPad P1 Gen 8 | |
| HP ZBook X G1i 16 | |
| Average of class Workstation (260 - 360, n=21, last 2 years) | |
| Lenovo ThinkPad P1 Gen 9 21UE000MGE | |
| Average Intel Core Ultra 7 366H, NVIDIA RTX PRO 2000 Blackwell Generation Laptop (n=1) | |
| Samsung Galaxy Book6 Ultra | |
| Dell XPS 16 Core Ultra X7 358H | |
| WebXPRT 4 / Overall | |
| Apple MacBook Pro 16 2026 M5 Pro | |
| HP ZBook X G1i 16 | |
| Dell XPS 16 Core Ultra X7 358H | |
| Lenovo ThinkPad P1 Gen 8 | |
| Samsung Galaxy Book6 Ultra | |
| Average of class Workstation (189.2 - 326, n=21, last 2 years) | |
| Lenovo ThinkPad P1 Gen 9 21UE000MGE | |
| Average Intel Core Ultra 7 366H, NVIDIA RTX PRO 2000 Blackwell Generation Laptop (n=1) | |
| Mozilla Kraken 1.1 / Total | |
| Samsung Galaxy Book6 Ultra | |
| Lenovo ThinkPad P1 Gen 8 | |
| HP ZBook X G1i 16 | |
| Lenovo ThinkPad P1 Gen 9 21UE000MGE | |
| Average Intel Core Ultra 7 366H, NVIDIA RTX PRO 2000 Blackwell Generation Laptop (n=1) | |
| Dell XPS 16 Core Ultra X7 358H | |
| Average of class Workstation (411 - 538, n=21, last 2 years) | |
| Apple MacBook Pro 16 2026 M5 Pro | |
* ... smaller is better
| PCMark 10 Score | 9384 points | |
Help | ||
| AIDA64 / Memory Copy | |
| Dell XPS 16 Core Ultra X7 358H | |
| Lenovo ThinkPad P1 Gen 9 21UE000MGE | |
| Samsung Galaxy Book6 Ultra | |
| Average Intel Core Ultra 7 366H (107814 - 120004, n=5) | |
| Lenovo ThinkPad P1 Gen 8 | |
| Average of class Workstation (56003 - 164795, n=21, last 2 years) | |
| AIDA64 / Memory Read | |
| Dell XPS 16 Core Ultra X7 358H | |
| Average Intel Core Ultra 7 366H (102778 - 111878, n=5) | |
| Lenovo ThinkPad P1 Gen 9 21UE000MGE | |
| Samsung Galaxy Book6 Ultra | |
| Average of class Workstation (55795 - 121563, n=21, last 2 years) | |
| Lenovo ThinkPad P1 Gen 8 | |
| AIDA64 / Memory Write | |
| Dell XPS 16 Core Ultra X7 358H | |
| Lenovo ThinkPad P1 Gen 9 21UE000MGE | |
| Samsung Galaxy Book6 Ultra | |
| Average Intel Core Ultra 7 366H (106062 - 120952, n=5) | |
| Average of class Workstation (55663 - 214520, n=21, last 2 years) | |
| Lenovo ThinkPad P1 Gen 8 | |
| AIDA64 / Memory Latency | |
| Lenovo ThinkPad P1 Gen 8 | |
| Average of class Workstation (93 - 165.2, n=21, last 2 years) | |
| Average Intel Core Ultra 7 366H (89.5 - 103, n=5) | |
| Lenovo ThinkPad P1 Gen 9 21UE000MGE | |
| Samsung Galaxy Book6 Ultra | |
| Dell XPS 16 Core Ultra X7 358H | |
* ... smaller is better
DPC Latency
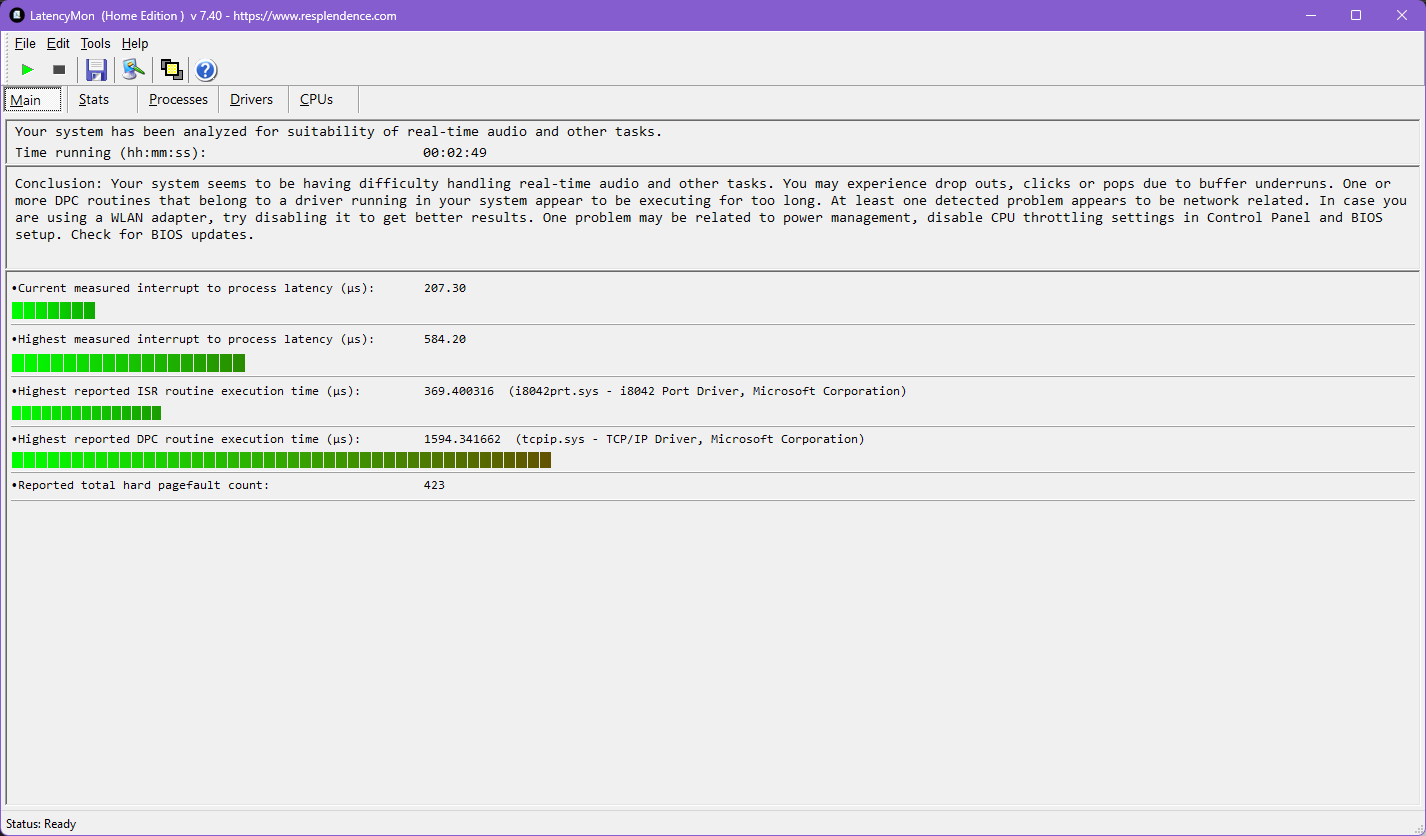
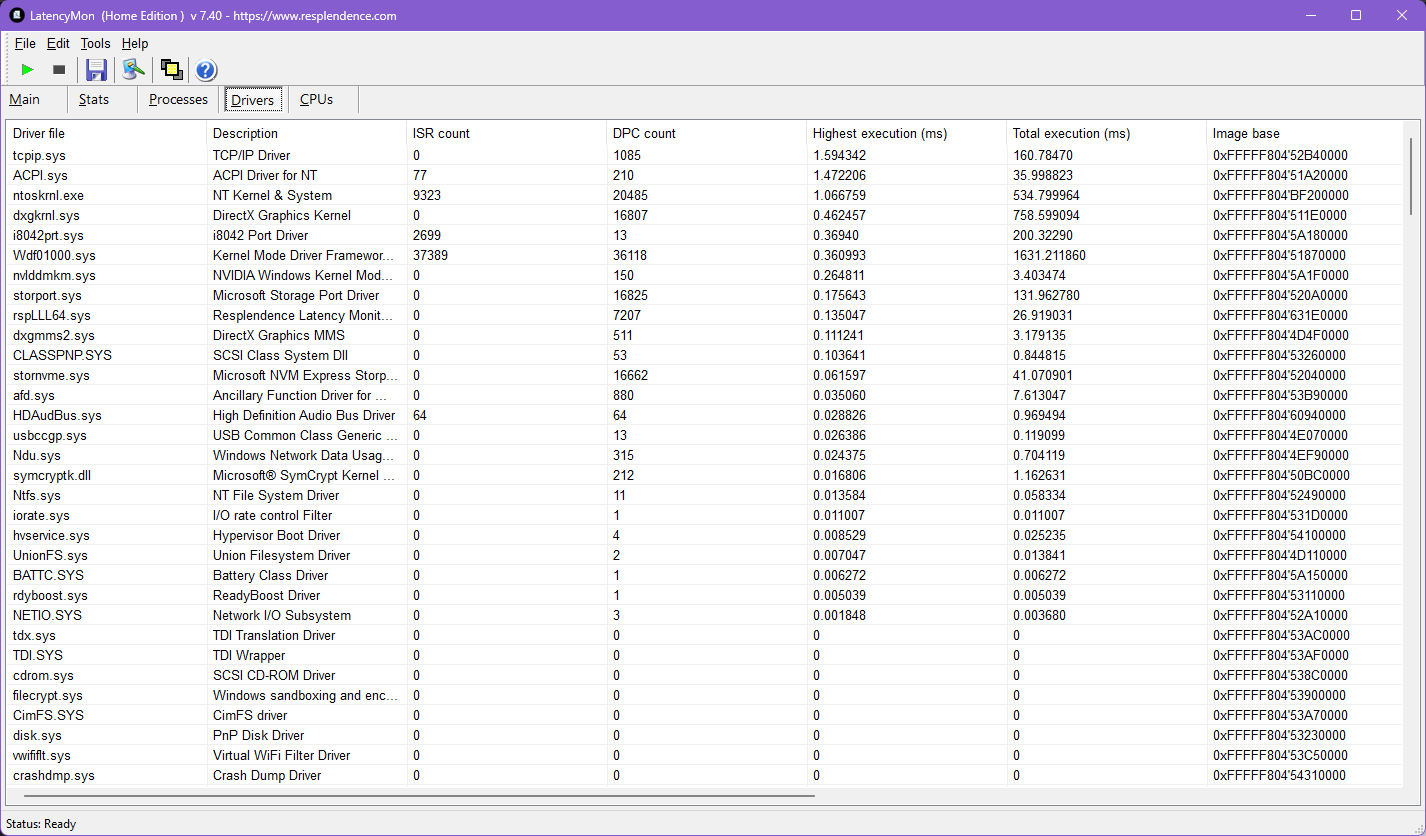
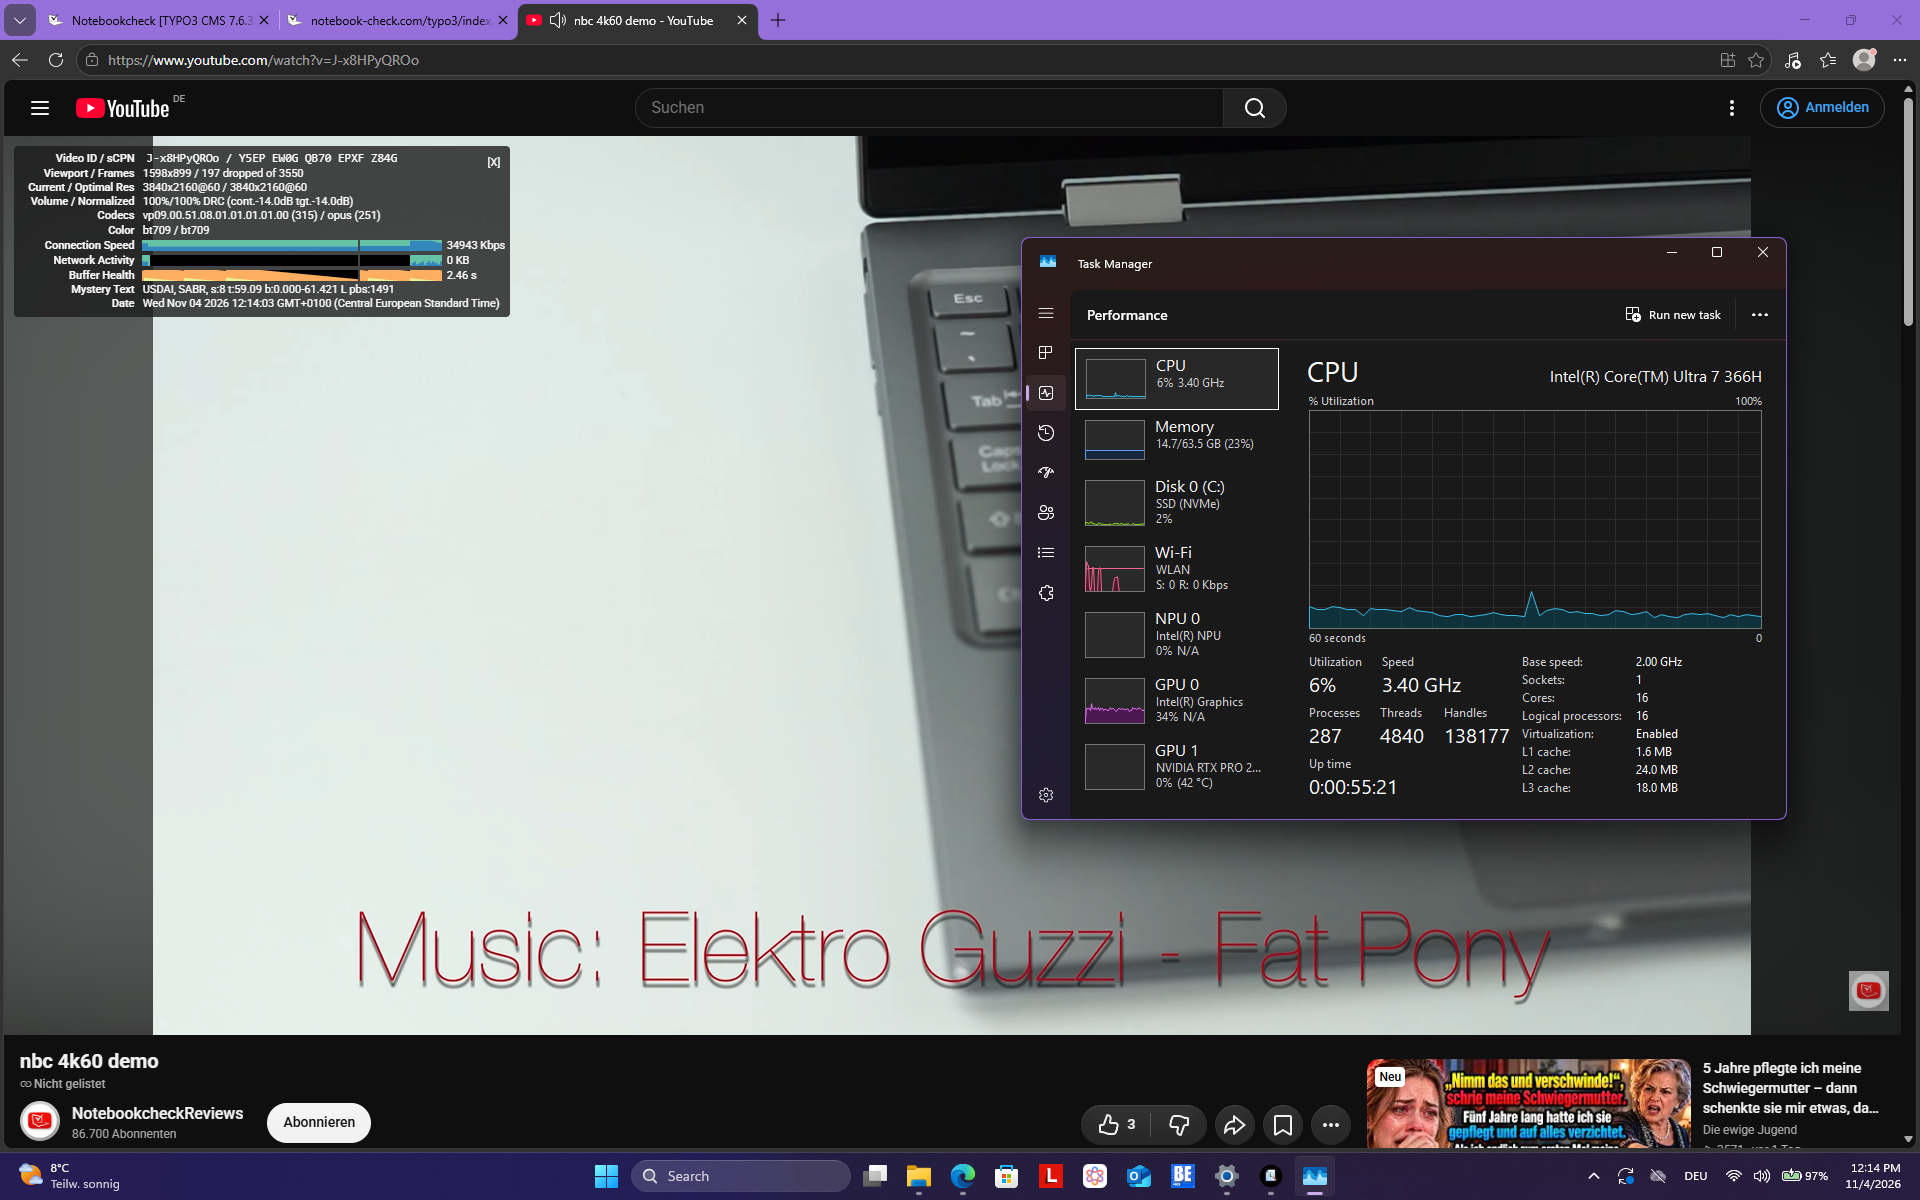
| DPC Latencies / LatencyMon - interrupt to process latency (max), Web, Youtube, Prime95 | |
| Lenovo ThinkPad P1 Gen 8 | |
| Average of class Workstation (439 - 5165, n=19, last 2 years) | |
| Samsung Galaxy Book6 Ultra | |
| HP ZBook X G1i 16 | |
| Lenovo ThinkPad P1 Gen 9 21UE000MGE | |
| Dell XPS 16 Core Ultra X7 358H | |
* ... smaller is better
Storage Devices
The ThinkPad P1 Gen 9 uses the same SSD as the older P1 G8, but there is a major difference: While this M.2 2280 PCIe 5.0 was limited to PCIe 4.0 speed in the older P1, that is not the case with the P1 Gen 9. This is a very fast SSD, and there also is zero throttling under sustained load.

Disk Throttling: DiskSpd Read Loop, Queue Depth 8
GPU and Gaming Performance
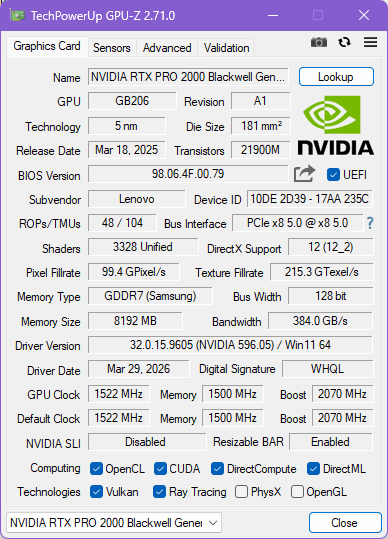
We are testing the Lenovo ThinkPad P1 Gen 9 with the most powerful GPU on offer, the Nvidia RTX Pro 2000 Blackwell. This is an ISV certified workstation GPU and roughly the equivalent of the Nvidia GeForce RTX 5060 Laptop.
Lenovo gives the GPU a TGP of 75 W. That is not a lot for a chip designed to be able to consume up to 100 W. Still, the ThinkPad P1 Gen 9 is clearly outperforming the Intel ARC iGPU solution easily.
| SPECviewperf Performance rating - Percent | |
| Lenovo ThinkPad P1 Gen 8 | |
| Lenovo ThinkPad P1 Gen 9 21UE000MGE | |
| HP ZBook X G1i 16 | |
| Average of class Workstation | |
| 3DMark 11 Performance | 29894 points | |
| 3DMark Fire Strike Score | 25692 points | |
| 3DMark Time Spy Score | 11084 points | |
Help | ||
* ... smaller is better
| GTA V - 1920x1080 Highest AA:4xMSAA + FX AF:16x | |
| Samsung Galaxy Book6 Ultra | |
| Lenovo ThinkPad P1 Gen 9 21UE000MGE | |
| Lenovo ThinkPad P1 Gen 8 | |
| HP ZBook X G1i 16 | |
| Average of class Workstation (18.1 - 156.1, n=20, last 2 years) | |
| Dell XPS 16 Core Ultra X7 358H | |
| Final Fantasy XV Benchmark - 1920x1080 High Quality | |
| Samsung Galaxy Book6 Ultra | |
| Lenovo ThinkPad P1 Gen 8 | |
| Lenovo ThinkPad P1 Gen 9 21UE000MGE | |
| HP ZBook X G1i 16 | |
| Average of class Workstation (26.4 - 197.6, n=20, last 2 years) | |
| Dell XPS 16 Core Ultra X7 358H | |
| Dota 2 Reborn - 1920x1080 ultra (3/3) best looking | |
| Lenovo ThinkPad P1 Gen 9 21UE000MGE | |
| HP ZBook X G1i 16 | |
| Samsung Galaxy Book6 Ultra | |
| Lenovo ThinkPad P1 Gen 8 | |
| Average of class Workstation (50.7 - 166, n=21, last 2 years) | |
| Dell XPS 16 Core Ultra X7 358H | |
Cyberpunk 2077 ultra FPS Chart
| low | med. | high | ultra | |
|---|---|---|---|---|
| GTA V (2015) | 187.3 | 184.7 | 179.6 | 129.7 |
| Dota 2 Reborn (2015) | 183.9 | 164.8 | 161 | 150.3 |
| Final Fantasy XV Benchmark (2018) | 212 | 138.9 | 104.8 | |
| X-Plane 11.11 (2018) | 116.9 | 99.3 | 80.5 | |
| Baldur's Gate 3 (2023) | 147.3 | 114.9 | 100.9 | 97.5 |
| Cyberpunk 2077 (2023) | 124.8 | 104.4 | 87.7 | 78.3 |
| F1 25 (2025) | 195.1 | 166.7 | 132.9 | 24.4 |
Emissions & Power Consumption
System Noise
While the Lenovo ThinkPad P1 Gen 9 is certainly far from being a loud system, it does get audible under load, with the two fans putting out a maximum of 47.9 dB(a). That is around the same noise level as the comparison laptops. When idling, the ThinkPad laptop is completely silent, as there is also no coil whine.
Noise level
| Idle |
| 25.6 / 25.6 / 25.6 dB(A) |
| Load |
| 41.5 / 47.9 dB(A) |
 | ||
30 dB silent 40 dB(A) audible 50 dB(A) loud |
||
min:  , med:  , max:  Earthworks M23R, Arta (15 cm distance) environment noise: 25.6 dB(A) | ||
| Lenovo ThinkPad P1 Gen 9 21UE000MGE Ultra 7 366H, RTX PRO 2000 Blackwell Generation Laptop | Lenovo ThinkPad P1 Gen 8 Ultra 7 255H, RTX PRO 2000 Blackwell Generation Laptop | HP ZBook X G1i 16 Ultra 7 265H, RTX PRO 2000 Blackwell Generation Laptop | Dell XPS 16 Core Ultra X7 358H Ultra X7 358H, Arc B390 Panther Lake iGPU | Samsung Galaxy Book6 Ultra Ultra 7 356H, GeForce RTX 5070 Laptop | Apple MacBook Pro 16 2026 M5 Pro M5 Pro 18-Core, M5 Pro 20-Core GPU | |
|---|---|---|---|---|---|---|
| Noise | 12% | 6% | 8% | 2% | 9% | |
| off / environment * (dB) | 25.6 | 23.1 10% | 23.7 7% | 23.3 9% | 25.1 2% | 25.4 1% |
| Idle Minimum * (dB) | 25.6 | 23.1 10% | 23.7 7% | 23.4 9% | 25.1 2% | 25.4 1% |
| Idle Average * (dB) | 25.6 | 23.1 10% | 23.7 7% | 23.4 9% | 25.1 2% | 25.4 1% |
| Idle Maximum * (dB) | 25.6 | 23.1 10% | 23.7 7% | 25.8 -1% | 25.1 2% | 25.4 1% |
| Load Average * (dB) | 41.5 | 27.3 34% | 32.7 21% | 38 8% | 36.9 11% | 25.4 39% |
| Cyberpunk 2077 ultra * (dB) | 47.8 | 50.9 -6% | 38.1 20% | 48.5 -1% | 33.6 30% | |
| Load Maximum * (dB) | 47.9 | 47.9 -0% | 48 -0% | 48.6 -1% | 48.5 -1% | 51.7 -8% |
* ... smaller is better
Temperature
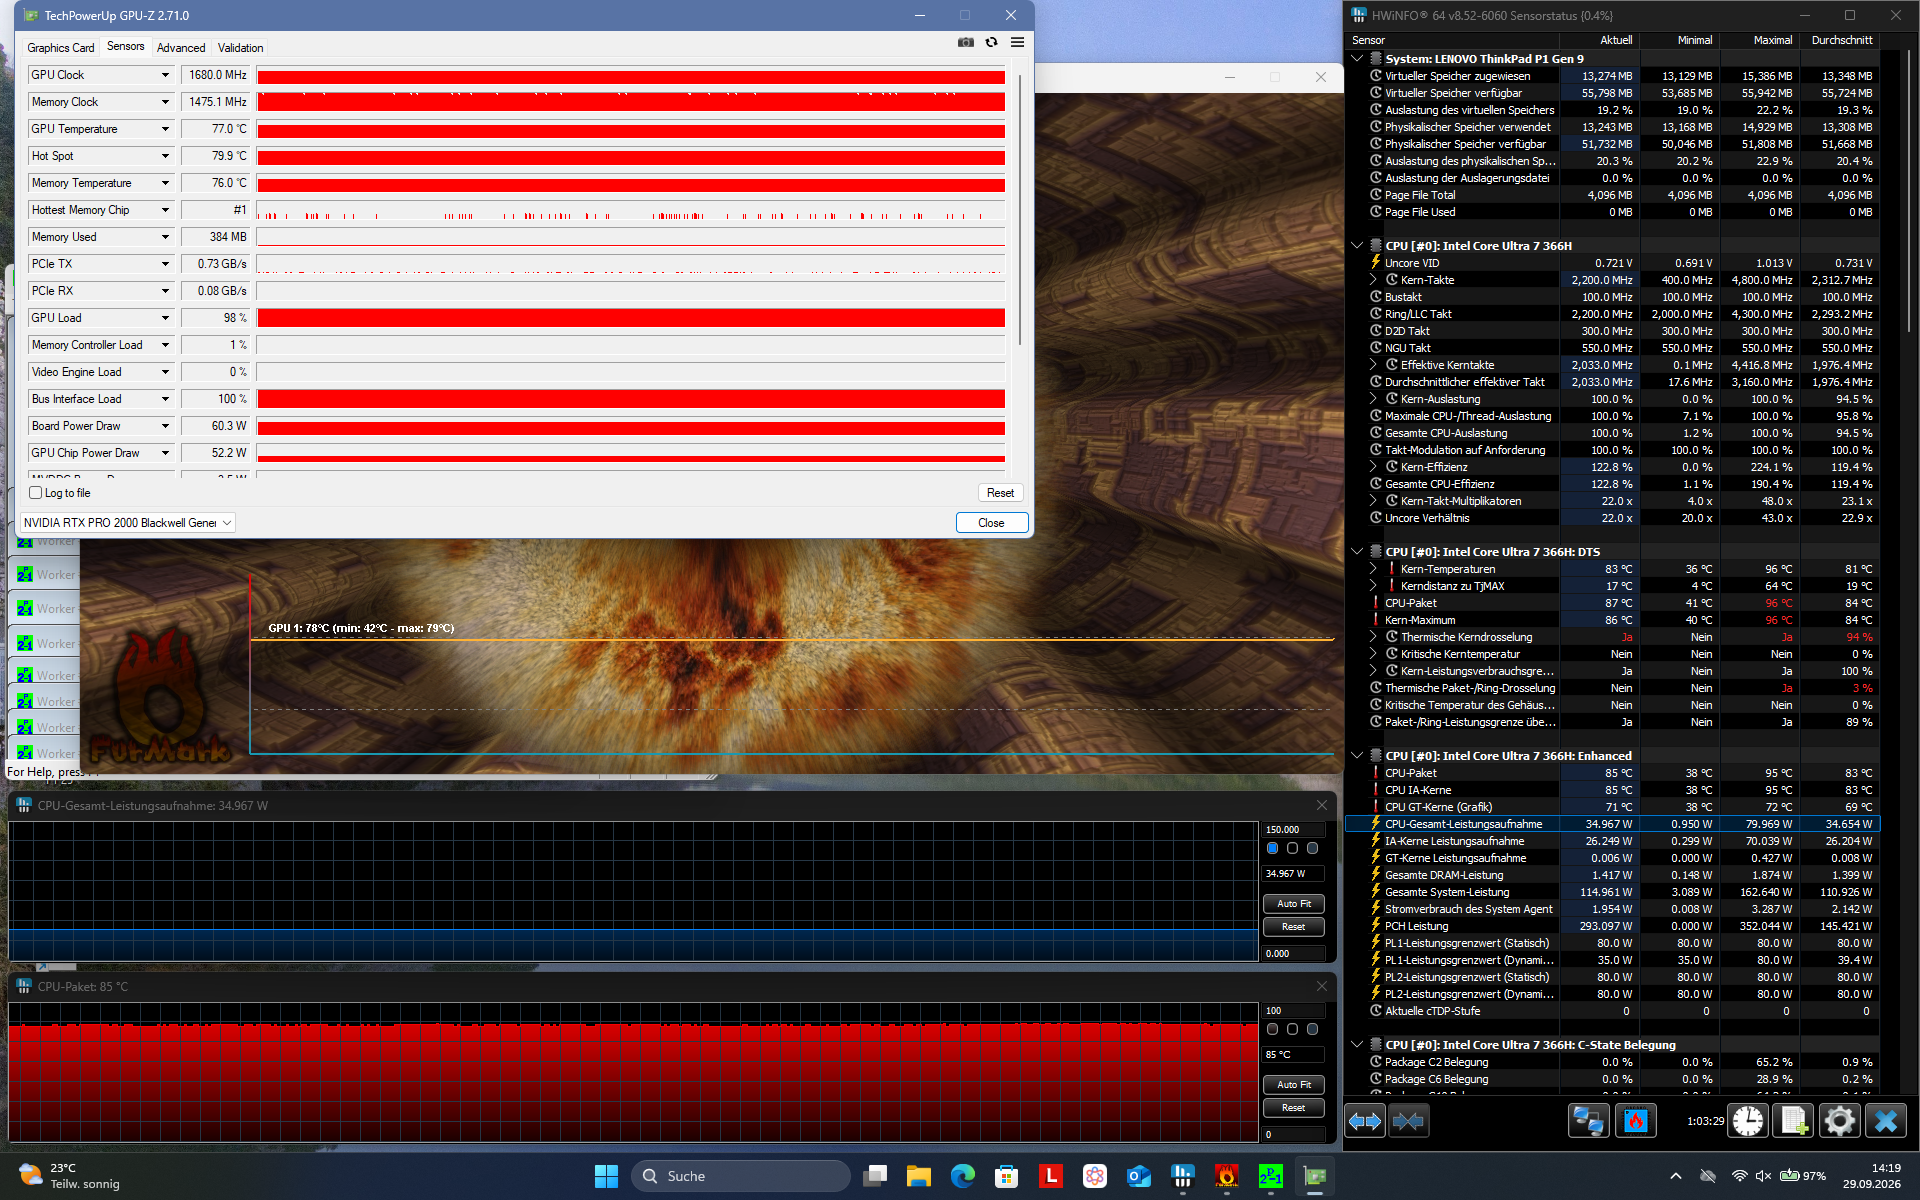
A slim chassis that pairs a powerful Intel chip with a dedicated RTX class GPU pretty high chassis temperatures - surprisingly, they are also substantially higher compared with the older P1 Gen 8. The maximum temperature measured was 51 degrees Celsius or 124 F.
Luckily, this is only true when the device is running our stress test. During the test, the device can cool up to 95 W, with the CPU consuming 35 W and the GPU consuming 60 W.
(-) The maximum temperature on the upper side is 51 °C / 124 F, compared to the average of 38.3 °C / 101 F, ranging from 22.2 to 69.8 °C for the class Workstation.
(±) The bottom heats up to a maximum of 43.9 °C / 111 F, compared to the average of 41.1 °C / 106 F
(+) In idle usage, the average temperature for the upper side is 27 °C / 81 F, compared to the device average of 32 °C / 90 F.
(-) 3: The average temperature for the upper side is 38.3 °C / 101 F, compared to the average of 32 °C / 90 F for the class Workstation.
(+) The palmrests and touchpad are reaching skin temperature as a maximum (32.8 °C / 91 F) and are therefore not hot.
(-) The average temperature of the palmrest area of similar devices was 27.8 °C / 82 F (-5 °C / -9 F).
| Lenovo ThinkPad P1 Gen 9 21UE000MGE Ultra 7 366H, RTX PRO 2000 Blackwell Generation Laptop | Lenovo ThinkPad P1 Gen 8 Ultra 7 255H, RTX PRO 2000 Blackwell Generation Laptop | HP ZBook X G1i 16 Ultra 7 265H, RTX PRO 2000 Blackwell Generation Laptop | Dell XPS 16 Core Ultra X7 358H Ultra X7 358H, Arc B390 Panther Lake iGPU | Samsung Galaxy Book6 Ultra Ultra 7 356H, GeForce RTX 5070 Laptop | Apple MacBook Pro 16 2026 M5 Pro M5 Pro 18-Core, M5 Pro 20-Core GPU | |
|---|---|---|---|---|---|---|
| Heat | 5% | 5% | 16% | 6% | 14% | |
| Maximum Upper Side * (°C) | 51 | 45 12% | 36 29% | 40.6 20% | 42.7 16% | 40.6 20% |
| Maximum Bottom * (°C) | 43.9 | 33 25% | 39.4 10% | 39.8 9% | 49.1 -12% | 42.4 3% |
| Idle Upper Side * (°C) | 28.3 | 30.6 -8% | 30.4 -7% | 23.2 18% | 25.4 10% | 23.8 16% |
| Idle Bottom * (°C) | 28.6 | 31.6 -10% | 31.8 -11% | 23.8 17% | 25.5 11% | 23.6 17% |
* ... smaller is better
Speakers
The amount of speakers depends on which variant of the ThinkPad P1 Gen 9 you buy - WWAN models with 5G have four speakers, non-WWAN models like ours have two. The bottom firing stereo speakers still perform pretty great, as they are quite loud and even have some bass. They do have less bass than a MacBook Pro 16, but still, listening to music with the ThinkPad is a nice experience.
Lenovo ThinkPad P1 Gen 9 21UE000MGE audio analysis
(+) | speakers can play relatively loud (89.5 dB)
Bass 100 - 315 Hz
(±) | reduced bass - on average 12.3% lower than median
(±) | linearity of bass is average (12.9% delta to prev. frequency)
Mids 400 - 2000 Hz
(+) | balanced mids - only 3.4% away from median
(+) | mids are linear (3.6% delta to prev. frequency)
Highs 2 - 16 kHz
(+) | balanced highs - only 1.1% away from median
(+) | highs are linear (3.3% delta to prev. frequency)
Overall 100 - 16.000 Hz
(+) | overall sound is linear (9.5% difference to median)
Compared to same class
» 6% of all tested devices in this class were better, 1% similar, 94% worse
» The best had a delta of 7%, average was 17%, worst was 35%
Compared to all devices tested
» 4% of all tested devices were better, 1% similar, 95% worse
» The best had a delta of 4%, average was 23%, worst was 136%
Apple MacBook Pro 16 2026 M5 Pro audio analysis
(+) | speakers can play relatively loud (84.7 dB)
Bass 100 - 315 Hz
(+) | good bass - only 4.9% away from median
(+) | bass is linear (6% delta to prev. frequency)
Mids 400 - 2000 Hz
(+) | balanced mids - only 1% away from median
(+) | mids are linear (2.7% delta to prev. frequency)
Highs 2 - 16 kHz
(+) | balanced highs - only 2.7% away from median
(+) | highs are linear (2.9% delta to prev. frequency)
Overall 100 - 16.000 Hz
(+) | overall sound is linear (5.2% difference to median)
Compared to same class
» 1% of all tested devices in this class were better, 1% similar, 98% worse
» The best had a delta of 5%, average was 17%, worst was 45%
Compared to all devices tested
» 0% of all tested devices were better, 0% similar, 100% worse
» The best had a delta of 4%, average was 23%, worst was 136%
Power Consumption and Battery Life
Not so long ago, workstation laptops like the ThinkPad P1 Gen 9 would provide an abysmal battery life, due to their high power consumption. This is no longer the case: Our review device lasted over 22 hrs in our standardized Wi-Fi/websurfing test (150 cd/m² screen brightness), more than double the average of the workstation category. Clearly, Intel Panther Lake has worked its magic here, bringing Ultrabook-like efficiency to the workstation sector.
| Off / Standby | 0.2 / 0.8 Watt |
| Idle | 2.2 / 7.8 / 8.7 Watt |
| Load |
112.1 / 142.9 Watt |
   
| |
Key:
min: ,
med: ,
max: Metrahit Energy | |
Power Consumption Cyberpunk / Stress Test
Power Consumption external Monitor
| Lenovo ThinkPad P1 Gen 9 21UE000MGE Ultra 7 366H, RTX PRO 2000 Blackwell Generation Laptop, 90 Wh | Lenovo ThinkPad P1 Gen 8 Ultra 7 255H, RTX PRO 2000 Blackwell Generation Laptop, 90 Wh | HP ZBook X G1i 16 Ultra 7 265H, RTX PRO 2000 Blackwell Generation Laptop, 83 Wh | Dell XPS 16 Core Ultra X7 358H Ultra X7 358H, Arc B390 Panther Lake iGPU, 70 Wh | Samsung Galaxy Book6 Ultra Ultra 7 356H, GeForce RTX 5070 Laptop, 80.2 Wh | Apple MacBook Pro 16 2026 M5 Pro M5 Pro 18-Core, M5 Pro 20-Core GPU, 99.6 Wh | Average of class Workstation | |
|---|---|---|---|---|---|---|---|
| Battery runtime | -76% | -45% | -54% | -26% | -18% | -42% | |
| WiFi v1.3 (h) | 22.6 | 5.5 -76% | 12.5 -45% | 10.3 -54% | 16.8 -26% | 18.5 -18% | 10.1 ? -55% |
| Load (h) | 2 | 1.418 ? -29% |
Notebookcheck Rating
Lenovo ThinkPad P1 Gen 9 21UE000MGE
- 11/05/2026 v8
Benjamin Herzig
 Total Sustainability Score:
Potential Competitors in Comparison
Image | Model / Review | Price | Weight | Height | Display |
|---|---|---|---|---|---|
1. 90.8%  | Lenovo ThinkPad P1 Gen 9 21UE000MGE Intel Core Ultra 7 366H ⎘ NVIDIA RTX PRO 2000 Blackwell Generation Laptop ⎘ 64 GB Memory, 1024 GB SSD | List Price: 5300 Euro | 1.9 kg | 21 mm | 16.00" 1920x1200 142 PPI IP LED |
2. 91.6%  | Lenovo ThinkPad P1 Gen 8 Intel Core Ultra 7 255H ⎘ NVIDIA RTX PRO 2000 Blackwell Generation Laptop ⎘ 32 GB Memory, 1024 GB SSD | List Price: 2000 USD | 1.9 kg | 20.6 mm | 16.00" 3200x2000 236 PPI Tandem OLED |
3. 87.4%  | HP ZBook X G1i 16 Intel Core Ultra 7 265H ⎘ NVIDIA RTX PRO 2000 Blackwell Generation Laptop ⎘ 64 GB Memory, 2048 GB SSD | List Price: 2700 USD | 2.2 kg | 23 mm | 16.00" 2560x1600 189 PPI IPS |
4. 87.2%  | Dell XPS 16 Core Ultra X7 358H Intel Core Ultra X7 358H ⎘ Intel Arc B390 12 Xe3 Panther Lake iGPU ⎘ 32 GB Memory | List Price: 2350 USD | 1.7 kg | 14.62 mm | 16.00" 3200x2000 236 PPI OLED |
5. 90.7%  | Samsung Galaxy Book6 Ultra Intel Core Ultra 7 356H ⎘ NVIDIA GeForce RTX 5070 Laptop ⎘ 32 GB Memory, 1000 GB SSD | List Price: 3599€ | 1.9 kg | 15.4 mm | 16.00" 2880x1800 212 PPI OLED |
6. 92.3%  | Apple MacBook Pro 16 2026 M5 Pro Apple M5 Pro 18-Core ⎘ Apple M5 Pro 20-Core GPU ⎘ 64 GB Memory, 4096 GB SSD | List Price: 5298€ | 2.1 kg | 16.8 mm | 16.20" 3456x2234 254 PPI Mini-LED |
Transparency
The selection of devices to be reviewed is made by our editorial team. The test sample was provided to the author as a loan by the manufacturer or retailer for the purpose of this review. The lender had no influence on this review, nor did the manufacturer receive a copy of this review before publication. There was no obligation to publish this review. As an independent media company, Notebookcheck is not subjected to the authority of manufacturers, retailers or publishers.
This is how Notebookcheck is testing
Every year, Notebookcheck independently reviews hundreds of laptops and smartphones using standardized procedures to ensure that all results are comparable. We have continuously developed our test methods for around 20 years and set industry standards in the process. In our test labs, high-quality measuring equipment is utilized by experienced technicians and editors. These tests involve a multi-stage validation process. Our complex rating system is based on hundreds of well-founded measurements and benchmarks, which maintains objectivity. Further information on our test methods can be found here.
 Add as a preferred source on Google


