Intel HD Graphics (Haswell) vs Intel HD Graphics (Skylake) vs Intel HD Graphics P530
Intel HD Graphics (Haswell) ► remove from comparison
The Intel HD Graphics (Haswell) is an integrated graphics card in the Haswell codenamed processors (Celeron and Pentium). It is the successor the the Intel HD Graphics in the Ivy Bridge CPUs and performs slightly better. Depending on the processor model, the base and turbo clock rates may differ, resulting in varying graphics performance between CPU models.
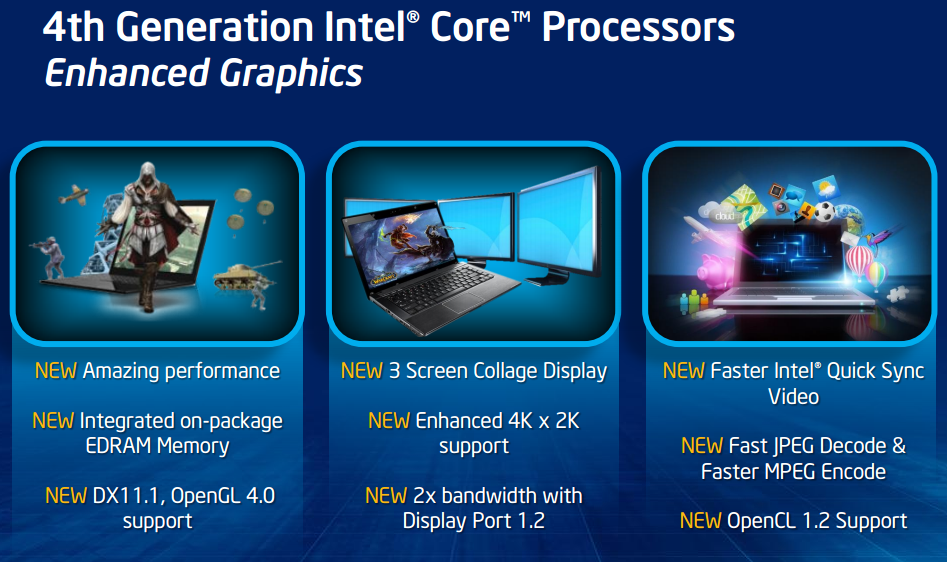
In comparison to the HD 4000, the graphics core has been modified extensively. The GPU supports DirectX 11.1, OpenCL 1.2 and OpenGL 4.0. It also features an improved decoder for 4K videos and the fast Quick Sync encoder (deactivated in many entry level models).
The Performance of the HD Graphics (Haswell) is similar to the old HD Graphics 3000 or the AMD Radeon HD 8250 . Only a few modern games like Dota 2 can be played fluently in very low details and resolutions.
Due to the 22nm 3D Tri-Gate production process, the power consumption should be relatively low (the development was focused on performance per Watt). The GPU can be found in ULV models and regular (37 W) dual core CPUs.
Intel HD Graphics (Skylake) ► remove from comparison
The Intel HD Graphics (Skylake) (GT1) is an integrated graphics unit, which can be found in low-end ULV (Ultra Low Voltage) processors of the Skylake generation. In most CPUs, this GPU was named Intel HD Graphics 510 or Intel HD Graphics 515 (see both pages for benchmarks and information).
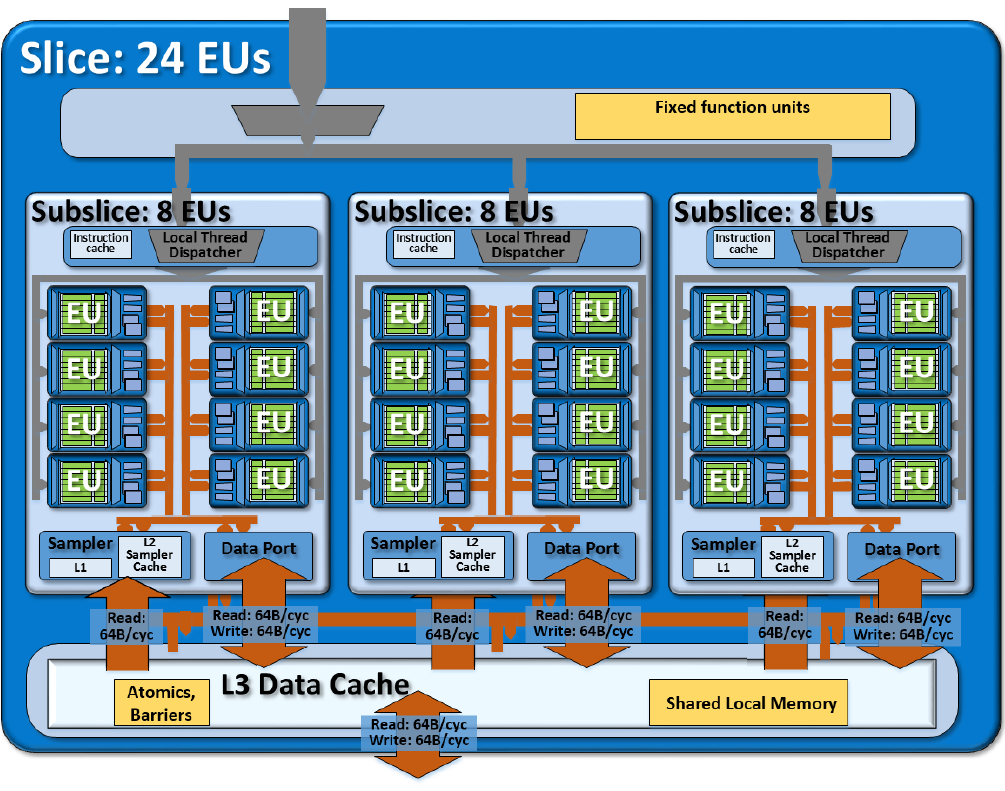
This "GT1" version of the Skylake GPU offers 12 Execution Units (EUs) clocked at up to 800 MHz (depending on the CPU model). Due to its lack of dedicated graphics memory or eDRAM cache, the HD Graphics has to access the main memory (2x 64bit DDR3L-1600 / DDR4-2133).
Performance
Depending on various factors like memory configuration, the HD Graphics should perform similar to the older HD Graphics 4200 and will handle only some older and less demanding games in lowest settings.
Features
The revised video engine now decodes H.265/HEVC completely in hardware and thereby much more efficiently than before. Displays can be connected via DP 1.2 / eDP 1.3 (max. 3840 x 2160 @ 60 Hz), whereas HDMI is limited to the older version 1.4a (max. 3840 x 2160 @ 30 Hz). However, HDMI 2.0 can be added using a DisplayPort converter. Up to three displays can be controlled simultaneously.
Power Consumption
The HD Graphics (Skylake) can be found in mobile processors specified at 6 W TDP and is therefore suited for passively cooled 2-in-1 laptops and tablets.
Intel HD Graphics P530 ► remove from comparison
The Intel HD Graphics P530 (GT2) is an integrated graphics unit, which can be found in various Xeon workstation processors of the Skylake generation. The "GT2" version of the Skylake GPU offers 24 Execution Units (EUs) clocked at up to 1050 MHz (depending on the CPU model). Due to its lack of dedicated graphics memory or eDRAM cache, the P530 has to access the main memory (2x 64bit DDR3L-1600 / DDR4-2133).
Performance
Depending on the memory configuration, the HD Graphics P530 is just slightly behind a dedicated GeForce 920M and will handle modern games (as of 2015) in low or medium settings.
Features
The revised video engine now decodes H.265/HEVC completely in hardware and thereby much more efficiently than before. Displays can be connected via DP 1.2 / eDP 1.3 (max. 3840 x 2160 @ 60 Hz), whereas HDMI is limited to the older version 1.4a (max. 3840 x 2160 @ 30 Hz). However, HDMI 2.0 can be added using a DisplayPort converter. Up to three displays can be controlled simultaneously.
Power Consumption
The HD Graphics P530 can be found in mobile quad-core Xeon processors with 45 W TDP.
Intel HD Graphics (Haswell) Intel HD Graphics (Skylake) Intel HD Graphics P530 HD Graphics Series Codename Haswell GT1 Skylake GT1 Skylake GT2 Architecture Gen. 7.5 Haswell Gen. 9 Skylake Gen. 9 Skylake Pipelines 10 - unified 12 - unified 24 - unified Core Speed 200 - 1000 (Boost) MHz 300 - 800 (Boost) MHz 350 - 1050 (Boost) MHz Memory Bus Width 64/128 Bit 64/128 Bit 64/128 Bit Shared Memory yes yes yes API DirectX 11.1, Shader 5.0 DirectX 12_1, OpenGL 4.4 DirectX 12_1, OpenGL 4.4 technology 22 nm 14 nm 14 nm Date of Announcement 01.10.2012 01.09.2015 01.09.2015 Memory Type DDR3L/LPDDR3 DDR3/DDR4 Features QuickSync QuickSync
CPU in HD Graphics (Haswell) GPU Base Speed GPU Boost / Turbo Intel Pentium 3560M 2 x 2400 MHz, 37 W 400 MHz 1100 MHz Intel Pentium 3550M 2 x 2300 MHz, 37 W 400 MHz 1100 MHz Intel Celeron 2970M 2 x 2200 MHz, 37 W 400 MHz 1100 MHz » show 10 more Intel Celeron 2950M 2 x 2000 MHz, 37 W 400 MHz 1100 MHz Intel Pentium 3558U 2 x 1700 MHz, 15 W 200 MHz 1000 MHz Intel Pentium 3556U 2 x 1700 MHz, 15 W 200 MHz 1000 MHz Intel Celeron 2981U 2 x 1600 MHz, 15 W 200 MHz 1000 MHz Intel Celeron 2980U 2 x 1600 MHz, 15 W 200 MHz 1000 MHz Intel Celeron 2957U 2 x 1400 MHz, 15 W 200 MHz 1000 MHz Intel Celeron 2955U 2 x 1400 MHz, 15 W 200 MHz 1000 MHz Intel Pentium 3561Y 2 x 1200 MHz, 11.5 W 200 MHz 850 MHz Intel Pentium 3560Y 2 x 1200 MHz, 11.5 W 200 MHz 850 MHz Intel Celeron 2961Y 2 x 1100 MHz, 11.5 W 200 MHz 850 MHz min. - max. 200 - 400 MHz 850 - 1100 MHz
CPU in HD Graphics P530 GPU Base Speed GPU Boost / Turbo Intel Xeon E3-1535M v5 4 x 2900 MHz, 45 W 350 MHz 1050 MHz Intel Xeon E3-1505M v5 4 x 2800 MHz, 45 W 350 MHz 1050 MHz min. - max. 200 - 400 MHz 850 - 1100 MHz
Benchmarks Performance Rating - 3DMark 11 + Fire Strike + Time Spy - HD Graphics (Haswell)
0.2 pt (0%)
...
Intel HD Graphics (Haswell)
...
max:
3DMark - 3DMark Ice Storm Unlimited Graphics
43493 Points (5%)
3DMark - 3DMark Cloud Gate Score
min: 2141 avg: 2403 median: 2335.5 (2%) max: 3011 Points
3DMark - 3DMark Cloud Gate Graphics
min: 3111 avg: 3415 median: 3278 (1%) max: 4199 Points
3DMark - 3DMark Fire Strike Standard Score
min: 300 avg: 323.8 median: 314 (1%) max: 383 Points
3DMark - 3DMark Fire Strike Standard Graphics
min: 340 avg: 370.8 median: 362.5 (0%) max: 433 Points
3DMark - 3DMark Ice Storm Graphics
min: 29291 avg: 34138 median: 34675 (4%) max: 40515 Points
3DMark 11 - 3DM11 Performance Score
min: 435 avg: 543 median: 544 (1%) max: 688 Points
3DMark 11 - 3DM11 Performance GPU
min: 384 avg: 479.6 median: 484 (0%) max: 602 Points
3DMark Vantage + Intel HD Graphics (Haswell) 3DMark Vantage - 3DM Vant. Perf. total
min: 2146 avg: 2163 median: 2163 (1%) max: 2180 Points
3DM Vant. Perf. GPU no PhysX + Intel HD Graphics (Haswell) 3DMark Vantage - 3DM Vant. Perf. GPU no PhysX
min: 1848 avg: 1859 median: 1859 (1%) max: 1870 Points
3DMark 06 3DMark 06 - Standard 1280x1024 + Intel HD Graphics (Haswell)
min: 2917 avg: 3274 median: 3357.5 (4%) max: 3463 Points
Windows 7 Experience Index - Win7 Gaming graphics
6.3 Points (80%)
Windows 7 Experience Index - Win7 Graphics
4.7 Points (59%)
Cinebench R10 Cinebench R10 Shading (32bit) + Intel HD Graphics (Haswell) Cinebench R10 - Cinebench R10 Shading (32bit)
min: 3867 avg: 4235 median: 4215.5 (3%) max: 4642 Points
Cinebench R11.5 Cinebench R11.5 OpenGL 64 Bit + Intel HD Graphics (Haswell) Cinebench R11.5 - Cinebench R11.5 OpenGL 64 Bit
min: 9.38 avg: 11.4 median: 11.6 (4%) max: 12.78 fps
Cinebench R15 + Intel HD Graphics (Haswell) Cinebench R15 - Cinebench R15 OpenGL 64 Bit
min: 10.28 avg: 13.2 median: 13.9 (1%) max: 14.59 fps
Cinebench R15 OpenGL Ref. Match 64 Bit + Intel HD Graphics (Haswell) Cinebench R15 - Cinebench R15 OpenGL Ref. Match 64 Bit
98 % (98%)
GFXBench - GFXBench Car Chase Offscreen
11.6 fps (1%)
GFXBench 3.1 - GFXBench Manhattan ES 3.1 Offscreen
20.1 fps (0%)
GFXBench 3.0 - GFXBench 3.0 Manhattan Offscreen
28.7 fps (2%)
GFXBench (DX / GLBenchmark) 2.7 + Intel HD Graphics (Haswell) GFXBench (DX / GLBenchmark) 2.7 - GFXBench T-Rex HD Offscreen C24Z16
53.5 fps (0%)
LuxMark v2.0 64Bit - LuxMark v2.0 Room GPU
min: 77 avg: 93 median: 93 (0%) max: 109 Samples/s
LuxMark v2.0 64Bit - LuxMark v2.0 Sala GPU
min: 115 avg: 140 median: 140 (0%) max: 165 Samples/s
ComputeMark v2.1 - ComputeMark v2.1 Result
min: 355 avg: 370 median: 370 (0%) max: 385 Points
Power Consumption - Furmark Stress Test Power Consumption - external Monitor *
43.7 Watt (6%)
Power Consumption - The Witcher 3 Power Consumption - external Monitor *
30.5 Watt (4%)
Average Benchmarks Intel HD Graphics (Haswell) → 0% n=
- Range of benchmark values for this graphics card
- Average benchmark values for this graphics card
* Smaller numbers mean a higher performance
1 This benchmark is not used for the average calculation
Game Benchmarks The following benchmarks stem from our benchmarks of review laptops. The performance depends on the used graphics memory, clock rate, processor, system settings, drivers, and operating systems. So the results don't have to be representative for all laptops with this GPU. For detailed information on the benchmark results, click on the fps number.
HD Graphics (Haswell):
0 (!) [X] MSI CX61 2QC 2970M MS-16GD Intel Celeron 2970M 2.2GHz
HD Graphics (Haswell)
fps
100%
HD Graphics (Haswell):
4.9 (!) [X] MSI CX61 2QC 2970M MS-16GD Intel Celeron 2970M 2.2GHz
HD Graphics (Haswell)
min:
1 fps, max:
7 fps
fps
100%
HD Graphics (Haswell):
14.3 [X] MSI CX61 2QC 2970M MS-16GD Intel Celeron 2970M 2.2GHz
HD Graphics (Haswell)
fps
100%
HD Graphics (Haswell):
8 [X] MSI CX61 2QC 2970M MS-16GD Intel Celeron 2970M 2.2GHz
HD Graphics (Haswell)
fps
100%
HD Graphics (Haswell):
5.9 [X] MSI CX61 2QC 2970M MS-16GD Intel Celeron 2970M 2.2GHz
HD Graphics (Haswell)
min:
5 fps, max:
7 fps
fps
100%
HD Graphics (Haswell):
13 [X] MSI CX61 2QC 2970M MS-16GD Intel Celeron 2970M 2.2GHz
HD Graphics (Haswell)
min:
7 fps, max:
13 fps
fps
100%
HD Graphics (Haswell):
62 [X] MSI CX61 2QC 2970M MS-16GD Intel Celeron 2970M 2.2GHz
HD Graphics (Haswell)
min:
54 fps
fps
100%
HD Graphics (Haswell):
28.6 [X] MSI CX61 2QC 2970M MS-16GD Intel Celeron 2970M 2.2GHz
HD Graphics (Haswell)
min:
19 fps
fps
100%
HD Graphics (Haswell):
16.4 [X] MSI CX61 2QC 2970M MS-16GD Intel Celeron 2970M 2.2GHz
HD Graphics (Haswell)
min:
14 fps, max:
19 fps
fps
100%
HD Graphics (Haswell):
45.1 [X] MSI CX61 2QC 2970M MS-16GD Intel Celeron 2970M 2.2GHz
HD Graphics (Haswell)
min:
37 fps, max:
54 fps
fps
100%
HD Graphics (Haswell):
15.9 [X] MSI CX61 2QC 2970M MS-16GD Intel Celeron 2970M 2.2GHz
HD Graphics (Haswell)
min:
13 fps, max:
19 fps
fps
HD Graphics (Haswell):
0 (!) [X] MSI CX61 2QC 2970M MS-16GD Intel Celeron 2970M 2.2GHz
HD Graphics (Haswell)
fps
100%
HD Graphics (Haswell):
17.8 [X] MSI CX61 2QC 2970M MS-16GD Intel Celeron 2970M 2.2GHz
HD Graphics (Haswell)
min:
15 fps, max:
21 fps
fps
100%
HD Graphics (Haswell):
38.6 [X] MSI CX61 2QC 2970M MS-16GD Intel Celeron 2970M 2.2GHz
HD Graphics (Haswell)
min:
35 fps, max:
52 fps
fps
100%
HD Graphics (Haswell):
21.6 [X] MSI CX61 2QC 2970M MS-16GD Intel Celeron 2970M 2.2GHz
HD Graphics (Haswell)
min:
19 fps, max:
28 fps
fps
100%
HD Graphics (Haswell):
6.3 [X] MSI CX61 2QC 2970M MS-16GD Intel Celeron 2970M 2.2GHz
HD Graphics (Haswell)
min:
5 fps, max:
8 fps
fps
100%
HD Graphics (Haswell):
14.1 [X] MSI CX61 2QC 2970M MS-16GD Intel Celeron 2970M 2.2GHz
HD Graphics (Haswell)
min:
12 fps, max:
15 fps
fps
100%
HD Graphics (Haswell):
12.4 [X] MSI CX61 2QC 2970M MS-16GD Intel Celeron 2970M 2.2GHz
HD Graphics (Haswell)
min:
11 fps, max:
14 fps
fps
100%
HD Graphics (Haswell):
7.1 [X] MSI CX61 2QC 2970M MS-16GD Intel Celeron 2970M 2.2GHz
HD Graphics (Haswell)
min:
6 fps, max:
8 fps
fps
100%
HD Graphics (Haswell):
26.1 [X] MSI CX61 2QC 2970M MS-16GD Intel Celeron 2970M 2.2GHz
HD Graphics (Haswell)
min:
19 fps, max:
33 fps
fps
100%
HD Graphics (Haswell):
16.3 [X] MSI CX61 2QC 2970M MS-16GD Intel Celeron 2970M 2.2GHz
HD Graphics (Haswell)
min:
12 fps, max:
21 fps
fps
HD Graphics (Haswell):
0 (!) [X] MSI CX61 2QC 2970M MS-16GD Intel Celeron 2970M 2.2GHz
HD Graphics (Haswell)
fps
100%
HD Graphics (Haswell):
6 [X] MSI CX61 2QC 2970M MS-16GD Intel Celeron 2970M 2.2GHz
HD Graphics (Haswell)
min:
3 fps, max:
9 fps
fps
100%
HD Graphics (Haswell):
8.5 [X] MSI CX61 2QC 2970M MS-16GD Intel Celeron 2970M 2.2GHz
HD Graphics (Haswell)
min:
6 fps, max:
11 fps
fps
100%
HD Graphics (Haswell):
9 [X] MSI CX61 2QC 2970M MS-16GD Intel Celeron 2970M 2.2GHz
HD Graphics (Haswell)
min:
8 fps, max:
11 fps
fps
100%
HD Graphics (Haswell):
9.4 [X] MSI CX61 2QC 2970M MS-16GD Intel Celeron 2970M 2.2GHz
HD Graphics (Haswell)
min:
8 fps, max:
11 fps
fps
100%
HD Graphics (Haswell):
5.3 [X] MSI CX61 2QC 2970M MS-16GD Intel Celeron 2970M 2.2GHz
HD Graphics (Haswell)
fps
100%
HD Graphics (Haswell):
2.5 [X] MSI CX61 2QC 2970M MS-16GD Intel Celeron 2970M 2.2GHz
HD Graphics (Haswell)
fps
100%
HD Graphics (Haswell):
1.8 [X] MSI CX61 2QC 2970M MS-16GD Intel Celeron 2970M 2.2GHz
HD Graphics (Haswell)
fps
100%
HD Graphics (Haswell):
13.7 [X] MSI CX61 2QC 2970M MS-16GD Intel Celeron 2970M 2.2GHz
HD Graphics (Haswell)
min:
5 fps, max:
75 fps
fps
100%
HD Graphics (Haswell):
8.9 [X] MSI CX61 2QC 2970M MS-16GD Intel Celeron 2970M 2.2GHz
HD Graphics (Haswell)
min:
4 fps, max:
65 fps
fps
100%
HD Graphics (Haswell):
11.7 [X] MSI CX61 2QC 2970M MS-16GD Intel Celeron 2970M 2.2GHz
HD Graphics (Haswell)
min:
10 fps, max:
14 fps
fps
HD Graphics (Haswell):
0 (!) [X] MSI CX61 2QC 2970M MS-16GD Intel Celeron 2970M 2.2GHz
HD Graphics (Haswell)
fps
100%
HD Graphics (Haswell):
41.4 [X] MSI CX61 2QC 2970M MS-16GD Intel Celeron 2970M 2.2GHz
HD Graphics (Haswell)
min:
21 fps, max:
51 fps
fps
100%
HD Graphics (Haswell):
24.1 [X] MSI CX61 2QC 2970M MS-16GD Intel Celeron 2970M 2.2GHz
HD Graphics (Haswell)
min:
11 fps, max:
35 fps
fps
100%
HD Graphics (Haswell):
11.4 [X] MSI CX61 2QC 2970M MS-16GD Intel Celeron 2970M 2.2GHz
HD Graphics (Haswell)
min:
5 fps, max:
18 fps
fps
100%
HD Graphics (Haswell):
8.9 [X] MSI CX61 2QC 2970M MS-16GD Intel Celeron 2970M 2.2GHz
HD Graphics (Haswell)
min:
5 fps, max:
12 fps
fps
100%
HD Graphics (Haswell):
5.2 [X] MSI CX61 2QC 2970M MS-16GD Intel Celeron 2970M 2.2GHz
HD Graphics (Haswell)
min:
3 fps, max:
8 fps
5.8 ~ 6 fps
100%
HD Graphics (Haswell):
3.1 fps
100%
HD Graphics (Haswell):
52.4 fps
100%
HD Graphics (Haswell):
12.8 fps
100%
HD Graphics (Haswell):
15.9 fps
100%
HD Graphics (Haswell):
11.2 fps
100%
HD Graphics (Haswell):
7.7 fps
100%
HD Graphics (Haswell):
5.7 fps
100%
HD Graphics (Haswell):
9.7 fps
100%
HD Graphics (Haswell):
8.4 fps
100%
HD Graphics (Haswell):
10.9 fps
100%
HD Graphics (Haswell):
7 fps
100%
HD Graphics (Haswell):
31 fps
100%
HD Graphics (Haswell):
20 fps
100%
HD Graphics (Haswell):
9 fps
100%
HD Graphics (Haswell):
5.8 fps
100%
HD Graphics (Haswell):
21.6 fps
100%
HD Graphics (Haswell):
12.9 fps
100%
HD Graphics (Haswell):
13.5 fps
100%
HD Graphics (Haswell):
8.3 fps
100%
HD Graphics (Haswell):
16.4 fps
100%
HD Graphics (Haswell):
11.3 fps
100%
HD Graphics (Haswell):
123.6 fps
100%
HD Graphics (Haswell):
26.2 fps
100%
HD Graphics (Haswell):
13.3 fps
100%
HD Graphics (Haswell):
9.7 fps
100%
HD Graphics (Haswell):
58.2 fps
100%
HD Graphics (Haswell):
19.6 fps
100%
HD Graphics (Haswell):
2.2 fps
100%
HD Graphics (Haswell):
19.9 fps
100%
HD Graphics (Haswell):
14 fps
100%
HD Graphics (Haswell):
35.2 fps
100%
HD Graphics (Haswell):
13.6 fps
100%
HD Graphics (Haswell):
9 fps
100%
HD Graphics (Haswell):
23.1 fps
100%
HD Graphics (Haswell):
13.7 fps
100%
HD Graphics (Haswell):
10.1 fps
100%
HD Graphics (Haswell):
5.7 fps
100%
HD Graphics (Haswell):
22.1 fps
100%
HD Graphics (Haswell):
13 fps
100%
HD Graphics (Haswell):
11.1 fps
100%
HD Graphics (Haswell):
12.8 27.8 [X] MSI CX61 2QC 2970M MS-16GD Intel Celeron 2970M 2.2GHz
HD Graphics (Haswell)
~ 20 fps
100%
HD Graphics (Haswell):
10 18.2 [X] MSI CX61 2QC 2970M MS-16GD Intel Celeron 2970M 2.2GHz
HD Graphics (Haswell)
~ 14 fps
100%
HD Graphics (Haswell):
11.8 [X] MSI CX61 2QC 2970M MS-16GD Intel Celeron 2970M 2.2GHz
HD Graphics (Haswell)
fps
100%
HD Graphics (Haswell):
3.9 [X] MSI CX61 2QC 2970M MS-16GD Intel Celeron 2970M 2.2GHz
HD Graphics (Haswell)
fps
100%
HD Graphics (Haswell):
21 fps
100%
HD Graphics (Haswell):
12 fps
100%
HD Graphics (Haswell):
27 fps
100%
HD Graphics (Haswell):
18 fps
100%
HD Graphics (Haswell):
14 fps
100%
HD Graphics (Haswell):
57.7 fps
100%
HD Graphics (Haswell):
37 fps
100%
HD Graphics (Haswell):
22.4 fps
100%
HD Graphics (Haswell):
16.9 fps
100%
HD Graphics (Haswell):
14 fps
100%
HD Graphics (Haswell):
7.8 fps
100%
HD Graphics (Haswell):
15.9 fps
100%
HD Graphics (Haswell):
8.9 fps
100%
HD Graphics (Haswell):
14.2 fps
100%
HD Graphics (Haswell):
11.5 fps
100%
HD Graphics (Haswell):
36.9 fps
100%
HD Graphics (Haswell):
24.2 fps
100%
HD Graphics (Haswell):
7.2 fps
100%
HD Graphics (Haswell):
38 38.5 ~ 38 fps
100%
HD Graphics (Haswell):
18.6 19.6 ~ 19 fps
100%
HD Graphics (Haswell):
13.2 fps
100%
HD Graphics (Haswell):
11.2 fps
100%
HD Graphics (Haswell):
23 32.8 [X] MSI CX61 2QC 2970M MS-16GD Intel Celeron 2970M 2.2GHz
HD Graphics (Haswell)
~ 28 fps
100%
HD Graphics (Haswell):
10.3 14.2 [X] MSI CX61 2QC 2970M MS-16GD Intel Celeron 2970M 2.2GHz
HD Graphics (Haswell)
~ 12 fps
100%
HD Graphics (Haswell):
11.9 [X] MSI CX61 2QC 2970M MS-16GD Intel Celeron 2970M 2.2GHz
HD Graphics (Haswell)
fps
100%
HD Graphics (Haswell):
3.7 [X] MSI CX61 2QC 2970M MS-16GD Intel Celeron 2970M 2.2GHz
HD Graphics (Haswell)
fps
100%
HD Graphics (Haswell):
96.5 fps
100%
HD Graphics (Haswell):
28.3 fps
100%
HD Graphics (Haswell):
15 fps
100%
HD Graphics (Haswell):
59.6 fps
100%
HD Graphics (Haswell):
11.2 fps
100%
HD Graphics (Haswell):
12.2 fps
100%
HD Graphics (Haswell):
7.6 fps
100%
HD Graphics (Haswell):
38.7 fps
100%
HD Graphics (Haswell):
17.7 fps
100%
HD Graphics (Haswell):
13.1 fps
100%
HD Graphics (Haswell):
18.7 fps
100%
HD Graphics (Haswell):
11.4 fps
100%
HD Graphics (Haswell):
12.3 fps
100%
HD Graphics (Haswell):
9.9 fps
100%
HD Graphics (Haswell):
25.6 fps
100%
HD Graphics (Haswell):
17.6 fps
100%
HD Graphics (Haswell):
22.3 fps
100%
HD Graphics (Haswell):
16.8 fps
100%
HD Graphics (Haswell):
46.2 fps
100%
HD Graphics (Haswell):
34.7 fps
100%
HD Graphics (Haswell):
22.5 fps
100%
HD Graphics (Haswell):
31 fps
100%
HD Graphics (Haswell):
18.8 fps
100%
HD Graphics (Haswell):
11.7 fps
100%
HD Graphics (Haswell):
36.9 fps
100%
HD Graphics (Haswell):
23 fps
100%
HD Graphics (Haswell):
19.5 fps
100%
HD Graphics (Haswell):
12.5 fps
100%
HD Graphics (Haswell):
36 fps
100%
HD Graphics (Haswell):
16 fps
100%
HD Graphics (Haswell):
9.8 fps
100%
HD Graphics (Haswell):
21.7 22.2 ~ 22 fps
100%
HD Graphics (Haswell):
11.2 11.3 ~ 11 fps
100%
HD Graphics (Haswell):
6.8 fps
100%
HD Graphics (Haswell):
36.8 fps
100%
HD Graphics (Haswell):
16.7 fps
100%
HD Graphics (Haswell):
51.9 fps
100%
HD Graphics (Haswell):
27.4 fps
100%
HD Graphics (Haswell):
14.8 fps
100%
HD Graphics (Haswell):
49.2 fps
100%
HD Graphics (Haswell):
28 fps
100%
HD Graphics (Haswell):
21.2 fps
100%
HD Graphics (Haswell):
42.6 fps
100%
HD Graphics (Haswell):
17.8 fps
100%
HD Graphics (Haswell):
113 fps
100%
HD Graphics (Haswell):
45.1 fps
100%
HD Graphics (Haswell):
93.7 fps
100%
HD Graphics (Haswell):
39.2 fps
Average Gaming Intel HD Graphics (Haswell) → 100% Average Gaming 30-70 fps → 100%
For more games that might be playable and a list of all games and graphics cards visit our Gaming List
v1.26
log 26. 21:32:17
#0 checking url part for id 4622 +0s ... 0s
#1 checking url part for id 6474 +0s ... 0s
#2 checking url part for id 6452 +0s ... 0s
#3 not redirecting to Ajax server +0s ... 0s
#4 did not recreate cache, as it is less than 5 days old! Created at Thu, 25 Apr 2024 05:40:10 +0200 +0.001s ... 0.001s
#5 composed specs +0.114s ... 0.116s
#6 did output specs +0s ... 0.116s
#7 start showIntegratedCPUs +0s ... 0.116s
#8 getting avg benchmarks for device 4622 +0.052s ... 0.167s
#9 got single benchmarks 4622 +0.042s ... 0.209s
#10 getting avg benchmarks for device 6474 +0.002s ... 0.211s
#11 got single benchmarks 6474 +0s ... 0.212s
#12 getting avg benchmarks for device 6452 +0.002s ... 0.213s
#13 got single benchmarks 6452 +0s ... 0.214s
#14 got avg benchmarks for devices +0s ... 0.214s
#15 min, max, avg, median took s +0.113s ... 0.326s
#16 before gaming benchmark output +0s ... 0.326s
#17 Got 179 rows for game benchmarks. +0.012s ... 0.338s
#18 composed SQL query for gamebenchmarks +0s ... 0.338s
#19 got data and put it in $dataArray +0.049s ... 0.387s
#20 benchmarks composed for output. +0.181s ... 0.568s
#21 calculated avg scores. +0s ... 0.568s
#22 return log +0.003s ... 0.571s
Please share our article, every link counts!
Redaktion, 2017-09- 8 (Update: 2023-07- 1)
 Deutsch
 English
 Español
 Français
 Italiano
 Nederlands
 Polski
 Português
 Русский
 Türkçe
 Svenska
 Chinese
 Magyar