Notebookcheck Logo

NVIDIA GeForce GTX 760 vs Intel UHD Graphics 610 vs Intel Iris Pro Graphics 580

NVIDIA GeForce GTX 760

► remove from comparison NVIDIA GeForce GTX 760

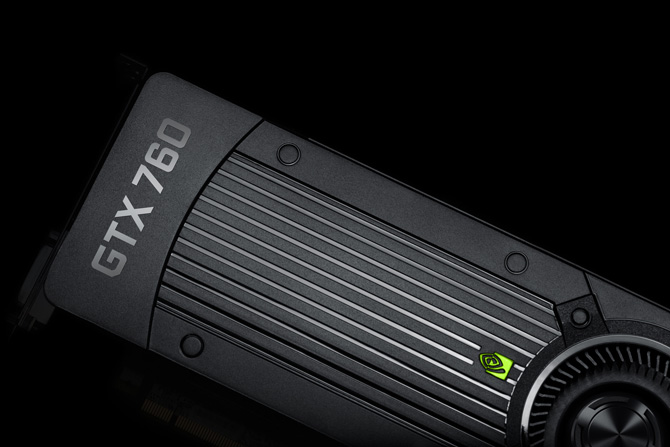
The NVIDIA GeForce GTX 760 is a mid-range desktop graphics card based on the Kepler GK104 chip. It is significantly faster than the mobile Nvidia GeForce GTX 760M for laptops. Depending on the chip temperature and power consumption the core can be clocked between 980-1033 MHz (or even higher). The GDDR5 graphics memory of the 760 is clocked at 3000 MHz (6000 MHz effective).

On average the performance of the GTX 760 is between the GTX 660 and 770 / 680 in the Nvidia lineup and between the Radeon R9 270X and the R9 280 from AMD. The performance is sufficient for maximum detail settings in full HD resolution (for games from 2014 and earlier). However, in some games like Crysis 3 and Thief the average frame rate we tested was only about 30fps (see below).

The power consumption is rated at 160 Watt TDP (load).

Intel UHD Graphics 610

► remove from comparison Intel UHD Graphics 610

The Intel UHD Graphics 610 (GT1) is an integrated graphics unit, which can be found in low-end ULV (Ultra Low Voltage) processors of the Whisky-Lake generation. This "GT1" version of the Skylake GPU offers 12 Execution Units (EUs) clocked at up to 950 MHz (depending on the CPU model). Due to its lack of dedicated graphics memory or eDRAM cache, the HD 610 has to access the main memory (2x 64bit DDR3L-1600 / DDR4-2133).

Performance

Depending on various factors like memory configuration, the UHD Graphics 610 should offer a similar performance as the similar Intel HD Graphics 610 and the old Skylake HD Graphics 510 and therefore can only handle non demanding games. E.g. Farming Simulator 17, World of Warships or Dota 2 Reborn can be played on low settings.

Features

The revised video engine now supports H.265/HEVC Main10 profile in hardware with 10 bit colors. Furthermore, Googles VP9 codec can also be hardware decoded. The Pentium chips should already support HDCP 2.2 and therefore Netflix 4K. HDMI 2.0 however is still only supported with an external converter chip (LSPCon).

Power Consumption

The UHD Graphics 610 can be found in mobile processors specified at 15 W TDP and is therefore suited for compact laptops and ultrabooks.

Intel Iris Pro Graphics 580

► remove from comparison

The Intel Iris Pro Graphics 580 (GT4e) is an integrated graphics unit of the Skylake generation (top version). As successors of the Iris Graphics 6200 (Broadwell), the Iris 580 can be found in some high-end quad core CPUs and offers 128 MB of dedicated eDRAM memory. Furthermore, the so-called GT4e-version features 72 Execution Units (EUs). Besides the eDRAM cache, the Iris 580 is able to access the main memory (2x 64bit DDR3L-1600 / DDR4-2133).

Compared to the Iris Graphics 550 (28 W GT3e), the Iris Pro Graphics 580 offers more EUs (72 vs. 48) and a larger eDRAM Cache (128 vs. 64 MB).

Performance

The exact performance of the Iris Graphics 580 depends on memory configuration and CPU model (different clock speeds). However, it should be clearly faster than the old Broadwell Iris Pro 6200 and may compete with a dedicated GeForce 945M. Modern games of 2015/2016 should be playable in medium settings.

Features

The revised video engine now decodes H.265/HEVC completely in hardware and thereby much more efficiently than before. Displays can be connected via DP 1.2 / eDP 1.3 (max. 3840 x 2160 @ 60 Hz), whereas HDMI is limited to the older version 1.4 (max. 3840 x 2160 @ 30 Hz). However, HDMI 2.0 can be added using a DisplayPort converter. Up to three displays can be controlled simultaneously.

Power Consumption

The Iris Graphics 580 can be found in some mobile high-end quad core processors (45 W). Therefore, they are most likely not used in thin and light laptops.

NVIDIA GeForce GTX 760Intel UHD Graphics 610Intel Iris Pro Graphics 580
Gen. 9 Series
GeForce GTX 780 Ti 2880 @ 0.88 - 0.93 GHz384 Bit @ 3500 MHz
GeForce GTX 760 1152 @ 0.98 - 1.03 GHz256 Bit @ 3000 MHz
GeForce GTX 750 Ti 640 @ 1.02 - 1.09 GHz128 Bit @ 2700 MHz
Iris Pro Graphics P580 72 @ 0.35 - 1.1 GHzeDRAM + 64/128 Bit
Iris Pro Graphics 580 72 @ 0.35 - 1.05 GHzeDRAM + 64/128 Bit
Iris Graphics 550 48 @ 0.3 - 1.1 GHzeDRAM + 64/128 Bit
Iris Graphics 540 48 @ 0.3 - 1.05 GHzeDRAM + 64/128 Bit
HD Graphics 530 24 @ 0.35 - 1.15 GHz64/128 Bit
HD Graphics 520 24 @ 0.3 - 1.05 GHz64/128 Bit
HD Graphics 515 24 @ 0.3 - 1 GHz64/128 Bit
UHD Graphics 610 12 @ 0.3 - 0.95 GHz64/128 Bit
HD Graphics 610 12 @ 0.3 - 0.95 GHz64/128 Bit
HD Graphics 510 12 @ 0.3 - 0.95 GHz64/128 Bit
UHD Graphics 605 18 @ 0.3 - 0.75 GHz64/128 Bit
HD Graphics 505 18 @ 0.3 - 0.75 GHz64/128 Bit
UHD Graphics 600 12 @ 0.3 - 0.7 GHz64/128 Bit
HD Graphics 500 12 @ 0.3 - 0.7 GHz64/128 Bit
ArchitectureKeplerGen. 9 Kaby LakeGen. 9 Skylake
Pipelines1152 - unified12 - unified72 - unified
Core Speed980 - 1033 (Boost) MHz300 - 950 (Boost) MHz350 - 1050 (Boost) MHz
Memory Speed3000 MHz
Memory Bus Width256 Bit64/128 BiteDRAM + 64/128 Bit
Memory TypeGDDR5DDR3/DDR4eDRAM
Max. Amount of Memory2048 MB128 MB
Shared Memorynoyesyes
APIDirectX 11.0, Shader 5.0, OpenGL 4.3DirectX 12_1, OpenGL 4.4DirectX 12_1, OpenGL 4.4
Power Consumption170 Watt
Transistors3.5 Billion
technology28 nm14 nm14 nm
FeaturesSLI, Purevideo, 3D Vision, PhysX, CUDA, GPU Boost 2.0, GeForce Experience, Adaptive VSyncQuickSyncQuickSync
Date of Announcement25.06.2013 01.01.2019 24.01.2016
Link to Manufacturer Pagewww.nvidia.de
CodenameKaby Lake GT1Skylake GT4e
CPU in UHD Graphics 610GPU Base SpeedGPU Boost / Turbo
Intel Core i5-10200H4 x 2400 MHz, 45 W350 MHz1050 MHz
Intel Pentium Gold 6405U2 x 2400 MHz, 15 W300 MHz900 MHz
Intel Pentium Gold 5405U2 x 2300 MHz, 15 W300 MHz950 MHz
min. - max.300 - 350 MHz900 - 1050 MHz
CPU in Iris Pro Graphics 580GPU Base SpeedGPU Boost / Turbo
Intel Core i7-6970HQ4 x 2800 MHz, 45 W350 MHz1050 MHz
Intel Core i7-6870HQ4 x 2700 MHz, 45 W350 MHz1000 MHz
Intel Core i7-6770HQ4 x 2600 MHz, 45 W350 MHz950 MHz
Intel Core i5-6350HQ4 x 2300 MHz, 45 W350 MHz900 MHz
min. - max.350 MHz900 - 1050 MHz

Benchmarks

Performance Rating - 3DMark 11 + Fire Strike + Time Spy - GeForce GTX 760
2.2 pt (7%)
Restrict / Search: Model: Max. age: years
Performance Rating - 3DMark 11 + Fire Strike + Time Spy - UHD Graphics 610
0.2 pt (1%)
Restrict / Search: Model: Max. age: years
Performance Rating - 3DMark 11 + Fire Strike + Time Spy - Iris Pro Graphics 580
0.7 pt (2%)
0.05426 -92%
...
0.641 -10%
0.646 -9%
0.653 -8%
0.655 -8%
0.659 -7%
0.661 -7%
0.662 -7%
0.69 -3%
0.705 -1%
Intel Iris Pro Graphics 580
0.712
0.712 0%
0.723 2%
0.73 3%
Intel UHD Graphics 32EUs (Alder Lake)
0.731 3%
0.742 4%
0.747 5%
0.747 5%
0.777 9%
NVIDIA GeForce GTX 460 768MB
0.783 10%
...
33.3 4577%
0%
100%
Restrict / Search: Model: Max. age: years
3DMark - 3DMark Time Spy Score
222 Points (1%)
3DMark - 3DMark Time Spy Graphics
194 Points (0%)
3DMark - 3DMark Ice Storm Unlimited Graphics
min: 41521     avg: 42713     median: 42712.5 (4%)     max: 43904 Points
184880 Points (19%)
3DMark - 3DMark Ice Storm Extreme Graphics
20443 Points (2%)
98218 Points (12%)
3DMark - 3DMark Cloud Gate Score
19815 Points (19%)
min: 4244     avg: 4334     median: 4333.5 (4%)     max: 4423 Points
11346 Points (11%)
3DMark - 3DMark Cloud Gate Graphics
40150 Points (10%)
min: 5139     avg: 5277     median: 5276.5 (1%)     max: 5414 Points
14594 Points (4%)
3DMark - 3DMark Fire Strike Standard Score
5431 Points (8%)
min: 597     avg: 616     median: 616 (1%)     max: 635 Points
1836 Points (3%)
3DMark - 3DMark Fire Strike Standard Graphics
5959 Points (5%)
min: 634     avg: 664     median: 663.5 (1%)     max: 693 Points
1903 Points (2%)
3DMark - 3DMark Ice Storm Graphics
304574 Points (34%)
min: 33154     avg: 36325     median: 36325 (4%)     max: 39496 Points
149585 Points (17%)
3DMark - 3DMark Night Raid
2629 Points (2%)
3DMark - 3DMark Night Raid Graphics Score
2850 Points (1%)
3DMark 11 - 3DM11 Performance Score
7985 Points (10%)
min: 1026     avg: 1046     median: 1045.5 (1%)     max: 1065 Points
3510 Points (4%)
3DMark 11 - 3DM11 Performance GPU
7962 Points (6%)
min: 915     avg: 923     median: 922.5 (1%)     max: 930 Points
3220 Points (2%)
3DMark Vantage
3DM Vant. Perf. total + NVIDIA GeForce GTX 760
3DMark Vantage - 3DM Vant. Perf. total
29073 Points (8%)
3DM Vant. Perf. total + Intel UHD Graphics 610
3996 Points (1%)
3DM Vant. Perf. GPU no PhysX + NVIDIA GeForce GTX 760
3DMark Vantage - 3DM Vant. Perf. GPU no PhysX
30123 Points (16%)
3DM Vant. Perf. GPU no PhysX + Intel UHD Graphics 610
3375 Points (2%)
3DMark 05 - 3DMark 05 - Standard
12054 Points (13%)
3DMark 06 3DMark 06 - Standard 1280x1024 + Intel UHD Graphics 610
3DMark 06
min: 6026     avg: 6902     median: 6902 (9%)     max: 7778 Points
Unigine Valley 1.0 - Unigine Valley 1.0 DX
min: 3     avg: 3.4     median: 3.4 (1%)     max: 3.7 fps
Unigine Heaven 3.0 - Unigine Heaven 3.0 DX 11
75.2 fps (25%)
Unigine Heaven 2.1 - Heaven 2.1 high
103.1 fps (19%)
Cinebench R10 Cinebench R10 Shading (32bit) + Intel UHD Graphics 610
Cinebench R10 - Cinebench R10 Shading (32bit)
min: 4516     avg: 5210     median: 5209.5 (4%)     max: 5903 Points
Cinebench R10 Shading (32bit) + Intel Iris Pro Graphics 580
11355 Points (8%)
Cinebench R11.5 Cinebench R11.5 OpenGL 64 Bit + Intel UHD Graphics 610
Cinebench R11.5 - Cinebench R11.5 OpenGL 64 Bit
17.3 fps (6%)
Cinebench R11.5 OpenGL 64 Bit + Intel Iris Pro Graphics 580
63 fps (21%)
Cinebench R15
Cinebench R15 OpenGL 64 Bit + Intel UHD Graphics 610
Cinebench R15 - Cinebench R15 OpenGL 64 Bit
min: 27.5     avg: 28.4     median: 28.4 (2%)     max: 29.24 fps
Cinebench R15 OpenGL 64 Bit + Intel Iris Pro Graphics 580
min: 85.1     avg: 85.6     median: 85.6 (5%)     max: 86 fps
Cinebench R15 OpenGL Ref. Match 64 Bit + Intel UHD Graphics 610
Cinebench R15 - Cinebench R15 OpenGL Ref. Match 64 Bit
97.8 % (98%)
Cinebench R15 OpenGL Ref. Match 64 Bit + Intel Iris Pro Graphics 580
min: 97.8     avg: 97.9     median: 97.8 (98%)     max: 98 %
GFXBench - GFXBench 5.0 Aztec Ruins High Tier Offscreen
5.4 fps (1%)
GFXBench - GFXBench 5.0 Aztec Ruins Normal Tier Offscreen
15.3 fps (1%)
GFXBench - GFXBench Car Chase Offscreen
16.7 fps (2%)
GFXBench 3.1 - GFXBench Manhattan ES 3.1 Offscreen
23.1 fps (0%)
GFXBench 3.0 - GFXBench 3.0 Manhattan Offscreen
33.1 fps (1%)
GFXBench (DX / GLBenchmark) 2.7
GFXBench T-Rex HD Offscreen C24Z16 + Intel UHD Graphics 610
GFXBench (DX / GLBenchmark) 2.7 - GFXBench T-Rex HD Offscreen C24Z16
71.9 fps (1%)
Basemark GPU 1.2 - Basemark GPU 1.2 Vulkan Official Medium Offscreen 1080
25.5 fps (1%)
LuxMark v2.0 64Bit - LuxMark v2.0 Room GPU
min: 144     avg: 157     median: 157 (1%)     max: 170 Samples/s
362 Samples/s (1%)
LuxMark v2.0 64Bit - LuxMark v2.0 Sala GPU
min: 295     avg: 304.5     median: 304.5 (1%)     max: 314 Samples/s
875 Samples/s (2%)
ComputeMark v2.1 - ComputeMark v2.1 Result
min: 480     avg: 481.5     median: 481.5 (0%)     max: 483 Points
2308 Points (2%)
Power Consumption - Furmark Stress Test Power Consumption - external Monitor *
min: 18     avg: 23.1     median: 23.1 (3%)     max: 28.2 Watt
Power Consumption - Witcher 3 Power Consumption *
25.6 Watt (6%)
Clock Speed - GPU Clock Speed Furmark
948 MHz (38%)

Average Benchmarks NVIDIA GeForce GTX 760 → 100% n=7

Average Benchmarks Intel UHD Graphics 610 → 13% n=7

Average Benchmarks Intel Iris Pro Graphics 580 → 42% n=7

- Range of benchmark values for this graphics card
red legend - Average benchmark values for this graphics card
* Smaller numbers mean a higher performance
1 This benchmark is not used for the average calculation

Game Benchmarks

The following benchmarks stem from our benchmarks of review laptops. The performance depends on the used graphics memory, clock rate, processor, system settings, drivers, and operating systems. So the results don't have to be representative for all laptops with this GPU. For detailed information on the benchmark results, click on the fps number.

F1 2021

F1 2021

2021
low 1280x720
UHD Graphics 610:
19.7  fps
med. 1920x1080
UHD Graphics 610:
7.9  fps
high 1920x1080
UHD Graphics 610:
6.3  fps
F1 2020

F1 2020

2020
low 1280x720
UHD Graphics 610:
17.6  fps
med. 1920x1080
UHD Graphics 610:
7.5  fps
high 1920x1080
UHD Graphics 610:
5.5  fps
low 1280x720
UHD Graphics 610:
15.5  fps
low 1280x720
UHD Graphics 610:
0 (!)  fps
low 1280x720
UHD Graphics 610:
8.6  fps
med. 1920x1080
UHD Graphics 610:
30.4  fps
high 1920x1080
UHD Graphics 610:
21.9  fps
med. 1920x1080
UHD Graphics 610:
7.7  fps
low 1280x720
UHD Graphics 610:
8  fps
low 1280x720
UHD Graphics 610:
6  fps
FIFA 20

FIFA 20

2019
low 1280x720
UHD Graphics 610:
27.5 (!)  fps
F1 2019

F1 2019

2019
low 1280x720
UHD Graphics 610:
16.6  fps
low 1280x720
UHD Graphics 610:
16.9  fps
med. 1920x1080
UHD Graphics 610:
5  fps
Anno 1800

Anno 1800

2019
low 1280x720
UHD Graphics 610:
10.4  fps
low 1280x720
UHD Graphics 610:
23.6 24.7 ~ 24 fps
low 1280x720
UHD Graphics 610:
7 8 ~ 8 fps
med. 1920x1080
UHD Graphics 610:
4  fps
high 1920x1080
UHD Graphics 610:
4  fps
low 1280x720
UHD Graphics 610:
6.8  fps
low 1280x720
UHD Graphics 610:
9  fps
Strange Brigade

Strange Brigade

2018
low 1280x720
UHD Graphics 610:
18.3  fps
med. 1920x1080
UHD Graphics 610:
7.7  fps
high 1920x1080
UHD Graphics 610:
10  fps
ultra 1920x1080
UHD Graphics 610:
13.6  fps
Far Cry 5

Far Cry 5

2018
low 1280x720
UHD Graphics 610:
7 8 ~ 8 fps
med. 1920x1080
UHD Graphics 610:
4  fps
high 1920x1080
UHD Graphics 610:
3  fps
low 1280x720
UHD Graphics 610:
9.6 10.9 ~ 10 fps
med. 1920x1080
UHD Graphics 610:
7.5 10.5 ~ 9 fps
high 1920x1080
UHD Graphics 610:
6.9 7.3 ~ 7 fps
low 1280x720
UHD Graphics 610:
7.7  fps
med. 1920x1080
UHD Graphics 610:
3.5  fps
high 1920x1080
UHD Graphics 610:
3.5  fps
Fortnite

Fortnite

2018
low 1280x720
UHD Graphics 610:
23.8 (!)  fps
low 1280x720
UHD Graphics 610:
14  fps
low 1280x720
UHD Graphics 610:
20.3  fps
Overwatch

Overwatch

2016
low 1280x720
UHD Graphics 610:
24.8  fps
Iris Pro Graphics 580:
60.5  fps
med. 1366x768
UHD Graphics 610:
17.7  fps
Iris Pro Graphics 580:
53.3  fps
high 1920x1080
Iris Pro Graphics 580:
42.9  fps
ultra 1920x1080
Iris Pro Graphics 580:
23.1  fps
Doom

Doom

2016
low 1280x720
Iris Pro Graphics 580:
0 (!)  fps
low 1024x768
Iris Pro Graphics 580:
30.2  fps
med. 1366x768
Iris Pro Graphics 580:
18.2  fps
high 1920x1080
Iris Pro Graphics 580:
12.2  fps
ultra 1920x1080
Iris Pro Graphics 580:
8.9  fps
low 1024x768
UHD Graphics 610:
24.2  fps
med. 1366x768
UHD Graphics 610:
15.1  fps
Fallout 4

Fallout 4

2015
low 1280x720
Iris Pro Graphics 580:
0 (!)  fps
low 1024x768
Iris Pro Graphics 580:
59.9  fps
med. 1366x768
Iris Pro Graphics 580:
58.6  fps
high 1920x1080
Iris Pro Graphics 580:
23  fps
ultra 1920x1080
Iris Pro Graphics 580:
14.9  fps
low 1280x720
UHD Graphics 610:
54.4 63.1 ~ 59 fps
Iris Pro Graphics 580:
59.8  fps
med. 1366x768
UHD Graphics 610:
23.1 31.7 ~ 27 fps
Iris Pro Graphics 580:
37.2  fps
high 1920x1080
UHD Graphics 610:
10.6 12.8 ~ 12 fps
Iris Pro Graphics 580:
15.3  fps
ultra 1920x1080
UHD Graphics 610:
9.7 11.6 ~ 11 fps
Iris Pro Graphics 580:
14  fps
low 1280x720
Iris Pro Graphics 580:
0 (!)  fps
low 1024x768
UHD Graphics 610:
9.2 11.3 ~ 10 fps
med. 1366x768
UHD Graphics 610:
7.7  fps
high 1920x1080
UHD Graphics 610:
4.2  fps
GTA V

GTA V

2015
low 1024x768
UHD Graphics 610:
17.9 28.5 ~ 23 fps
med. 1366x768
UHD Graphics 610:
16.7 25.4 ~ 21 fps
high 1920x1080
UHD Graphics 610:
6  fps
F1 2014

F1 2014

2014
low 1024x768
100%
GeForce GTX 760:
132  fps
med. 1366x768
100%
GeForce GTX 760:
131  fps
high 1920x1080
100%
GeForce GTX 760:
128  fps
ultra 1920x1080
100%
GeForce GTX 760:
111  fps
low 1024x768
100%
GeForce GTX 760:
65.4  fps
med. 1366x768
100%
GeForce GTX 760:
64.7  fps
high 1920x1080
100%
GeForce GTX 760:
43.6  fps
low 1024x768
100%
GeForce GTX 760:
85.9  fps
med. 1366x768
100%
GeForce GTX 760:
71.3  fps
high 1920x1080
100%
GeForce GTX 760:
37.4  fps
ultra 1920x1080
100%
GeForce GTX 760:
35.2  fps
low 1024x768
100%
GeForce GTX 760:
242.7  fps
med. 1366x768
100%
GeForce GTX 760:
176.8  fps
high 1920x1080
100%
GeForce GTX 760:
97.5  fps
ultra 1920x1080
100%
GeForce GTX 760:
67.7  fps
low 1280x720
100%
GeForce GTX 760:
167.6  fps
med. 1344x756
100%
GeForce GTX 760:
102.8  fps
high 1920x1080
100%
GeForce GTX 760:
61.3  fps
ultra 1920x1080
100%
GeForce GTX 760:
37.4  fps
Fifa 15

Fifa 15

2014
low 1280x720
100%
GeForce GTX 760:
309.8  fps
high 1366x768
100%
GeForce GTX 760:
219  fps
ultra 1920x1080
100%
GeForce GTX 760:
181.3  fps
Sims 4

Sims 4

2014
low 1024x768
100%
GeForce GTX 760:
183  fps
med. 1366x768
100%
GeForce GTX 760:
97  fps
high 1920x1080
100%
GeForce GTX 760:
83.7  fps
ultra 1920x1080
100%
GeForce GTX 760:
77.8  fps
low 1024x768
100%
GeForce GTX 760:
56.7  fps
med. 1366x768
100%
GeForce GTX 760:
66.4  fps
high 1920x1080
100%
GeForce GTX 760:
63.1  fps
ultra 1920x1080
100%
GeForce GTX 760:
59.2  fps
low 1024x768
100%
GeForce GTX 760:
290.2  fps
med. 1366x768
100%
GeForce GTX 760:
154.8  fps
high 1920x1080
100%
GeForce GTX 760:
128.7  fps
ultra 1920x1080
100%
GeForce GTX 760:
73.2  fps
low 1024x768
100%
GeForce GTX 760:
96.2  fps
med. 1366x768
100%
GeForce GTX 760:
80.4  fps
high 1920x1080
100%
GeForce GTX 760:
41.1  fps
low 1280x720
100%
GeForce GTX 760:
60  fps
med. 1280x720
100%
GeForce GTX 760:
60  fps
high 1920x1080
100%
GeForce GTX 760:
60  fps
low 1024x768
100%
GeForce GTX 760:
98.9  fps
med. 1366x768
100%
GeForce GTX 760:
97.9  fps
high 1366x768
100%
GeForce GTX 760:
94.8  fps
ultra 1920x1080
100%
GeForce GTX 760:
65.1  fps
Thief

Thief

2014
low 1024x768
100%
GeForce GTX 760:
97.7  fps
45%
Iris Pro Graphics 580:
43.8  fps
med. 1366x768
100%
GeForce GTX 760:
75.5  fps
40%
Iris Pro Graphics 580:
30.1  fps
high 1366x768
100%
GeForce GTX 760:
67.3  fps
37%
Iris Pro Graphics 580:
25  fps
ultra 1920x1080
100%
GeForce GTX 760:
39.2  fps
32%
Iris Pro Graphics 580:
12.4  fps
low 1024x768
100%
GeForce GTX 760:
150.2  fps
med. 1366x768
100%
GeForce GTX 760:
112.5  fps
high 1366x768
100%
GeForce GTX 760:
76.2  fps
ultra 1920x1080
100%
GeForce GTX 760:
50  fps
low 1024x768
100%
GeForce GTX 760:
176.4  fps
med. 1366x768
100%
GeForce GTX 760:
141.7  fps
high 1366x768
100%
GeForce GTX 760:
104.6  fps
ultra 1920x1080
100%
GeForce GTX 760:
49.3  fps
low 1280x720
100%
GeForce GTX 760:
98.5  fps
med. 1366x768
100%
GeForce GTX 760:
87.9  fps
high 1366x768
100%
GeForce GTX 760:
77.8  fps
ultra 1920x1080
100%
GeForce GTX 760:
55.3  fps
Dota 2

Dota 2

2013
low 1024x768
100%
GeForce GTX 760:
119.7  fps
med. 1366x768
100%
GeForce GTX 760:
119.7  fps
ultra 1920x1080
100%
GeForce GTX 760:
115.3  fps
GRID 2

GRID 2

2013
low 1024x768
100%
GeForce GTX 760:
205.9  fps
med. 1366x768
100%
GeForce GTX 760:
161.2  fps
high 1366x768
100%
GeForce GTX 760:
150.2  fps
ultra 1920x1080
100%
GeForce GTX 760:
79.5  fps
low 1024x768
100%
GeForce GTX 760:
126.4  fps
50%
Iris Pro Graphics 580:
63.7  fps
med. 1366x768
100%
GeForce GTX 760:
112.5  fps
45%
Iris Pro Graphics 580:
50.8  fps
high 1366x768
100%
GeForce GTX 760:
73.5  fps
39%
Iris Pro Graphics 580:
28.5  fps
ultra 1920x1080
100%
GeForce GTX 760:
41.8  fps
34%
Iris Pro Graphics 580:
14.3  fps
low 1280x720
100%
GeForce GTX 760:
269.5  fps
38%
Iris Pro Graphics 580:
101.3  fps
med. 1366x768
100%
GeForce GTX 760:
186.8  fps
31%
Iris Pro Graphics 580:
57.9  fps
high 1366x768
100%
GeForce GTX 760:
164.8  fps
31%
Iris Pro Graphics 580:
51  fps
ultra 1920x1080
100%
GeForce GTX 760:
65.3  fps
23%
Iris Pro Graphics 580:
14.9  fps
low 1024x768
Iris Pro Graphics 580:
380.6  fps
med. 1366x768
Iris Pro Graphics 580:
127.1  fps
high 1366x768
Iris Pro Graphics 580:
73.6  fps
ultra 1920x1080
Iris Pro Graphics 580:
36.2  fps
low 1024x768
100%
GeForce GTX 760:
398.7  fps
med. 1366x768
100%
GeForce GTX 760:
235.8  fps
high 1366x768
100%
GeForce GTX 760:
167.1  fps
ultra 1920x1080
100%
GeForce GTX 760:
72.9  fps
Crysis 3

Crysis 3

2013
low 1024x768
100%
GeForce GTX 760:
142  fps
med. 1366x768
100%
GeForce GTX 760:
119.3  fps
high 1366x768
100%
GeForce GTX 760:
83  fps
ultra 1920x1080
100%
GeForce GTX 760:
33.3  fps
Far Cry 3

Far Cry 3

2012
low 1024x768
100%
GeForce GTX 760:
132.4  fps
med. 1366x768
100%
GeForce GTX 760:
123.6  fps
high 1366x768
100%
GeForce GTX 760:
91  fps
ultra 1920x1080
100%
GeForce GTX 760:
34.3  fps
low 1024x768
100%
GeForce GTX 760:
93.7  fps
med. 1366x768
100%
GeForce GTX 760:
89.4  fps
high 1366x768
100%
GeForce GTX 760:
74.9  fps
ultra 1920x1080
100%
GeForce GTX 760:
40.7  fps
low 1024x768
100%
GeForce GTX 760:
131.2  fps
88%
Iris Pro Graphics 580:
115.8  fps
high 1366x768
100%
GeForce GTX 760:
72.8  fps
53%
Iris Pro Graphics 580:
38.7  fps
ultra 1920x1080
100%
GeForce GTX 760:
50.4  fps
33%
Iris Pro Graphics 580:
16.7  fps
low 1024x768
UHD Graphics 610:
57.9  fps
med. 1366x768
UHD Graphics 610:
42.1  fps
low 1024x768
Iris Pro Graphics 580:
107.2  fps
med. 1366x768
Iris Pro Graphics 580:
81.2  fps
high 1366x768
Iris Pro Graphics 580:
37.3  fps
ultra 1920x1080
Iris Pro Graphics 580:
8.8  fps
low 1024x768
UHD Graphics 610:
38.9  fps
med. 1366x768
UHD Graphics 610:
26.2  fps

Average Gaming NVIDIA GeForce GTX 760 → 100%

Average Gaming 30-70 fps → 100%

Average Gaming Intel Iris Pro Graphics 580 → 41%

Average Gaming 30-70 fps → 42%

NVIDIA GeForce GTX 760Intel UHD Graphics 610Intel Iris Pro Graphics 580
lowmed.highultraQHD4Klowmed.highultraQHD4Klowmed.highultraQHD4K
F1 202119.77.886.26
F1 202017.67.545.5
Gears Tactics15.5
Doom Eternal
Hunt Showdown8.59
Hearthstone30.421.9
Star Wars Jedi Fallen Order7.74
Need for Speed Heat8
Ghost Recon Breakpoint6
FIFA 2027.5
F1 201916.6
Total War: Three Kingdoms16.95
Anno 180010.4
Dirt Rally 2.024
Far Cry New Dawn844
Battlefield V6.82
Shadow of the Tomb Raider9
Strange Brigade18.37.71013.6
Far Cry 5843
X-Plane 11.111097
Final Fantasy XV Benchmark7.733.533.53
Fortnite23.8
Middle-earth: Shadow of War14
Rocket League20.3
Overwatch24.817.760.553.342.923.1
Rainbow Six Siege24.215.1
Dota 2 Reborn5927121159.837.215.314
The Witcher 3107.684.18
GTA V23215.97
Counter-Strike: GO57.942.1
Diablo III38.926.2
NVIDIA GeForce GTX 760Intel UHD Graphics 610Intel Iris Pro Graphics 580
lowmed.highultraQHD4Klowmed.highultraQHD4Klowmed.highultraQHD4K
< 30 fps
< 60 fps
< 120 fps
≥ 120 fps


< 30 fps
< 60 fps
< 120 fps
≥ 120 fps
25
3

15
2

11


2


< 30 fps
< 60 fps
< 120 fps
≥ 120 fps

1
1

2

1
1

2


For more games that might be playable and a list of all games and graphics cards visit our Gaming List

v1.33
log 25. 05:19:46

#0 ran 0s before starting gpusingle class +0s ... 0s

#1 checking url part for id 5599 +0s ... 0s

#2 checking url part for id 10401 +0s ... 0s

#3 checking url part for id 7236 +0s ... 0s

#4 redirected to Ajax server, took 1756091986s time from redirect:0 +0s ... 0s

#5 did not recreate cache, as it is less than 5 days old! Created at Mon, 25 Aug 2025 05:18:48 +0200 +0s ... 0s

#6 composed specs +0.003s ... 0.004s

#7 did output specs +0s ... 0.004s

#8 start showIntegratedCPUs +0s ... 0.004s

#9 getting avg benchmarks for device 5599 +0.011s ... 0.015s

#10 got single benchmarks 5599 +0s ... 0.015s

#11 getting avg benchmarks for device 10401 +0.001s ... 0.016s

#12 got single benchmarks 10401 +0.001s ... 0.017s

#13 getting avg benchmarks for device 7236 +0.004s ... 0.021s

#14 got single benchmarks 7236 +0.004s ... 0.025s

#15 got avg benchmarks for devices +0s ... 0.025s

#16 min, max, avg, median took s +0.023s ... 0.047s

#17 before gaming benchmark output +0s ... 0.047s

#18 Got 208 rows for game benchmarks. +0.007s ... 0.054s

#19 composed SQL query for gamebenchmarks +0s ... 0.054s

#20 got data and put it in $dataArray +0.002s ... 0.056s

#21 benchmarks composed for output. +0.02s ... 0.076s

#22 calculated avg scores. +0s ... 0.076s

#23 return log +0s ... 0.076s

Please share our article, every link counts!
Mail Logo
> Expert Reviews and News on Laptops, Smartphones and Tech Innovations > Benchmarks / Tech > Graphics Card Comparison - Head 2 Head
Redaktion, 2017-09- 8 (Update: 2023-07- 1)