


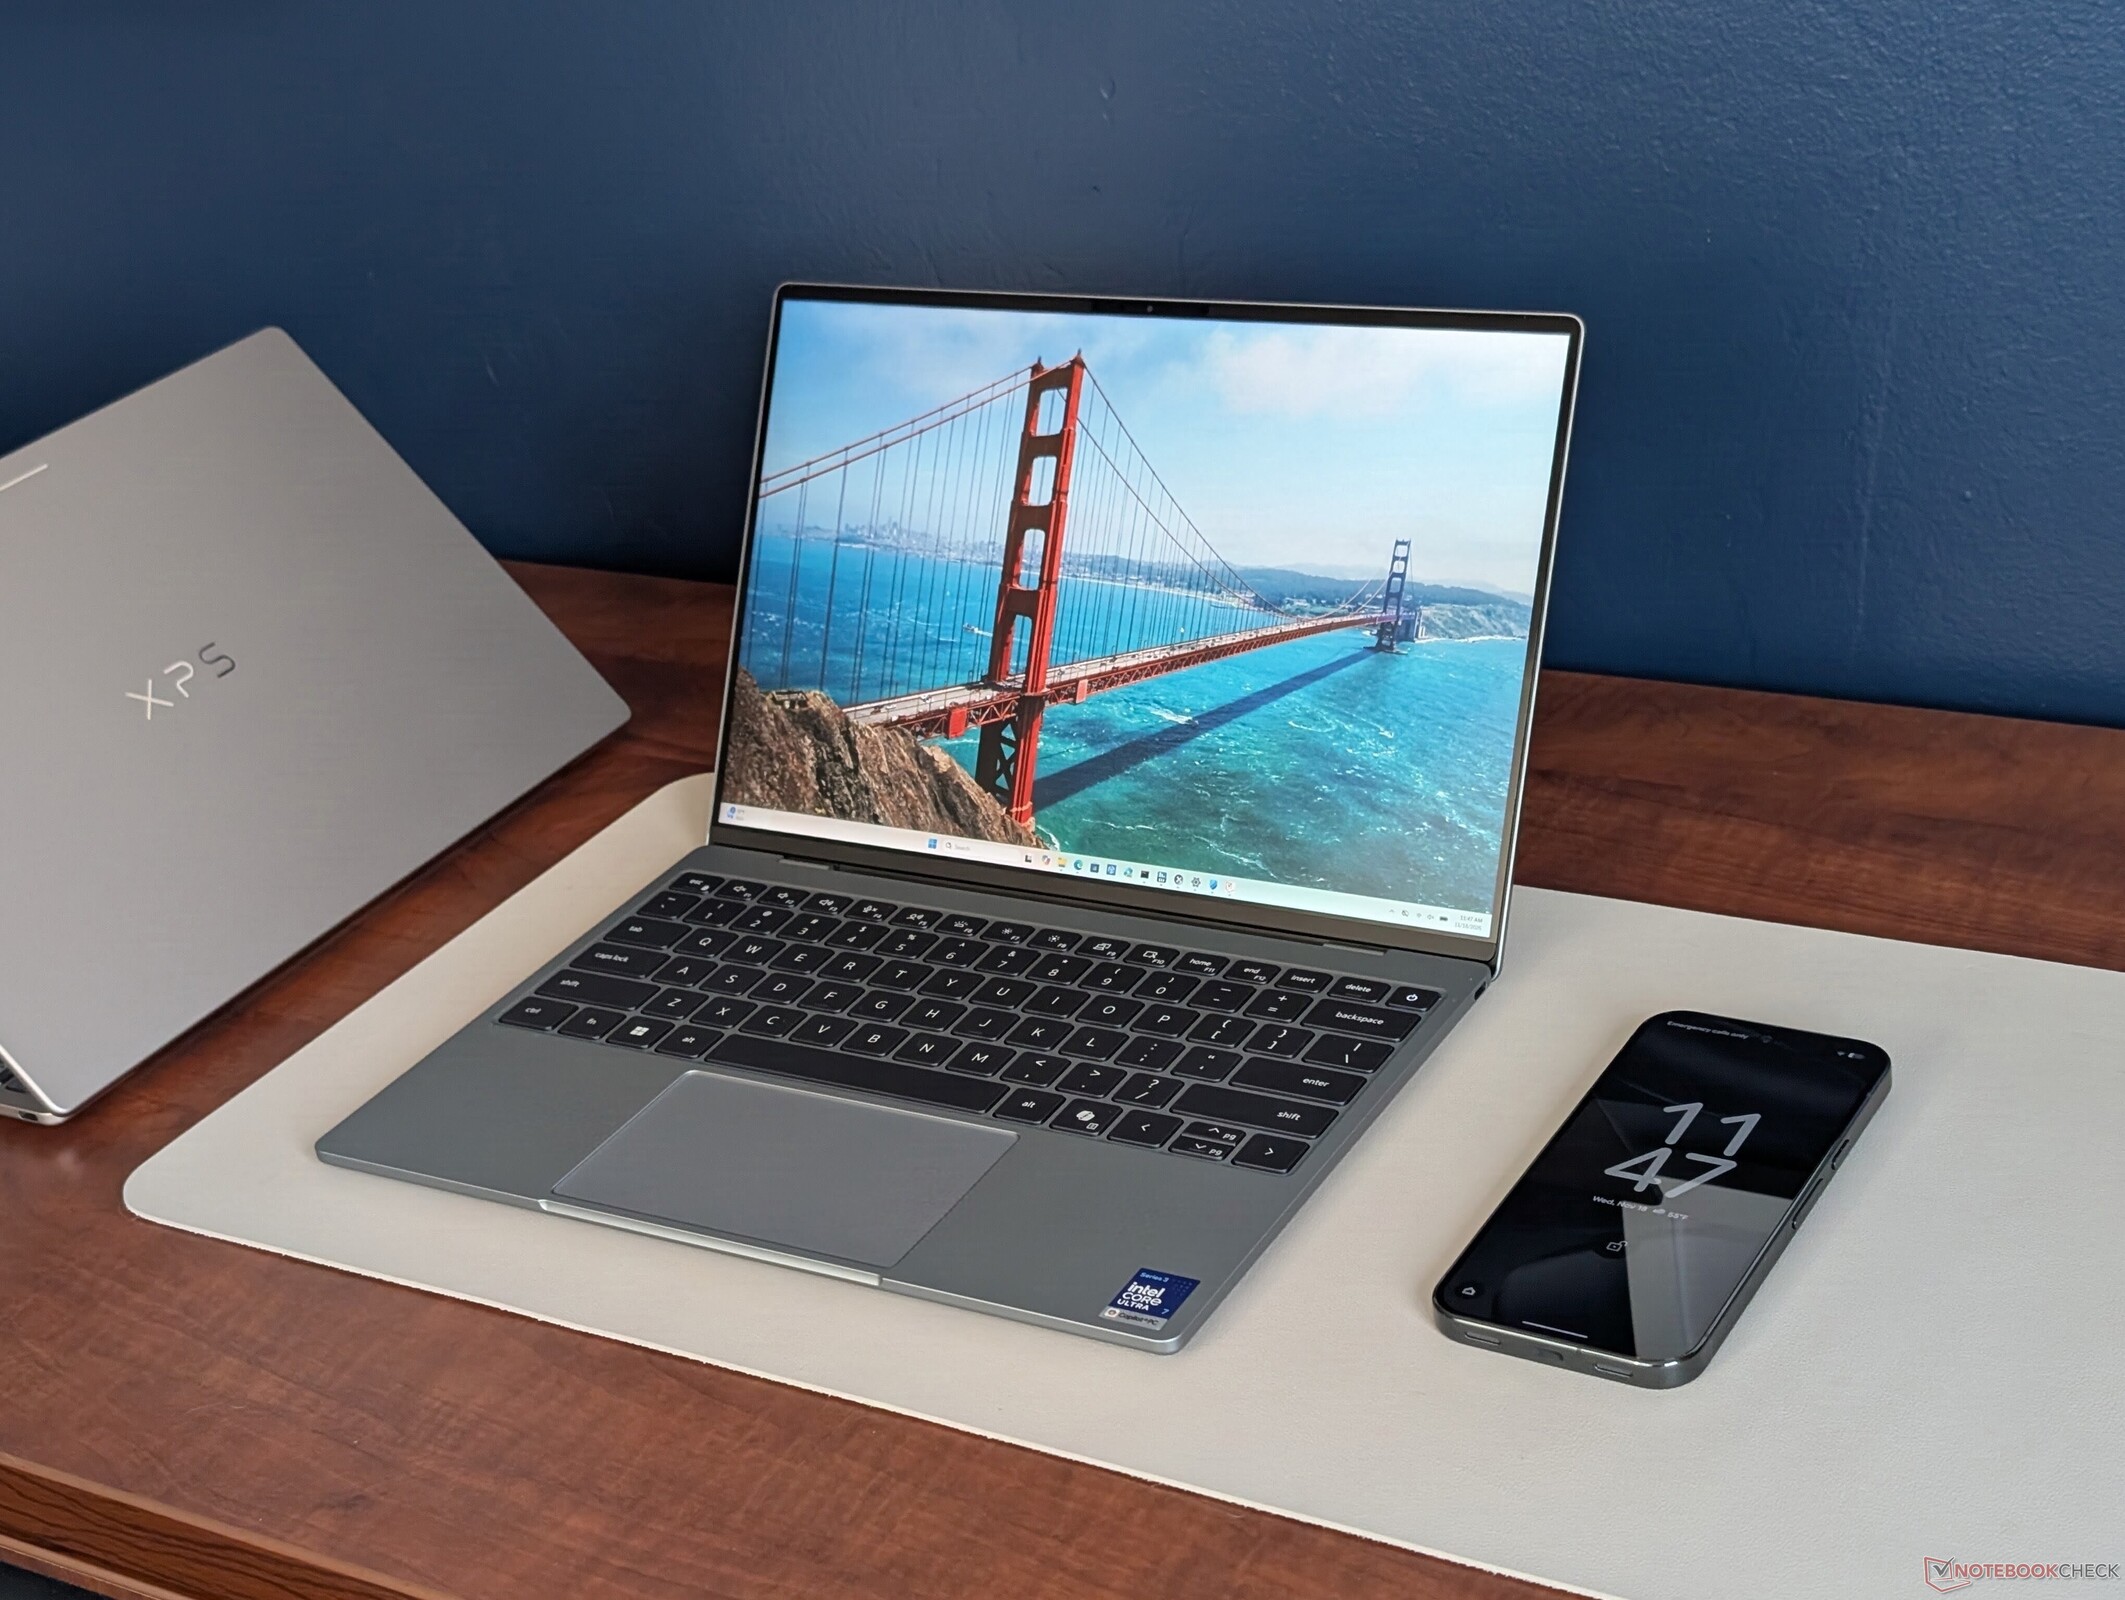
Verdict — Finding The Right Balance Between CPU, RAM, And Price
At the time of writing, the Core Ultra 7 SKU retails for $1000 more than the baseline Core 5 option. RAM doubles from 8 GB to 16 GB while storage quadruples from 256 GB to 1 TB. The CPU upgrade, however, is unfortunately not as straightforward.
Our tests show that the Core Ultra 7 355 can provide a significant performance boost of ~50% over the Core 5 320. On the other hand, the performance gap would drop to just 7 to 10 percent when running sustained loads for longer periods. This means that the Core Ultra 7 system feels noticeably faster than the base option when multitasking and launching applications while the boost becomes less noticeable if encoding long videos, compressing/decompressing large files, or running other CPU-heavy tasks that can last for several minutes or longer.
Ideally, the system would be able to sustain Turbo Boost speeds for longer to make the Core Ultra 7 configuration more lucrative. Most office users will not find the limited Turbo Boost to be a dealbreaker whereas power users may want to consider the slightly larger XPS 14 or ExpertBook Ultra instead for much faster performance.
The uneven CPU performance advantage makes it difficult to justify the wide price difference between the 8 GB Core 5 and 16 GB Core Ultra 7 configurations. Now having tested both extremes, we can comfortably say that the 16 GB Core 5 configuration for ~$1000 is a reasonable middle ground for most light users and students.
Pros
Cons
Price and Availability
The XPS 13 with Core Ultra 7 currently retails for $1800 while the base Core 5 option starts at $750.

The 2026 XPS 13 made waves for its ultra-low starting price of $800 when it launched earlier this year. With just 8 GB of RAM, however, the base Core 5 configuration may not have been for everyone regardless of how sleek or visually attractive the model may be. This time, we're checking out the more "proper" Core Ultra 7 configuration with 16 GB of RAM retailing for a much higher price of $1800.
Competitors in this space include other ultrathin prosumer subnotebooks like the MSI Prestige 13, Surface Laptop 13, or the HP OmniBook 7 Aero 13. We recommend checking out our original XPS 13 Wildcat review for more details on the physical features of the model.
More Dell reviews:
Specifications
Case
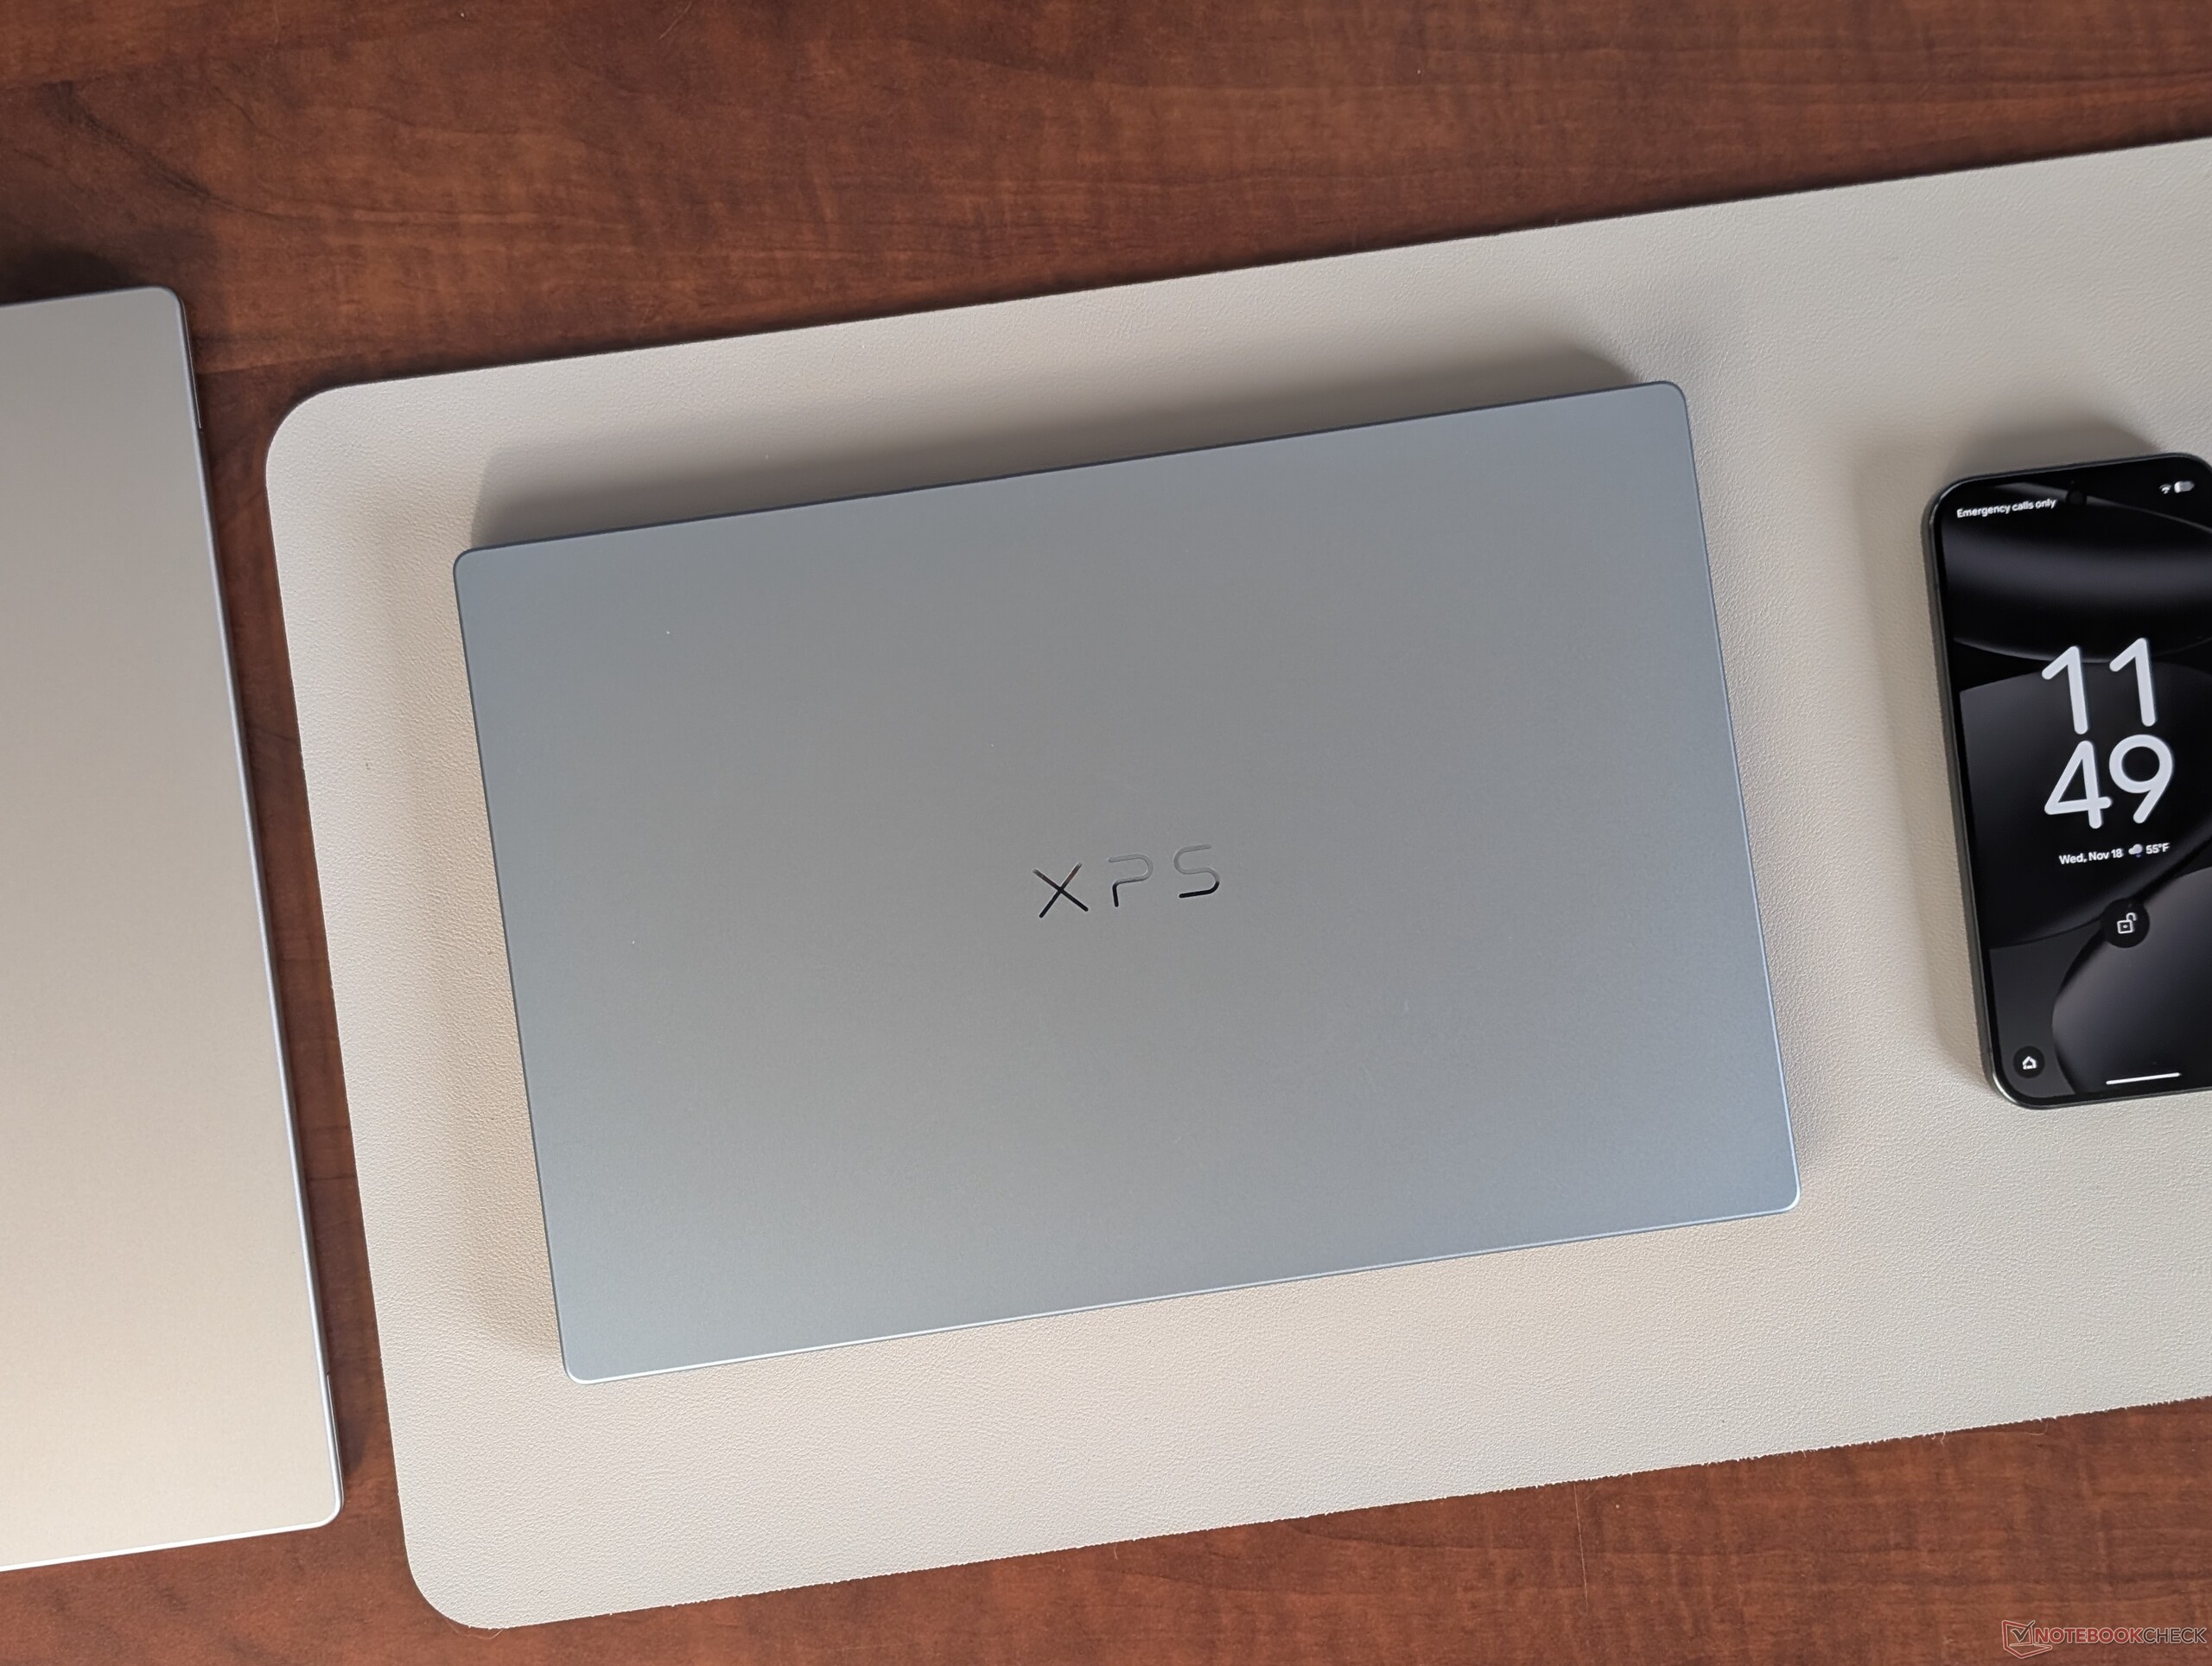
Connectivity


Communication
| Networking | |
| iperf3 transmit Wi-Fi6/7 RT-BE96U | |
| Dell XPS 13 DX13260 Core Ultra 7 | |
| MSI Prestige 13 AI+ A3MG | |
| Microsoft Surface Laptop 13 2026 | |
| iperf3 receive Wi-Fi6/7 RT-BE96U | |
| Dell XPS 13 DX13260 Core Ultra 7 | |
| MSI Prestige 13 AI+ A3MG | |
| Microsoft Surface Laptop 13 2026 | |
| iperf3 receive AXE11000 6GHz | |
| Framework Laptop 13 Pro | |
| Dell XPS 13 DX13260 | |
| iperf3 transmit AXE11000 6GHz | |
| Framework Laptop 13 Pro | |
| Dell XPS 13 DX13260 | |
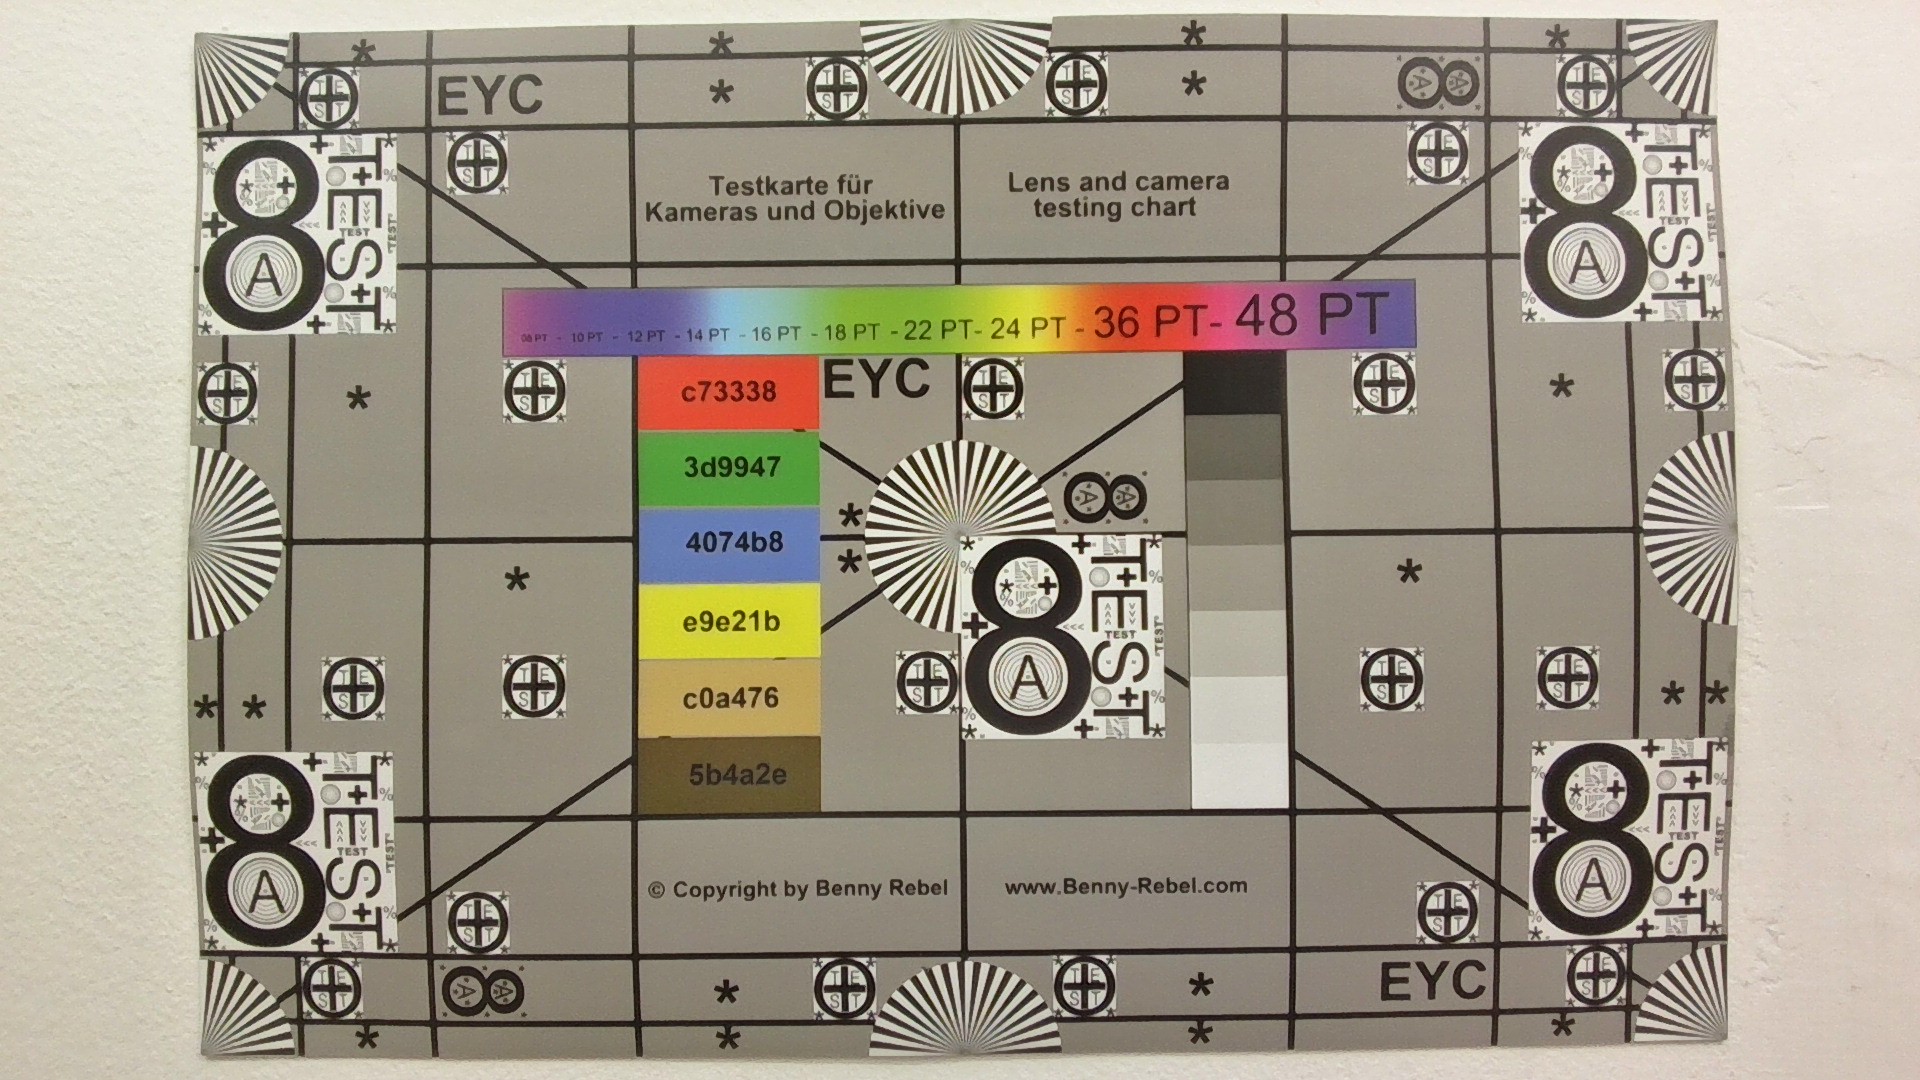
Webcam


Maintenance

Input Devices

Display
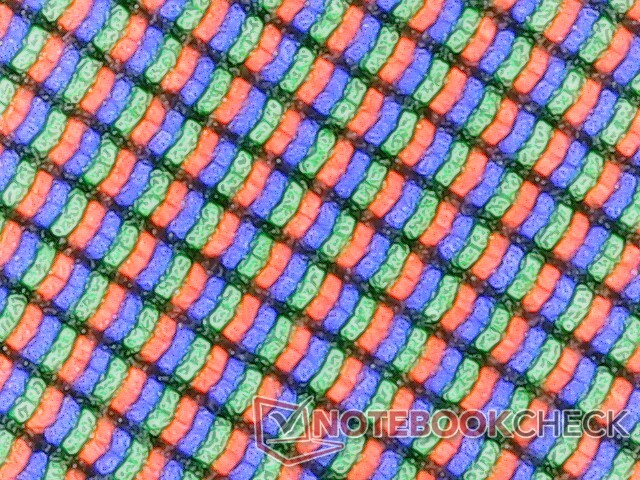
Interestingly, our Core Ultra 7 unit ships with a Sharp LQ134Z1 panel instead of the LG Philips LP134WQ panel as found on our Core 5 unit. Both are otherwise nearly identical as they are each 120 Hz matte IPS touchscreens with full P3 colors and similar characteristics.

| |||||||||||||||||||||||||
Brightness Distribution: 76 %
Center on Battery: 473.3 cd/m²
Contrast: 2456:1 (Black: 0.2 cd/m²)
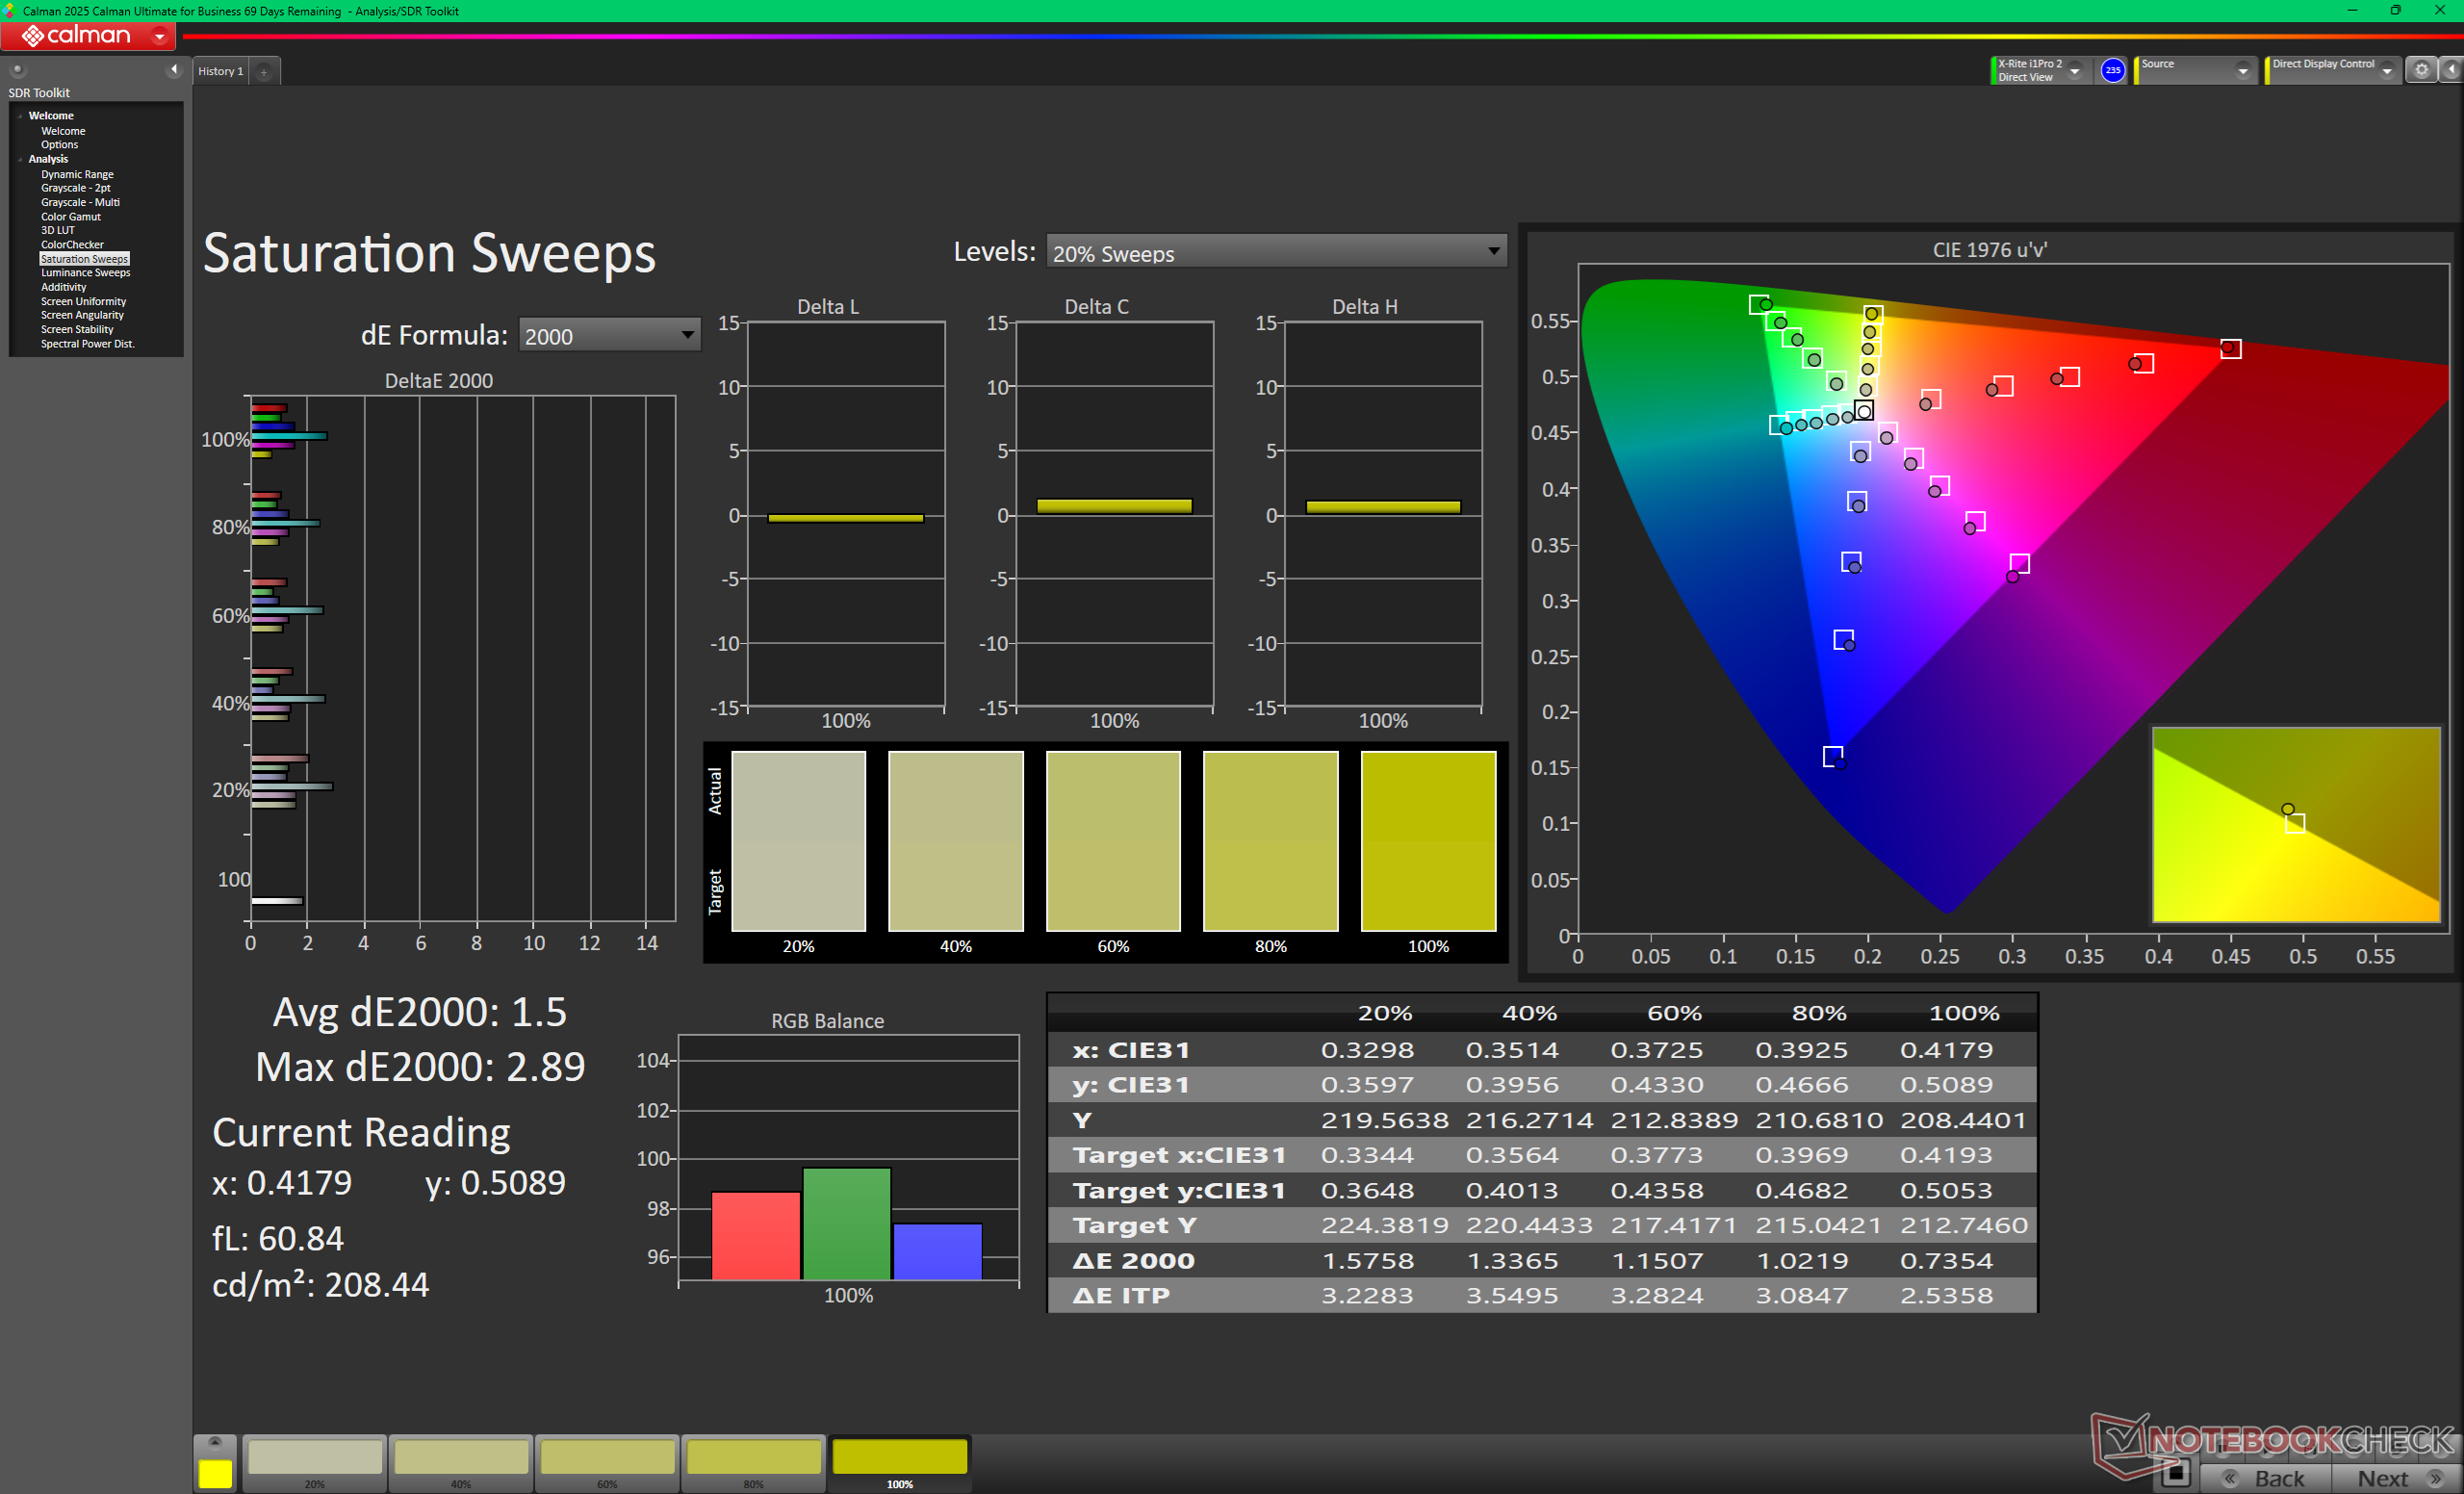
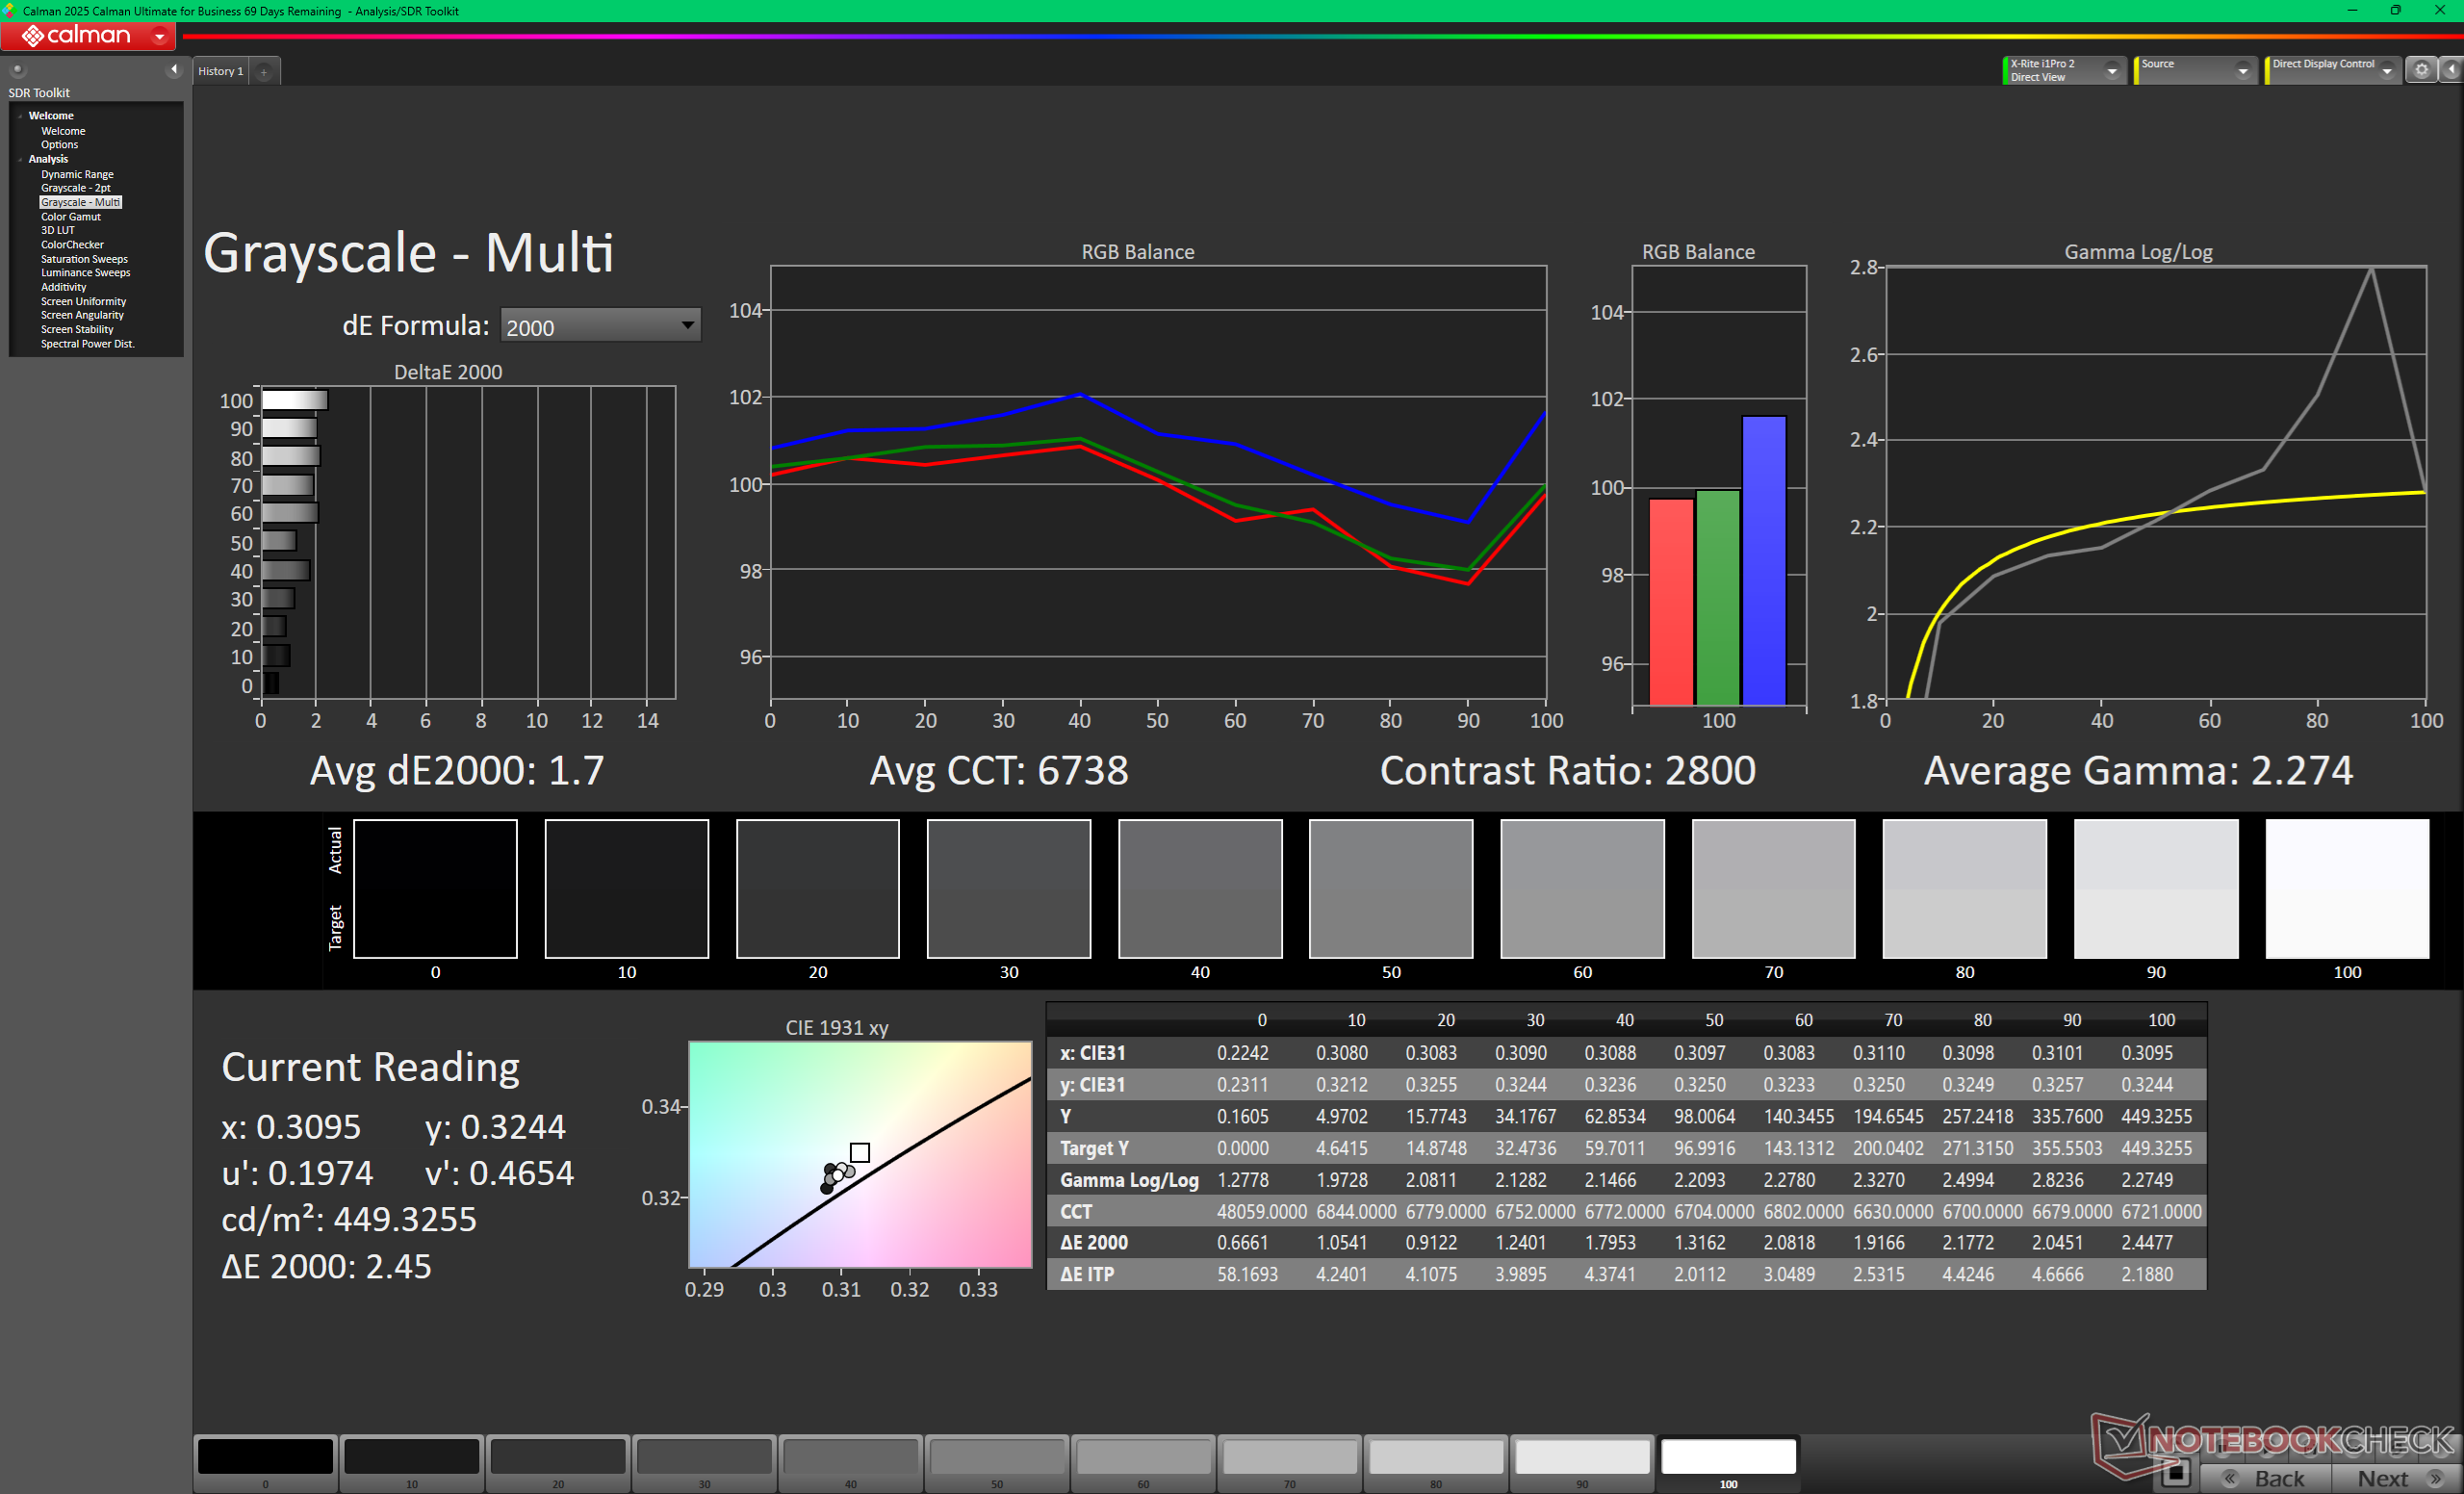
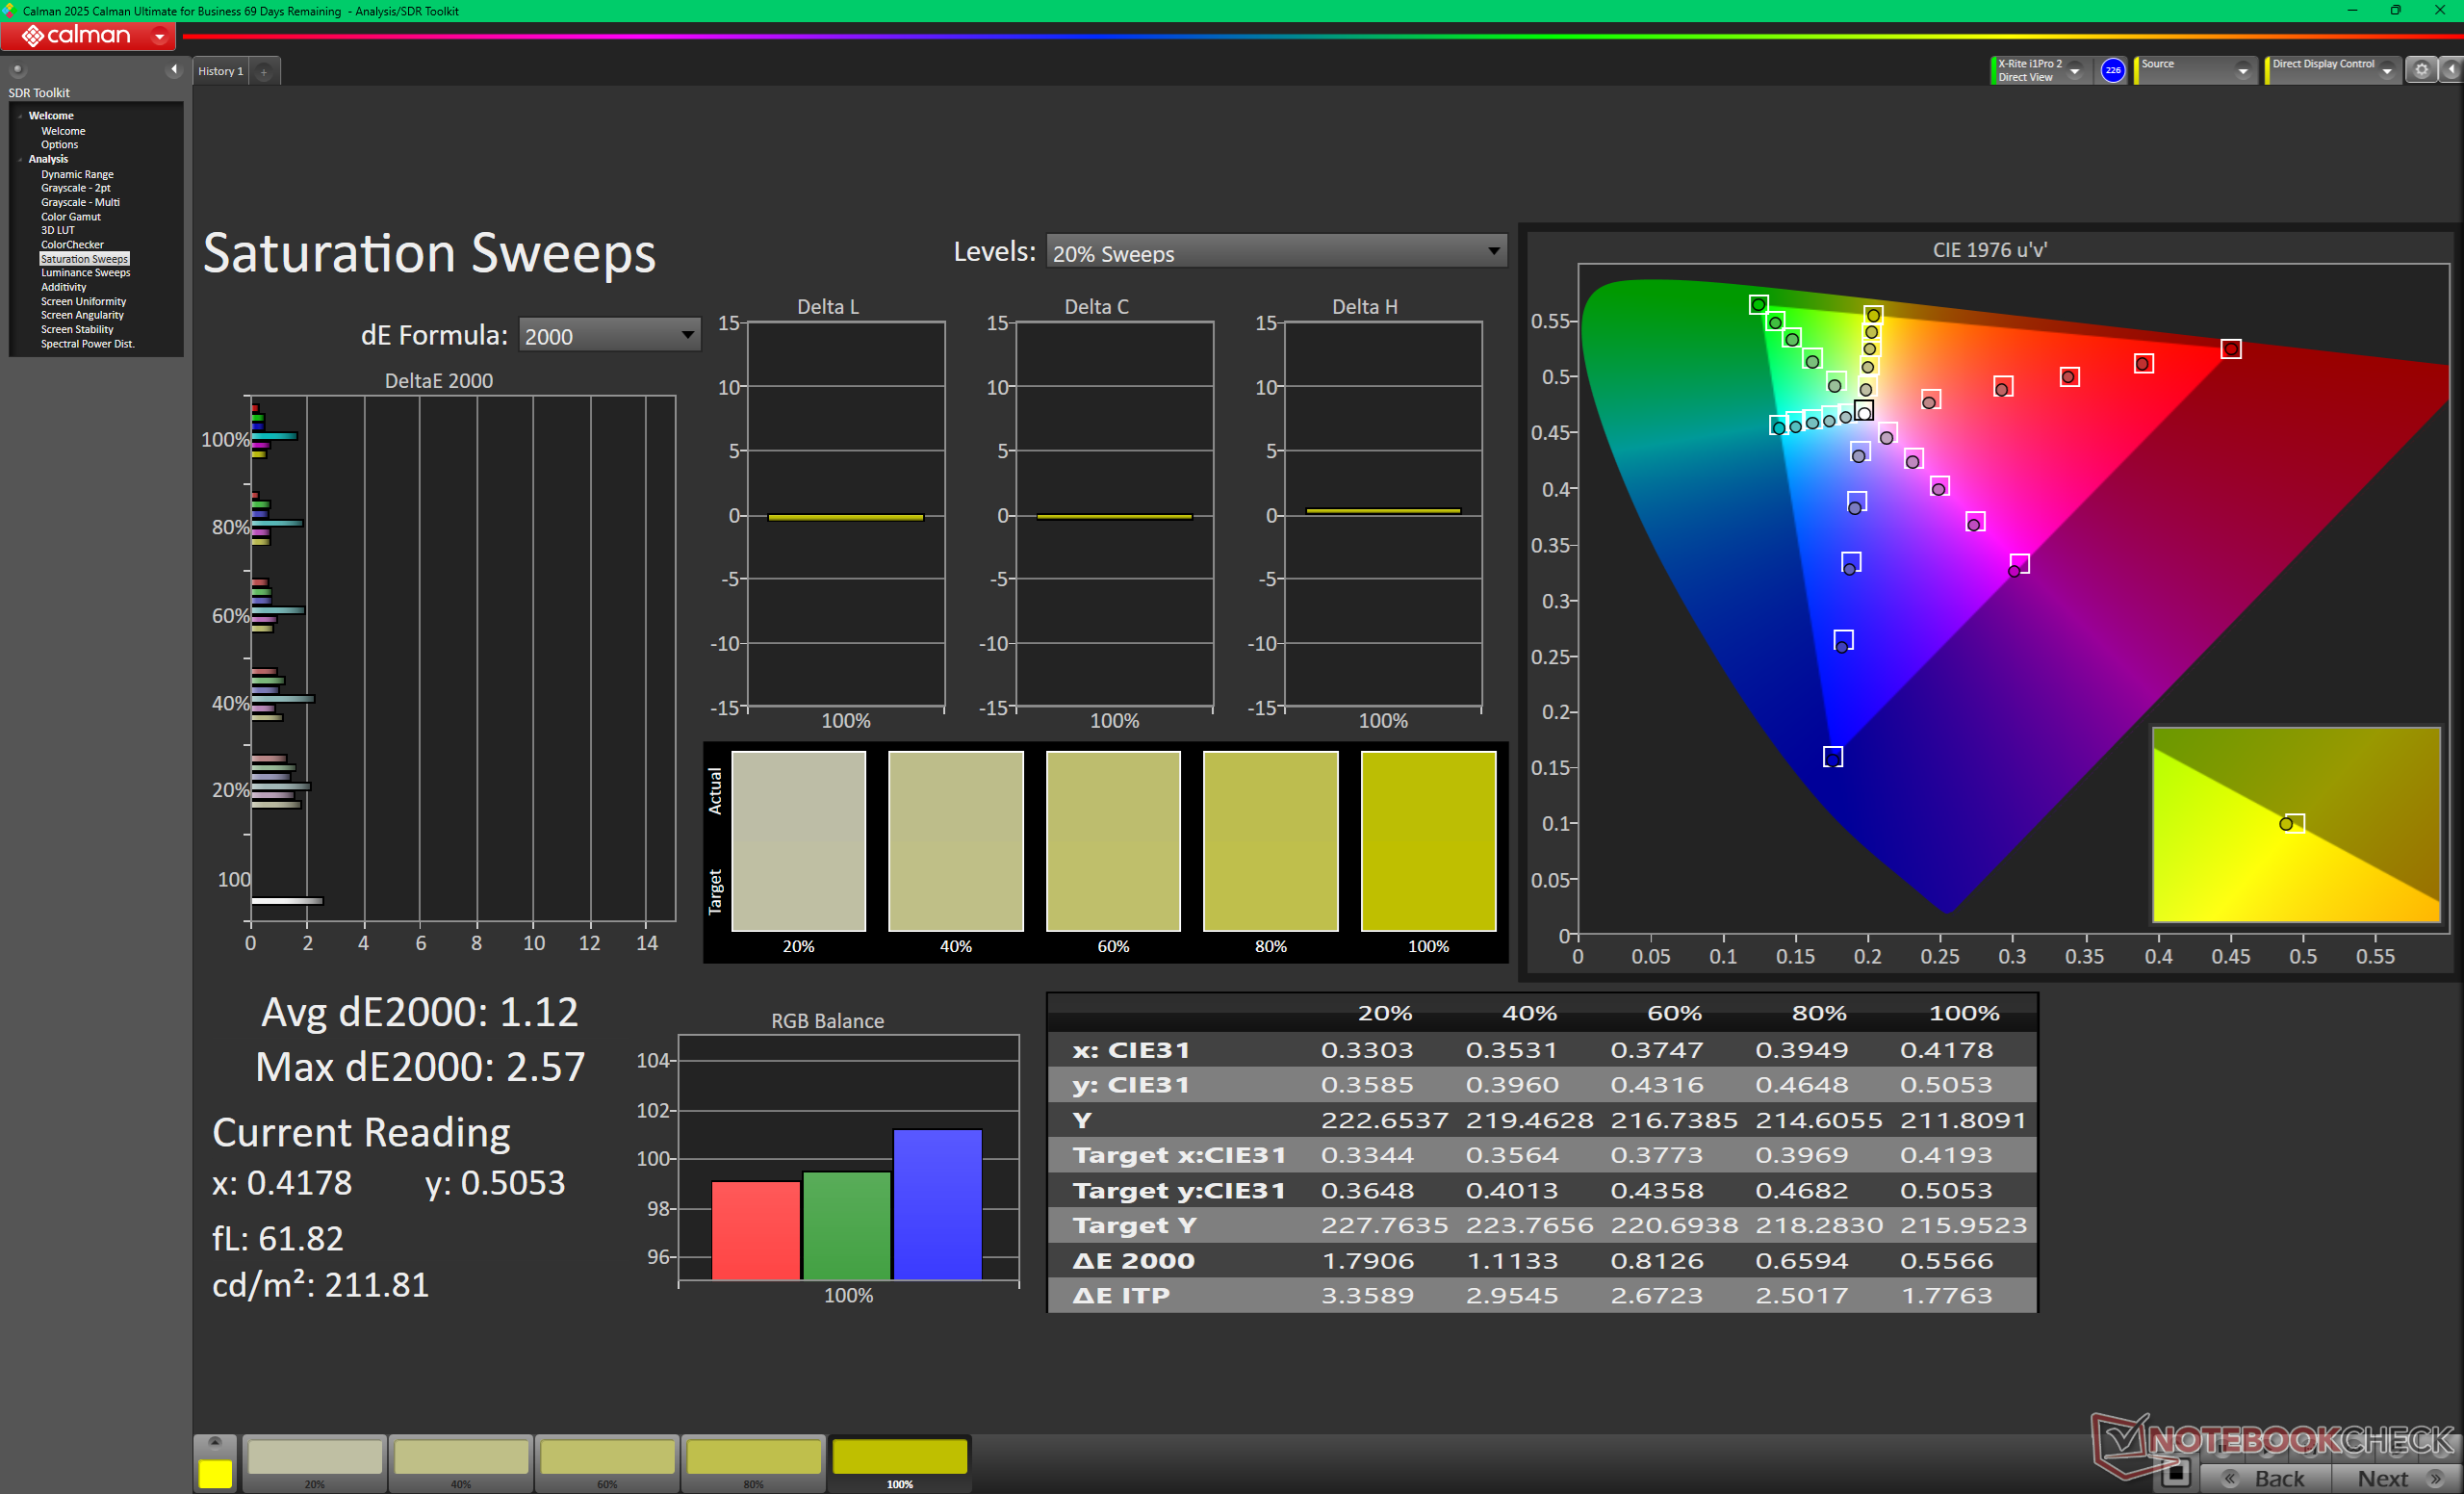
ΔE ColorChecker Calman: 1.82 | ∀{0.5-29.43 Ø4.68}
calibrated: 1.24
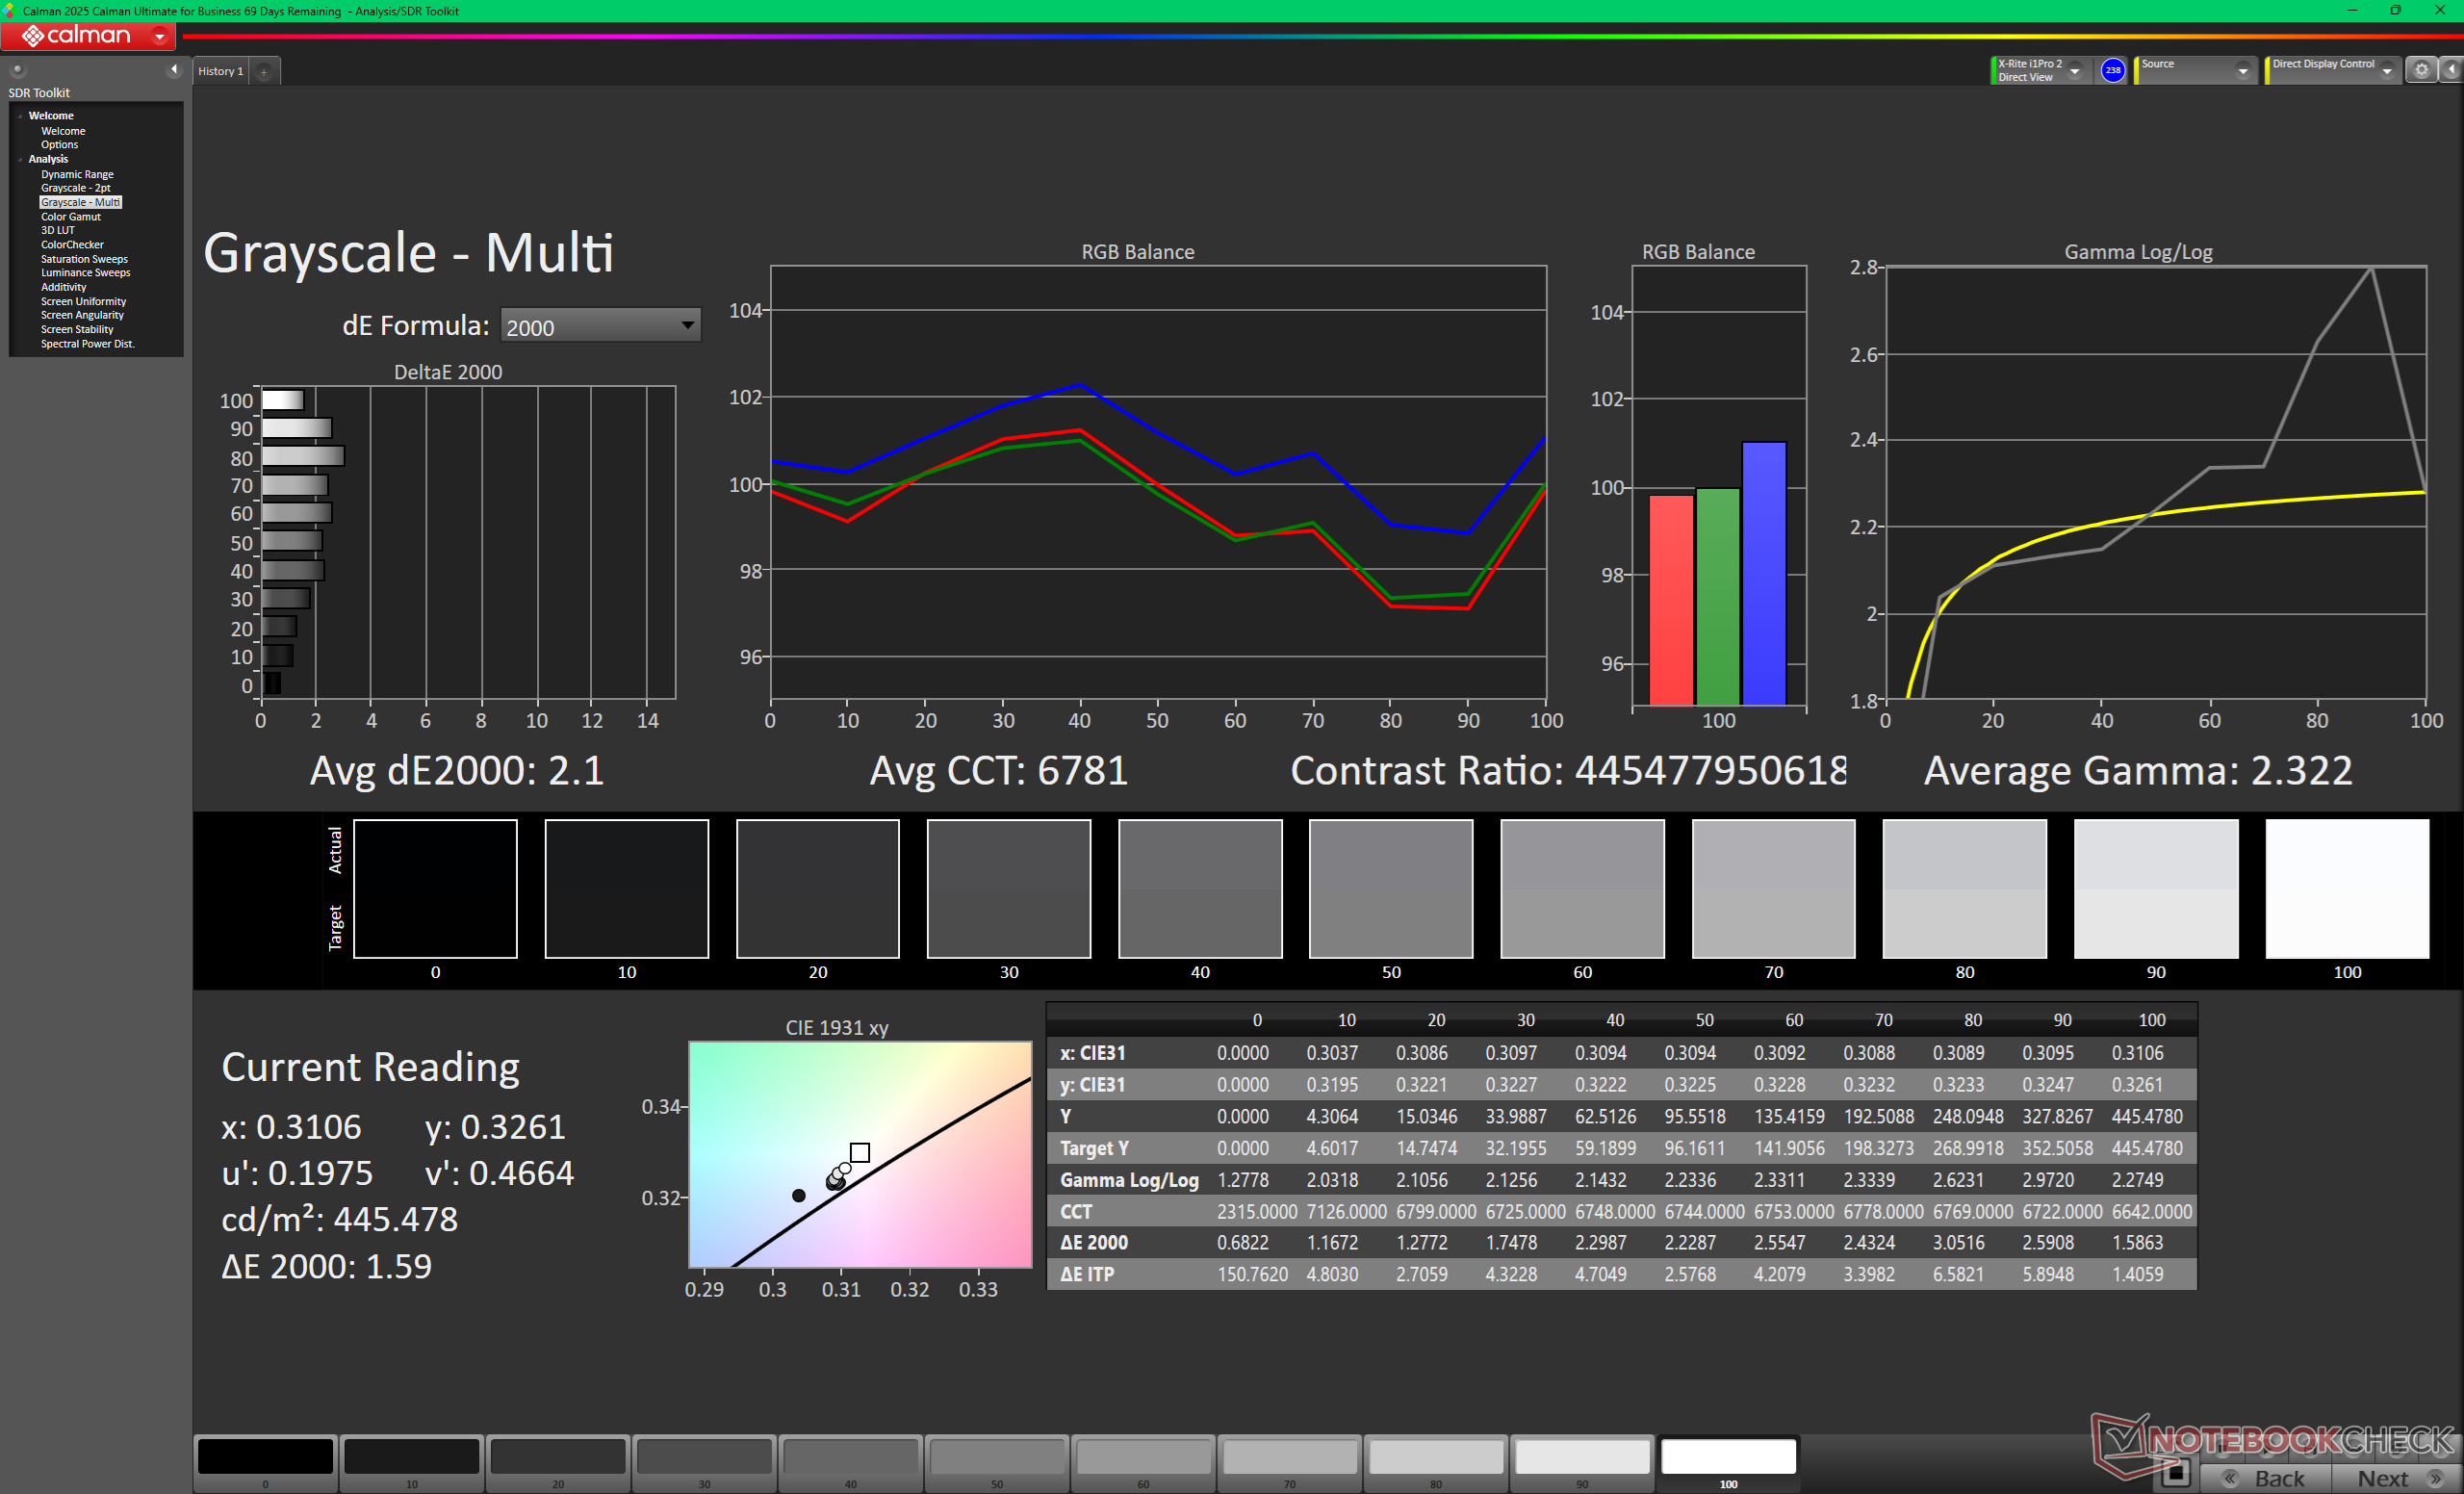
ΔE Greyscale Calman: 2.1 | ∀{0.09-98 Ø4.92}
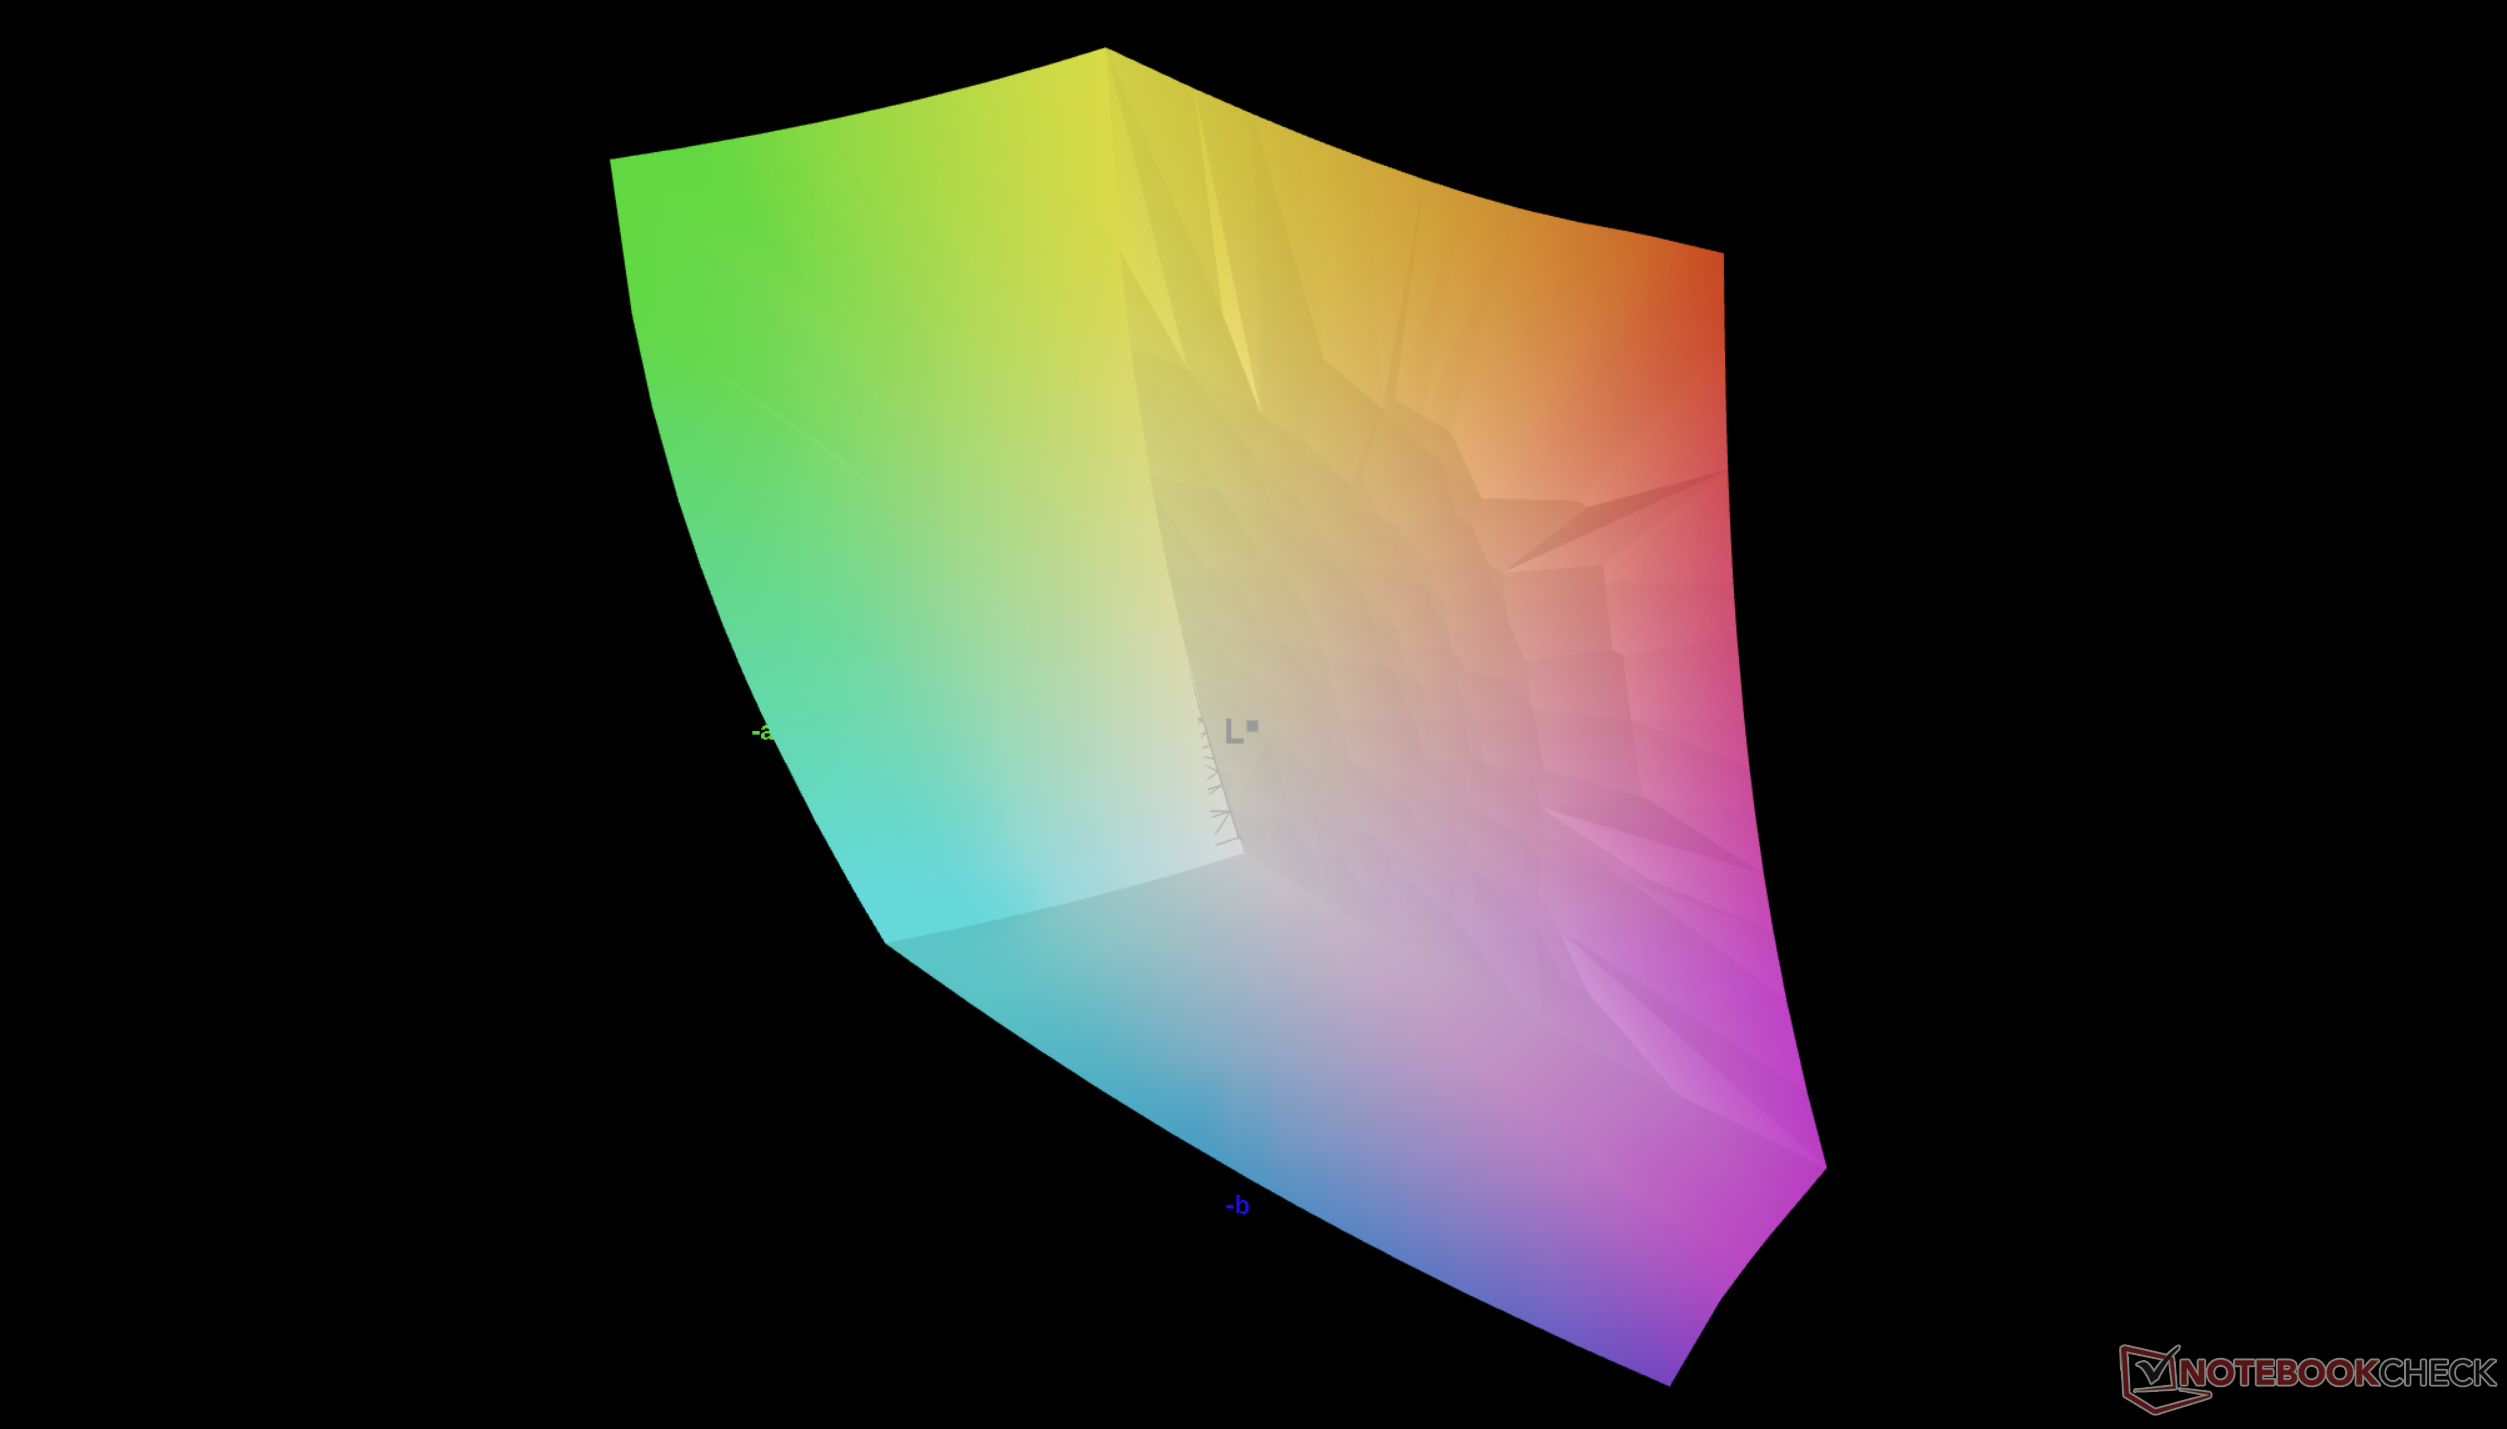
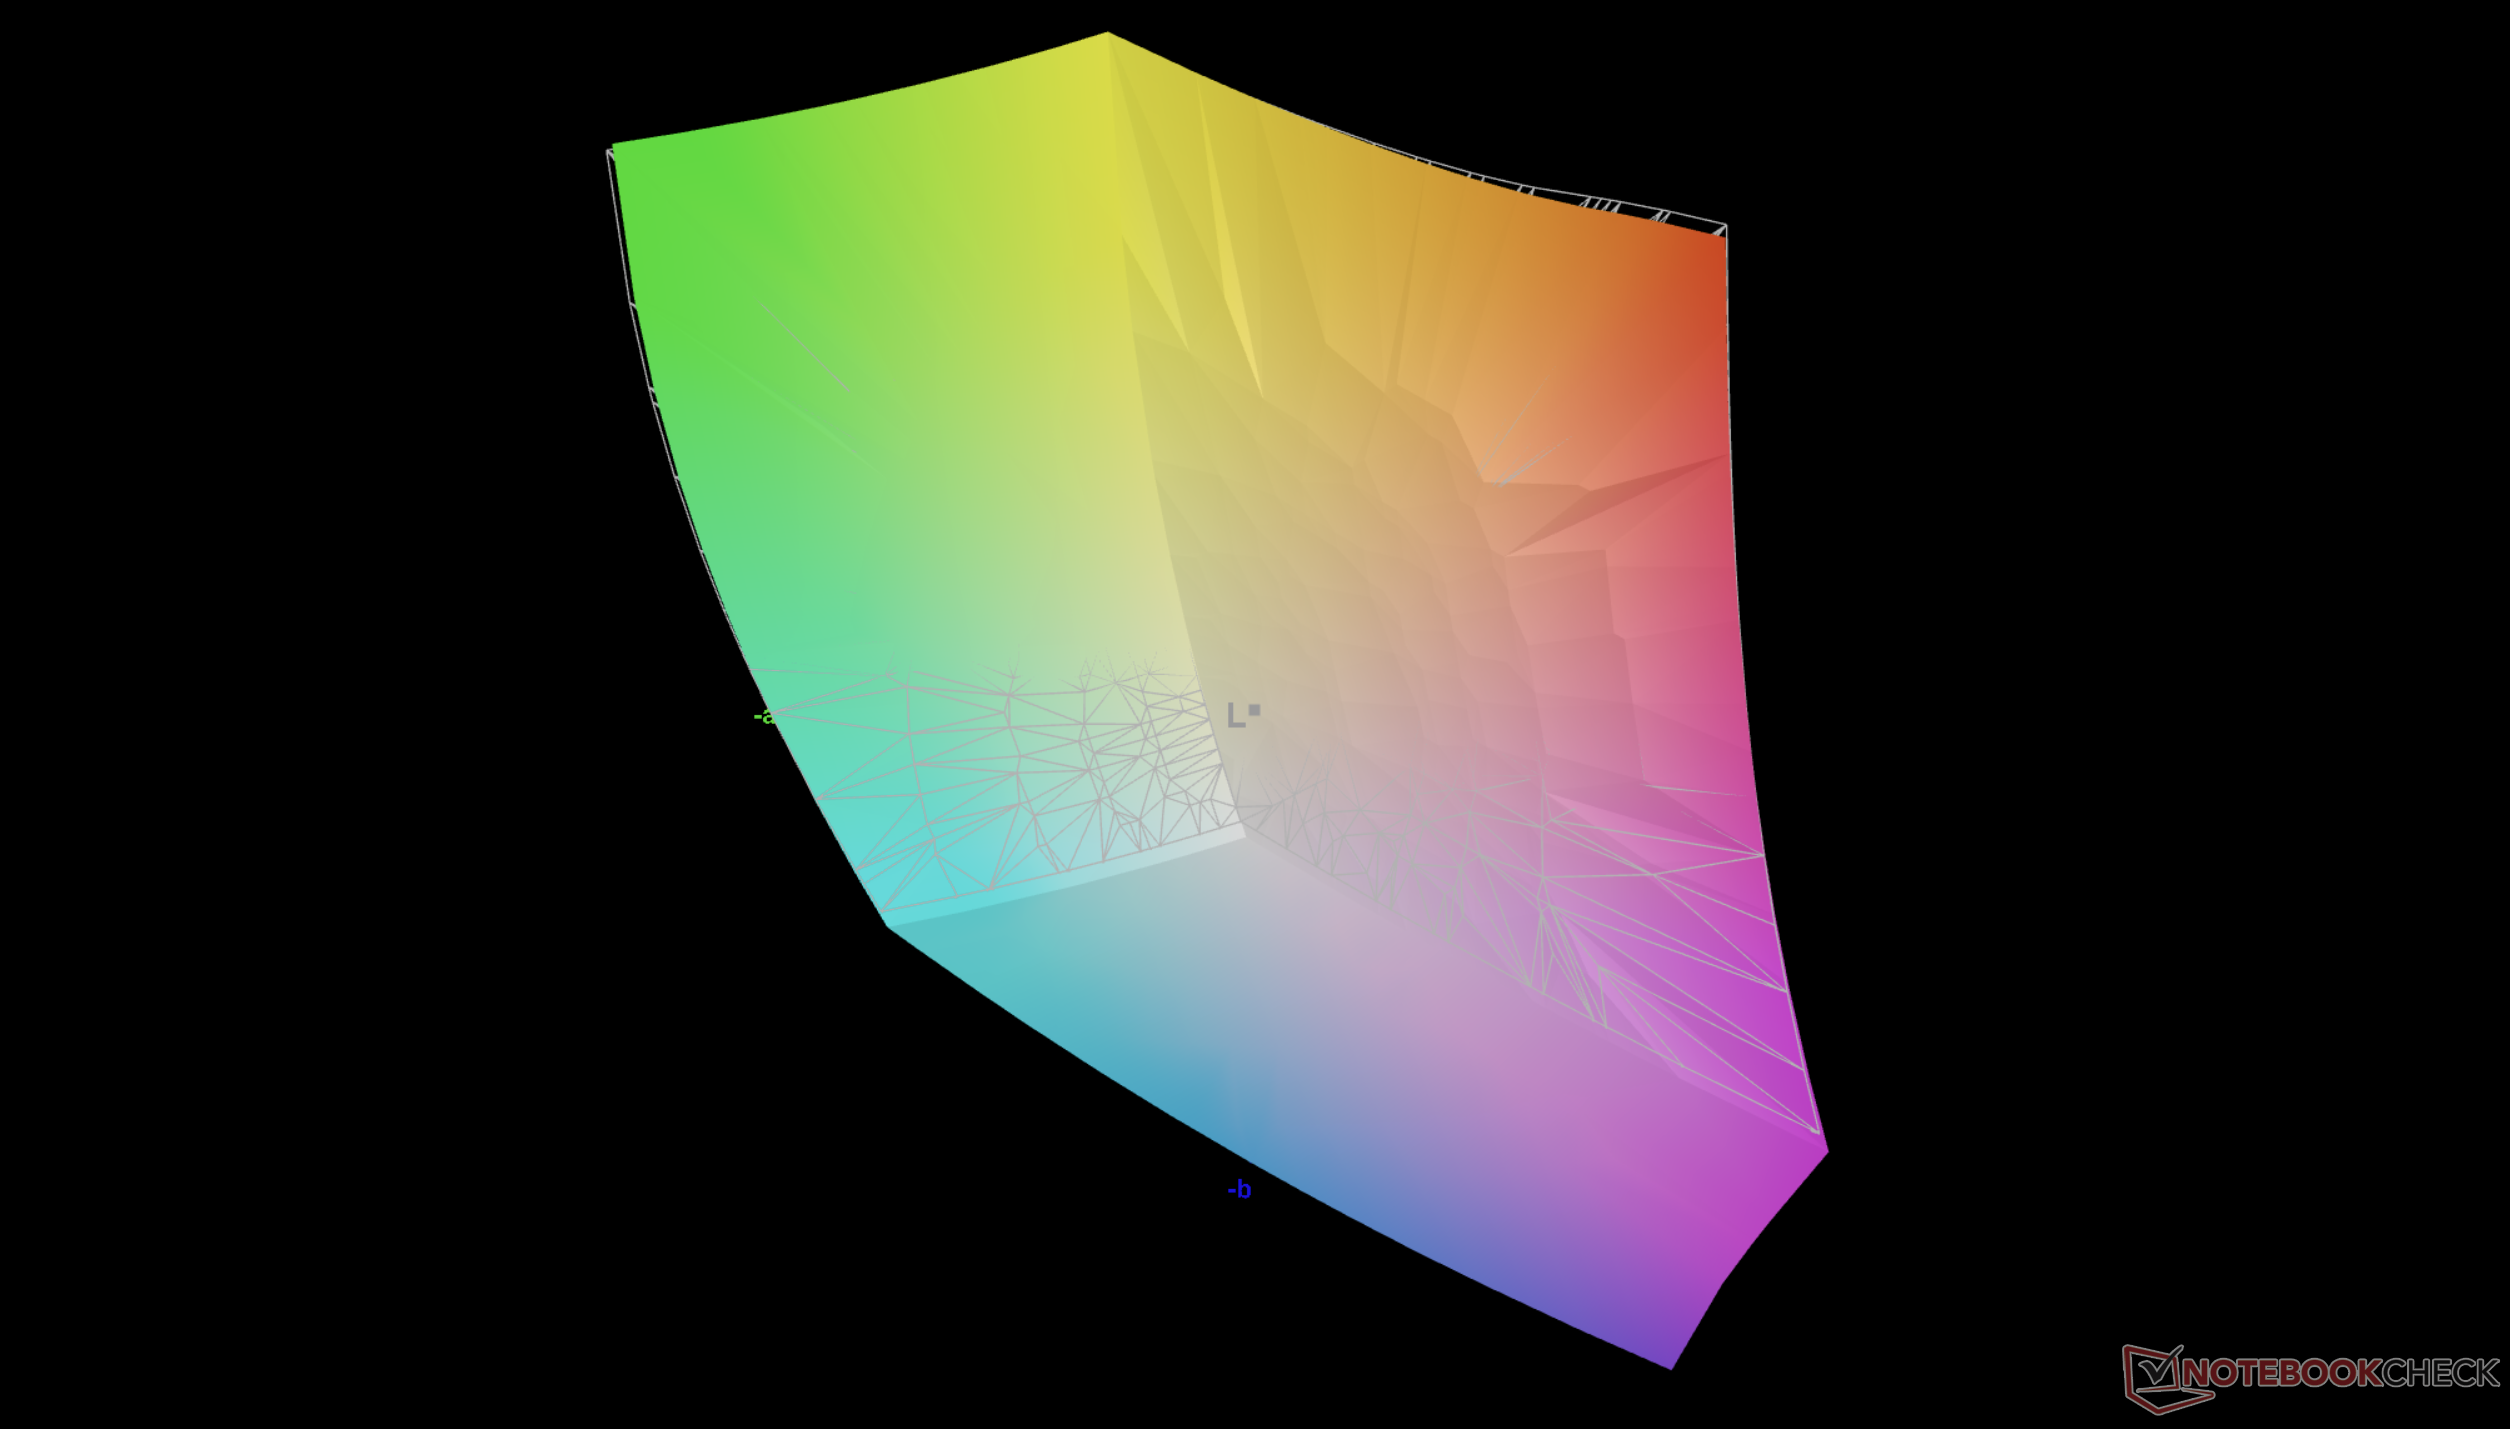
87.5% AdobeRGB 1998 (Argyll 3D)
100% sRGB (Argyll 3D)
99.4% Display P3 (Argyll 3D)
Gamma: 2.32
CCT: 6781 K
| Dell XPS 13 DX13260 Core Ultra 7 Sharp LQ134Z1, IPS, 2560x1600, 13.4", 120 Hz | Dell XPS 13 DX13260 LG Philips LP134WQ, IPS, 2560x1600, 13.4", 120 Hz | Microsoft Surface Laptop 13 2026 LP130WU12241, IPS, 1920x1280, 13", 60 Hz | Framework Laptop 13 Pro MND508ZB1-1, IPS, 2880x1920, 13.5", 120 Hz | MSI Prestige 13 AI+ A3MG ATNA33AA07-0, OLED, 2880x1800, 13.3", 60 Hz | HP OmniBook 7 Aero 13-bg1077nr LG Philips LGD0746, IPS, 1920x1200, 13.3", 60 Hz | |
|---|---|---|---|---|---|---|
| Display | -0% | -18% | -16% | 3% | -20% | |
| Display P3 Coverage (%) | 99.4 | 98.2 -1% | 70.2 -29% | 70.7 -29% | 99.9 1% | 66.5 -33% |
| sRGB Coverage (%) | 100 | 99.9 0% | 95.3 -5% | 99.6 0% | 100 0% | 96.8 -3% |
| AdobeRGB 1998 Coverage (%) | 87.5 | 87.6 0% | 70.6 -19% | 71.9 -18% | 95.7 9% | 67.3 -23% |
| Response Times | -12% | -4% | 18% | 86% | -4% | |
| Response Time Grey 50% / Grey 80% * (ms) | 44.6 ? | 51.2 ? -15% | 54.1 ? -21% | 35.1 ? 21% | 1.8 ? 96% | 44.7 ? -0% |
| Response Time Black / White * (ms) | 27.7 ? | 33.6 ? -21% | 24 ? 13% | 23.6 ? 15% | 1.5 ? 95% | 29.7 ? -7% |
| PWM Frequency (Hz) | 60 ? | |||||
| PWM Amplitude * (%) | 100 | 100 -0% | 33 67% | |||
| Screen | 10% | -18% | 1% | 405% | -64% | |
| Brightness middle (cd/m²) | 491.2 | 539.3 10% | 520 6% | 773.3 57% | 394 -20% | 442 -10% |
| Brightness (cd/m²) | 432 | 503 16% | 502 16% | 722 67% | 395 -9% | 420 -3% |
| Brightness Distribution (%) | 76 | 89 17% | 91 20% | 87 14% | 98 29% | 88 16% |
| Black Level * (cd/m²) | 0.2 | 0.25 -25% | 0.28 -40% | 0.36 -80% | 0.005 97% | 0.3 -50% |
| Contrast (:1) | 2456 | 2157 -12% | 1857 -24% | 2148 -13% | 78800 3108% | 1473 -40% |
| Colorchecker dE 2000 * | 1.82 | 1.2 34% | 2.1 -15% | 2.14 -18% | 1.67 8% | 4.34 -138% |
| Colorchecker dE 2000 max. * | 3.31 | 3.63 -10% | 5 -51% | 4.25 -28% | 3.9 -18% | 9.71 -193% |
| Colorchecker dE 2000 calibrated * | 1.24 | 0.92 26% | 0.61 51% | 0.58 53% | ||
| Greyscale dE 2000 * | 2.1 | 1.4 33% | 3.2 -52% | 2.9 -38% | 1.2 43% | 6.5 -210% |
| Gamma | 2.32 95% | 2.2 100% | 2.19 100% | 2.24 98% | 2.212 99% | 2.13 103% |
| CCT | 6781 96% | 6727 97% | 7012 93% | 7010 93% | 6470 100% | 7466 87% |
| Total Average (Program / Settings) | -1% /
3% | -13% /
-15% | 1% /
0% | 165% /
250% | -29% /
-46% |
* ... smaller is better


Display Response Times
| ↔ Response Time Black to White | ||
|---|---|---|
| 27.7 ms ... rise ↗ and fall ↘ combined | ↗ 14.3 ms rise | 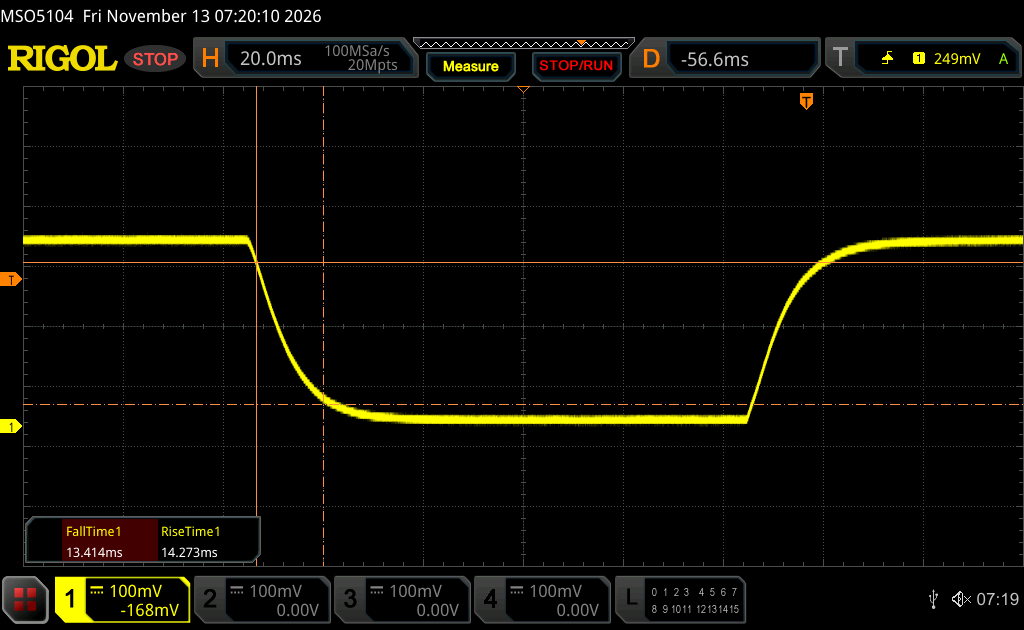 |
| ↘ 13.4 ms fall | ||
| The screen shows relatively slow response rates in our tests and may be too slow for gamers. In comparison, all tested devices range from 0.1 (minimum) to 240 (maximum) ms. » 72 % of all devices are better. This means that the measured response time is worse than the average of all tested devices (19.6 ms). | ||
| ↔ Response Time 50% Grey to 80% Grey | ||
| 44.6 ms ... rise ↗ and fall ↘ combined | ↗ 21 ms rise | 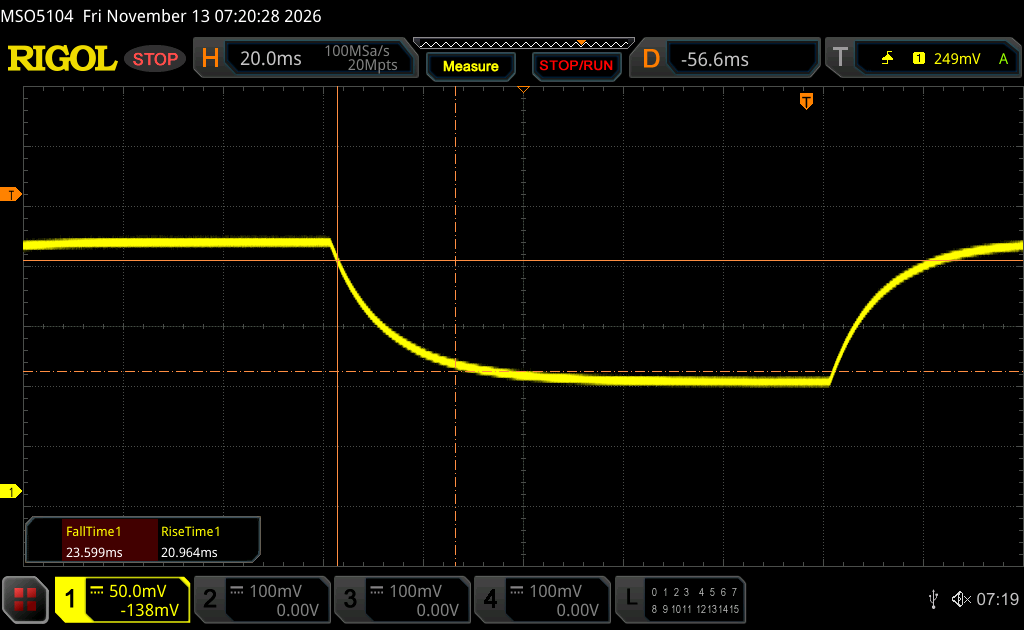 |
| ↘ 23.6 ms fall | ||
| The screen shows slow response rates in our tests and will be unsatisfactory for gamers. In comparison, all tested devices range from 0.13 (minimum) to 636 (maximum) ms. » 76 % of all devices are better. This means that the measured response time is worse than the average of all tested devices (30.6 ms). | ||
Screen Flickering / PWM (Pulse-Width Modulation)
| Screen flickering / PWM not detected | 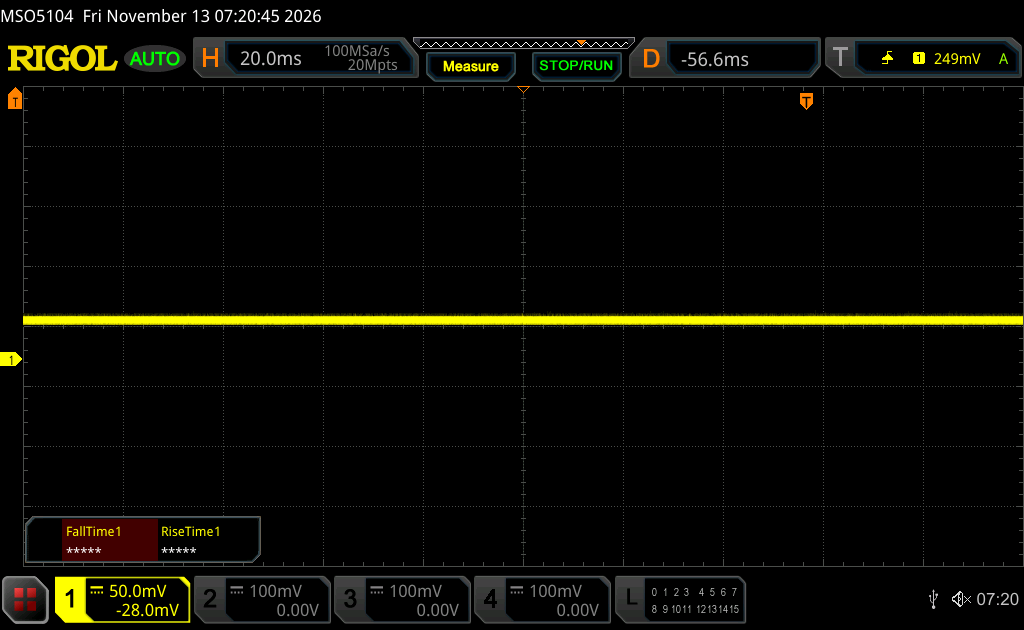 | ||
In comparison: 52 % of all tested devices do not use PWM to dim the display. If PWM was detected, an average of 7547 (minimum: 5 - maximum: 343500) Hz was measured. | |||


Performance
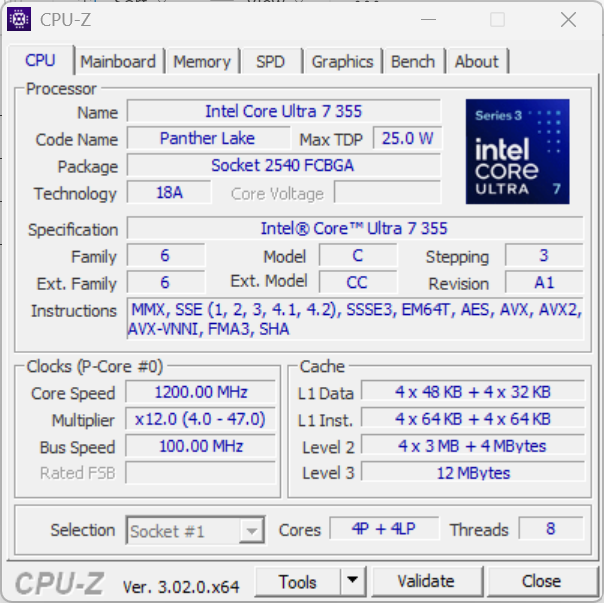
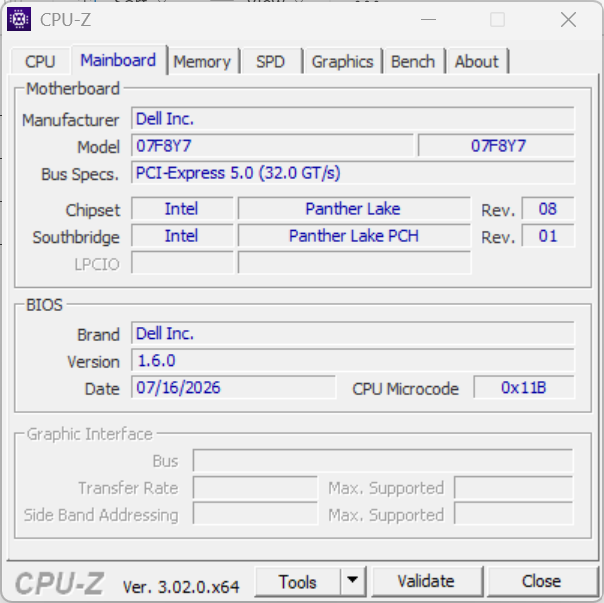
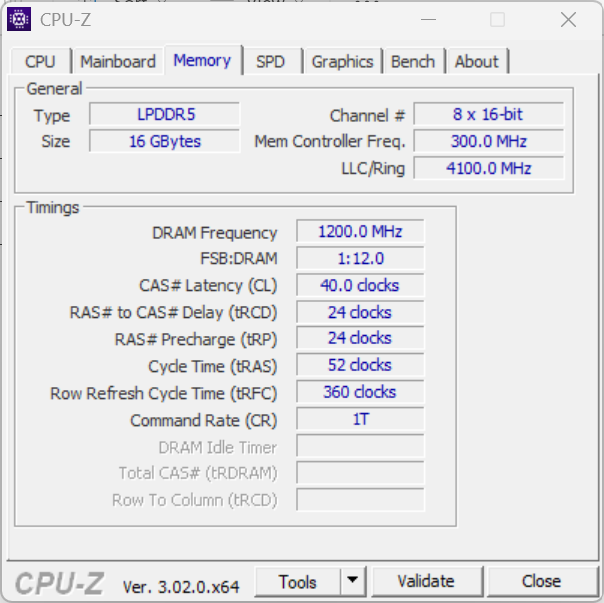
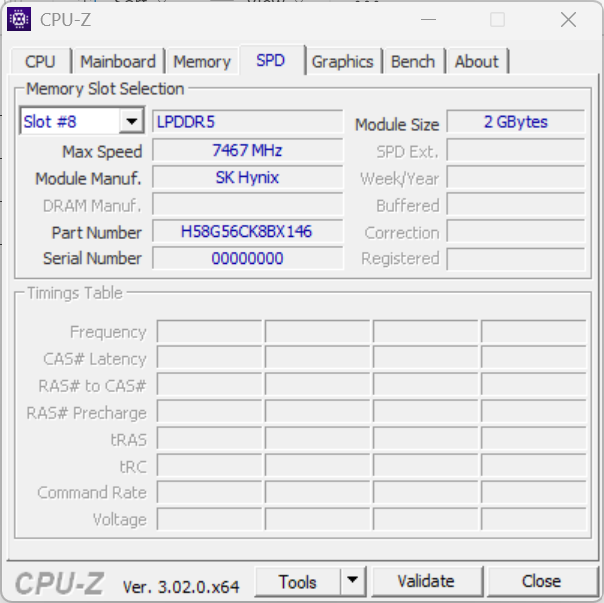
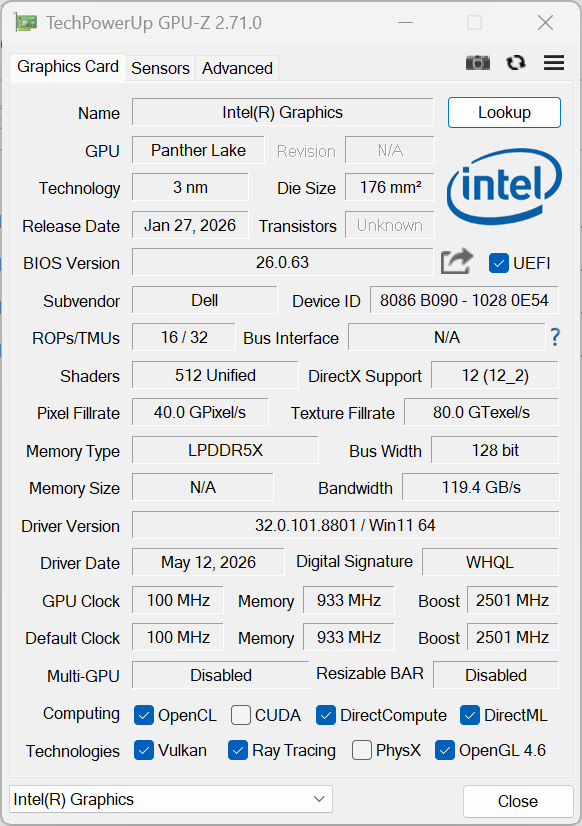
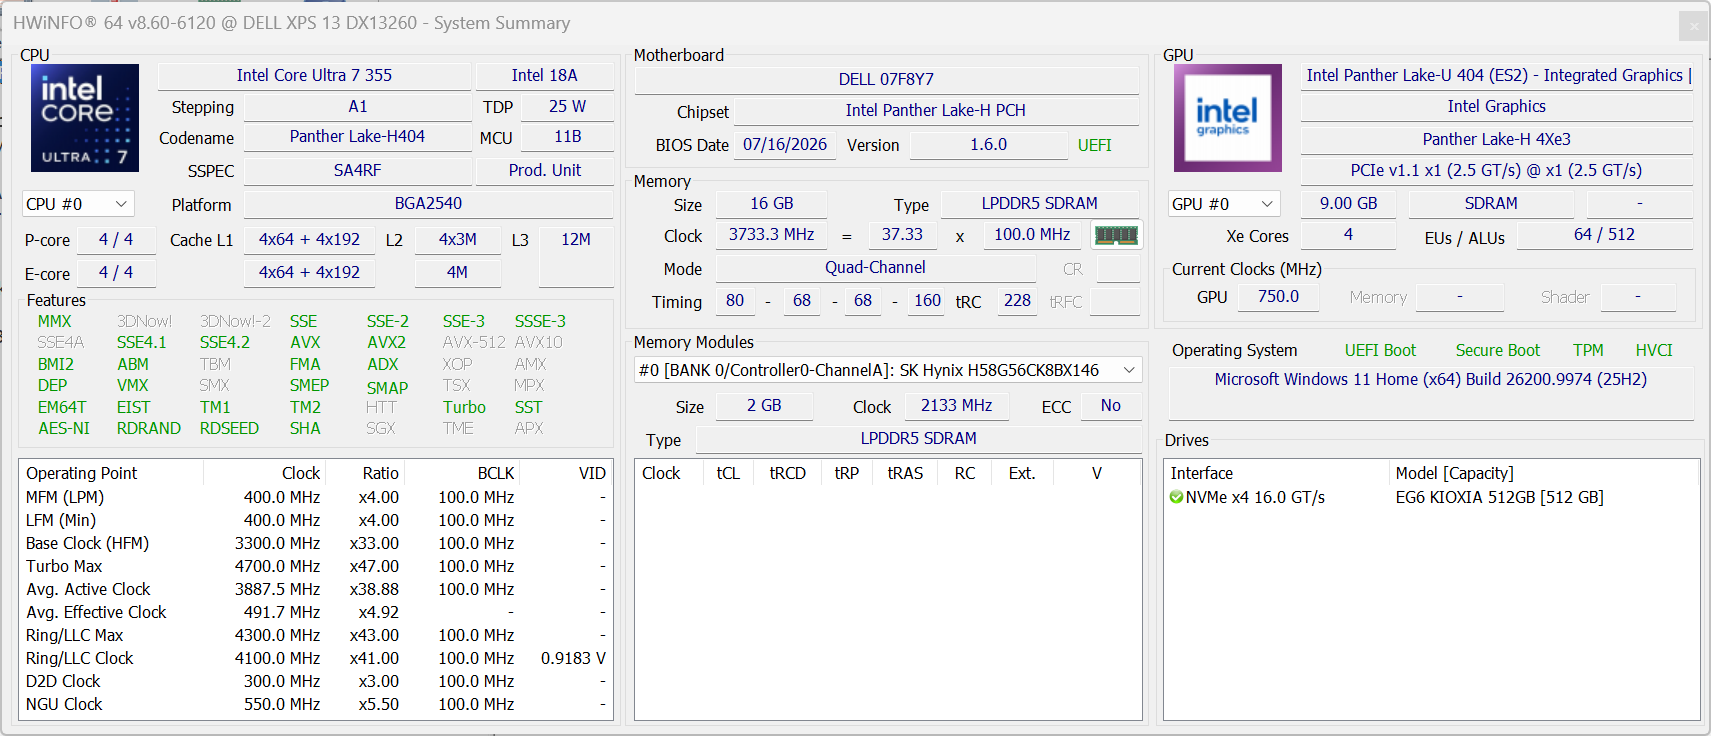
Testing Conditions
We set Windows to Performance mode prior to running the benchmarks below.
Processor Performance
The Core Ultra 7 355 starts off strong with performance levels of up to 50 percent faster than the base Core 5 320. However, it also suffers from steeper throttling and so the performance advantage narrows to just 7 to 10 percent after several minutes of heavy load.
Cinebench R15 Multi Loop
Cinebench 2026: CPU Multi | CPU Single Thread
Cinebench 2024: CPU Multi Core | CPU Single Core
Cinebench R23: Multi Core | Single Core
Cinebench R20: CPU (Multi Core) | CPU (Single Core)
Cinebench R15: CPU Multi 64Bit | CPU Single 64Bit
Blender: v2.79 BMW27 CPU
7-Zip 18.03: 7z b 4 | 7z b 4 -mmt1
Geekbench 7: Multi-Core | Single-Core
Geekbench 6.7: Multi-Core | Single-Core
HWBOT x265 Benchmark v2.2: 4k Preset
LibreOffice : 20 Documents To PDF
R Benchmark 2.5: Overall mean
| CPU Performance rating | |
| Framework Laptop 13 Pro -2! | |
| HP OmniBook 7 Aero 13-bg1077nr -4! | |
| MSI Prestige 13 AI+ A3MG -4! | |
| Average Intel Core Ultra 7 355 | |
| Microsoft Surface Pro OLED Lunar Lake -4! | |
| Dell XPS 13 DX13260 Core Ultra 7 | |
| MSI Summit E13 AI Evo A1MTG -4! | |
| HP EliteBook 8 Flip G1i 13 -4! | |
| Microsoft Surface Laptop 13 2026 -2! | |
| Dell Latitude 13 7350 -6! | |
| Dell XPS 13 DX13260 -6! | |
| Lenovo ThinkPad X13 2-in-1 Gen 5 -6! | |
| Cinebench 2026 / CPU Multi | |
| Framework Laptop 13 Pro | |
| Average Intel Core Ultra 7 355 (2021 - 2749, n=7) | |
| Dell XPS 13 DX13260 Core Ultra 7 | |
| Cinebench 2026 / CPU Single Thread | |
| Framework Laptop 13 Pro | |
| Average Intel Core Ultra 7 355 (468 - 487, n=7) | |
| Dell XPS 13 DX13260 Core Ultra 7 | |
| Cinebench 2024 / CPU Multi Core | |
| MSI Prestige 13 AI+ A3MG | |
| Framework Laptop 13 Pro | |
| HP OmniBook 7 Aero 13-bg1077nr | |
| Microsoft Surface Laptop 13 2026 | |
| Average Intel Core Ultra 7 355 (490 - 677, n=7) | |
| Microsoft Surface Pro OLED Lunar Lake | |
| MSI Summit E13 AI Evo A1MTG | |
| HP EliteBook 8 Flip G1i 13 | |
| Dell XPS 13 DX13260 Core Ultra 7 | |
| Cinebench 2024 / CPU Single Core | |
| Microsoft Surface Laptop 13 2026 | |
| Microsoft Surface Pro OLED Lunar Lake | |
| MSI Prestige 13 AI+ A3MG | |
| Dell XPS 13 DX13260 Core Ultra 7 | |
| Average Intel Core Ultra 7 355 (117.1 - 119.4, n=7) | |
| Framework Laptop 13 Pro | |
| HP OmniBook 7 Aero 13-bg1077nr | |
| HP EliteBook 8 Flip G1i 13 | |
| MSI Summit E13 AI Evo A1MTG | |
| Geekbench 7 / Multi-Core | |
| Microsoft Surface Laptop 13 2026 | |
| Average Intel Core Ultra 7 355 (11159 - 11542, n=2) | |
| Dell XPS 13 DX13260 Core Ultra 7 | |
| Geekbench 7 / Single-Core | |
| Microsoft Surface Laptop 13 2026 | |
| Average Intel Core Ultra 7 355 (2442 - 2518, n=2) | |
| Dell XPS 13 DX13260 Core Ultra 7 | |
* ... smaller is better
AIDA64: FP32 Ray-Trace | FPU Julia | CPU SHA3 | CPU Queen | FPU SinJulia | FPU Mandel | CPU AES | CPU ZLib | FP64 Ray-Trace | CPU PhotoWorxx
| Performance rating | |
| HP OmniBook 7 Aero 13-bg1077nr | |
| Framework Laptop 13 Pro -1! | |
| MSI Prestige 13 AI+ A3MG -1! | |
| Average Intel Core Ultra 7 355 | |
| Dell XPS 13 DX13260 Core Ultra 7 -1! | |
| Microsoft Surface Laptop 13 2026 -1! | |
| Dell XPS 13 DX13260 -1! | |
| AIDA64 / FP32 Ray-Trace | |
| HP OmniBook 7 Aero 13-bg1077nr (v6.92.6600) | |
| Framework Laptop 13 Pro (v8.20.8100) | |
| Average Intel Core Ultra 7 355 (8258 - 12838, n=7) | |
| MSI Prestige 13 AI+ A3MG (v8.20.8100) | |
| Dell XPS 13 DX13260 Core Ultra 7 (v8.20.8100) | |
| Microsoft Surface Laptop 13 2026 (v8.20.8100) | |
| Dell XPS 13 DX13260 (v8.20.8100) | |
| AIDA64 / FPU Julia | |
| HP OmniBook 7 Aero 13-bg1077nr (v6.92.6600) | |
| Framework Laptop 13 Pro (v8.20.8100) | |
| Average Intel Core Ultra 7 355 (44402 - 66632, n=7) | |
| MSI Prestige 13 AI+ A3MG (v8.20.8100) | |
| Dell XPS 13 DX13260 Core Ultra 7 (v8.20.8100) | |
| Microsoft Surface Laptop 13 2026 (v8.20.8100) | |
| Dell XPS 13 DX13260 (v8.20.8100) | |
| AIDA64 / CPU SHA3 | |
| Framework Laptop 13 Pro (v8.20.8100) | |
| HP OmniBook 7 Aero 13-bg1077nr (v6.92.6600) | |
| MSI Prestige 13 AI+ A3MG (v8.20.8100) | |
| Average Intel Core Ultra 7 355 (2160 - 2884, n=7) | |
| Dell XPS 13 DX13260 Core Ultra 7 (v8.20.8100) | |
| Microsoft Surface Laptop 13 2026 (v8.20.8100) | |
| Dell XPS 13 DX13260 (v8.20.8100) | |
| AIDA64 / CPU Queen | |
| HP OmniBook 7 Aero 13-bg1077nr (v6.92.6600) | |
| Average Intel Core Ultra 7 355 (n=1) | |
| AIDA64 / FPU SinJulia | |
| HP OmniBook 7 Aero 13-bg1077nr (v6.92.6600) | |
| Framework Laptop 13 Pro (v8.20.8100) | |
| MSI Prestige 13 AI+ A3MG (v8.20.8100) | |
| Average Intel Core Ultra 7 355 (4136 - 4601, n=7) | |
| Dell XPS 13 DX13260 Core Ultra 7 (v8.20.8100) | |
| Microsoft Surface Laptop 13 2026 (v8.20.8100) | |
| Dell XPS 13 DX13260 (v8.20.8100) | |
| AIDA64 / FPU Mandel | |
| HP OmniBook 7 Aero 13-bg1077nr (v6.92.6600) | |
| Framework Laptop 13 Pro (v8.20.8100) | |
| Average Intel Core Ultra 7 355 (22768 - 35293, n=7) | |
| MSI Prestige 13 AI+ A3MG (v8.20.8100) | |
| Dell XPS 13 DX13260 Core Ultra 7 (v8.20.8100) | |
| Microsoft Surface Laptop 13 2026 (v8.20.8100) | |
| Dell XPS 13 DX13260 (v8.20.8100) | |
| AIDA64 / CPU AES | |
| HP OmniBook 7 Aero 13-bg1077nr (v6.92.6600) | |
| Framework Laptop 13 Pro (v8.20.8100) | |
| MSI Prestige 13 AI+ A3MG (v8.20.8100) | |
| Microsoft Surface Laptop 13 2026 (v8.20.8100) | |
| Average Intel Core Ultra 7 355 (35815 - 39424, n=7) | |
| Dell XPS 13 DX13260 Core Ultra 7 (v8.20.8100) | |
| Dell XPS 13 DX13260 (v8.20.8100) | |
| AIDA64 / CPU ZLib | |
| Framework Laptop 13 Pro (v8.20.8100) | |
| MSI Prestige 13 AI+ A3MG (v8.20.8100) | |
| HP OmniBook 7 Aero 13-bg1077nr (v6.92.6600) | |
| Average Intel Core Ultra 7 355 (555 - 651, n=7) | |
| Dell XPS 13 DX13260 Core Ultra 7 (v8.20.8100) | |
| Microsoft Surface Laptop 13 2026 (v8.20.8100) | |
| Dell XPS 13 DX13260 (v8.20.8100) | |
| AIDA64 / FP64 Ray-Trace | |
| HP OmniBook 7 Aero 13-bg1077nr (v6.92.6600) | |
| Framework Laptop 13 Pro (v8.20.8100) | |
| Average Intel Core Ultra 7 355 (4401 - 6833, n=7) | |
| MSI Prestige 13 AI+ A3MG (v8.20.8100) | |
| Dell XPS 13 DX13260 Core Ultra 7 (v8.20.8100) | |
| Microsoft Surface Laptop 13 2026 (v8.20.8100) | |
| Dell XPS 13 DX13260 (v8.20.8100) | |
| AIDA64 / CPU PhotoWorxx | |
| Framework Laptop 13 Pro (v8.20.8100) | |
| MSI Prestige 13 AI+ A3MG (v8.20.8100) | |
| Average Intel Core Ultra 7 355 (57998 - 60440, n=7) | |
| Dell XPS 13 DX13260 Core Ultra 7 (v8.20.8100) | |
| HP OmniBook 7 Aero 13-bg1077nr (v6.92.6600) | |
| Microsoft Surface Laptop 13 2026 (v8.20.8100) | |
| Dell XPS 13 DX13260 (v8.20.8100) | |
System Performance
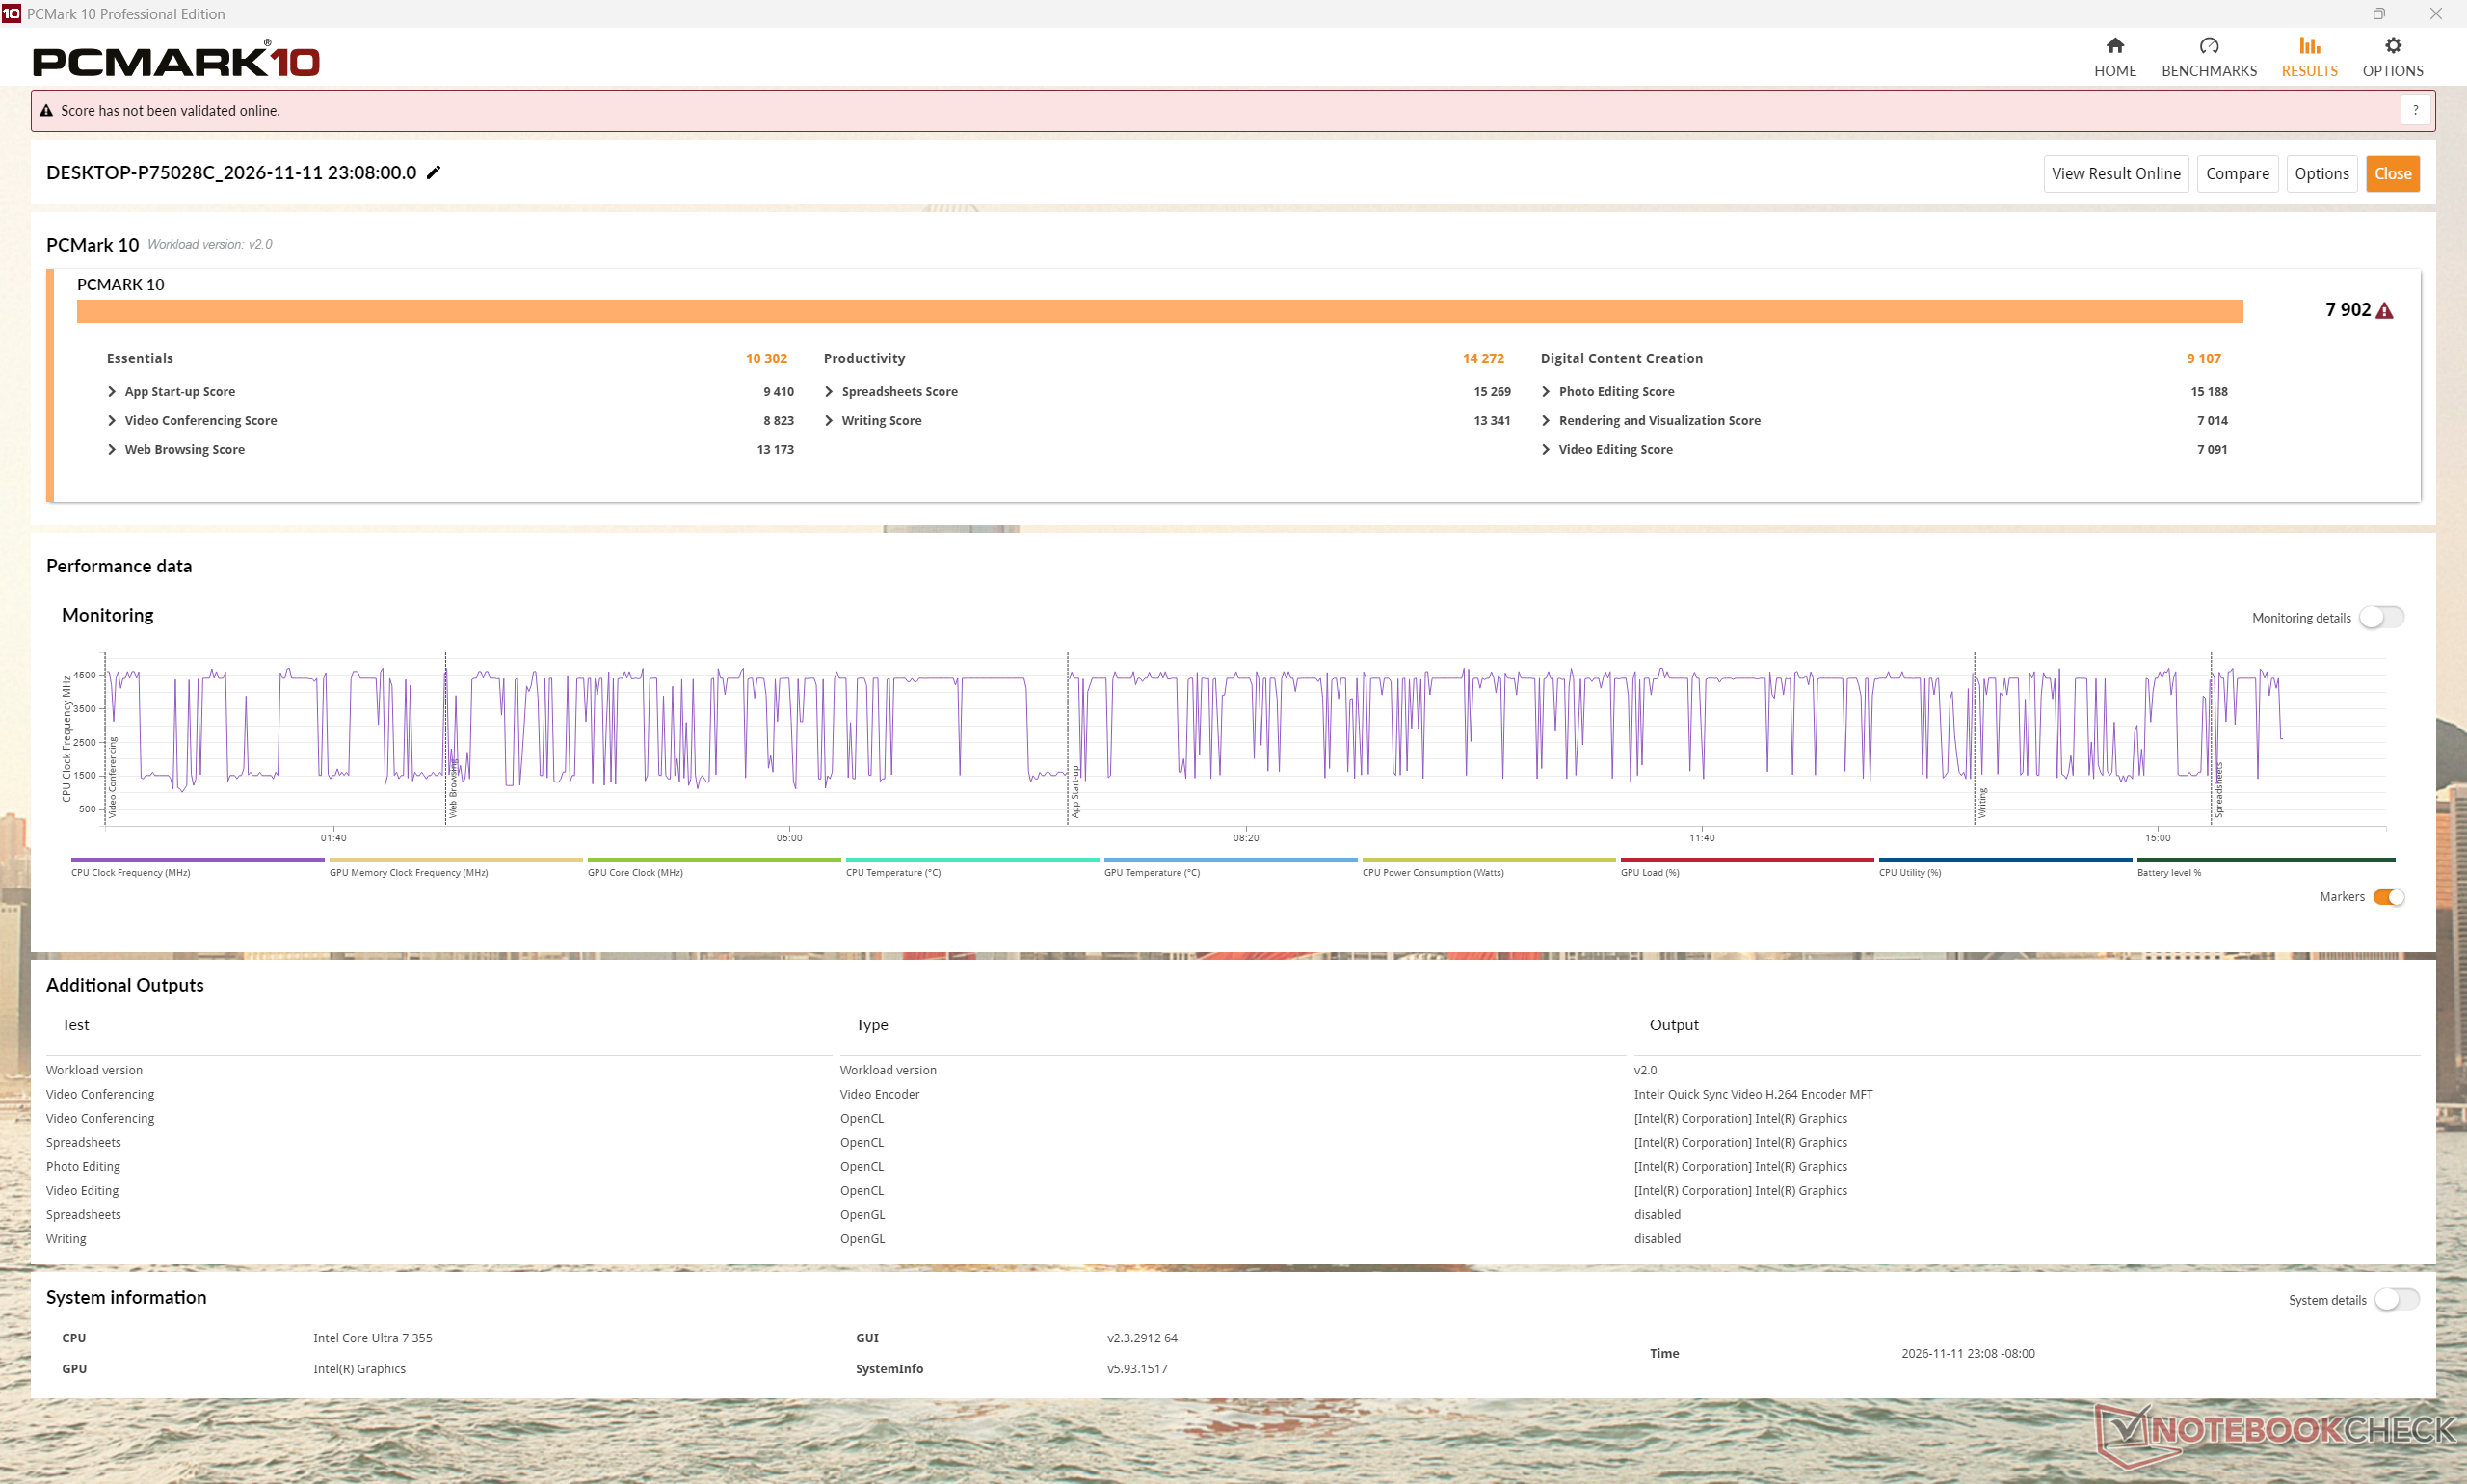
PCMark 10: Score | Essentials | Productivity | Digital Content Creation
CrossMark: Overall | Productivity | Creativity | Responsiveness
WebXPRT 5: Overall
Mozilla Kraken 1.1: Total
Geekbench AI: Single Precision GPU 1.7 | Half Precision GPU 1.7 | Quantized GPU 1.7
| Performance rating | |
| Framework Laptop 13 Pro | |
| MSI Prestige 13 AI+ A3MG -4! | |
| Average Intel Core Ultra 7 355, Intel Graphics 4 Xe3 Panther Lake iGPU | |
| Dell XPS 13 DX13260 Core Ultra 7 | |
| HP OmniBook 7 Aero 13-bg1077nr -1! | |
| Microsoft Surface Laptop 13 2026 -7! | |
| Dell XPS 13 DX13260 | |
| PCMark 10 / Score | |
| Framework Laptop 13 Pro | |
| HP OmniBook 7 Aero 13-bg1077nr | |
| Dell XPS 13 DX13260 Core Ultra 7 | |
| Average Intel Core Ultra 7 355, Intel Graphics 4 Xe3 Panther Lake iGPU (6365 - 8201, n=7) | |
| MSI Prestige 13 AI+ A3MG | |
| Dell XPS 13 DX13260 | |
| PCMark 10 / Essentials | |
| HP OmniBook 7 Aero 13-bg1077nr | |
| MSI Prestige 13 AI+ A3MG | |
| Framework Laptop 13 Pro | |
| Average Intel Core Ultra 7 355, Intel Graphics 4 Xe3 Panther Lake iGPU (9325 - 10820, n=7) | |
| Dell XPS 13 DX13260 Core Ultra 7 | |
| Dell XPS 13 DX13260 | |
| PCMark 10 / Productivity | |
| Framework Laptop 13 Pro | |
| HP OmniBook 7 Aero 13-bg1077nr | |
| Dell XPS 13 DX13260 Core Ultra 7 | |
| Average Intel Core Ultra 7 355, Intel Graphics 4 Xe3 Panther Lake iGPU (12083 - 14955, n=7) | |
| MSI Prestige 13 AI+ A3MG | |
| Dell XPS 13 DX13260 | |
| PCMark 10 / Digital Content Creation | |
| Framework Laptop 13 Pro | |
| HP OmniBook 7 Aero 13-bg1077nr | |
| MSI Prestige 13 AI+ A3MG | |
| Dell XPS 13 DX13260 Core Ultra 7 | |
| Average Intel Core Ultra 7 355, Intel Graphics 4 Xe3 Panther Lake iGPU (6211 - 9368, n=7) | |
| Dell XPS 13 DX13260 | |
| CrossMark / Overall | |
| Framework Laptop 13 Pro | |
| MSI Prestige 13 AI+ A3MG | |
| Dell XPS 13 DX13260 Core Ultra 7 | |
| Average Intel Core Ultra 7 355, Intel Graphics 4 Xe3 Panther Lake iGPU (1627 - 1892, n=7) | |
| Dell XPS 13 DX13260 | |
| Microsoft Surface Laptop 13 2026 | |
| HP OmniBook 7 Aero 13-bg1077nr | |
| CrossMark / Productivity | |
| MSI Prestige 13 AI+ A3MG | |
| Framework Laptop 13 Pro | |
| Dell XPS 13 DX13260 Core Ultra 7 | |
| Average Intel Core Ultra 7 355, Intel Graphics 4 Xe3 Panther Lake iGPU (1561 - 1826, n=7) | |
| Dell XPS 13 DX13260 | |
| Microsoft Surface Laptop 13 2026 | |
| HP OmniBook 7 Aero 13-bg1077nr | |
| CrossMark / Creativity | |
| Framework Laptop 13 Pro | |
| MSI Prestige 13 AI+ A3MG | |
| Dell XPS 13 DX13260 Core Ultra 7 | |
| Average Intel Core Ultra 7 355, Intel Graphics 4 Xe3 Panther Lake iGPU (1761 - 2052, n=7) | |
| HP OmniBook 7 Aero 13-bg1077nr | |
| Microsoft Surface Laptop 13 2026 | |
| Dell XPS 13 DX13260 | |
| CrossMark / Responsiveness | |
| Framework Laptop 13 Pro | |
| MSI Prestige 13 AI+ A3MG | |
| Average Intel Core Ultra 7 355, Intel Graphics 4 Xe3 Panther Lake iGPU (1458 - 1671, n=7) | |
| Dell XPS 13 DX13260 Core Ultra 7 | |
| Dell XPS 13 DX13260 | |
| Microsoft Surface Laptop 13 2026 | |
| HP OmniBook 7 Aero 13-bg1077nr | |
| WebXPRT 5 / Overall | |
| Framework Laptop 13 Pro | |
| Dell XPS 13 DX13260 Core Ultra 7 | |
| Average Intel Core Ultra 7 355, Intel Graphics 4 Xe3 Panther Lake iGPU (98 - 117, n=7) | |
| Dell XPS 13 DX13260 | |
| Microsoft Surface Laptop 13 2026 | |
| Mozilla Kraken 1.1 / Total | |
| HP OmniBook 7 Aero 13-bg1077nr | |
| Dell XPS 13 DX13260 | |
| Microsoft Surface Laptop 13 2026 | |
| Dell XPS 13 DX13260 Core Ultra 7 | |
| Average Intel Core Ultra 7 355, Intel Graphics 4 Xe3 Panther Lake iGPU (323 - 559, n=8) | |
| Framework Laptop 13 Pro | |
| MSI Prestige 13 AI+ A3MG | |
| Geekbench AI / Single Precision GPU 1.7 | |
| Framework Laptop 13 Pro | |
| HP OmniBook 7 Aero 13-bg1077nr | |
| Average Intel Core Ultra 7 355, Intel Graphics 4 Xe3 Panther Lake iGPU (1944 - 6555, n=8) | |
| Dell XPS 13 DX13260 | |
| Dell XPS 13 DX13260 Core Ultra 7 | |
| Geekbench AI / Half Precision GPU 1.7 | |
| Framework Laptop 13 Pro | |
| Average Intel Core Ultra 7 355, Intel Graphics 4 Xe3 Panther Lake iGPU (2021 - 12864, n=8) | |
| HP OmniBook 7 Aero 13-bg1077nr | |
| Dell XPS 13 DX13260 | |
| Dell XPS 13 DX13260 Core Ultra 7 | |
| Geekbench AI / Quantized GPU 1.7 | |
| Framework Laptop 13 Pro | |
| HP OmniBook 7 Aero 13-bg1077nr | |
| Average Intel Core Ultra 7 355, Intel Graphics 4 Xe3 Panther Lake iGPU (1850 - 4449, n=8) | |
| Dell XPS 13 DX13260 | |
| Dell XPS 13 DX13260 Core Ultra 7 | |
* ... smaller is better
| PCMark 10 Score | 7902 points | |
Help | ||
| AIDA64 / Memory Copy | |
| Framework Laptop 13 Pro | |
| MSI Prestige 13 AI+ A3MG | |
| Average Intel Core Ultra 7 355 (97301 - 105135, n=7) | |
| Dell XPS 13 DX13260 Core Ultra 7 | |
| HP OmniBook 7 Aero 13-bg1077nr | |
| Microsoft Surface Laptop 13 2026 | |
| Dell XPS 13 DX13260 | |
| AIDA64 / Memory Read | |
| Framework Laptop 13 Pro | |
| MSI Prestige 13 AI+ A3MG | |
| Dell XPS 13 DX13260 Core Ultra 7 | |
| Average Intel Core Ultra 7 355 (75985 - 86387, n=8) | |
| Microsoft Surface Laptop 13 2026 | |
| HP OmniBook 7 Aero 13-bg1077nr | |
| Dell XPS 13 DX13260 | |
| AIDA64 / Memory Write | |
| Dell XPS 13 DX13260 Core Ultra 7 | |
| Average Intel Core Ultra 7 355 (103056 - 108621, n=7) | |
| MSI Prestige 13 AI+ A3MG | |
| Framework Laptop 13 Pro | |
| HP OmniBook 7 Aero 13-bg1077nr | |
| Microsoft Surface Laptop 13 2026 | |
| Dell XPS 13 DX13260 | |
| AIDA64 / Memory Latency | |
| Dell XPS 13 DX13260 | |
| MSI Prestige 13 AI+ A3MG | |
| HP OmniBook 7 Aero 13-bg1077nr | |
| Framework Laptop 13 Pro | |
| Average Intel Core Ultra 7 355 (99.7 - 105.8, n=7) | |
| Dell XPS 13 DX13260 Core Ultra 7 | |
* ... smaller is better
DPC Latency
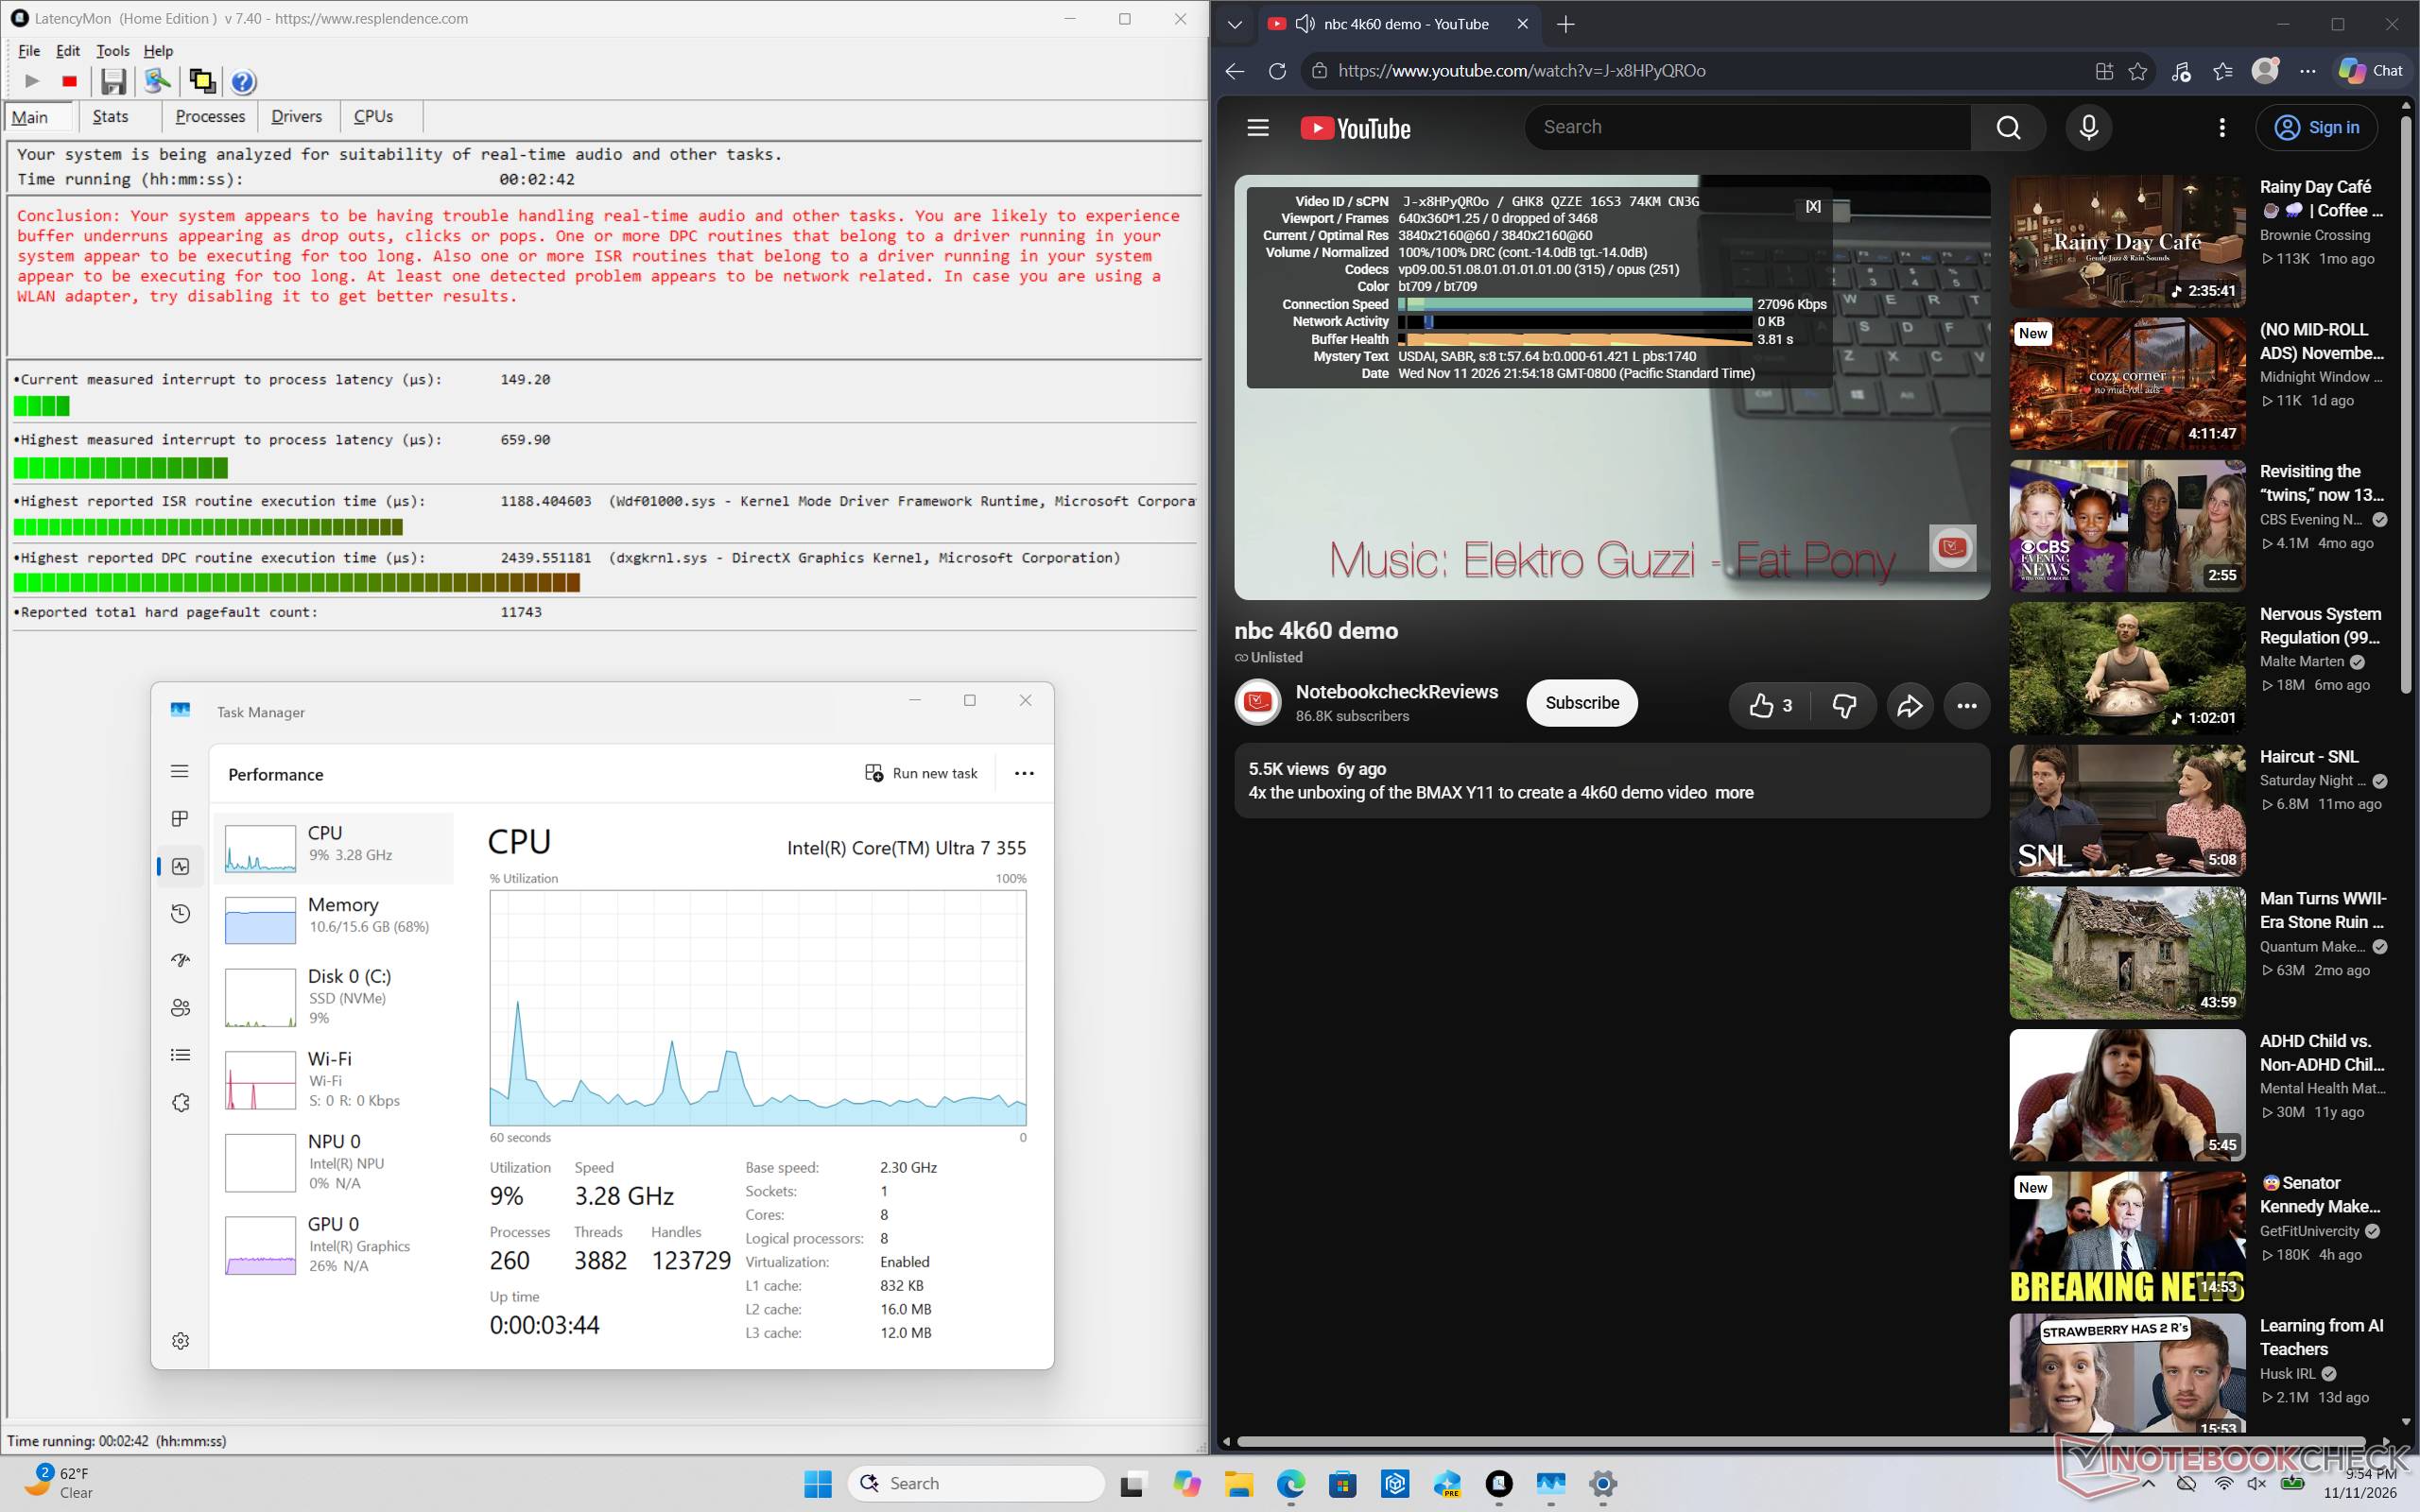
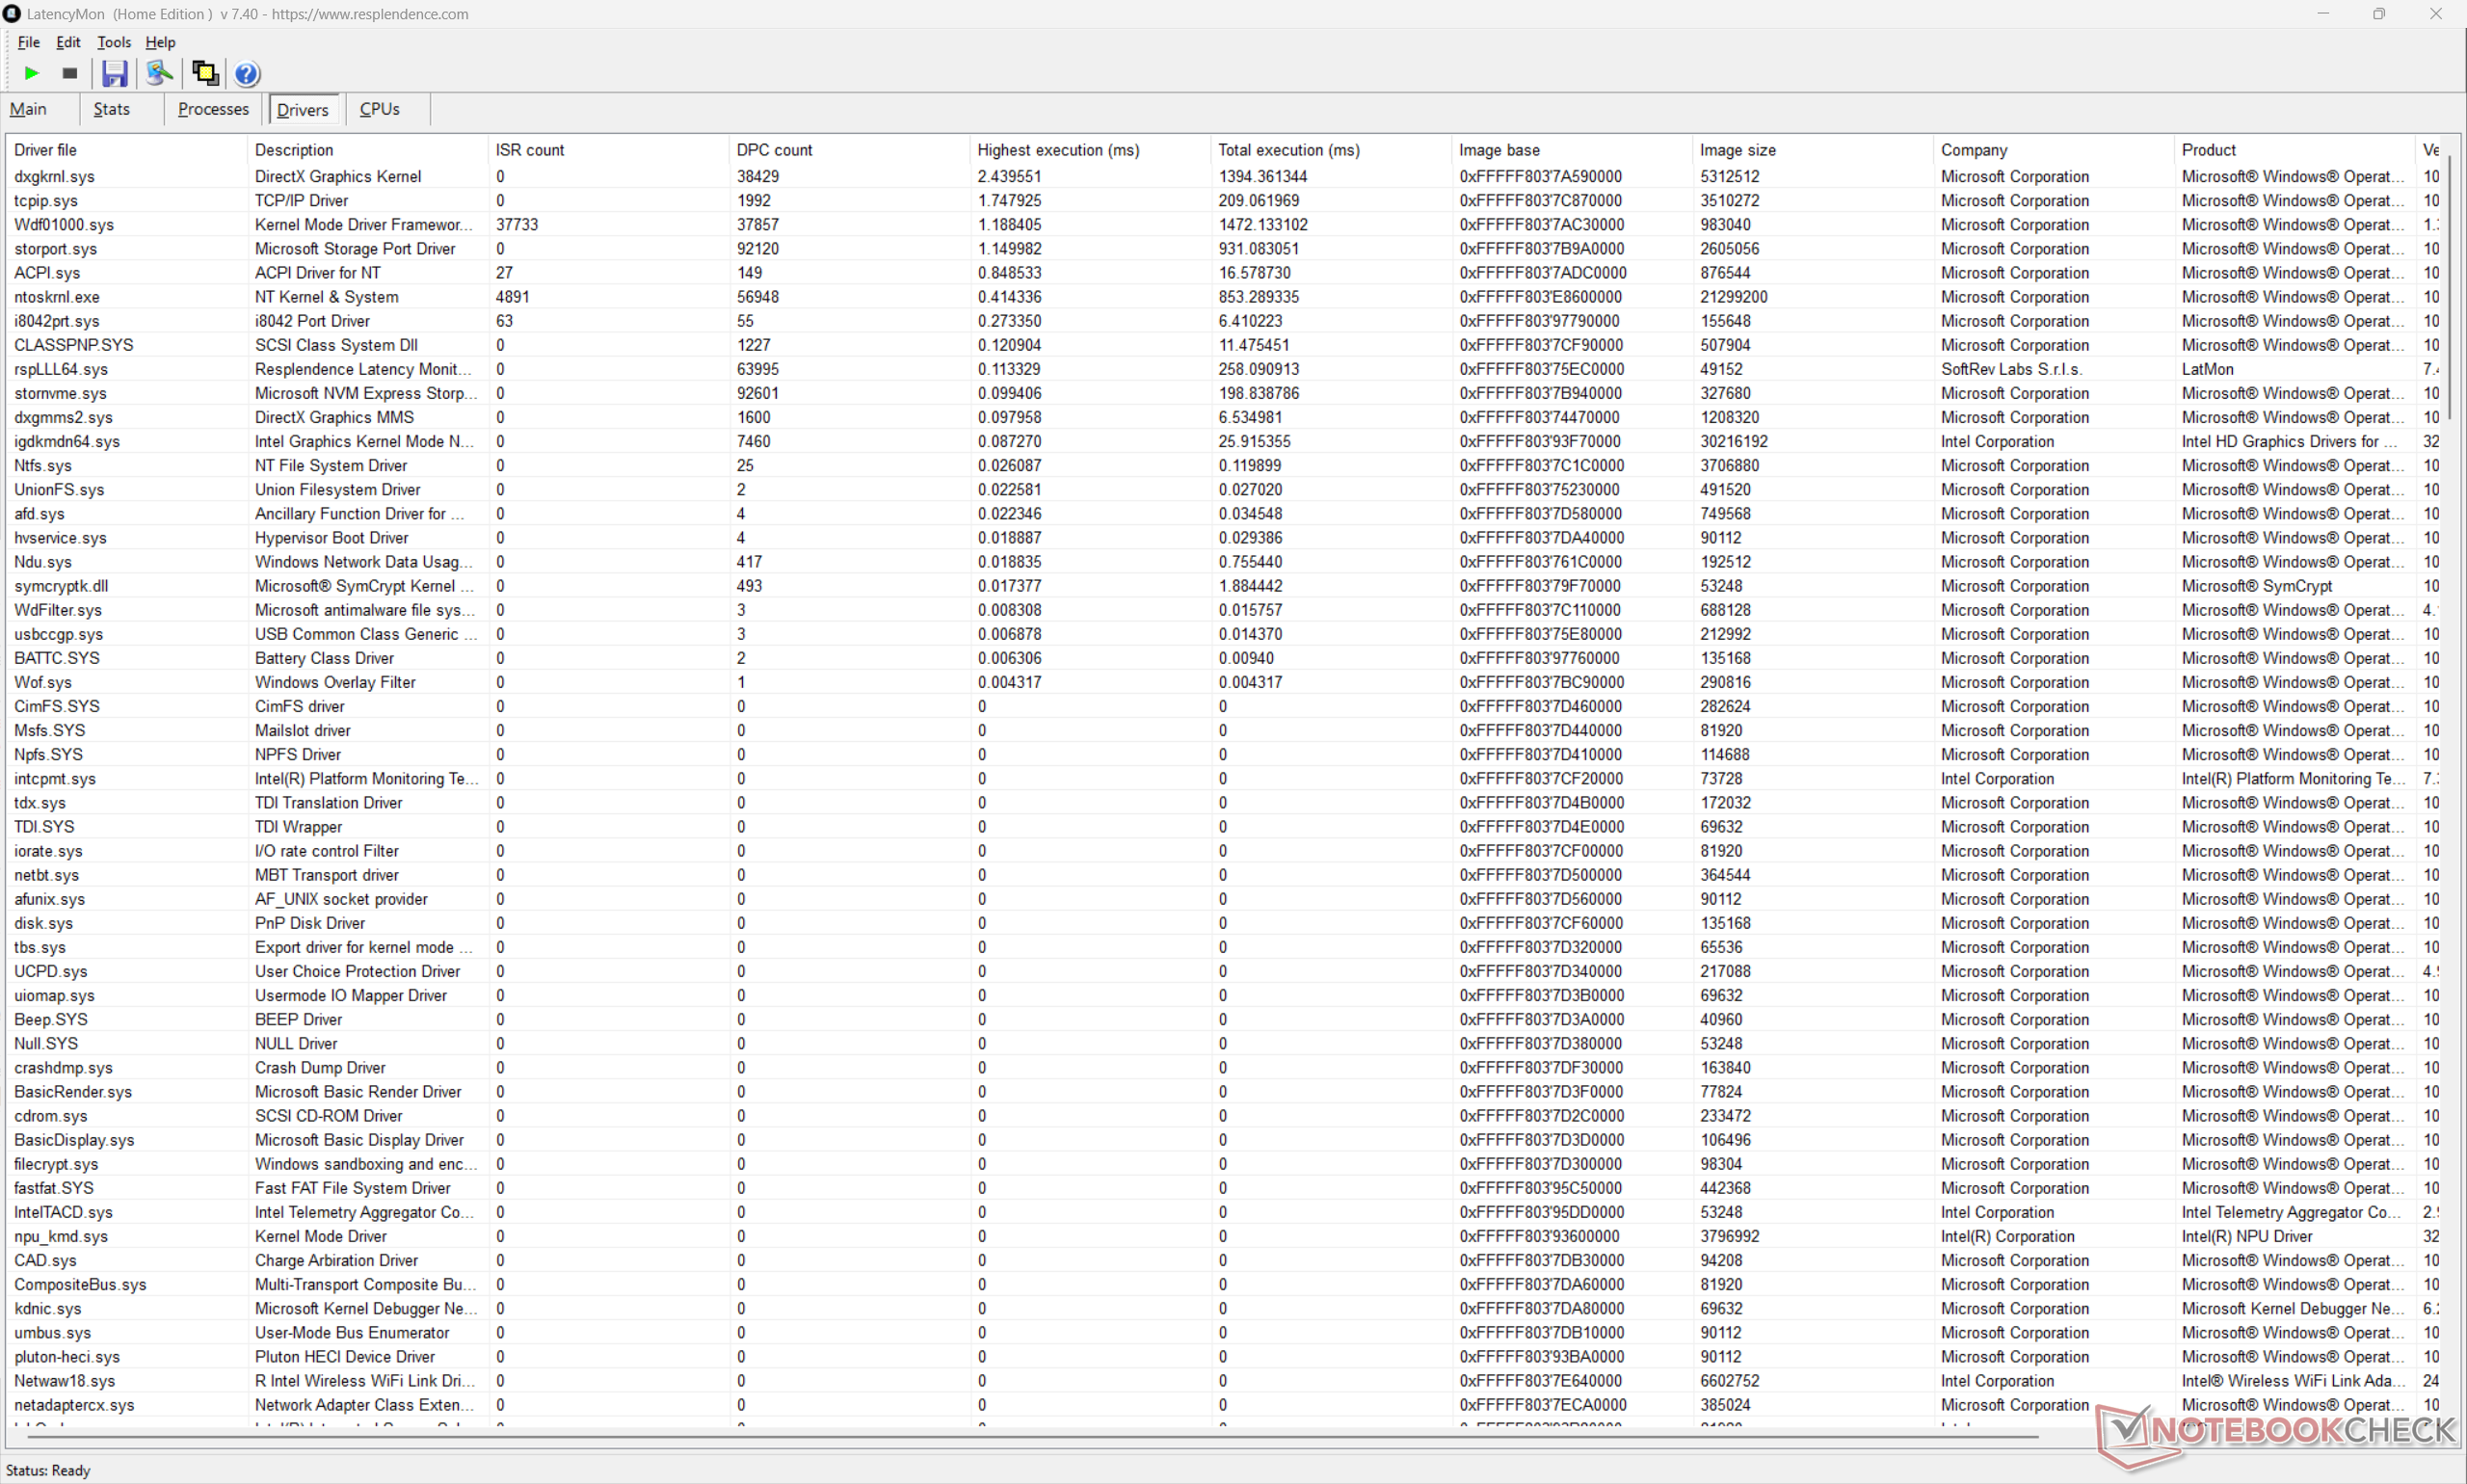
| DPC Latencies / LatencyMon - interrupt to process latency (max), Web, Youtube, Prime95 | |
| Dell XPS 13 DX13260 | |
| HP OmniBook 7 Aero 13-bg1077nr | |
| Dell XPS 13 DX13260 Core Ultra 7 | |
| Framework Laptop 13 Pro | |
* ... smaller is better
Storage Devices
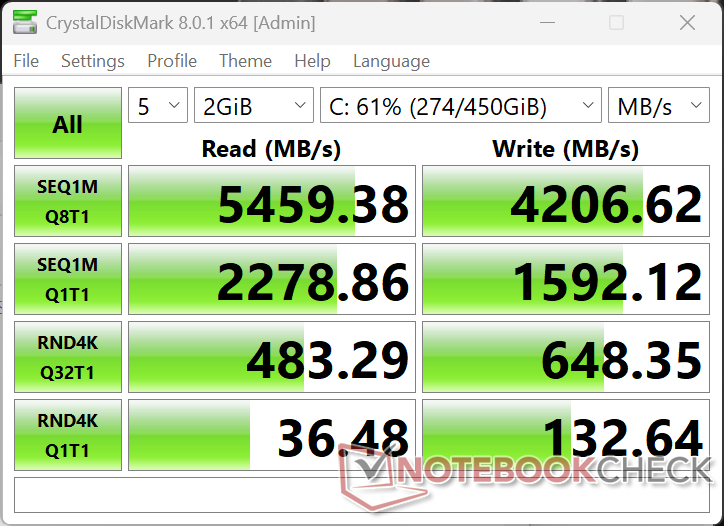
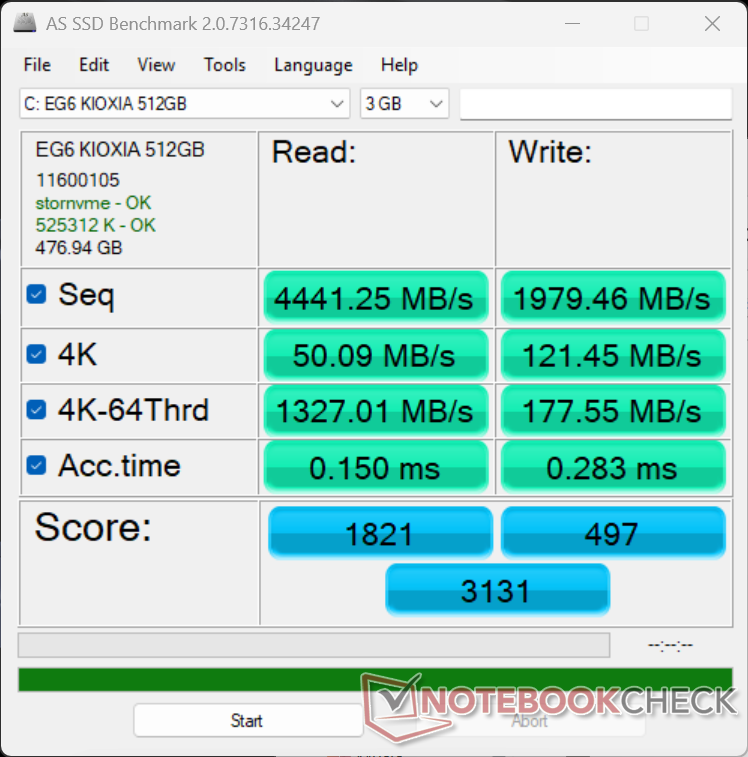

| Drive Performance rating - Percent | |
| Framework Laptop 13 Pro | |
| MSI Prestige 13 AI+ A3MG | |
| HP OmniBook 7 Aero 13-bg1077nr | |
| Dell XPS 13 DX13260 | |
| Dell XPS 13 DX13260 Core Ultra 7 | |
| Microsoft Surface Laptop 13 2026 | |
* ... smaller is better
Disk Throttling: DiskSpd Read Loop, Queue Depth 8
GPU Performance
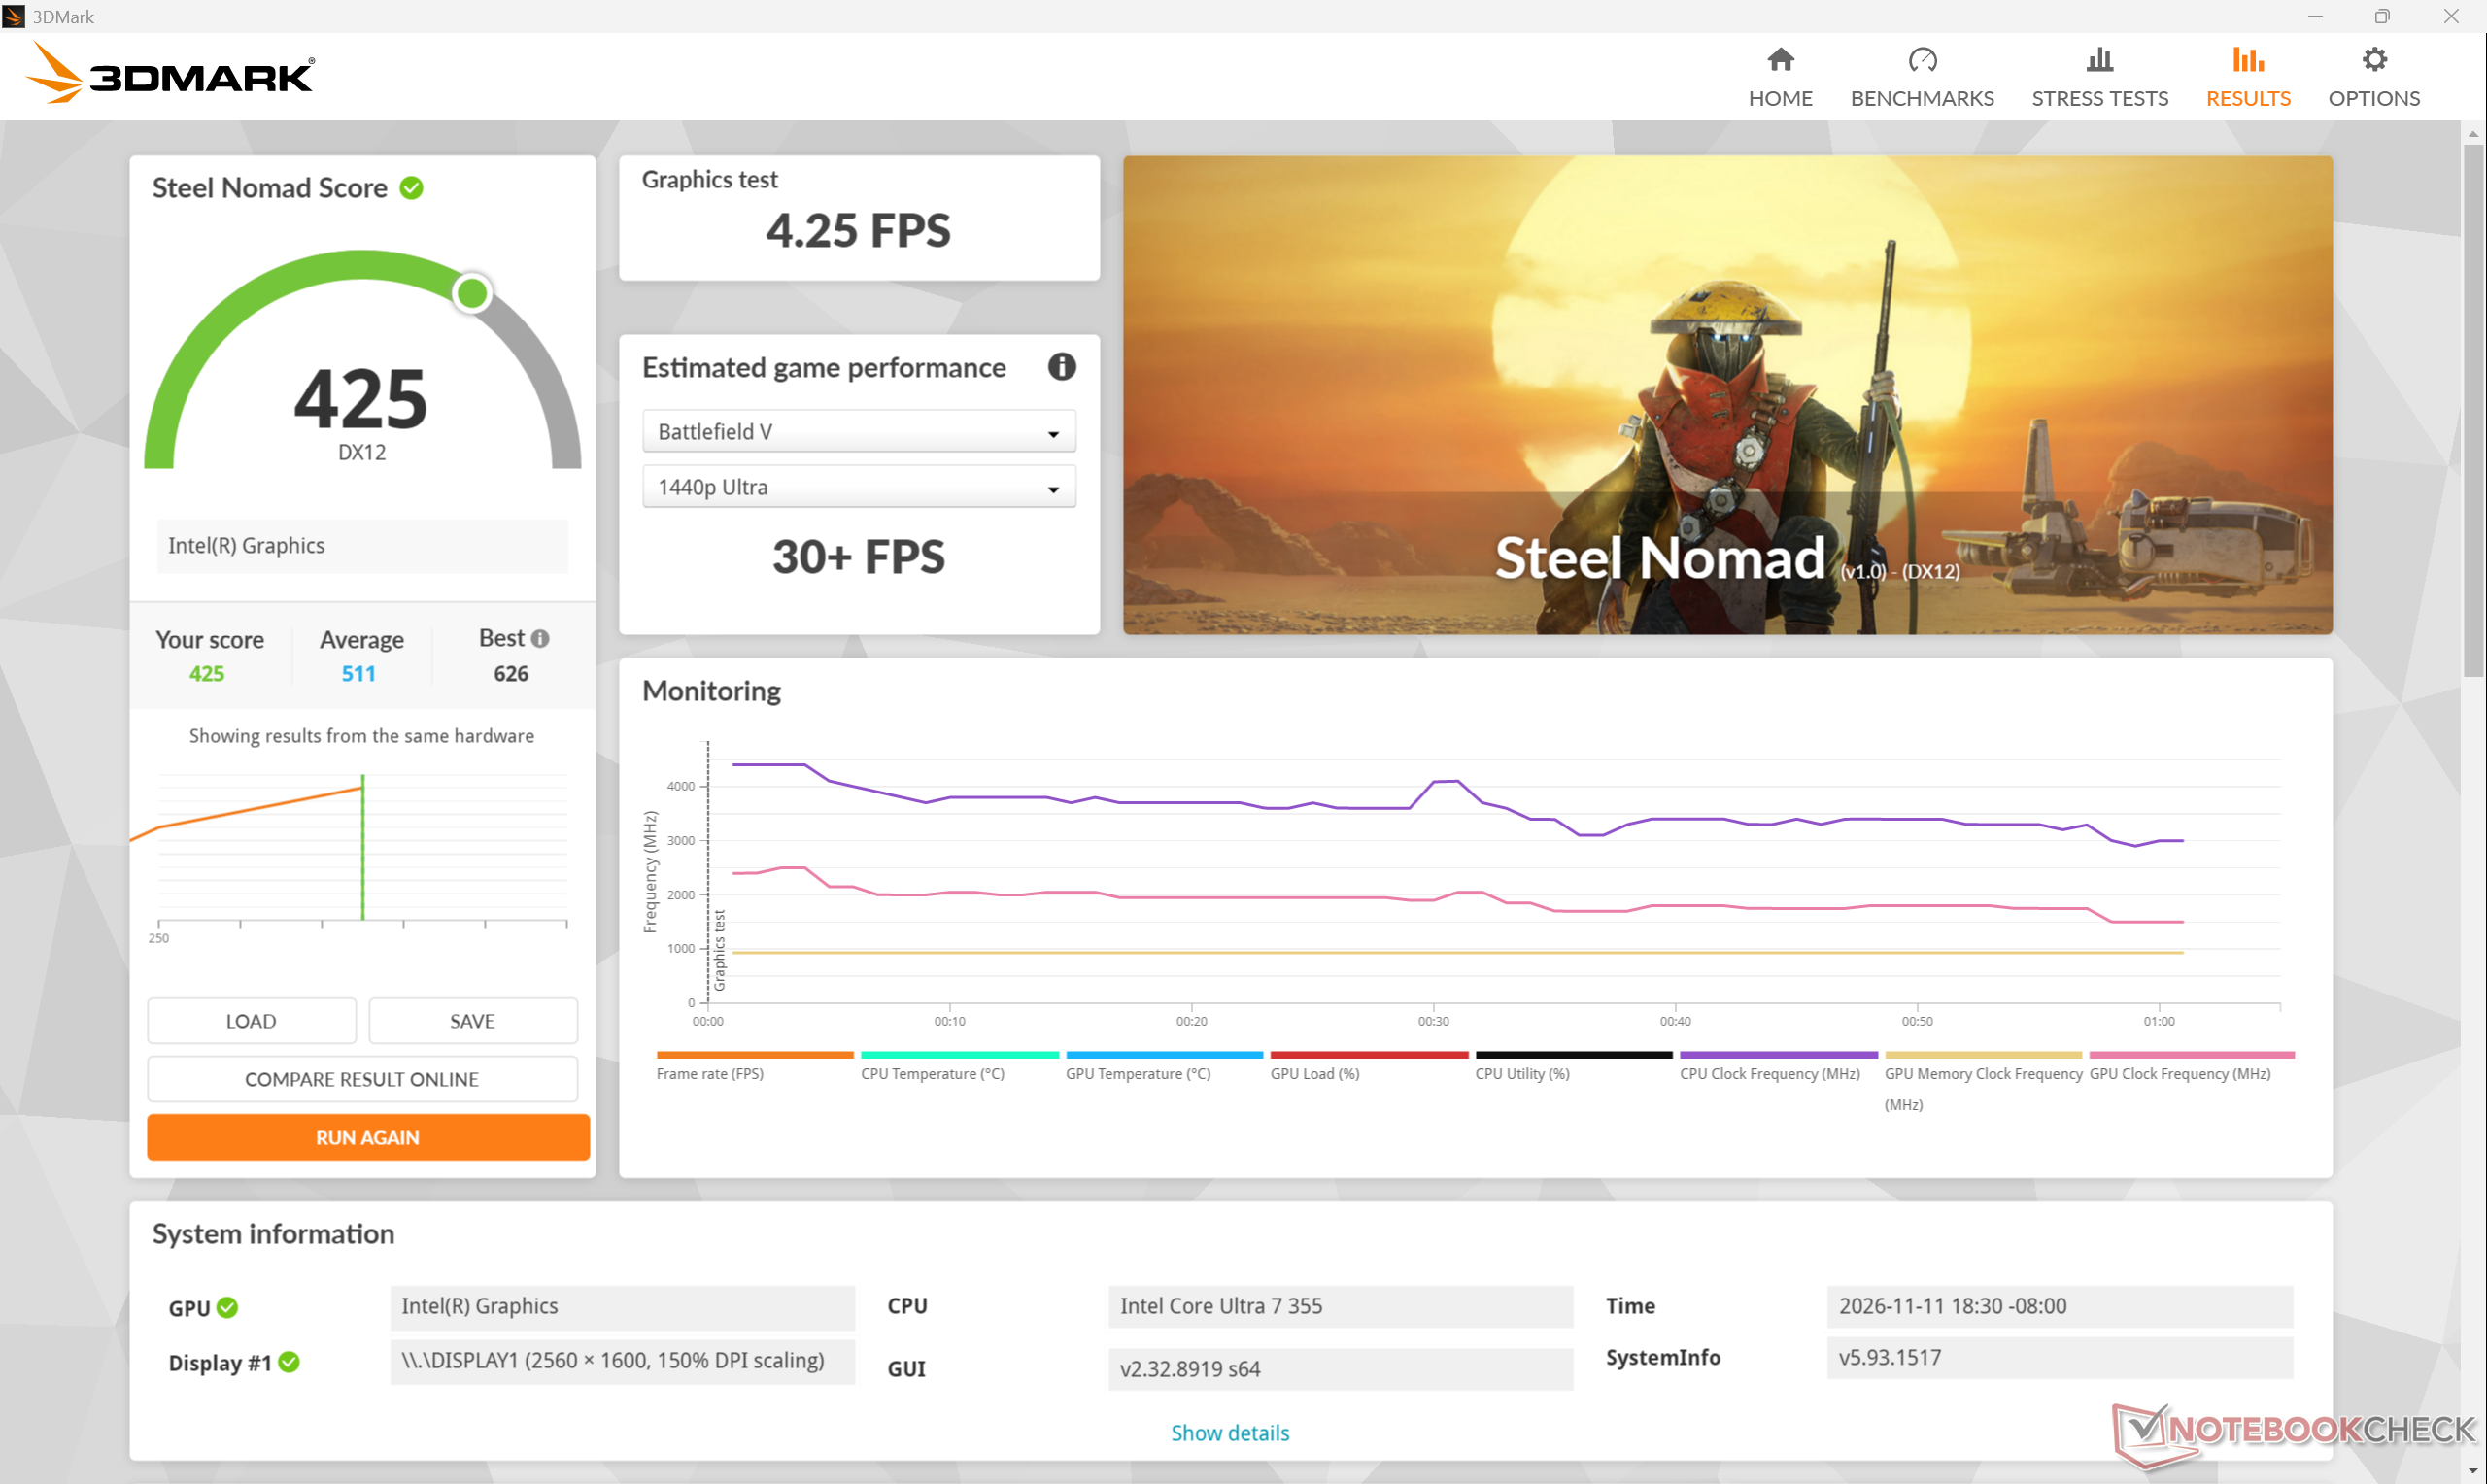
The Panther Lake Graphics 4 Xe3 is about 70 to 80 percent faster than the Graphics 2 Xe3 in the base Core 5 320 configuration. However, it is still not fast enough to run most modern titles even at the lowest settings.
Frame rates when idling on Cyberpunk 2077 would cycle instead of remaining steady due to cycling clock rates.
| Power Profile | Graphics Score | Physics Score | Combined Score |
| Performance Mode | 6364 | 14107 | 1637 |
| Balanced Mode | 6595 | 14660 | 1730 |
| Battery Power | 6502 | 17050 | 1769 |
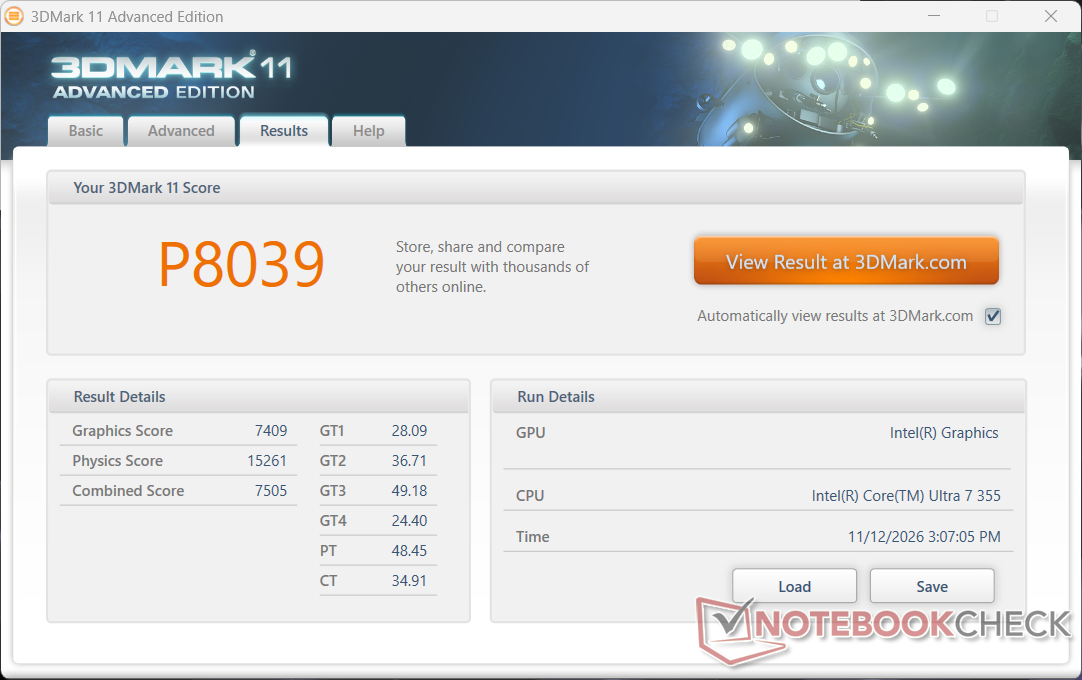
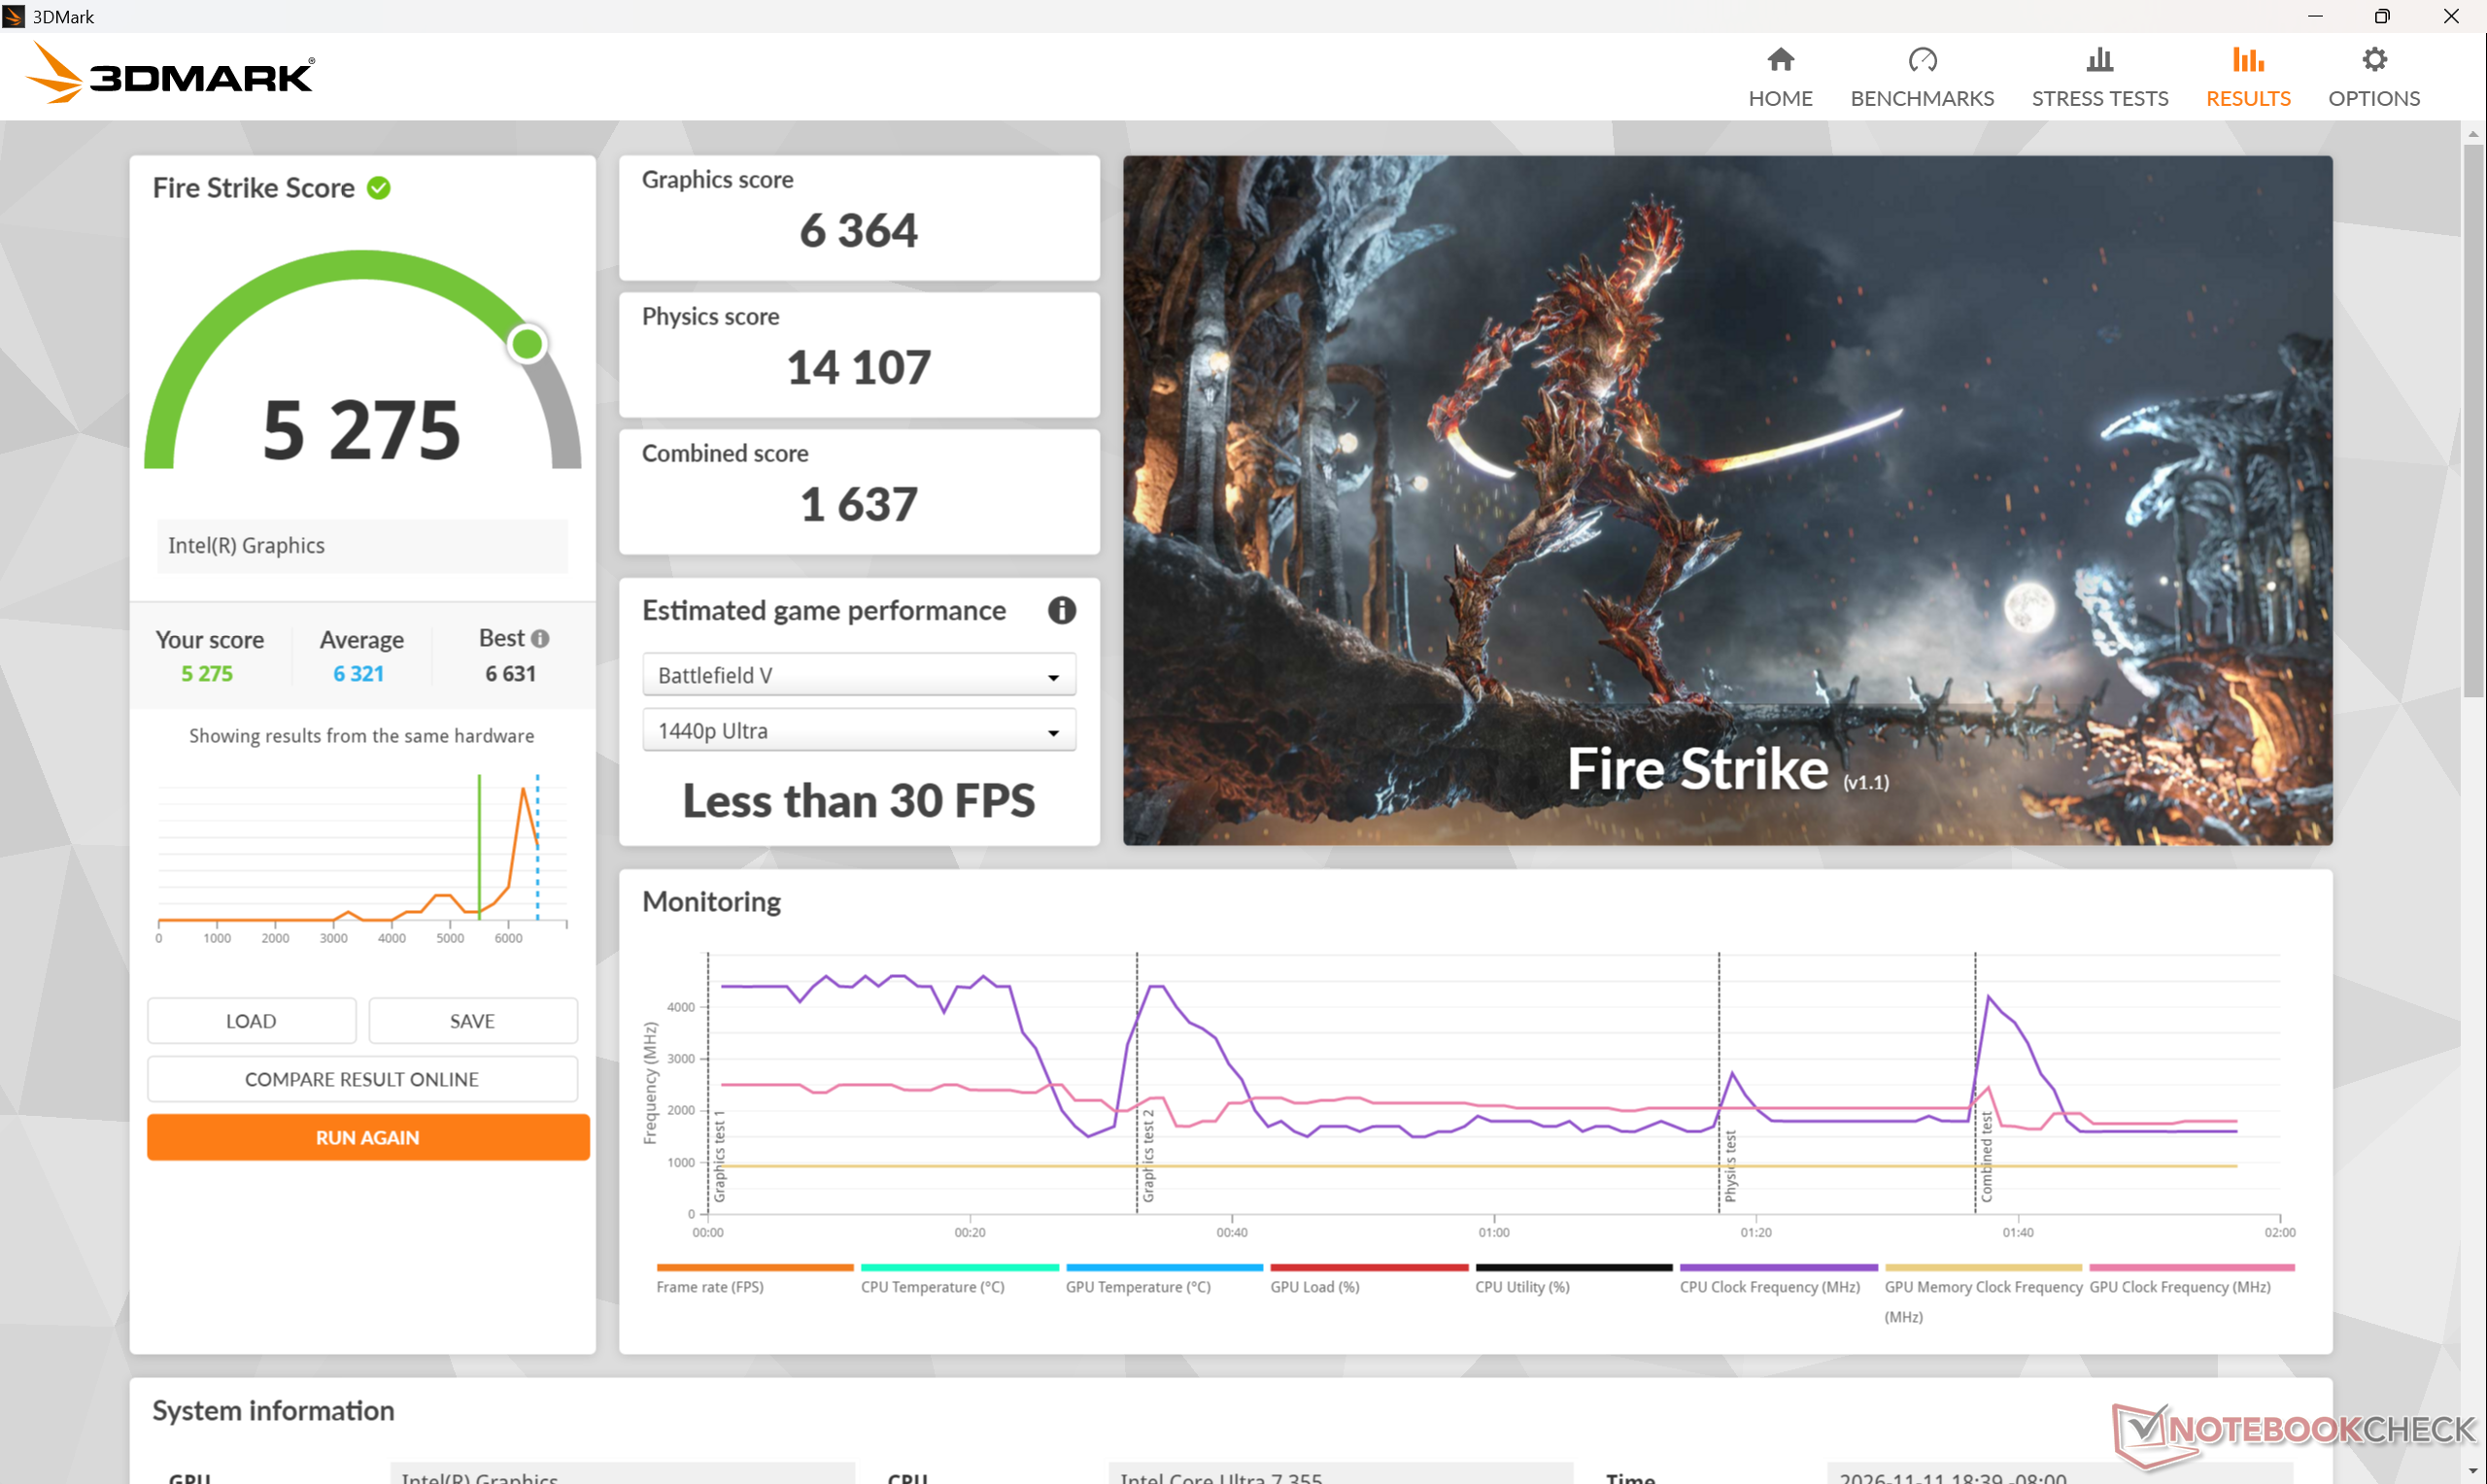
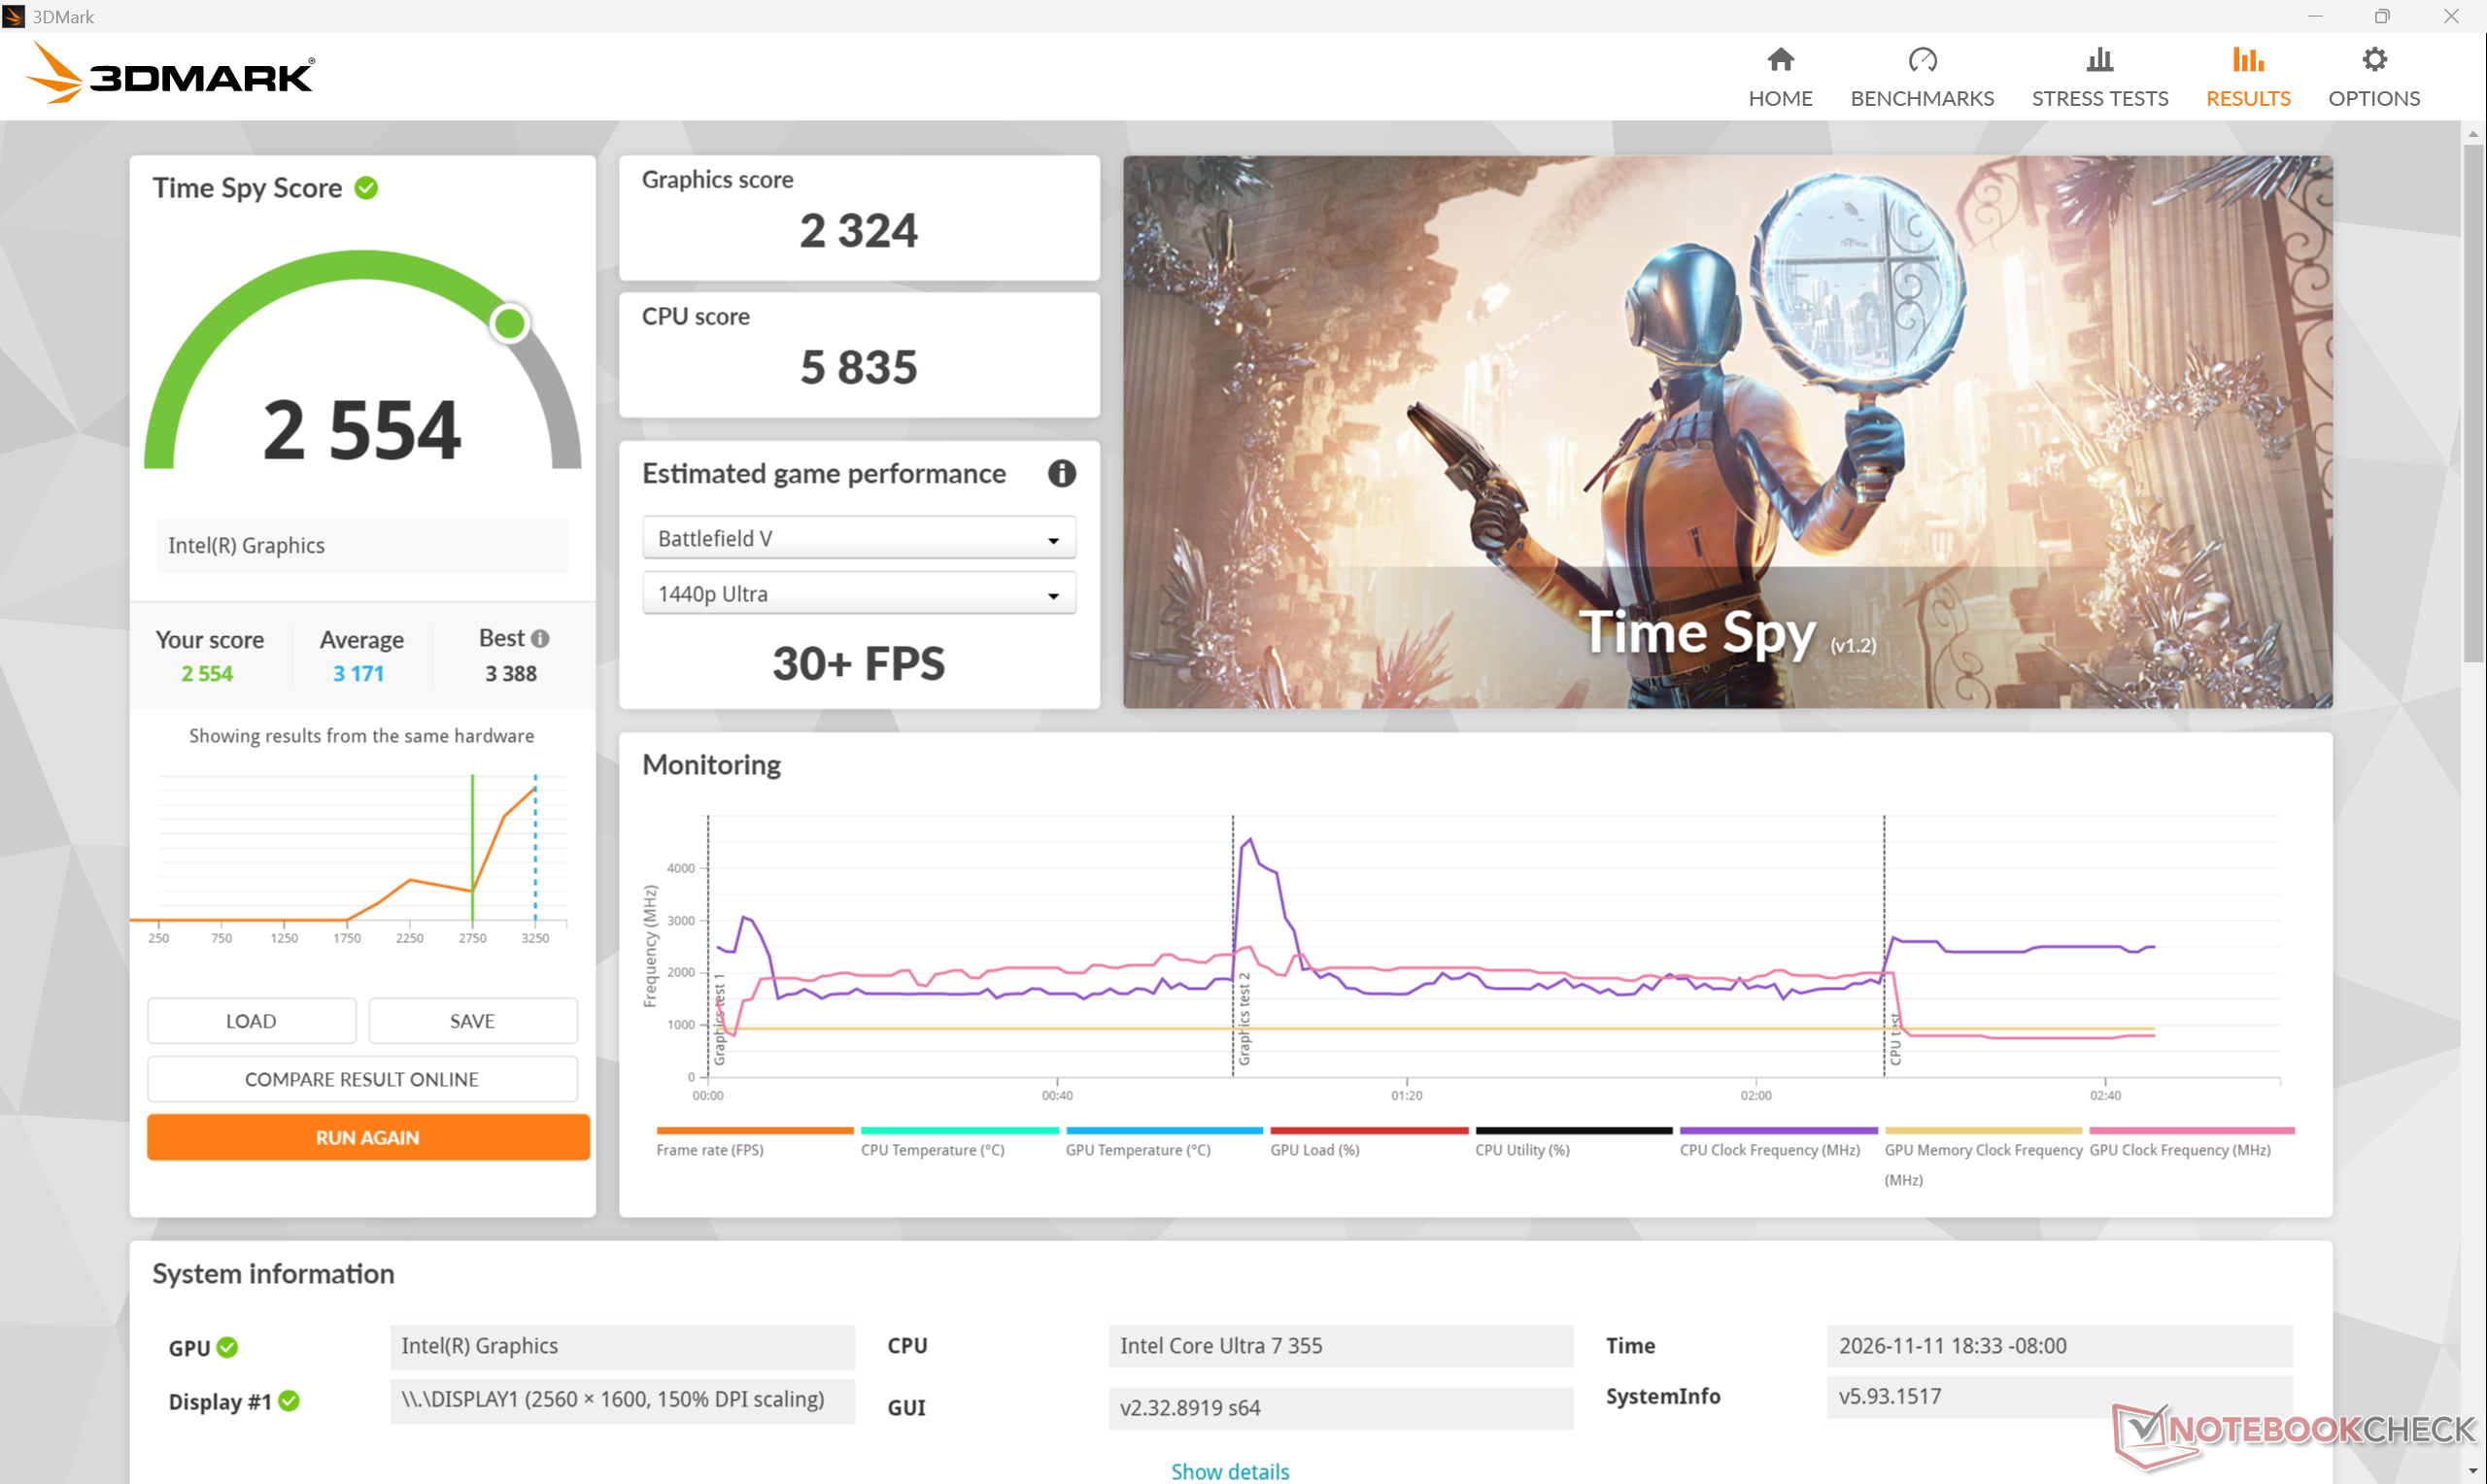
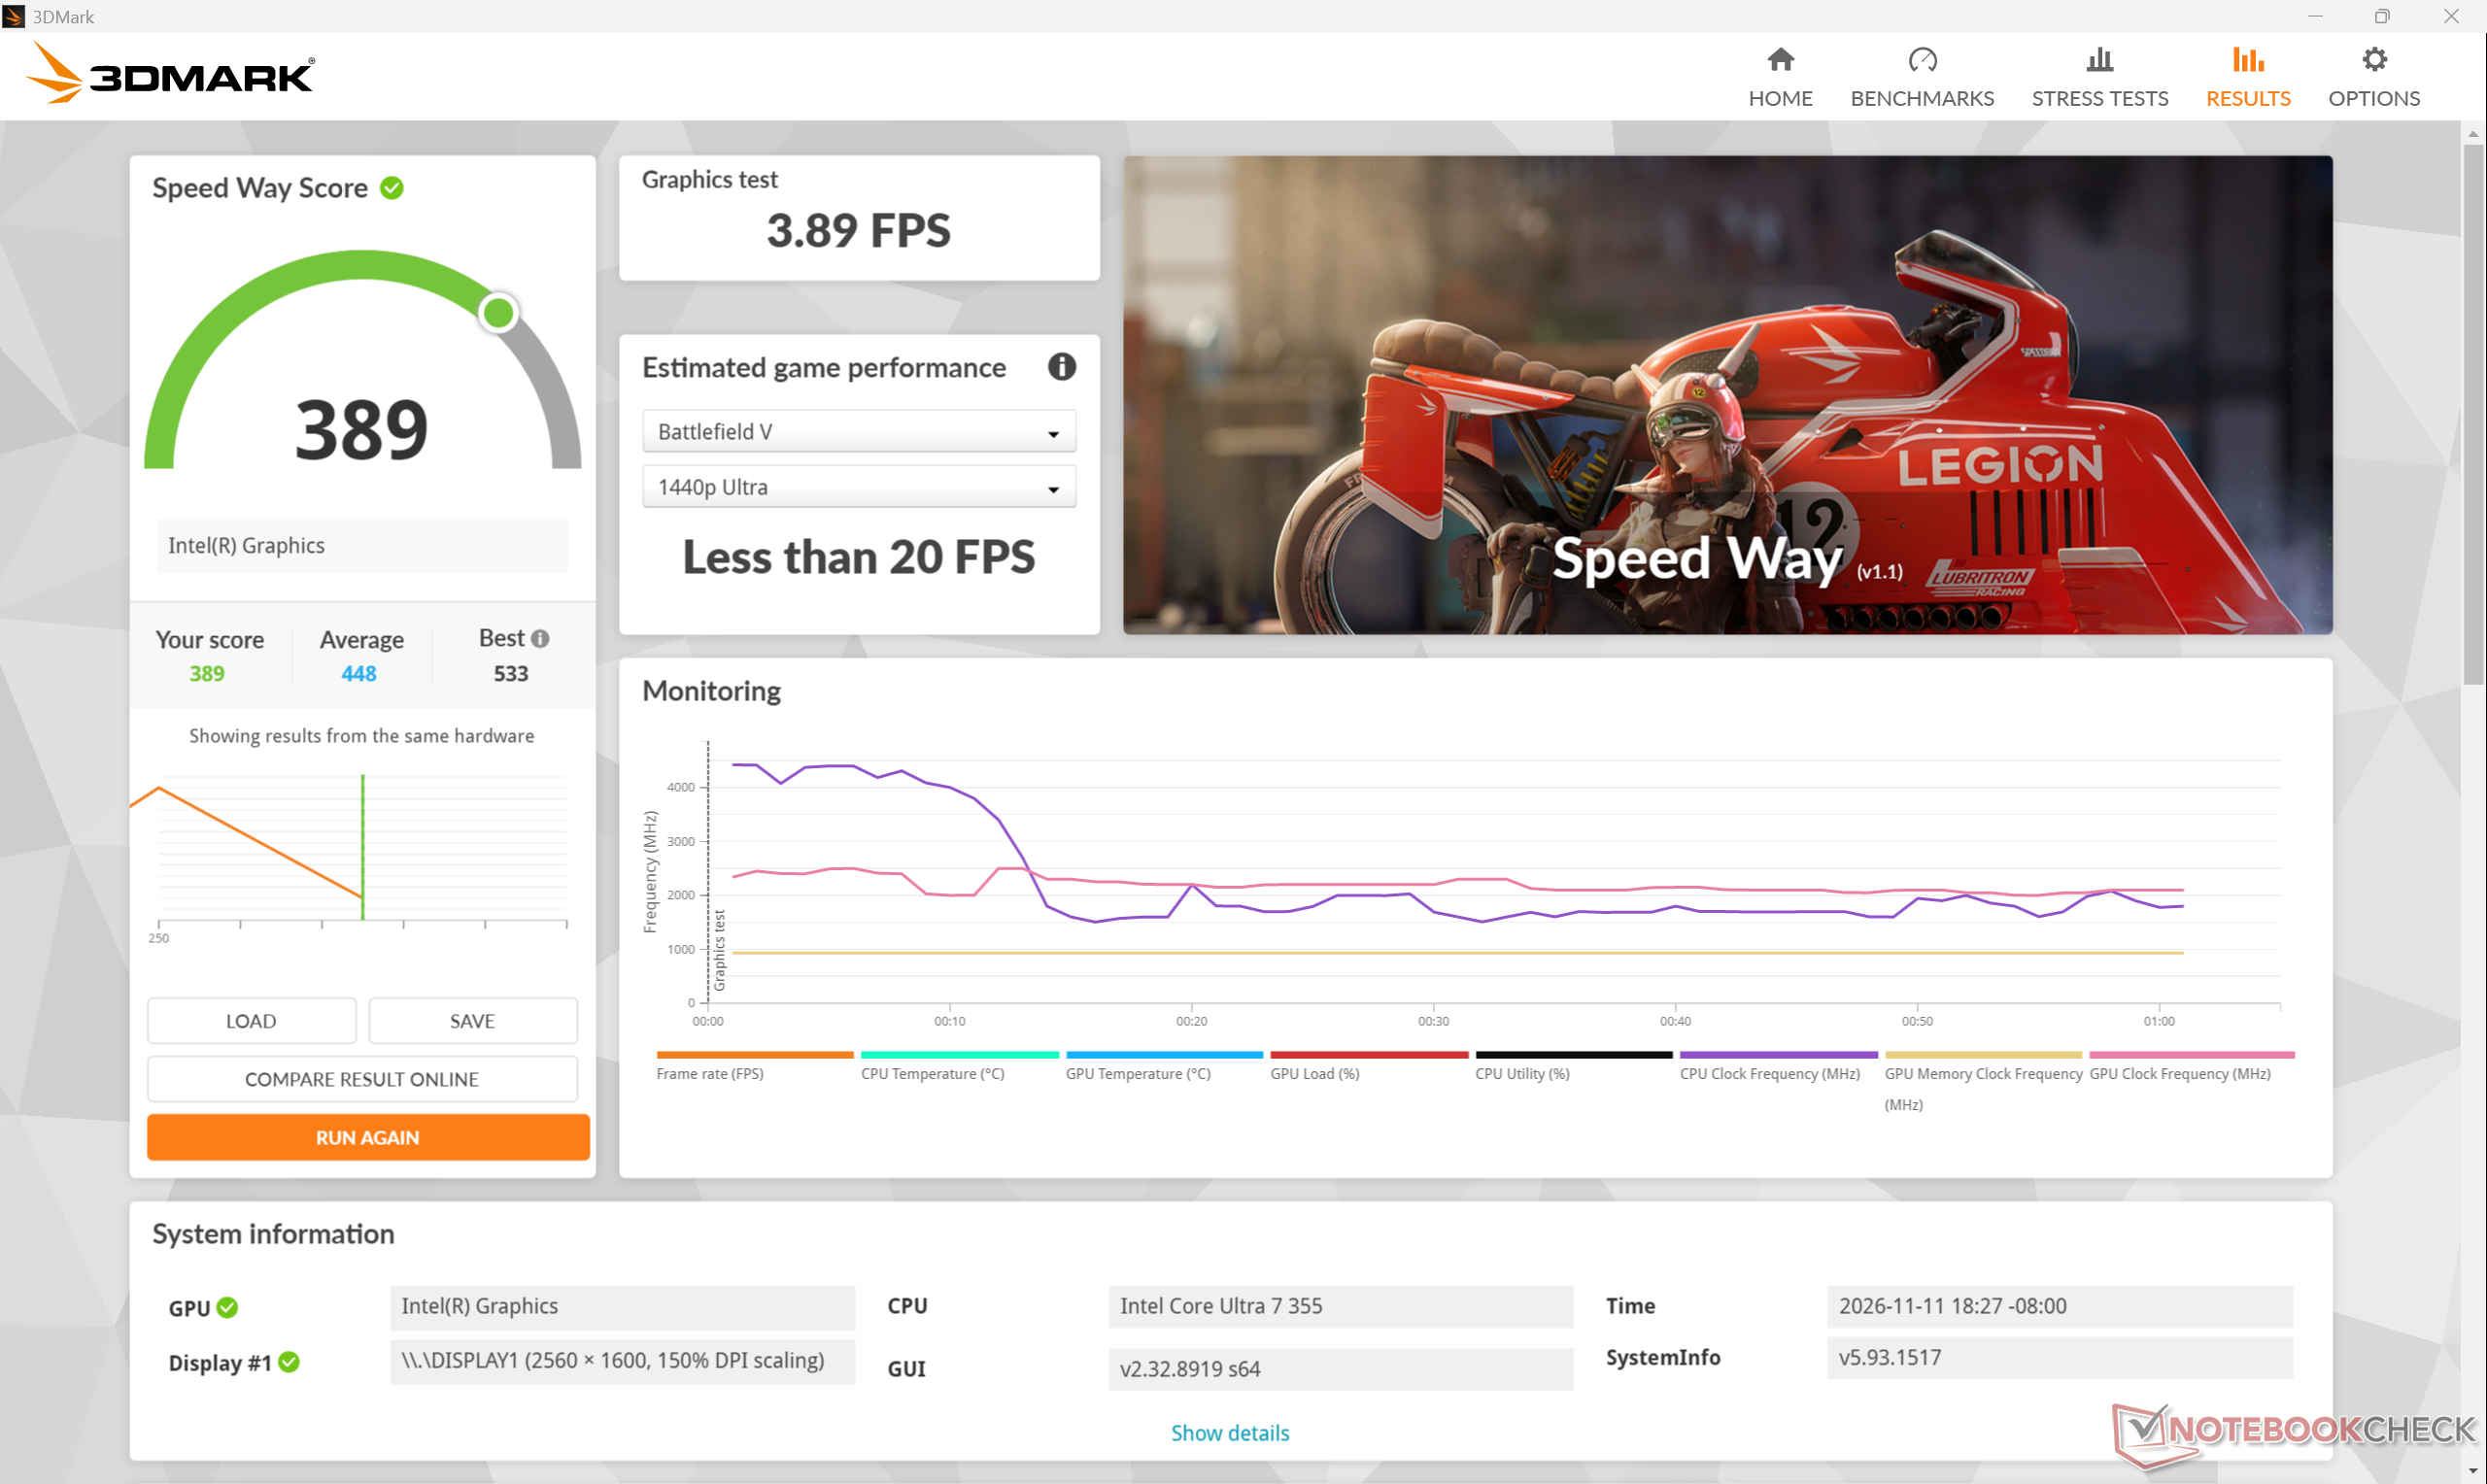
| 3DMark 11 Performance | 8039 points | |
| 3DMark Cloud Gate Standard Score | 24029 points | |
| 3DMark Fire Strike Score | 5275 points | |
| 3DMark Time Spy Score | 2554 points | |
| 3DMark Steel Nomad Score | 425 points | |
Help | ||
* ... smaller is better
| Performance rating - Percent | |
| Framework Laptop 13 Pro | |
| MSI Prestige 13 AI+ A3MG -4! | |
| HP OmniBook 7 Aero 13-bg1077nr | |
| Microsoft Surface Laptop 13 2026 | |
| Dell XPS 13 DX13260 Core Ultra 7 | |
| Dell XPS 13 DX13260 -2! | |
| Cyberpunk 2077 - 1920x1080 Ultra Preset (FSR off) | |
| Framework Laptop 13 Pro | |
| Dell XPS 13 DX13260 Core Ultra 7 | |
| MSI Prestige 13 AI+ A3MG | |
| HP OmniBook 7 Aero 13-bg1077nr | |
| Microsoft Surface Laptop 13 2026 | |
| Baldur's Gate 3 - 1920x1080 Ultra Preset AA:T | |
| Framework Laptop 13 Pro | |
| HP OmniBook 7 Aero 13-bg1077nr | |
| Dell XPS 13 DX13260 Core Ultra 7 | |
| Microsoft Surface Laptop 13 2026 | |
| Dell XPS 13 DX13260 | |
| GTA V - 1920x1080 Highest AA:4xMSAA + FX AF:16x | |
| Framework Laptop 13 Pro | |
| HP OmniBook 7 Aero 13-bg1077nr | |
| Microsoft Surface Laptop 13 2026 | |
| Dell XPS 13 DX13260 Core Ultra 7 | |
| Dell XPS 13 DX13260 | |
| Final Fantasy XV Benchmark - 1920x1080 High Quality | |
| Framework Laptop 13 Pro | |
| HP OmniBook 7 Aero 13-bg1077nr | |
| Dell XPS 13 DX13260 | |
| Dell XPS 13 DX13260 Core Ultra 7 | |
| Microsoft Surface Laptop 13 2026 | |
| Strange Brigade - 1920x1080 ultra AA:ultra AF:16 | |
| Framework Laptop 13 Pro | |
| HP OmniBook 7 Aero 13-bg1077nr | |
| Dell XPS 13 DX13260 Core Ultra 7 | |
| Microsoft Surface Laptop 13 2026 | |
| Dota 2 Reborn - 1920x1080 ultra (3/3) best looking | |
| Framework Laptop 13 Pro | |
| HP OmniBook 7 Aero 13-bg1077nr | |
| MSI Prestige 13 AI+ A3MG | |
| Microsoft Surface Laptop 13 2026 | |
| Dell XPS 13 DX13260 Core Ultra 7 | |
| Dell XPS 13 DX13260 | |
| X-Plane 11.11 - 1920x1080 high (fps_test=3) | |
| HP OmniBook 7 Aero 13-bg1077nr | |
| Framework Laptop 13 Pro | |
| Microsoft Surface Laptop 13 2026 | |
| MSI Prestige 13 AI+ A3MG | |
| Dell XPS 13 DX13260 Core Ultra 7 | |
| Dell XPS 13 DX13260 | |
Cyberpunk 2077 ultra FPS Chart
| low | med. | high | ultra | |
|---|---|---|---|---|
| GTA V (2015) | 145.4 | 110.5 | 11.3 | |
| Dota 2 Reborn (2015) | 101.9 | 49.7 | 56.4 | 51.9 |
| Final Fantasy XV Benchmark (2018) | 45 | 21.6 | 16.7 | |
| X-Plane 11.11 (2018) | 41 | 32.9 | 25 | |
| Strange Brigade (2018) | 69.7 | 32 | 50.3 | 38.3 |
| Baldur's Gate 3 (2023) | 23.7 | 19 | 17 | 16.8 |
| Cyberpunk 2077 (2023) | 37.6 | 28.1 | 21.3 | 19.7 |
| F1 24 (2024) | 51.2 | 47.4 | 34.4 | 10.9 |
Emissions
System Noise
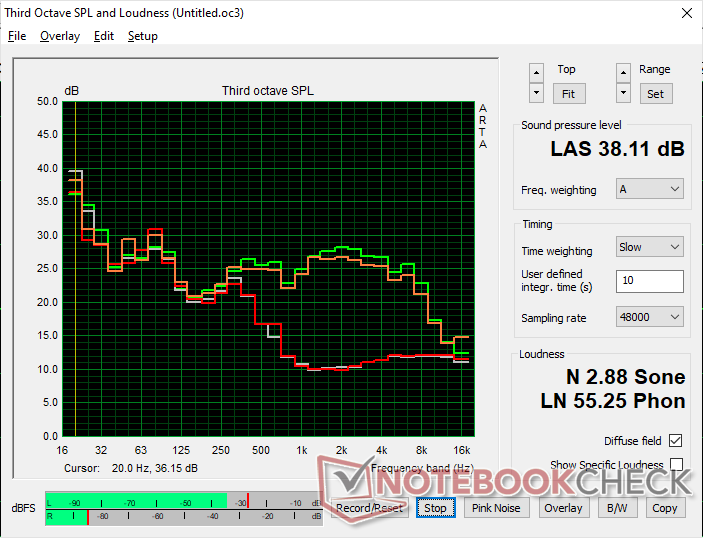
Noise level
| Idle |
| 25.6 / 25.6 / 25.6 dB(A) |
| Load |
| / 38.1 dB(A) |
 | ||
30 dB silent 40 dB(A) audible 50 dB(A) loud |
||
min:  , med:  , max:  Earthworks M23R, Arta (15 cm distance) environment noise: 25.6 dB(A) | ||
| Dell XPS 13 DX13260 Core Ultra 7 Ultra 7 355, Intel Graphics 4 Xe3 PTL | Dell XPS 13 DX13260 Core 5 320, Intel Graphics 2 Xe3 WCL | Microsoft Surface Laptop 13 2026 SD X2 Plus X2P-42-100, Adreno X2-45 | Framework Laptop 13 Pro Ultra X7 358H, Arc B390 Panther Lake iGPU | MSI Prestige 13 AI+ A3MG Ultra 9 386H, Intel Graphics 4 Xe3 PTL | HP OmniBook 7 Aero 13-bg1077nr Ryzen AI 7 350, Radeon 860M | |
|---|---|---|---|---|---|---|
| Noise | 6% | 13% | 6% | -6% | 10% | |
| off / environment * (dB) | 25.6 | 23.3 9% | 23.8 7% | 23.4 9% | 25 2% | 23.2 9% |
| Idle Minimum * (dB) | 25.6 | 23.3 9% | 23.8 7% | 23.4 9% | 26 -2% | 23.3 9% |
| Idle Average * (dB) | 25.6 | 23.3 9% | 23.8 7% | 23.4 9% | 27 -5% | 23.3 9% |
| Idle Maximum * (dB) | 25.6 | 23.3 9% | 23.8 7% | 23.4 9% | 28 -9% | 23.3 9% |
| Cyberpunk 2077 ultra * (dB) | 37 | 35.6 4% | 27.6 25% | 40.4 -9% | 41 -11% | 23.5 36% |
| Load Maximum * (dB) | 38.1 | 40.7 -7% | 29.6 22% | 35.8 6% | 42 -10% | 42 -10% |
| Load Average * (dB) | 27.7 | 23.8 | 30.5 | 31 | 24.7 |
* ... smaller is better
Temperature


(±) The maximum temperature on the upper side is 40.6 °C / 105 F, compared to the average of 35.9 °C / 97 F, ranging from 21.4 to 59 °C for the class Subnotebook.
(+) The bottom heats up to a maximum of 38.8 °C / 102 F, compared to the average of 39.2 °C / 103 F
(+) In idle usage, the average temperature for the upper side is 25.6 °C / 78 F, compared to the device average of 30.8 °C / 87 F.
(+) The palmrests and touchpad are cooler than skin temperature with a maximum of 30.4 °C / 86.7 F and are therefore cool to the touch.
(-) The average temperature of the palmrest area of similar devices was 28.2 °C / 82.8 F (-2.2 °C / -3.9 F).


| Dell XPS 13 DX13260 Core Ultra 7 Ultra 7 355, Intel Graphics 4 Xe3 PTL | Dell XPS 13 DX13260 Core 5 320, Intel Graphics 2 Xe3 WCL | Microsoft Surface Laptop 13 2026 SD X2 Plus X2P-42-100, Adreno X2-45 | Framework Laptop 13 Pro Ultra X7 358H, Arc B390 Panther Lake iGPU | MSI Prestige 13 AI+ A3MG Ultra 9 386H, Intel Graphics 4 Xe3 PTL | HP OmniBook 7 Aero 13-bg1077nr Ryzen AI 7 350, Radeon 860M | |
|---|---|---|---|---|---|---|
| Heat | 2% | 1% | -11% | -5% | 8% | |
| Maximum Upper Side * (°C) | 40.6 | 39 4% | 39.9 2% | 43.2 -6% | 42 -3% | 35.8 12% |
| Maximum Bottom * (°C) | 38.8 | 38.2 2% | 46.6 -20% | 44.2 -14% | 41 -6% | 37.6 3% |
| Idle Upper Side * (°C) | 26.6 | 26 2% | 23.5 12% | 29.2 -10% | 24.2 9% | |
| Idle Bottom * (°C) | 26.2 | 26.2 -0% | 24.2 8% | 29.8 -14% | 24 8% |
* ... smaller is better
Stress Test
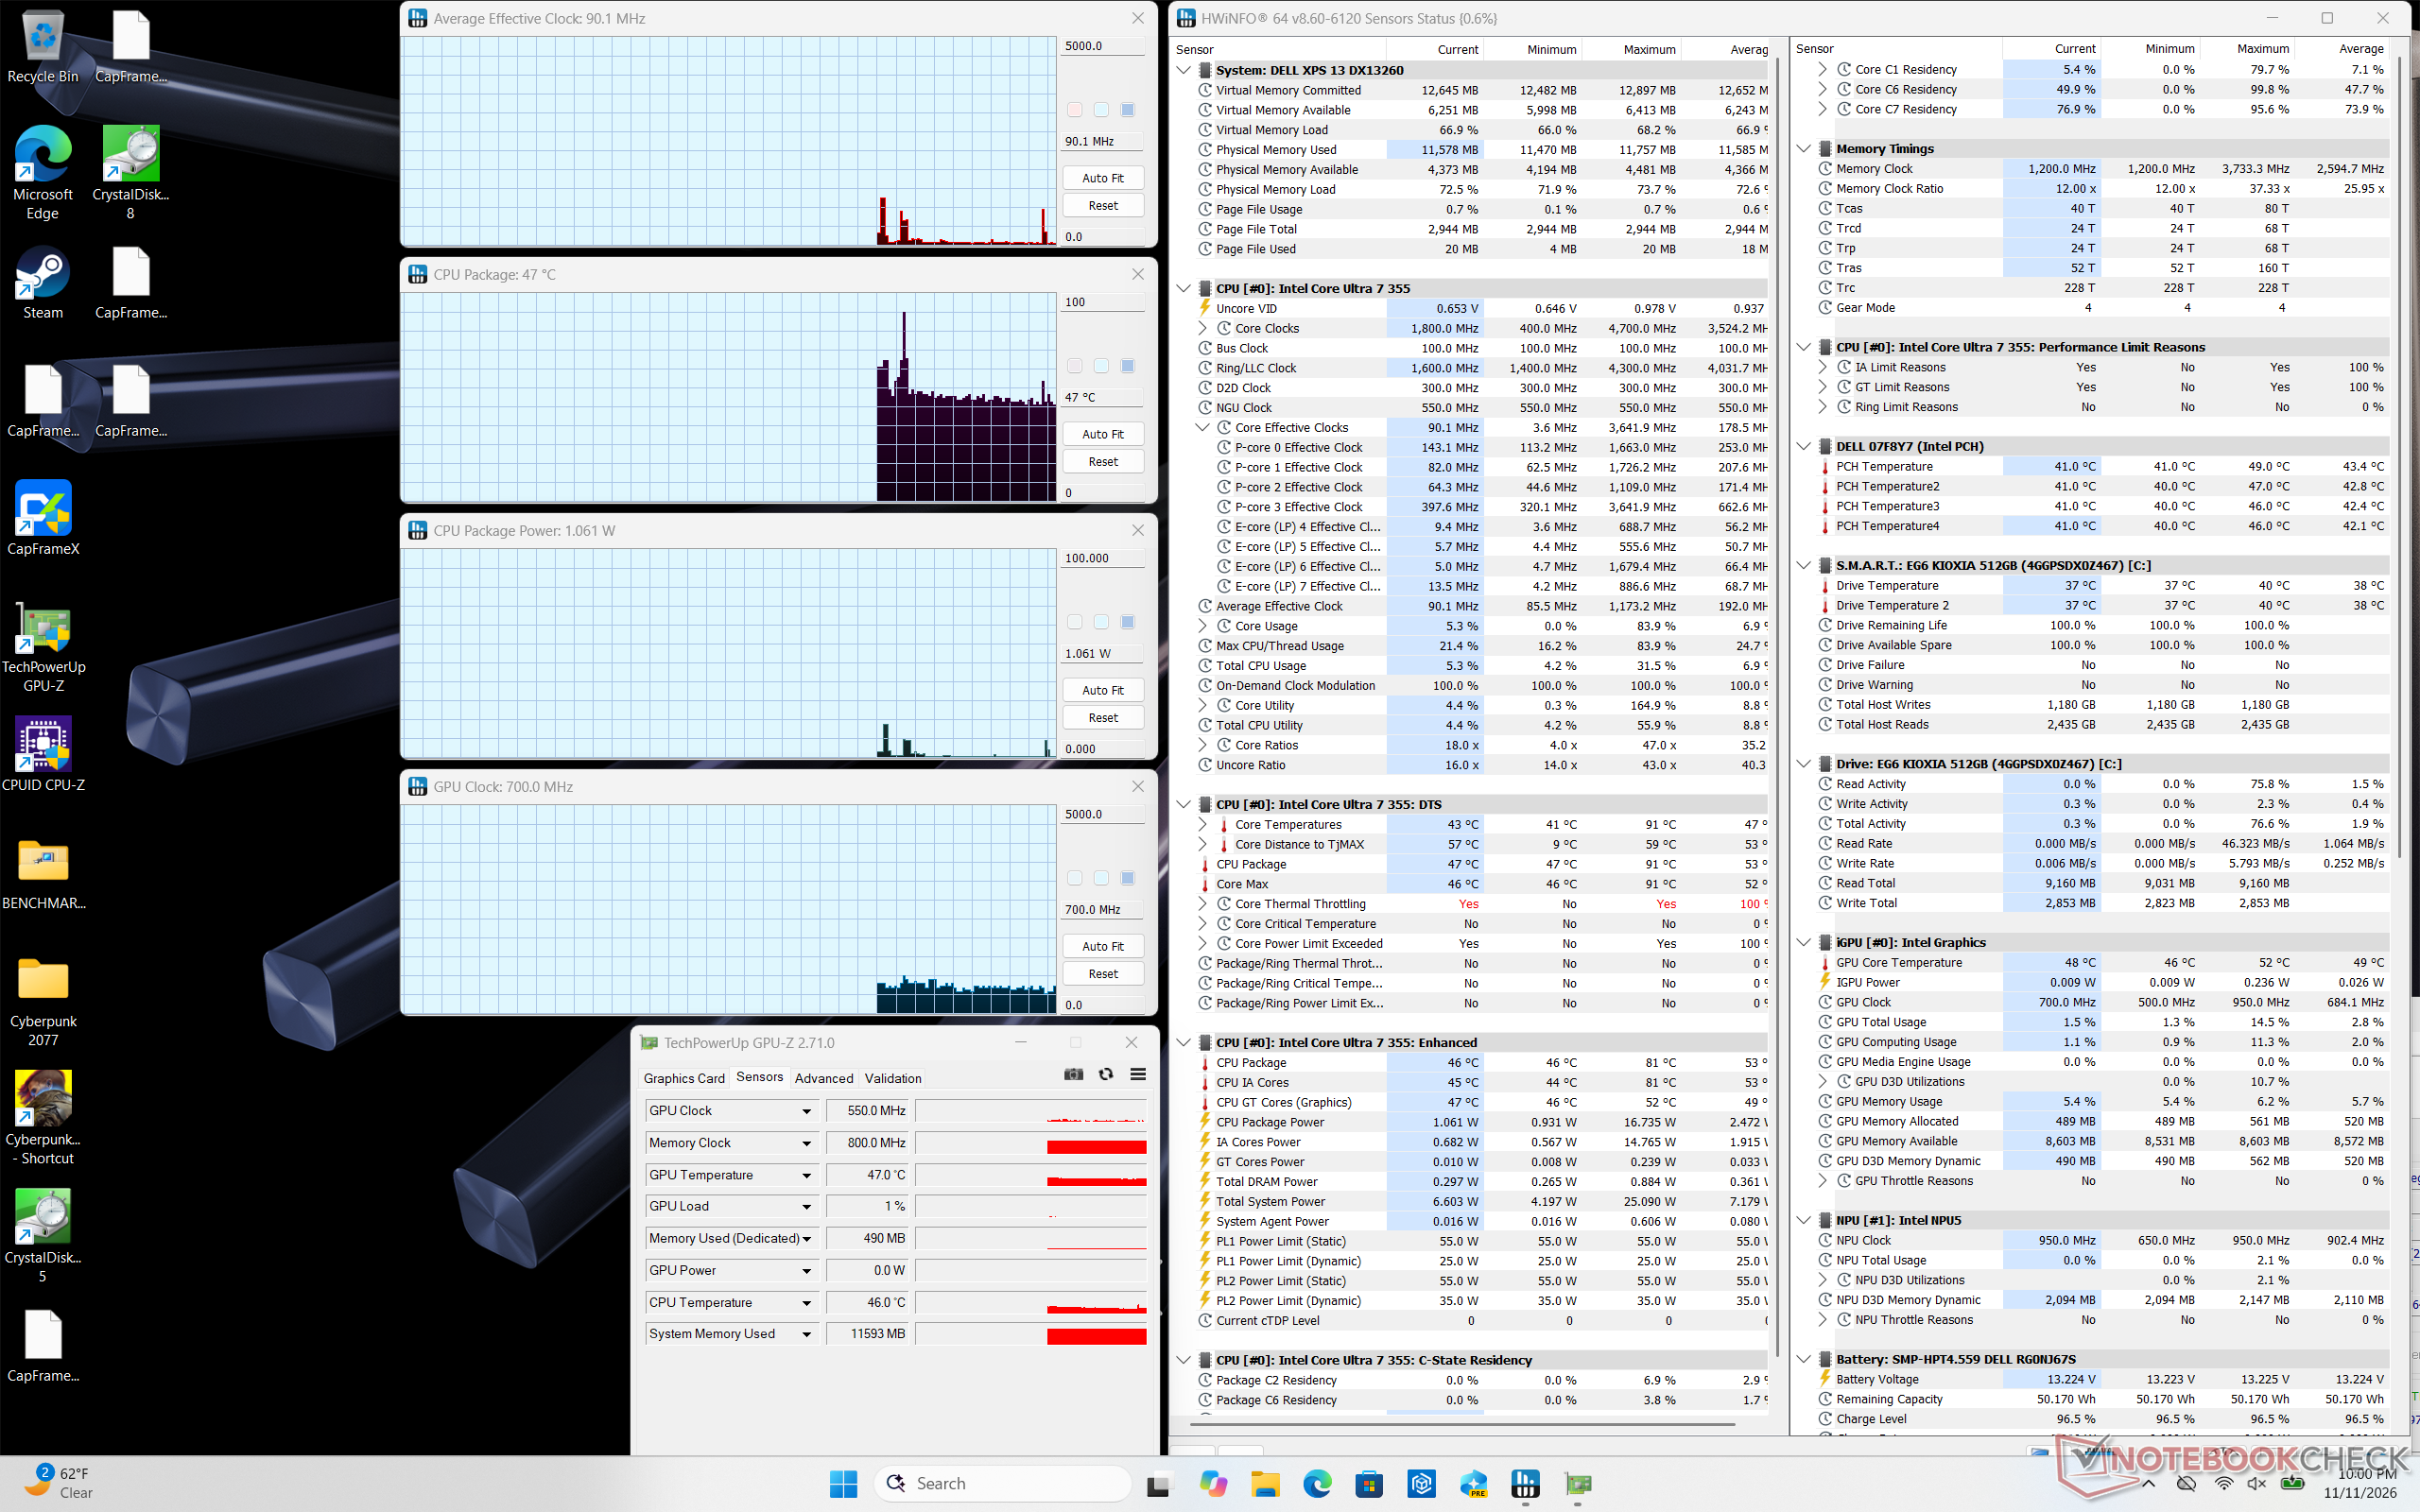
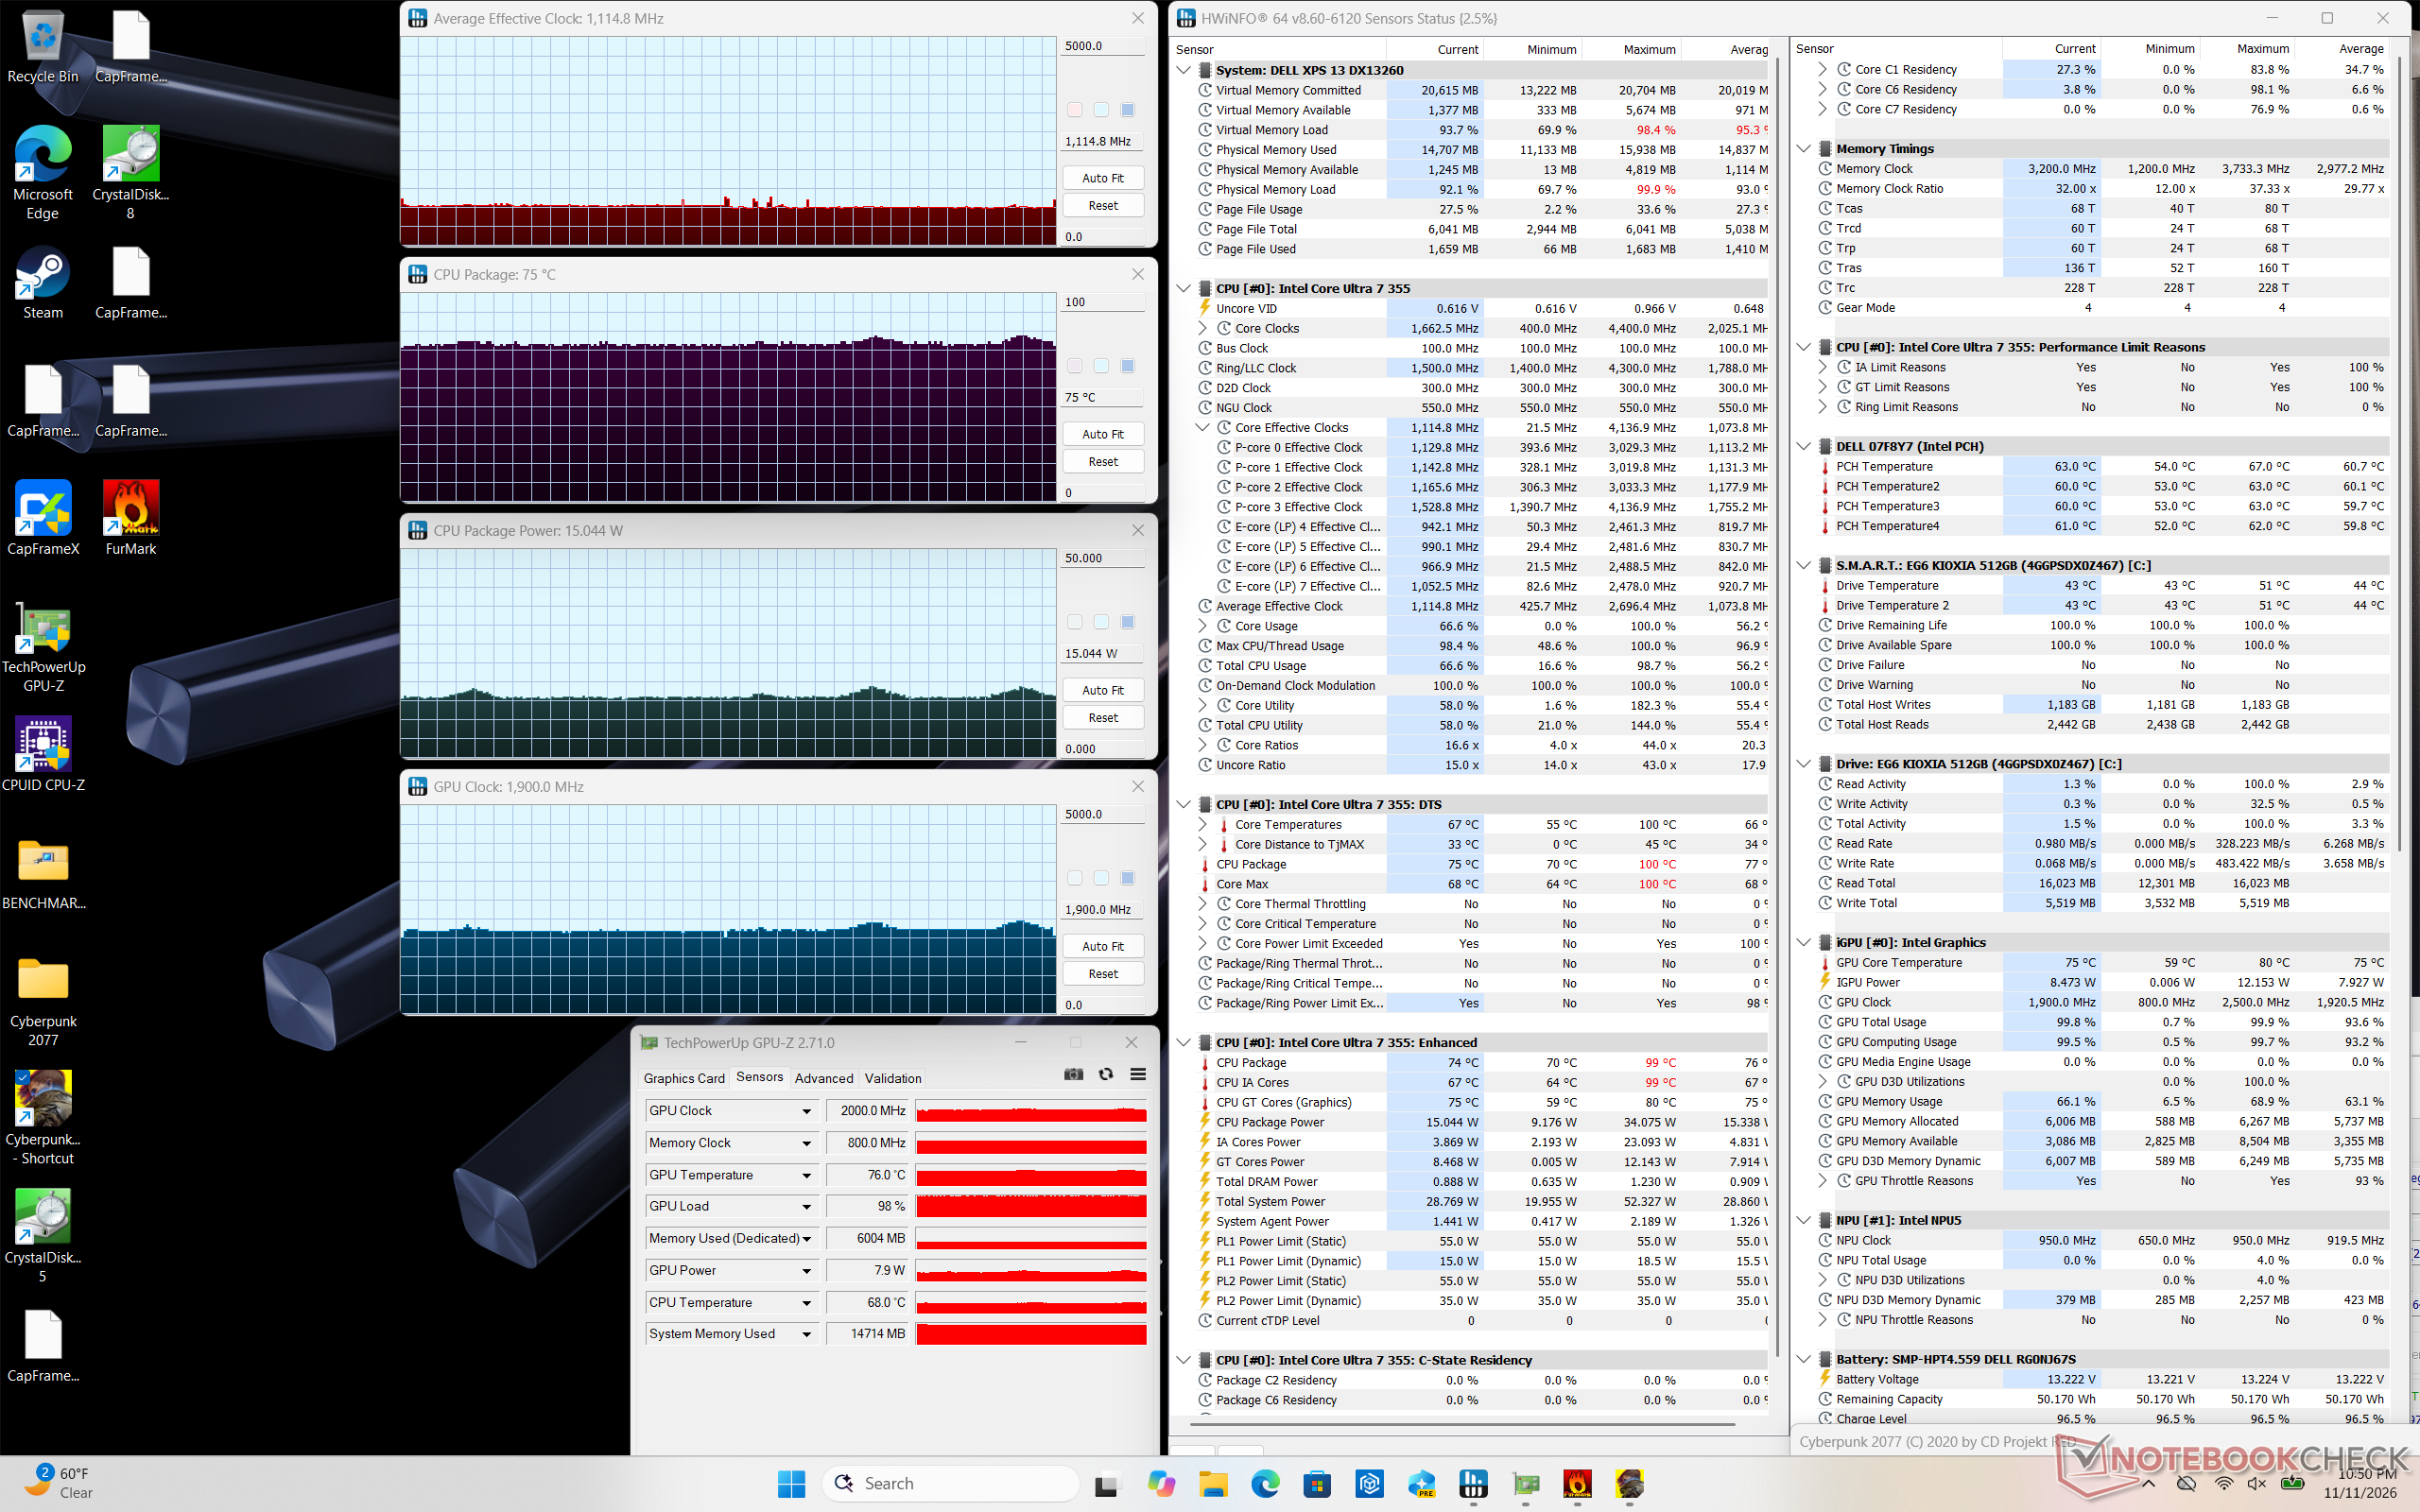
When running Prime95, the CPU would boost to 3.2 GHz, 36 W, and 100 C lasting for about 30 seconds. Thereafter, performance would drop and cycle between 2.0 to 2.3 GHz, 14 W to 19 W, and 77 C to 80 C to represent limited Turbo Boost sustainability. The sharp drop also mirrors our CineBench R15 xT loop test observations above.
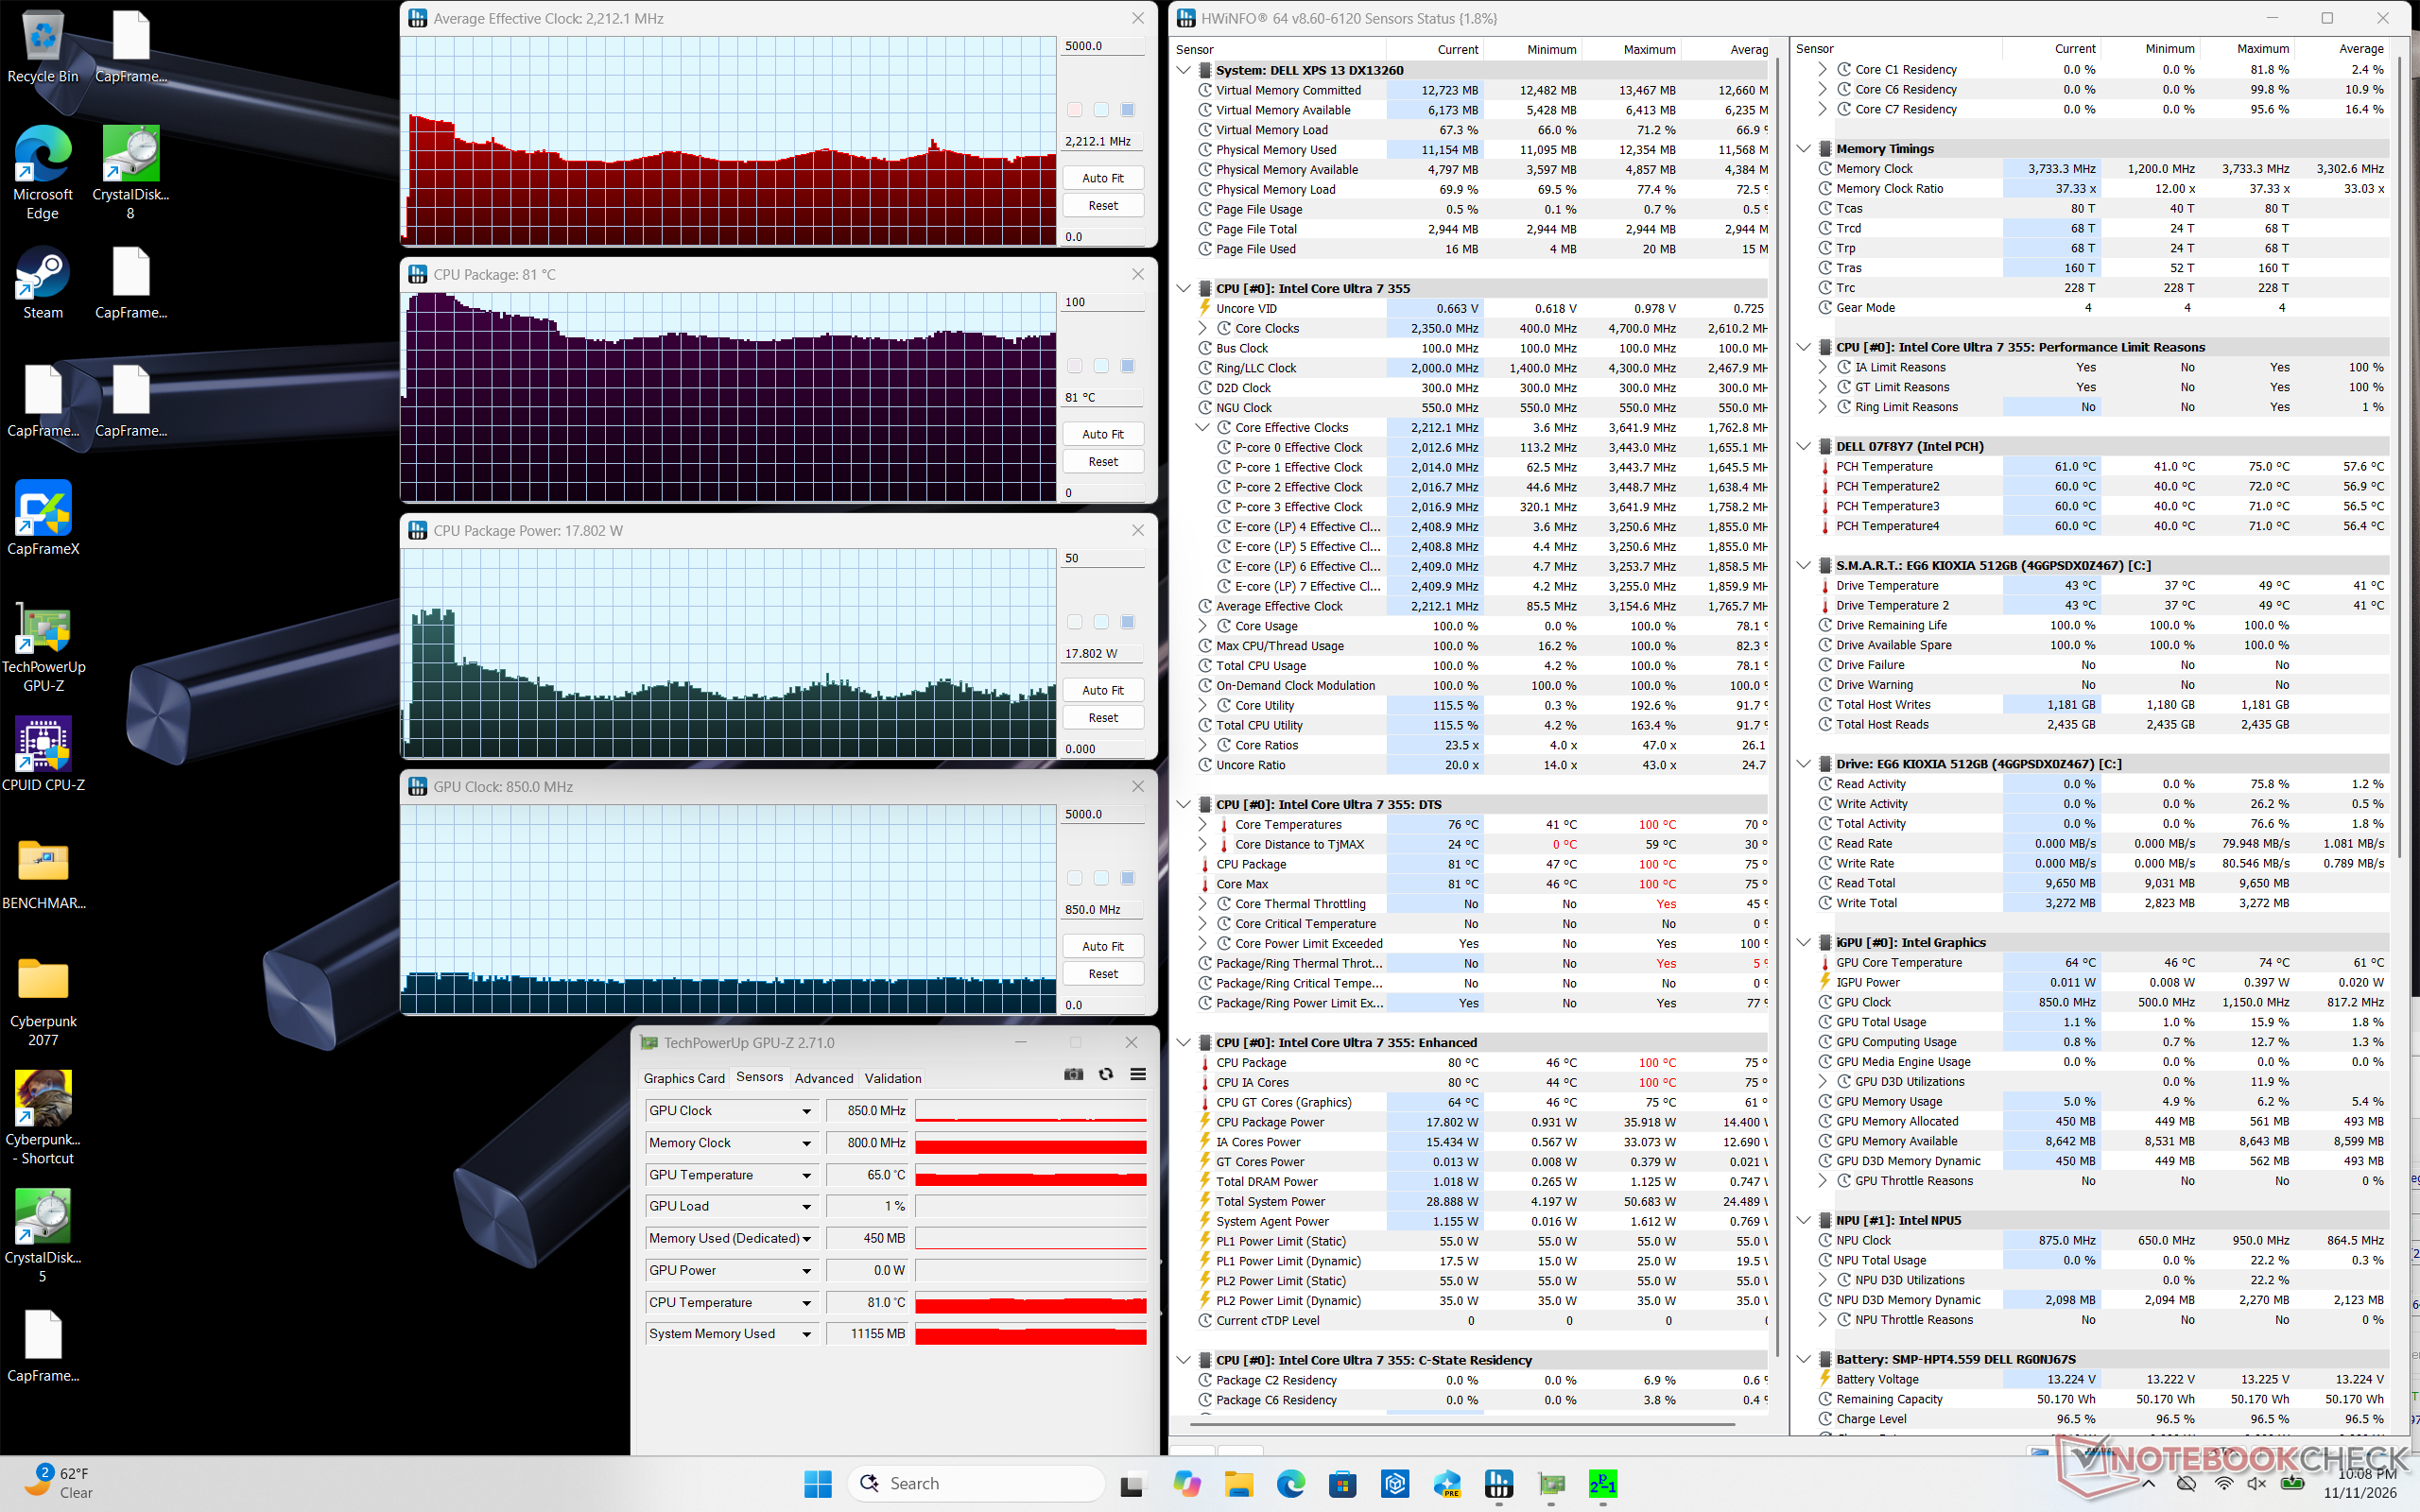
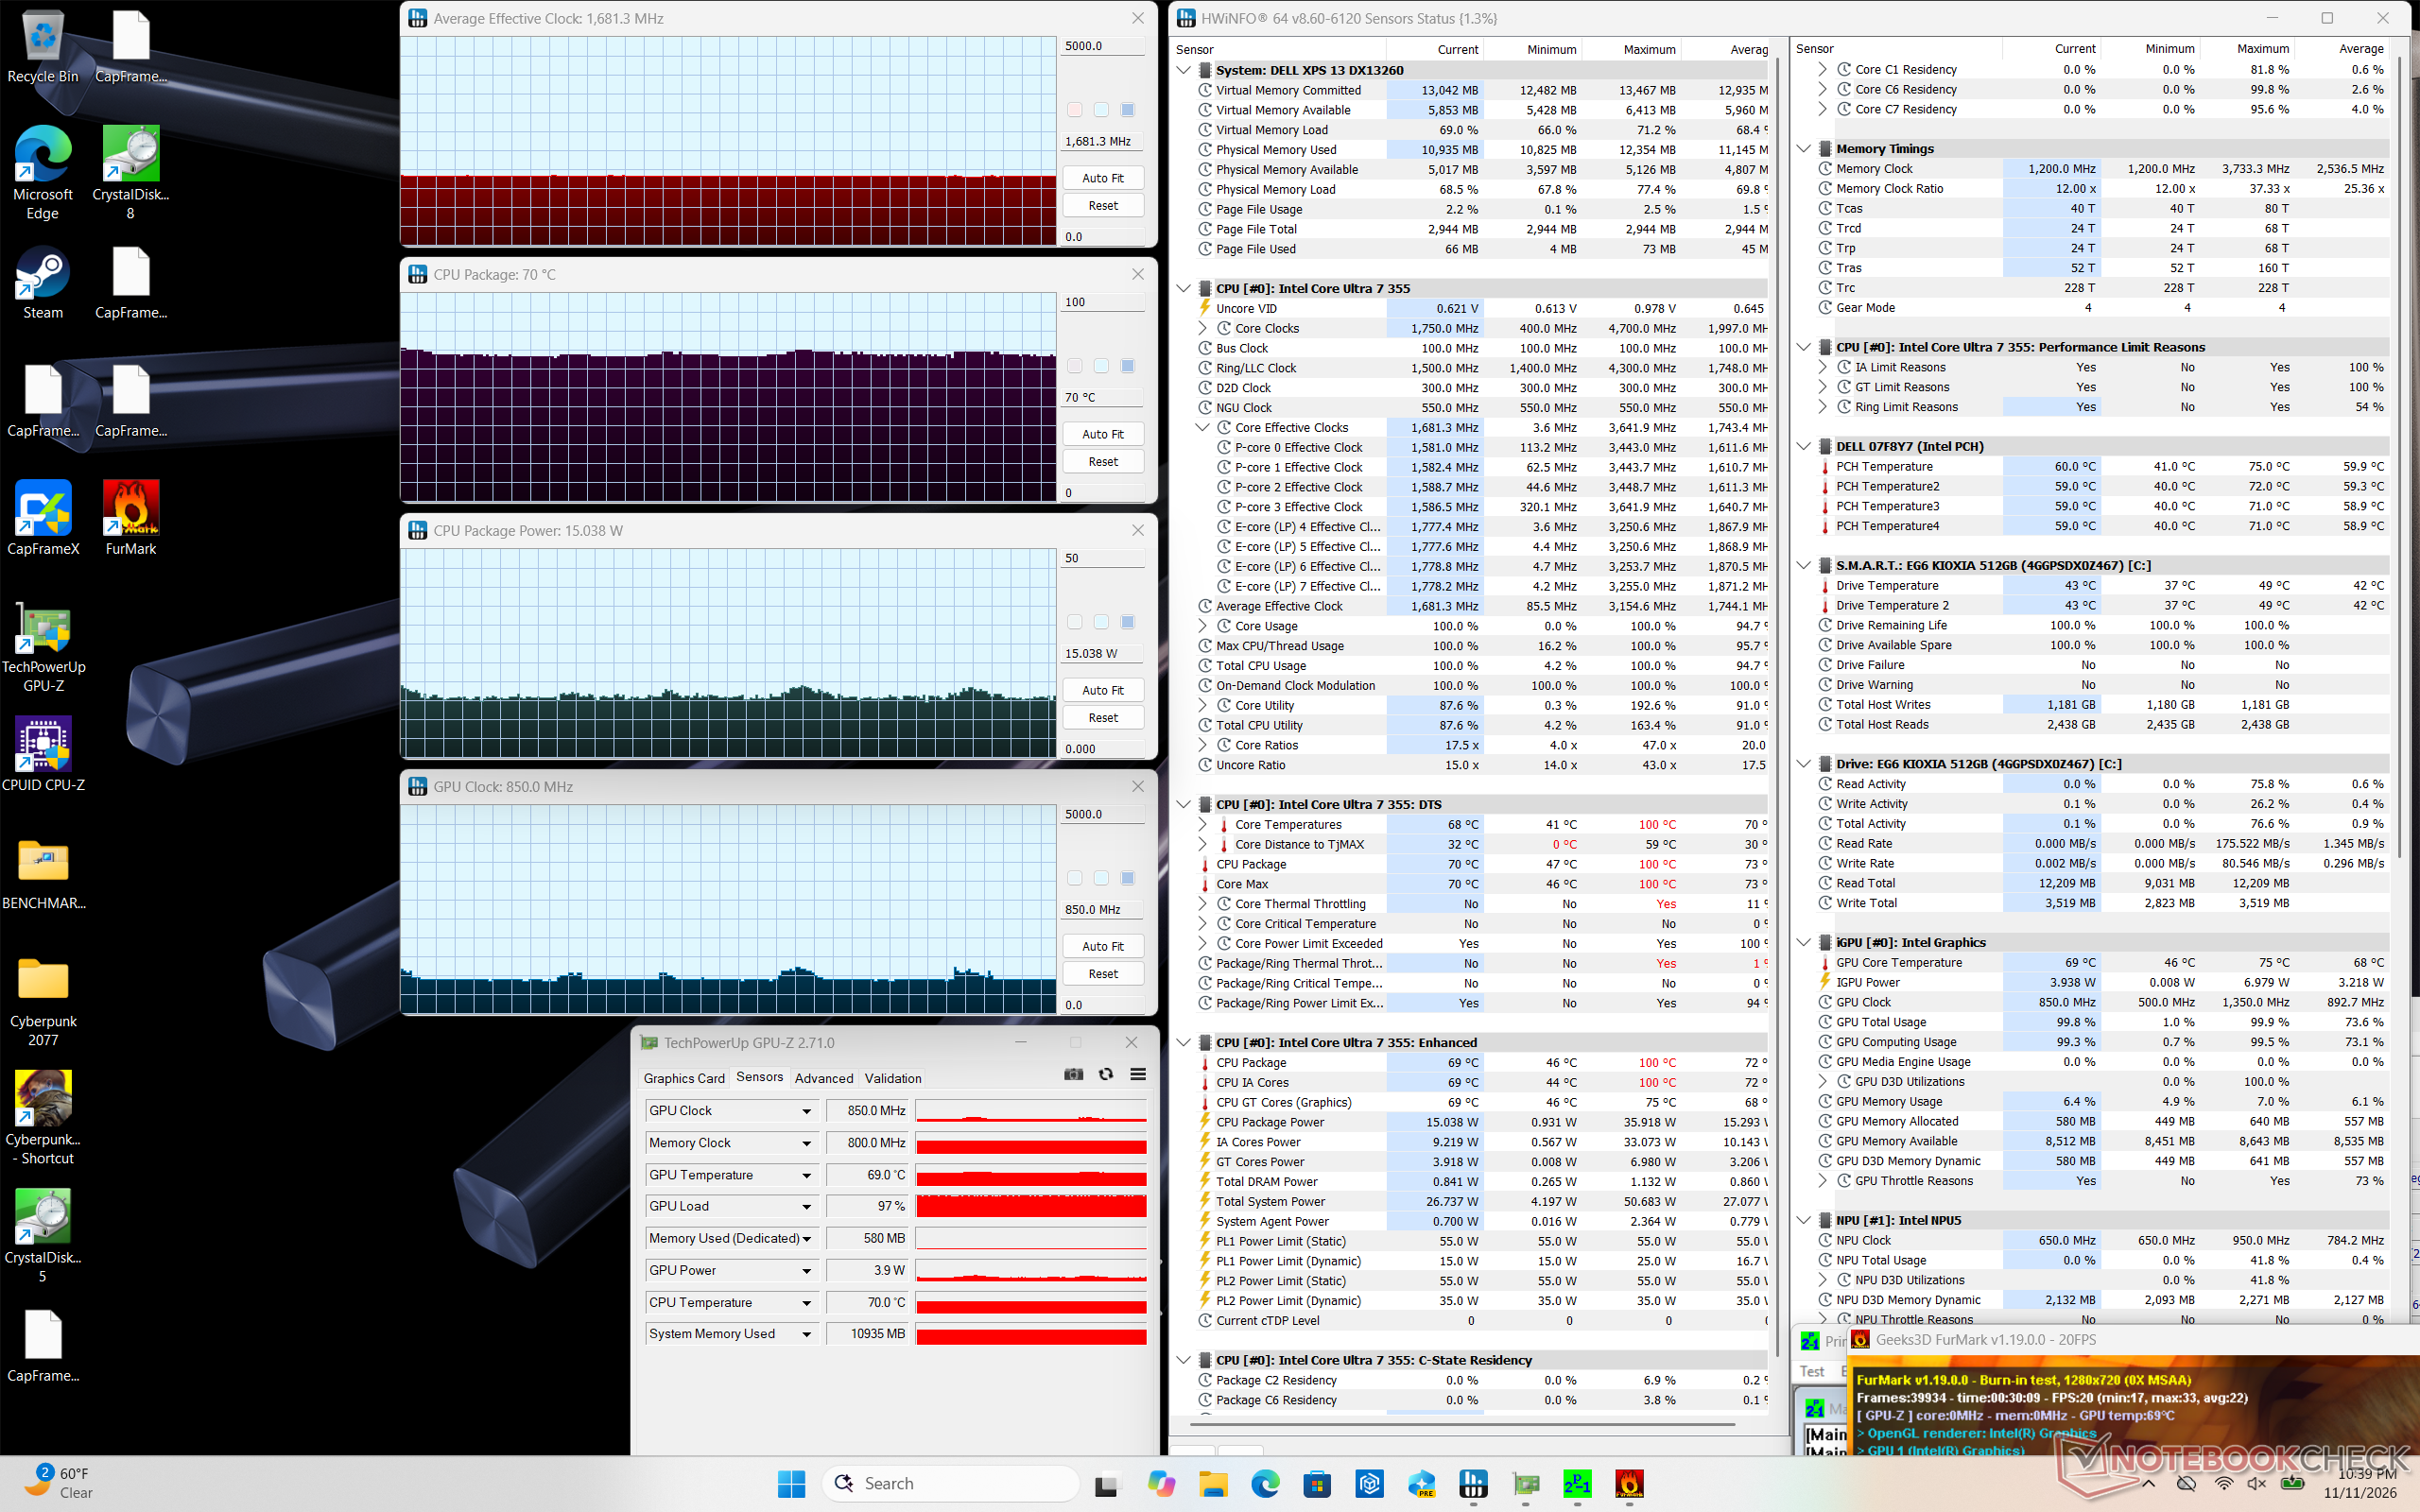
| CPU Clock (GHz) | GPU Clock (MHz) | Average CPU Temperature (°C) | |
| System Idle | -- | -- | 47 |
| Prime95 Stress | 2.0 - 2.3 | -- | 77 - 80 |
| Prime95 + FurMark Stress | 1.7 | 850 | 70 |
| Cyberpunk 2077 Stress | 1.1 | 1900 - 2200 | 75 |
Speakers
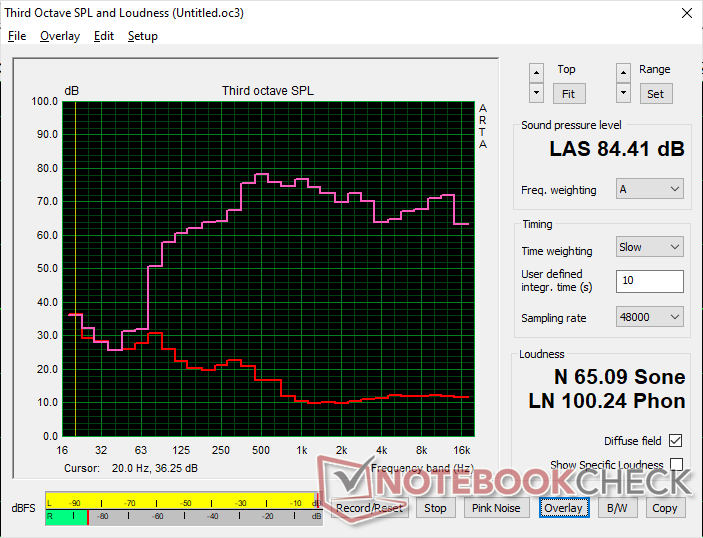
Dell XPS 13 DX13260 Core Ultra 7 audio analysis
(+) | speakers can play relatively loud (84.4 dB)
Bass 100 - 315 Hz
(±) | reduced bass - on average 7% lower than median
(+) | bass is linear (4.8% delta to prev. frequency)
Mids 400 - 2000 Hz
(±) | higher mids - on average 5% higher than median
(+) | mids are linear (5.1% delta to prev. frequency)
Highs 2 - 16 kHz
(+) | balanced highs - only 2.8% away from median
(+) | highs are linear (4.6% delta to prev. frequency)
Overall 100 - 16.000 Hz
(+) | overall sound is linear (9% difference to median)
Compared to same class
» 4% of all tested devices in this class were better, 1% similar, 94% worse
» The best had a delta of 5%, average was 18%, worst was 53%
Compared to all devices tested
» 3% of all tested devices were better, 1% similar, 96% worse
» The best had a delta of 4%, average was 23%, worst was 136%
Apple MacBook Pro 16 2021 M1 Pro audio analysis
(+) | speakers can play relatively loud (84.7 dB)
Bass 100 - 315 Hz
(+) | good bass - only 3.8% away from median
(+) | bass is linear (5.2% delta to prev. frequency)
Mids 400 - 2000 Hz
(+) | balanced mids - only 1.3% away from median
(+) | mids are linear (2.1% delta to prev. frequency)
Highs 2 - 16 kHz
(+) | balanced highs - only 1.9% away from median
(+) | highs are linear (2.7% delta to prev. frequency)
Overall 100 - 16.000 Hz
(+) | overall sound is linear (4.6% difference to median)
Compared to same class
» 0% of all tested devices in this class were better, 0% similar, 100% worse
» The best had a delta of 5%, average was 17%, worst was 45%
Compared to all devices tested
» 0% of all tested devices were better, 0% similar, 100% worse
» The best had a delta of 4%, average was 23%, worst was 136%
Energy Management
Power Consumption
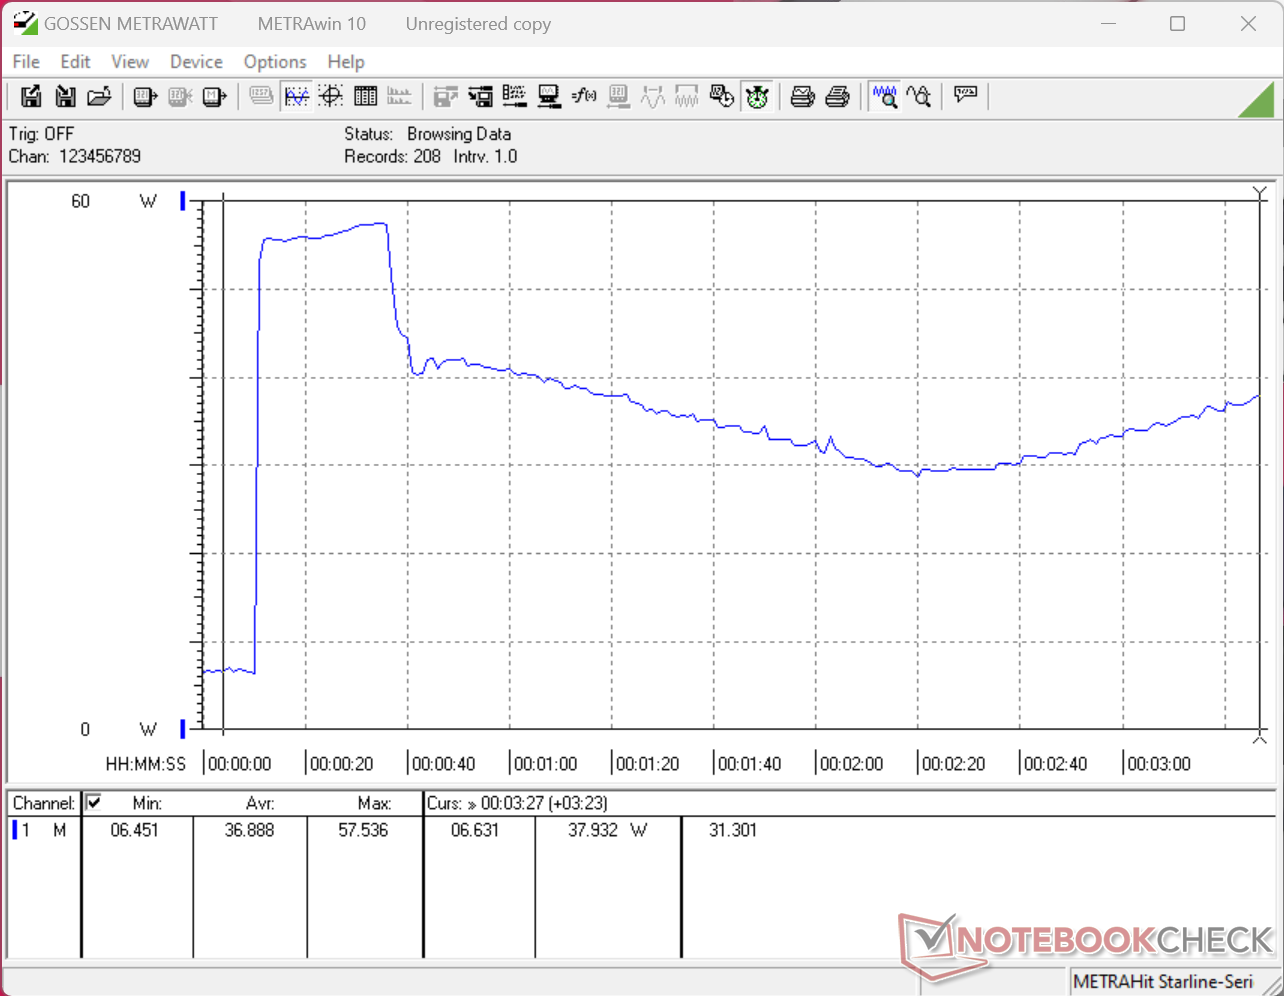
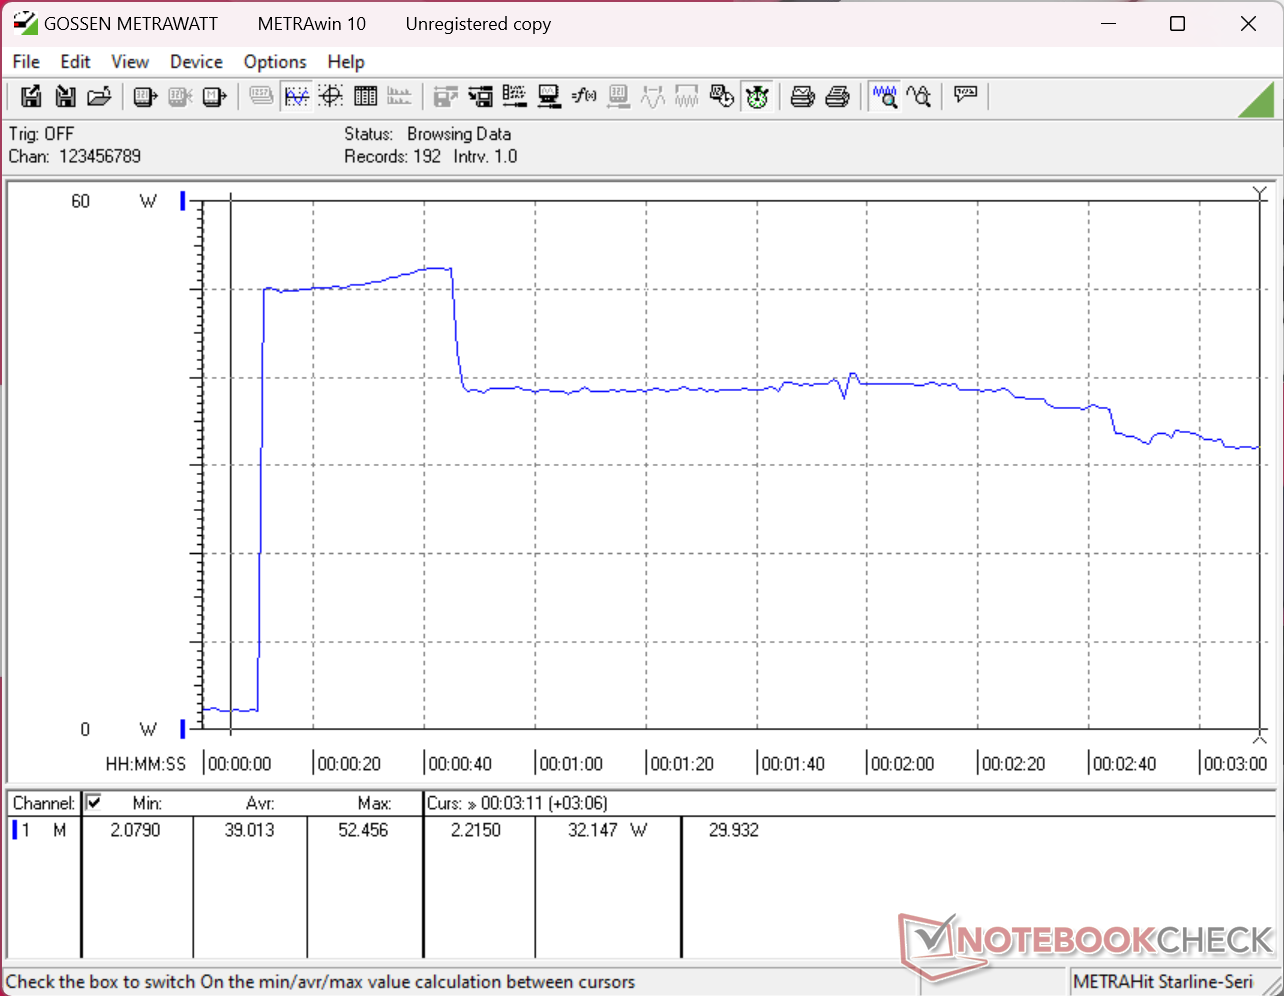
Power consumption would spike to 52 W when initiating Prime95 stress before falling to 32 W or lower just shortly thereafter as shown by the screenshot below to signify limited Turbo Boost potential. Consumption would also cycle when running Cyberpunk 2077 which aligns with the fluctuating frame rates shown above.
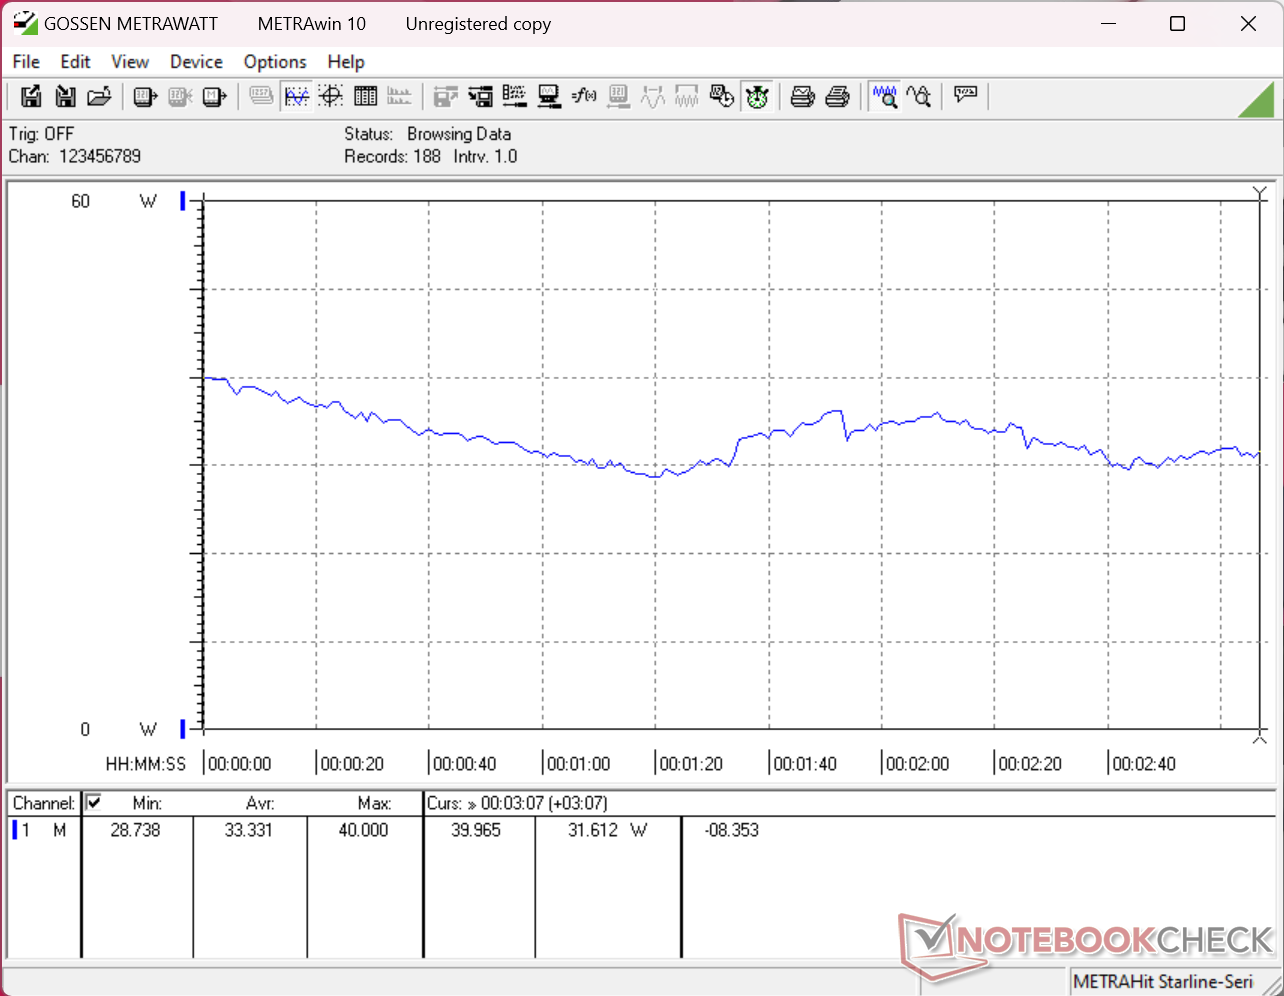
| Off / Standby | 0.03 / 0.8 Watt |
| Idle | 2 / 4.7 / 5.8 Watt |
| Load |
/ 57.6 Watt |
   
| |
Key:
min: ,
med: ,
max: Metrahit Energy | |
| Dell XPS 13 DX13260 Core Ultra 7 Ultra 7 355, Intel Graphics 4 Xe3 PTL, , IPS, 2560x1600, 13.4" | Dell XPS 13 DX13260 Core 5 320, Intel Graphics 2 Xe3 WCL, Kioxia BG7 512 GB, IPS, 2560x1600, 13.4" | Microsoft Surface Laptop 13 2026 SD X2 Plus X2P-42-100, Adreno X2-45, Kioxia THGJFJT2T85BAT01, IPS, 1920x1280, 13" | Framework Laptop 13 Pro Ultra X7 358H, Arc B390 Panther Lake iGPU, WD PC SN7100S SDFPMSL-1T00-1101, IPS, 2880x1920, 13.5" | MSI Prestige 13 AI+ A3MG Ultra 9 386H, Intel Graphics 4 Xe3 PTL, Micron 2500 1TB MTFDKBA1T0QGN, OLED, 2880x1800, 13.3" | HP OmniBook 7 Aero 13-bg1077nr Ryzen AI 7 350, Radeon 860M, SK hynix PC801 HFS001TEJ9X101N, IPS, 1920x1200, 13.3" | |
|---|---|---|---|---|---|---|
| Power Consumption | 0% | 4% | -50% | -17% | -37% | |
| Idle Minimum * (Watt) | 2 | 1.9 5% | 2.1 -5% | 2.3 -15% | 3.5 -75% | 3.2 -60% |
| Idle Average * (Watt) | 4.7 | 5.4 -15% | 6 -28% | 8.4 -79% | 4 15% | 6.8 -45% |
| Idle Maximum * (Watt) | 5.8 | 5.8 -0% | 6.6 -14% | 8.5 -47% | 6.4 -10% | 7 -21% |
| Cyberpunk 2077 ultra external monitor * (Watt) | 31 | 30.1 3% | 22 29% | 47.4 -53% | 41.6 -34% | |
| Cyberpunk 2077 ultra * (Watt) | 33.3 | 33.6 -1% | 21.9 34% | 52.9 -59% | 41 -23% | 52.8 -59% |
| Load Maximum * (Watt) | 57.6 | 52 10% | 54.8 5% | 84.2 -46% | 54 6% | 59.9 -4% |
| Load Average * (Watt) | 20.6 | 14.7 | 32.1 | 44 | 50.3 |
* ... smaller is better
Power Consumption Cyberpunk / Stress Test
Power Consumption external Monitor
Battery Life
| Dell XPS 13 DX13260 Core Ultra 7 Ultra 7 355, Intel Graphics 4 Xe3 PTL, 52 Wh | Dell XPS 13 DX13260 Core 5 320, Intel Graphics 2 Xe3 WCL, 52 Wh | Microsoft Surface Laptop 13 2026 SD X2 Plus X2P-42-100, Adreno X2-45, 50 Wh | Framework Laptop 13 Pro Ultra X7 358H, Arc B390 Panther Lake iGPU, 74.5 Wh | MSI Prestige 13 AI+ A3MG Ultra 9 386H, Intel Graphics 4 Xe3 PTL, 53.8 Wh | HP OmniBook 7 Aero 13-bg1077nr Ryzen AI 7 350, Radeon 860M, 43 Wh | |
|---|---|---|---|---|---|---|
| Battery runtime | ||||||
| WiFi v1.3 (h) | 15.3 | 18.4 20% | 18.8 23% | 19.3 26% | 12 -22% | 10.4 -32% |
Notebookcheck Rating
Strong design and touchscreen with great specifications on paper, but steep Turbo Boost limitations prevent the Core Ultra 7 from outshining the Core 5 320.
Dell XPS 13 DX13260 Core Ultra 7
- 11/18/2026 v8
Allen Ngo
 Total Sustainability Score:
Potential Competitors in Comparison
Image | Model / Review | Price | Weight | Height | Display |
|---|---|---|---|---|---|
1. 85.5%  | Dell XPS 13 DX13260 Core Ultra 7 Intel Core Ultra 7 355 ⎘ Intel Graphics 4 Xe3 Panther Lake iGPU ⎘ 16 GB Memory | List Price: 1800 USD | 1.1 kg | 12.7 mm | 13.40" 2560x1600 225 PPI IPS |
2. 85.7%  | Dell XPS 13 DX13260 Intel Core 5 320 ⎘ Intel Graphics 2 Xe3 Wildcat Lake iGPU ⎘ 8 GB Memory, 512 GB SSD | List Price: 700 USD | 1.1 kg | 12.7 mm | 13.40" 2560x1600 225 PPI IPS |
3. 86.3%  | Microsoft Surface Laptop 13 2026 Qualcomm Snapdragon X2 Plus X2P-42-100 ⎘ Qualcomm SD X2 Adreno X2-45 ⎘ 16 GB Memory, 512 GB UFS 4.x | List Price: 1439€ | 1.2 kg | 15.6 mm | 13.00" 1920x1280 178 PPI IPS |
4. 87.9%  | Framework Laptop 13 Pro Intel Core Ultra X7 358H ⎘ Intel Arc B390 12 Xe3 Panther Lake iGPU ⎘ 32 GB Memory, 1024 GB SSD | Amazon: 1. $1,199.99 Microsoft Surface Pro (2026)... 2. $1,199.00 GEEKOM GeekBook X16 Pro Lapt... 3. $4,199.00 Dell Pro Rugged 13 RA13250 L... List Price: 3000 USD | 1.4 kg | 15.85 mm | 13.50" 2880x1920 256 PPI IPS |
5. 84%  | MSI Prestige 13 AI+ A3MG Intel Core Ultra 9 386H ⎘ Intel Graphics 4 Xe3 Panther Lake iGPU ⎘ 32 GB Memory, 1024 GB SSD | List Price: 1600 EUR | 888 g | 15.9 mm | 13.30" 2880x1800 255 PPI OLED |
6. 86.9%  | HP OmniBook 7 Aero 13-bg1077nr AMD Ryzen AI 7 350 ⎘ AMD Radeon 860M ⎘ 32 GB Memory, 1024 GB SSD | List Price: 1250 USD | 1 kg | 17.6 mm | 13.30" 1920x1200 170 PPI IPS |
Transparency
The selection of devices to be reviewed is made by our editorial team. The test sample was provided to the author as a loan by the manufacturer or retailer for the purpose of this review. The lender had no influence on this review, nor did the manufacturer receive a copy of this review before publication. There was no obligation to publish this review. As an independent media company, Notebookcheck is not subjected to the authority of manufacturers, retailers or publishers.
This is how Notebookcheck is testing
Every year, Notebookcheck independently reviews hundreds of laptops and smartphones using standardized procedures to ensure that all results are comparable. We have continuously developed our test methods for around 20 years and set industry standards in the process. In our test labs, high-quality measuring equipment is utilized by experienced technicians and editors. These tests involve a multi-stage validation process. Our complex rating system is based on hundreds of well-founded measurements and benchmarks, which maintains objectivity. Further information on our test methods can be found here.
 Add as a preferred source on Google


