AMD Ryzen 5 4500U vs AMD Ryzen 5 5600H vs AMD Ryzen 7 4700U
AMD Ryzen 5 4500U ► remove from comparison
The AMD Ryzen 5 4500U is an upper mid-range, hexa-core processor of the Renoir product family . The APU was unveiled in H1 2020; it is designed for use in thinner, lighter laptops. Its six Zen 2 CPU cores run at 2.3 GHz (base clock speed) to 4.0 GHz (highest Boost frequency possible). Ryzen 5 4500U features the Vega 6 iGPU.
The sole advantage of Ryzen 5 4600U over Ryzen 5 4500U is the thread-doubling SMT technology support. The former has SMT while the latter does not.
Architecture
Zen 2 is a resounding success, delivering massive improvements over outgoing Zen Plus-based processors. Ryzen 5 4500U is manufactured on the cutting-edge 7 nm TSMC process; it is compatible with dual-channel DDR4-3200 or quad-channel LPDDR4-4266 memory. This processor has 8 MB of Level 3 cache.
While the APU uses Zen 2 cores just like the desktop-grade Ryzen 3000-series processors do, Ryzen 7 3800XT included, it does does not have PCI-Express 4.0 support. It does feature several PCI-Express 3.0 lanes for connecting discrete graphics cards, SSDs and other devices. Four PCI-Express 3.0 lanes allow for read/write rates of up to 3.9 GB/s provided a suitably fast NVMe SSD is used.
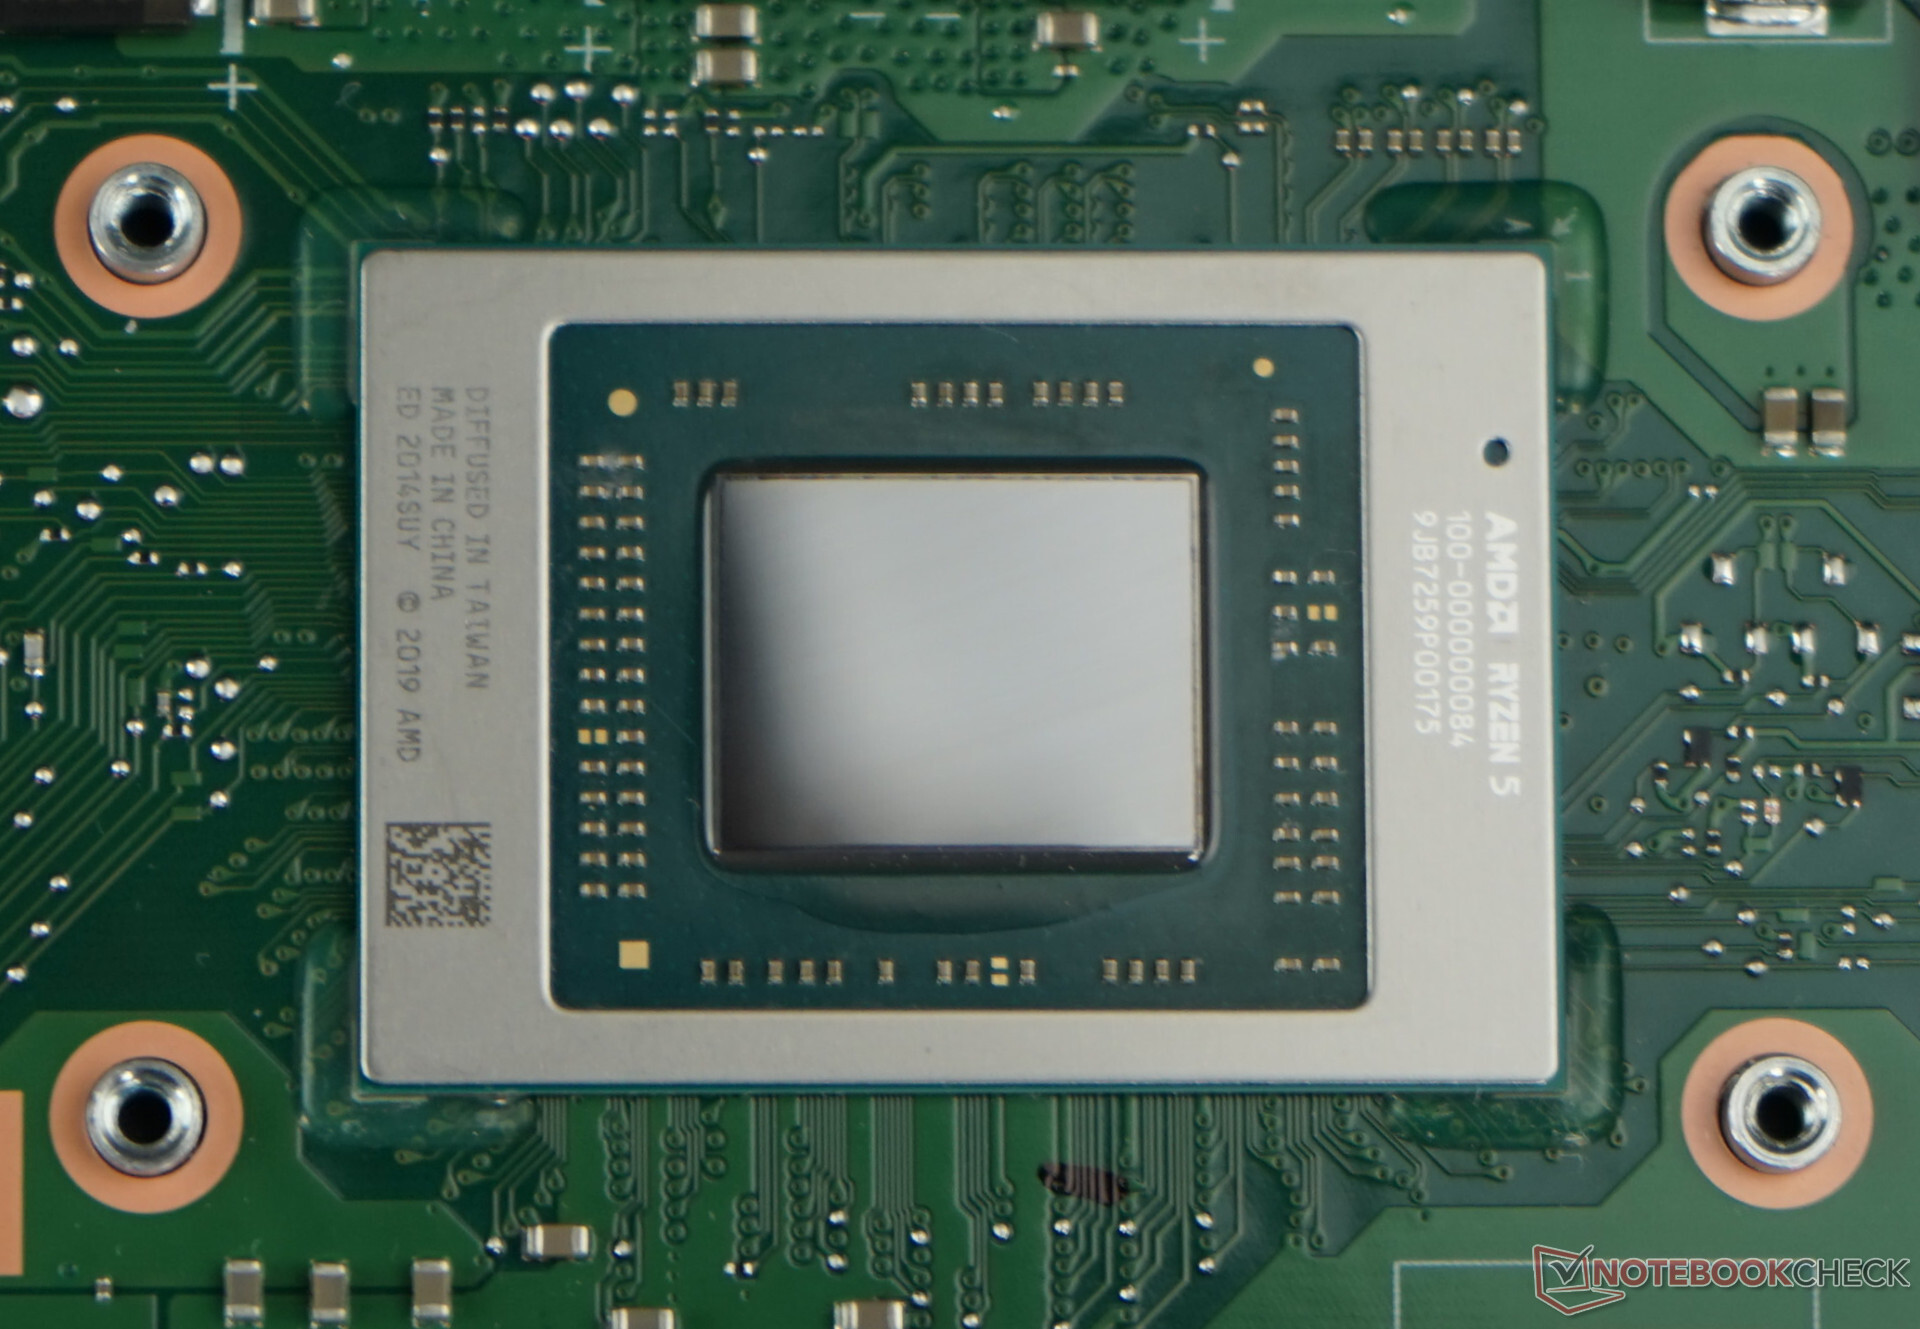
Ryzen 5 4500U gets soldered permanently on to the motherboard (FP6 socket interface) and is anything but user-replaceable.
Performance
The average Ryzen 5 4500U in our database nearly matches the Core i5-11300H , the Core i5-11320H and also the AMD Ryzen 3 5300U as far as multi-thread benchmark scores are concerned - thus delivering an undeniably impressive performance jump over the outgoing Ryzen 5 3500U .
Thanks to its decent cooling solution and a long-term power limit of 38 W, the Xiaomi RedmiBook 16 R5 is among the fastest systems powered by the R5 4500U that we know of. It can be about 20% faster in CPU-bound workloads than the slowest system built around the same chip in our database, as of August 2023.
Graphics
Just like its name suggests, the Radeon RX Vega 6 graphics adapter has 6 Compute Units (6 x 64 = 384 unified shaders). In the case of Ryzen 5 4500U, this graphics adapter runs at up to 1,500 MHz. The iGPU definitely supports UHD 2160p monitors at 60 Hz; it will have no trouble HW-decoding HEVC, AVC, VP9, MPEG-2 and other widespread video codecs. AV1 is not supported though; such a video will have to be software-decoded for much lower energy efficiency.
Vega 6 will let you play many titles of 2020 and 2021 as long as you stick to low settings and low resolutions. F1 2021 Outriders
Power consumption
This Ryzen chip is very energy efficient, as of mid 2022, thanks to the cutting-edge 7 nm TSMC manufacturing process and the mature Zen 2 architecture.
The Ryzen 5 4500U has a default TDP (also known as the long-term Power Limit) of 15 W that can be changed to anything between 10 W and 25 W by laptop makers if required, a right they use more often than not. Clock speeds and performance will change accordingly as a result. By going for the lowest value, it will be possible to use the APU as the heart of a passively cooled tablet, laptop, mini-PC.
AMD Ryzen 5 5600H ► remove from comparison
The AMD Ryzen 5 5600H is a processor for big (gaming) laptops based on the Cezanne generation. The R5 5600H has six of the eight cores based on the Zen 3 microarchitecture. They are clocked at 3.3 GHz (guaranteed base clock) to 4.2 GHz (Turbo) and support SMT for a total of 12 threads. The chip is manufactured on the modern 7 nm TSMC process.
The new Zen 3 microarchitecture offers a significantly higher IPC (instructions per clock) compared to Zen 2. For desktop processors AMD claims 19 percent on average and in applications reviews showed around 12% gains at the same clock speed.
In addition to the six CPU cores, the APU also integrates a Radeon RX Vega 7 integrated graphics processor with 7 CUs running at up to 1800 MHz. The dual channel memory controller supports DDR4-3200 and energy efficient LPDDR4-4266 RAM. Furthermore, 16 MB of L3 cache can be found on the chip.
Performance
The average 5600H in our database is in the same league as the Ryzen 5 6600HS and the Core i7-1260P , as far as multi-thread benchmark scores are concerned.
Thanks to its decent cooling solution and a long-term CPU power limit of 45 W, the Lenovo Legion 5 17 is among the fastest laptops powered by the 5600H that we know of. It can be roughly 30% faster in CPU-bound workloads than the slowest system featuring the same chip in our database, as of August 2023.
Power consumption
This Ryzen 5 series chip has a default TDP (also known as the long-term power limit) of 45 W, a value that laptop makers are allowed to change to anything between 35 W and 54 W with clock speed and performance changing accordingly as a result. A high-performance cooling solution is a must for a CPU like this.
The hexa-core APU is built with the 7 nm TSMC process for decent, as of late 2022, energy efficiency.
AMD Ryzen 7 4700U ► remove from comparison
The AMD Ryzen 7 4700U is a processor for thin and light laptops based on the Renoir architecture . The 4700U integrates all eight cores based on the Zen 2 microarchitecture. They are clocked at 2 (guaranteed base clock) to 4.1 GHz (Turbo). There is no support for the thread-doubling SMT tech. The chip is manufactured on the modern 7 nm TSMC process and partly thanks to it AMD advertises a 2x improved performance per Watt for the Renoir chips. Compared to the faster R7 4800U , the 4700U offers slightly lower clock speeds and no support for SMT / Hyperthreading.
In addition to the eight CPU cores, the APU also integrates a Radeon RX Vega 7 integrated graphics card with 7 CUs and up to 1600 MHz. The dual channel memory controller supports DDR4-3200 and energy efficient LPDDR4-4266 RAM. Furthermore, 8 MB level 3 cache can be found on the chip. See our hub page on the Renoir Processors for more information.
Performance
The average 4700U in our database proves to be a rather competent little processor. It trades blows with the much more power-hungry Intel Core i7-10750H , as far as multi-thread benchmark scores are concerned. While it fails to get far enough away from the more affordable Ryzen 5 4600U , this Ryzen 7 is still a good CPU for most tasks.
Your mileage may vary depending on how competent the cooling solution of your laptop is and how high the CPU power limits are.
Power consumption
The Ryzen 7 4700U is a 15 W chip. However, laptop makers are allowed to change that value to anything between 10 W and 25 W, with clock speeds and long-term performance changing accordingly as a result. By going for the lowest value, it is possible to build a passively cooled system around the APU.
The fairly modern 7 nm TSMC process this Ryzen is manufactured on makes for above average, as of mid 2022, energy efficiency.
Model AMD Ryzen 5 4500U AMD Ryzen 5 5600H AMD Ryzen 7 4700U Series AMD Renoir (Ryzen 4000 APU) AMD Cezanne (Zen 3, Ryzen 5000) AMD Renoir (Ryzen 4000 APU) Codename Renoir-U (Zen 2) Cezanne-H (Zen 3) Renoir-U (Zen 2) Series: Renoir (Ryzen 4000 APU) Renoir-U (Zen 2) Clock 2300 - 4000 MHz 3300 - 4200 MHz 2000 - 4100 MHz L1 Cache 384 KB 384 KB 512 KB L2 Cache 3 MB 3 MB 4 MB L3 Cache 8 MB 16 MB 8 MB Cores / Threads 6 / 6 6 / 12 8 / 8 TDP 15 Watt 45 Watt 15 Watt Technology 7 nm 7 nm 7 nm max. Temp. 105 °C 105 °C Socket FP6 FP6 FP6 Features DDR4-3200/LPDDR4-4266 RAM, PCIe 3, MMX, SSE, SSE2, SSE3, SSSE3, SSE4A, SSE4.1, SSE4.2, AVX, AVX2, BMI2, ABM, FMA, ADX, SMEP, SMAP, CPB, AES-NI, RDRAND, RDSEED, SHA, SME DDR4-3200/LPDDR4-4266 RAM, PCIe 3, MMX, SSE, SSE2, SSE3, SSSE3, SSE4A, SSE4.1, SSE4.2, AVX, AVX2, BMI2, ABM, FMA, ADX, SMEP, SMAP, SMT, CPB, AES-NI, RDRAND, RDSEED, SHA, SME DDR4-3200/LPDDR4-4266 RAM, PCIe 3, MMX, SSE, SSE2, SSE3, SSSE3, SSE4A, SSE4.1, SSE4.2, AVX, AVX2, BMI2, ABM, FMA, ADX, SMEP, SMAP, CPB, AES-NI, RDRAND, RDSEED, SHA, SME iGPU AMD Radeon RX Vega 6 (Ryzen 4000/5000) ( - 1500 MHz)AMD Radeon RX Vega 7 ( - 1800 MHz)AMD Radeon RX Vega 7 ( - 1600 MHz)Architecture x86 x86 x86 Announced Manufacturer www.amd.com www.amd.com
Benchmarks Performance Rating - CB R15 + R20 + 7-Zip + X265 + Blender + 3DM11 CPU - R5 4500U
30.5 pt (42%)
...
...
max:
Performance Rating - CB R15 + R20 + 7-Zip + X265 + Blender + 3DM11 CPU - R5 5600H
37 pt (51%)
...
Intel Core i5-11500B
...
max:
Performance Rating - CB R15 + R20 + 7-Zip + X265 + Blender + 3DM11 CPU - R7 4700U
31.8 pt (44%)
...
...
max:
Cinebench 2024 - CB24 CPU Single Core
80 Points (56%)
Cinebench 2024 - CB24 CPU Multi Core
439 Points (8%)
68 Points (1%)
Model CPU GPU RAM Value Acer Swift 3 SF314-42-R9YN R7 4700U 29.8 W / 18 W Vega 7 1600 / 1600 MHz8 GB 68
CPU TDP 18 W TDP 40 W 15% 100%
Cinebench R23 - Cinebench R23 Multi Core
5920 Points (5%)
min: 7945 avg: 9466 median: 9564 (9%) max: 10416 Points
CPU TDP ? TDP 25 W TDP 31 W TDP 35 W TDP 40 W TDP 41 W TDP 45 W TDP 54 W TDP 94 W 99% 83% 59% 79% 95% 93% 100% 94% 91%
min: 6208 avg: 7102 median: 7378 (7%) max: 7719 Points
CPU TDP ? TDP 18 W TDP 20 W TDP 25 W TDP 31 W TDP 35 W TDP 37 W TDP 40 W TDP 41 W TDP 45 W TDP 54 W TDP 94 W 99% 62% 74% 83% 59% 79% 77% 95% 93% 100% 94% 91%
Cinebench R23 - Cinebench R23 Single Core
1152 Points (49%)
min: 1316 avg: 1363 median: 1367 (58%) max: 1381 Points
CPU TDP ? TDP 25 W TDP 31 W TDP 35 W TDP 40 W TDP 41 W TDP 45 W TDP 54 W TDP 94 W 100% 96% 84% 99% 100% 99% 100% 99% 98%
min: 1217 avg: 1221 median: 1220.5 (52%) max: 1224 Points
CPU TDP ? TDP 20 W TDP 25 W TDP 31 W TDP 35 W TDP 37 W TDP 40 W TDP 41 W TDP 45 W TDP 54 W TDP 94 W 100% 89% 96% 84% 99% 89% 100% 99% 100% 99% 98%
Cinebench R20 - Cinebench R20 CPU (Single Core)
min: 424 avg: 445.8 median: 447.5 (50%) max: 453 Points
CPU TDP ? TDP 25 W TDP 31 W 99% 97% 100%
min: 527 avg: 533 median: 533 (59%) max: 538 Points
CPU TDP ? TDP 25 W TDP 31 W TDP 35 W TDP 40 W TDP 41 W TDP 45 W TDP 54 W TDP 94 W 89% 90% 84% 99% 100% 100% 100% 100% 98%
min: 448 avg: 466.7 median: 466 (52%) max: 478 Points
CPU TDP ? TDP 18 W TDP 20 W TDP 25 W TDP 28 W TDP 31 W TDP 35 W TDP 37 W TDP 40 W TDP 41 W TDP 45 W TDP 54 W TDP 94 W 88% 87% 89% 90% 89% 84% 99% 88% 100% 100% 100% 100% 98%
Cinebench R20 - Cinebench R20 CPU (Multi Core)
min: 1843 avg: 2236 median: 2219 (5%) max: 2530 Points
CPU TDP ? TDP 25 W TDP 31 W 90% 96% 100%
min: 3074 avg: 3678 median: 3688.5 (9%) max: 4059 Points
CPU TDP ? TDP 25 W TDP 31 W TDP 35 W TDP 40 W TDP 41 W TDP 45 W TDP 54 W TDP 94 W 71% 73% 63% 79% 97% 92% 100% 94% 90%
min: 2401 avg: 2698 median: 2647 (6%) max: 3095 Points
CPU TDP ? TDP 18 W TDP 20 W TDP 25 W TDP 28 W TDP 31 W TDP 35 W TDP 37 W TDP 40 W TDP 41 W TDP 45 W TDP 54 W TDP 94 W 70% 62% 74% 73% 72% 63% 79% 79% 97% 92% 100% 94% 90%
Cinebench R15 - Cinebench R15 CPU Multi 64 Bit
min: 715 avg: 896 median: 892 (6%) max: 1007 Points
CPU TDP ? TDP 25 W TDP 31 W 92% 97% 100%
min: 1319 avg: 1562 median: 1563 (10%) max: 1723 Points
CPU TDP ? TDP 25 W TDP 31 W TDP 35 W TDP 40 W TDP 41 W TDP 45 W TDP 54 W TDP 94 W 63% 74% 58% 80% 96% 94% 100% 91% 93%
min: 801 avg: 1091 median: 1094.5 (7%) max: 1253 Points
CPU TDP ? TDP 18 W TDP 20 W TDP 25 W TDP 28 W TDP 31 W TDP 35 W TDP 37 W TDP 40 W TDP 41 W TDP 45 W TDP 54 W TDP 94 W 63% 57% 71% 74% 69% 58% 80% 75% 96% 94% 100% 91% 93%
Cinebench R15 - Cinebench R15 CPU Single 64 Bit
min: 156 avg: 172.8 median: 174 (52%) max: 177 Points
CPU TDP ? TDP 25 W TDP 31 W 98% 98% 100%
min: 218 avg: 222.2 median: 223 (67%) max: 225 Points
CPU TDP ? TDP 25 W TDP 31 W TDP 35 W TDP 40 W TDP 41 W TDP 45 W TDP 54 W TDP 94 W 83% 87% 78% 98% 100% 99% 99% 99% 97%
min: 176 avg: 180.3 median: 180 (54%) max: 185 Points
CPU TDP ? TDP 18 W TDP 20 W TDP 25 W TDP 28 W TDP 31 W TDP 35 W TDP 37 W TDP 40 W TDP 41 W TDP 45 W TDP 54 W TDP 94 W 82% 80% 82% 87% 81% 78% 98% 79% 100% 99% 99% 99% 97%
Cinebench R11.5 - Cinebench R11.5 CPU Multi 64 Bit
min: 10.22 avg: 10.9 median: 10.9 (14%) max: 11.6 Points
CPU TDP ? TDP 31 W 88% 100%
min: 17.51 avg: 18.7 median: 18.7 (24%) max: 19.71 Points
CPU TDP ? TDP 31 W TDP 40 W TDP 45 W TDP 94 W 72% 59% 95% 100% 89%
12.6 Points (16%)
CPU TDP ? TDP 31 W TDP 40 W TDP 45 W TDP 94 W 69% 59% 95% 100% 89%
Cinebench R11.5 - Cinebench R11.5 CPU Single 64 Bit
min: 2.02 avg: 2 median: 2 (50%) max: 2.04 Points
CPU TDP ? TDP 31 W 99% 100%
min: 2.62 avg: 2.6 median: 2.6 (65%) max: 2.63 Points
CPU TDP ? TDP 31 W TDP 40 W TDP 45 W TDP 94 W 88% 78% 100% 100% 100%
2.1 Points (52%)
CPU TDP ? TDP 31 W TDP 40 W TDP 45 W TDP 94 W 85% 78% 100% 100% 100%
Cinebench R10 - Cinebench R10 Rend. Single (32bit)
min: 5319 avg: 5337 median: 5337 (32%) max: 5355 Points
CPU TDP ? TDP 31 W 99% 100%
min: 5719 avg: 5804 median: 5817 (35%) max: 5847 Points
CPU TDP ? TDP 31 W TDP 40 W TDP 45 W TDP 94 W 95% 92% 99% 100% 98%
min: 5475 avg: 5524 median: 5524 (33%) max: 5573 Points
CPU TDP ? TDP 31 W TDP 40 W TDP 45 W TDP 94 W 95% 92% 99% 100% 98%
Cinebench R10 - Cinebench R10 Rend. Multi (32bit)
min: 22934 avg: 24156 median: 24155.5 (18%) max: 25377 Points
CPU TDP ? TDP 31 W 90% 100%
min: 32456 avg: 34272 median: 34229 (25%) max: 35806 Points
CPU TDP ? TDP 31 W TDP 40 W TDP 45 W TDP 94 W 78% 71% 96% 100% 91%
min: 23834 avg: 24771 median: 24770.5 (18%) max: 25707 Points
CPU TDP ? TDP 31 W TDP 40 W TDP 45 W TDP 94 W 74% 71% 96% 100% 91%
Cinebench R10 - Cinebench R10 Rend. Multi (64bit)
38477 Points (27%)
min: 57574 avg: 60347 median: 59479 (41%) max: 63144 Points
CPU TDP ? TDP 40 W TDP 45 W TDP 94 W 77% 94% 100% 91%
45303 Points (31%)
CPU TDP ? TDP 40 W TDP 45 W TDP 94 W 75% 94% 100% 91%
Cinebench R10 - Cinebench R10 Rend. Single (64bit)
9139 Points (11%)
min: 11082 avg: 11111 median: 11095 (14%) max: 11201 Points
CPU TDP ? TDP 40 W TDP 45 W TDP 94 W 90% 100% 99% 99%
9491 Points (12%)
CPU TDP ? TDP 40 W TDP 45 W TDP 94 W 88% 100% 99% 99%
wPrime 2.10 - wPrime 2.0 1024m *
min: 170.4 avg: 171.9 median: 171.9 (2%) max: 173.4 s
CPU TDP ? TDP 31 W 100% 100%
min: 129.204 avg: 201.1 median: 201.1 (2%) max: 273 s
CPU TDP ? TDP 31 W TDP 40 W 100% 101% 101%
265.7 s (3%)
CPU TDP ? TDP 31 W TDP 40 W 100% 101% 101%
wPrime 2.10 - wPrime 2.0 32m *
min: 5.7 avg: 7.8 median: 8.3 (2%) max: 9.48 s
CPU TDP ? TDP 31 W 100% 101%
min: 4.552 avg: 6.6 median: 6.6 (1%) max: 8.6 s
CPU TDP ? TDP 31 W TDP 40 W 100% 101% 101%
7.9 s (2%)
CPU TDP ? TDP 31 W TDP 40 W 100% 101% 101%
wPrime 1.55 - wPrime 1.55 1024m *
273 s (1%)
wPrime 1.55 - wPrime 1.55 32m *
8.6 s (5%)
min: 3420 avg: 3493 median: 3493 (6%) max: 3566 Points
CPU TDP ? TDP 31 W 96% 100%
7497 Points (12%)
CPU TDP ? TDP 31 W TDP 40 W 46% 48% 100%
min: 3888 avg: 3963 median: 3963 (6%) max: 4038 Points
CPU TDP ? TDP 18 W TDP 31 W TDP 40 W 49% 54% 48% 100%
7-Zip 18.03 - 7-Zip 18.03 Multli Thread 4 runs
min: 22466 avg: 24384 median: 24101 (14%) max: 25891 MIPS
CPU TDP ? TDP 22 W TDP 25 W TDP 31 W 94% 87% 100% 100%
min: 36315 avg: 43438 median: 44558 (26%) max: 46562 MIPS
CPU TDP ? TDP 22 W TDP 25 W TDP 31 W TDP 35 W TDP 40 W TDP 41 W TDP 45 W TDP 54 W TDP 94 W 67% 48% 72% 56% 86% 100% 78% 97% 94% 87%
min: 26652 avg: 30273 median: 30954 (18%) max: 33890 MIPS
CPU TDP ? TDP 18 W TDP 20 W TDP 22 W TDP 25 W TDP 28 W TDP 31 W TDP 35 W TDP 37 W TDP 40 W TDP 41 W TDP 45 W TDP 54 W TDP 94 W 66% 59% 68% 48% 72% 66% 56% 86% 71% 100% 78% 97% 94% 87%
7-Zip 18.03 - 7-Zip 18.03 Single Thread 4 runs
min: 4235 avg: 4290 median: 4288 (51%) max: 4338 MIPS
CPU TDP ? TDP 22 W TDP 25 W TDP 31 W 99% 98% 100% 100%
min: 5213 avg: 5350 median: 5358.5 (64%) max: 5446 MIPS
CPU TDP ? TDP 22 W TDP 25 W TDP 31 W TDP 35 W TDP 40 W TDP 41 W TDP 45 W TDP 54 W TDP 94 W 86% 78% 88% 80% 100% 99% 98% 99% 100% 96%
min: 4208 avg: 4361 median: 4361.5 (52%) max: 4470 MIPS
CPU TDP ? TDP 18 W TDP 20 W TDP 22 W TDP 25 W TDP 28 W TDP 31 W TDP 35 W TDP 37 W TDP 40 W TDP 41 W TDP 45 W TDP 54 W TDP 94 W 84% 80% 82% 78% 88% 82% 80% 100% 80% 99% 98% 99% 100% 96%
X264 HD Benchmark 4.0 - x264 Pass 2
59.3 fps (21%)
95.2 fps (33%)
CPU TDP 31 W TDP 40 W 62% 100%
57.4 fps (20%)
CPU TDP ? TDP 31 W TDP 40 W 60% 62% 100%
X264 HD Benchmark 4.0 - x264 Pass 1
210 fps (48%)
251.2 fps (58%)
CPU TDP 31 W TDP 40 W 84% 100%
191.3 fps (44%)
CPU TDP ? TDP 31 W TDP 40 W 76% 84% 100%
HWBOT x265 Benchmark v2.2 - HWBOT x265 4k Preset
min: 5.86 avg: 6.8 median: 6.9 (12%) max: 7.33 fps
CPU TDP ? TDP 22 W TDP 25 W TDP 31 W 92% 83% 100% 98%
min: 9.92 avg: 12 median: 12.2 (21%) max: 13.3 fps
CPU TDP ? TDP 22 W TDP 25 W TDP 31 W TDP 35 W TDP 40 W TDP 41 W TDP 45 W TDP 54 W TDP 94 W 70% 48% 74% 57% 83% 98% 79% 100% 95% 87%
min: 6.79 avg: 8.4 median: 8.4 (15%) max: 10.1 fps
CPU TDP ? TDP 18 W TDP 20 W TDP 22 W TDP 25 W TDP 28 W TDP 31 W TDP 35 W TDP 37 W TDP 40 W TDP 41 W TDP 45 W TDP 54 W TDP 94 W 69% 63% 65% 48% 74% 69% 57% 83% 73% 98% 79% 100% 95% 87%
TrueCrypt - TrueCrypt Serpent
min: 0.511 avg: 0.5 median: 0.5 (0%) max: 0.541 GB/s
CPU TDP ? TDP 31 W 100% 94%
min: 0.806 avg: 0.8 median: 0.8 (0%) max: 0.857 GB/s
CPU TDP ? TDP 31 W TDP 40 W 79% 60% 100%
min: 0.571 avg: 0.6 median: 0.6 (0%) max: 0.708 GB/s
CPU TDP ? TDP 18 W TDP 31 W TDP 40 W 75% 83% 60% 100%
TrueCrypt - TrueCrypt Twofish
min: 0.865 avg: 0.9 median: 0.9 (15%) max: 0.922 GB/s
CPU TDP ? TDP 31 W 100% 94%
min: 1.1 avg: 1.2 median: 1.2 (21%) max: 1.3 GB/s
CPU TDP ? TDP 31 W TDP 40 W 78% 67% 100%
min: 0.929 avg: 1 median: 1 (17%) max: 1.1 GB/s
CPU TDP ? TDP 18 W TDP 31 W TDP 40 W 76% 85% 67% 100%
TrueCrypt - TrueCrypt AES
4.9 GB/s (13%)
CPU TDP ? TDP 31 W 100% 100%
min: 5.3 avg: 7.4 median: 7.4 (19%) max: 9.4 GB/s
CPU TDP ? TDP 31 W TDP 40 W 54% 52% 100%
min: 5 avg: 5.3 median: 5.3 (14%) max: 5.5 GB/s
CPU TDP ? TDP 18 W TDP 31 W TDP 40 W 54% 59% 52% 100%
Blender - Blender 3.3 Classroom CPU *
min: 556 avg: 598 median: 584 (7%) max: 666 Seconds
CPU TDP 35 W TDP 40 W TDP 41 W TDP 94 W 100% 102% 101% 101%
858 Seconds (11%)
Model CPU GPU RAM Value Acer Swift 3 SF314-42-R9YN R7 4700U 29.8 W / 18 W Vega 7 1600 / 1600 MHz 3.3.38 GB 858
CPU TDP 18 W TDP 35 W TDP 40 W TDP 41 W TDP 94 W 100% 103% 104% 104% 104%
Blender - Blender 2.79 BMW27 CPU *
min: 533 avg: 603 median: 584 (4%) max: 748 Seconds
CPU TDP ? TDP 22 W TDP 25 W TDP 31 W 101% 100% 101% 101%
min: 299.7 avg: 325.9 median: 324 (2%) max: 384 Seconds
CPU TDP ? TDP 22 W TDP 25 W TDP 31 W TDP 35 W TDP 40 W TDP 41 W TDP 45 W TDP 54 W TDP 94 W 101% 100% 102% 101% 102% 103% 103% 103% 103% 103%
min: 407 avg: 479.6 median: 477.5 (3%) max: 537 Seconds
CPU TDP ? TDP 18 W TDP 20 W TDP 22 W TDP 25 W TDP 28 W TDP 31 W TDP 35 W TDP 37 W TDP 40 W TDP 41 W TDP 45 W TDP 54 W TDP 94 W 101% 101% 102% 100% 102% 102% 101% 102% 101% 103% 103% 103% 103% 103%
R Benchmark 2.5 - R Benchmark 2.5 *
min: 0.614 avg: 0.6 median: 0.6 (14%) max: 0.654 sec
CPU TDP ? TDP 22 W TDP 25 W TDP 31 W 100% 100% 100% 100%
min: 0.526 avg: 0.5 median: 0.5 (12%) max: 0.596 sec
CPU TDP ? TDP 22 W TDP 25 W TDP 31 W TDP 35 W TDP 40 W TDP 41 W TDP 45 W TDP 54 W TDP 94 W 101% 100% 101% 100% 103% 103% 102% 103% 103% 102%
min: 0.598 avg: 0.6 median: 0.6 (13%) max: 0.651 sec
CPU TDP ? TDP 18 W TDP 20 W TDP 22 W TDP 25 W TDP 28 W TDP 31 W TDP 35 W TDP 37 W TDP 40 W TDP 41 W TDP 45 W TDP 54 W TDP 94 W 101% 101% 101% 100% 101% 101% 100% 103% 101% 103% 102% 103% 103% 102%
3DMark 06 - CPU - 3DMark 06 - CPU
min: 8933 avg: 8934 median: 8933.5 (19%) max: 8934 Points
CPU TDP ? TDP 31 W 100% 100%
min: 11446 avg: 12027 median: 11952 (25%) max: 12757 Points
CPU TDP ? TDP 31 W TDP 40 W TDP 45 W TDP 94 W 82% 70% 93% 100% 90%
min: 8497 avg: 8629 median: 8629 (18%) max: 8761 Points
CPU TDP ? TDP 18 W TDP 31 W TDP 40 W TDP 45 W TDP 94 W 77% 69% 70% 93% 100% 90%
Super Pi mod 1.5 XS 1M - Super Pi mod 1.5 XS 1M *
min: 10 avg: 10.3 median: 10.3 (2%) max: 10.5 s
CPU TDP ? TDP 31 W 100% 100%
min: 7.2 avg: 7.9 median: 7.9 (2%) max: 8.672 s
CPU TDP ? TDP 31 W TDP 40 W 100% 100% 100%
10 s (2%)
CPU TDP ? TDP 31 W TDP 40 W 100% 100% 100%
Super Pi mod 1.5 XS 2M - Super Pi mod 1.5 XS 2M *
24 s (1%)
min: 15.7 avg: 17.2 median: 17.2 (1%) max: 18.772 s
CPU TDP ? TDP 40 W 100% 100%
23.4 s (1%)
CPU TDP ? TDP 40 W 100% 100%
Super Pi Mod 1.5 XS 32M - Super Pi mod 1.5 XS 32M *
min: 620 avg: 622 median: 622 (3%) max: 624 s
CPU TDP ? TDP 31 W 100% 100%
min: 366 avg: 406.6 median: 406.6 (2%) max: 447.224 s
CPU TDP ? TDP 31 W TDP 40 W 101% 100% 101%
599 s (3%)
CPU TDP ? TDP 31 W TDP 40 W 100% 100% 101%
3DMark Vantage - 3DM Vant. Perf. CPU no Physx
min: 52691 avg: 54378 median: 55183 (48%) max: 55261 Points
CPU TDP 40 W TDP 45 W TDP 94 W 100% 100% 95%
34583 Points (30%)
CPU TDP ? TDP 40 W TDP 45 W TDP 94 W 63% 100% 100% 95%
3DMark 11 - 3DM11 Performance Physics
min: 7061 avg: 8121 median: 8095 (22%) max: 8704 Points
CPU TDP ? TDP 22 W TDP 25 W TDP 31 W 93% 87% 100% 99%
min: 8662 avg: 13031 median: 13537 (37%) max: 15562 Points
CPU TDP ? TDP 22 W TDP 25 W TDP 31 W TDP 35 W TDP 40 W TDP 41 W TDP 45 W TDP 54 W TDP 94 W 68% 52% 77% 59% 77% 100% 60% 96% 86% 69%
min: 9347 avg: 10076 median: 9601.5 (26%) max: 11537 Points
CPU TDP ? TDP 18 W TDP 20 W TDP 22 W TDP 25 W TDP 28 W TDP 31 W TDP 35 W TDP 37 W TDP 40 W TDP 41 W TDP 45 W TDP 54 W TDP 94 W 68% 65% 80% 52% 77% 76% 59% 77% 76% 100% 60% 96% 86% 69%
3DMark - 3DMark Ice Storm Physics
min: 61260 avg: 63475 median: 63892 (52%) max: 65272 Points
CPU TDP ? TDP 22 W 100% 95%
min: 78452 avg: 81114 median: 80711.5 (66%) max: 84582 Points
CPU TDP ? TDP 22 W TDP 40 W TDP 45 W 84% 74% 97% 100%
min: 58167 avg: 61666 median: 61529.5 (50%) max: 65439 Points
CPU TDP ? TDP 22 W TDP 28 W TDP 37 W TDP 40 W TDP 45 W 78% 74% 79% 77% 97% 100%
3DMark - 3DMark Ice Storm Extreme Physics
min: 57910 avg: 62775 median: 63587.5 (52%) max: 66013 Points
CPU TDP ? TDP 22 W 100% 100%
min: 80031 avg: 81646 median: 80543 (65%) max: 84364 Points
CPU TDP ? TDP 22 W TDP 40 W TDP 45 W 76% 76% 97% 100%
min: 58593 avg: 62251 median: 64060 (52%) max: 65582 Points
CPU TDP ? TDP 22 W TDP 28 W TDP 37 W TDP 40 W TDP 45 W 75% 76% 80% 78% 97% 100%
3DMark - 3DMark Ice Storm Unlimited Physics
min: 68588 avg: 69178 median: 69062 (58%) max: 69884 Points
CPU TDP ? TDP 22 W 100% 100%
min: 83587 avg: 84905 median: 85177 (72%) max: 85952 Points
CPU TDP ? TDP 22 W TDP 40 W TDP 45 W 81% 81% 98% 100%
min: 64456 avg: 68216 median: 67931 (57%) max: 70845 Points
CPU TDP ? TDP 18 W TDP 22 W TDP 28 W TDP 37 W TDP 40 W TDP 45 W 80% 75% 81% 83% 82% 98% 100%
3DMark - 3DMark Cloud Gate Physics
min: 6900 avg: 7494 median: 7616 (19%) max: 7925 Points
CPU TDP ? TDP 22 W TDP 31 W 95% 87% 100%
min: 9129 avg: 12370 median: 12951 (33%) max: 13650 Points
CPU TDP ? TDP 22 W TDP 25 W TDP 31 W TDP 35 W TDP 40 W TDP 41 W TDP 45 W TDP 54 W TDP 94 W 73% 52% 94% 59% 68% 100% 84% 99% 88% 80%
min: 7698 avg: 9402 median: 9475 (24%) max: 10860 Points
CPU TDP ? TDP 18 W TDP 22 W TDP 25 W TDP 28 W TDP 31 W TDP 35 W TDP 37 W TDP 40 W TDP 41 W TDP 45 W TDP 54 W TDP 94 W 71% 65% 52% 94% 76% 59% 68% 81% 100% 84% 99% 88% 80%
3DMark - 3DMark Fire Strike Standard Physics
min: 9800 avg: 11318 median: 11477 (20%) max: 12259 Points
CPU TDP ? TDP 22 W TDP 31 W 92% 84% 100%
min: 1131 avg: 18287 median: 20724.5 (37%) max: 21597 Points
CPU TDP ? TDP 22 W TDP 25 W TDP 31 W TDP 35 W TDP 40 W TDP 41 W TDP 45 W TDP 54 W TDP 94 W 67% 48% 94% 58% 66% 99% 81% 100% 41% 85%
min: 10953 avg: 13815 median: 14100 (25%) max: 15386 Points
CPU TDP ? TDP 18 W TDP 20 W TDP 22 W TDP 25 W TDP 28 W TDP 31 W TDP 35 W TDP 37 W TDP 40 W TDP 41 W TDP 45 W TDP 54 W TDP 94 W 66% 58% 72% 48% 94% 69% 58% 66% 71% 99% 81% 100% 41% 85%
3DMark - 3DMark Time Spy CPU
min: 3316 avg: 3759 median: 3734 (16%) max: 4187 Points
CPU TDP ? TDP 22 W TDP 31 W 92% 81% 100%
min: 3754 avg: 6442 median: 6796 (29%) max: 7512 Points
CPU TDP ? TDP 22 W TDP 25 W TDP 31 W TDP 35 W TDP 40 W TDP 41 W TDP 45 W TDP 54 W TDP 94 W 70% 46% 90% 57% 70% 95% 53% 100% 80% 89%
min: 3420 avg: 4699 median: 4722 (20%) max: 5345 Points
CPU TDP ? TDP 18 W TDP 20 W TDP 22 W TDP 25 W TDP 28 W TDP 31 W TDP 35 W TDP 37 W TDP 40 W TDP 41 W TDP 45 W TDP 54 W TDP 94 W 68% 64% 75% 46% 90% 72% 57% 70% 73% 95% 53% 100% 80% 89%
Geekbench 6.2 - Geekbench 6.2 Single-Core
min: 1610 avg: 1729 median: 1728.5 (47%) max: 1847 Points
CPU TDP 40 W TDP 94 W 87% 100%
Geekbench 6.2 - Geekbench 6.2 Multi-Core
min: 5801 avg: 6856 median: 6855.5 (27%) max: 7910 Points
CPU TDP 40 W TDP 94 W 100% 73%
Geekbench 5.5 - Geekbench 5.1 - 5.4 64 Bit Single-Core
min: 1082 avg: 1109 median: 1097 (46%) max: 1220 Points
CPU TDP ? TDP 25 W TDP 31 W 90% 100% 90%
min: 1365 avg: 1412 median: 1422.5 (60%) max: 1445 Points
CPU TDP ? TDP 25 W TDP 31 W TDP 35 W TDP 40 W TDP 41 W TDP 45 W TDP 54 W TDP 94 W 83% 90% 77% 100% 100% 95% 99% 99% 95%
min: 1101 avg: 1134 median: 1131 (48%) max: 1168 Points
CPU TDP ? TDP 18 W TDP 20 W TDP 25 W TDP 28 W TDP 31 W TDP 35 W TDP 37 W TDP 40 W TDP 41 W TDP 45 W TDP 54 W TDP 94 W 82% 77% 81% 90% 80% 77% 100% 78% 100% 95% 99% 99% 95%
Geekbench 5.5 - Geekbench 5.1 - 5.4 64 Bit Multi-Core
min: 4352 avg: 4774 median: 4632 (8%) max: 6234 Points
CPU TDP ? TDP 25 W TDP 31 W 74% 100% 76%
min: 4990 avg: 6521 median: 6536 (12%) max: 7253 Points
CPU TDP ? TDP 25 W TDP 31 W TDP 35 W TDP 40 W TDP 41 W TDP 45 W TDP 54 W TDP 94 W 74% 85% 65% 84% 100% 69% 92% 89% 81%
min: 4792 avg: 5630 median: 5656 (10%) max: 6502 Points
CPU TDP ? TDP 18 W TDP 20 W TDP 25 W TDP 28 W TDP 31 W TDP 35 W TDP 37 W TDP 40 W TDP 41 W TDP 45 W TDP 54 W TDP 94 W 74% 69% 90% 85% 81% 65% 84% 86% 100% 69% 92% 89% 81%
Geekbench 5.0 - Geekbench 5.0 64 Bit Single-Core
1074 Points (5%)
Model CPU GPU RAM Value Acer Swift 3 SF314-42 Pre-Sample R5 4500U Vega 6 1500 MHz8 GB 1074
min: 1341 avg: 1368 median: 1369 (6%) max: 1393 Points
CPU TDP ? TDP 35 W TDP 40 W TDP 41 W TDP 45 W TDP 94 W 77% 98% 100% 97% 99% 96%
min: 1125 avg: 1140 median: 1128 (5%) max: 1167 Points
CPU TDP ? TDP 35 W TDP 40 W TDP 41 W TDP 45 W TDP 94 W 81% 98% 100% 97% 99% 96%
Geekbench 5.0 - Geekbench 5.0 64 Bit Multi-Core
4282 Points (14%)
Model CPU GPU RAM Value Acer Swift 3 SF314-42 Pre-Sample R5 4500U Vega 6 1500 MHz8 GB 4282
min: 4955 avg: 6222 median: 6483 (20%) max: 7128 Points
CPU TDP ? TDP 35 W TDP 40 W TDP 41 W TDP 45 W TDP 94 W 60% 85% 100% 70% 92% 82%
min: 4884 avg: 5220 median: 5018 (16%) max: 5757 Points
CPU TDP ? TDP 35 W TDP 40 W TDP 41 W TDP 45 W TDP 94 W 70% 85% 100% 70% 92% 82%
Geekbench 4.4 - Geekbench 4.1 - 4.4 64 Bit Single-Core
min: 4486 avg: 4624 median: 4624 (46%) max: 4762 Points
CPU TDP ? TDP 31 W 94% 100%
min: 5812 avg: 5914 median: 5813 (58%) max: 6117 Points
CPU TDP ? TDP 31 W TDP 40 W TDP 45 W 73% 78% 100% 95%
min: 4560 avg: 4792 median: 4841 (48%) max: 4974 Points
CPU TDP ? TDP 31 W TDP 40 W TDP 45 W 77% 78% 100% 95%
Geekbench 4.4 - Geekbench 4.1 - 4.4 64 Bit Multi-Core
min: 17798 avg: 18561 median: 18561 (20%) max: 19324 Points
CPU TDP ? TDP 31 W 92% 100%
min: 27071 avg: 27953 median: 27790 (30%) max: 28997 Points
CPU TDP ? TDP 31 W TDP 40 W TDP 45 W 61% 67% 100% 95%
min: 19566 avg: 21030 median: 21001 (23%) max: 22524 Points
CPU TDP ? TDP 31 W TDP 40 W TDP 45 W 70% 67% 100% 95%
Geekbench 4.0 - Geekbench 4.0 64 Bit Single-Core
4751 Points (65%)
Geekbench 4.0 - Geekbench 4.0 64 Bit Multi-Core
19818 Points (48%)
Geekbench 3 - Geekbench 3 32 Bit Multi-Core
18690 Points (33%)
20656 Points (37%)
Geekbench 3 - Geekbench 3 32 Bit Single-Core
3960 Points (77%)
4351 Points (85%)
Geekbench 3 - Geekbench 3 64 Bit Multi-Core
19029 Points (30%)
21923 Points (34%)
Geekbench 3 - Geekbench 3 64 Bit Single-Core
4162 Points (62%)
4611 Points (69%)
Geekbench 2 - 32 Bit - Geekbench Stream
6630 Points (53%)
8930 Points (72%)
Geekbench 2 - 32 Bit - Geekbench Memory
5771 Points (52%)
6857 Points (62%)
Geekbench 2 - 32 Bit - Geekbench Floating Point
20968 Points (41%)
21332 Points (42%)
Geekbench 2 - 32 Bit - Geekbench Integer
16596 Points (33%)
20116 Points (40%)
Geekbench 2 - 32 Bit - Geekbench Total Score
14964 Points (39%)
16771 Points (44%)
Mozilla Kraken 1.1 - Kraken 1.1 Total Score *
min: 819 avg: 851 median: 853 (1%) max: 871 ms
CPU TDP ? TDP 22 W TDP 25 W TDP 31 W 100% 100% 100% 100%
min: 640 avg: 654 median: 652 (1%) max: 674 ms
CPU TDP ? TDP 22 W TDP 25 W TDP 31 W TDP 35 W TDP 40 W TDP 41 W TDP 45 W TDP 54 W TDP 94 W 100% 100% 100% 100% 100% 100% 100% 100% 100% 100%
min: 805 avg: 838 median: 825 (1%) max: 954 ms
CPU TDP ? TDP 18 W TDP 20 W TDP 22 W TDP 25 W TDP 28 W TDP 31 W TDP 35 W TDP 37 W TDP 40 W TDP 41 W TDP 45 W TDP 54 W TDP 94 W 100% 100% 100% 100% 100% 100% 100% 100% 100% 100% 100% 100% 100% 100%
Sunspider - Sunspider 1.0 Total Score *
99 ms (1%)
90.4 ms (1%)
Sunspider - Sunspider 0.9.1 Total Score *
90.9 ms (1%)
Octane V2 - Octane V2 Total Score
min: 33759 avg: 43608 median: 48506 (44%) max: 48558 Points
min: 64416 avg: 66303 median: 67221 (60%) max: 67271 Points
CPU TDP ? TDP 45 W TDP 54 W 65% 100% 98%
min: 34607 avg: 43312 median: 43380.5 (39%) max: 51878 Points
CPU TDP ? TDP 20 W TDP 28 W TDP 45 W TDP 54 W 60% 76% 77% 100% 98%
WebXPRT 4 - WebXPRT 4 Score
min: 196.4 avg: 200.7 median: 200.2 (58%) max: 206 Points
CPU TDP 35 W TDP 40 W TDP 41 W TDP 94 W 98% 100% 95% 96%
WebXPRT 3 - WebXPRT 3 Score
min: 191 avg: 196.5 median: 197 (41%) max: 202 Points
CPU TDP ? TDP 22 W 100% 99%
min: 245 avg: 263 median: 267 (56%) max: 273 Points
CPU TDP ? TDP 22 W TDP 25 W TDP 35 W TDP 40 W TDP 41 W TDP 45 W TDP 54 W TDP 94 W 81% 72% 97% 99% 100% 94% 97% 100% 90%
min: 192 avg: 205.6 median: 203 (42%) max: 224 Points
CPU TDP ? TDP 20 W TDP 22 W TDP 25 W TDP 28 W TDP 35 W TDP 37 W TDP 40 W TDP 41 W TDP 45 W TDP 54 W TDP 94 W 80% 77% 72% 97% 80% 99% 71% 100% 94% 97% 100% 90%
CrossMark - CrossMark Overall
816 Points (31%)
min: 1157 avg: 1292 median: 1311 (50%) max: 1353 Points
CPU TDP 25 W TDP 31 W TDP 35 W TDP 40 W TDP 41 W TDP 45 W TDP 54 W TDP 94 W 96% 60% 97% 99% 86% 99% 100% 92%
926 Points (35%)
Model CPU GPU RAM Value Acer Swift 3 SF314-42-R9YN R7 4700U 29.8 W / 18 W Vega 7 1600 / 1600 MHz8 GB 926
CPU TDP 18 W TDP 25 W TDP 31 W TDP 35 W TDP 40 W TDP 41 W TDP 45 W TDP 54 W TDP 94 W 68% 96% 60% 97% 99% 86% 99% 100% 92%
Power Consumption - Prime95 Power Consumption - external Monitor *
min: 28.8 avg: 42 median: 43 (7%) max: 53 Watt
CPU TDP ? TDP 22 W TDP 31 W 102% 103% 100%
min: 48.8 avg: 72 median: 69.1 (12%) max: 104.2 Watt
CPU TDP ? TDP 22 W TDP 25 W TDP 31 W TDP 35 W TDP 40 W TDP 41 W TDP 45 W TDP 54 W 104% 110% 103% 106% 106% 104% 107% 100% 104%
min: 26.5 avg: 35.3 median: 28 (5%) max: 51.4 Watt
CPU TDP ? TDP 22 W TDP 25 W TDP 31 W TDP 35 W TDP 37 W TDP 40 W TDP 41 W TDP 45 W TDP 54 W 106% 110% 103% 106% 106% 106% 104% 107% 100% 104%
Power Consumption - Cinebench R15 Multi Power Consumption - external Monitor *
min: 26.8 avg: 37.8 median: 30.7 (6%) max: 53 Watt
CPU TDP ? TDP 22 W TDP 31 W 103% 105% 100%
min: 48.2 avg: 75.4 median: 71.7 (13%) max: 106.2 Watt
CPU TDP ? TDP 22 W TDP 25 W TDP 31 W TDP 35 W TDP 40 W TDP 41 W TDP 45 W TDP 54 W 105% 113% 103% 108% 108% 104% 104% 100% 105%
min: 36.5 avg: 37.5 median: 37 (7%) max: 39.1 Watt
CPU TDP ? TDP 22 W TDP 25 W TDP 31 W TDP 35 W TDP 37 W TDP 40 W TDP 41 W TDP 45 W TDP 54 W 106% 113% 103% 108% 108% 111% 104% 104% 100% 105%
Power Consumption - Idle Power Consumption - external Monitor *
min: 5.05 avg: 6.2 median: 6.2 (4%) max: 7.26 Watt
CPU TDP 40 W TDP 41 W 100% 102%
Power Consumption - Idle Power Consumption 150cd 1min *
min: 5.72 avg: 10.7 median: 11.8 (13%) max: 17.4 Watt
CPU TDP ? TDP 25 W TDP 41 W TDP 45 W 104% 111% 112% 100%
5 Watt (6%)
Model CPU GPU RAM Value Acer Swift 3 SF314-42-R9YN R7 4700U 29.8 W / 18 W Vega 7 1600 / 1600 MHz8 GB 5
CPU TDP ? TDP 18 W TDP 25 W TDP 41 W TDP 45 W 104% 113% 111% 112% 100%
Power Consumption - Cinebench R15 Multi Power Efficiency - external Monitor
min: 16.5 avg: 24.7 median: 25.3 (19%) max: 31.7 Points per Watt
CPU TDP ? TDP 31 W 100% 73%
min: 15.8 avg: 21.3 median: 20.9 (16%) max: 27.4 Points per Watt
CPU TDP ? TDP 25 W TDP 31 W TDP 35 W TDP 41 W TDP 45 W TDP 54 W 82% 76% 70% 100% 82% 71% 90%
min: 26.9 avg: 29.6 median: 28 (21%) max: 34 Points per Watt
CPU TDP ? TDP 25 W TDP 31 W TDP 35 W TDP 37 W TDP 41 W TDP 45 W TDP 54 W 70% 61% 57% 81% 100% 66% 57% 73%
Average Benchmarks AMD Ryzen 5 4500U → 100% n=46 Average Benchmarks AMD Ryzen 5 5600H → 139% n=46 Average Benchmarks AMD Ryzen 7 4700U → 108% n=46
- Range of benchmark values for this graphics card
- Average benchmark values for this graphics card
* Smaller numbers mean a higher performance
1 This benchmark is not used for the average calculation
v1.26
log 20. 14:59:30
#0 checking url part for id 11687 +0s ... 0s
#1 checking url part for id 13003 +0s ... 0s
#2 checking url part for id 11683 +0s ... 0s
#3 not redirecting to Ajax server +0s ... 0s
#4 did not recreate cache, as it is less than 5 days old! Created at Sun, 19 May 2024 05:35:32 +0200 +0.001s ... 0.001s
#5 composed specs +0.056s ... 0.057s
#6 did output specs +0s ... 0.057s
#7 getting avg benchmarks for device 11687 +0.02s ... 0.077s
#8 got single benchmarks 11687 +0.072s ... 0.149s
#9 getting avg benchmarks for device 13003 +0.019s ... 0.168s
#10 got single benchmarks 13003 +0.095s ... 0.263s
#11 getting avg benchmarks for device 11683 +0.019s ... 0.282s
#12 got single benchmarks 11683 +0.069s ... 0.351s
#13 got avg benchmarks for devices +0s ... 0.351s
#14 min, max, avg, median took s +0.627s ... 0.978s
#15 return log +0s ... 0.978s
Please share our article, every link counts!
Redaktion, 2017-09- 8 (Update: 2023-07- 1)
 Deutsch
 English
 Español
 Français
 Italiano
 Nederlands
 Polski
 Português
 Русский
 Türkçe
 Svenska
 Chinese
 Magyar