

Intel Arc A310 vs Apple M2 8-Core GPU
Intel Arc A310
► remove from comparison
The Intel Arc A310 is a dedicated entry-level graphics card from Intel for desktops. It is based on the ACM-G11 chip and offers 6 of the 8 Xe cores (96 ALUs), 6 of the 8 ray tracing units, 1.152 MB L1 cache and 4MB L2 cache. The memory interface is 64 bits wide and supports 4GB GDDR6 graphics memory with 15.5 Gbps. The TGP is between 40 and 75 watts depending on the model.
The A310 is similar to the mobile Arc A350Mexcept for the higher clock rates of the cores and memory.
The ACM-G11 chip is manufactured at TSMC in 6nm (N6 process) and offers 7.2 billion transistors and is 157 mm2 in size. It integrates two media engines for VP9, AVC, HEVC, AV1 8k60 12-bit HDR decoding and 8k 10-bit HDR encoding. The integrated 4 display pipes support 4x 4k120 HDR, HDMI 2.0B, DP 2.0 10G and Adaptive Sync.
Apple M2 8-Core GPU
► remove from comparison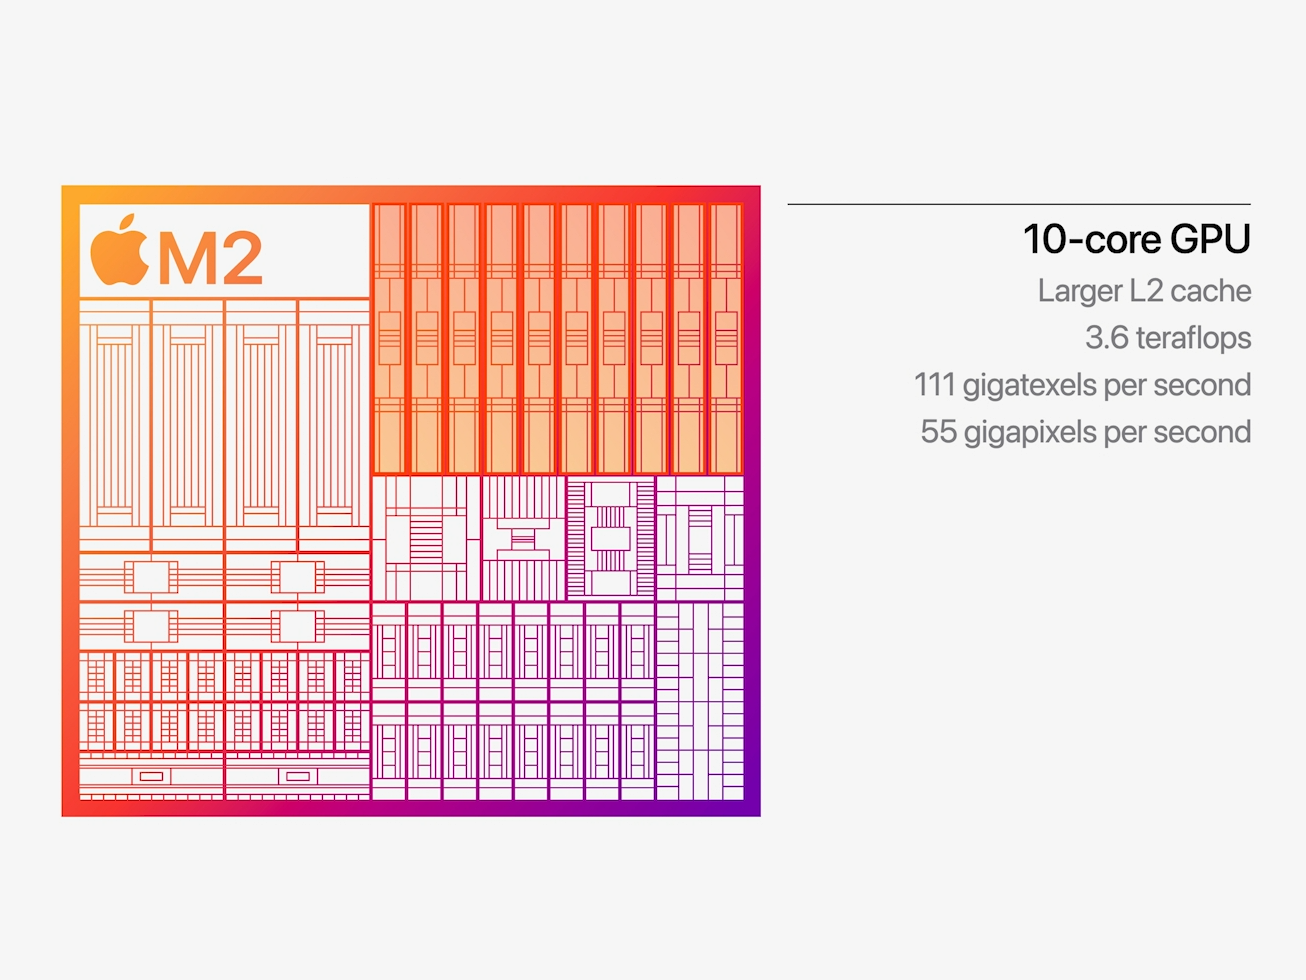
The Apple M2 8-core GPU is an integrated graphics card offering 8 of the 10 cores designed by Apple and integrated in the Apple M2 SoC. It uses the unified memory architecture of the M2 SoC (up to 24 GB LPDDR5-6400 with 100 GB/s bandwidth) and should offer 128 execution units.
The performance is positioned right between the old 8-core model in the M1 GPU and the higher end 10-core model in the M2. The theoretical performance should be around 2.9 Teraflops, as the 8-core version offers the same 1,398 MHz maximum clock rate as the 10-core version. Compared to other iGPUs from AMD and Intel, the M2 benefits greatly from the unified memory architecture and the high bandwidth.
The M2 chip is manufactured in the second generation 5nm process at TSMC (most likely N5P). The power consumption is around 10 Watt (in our tests under load of the MBP13) compared to the 13.5W of the 10-core version.
| Intel Arc A310 | Apple M2 8-Core GPU | ||||||||||||||||||||||||||||||||||||||||||||||||||||||||||
| Apple M2 Series |
|
| |||||||||||||||||||||||||||||||||||||||||||||||||||||||||
| Codename | Alchemist | ||||||||||||||||||||||||||||||||||||||||||||||||||||||||||
| Architecture | Xe HPG | ||||||||||||||||||||||||||||||||||||||||||||||||||||||||||
| Pipelines | 6 - unified | 8 - unified | |||||||||||||||||||||||||||||||||||||||||||||||||||||||||
| Raytracing Cores | 6 | ||||||||||||||||||||||||||||||||||||||||||||||||||||||||||
| Core Speed | 2000 (Boost) MHz | 1398 (Boost) MHz | |||||||||||||||||||||||||||||||||||||||||||||||||||||||||
| Cache | L1: 1.1 MB, L2: 4 MB | ||||||||||||||||||||||||||||||||||||||||||||||||||||||||||
| Memory Speed | 15500 MHz | ||||||||||||||||||||||||||||||||||||||||||||||||||||||||||
| Memory Bus Width | 64 Bit | ||||||||||||||||||||||||||||||||||||||||||||||||||||||||||
| Memory Type | GDDR6 | LPDDR5-6400 | |||||||||||||||||||||||||||||||||||||||||||||||||||||||||
| Max. Amount of Memory | 4 GB | ||||||||||||||||||||||||||||||||||||||||||||||||||||||||||
| Shared Memory | no | no | |||||||||||||||||||||||||||||||||||||||||||||||||||||||||
| Memory Bandwidth | 124 GB/s | ||||||||||||||||||||||||||||||||||||||||||||||||||||||||||
| API | DirectX 12_2, OpenGL 4.6, Vulkan 1.3 | ||||||||||||||||||||||||||||||||||||||||||||||||||||||||||
| Power Consumption | 75 Watt (40 - 75 Watt TGP) | 10 Watt | |||||||||||||||||||||||||||||||||||||||||||||||||||||||||
| Transistors | 7.2 Billion | ||||||||||||||||||||||||||||||||||||||||||||||||||||||||||
| Die Size | 157 mm² | ||||||||||||||||||||||||||||||||||||||||||||||||||||||||||
| technology | 6 nm | 5 nm | |||||||||||||||||||||||||||||||||||||||||||||||||||||||||
| PCIe | 4 8x | ||||||||||||||||||||||||||||||||||||||||||||||||||||||||||
| Displays | 4 Displays (max.), HDMI 2.0b, DisplayPort 2.0 10G Ready | ||||||||||||||||||||||||||||||||||||||||||||||||||||||||||
| Date of Announcement | 01.09.2022 | 06.06.2022 | |||||||||||||||||||||||||||||||||||||||||||||||||||||||||
| Link to Manufacturer Page | www.intel.com | ||||||||||||||||||||||||||||||||||||||||||||||||||||||||||
| Predecessor | M1 8-Core GPU |
Benchmarks
3DM Vant. Perf. total + Intel Arc A310
Cinebench R15 OpenGL 64 Bit + Apple M2 8-Core GPU
GFXBench T-Rex HD Offscreen C24Z16 + Apple M2 8-Core GPU
Average Benchmarks Intel Arc A310 → 100% n=3
Average Benchmarks Apple M2 8-Core GPU → 116% n=3
* Smaller numbers mean a higher performance
1 This benchmark is not used for the average calculation
Game Benchmarks
The following benchmarks stem from our benchmarks of review laptops. The performance depends on the used graphics memory, clock rate, processor, system settings, drivers, and operating systems. So the results don't have to be representative for all laptops with this GPU. For detailed information on the benchmark results, click on the fps number.

Last Epoch
2024
Skull & Bones
2024
Helldivers 2
2024
Enshrouded
2024
Palworld
2024

Ready or Not
2023
The Finals
2023

EA Sports WRC
2023
Alan Wake 2
2023
Lords of the Fallen
2023
Total War Pharaoh
2023

Counter-Strike 2
2023

Baldur's Gate 3
2023
Lies of P
2023
The Crew Motorfest
2023
Starfield
2023
Armored Core 6
2023
Atlas Fallen
2023

F1 23
2023

Company of Heroes 3
2023
Sons of the Forest
2023
Atomic Heart
2023
Returnal
2023
Hogwarts Legacy
2023
Borderlands 3
2019


Strange Brigade
2018
Far Cry 5
2018

The Witcher 3
2015
GTA V
2015Average Gaming Intel Arc A310 → 100%
Average Gaming 30-70 fps → 100%
| Intel Arc A310 | Apple M2 8-Core GPU | |||||||||||||
|---|---|---|---|---|---|---|---|---|---|---|---|---|---|---|
| low | med. | high | ultra | QHD | 4K | low | med. | high | ultra | QHD | 4K | |||
| Last Epoch | 62.5 | 53.4 | 39.6 | 30.9 | ||||||||||
| Skull & Bones | ||||||||||||||
| Helldivers 2 | 22.4 | 19.5 | 16.7 | 16.3 | ||||||||||
| Enshrouded | 20.4 | 18 | 13.8 | 9.88 | ||||||||||
| Palworld | 38.3 | 33.2 | 23.2 | 20.9 | ||||||||||
| Prince of Persia The Lost Crown | 260 | 154.7 | 141.6 | |||||||||||
| Ready or Not | 102.2 | 75.6 | 58.3 | 34.6 | ||||||||||
| The Finals | 75 | 53.1 | 46.6 | 34.6 | ||||||||||
| Avatar Frontiers of Pandora | 16 | 14 | 11 | 8.1 | ||||||||||
| EA Sports WRC | 34.3 | 27.3 | 18.6 | 16.8 | ||||||||||
| Alan Wake 2 | 16.3 | 13.9 | 12.3 | |||||||||||
| Lords of the Fallen | 22.7 | 22.2 | 18.4 | 14 | ||||||||||
| Total War Pharaoh | 111 | 73.6 | 41.6 | 32.3 | ||||||||||
| Assassin's Creed Mirage | 37 | 32 | 25 | 20 | ||||||||||
| Counter-Strike 2 | 153.5 | 106.3 | 37.5 | 27.7 | ||||||||||
| Cyberpunk 2077 2.2 Phantom Liberty | 41 | 31.1 | 25.7 | 23.7 | ||||||||||
| Baldur's Gate 3 | 40.6 | 32 | 25.5 | 24.9 | ||||||||||
| Lies of P | 49.3 | 42 | 36 | 30.3 | ||||||||||
| The Crew Motorfest | 37 | 33 | 27 | 22 | ||||||||||
| Starfield | 17.3 | 14.2 | 13 | 10.3 | ||||||||||
| Armored Core 6 | 56.3 | 43.8 | 39 | 26.9 | ||||||||||
| Atlas Fallen | 32.6 | 31.8 | 26.7 | 8.12 | ||||||||||
| Ratchet & Clank Rift Apart | 30.3 | 24.6 | 19.1 | 16.1 | ||||||||||
| F1 23 | 88 | 75 | 42 | 12 | ||||||||||
| Resident Evil 4 Remake | 42.4 | 30.1 | 21.6 | 9.5 | ||||||||||
| Company of Heroes 3 | 35.2 | 31.2 | 25.4 | 24.8 | ||||||||||
| Sons of the Forest | 29.9 | 18.9 | 17.4 | 17.1 | ||||||||||
| Atomic Heart | 54.2 | 40.3 | 27.4 | 18.8 | ||||||||||
| Returnal | 30 | 29 | 26 | 21 | ||||||||||
| Hogwarts Legacy | 42.3 | 35.2 | 21.5 | 15.4 | ||||||||||
| Strange Brigade | 187.3 | 79.7 | 65.3 | 53.8 | ||||||||||
| Far Cry 5 | 99 | 51 | 47 | 44 | ||||||||||
| Final Fantasy XV Benchmark | 41.7 | 24.1 | ||||||||||||
| The Witcher 3 | 176 | 108 | 56 | 29 | ||||||||||
| GTA V | 187.7 | 187.6 | 38.3 | 16.8 | ||||||||||
| Intel Arc A310 | Apple M2 8-Core GPU | |||||||||||||
| low | med. | high | ultra | QHD | 4K | low | med. | high | ultra | QHD | 4K | < 30 fps < 60 fps < 120 fps ≥ 120 fps | 7 15 6 4 | 10 16 6 2 | 21 11 1 1 | 24 7 1 | | | < 30 fps < 60 fps < 120 fps ≥ 120 fps | | | | | | |
For more games that might be playable and a list of all games and graphics cards visit our Gaming List