Notebookcheck Logo

Intel Core i9-14900K vs Apple S5 vs Apple A6x

Intel Core i9-14900K

► remove from comparison Intel i9-14900K

The Intel Core i9-14900K is a high-end processor based on the Raptor Lake architecture, similar to the Intel Core i9-13900K last year. The base clock is 3.2 GHz and can reach up to 6 GHz under optimal conditions. The total of 32 threads are still divided into 8 P and 16 E cores. The 8 performance cores (P-cores) also offer hyperthreading, which means that a total of 32 threads can be processed simultaneously in conjunction with the 16 energy-efficient E-cores. As before, the K models continue to offer a freely selectable multiplier, which simplifies overclocking. The Intel Core i9-14900K uses the same CPU socket (LGA 1700) as the Intel Core i9-13900K. This means you don't necessarily need a new motherboard, as the 600 series chipsets support the new processors after a BIOS update. There is also still the option of using DDR4 for the RAM.

Performance

Compared to the Intel Core i9-13900K, the Core i9-14900K still offers 8 P-cores, which are relieved by 16 additional E-cores for demanding applications and thus ensure very high multi-thread performance. In comparison, however, the Intel Core i9-14900K can only gain a slight lead. The e-cores primarily take care of background applications. The hybrid architecture relies on the Intel Thread Director, which is responsible for the correct allocation of tasks. Meanwhile, the IPC could only be increased slightly. As an innovation with the Intel Core i9-14900K, the manufacturer is increasingly relying on AI, which is also used for overclocking. With one click in the Intel Extreme Utility, the tool checks the entire system and makes the necessary settings.

Graphics unit

Like the Intel Core i9-13900K, the Intel Core i9-14900K offers an integrated graphics unit. The Intel Iris Xe architecture continues to serve as the basis. In terms of performance, however, nothing has changed with the Intel UHD Graphics 770.

Power consumption

The Intel Core i9-14900K is specified with a TDP of 125 watts, which corresponds to the PL1 value. In Boost mode, the processor's performance can increase to up to 253 watts (PL2). However, this requires very good cooling. Compared to the Intel Core i9-13900K, the specified power consumption does not increase if the limits are adhered to. The situation is different if the limits are deactivated. As this value depends on the overall system, we cannot make an exact statement on this.

Apple S5

► remove from comparison Apple S5

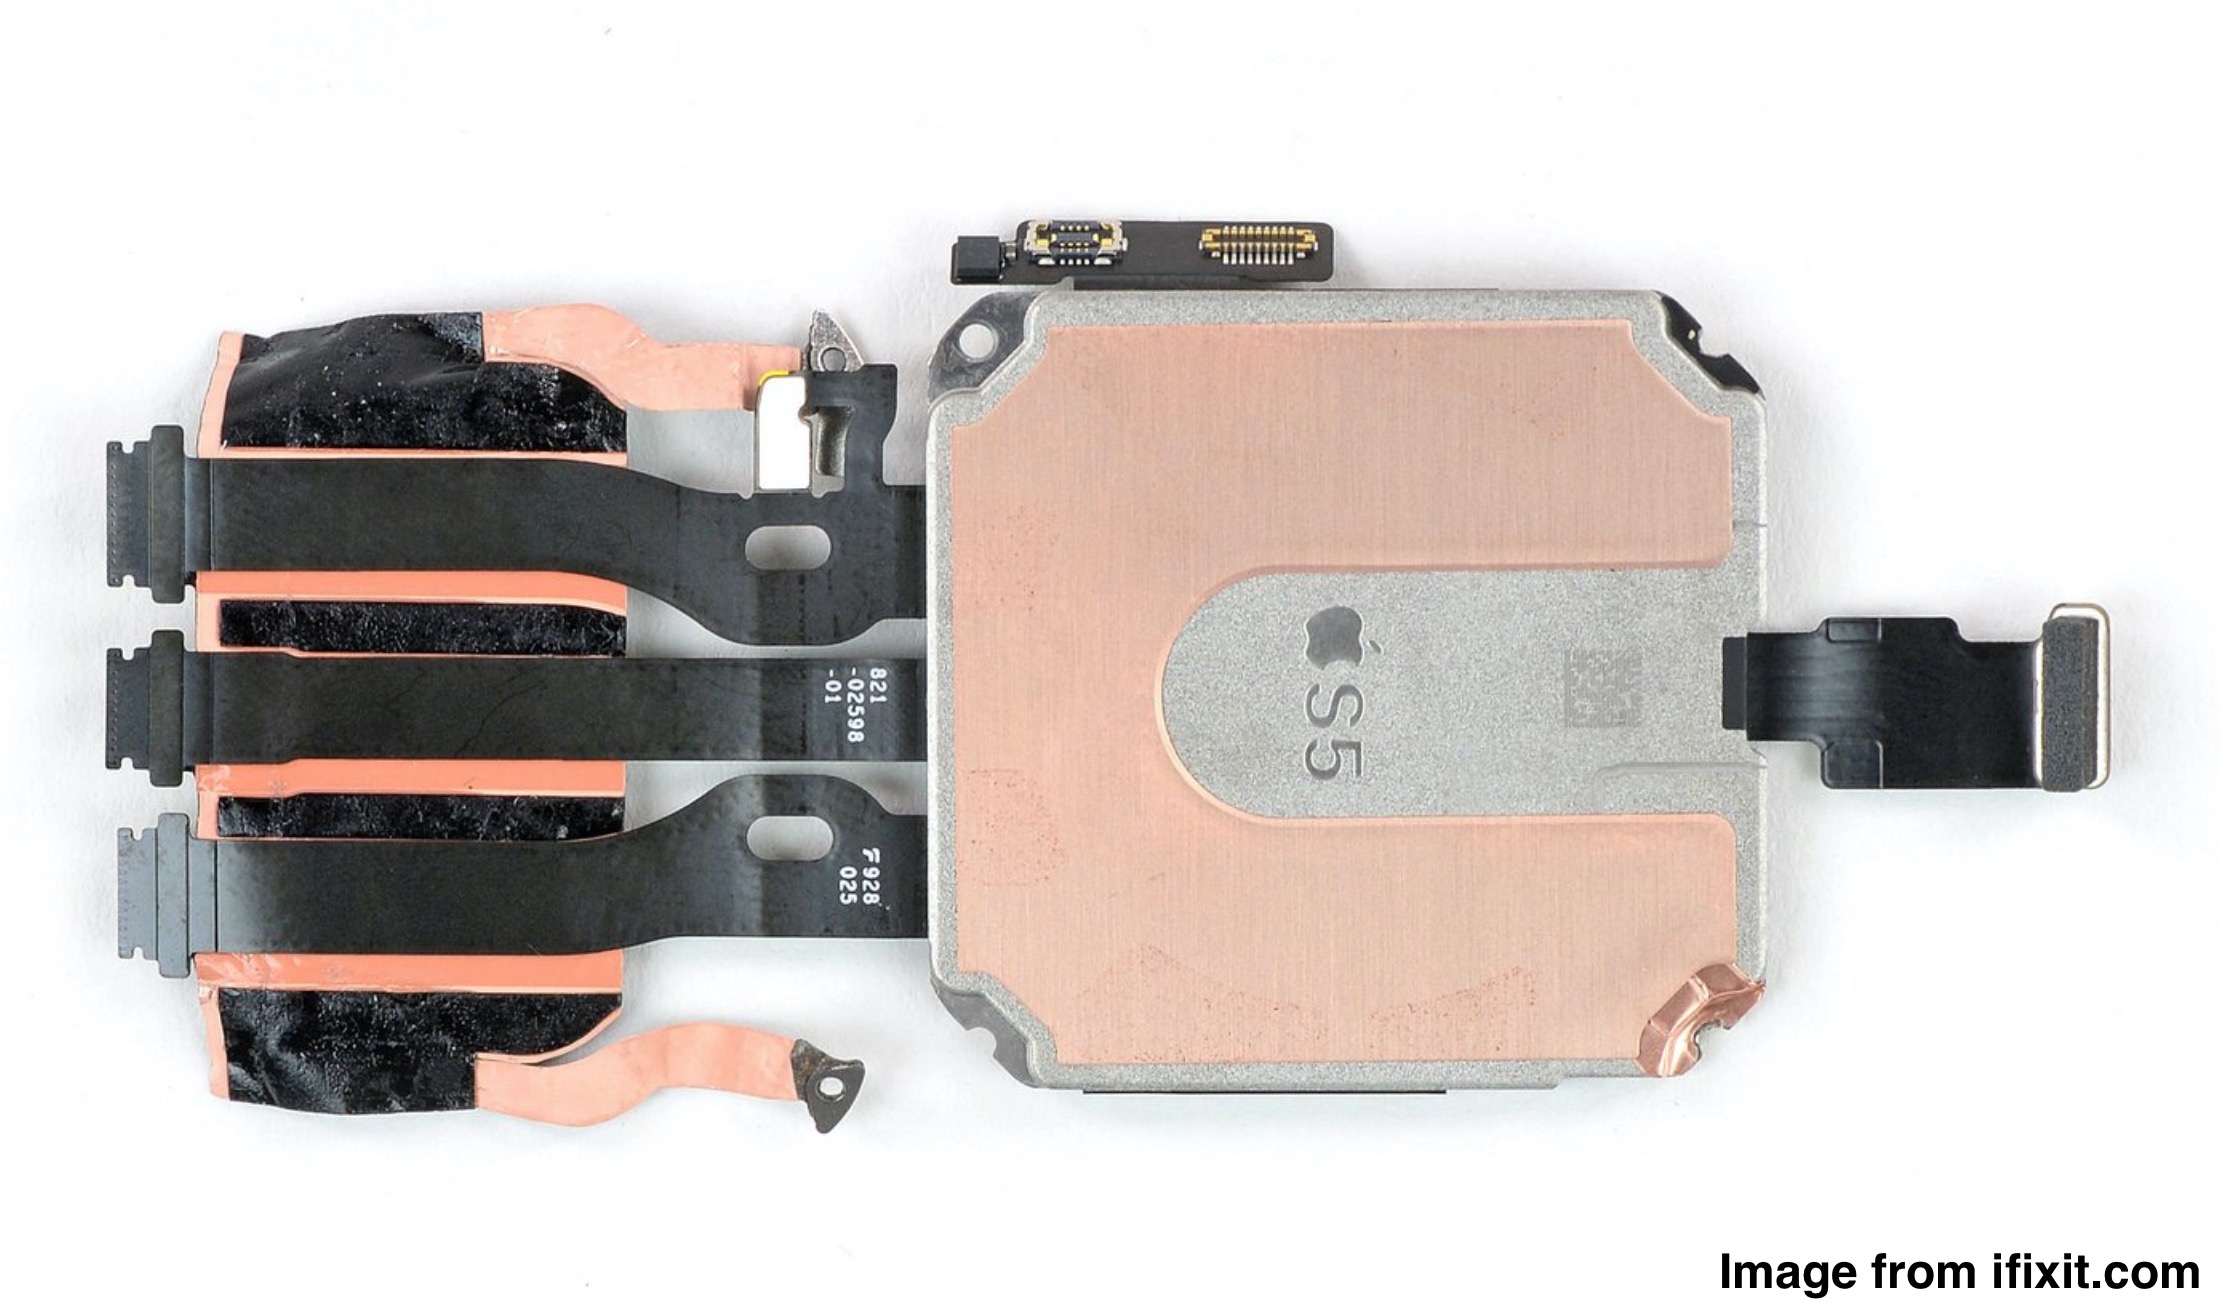
The Apple S5 is a 64-Bit dual core processor for the Apple Watch Series 5 (40 and 44mm). It integrates a GPU, 32 GB flash memory, Bluetooth 5.0, 1 GB RAM, 802.11 b/g/n 2.4 GHz WiFi and satellite positioning (GPS, GLONASS, Galileo, QZSS).

Apple A6x

► remove from comparison

The Apple A6x is a dual-core-SoC (System on a Chip) with ARM compatible CPU cores (ARMv7s instruction set). Both can be clocked at up to 1400 MHz depending on the load. It is used in the iPad 4 and compared to the A6 in the iPhone 5, the A6x offers a faster GPU (PowerVR SGX544MP4).

The CPU-Performance of the A6x is similar to the Qualcomm Snapdragon S4 Pro MSM8960T, while the GPU is about as fast as the Adreno 320.

ModelIntel Core i9-14900KApple S5Apple A6x
CodenameRaptor Lake
SeriesIntel Raptor Lake-RApple Apple A-Series
Series: Apple A-Series
Intel Core i9-14900K « 3.2 - 6 GHz24 / 32 cores36 MB L3
Intel Core i7-14700K2.5 - 5.6 GHz20 / 28 cores33 MB L3
Intel Core i9-149002 - 5.8 GHz24 / 32 cores36 MB L3
Intel Core i7-147001.5 - 5.4 GHz20 / 28 cores33 MB L3
Intel Core i5-14600K3.5 - 5.3 GHz14 / 20 cores24 MB L3
Intel Core i5-145002.6 - 5 GHz14 / 20 cores24 MB L3
Intel Core i5-14500T1.7 - 4.8 GHz14 / 20 cores24 MB L3
Apple A18 Pro - 4 GHz6 / 6 cores
Apple A18 - 3.8 GHz6 / 6 cores
Apple A15 Bionic2.02 - 3.23 GHz6 / 6 cores32 MB L3
Apple A12 Bionic - 2.49 GHz6 / 6 cores
Apple A6x « 1.4 GHzcores
Apple A61 GHzcores
Clock3200 - 6000 MHz1400 MHz
L2 Cache32 MB
L3 Cache36 MB
Cores / Threads24 / 32
8 x 6.0 GHz Intel Raptor Cove P-Core
16 x 4.4 GHz Intel Gracemont E-Core
2 / 22
TDP125 Watt
Technology10 nm32 nm
Die Size257 mm2
max. Temp.100 °C
SocketLGA 1700
FeaturesIntel UHD Graphics 770, DDR5 5600 MT/s, DDR4 3200 MT/s
iGPUIntel UHD Graphics 770 (300 - 1650 MHz)
Architecturex86ARM
$589 U.S.
Announced
Manufacturerark.intel.com

Benchmarks

Performance Rating - CB R15 + R20 + 7-Zip + X265 + Blender + 3DM11 CPU - i9-14900K
51.1 pt (85%)
Restrict / Search: Model: Max. age: years
Cinebench 2024 - Cinebench 2024 CPU Single Core
min: 134     avg: 136.5     median: 137 (77%)     max: 138 Points
Cinebench 2024 - Cinebench 2024 CPU Multi Core
min: 2112     avg: 2189     median: 2146.5 (40%)     max: 2352 Points
Cinebench R23 - Cinebench R23 Multi Core
min: 37606     avg: 39400     median: 39399.5 (37%)     max: 41193 Points
Cinebench R23 - Cinebench R23 Single Core
min: 2174     avg: 2263     median: 2262.5 (95%)     max: 2351 Points
Cinebench R20 - Cinebench R20 CPU (Single Core)
900 Points (98%)
Cinebench R20 - Cinebench R20 CPU (Multi Core)
15466 Points (38%)
Cinebench R15 - Cinebench R15 CPU Multi 64 Bit
min: 5924     avg: 6103     median: 6103 (39%)     max: 6282 Points
Cinebench R15 - Cinebench R15 CPU Single 64 Bit
min: 317     avg: 324.5     median: 324.5 (90%)     max: 332 Points
Cinebench R11.5 - Cinebench R11.5 CPU Multi 64 Bit
72.2 Points (93%)
Cinebench R11.5 - Cinebench R11.5 CPU Single 64 Bit
min: 4.02     avg: 4     median: 4 (95%)     max: 4.21 Points
Cinebench R10 - Cinebench R10 Rend. Single (32bit)
12643 Points (76%)
Cinebench R10 - Cinebench R10 Rend. Multi (32bit)
94801 Points (69%)
Cinebench R10 - Cinebench R10 Rend. Multi (64bit)
144156 Points (92%)
Cinebench R10 - Cinebench R10 Rend. Single (64bit)
18511 Points (23%)
wPrime 2.10 - wPrime 2.0 1024m *
74.5 s (1%)
wPrime 2.10 - wPrime 2.0 32m *
2.1 s (0%)
WinRAR - WinRAR 4.0
16108 Points (26%)
7-Zip 18.03 - 7-Zip 18.03 Multi Thread 4 runs
min: 145144     avg: 146282     median: 145207 (83%)     max: 149570 MIPS
7-Zip 18.03 - 7-Zip 18.03 Single Thread 4 runs
min: 7772     avg: 7893     median: 7932 (93%)     max: 7934 MIPS
X264 HD Benchmark 4.0 - x264 Pass 2
min: 75.9     avg: 181.2     median: 181.2 (61%)     max: 286.5 fps
X264 HD Benchmark 4.0 - x264 Pass 1
min: 257.5     avg: 345.5     median: 345.5 (80%)     max: 433.5 fps
HWBOT x265 Benchmark v2.2 - HWBOT x265 4k Preset
min: 40.8     avg: 41.4     median: 41.1 (72%)     max: 42.8 fps
TrueCrypt - TrueCrypt Serpent
2.8 GB/s (82%)
TrueCrypt - TrueCrypt Twofish
5.8 GB/s (100%)
TrueCrypt - TrueCrypt AES
26.7 GB/s (70%)
Blender - Blender 3.3 Classroom CPU *
min: 135     avg: 143     median: 144.5 (2%)     max: 147 Seconds
Blender - Blender 2.79 BMW27 CPU *
min: 80     avg: 84.6     median: 85 (1%)     max: 87 Seconds
R Benchmark 2.5 - R Benchmark 2.5 *
min: 0.3425     avg: 0.3     median: 0.3 (7%)     max: 0.3504 sec
3DMark 06 - CPU - 3DMark 06 - CPU
min: 20532     avg: 22354     median: 22657.5 (48%)     max: 22928 Points
Super Pi mod 1.5 XS 1M - Super Pi mod 1.5 XS 1M *
5.5 s (1%)
Super Pi mod 1.5 XS 2M - Super Pi mod 1.5 XS 2M *
12 s (1%)
Super Pi Mod 1.5 XS 32M - Super Pi mod 1.5 XS 32M *
280.3 s (1%)
3DMark Vantage - 3DM Vant. Perf. CPU no Physx
min: 11403     avg: 101267     median: 111512 (86%)     max: 114209 Points
3DMark 11 - 3DM11 Performance Physics
min: 28497     avg: 31204     median: 31391 (77%)     max: 32853 Points
3DMark - 3DMark Ice Storm Physics
min: 89084     avg: 104553     median: 105332 (86%)     max: 111347 Points
8%
1 A6x +
8647 Points (7%)
3DMark - 3DMark Ice Storm Extreme Physics
min: 88682     avg: 104672     median: 105402 (86%)     max: 110989 Points
8%
1 A6x +
8627 Points (7%)
3DMark - 3DMark Ice Storm Unlimited Physics
min: 90865     avg: 104818     median: 105098 (87%)     max: 110670 Points
8%
1 A6x +
8850 Points (7%)
3DMark - 3DMark Cloud Gate Physics
min: 27678     avg: 28978     median: 29112 (74%)     max: 30462 Points
3DMark - 3DMark Fire Strike Standard Physics
min: 48193     avg: 52120     median: 52422.5 (93%)     max: 56087 Points
3DMark - 3DMark Time Spy CPU
min: 19418     avg: 22303     median: 22575 (95%)     max: 23721 Points
Geekbench 6.4 - Geekbench 6.4 Single-Core
min: 3108     avg: 3214     median: 3243 (81%)     max: 3294 Points
Geekbench 6.4 - Geekbench 6.4 Multi-Core
min: 20435     avg: 21326     median: 21397 (83%)     max: 21790 Points
Geekbench 6.0 - Geekbench 6.0 Single-Core
min: 2985     avg: 3078     median: 3104 (99%)     max: 3150 Points
Geekbench 6.0 - Geekbench 6.0 Multi-Core
min: 19463     avg: 20452     median: 20693 (85%)     max: 20754 Points
Geekbench 5.5 - Geekbench 5.1 - 5.5 64 Bit Single-Core
min: 2243     avg: 2347     median: 2369 (93%)     max: 2370 Points
Geekbench 5.5 - Geekbench 5.1 - 5.5 64 Bit Multi-Core
min: 24552     avg: 25148     median: 25199 (45%)     max: 25867 Points
Geekbench 5.0 - Geekbench 5.0 64 Bit Single-Core
min: 2177     avg: 2237     median: 2247 (10%)     max: 2280 Points
Geekbench 5.0 - Geekbench 5.0 64 Bit Multi-Core
min: 23151     avg: 24582     median: 24467 (77%)     max: 25496 Points
Geekbench 4.4 - Geekbench 4.1 - 4.4 64 Bit Single-Core
min: 9620     avg: 9873     median: 9872.5 (99%)     max: 10009 Points
Geekbench 4.4 - Geekbench 4.1 - 4.4 64 Bit Multi-Core
min: 82660     avg: 87853     median: 88108.5 (88%)     max: 91119 Points
Geekbench 3 - Geekbench 3 32 Bit Multi-Core
100%
1 A6x +
1424 Points (3%)
Geekbench 3 - Geekbench 3 32 Bit Single-Core
100%
1 A6x +
781 Points (15%)
Geekbench 2 - 32 Bit - Geekbench Stream
100%
1 A6x +
1012 Points (8%)
Geekbench 2 - 32 Bit - Geekbench Memory
100%
1 A6x +
2053 Points (19%)
Geekbench 2 - 32 Bit - Geekbench Floating Point
100%
1 A6x +
2262 Points (4%)
Geekbench 2 - 32 Bit - Geekbench Integer
100%
1 A6x +
1330 Points (3%)
Geekbench 2 - 32 Bit - Geekbench Total Score
100%
1 A6x +
1768 Points (5%)
Linpack Android / IOS - Linpack Multi Thread
100%
1 A6x +
654 MFLOPS (22%)
Linpack Android / IOS - Linpack Single Thread
100%
1 A6x +
382.4 MFLOPS (37%)
Mozilla Kraken 1.1 - Kraken 1.1 Total Score *
min: 413     avg: 415     median: 414 (0%)     max: 418 ms
Sunspider - Sunspider 1.0 Total Score *
100%
1 S5 +
min: 2014     avg: 2022     median: 2022 (22%)     max: 2030 ms
Sunspider - Sunspider 0.9.1 Total Score *
100%
1 A6x +
895 ms (8%)
WebXPRT 4 - WebXPRT 4 Score
min: 332     avg: 334.7     median: 334 (92%)     max: 338 Points
WebXPRT 3 - WebXPRT 3 Score
min: 371     avg: 388.3     median: 386 (69%)     max: 410 Points
CrossMark - CrossMark Overall
min: 2490     avg: 2566     median: 2584 (97%)     max: 2611 Points
Power Consumption - Prime95 Power Consumption - external Monitor *
537 Watt (93%)
Power Consumption - Cinebench R15 Multi Power Consumption - external Monitor *
548 Watt (100%)
Power Consumption - Idle Power Consumption - external Monitor *
min: 64.1     avg: 83.8     median: 77.6 (51%)     max: 151.2 Watt
Power Consumption - Power Efficiency - Cinebench R15 Multi external Monitor
11.5 Points per Watt (9%)

Average Benchmarks Intel Core i9-14900K → 0% n=0

Average Benchmarks Apple S5 → 0% n=0

Average Benchmarks Apple A6x → 0% n=0

- Range of benchmark values for this graphics card
red legend - Average benchmark values for this graphics card
* Smaller numbers mean a higher performance
1 This benchmark is not used for the average calculation

v1.33
log 30. 04:17:04

#0 ran 0s before starting gpusingle class +0s ... 0s

#1 checking url part for id 15092 +0s ... 0s

#2 checking url part for id 11530 +0s ... 0s

#3 checking url part for id 3609 +0s ... 0s

#4 redirected to Ajax server, took 1753841824s time from redirect:0 +0s ... 0s

#5 did not recreate cache, as it is less than 5 days old! Created at Mon, 28 Jul 2025 05:17:35 +0200 +0s ... 0s

#6 composed specs +0.006s ... 0.006s

#7 did output specs +0s ... 0.006s

#8 getting avg benchmarks for device 15092 +0.006s ... 0.011s

#9 got single benchmarks 15092 +0.065s ... 0.077s

#10 getting avg benchmarks for device 11530 +0.001s ... 0.078s

#11 got single benchmarks 11530 +0.004s ... 0.081s

#12 getting avg benchmarks for device 3609 +0.001s ... 0.082s

#13 got single benchmarks 3609 +0.004s ... 0.086s

#14 got avg benchmarks for devices +0s ... 0.086s

#15 min, max, avg, median took s +0.051s ... 0.137s

#16 return log +0s ... 0.137s

Please share our article, every link counts!
Mail Logo
> Expert Reviews and News on Laptops, Smartphones and Tech Innovations > Benchmarks / Tech > Processor Comparison - Head 2 Head
Redaktion, 2017-09- 8 (Update: 2023-07- 1)