Notebookcheck Logo

AMD Ryzen 7 PRO 7840HS vs AMD Ryzen 5 4500U vs AMD Ryzen 7 7840HS

AMD Ryzen 7 PRO 7840HS

► remove from comparison AMD R7 PRO 7840HS

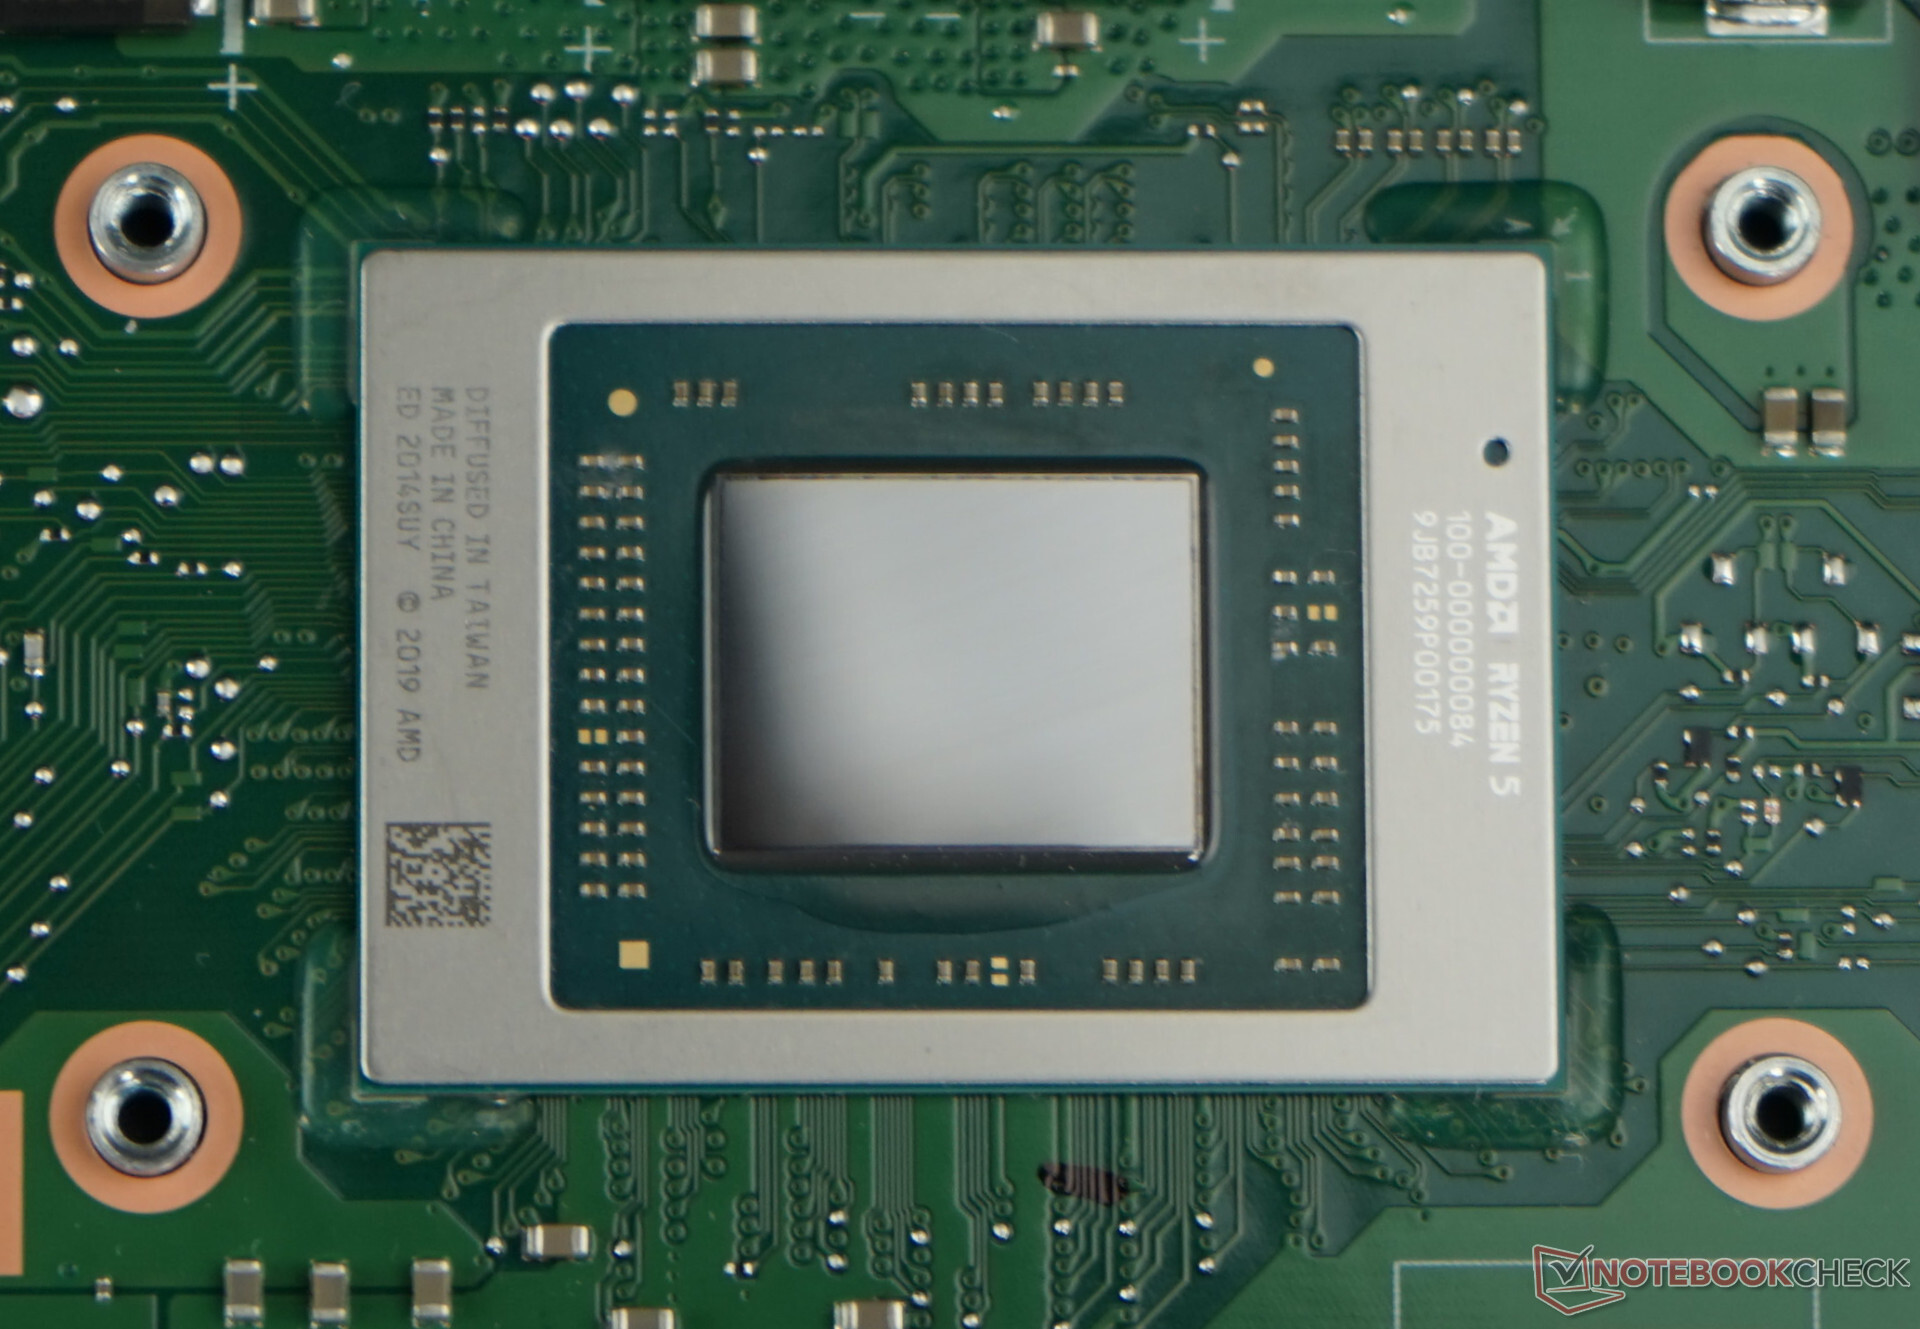
The AMD Ryzen 7 PRO 7840HS is a fast high-end laptop processor of the Phoenix series. It offers 8 cores (octa core) based on the Zen 4 architecture that supports hyperthreading (16 threads). The cores clock from 3.8 (base) up to 5.1 GHz (single core boost). The processor includes 8 MB L2 cache and 16 MB L3 cache.

Compared to the consumer Ryzen 7 7840HS, the PRO models offer additional security, manageability, and reliability features designed for professional users and workstation environments.

The performance of the R7 PRO 7840HS is only slightly below the fastest model, the R9 PRO 7940HS, as the clock speed difference is only minimal (e.g. -100 MHz / 2% slower single core boost). Therefore, the CPU should also perform slightly higher than the old top model Ryzen 9 6980HX (8 Zen 3 cores with up to 4.9 GHz) at 54W TDP and Ryzen 9 6980HS at 35W TDP. Compared to the higher end Dragon Range series, the 7840HS should be similar to the Ryzen 7 7745HX (also 8 Zen 4 cores, max 5.1 GHz, 55W TDP, 32 MB L3).

The chip integrates a modern and fast RDNA 3 graphics adapter (iGPU) called Radeon 780M with 12 CUs and up to 2.7 GHz clock speed. Furthermore, the Phoenix series include a video engine with AV1 de- and encoding, a new Xilinx FPGA based XDNA AI accelerator (Ryzen AI) that should be faster than the AI engine in the Apple M2 SOC and a dual-channel DDR5-5600 / LPDDR5x-7500 memory controller (with ECC support). The connectivity features includes 2 possible USB 4 (40 Gbps) ports and 20 PCIe 4.0 lanes for a GPU and SSDs.

The Phoenix series uses a single monolithic design (unlike the chiplet design of the 7045HX series) and is manufactured on the modern 4nm process at TSMC. The TDP can be configured between 35 and 45 Watt.

AMD Ryzen 5 4500U

► remove from comparison AMD R5 4500U

The AMD Ryzen 5 4500U is an upper mid-range, hexa-core processor of the Renoir product family. The APU was unveiled in H1 2020; it is designed for use in thinner, lighter laptops. Its six Zen 2 CPU cores run at 2.3 GHz (base clock speed) to 4.0 GHz (highest Boost frequency possible). Ryzen 5 4500U features the Vega 6 iGPU.

The sole advantage of Ryzen 5 4600U over Ryzen 5 4500U is the thread-doubling SMT technology support. The former has SMT while the latter does not.

Architecture

Zen 2 is a resounding success, delivering massive improvements over outgoing Zen Plus-based processors. Ryzen 5 4500U is manufactured on the cutting-edge 7 nm TSMC process; it is compatible with dual-channel DDR4-3200 or quad-channel LPDDR4-4266 memory. This processor has 8 MB of Level 3 cache.

While the APU uses Zen 2 cores just like the desktop-grade Ryzen 3000-series processors do, Ryzen 7 3800XT included, it does does not have PCI-Express 4.0 support. It does feature several PCI-Express 3.0 lanes for connecting discrete graphics cards, SSDs and other devices. Four PCI-Express 3.0 lanes allow for read/write rates of up to 3.9 GB/s provided a suitably fast NVMe SSD is used.

Ryzen 5 4500U gets soldered permanently on to the motherboard (FP6 socket interface) and is anything but user-replaceable.

Performance

The average Ryzen 5 4500U in our database nearly matches the Core i5-11300H, the Core i5-11320H and also the AMD Ryzen 3 5300U as far as multi-thread benchmark scores are concerned - thus delivering an undeniably impressive performance jump over the outgoing Ryzen 5 3500U.

Thanks to its decent cooling solution and a long-term power limit of 38 W, the Xiaomi RedmiBook 16 R5 is among the fastest systems powered by the R5 4500U that we know of. It can be about 20% faster in CPU-bound workloads than the slowest system built around the same chip in our database, as of August 2023.

Graphics

Just like its name suggests, the Radeon RX Vega 6 graphics adapter has 6 Compute Units (6 x 64 = 384 unified shaders). In the case of Ryzen 5 4500U, this graphics adapter runs at up to 1,500 MHz. The iGPU definitely supports UHD 2160p monitors at 60 Hz; it will have no trouble HW-decoding HEVC, AVC, VP9, MPEG-2 and other widespread video codecs. AV1 is not supported though; such a video will have to be software-decoded for much lower energy efficiency.

Vega 6 will let you play many titles of 2020 and 2021 as long as you stick to low settings and low resolutions. F1 2021 (720p, Low) runs at 32 fps; Outriders (720p, Low) runs at 27 fps, to give you an example or two. As the iGPU has no VRAM of its own, it is paramount that fast system RAM is used.

Power consumption

This Ryzen chip is very energy efficient, as of mid 2022, thanks to the cutting-edge 7 nm TSMC manufacturing process and the mature Zen 2 architecture.

The Ryzen 5 4500U has a default TDP (also known as the long-term Power Limit) of 15 W that can be changed to anything between 10 W and 25 W by laptop makers if required, a right they use more often than not. Clock speeds and performance will change accordingly as a result. By going for the lowest value, it will be possible to use the APU as the heart of a passively cooled tablet, laptop, mini-PC.

AMD Ryzen 7 7840HS

► remove from comparison AMD R7 7840HS

The Ryzen 7 7840HS is a powerful Phoenix family chip that saw the light of day in H1 2023. The processor features 8 cores (16 threads thanks to SMT support) running at 3.8 GHz. The highest Boost clock speed achievable is 5.1 GHz.

Not only does this APU has full might of the Zen 4 architecture at its disposal, it also comes with the new Ryzen AI technology that's set to make generative AI more ubiquitous than ever before. Last but not the least, the Radeon 780M serves as the integrated GPU.

Architecture & Features

Phoenix family chips are powered by the Zen 4 architecture, much like Dragon Range family chips are. The latter however lacks hardware AI workload acceleration capabilities that Phoenix has. Ryzen AI is coming after Intel's DL Boost and GNA technologies; time will tell if this move by AMD is a good idea.

Perhaps more importantly, Zen 4 introduces AVX512 support (which Zen 3 chips did not have) and, thanks to a plethora of other improvements including larger caches/registers/buffers across the board, is set to bring a double-digit IPC improvement.

Elsewhere, the 7840HS has 16 MB of L3 cache and a seriously fast RAM controller (up to LPDDR5x-7500 and up to DDR5-5600, ECC-enabled memory included). PCI-Express speeds are capped at 1.97 GB/s per lane which corresponds to the 4.0 spec.

This Ryzen 7 series chip is designed to run 64-bit Windows 11, 64-bit Windows 10 or Linux; please note that it isn't overclockable and neither is it user-replaceable. It gets soldered down for good instead (FP7, FP7r2, FP8 socket interfaces).

Performance

The average 7840HS in our database is in the same league as the Core i7-12700H, Core i7-12850HX, Core i9-12900H, Core i9-13900H and also the Ryzen 9 7940HS, as far as multi-thread benchmark scores are concerned. This is a very fast chip, as of Q3 2023.

Your mileage may vary depending on how high the CPU power limits are and how competent the cooling solution of your system is.

Graphics

The Radeon 780M (12 CUs / 768 shaders, up to 2,700 MHz) is capable of powering 4 monitors simultaneously with resolutions as high as SUHD 4320p. It will also have little issue hardware-encoding and hardware-decoding the most widely used video codecs (AV1, HEVC, AVC). As far as gaming is concerned, the thing will let you play most games at 1080p as long as you are fine with moderate quality settings. Long story short, this is the best iGPU money can buy, as of H2 2023.

Your mileage may vary depending on how high the CPU power limits are, how competent the cooling solution of your system is, how fast the RAM of your system is (there is no dedicated VRAM here).

Power consumption

This Ryzen 7 series chip has a long-term power limit (default TDP) of 35 W to 54 W, giving system makers a choice between improving battery life and making the system they're designing insanely fast. Either way, an active cooling solution is a must for a laptop or a mini-PC built around this APU.

The 7840HS is built with TSMC's 4 nm process for high, as of late 2023, energy efficiency.

ModelAMD Ryzen 7 PRO 7840HSAMD Ryzen 5 4500UAMD Ryzen 7 7840HS
SeriesAMD Phoenix (Zen 4, Ryzen 7040)AMD Renoir (Ryzen 4000 APU)AMD Phoenix (Zen 4, Ryzen 7040)
CodenamePhoenix-HS (Zen 4)Renoir-U (Zen 2)Phoenix-HS (Zen 4)
Series: Phoenix (Zen 4, Ryzen 7040) Phoenix-HS (Zen 4)
AMD Ryzen 9 7940HS4 - 5.2 GHz8 / 16 cores16 MB L3
AMD Ryzen 9 PRO 7940HS4 - 5.2 GHz8 / 16 cores16 MB L3
AMD Ryzen 7 7840HS3.8 - 5.1 GHz8 / 16 cores16 MB L3
AMD Ryzen 7 7840S3.8 - 5.1 GHz8 / 16 cores16 MB L3
AMD Ryzen 7 PRO 7840HS « 3.8 - 5.1 GHz8 / 16 cores16 MB L3
AMD Ryzen 5 7640HS4.3 - 5 GHz6 / 12 cores16 MB L3
AMD Ryzen 7 4980U2 - 4.4 GHz8 / 16 cores8 MB L3
AMD Ryzen 7 4800U1.8 - 4.2 GHz8 / 16 cores8 MB L3
AMD Ryzen 7 4700U2 - 4.1 GHz8 / 8 cores8 MB L3
AMD Ryzen 5 4680U2.2 - 4 GHz6 / 12 cores8 MB L3
AMD Ryzen 5 4600U2.1 - 4 GHz6 / 12 cores8 MB L3
AMD Ryzen 5 4500U « 2.3 - 4 GHz6 / 6 cores8 MB L3
AMD Ryzen 3 4300U2.7 - 3.7 GHz4 / 4 cores4 MB L3
AMD Ryzen 9 7940HS4 - 5.2 GHz8 / 16 cores16 MB L3
AMD Ryzen 9 PRO 7940HS4 - 5.2 GHz8 / 16 cores16 MB L3
AMD Ryzen 7 7840HS « 3.8 - 5.1 GHz8 / 16 cores16 MB L3
AMD Ryzen 7 7840S3.8 - 5.1 GHz8 / 16 cores16 MB L3
AMD Ryzen 7 PRO 7840HS3.8 - 5.1 GHz8 / 16 cores16 MB L3
AMD Ryzen 5 7640HS4.3 - 5 GHz6 / 12 cores16 MB L3
Clock3800 - 5100 MHz2300 - 4000 MHz3800 - 5100 MHz
L1 Cache512 KB384 KB512 KB
L2 Cache8 MB3 MB8 MB
L3 Cache16 MB8 MB16 MB
Cores / Threads8 / 16
8 x 5.1 GHz AMD Zen 4
6 / 68 / 16
TDP35 Watt15 Watt35 Watt
Technology4 nm7 nm4 nm
Die Size178 mm2178 mm2
max. Temp.100 °C105 °C100 °C
SocketFP7/FP8FP6FP7/FP7r2/FP8
iGPUAMD Radeon 780M ( - 2700 MHz)AMD Radeon RX Vega 6 (Ryzen 4000/5000) ( - 1500 MHz)AMD Radeon 780M ( - 2700 MHz)
Architecturex86x86x86
Announced
Manufacturerwww.amd.comwww.amd.com
FeaturesDDR4-3200/LPDDR4-4266 RAM, PCIe 3, MMX, SSE, SSE2, SSE3, SSSE3, SSE4A, SSE4.1, SSE4.2, AVX, AVX2, BMI2, ABM, FMA, ADX, SMEP, SMAP, CPB, AES-NI, RDRAND, RDSEED, SHA, SMEDDR5-5600/LPDDR5x-7500 RAM (incl. ECC), PCIe 4, Ryzen AI, MMX, SSE, SSE2, SSE3, SSSE3, SSE4A, SSE4.1, SSE4.2, AVX, AVX2, AVX-512, BMI2, ABM, FMA, ADX, SMEP, SMAP, SMT, CPB, AES-NI, RDRAND, RDSEED, SHA, SME

Benchmarks

Performance Rating - CB R15 + R20 + 7-Zip + X265 + Blender + 3DM11 CPU - R7 PRO 7840HS
44.4 pt (62%)
Performance Rating - CB R15 + R20 + 7-Zip + X265 + Blender + 3DM11 CPU - R5 4500U
30.5 pt (42%)
Performance Rating - CB R15 + R20 + 7-Zip + X265 + Blender + 3DM11 CPU - R7 7840HS
45.7 pt (63%)
Cinebench 2024 - CB24 CPU Single Core
min: 103.4     avg: 103.7     median: 103.7 (72%)     max: 104 Points
min: 101     avg: 104.5     median: 105 (73%)     max: 107 Points
Cinebench 2024 - CB24 CPU Multi Core
min: 852     avg: 882     median: 881.5 (16%)     max: 911 Points
min: 880     avg: 918     median: 918 (17%)     max: 956 Points
Cinebench R23 - Cinebench R23 Multi Core
min: 14240     avg: 15052     median: 15051.5 (14%)     max: 15863 Points
5920 Points (5%)
min: 15515     avg: 16432     median: 16282.5 (15%)     max: 17214 Points
Cinebench R23 - Cinebench R23 Single Core
min: 1691     avg: 1733     median: 1732.5 (74%)     max: 1774 Points
1152 Points (49%)
min: 1737     avg: 1771     median: 1775 (75%)     max: 1812 Points
Cinebench R20 - Cinebench R20 CPU (Single Core)
min: 651     avg: 672     median: 672 (75%)     max: 693 Points
min: 424     avg: 445.8     median: 447.5 (50%)     max: 453 Points
min: 661     avg: 686     median: 689 (77%)     max: 705 Points
Cinebench R20 - Cinebench R20 CPU (Multi Core)
min: 5327     avg: 5781     median: 5781 (14%)     max: 6235 Points
min: 1843     avg: 2236     median: 2219 (5%)     max: 2530 Points
min: 6061     avg: 6418     median: 6361.5 (16%)     max: 6744 Points
Cinebench R15 - Cinebench R15 CPU Multi 64 Bit
min: 2361     avg: 2440     median: 2440 (15%)     max: 2519 Points
min: 715     avg: 896     median: 892 (6%)     max: 1007 Points
min: 2473     avg: 2592     median: 2565 (16%)     max: 2729 Points
Cinebench R15 - Cinebench R15 CPU Single 64 Bit
min: 262     avg: 269     median: 269 (81%)     max: 276 Points
min: 156     avg: 172.8     median: 174 (52%)     max: 177 Points
min: 270     avg: 277.9     median: 279 (84%)     max: 286 Points
Cinebench R11.5 - Cinebench R11.5 CPU Multi 64 Bit
min: 10.22     avg: 10.9     median: 10.9 (14%)     max: 11.6 Points
min: 29.7     avg: 30     median: 30 (39%)     max: 30.25 Points
Cinebench R11.5 - Cinebench R11.5 CPU Single 64 Bit
min: 2.02     avg: 2     median: 2 (50%)     max: 2.04 Points
min: 3.29     avg: 3.3     median: 3.3 (82%)     max: 3.33 Points
Cinebench R10 - Cinebench R10 Rend. Single (32bit)
min: 5319     avg: 5337     median: 5337 (32%)     max: 5355 Points
min: 7574     avg: 7642     median: 7641.5 (46%)     max: 7709 Points
Cinebench R10 - Cinebench R10 Rend. Multi (32bit)
min: 22934     avg: 24156     median: 24155.5 (18%)     max: 25377 Points
min: 45602     avg: 47933     median: 47933 (35%)     max: 50264 Points
Cinebench R10 - Cinebench R10 Rend. Multi (64bit)
38477 Points (27%)
min: 83726     avg: 85395     median: 85395 (59%)     max: 87064 Points
Cinebench R10 - Cinebench R10 Rend. Single (64bit)
9139 Points (11%)
min: 14015     avg: 14096     median: 14096 (17%)     max: 14177 Points
wPrime 2.10 - wPrime 2.0 1024m *
min: 170.4     avg: 171.9     median: 171.9 (2%)     max: 173.4 s
min: 71.922     avg: 72.4     median: 72.4 (1%)     max: 72.819 s
wPrime 2.10 - wPrime 2.0 32m *
min: 5.7     avg: 7.8     median: 8.3 (2%)     max: 9.48 s
min: 2.626     avg: 2.6     median: 2.6 (1%)     max: 2.658 s
WinRAR - WinRAR 4.0
min: 3420     avg: 3493     median: 3493 (6%)     max: 3566 Points
min: 6428     avg: 7064     median: 7063.5 (11%)     max: 7699 Points
7-Zip 18.03 - 7-Zip 18.03 Multli Thread 4 runs
min: 62497     avg: 66442     median: 66442 (38%)     max: 70387 MIPS
min: 22466     avg: 24384     median: 24101 (14%)     max: 25891 MIPS
min: 59538     avg: 69052     median: 70243 (40%)     max: 73035 MIPS
7-Zip 18.03 - 7-Zip 18.03 Single Thread 4 runs
min: 6493     avg: 6496     median: 6495.5 (78%)     max: 6498 MIPS
min: 4235     avg: 4290     median: 4288 (51%)     max: 4338 MIPS
min: 6049     avg: 6559     median: 6632 (79%)     max: 6754 MIPS
X264 HD Benchmark 4.0 - x264 Pass 2
59.3 fps (21%)
min: 144.1     avg: 146.7     median: 146.7 (51%)     max: 149.3 fps
X264 HD Benchmark 4.0 - x264 Pass 1
210 fps (48%)
min: 281.5     avg: 289.8     median: 289.8 (67%)     max: 298 fps
HWBOT x265 Benchmark v2.2 - HWBOT x265 4k Preset
min: 18.1     avg: 19     median: 19 (33%)     max: 19.9 fps
min: 5.86     avg: 6.8     median: 6.9 (12%)     max: 7.33 fps
min: 11.7     avg: 19.8     median: 20.4 (36%)     max: 21.8 fps
TrueCrypt - TrueCrypt Serpent
min: 0.511     avg: 0.5     median: 0.5 (0%)     max: 0.541 GB/s
1.3 GB/s (0%)
TrueCrypt - TrueCrypt Twofish
min: 0.865     avg: 0.9     median: 0.9 (15%)     max: 0.922 GB/s
2.1 GB/s (36%)
TrueCrypt - TrueCrypt AES
4.9 GB/s (13%)
min: 14.7     avg: 14.8     median: 14.8 (39%)     max: 14.9 GB/s
Blender - Blender 3.3 Classroom CPU *
min: 325     avg: 327     median: 327 (4%)     max: 329 Seconds
min: 298     avg: 324.8     median: 318 (4%)     max: 463 Seconds
Blender - Blender 2.79 BMW27 CPU *
min: 201     avg: 203     median: 203 (1%)     max: 205 Seconds
min: 533     avg: 603     median: 584 (4%)     max: 748 Seconds
min: 185     avg: 198.7     median: 196 (1%)     max: 229 Seconds
R Benchmark 2.5 - R Benchmark 2.5 *
min: 0.44     avg: 0.4     median: 0.4 (10%)     max: 0.4487 sec
min: 0.614     avg: 0.6     median: 0.6 (14%)     max: 0.654 sec
min: 0.4184     avg: 0.4     median: 0.4 (9%)     max: 0.4739 sec
3DMark 06 - CPU - 3DMark 06 - CPU
14772 Points (31%)
min: 8933     avg: 8934     median: 8933.5 (19%)     max: 8934 Points
min: 15312     avg: 15685     median: 15663 (33%)     max: 16073 Points
Super Pi mod 1.5 XS 1M - Super Pi mod 1.5 XS 1M *
min: 10     avg: 10.3     median: 10.3 (2%)     max: 10.5 s
min: 7.112     avg: 7.9     median: 7.9 (2%)     max: 8.774 s
Super Pi mod 1.5 XS 2M - Super Pi mod 1.5 XS 2M *
24 s (1%)
min: 17.697     avg: 19.5     median: 19.5 (1%)     max: 21.271 s
Super Pi Mod 1.5 XS 32M - Super Pi mod 1.5 XS 32M *
min: 620     avg: 622     median: 622 (3%)     max: 624 s
min: 655.388     avg: 690     median: 689.9 (3%)     max: 724.411 s
3DMark Vantage - 3DM Vant. Perf. CPU no Physx
79794 Points (70%)
min: 76708     avg: 82457     median: 83358.5 (73%)     max: 85884 Points
3DMark 11 - 3DM11 Performance Physics
min: 17015     avg: 20787     median: 20787 (56%)     max: 24559 Points
min: 7061     avg: 8121     median: 8095 (22%)     max: 8704 Points
min: 17320     avg: 22184     median: 22615 (61%)     max: 25584 Points
3DMark - 3DMark Ice Storm Physics
min: 61260     avg: 63475     median: 63892 (52%)     max: 65272 Points
min: 77280     avg: 89035     median: 91414 (74%)     max: 93910 Points
3DMark - 3DMark Ice Storm Extreme Physics
min: 57910     avg: 62775     median: 63587.5 (52%)     max: 66013 Points
min: 84349     avg: 89853     median: 91645 (74%)     max: 93208 Points
3DMark - 3DMark Ice Storm Unlimited Physics
min: 68588     avg: 69178     median: 69062 (58%)     max: 69884 Points
min: 84416     avg: 91454     median: 92596 (78%)     max: 95508 Points
3DMark - 3DMark Cloud Gate Physics
min: 6900     avg: 7494     median: 7616 (19%)     max: 7925 Points
min: 13602     avg: 19711     median: 20681 (52%)     max: 21602 Points
3DMark - 3DMark Fire Strike Standard Physics
min: 26669     avg: 27465     median: 27464.5 (49%)     max: 28260 Points
min: 9800     avg: 11318     median: 11477 (20%)     max: 12259 Points
min: 24338     avg: 27680     median: 27921 (50%)     max: 29343 Points
3DMark - 3DMark Time Spy CPU
min: 10679     avg: 10990     median: 10990 (46%)     max: 11301 Points
min: 3316     avg: 3759     median: 3734 (16%)     max: 4187 Points
min: 9433     avg: 11035     median: 11145 (47%)     max: 12218 Points
Geekbench 6.2 - Geekbench 6.2 Single-Core
min: 2419     avg: 2546     median: 2581 (78%)     max: 2638 Points
min: 2585     avg: 2662     median: 2670 (81%)     max: 2721 Points
Geekbench 6.2 - Geekbench 6.2 Multi-Core
min: 10518     avg: 12078     median: 12457 (49%)     max: 13259 Points
min: 12111     avg: 12974     median: 13100 (52%)     max: 13498 Points
Geekbench 5.5 - Geekbench 5.1 - 5.4 64 Bit Single-Core
min: 1822     avg: 1888     median: 1887.5 (80%)     max: 1953 Points
min: 1082     avg: 1109     median: 1097 (46%)     max: 1220 Points
min: 1837     avg: 1968     median: 1967 (83%)     max: 2017 Points
Geekbench 5.5 - Geekbench 5.1 - 5.4 64 Bit Multi-Core
min: 10034     avg: 11037     median: 11036.5 (20%)     max: 12039 Points
min: 4352     avg: 4774     median: 4632 (8%)     max: 6234 Points
min: 8446     avg: 11651     median: 11872 (21%)     max: 12339 Points
Geekbench 5.0 - Geekbench 5.0 64 Bit Single-Core
1074 Points (5%)
min: 1834     avg: 1896     median: 1900 (8%)     max: 1936 Points
Geekbench 5.0 - Geekbench 5.0 64 Bit Multi-Core
4282 Points (14%)
min: 8572     avg: 11439     median: 11933 (38%)     max: 12278 Points
Geekbench 4.4 - Geekbench 4.1 - 4.4 64 Bit Single-Core
min: 4486     avg: 4624     median: 4624 (46%)     max: 4762 Points
min: 7924     avg: 8100     median: 8148 (81%)     max: 8166 Points
Geekbench 4.4 - Geekbench 4.1 - 4.4 64 Bit Multi-Core
min: 17798     avg: 18561     median: 18561 (20%)     max: 19324 Points
min: 47599     avg: 48417     median: 48498 (53%)     max: 48906 Points
Geekbench 3 - Geekbench 3 32 Bit Multi-Core
18690 Points (33%)
Geekbench 3 - Geekbench 3 32 Bit Single-Core
3960 Points (77%)
Geekbench 3 - Geekbench 3 64 Bit Multi-Core
19029 Points (30%)
Geekbench 3 - Geekbench 3 64 Bit Single-Core
4162 Points (62%)
Geekbench 2 - 32 Bit - Geekbench Stream
6630 Points (53%)
Geekbench 2 - 32 Bit - Geekbench Memory
5771 Points (52%)
Geekbench 2 - 32 Bit - Geekbench Floating Point
20968 Points (41%)
Geekbench 2 - 32 Bit - Geekbench Integer
16596 Points (33%)
Geekbench 2 - 32 Bit - Geekbench Total Score
14964 Points (39%)
Mozilla Kraken 1.1 - Kraken 1.1 Total Score *
539 ms (1%)
min: 819     avg: 851     median: 853 (1%)     max: 871 ms
min: 485     avg: 508     median: 508 (1%)     max: 544 ms
Sunspider - Sunspider 1.0 Total Score *
99 ms (1%)
Sunspider - Sunspider 0.9.1 Total Score *
90.9 ms (1%)
Octane V2 - Octane V2 Total Score
89380 Points (80%)
min: 33759     avg: 43608     median: 48506 (44%)     max: 48558 Points
min: 91356     avg: 91588     median: 91577 (82%)     max: 91831 Points
WebXPRT 4 - WebXPRT 4 Score
min: 222     avg: 242     median: 242 (70%)     max: 262 Points
min: 220     avg: 261.3     median: 263 (76%)     max: 319 Points
WebXPRT 3 - WebXPRT 3 Score
min: 311     avg: 363     median: 363 (76%)     max: 415 Points
min: 191     avg: 196.5     median: 197 (41%)     max: 202 Points
min: 288     avg: 316.9     median: 322 (67%)     max: 339 Points
CrossMark - CrossMark Overall
min: 1574     avg: 1620     median: 1620 (62%)     max: 1666 Points
816 Points (31%)
min: 1566     avg: 1770     median: 1801 (69%)     max: 1993 Points
Power Consumption - Prime95 Power Consumption - external Monitor *
min: 76.6     avg: 83     median: 83 (14%)     max: 89.4 Watt
min: 28.8     avg: 42     median: 43 (7%)     max: 53 Watt
min: 64.7     avg: 94.4     median: 89.6 (15%)     max: 137.9 Watt
Power Consumption - Cinebench R15 Multi Power Consumption - external Monitor *
min: 85.9     avg: 86.8     median: 86.8 (16%)     max: 87.7 Watt
min: 26.8     avg: 37.8     median: 30.7 (6%)     max: 53 Watt
min: 74.7     avg: 102.2     median: 93 (17%)     max: 135.7 Watt
Power Consumption - Idle Power Consumption - external Monitor *
min: 5.01     avg: 5.2     median: 5.2 (3%)     max: 5.32 Watt
min: 4.73     avg: 14.6     median: 11.8 (8%)     max: 59.2 Watt
Power Consumption - Idle Power Consumption 150cd 1min *
min: 5.11     avg: 6.3     median: 6.3 (7%)     max: 7.44 Watt
min: 7.09     avg: 13.7     median: 12.6 (14%)     max: 35.5 Watt
Power Consumption - Cinebench R15 Multi Power Efficiency - external Monitor
27.5 Points per Watt (20%)
min: 16.5     avg: 24.7     median: 25.3 (19%)     max: 31.7 Points per Watt
min: 20.1     avg: 27     median: 28.4 (21%)     max: 33.2 Points per Watt

Average Benchmarks AMD Ryzen 7 PRO 7840HS → 100% n=21

Average Benchmarks AMD Ryzen 5 4500U → 56% n=21

Average Benchmarks AMD Ryzen 7 7840HS → 104% n=21

- Range of benchmark values for this graphics card
- Average benchmark values for this graphics card
* Smaller numbers mean a higher performance
1 This benchmark is not used for the average calculation

v1.26
log 12. 11:31:11

#0 checking url part for id 15054 +0s ... 0s

#1 checking url part for id 11687 +0s ... 0s

#2 checking url part for id 14948 +0s ... 0s

#3 not redirecting to Ajax server +0s ... 0s

#4 did not recreate cache, as it is less than 5 days old! Created at Fri, 10 May 2024 05:37:21 +0200 +0.001s ... 0.001s

#5 composed specs +0.063s ... 0.064s

#6 did output specs +0s ... 0.064s

#7 getting avg benchmarks for device 15054 +0.022s ... 0.086s

#8 got single benchmarks 15054 +0.015s ... 0.101s

#9 getting avg benchmarks for device 11687 +0.019s ... 0.119s

#10 got single benchmarks 11687 +0.07s ... 0.189s

#11 getting avg benchmarks for device 14948 +0.015s ... 0.204s

#12 got single benchmarks 14948 +0.073s ... 0.278s

#13 got avg benchmarks for devices +0s ... 0.278s

#14 min, max, avg, median took s +0.554s ... 0.832s

#15 return log +0s ... 0.832s

Please share our article, every link counts!
> Expert Reviews and News on Laptops, Smartphones and Tech Innovations > Benchmarks / Tech > Processor Comparison - Head 2 Head
Redaktion, 2017-09- 8 (Update: 2023-07- 1)