Intel HD Graphics 510 vs Intel Iris Plus Graphics 640
Intel HD Graphics 510 ► remove from comparison
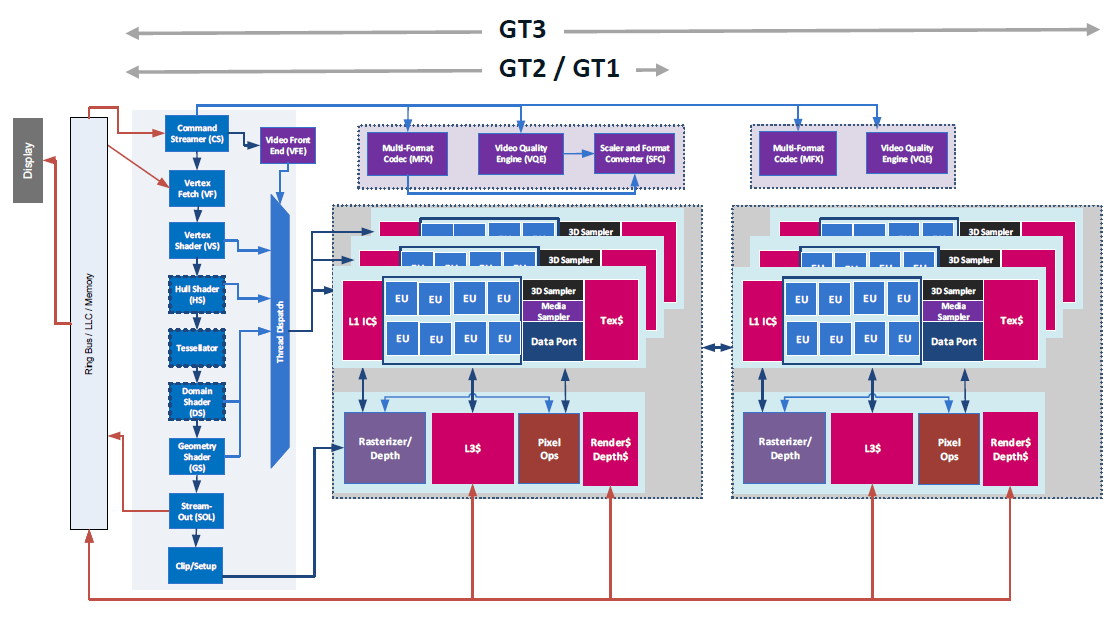
The Intel HD Graphics 510 (GT1) is an integrated graphics unit, which can be found in low-end ULV (Ultra Low Voltage) processors of the Skylake generation. This "GT1" version of the Skylake GPU offers 12 Execution Units (EUs) clocked at up to 950 MHz (depending on the CPU model). Due to its lack of dedicated graphics memory or eDRAM cache, the HD 510 has to access the main memory (2x 64bit DDR3L-1600 / DDR4-2133).
Performance
Depending on various factors like memory configuration, the HD Graphics 510 should perform sligthly below the older HD Graphics 4400 and will handle modern games (as of 2015) only in lowest settings (if it does at all).
Features
The revised video engine now decodes H.265/HEVC completely in hardware and thereby much more efficiently than before. Displays can be connected via DP 1.2 / eDP 1.3 (max. 3840 x 2160 @ 60 Hz), whereas HDMI is limited to the older version 1.4a (max. 3840 x 2160 @ 30 Hz). However, HDMI 2.0 can be added using a DisplayPort converter. Up to three displays can be controlled simultaneously.
Power Consumption
The HD Graphics 510 can be found in mobile processors specified at 15 W TDP and is therefore suited for compact laptops and ultrabooks.
Intel Iris Plus Graphics 640 ► remove from comparison
The Intel Iris Plus Graphics 640 (GT3e) is a processor graphics card for Kaby Lake models announced in January 2017. As the successor to the Intel Iris Graphics 540 (Skylake), the Iris Plus Graphics 640 is used for 15-Watt ULV models and is equipped with 64 MB eDRAM cache. There should not be any big changes compared to the Iris Graphics 540.
The so called GT3e version of the Kaby Lake GPU still has 48 Execution Units (EUs), which can reach up to 1050 MHz depending on the model. Besides eDRAM cache, the Iris 640 can also access the system memory (2x 64 Bit DDR3L-1600/LPDDR3-1866/DDR4-2400) via processor interface.
Compared to the Iris Plus 650 from the 28-Watt models, the Iris 640 only has a slightly lower maximum clock as well as the lower TDP, so the utilization of the Turbo Boost potential should be worse.
Performance
The exact performance of the Iris Plus Graphics 640 depends on the CPU model, because maximum clock as well as the size of the L3 cache can differ a bit. The system memory (DDR3/DDR4) will influence the performance as well.
The fastest chips are high-clocked Core i7 models like the Core i7-7660U . Depending on the game, the Iris Plus 640 will probably be similar to the previous model somewhere between a dedicated GeForce 920M and GeForce 940M and is usually limited to low settings in modern games.
Features
The reworked video engine now fully supports hardware decoding of H.265/HEVC videos. Contrary to Skylake, however, Kaby Lake can now also decode H.265/HEVC Main 10 with a 10-bit color depth as well as Google's VP9 codec. The video output is possible via DP 1.2/eDP 1.3 (up to 3840 x 2160 @60 Hz), whereas HDMI is also supported in the older 1.4a standard. An HDMI 2.0 output can be added via converter from DisplayPort. The GPU can drive up to three displays simultaneously.
Power Consumption
The Iris Plus Graphics 640 is used for 15-Watt ULV processor and therefore thin notebooks and Ultrabooks.
Intel HD Graphics 510 Intel Iris Plus Graphics 640 Gen. 9.5 Series Codename Skylake GT1 Kaby Lake GT3e Architecture Gen. 9 Skylake Gen. 9.5 Kaby Lake Pipelines 12 - unified 48 - unified Core Speed 300 - 950 (Boost) MHz 300 - 1050 (Boost) MHz Memory Bus Width 64/128 Bit 64/128 Bit Memory Type DDR3/DDR4 DDR3/DDR4 Shared Memory yes yes API DirectX 12_1, OpenGL 4.4 DirectX 12_1, OpenGL 4.4 technology 14 nm 14 nm Features QuickSync QuickSync Date of Announcement 01.09.2015 03.01.2017 Max. Amount of Memory 64 MB
Benchmarks Performance Rating - 3DMark 11 + Fire Strike + Time Spy - HD Graphics 510
0.3 pt (1%)
...
...
max:
3DMark - 3DMark Time Spy Score
min: 467 avg: 499.8 median: 494.5 (1%) max: 543 Points
3DMark - 3DMark Time Spy Graphics
min: 413 avg: 442.5 median: 437 (1%) max: 483 Points
3DMark - 3DMark Ice Storm Unlimited Graphics
43274 Points (5%)
min: 142163 avg: 147298 median: 145481 (16%) max: 154251 Points
3DMark - 3DMark Ice Storm Extreme Graphics
26846 Points (3%)
3DMark - 3DMark Cloud Gate Score
4721 Points (5%)
min: 7558 avg: 8025 median: 8067 (9%) max: 8711 Points
3DMark - 3DMark Cloud Gate Graphics
5664 Points (1%)
min: 10486 avg: 11119 median: 11248 (3%) max: 11495 Points
3DMark - 3DMark Fire Strike Standard Score
570 Points (1%)
min: 1236 avg: 1349 median: 1310 (2%) max: 1509 Points
3DMark - 3DMark Fire Strike Standard Graphics
621 Points (1%)
min: 1315 avg: 1411 median: 1393.5 (2%) max: 1541 Points
3DMark - 3DMark Ice Storm Graphics
62653 Points (8%)
3DMark 11 - 3DM11 Performance Score
985 Points (1%)
min: 2136 avg: 2440 median: 2561 (4%) max: 2664 Points
3DMark 11 - 3DM11 Performance GPU
847 Points (1%)
min: 1980 avg: 2275 median: 2379 (2%) max: 2493 Points
3DMark Vantage + Intel HD Graphics 510 3DMark Vantage - 3DM Vant. Perf. total
3798 Points (1%)
3DM Vant. Perf. GPU no PhysX + Intel HD Graphics 510 3DMark Vantage - 3DM Vant. Perf. GPU no PhysX
3125 Points (2%)
3DMark 06 3DMark 06 - Standard 1280x1024 + Intel HD Graphics 510
7253 Points (9%)
Model CPU GPU RAM Value 3DMark 06 - Standard 1280x1024 Asus Vivobook F556UQ-XO626D (3DMark 06 - Standard 1280x1024) 6198DU HD Graphics 510 100 MHz8 GB 7253
3DMark 06 - Standard 1280x1024 + Intel Iris Plus Graphics 640
min: 13164 avg: 14118 median: 14117.5 (18%) max: 15071 Points
Unigine Valley 1.0 - Unigine Valley 1.0 DX
6.5 fps (2%)
Unigine Heaven 3.0 - Unigine Heaven 3.0 DX 11
9.3 fps (3%)
Unigine Heaven 3.0 - Unigine Heaven 3.0 OpenGL
10.8 fps (5%)
Unigine Heaven 2.1 - Heaven 2.1 high
13.5 fps (3%)
Cinebench R10 Cinebench R10 Shading (32bit) + Intel HD Graphics 510 Cinebench R10 - Cinebench R10 Shading (32bit)
7348 Points (5%)
Cinebench R10 Shading (32bit) + Intel Iris Plus Graphics 640
min: 8824 avg: 9678 median: 9703 (7%) max: 10506 Points
Cinebench R11.5 Cinebench R11.5 OpenGL 64 Bit + Intel HD Graphics 510 Cinebench R11.5 - Cinebench R11.5 OpenGL 64 Bit
17.2 fps (6%)
Cinebench R11.5 OpenGL 64 Bit + Intel Iris Plus Graphics 640
46.1 fps (16%)
Cinebench R15 + Intel HD Graphics 510 Cinebench R15 - Cinebench R15 OpenGL 64 Bit
28 fps (2%)
Cinebench R15 OpenGL 64 Bit + Intel Iris Plus Graphics 640
min: 41.32 avg: 54 median: 56.2 (3%) max: 62.3 fps
Cinebench R15 OpenGL Ref. Match 64 Bit + Intel Iris Plus Graphics 640 Cinebench R15 - Cinebench R15 OpenGL Ref. Match 64 Bit
min: 97.8 avg: 98.2 median: 97.8 (98%) max: 99.3 %
GFXBench - GFXBench Car Chase Offscreen
35.9 fps (4%)
40.7 fps (5%)
GFXBench 3.1 - GFXBench Manhattan ES 3.1 Offscreen
51.7 fps (1%)
56.1 fps (1%)
GFXBench 3.0 - GFXBench 3.0 Manhattan Offscreen
64.6 fps (4%)
31.2 fps (2%)
GFXBench (DX / GLBenchmark) 2.7 + Intel HD Graphics 510 GFXBench (DX / GLBenchmark) 2.7 - GFXBench T-Rex HD Offscreen C24Z16
121.9 fps (1%)
GFXBench T-Rex HD Offscreen C24Z16 + Intel Iris Plus Graphics 640
171 fps (1%)
LuxMark v2.0 64Bit - LuxMark v2.0 Room GPU
167 Samples/s (1%)
min: 315 avg: 325 median: 325 (1%) max: 335 Samples/s
LuxMark v2.0 64Bit - LuxMark v2.0 Sala GPU
302 Samples/s (1%)
min: 748 avg: 779 median: 778.5 (1%) max: 809 Samples/s
ComputeMark v2.1 - ComputeMark v2.1 Result
500 Points (1%)
min: 1575 avg: 1677 median: 1677 (2%) max: 1779 Points
Power Consumption - Furmark Stress Test Power Consumption - external Monitor *
min: 30.8 avg: 33.6 median: 31.5 (4%) max: 38.5 Watt
Power Consumption - The Witcher 3 Power Consumption - external Monitor *
min: 28 avg: 33.5 median: 33.5 (5%) max: 38.9 Watt
Power Consumption - Witcher 3 Power Consumption *
min: 31.7 avg: 34.9 median: 34.9 (8%) max: 38.1 Watt
Power Consumption - Witcher 3 ultra Power Efficiency - external Monitor
0.1 fps per Watt (9%)
Emissions Witcher 3 Fan Noise + Intel Iris Plus Graphics 640 Emissions - Witcher 3 Fan Noise
33.4 dB(A) (53%)
Clock Speed - GPU Clock Witcher 3 ultra
min: 748 avg: 823 median: 823 (32%) max: 898 MHz
Clock Speed - GPU Clock Speed Furmark
min: 570 avg: 634 median: 634 (25%) max: 698 MHz
Average Benchmarks Intel HD Graphics 510 → 100% n=18 Average Benchmarks Intel Iris Plus Graphics 640 → 205% n=18
- Range of benchmark values for this graphics card
- Average benchmark values for this graphics card
* Smaller numbers mean a higher performance
1 This benchmark is not used for the average calculation
Game Benchmarks The following benchmarks stem from our benchmarks of review laptops. The performance depends on the used graphics memory, clock rate, processor, system settings, drivers, and operating systems. So the results don't have to be representative for all laptops with this GPU. For detailed information on the benchmark results, click on the fps number.
Iris Plus Graphics 640:
13.8 fps
Iris Plus Graphics 640:
28 fps
Iris Plus Graphics 640:
69.5 (!) [X] Microsoft Surface Laptop i7 Intel Core i7-7660U 2.5GHz
Iris Plus Graphics 640
min:
59 fps, max:
78 fps
fps
Iris Plus Graphics 640:
38.8 (!) [X] Microsoft Surface Laptop i7 Intel Core i7-7660U 2.5GHz
Iris Plus Graphics 640
min:
34 fps, max:
43 fps
fps
Iris Plus Graphics 640:
33 38 ~ 36 fps
Iris Plus Graphics 640:
15 15 ~ 15 fps
Iris Plus Graphics 640:
22.9 fps
Iris Plus Graphics 640:
99 fps
Iris Plus Graphics 640:
48 fps
Iris Plus Graphics 640:
31.8 fps
Iris Plus Graphics 640:
39.9 45.4 ~ 43 fps
Iris Plus Graphics 640:
17.9 18.1 ~ 18 fps
Iris Plus Graphics 640:
14.8 fps
Iris Plus Graphics 640:
33.8 fps
Iris Plus Graphics 640:
20.4 fps
Iris Plus Graphics 640:
16 16.6 ~ 16 fps
Iris Plus Graphics 640:
30.8 33.5 ~ 32 fps
Iris Plus Graphics 640:
11.8 12.7 ~ 12 fps
100%
HD Graphics 510:
18.3 [X] Asus Vivobook F556UQ-XO626D Intel Core i5-6198DU 2.3GHz
HD Graphics 510
fps
100%
HD Graphics 510:
19.9 [X] Asus Vivobook F556UQ-XO626D Intel Core i5-6198DU 2.3GHz
HD Graphics 510
fps
221%
Iris Plus Graphics 640:
42.9 45 ~ 44 fps
100%
HD Graphics 510:
15.4 [X] Asus Vivobook F556UQ-XO626D Intel Core i5-6198DU 2.3GHz
HD Graphics 510
fps
204%
Iris Plus Graphics 640:
31.4 fps
Iris Plus Graphics 640:
22.9 fps
100%
HD Graphics 510:
70.6 [X] Asus Vivobook F556UQ-XO626D Intel Core i5-6198DU 2.3GHz
HD Graphics 510
fps
171%
Iris Plus Graphics 640:
121 fps
100%
HD Graphics 510:
41.3 [X] Asus Vivobook F556UQ-XO626D Intel Core i5-6198DU 2.3GHz
HD Graphics 510
fps
220%
Iris Plus Graphics 640:
91 fps
Iris Plus Graphics 640:
31.6 fps
Iris Plus Graphics 640:
17.8 fps
Iris Plus Graphics 640:
19.6 24.2 ~ 22 fps
Iris Plus Graphics 640:
9.2 11.1 ~ 10 fps
100%
HD Graphics 510:
24.5 [X] Asus Vivobook F556UQ-XO626D Intel Core i5-6198DU 2.3GHz
HD Graphics 510
fps
100%
HD Graphics 510:
9.4 [X] Asus Vivobook F556UQ-XO626D Intel Core i5-6198DU 2.3GHz
HD Graphics 510
fps
Iris Plus Graphics 640:
20.2 fps
Iris Plus Graphics 640:
19.5 fps
100%
HD Graphics 510:
13.4 [X] Asus Vivobook F556UQ-XO626D Intel Core i5-6198DU 2.3GHz
HD Graphics 510
fps
186%
Iris Plus Graphics 640:
24.9 fps
100%
HD Graphics 510:
7.7 [X] Asus Vivobook F556UQ-XO626D Intel Core i5-6198DU 2.3GHz
HD Graphics 510
fps
Iris Plus Graphics 640:
28 fps
Iris Plus Graphics 640:
13 fps
100%
HD Graphics 510:
11.1 [X] Asus Vivobook F556UQ-XO626D Intel Core i5-6198DU 2.3GHz
HD Graphics 510
fps
225%
Iris Plus Graphics 640:
23.5 25.8 ~ 25 fps
100%
HD Graphics 510:
7 [X] Asus Vivobook F556UQ-XO626D Intel Core i5-6198DU 2.3GHz
HD Graphics 510
fps
257%
Iris Plus Graphics 640:
16.7 19.4 ~ 18 fps
Iris Plus Graphics 640:
9.1 fps
100%
HD Graphics 510:
25 [X] Asus Vivobook F556UQ-XO626D Intel Core i5-6198DU 2.3GHz
HD Graphics 510
fps
100%
HD Graphics 510:
15.9 [X] Asus Vivobook F556UQ-XO626D Intel Core i5-6198DU 2.3GHz
HD Graphics 510
fps
Iris Plus Graphics 640:
14.2 fps
Iris Plus Graphics 640:
44.7 fps
Iris Plus Graphics 640:
26.2 fps
Iris Plus Graphics 640:
12.9 fps
100%
HD Graphics 510:
19.9 [X] Asus Vivobook F556UQ-XO626D Intel Core i5-6198DU 2.3GHz
HD Graphics 510
fps
100%
HD Graphics 510:
11 [X] Asus Vivobook F556UQ-XO626D Intel Core i5-6198DU 2.3GHz
HD Graphics 510
fps
100%
HD Graphics 510:
48.7 [X] Asus Vivobook F556UQ-XO626D Intel Core i5-6198DU 2.3GHz
HD Graphics 510
fps
100%
HD Graphics 510:
29.2 [X] Asus Vivobook F556UQ-XO626D Intel Core i5-6198DU 2.3GHz
HD Graphics 510
fps
100%
HD Graphics 510:
38.9 [X] Asus Vivobook F556UQ-XO626D Intel Core i5-6198DU 2.3GHz
HD Graphics 510
fps
100%
HD Graphics 510:
25.2 [X] Asus Vivobook F556UQ-XO626D Intel Core i5-6198DU 2.3GHz
HD Graphics 510
fps
100%
HD Graphics 510:
66.2 [X] Asus Vivobook F556UQ-XO626D Intel Core i5-6198DU 2.3GHz
HD Graphics 510
fps
121%
Iris Plus Graphics 640:
68 92 ~ 80 fps
100%
HD Graphics 510:
41.8 [X] Asus Vivobook F556UQ-XO626D Intel Core i5-6198DU 2.3GHz
HD Graphics 510
fps
141%
Iris Plus Graphics 640:
55 63.7 ~ 59 fps
Iris Plus Graphics 640:
27.6 29.5 ~ 29 fps
Iris Plus Graphics 640:
19.8 23 ~ 21 fps
Iris Plus Graphics 640:
13.4 fps
Iris Plus Graphics 640:
4 fps
100%
HD Graphics 510:
110.4 [X] Asus Vivobook F556UQ-XO626D Intel Core i5-6198DU 2.3GHz
HD Graphics 510
fps
100%
HD Graphics 510:
19.3 [X] Asus Vivobook F556UQ-XO626D Intel Core i5-6198DU 2.3GHz
HD Graphics 510
fps
100%
HD Graphics 510:
30.9 [X] Asus Vivobook F556UQ-XO626D Intel Core i5-6198DU 2.3GHz
HD Graphics 510
fps
183%
Iris Plus Graphics 640:
56.7 fps
100%
HD Graphics 510:
26.8 [X] Asus Vivobook F556UQ-XO626D Intel Core i5-6198DU 2.3GHz
HD Graphics 510
fps
108%
Iris Plus Graphics 640:
28.9 fps
Iris Plus Graphics 640:
11.8 fps
100%
HD Graphics 510:
31.5 [X] Asus Vivobook F556UQ-XO626D Intel Core i5-6198DU 2.3GHz
HD Graphics 510
fps
100%
HD Graphics 510:
22.2 [X] Asus Vivobook F556UQ-XO626D Intel Core i5-6198DU 2.3GHz
HD Graphics 510
fps
100%
HD Graphics 510:
72 [X] Asus Vivobook F556UQ-XO626D Intel Core i5-6198DU 2.3GHz
HD Graphics 510
fps
100%
HD Graphics 510:
47 [X] Asus Vivobook F556UQ-XO626D Intel Core i5-6198DU 2.3GHz
HD Graphics 510
fps
100%
HD Graphics 510:
173.7 [X] Asus Vivobook F556UQ-XO626D Intel Core i5-6198DU 2.3GHz
HD Graphics 510
fps
100%
HD Graphics 510:
32.2 [X] Asus Vivobook F556UQ-XO626D Intel Core i5-6198DU 2.3GHz
HD Graphics 510
fps
Iris Plus Graphics 640:
28.6 fps
Iris Plus Graphics 640:
20.2 20.8 ~ 21 fps
100%
HD Graphics 510:
135.5 [X] Asus Vivobook F556UQ-XO626D Intel Core i5-6198DU 2.3GHz
HD Graphics 510
fps
100%
HD Graphics 510:
32.8 [X] Asus Vivobook F556UQ-XO626D Intel Core i5-6198DU 2.3GHz
HD Graphics 510
fps
100%
HD Graphics 510:
33.4 [X] Asus Vivobook F556UQ-XO626D Intel Core i5-6198DU 2.3GHz
HD Graphics 510
fps
156%
Iris Plus Graphics 640:
43.1 60.3 ~ 52 fps
100%
HD Graphics 510:
22.5 [X] Asus Vivobook F556UQ-XO626D Intel Core i5-6198DU 2.3GHz
HD Graphics 510
fps
160%
Iris Plus Graphics 640:
29.7 42 ~ 36 fps
100%
HD Graphics 510:
15.9 [X] Asus Vivobook F556UQ-XO626D Intel Core i5-6198DU 2.3GHz
HD Graphics 510
fps
170%
Iris Plus Graphics 640:
23.2 30.7 ~ 27 fps
Iris Plus Graphics 640:
8.2 9.9 ~ 9 fps
100%
HD Graphics 510:
39 [X] Asus Vivobook F556UQ-XO626D Intel Core i5-6198DU 2.3GHz
HD Graphics 510
fps
167%
Iris Plus Graphics 640:
61 68.2 ~ 65 fps
100%
HD Graphics 510:
20.1 [X] Asus Vivobook F556UQ-XO626D Intel Core i5-6198DU 2.3GHz
HD Graphics 510
fps
214%
Iris Plus Graphics 640:
40.2 45.1 ~ 43 fps
100%
HD Graphics 510:
17.7 [X] Asus Vivobook F556UQ-XO626D Intel Core i5-6198DU 2.3GHz
HD Graphics 510
fps
203%
Iris Plus Graphics 640:
33.5 38.3 ~ 36 fps
Iris Plus Graphics 640:
10.7 12.5 ~ 12 fps
100%
HD Graphics 510:
52.7 [X] Asus Vivobook F556UQ-XO626D Intel Core i5-6198DU 2.3GHz
HD Graphics 510
fps
224%
Iris Plus Graphics 640:
103 132.6 ~ 118 fps
100%
HD Graphics 510:
23.9 [X] Asus Vivobook F556UQ-XO626D Intel Core i5-6198DU 2.3GHz
HD Graphics 510
fps
255%
Iris Plus Graphics 640:
54.1 68.7 ~ 61 fps
100%
HD Graphics 510:
16.2 [X] Asus Vivobook F556UQ-XO626D Intel Core i5-6198DU 2.3GHz
HD Graphics 510
fps
259%
Iris Plus Graphics 640:
37 47.1 ~ 42 fps
Iris Plus Graphics 640:
17.2 21.6 ~ 19 fps
Iris Plus Graphics 640:
35.2 fps
Iris Plus Graphics 640:
28.5 fps
Average Gaming Intel HD Graphics 510 → 100% Average Gaming 30-70 fps → 100%
Average Gaming Intel Iris Plus Graphics 640 → 193% Average Gaming 30-70 fps → 197%
For more games that might be playable and a list of all games and graphics cards visit our Gaming List
v1.26
log 01. 16:22:33
#0 checking url part for id 6475 +0s ... 0s
#1 checking url part for id 7656 +0s ... 0s
#2 not redirecting to Ajax server +0s ... 0s
#3 did not recreate cache, as it is less than 5 days old! Created at Sat, 01 Jun 2024 05:39:27 +0200 +0.001s ... 0.001s
#4 composed specs +0.095s ... 0.097s
#5 did output specs +0s ... 0.097s
#6 start showIntegratedCPUs +0s ... 0.097s
#7 getting avg benchmarks for device 6475 +0.047s ... 0.143s
#8 got single benchmarks 6475 +0.018s ... 0.162s
#9 getting avg benchmarks for device 7656 +0.002s ... 0.164s
#10 got single benchmarks 7656 +0.017s ... 0.181s
#11 got avg benchmarks for devices +0s ... 0.181s
#12 min, max, avg, median took s +0.261s ... 0.441s
#13 before gaming benchmark output +0s ... 0.441s
#14 Got 175 rows for game benchmarks. +0.018s ... 0.46s
#15 composed SQL query for gamebenchmarks +0s ... 0.46s
#16 got data and put it in $dataArray +0.028s ... 0.488s
#17 benchmarks composed for output. +0.09s ... 0.579s
#18 calculated avg scores. +0s ... 0.579s
#19 return log +0.047s ... 0.625s
Please share our article, every link counts!
Redaktion, 2017-09- 8 (Update: 2023-07- 1)
 Deutsch
 English
 Español
 Français
 Italiano
 Nederlands
 Polski
 Português
 Русский
 Türkçe
 Svenska
 Chinese
 Magyar