Qualcomm Adreno 640 vs Intel Iris Plus Graphics 655
Qualcomm Adreno 640 ► remove from comparison
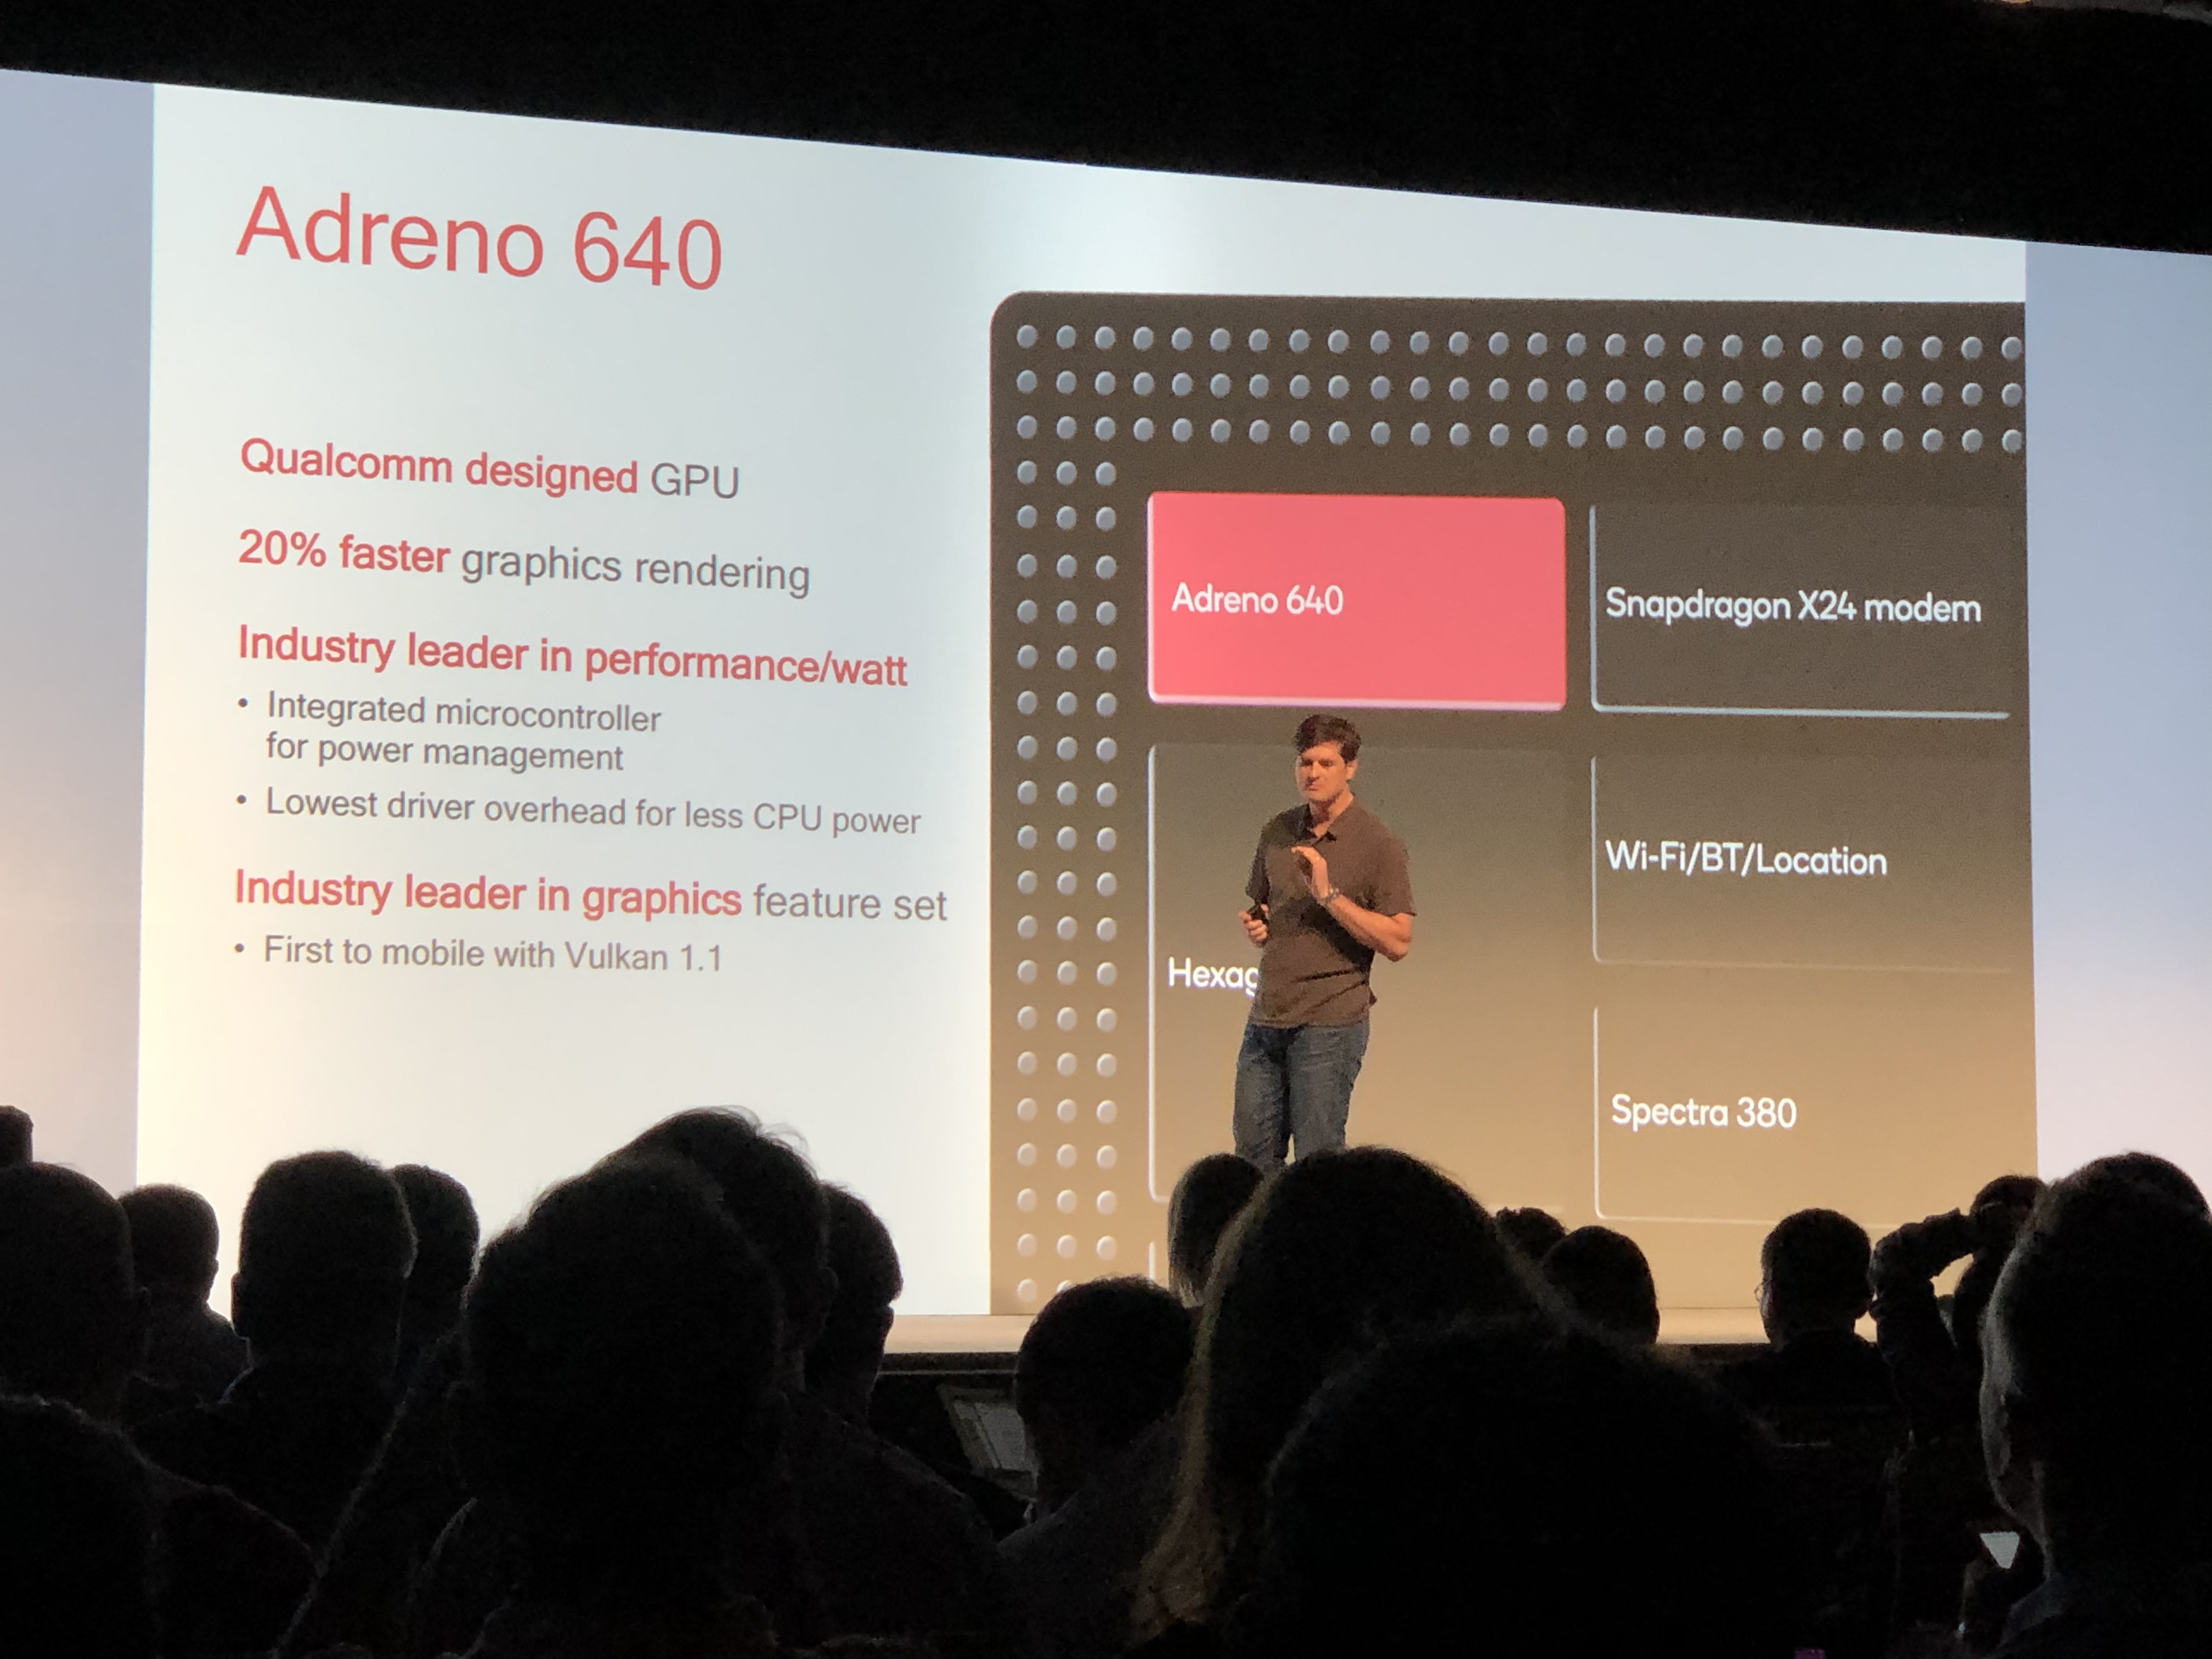
The Qualcomm Adreno 640 is a smartphone and tablet GPU that is integrated within the Qualcomm Snapdragon 855 SoC. The chip will be available from early 2019 and will be used mainly in high-end Android devices.
According to Qualcomm, the Adreno 640 GPU offers a 20% improved performance over the Adreno 630, its predecessor, which is integrated in the Snapdragon 845 SoC. The enhanced performance is achieved by the Adreno 640 having 50% more FP16 and FP32 compute units (ALUs) than the Adreno 630, while its 7 nm FinFET manufacturing process makes it 20% more efficient too.
The Adreno 640 will also support the Vulkan 1.1 API, something which is possible for other Adreno 600 series GPUs too.
Intel Iris Plus Graphics 655 ► remove from comparison
The Intel Iris Plus Graphics 655 (GT3e) is a processor graphics card announced in September 2017. As the successor to the Intel Iris Graphics 650 (Kaby Lake), the Iris Plus Graphics 655 is used for 28-Watt Coffee Lake-U models. The biggest difference is the doubled eDRAM-cache at 128 MB. There should not be any big changes compared to the Iris Graphics 650.
The so called GT3e version of the Kaby Lake GPU still has 48 Execution Units (EUs), which can reach up to 1200 MHz (previously 1100 MHz) depending on the model. Besides eDRAM cache, the Iris 655 can also access the system memory (2x 64 Bit DDR3L-2133/DDR4-2400) via processor interface.
Compared to the Iris Plus 640 from the 15-Watt models, the Iris 655 only has a slightly higher maximum clock as well as almost twice the TDP, which allows a better utilization of the Turbo Boost potential.
The exact performance of the Iris Plus Graphics 655 depends on the CPU model, because maximum clock as well as the size of the L3 cache can differ a bit. The system memory (DDR3/DDR4) will influence the performance as well.
The fastest chips are high-clocked Core i7 models like the Core i7-8559U. Depending on the game, the Iris Plus 655 will probably be on par with a dedicated GeForce 930M or GeForce 940MX and can handle smooth gameplay in modern titles in low up to medium settings.
The reworked video engine now fully supports hardware decoding of H.265/HEVC videos. Contrary to Skylake, however, Kaby Lake can now also decode H.265/HEVC Main 10 with a 10-bit color depth as well as Google's VP9 codec. The video output is possible via DP 1.2/eDP 1.3 (up to 3840 x 2160 @60 Hz), whereas HDMI is also supported in the older 1.4a standard. An HDMI 2.0 output can be added via converter from DisplayPort. The GPU can drive up to three displays simultaneously.
The Iris Plus Graphics 655 is used for 28-Watt processor and therefore small/medium-sized notebooks.
Qualcomm Adreno 640 Intel Iris Plus Graphics 655 Gen. 9.5 Series Shared Memory yes yes API DirectX 12, OpenGL ES 3.2 DirectX 12_1, OpenGL 4.5 technology 10 nm 14 nm Features OpenGL ES 3.2, OpenCL 2.0, DirectX 12, Vulkan 1.1 QuickSync Date of Announcement 12.02.2018 01.09.2017 Codename Kaby Lake GT3e Architecture Gen. 9.5 Kaby Lake Pipelines 48 - unified Core Speed 300 - 1200 (Boost) MHz Memory Type DDR3/DDR4
Benchmarks Performance Rating - 3DMark 11 + Fire Strike + Time Spy - Iris Plus Graphics 655
0.9 pt (3%)
Intel Iris Plus Graphics 655
...
max:
3DMark - 3DMark Time Spy Score
min: 348 avg: 647 median: 684 (2%) max: 722 Points
3DMark - 3DMark Time Spy Graphics
min: 301 avg: 570 median: 604.5 (2%) max: 633 Points
3DMark - 3DMark Ice Storm Unlimited Graphics
min: 97354 avg: 108080 median: 106829 (12%) max: 118129 Points
min: 131607 avg: 139716 median: 137266 (16%) max: 152727 Points
3DMark - 3DMark Ice Storm Extreme Graphics
min: 57033 avg: 72655 median: 71073 (9%) max: 89859 Points
3DMark - 3DMark Cloud Gate Score
min: 6769 avg: 10798 median: 11622 (12%) max: 13037 Points
3DMark - 3DMark Cloud Gate Graphics
min: 6498 avg: 13736 median: 14343 (4%) max: 16698 Points
3DMark - 3DMark Fire Strike Standard Score
min: 852 avg: 1703 median: 1850 (3%) max: 2040 Points
3DMark - 3DMark Fire Strike Standard Graphics
min: 920 avg: 1836 median: 1983 (2%) max: 2260 Points
3DMark - 3DMark Ice Storm Graphics
min: 85405 avg: 107151 median: 110302 (13%) max: 122594 Points
3DMark - 3DMark Sling Shot (ES 3.0) Unlimited
min: 5268 avg: 7441 median: 7659 (33%) max: 8661 Points
3DMark - 3DMark Sling Shot (ES 3.0) Unlimited Graphics
min: 6358 avg: 9988 median: 10199 (22%) max: 12070 Points
3DMark - 3DMark Sling Shot Extreme (ES 3.1) Unlimited
min: 3969 avg: 6014 median: 6182 (31%) max: 6981 Points
3DMark - 3DMark Sling Shot Extreme (ES 3.1) Unlimited Graphics
min: 5184 avg: 7016 median: 7072.5 (21%) max: 8218 Points
3DMark - 3DMark Wild Life Unlimited
min: 3079 avg: 3323 median: 3436 (2%) max: 3455 Points
3DMark - 3DMark Wild Life Extreme Unlimited
min: 864 avg: 936 median: 970 (1%) max: 974 Points
3DMark 11 - 3DM11 Performance Score
min: 1548 avg: 2942 median: 3180.5 (4%) max: 3349 Points
3DMark 11 - 3DM11 Performance GPU
min: 1365 avg: 2707 median: 2894 (2%) max: 3081 Points
3DMark Vantage + Intel Iris Plus Graphics 655 3DMark Vantage - 3DM Vant. Perf. total
min: 12093 avg: 12287 median: 12287 (4%) max: 12481 Points
3DM Vant. Perf. GPU no PhysX + Intel Iris Plus Graphics 655 3DMark Vantage - 3DM Vant. Perf. GPU no PhysX
min: 10337 avg: 10514 median: 10513.5 (6%) max: 10690 Points
3DMark 05 - 3DMark 05 - Standard
22740 Points (25%)
3DMark 06 3DMark 06 - Standard 1280x1024 + Intel Iris Plus Graphics 655
min: 17176 avg: 17885 median: 17885 (23%) max: 18594 Points
Unigine Valley 1.0 - Unigine Valley 1.0 DX
8.2 fps (3%)
SPECviewperf 12 + Intel Iris Plus Graphics 655 SPECviewperf 12 - specvp12 sw-03
28.2 fps (7%)
specvp12 snx-02 + Intel Iris Plus Graphics 655 SPECviewperf 12 - specvp12 snx-02
2.1 fps (0%)
specvp12 showcase-01 + Intel Iris Plus Graphics 655 SPECviewperf 12 - specvp12 showcase-01
10.3 fps (2%)
specvp12 mediacal-01 + Intel Iris Plus Graphics 655 SPECviewperf 12 - specvp12 mediacal-01
4.6 fps (1%)
specvp12 maya-04 + Intel Iris Plus Graphics 655 SPECviewperf 12 - specvp12 maya-04
20.4 fps (6%)
specvp12 energy-01 + Intel Iris Plus Graphics 655 SPECviewperf 12 - specvp12 energy-01
0.3 fps (0%)
specvp12 creo-01 + Intel Iris Plus Graphics 655 SPECviewperf 12 - specvp12 creo-01
14.9 fps (6%)
specvp12 catia-04 + Intel Iris Plus Graphics 655 SPECviewperf 12 - specvp12 catia-04
18.8 fps (3%)
specvp12 3dsmax-05 + Intel Iris Plus Graphics 655 SPECviewperf 12 - specvp12 3dsmax-05
18.1 fps (3%)
SPECviewperf 13 specvp13 sw-04 + Intel Iris Plus Graphics 655 SPECviewperf 13 - specvp13 sw-04
34.6 fps (9%)
specvp13 snx-03 + Intel Iris Plus Graphics 655 SPECviewperf 13 - specvp13 snx-03
3.8 fps (0%)
specvp13 showcase-02 + Intel Iris Plus Graphics 655 SPECviewperf 13 - specvp13 showcase-02
10.3 fps (2%)
specvp13 medical-02 + Intel Iris Plus Graphics 655 SPECviewperf 13 - specvp13 medical-02
3.8 fps (1%)
specvp13 maya-05 + Intel Iris Plus Graphics 655 SPECviewperf 13 - specvp13 maya-05
25.9 fps (3%)
specvp13 energy-02 + Intel Iris Plus Graphics 655 SPECviewperf 13 - specvp13 energy-02
1.1 fps (0%)
specvp13 creo-02 + Intel Iris Plus Graphics 655 SPECviewperf 13 - specvp13 creo-02
19.6 fps (3%)
specvp13 catia-05 + Intel Iris Plus Graphics 655 SPECviewperf 13 - specvp13 catia-05
26.4 fps (3%)
specvp13 3dsmax-06 + Intel Iris Plus Graphics 655 SPECviewperf 13 - specvp13 3dsmax-06
18.2 fps (3%)
SPECviewperf 2020 specvp2020 solidworks-05 4k + Intel Iris Plus Graphics 655 SPECviewperf 2020 - specvp2020 solidworks-05 4k
21.2 fps (6%)
specvp2020 snx-04 4k + Intel Iris Plus Graphics 655 SPECviewperf 2020 - specvp2020 snx-04 4k
3.8 fps (0%)
specvp2020 medical-03 4k + Intel Iris Plus Graphics 655 SPECviewperf 2020 - specvp2020 medical-03 4k
1.8 fps (2%)
specvp2020 maya-06 4k + Intel Iris Plus Graphics 655 SPECviewperf 2020 - specvp2020 maya-06 4k
32.7 fps (5%)
specvp2020 energy-03 4k + Intel Iris Plus Graphics 655 SPECviewperf 2020 - specvp2020 energy-03 4k
1.1 fps (0%)
specvp2020 creo-03 4k + Intel Iris Plus Graphics 655 SPECviewperf 2020 - specvp2020 creo-03 4k
12.1 fps (6%)
specvp2020 catia-06 4k + Intel Iris Plus Graphics 655 SPECviewperf 2020 - specvp2020 catia-06 4k
6.3 fps (4%)
specvp2020 3dsmax-07 4k + Intel Iris Plus Graphics 655 SPECviewperf 2020 - specvp2020 3dsmax-07 4k
8.4 fps (3%)
Cinebench R10 Cinebench R10 Shading (32bit) + Intel Iris Plus Graphics 655 Cinebench R10 - Cinebench R10 Shading (32bit)
min: 7836 avg: 9544 median: 10263 (7%) max: 10533 Points
Cinebench R11.5 Cinebench R11.5 OpenGL 64 Bit + Intel Iris Plus Graphics 655 Cinebench R11.5 - Cinebench R11.5 OpenGL 64 Bit
min: 50.25 avg: 51.4 median: 51.6 (18%) max: 52.2 fps
Cinebench R15 + Intel Iris Plus Graphics 655 Cinebench R15 - Cinebench R15 OpenGL 64 Bit
min: 33.91 avg: 67 median: 74 (4%) max: 88 fps
Cinebench R15 OpenGL Ref. Match 64 Bit + Intel Iris Plus Graphics 655 Cinebench R15 - Cinebench R15 OpenGL Ref. Match 64 Bit
min: 97.8 avg: 98.1 median: 97.8 (98%) max: 99.3 %
GFXBench - GFXBench 5.0 4K Aztec Ruins High Tier Offscreen
6.6 fps (3%)
GFXBench - GFXBench 5.0 Aztec Ruins High Tier Offscreen
min: 8.5 avg: 17.5 median: 17 (3%) max: 39 fps
GFXBench - GFXBench 5.0 Aztec Ruins Normal Tier Offscreen
min: 16 avg: 40.5 median: 42 (3%) max: 47 fps
GFXBench - GFXBench Car Chase Offscreen
min: 22 avg: 40.2 median: 42 (5%) max: 48 fps
GFXBench 3.1 - GFXBench Manhattan ES 3.1 Offscreen
min: 35 avg: 64.4 median: 69 (1%) max: 79 fps
min: 43.1 avg: 2387 median: 2387.1 (50%) max: 4731 fps
GFXBench 3.0 - GFXBench 3.0 Manhattan Offscreen
min: 50 avg: 94.7 median: 99.5 (6%) max: 112 fps
199.6 fps (12%)
GFXBench (DX / GLBenchmark) 2.7 + Qualcomm Adreno 640 GFXBench (DX / GLBenchmark) 2.7 - GFXBench T-Rex HD Offscreen C24Z16
min: 85 avg: 158.9 median: 166 (1%) max: 185 fps
GFXBench T-Rex HD Offscreen C24Z16 + Intel Iris Plus Graphics 655
min: 199.6 avg: 6375 median: 6375.3 (51%) max: 12551 fps
Antutu v9 - AnTuTu v9 GPU
min: 204205 avg: 204715 median: 204715 (26%) max: 205225 Points
Basemark GPU 1.2 - Basemark GPU 1.2 Vulkan Official Medium Offscreen 1080
64.9 fps (0%)
Geekbench 6.2 - Geekbench 6.2 GPU OpenCL
2968 Points (1%)
Geekbench 6.2 - Geekbench 6.2 GPU Vulkan
2419 Points (1%)
LuxMark v2.0 64Bit - LuxMark v2.0 Room GPU
min: 359 avg: 419.5 median: 419.5 (2%) max: 480 Samples/s
LuxMark v2.0 64Bit - LuxMark v2.0 Sala GPU
min: 882 avg: 1038 median: 1038 (2%) max: 1194 Samples/s
ComputeMark v2.1 - ComputeMark v2.1 Result
min: 1584 avg: 1713 median: 1712.5 (2%) max: 1841 Points
PassMark PerformanceTest Mobile V1 - PerformanceTest Mobile V1 2D Graphics Tests
min: 10504 avg: 18251 median: 14922.5 (15%) max: 40654 Points
PassMark PerformanceTest Mobile V1 - PerformanceTest Mobile V1 3D Graphics Tests
min: 4244 avg: 11804 median: 5422.5 (9%) max: 44840 Points
Power Consumption - Furmark Stress Test Power Consumption - external Monitor *
min: 28.9 avg: 37.4 median: 39.2 (6%) max: 42.4 Watt
Power Consumption - The Witcher 3 Power Consumption - external Monitor *
min: 35.3 avg: 40.6 median: 39.4 (6%) max: 47.2 Watt
Power Consumption - Witcher 3 Power Consumption *
min: 39.4 avg: 43.3 median: 43.3 (10%) max: 47.2 Watt
Power Consumption - GFXBench Aztec Ruins Normal Tier Offscreen Power Consumption 150cd *
7.8 Watt (3%)
Power Consumption - Witcher 3 ultra Power Efficiency
0.1 fps per Watt (14%)
Power Consumption - Witcher 3 ultra Power Efficiency - external Monitor
0.2 fps per Watt (13%)
Emissions Witcher 3 Fan Noise + Intel Iris Plus Graphics 655 Emissions - Witcher 3 Fan Noise
min: 32.5 avg: 36.2 median: 37.2 (60%) max: 39 dB(A)
Clock Speed - GPU Clock Witcher 3 ultra
998 MHz (39%)
Average Benchmarks Qualcomm Adreno 640 → 100% n=4 Average Benchmarks Intel Iris Plus Graphics 655 → 1907% n=4
- Range of benchmark values for this graphics card
- Average benchmark values for this graphics card
* Smaller numbers mean a higher performance
1 This benchmark is not used for the average calculation
Game Benchmarks The following benchmarks stem from our benchmarks of review laptops. The performance depends on the used graphics memory, clock rate, processor, system settings, drivers, and operating systems. So the results don't have to be representative for all laptops with this GPU. For detailed information on the benchmark results, click on the fps number.
Iris Plus Graphics 655:
44.6 fps
Iris Plus Graphics 655:
21.6 fps
Iris Plus Graphics 655:
16.4 fps
Iris Plus Graphics 655:
10.2 fps
100%
Adreno 640:
30 30 [X] Xiaomi Pad 5 1.61.6
Qualcomm Snapdragon 860 GHz
Adreno 640
min:
30 fps, max:
30 fps
~ 30 fps
Iris Plus Graphics 655:
40.7 fps
Iris Plus Graphics 655:
19.1 fps
Iris Plus Graphics 655:
14.5 fps
Iris Plus Graphics 655:
9.6 fps
Iris Plus Graphics 655:
54.8 fps
Iris Plus Graphics 655:
17.3 fps
Iris Plus Graphics 655:
11.6 fps
Iris Plus Graphics 655:
0 (!) [X] Intel NUC8i7BE Intel Core i7-8559U 2.7GHz
Iris Plus Graphics 655
fps
Iris Plus Graphics 655:
29.1 [X] Intel NUC8i7BE Intel Core i7-8559U 2.7GHz
Iris Plus Graphics 655
min:
17 fps, max:
36 fps
fps
Iris Plus Graphics 655:
16.2 [X] Intel NUC8i7BE Intel Core i7-8559U 2.7GHz
Iris Plus Graphics 655
min:
11 fps, max:
22 fps
fps
Iris Plus Graphics 655:
14.1 [X] Intel NUC8i7BE Intel Core i7-8559U 2.7GHz
Iris Plus Graphics 655
min:
11 fps, max:
21 fps
fps
Iris Plus Graphics 655:
6.6 [X] Intel NUC8i7BE Intel Core i7-8559U 2.7GHz
Iris Plus Graphics 655
min:
3 fps, max:
9 fps
fps
Iris Plus Graphics 655:
59.8 [X] Intel NUC8i7BE Intel Core i7-8559U 2.7GHz
Iris Plus Graphics 655
min:
56 fps, max:
62 fps
fps
Iris Plus Graphics 655:
27.2 [X] Intel NUC8i7BE Intel Core i7-8559U 2.7GHz
Iris Plus Graphics 655
min:
20 fps, max:
31 fps
fps
Iris Plus Graphics 655:
15.8 [X] Intel NUC8i7BE Intel Core i7-8559U 2.7GHz
Iris Plus Graphics 655
min:
3.7 fps, P1:
6.17 fps, max:
130 fps
fps
Iris Plus Graphics 655:
0 (!) [X] Intel NUC8i7BE Intel Core i7-8559U 2.7GHz
Iris Plus Graphics 655
fps
Iris Plus Graphics 655:
36.3 (!) [X] Intel NUC8i7BE Intel Core i7-8559U 2.7GHz
Iris Plus Graphics 655
P1:
24.6 fps
fps
Iris Plus Graphics 655:
20.9 (!) [X] Intel NUC8i7BE Intel Core i7-8559U 2.7GHz
Iris Plus Graphics 655
P1:
14.5 fps
fps
Iris Plus Graphics 655:
0 (!) [X] Intel NUC8i7BE Intel Core i7-8559U 2.7GHz
Iris Plus Graphics 655
fps
Iris Plus Graphics 655:
92 [X] Intel NUC8i7BE DirectX 11
Intel Core i7-8559U 2.7GHz
Iris Plus Graphics 655
P1:
74.1 fps
fps
Iris Plus Graphics 655:
55.9 [X] Intel NUC8i7BE DirectX 11
Intel Core i7-8559U 2.7GHz
Iris Plus Graphics 655
P1:
47.4 fps
fps
Iris Plus Graphics 655:
46.3 [X] Intel NUC8i7BE DirectX 11
Intel Core i7-8559U 2.7GHz
Iris Plus Graphics 655
P1:
35.6 fps
fps
Iris Plus Graphics 655:
34.9 [X] Intel NUC8i7BE DirectX 11
Intel Core i7-8559U 2.7GHz
Iris Plus Graphics 655
P1:
31.3 fps
fps
Iris Plus Graphics 655:
26.5 [X] Intel NUC8i7BE DirectX 11
Intel Core i7-8559U 2.7GHz
Iris Plus Graphics 655
P1:
24 fps
fps
Iris Plus Graphics 655:
13.6 [X] Intel NUC8i7BE DirectX 11
Intel Core i7-8559U 2.7GHz
Iris Plus Graphics 655
P1:
12 fps
fps
Iris Plus Graphics 655:
22.5 23.5 ~ 23 fps
Iris Plus Graphics 655:
10.2 10.4 ~ 10 fps
Iris Plus Graphics 655:
6.4 6.7 ~ 7 fps
Iris Plus Graphics 655:
25.4 (!) [X] Intel NUC8i7BE Intel Core i7-8559U 2.7GHz
Iris Plus Graphics 655
min:
20 fps, max:
31 fps
fps
Iris Plus Graphics 655:
51.2 [X] Intel NUC8i7BE Intel Core i7-8559U 2.7GHz
Iris Plus Graphics 655
min:
46 fps, max:
56 fps
fps
Iris Plus Graphics 655:
21.9 [X] Intel NUC8i7BE Intel Core i7-8559U 2.7GHz
Iris Plus Graphics 655
min:
19 fps, max:
23 fps
fps
Iris Plus Graphics 655:
19.3 [X] Intel NUC8i7BE Intel Core i7-8559U 2.7GHz
Iris Plus Graphics 655
min:
17 fps, max:
21 fps
fps
Iris Plus Graphics 655:
56.7 [X] Intel NUC8i7BE Intel Core i7-8559U 2.7GHz
Iris Plus Graphics 655
min:
51 fps, max:
63 fps
fps
Iris Plus Graphics 655:
18.5 [X] Intel NUC8i7BE Intel Core i7-8559U 2.7GHz
Iris Plus Graphics 655
min:
14 fps, max:
24 fps
fps
Iris Plus Graphics 655:
10.5 [X] Intel NUC8i7BE Intel Core i7-8559U 2.7GHz
Iris Plus Graphics 655
min:
8 fps, max:
13 fps
fps
Iris Plus Graphics 655:
24.5 fps
Iris Plus Graphics 655:
30.2 [X] Intel NUC8i7BE Intel Core i7-8559U 2.7GHz
Iris Plus Graphics 655
min:
26 fps, max:
34 fps
fps
Iris Plus Graphics 655:
35 fps
Iris Plus Graphics 655:
64 [X] Intel NUC8i7BE Intel Core i7-8559U 2.7GHz
Iris Plus Graphics 655
min:
57 fps, max:
76 fps
fps
Iris Plus Graphics 655:
22.8 [X] Intel NUC8i7BE Intel Core i7-8559U 2.7GHz
Iris Plus Graphics 655
min:
20 fps, max:
25 fps
fps
Iris Plus Graphics 655:
16.6 [X] Intel NUC8i7BE Intel Core i7-8559U 2.7GHz
Iris Plus Graphics 655
min:
8 fps, max:
21 fps
fps
Iris Plus Graphics 655:
21 22 [X] Intel NUC8i7BE Intel Core i7-8559U 2.7GHz
Iris Plus Graphics 655
min:
19 fps, max:
27 fps
~ 22 fps
Iris Plus Graphics 655:
11 [X] Intel NUC8i7BE Intel Core i7-8559U 2.7GHz
Iris Plus Graphics 655
min:
10 fps, max:
14 fps
11 ~ 11 fps
Iris Plus Graphics 655:
10 fps
Iris Plus Graphics 655:
9 fps
Iris Plus Graphics 655:
18.3 [X] Intel NUC8i7BE Intel Core i7-8559U 2.7GHz
Iris Plus Graphics 655
min:
10.36 fps, max:
31.73 fps
20.1 ~ 19 fps
Iris Plus Graphics 655:
10.1 fps
Iris Plus Graphics 655:
7.4 fps
Iris Plus Graphics 655:
19.9 [X] Intel NUC8i7BE Intel Core i7-8559U 2.7GHz
Iris Plus Graphics 655
min:
1 fps, max:
33 fps
fps
Iris Plus Graphics 655:
0 (!) fps
Iris Plus Graphics 655:
13 18 [X] Intel NUC8i7BE Intel Core i7-8559U 2.7GHz
Iris Plus Graphics 655
min:
7 fps, max:
26 fps
~ 16 fps
Iris Plus Graphics 655:
25 fps
Iris Plus Graphics 655:
0 (!) fps
Iris Plus Graphics 655:
82 [X] Intel NUC8i7BE Intel Core i7-8559U 2.7GHz
Iris Plus Graphics 655
min:
70 fps, max:
96 fps
fps
Iris Plus Graphics 655:
45.8 [X] Intel NUC8i7BE Intel Core i7-8559U 2.7GHz
Iris Plus Graphics 655
min:
39 fps, max:
51 fps
fps
Iris Plus Graphics 655:
40.3 [X] Intel NUC8i7BE Intel Core i7-8559U 2.7GHz
Iris Plus Graphics 655
min:
32 fps, max:
48 fps
fps
Iris Plus Graphics 655:
36.7 [X] Intel NUC8i7BE Intel Core i7-8559U 2.7GHz
Iris Plus Graphics 655
min:
30 fps, max:
45 fps
fps
Iris Plus Graphics 655:
11 13 ~ 12 fps
Iris Plus Graphics 655:
8 10.1 ~ 9 fps
Iris Plus Graphics 655:
41.4 fps
Iris Plus Graphics 655:
17.6 fps
Iris Plus Graphics 655:
16.9 fps
Iris Plus Graphics 655:
14.5 fps
Iris Plus Graphics 655:
45 fps
Iris Plus Graphics 655:
23 fps
Iris Plus Graphics 655:
17 fps
Iris Plus Graphics 655:
12 12 ~ 12 fps
Iris Plus Graphics 655:
30.9 fps
Iris Plus Graphics 655:
20 22 23 [X] Intel NUC8i7BE Intel Core i7-8559U 2.7GHz
Iris Plus Graphics 655
min:
20 fps, max:
28 fps
~ 22 fps
Iris Plus Graphics 655:
10 11 [X] Intel NUC8i7BE Intel Core i7-8559U 2.7GHz
Iris Plus Graphics 655
min:
10 fps, max:
14 fps
11 ~ 11 fps
Iris Plus Graphics 655:
10 fps
Iris Plus Graphics 655:
9 fps
100%
Adreno 640:
59 60 [X] OnePlus 7 Pro 1.28.2.2
Qualcomm Snapdragon 855 2.8GHz
Adreno 640
min:
58 fps, max:
61 fps
60 [X] OnePlus 7 1.29.1.2
Qualcomm Snapdragon 855 2.8GHz
Adreno 640
min:
59 fps, max:
60 fps
60 [X] LG G8s ThinQ 1.29.1.2
Qualcomm Snapdragon 855 2.8GHz
Adreno 640
min:
59 fps, max:
61 fps
60 [X] OnePlus 7T 1.31.1.5
Qualcomm Snapdragon 855+ / 855 Plus GHz
Adreno 640
min:
59 fps, max:
60 fps
60 [X] OnePlus 7T Pro 1.31.1.5
Qualcomm Snapdragon 855+ / 855 Plus GHz
Adreno 640
min:
58 fps, max:
60 fps
60 ~ 60 fps
100%
Adreno 640:
30 [X] Asus ROG Phone 2 1.32.1.2
Qualcomm Snapdragon 855+ / 855 Plus GHz
Adreno 640
min:
30 fps, max:
31 fps
59 60 [X] OnePlus 7 Pro 1.28.2.2
Qualcomm Snapdragon 855 2.8GHz
Adreno 640
min:
59 fps, max:
61 fps
60 [X] OnePlus 7 1.29.1.2
Qualcomm Snapdragon 855 2.8GHz
Adreno 640
min:
58 fps, max:
60 fps
60 [X] LG G8s ThinQ 1.29.1.2
Qualcomm Snapdragon 855 2.8GHz
Adreno 640
min:
53 fps, max:
61 fps
60 [X] OnePlus 7T 1.31.1.5
Qualcomm Snapdragon 855+ / 855 Plus GHz
Adreno 640
min:
1 fps, max:
60 fps
60 [X] OnePlus 7T Pro 1.31.1.5
Qualcomm Snapdragon 855+ / 855 Plus GHz
Adreno 640
min:
50 fps, max:
60 fps
60 61 [X] Asus ROG Phone 2 1.32.1.2
Qualcomm Snapdragon 855+ / 855 Plus GHz
Adreno 640
min:
60 fps, max:
63 fps
62 [X] Google Pixel 4 1.31.1.5
Qualcomm Snapdragon 855 2.8GHz
Adreno 640
min:
35 fps, max:
63 fps
~ 57 fps
100%
Adreno 640:
59 60 [X] OnePlus 7 Pro 1.18.3
Qualcomm Snapdragon 855 2.8GHz
Adreno 640
min:
2 fps, max:
61 fps
60 [X] OnePlus 7T Pro 1.19.2
Qualcomm Snapdragon 855+ / 855 Plus GHz
Adreno 640
min:
59 fps, max:
60 fps
60 ~ 60 fps
100%
Adreno 640:
59 60 [X] OnePlus 7 Pro 1.18.3
Qualcomm Snapdragon 855 2.8GHz
Adreno 640
min:
2 fps, max:
61 fps
60 [X] OnePlus 7T Pro 1.19.2
Qualcomm Snapdragon 855+ / 855 Plus GHz
Adreno 640
min:
52 fps, max:
60 fps
60 ~ 60 fps
Iris Plus Graphics 655:
15.7 250 ~ 133 fps
Iris Plus Graphics 655:
40.3 fps
Iris Plus Graphics 655:
51.5 fps
Iris Plus Graphics 655:
21.6 fps
Iris Plus Graphics 655:
13 fps
Iris Plus Graphics 655:
30 fps
Iris Plus Graphics 655:
18 fps
Iris Plus Graphics 655:
14 fps
Iris Plus Graphics 655:
9 fps
Iris Plus Graphics 655:
128 fps
Iris Plus Graphics 655:
125 fps
Iris Plus Graphics 655:
113 fps
Iris Plus Graphics 655:
57.8 fps
Iris Plus Graphics 655:
34.4 fps
Iris Plus Graphics 655:
20.4 22.7 [X] Intel NUC8i7BE Intel Core i7-8559U 2.7GHz
Iris Plus Graphics 655
min:
15 fps, max:
27 fps
~ 22 fps
Iris Plus Graphics 655:
10.2 fps
Iris Plus Graphics 655:
0 (!) 41.3 [X] Intel NUC8i7BE Intel Core i7-8559U 2.7GHz
Iris Plus Graphics 655
min:
31 fps, max:
65 fps
~ 21 fps
Iris Plus Graphics 655:
16.1 [X] Intel NUC8i7BE Intel Core i7-8559U 2.7GHz
Iris Plus Graphics 655
min:
13 fps, max:
21 fps
fps
Iris Plus Graphics 655:
28.7 [X] Intel NUC8i7BE Intel Core i7-8559U 2.7GHz
Iris Plus Graphics 655
min:
2.6 fps, max:
41.3 fps
fps
Iris Plus Graphics 655:
21.1 [X] Intel NUC8i7BE Intel Core i7-8559U 2.7GHz
Iris Plus Graphics 655
min:
16 fps, max:
29 fps
fps
Iris Plus Graphics 655:
91 fps
Iris Plus Graphics 655:
68 fps
Iris Plus Graphics 655:
29.9 fps
Iris Plus Graphics 655:
18.2 fps
Iris Plus Graphics 655:
19.4 fps
Iris Plus Graphics 655:
11.3 fps
Iris Plus Graphics 655:
10.5 fps
Iris Plus Graphics 655:
34.2 fps
Iris Plus Graphics 655:
21.2 fps
Iris Plus Graphics 655:
25.9 39.2 ~ 33 fps
Iris Plus Graphics 655:
17.6 22.3 ~ 20 fps
Iris Plus Graphics 655:
10.8 fps
Iris Plus Graphics 655:
8.9 fps
Iris Plus Graphics 655:
75.8 [X] Intel NUC8i7BE Intel Core i7-8559U 2.7GHz
Iris Plus Graphics 655
min:
12 fps, max:
128 fps
fps
Iris Plus Graphics 655:
0 (!) [X] Intel NUC8i7BE Intel Core i7-8559U 2.7GHz
Iris Plus Graphics 655
fps
Iris Plus Graphics 655:
11.6 12.2 ~ 12 fps
Iris Plus Graphics 655:
14.6 17.8 ~ 16 fps
Iris Plus Graphics 655:
10.1 10.9 ~ 11 fps
Iris Plus Graphics 655:
5.6 5.6 ~ 6 fps
Iris Plus Graphics 655:
57 61 68 [X] Intel NUC8i7BE Intel Core i7-8559U 2.7GHz
Iris Plus Graphics 655
min:
17.5 fps, P1:
40 fps, max:
131 fps
~ 62 fps
Iris Plus Graphics 655:
51.2 51.8 62.1 [X] Intel NUC8i7BE Intel Core i7-8559U 2.7GHz
Iris Plus Graphics 655
min:
15.1 fps, P1:
37 fps, max:
117 fps
~ 55 fps
Iris Plus Graphics 655:
13.7 14.3 15.8 [X] Intel NUC8i7BE Intel Core i7-8559U 2.7GHz
Iris Plus Graphics 655
min:
8.44 fps, P1:
11.9 fps, max:
85.5 fps
~ 15 fps
Iris Plus Graphics 655:
5.2 5.5 6.2 [X] Intel NUC8i7BE Intel Core i7-8559U 2.7GHz
Iris Plus Graphics 655
min:
3.37 fps, P1:
4.2 fps, max:
28.7 fps
~ 6 fps
Iris Plus Graphics 655:
4.2 [X] Intel NUC8i7BE Intel Core i7-8559U 2.7GHz
Iris Plus Graphics 655
min:
2.38 fps, P1:
2.82 fps, max:
99 fps
fps
100%
Adreno 640:
60 120 [X] Asus ROG Phone 2 1.6.3
Qualcomm Snapdragon 855+ / 855 Plus GHz
Adreno 640
min:
118 fps, max:
121 fps
~ 90 fps
100%
Adreno 640:
28 [X] LG G8s ThinQ 1.6.3a
Qualcomm Snapdragon 855 2.8GHz
Adreno 640
min:
26 fps, max:
30 fps
30 [X] OnePlus 7 Pro 1.5.4a
Qualcomm Snapdragon 855 2.8GHz
Adreno 640
min:
29 fps, max:
31 fps
30 [X] OnePlus 7 1.5.4a
Qualcomm Snapdragon 855 2.8GHz
Adreno 640
min:
29 fps, max:
31 fps
30 30 [X] OnePlus 7T 1.7.3a
Qualcomm Snapdragon 855+ / 855 Plus GHz
Adreno 640
min:
29 fps, max:
31 fps
30 [X] OnePlus 7T Pro 1.8.1a
Qualcomm Snapdragon 855+ / 855 Plus GHz
Adreno 640
min:
27 fps, max:
31 fps
30 30 60 [X] Asus ROG Phone 2 1.8.1a
Qualcomm Snapdragon 855+ / 855 Plus GHz
Adreno 640
min:
44 fps, max:
61 fps
60 [X] Asus ROG Phone 2 1.8.1a
Qualcomm Snapdragon 855+ / 855 Plus GHz
Adreno 640
min:
56 fps, max:
61 fps
~ 36 fps
100%
Adreno 640:
28 [X] LG G8s ThinQ 1.6.3a
Qualcomm Snapdragon 855 2.8GHz
Adreno 640
min:
24 fps, max:
30 fps
29 30 [X] OnePlus 7 Pro 1.5.4a
Qualcomm Snapdragon 855 2.8GHz
Adreno 640
min:
27 fps, max:
31 fps
30 [X] OnePlus 7 1.5.4a
Qualcomm Snapdragon 855 2.8GHz
Adreno 640
min:
27 fps, max:
31 fps
30 30 [X] OnePlus 7T 1.7.3a
Qualcomm Snapdragon 855+ / 855 Plus GHz
Adreno 640
min:
27 fps, max:
31 fps
30 30 [X] OnePlus 7T Pro 1.8.1a
Qualcomm Snapdragon 855+ / 855 Plus GHz
Adreno 640
min:
25 fps, max:
31 fps
60 ~ 33 fps
Iris Plus Graphics 655:
54.3 64.8 ~ 60 fps
Iris Plus Graphics 655:
49.4 55 ~ 52 fps
Iris Plus Graphics 655:
15.5 17 ~ 16 fps
100%
Adreno 640:
120 [X] Asus ROG Phone 2 1.62.1
Qualcomm Snapdragon 855+ / 855 Plus GHz
Adreno 640
min:
118 fps, max:
121 fps
fps
Iris Plus Graphics 655:
93.7 fps
Iris Plus Graphics 655:
49.6 fps
Iris Plus Graphics 655:
12.4 fps
100%
Adreno 640:
60 120 [X] Asus ROG Phone 2 1.112.0
Qualcomm Snapdragon 855+ / 855 Plus GHz
Adreno 640
min:
118 fps, max:
121 fps
~ 90 fps
Average Gaming Qualcomm Adreno 640 → 100% Average Gaming 30-70 fps → 100%
For more games that might be playable and a list of all games and graphics cards visit our Gaming List
v1.26
log 15. 21:40:32
#0 checking url part for id 9446 +0s ... 0s
#1 checking url part for id 8828 +0s ... 0s
#2 not redirecting to Ajax server +0s ... 0s
#3 did not recreate cache, as it is less than 5 days old! Created at Mon, 13 May 2024 05:40:51 +0200 +0.001s ... 0.001s
#4 composed specs +0.079s ... 0.08s
#5 did output specs +0s ... 0.08s
#6 start showIntegratedCPUs +0s ... 0.08s
#7 getting avg benchmarks for device 9446 +0.026s ... 0.106s
#8 got single benchmarks 9446 +0.064s ... 0.17s
#9 getting avg benchmarks for device 8828 +0.016s ... 0.186s
#10 got single benchmarks 8828 +0.023s ... 0.208s
#11 got avg benchmarks for devices +0s ... 0.208s
#12 min, max, avg, median took s +0.221s ... 0.429s
#13 before gaming benchmark output +0s ... 0.429s
#14 Got 316 rows for game benchmarks. +0.043s ... 0.473s
#15 composed SQL query for gamebenchmarks +0s ... 0.473s
#16 got data and put it in $dataArray +0.039s ... 0.512s
#17 benchmarks composed for output. +0.144s ... 0.656s
#18 calculated avg scores. +0s ... 0.656s
#19 return log +0.067s ... 0.723s
Please share our article, every link counts!
Redaktion, 2017-09- 8 (Update: 2023-07- 1)
 Deutsch
 English
 Español
 Français
 Italiano
 Nederlands
 Polski
 Português
 Русский
 Türkçe
 Svenska
 Chinese
 Magyar