


Verdict — Extra Performance Comes With Extra Weight
The Area-51 may look new and fancy, but it doubles down on the same principles that defined previous generation Alienware laptops: maximum performance at the cost of heavier weight and a larger size. This is one of the few 16-inch gaming laptops where the GPU can run the full 175 W without any compromises or throttling for slightly faster performance than most other laptops with the same GPU options. We also appreciate the new rear RGB LED which isn't as blinding as on older designs. Gamers who want to squeeze as much performance as possible from their purchases and prefer mechanical keys will find a lot to like about the Area-51.
Obvious drawbacks include the heavy weight, larger size, and much shorter battery life when compared to thin-and-light alternatives like the Razer Blade 16 or Asus Zephyrus G16. Most notably, the GPU can only run at 175 W if set to Turbo mode (i.e., maximum fan noise mode) or else it will be limited to 150 W if "only" running on Performance mode. Fan noise then becomes slightly but measurably louder than the aforementioned alternatives despite the denser cooling solution of the Alienware.
Pros
Cons
Price and Availability
Dell is now shipping the Alienware 16 Area-51 for $3200 as configured with the GeForce RTX 5080. SKUs are also available on Amazon for $5000.
The portfolio-wide rebranding at Dell this year includes not only its consumer and business families but also its Alienware family of gaming laptops. The Area-51 name is returning to represent Alienware's flagship laptop models in much the same way the last Area-51 model did all the way back in 2019.
Two sizes are currently available: Alienware 16 Area-51 and Alienware 18 Area-51. Our test unit is the former equipped with the Core Ultra 9 275HX Arrow Lake CPU, 175 W GeForce RTX 5080 GPU, Cherry mechanical keyboard, and 1600p240 IPS display for approximately $3250. The CPU and display are fixed across all current 16-inch SKUs while the Nvidia Blackwell GPU may vary.
Alternatives to the Alienware 16 Area-51 include other large flagship 16-inch gaming laptops like the Lenovo Legion Pro 7i 16 Gen 10, Acer Predator Helios 16, or Asus ROG Strix Scar 16 series.
More Dell reviews:
Specifications
Case — New Alienware 30 'AW30' Design
Alienware has dropped the "Legend 3" design language of last generation models in favor of the "Alienware 30" design to celebrate their upcoming 30th anniversary. The new design is an improvement both aesthetically and qualitywise as surfaces are smoother and more "fluid" with fewer sharp edges. Gone are the honeycomb grilles and rear LED ring in favor of more cleverly hidden ventilation and a softer RGB LED bar, respectively. The bottom Gorilla Glass window is also a nice touch to show off the "Cryo-chamber" thermal solution without impacting airflow. The whole system feels as rigid as an MSI Titan 18 if not more so.
Perhaps our biggest gripe with the new design is how much of a fingerprint magnet it can be. A lighter or brighter color option could potentially hide grease buildup more easily.

At 3.3 kg, the Area-51 is about 600 g heavier than the already hefty Alienware x16 R2 to be one of the heaviest 16-inch gaming laptops in the market. If you're expecting to travel, then practically any other 16-inch alternative is going to be both thinner and lighter than the new Alienware.


Connectivity
The model lacks RJ-45 and has dropped the mini-DisplayPort option that was present on last year's x16 R2. To compensate, the two Thunderbolt 4 ports have been upgraded to Thunderbolt 5 to support dual 8K60 external monitors.


SD Card Reader
Dell has thankfully upgraded the MicroSD reader on the x16 R2 to a full-size one on for year's Area-51 redesign.

| SD Card Reader | |
| average JPG Copy Test (av. of 3 runs) | |
| MSI Vector A18 HX A9W (Toshiba Exceria Pro SDXC 64 GB UHS-II) | |
| Razer Blade 16 RTX 5080 (Toshiba Exceria Pro SDXC 64 GB UHS-II) | |
| Alienware 16 Area-51 (Toshiba Exceria Pro SDXC 64 GB UHS-II) | |
| Alienware x16 R2 P120F (AV PRO microSD 128 GB V60) | |
| maximum AS SSD Seq Read Test (1GB) | |
| Alienware x16 R2 P120F (AV PRO microSD 128 GB V60) | |
| MSI Vector A18 HX A9W (Toshiba Exceria Pro SDXC 64 GB UHS-II) | |
| Alienware 16 Area-51 (Toshiba Exceria Pro SDXC 64 GB UHS-II) | |
| Razer Blade 16 RTX 5080 (Toshiba Exceria Pro SDXC 64 GB UHS-II) | |
Communication
The Intel Killer BE1750W comes standard for Wi-Fi 7 and Bluetooth 5.4 connectivity.

Webcam
Users can configure between a 2 MP or 8 MP webcam. IR comes standard albeit without any privacy shutter.


Maintenance
The bottom panel is secured by 8 Phillips screws for generally easy servicing. Once inside, owners have access to two SODIMM slots and three M.2 2280 SSD slots. Note that only one of the three SSD slots supports PCIe5 SSDs.

Sustainability
Dell does not explicitly state any recycled minerals used during the manufacturing process for the Alienware 16. Meanwhile, the packaging is made from 100% recycled or renewed materials.
Accessories And Warranty
There are no extras in the box other than the AC adapter and paperwork. The usual one-year limited manufacturer warranty applies if purchased in the US.
Input Devices
Keyboard
While the chassis design is new, the per-key RGB ultra low-profile Cherry mechanical keyboard is not as Alienware has been offering this option on select models since at least 2021. The keyboard remains one of our favorites for typing or gaming due to its sharp, loud, and satisfying click especially when compared to the common membrane-based keyboards. Gamers who want a quieter typing experience can still configure with the standard non-Cherry keyboard instead.
Touchpad
The clickpads on Alienware laptops have never been particularly large and the tradition continues even on the new Area-51 design. In fact, its dimensions are identical to the clickpad on the Alienware x16 R1/R2 at just 11.2 x 6.5 cm compared to 13.3 x 9 cm on the Gigabyte Aero X16. Cursor control and clicks are responsive and tactile, respectively, but multi-touch inputs feel cramped.


Display — 1600p, 240 Hz, Advanced G-Sync, IPS
The model utilizes the same QHD+ BOE B160QAN panel as found on last year's Alienware x16 R2 for a similar viewing experience. This time, however, the display is noticeably brighter at around 550 nits compared to only ~350 nits on the x16 R2. On the flip side, both HDR and Windows DRR continue to be unsupported.


| |||||||||||||||||||||||||
Brightness Distribution: 88 %
Center on Battery: 554 cd/m²
Contrast: 1065:1 (Black: 0.52 cd/m²)
ΔE ColorChecker Calman: 2.81 | ∀{0.5-29.43 Ø4.78}
calibrated: 0.65
ΔE Greyscale Calman: 4.7 | ∀{0.09-98 Ø5}
89.2% AdobeRGB 1998 (Argyll 3D)
100% sRGB (Argyll 3D)
96% Display P3 (Argyll 3D)
Gamma: 2.3
CCT: 6476 K
| Alienware 16 Area-51 AU Optronics B160QAN, IPS, 2560x1600, 16", 240 Hz | Alienware x16 R2 P120F BOE B160QAN, IPS, 2560x1600, 16", 240 Hz | Razer Blade 16 RTX 5080 ATNA60DL04-0, OLED, 2560x1600, 16", 240 Hz | Gigabyte Aero X16 1WH MNG007DA5-1, IPS, 2560x1600, 16", 165 Hz | MSI Vector A18 HX A9W AU Optronics B180QAN01.0, IPS, 2560x1600, 18", 240 Hz | Lenovo Legion Pro 7i 16 Gen 10 Samsung ATNA60HU01-0, OLED, 2560x1600, 16", 240 Hz | |
|---|---|---|---|---|---|---|
| Display | 1% | 4% | -17% | -0% | 3% | |
| Display P3 Coverage (%) | 96 | 98.3 2% | 99.3 3% | 68.7 -28% | 98.1 2% | 99.5 4% |
| sRGB Coverage (%) | 100 | 100 0% | 100 0% | 96.1 -4% | 99.9 0% | 100 0% |
| AdobeRGB 1998 Coverage (%) | 89.2 | 88.8 0% | 97.8 10% | 71.2 -20% | 86.3 -3% | 94.4 6% |
| Response Times | 6% | 94% | -64% | -2% | 94% | |
| Response Time Grey 50% / Grey 80% * (ms) | 4.8 ? | 3.9 ? 19% | 0.29 ? 94% | 12 ? -150% | 4.3 ? 10% | 0.28 ? 94% |
| Response Time Black / White * (ms) | 7.2 ? | 7.8 ? -8% | 0.4 ? 94% | 5.6 ? 22% | 8.1 ? -13% | 0.43 ? 94% |
| PWM Frequency (Hz) | 960 ? | 1438 ? | ||||
| PWM Amplitude * (%) | 44 | 29 | ||||
| Screen | 9% | 28% | 9% | 0% | 8% | |
| Brightness middle (cd/m²) | 554 | 348.4 -37% | 394.4 -29% | 395 -29% | 543 -2% | 490.4 -11% |
| Brightness (cd/m²) | 532 | 340 -36% | 401 -25% | 398 -25% | 502 -6% | 498 -6% |
| Brightness Distribution (%) | 88 | 90 2% | 97 10% | 97 10% | 86 -2% | 97 10% |
| Black Level * (cd/m²) | 0.52 | 0.33 37% | 0.32 38% | 0.56 -8% | ||
| Contrast (:1) | 1065 | 1056 -1% | 1234 16% | 970 -9% | ||
| Colorchecker dE 2000 * | 2.81 | 2.68 5% | 0.82 71% | 1.3 54% | 3.41 -21% | 3.2 -14% |
| Colorchecker dE 2000 max. * | 8.32 | 4.14 50% | 2.82 66% | 2.8 66% | 6.4 23% | 6.04 27% |
| Colorchecker dE 2000 calibrated * | 0.65 | 0.42 35% | 1.4 -115% | 0.66 -2% | 0.84 -29% | |
| Greyscale dE 2000 * | 4.7 | 3.4 28% | 1.1 77% | 1.8 62% | 3.4 28% | 1 79% |
| Gamma | 2.3 96% | 2.41 91% | 2.2 100% | 2.2 100% | 2.3 96% | 2.24 98% |
| CCT | 6476 100% | 6083 107% | 6424 101% | 6842 95% | 6070 107% | 6373 102% |
| Total Average (Program / Settings) | 5% /
7% | 42% /
34% | -24% /
-7% | -1% /
-0% | 35% /
21% |
* ... smaller is better


The display comes decently calibrated out of the box against the sRGB standard with average grayscale and deltaE values of 4.7 and 2.81, respectively. Our own calibration with an X-Rite colorimeter would improve the averages down to just <1.0 each to better exploit the capabilities of the full P3 panel. Our calibrated ICM profile is available to download above for free.


Display Response Times
| ↔ Response Time Black to White | ||
|---|---|---|
| 7.2 ms ... rise ↗ and fall ↘ combined | ↗ 3.8 ms rise |  |
| ↘ 3.4 ms fall | ||
| The screen shows very fast response rates in our tests and should be very well suited for fast-paced gaming. In comparison, all tested devices range from 0.1 (minimum) to 240 (maximum) ms. » 20 % of all devices are better. This means that the measured response time is better than the average of all tested devices (20.2 ms). | ||
| ↔ Response Time 50% Grey to 80% Grey | ||
| 4.8 ms ... rise ↗ and fall ↘ combined | ↗ 2 ms rise |  |
| ↘ 2.8 ms fall | ||
| The screen shows very fast response rates in our tests and should be very well suited for fast-paced gaming. In comparison, all tested devices range from 0.165 (minimum) to 636 (maximum) ms. » 15 % of all devices are better. This means that the measured response time is better than the average of all tested devices (31.6 ms). | ||
Screen Flickering / PWM (Pulse-Width Modulation)
| Screen flickering / PWM not detected |  | ||
In comparison: 53 % of all tested devices do not use PWM to dim the display. If PWM was detected, an average of 8121 (minimum: 5 - maximum: 343500) Hz was measured. | |||
Outdoor visibility is decent if under shade. Otherwise, colors become washed out and more difficult to see if under brighter ambient conditions.


Performance


Testing Conditions
We set Alienware Command Center to Performance mode prior to running the benchmarks below. A louder Turbo mode is also available to boost overall performance if desired.
Processor
When set to Performance mode, the Core Ultra 9 275HX in the Area-51 runs about 10 percent slower than the average laptop in our database with the same processor. Users must therefore run the system on the louder Turbo mode setting in order to narrow that gap. For example, rerunning our CineBench R15 xT loop test on Turbo mode would result in a higher average score of 5557 points instead to be more in like with what we observed on the Lenovo Legion Pro 7i 16 Gen 10. Multi-thread performance is nevertheless a decent improvement over the Core i9-14900HX even when not running on Turbo mode.
Cinebench R15 Multi Loop
Cinebench R23: Multi Core | Single Core
Cinebench R20: CPU (Multi Core) | CPU (Single Core)
Cinebench R15: CPU Multi 64Bit | CPU Single 64Bit
Blender: v2.79 BMW27 CPU
7-Zip 18.03: 7z b 4 | 7z b 4 -mmt1
Geekbench 6.5: Multi-Core | Single-Core
Geekbench 5.5: Multi-Core | Single-Core
HWBOT x265 Benchmark v2.2: 4k Preset
LibreOffice : 20 Documents To PDF
R Benchmark 2.5: Overall mean
* ... smaller is better
AIDA64: FP32 Ray-Trace | FPU Julia | CPU SHA3 | CPU Queen | FPU SinJulia | FPU Mandel | CPU AES | CPU ZLib | FP64 Ray-Trace | CPU PhotoWorxx
| Performance rating | |
| MSI Vector A18 HX A9W | |
| Lenovo Legion Pro 7i 16 Gen 10 | |
| Average Intel Core Ultra 9 275HX | |
| Alienware 16 Area-51 | |
| Razer Blade 16 RTX 5080 | |
| Gigabyte Aero X16 1WH | |
| Alienware x16 R2 P120F | |
| AIDA64 / FP32 Ray-Trace | |
| MSI Vector A18 HX A9W | |
| Lenovo Legion Pro 7i 16 Gen 10 | |
| Average Intel Core Ultra 9 275HX (28067 - 39895, n=27) | |
| Alienware 16 Area-51 | |
| Razer Blade 16 RTX 5080 | |
| Gigabyte Aero X16 1WH | |
| Alienware x16 R2 P120F | |
| AIDA64 / FPU Julia | |
| MSI Vector A18 HX A9W | |
| Lenovo Legion Pro 7i 16 Gen 10 | |
| Average Intel Core Ultra 9 275HX (140254 - 200744, n=27) | |
| Alienware 16 Area-51 | |
| Razer Blade 16 RTX 5080 | |
| Gigabyte Aero X16 1WH | |
| Alienware x16 R2 P120F | |
| AIDA64 / CPU SHA3 | |
| MSI Vector A18 HX A9W | |
| Lenovo Legion Pro 7i 16 Gen 10 | |
| Average Intel Core Ultra 9 275HX (6766 - 9817, n=27) | |
| Alienware 16 Area-51 | |
| Razer Blade 16 RTX 5080 | |
| Alienware x16 R2 P120F | |
| Gigabyte Aero X16 1WH | |
| AIDA64 / CPU Queen | |
| MSI Vector A18 HX A9W | |
| Lenovo Legion Pro 7i 16 Gen 10 | |
| Average Intel Core Ultra 9 275HX (113887 - 140937, n=27) | |
| Alienware 16 Area-51 | |
| Alienware x16 R2 P120F | |
| Razer Blade 16 RTX 5080 | |
| Gigabyte Aero X16 1WH | |
| AIDA64 / FPU SinJulia | |
| MSI Vector A18 HX A9W | |
| Razer Blade 16 RTX 5080 | |
| Lenovo Legion Pro 7i 16 Gen 10 | |
| Gigabyte Aero X16 1WH | |
| Alienware 16 Area-51 | |
| Average Intel Core Ultra 9 275HX (11172 - 14425, n=27) | |
| Alienware x16 R2 P120F | |
| AIDA64 / FPU Mandel | |
| MSI Vector A18 HX A9W | |
| Lenovo Legion Pro 7i 16 Gen 10 | |
| Average Intel Core Ultra 9 275HX (72596 - 104508, n=27) | |
| Alienware 16 Area-51 | |
| Razer Blade 16 RTX 5080 | |
| Gigabyte Aero X16 1WH | |
| Alienware x16 R2 P120F | |
| AIDA64 / CPU AES | |
| MSI Vector A18 HX A9W | |
| Lenovo Legion Pro 7i 16 Gen 10 | |
| Average Intel Core Ultra 9 275HX (107195 - 247074, n=27) | |
| Alienware 16 Area-51 | |
| Alienware x16 R2 P120F | |
| Gigabyte Aero X16 1WH | |
| Razer Blade 16 RTX 5080 | |
| AIDA64 / CPU ZLib | |
| MSI Vector A18 HX A9W | |
| Lenovo Legion Pro 7i 16 Gen 10 | |
| Average Intel Core Ultra 9 275HX (1599 - 2263, n=27) | |
| Alienware 16 Area-51 | |
| Razer Blade 16 RTX 5080 | |
| Alienware x16 R2 P120F | |
| Gigabyte Aero X16 1WH | |
| AIDA64 / FP64 Ray-Trace | |
| MSI Vector A18 HX A9W | |
| Lenovo Legion Pro 7i 16 Gen 10 | |
| Average Intel Core Ultra 9 275HX (14847 - 21854, n=27) | |
| Alienware 16 Area-51 | |
| Razer Blade 16 RTX 5080 | |
| Gigabyte Aero X16 1WH | |
| Alienware x16 R2 P120F | |
| AIDA64 / CPU PhotoWorxx | |
| Lenovo Legion Pro 7i 16 Gen 10 | |
| Alienware 16 Area-51 | |
| Alienware x16 R2 P120F | |
| Razer Blade 16 RTX 5080 | |
| Average Intel Core Ultra 9 275HX (37482 - 62916, n=27) | |
| Gigabyte Aero X16 1WH | |
| MSI Vector A18 HX A9W | |
Stress Test
The CPU stabilizes at 3.6 GHz, ~140 W, and 95 C when running Prime95 on Performance mode. Clock rates and package power become slightly higher at 3.8 GHz and ~150 W, respectively, if on Turbo mode. Similarly, the GPU is capped at 150 W on Performance mode and can only reach 175 W on Turbo mode. The temperature difference between the modes is minor as the faster performance on Turbo mode is balanced out by the louder fans.


| CPU Clock (GHz) | GPU Clock (MHz) | Average CPU Temperature (°C) | Average GPU Temperature (°C) | |
| System Idle | -- | -- | 52 | 39 |
| Prime95 Stress (Performance mode) | 3.6 | -- | 95 | 63 |
| Prime95 Stress (Turbo mode) | 3.8 | -- | 92 | 50 |
| Prime95 + FurMark Stress | 1.7 | 2032 | 76 | 74 |
| Cyberpunk 2077 Stress (Performance mode) | 2.0 | 2475 | 76 | 73 |
| Cyberpunk 2077 Stress (Turbo mode) | 2.0 | 2542 | 76 | 73 |
System Performance
PCMark scores are consistently higher than on the outgoing Alienware x16 R2 while being on par with current competitors like the Lenovo Legion Pro 7i 16 Gen 10.

PCMark 10: Score | Essentials | Productivity | Digital Content Creation
CrossMark: Overall | Productivity | Creativity | Responsiveness
WebXPRT 3: Overall
WebXPRT 4: Overall
Mozilla Kraken 1.1: Total
| Performance rating | |
| MSI Vector A18 HX A9W | |
| Alienware 16 Area-51 | |
| Lenovo Legion Pro 7i 16 Gen 10 | |
| Average Intel Core Ultra 9 275HX, NVIDIA GeForce RTX 5080 Laptop | |
| Razer Blade 16 RTX 5080 -4! | |
| Gigabyte Aero X16 1WH | |
| Alienware x16 R2 P120F | |
| PCMark 10 / Score | |
| MSI Vector A18 HX A9W | |
| Lenovo Legion Pro 7i 16 Gen 10 | |
| Alienware 16 Area-51 | |
| Razer Blade 16 RTX 5080 | |
| Average Intel Core Ultra 9 275HX, NVIDIA GeForce RTX 5080 Laptop (7805 - 9153, n=8) | |
| Gigabyte Aero X16 1WH | |
| Alienware x16 R2 P120F | |
| PCMark 10 / Essentials | |
| MSI Vector A18 HX A9W | |
| Lenovo Legion Pro 7i 16 Gen 10 | |
| Alienware 16 Area-51 | |
| Average Intel Core Ultra 9 275HX, NVIDIA GeForce RTX 5080 Laptop (10423 - 11472, n=8) | |
| Razer Blade 16 RTX 5080 | |
| Gigabyte Aero X16 1WH | |
| Alienware x16 R2 P120F | |
| PCMark 10 / Productivity | |
| MSI Vector A18 HX A9W | |
| Gigabyte Aero X16 1WH | |
| Razer Blade 16 RTX 5080 | |
| Lenovo Legion Pro 7i 16 Gen 10 | |
| Average Intel Core Ultra 9 275HX, NVIDIA GeForce RTX 5080 Laptop (8319 - 10708, n=8) | |
| Alienware 16 Area-51 | |
| Alienware x16 R2 P120F | |
| PCMark 10 / Digital Content Creation | |
| Lenovo Legion Pro 7i 16 Gen 10 | |
| MSI Vector A18 HX A9W | |
| Alienware 16 Area-51 | |
| Average Intel Core Ultra 9 275HX, NVIDIA GeForce RTX 5080 Laptop (10505 - 19351, n=8) | |
| Razer Blade 16 RTX 5080 | |
| Alienware x16 R2 P120F | |
| Gigabyte Aero X16 1WH | |
| CrossMark / Overall | |
| MSI Vector A18 HX A9W | |
| Alienware 16 Area-51 | |
| Average Intel Core Ultra 9 275HX, NVIDIA GeForce RTX 5080 Laptop (1857 - 2221, n=8) | |
| Lenovo Legion Pro 7i 16 Gen 10 | |
| Gigabyte Aero X16 1WH | |
| Alienware x16 R2 P120F | |
| CrossMark / Productivity | |
| Alienware 16 Area-51 | |
| Average Intel Core Ultra 9 275HX, NVIDIA GeForce RTX 5080 Laptop (1764 - 2056, n=8) | |
| MSI Vector A18 HX A9W | |
| Lenovo Legion Pro 7i 16 Gen 10 | |
| Gigabyte Aero X16 1WH | |
| Alienware x16 R2 P120F | |
| CrossMark / Creativity | |
| MSI Vector A18 HX A9W | |
| Alienware 16 Area-51 | |
| Average Intel Core Ultra 9 275HX, NVIDIA GeForce RTX 5080 Laptop (2115 - 2498, n=8) | |
| Lenovo Legion Pro 7i 16 Gen 10 | |
| Gigabyte Aero X16 1WH | |
| Alienware x16 R2 P120F | |
| CrossMark / Responsiveness | |
| Alienware 16 Area-51 | |
| Average Intel Core Ultra 9 275HX, NVIDIA GeForce RTX 5080 Laptop (1466 - 2016, n=8) | |
| MSI Vector A18 HX A9W | |
| Alienware x16 R2 P120F | |
| Lenovo Legion Pro 7i 16 Gen 10 | |
| Gigabyte Aero X16 1WH | |
| WebXPRT 3 / Overall | |
| MSI Vector A18 HX A9W | |
| Lenovo Legion Pro 7i 16 Gen 10 | |
| Alienware 16 Area-51 | |
| Average Intel Core Ultra 9 275HX, NVIDIA GeForce RTX 5080 Laptop (306 - 378, n=8) | |
| Gigabyte Aero X16 1WH | |
| Razer Blade 16 RTX 5080 | |
| Alienware x16 R2 P120F | |
| WebXPRT 4 / Overall | |
| Lenovo Legion Pro 7i 16 Gen 10 | |
| Alienware 16 Area-51 | |
| Average Intel Core Ultra 9 275HX, NVIDIA GeForce RTX 5080 Laptop (285 - 336, n=8) | |
| MSI Vector A18 HX A9W | |
| Gigabyte Aero X16 1WH | |
| Razer Blade 16 RTX 5080 | |
| Alienware x16 R2 P120F | |
| Mozilla Kraken 1.1 / Total | |
| Alienware x16 R2 P120F | |
| Gigabyte Aero X16 1WH | |
| Razer Blade 16 RTX 5080 | |
| Average Intel Core Ultra 9 275HX, NVIDIA GeForce RTX 5080 Laptop (405 - 432, n=8) | |
| Alienware 16 Area-51 | |
| Lenovo Legion Pro 7i 16 Gen 10 | |
| MSI Vector A18 HX A9W | |
* ... smaller is better
| PCMark 10 Score | 8767 points | |
Help | ||
| AIDA64 / Memory Copy | |
| Razer Blade 16 RTX 5080 | |
| Alienware x16 R2 P120F | |
| Alienware 16 Area-51 | |
| Lenovo Legion Pro 7i 16 Gen 10 | |
| Average Intel Core Ultra 9 275HX (56003 - 94460, n=27) | |
| Gigabyte Aero X16 1WH | |
| MSI Vector A18 HX A9W | |
| AIDA64 / Memory Read | |
| Razer Blade 16 RTX 5080 | |
| Lenovo Legion Pro 7i 16 Gen 10 | |
| Alienware 16 Area-51 | |
| Alienware x16 R2 P120F | |
| Average Intel Core Ultra 9 275HX (55795 - 97151, n=27) | |
| MSI Vector A18 HX A9W | |
| Gigabyte Aero X16 1WH | |
| AIDA64 / Memory Write | |
| Razer Blade 16 RTX 5080 | |
| Gigabyte Aero X16 1WH | |
| Lenovo Legion Pro 7i 16 Gen 10 | |
| Alienware 16 Area-51 | |
| Average Intel Core Ultra 9 275HX (55663 - 106063, n=27) | |
| Alienware x16 R2 P120F | |
| MSI Vector A18 HX A9W | |
| AIDA64 / Memory Latency | |
| Alienware x16 R2 P120F | |
| Alienware 16 Area-51 | |
| Average Intel Core Ultra 9 275HX (105.8 - 161.6, n=27) | |
| Lenovo Legion Pro 7i 16 Gen 10 | |
| Razer Blade 16 RTX 5080 | |
| MSI Vector A18 HX A9W | |
| Gigabyte Aero X16 1WH | |
* ... smaller is better
DPC Latency
LatencyMon shows DPC issues when opening multiple browser tabs of our homepage but with otherwise no dropped frames recorded when playing back 4K60 video content.


| DPC Latencies / LatencyMon - interrupt to process latency (max), Web, Youtube, Prime95 | |
| Alienware x16 R2 P120F | |
| Alienware 16 Area-51 | |
| Gigabyte Aero X16 1WH | |
| Razer Blade 16 RTX 5080 | |
| Lenovo Legion Pro 7i 16 Gen 10 | |
| MSI Vector A18 HX A9W | |
* ... smaller is better
Storage Devices
The Samsung PM9C1a exhibits no throttling or performance issues for consistent speeds of up to 6200 MB/s.


| Drive Performance rating - Percent | |
| Alienware 16 Area-51 | |
| Alienware x16 R2 P120F | |
| Razer Blade 16 RTX 5080 | |
| Gigabyte Aero X16 1WH | |
| Lenovo Legion Pro 7i 16 Gen 10 | |
| MSI Vector A18 HX A9W | |
* ... smaller is better
Disk Throttling: DiskSpd Read Loop, Queue Depth 8
GPU Performance
The GeForce RTX 5080 in the Area-51 performs within just a few percentage points of the average laptop in our database with the same GPU even when running on Performance mode instead of Turbo mode. Running on Turbo mode would improve graphics performance by about 8 percent as shown by our Fire Strike results table below.
Upgrading to the RTX 5090 SKU is expected to improve performance by up to 10 percent (if running on Turbo mode) over our RTX 5080 configuration while downgrading to the RTX 5070 Ti will decrease performance by 15 to 25 percent.
| Power Profile | Graphics Score | Physics Score | Combined Score |
| Turbo Mode | 51295 | 48830 | 13650 |
| Performance Mode | 47367 (-8%) | 47987 (-2%) | 10378 (-24%) |
| Balanced Mode | 48596 (-5%) | 48115 (-1%) | 13674 (-0%) |
| Battery Power | 30205 (-41%) | 27507 (-44%) | 8130 (-40%) |


| 3DMark 11 Performance | 48827 points | |
| 3DMark Fire Strike Score | 34970 points | |
| 3DMark Time Spy Score | 20592 points | |
| 3DMark Steel Nomad Score | 5211 points | |
Help | ||
* ... smaller is better
Gaming Performance
The mobile RTX 5080 is nowhere near as fast as the desktop RTX 5080, but it still pairs very well with the 1600p display. Demanding titles like Alan Wake 2 or Monster Hunter Wilds run >60 FPS at QHD and maximum settings before applying DLSS or FG. DLSS and FG are nonetheless highly recommended if supported as they are the biggest differentiators between the GeForce 40 and 50 series.
It's worth noting that Indiana Jones and the Great Circle would consistently crash when attempting to benchmark at 4K maximum settings.
See our dedicated page on the RTX 5080 for more benchmarks and comparisons.
| Monster Hunter Wilds | |
| 1920x1080 ultra, RT: high, no upscaling | |
| Alienware 16 Area-51 | |
| Average NVIDIA GeForce RTX 5080 Laptop (65.7 - 90, n=7) | |
| MSI Vector A18 HX A9W | |
| Razer Blade 16 RTX 5080 | |
| 2560x1440 ultra, RT: high, no upscaling | |
| Alienware 16 Area-51 | |
| Average NVIDIA GeForce RTX 5080 Laptop (58.9 - 73.2, n=7) | |
| Razer Blade 16 RTX 5080 | |
| MSI Vector A18 HX A9W | |
| 2560x1440 ultra, RT: high, DLSS3 quality | |
| Alienware 16 Area-51 | |
| Average NVIDIA GeForce RTX 5080 Laptop (64.9 - 87.7, n=6) | |
| MSI Vector A18 HX A9W | |
| Razer Blade 16 RTX 5080 | |
| 3840x2160 ultra, RT: high, no upscaling | |
| Alienware 16 Area-51 | |
| Average NVIDIA GeForce RTX 5080 Laptop (37.9 - 47.6, n=7) | |
| Razer Blade 16 RTX 5080 | |
| MSI Vector A18 HX A9W | |
| 3840x2160 ultra, RT: high, DLSS3 quality | |
| Alienware 16 Area-51 | |
| Average NVIDIA GeForce RTX 5080 Laptop (50.9 - 61.8, n=7) | |
| Razer Blade 16 RTX 5080 | |
Cyberpunk 2077 ultra FPS Chart
| low | med. | high | ultra | QHD DLSS | QHD | 4K DLSS | 4K | |
|---|---|---|---|---|---|---|---|---|
| Dota 2 Reborn (2015) | 224 | 188.9 | 180.4 | 160.4 | 152.9 | |||
| Final Fantasy XV Benchmark (2018) | 189.6 | 158.8 | 96.5 | |||||
| X-Plane 11.11 (2018) | 158.5 | 135.5 | 111.9 | 86.6 | ||||
| Strange Brigade (2018) | 397 | 303 | 159 | |||||
| Baldur's Gate 3 (2023) | 202.6 | 207.5 | 154.4 | 129.6 | 79.8 | |||
| Cyberpunk 2077 (2023) | 160.2 | 143.9 | 135.1 | 117.9 | 102.4 | 69.2 | 47.5 | |
| Alan Wake 2 (2023) | 113.5 | 74.3 | 59.9 | 39.7 | ||||
| F1 24 (2024) | 132.5 | 134.2 | 84.7 | 71.8 | 41.9 | |||
| Black Myth: Wukong (2024) | 57 | 64 | 43 | 45 | 26 | |||
| Indiana Jones and the Great Circle (2024) | 124.2 | 118.1 | 99.3 | 55.2 | ||||
| Monster Hunter Wilds (2025) | 83.1 | 80.8 | 69.8 | 60 | 47.6 | |||
| Assassin's Creed Shadows (2025) | 65 | 66 | 55 | 54 | 39 |
Emissions
System Noise
The fans are always active at around 28.1 dB(A) against a silent background of 23.6 dB(A) even if set to Quiet mode. However, the quad fans are excellent at maintaining low RPMs when higher loads like 3DMark 06 are introduced and so the ramp up time is quite slow and steady for a gaming laptop.
Fan noise when running Cyberpunk 2077 would stabilize at around 47.3 dB(A), 50.4 dB(A), and 56.4 dB(A) if set to Balanced, Performance, and Turbo modes, respectively. Since the maximum 175 W TGP is locked to Turbo mode as mentioned above, users must endure the maximum fan noise setting if they want to run the GPU at full power. Headphones are highly recommended if fan noise reaches 55 dB(A) or louder.


Noise level
| Idle |
| 25.4 / 27.8 / 28.1 dB(A) |
| Load |
| 28.8 / 56.4 dB(A) |
 | ||
30 dB silent 40 dB(A) audible 50 dB(A) loud |
||
min: | ||
| Alienware 16 Area-51 GeForce RTX 5080 Laptop, Ultra 9 275HX, Samsung PM9C1a MZ9L81T0HDLB | Alienware x16 R2 P120F GeForce RTX 4080 Laptop GPU, Ultra 9 185H, WDC PC SN810 1TB | Razer Blade 16 RTX 5080 GeForce RTX 5080 Laptop, Ryzen AI 9 365, Samsung PM9A1 MZVL21T0HCLR | Gigabyte Aero X16 1WH GeForce RTX 5070 Laptop, Ryzen AI 7 350, Kingston OM8PGP41024Q-A0 | MSI Vector A18 HX A9W GeForce RTX 5070 Ti Laptop, R9 9955HX | Lenovo Legion Pro 7i 16 Gen 10 GeForce RTX 5080 Laptop, Ultra 9 275HX, SK Hynix HFS001TEJ9X115N | |
|---|---|---|---|---|---|---|
| Noise | 1% | -2% | 4% | -10% | 5% | |
| off / environment * (dB) | 23.6 | 23.4 1% | 23 3% | 23.9 -1% | 22.5 5% | 22.9 3% |
| Idle Minimum * (dB) | 25.4 | 23.8 6% | 23.1 9% | 23.9 6% | 26 -2% | 22.9 10% |
| Idle Average * (dB) | 27.8 | 28.5 -3% | 23.1 17% | 23.9 14% | 26 6% | 22.9 18% |
| Idle Maximum * (dB) | 28.1 | 28.5 -1% | 29.2 -4% | 23.9 15% | 32 -14% | 26.3 6% |
| Load Average * (dB) | 28.8 | 28.8 -0% | 43 -49% | 33.2 -15% | 44.4 -54% | 27.8 3% |
| Cyberpunk 2077 ultra * (dB) | 50.4 | 50.1 1% | 50.2 -0% | 49.8 1% | 54.2 -8% | |
| Load Maximum * (dB) | 56.4 | 54.2 4% | 52.4 7% | 50.2 11% | 61.6 -9% | 53.9 4% |
| Witcher 3 ultra * (dB) | 49.5 |
* ... smaller is better
Temperature
Surface temperatures when gaming can reach over 44 C or 48 C toward the rear of the chassis where skin or palms are less likely to touch. The hot spots are still noticeably cooler than what we recorded on the older x16 R2 even though the Area-51 design has fewer ventilation grilles.


(±) The maximum temperature on the upper side is 43.8 °C / 111 F, compared to the average of 40.4 °C / 105 F, ranging from 21.2 to 68.8 °C for the class Gaming.
(±) The bottom heats up to a maximum of 40 °C / 104 F, compared to the average of 43.3 °C / 110 F
(±) In idle usage, the average temperature for the upper side is 32.6 °C / 91 F, compared to the device average of 33.9 °C / 93 F.
(-) 3: The average temperature for the upper side is 38.7 °C / 102 F, compared to the average of 33.9 °C / 93 F for the class Gaming.
(+) The palmrests and touchpad are cooler than skin temperature with a maximum of 30.8 °C / 87.4 F and are therefore cool to the touch.
(±) The average temperature of the palmrest area of similar devices was 28.9 °C / 84 F (-1.9 °C / -3.4 F).


| Alienware 16 Area-51 Intel Core Ultra 9 275HX, NVIDIA GeForce RTX 5080 Laptop | Alienware x16 R2 P120F Intel Core Ultra 9 185H, NVIDIA GeForce RTX 4080 Laptop GPU | Razer Blade 16 RTX 5080 AMD Ryzen AI 9 365, NVIDIA GeForce RTX 5080 Laptop | Gigabyte Aero X16 1WH AMD Ryzen AI 7 350, NVIDIA GeForce RTX 5070 Laptop | MSI Vector A18 HX A9W AMD Ryzen 9 9955HX, NVIDIA GeForce RTX 5070 Ti Laptop | Lenovo Legion Pro 7i 16 Gen 10 Intel Core Ultra 9 275HX, NVIDIA GeForce RTX 5080 Laptop | |
|---|---|---|---|---|---|---|
| Heat | -11% | -10% | 5% | 3% | 4% | |
| Maximum Upper Side * (°C) | 43.8 | 51 -16% | 50.6 -16% | 43.3 1% | 46.6 -6% | 42.6 3% |
| Maximum Bottom * (°C) | 40 | 50.8 -27% | 48.6 -22% | 50.3 -26% | 45.6 -14% | 41.2 -3% |
| Idle Upper Side * (°C) | 35.8 | 36.6 -2% | 35.2 2% | 27 25% | 31.2 13% | 32.6 9% |
| Idle Bottom * (°C) | 35.2 | 35.2 -0% | 37 -5% | 28.3 20% | 28.6 19% | 32.4 8% |
* ... smaller is better
Speakers


Alienware 16 Area-51 audio analysis
(+) | speakers can play relatively loud (88.9 dB)
Bass 100 - 315 Hz
(-) | nearly no bass - on average 22.1% lower than median
(±) | linearity of bass is average (13.1% delta to prev. frequency)
Mids 400 - 2000 Hz
(+) | balanced mids - only 1.4% away from median
(+) | mids are linear (3.2% delta to prev. frequency)
Highs 2 - 16 kHz
(+) | balanced highs - only 3.7% away from median
(+) | highs are linear (3.4% delta to prev. frequency)
Overall 100 - 16.000 Hz
(+) | overall sound is linear (14.1% difference to median)
Compared to same class
» 24% of all tested devices in this class were better, 7% similar, 69% worse
» The best had a delta of 6%, average was 18%, worst was 132%
Compared to all devices tested
» 16% of all tested devices were better, 4% similar, 80% worse
» The best had a delta of 4%, average was 24%, worst was 134%
Apple MacBook Pro 16 2021 M1 Pro audio analysis
(+) | speakers can play relatively loud (84.7 dB)
Bass 100 - 315 Hz
(+) | good bass - only 3.8% away from median
(+) | bass is linear (5.2% delta to prev. frequency)
Mids 400 - 2000 Hz
(+) | balanced mids - only 1.3% away from median
(+) | mids are linear (2.1% delta to prev. frequency)
Highs 2 - 16 kHz
(+) | balanced highs - only 1.9% away from median
(+) | highs are linear (2.7% delta to prev. frequency)
Overall 100 - 16.000 Hz
(+) | overall sound is linear (4.6% difference to median)
Compared to same class
» 0% of all tested devices in this class were better, 0% similar, 100% worse
» The best had a delta of 5%, average was 17%, worst was 45%
Compared to all devices tested
» 0% of all tested devices were better, 0% similar, 100% worse
» The best had a delta of 4%, average was 24%, worst was 134%
Energy Management
Power Consumption
Consumption is very high at 27 W to 42 W when just idling on desktop even at the lowest settings compared to almost one-third on the Blade 16. Battery life subsequently suffers as a result as shown in the next section below.
Gaming consumes about 256 W if on Performance mode or almost 300 W if on Turbo mode to be one of the more demanding gaming laptops next to the Lenovo Legion Pro 7i 16 Gen 10.
The 360 W GaN AC adapter is reasonably sized (~189 x 8.5 x 2.6 cm) compared to the gargantuan 400 W adapter that ships with the aforementioned Lenovo.


| Off / Standby | |
| Idle | |
| Load |
|
Key:
min: | |
| Alienware 16 Area-51 Ultra 9 275HX, GeForce RTX 5080 Laptop, Samsung PM9C1a MZ9L81T0HDLB, IPS, 2560x1600, 16" | Alienware x16 R2 P120F Ultra 9 185H, GeForce RTX 4080 Laptop GPU, WDC PC SN810 1TB, IPS, 2560x1600, 16" | Razer Blade 16 RTX 5080 Ryzen AI 9 365, GeForce RTX 5080 Laptop, Samsung PM9A1 MZVL21T0HCLR, OLED, 2560x1600, 16" | Gigabyte Aero X16 1WH Ryzen AI 7 350, GeForce RTX 5070 Laptop, Kingston OM8PGP41024Q-A0, IPS, 2560x1600, 16" | MSI Vector A18 HX A9W R9 9955HX, GeForce RTX 5070 Ti Laptop, , IPS, 2560x1600, 18" | Lenovo Legion Pro 7i 16 Gen 10 Ultra 9 275HX, GeForce RTX 5080 Laptop, SK Hynix HFS001TEJ9X115N, OLED, 2560x1600, 16" | |
|---|---|---|---|---|---|---|
| Power Consumption | 35% | 40% | 58% | -13% | -14% | |
| Idle Minimum * (Watt) | 27 | 9.9 63% | 7 74% | 5.8 79% | 20.8 23% | 28.5 -6% |
| Idle Average * (Watt) | 33.5 | 14.5 57% | 15 55% | 10.9 67% | 52.8 -58% | 38.8 -16% |
| Idle Maximum * (Watt) | 41.4 | 33.5 19% | 15.4 63% | 11.2 73% | 54.5 -32% | 45.6 -10% |
| Load Average * (Watt) | 124.7 | 97.5 22% | 108.5 13% | 91.3 27% | 146.6 -18% | 132.2 -6% |
| Cyberpunk 2077 ultra external monitor * (Watt) | 249 | 194.8 22% | 117.9 53% | 278 -12% | 319 -28% | |
| Cyberpunk 2077 ultra * (Watt) | 256 | 195.2 24% | 123.8 52% | 285 -11% | 318 -24% | |
| Load Maximum * (Watt) | 367.2 | 315.2 14% | 254.1 31% | 155.3 58% | 297.3 19% | 384 -5% |
| Witcher 3 ultra * (Watt) | 230 |
* ... smaller is better
Power Consumption Cyberpunk / Stress Test
Power Consumption external Monitor
Battery Life

Runtimes are just as poor as on last year's Alienware x16 R2 as a result of the high idling power consumption mentioned above even after running on iGPU mode, Battery mode, disabling the LEDs, and reducing the refresh rate from 240 Hz to just 60 Hz. Competing models like the Razer Blade 16 or Gigabyte Aero X16 are able to last for several hours longer each.
| Alienware 16 Area-51 Ultra 9 275HX, GeForce RTX 5080 Laptop, 96 Wh | Alienware x16 R2 P120F Ultra 9 185H, GeForce RTX 4080 Laptop GPU, 90 Wh | Razer Blade 16 RTX 5080 Ryzen AI 9 365, GeForce RTX 5080 Laptop, 90 Wh | Gigabyte Aero X16 1WH Ryzen AI 7 350, GeForce RTX 5070 Laptop, 76 Wh | MSI Vector A18 HX A9W R9 9955HX, GeForce RTX 5070 Ti Laptop, 99 Wh | Lenovo Legion Pro 7i 16 Gen 10 Ultra 9 275HX, GeForce RTX 5080 Laptop, 99 Wh | |
|---|---|---|---|---|---|---|
| Battery runtime | 14% | 186% | 207% | 81% | 93% | |
| Reader / Idle (h) | 3.1 | 7 126% | ||||
| WiFi v1.3 (h) | 2.8 | 3.2 14% | 8 186% | 8.6 207% | 3.8 36% | 5.4 93% |
| Load (h) | 0.8 |
Notebookcheck Rating
Alienware 16 Area-51
- 06/09/2025 v8
Allen Ngo
 Total Sustainability Score:
 Potential Competitors in Comparison
Image | Model / Review | Price | Weight | Height | Display |
|---|---|---|---|---|---|
1. 85.7%  | Alienware 16 Area-51 Intel Core Ultra 9 275HX ⎘ NVIDIA GeForce RTX 5080 Laptop ⎘ 32 GB Memory, 1024 GB SSD | Amazon: List Price: 3500 USD | 3.3 kg | 28.5 mm | 16.00" 2560x1600 189 PPI IPS |
2. 88.4% v7 (old) 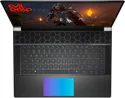 | Alienware x16 R2 P120F Intel Core Ultra 9 185H ⎘ NVIDIA GeForce RTX 4080 Laptop GPU ⎘ 32 GB Memory, 1024 GB SSD | Amazon: $2,399.99 List Price: 3200 USD | 2.7 kg | 18.57 mm | 16.00" 2560x1600 189 PPI IPS |
3. 87.2% 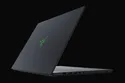 | Razer Blade 16 RTX 5080 AMD Ryzen AI 9 365 ⎘ NVIDIA GeForce RTX 5080 Laptop ⎘ 32 GB Memory, 1024 GB SSD | Amazon: 1. $49.99 RC30-0248 Laptop attery For ... 2. $4,699.99 Razer Blade 18 Gaming Laptop... 3. $4,069.00 Razer Blade Pro 17 Gaming La... List Price: 3500 USD | 2.1 kg | 17.4 mm | 16.00" 2560x1600 189 PPI OLED |
4. 83.7%  | Gigabyte Aero X16 1WH AMD Ryzen AI 7 350 ⎘ NVIDIA GeForce RTX 5070 Laptop ⎘ 32 GB Memory, 1024 GB SSD | Amazon: 1. $1,429.99 GIGABYTE AERO X16; Copilot+ ... 2. $1,149.99 GIGABYTE AERO X16; Copilot+ ... 3. $1,349.99 GIGABYTE AERO X16; Copilot+ ... List Price: 1799€ | 2 kg | 19.9 mm | 16.00" 2560x1600 189 PPI IPS |
5. 84.8%  | MSI Vector A18 HX A9W AMD Ryzen 9 9955HX ⎘ NVIDIA GeForce RTX 5070 Ti Laptop ⎘ 32 GB Memory | Amazon: $4,799.00 List Price: 3200 USD | 3.5 kg | 32.05 mm | 18.00" 2560x1600 189 PPI IPS |
6. 87.5%  | Lenovo Legion Pro 7i 16 Gen 10 Intel Core Ultra 9 275HX ⎘ NVIDIA GeForce RTX 5080 Laptop ⎘ 32 GB Memory, 1024 GB SSD | Amazon: $2,799.99 List Price: 4200 USD | 2.6 kg | 26.65 mm | 16.00" 2560x1600 189 PPI OLED |
Transparency
The selection of devices to be reviewed is made by our editorial team. The test sample was provided to the author as a loan by the manufacturer or retailer for the purpose of this review. The lender had no influence on this review, nor did the manufacturer receive a copy of this review before publication. There was no obligation to publish this review. As an independent media company, Notebookcheck is not subjected to the authority of manufacturers, retailers or publishers.
This is how Notebookcheck is testing
Every year, Notebookcheck independently reviews hundreds of laptops and smartphones using standardized procedures to ensure that all results are comparable. We have continuously developed our test methods for around 20 years and set industry standards in the process. In our test labs, high-quality measuring equipment is utilized by experienced technicians and editors. These tests involve a multi-stage validation process. Our complex rating system is based on hundreds of well-founded measurements and benchmarks, which maintains objectivity. Further information on our test methods can be found here.
