Notebookcheck Logo

NVIDIA RTX A5000 Laptop GPU vs Intel Iris Plus Graphics 655

NVIDIA RTX A5000 Laptop GPU

► remove from comparison NVIDIA RTX A5000 Laptop GPU

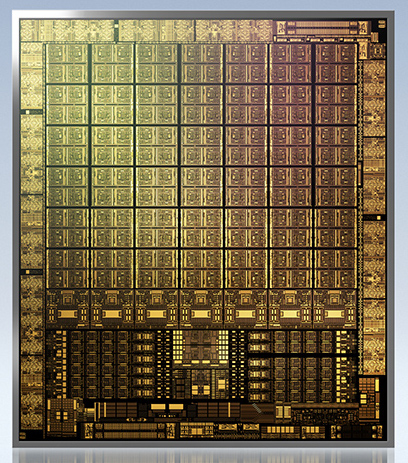
The NVIDIA RTX A5000 Laptop GPU or A5000 Mobile is a professional graphics card for mobile workstations. It is based on the GA104 Ampere chip and similar to the consumer GeForce RTX 3080 Laptop GPU. It offers the same 6.144 graphics cores, 48 RT cores, 192 Tensor cores and 16 GB GDDR6 graphics memory with a 256 Bit memory bus. It supports PCIe 4.0 and will be available in different variants from 80 - 165 Watt (TGP) with different clock speeds (and performance). The GPU supports eDP 1.4b to connect the internal monitor and DisplayPort 1.4 and HDMI 2.1 for external connections.

There is no more Max-Q variant (formerly used for the low power variants) but every OEM can choose to implement Max-Q technologies (Dynamic Boost, Whispermode).

The raw performance should be similar to the GeForce RTX 3080 for laptops at the same TGP level. Both GPUs depend heavily on good cooling and a high TGP for good performance. At a similar power consumption level the RTX A5000 should be clearly faster than the old Quadro RTX 5000 and 5000 Max-Q. The desktop variant of the A5000 however, is a lot faster.

The GA104 chip offers 6,144 FP32 ALUs of which half can also execute INT32 instructions (i.e. 3,072 INT32 ALUs). With Turing all shaders could still execute FP32 or INT32 instructions. The raytracing and tensor cores on the chip were also improved according to Nvidia. The Ampere chips also include an improved 5th generation video encoder (NVENC for H.264 and H.265) and a 7th generation decoder (for various formats now including AV1).

The GA104 chip is manufactured by Samsung in 8nm (8N), which is not quite able to keep up with the 7nm node at TSMC (e.g. used by AMD and also for the professional GA100 Ampere chip).

Intel Iris Plus Graphics 655

► remove from comparison Intel Iris Plus Graphics 655

The Intel Iris Plus Graphics 655 (GT3e) is a processor graphics card announced in September 2017. As the successor to the Intel Iris Graphics 650 (Kaby Lake), the Iris Plus Graphics 655 is used for 28-Watt Coffee Lake-U models. The biggest difference is the doubled eDRAM-cache at 128 MB. There should not be any big changes compared to the Iris Graphics 650.

The so called GT3e version of the Kaby Lake GPU still has 48 Execution Units (EUs), which can reach up to 1200 MHz (previously 1100 MHz) depending on the model. Besides eDRAM cache, the Iris 655 can also access the system memory (2x 64 Bit DDR3L-2133/DDR4-2400) via processor interface.

Compared to the Iris Plus 640 from the 15-Watt models, the Iris 655 only has a slightly higher maximum clock as well as almost twice the TDP, which allows a better utilization of the Turbo Boost potential.

Performance

The exact performance of the Iris Plus Graphics 655 depends on the CPU model, because maximum clock as well as the size of the L3 cache can differ a bit. The system memory (DDR3/DDR4) will influence the performance as well.

The fastest chips are high-clocked Core i7 models like the Core i7-8559U. Depending on the game, the Iris Plus 655 will probably be on par with a dedicated GeForce 930M or GeForce 940MX and can handle smooth gameplay in modern titles in low up to medium settings.

Features

The reworked video engine now fully supports hardware decoding of H.265/HEVC videos. Contrary to Skylake, however, Kaby Lake can now also decode H.265/HEVC Main 10 with a 10-bit color depth as well as Google's VP9 codec. The video output is possible via DP 1.2/eDP 1.3 (up to 3840 x 2160 @60 Hz), whereas HDMI is also supported in the older 1.4a standard. An HDMI 2.0 output can be added via converter from DisplayPort. The GPU can drive up to three displays simultaneously.

Power Consumption

The Iris Plus Graphics 655 is used for 28-Watt processor and therefore small/medium-sized notebooks.

NVIDIA RTX A5000 Laptop GPUIntel Iris Plus Graphics 655
Gen. 9.5 Series
RTX A5500 Laptop GPU compare 7424 256 Bit @ 16000 MHz
RTX A4500 Laptop GPU compare 5888 @ 0.93 - 1.5 GHz256 Bit @ 16000 MHz
RTX A5000 Laptop GPU 6144 @ 1.22 - 1.77 GHz256 Bit @ 14000 MHz
RTX A4000 Laptop GPU compare 5120 @ 0.78 - 1.68 GHz256 Bit @ 12000 MHz
RTX A3000 Laptop GPU compare 4096 @ 1.08 - 1.56 GHz192 Bit @ 14000 MHz
RTX A2000 compare 3328 @ 0.56 - 1.2 GHz192 Bit @ 12000 MHz
RTX A2000 Laptop GPU compare 2560 @ 0.89 - 1.69 GHz128 Bit @ 14000 MHz
RTX A1000 Laptop GPU compare 2048 128 Bit @ 14000 MHz
RTX A500 Laptop GPU compare 2048 64 Bit @ 14000 MHz
Iris Plus Graphics 655 48 @ 0.3 - 1.2 GHz
Iris Plus Graphics 650 compare 48 @ 0.3 - 1.1 GHz64/128 Bit
Iris Plus Graphics 645 compare 48 @ 0.3 - 1.15 GHz
Iris Plus Graphics 640 compare 48 @ 0.3 - 1.05 GHz64/128 Bit
UHD Graphics 630 compare 24 @ 0.3 - 1.15 GHz64/128 Bit
UHD Graphics P630 compare 24 @ 0.3 - 1.2 GHz64/128 Bit
HD Graphics 630 compare 24 @ 0.3 - 1.15 GHz64/128 Bit
HD Graphics P630 compare 24 64/128 Bit
UHD Graphics 620 compare 24 @ 0.3 - 1.15 GHz
HD Graphics 620 compare 24 @ 0.3 - 1.05 GHz64/128 Bit
UHD Graphics 617 compare 24 @ 0.3 - 1.15 GHz64/128 Bit
UHD Graphics 615 compare 24 @ 0.3 - 1 GHz64/128 Bit
HD Graphics 615 compare 24 @ 0.3 - 1.05 GHz64/128 Bit
CodenameGA104Kaby Lake GT3e
ArchitectureAmpereGen. 9.5 Kaby Lake
Pipelines6144 - unified48 - unified
TMUs192
ROPs96
Raytracing Cores48
Tensor / AI Cores192
Core Speed1215 - 1770 (Boost) MHz300 - 1200 (Boost) MHz
Theoretical Performance21.7 TFLOPS FP32
Memory Speed14000 effective = 1750 MHz
Memory Bus Width256 Bit
Memory TypeGDDR6DDR3/DDR4
Max. Amount of Memory16 GB
Shared Memorynoyes
Memory Bandwidth448 GB/s
APIDirectX 12_2, Shader 6.7, OpenGL 4.6DirectX 12_1, OpenGL 4.5
Power Consumption165 Watt (80 - 150 Watt TGP)
Transistors17.4 Billion
Die Size 392 mm²
technology8 nm14 nm
PCIe4.0
DisplaysHDMI 2.1, DisplayPort 1.4
FeaturesDisplayPort 1.4, HDMI 2.1, PCIe 4.0 x16, 21.7 SP-FP TFLOPS Peak, 174 Tensor Performance Peak, up to 448 GB/s Memory Bandwidth, Resizable BAR, Support for Modern StandbyQuickSync
Notebook Sizelarge
Date of Announcement12.04.2021 01.09.2017
Link to Manufacturer Pagewww.nvidia.com
CPU in Iris Plus Graphics 655GPU Base SpeedGPU Boost / Turbo
Intel Core i7-8559U4 x 2700 MHz, 28 W300 MHz1200 MHz
Intel Core i5-8269U4 x 2600 MHz, 28 W300 MHz1100 MHz
Intel Core i5-8279U4 x 2400 MHz, 28 W300 MHz1150 MHz
min. - max.300 MHz1050 - 1200 MHz

Benchmarks

Performance Rating - 3DMark 11 + Fire Strike + Time Spy - Iris Plus Graphics 655
0.7 pt (2%)
Restrict / Search: Model: Max. age: years
3DMark - 3DMark Time Spy Score
min: 8348     avg: 9897     median: 10157 (27%)     max: 11185 Points
min: 348     avg: 647     median: 684 (2%)     max: 722 Points
3DMark - 3DMark Time Spy Graphics
min: 8242     avg: 10043     median: 10307 (21%)     max: 11580 Points
min: 301     avg: 570     median: 604.5 (1%)     max: 633 Points
3DMark - 3DMark Ice Storm Unlimited Graphics
min: 131607     avg: 139716     median: 137266 (14%)     max: 152727 Points
3DMark - 3DMark Ice Storm Extreme Graphics
min: 57033     avg: 72655     median: 71073 (8%)     max: 89859 Points
3DMark - 3DMark Cloud Gate Score
min: 32082     avg: 33689     median: 33688.5 (32%)     max: 35295 Points
min: 6769     avg: 10798     median: 11622 (11%)     max: 13037 Points
3DMark - 3DMark Cloud Gate Graphics
min: 46733     avg: 50154     median: 50153.5 (12%)     max: 53574 Points
min: 6498     avg: 13736     median: 14343 (4%)     max: 16698 Points
3DMark - 3DMark Fire Strike Standard Score
min: 18791     avg: 21922     median: 22819 (34%)     max: 24155 Points
min: 852     avg: 1703     median: 1850 (3%)     max: 2040 Points
3DMark - 3DMark Fire Strike Standard Graphics
min: 23579     avg: 26820     median: 27271 (25%)     max: 29610 Points
min: 920     avg: 1836     median: 1983 (2%)     max: 2260 Points
3DMark - 3DMark Ice Storm Graphics
min: 85405     avg: 107151     median: 110302 (12%)     max: 122594 Points
3DMark 11 - 3DM11 Performance Score
min: 24697     avg: 28454     median: 28454 (34%)     max: 32211 Points
min: 1548     avg: 2942     median: 3180.5 (4%)     max: 3349 Points
3DMark 11 - 3DM11 Performance GPU
min: 30423     avg: 36164     median: 36163.5 (28%)     max: 41904 Points
min: 1365     avg: 2707     median: 2894 (2%)     max: 3081 Points
3DMark Vantage
3DM Vant. Perf. total + Intel Iris Plus Graphics 655
3DMark Vantage - 3DM Vant. Perf. total
min: 12093     avg: 12287     median: 12287 (4%)     max: 12481 Points
3DM Vant. Perf. GPU no PhysX + Intel Iris Plus Graphics 655
3DMark Vantage - 3DM Vant. Perf. GPU no PhysX
min: 10337     avg: 10514     median: 10513.5 (6%)     max: 10690 Points
3DMark 05 - 3DMark 05 - Standard
22740 Points (25%)
3DMark 06 3DMark 06 - Standard 1280x1024 + Intel Iris Plus Graphics 655
3DMark 06
min: 17176     avg: 17885     median: 17885 (23%)     max: 18594 Points
Unigine Valley 1.0 - Unigine Valley 1.0 DX
8.2 fps (2%)
SPECviewperf 12
specvp12 sw-03 + NVIDIA RTX A5000 Laptop GPU
SPECviewperf 12 - specvp12 sw-03
168.2 fps (42%)
specvp12 sw-03 + Intel Iris Plus Graphics 655
28.2 fps (7%)
specvp12 snx-02 + NVIDIA RTX A5000 Laptop GPU
SPECviewperf 12 - specvp12 snx-02
167.3 fps (25%)
specvp12 snx-02 + Intel Iris Plus Graphics 655
2.1 fps (0%)
specvp12 showcase-01 + NVIDIA RTX A5000 Laptop GPU
SPECviewperf 12 - specvp12 showcase-01
110.3 fps (19%)
specvp12 showcase-01 + Intel Iris Plus Graphics 655
10.3 fps (2%)
specvp12 mediacal-01 + NVIDIA RTX A5000 Laptop GPU
SPECviewperf 12 - specvp12 mediacal-01
69.8 fps (18%)
specvp12 mediacal-01 + Intel Iris Plus Graphics 655
4.6 fps (1%)
specvp12 maya-04 + NVIDIA RTX A5000 Laptop GPU
SPECviewperf 12 - specvp12 maya-04
113.8 fps (31%)
specvp12 maya-04 + Intel Iris Plus Graphics 655
20.4 fps (6%)
specvp12 energy-01 + NVIDIA RTX A5000 Laptop GPU
SPECviewperf 12 - specvp12 energy-01
16.9 fps (15%)
specvp12 energy-01 + Intel Iris Plus Graphics 655
0.3 fps (0%)
specvp12 creo-01 + NVIDIA RTX A5000 Laptop GPU
SPECviewperf 12 - specvp12 creo-01
151.3 fps (61%)
specvp12 creo-01 + Intel Iris Plus Graphics 655
14.9 fps (6%)
specvp12 catia-04 + NVIDIA RTX A5000 Laptop GPU
SPECviewperf 12 - specvp12 catia-04
177.3 fps (29%)
specvp12 catia-04 + Intel Iris Plus Graphics 655
18.8 fps (3%)
specvp12 3dsmax-05 + Intel Iris Plus Graphics 655
SPECviewperf 12 - specvp12 3dsmax-05
18.1 fps (3%)
SPECviewperf 13 specvp13 sw-04 + NVIDIA RTX A5000 Laptop GPU
SPECviewperf 13 - specvp13 sw-04
min: 144.9     avg: 151.3     median: 151.3 (41%)     max: 157.7 fps
specvp13 sw-04 + Intel Iris Plus Graphics 655
34.6 fps (9%)
specvp13 snx-03 + NVIDIA RTX A5000 Laptop GPU
SPECviewperf 13 - specvp13 snx-03
min: 276     avg: 297.6     median: 297.6 (33%)     max: 319.2 fps
specvp13 snx-03 + Intel Iris Plus Graphics 655
3.8 fps (0%)
specvp13 showcase-02 + NVIDIA RTX A5000 Laptop GPU
SPECviewperf 13 - specvp13 showcase-02
min: 103.8     avg: 117.9     median: 117.9 (20%)     max: 131.9 fps
specvp13 showcase-02 + Intel Iris Plus Graphics 655
10.3 fps (2%)
specvp13 medical-02 + NVIDIA RTX A5000 Laptop GPU
SPECviewperf 13 - specvp13 medical-02
min: 109.4     avg: 114.3     median: 114.3 (19%)     max: 119.1 fps
specvp13 medical-02 + Intel Iris Plus Graphics 655
3.8 fps (1%)
specvp13 maya-05 + NVIDIA RTX A5000 Laptop GPU
SPECviewperf 13 - specvp13 maya-05
min: 219.7     avg: 235.1     median: 235.1 (27%)     max: 250.4 fps
specvp13 maya-05 + Intel Iris Plus Graphics 655
25.9 fps (3%)
specvp13 energy-02 + NVIDIA RTX A5000 Laptop GPU
SPECviewperf 13 - specvp13 energy-02
min: 53.2     avg: 63.8     median: 63.8 (21%)     max: 74.3 fps
specvp13 energy-02 + Intel Iris Plus Graphics 655
1.1 fps (0%)
specvp13 creo-02 + NVIDIA RTX A5000 Laptop GPU
SPECviewperf 13 - specvp13 creo-02
min: 214.3     avg: 233     median: 233 (34%)     max: 251.7 fps
specvp13 creo-02 + Intel Iris Plus Graphics 655
19.6 fps (3%)
specvp13 catia-05 + NVIDIA RTX A5000 Laptop GPU
SPECviewperf 13 - specvp13 catia-05
min: 243.4     avg: 262.2     median: 262.2 (29%)     max: 280.9 fps
specvp13 catia-05 + Intel Iris Plus Graphics 655
26.4 fps (3%)
specvp13 3dsmax-06 + NVIDIA RTX A5000 Laptop GPU
SPECviewperf 13 - specvp13 3dsmax-06
min: 183.8     avg: 196     median: 196 (31%)     max: 208.1 fps
specvp13 3dsmax-06 + Intel Iris Plus Graphics 655
18.2 fps (3%)
SPECviewperf 2020 specvp2020 solidworks-05 1080p + NVIDIA RTX A5000 Laptop GPU
SPECviewperf 2020 - specvp2020 solidworks-05 1080p
min: 169     avg: 181.5     median: 176 (33%)     max: 199.4 fps
specvp2020 snx-04 1080p + NVIDIA RTX A5000 Laptop GPU
SPECviewperf 2020 - specvp2020 snx-04 1080p
min: 260.5     avg: 285     median: 285.4 (35%)     max: 309.1 fps
specvp2020 medical-03 1080p + NVIDIA RTX A5000 Laptop GPU
SPECviewperf 2020 - specvp2020 medical-03 1080p
min: 56.6     avg: 57.4     median: 56.9 (16%)     max: 58.7 fps
specvp2020 maya-06 1080p + NVIDIA RTX A5000 Laptop GPU
SPECviewperf 2020 - specvp2020 maya-06 1080p
min: 258.3     avg: 272.8     median: 270.1 (29%)     max: 290 fps
specvp2020 energy-03 1080p + NVIDIA RTX A5000 Laptop GPU
SPECviewperf 2020 - specvp2020 energy-03 1080p
min: 55     avg: 64.8     median: 67.9 (11%)     max: 71.6 fps
specvp2020 creo-03 1080p + NVIDIA RTX A5000 Laptop GPU
SPECviewperf 2020 - specvp2020 creo-03 1080p
min: 132.6     avg: 136.1     median: 136 (47%)     max: 139.7 fps
specvp2020 catia-06 1080p + NVIDIA RTX A5000 Laptop GPU
SPECviewperf 2020 - specvp2020 catia-06 1080p
min: 93.6     avg: 99.5     median: 98.8 (48%)     max: 106 fps
specvp2020 3dsmax-07 1080p + NVIDIA RTX A5000 Laptop GPU
SPECviewperf 2020 - specvp2020 3dsmax-07 1080p
min: 120     avg: 124.2     median: 123.1 (33%)     max: 129.6 fps
specvp2020 solidworks-05 4k + NVIDIA RTX A5000 Laptop GPU
SPECviewperf 2020 - specvp2020 solidworks-05 4k
min: 72.8     avg: 82.6     median: 82.4 (20%)     max: 92.5 fps
specvp2020 solidworks-05 4k + Intel Iris Plus Graphics 655
21.2 fps (5%)
specvp2020 snx-04 4k + NVIDIA RTX A5000 Laptop GPU
SPECviewperf 2020 - specvp2020 snx-04 4k
min: 133.4     avg: 152.3     median: 151.3 (16%)     max: 172.2 fps
specvp2020 snx-04 4k + Intel Iris Plus Graphics 655
3.8 fps (0%)
specvp2020 medical-03 4k + NVIDIA RTX A5000 Laptop GPU
SPECviewperf 2020 - specvp2020 medical-03 4k
min: 21.42     avg: 22.8     median: 23.5 (15%)     max: 23.58 fps
specvp2020 medical-03 4k + Intel Iris Plus Graphics 655
1.8 fps (1%)
specvp2020 maya-06 4k + NVIDIA RTX A5000 Laptop GPU
SPECviewperf 2020 - specvp2020 maya-06 4k
min: 119.2     avg: 127.7     median: 129.5 (19%)     max: 134.5 fps
specvp2020 maya-06 4k + Intel Iris Plus Graphics 655
32.7 fps (5%)
specvp2020 energy-03 4k + NVIDIA RTX A5000 Laptop GPU
SPECviewperf 2020 - specvp2020 energy-03 4k
min: 39.3     avg: 87.1     median: 83.3 (12%)     max: 138.7 fps
specvp2020 energy-03 4k + Intel Iris Plus Graphics 655
1.1 fps (0%)
specvp2020 creo-03 4k + NVIDIA RTX A5000 Laptop GPU
SPECviewperf 2020 - specvp2020 creo-03 4k
min: 88.6     avg: 93.3     median: 89.8 (40%)     max: 101.6 fps
specvp2020 creo-03 4k + Intel Iris Plus Graphics 655
12.1 fps (5%)
specvp2020 catia-06 4k + NVIDIA RTX A5000 Laptop GPU
SPECviewperf 2020 - specvp2020 catia-06 4k
min: 53     avg: 58.4     median: 57.9 (38%)     max: 64.2 fps
specvp2020 catia-06 4k + Intel Iris Plus Graphics 655
6.3 fps (4%)
specvp2020 3dsmax-07 4k + NVIDIA RTX A5000 Laptop GPU
SPECviewperf 2020 - specvp2020 3dsmax-07 4k
min: 77     avg: 83.9     median: 86.9 (29%)     max: 87.8 fps
specvp2020 3dsmax-07 4k + Intel Iris Plus Graphics 655
8.4 fps (3%)
Cinebench R10 Cinebench R10 Shading (32bit) + Intel Iris Plus Graphics 655
Cinebench R10 - Cinebench R10 Shading (32bit)
min: 7836     avg: 9544     median: 10263 (7%)     max: 10533 Points
Cinebench R11.5 Cinebench R11.5 OpenGL 64 Bit + Intel Iris Plus Graphics 655
Cinebench R11.5 - Cinebench R11.5 OpenGL 64 Bit
min: 50.25     avg: 51.4     median: 51.6 (17%)     max: 52.2 fps
Cinebench R15
Cinebench R15 OpenGL 64 Bit + NVIDIA RTX A5000 Laptop GPU
Cinebench R15 - Cinebench R15 OpenGL 64 Bit
min: 291     avg: 294.7     median: 291 (17%)     max: 302 fps
Cinebench R15 OpenGL 64 Bit + Intel Iris Plus Graphics 655
min: 33.91     avg: 67     median: 74 (4%)     max: 88 fps
Cinebench R15 OpenGL Ref. Match 64 Bit + NVIDIA RTX A5000 Laptop GPU
Cinebench R15 - Cinebench R15 OpenGL Ref. Match 64 Bit
99.6 % (100%)
Cinebench R15 OpenGL Ref. Match 64 Bit + Intel Iris Plus Graphics 655
min: 97.8     avg: 98.1     median: 97.8 (98%)     max: 99.3 %
GFXBench - GFXBench Car Chase Offscreen
455 fps (43%)
GFXBench 3.1 - GFXBench Manhattan ES 3.1 Offscreen
597 fps (13%)
min: 43.1     avg: 2387     median: 2387.1 (50%)     max: 4731 fps
GFXBench 3.0 - GFXBench 3.0 Manhattan Offscreen
654 fps (27%)
199.6 fps (8%)
GFXBench (DX / GLBenchmark) 2.7
GFXBench T-Rex HD Offscreen C24Z16 + NVIDIA RTX A5000 Laptop GPU
GFXBench (DX / GLBenchmark) 2.7 - GFXBench T-Rex HD Offscreen C24Z16
2032 fps (16%)
GFXBench T-Rex HD Offscreen C24Z16 + Intel Iris Plus Graphics 655
min: 199.6     avg: 6375     median: 6375.3 (51%)     max: 12551 fps
LuxMark v2.0 64Bit - LuxMark v2.0 Room GPU
4101 Samples/s (15%)
min: 359     avg: 419.5     median: 419.5 (2%)     max: 480 Samples/s
LuxMark v2.0 64Bit - LuxMark v2.0 Sala GPU
9147 Samples/s (16%)
min: 882     avg: 1038     median: 1038 (2%)     max: 1194 Samples/s
ComputeMark v2.1 - ComputeMark v2.1 Result
24031 Points (20%)
min: 1584     avg: 1713     median: 1712.5 (1%)     max: 1841 Points
Power Consumption - Furmark Stress Test Power Consumption - external Monitor *
min: 125     avg: 157.7     median: 132 (18%)     max: 216 Watt
min: 28.9     avg: 37.4     median: 39.2 (5%)     max: 42.4 Watt
Power Consumption - The Witcher 3 Power Consumption - external Monitor *
min: 129     avg: 169     median: 152 (21%)     max: 226 Watt
min: 35.3     avg: 40.6     median: 39.4 (6%)     max: 47.2 Watt
Power Consumption - Witcher 3 Power Consumption *
min: 132     avg: 176.3     median: 165 (36%)     max: 232 Watt
min: 39.4     avg: 43.3     median: 43.3 (10%)     max: 47.2 Watt
Power Consumption - Power Efficiency - Witcher 3 ultra
min: 0.4237     avg: 0.5     median: 0.5 (45%)     max: 0.681 fps per Watt
0.1 fps per Watt (13%)
Power Consumption - Power Efficiency - Witcher 3 ultra external Monitor
min: 0.435     avg: 0.6     median: 0.5 (45%)     max: 0.697 fps per Watt
0.2 fps per Watt (13%)
Emissions Witcher 3 Fan Noise + NVIDIA RTX A5000 Laptop GPU
Emissions - Witcher 3 Fan Noise
min: 44.2     avg: 45.4     median: 45.4 (65%)     max: 46.6 dB(A)
Witcher 3 Fan Noise + Intel Iris Plus Graphics 655
min: 32.5     avg: 36.2     median: 37.2 (53%)     max: 39 dB(A)
Clock Speed - GPU Clock Witcher 3 ultra
1755 MHz (69%)
998 MHz (39%)
Clock Speed - GPU Clock Speed Furmark
1350 MHz (53%)

Average Benchmarks NVIDIA RTX A5000 Laptop GPU → 100% n=42

Average Benchmarks Intel Iris Plus Graphics 655 → 31% n=42

- Range of benchmark values for this graphics card
red legend - Average benchmark values for this graphics card
* Smaller numbers mean a higher performance
1 This benchmark is not used for the average calculation

Game Benchmarks

The following benchmarks stem from our benchmarks of review laptops. The performance depends on the used graphics memory, clock rate, processor, system settings, drivers, and operating systems. So the results don't have to be representative for all laptops with this GPU. For detailed information on the benchmark results, click on the fps number.

Far Cry 6

Far Cry 6

2021
low 1280x720
100%
RTX A5000 Laptop GPU:
120  fps
med. 1920x1080
100%
RTX A5000 Laptop GPU:
103  fps
high 1920x1080
100%
RTX A5000 Laptop GPU:
95  fps
ultra 1920x1080
100%
RTX A5000 Laptop GPU:
89  fps
QHD 2560x1440
100%
RTX A5000 Laptop GPU:
79  fps
4K 3840x2160
100%
RTX A5000 Laptop GPU:
51  fps
F1 2021

F1 2021

2021
low 1280x720
100%
RTX A5000 Laptop GPU:
164 257 269 ~ 230 fps
19%
Iris Plus Graphics 655:
44.6  fps
med. 1920x1080
100%
RTX A5000 Laptop GPU:
136 171 187 ~ 165 fps
13%
Iris Plus Graphics 655:
21.6  fps
high 1920x1080
100%
RTX A5000 Laptop GPU:
122 159 161 ~ 147 fps
11%
Iris Plus Graphics 655:
16.4  fps
ultra 1920x1080
100%
RTX A5000 Laptop GPU:
85 104 109 ~ 99 fps
10%
Iris Plus Graphics 655:
10.2  fps
QHD 2560x1440
100%
RTX A5000 Laptop GPU:
59 82.8 88.2 ~ 77 fps
4K 3840x2160
100%
RTX A5000 Laptop GPU:
38 48.7 53.6 ~ 47 fps
Hitman 3

Hitman 3

2021
low 1280x720
100%
RTX A5000 Laptop GPU:
206.6  fps
med. 1920x1080
100%
RTX A5000 Laptop GPU:
147.3  fps
high 1920x1080
100%
RTX A5000 Laptop GPU:
138.1  fps
ultra 1920x1080
100%
RTX A5000 Laptop GPU:
125.8  fps
QHD 2560x1440
100%
RTX A5000 Laptop GPU:
87.1  fps
4K 3840x2160
100%
RTX A5000 Laptop GPU:
47.1  fps
low 1280x720
100%
RTX A5000 Laptop GPU:
114.6 118 ~ 116 fps
med. 1920x1080
100%
RTX A5000 Laptop GPU:
83.1 104 ~ 94 fps
high 1920x1080
100%
RTX A5000 Laptop GPU:
68.1 90 ~ 79 fps
ultra 1920x1080
100%
RTX A5000 Laptop GPU:
58.6 78 ~ 68 fps
QHD 2560x1440
100%
RTX A5000 Laptop GPU:
37.1 51 ~ 44 fps
4K 3840x2160
100%
RTX A5000 Laptop GPU:
16.7 25 ~ 21 fps
low 1280x720
100%
RTX A5000 Laptop GPU:
123  fps
med. 1920x1080
100%
RTX A5000 Laptop GPU:
90  fps
high 1920x1080
100%
RTX A5000 Laptop GPU:
84  fps
ultra 1920x1080
100%
RTX A5000 Laptop GPU:
80  fps
QHD 2560x1440
100%
RTX A5000 Laptop GPU:
59  fps
4K 3840x2160
100%
RTX A5000 Laptop GPU:
38  fps
low 1280x720
100%
RTX A5000 Laptop GPU:
113  fps
med. 1920x1080
100%
RTX A5000 Laptop GPU:
76  fps
high 1920x1080
100%
RTX A5000 Laptop GPU:
64  fps
ultra 1920x1080
100%
RTX A5000 Laptop GPU:
55  fps
QHD 2560x1440
100%
RTX A5000 Laptop GPU:
44  fps
4K 3840x2160
100%
RTX A5000 Laptop GPU:
29  fps
Dirt 5

Dirt 5

2020
low 1280x720
100%
RTX A5000 Laptop GPU:
178.1  fps
med. 1920x1080
100%
RTX A5000 Laptop GPU:
115.2  fps
high 1920x1080
100%
RTX A5000 Laptop GPU:
91.7  fps
ultra 1920x1080
100%
RTX A5000 Laptop GPU:
74.8  fps
QHD 2560x1440
100%
RTX A5000 Laptop GPU:
59.5  fps
4K 3840x2160
100%
RTX A5000 Laptop GPU:
39  fps
low 1280x720
100%
RTX A5000 Laptop GPU:
69  fps
med. 1920x1080
100%
RTX A5000 Laptop GPU:
64  fps
high 1920x1080
100%
RTX A5000 Laptop GPU:
60  fps
ultra 1920x1080
100%
RTX A5000 Laptop GPU:
45  fps
QHD 2560x1440
100%
RTX A5000 Laptop GPU:
43  fps
4K 3840x2160
100%
RTX A5000 Laptop GPU:
26  fps
low 1280x720
100%
RTX A5000 Laptop GPU:
133  fps
med. 1920x1080
100%
RTX A5000 Laptop GPU:
109  fps
high 1920x1080
100%
RTX A5000 Laptop GPU:
101  fps
ultra 1920x1080
100%
RTX A5000 Laptop GPU:
91  fps
QHD 2560x1440
100%
RTX A5000 Laptop GPU:
73  fps
4K 3840x2160
100%
RTX A5000 Laptop GPU:
40  fps
F1 2020

F1 2020

2020
low 1280x720
100%
RTX A5000 Laptop GPU:
253  fps
16%
Iris Plus Graphics 655:
40.7  fps
med. 1920x1080
100%
RTX A5000 Laptop GPU:
181  fps
11%
Iris Plus Graphics 655:
19.1  fps
high 1920x1080
100%
RTX A5000 Laptop GPU:
164  fps
9%
Iris Plus Graphics 655:
14.5  fps
ultra 1920x1080
100%
RTX A5000 Laptop GPU:
133  fps
7%
Iris Plus Graphics 655:
9.6  fps
4K 3840x2160
100%
RTX A5000 Laptop GPU:
63.1  fps
low 1280x720
100%
RTX A5000 Laptop GPU:
145.8  fps
38%
Iris Plus Graphics 655:
54.8  fps
med. 1920x1080
100%
RTX A5000 Laptop GPU:
181.2  fps
10%
Iris Plus Graphics 655:
17.3  fps
high 1920x1080
100%
RTX A5000 Laptop GPU:
120.3  fps
10%
Iris Plus Graphics 655:
11.6  fps
ultra 1920x1080
100%
RTX A5000 Laptop GPU:
94.7  fps
QHD 2560x1440
100%
RTX A5000 Laptop GPU:
66.6  fps
4K 3840x2160
100%
RTX A5000 Laptop GPU:
34.9  fps
low 1280x720
Iris Plus Graphics 655:
0 (!)  fps
low 1280x720
Iris Plus Graphics 655:
29.1  fps
med. 1920x1080
Iris Plus Graphics 655:
16.2  fps
high 1920x1080
Iris Plus Graphics 655:
14.1  fps
ultra 1920x1080
Iris Plus Graphics 655:
6.6  fps
high 1920x1080
Iris Plus Graphics 655:
59.8  fps
4K 3840x2160
Iris Plus Graphics 655:
27.2  fps
low 1280x720
Iris Plus Graphics 655:
15.8  fps
low 1280x720
Iris Plus Graphics 655:
0 (!)  fps
GRID 2019

GRID 2019

2019
low 1280x720
Iris Plus Graphics 655:
36.3 (!)  fps
med. 1920x1080
Iris Plus Graphics 655:
20.9 (!)  fps
low 1280x720
Iris Plus Graphics 655:
0 (!)  fps
FIFA 20

FIFA 20

2019
low 1280x720
Iris Plus Graphics 655:
92  fps
med. 1920x1080
Iris Plus Graphics 655:
55.9  fps
high 1920x1080
Iris Plus Graphics 655:
46.3  fps
ultra 1920x1080
Iris Plus Graphics 655:
34.9  fps
QHD 2560x1440
Iris Plus Graphics 655:
26.5  fps
4K 3840x2160
Iris Plus Graphics 655:
13.6  fps
low 1280x720
100%
RTX A5000 Laptop GPU:
159.6  fps
14%
Iris Plus Graphics 655:
22.5 23.5 ~ 23 fps
med. 1920x1080
100%
RTX A5000 Laptop GPU:
121.6  fps
8%
Iris Plus Graphics 655:
10.2 10.4 ~ 10 fps
high 1920x1080
100%
RTX A5000 Laptop GPU:
85.9  fps
8%
Iris Plus Graphics 655:
6.4 6.7 ~ 7 fps
ultra 1920x1080
100%
RTX A5000 Laptop GPU:
67.1  fps
QHD 2560x1440
100%
RTX A5000 Laptop GPU:
46.8  fps
4K 3840x2160
100%
RTX A5000 Laptop GPU:
25.6  fps
Control

Control

2019
low 1280x720
Iris Plus Graphics 655:
25.4 (!)  fps
F1 2019

F1 2019

2019
low 1280x720
Iris Plus Graphics 655:
51.2  fps
med. 1920x1080
Iris Plus Graphics 655:
21.9  fps
high 1920x1080
Iris Plus Graphics 655:
19.3  fps
low 1280x720
Iris Plus Graphics 655:
56.7  fps
med. 1920x1080
Iris Plus Graphics 655:
18.5  fps
high 1920x1080
Iris Plus Graphics 655:
10.5  fps
Rage 2

Rage 2

2019
low 1280x720
Iris Plus Graphics 655:
24.5  fps
Anno 1800

Anno 1800

2019
low 1280x720
Iris Plus Graphics 655:
30.2  fps
low 1280x720
Iris Plus Graphics 655:
35  fps
low 1280x720
Iris Plus Graphics 655:
64  fps
med. 1920x1080
Iris Plus Graphics 655:
22.8  fps
Anthem

Anthem

2019
low 1280x720
Iris Plus Graphics 655:
16.6  fps
low 1280x720
100%
RTX A5000 Laptop GPU:
105  fps
21%
Iris Plus Graphics 655:
21 22 ~ 22 fps
med. 1920x1080
100%
RTX A5000 Laptop GPU:
85  fps
13%
Iris Plus Graphics 655:
11 11 ~ 11 fps
high 1920x1080
100%
RTX A5000 Laptop GPU:
78  fps
13%
Iris Plus Graphics 655:
10  fps
ultra 1920x1080
100%
RTX A5000 Laptop GPU:
71  fps
13%
Iris Plus Graphics 655:
9  fps
QHD 2560x1440
100%
RTX A5000 Laptop GPU:
62  fps
4K 3840x2160
100%
RTX A5000 Laptop GPU:
43  fps
low 1280x720
100%
RTX A5000 Laptop GPU:
148 154 ~ 151 fps
13%
Iris Plus Graphics 655:
18.3 20.1 ~ 19 fps
med. 1920x1080
100%
RTX A5000 Laptop GPU:
94.8 126 ~ 110 fps
9%
Iris Plus Graphics 655:
10.1  fps
high 1920x1080
100%
RTX A5000 Laptop GPU:
69 74.5 ~ 72 fps
10%
Iris Plus Graphics 655:
7.4  fps
ultra 1920x1080
100%
RTX A5000 Laptop GPU:
55 59.8 ~ 57 fps
QHD 2560x1440
100%
RTX A5000 Laptop GPU:
41 46.3 ~ 44 fps
4K 3840x2160
100%
RTX A5000 Laptop GPU:
24 28.5 ~ 26 fps
low 1280x720
Iris Plus Graphics 655:
19.9  fps
low 1280x720
Iris Plus Graphics 655:
0 (!)  fps
low 1280x720
Iris Plus Graphics 655:
13 18 ~ 16 fps
low 1280x720
Iris Plus Graphics 655:
25  fps
med. 1920x1080
Iris Plus Graphics 655:
0 (!)  fps
FIFA 19

FIFA 19

2018
low 1280x720
Iris Plus Graphics 655:
82  fps
med. 1920x1080
Iris Plus Graphics 655:
45.8  fps
high 1920x1080
Iris Plus Graphics 655:
40.3  fps
ultra 1920x1080
Iris Plus Graphics 655:
36.7  fps
low 1280x720
100%
RTX A5000 Laptop GPU:
128  fps
16%
Iris Plus Graphics 655:
19 20.5 22 23.5 ~ 21 fps
med. 1920x1080
100%
RTX A5000 Laptop GPU:
109  fps
11%
Iris Plus Graphics 655:
11 13 ~ 12 fps
high 1920x1080
100%
RTX A5000 Laptop GPU:
106  fps
8%
Iris Plus Graphics 655:
8 10.1 ~ 9 fps
ultra 1920x1080
100%
RTX A5000 Laptop GPU:
94  fps
QHD 2560x1440
100%
RTX A5000 Laptop GPU:
71  fps
4K 3840x2160
100%
RTX A5000 Laptop GPU:
38  fps
Strange Brigade

Strange Brigade

2018
low 1280x720
100%
RTX A5000 Laptop GPU:
337 412 419 ~ 389 fps
11%
Iris Plus Graphics 655:
41.4  fps
med. 1920x1080
100%
RTX A5000 Laptop GPU:
195 231 251 ~ 226 fps
8%
Iris Plus Graphics 655:
17.6  fps
high 1920x1080
100%
RTX A5000 Laptop GPU:
165 192 213 ~ 190 fps
9%
Iris Plus Graphics 655:
16.9  fps
ultra 1920x1080
100%
RTX A5000 Laptop GPU:
147 160 191 ~ 166 fps
9%
Iris Plus Graphics 655:
14.5  fps
QHD 2560x1440
100%
RTX A5000 Laptop GPU:
108 129 146 ~ 128 fps
4K 3840x2160
100%
RTX A5000 Laptop GPU:
64 86.8 ~ 75 fps
F1 2018

F1 2018

2018
low 1280x720
Iris Plus Graphics 655:
45  fps
med. 1920x1080
Iris Plus Graphics 655:
23  fps
high 1920x1080
Iris Plus Graphics 655:
17  fps
ultra 1920x1080
Iris Plus Graphics 655:
12 12 ~ 12 fps
low 1280x720
Iris Plus Graphics 655:
30.9  fps
Far Cry 5

Far Cry 5

2018
low 1280x720
100%
RTX A5000 Laptop GPU:
76 137 ~ 107 fps
21%
Iris Plus Graphics 655:
20 22 23 ~ 22 fps
med. 1920x1080
100%
RTX A5000 Laptop GPU:
69 93 121 ~ 94 fps
12%
Iris Plus Graphics 655:
10 11 11 ~ 11 fps
high 1920x1080
100%
RTX A5000 Laptop GPU:
62 90 113 ~ 88 fps
11%
Iris Plus Graphics 655:
10  fps
ultra 1920x1080
100%
RTX A5000 Laptop GPU:
60 85 103 ~ 83 fps
11%
Iris Plus Graphics 655:
9  fps
QHD 2560x1440
100%
RTX A5000 Laptop GPU:
58 79 92 ~ 76 fps
4K 3840x2160
100%
RTX A5000 Laptop GPU:
36 44 50 ~ 43 fps
World of Tanks enCore

World of Tanks enCore

2018
low 1366x768
Iris Plus Graphics 655:
15.7 250 ~ 133 fps
med. 1920x1080
Iris Plus Graphics 655:
40.3  fps
low 1280x720
100%
RTX A5000 Laptop GPU:
108 117 136 ~ 120 fps
22%
Iris Plus Graphics 655:
13.8 21.2 22.4 25.3 26.8 32.6 42.8 ~ 26 fps
med. 1920x1080
100%
RTX A5000 Laptop GPU:
90.8 102 114 ~ 102 fps
18%
Iris Plus Graphics 655:
9.8 15 15.3 18 18.4 23.3 29.5 ~ 18 fps
high 1920x1080
100%
RTX A5000 Laptop GPU:
76.5 81.6 90.5 ~ 83 fps
19%
Iris Plus Graphics 655:
8.6 12.3 13.4 15.9 16 19.8 25.1 ~ 16 fps
4K 3840x2160
100%
RTX A5000 Laptop GPU:
48.6 52 65.3 ~ 55 fps
low 1280x720
100%
RTX A5000 Laptop GPU:
155 184 184 ~ 174 fps
9%
Iris Plus Graphics 655:
9.1 14.7 15.6 16.6 16.9 17 17.3 18.1 ~ 16 fps
med. 1920x1080
100%
RTX A5000 Laptop GPU:
110 123 144 ~ 126 fps
7%
Iris Plus Graphics 655:
7.9 8.8 9.1 9.7 ~ 9 fps
high 1920x1080
100%
RTX A5000 Laptop GPU:
81.1 91.8 108 ~ 94 fps
6%
Iris Plus Graphics 655:
5.3 6 6.1 6.6 ~ 6 fps
QHD 2560x1440
100%
RTX A5000 Laptop GPU:
62.6 70.6 83.6 ~ 72 fps
4K 3840x2160
100%
RTX A5000 Laptop GPU:
35.4 41 51.1 ~ 43 fps
Fortnite

Fortnite

2018
low 1280x720
Iris Plus Graphics 655:
51.5  fps
med. 1920x1080
Iris Plus Graphics 655:
21.6  fps
low 1280x720
Iris Plus Graphics 655:
13  fps
low 1280x720
Iris Plus Graphics 655:
30  fps
med. 1920x1080
Iris Plus Graphics 655:
18  fps
high 1920x1080
Iris Plus Graphics 655:
14  fps
ultra 1920x1080
Iris Plus Graphics 655:
9  fps
low 1280x720
Iris Plus Graphics 655:
128  fps
med. 1366x768
Iris Plus Graphics 655:
125  fps
high 1920x1080
Iris Plus Graphics 655:
113  fps
ultra 1920x1080
Iris Plus Graphics 655:
57.8  fps
4K 3820x2160
Iris Plus Graphics 655:
34.4  fps
low 1280x720
Iris Plus Graphics 655:
78 97 133.3 ~ 103 fps
med. 1920x1080
Iris Plus Graphics 655:
40.6 46 59.1 ~ 49 fps
high 1920x1080
Iris Plus Graphics 655:
32.7 36 38.8 ~ 36 fps
low 1280x720
Iris Plus Graphics 655:
20.4 22.7 ~ 22 fps
med. 1920x1080
Iris Plus Graphics 655:
10.2  fps
For Honor

For Honor

2017
low 1280x720
Iris Plus Graphics 655:
0 (!) 41.3 ~ 21 fps
med. 1920x1080
Iris Plus Graphics 655:
16.1  fps
low 1280x720
Iris Plus Graphics 655:
28.7  fps
med. 1366x768
Iris Plus Graphics 655:
21.1  fps
Overwatch

Overwatch

2016
low 1280x720
Iris Plus Graphics 655:
91  fps
med. 1366x768
Iris Plus Graphics 655:
68  fps
high 1920x1080
Iris Plus Graphics 655:
29.9  fps
ultra 1920x1080
Iris Plus Graphics 655:
18.2  fps
low 1280x768
Iris Plus Graphics 655:
19.4  fps
med. 1920x1080
Iris Plus Graphics 655:
11.3  fps
high 1920x1080
Iris Plus Graphics 655:
10.5  fps
low 1280x720
Iris Plus Graphics 655:
34.2  fps
med. 1366x768
Iris Plus Graphics 655:
21.2  fps
low 1024x768
Iris Plus Graphics 655:
25.9 39.2 ~ 33 fps
med. 1366x768
Iris Plus Graphics 655:
17.6 22.3 ~ 20 fps
high 1920x1080
Iris Plus Graphics 655:
10.8  fps
ultra 1920x1080
Iris Plus Graphics 655:
8.9  fps
low 1024x768
Iris Plus Graphics 655:
75.8  fps
med. 1366x768
Iris Plus Graphics 655:
0 (!)  fps
low 1280x720
100%
RTX A5000 Laptop GPU:
144 164 ~ 154 fps
56%
Iris Plus Graphics 655:
51.4 84 86.8 87.9 92.6 94.4 95 98 ~ 86 fps
med. 1366x768
100%
RTX A5000 Laptop GPU:
136 148 ~ 142 fps
41%
Iris Plus Graphics 655:
34.6 37.1 57 63 64 66 68 77.9 ~ 58 fps
high 1920x1080
100%
RTX A5000 Laptop GPU:
124 140 ~ 132 fps
22%
Iris Plus Graphics 655:
15.8 25.3 27.8 31.9 32.4 33.3 34.5 34.7 ~ 29 fps
ultra 1920x1080
100%
RTX A5000 Laptop GPU:
117 131 ~ 124 fps
21%
Iris Plus Graphics 655:
13.4 22.7 24.5 27.7 28.1 28.1 29.9 30.4 ~ 26 fps
4K 3840x2160
100%
RTX A5000 Laptop GPU:
95 118 ~ 107 fps
11%
Iris Plus Graphics 655:
11.6 12.2 ~ 12 fps
low 1024x768
100%
RTX A5000 Laptop GPU:
321 335.1 354 ~ 337 fps
8%
Iris Plus Graphics 655:
23.2 24.7 27.4 27.9 ~ 26 fps
med. 1366x768
100%
RTX A5000 Laptop GPU:
217.9 227.4 271 ~ 239 fps
7%
Iris Plus Graphics 655:
14.6 17.8 ~ 16 fps
high 1920x1080
100%
RTX A5000 Laptop GPU:
124 149.5 179 ~ 151 fps
7%
Iris Plus Graphics 655:
10.1 10.9 ~ 11 fps
ultra 1920x1080
100%
RTX A5000 Laptop GPU:
81.7 89.9 98.3 ~ 90 fps
7%
Iris Plus Graphics 655:
5.6 5.6 ~ 6 fps
4K 3840x2160
100%
RTX A5000 Laptop GPU:
54.8 57.5 74 ~ 62 fps
GTA V

GTA V

2015
low 1024x768
100%
RTX A5000 Laptop GPU:
175 180 181 ~ 179 fps
35%
Iris Plus Graphics 655:
57 61 68 ~ 62 fps
med. 1366x768
100%
RTX A5000 Laptop GPU:
169 175 175 ~ 173 fps
32%
Iris Plus Graphics 655:
51.2 51.8 62.1 ~ 55 fps
high 1920x1080
100%
RTX A5000 Laptop GPU:
131 158 161 ~ 150 fps
10%
Iris Plus Graphics 655:
13.7 14.3 15.8 ~ 15 fps
ultra 1920x1080
100%
RTX A5000 Laptop GPU:
76.1 85.8 94.6 ~ 86 fps
7%
Iris Plus Graphics 655:
5.2 5.5 6.2 ~ 6 fps
QHD 2560x1440
100%
RTX A5000 Laptop GPU:
70.4 82.2 84.3 ~ 79 fps
5%
Iris Plus Graphics 655:
4.2  fps
4K 3840x2160
100%
RTX A5000 Laptop GPU:
75.5 76.3 92.5 ~ 81 fps
low 1280x720
Iris Plus Graphics 655:
78.4 116.6 ~ 98 fps
med. 1366x768
Iris Plus Graphics 655:
54.3 64.8 ~ 60 fps
high 1366x768
Iris Plus Graphics 655:
49.4 55 ~ 52 fps
ultra 1920x1080
Iris Plus Graphics 655:
15.5 17 ~ 16 fps
high 1366x768
Iris Plus Graphics 655:
93.7  fps
ultra 1920x1080
Iris Plus Graphics 655:
49.6  fps
4K 3820x2160
Iris Plus Graphics 655:
12.4  fps

Average Gaming NVIDIA RTX A5000 Laptop GPU → 100%

Average Gaming 30-70 fps → 100%

Average Gaming Intel Iris Plus Graphics 655 → 14%

Average Gaming 30-70 fps → 27%

NVIDIA RTX A5000 Laptop GPUIntel Iris Plus Graphics 655
lowmed.highultraQHD4Klowmed.highultraQHD4K
Far Cry 612010395897951
F1 202123016514799774744.621.616.410.2
Hitman 3206.6147.3138.1125.887.147.1
Cyberpunk 2077 1.01169479684421
Immortals Fenyx Rising1239084805938
Assassin´s Creed Valhalla1137664554429
Dirt 5178.1115.291.774.859.539
Watch Dogs Legion696460454326
Horizon Zero Dawn133109101917340
F1 202025318116413363.140.719.114.59.64
Gears Tactics145.8181.2120.394.766.634.954.817.311.6
Borderlands 3159.6121.685.967.146.825.623107
Far Cry New Dawn10585787162432211109
Metro Exodus151110725744261910.17.41
Shadow of the Tomb Raider12810910694713821129
Strange Brigade3892261901661287541.417.616.914.5
Far Cry 510794888376432211109
X-Plane 11.111201028355261816
Final Fantasy XV Benchmark1741269472431696
Dota 2 Reborn1541421321241078658292612
The Witcher 333723915190622616116
GTA V17917315086798162551564.17
NVIDIA RTX A5000 Laptop GPUIntel Iris Plus Graphics 655
lowmed.highultraQHD4Klowmed.highultraQHD4K
< 30 fps
< 60 fps
< 120 fps
≥ 120 fps


5
17


12
10


14
8

3
13
4

7
10
1
5
12
5
< 30 fps
< 60 fps
< 120 fps
≥ 120 fps
8
4
2
12
2

14


8


1


1


For more games that might be playable and a list of all games and graphics cards visit our Gaming List

Add one or more devices and compare

In the following list you can select (and also search for) devices that should be added to the comparison. You can select more than one device.

restrict list:
v1.33
log 12. 08:52:12

#0 ran 0s before starting gpusingle class +0s ... 0s

#1 checking url part for id 10675 +0s ... 0s

#2 checking url part for id 8828 +0s ... 0s

#3 redirected to Ajax server, took 1757659931s time from redirect:0 +0s ... 0s

#4 did not recreate cache, as it is less than 5 days old! Created at Wed, 10 Sep 2025 11:38:50 +0200 +0s ... 0s

#5 composed specs +0.02s ... 0.02s

#6 did output specs +0s ... 0.02s

#7 start showIntegratedCPUs +0s ... 0.02s

#8 getting avg benchmarks for device 10675 +0.019s ... 0.039s

#9 got single benchmarks 10675 +0.008s ... 0.046s

#10 getting avg benchmarks for device 8828 +0.004s ... 0.05s

#11 got single benchmarks 8828 +0.009s ... 0.059s

#12 got avg benchmarks for devices +0s ... 0.059s

#13 min, max, avg, median took s +0.045s ... 0.104s

#14 before gaming benchmark output +0s ... 0.104s

#15 Got 465 rows for game benchmarks. +0.021s ... 0.125s

#16 composed SQL query for gamebenchmarks +0s ... 0.125s

#17 got data and put it in $dataArray +0.005s ... 0.13s

#18 benchmarks composed for output. +0.021s ... 0.151s

#19 calculated avg scores. +0s ... 0.151s

#20 return log +0.002s ... 0.153s

Please share our article, every link counts!
Mail Logo
> Expert Reviews and News on Laptops, Smartphones and Tech Innovations > Benchmarks / Tech > Graphics Card Comparison - Head 2 Head
Redaktion, 2017-09- 8 (Update: 2023-07- 1)