Notebookcheck Logo

Apple M1 7-Core GPU vs NVIDIA GeForce GTX 1050 (Desktop) vs Apple M1 8-Core GPU

Apple M1 7-Core GPU

► remove from comparison Apple M1 7-Core GPU

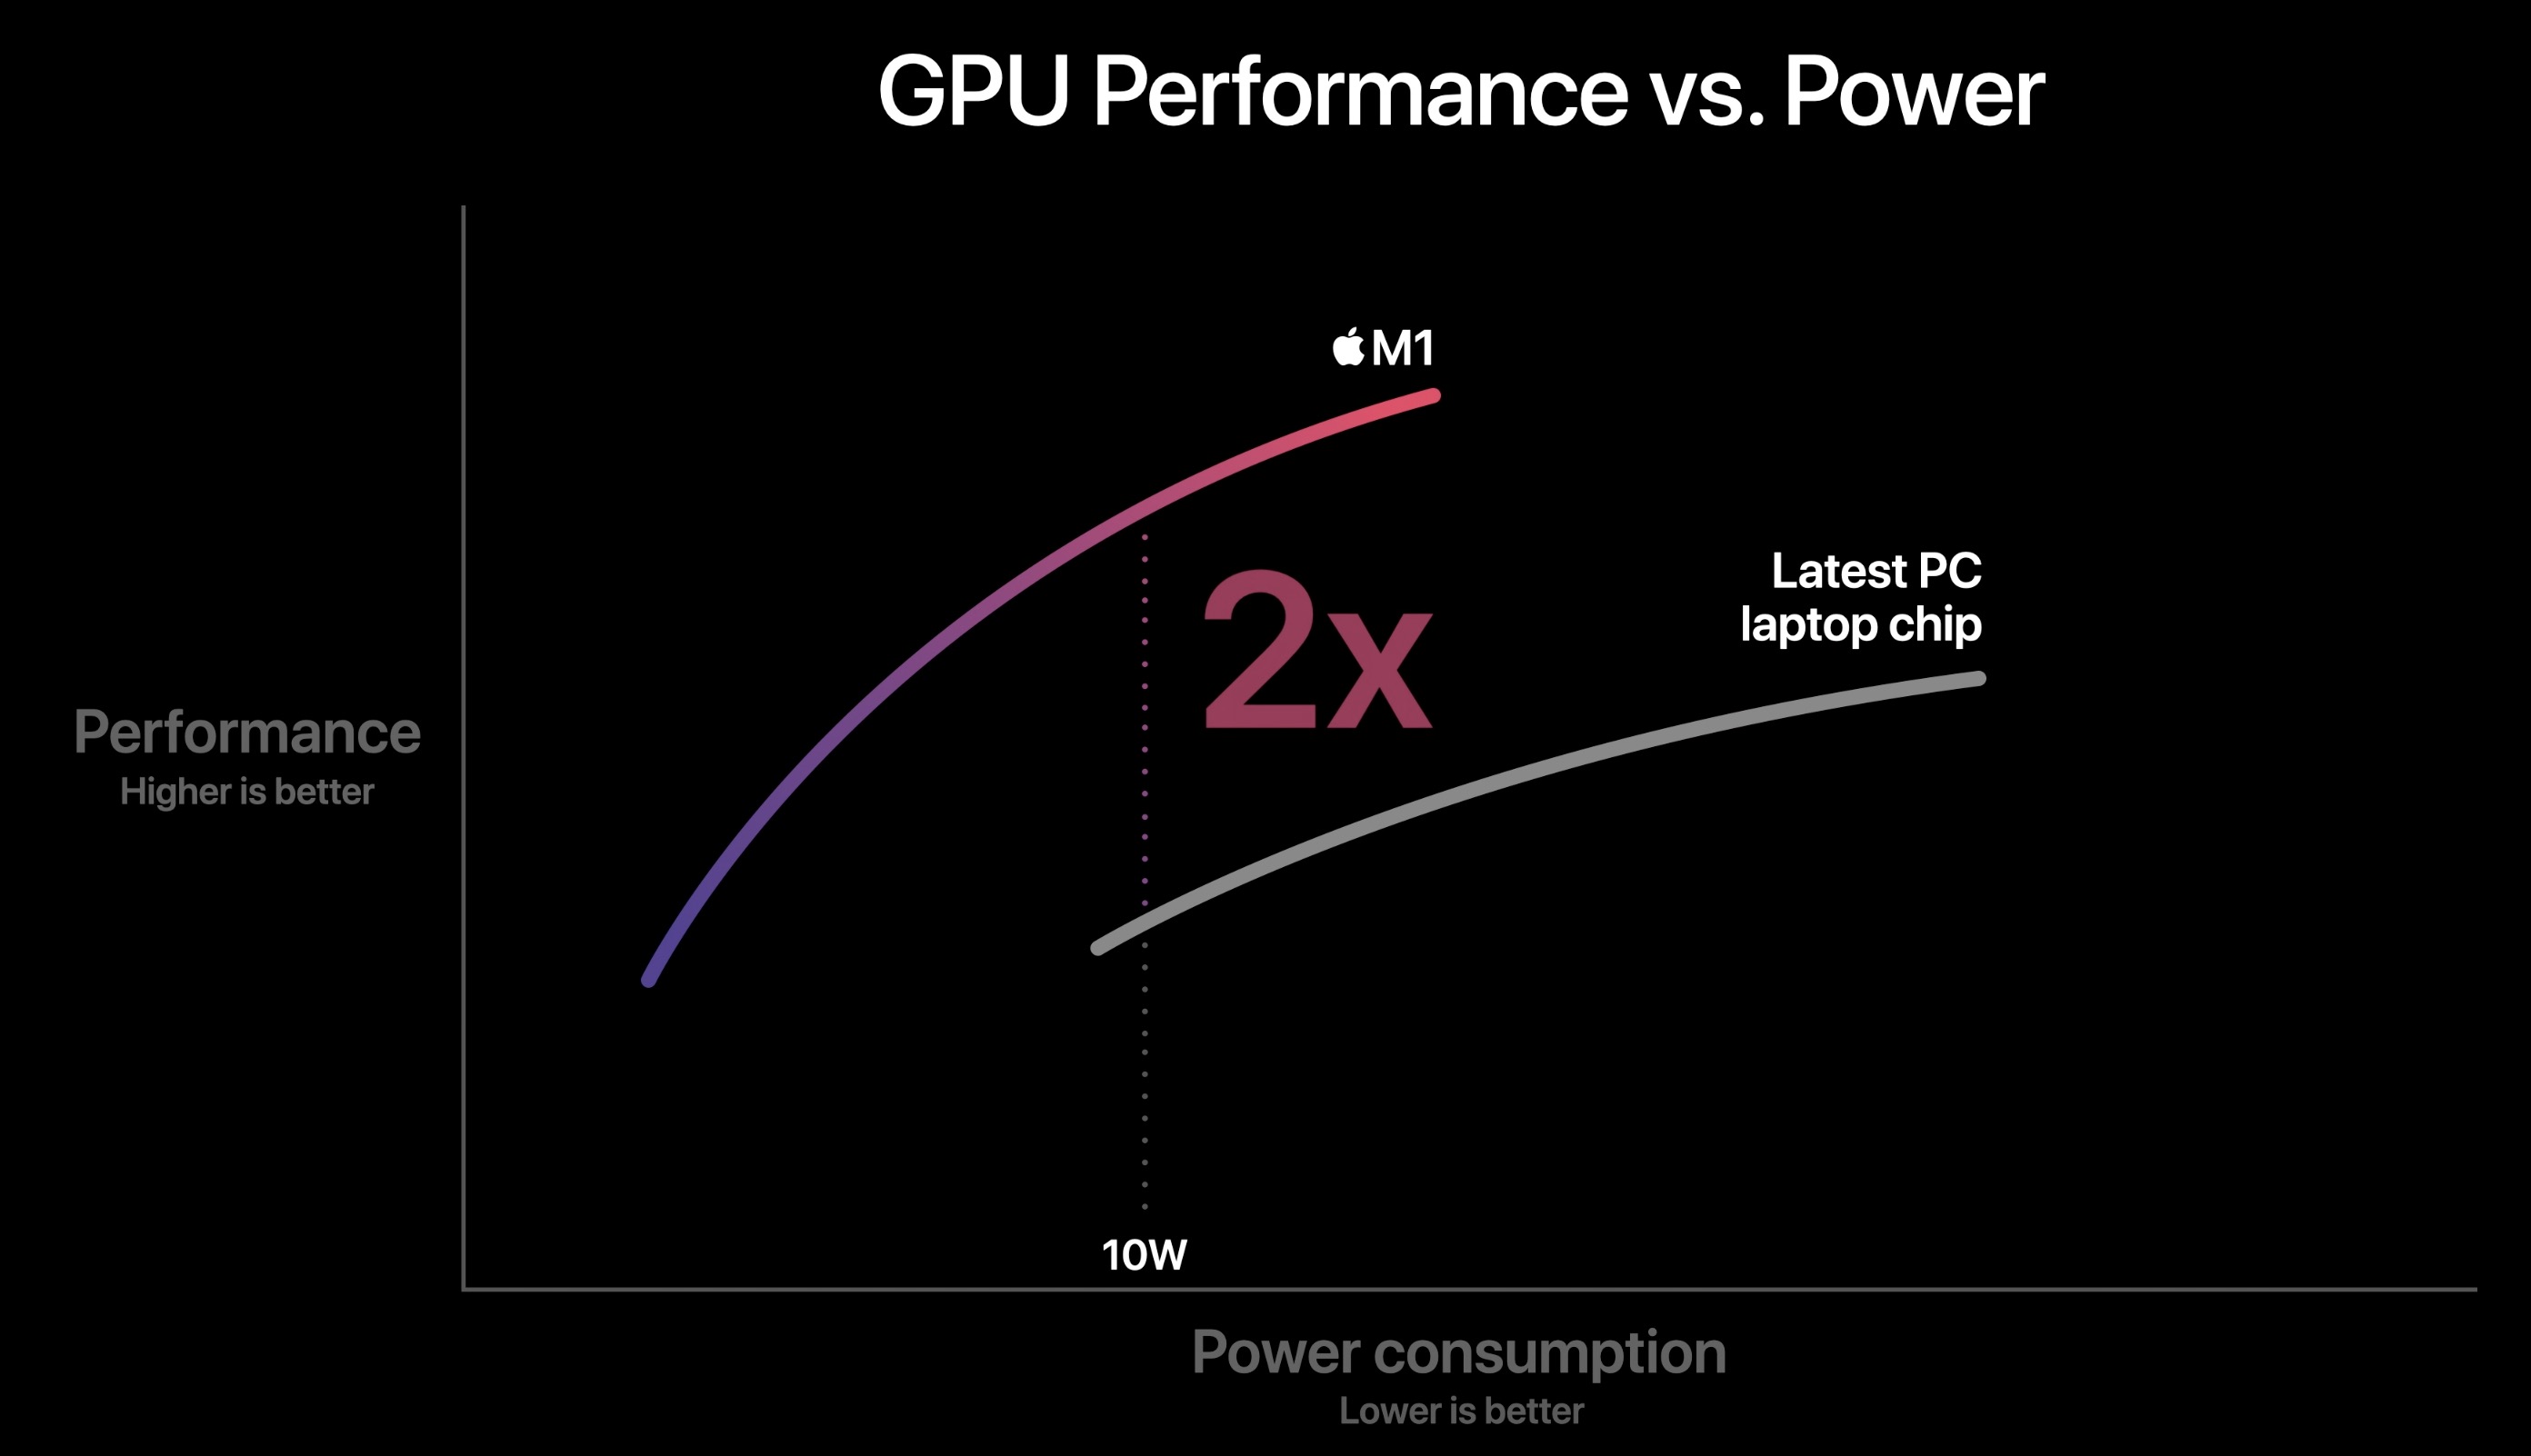
The Apple M1 GPU is an integrated graphics card offering 7 cores (1 deactivated core in the entry MacBook Air) designed by Apple and integrated in the Apple M1 SoC. According to Apple it is faster and more energy efficient as competing products (like the Tiger Lake Xe GPU). The peak performance of the high end variant with 8 cores is 2.6 teraflops, therefore the 7 core version should offer around 2.3 teraflops. Thanks to the unified memory architecture it should have fast access to the RAM.

The Apple M1 is manufactured in the modern 5nm process at TSMC and should offer an excellent energy efficiency.

NVIDIA GeForce GTX 1050 (Desktop)

► remove from comparison NVIDIA GeForce GTX 1050 (Desktop)

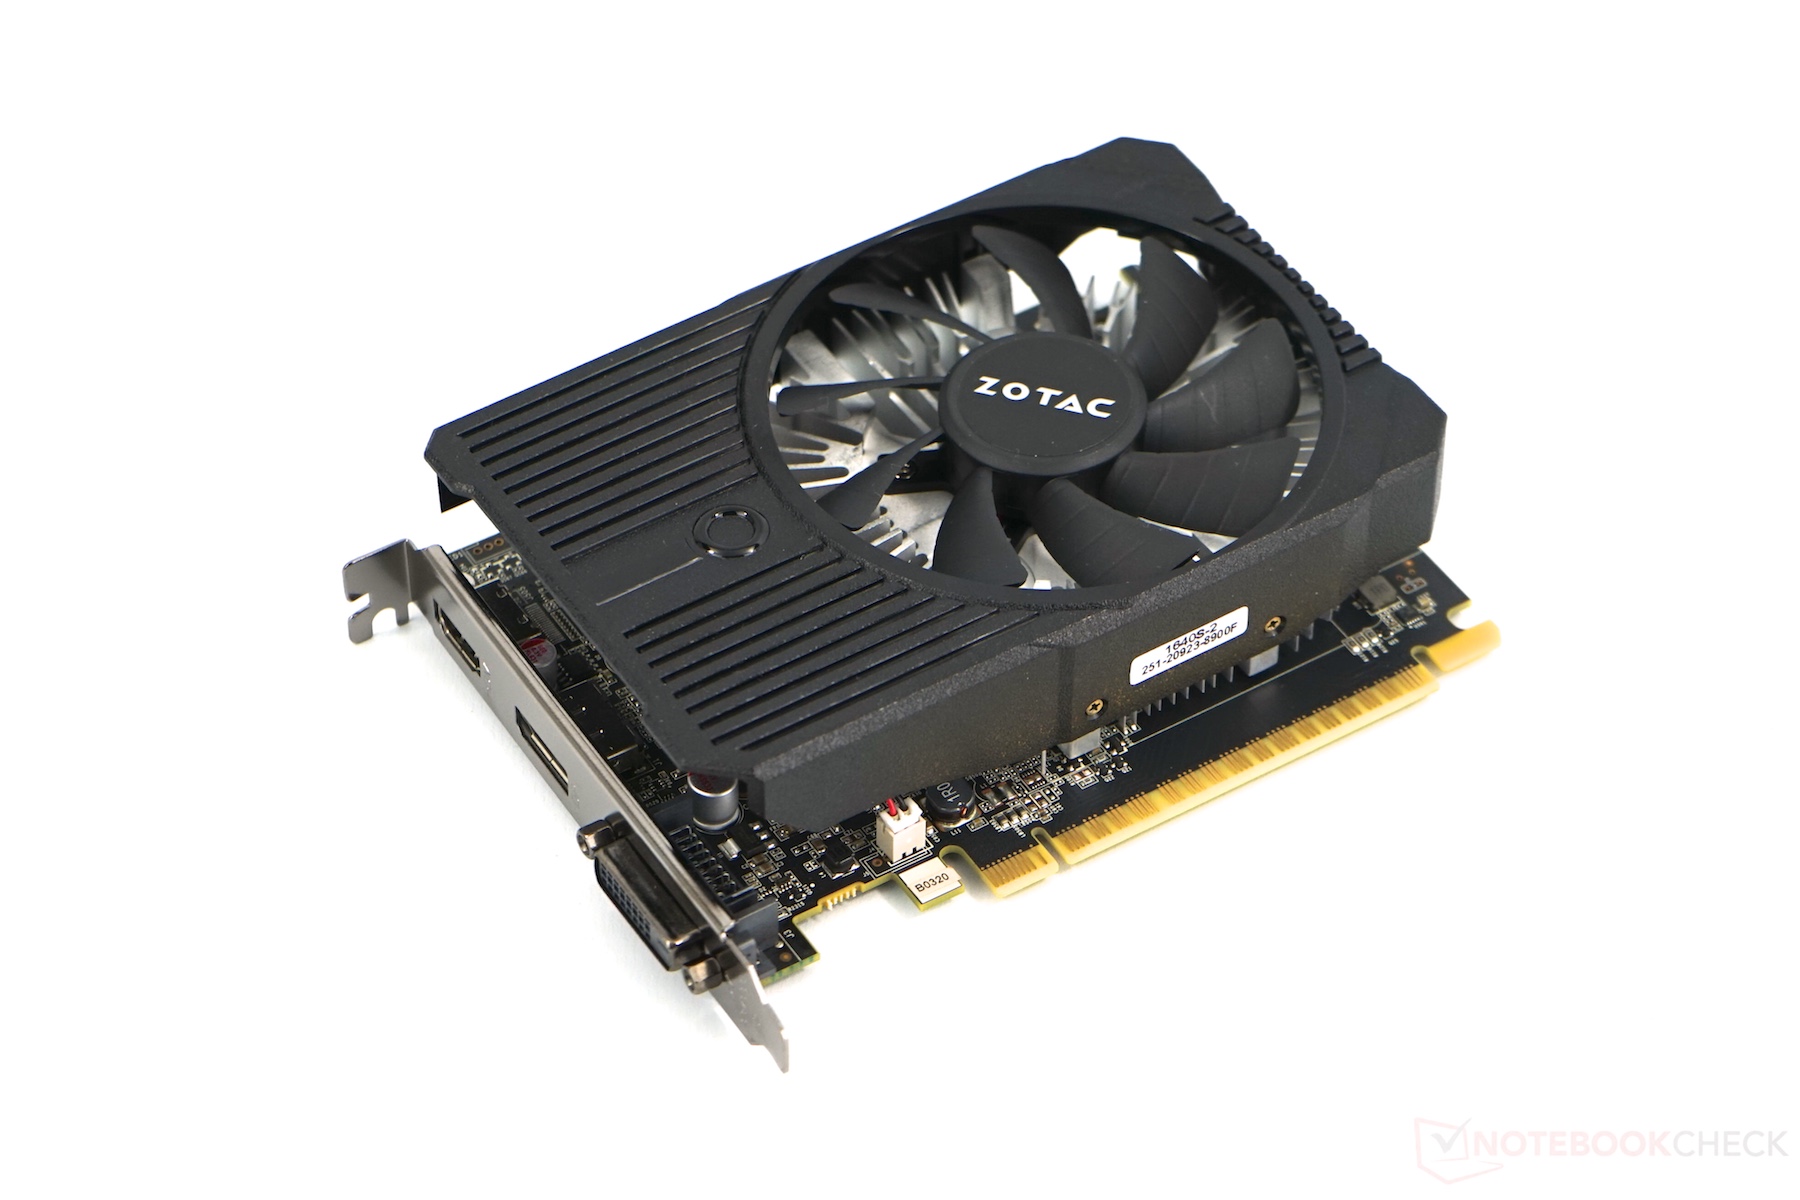
The Nvidia GeForce GTX 1050 is an entry level graphics card for desktops based on the Pascal architecture. It uses the same GP107 chip as the GTX 1050 Ti, but with only 640 instead of 768 shaders. The chip is manufactured at Samsung in 14 nm (opposed to the 16 nm TSCM based Pascal chips of the 1060 and up). The performance and specs should be similar to the GTX 1050 laptop version, that will be released later (early 2017). Compared to the faster GTX 1050 Ti, the 1050 offers less shaders (640 instead of 768) and only 2 GB of GDDR5 (instead of the 4 GB of the 1050 Ti).

Gaming benchmarks by Nvidia state that the GTX 1050 is about 30% faster on average than the Radeon RX 460 with 2 GB VRAM. The 4 GB version of the RX 460 should be about 10% slower and the older GTX 950 should reach a similar performance level as the new GTX 1050. Therefore, the GTX 1050 should be ideal for 1080p gaming with high detail settings (but not max settings).

Apple M1 8-Core GPU

► remove from comparison Apple M1 8-Core GPU

The Apple M1 GPU is an integrated graphics card offering 8 cores (1 deactivated core in the entry MacBook Air) designed by Apple and integrated in the Apple M1 SoC. According to Apple it is faster and more energy efficient as competing products (like the Tiger Lake Xe GPU). The peak performance of the high end variant is 2.6 teraflops and thanks to the unified memory architecture it should have fast access to the RAM.

The Apple M1 is manufactured in the modern 5nm process at TSMC and should offer an excellent energy efficiency. According to internal tools, the M1 GPU uses under load approximately 10 Watt (11.5 Watt package power including the RAM).

Apple M1 7-Core GPUNVIDIA GeForce GTX 1050 (Desktop)Apple M1 8-Core GPU
Apple M1 Series
M1 Max 32-Core GPU 32 @ 1.3 GHz512 Bit
M1 Max 24-Core GPU 24 @ 1.3 GHz
M1 Pro 16-Core GPU 16 @ 1.3 GHz
M1 Pro 14-Core GPU 14 @ 1.3 GHz
M1 8-Core GPU 8 @ 1.28 GHz
M1 7-Core GPU 7 @ 1.28 GHz
GeForce GTX 1080 Ti 3584 @ 1.48 - 1.6 GHz352 Bit @ 11000 MHz
GeForce GTX 1080 SLI (Laptop) 5120 @ 1.56 - 1.73 GHz256 Bit @ 10000 MHz
GeForce GTX 1070 SLI (Desktop) 3840 @ 1.51 - 1.68 GHz256 Bit @ 8000 MHz
GeForce GTX 1070 SLI (Laptop) 4096 @ 1.44 - 1.65 GHz256 Bit @ 8000 MHz
GeForce GTX 1080 (Desktop) 2560 @ 1.61 - 1.73 GHz256 Bit @ 10000 MHz
GeForce GTX 1080 Mobile 2560 @ 1.57 - 1.73 GHz256 Bit @ 10000 MHz
GeForce GTX 1070 Ti (Desktop) 2432 @ 1.61 - 1.68 GHz256 Bit @ 8000 MHz
GeForce GTX 1070 (Desktop) 1920 @ 1.51 - 1.68 GHz256 Bit @ 8000 MHz
GeForce GTX 1080 Max-Q 2560 @ 1.1 - 1.28 GHz256 Bit @ 10000 MHz
GeForce GTX 1070 Mobile 2048 @ 1.44 - 1.65 GHz256 Bit @ 8000 MHz
GeForce GTX 1070 Max-Q 2048 @ 1.1 - 1.27 GHz256 Bit @ 8000 MHz
GeForce GTX 1060 (Desktop) 1280 @ 1.51 - 1.71 GHz192 Bit @ 8000 MHz
GeForce GTX 1060 Mobile 1280 @ 1.4 - 1.67 GHz192 Bit @ 8000 MHz
GeForce GTX 1060 Max-Q 1280 @ 1.06 - 1.34 GHz192 Bit @ 8000 MHz
GeForce GTX 1050 Ti Mobile 768 @ 1.49 - 1.62 GHz128 Bit @ 7000 MHz
GeForce GTX 1050 Ti (Desktop) 768 @ 1.29 - 1.39 GHz128 Bit @ 7008 MHz
GeForce GTX 1050 Ti Max-Q 768 @ 1.15 - 1.29 GHz128 Bit @ 7000 MHz
GeForce GTX 1050 (Desktop) 640 @ 1.35 - 1.46 GHz128 Bit @ 7008 MHz
GeForce GTX 1050 Mobile 640 @ 1.35 - 1.49 GHz128 Bit @ 7000 MHz
GeForce GTX 1050 Max-Q 640 @ 1 - 1.14 GHz128 Bit @ 7000 MHz
GeForce GT 1030 (Desktop) 384 @ 1.23 - 1.67 GHz64 Bit @ 6000 MHz
M1 Max 32-Core GPU 32 @ 1.3 GHz512 Bit
M1 Max 24-Core GPU 24 @ 1.3 GHz
M1 Pro 16-Core GPU 16 @ 1.3 GHz
M1 Pro 14-Core GPU 14 @ 1.3 GHz
M1 8-Core GPU 8 @ 1.28 GHz
M1 7-Core GPU 7 @ 1.28 GHz
Pipelines7 - unified640 - unified8 - unified
Core Speed1278 MHz1354 - 1455 (Boost) MHz1278 MHz
Memory TypeLPDDR4X-4266GDDR5LPDDR4X-4266
Shared Memorynonono
technology5 nm14 nm5 nm
Date of Announcement10.11.2020 25.10.2016 10.11.2020
CodenameN17P-G1
ArchitecturePascal
Memory Speed7008 MHz
Memory Bus Width128 Bit
Max. Amount of Memory2048 MB
APIDirectX 12_1, OpenGL 4.5
FeaturesMulti-Projection, VR Ready, G-SYNC, Vulkan, Multi Monitor
Theoretical Performance2.6 TFLOPS FP32
Power Consumption10 Watt
CPU in M1 8-Core GPUGPU Base SpeedGPU Boost / Turbo
Apple M18 x 2064 MHz? MHz? MHz

Benchmarks

3DMark - 3DMark Time Spy Score
1984 Points (5%)
3DMark - 3DMark Time Spy Graphics
1797 Points (4%)
3DMark - 3DMark Ice Storm Unlimited Graphics
349683 Points (35%)
280200 Points (28%)
3DMark - 3DMark Cloud Gate Score
21461 Points (20%)
3DMark - 3DMark Cloud Gate Graphics
40922 Points (10%)
3DMark - 3DMark Fire Strike Standard Score
6122 Points (9%)
3DMark - 3DMark Fire Strike Standard Graphics
6797 Points (6%)
3DMark - 3DMark Sling Shot (ES 3.0) Unlimited
min: 7588     avg: 10635     median: 10635 (46%)     max: 13682 Points
3DMark - 3DMark Sling Shot (ES 3.0) Unlimited Graphics
min: 35978     avg: 39365     median: 39364.5 (87%)     max: 42751 Points
3DMark - 3DMark Sling Shot Extreme (ES 3.1) Unlimited
min: 8911     avg: 9606     median: 9605.5 (40%)     max: 10300 Points
3DMark - 3DMark Sling Shot Extreme (ES 3.1) Unlimited Graphics
25707 Points (64%)
3DMark - 3DMark Sling Shot (ES 3.0)
0 Points (0%)
3DMark - 3DMark Sling Shot (ES 3.0) Graphics
0 Points (0%)
3DMark - 3DMark Wild Life Unlimited
16159 Points (8%)
3DMark - 3DMark Wild Life Extreme Unlimited
4515 Points (5%)
min: 4144     avg: 4696     median: 4821 (6%)     max: 4997 Points
3DMark 11 - 3DM11 Performance Score
8817 Points (11%)
3DMark 11 - 3DM11 Performance GPU
8571 Points (7%)
3DMark Vantage
3DM Vant. Perf. total + NVIDIA GeForce GTX 1050 (Desktop)
3DMark Vantage - 3DM Vant. Perf. total
32463 Points (9%)
3DM Vant. Perf. GPU no PhysX + NVIDIA GeForce GTX 1050 (Desktop)
3DMark Vantage - 3DM Vant. Perf. GPU no PhysX
32494 Points (18%)
3DMark 2001SE - 3DMark 2001 - Standard
96234 Points (100%)
3DMark 06 3DMark 06 - Standard 1280x1024 + NVIDIA GeForce GTX 1050 (Desktop)
3DMark 06
min: 28000     avg: 30921     median: 29795 (39%)     max: 36095 Points
Unigine Valley 1.0 - Unigine Valley 1.0 DX
37.6 fps (11%)
Unigine Heaven 3.0 - Unigine Heaven 3.0 DX 11
88.3 fps (29%)
Unigine Heaven 3.0 - Unigine Heaven 3.0 OpenGL
36.4 fps (16%)
Blender - Blender 3.3 Classroom CUDA *
271 Seconds (40%)
Blender - Blender 3.3 Classroom METAL *
956 Seconds (100%)
SPECviewperf 12
specvp12 sw-03 + NVIDIA GeForce GTX 1050 (Desktop)
SPECviewperf 12 - specvp12 sw-03
37.8 fps (9%)
specvp12 snx-02 + NVIDIA GeForce GTX 1050 (Desktop)
SPECviewperf 12 - specvp12 snx-02
4.7 fps (1%)
specvp12 showcase-01 + NVIDIA GeForce GTX 1050 (Desktop)
SPECviewperf 12 - specvp12 showcase-01
29.3 fps (5%)
specvp12 mediacal-01 + NVIDIA GeForce GTX 1050 (Desktop)
SPECviewperf 12 - specvp12 mediacal-01
17.5 fps (4%)
specvp12 maya-04 + NVIDIA GeForce GTX 1050 (Desktop)
SPECviewperf 12 - specvp12 maya-04
57.8 fps (16%)
specvp12 energy-01 + NVIDIA GeForce GTX 1050 (Desktop)
SPECviewperf 12 - specvp12 energy-01
0.8 fps (1%)
specvp12 creo-01 + NVIDIA GeForce GTX 1050 (Desktop)
SPECviewperf 12 - specvp12 creo-01
18.2 fps (7%)
specvp12 catia-04 + NVIDIA GeForce GTX 1050 (Desktop)
SPECviewperf 12 - specvp12 catia-04
28.2 fps (5%)
Cinebench R15
Cinebench R15 OpenGL 64 Bit + Apple M1 7-Core GPU
Cinebench R15 - Cinebench R15 OpenGL 64 Bit
90 fps (5%)
Cinebench R15 OpenGL 64 Bit + NVIDIA GeForce GTX 1050 (Desktop)
min: 109     avg: 132     median: 132 (8%)     max: 155 fps
Cinebench R15 OpenGL 64 Bit + Apple M1 8-Core GPU
min: 88.1     avg: 89.1     median: 89.4 (5%)     max: 89.8 fps
Cinebench R15 OpenGL Ref. Match 64 Bit + Apple M1 7-Core GPU
Cinebench R15 - Cinebench R15 OpenGL Ref. Match 64 Bit
99.5 % (100%)
Cinebench R15 OpenGL Ref. Match 64 Bit + NVIDIA GeForce GTX 1050 (Desktop)
99.6 % (100%)
Cinebench R15 OpenGL Ref. Match 64 Bit + Apple M1 8-Core GPU
GFXBench - GFXBench 5.0 Aztec Ruins High Tier Offscreen
72.4 fps (13%)
GFXBench - GFXBench 5.0 Aztec Ruins Normal Tier Offscreen
192 fps (14%)
GFXBench - GFXBench Car Chase Offscreen
162 fps (15%)
137.6 fps (13%)
GFXBench 3.1 - GFXBench Manhattan ES 3.1 Offscreen
240 fps (5%)
200 fps (4%)
GFXBench 3.0 - GFXBench 3.0 Manhattan Offscreen
376 fps (16%)
268 fps (11%)
GFXBench (DX / GLBenchmark) 2.7
GFXBench T-Rex HD Offscreen C24Z16 + Apple M1 7-Core GPU
GFXBench (DX / GLBenchmark) 2.7 - GFXBench T-Rex HD Offscreen C24Z16
620 fps (5%)
GFXBench T-Rex HD Offscreen C24Z16 + NVIDIA GeForce GTX 1050 (Desktop)
472 fps (4%)
GFXBench T-Rex HD Offscreen C24Z16 + Apple M1 8-Core GPU
Antutu v9 - AnTuTu v9 GPU
min: 549301     avg: 598951     median: 598951 (60%)     max: 648601 Points
Basemark GPU 1.2 - Basemark GPU 1.2 Vulkan Official Medium Offscreen 1080
105 fps (3%)
Geekbench 6.4 - Geekbench 6.4 GPU OpenCL
18341 Points (5%)
Geekbench 6.4 - Geekbench 6.4 GPU Metal
30112 Points (17%)
LuxMark v2.0 64Bit - LuxMark v2.0 Room GPU
1037 Samples/s (4%)
LuxMark v2.0 64Bit - LuxMark v2.0 Sala GPU
1864 Samples/s (3%)
ComputeMark v2.1 - ComputeMark v2.1 Result
4749 Points (4%)
Power Consumption - Furmark Stress Test Power Consumption - external Monitor *
152 Watt (20%)
Power Consumption - The Witcher 3 Power Consumption - external Monitor *
155 Watt (22%)
Power Consumption - Witcher 3 Power Consumption *
min: 19.6     avg: 39.4     median: 39.4 (9%)     max: 59.2 Watt
Power Consumption - GFXBench Aztec Ruins Normal Tier Offscreen Power Consumption 150cd *
19.5 Watt (8%)
min: 16     avg: 16.4     median: 16.5 (6%)     max: 16.6 Watt
Power Consumption - Power Efficiency - Witcher 3 ultra external Monitor
0.2 fps per Watt (13%)

Average Benchmarks Apple M1 7-Core GPU → 100% n=6

Average Benchmarks NVIDIA GeForce GTX 1050 (Desktop) → 94% n=6

Average Benchmarks Apple M1 8-Core GPU → 99% n=6

- Range of benchmark values for this graphics card
red legend - Average benchmark values for this graphics card
* Smaller numbers mean a higher performance
1 This benchmark is not used for the average calculation

Game Benchmarks

The following benchmarks stem from our benchmarks of review laptops. The performance depends on the used graphics memory, clock rate, processor, system settings, drivers, and operating systems. So the results don't have to be representative for all laptops with this GPU. For detailed information on the benchmark results, click on the fps number.

F1 25

F1 25

2025
low 1920x1080
GeForce GTX 1050 (Desktop):
42.7  fps
med. 1920x1080
GeForce GTX 1050 (Desktop):
34  fps
high 1920x1080
GeForce GTX 1050 (Desktop):
24.6  fps
low 1920x1080
GeForce GTX 1050 (Desktop):
23.6  fps
Stalker 2

Stalker 2

2024
low 1920x1080
GeForce GTX 1050 (Desktop):
8.6  fps
med. 1920x1080
GeForce GTX 1050 (Desktop):
8  fps
high 1920x1080
GeForce GTX 1050 (Desktop):
5  fps
low 1920x1080
GeForce GTX 1050 (Desktop):
10.7  fps
med. 1920x1080
GeForce GTX 1050 (Desktop):
6 6 ~ 6 fps
low 1920x1080
GeForce GTX 1050 (Desktop):
25  fps
med. 1920x1080
GeForce GTX 1050 (Desktop):
20.3  fps
F1 22

F1 22

2022
low 1920x1080
GeForce GTX 1050 (Desktop):
55.3  fps
med. 1920x1080
GeForce GTX 1050 (Desktop):
48.5  fps
high 1920x1080
GeForce GTX 1050 (Desktop):
31.6  fps
med. 1920x1080
GeForce GTX 1050 (Desktop):
16.4  fps
high 1920x1080
GeForce GTX 1050 (Desktop):
13.2  fps
QHD 2560x1440
GeForce GTX 1050 (Desktop):
9.6  fps
med. 1920x1080
GeForce GTX 1050 (Desktop):
18.3  fps
low 1280x720
GeForce GTX 1050 (Desktop):
0 (!)  fps
low 1280x720
GeForce GTX 1050 (Desktop):
32.1  fps
League of Legends: Wild Rift

League of Legends: Wild Rift

2020
ultra
M1 8-Core GPU:
60  fps
Call of Duty Mobile

Call of Duty Mobile

2020
high
M1 8-Core GPU:
59 60 ~ 60 fps
ultra
M1 8-Core GPU:
59 60 60 ~ 60 fps
Genshin Impact

Genshin Impact

2020
ultra
M1 8-Core GPU:
59 60 ~ 60 fps
low 1280x720
GeForce GTX 1050 (Desktop):
47.1  fps
med. 1920x1080
GeForce GTX 1050 (Desktop):
19.2  fps
high 1920x1080
GeForce GTX 1050 (Desktop):
12.1  fps
ultra 1920x1080
GeForce GTX 1050 (Desktop):
5.5  fps
Armajet

Armajet

2020
high
M1 8-Core GPU:
59 60 ~ 60 fps
F1 2020

F1 2020

2020
low 1280x720
GeForce GTX 1050 (Desktop):
133  fps
med. 1920x1080
GeForce GTX 1050 (Desktop):
62  fps
high 1920x1080
GeForce GTX 1050 (Desktop):
40.8  fps
ultra 1920x1080
GeForce GTX 1050 (Desktop):
25.9  fps
low 1280x720
GeForce GTX 1050 (Desktop):
177  fps
med. 1920x1080
GeForce GTX 1050 (Desktop):
62.2  fps
high 1920x1080
GeForce GTX 1050 (Desktop):
38.2  fps
ultra 1920x1080
GeForce GTX 1050 (Desktop):
30.7  fps
QHD 2560x1440
GeForce GTX 1050 (Desktop):
19  fps
low 1280x720
GeForce GTX 1050 (Desktop):
52.5  fps
med. 1920x1080
GeForce GTX 1050 (Desktop):
39.3  fps
high 1920x1080
GeForce GTX 1050 (Desktop):
31.3  fps
ultra 1920x1080
GeForce GTX 1050 (Desktop):
28.2  fps
low 1280x720
GeForce GTX 1050 (Desktop):
115  fps
med. 1920x1080
GeForce GTX 1050 (Desktop):
63.9  fps
high 1920x1080
GeForce GTX 1050 (Desktop):
50.5  fps
ultra 1920x1080
GeForce GTX 1050 (Desktop):
29.9  fps
QHD 2560x1440
GeForce GTX 1050 (Desktop):
19.8  fps
QHD 2560x1440
100%
M1 7-Core GPU:
58  fps
low 1280x720
GeForce GTX 1050 (Desktop):
65  fps
med. 1920x1080
GeForce GTX 1050 (Desktop):
30.5  fps
high 1920x1080
GeForce GTX 1050 (Desktop):
18.5  fps
ultra 1920x1080
GeForce GTX 1050 (Desktop):
0 (!)  fps
low 1280x720
GeForce GTX 1050 (Desktop):
56.6  fps
med. 1920x1080
GeForce GTX 1050 (Desktop):
33.9  fps
high 1920x1080
GeForce GTX 1050 (Desktop):
30.7  fps
ultra 1920x1080
GeForce GTX 1050 (Desktop):
17.1  fps
FIFA 20

FIFA 20

2019
low 1280x720
GeForce GTX 1050 (Desktop):
196  fps
med. 1920x1080
GeForce GTX 1050 (Desktop):
167  fps
high 1920x1080
GeForce GTX 1050 (Desktop):
154  fps
ultra 1920x1080
GeForce GTX 1050 (Desktop):
124  fps
QHD 2560x1440
GeForce GTX 1050 (Desktop):
95  fps
4K 3840x2160
GeForce GTX 1050 (Desktop):
54.1  fps
low 1280x720
100%
M1 7-Core GPU:
45.2  fps
217%
GeForce GTX 1050 (Desktop):
98  fps
106%
M1 8-Core GPU:
30.4 52.5 54 56.7 ~ 48 fps
med. 1920x1080
100%
M1 7-Core GPU:
28  fps
143%
GeForce GTX 1050 (Desktop):
40.1  fps
104%
M1 8-Core GPU:
20.3 30.7 32.5 33 ~ 29 fps
high 1920x1080
100%
M1 7-Core GPU:
17.7  fps
141%
GeForce GTX 1050 (Desktop):
25  fps
113%
M1 8-Core GPU:
19 20 20.5 ~ 20 fps
ultra 1920x1080
GeForce GTX 1050 (Desktop):
18.4  fps
4K 3840x2160
GeForce GTX 1050 (Desktop):
2.1  fps
Control

Control

2019
low 1280x720
GeForce GTX 1050 (Desktop):
75  fps
med. 1920x1080
GeForce GTX 1050 (Desktop):
23.6  fps
high 1920x1080
GeForce GTX 1050 (Desktop):
15.8  fps
F1 2019

F1 2019

2019
low 1280x720
GeForce GTX 1050 (Desktop):
166  fps
med. 1920x1080
GeForce GTX 1050 (Desktop):
71  fps
high 1920x1080
GeForce GTX 1050 (Desktop):
60  fps
ultra 1920x1080
GeForce GTX 1050 (Desktop):
33.4  fps
QHD 2560x1440
GeForce GTX 1050 (Desktop):
25.7  fps
low 1280x720
100%
M1 7-Core GPU:
95.2 (!)  fps
150%
GeForce GTX 1050 (Desktop):
143  fps
103%
M1 8-Core GPU:
93.4 100 100 100.1 ~ 98 fps
med. 1920x1080
100%
M1 7-Core GPU:
26.3 (!)  fps
165%
GeForce GTX 1050 (Desktop):
43.3  fps
133%
M1 8-Core GPU:
32.2 33 33 42.3 ~ 35 fps
high 1920x1080
100%
M1 7-Core GPU:
17.4 (!)  fps
129%
GeForce GTX 1050 (Desktop):
22.5  fps
126%
M1 8-Core GPU:
20 20.3 20.6 25.5 ~ 22 fps
ultra 1920x1080
GeForce GTX 1050 (Desktop):
15  fps
M1 8-Core GPU:
15 15 ~ 15 fps
QHD 2560x1440
GeForce GTX 1050 (Desktop):
6.3  fps
4K 3840x2160
GeForce GTX 1050 (Desktop):
1  fps
low 1280x720
GeForce GTX 1050 (Desktop):
124  fps
med. 1920x1080
GeForce GTX 1050 (Desktop):
43.2  fps
high 1920x1080
GeForce GTX 1050 (Desktop):
33  fps
ultra 1920x1080
GeForce GTX 1050 (Desktop):
24.4  fps
QHD 2560x1440
GeForce GTX 1050 (Desktop):
15.1  fps
4K 3840x2160
GeForce GTX 1050 (Desktop):
6  fps
low 1280x720
GeForce GTX 1050 (Desktop):
134  fps
med. 1920x1080
GeForce GTX 1050 (Desktop):
56.9  fps
high 1920x1080
GeForce GTX 1050 (Desktop):
45  fps
ultra 1920x1080
GeForce GTX 1050 (Desktop):
22.1  fps
QHD 2560x1440
GeForce GTX 1050 (Desktop):
20.5  fps
Anthem

Anthem

2019
low 1280x720
GeForce GTX 1050 (Desktop):
67  fps
med. 1920x1080
GeForce GTX 1050 (Desktop):
36.7  fps
high 1920x1080
GeForce GTX 1050 (Desktop):
30.5  fps
ultra 1920x1080
GeForce GTX 1050 (Desktop):
28.3  fps
QHD 2560x1440
GeForce GTX 1050 (Desktop):
16.5  fps
low 1280x720
GeForce GTX 1050 (Desktop):
77  fps
med. 1920x1080
GeForce GTX 1050 (Desktop):
41  fps
high 1920x1080
GeForce GTX 1050 (Desktop):
38  fps
ultra 1920x1080
GeForce GTX 1050 (Desktop):
35  fps
QHD 2560x1440
GeForce GTX 1050 (Desktop):
25  fps
4K 3840x2160
GeForce GTX 1050 (Desktop):
11  fps
low 1280x720
GeForce GTX 1050 (Desktop):
35.5  fps
med. 1920x1080
GeForce GTX 1050 (Desktop):
20.5  fps
high 1920x1080
GeForce GTX 1050 (Desktop):
16  fps
ultra 1920x1080
GeForce GTX 1050 (Desktop):
13  fps
low 1280x720
GeForce GTX 1050 (Desktop):
108  fps
med. 1920x1080
GeForce GTX 1050 (Desktop):
45.6  fps
high 1920x1080
GeForce GTX 1050 (Desktop):
37  fps
ultra 1920x1080
GeForce GTX 1050 (Desktop):
36.7  fps
4K 3840x2160
GeForce GTX 1050 (Desktop):
12  fps
ultra 1920x1080
GeForce GTX 1050 (Desktop):
32.2  fps
ultra 1920x1080
GeForce GTX 1050 (Desktop):
44.6  fps
low 1280x720
GeForce GTX 1050 (Desktop):
124  fps
med. 1920x1080
GeForce GTX 1050 (Desktop):
55.6  fps
high 1920x1080
GeForce GTX 1050 (Desktop):
43.1  fps
ultra 1920x1080
GeForce GTX 1050 (Desktop):
36.3  fps
QHD 2560x1440
GeForce GTX 1050 (Desktop):
27.1  fps
ultra 1920x1080
GeForce GTX 1050 (Desktop):
52.3  fps
ultra 1920x1080
GeForce GTX 1050 (Desktop):
38.2  fps
Hitman 2

Hitman 2

2018
ultra 1920x1080
GeForce GTX 1050 (Desktop):
29.2  fps
med. 1920x1080
GeForce GTX 1050 (Desktop):
43.3  fps
high 1920x1080
GeForce GTX 1050 (Desktop):
36.1  fps
ultra 1920x1080
GeForce GTX 1050 (Desktop):
32.9  fps
low 1280x720
GeForce GTX 1050 (Desktop):
71  fps
med. 1920x1080
GeForce GTX 1050 (Desktop):
38  fps
high 1920x1080
GeForce GTX 1050 (Desktop):
26  fps
ultra 1920x1080
GeForce GTX 1050 (Desktop):
15  fps
high 1920x1080
GeForce GTX 1050 (Desktop):
49  fps
ultra 1920x1080
GeForce GTX 1050 (Desktop):
34  fps
FIFA 19

FIFA 19

2018
ultra 1920x1080
GeForce GTX 1050 (Desktop):
95  fps
4K 3840x2160
GeForce GTX 1050 (Desktop):
33.8  fps
low 1280x720
100%
M1 7-Core GPU:
65  fps
94%
GeForce GTX 1050 (Desktop):
61  fps
106%
M1 8-Core GPU:
64 66 78 ~ 69 fps
med. 1920x1080
100%
M1 7-Core GPU:
22  fps
123%
GeForce GTX 1050 (Desktop):
27  fps
145%
M1 8-Core GPU:
25 27 45 ~ 32 fps
high 1920x1080
GeForce GTX 1050 (Desktop):
25 27 ~ 26 fps
M1 8-Core GPU:
23 25 43 ~ 30 fps
ultra 1920x1080
GeForce GTX 1050 (Desktop):
22 23 ~ 23 fps
M1 8-Core GPU:
38  fps
Strange Brigade

Strange Brigade

2018
low 1280x720
GeForce GTX 1050 (Desktop):
149  fps
med. 1920x1080
GeForce GTX 1050 (Desktop):
53.2  fps
high 1920x1080
GeForce GTX 1050 (Desktop):
34.7  fps
ultra 1920x1080
GeForce GTX 1050 (Desktop):
31.3  fps
QHD 2560x1440
GeForce GTX 1050 (Desktop):
18.4  fps
4K 3840x2160
GeForce GTX 1050 (Desktop):
11.1  fps
F1 2018

F1 2018

2018
low 1280x720
GeForce GTX 1050 (Desktop):
64  fps
med. 1920x1080
GeForce GTX 1050 (Desktop):
52  fps
high 1920x1080
GeForce GTX 1050 (Desktop):
36 54.1 ~ 45 fps
ultra 1920x1080
GeForce GTX 1050 (Desktop):
24 32.9 ~ 28 fps
4K 3840x2160
GeForce GTX 1050 (Desktop):
13.4  fps
PUBG Mobile

PUBG Mobile

2018
low
M1 8-Core GPU:
39  fps
high
M1 8-Core GPU:
39 39.9 40 ~ 40 fps
ultra
M1 8-Core GPU:
39 44 ~ 42 fps
World of Tanks Blitz

World of Tanks Blitz

2018
high
M1 8-Core GPU:
59  fps
low 1280x720
GeForce GTX 1050 (Desktop):
72.6  fps
med. 1920x1080
GeForce GTX 1050 (Desktop):
65.2  fps
high 1920x1080
GeForce GTX 1050 (Desktop):
56.1  fps
high 1920x1080
GeForce GTX 1050 (Desktop):
32.5  fps
ultra 1920x1080
GeForce GTX 1050 (Desktop):
22.9  fps
low 1280x720
GeForce GTX 1050 (Desktop):
54  fps
med. 1920x1080
GeForce GTX 1050 (Desktop):
26.2  fps
high 1920x1080
GeForce GTX 1050 (Desktop):
15.5  fps
4K 3840x2160
GeForce GTX 1050 (Desktop):
3  fps
Fortnite

Fortnite

2018
high 1920x1080
GeForce GTX 1050 (Desktop):
53.3  fps
ultra 1920x1080
GeForce GTX 1050 (Desktop):
42  fps
F1 2017

F1 2017

2017
low 1280x720
100%
M1 7-Core GPU:
60  fps
med. 1920x1080
100%
M1 7-Core GPU:
54  fps
high 1920x1080
100%
M1 7-Core GPU:
43  fps
Prey

Prey

2017
high 1920x1080
GeForce GTX 1050 (Desktop):
71  fps
ultra 1920x1080
GeForce GTX 1050 (Desktop):
67  fps
low 1280x720
100%
M1 7-Core GPU:
43.9  fps
med. 1920x1080
100%
M1 7-Core GPU:
32.5  fps
128%
GeForce GTX 1050 (Desktop):
41.5  fps
high 1920x1080
GeForce GTX 1050 (Desktop):
26.5  fps
med. 1920x1080
GeForce GTX 1050 (Desktop):
47.1  fps
high 1920x1080
GeForce GTX 1050 (Desktop):
24.3  fps
ultra 1920x1080
GeForce GTX 1050 (Desktop):
19.9  fps
low 1280x720
GeForce GTX 1050 (Desktop):
62.2  fps
med. 1920x1080
GeForce GTX 1050 (Desktop):
31.7  fps
high 1920x1080
GeForce GTX 1050 (Desktop):
29.2  fps
ultra 1920x1080
GeForce GTX 1050 (Desktop):
13.8  fps
For Honor

For Honor

2017
low 1280x720
GeForce GTX 1050 (Desktop):
142.2  fps
med. 1920x1080
GeForce GTX 1050 (Desktop):
55.8 64.5 ~ 60 fps
high 1920x1080
GeForce GTX 1050 (Desktop):
53 53.2 ~ 53 fps
ultra 1920x1080
GeForce GTX 1050 (Desktop):
40.5 42.8 ~ 42 fps
4K 3840x2160
GeForce GTX 1050 (Desktop):
13.5  fps
high 1920x1080
GeForce GTX 1050 (Desktop):
59.3  fps
ultra 1920x1080
GeForce GTX 1050 (Desktop):
47.5  fps
4K 3840x2160
GeForce GTX 1050 (Desktop):
13.9  fps
med. 1366x768
GeForce GTX 1050 (Desktop):
78  fps
high 1920x1080
GeForce GTX 1050 (Desktop):
35.4  fps
ultra 1920x1080
GeForce GTX 1050 (Desktop):
20  fps
med. 1366x768
GeForce GTX 1050 (Desktop):
80  fps
high 1920x1080
GeForce GTX 1050 (Desktop):
37.3  fps
ultra 1920x1080
GeForce GTX 1050 (Desktop):
33.7  fps
ultra 1920x1080
GeForce GTX 1050 (Desktop):
55.4  fps
high 1920x1080
GeForce GTX 1050 (Desktop):
52.9  fps
ultra 1920x1080
GeForce GTX 1050 (Desktop):
45.7  fps
4K 3840x2160
GeForce GTX 1050 (Desktop):
15.6  fps
ultra 1920x1080
GeForce GTX 1050 (Desktop):
103  fps
4K 3840x2160
GeForce GTX 1050 (Desktop):
46.3  fps
low 1280x720
GeForce GTX 1050 (Desktop):
104  fps
med. 1366x768
GeForce GTX 1050 (Desktop):
71 113 ~ 92 fps
high 1920x1080
GeForce GTX 1050 (Desktop):
38.5 42.6 ~ 41 fps
ultra 1920x1080
GeForce GTX 1050 (Desktop):
35.2 39 ~ 37 fps
4K 3840x2160
GeForce GTX 1050 (Desktop):
13.9  fps
low 1024x768
100%
M1 7-Core GPU:
80.3  fps
high 1920x1080
100%
M1 7-Core GPU:
30.1  fps
159%
GeForce GTX 1050 (Desktop):
48  fps
ultra 1920x1080
100%
M1 7-Core GPU:
27  fps
149%
GeForce GTX 1050 (Desktop):
40.2  fps
4K 3840x2160
100%
M1 7-Core GPU:
15.8  fps
199%
GeForce GTX 1050 (Desktop):
31.5  fps
Mafia 3

Mafia 3

2016
med. 1366x768
GeForce GTX 1050 (Desktop):
41.1  fps
high 1920x1080
GeForce GTX 1050 (Desktop):
26.1  fps
FIFA 17

FIFA 17

2016
ultra 1920x1080
GeForce GTX 1050 (Desktop):
157  fps
4K 3840x2160
GeForce GTX 1050 (Desktop):
61  fps
low 1280x720
100%
M1 7-Core GPU:
47.6  fps
181%
GeForce GTX 1050 (Desktop):
86  fps
med. 1366x768
100%
M1 7-Core GPU:
35.3  fps
179%
GeForce GTX 1050 (Desktop):
63.1  fps
high 1920x1080
100%
M1 7-Core GPU:
19  fps
177%
GeForce GTX 1050 (Desktop):
33.6  fps
ultra 1920x1080
GeForce GTX 1050 (Desktop):
12 21.4 ~ 17 fps
4K 3840x2160
GeForce GTX 1050 (Desktop):
9  fps
Overwatch

Overwatch

2016
high 1920x1080
GeForce GTX 1050 (Desktop):
108  fps
ultra 1920x1080
GeForce GTX 1050 (Desktop):
63  fps
4K 3840x2160
GeForce GTX 1050 (Desktop):
33.1  fps
Doom

Doom

2016
high 1920x1080
GeForce GTX 1050 (Desktop):
54  fps
ultra 1920x1080
GeForce GTX 1050 (Desktop):
46.5  fps
4K 3840x2160
GeForce GTX 1050 (Desktop):
18.3  fps
med. 1920x1080
GeForce GTX 1050 (Desktop):
37.4  fps
high 1920x1080
GeForce GTX 1050 (Desktop):
33.2  fps
4K 3840x2160
GeForce GTX 1050 (Desktop):
3.5  fps
med. 1366x768
GeForce GTX 1050 (Desktop):
44.7  fps
high 1920x1080
GeForce GTX 1050 (Desktop):
21.6  fps
ultra 1920x1080
GeForce GTX 1050 (Desktop):
18.9  fps
high 1920x1080
GeForce GTX 1050 (Desktop):
39.2  fps
ultra 1920x1080
GeForce GTX 1050 (Desktop):
30.3  fps
4K 3840x2160
GeForce GTX 1050 (Desktop):
14.1  fps
low 1280x720
GeForce GTX 1050 (Desktop):
125  fps
med. 1920x1080
GeForce GTX 1050 (Desktop):
57  fps
high 1920x1080
GeForce GTX 1050 (Desktop):
51  fps
ultra 1920x1080
GeForce GTX 1050 (Desktop):
38  fps
4K 3840x2160
GeForce GTX 1050 (Desktop):
15  fps
XCOM 2

XCOM 2

2016
med. 1920x1080
GeForce GTX 1050 (Desktop):
54.9  fps
high 1920x1080
GeForce GTX 1050 (Desktop):
33.2  fps
ultra 1920x1080
GeForce GTX 1050 (Desktop):
14.5  fps
low 1024x768
GeForce GTX 1050 (Desktop):
94.1  fps
med. 1366x768
GeForce GTX 1050 (Desktop):
53.5  fps
high 1920x1080
GeForce GTX 1050 (Desktop):
32.9 40.6 43.8 ~ 39 fps
ultra 1920x1080
GeForce GTX 1050 (Desktop):
28.9 36.9 ~ 33 fps
M1 8-Core GPU:
39.6  fps
4K 3840x2160
GeForce GTX 1050 (Desktop):
15.6  fps
low 1024x768
GeForce GTX 1050 (Desktop):
247  fps
med. 1366x768
GeForce GTX 1050 (Desktop):
155  fps
high 1920x1080
GeForce GTX 1050 (Desktop):
82.4  fps
ultra 1920x1080
GeForce GTX 1050 (Desktop):
65.9  fps
4K 3840x2160
GeForce GTX 1050 (Desktop):
20.3  fps
high 1920x1080
GeForce GTX 1050 (Desktop):
44.1  fps
ultra 1920x1080
GeForce GTX 1050 (Desktop):
16.5  fps
Fallout 4

Fallout 4

2015
ultra 1920x1080
GeForce GTX 1050 (Desktop):
41.1  fps
Anno 2205

Anno 2205

2015
high 1920x1080
GeForce GTX 1050 (Desktop):
54.3  fps
ultra 1920x1080
GeForce GTX 1050 (Desktop):
17  fps
4K 3840x2160
GeForce GTX 1050 (Desktop):
19.6  fps
ultra 1920x1080
GeForce GTX 1050 (Desktop):
100  fps
4K 3840 x 2160
GeForce GTX 1050 (Desktop):
31.9  fps
Mad Max

Mad Max

2015
ultra 1920x1080
GeForce GTX 1050 (Desktop):
69  fps
4K 3840x2160
GeForce GTX 1050 (Desktop):
24.1  fps
low 1280x720
GeForce GTX 1050 (Desktop):
111 148 ~ 130 fps
med. 1366x768
GeForce GTX 1050 (Desktop):
107 136 ~ 122 fps
high 1920x1080
GeForce GTX 1050 (Desktop):
100 124 156 ~ 127 fps
ultra 1920x1080
GeForce GTX 1050 (Desktop):
96.4 112 139 ~ 116 fps
4K 3840x2160
GeForce GTX 1050 (Desktop):
47.4  fps
low 1024x768
GeForce GTX 1050 (Desktop):
81.7 131 ~ 106 fps
med. 1366x768
GeForce GTX 1050 (Desktop):
50.3 77.9 ~ 64 fps
high 1920x1080
GeForce GTX 1050 (Desktop):
31.7 43.7 ~ 38 fps
ultra 1920x1080
GeForce GTX 1050 (Desktop):
16.4 24.1 ~ 20 fps
4K 3840x2160
GeForce GTX 1050 (Desktop):
15.3  fps
ultra 1920x1080
GeForce GTX 1050 (Desktop):
76  fps
4K 3840x2160
GeForce GTX 1050 (Desktop):
49.8  fps
GTA V

GTA V

2015
low 1024x768
GeForce GTX 1050 (Desktop):
176  fps
med. 1366x768
GeForce GTX 1050 (Desktop):
170  fps
high 1920x1080
GeForce GTX 1050 (Desktop):
78.6  fps
ultra 1920x1080
GeForce GTX 1050 (Desktop):
25.7 28.5 ~ 27 fps
QHD 2560x1440
GeForce GTX 1050 (Desktop):
7.3  fps
4K 3840x2160
GeForce GTX 1050 (Desktop):
23.8  fps
ultra 1920x1080
GeForce GTX 1050 (Desktop):
75.2  fps
ultra 1920x1080
GeForce GTX 1050 (Desktop):
44.9  fps
ultra 1920x1080
GeForce GTX 1050 (Desktop):
54  fps
4K 3840x2160
GeForce GTX 1050 (Desktop):
24  fps
Dota 2

Dota 2

2013
low 1024x768
GeForce GTX 1050 (Desktop):
116.4  fps
med. 1366x768
GeForce GTX 1050 (Desktop):
101  fps
ultra 1920x1080
GeForce GTX 1050 (Desktop):
82.3  fps
ultra 1920x1080
GeForce GTX 1050 (Desktop):
49  fps
low 1280x720
GeForce GTX 1050 (Desktop):
203.7  fps
med. 1366x768
GeForce GTX 1050 (Desktop):
145.2  fps
high 1366x768
GeForce GTX 1050 (Desktop):
127.9  fps
ultra 1920x1080
GeForce GTX 1050 (Desktop):
54.8 71.6 ~ 63 fps
Crysis 3

Crysis 3

2013
ultra 1920x1080
GeForce GTX 1050 (Desktop):
31.9  fps
low 1024x768
100%
M1 7-Core GPU:
109  fps
high 1366x768
100%
M1 7-Core GPU:
69  fps
ultra 1920x1080
100%
M1 7-Core GPU:
44.4  fps
563%
GeForce GTX 1050 (Desktop):
250  fps
high 1366x768
100%
M1 7-Core GPU:
86  fps
ultra 1920x1080
100%
M1 7-Core GPU:
47  fps

Average Gaming Apple M1 7-Core GPU → 100%

Average Gaming 30-70 fps → 100%

Average Gaming NVIDIA GeForce GTX 1050 (Desktop) → 181%

Average Gaming 30-70 fps → 155%

Average Gaming Apple M1 8-Core GPU → 117%

Average Gaming 30-70 fps → 123%

Apple M1 7-Core GPUNVIDIA GeForce GTX 1050 (Desktop)Apple M1 8-Core GPU
lowmed.highultraQHD4Klowmed.highultraQHD4Klowmed.highultraQHD4K
F1 2542.73424.6
Kingdom Come Deliverance 223.6
Stalker 28.55
Black Myth: Wukong85
Cyberpunk 2077 2.2 Phantom Liberty10.76
Baldur's Gate 32520.3
F1 2255.348.531.6
Dying Light 216.413.29.56
God of War18.3
Guardians of the Galaxy
Cyberpunk 2077 1.032.1
Flight Simulator 202047.119.212.15.5
F1 20201336240.825.9
Gears Tactics17762.238.230.719
Doom Eternal52.539.331.328.2
Escape from Tarkov11563.950.529.919.8
Red Dead Redemption 26530.518.5
Call of Duty Modern Warfare 201956.633.930.717.1
FIFA 201961671541249554.1
Borderlands 345.22817.79840.12518.42.1482920
Control7523.615.8
F1 2019166716033.425.7
Total War: Three Kingdoms95.226.317.414343.322.5156.3198352215
The Division 212443.23324.415.16
Dirt Rally 2.013456.94522.120.5
Anthem6736.730.528.316.5
Far Cry New Dawn774138352511
Metro Exodus35.520.51613
Apex Legends10845.63736.712
Just Cause 432.2
Darksiders III44.6
Battlefield V12455.643.136.327.1
Farming Simulator 1952.3
Fallout 7638.2
Hitman 229.2
Call of Duty Black Ops 443.336.132.9
Assassin´s Creed Odyssey71382615
Forza Horizon 44934
FIFA 199533.8
Shadow of the Tomb Raider65226127262369323038
Strange Brigade14953.234.731.318.411.1
F1 20186452452813.4
X-Plane 11.1172.665.256.1
Kingdom Come: Deliverance32.522.9
Final Fantasy XV Benchmark5426.215.53
Fortnite53.342
Prey7167
Warhammer 40.000: Dawn of War III43.932.541.526.5
Mass Effect Andromeda47.124.319.9
Ghost Recon Wildlands62.231.729.213.8
For Honor142.260534213.5
Resident Evil 759.347.513.9
Watch Dogs 27835.420
Dishonored 28037.333.7
Call of Duty Infinite Warfare55.4
Titanfall 252.945.715.6
Farming Simulator 1710346.3
Battlefield 110492413713.9
Civilization 680.330.12715.84840.231.5
Mafia 341.126.1
FIFA 1715761
Deus Ex Mankind Divided47.635.3198663.133.6179
Overwatch1086333.1
Doom5446.518.3
Ashes of the Singularity37.433.23.5
Hitman 201644.721.618.9
The Division39.230.314.1
Far Cry Primal12557513815
XCOM 254.933.214.5
Rise of the Tomb Raider94.153.5393315.639.6
Rainbow Six Siege24715582.465.920.3
Assassin's Creed Syndicate44.116.5
Fallout 441.1
Anno 220554.31719.6
World of Warships10031.9
Mad Max6924.1
Dota 2 Reborn13012212711647.4
The Witcher 310664382015.3
Dirt Rally7649.8
GTA V17617078.6277.3323.8
Alien: Isolation75.2
Middle-earth: Shadow of Mordor44.9
Battlefield 45424
Dota 2116.410182.3
Metro: Last Light49
BioShock Infinite203.7145.2127.963
Crysis 331.9
Counter-Strike: GO1096944.4250
Apple M1 7-Core GPUNVIDIA GeForce GTX 1050 (Desktop)Apple M1 8-Core GPU
lowmed.highultraQHD4Klowmed.highultraQHD4Klowmed.highultraQHD4K
< 30 fps
< 60 fps
< 120 fps
≥ 120 fps

3
4
3
2

3
1
1
1
1


1


< 30 fps
< 60 fps
< 120 fps
≥ 120 fps
4
8
17
15
10
26
12
5
17
36
5
3
26
29
12
3
12

1
24
8
1
< 30 fps
< 60 fps
< 120 fps
≥ 120 fps

1
2
1
2

2
1

1
2


For more games that might be playable and a list of all games and graphics cards visit our Gaming List

v1.33
log 20. 01:05:18

#0 ran 0s before starting gpusingle class +0s ... 0s

#1 checking url part for id 10560 +0s ... 0s

#2 checking url part for id 7583 +0s ... 0s

#3 checking url part for id 10552 +0s ... 0s

#4 redirected to Ajax server, took 1758323118s time from redirect:0 +0s ... 0s

#5 did not recreate cache, as it is less than 5 days old! Created at Fri, 19 Sep 2025 05:19:25 +0200 +0s ... 0s

#6 composed specs +0.02s ... 0.02s

#7 did output specs +0s ... 0.02s

#8 start showIntegratedCPUs +0s ... 0.02s

#9 getting avg benchmarks for device 10560 +0.018s ... 0.038s

#10 got single benchmarks 10560 +0.004s ... 0.042s

#11 getting avg benchmarks for device 7583 +0s ... 0.042s

#12 got single benchmarks 7583 +0.001s ... 0.043s

#13 getting avg benchmarks for device 10552 +0s ... 0.043s

#14 got single benchmarks 10552 +0.006s ... 0.049s

#15 got avg benchmarks for devices +0s ... 0.049s

#16 No cached benchmark found, getting uncached values +0.003s ... 0.052s

#17 No cached benchmark found, getting uncached values +0s ... 0.052s

#18 min, max, avg, median took s +0.014s ... 0.066s

#19 before gaming benchmark output +0s ... 0.066s

#20 Got 382 rows for game benchmarks. +0.012s ... 0.079s

#21 composed SQL query for gamebenchmarks +0s ... 0.079s

#22 got data and put it in $dataArray +0.003s ... 0.082s

#23 benchmarks composed for output. +0.029s ... 0.111s

#24 calculated avg scores. +0s ... 0.111s

#25 return log +0.001s ... 0.112s

Please share our article, every link counts!
Mail Logo
> Expert Reviews and News on Laptops, Smartphones and Tech Innovations > Benchmarks / Tech > Graphics Card Comparison - Head 2 Head
Redaktion, 2017-09- 8 (Update: 2023-07- 1)