 Deutsch
 English
 Español
 Français
 Italiano
 Nederlands
 Polski
 Português
 Русский
 Türkçe
 Svenska
 Chinese
 Magyar
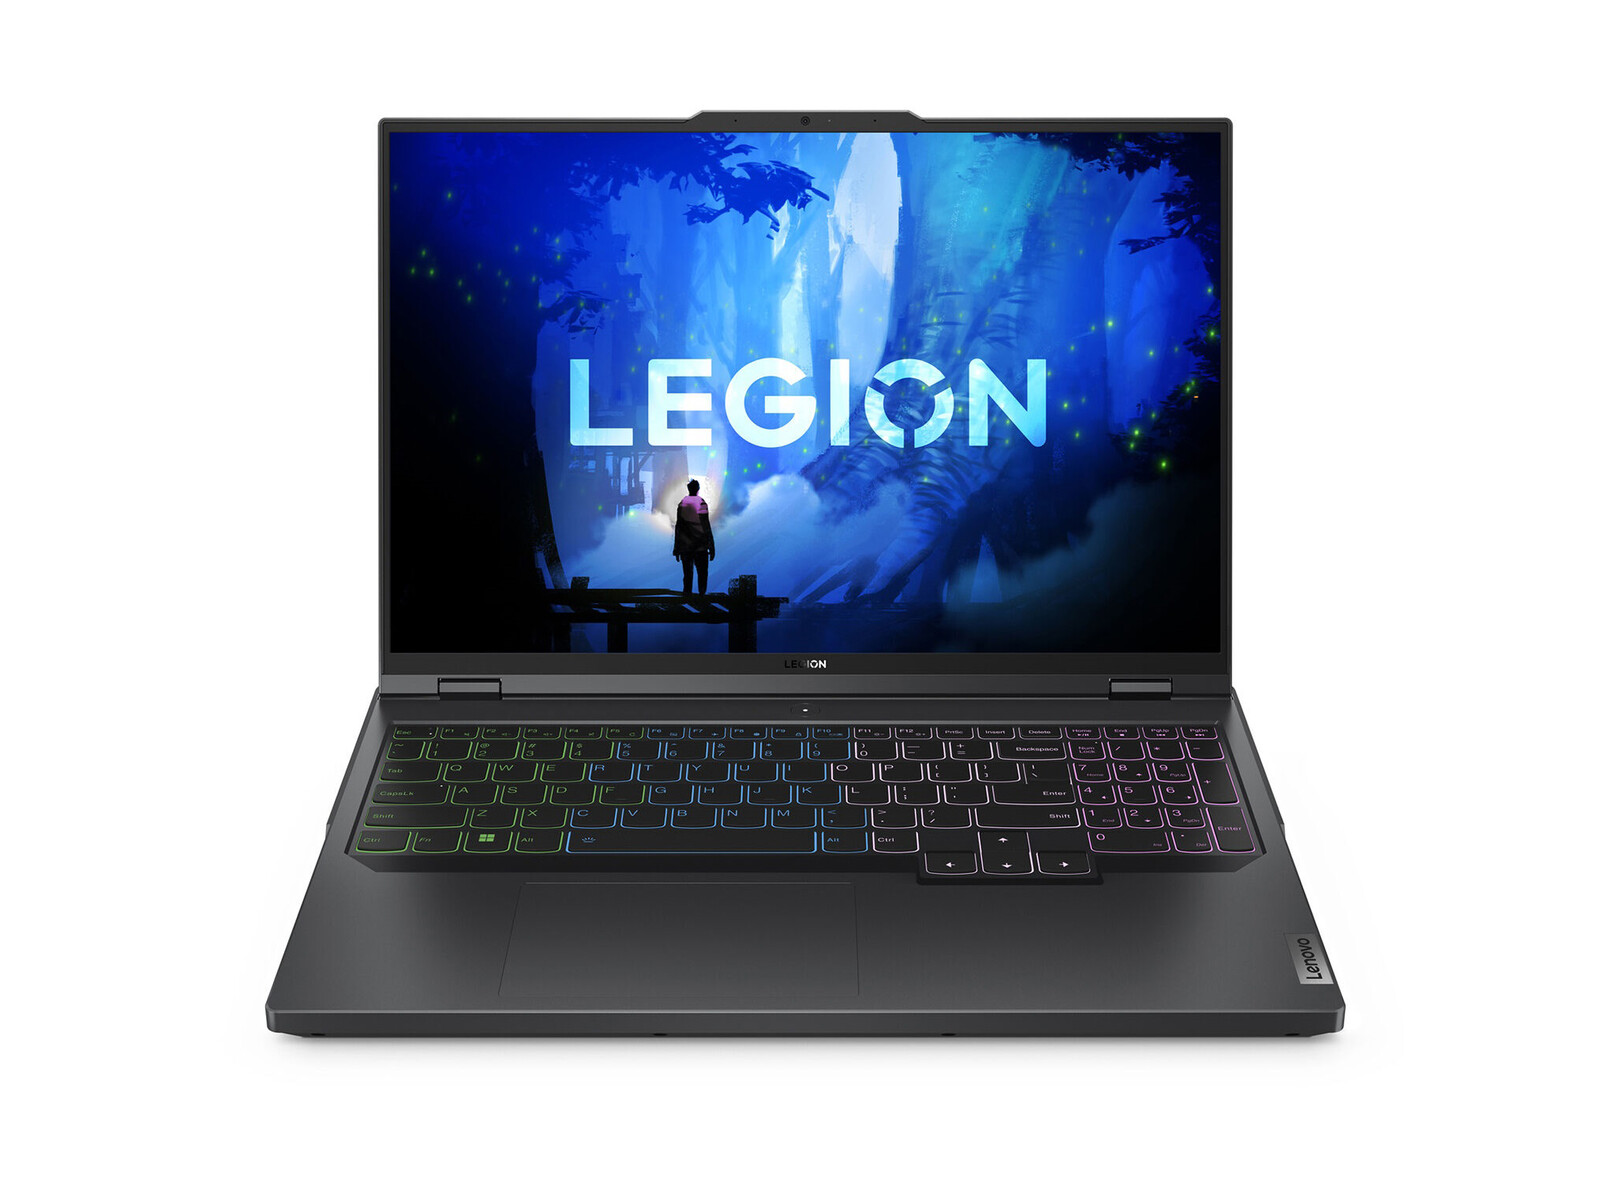
Lenovo Legion Pro 5 16IRX9 laptop review: Great performance, but a little heavy

Not to be confused with the visually different Legion 5 16IRX9, the Legion Pro 5 16IRX9 directly succeeds last year's Legion Pro 5 16 IRX8. It swaps out the 2023 Raptor Lake-HX CPUs for the 2024 Raptor Lake-HX refresh lineup while introducing slight visual changes and a new third display option.
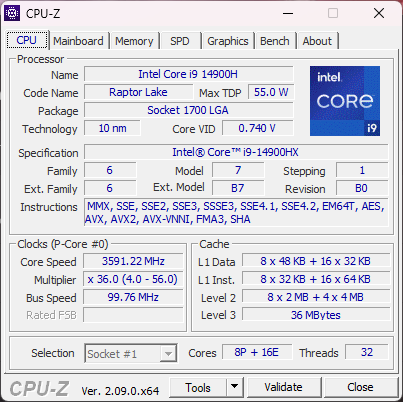
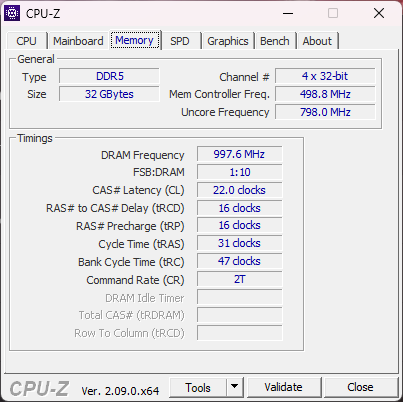
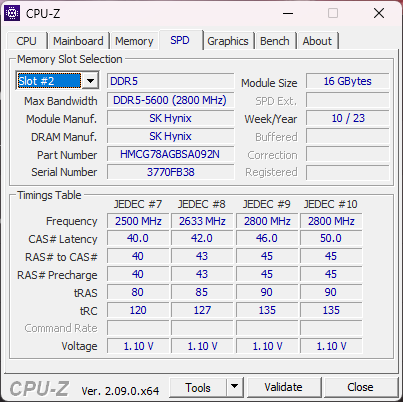
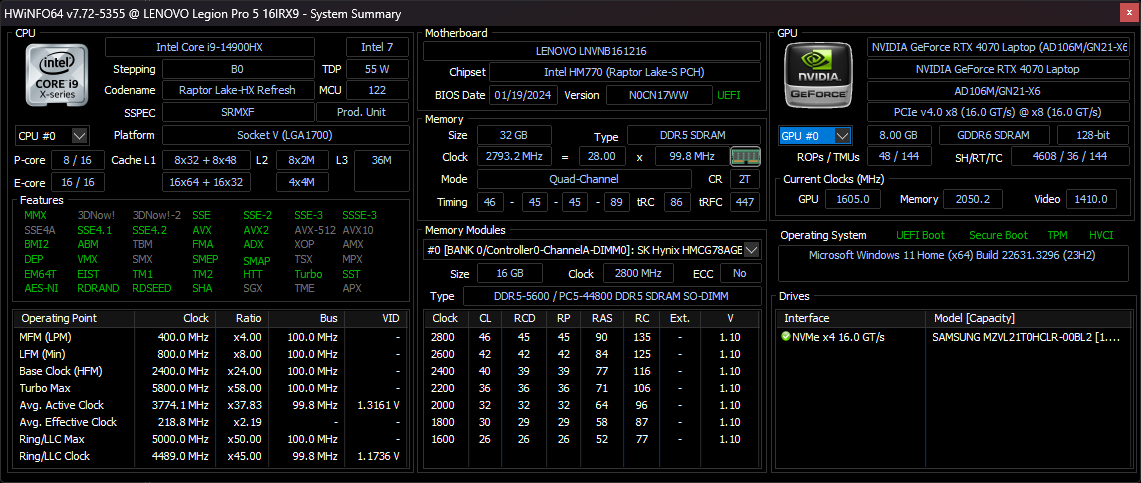
Our unit in review is a higher-end configuration with the Core i9-14900HX CPU, 140 W GeForce RTX 4070 GPU, and 1600p 165 Hz IPS sRGB display for approximately $1900 to $2100 retail. Other SKUs start with the Core i5-14500HX and RTX 4050 with full DCI-P3 colors instead, but the native 1600p resolution is the same across the board.
Alternatives to the Legion Pro 5 16 IRX9 include other upper midrange 16-inch gaming laptops like the HP Omen Transcend 16, Asus ROG Zephyrus G16, or MSI Stealth 16.
More Lenovo reviews:
Potential Competitors in Comparison
Rating | Date | Model | Weight | Height | Size | Resolution | Best Price |
|---|---|---|---|---|---|---|---|
| 89.3 % | 03/2024 | Lenovo Legion Pro 5 16IRX9 i9-14900HX, NVIDIA GeForce RTX 4070 Laptop GPU | 2.5 kg | 26.95 mm | 16.00" | 2560x1600 | |
| 87.9 % | 05/2023 | Lenovo Legion Pro 5 16IRX8 i7-13700HX, NVIDIA GeForce RTX 4060 Laptop GPU | 2.5 kg | 26.8 mm | 16.00" | 2560x1600 | |
| 90.2 % | 03/2024 | Alienware m16 R2 Ultra 7 155H, NVIDIA GeForce RTX 4070 Laptop GPU | 2.5 kg | 23.5 mm | 16.00" | 2560x1600 | |
| 88.4 % | 02/2024 | HP Omen Transcend 16-u1095ng i9-14900HX, NVIDIA GeForce RTX 4070 Laptop GPU | 2.3 kg | 20 mm | 16.00" | 2560x1600 | |
| 92.3 % | 02/2024 | Asus ROG Zephyrus G16 2024 GU605M Ultra 7 155H, NVIDIA GeForce RTX 4070 Laptop GPU | 1.8 kg | 16.4 mm | 16.00" | 2560x1600 | |
| 89.1 % | 11/2023 | MSI Stealth 16 Mercedes-AMG Motorsport A13VG i9-13900H, NVIDIA GeForce RTX 4070 Laptop GPU | 1.9 kg | 20 mm | 16.00" | 3840x2400 |
Case — Small External Changes
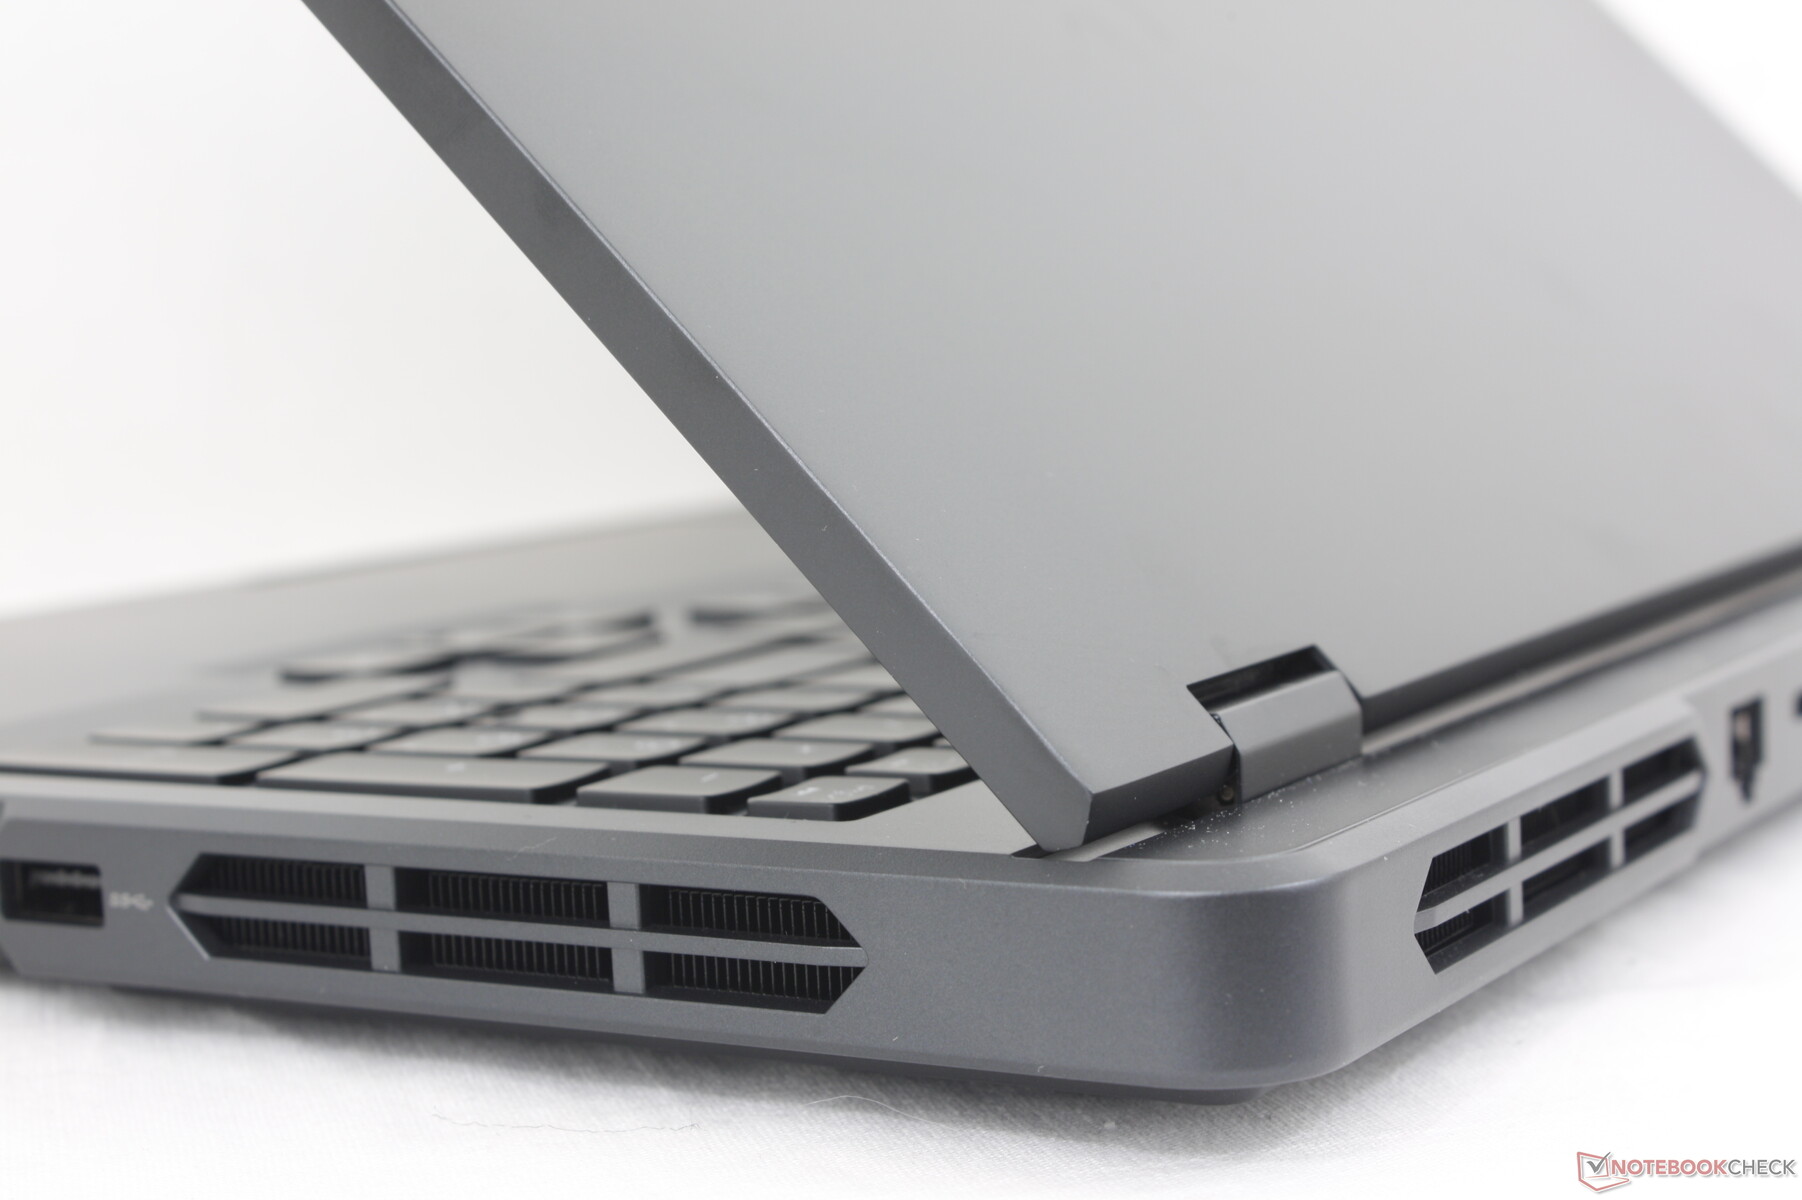
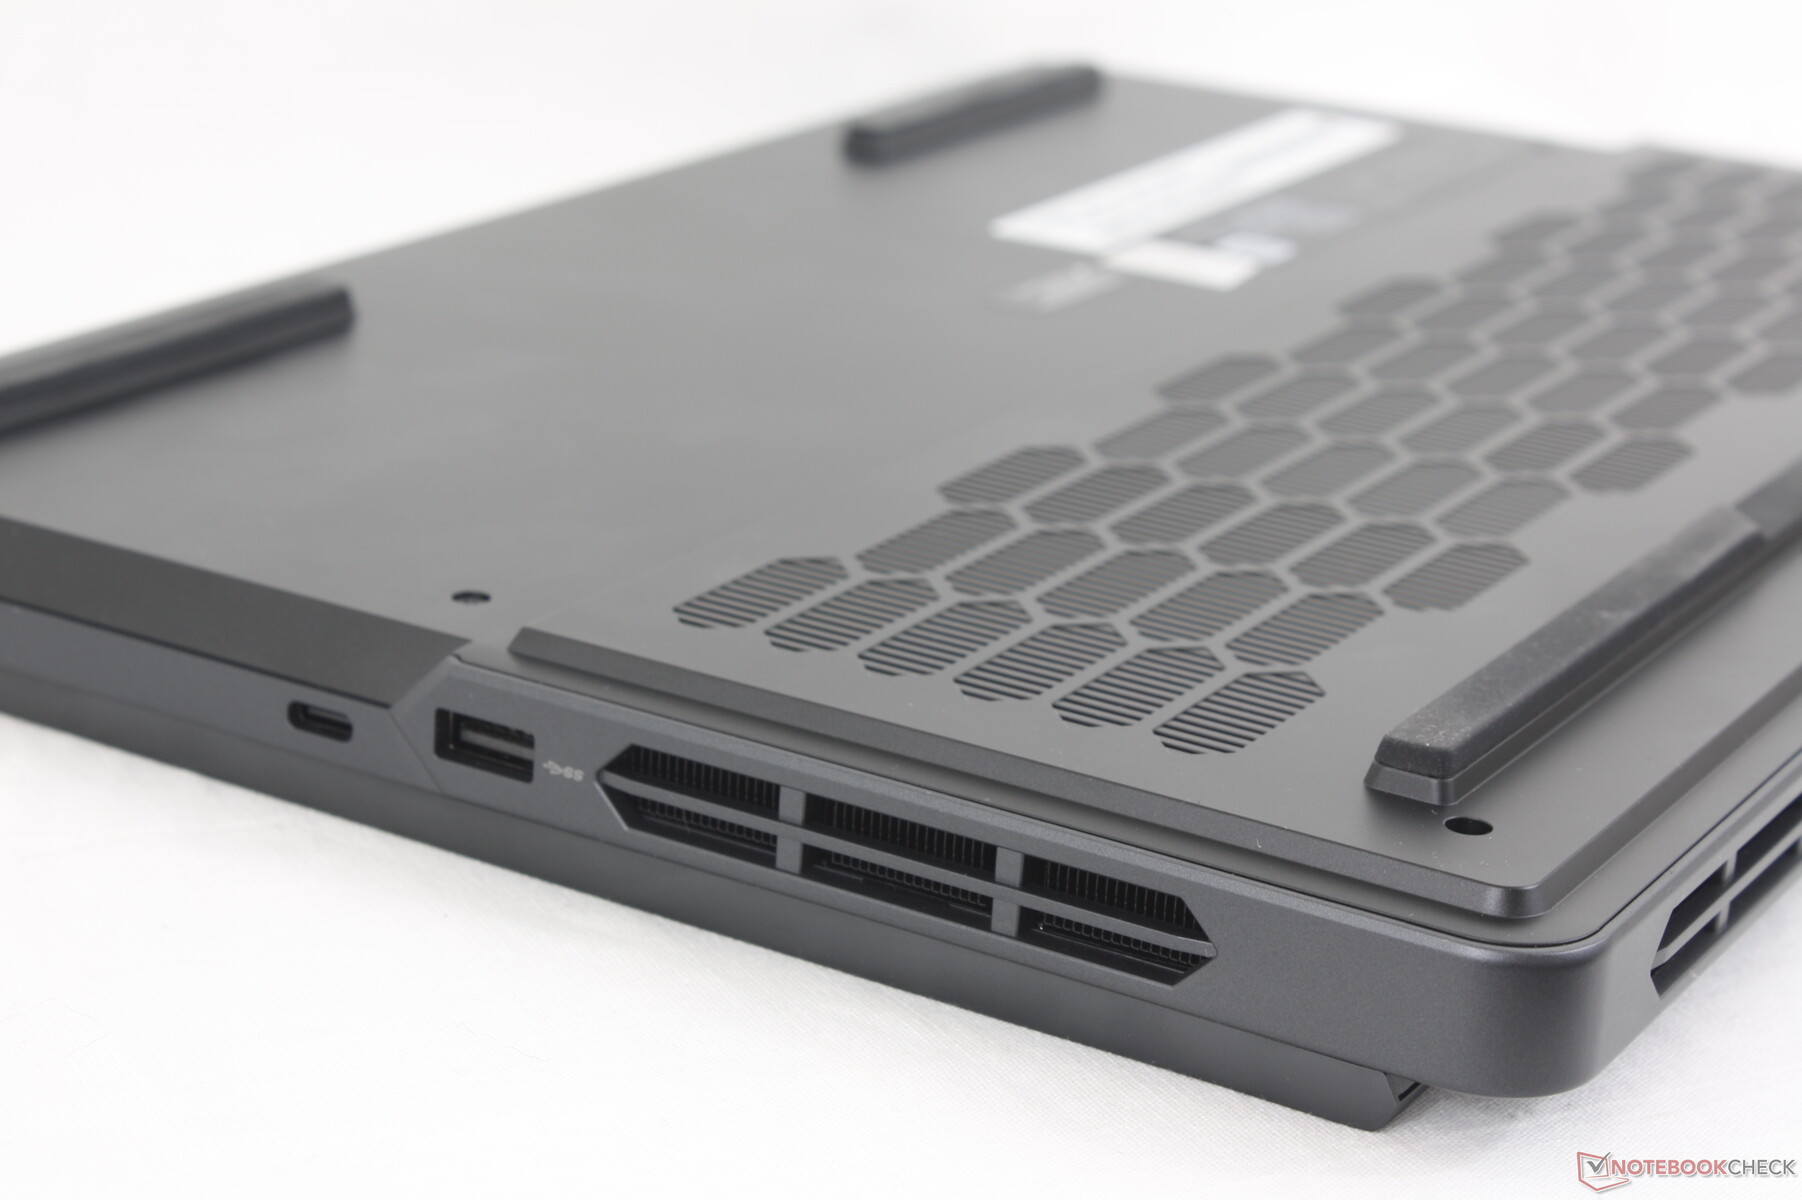
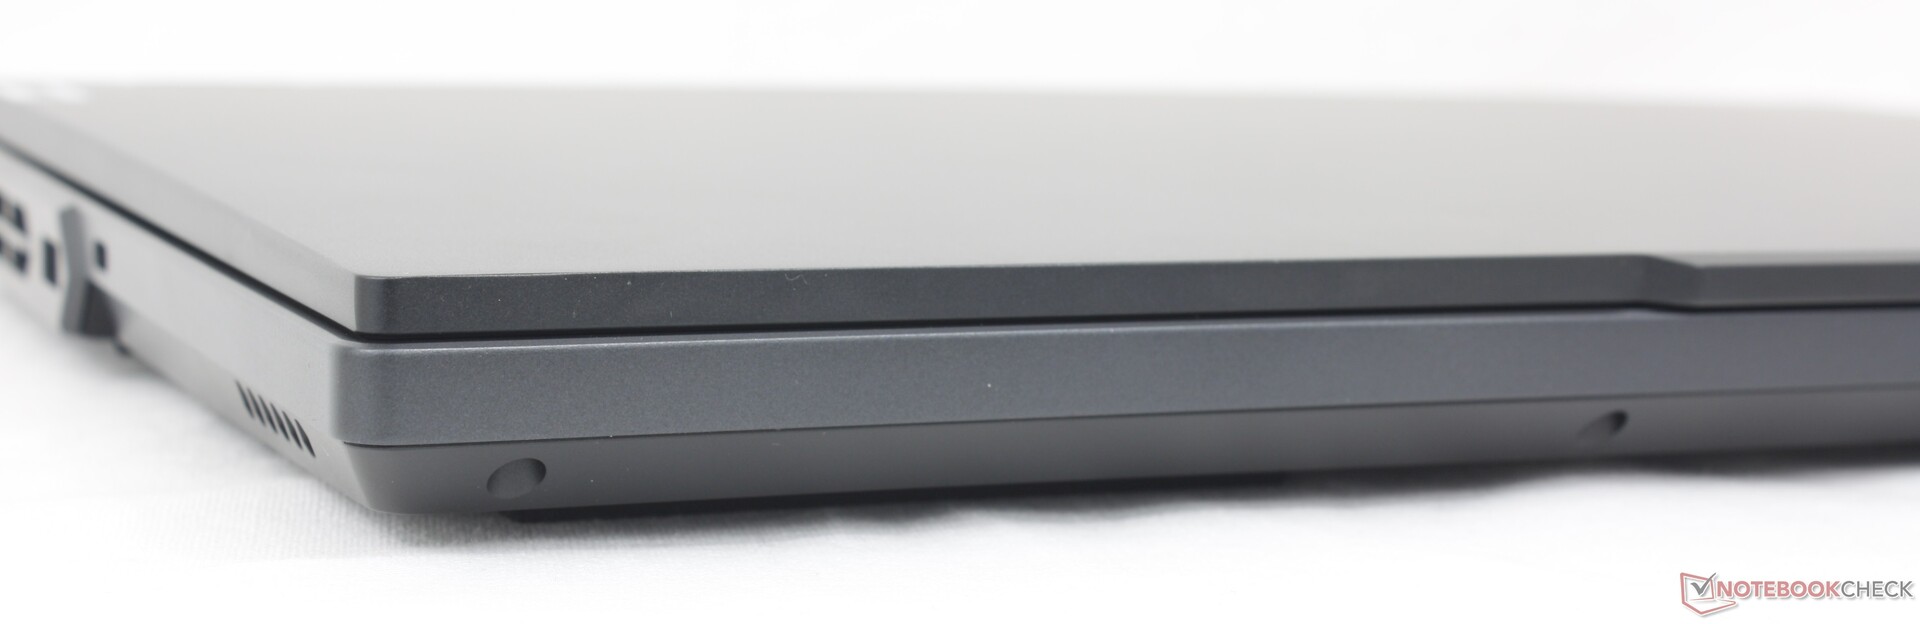
Lenovo utilizes similar gray aluminum materials across its Legion lineup and the Legion Pro 5 16IRX9 is no different. New to the model this year are the redesigned ventilation grilles along the bottom panel (D side) which are now extended hexagons instead of rectangles. The change is predominantly superficial and the rest of the chassis is otherwise the same as the Legion Pro 5 16IRX8.

The Legion Pro 5 16 remains one the largest and heaviest 16-inch gaming laptops by over 600 grams in some cases. However, the bigger size isn't wasted as the Lenovo ships with proper Core-HX series CPUs whereas smaller and lighter alternatives like the Alienware m16 R2 may ship with slower Core Ultra CPUs instead.
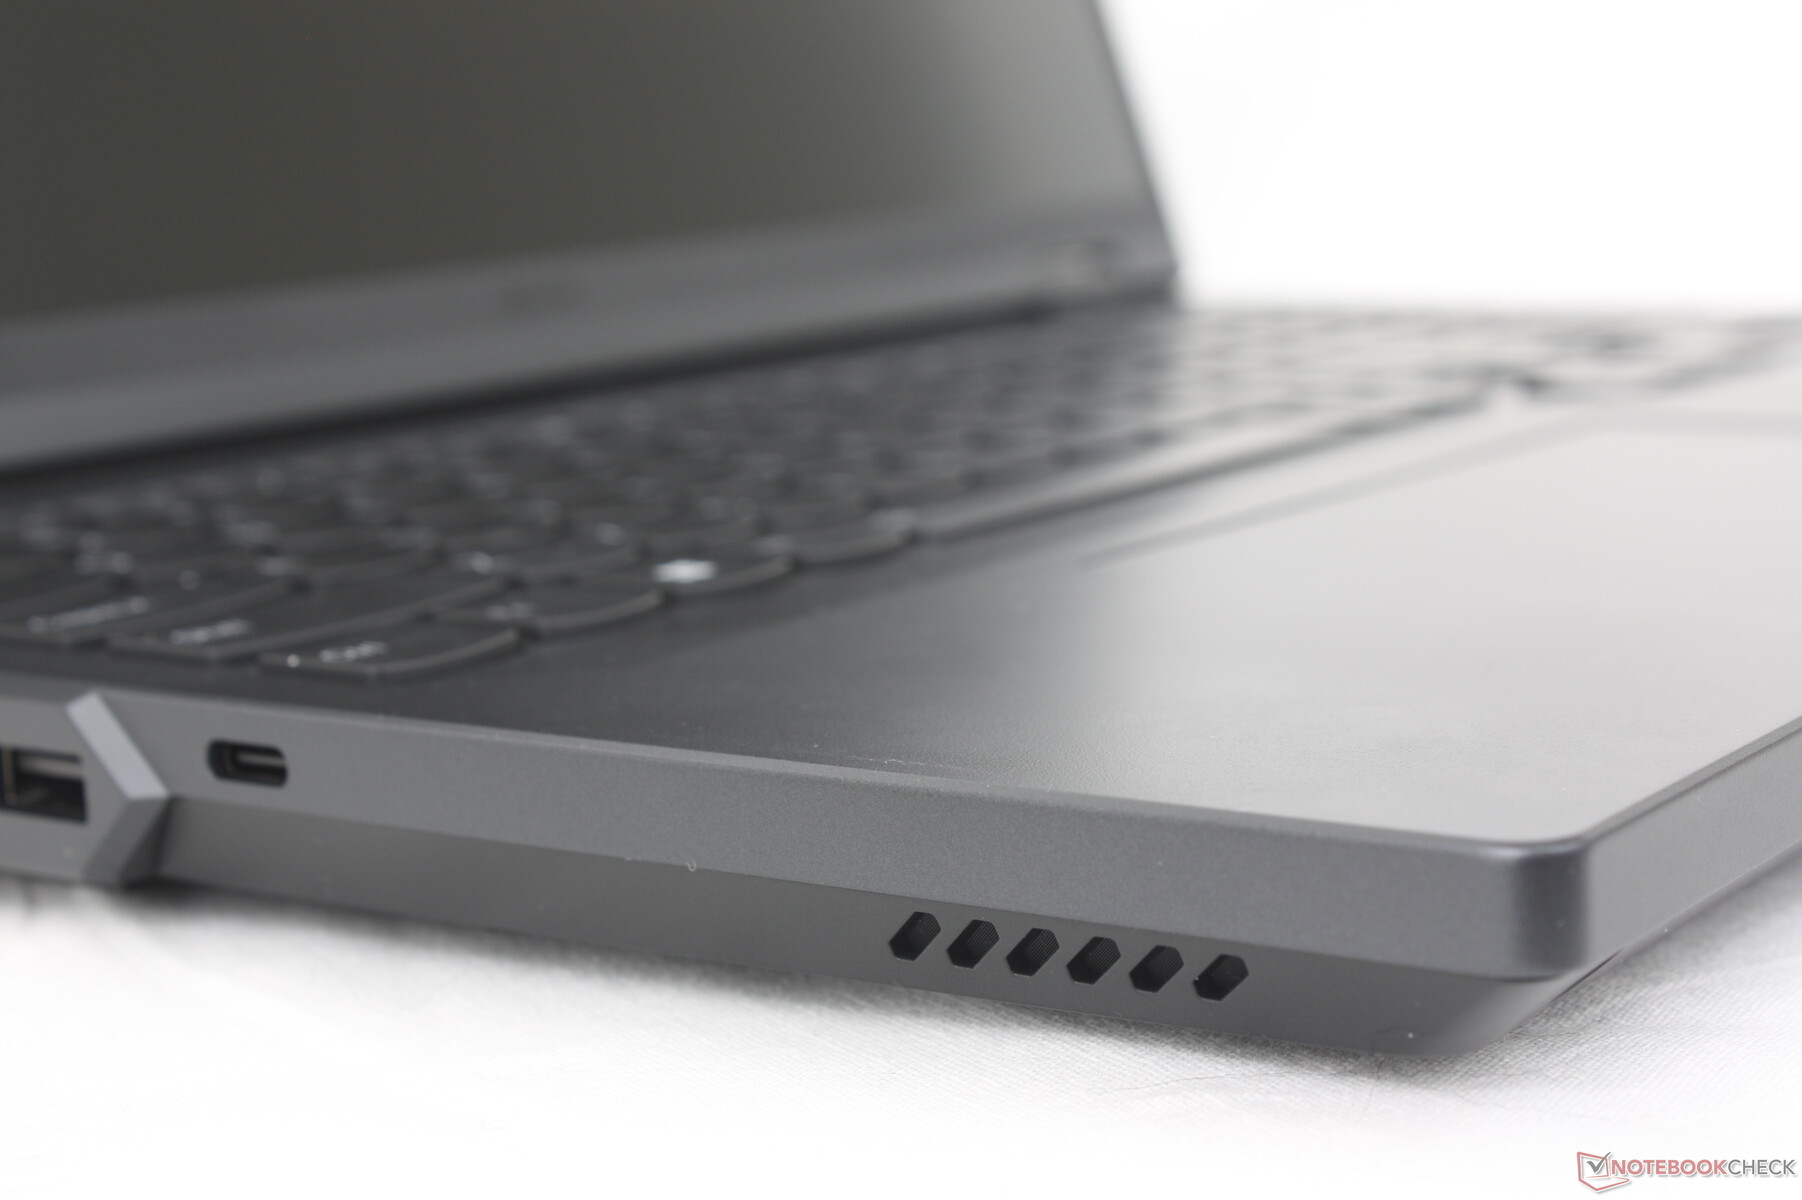


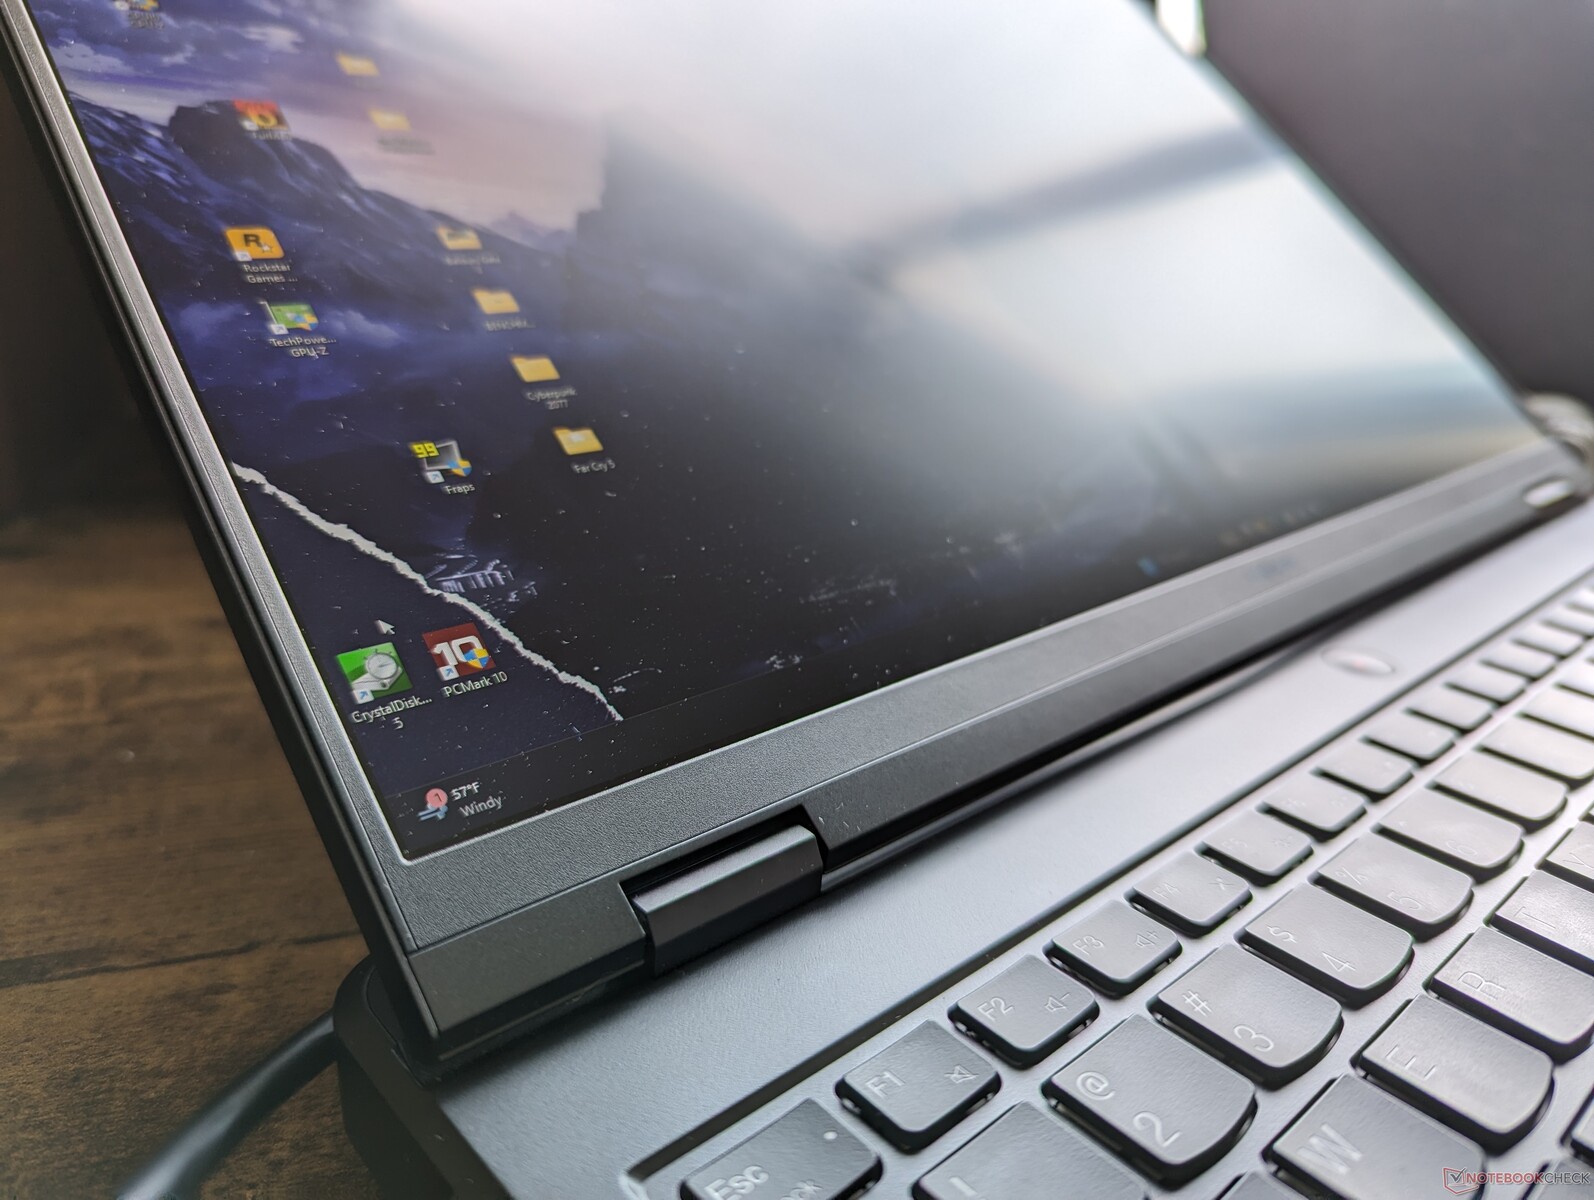
Connectivity
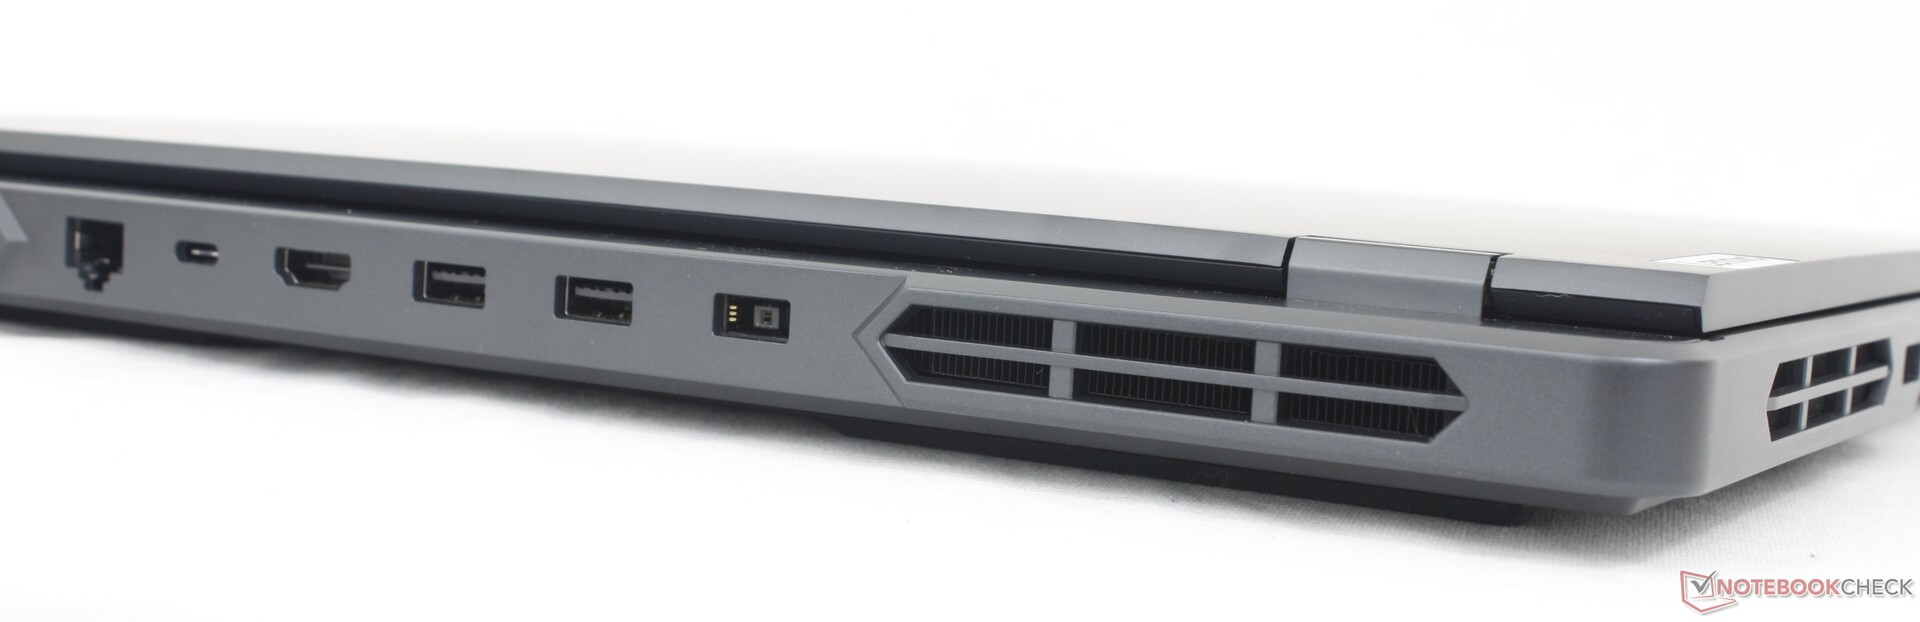
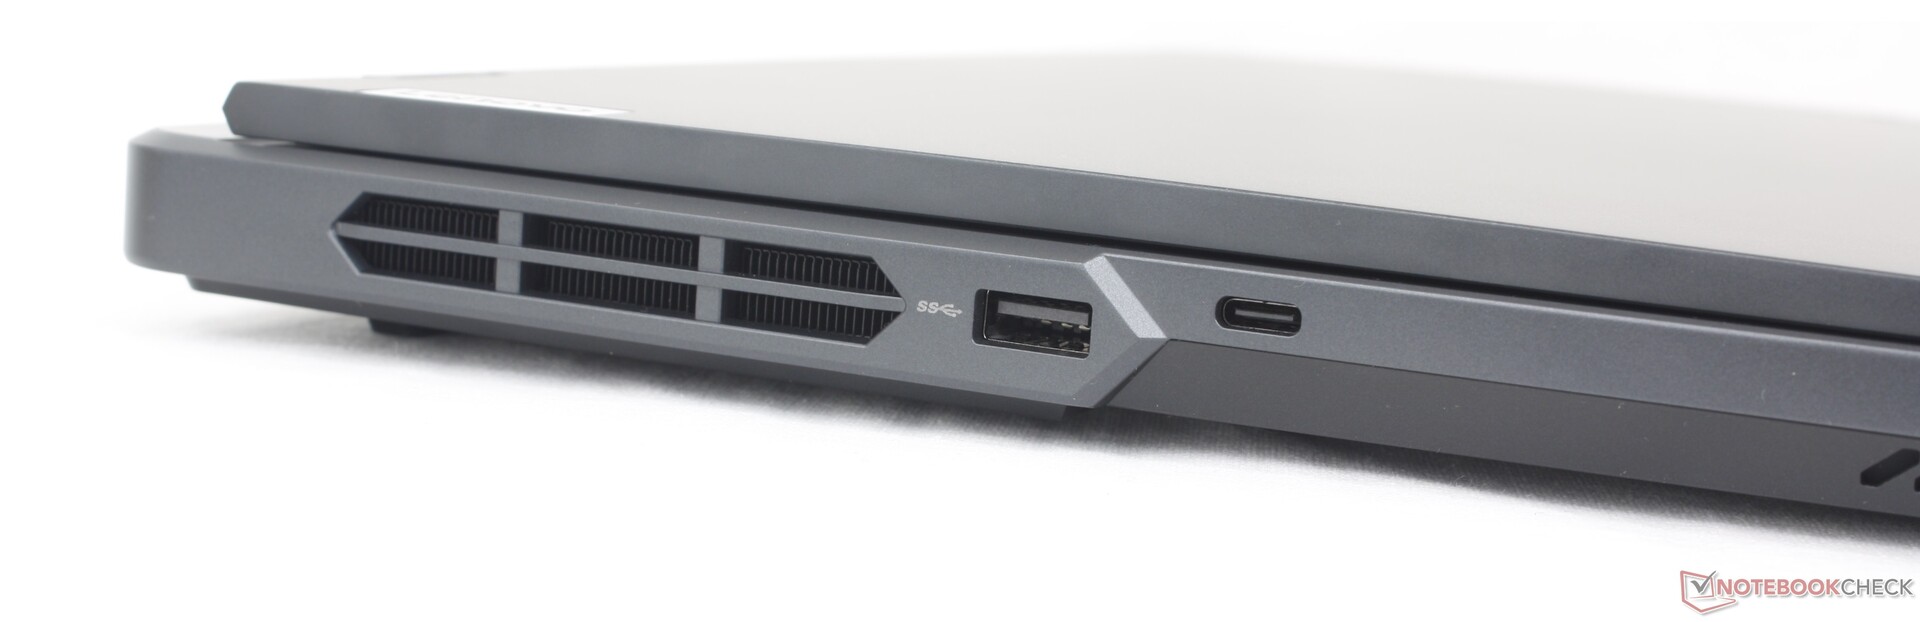
Port options remain competitive although the lack of an integrated SD card reader might irk some content creators. The printed port symbols along the thermal deck make it much easier to visually identify the rear ports when compared to laptops like the Alienware m16 R2 or HP Omen Transcend 16. However, the symbols are not illuminated unlike on the Legion Pro 7 series.
While laptops supporting Thunderbolt 5 are only now beginning to hit the market, the Legion Pro 5 16 is still on Thunderbolt 4 only.

Communication
An Intel AX211 comes standard for Wi-Fi 6E and Bluetooth 5.2 connectivity. We experienced no issues when paired to our Asus AXE11000 test router.
Webcam
While our test unit comes with a 2 MP webcam, some SKUs may only have a 1 MP webcam. An electronic shutter comes standard with no IR options.


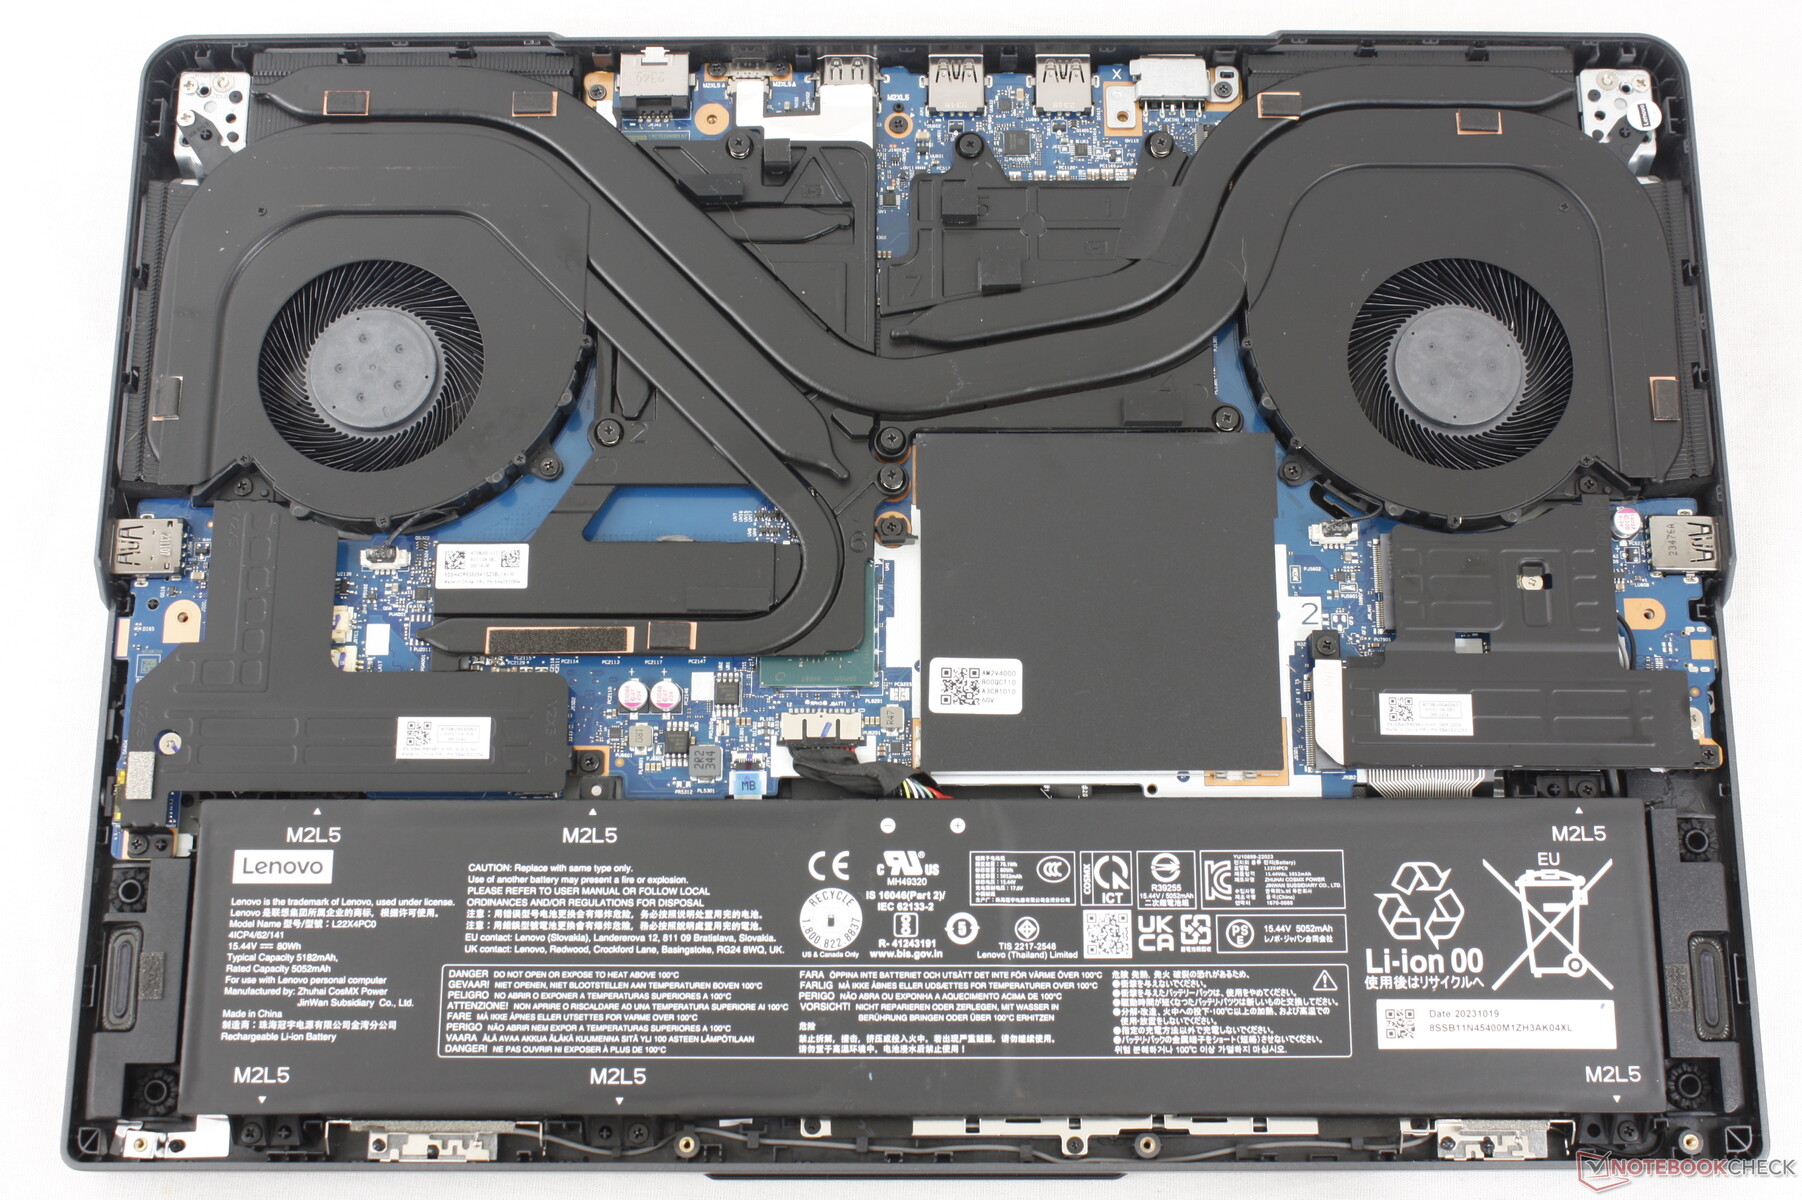
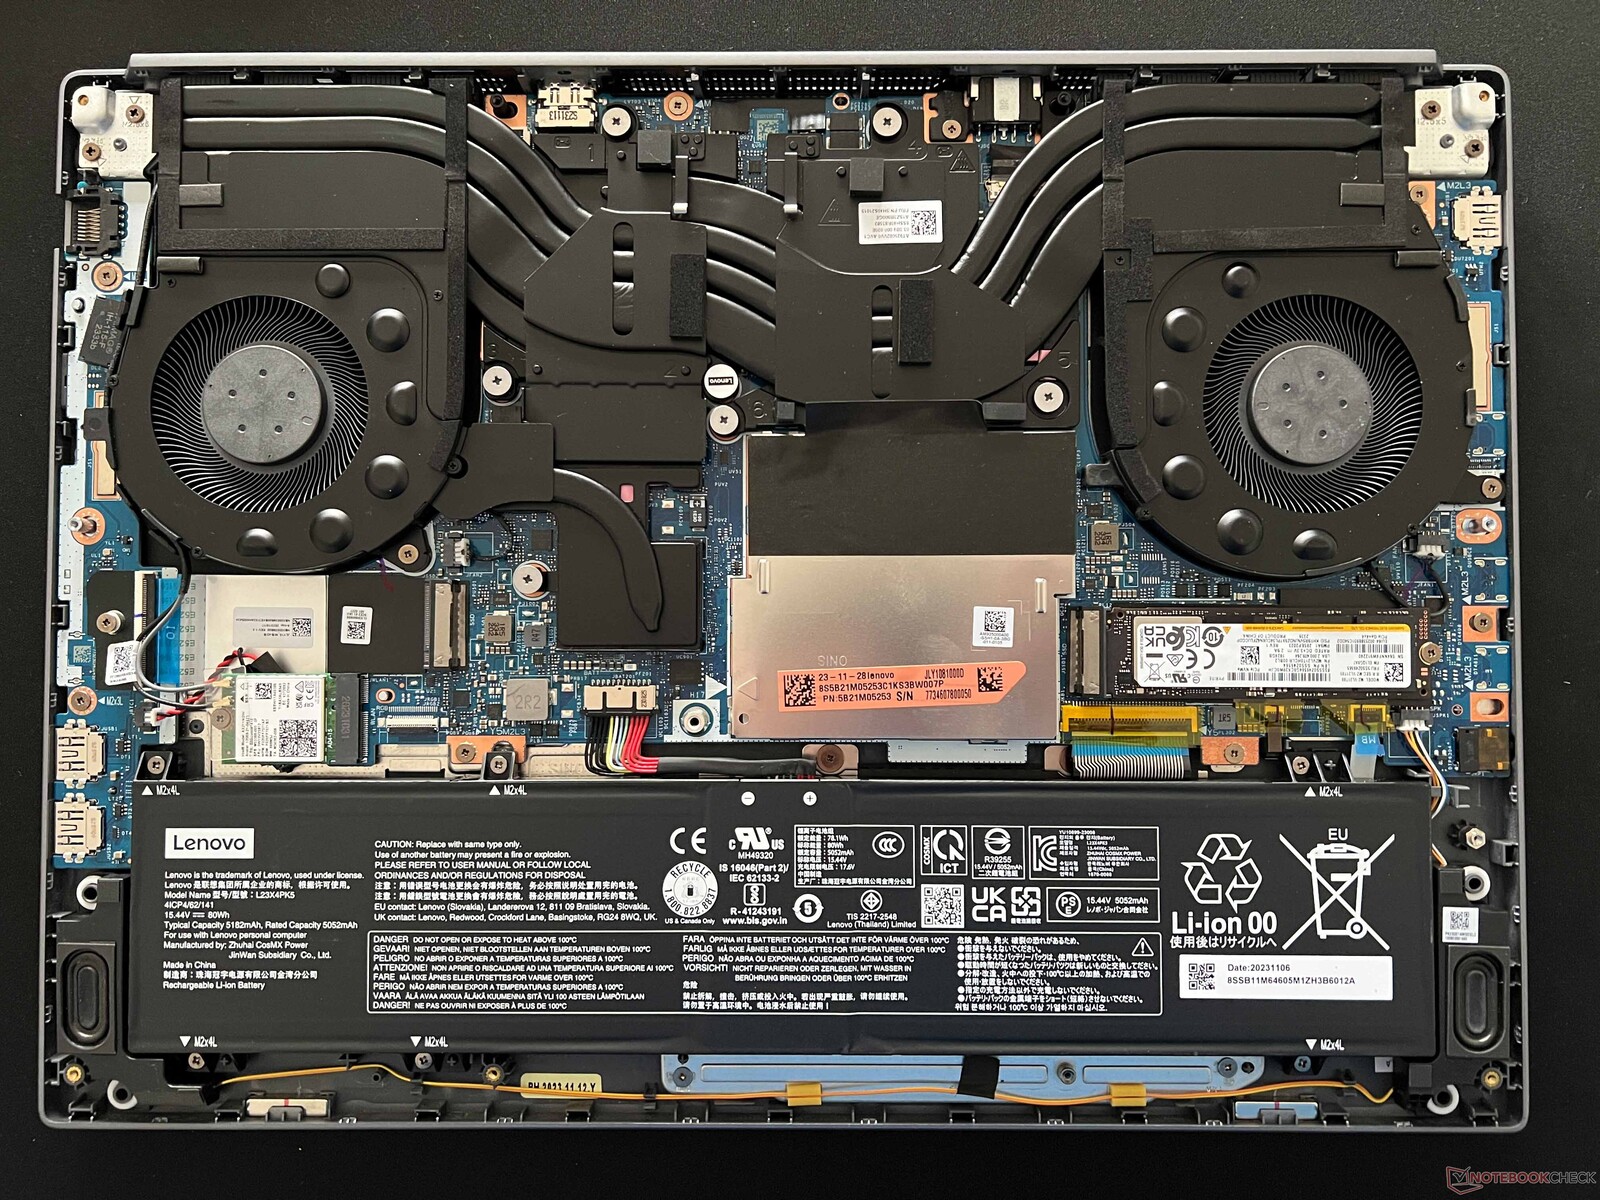
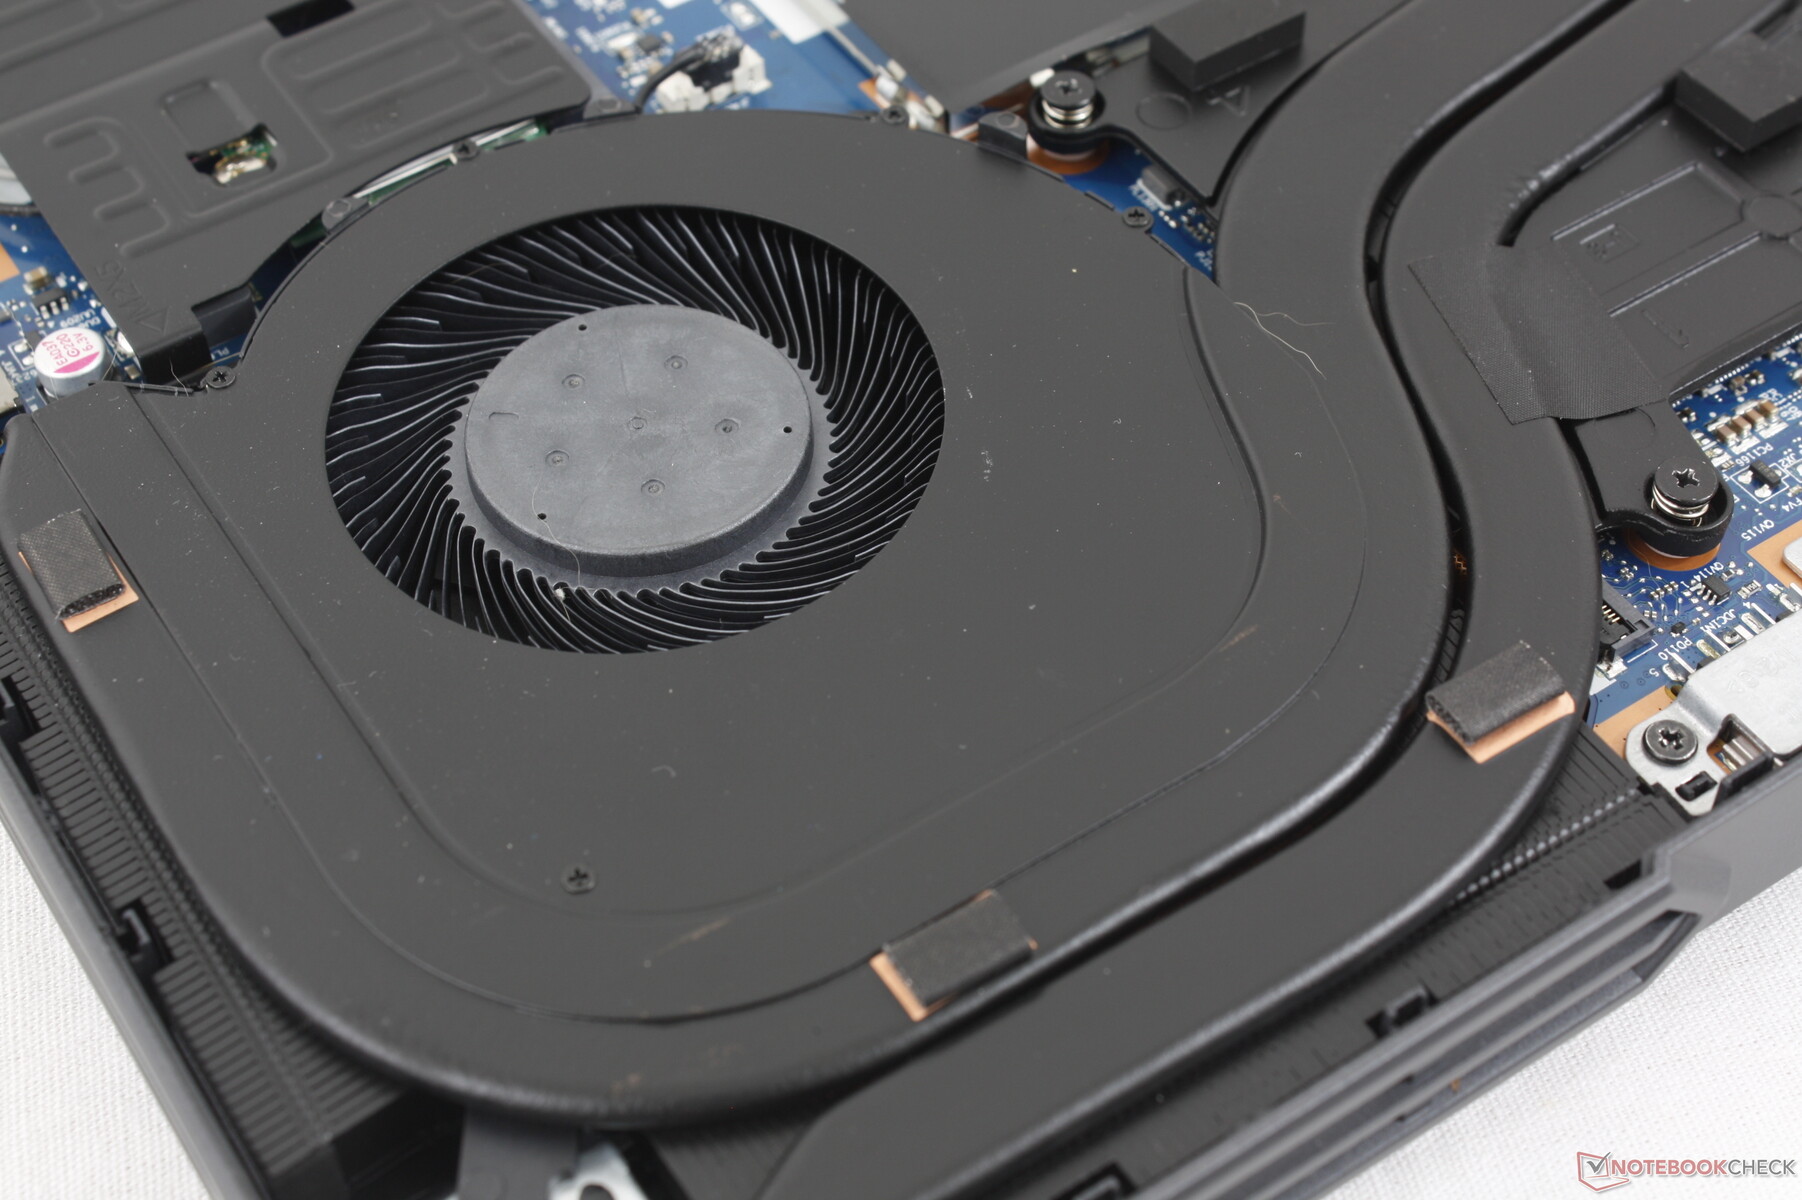
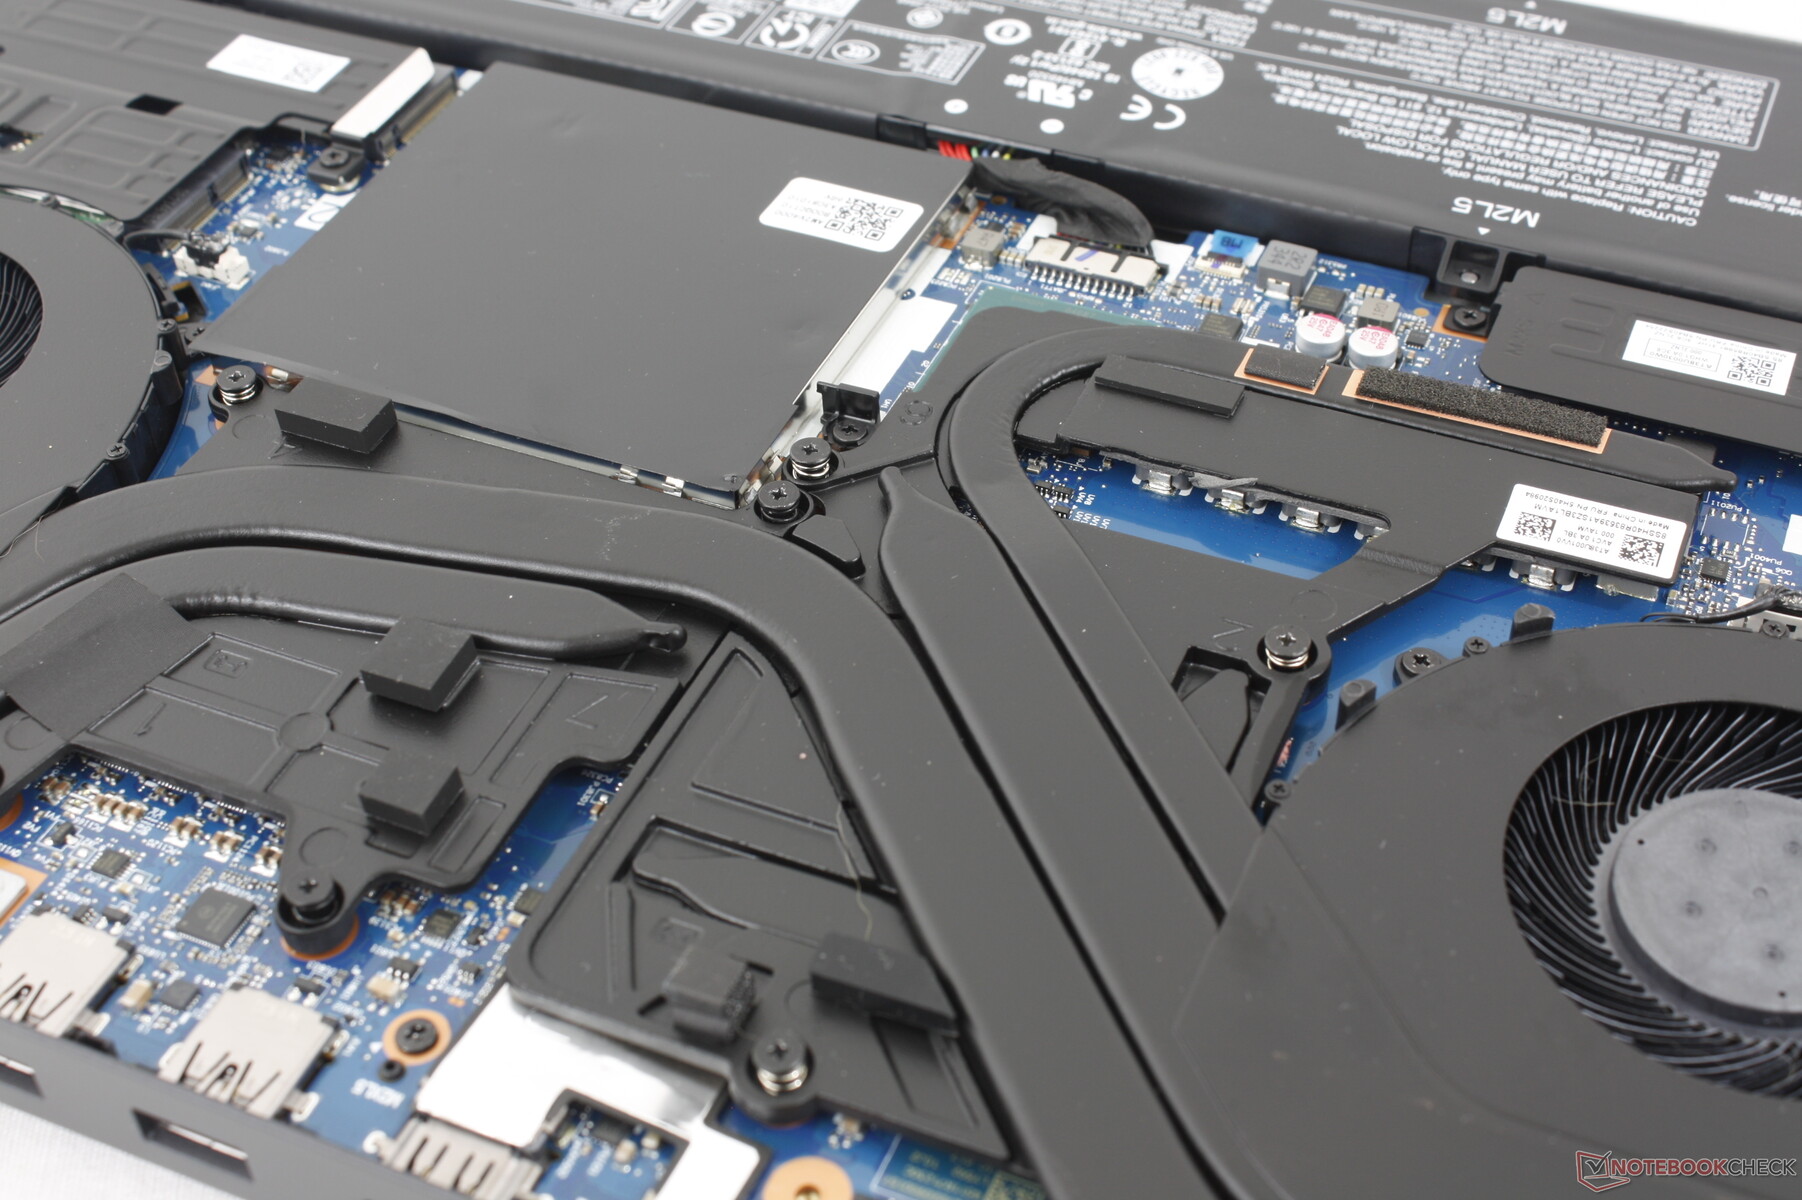
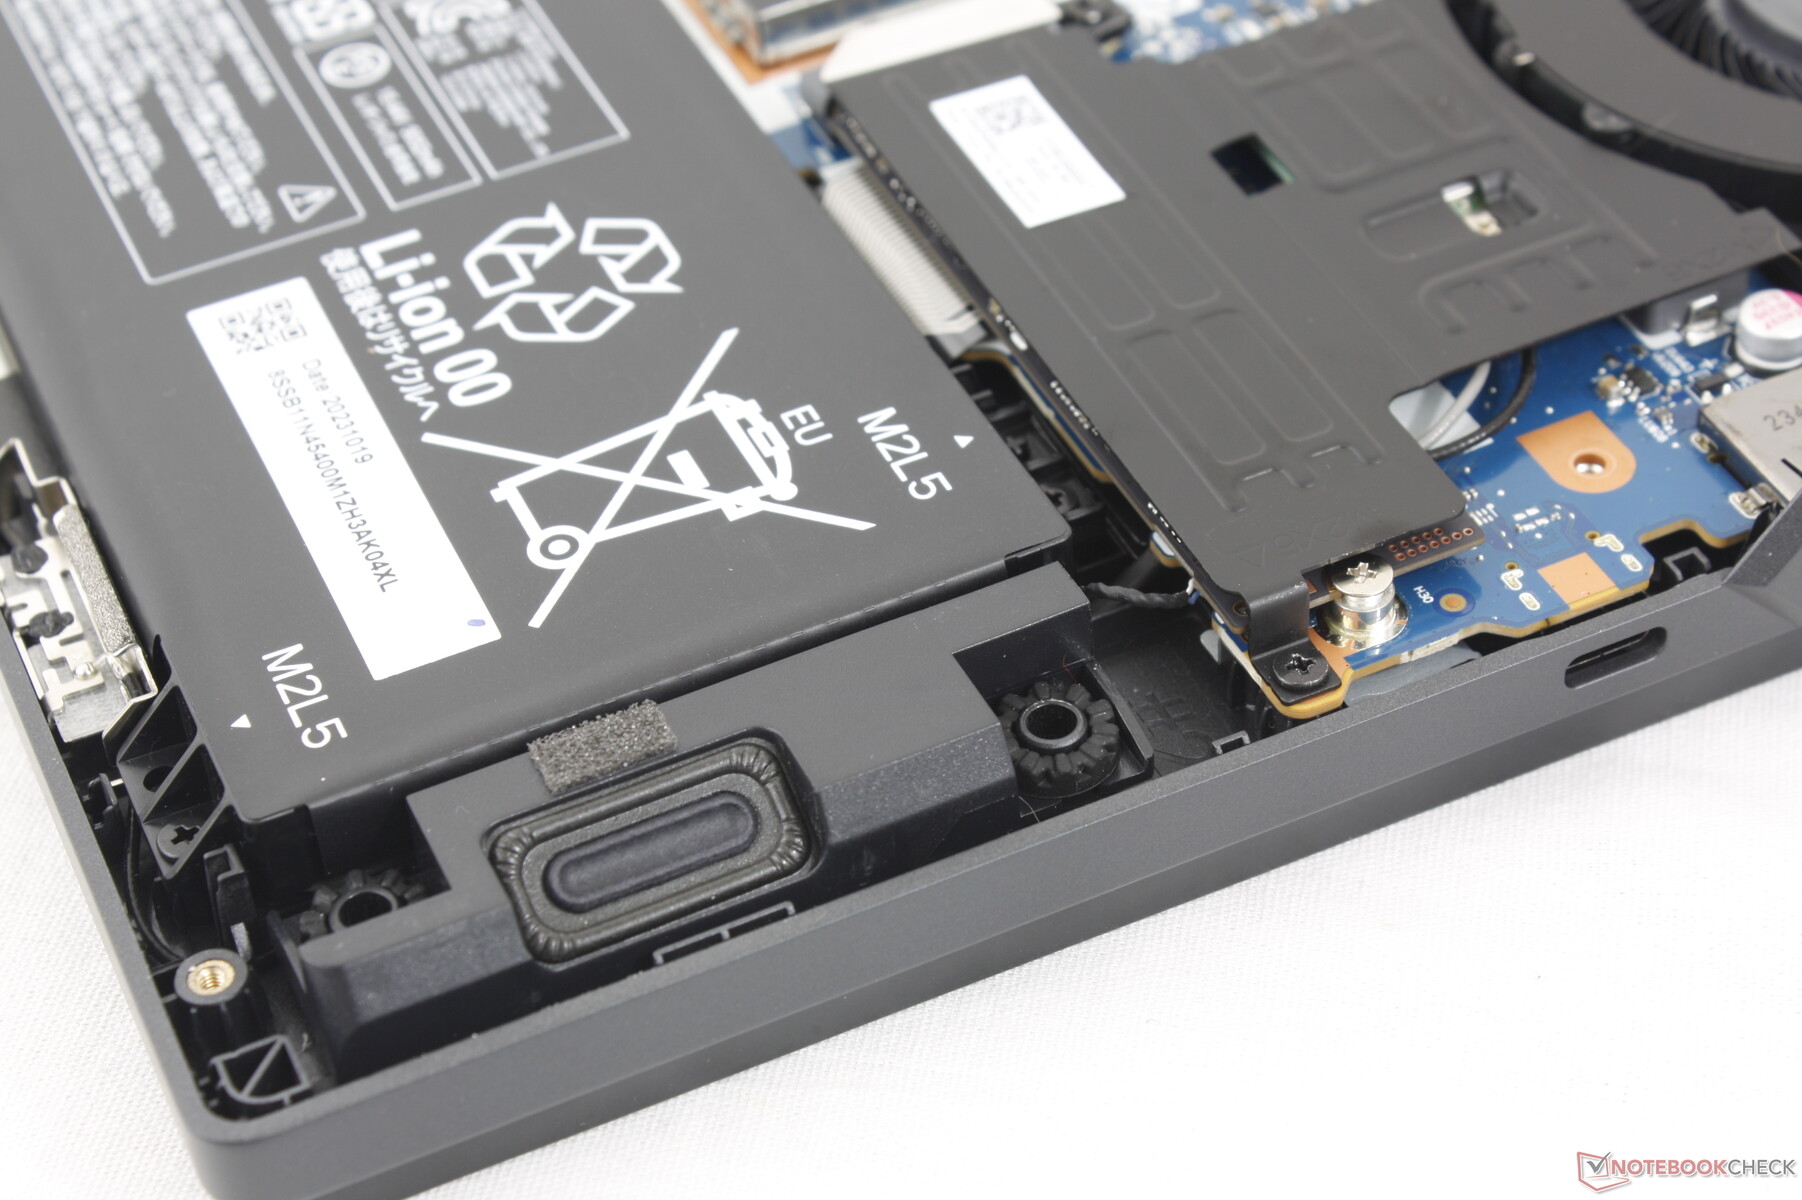
Maintenance
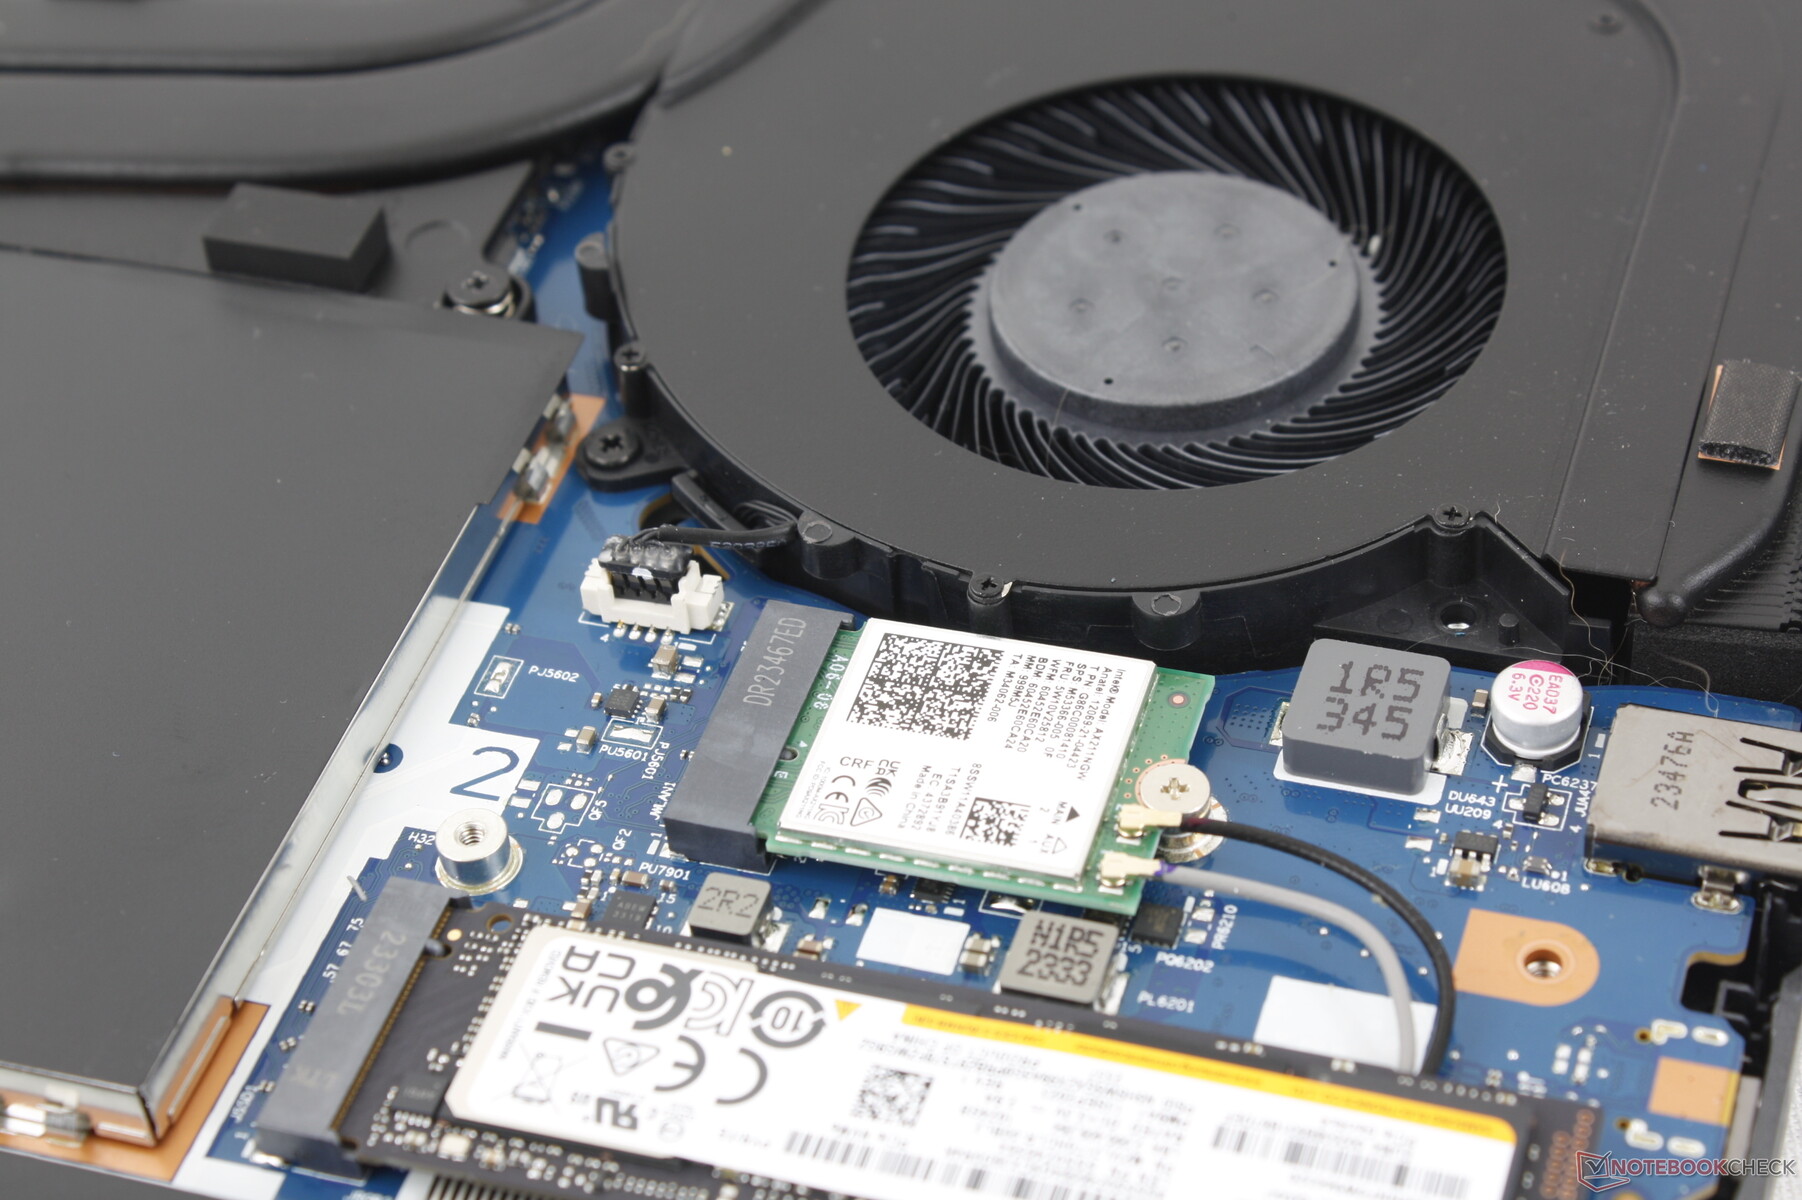
The motherboard incorporates only minor changes from last year's design. The WLAN, RAM, and two SSD slots are protected under additional aluminum plates. Interestingly, the Legion Pro 5 16 utilizes fewer but thicker copper heat pipes than the Legion 5 16 design.
Accessories And Warranty
There are no extras in the box other than the AC adapter and paperwork. The usual one-year limited manufacturer warranty applies if purchased in the US.
Input Devices — Familiar Legion Experience
Keyboard
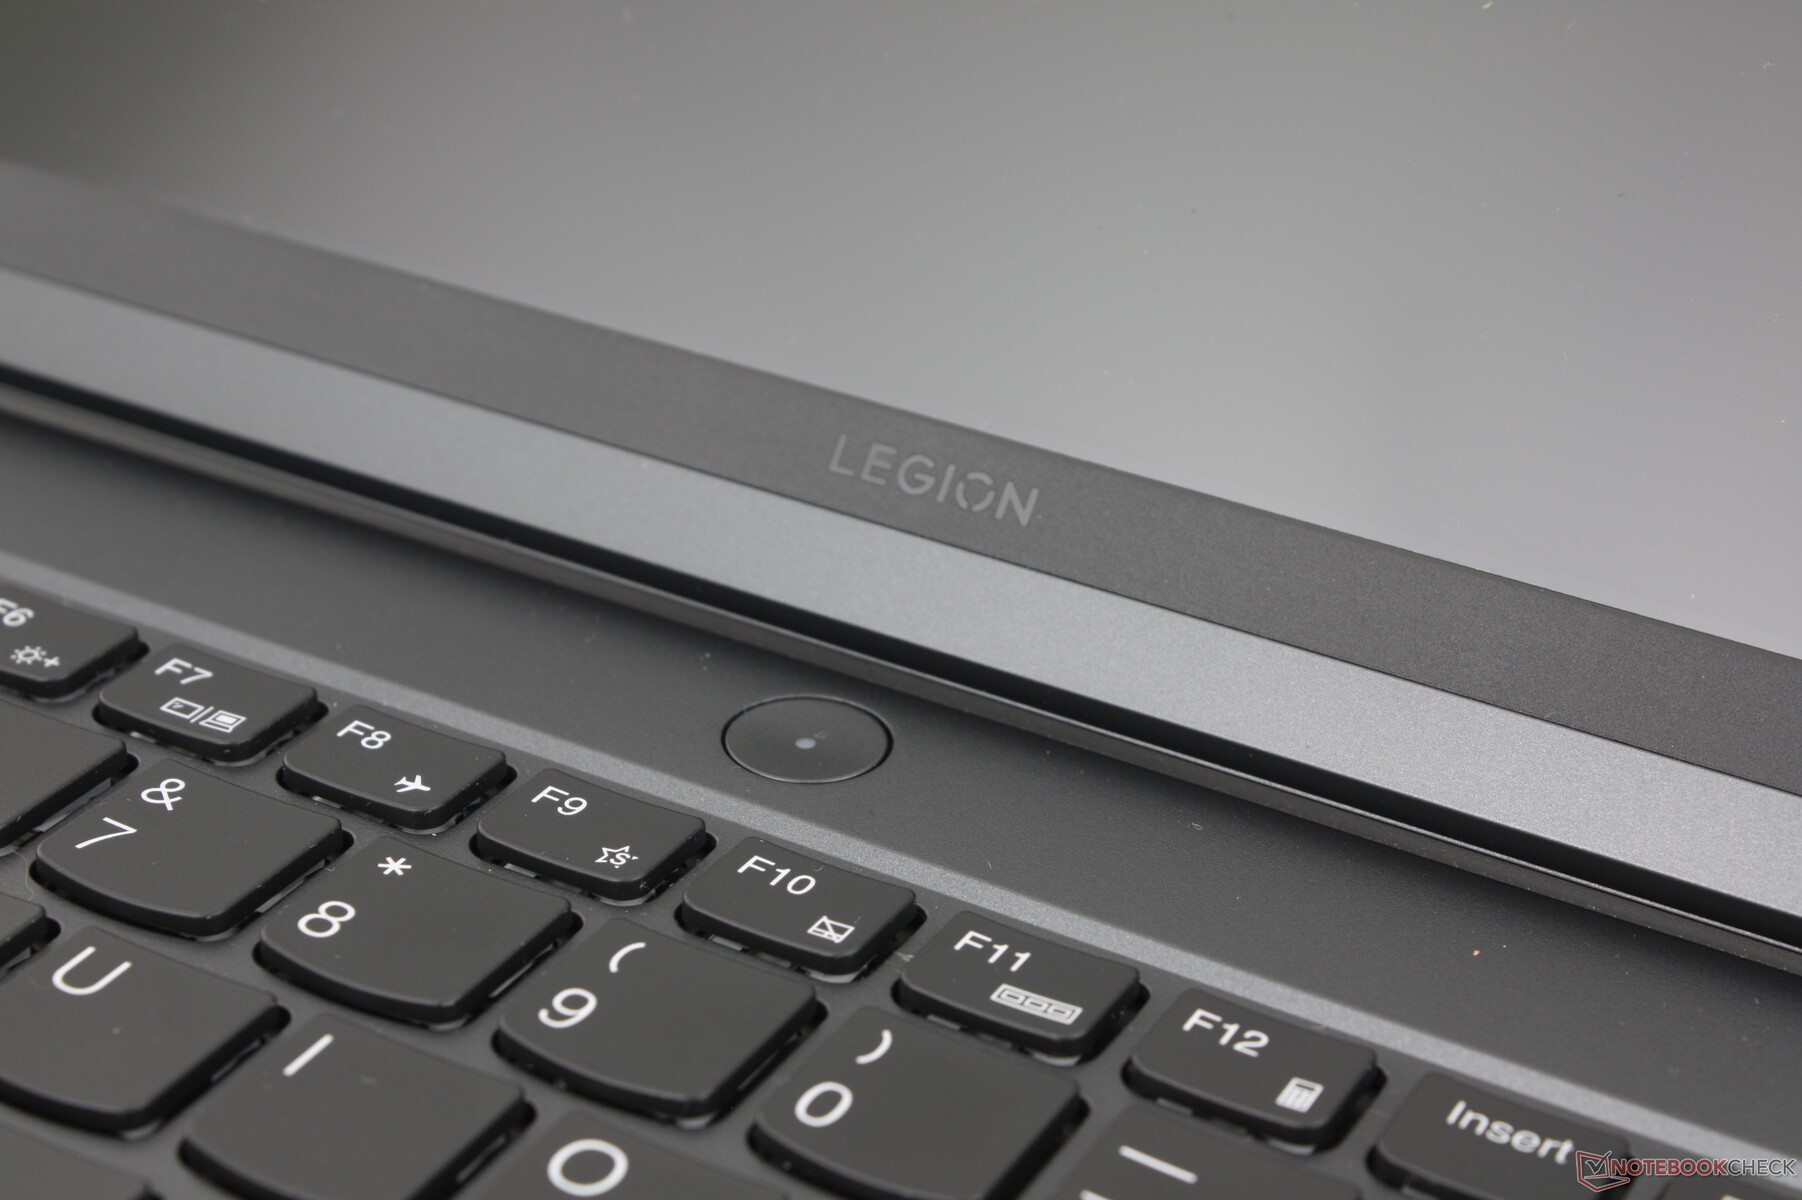
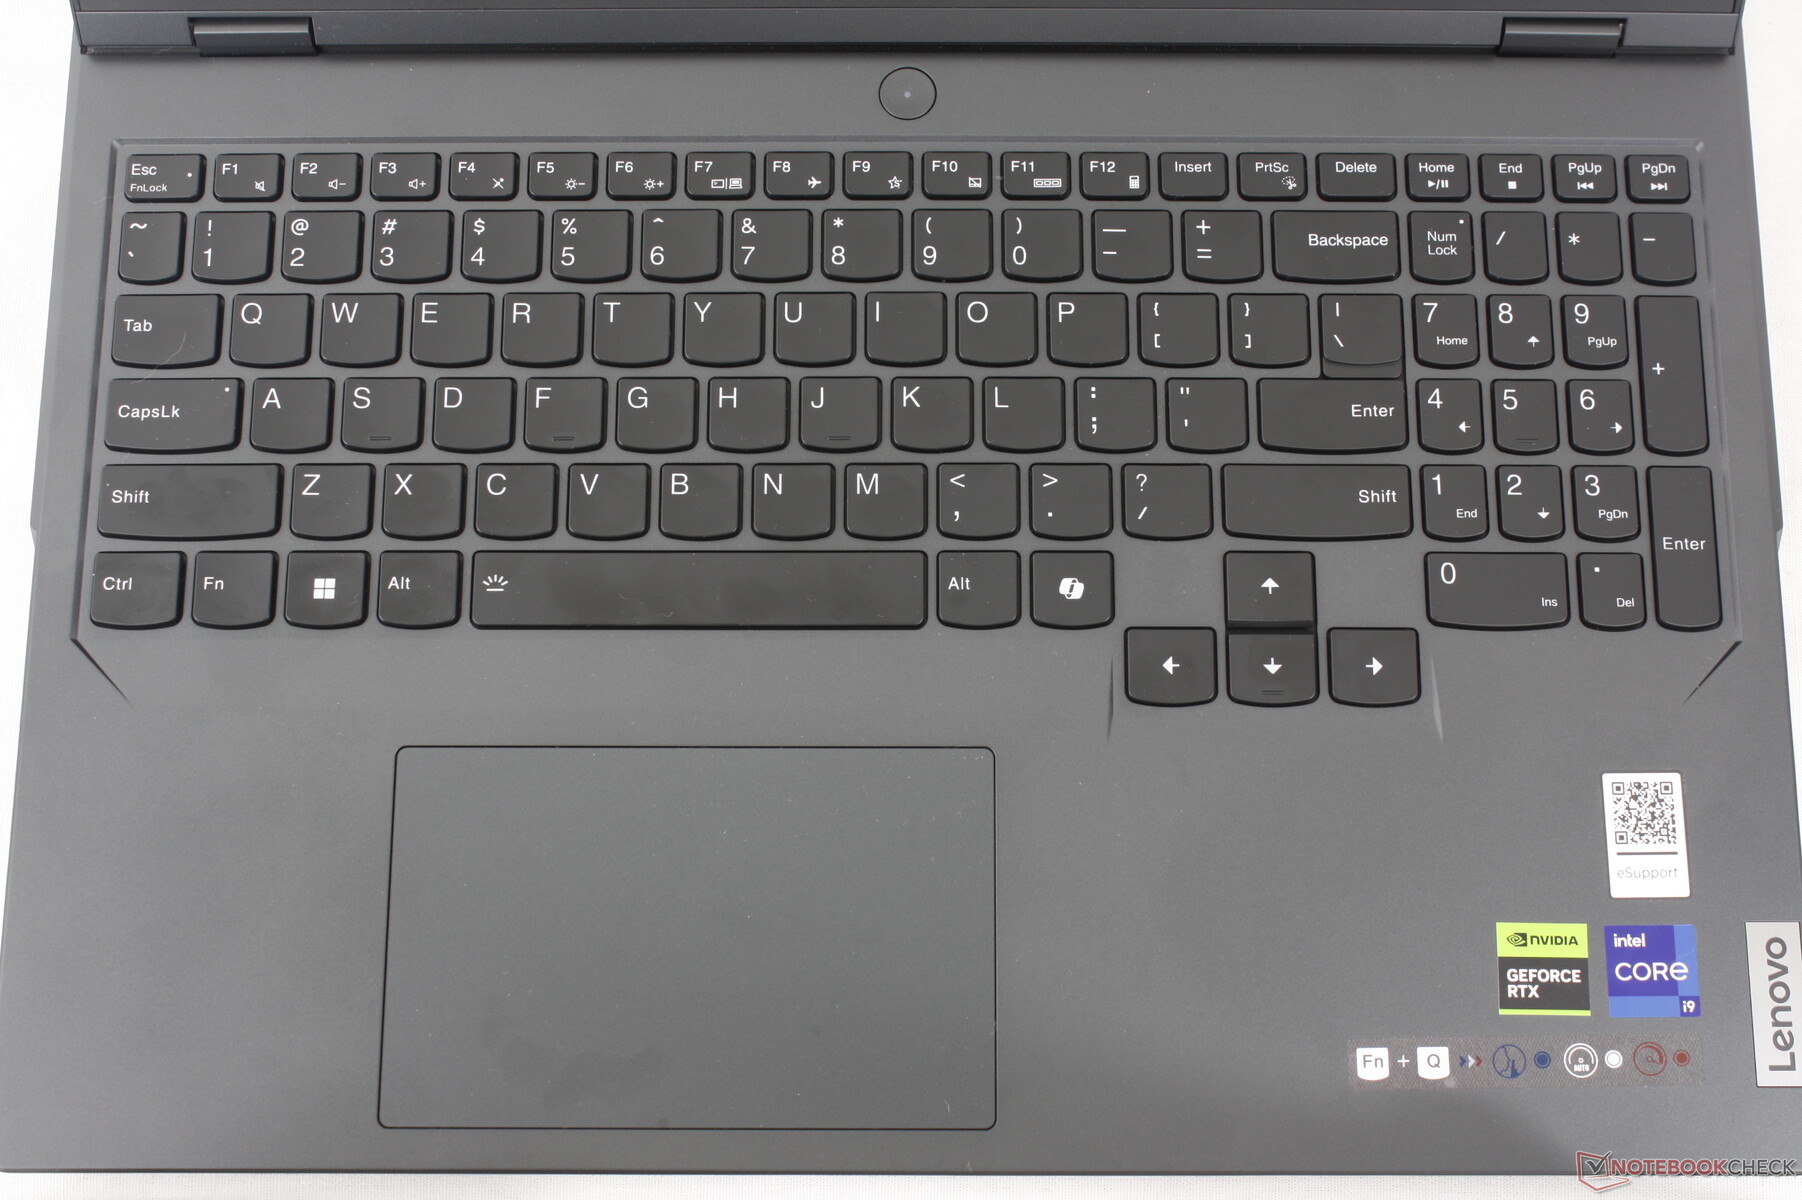
Much like on the recent Yoga Slim 7 14 G9, The Legion Pro 5 16 G9 has replaced the second Ctrl key with a dedicated Co-Pilot key. Microsoft is expected to launch a significant update for Windows this year revolving around AI and so the new key is Lenovo's way of future-proofing the laptop.
The typing experience is otherwise the same as on the Legion Pro 5 16 G8 as key sizes and symbols have not changed. Legion models continue to be one of the few gaming laptops with both a numpad and full-size arrow keys.
The keyboard backlight can be configured with either single-zone or quad-zone RGB. For per-key RGB lighting, users will have to consider the pricier Legion Pro 7 series instead.
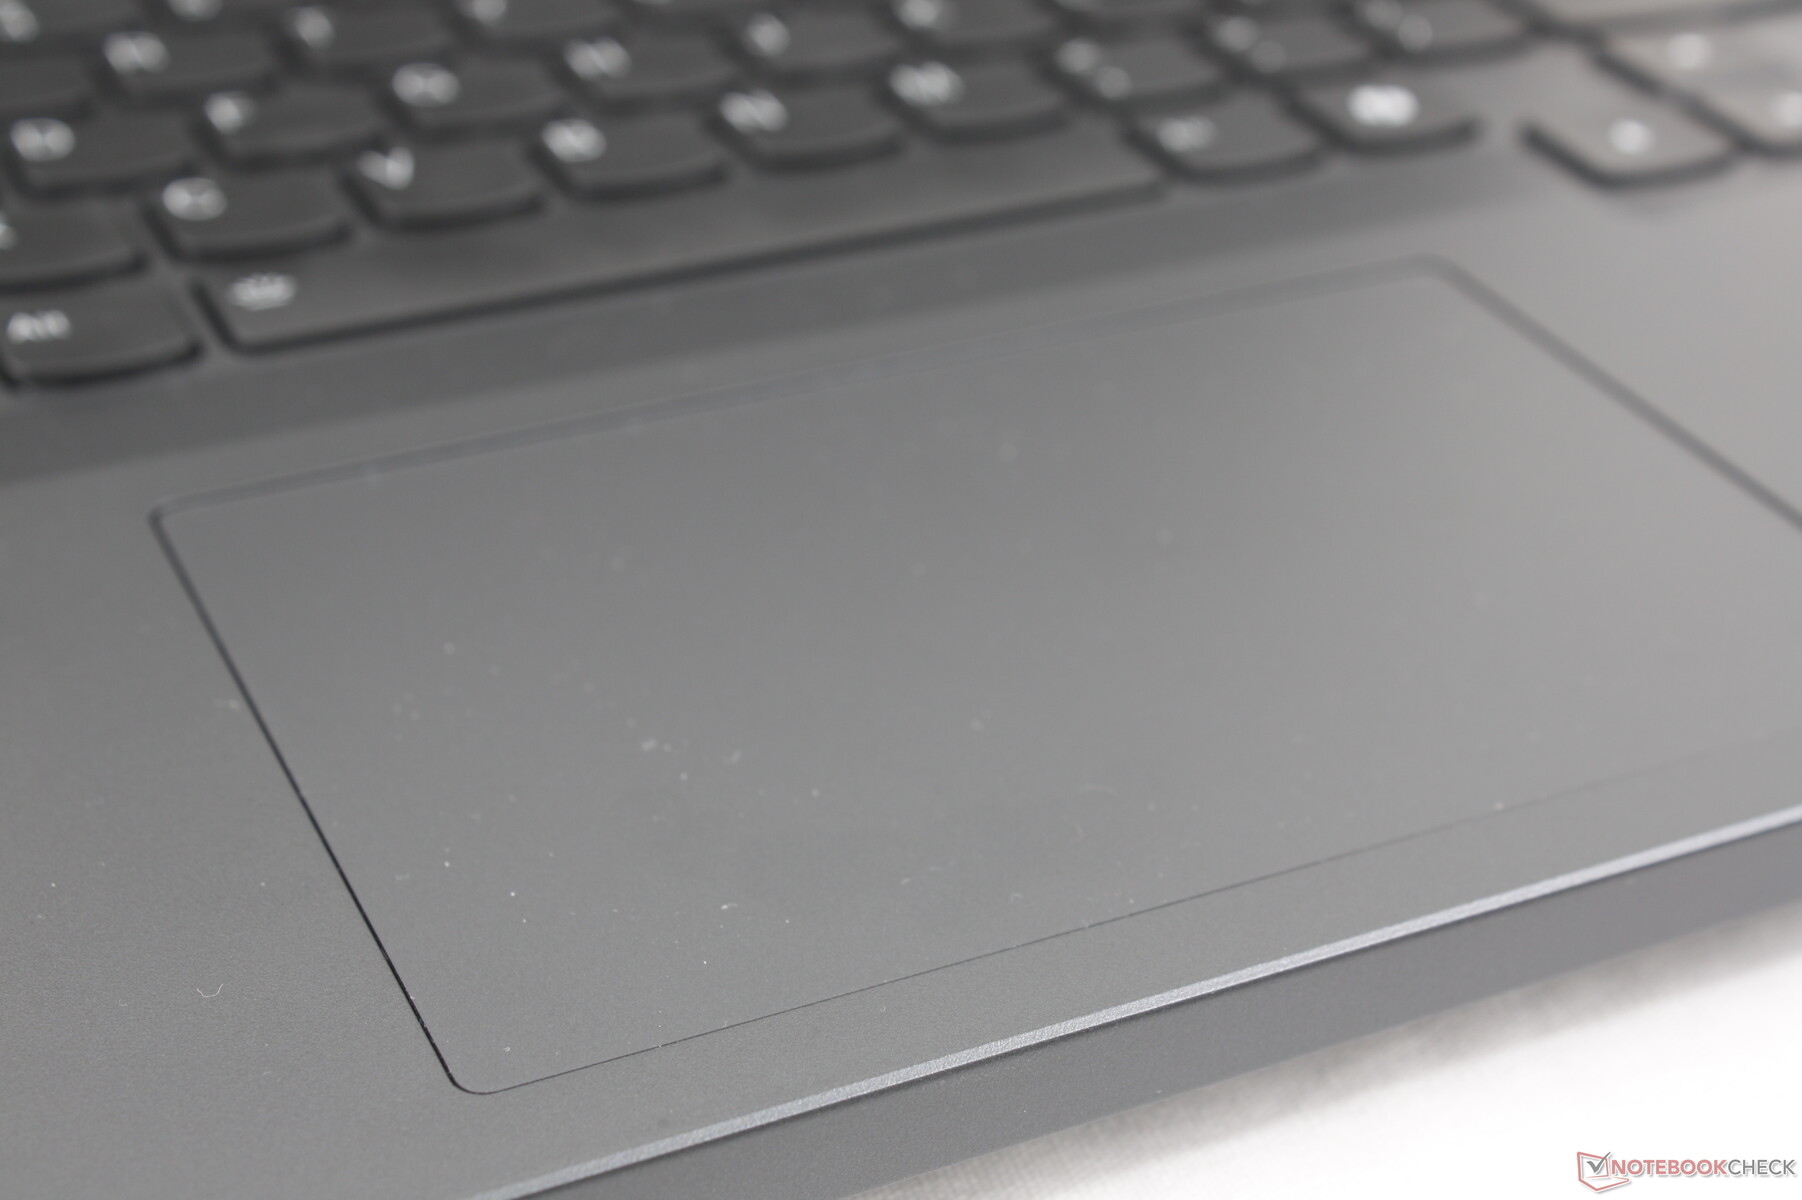
Touchpad
The Mylar clickpad is smaller than the one on the Razer Blade 16 (12 x 7.5 cm vs. 17 x 9.7 cm), but it's still spacious enough for simple tasks like browsing. Clicking continues to be shallow and with not enough feedback for an unsatisfyingly spongy feel.


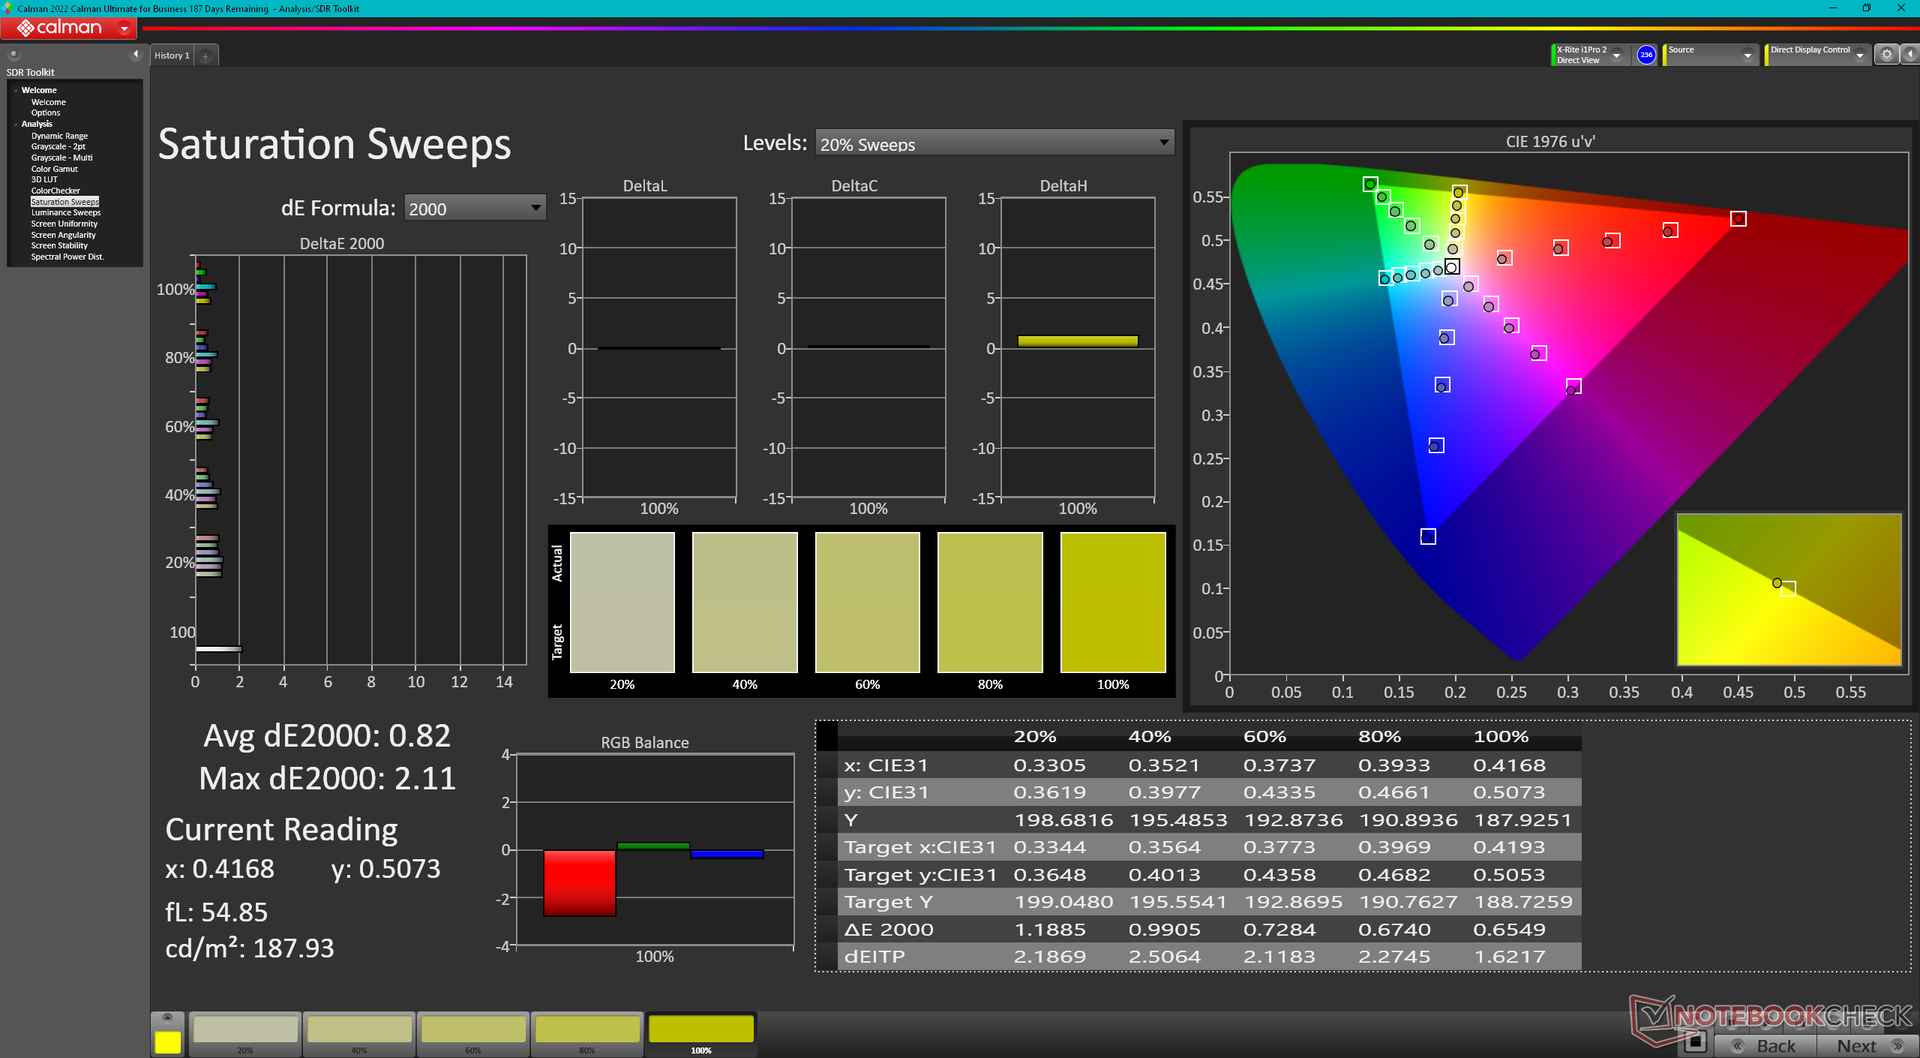
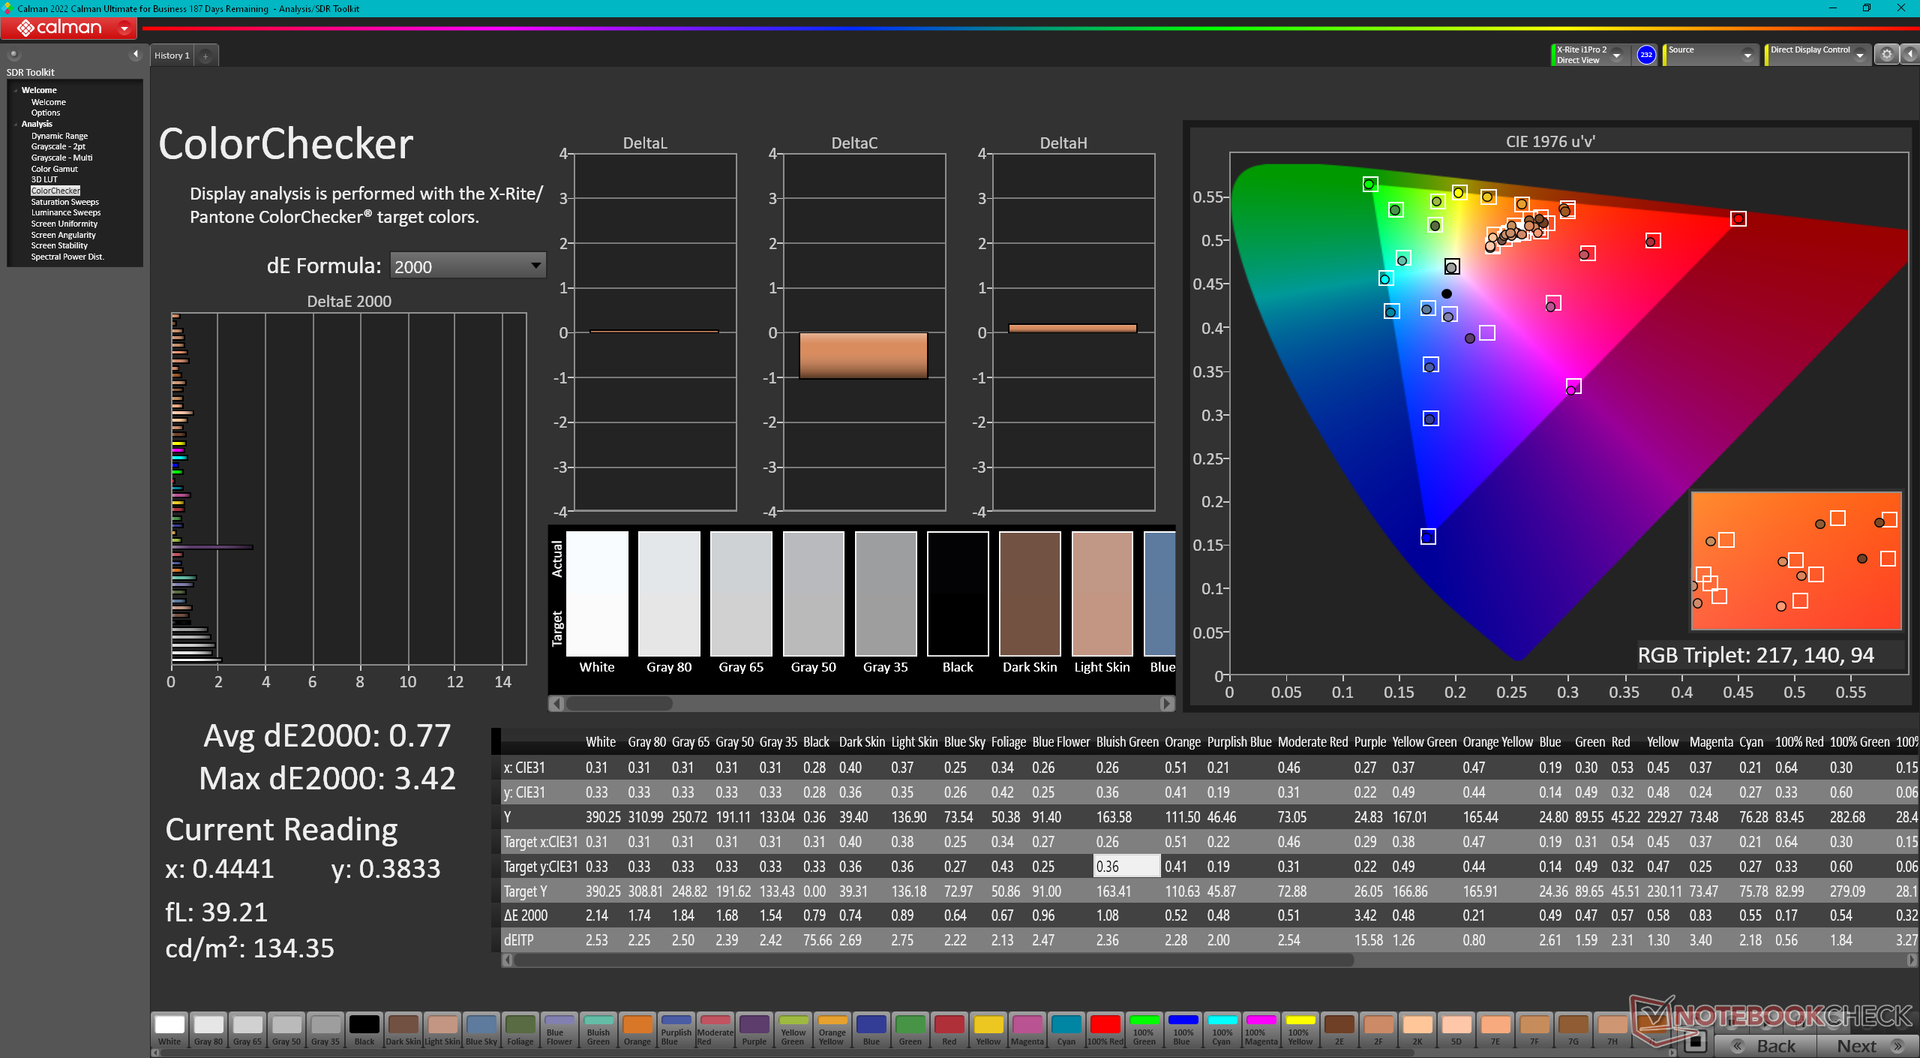
Display — Full sRGB And Fast Refresh Come Standard
Three display options are now available whereas last year's model was limited to only two. All are matte IPS with Advanced Optimus support, but only two support HDR. Our test unit comes with the panel highlighted below.
- 2560 x 1600, 300 nits, 100% sRGB, 165 Hz
- 2560 x 1600, 500 nits, 100% DCI-P3, 240 Hz, HDR400
- 2560 x 1600, 500 nits, 100% sRGB, 240 Hz, HDR400
Interestingly, our test unit utilizes the BOE NE160QDM-NYC whereas last year's model would come with the AU Optronics B160QAN03.1. Both otherwise offer the same 165 Hz refresh rate, fast black-white response times, and full sRGB colors for a similar viewing experience. While still an excellent panel for gaming and casual editing purposes, it lacks Windows variable refresh rate support which is a new feature on some other laptops like the Framework Laptop 16. Furthermore, HDR on IPS panels is not as impressive as HDR on OLED or mini-LED due to their deeper black levels and brighter whites. Users will instead have to upgrade to the pricier Legion Pro 9 series for such higher-end display features.


| |||||||||||||||||||||||||
Brightness Distribution: 91 %
Center on Battery: 384 cd/m²
Contrast: 1097:1 (Black: 0.35 cd/m²)
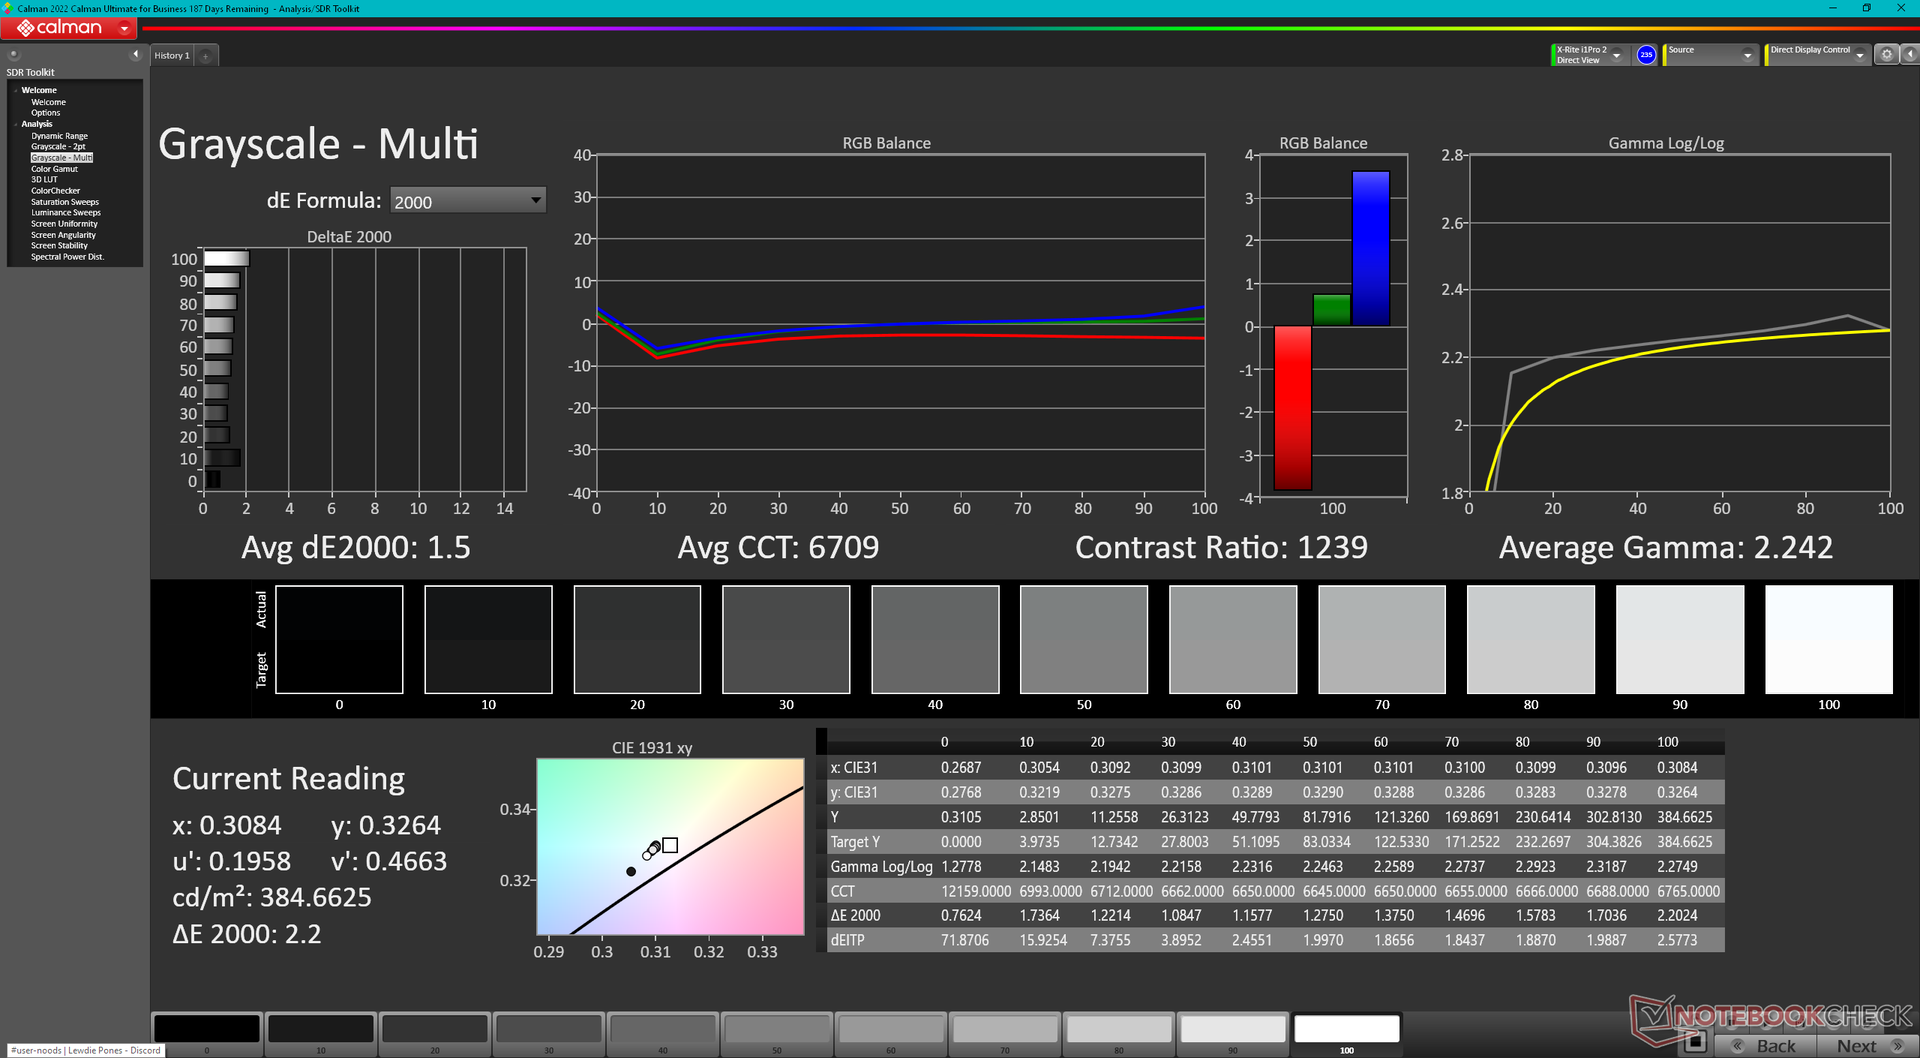
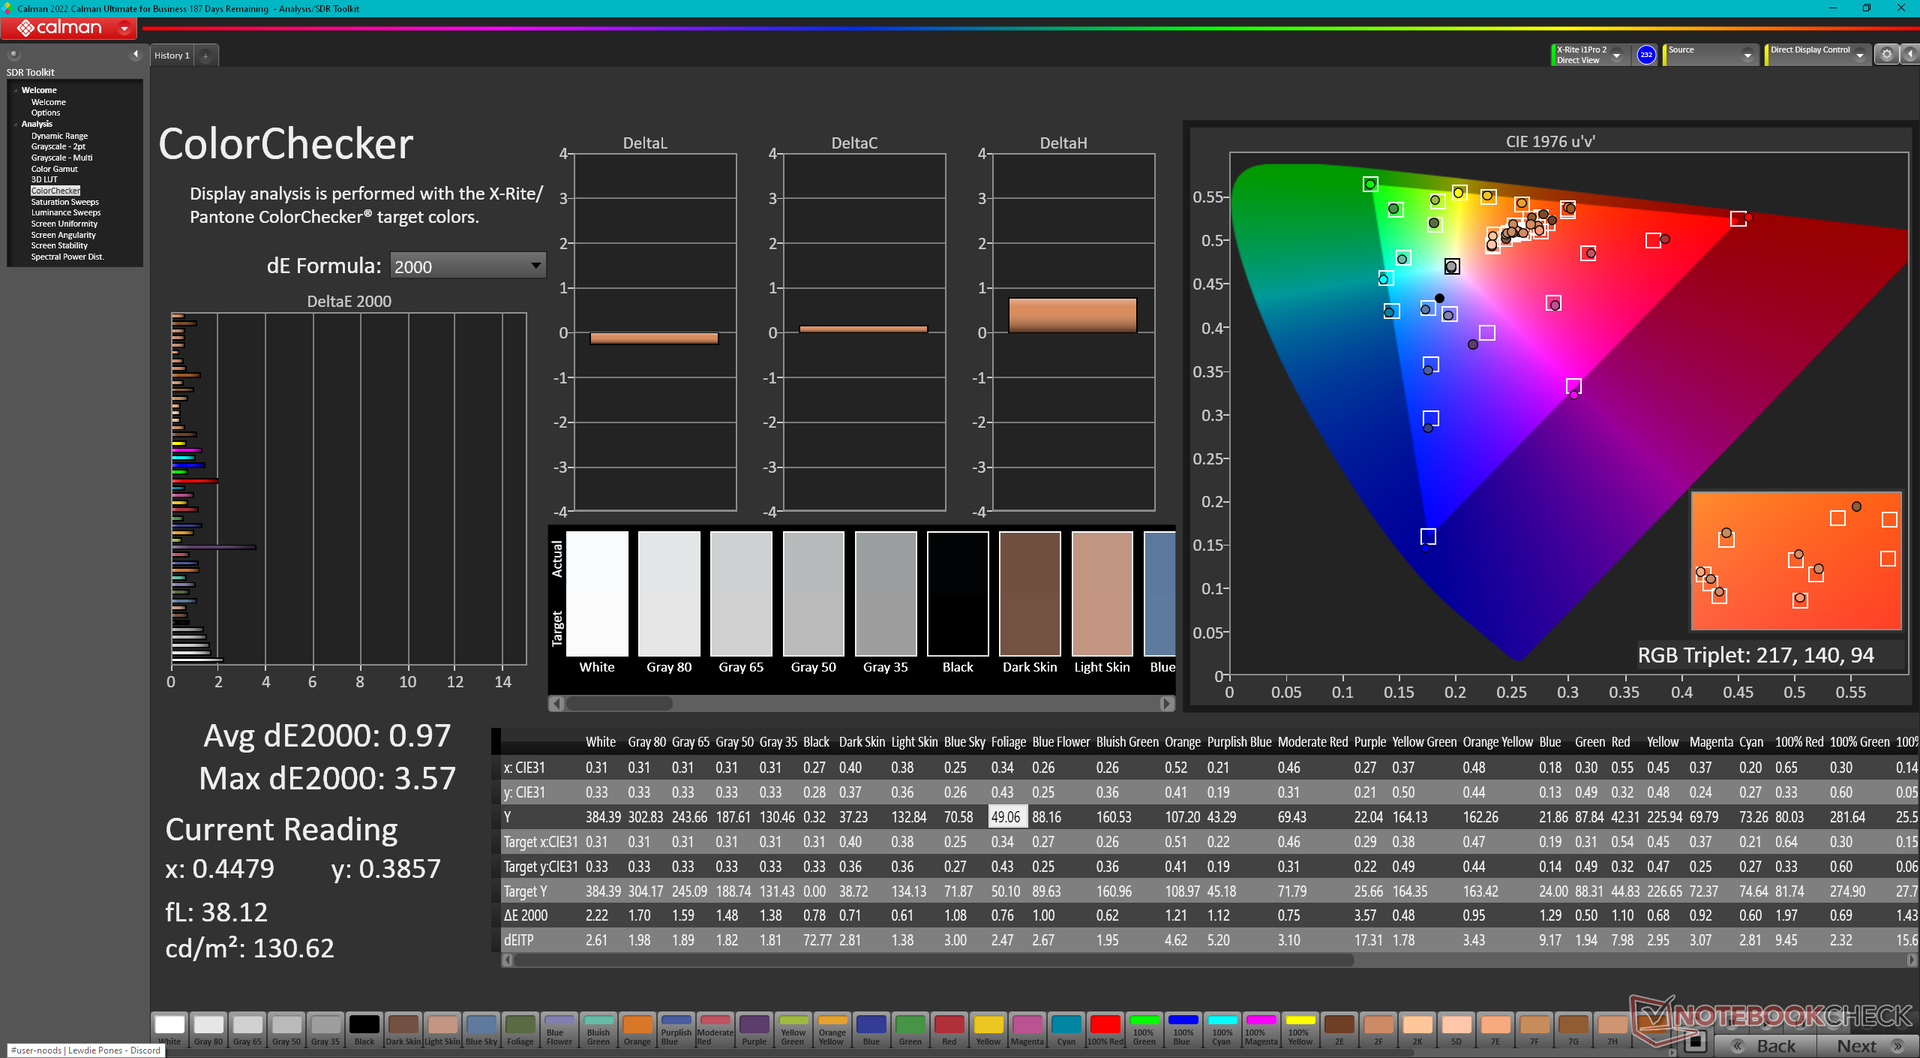
ΔE Color 0.97 | 0.5-29.43 Ø5, calibrated: 0.77
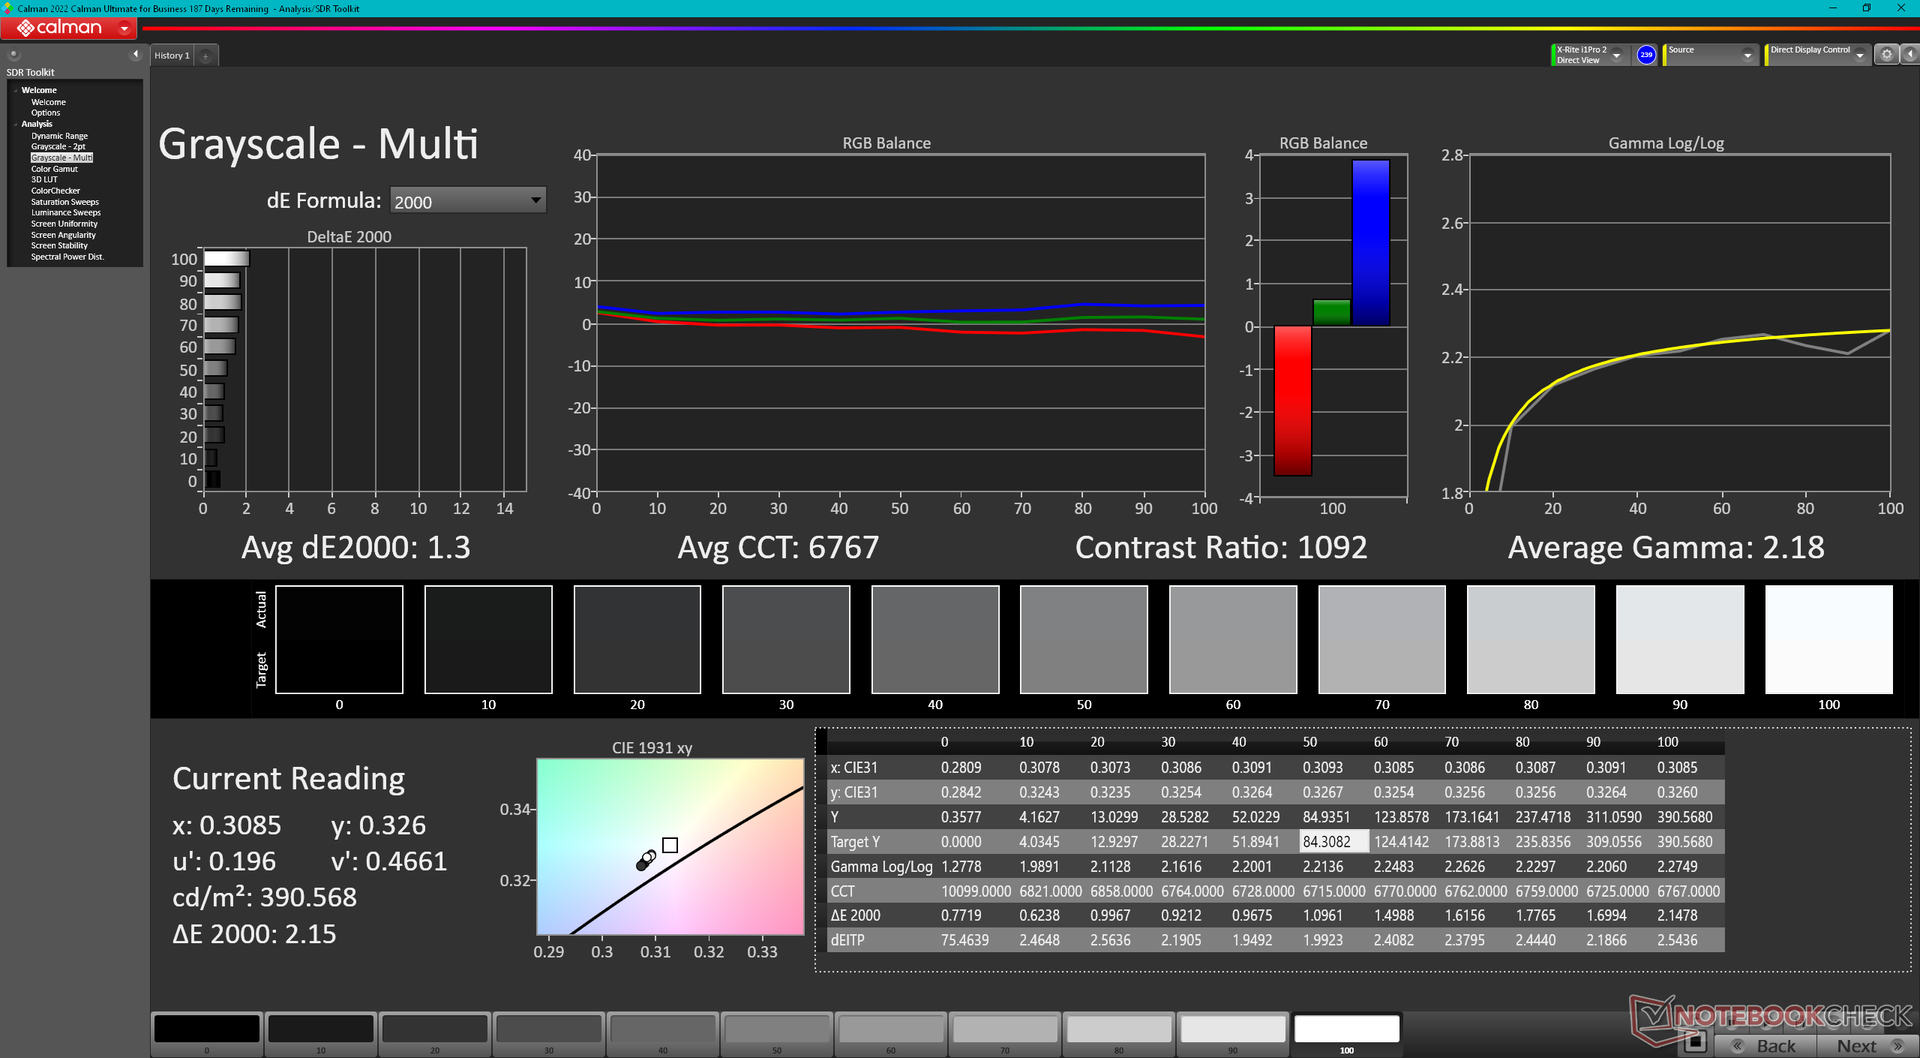
ΔE Greyscale 1.5 | 0.57-98 Ø5.3
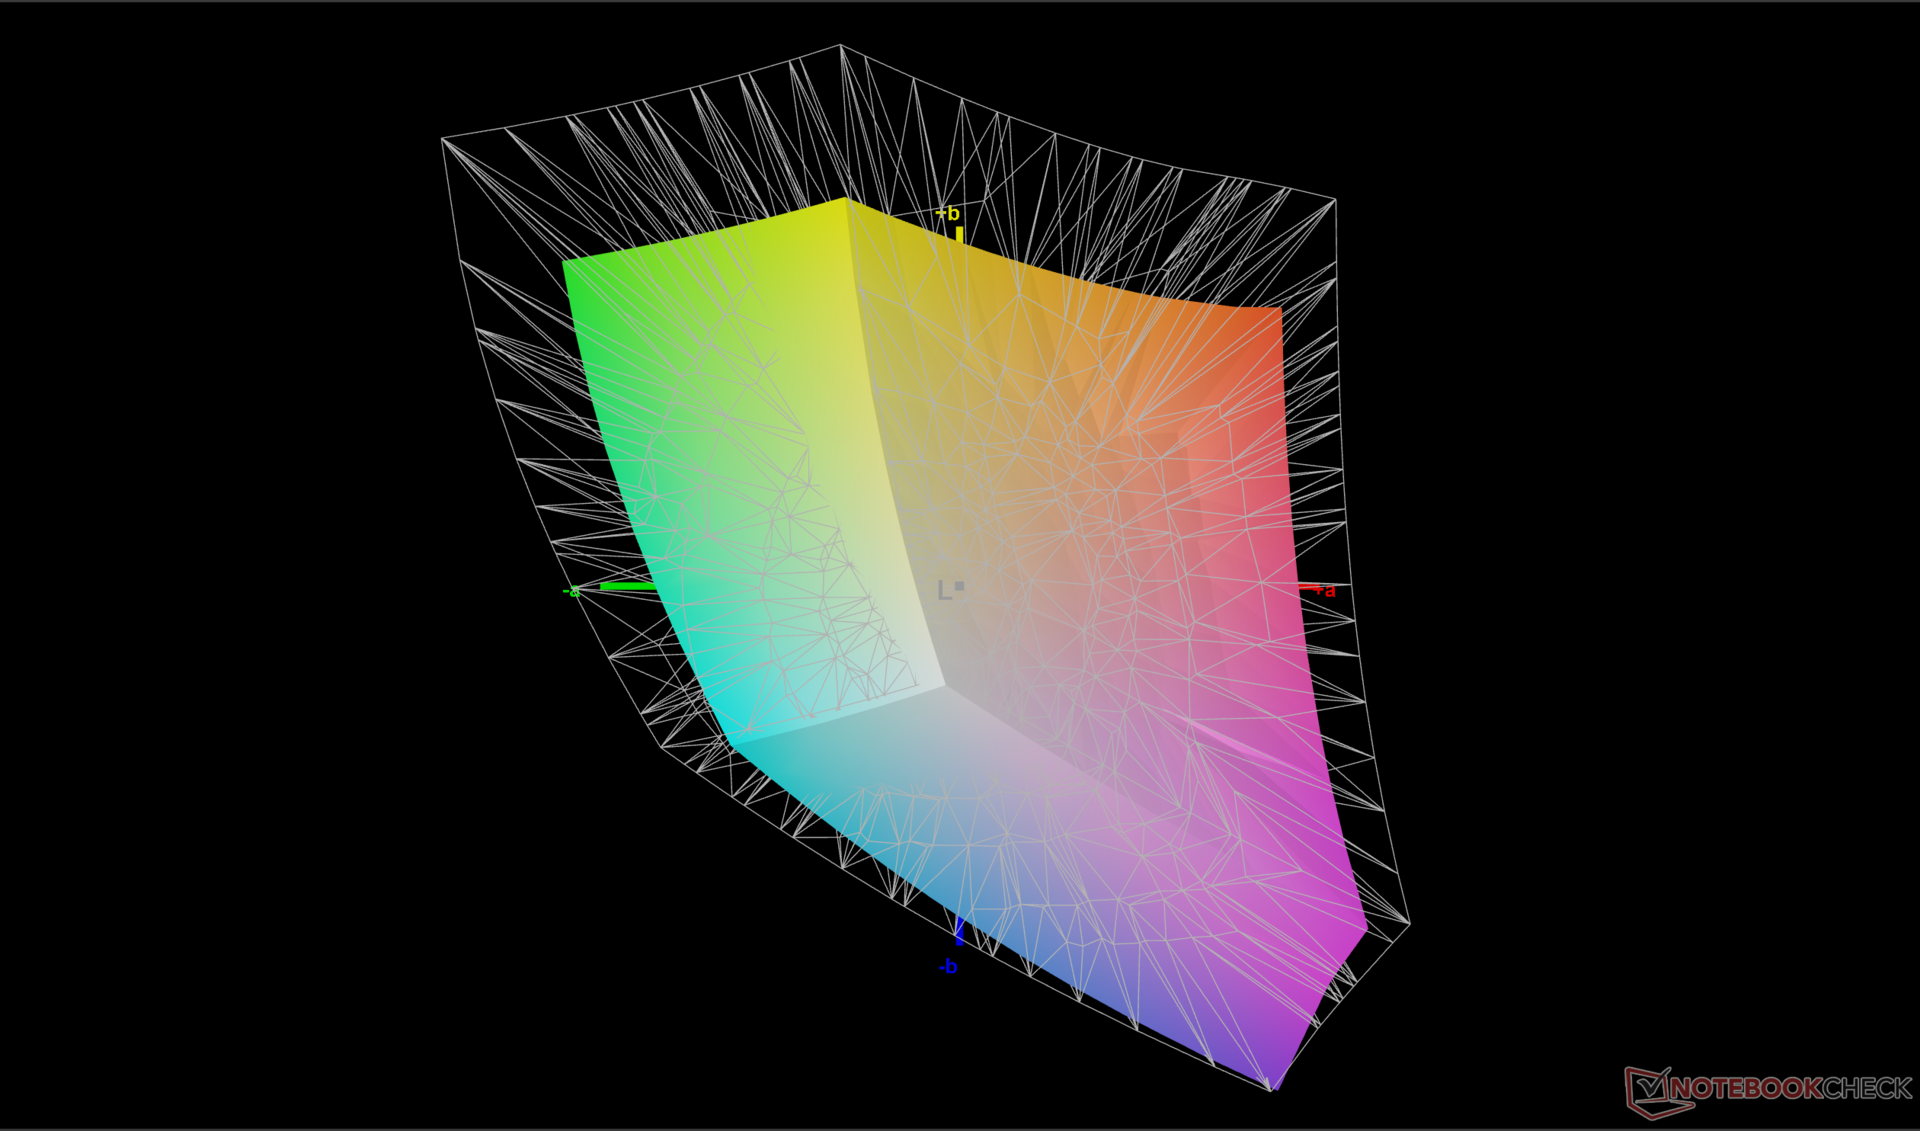
70.1% AdobeRGB 1998 (Argyll 2.2.0 3D)
99.4% sRGB (Argyll 2.2.0 3D)
69.3% Display P3 (Argyll 2.2.0 3D)
Gamma: 2.24
| Lenovo Legion Pro 5 16IRX9 BOE NE160QDM-NYC, IPS, 2560x1600, 16.00 | Lenovo Legion Pro 5 16IRX8 AU Optronics B160QAN03.1, IPS, 2560x1600, 16.00 | Alienware m16 R2 BOE NE16NYH, IPS, 2560x1600, 16.00 | HP Omen Transcend 16-u1095ng ATNA60DL02-0 (SDC41A4), OLED, 2560x1600, 16.00 | Asus ROG Zephyrus G16 2024 GU605M ATNA60DL01-0, OLED, 2560x1600, 16.00 | MSI Stealth 16 Mercedes-AMG Motorsport A13VG ATNA60YV09-0 (SDC4191), OLED, 3840x2400, 16.00 | |
|---|---|---|---|---|---|---|
| Display | 2% | 2% | 28% | 28% | 23% | |
| Display P3 Coverage | 69.3 | 71.2 3% | 71 2% | 99.8 44% | 99.9 44% | 99.2 43% |
| sRGB Coverage | 99.4 | 98.8 -1% | 100 1% | 100 1% | 100 1% | 99.9 1% |
| AdobeRGB 1998 Coverage | 70.1 | 73.3 5% | 71.4 2% | 97 38% | 96.9 38% | 88.4 26% |
| Response Times | -20% | 27% | 98% | 98% | 87% | |
| Response Time Grey 50% / Grey 80% * | 11.9 ? | 14.5 ? -22% | 5.7 ? 52% | 0.2 ? 98% | 0.22 ? 98% | 1.5 ? 87% |
| Response Time Black / White * | 8.9 ? | 10.4 ? -17% | 8.7 ? 2% | 0.2 ? 98% | 0.25 ? 97% | 1.2 ? 87% |
| PWM Frequency | 120 ? | 960 ? | 60 ? | |||
| Screen | -5% | -14% | 136% | -13% | 5% | |
| Brightness middle | 384 | 405.7 6% | 345.8 -10% | 390 2% | 416 8% | 382 -1% |
| Brightness | 366 | 368 1% | 337 -8% | 392 7% | 418 14% | 383 5% |
| Brightness Distribution | 91 | 87 -4% | 87 -4% | 98 8% | 96 5% | 96 5% |
| Black Level * | 0.35 | 0.38 -9% | 0.3 14% | 0.02 94% | ||
| Contrast | 1097 | 1068 -3% | 1153 5% | 19500 1678% | ||
| Colorchecker dE 2000 * | 0.97 | 1.65 -70% | 1.99 -105% | 1.94 -100% | 1.6 -65% | 0.84 13% |
| Colorchecker dE 2000 max. * | 3.57 | 4.2 -18% | 3.52 1% | 4.26 -19% | 2.1 41% | 3.39 5% |
| Colorchecker dE 2000 calibrated * | 0.77 | 0.53 31% | 0.62 19% | 4.21 -447% | 0.8 -4% | |
| Greyscale dE 2000 * | 1.5 | 1.2 20% | 2.1 -40% | 1.5 -0% | 2.7 -80% | 1.3 13% |
| Gamma | 2.24 98% | 2.3 96% | 2.32 95% | 2.221 99% | 2.16 102% | 2.166 102% |
| CCT | 6709 97% | 6453 101% | 6369 102% | 6395 102% | 6331 103% | 6550 99% |
| Total Average (Program / Settings) | -8% /
-6% | 5% /
-5% | 87% /
107% | 38% /
18% | 38% /
23% |
* ... smaller is better
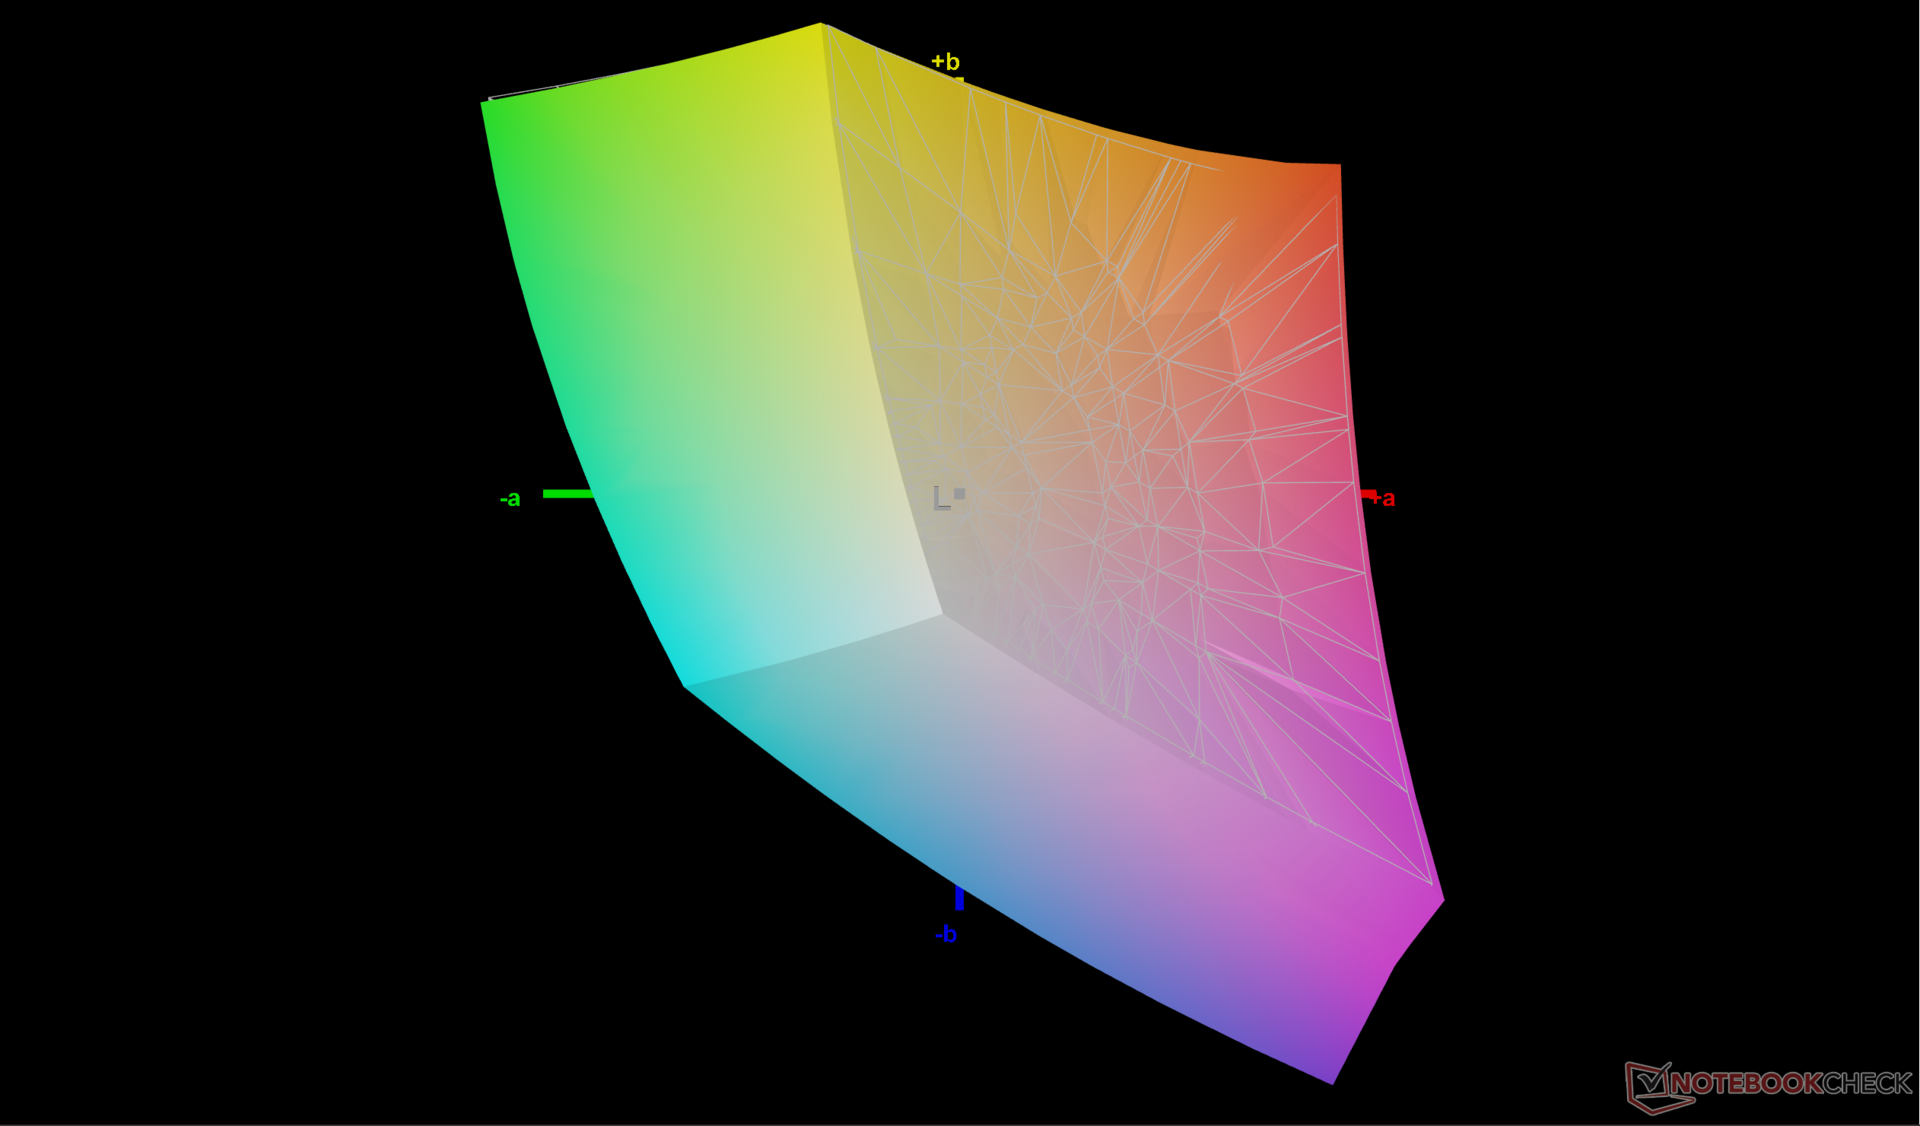
The display comes pre-calibrated out of the box with average grayscale and color deltaE values of just 1.5 and 0.97, respectively, which is surprising to see on a midrange gaming laptop. An end-user calibration is therefore not required for most users.

Display Response Times
| ↔ Response Time Black to White | ||
|---|---|---|
| 8.9 ms ... rise ↗ and fall ↘ combined | ↗ 4.8 ms rise |  |
| ↘ 4.1 ms fall | ||
| The screen shows fast response rates in our tests and should be suited for gaming. In comparison, all tested devices range from 0.1 (minimum) to 240 (maximum) ms. » 20 % of all devices are better. This means that the measured response time is better than the average of all tested devices (21.4 ms). | ||
| ↔ Response Time 50% Grey to 80% Grey | ||
| 11.9 ms ... rise ↗ and fall ↘ combined | ↗ 5.5 ms rise | 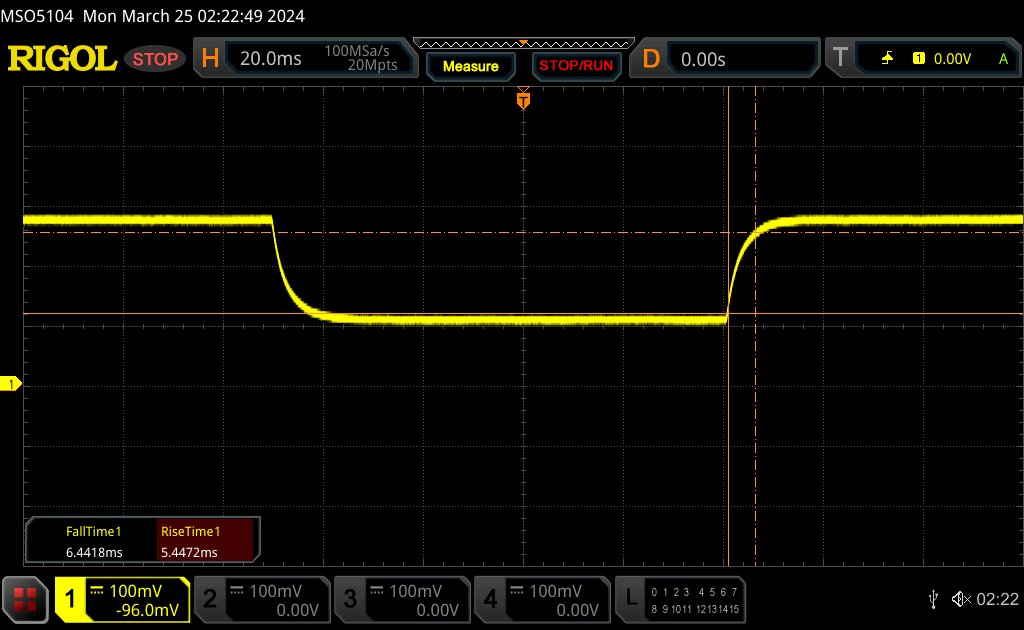 |
| ↘ 6.4 ms fall | ||
| The screen shows good response rates in our tests, but may be too slow for competitive gamers. In comparison, all tested devices range from 0.2 (minimum) to 636 (maximum) ms. » 20 % of all devices are better. This means that the measured response time is better than the average of all tested devices (33.7 ms). | ||
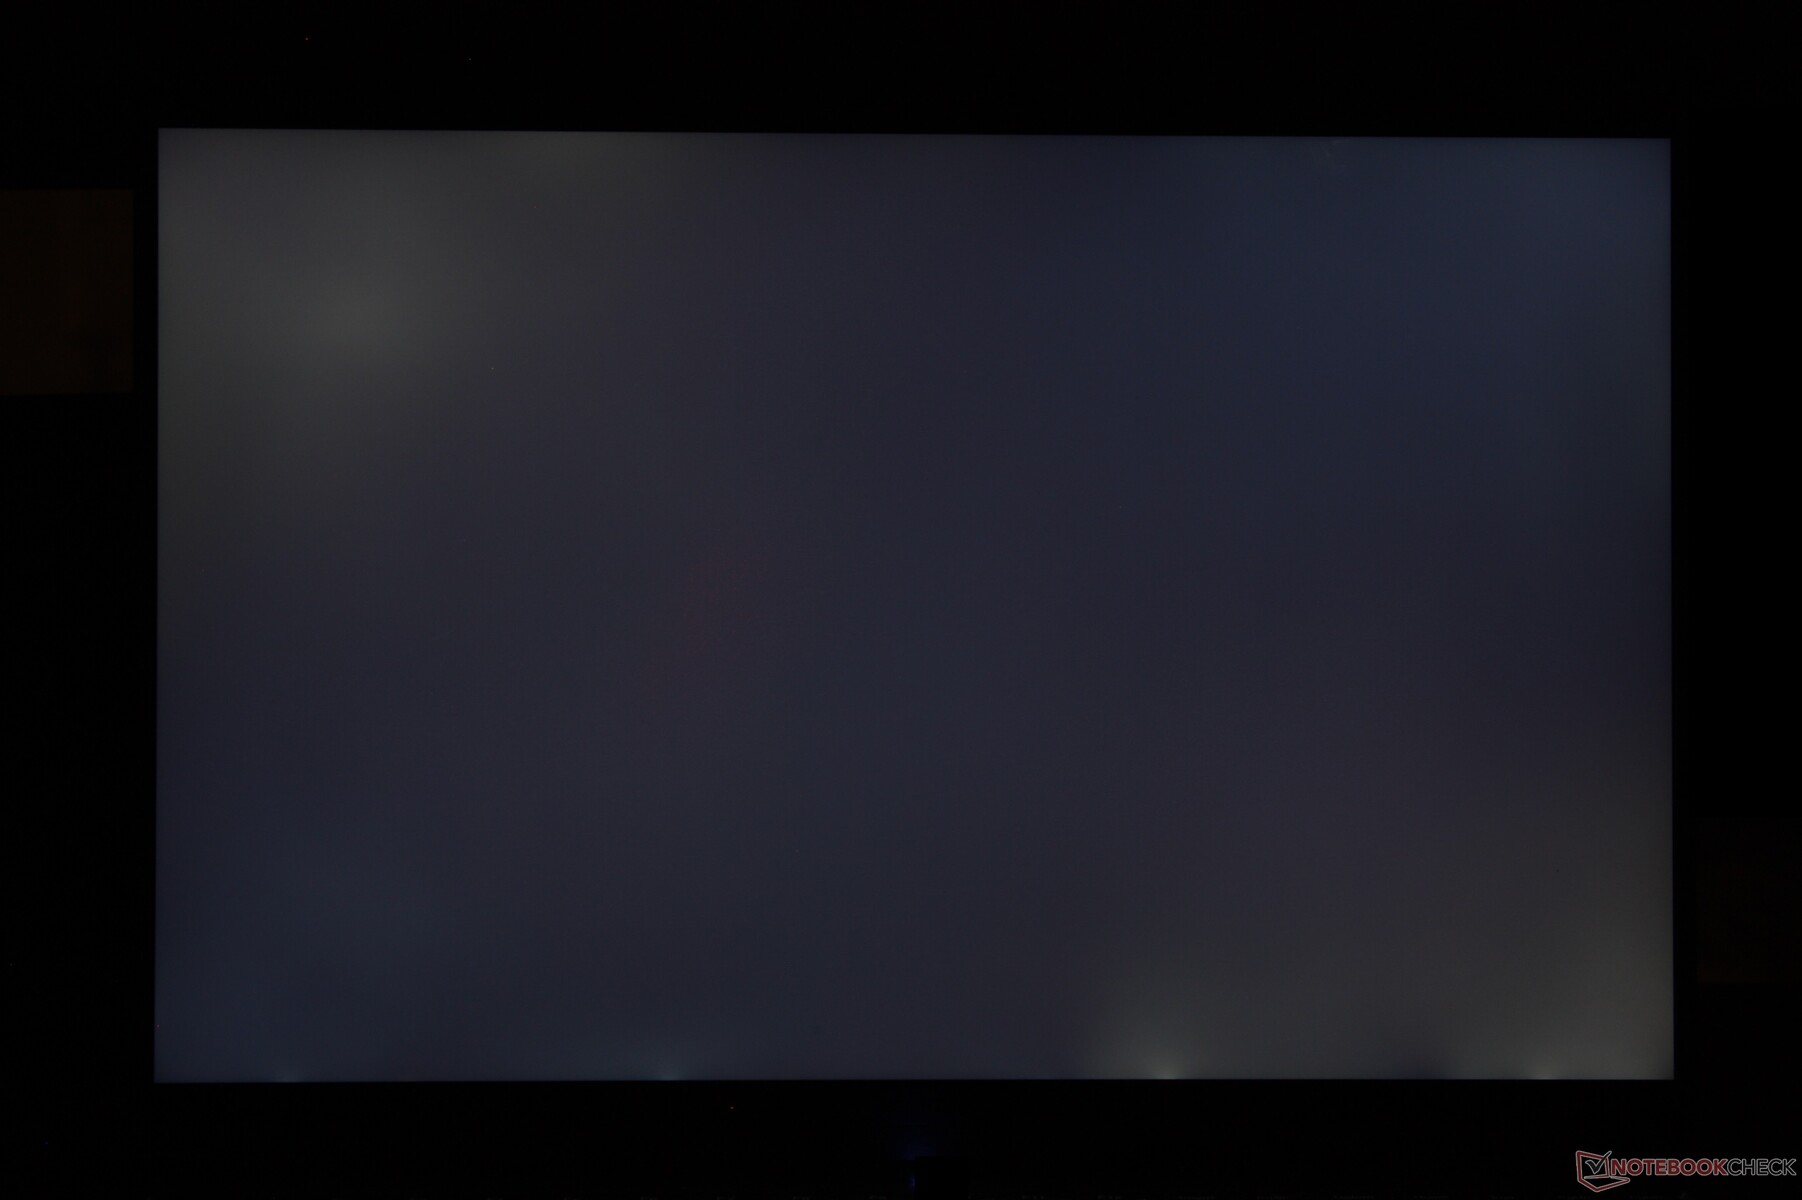
Screen Flickering / PWM (Pulse-Width Modulation)
| Screen flickering / PWM not detected | 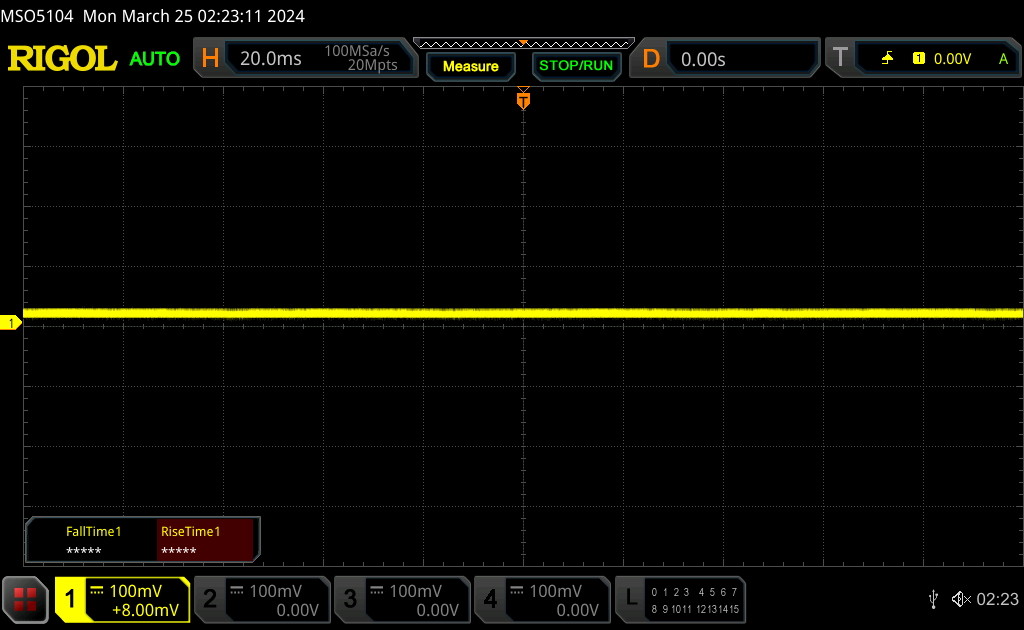 | ||
In comparison: 53 % of all tested devices do not use PWM to dim the display. If PWM was detected, an average of 17821 (minimum: 5 - maximum: 3846000) Hz was measured. | |||
Outdoor visibility hasn't changed much from last year's model since maximum brightness is about the same. While the model offers brighter panels, the increase isn't significant enough to make a noticeable difference outdoors.


Performance — Different Name, Same Performance


Testing Conditions
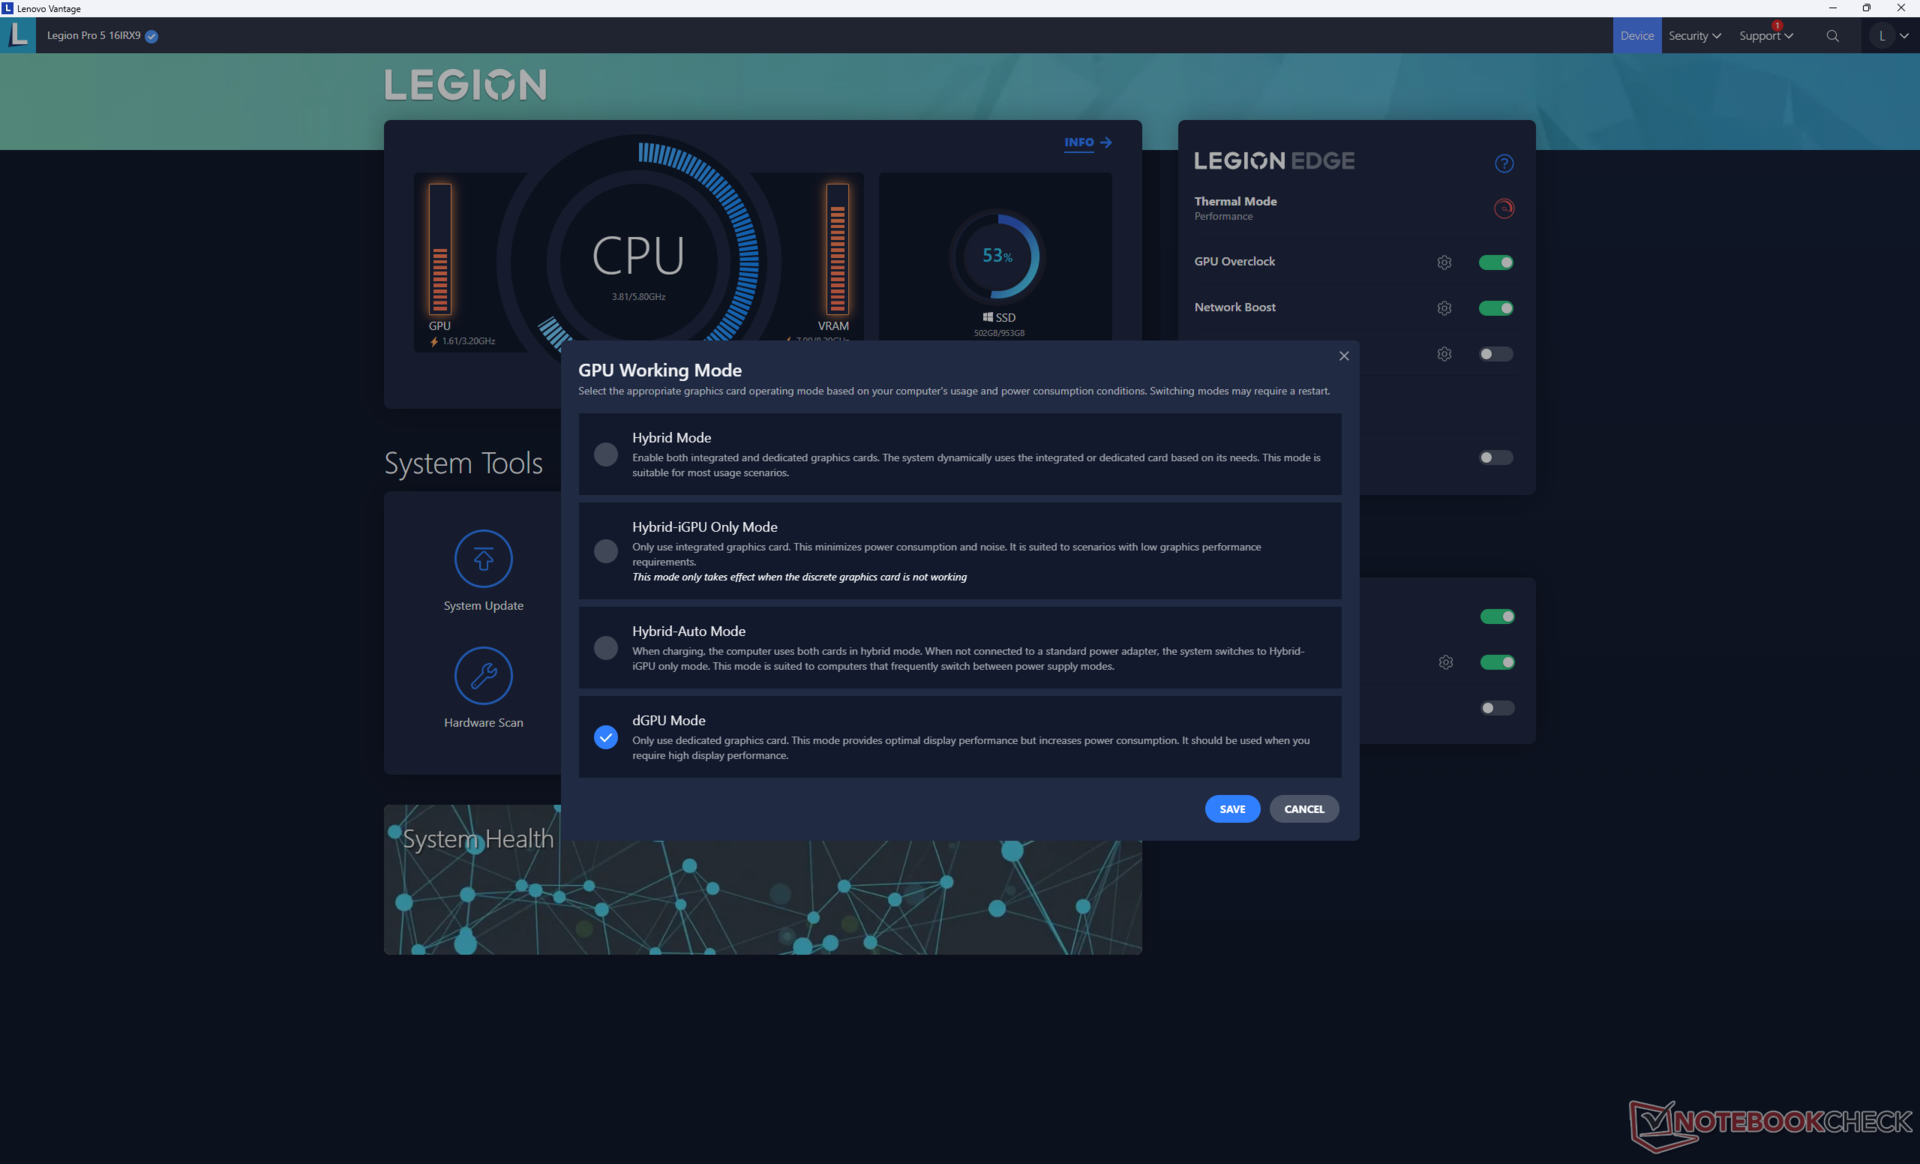
We set Lenovo Vantage to Performance mode, dGPU mode, and Windows to Performance mode prior to running the benchmarks below. GPU Overclock is also enabled by default to +100/+200 MHz clock/VRAM.
Advanced Optimus is supported. As usual, G-Sync is only active for the main display when set to dGPU mode.


Processor
CPU performance is excellent especially when compared to the HP Omen Transcend 16 which comes with the same Core i9-14900HX processor but is more heavily throttled. It also offers a very respectable performance boost of almost 50 percent over the Core i7-13700HX in our older Legion 5 Pro 16IRX8 test unit. Even so, overall performance is comparable to the less expensive Core i9-13900HX since the i9-14900HX is merely a rebrand.
Performance sustainability is good but not perfect. For example, performance would drop by about 6 percent over time when running CineBench R15 xT in a loop. The dip is thankfully not as severe as what we observed on the aforementioned HP laptop as shown by the graph below.
Downgrading to the i7-14700HX or i5-14500HX is expected to reduce performance by about 35 to 45 percent since these are also rebrands of the older i7-13700HX and i5-13500HX, respectively.
Cinebench R15 Multi Loop
Cinebench R23: Multi Core | Single Core
Cinebench R20: CPU (Multi Core) | CPU (Single Core)
Cinebench R15: CPU Multi 64Bit | CPU Single 64Bit
Blender: v2.79 BMW27 CPU
7-Zip 18.03: 7z b 4 | 7z b 4 -mmt1
Geekbench 6.2: Multi-Core | Single-Core
Geekbench 5.5: Multi-Core | Single-Core
HWBOT x265 Benchmark v2.2: 4k Preset
LibreOffice : 20 Documents To PDF
R Benchmark 2.5: Overall mean
* ... smaller is better
AIDA64: FP32 Ray-Trace | FPU Julia | CPU SHA3 | CPU Queen | FPU SinJulia | FPU Mandel | CPU AES | CPU ZLib | FP64 Ray-Trace | CPU PhotoWorxx
| Performance Rating | |
| Lenovo Legion Pro 5 16IRX9 | |
| Average Intel Core i9-14900HX | |
| Lenovo Legion Pro 5 16IRX8 | |
| HP Omen Transcend 16-u1095ng | |
| MSI Stealth 16 Mercedes-AMG Motorsport A13VG | |
| Alienware m16 R2 | |
| Asus ROG Zephyrus G16 2024 GU605M | |
| AIDA64 / FP32 Ray-Trace | |
| Average Intel Core i9-14900HX (17244 - 29351, n=22) | |
| Lenovo Legion Pro 5 16IRX9 | |
| Lenovo Legion Pro 5 16IRX8 | |
| MSI Stealth 16 Mercedes-AMG Motorsport A13VG | |
| Alienware m16 R2 | |
| HP Omen Transcend 16-u1095ng | |
| Asus ROG Zephyrus G16 2024 GU605M | |
| AIDA64 / FPU Julia | |
| Lenovo Legion Pro 5 16IRX9 | |
| Average Intel Core i9-14900HX (88537 - 148888, n=22) | |
| Lenovo Legion Pro 5 16IRX8 | |
| Alienware m16 R2 | |
| MSI Stealth 16 Mercedes-AMG Motorsport A13VG | |
| HP Omen Transcend 16-u1095ng | |
| Asus ROG Zephyrus G16 2024 GU605M | |
| AIDA64 / CPU SHA3 | |
| Lenovo Legion Pro 5 16IRX9 | |
| Average Intel Core i9-14900HX (4267 - 7229, n=22) | |
| Lenovo Legion Pro 5 16IRX8 | |
| HP Omen Transcend 16-u1095ng | |
| Alienware m16 R2 | |
| MSI Stealth 16 Mercedes-AMG Motorsport A13VG | |
| Asus ROG Zephyrus G16 2024 GU605M | |
| AIDA64 / CPU Queen | |
| Lenovo Legion Pro 5 16IRX9 | |
| Average Intel Core i9-14900HX (118405 - 148773, n=22) | |
| HP Omen Transcend 16-u1095ng | |
| MSI Stealth 16 Mercedes-AMG Motorsport A13VG | |
| Lenovo Legion Pro 5 16IRX8 | |
| Asus ROG Zephyrus G16 2024 GU605M | |
| Alienware m16 R2 | |
| AIDA64 / FPU SinJulia | |
| Lenovo Legion Pro 5 16IRX9 | |
| Average Intel Core i9-14900HX (12217 - 18256, n=22) | |
| Lenovo Legion Pro 5 16IRX8 | |
| HP Omen Transcend 16-u1095ng | |
| MSI Stealth 16 Mercedes-AMG Motorsport A13VG | |
| Asus ROG Zephyrus G16 2024 GU605M | |
| Alienware m16 R2 | |
| AIDA64 / FPU Mandel | |
| Lenovo Legion Pro 5 16IRX9 | |
| Average Intel Core i9-14900HX (43302 - 72594, n=22) | |
| Lenovo Legion Pro 5 16IRX8 | |
| Alienware m16 R2 | |
| MSI Stealth 16 Mercedes-AMG Motorsport A13VG | |
| HP Omen Transcend 16-u1095ng | |
| Asus ROG Zephyrus G16 2024 GU605M | |
| AIDA64 / CPU ZLib | |
| Lenovo Legion Pro 5 16IRX9 | |
| Average Intel Core i9-14900HX (1265 - 2149, n=22) | |
| Lenovo Legion Pro 5 16IRX8 | |
| HP Omen Transcend 16-u1095ng | |
| Alienware m16 R2 | |
| MSI Stealth 16 Mercedes-AMG Motorsport A13VG | |
| Asus ROG Zephyrus G16 2024 GU605M | |
| AIDA64 / FP64 Ray-Trace | |
| Lenovo Legion Pro 5 16IRX9 | |
| Average Intel Core i9-14900HX (9170 - 16128, n=22) | |
| Lenovo Legion Pro 5 16IRX8 | |
| MSI Stealth 16 Mercedes-AMG Motorsport A13VG | |
| Alienware m16 R2 | |
| HP Omen Transcend 16-u1095ng | |
| Asus ROG Zephyrus G16 2024 GU605M | |
| AIDA64 / CPU PhotoWorxx | |
| Lenovo Legion Pro 5 16IRX9 | |
| HP Omen Transcend 16-u1095ng | |
| Asus ROG Zephyrus G16 2024 GU605M | |
| Average Intel Core i9-14900HX (33960 - 51118, n=22) | |
| MSI Stealth 16 Mercedes-AMG Motorsport A13VG | |
| Alienware m16 R2 | |
| Lenovo Legion Pro 5 16IRX8 | |
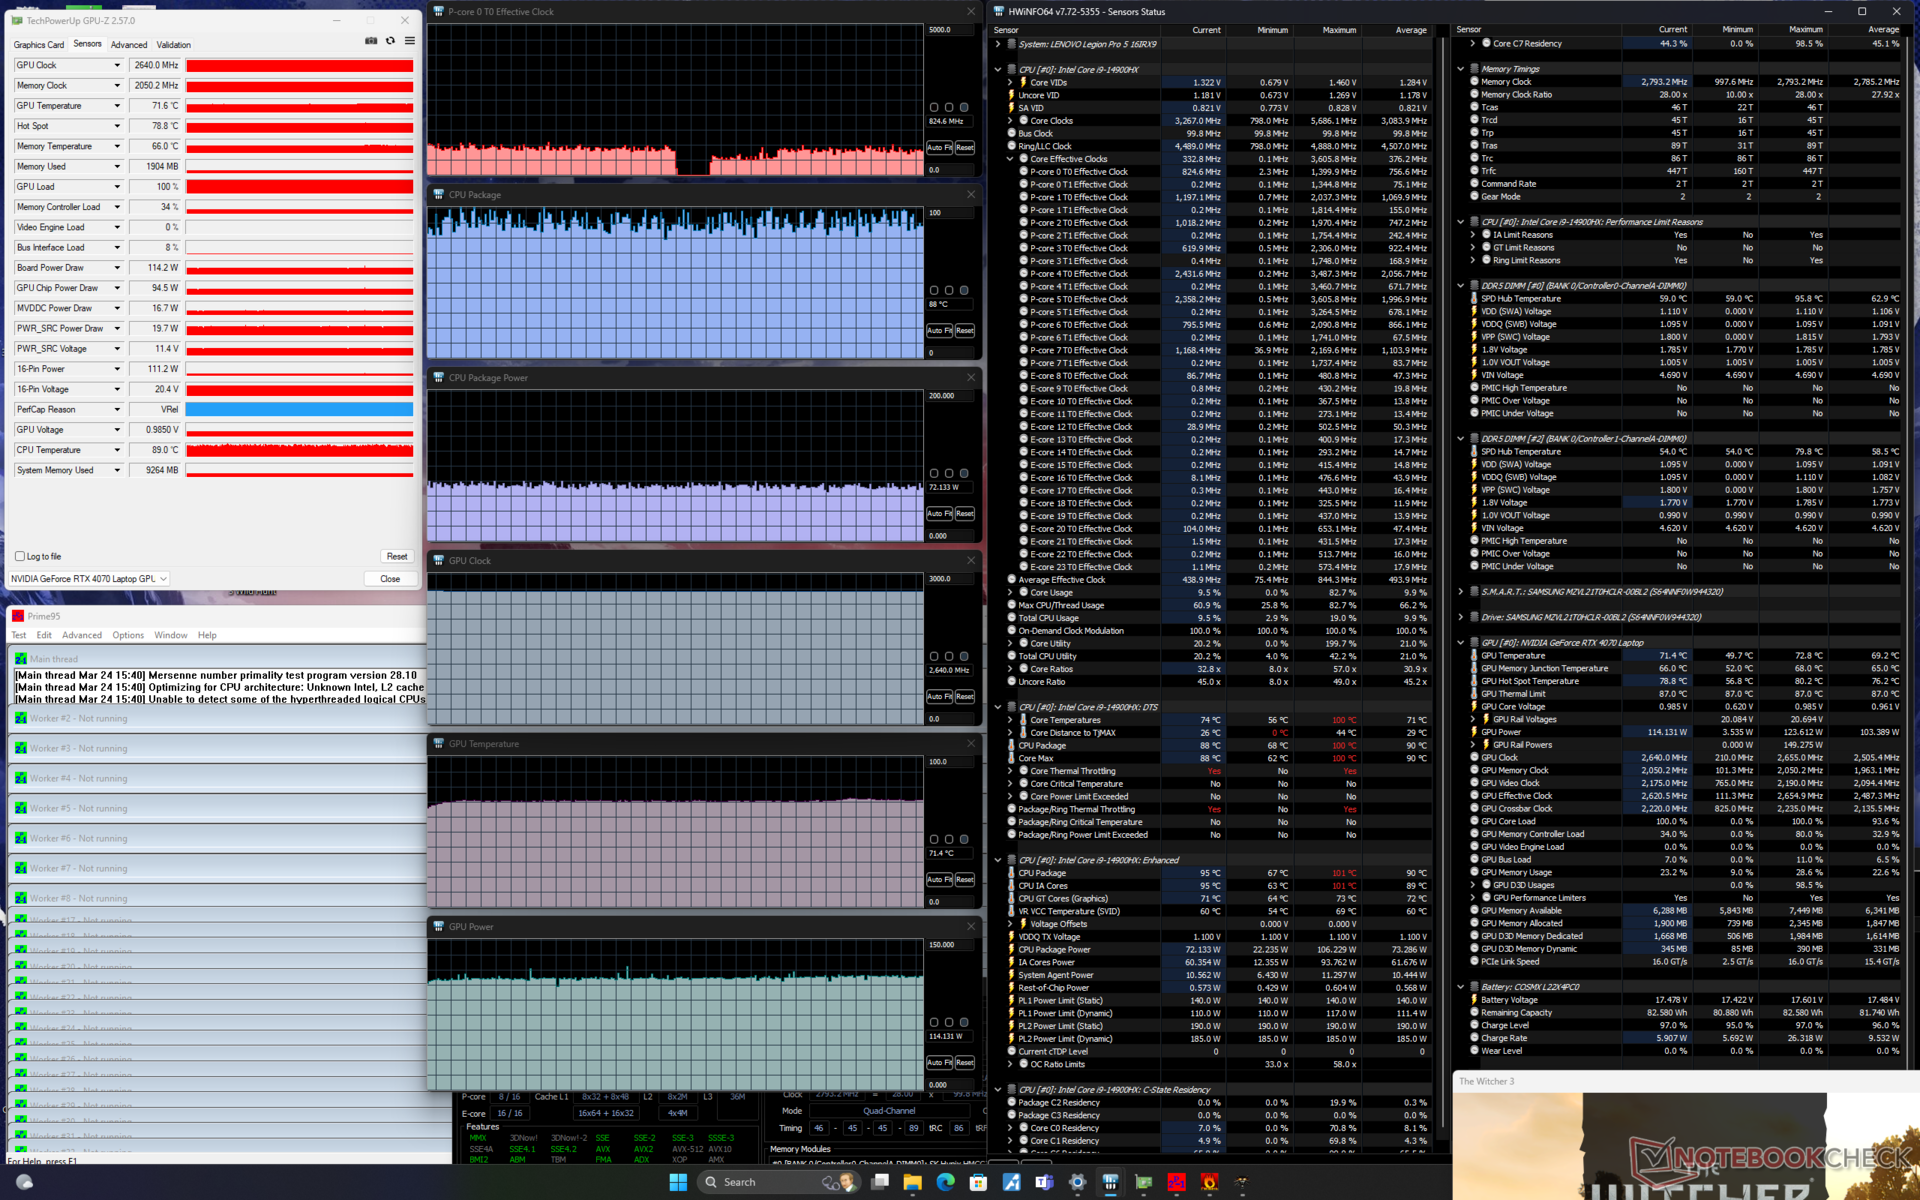
Stress Test

The CPU would boost to 4 GHz and 187 W when running Prime95 stress. Once core temperature reaches 97 C a few seconds later, however, the CPU would quickly stabilize at 2.8 GHz and 104 W in order to maintain a more manageable core temperature of 89 C. Though slightly warmer than on last year's model, it is at least cooler than on the Alienware m16 R2 with the slower Core Ultra 7 CPU under similar conditions.
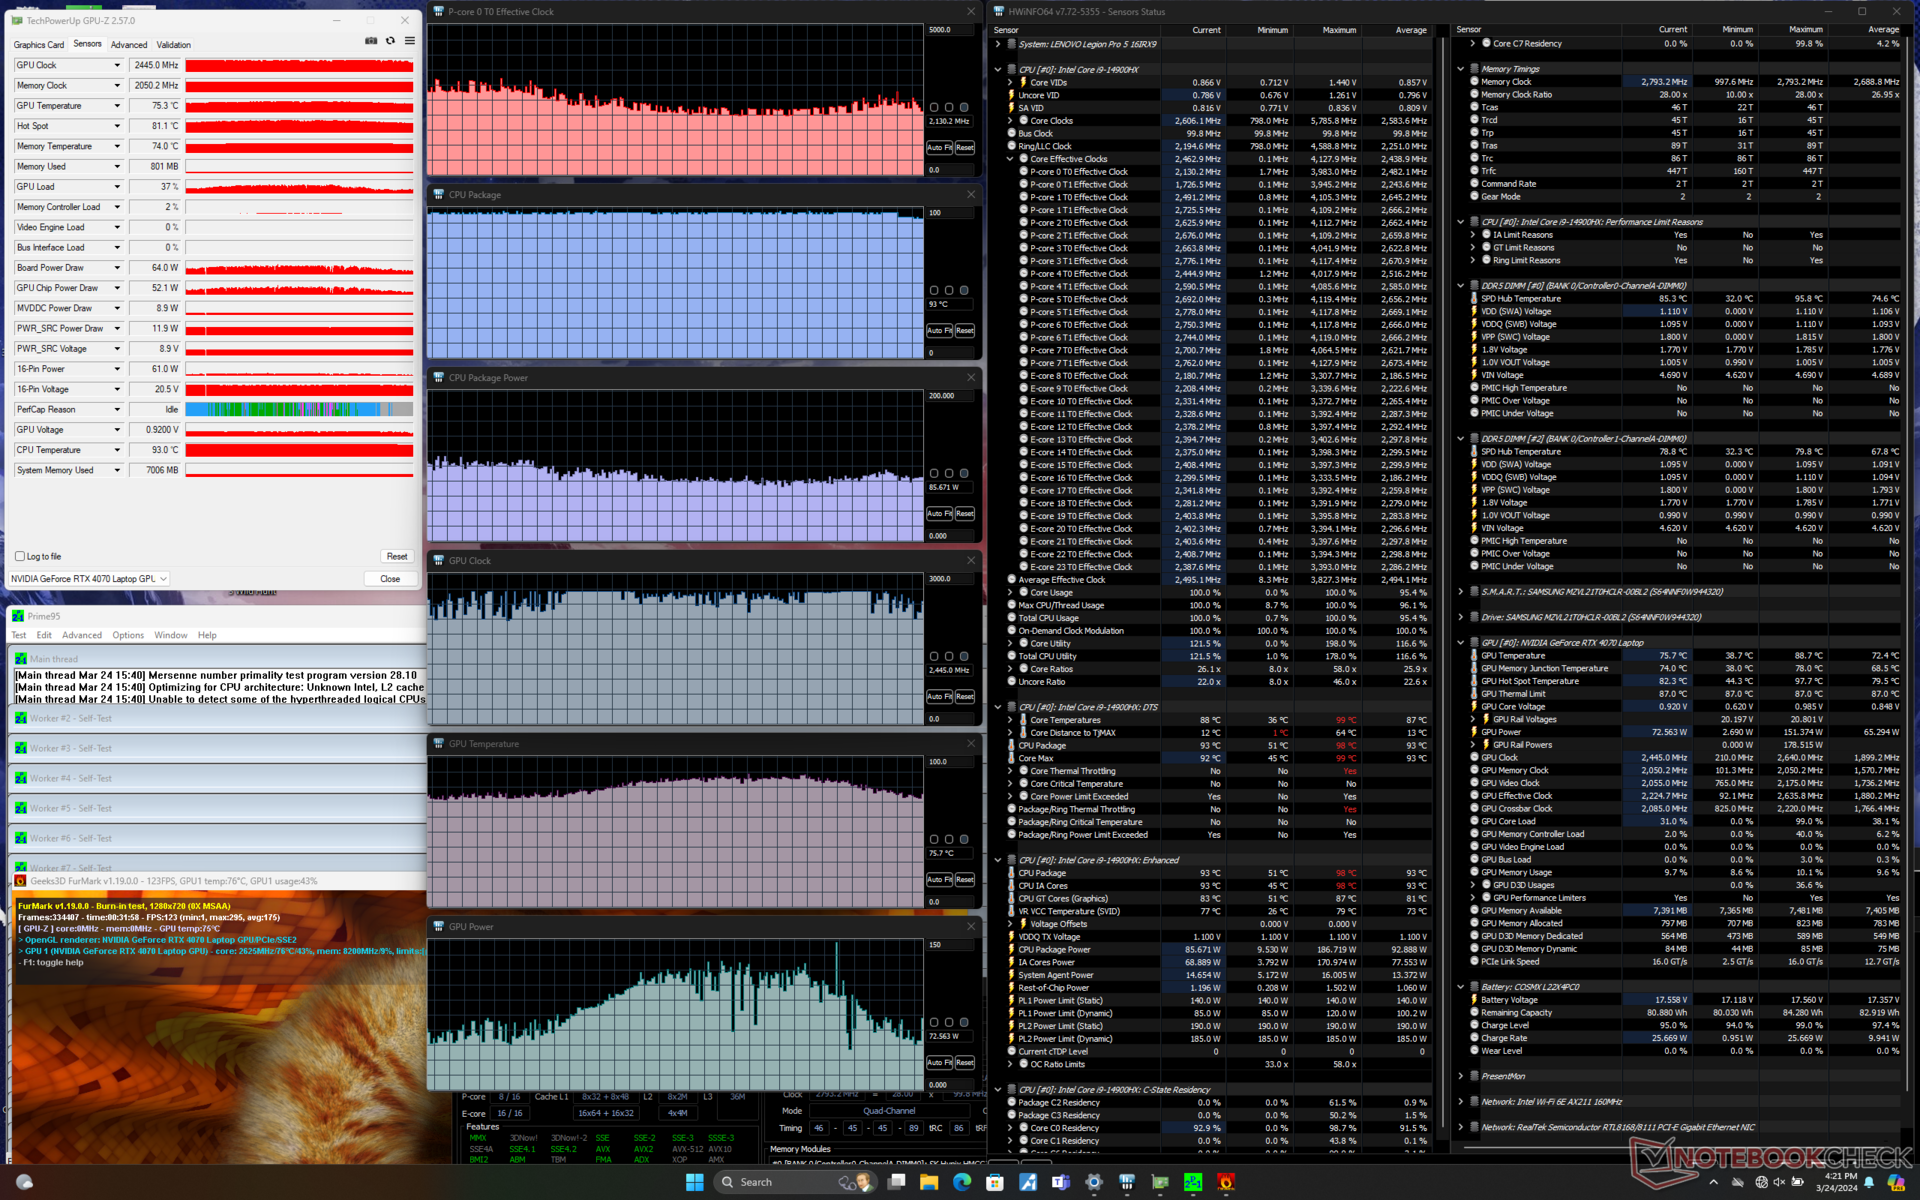
Graphics performance is reduced when switching from Performance mode to Balanced mode as noted in the GPU Performance section below. GPU board power draw and clock rate on Performance mode would drop from 114 W and 2640 MHz, respectively, to 2280 MHz and 77 W on Balanced mode. On the other hand, core temperatures are notably cooler by about 10 C when running on Balanced mode since overall performance is slower.
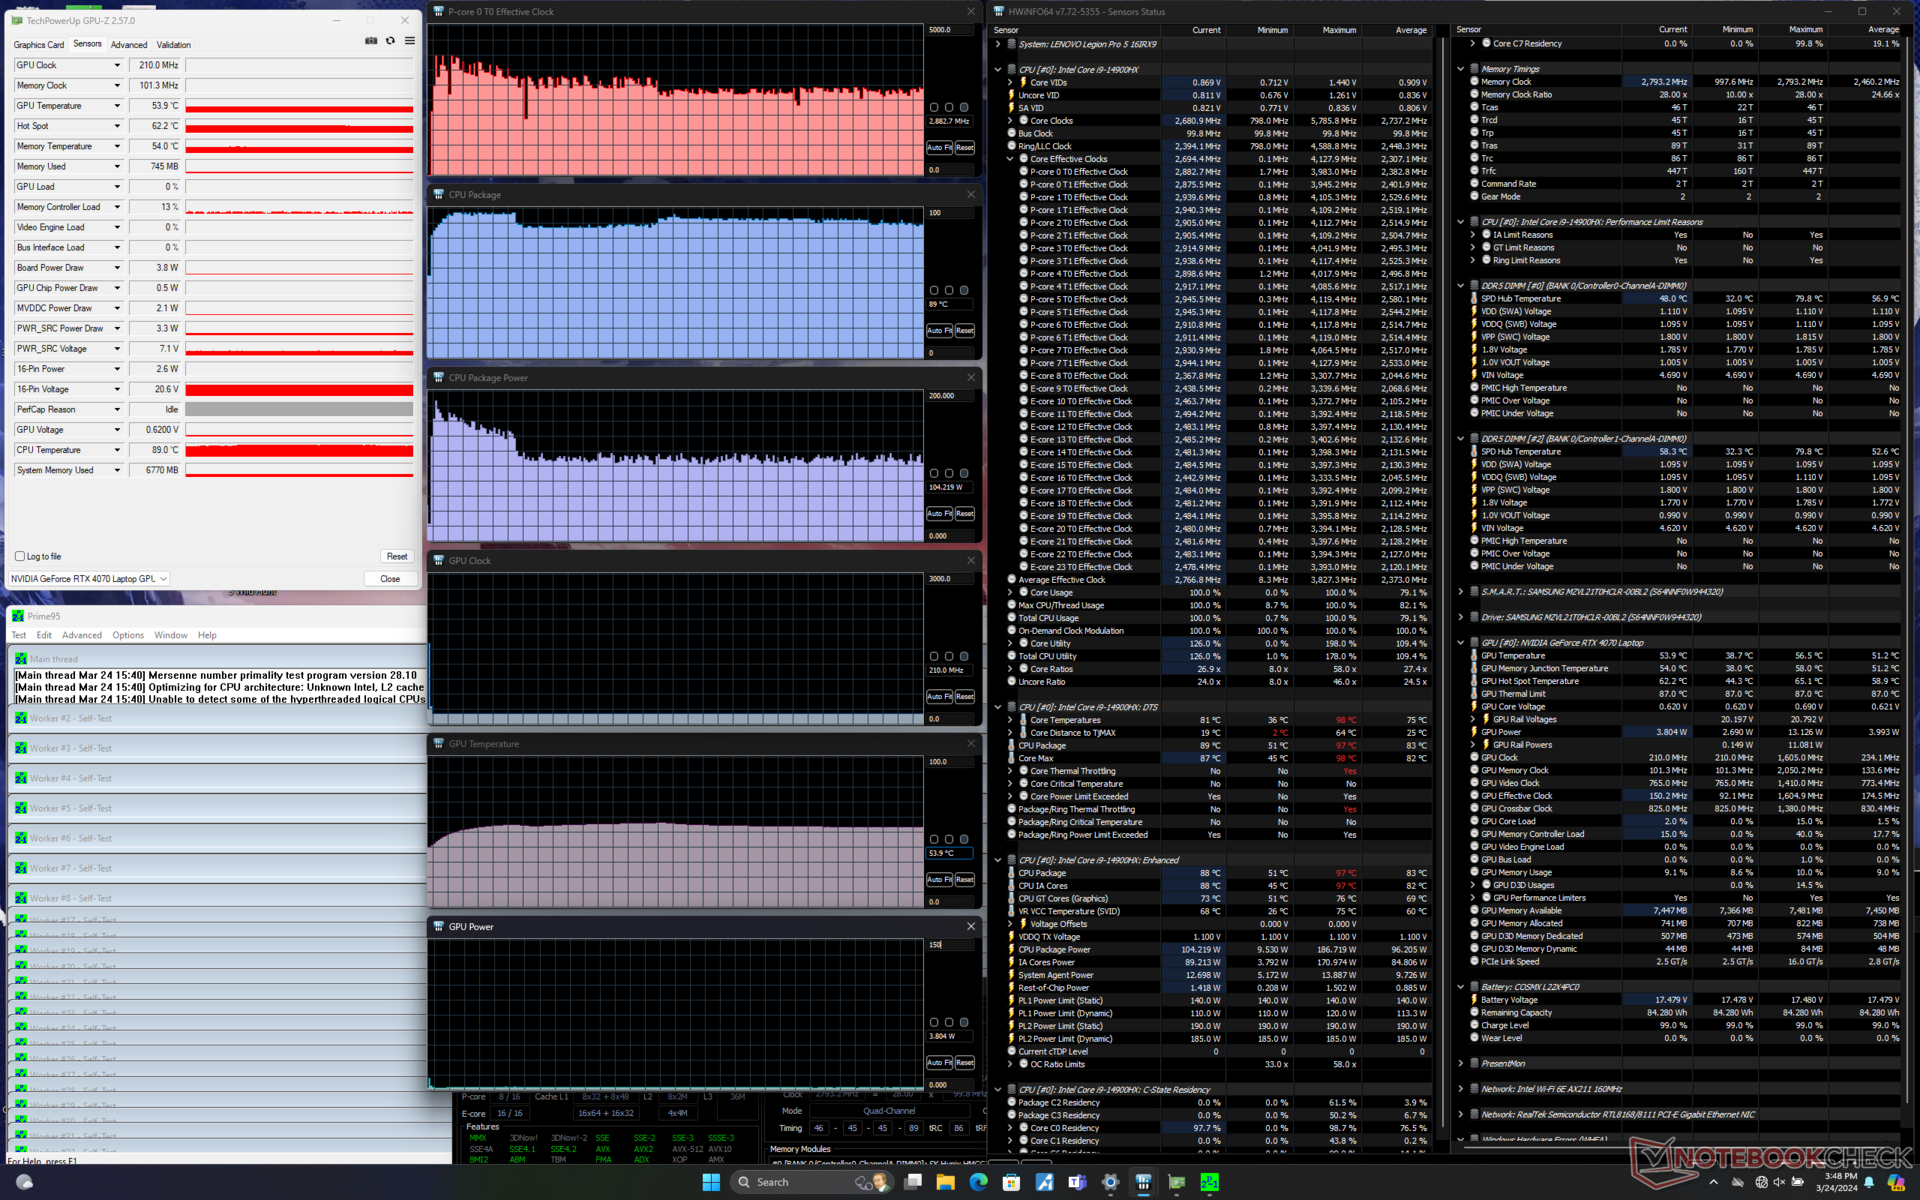

| CPU Clock (GHz) | GPU Clock (MHz) | Average CPU Temperature (°C) | Average GPU Temperature (°C) | |
| System Idle | -- | -- | 51 | 39 |
| Prime95 Stress | 2.8 | -- | 89 | 54 |
| Prime95 + FurMark Stress | ~2.1 | 2100 - 2700 | 95 | 70 - 88 |
| Witcher 3 Stress (Balanced mode) | ~0.5 | 2280 | ~78 | 63 |
| Witcher 3 Stress (Performance mode) | ~0.9 | 2640 | ~88 | 72 |
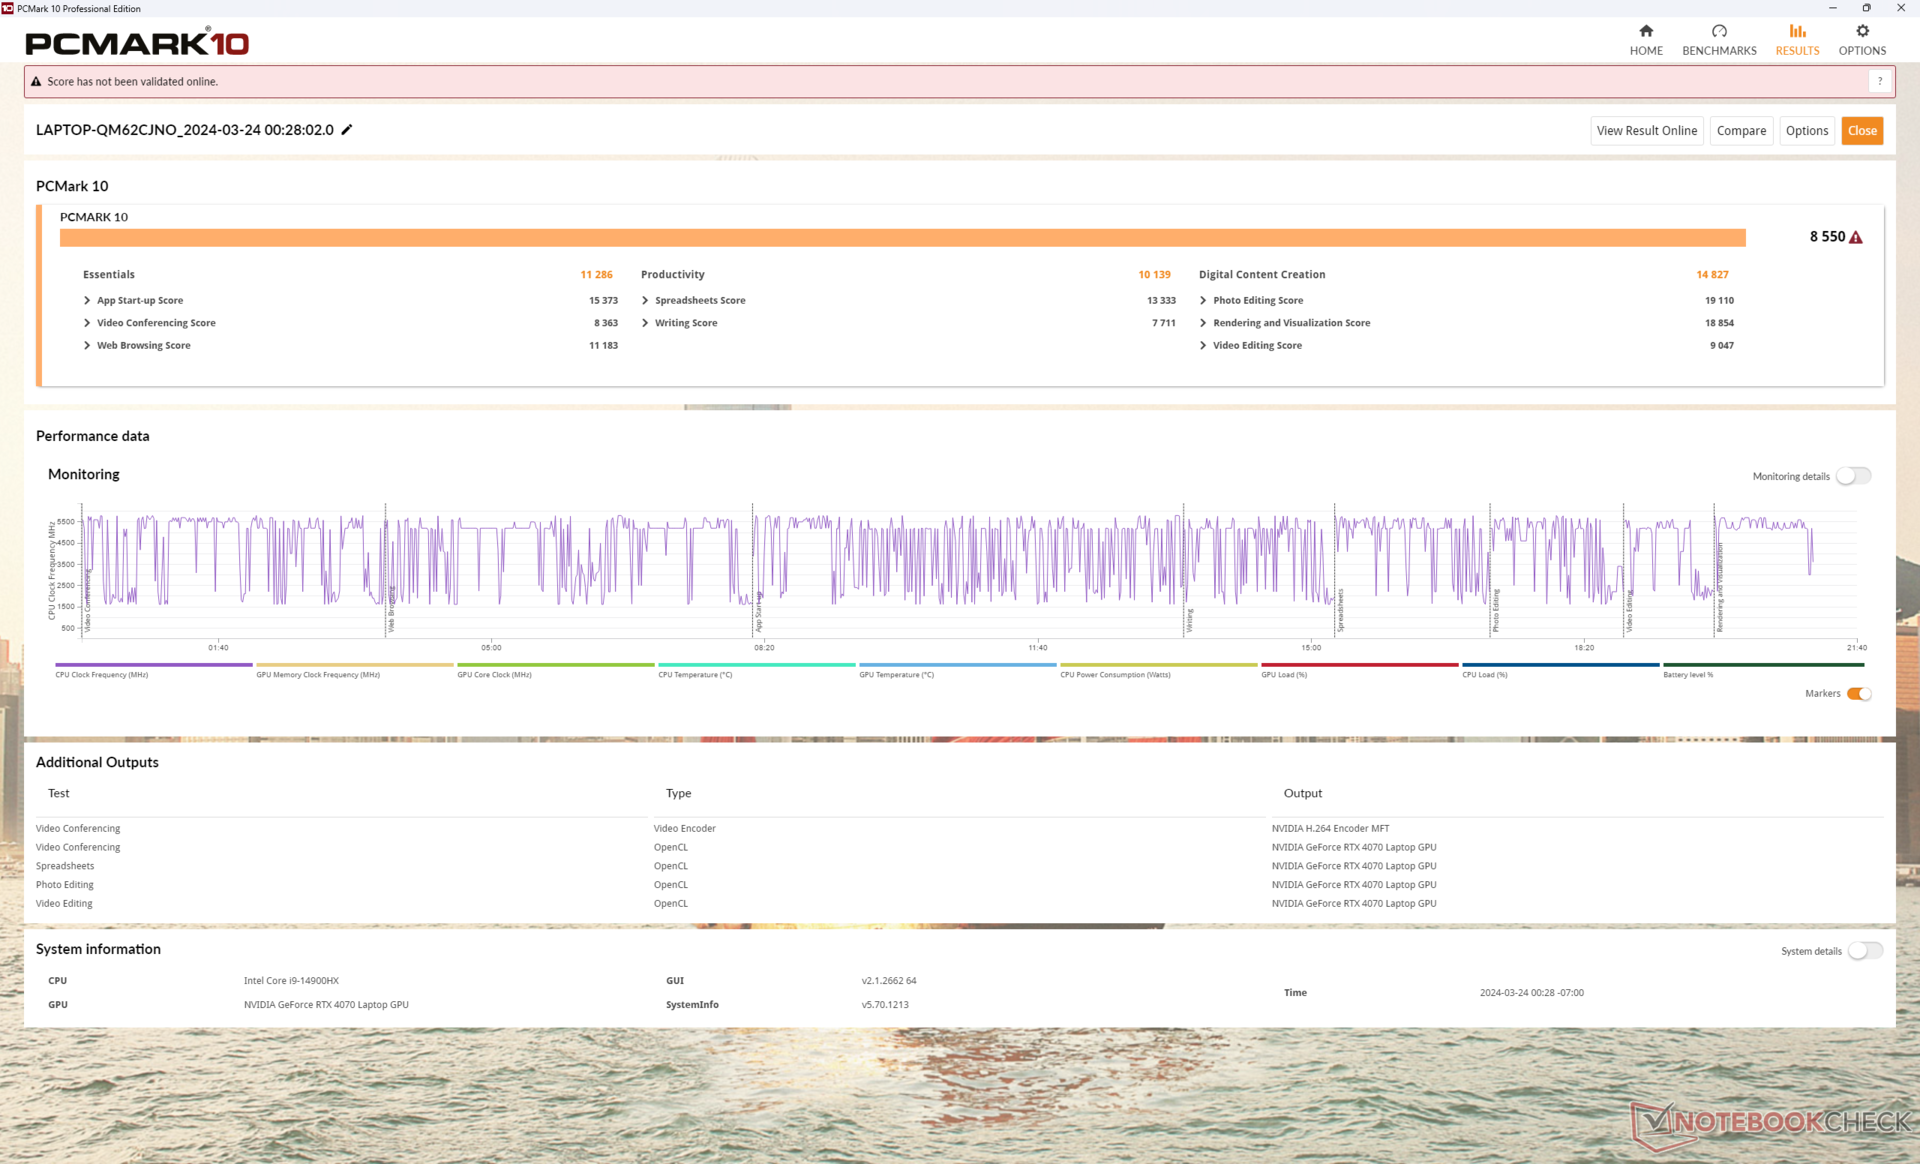
System Performance
PCMark scores are consistently ahead of the older Legion Pro 5 16IRX8 since our unit comes configured with higher-end Core i9 and GeForce RTX parts. We also didn't experience any wake-from-sleep issues that we saw on the recent Alienware m16 R2.
CrossMark: Overall | Productivity | Creativity | Responsiveness
WebXPRT 3: Overall
WebXPRT 4: Overall
Mozilla Kraken 1.1: Total
| PCMark 10 / Score | |
| Lenovo Legion Pro 5 16IRX9 | |
| Average Intel Core i9-14900HX, NVIDIA GeForce RTX 4070 Laptop GPU (7866 - 8550, n=5) | |
| HP Omen Transcend 16-u1095ng | |
| Alienware m16 R2 | |
| Lenovo Legion Pro 5 16IRX8 | |
| MSI Stealth 16 Mercedes-AMG Motorsport A13VG | |
| Asus ROG Zephyrus G16 2024 GU605M | |
| PCMark 10 / Essentials | |
| Lenovo Legion Pro 5 16IRX9 | |
| Average Intel Core i9-14900HX, NVIDIA GeForce RTX 4070 Laptop GPU (10621 - 11815, n=5) | |
| Lenovo Legion Pro 5 16IRX8 | |
| MSI Stealth 16 Mercedes-AMG Motorsport A13VG | |
| HP Omen Transcend 16-u1095ng | |
| Alienware m16 R2 | |
| Asus ROG Zephyrus G16 2024 GU605M | |
| PCMark 10 / Productivity | |
| Average Intel Core i9-14900HX, NVIDIA GeForce RTX 4070 Laptop GPU (9701 - 11103, n=5) | |
| HP Omen Transcend 16-u1095ng | |
| Lenovo Legion Pro 5 16IRX9 | |
| MSI Stealth 16 Mercedes-AMG Motorsport A13VG | |
| Alienware m16 R2 | |
| Asus ROG Zephyrus G16 2024 GU605M | |
| Lenovo Legion Pro 5 16IRX8 | |
| PCMark 10 / Digital Content Creation | |
| Lenovo Legion Pro 5 16IRX9 | |
| Average Intel Core i9-14900HX, NVIDIA GeForce RTX 4070 Laptop GPU (12114 - 14827, n=5) | |
| Alienware m16 R2 | |
| Lenovo Legion Pro 5 16IRX8 | |
| HP Omen Transcend 16-u1095ng | |
| Asus ROG Zephyrus G16 2024 GU605M | |
| MSI Stealth 16 Mercedes-AMG Motorsport A13VG | |
| CrossMark / Overall | |
| Average Intel Core i9-14900HX, NVIDIA GeForce RTX 4070 Laptop GPU (2002 - 2312, n=4) | |
| Lenovo Legion Pro 5 16IRX9 | |
| Alienware m16 R2 | |
| Asus ROG Zephyrus G16 2024 GU605M | |
| Lenovo Legion Pro 5 16IRX8 | |
| CrossMark / Productivity | |
| Average Intel Core i9-14900HX, NVIDIA GeForce RTX 4070 Laptop GPU (1827 - 2191, n=4) | |
| Lenovo Legion Pro 5 16IRX9 | |
| Alienware m16 R2 | |
| Asus ROG Zephyrus G16 2024 GU605M | |
| Lenovo Legion Pro 5 16IRX8 | |
| CrossMark / Creativity | |
| Average Intel Core i9-14900HX, NVIDIA GeForce RTX 4070 Laptop GPU (2287 - 2458, n=4) | |
| Lenovo Legion Pro 5 16IRX9 | |
| Asus ROG Zephyrus G16 2024 GU605M | |
| Alienware m16 R2 | |
| Lenovo Legion Pro 5 16IRX8 | |
| CrossMark / Responsiveness | |
| Average Intel Core i9-14900HX, NVIDIA GeForce RTX 4070 Laptop GPU (1769 - 2330, n=4) | |
| Lenovo Legion Pro 5 16IRX9 | |
| Lenovo Legion Pro 5 16IRX8 | |
| Alienware m16 R2 | |
| Asus ROG Zephyrus G16 2024 GU605M | |
| WebXPRT 3 / Overall | |
| HP Omen Transcend 16-u1095ng | |
| Average Intel Core i9-14900HX, NVIDIA GeForce RTX 4070 Laptop GPU (322 - 342, n=5) | |
| Lenovo Legion Pro 5 16IRX9 | |
| Alienware m16 R2 | |
| Asus ROG Zephyrus G16 2024 GU605M | |
| Lenovo Legion Pro 5 16IRX8 | |
| WebXPRT 4 / Overall | |
| Average Intel Core i9-14900HX, NVIDIA GeForce RTX 4070 Laptop GPU (291 - 301, n=3) | |
| Lenovo Legion Pro 5 16IRX9 | |
| Alienware m16 R2 | |
| Asus ROG Zephyrus G16 2024 GU605M | |
| Lenovo Legion Pro 5 16IRX8 | |
| Mozilla Kraken 1.1 / Total | |
| Asus ROG Zephyrus G16 2024 GU605M | |
| Alienware m16 R2 | |
| Lenovo Legion Pro 5 16IRX8 | |
| Lenovo Legion Pro 5 16IRX9 | |
| Average Intel Core i9-14900HX, NVIDIA GeForce RTX 4070 Laptop GPU (431 - 449, n=5) | |
| HP Omen Transcend 16-u1095ng | |
* ... smaller is better
| PCMark 10 Score | 8550 points | |
Help | ||
| AIDA64 / Memory Copy | |
| Asus ROG Zephyrus G16 2024 GU605M | |
| Lenovo Legion Pro 5 16IRX9 | |
| HP Omen Transcend 16-u1095ng | |
| Average Intel Core i9-14900HX (56992 - 83392, n=22) | |
| MSI Stealth 16 Mercedes-AMG Motorsport A13VG | |
| Alienware m16 R2 | |
| Lenovo Legion Pro 5 16IRX8 | |
| AIDA64 / Memory Read | |
| Asus ROG Zephyrus G16 2024 GU605M | |
| Lenovo Legion Pro 5 16IRX9 | |
| HP Omen Transcend 16-u1095ng | |
| Average Intel Core i9-14900HX (54443 - 87507, n=22) | |
| Alienware m16 R2 | |
| MSI Stealth 16 Mercedes-AMG Motorsport A13VG | |
| Lenovo Legion Pro 5 16IRX8 | |
| AIDA64 / Memory Write | |
| HP Omen Transcend 16-u1095ng | |
| Lenovo Legion Pro 5 16IRX9 | |
| Average Intel Core i9-14900HX (51387 - 78199, n=22) | |
| Asus ROG Zephyrus G16 2024 GU605M | |
| MSI Stealth 16 Mercedes-AMG Motorsport A13VG | |
| Alienware m16 R2 | |
| Lenovo Legion Pro 5 16IRX8 | |
| AIDA64 / Memory Latency | |
| Asus ROG Zephyrus G16 2024 GU605M | |
| Alienware m16 R2 | |
| MSI Stealth 16 Mercedes-AMG Motorsport A13VG | |
| HP Omen Transcend 16-u1095ng | |
| Average Intel Core i9-14900HX (79.7 - 105, n=22) | |
| Lenovo Legion Pro 5 16IRX9 | |
| Lenovo Legion Pro 5 16IRX8 | |
* ... smaller is better
DPC Latency
LatencyMon shows DPC issues when opening multiple browser tabs of our homepage. 4K video playback at 60 FPS is otherwise perfect in iGPU mode with no dropped frames recorded.


| DPC Latencies / LatencyMon - interrupt to process latency (max), Web, Youtube, Prime95 | |
| MSI Stealth 16 Mercedes-AMG Motorsport A13VG | |
| Asus ROG Zephyrus G16 2024 GU605M | |
| Alienware m16 R2 | |
| HP Omen Transcend 16-u1095ng | |
| Lenovo Legion Pro 5 16IRX9 | |
| Lenovo Legion Pro 5 16IRX8 | |
* ... smaller is better
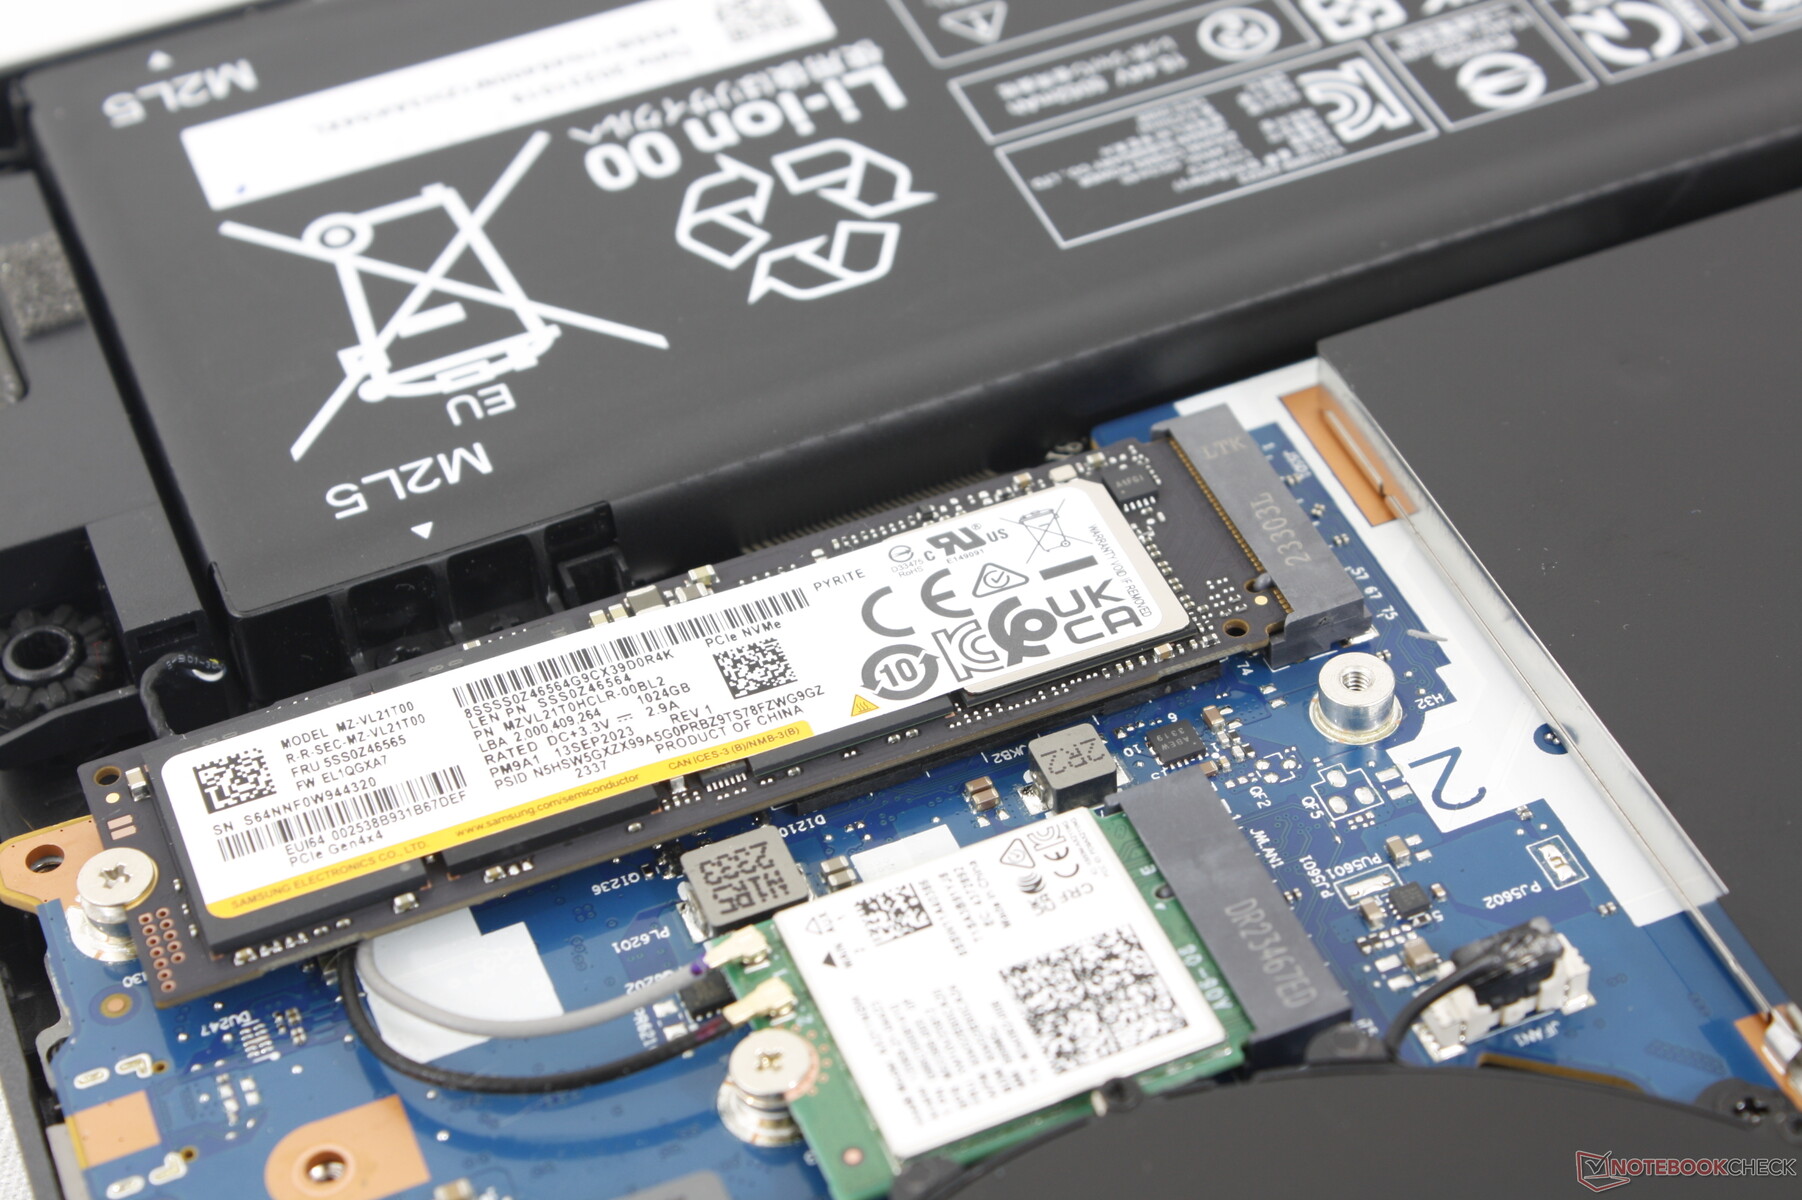
Storage Devices
Our unit ships with the Samsung PM9A1 instead of the SK Hynix PC801 as found on last year's Legion Pro 5 16IRX8. Interestingly, our Samsung drive would exhibit throttling with transfer rates dropping from 6600 MB/s to just 3300 MB/s halfway into our DiskSpd loop test. Meanwhile, the SK Hynix drive in last year's model would have no issues maintaining much higher transfer rates under similar conditions as shown by our comparison graph below. There is unfortunately no easy way to know which SSD the model will ship with before purchasing.


* ... smaller is better
Disk Throttling: DiskSpd Read Loop, Queue Depth 8
GPU Performance
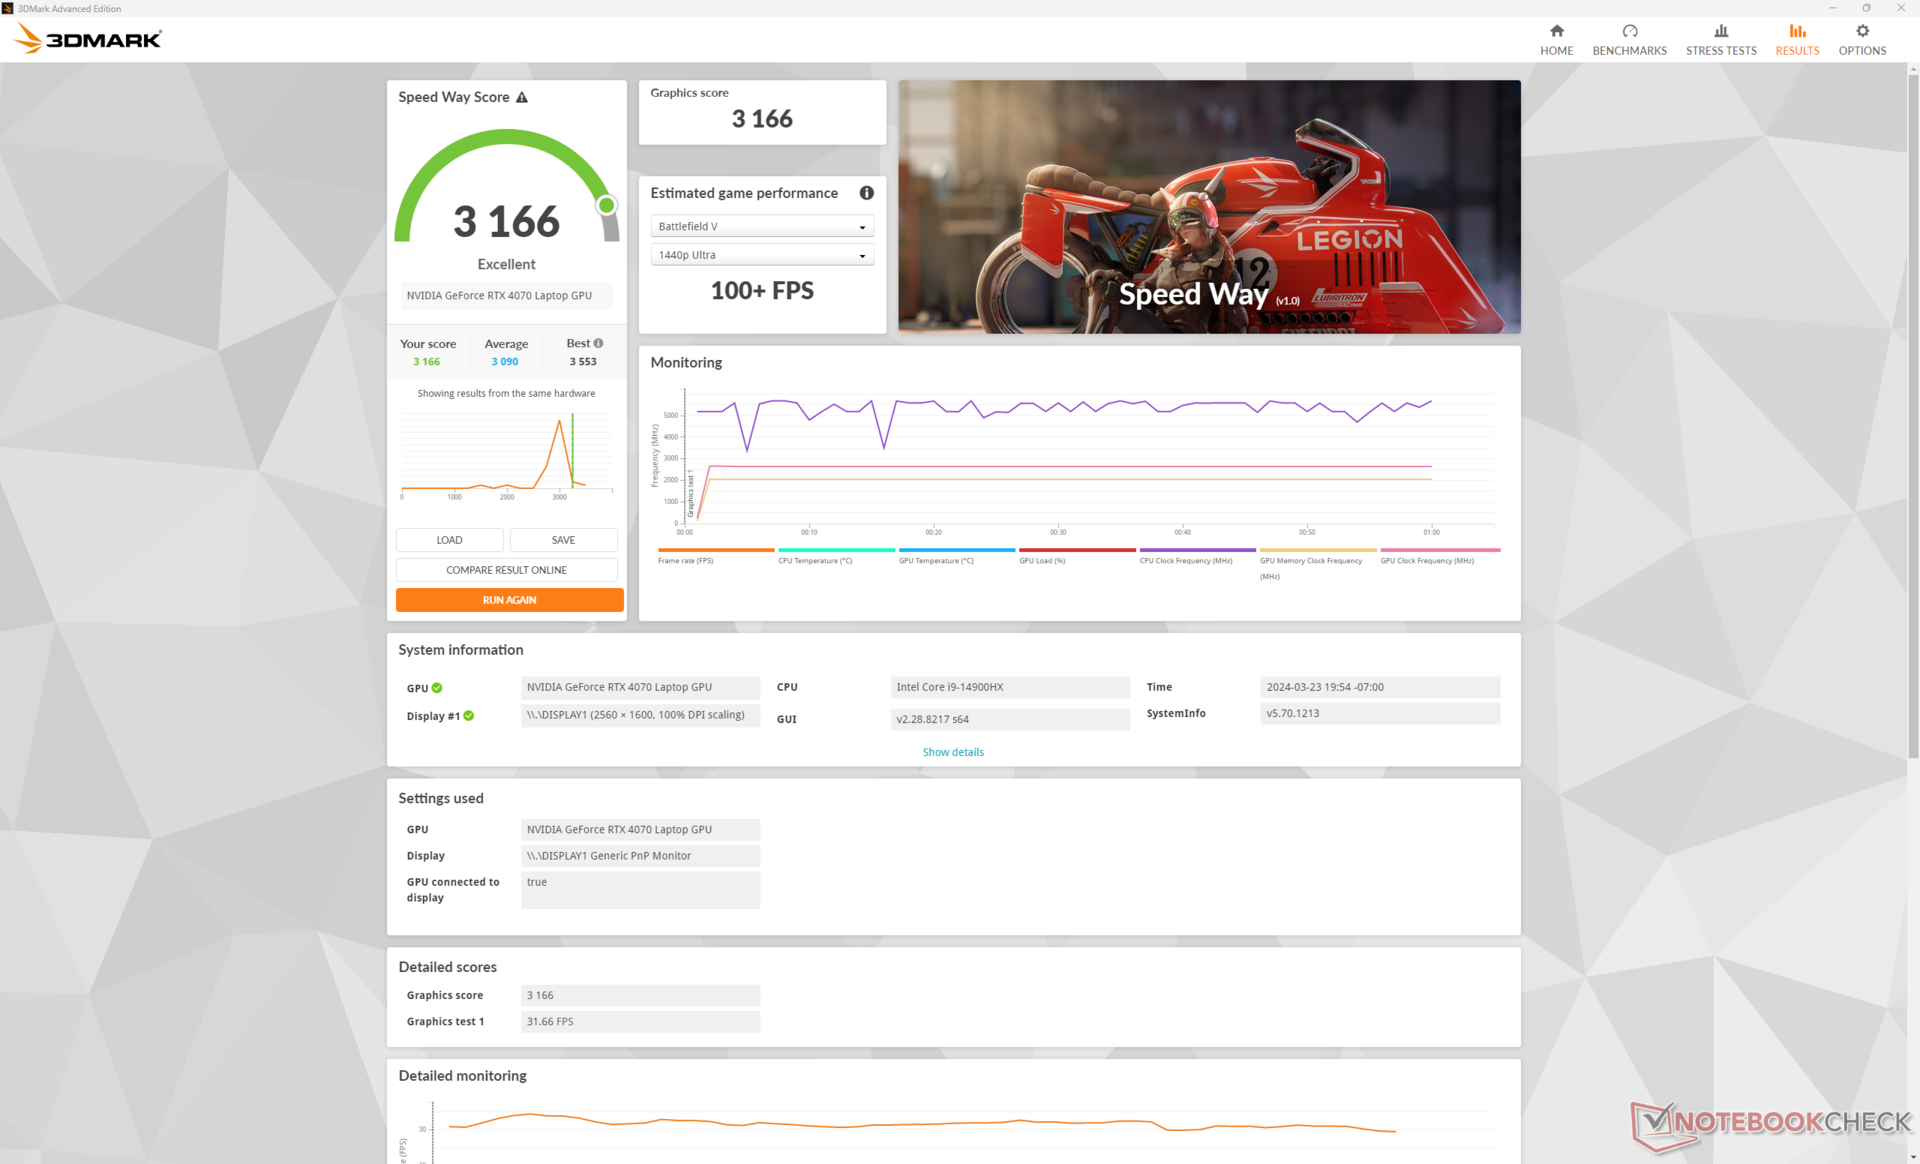
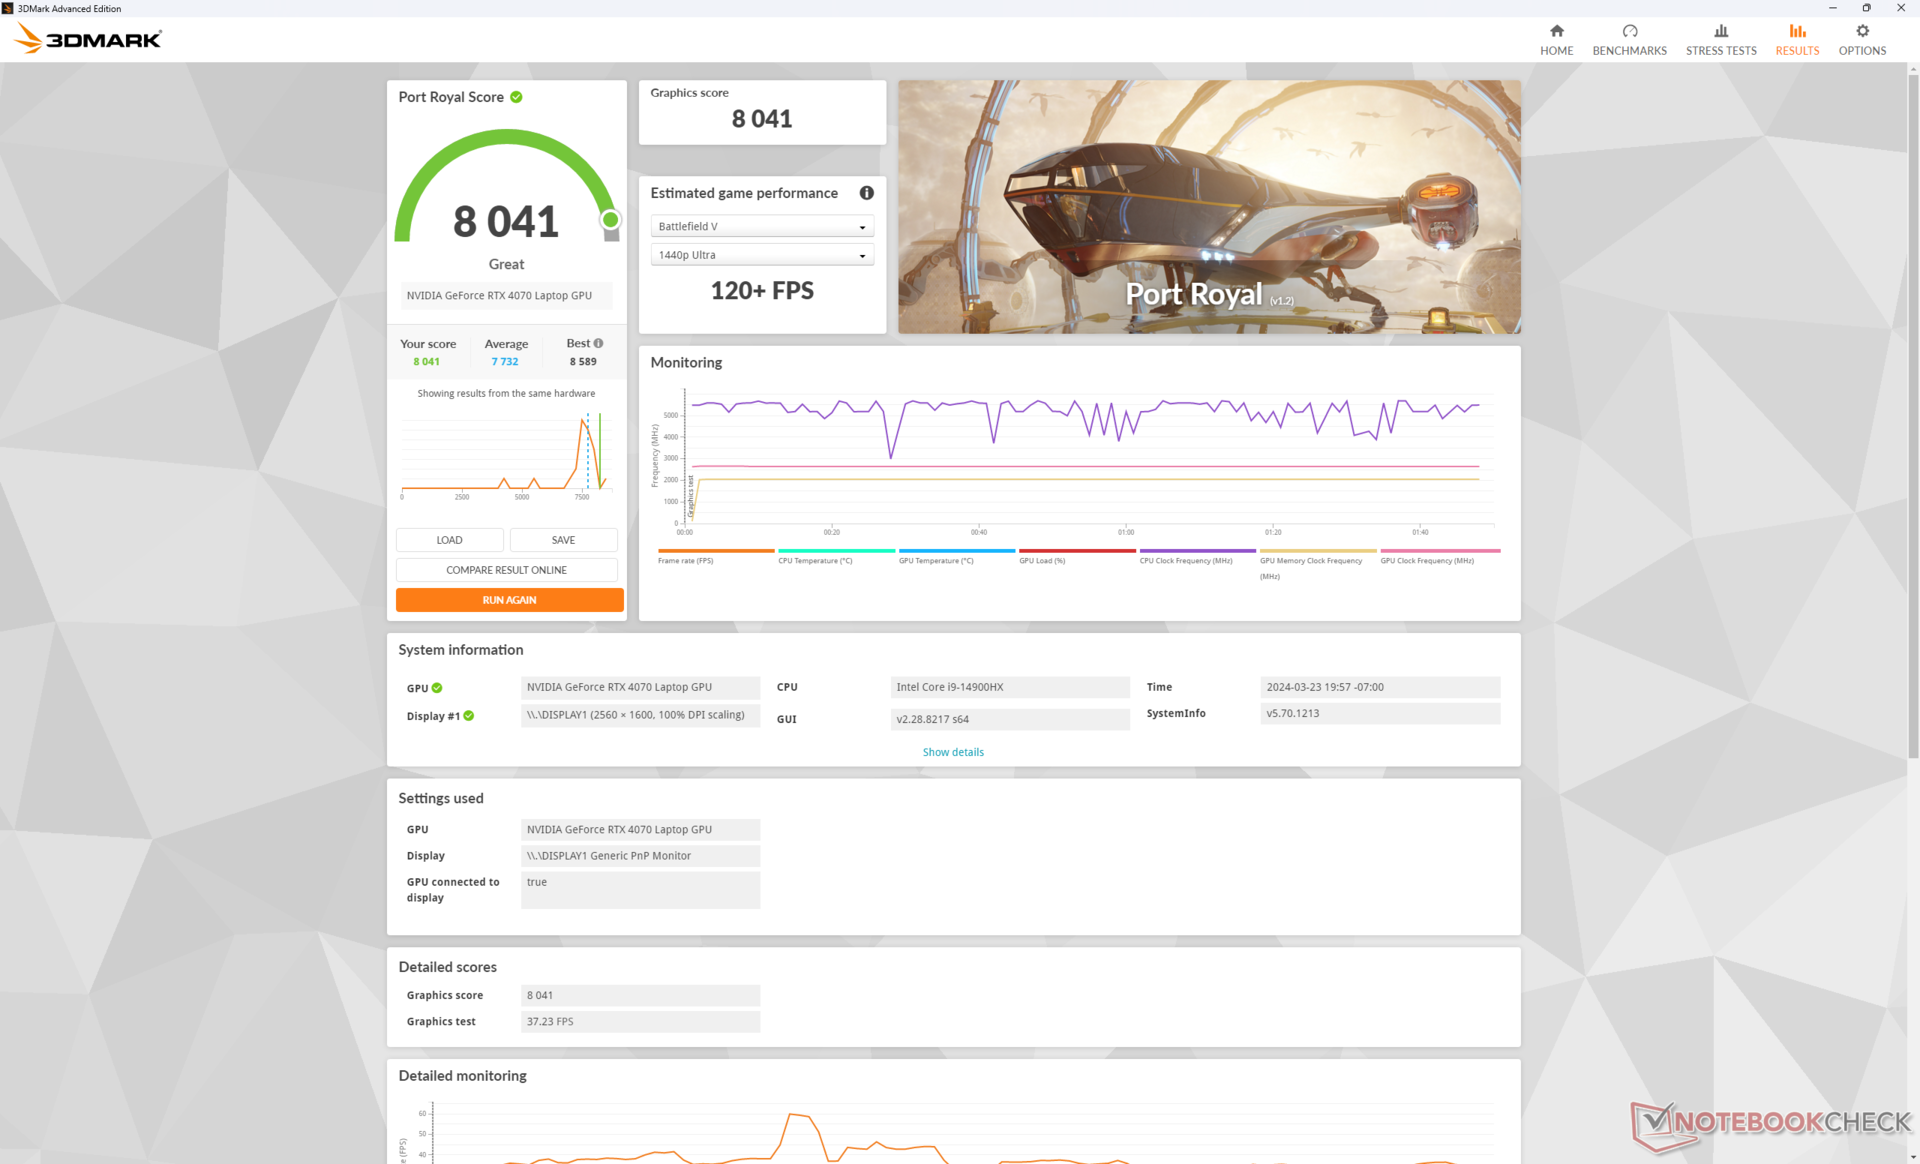
Graphics options include the GeForce RTX 4050, 4060, and 4070 with the same 140 W TGP target. We're willing to bet that the model can support faster RTX 4080 and 4090 options given its size and weight, but Lenovo wants to reserve such high-end options for the costlier Legion Pro 7 series instead. Nevertheless, the RTX 4070 in our Legion Pro 5 16 runs very well with benchmark results that are up to 15 percent faster than the average laptop in our database with the same GPU option.
Downgrading to the RTX 4060 or 4050 configuration is expected to impact graphics performance by about 10 to 20 percent and 25 to 35 percent, respectively. Users upgrading from an older RTX 3070 Ti laptop will not see significant benefits unless if the title supports DLSS 3 as the feature continues to be exclusive to RTX 40 Ada Lovelace GPUs.
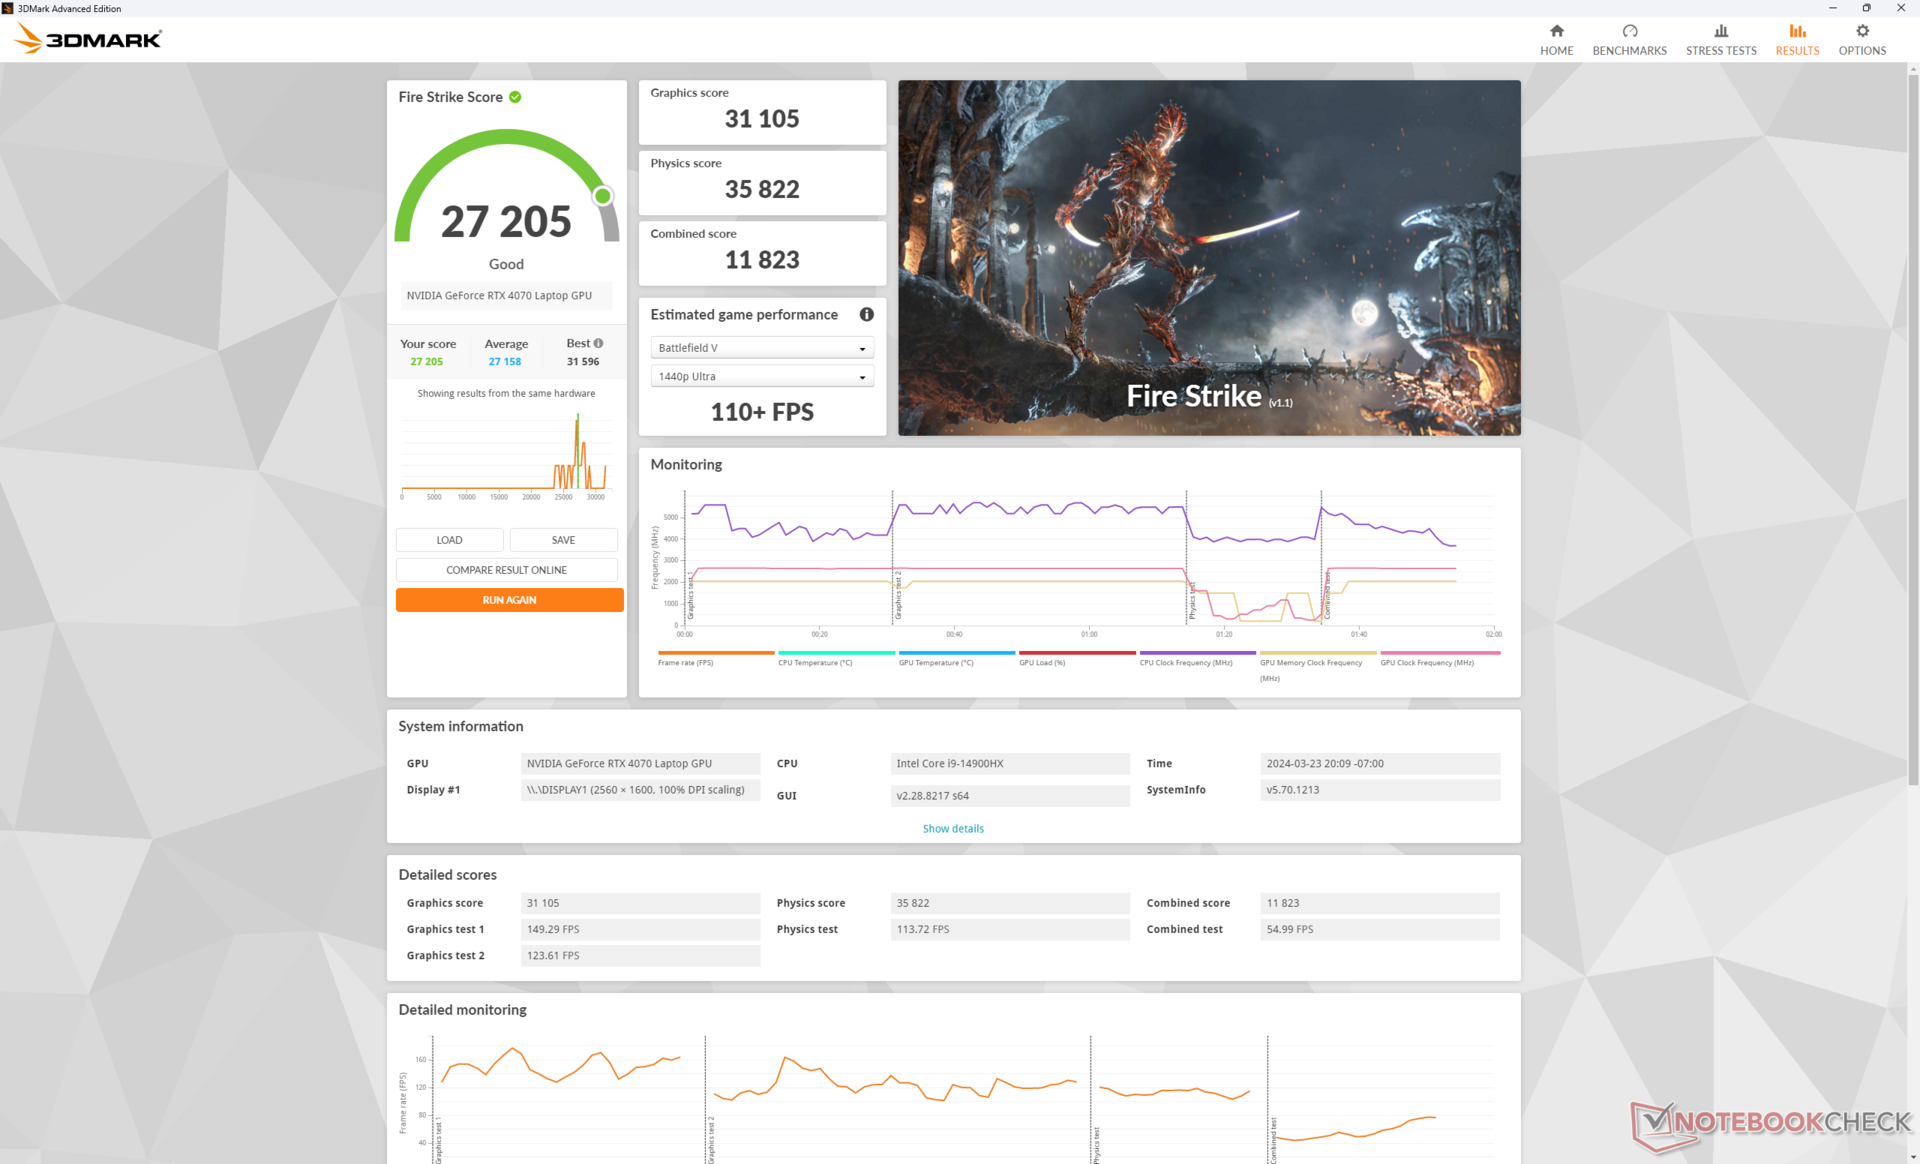
| Power Profile | Graphics Score | Physics Score | Combined Score |
| Performance Mode | 31105 | 35822 | 11823 |
| Balanced Mode | 29127 (-6%) | 37119 (+4%) | 11040 (-7%) |
| Battery Power | 21813 (-29%) | 21747 (-39%) | 6324 (-47%) |
Setting the system to Balanced mode instead of Performance mode will reduce GPU performance just slightly by about 6 percent while CPU performance is not affected.
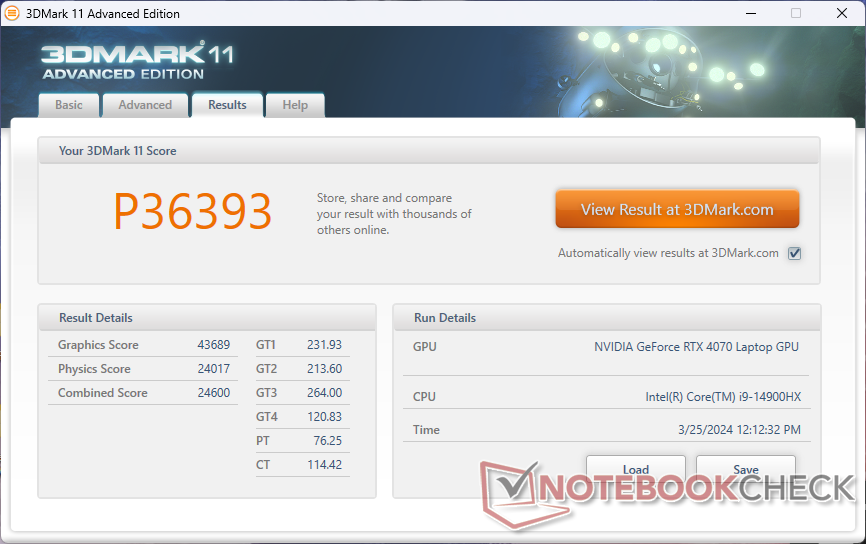

| 3DMark 11 Performance | 36393 points | |
| 3DMark Fire Strike Score | 27205 points | |
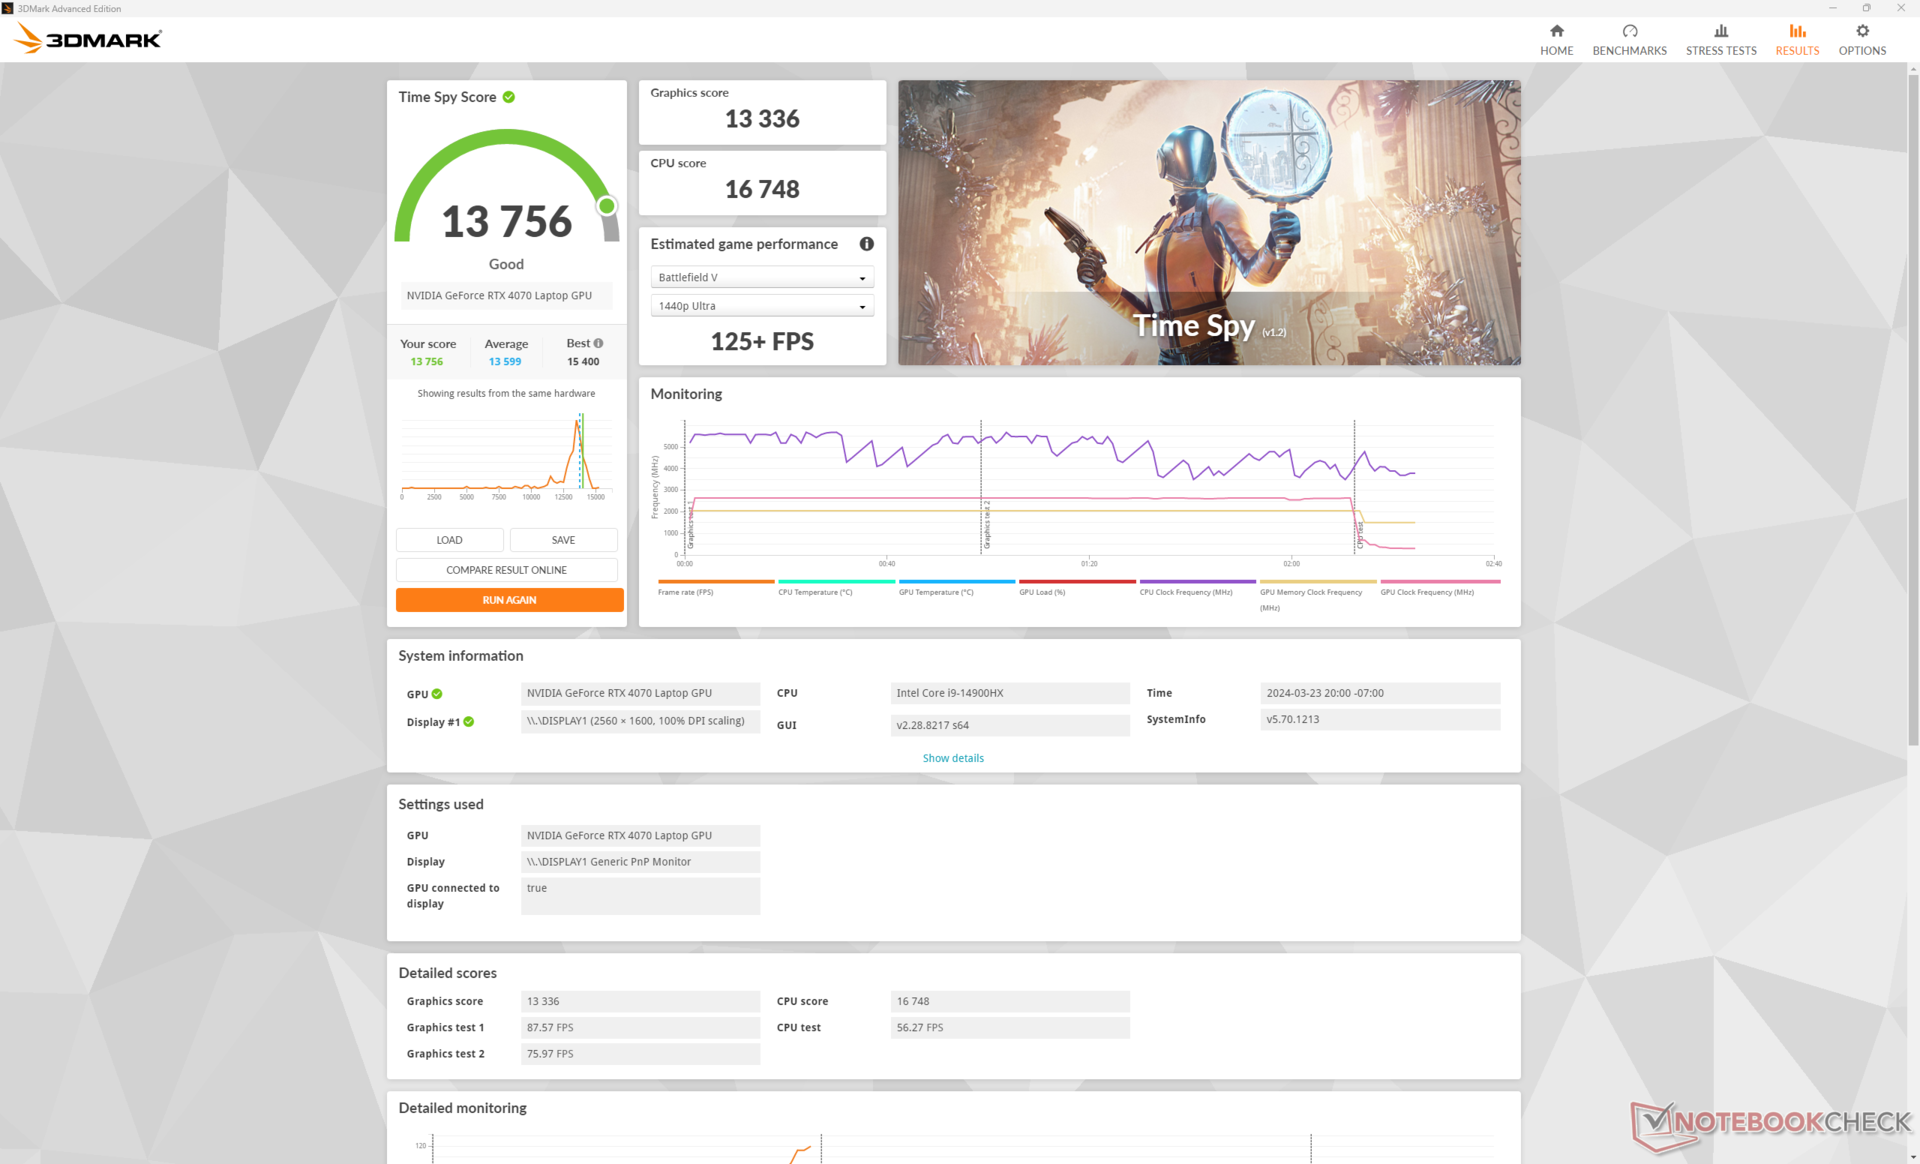
| 3DMark Time Spy Score | 13756 points | |
Help | ||
* ... smaller is better
Gaming Performance
Our Lenovo almost consistently outperforms the Alienware m16 R2 by 5 to 10 percent even though both ship with the same 140 W GeForce RTX 4070 GPU. The difference likely comes down to our faster Core i9-14900HX CPU whereas the Alienware comes with the Core Ultra 7 155H instead.
The mobile RTX 4070 performs poorly at 4K resolutions since it is much weaker than a "proper" desktop RTX 4070. For these scenarios, you'll want to enable DLSS 2 and/or frame generation whenever applicable to get smoother frame rates. For example, running Cyberpunk 2077 at native 4K with Ultra settings and no RT would result in an average frame rate of just 21. If DLSS 3 is enabled on Balanced, however, average frame rate would jump to 64.
Witcher 3 FPS Chart
| low | med. | high | ultra | QHD | 4K | |
| GTA V (2015) | 186.7 | 184.9 | 181.7 | 127.2 | 100.1 | 99.8 |
| The Witcher 3 (2015) | 607.3 | 448.7 | 268.3 | 133.7 | 83.5 | |
| Dota 2 Reborn (2015) | 231 | 205 | 196.7 | 185.3 | 153.3 | |
| Final Fantasy XV Benchmark (2018) | 205 | 185.9 | 131 | 95.1 | 52.8 | |
| X-Plane 11.11 (2018) | 188.3 | 173.3 | 137.6 | 120.3 | ||
| Far Cry 5 (2018) | 191 | 183 | 170 | 158 | 128 | 65 |
| Strange Brigade (2018) | 496 | 340 | 268 | 234 | 150.9 | 77.9 |
| Tiny Tina's Wonderlands (2022) | 283.4 | 230.6 | 151.4 | 115.9 | 79.5 | 36.9 |
| F1 22 (2022) | 320 | 312 | 245 | 88.7 | 58.8 | 27.6 |
| Baldur's Gate 3 (2023) | 176 | 150.8 | 128.5 | 125.6 | 89.6 | 45.2 |
| Cyberpunk 2077 2.0 Phantom Liberty (2023) | 143.4 | 124 | 102.2 | 87.1 | 52.8 | 23.5 |
Emissions
System Noise
Fan noise is generally louder than what we recorded on last year's Core i7 and RTX 4060 model potentially due to our faster Core i9 and RTX 4070 configuration. When running undemanding loads like browsers or video, fan noise would typically hover just under 30 dB(A) which is largely inaudible in most scenarios. When running 3DMark 06, however, the fans pick up speed rather quickly even when set to Balanced mode.
Interestingly, fan noise when gaming on Balanced mode is identical to Performance mode at 51 dB(A). This is supported by our Stress Test measurements above where core temperatures would be noticeably cooler on Balanced mode. As a result, we recommend gaming on Performance mode as Balanced mode does not offer a noticeably quieter experience. At over 50 dB(A), the Lenovo is going to be louder than most other gaming laptops regardless.

Noise Level
| Idle |
| 24.3 / 24.3 / 28.9 dB(A) |
| Load |
| 45.8 / 56.6 dB(A) |
 | ||
30 dB silent 40 dB(A) audible 50 dB(A) loud |
||
min: | ||
| Lenovo Legion Pro 5 16IRX9 NVIDIA GeForce RTX 4070 Laptop GPU, i9-14900HX, Samsung PM9A1 MZVL21T0HCLR | Lenovo Legion Pro 5 16IRX8 NVIDIA GeForce RTX 4060 Laptop GPU, i7-13700HX, SK hynix PC801 HFS512GEJ9X115N | Alienware m16 R2 NVIDIA GeForce RTX 4070 Laptop GPU, Ultra 7 155H, Samsung PM9A1 MZVL21T0HCLR | HP Omen Transcend 16-u1095ng NVIDIA GeForce RTX 4070 Laptop GPU, i9-14900HX, Kioxia XG8 KXG80ZNV1T02 | Asus ROG Zephyrus G16 2024 GU605M NVIDIA GeForce RTX 4070 Laptop GPU, Ultra 7 155H, WD PC SN560 SDDPNQE-1T00 | MSI Stealth 16 Mercedes-AMG Motorsport A13VG NVIDIA GeForce RTX 4070 Laptop GPU, i9-13900H, Samsung PM9A1 MZVL22T0HBLB | |
|---|---|---|---|---|---|---|
| Noise | 8% | 2% | -2% | 5% | 4% | |
| off / environment * | 23.9 | 23 4% | 24.7 -3% | 24 -0% | 23.9 -0% | 25 -5% |
| Idle Minimum * | 24.3 | 23.1 5% | 25.3 -4% | 29 -19% | 23.9 2% | 25 -3% |
| Idle Average * | 24.3 | 23.1 5% | 25.3 -4% | 30 -23% | 27.8 -14% | 26 -7% |
| Idle Maximum * | 28.9 | 26.6 8% | 25.3 12% | 31 -7% | 30.1 -4% | 27 7% |
| Load Average * | 45.8 | 34.7 24% | 31.7 31% | 45 2% | 34.2 25% | 39 15% |
| Witcher 3 ultra * | 51 | 47.6 7% | 53.8 -5% | 44 14% | 46.4 9% | 45 12% |
| Load Maximum * | 56.6 | 54.8 3% | 62 -10% | 47 17% | 46.4 18% | 51 10% |
* ... smaller is better
Temperature
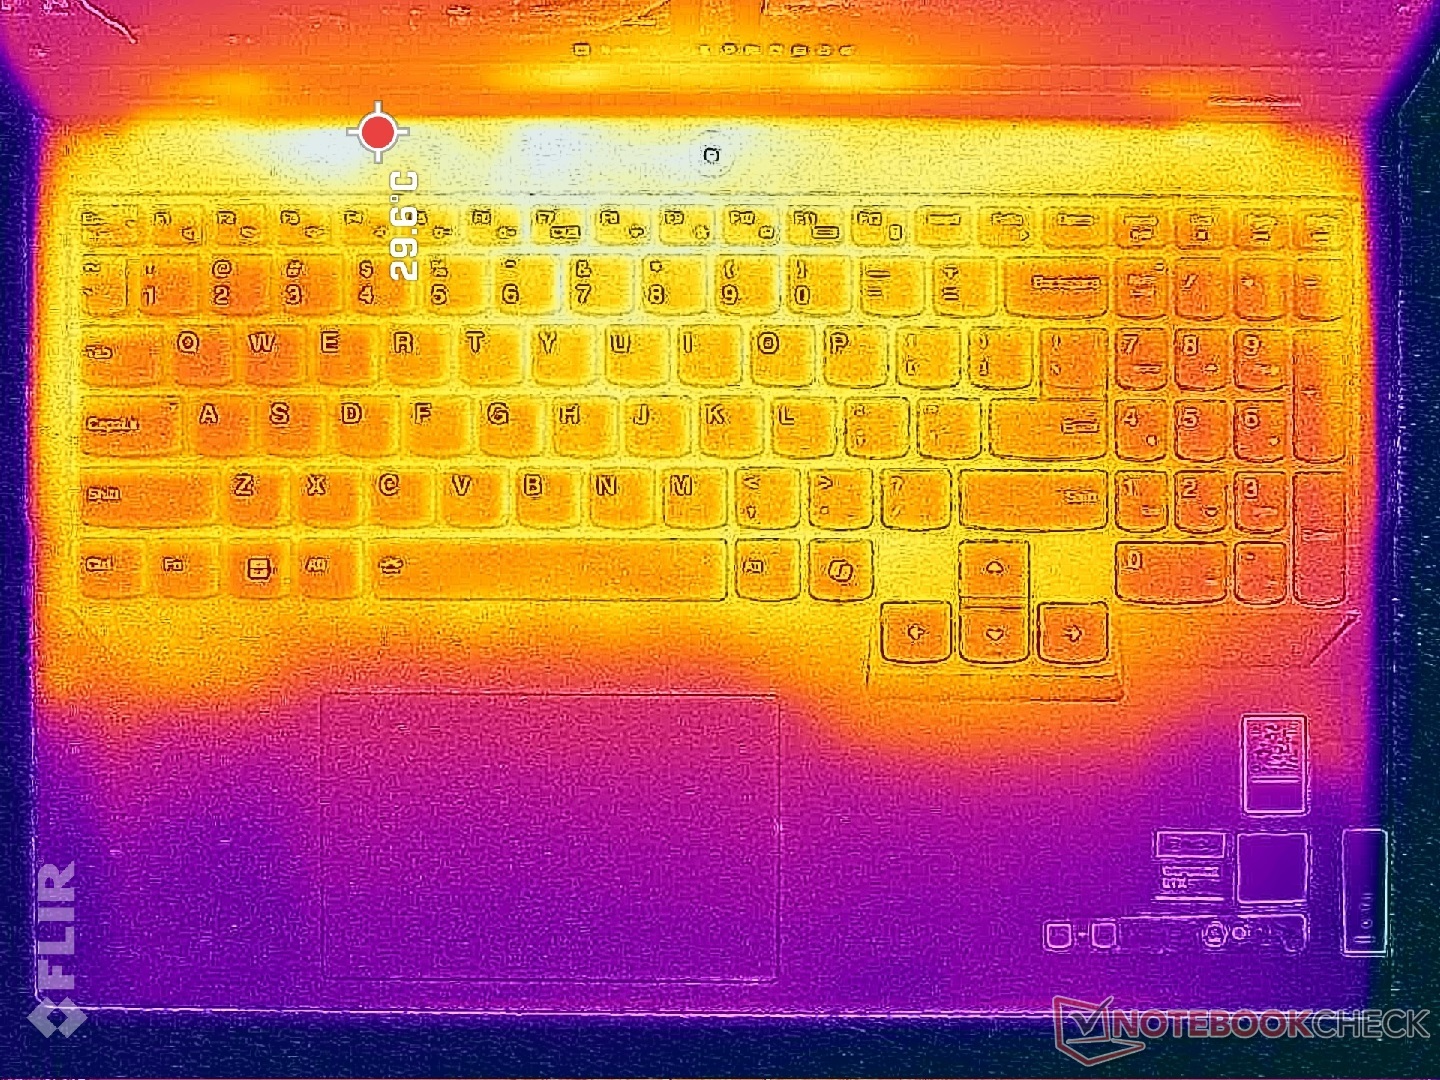
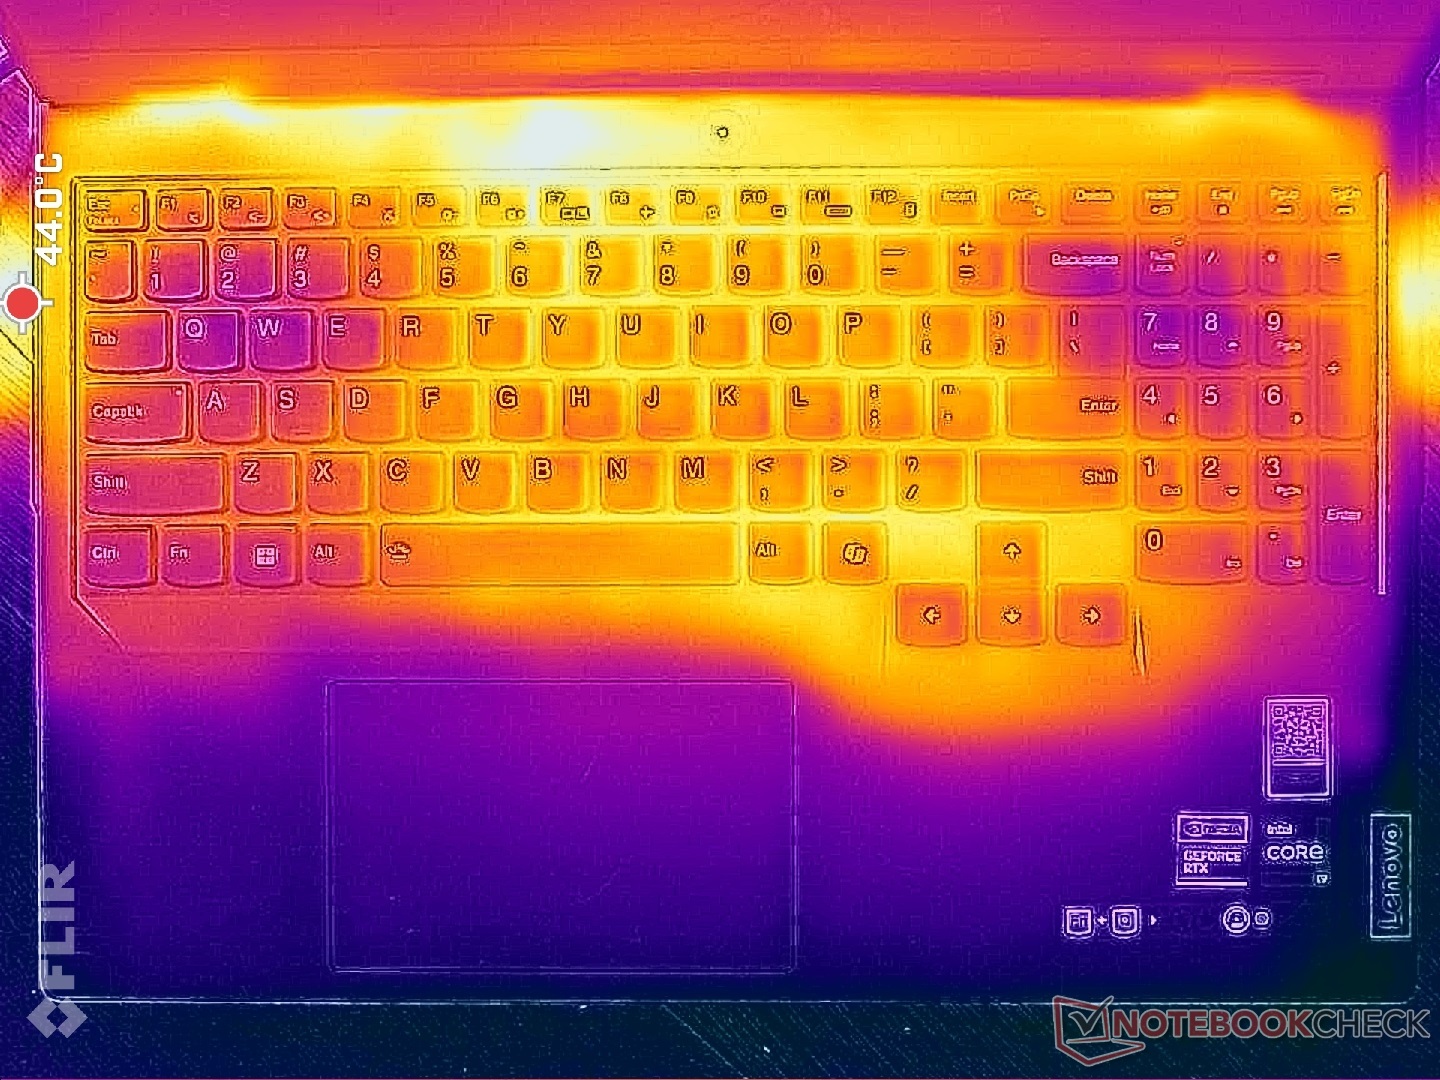
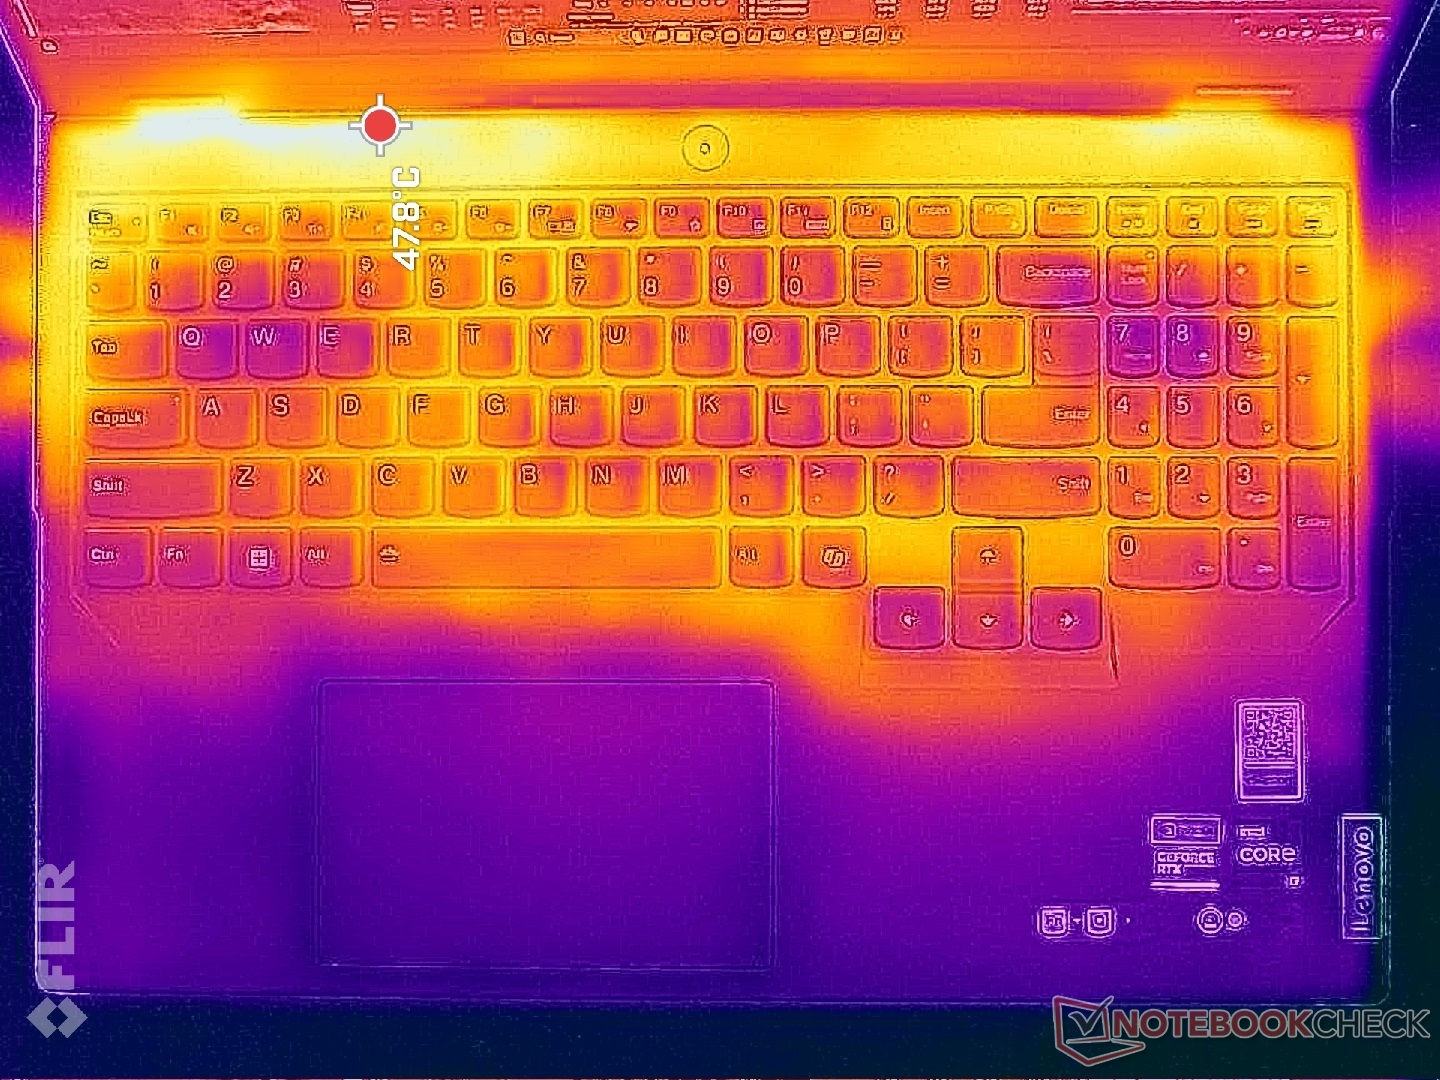
Surface temperatures can be warmer than we recorded on last year's model. When gaming, for example, much of the keyboard would be 40 C compared to only 36 C on the Legion Pro 5 16IRX8 or 34 C on the Alienware m16 R2. The palm rests and WASD keys would remain cooler to keep hands comfortable when gaming, but the rest of the laptop will be quite toasty.
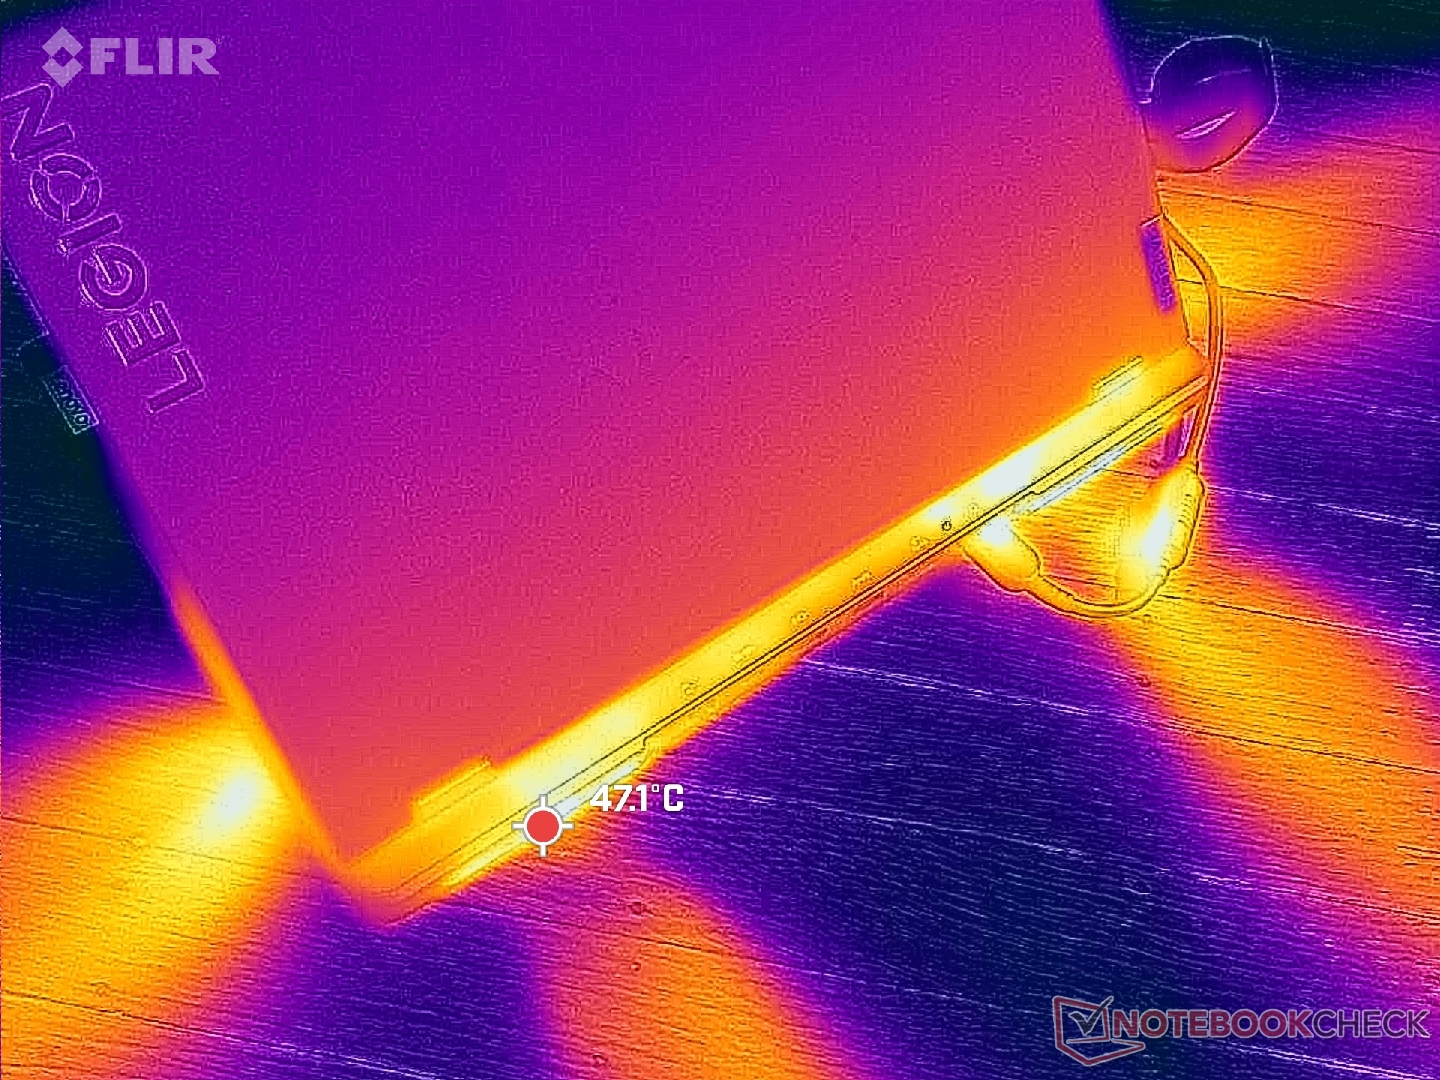
(±) The maximum temperature on the upper side is 43.8 °C / 111 F, compared to the average of 40.4 °C / 105 F, ranging from 21.2 to 68.8 °C for the class Gaming.
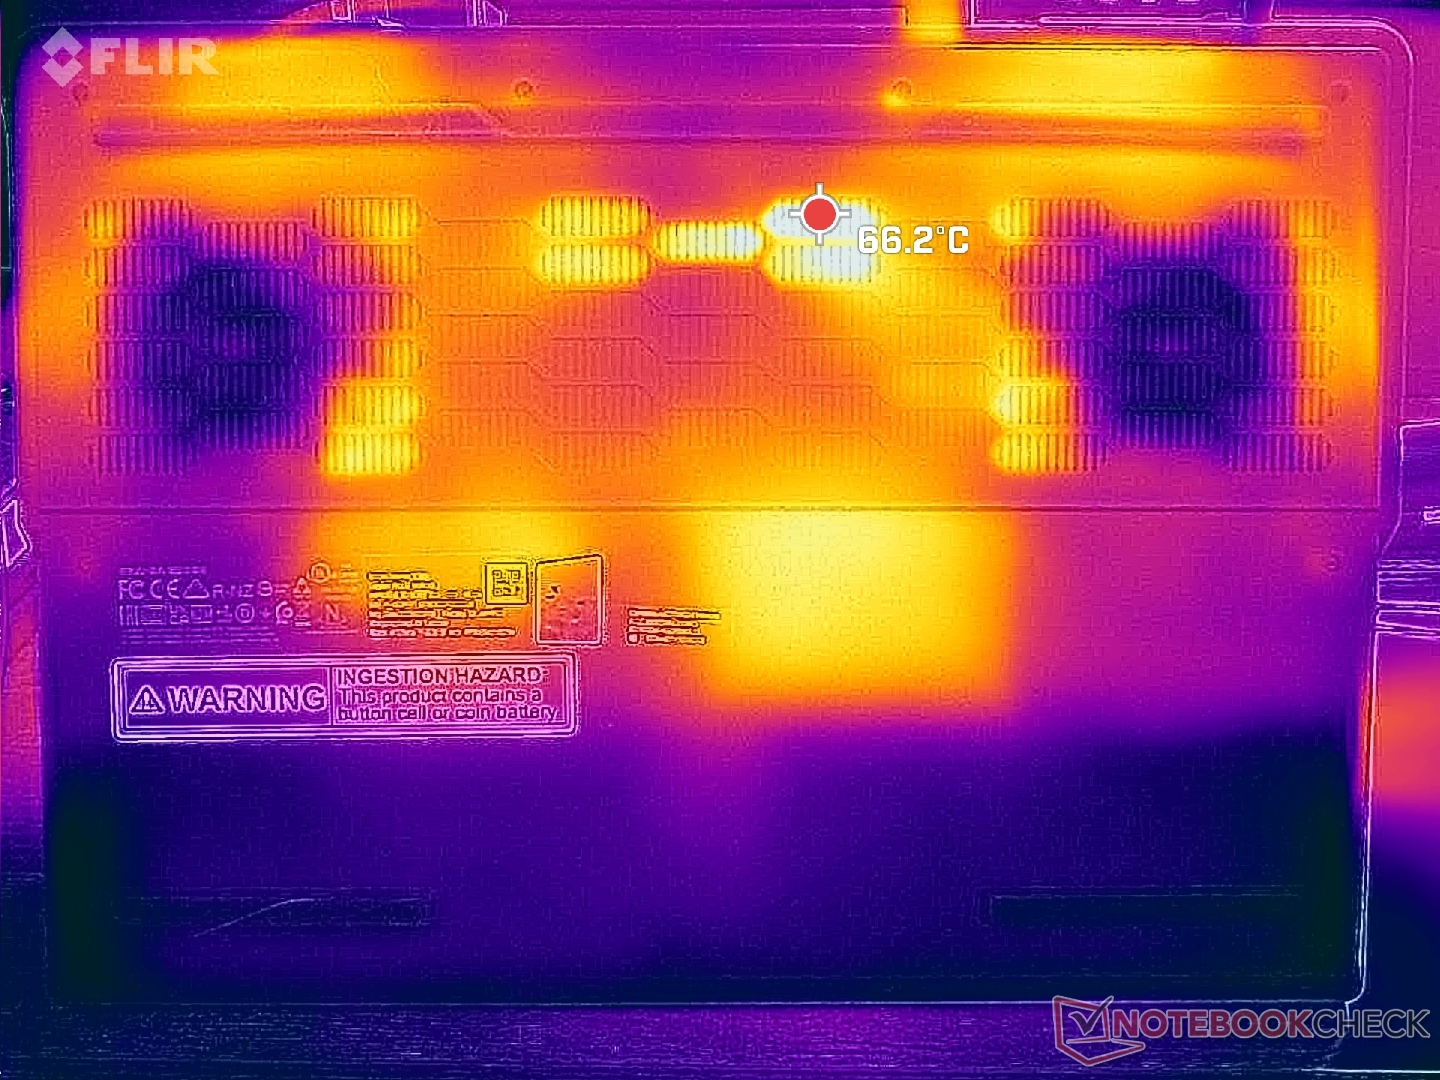
(-) The bottom heats up to a maximum of 55.4 °C / 132 F, compared to the average of 43.2 °C / 110 F
(+) In idle usage, the average temperature for the upper side is 29.6 °C / 85 F, compared to the device average of 33.8 °C / 93 F.
(±) Playing The Witcher 3, the average temperature for the upper side is 36.1 °C / 97 F, compared to the device average of 33.8 °C / 93 F.
(+) The palmrests and touchpad are cooler than skin temperature with a maximum of 28 °C / 82.4 F and are therefore cool to the touch.
(±) The average temperature of the palmrest area of similar devices was 28.9 °C / 84 F (+0.9 °C / 1.6 F).


| Lenovo Legion Pro 5 16IRX9 Intel Core i9-14900HX, NVIDIA GeForce RTX 4070 Laptop GPU | Lenovo Legion Pro 5 16IRX8 Intel Core i7-13700HX, NVIDIA GeForce RTX 4060 Laptop GPU | Alienware m16 R2 Intel Core Ultra 7 155H, NVIDIA GeForce RTX 4070 Laptop GPU | HP Omen Transcend 16-u1095ng Intel Core i9-14900HX, NVIDIA GeForce RTX 4070 Laptop GPU | Asus ROG Zephyrus G16 2024 GU605M Intel Core Ultra 7 155H, NVIDIA GeForce RTX 4070 Laptop GPU | MSI Stealth 16 Mercedes-AMG Motorsport A13VG Intel Core i9-13900H, NVIDIA GeForce RTX 4070 Laptop GPU | |
|---|---|---|---|---|---|---|
| Heat | 7% | -5% | 1% | 7% | 1% | |
| Maximum Upper Side * | 43.8 | 42.8 2% | 44.8 -2% | 49 -12% | 50.3 -15% | 49 -12% |
| Maximum Bottom * | 55.4 | 50 10% | 48 13% | 63 -14% | 48 13% | 52 6% |
| Idle Upper Side * | 32.8 | 29.6 10% | 37.2 -13% | 30 9% | 28.8 12% | 32 2% |
| Idle Bottom * | 36 | 34 6% | 42 -17% | 29 19% | 29.8 17% | 34 6% |
* ... smaller is better
Speakers
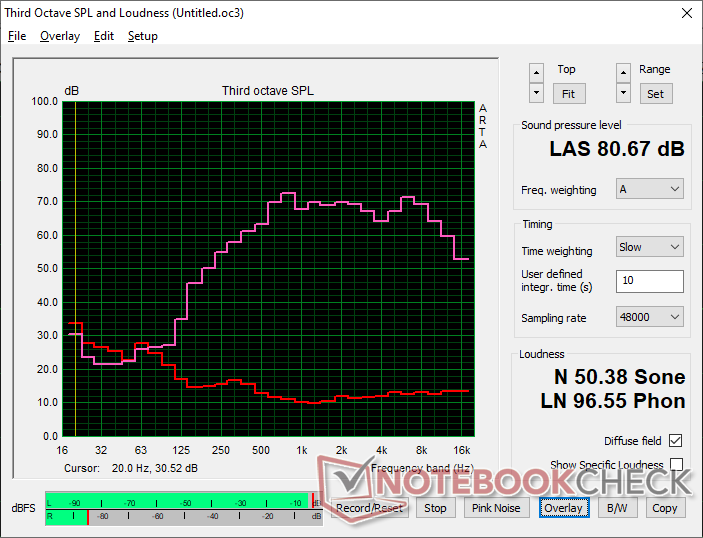
Lenovo Legion Pro 5 16IRX9 audio analysis
(±) | speaker loudness is average but good (80.7 dB)
Bass 100 - 315 Hz
(-) | nearly no bass - on average 19% lower than median
(±) | linearity of bass is average (10.1% delta to prev. frequency)
Mids 400 - 2000 Hz
(+) | balanced mids - only 4.7% away from median
(+) | mids are linear (5.7% delta to prev. frequency)
Highs 2 - 16 kHz
(+) | balanced highs - only 3.3% away from median
(+) | highs are linear (5.6% delta to prev. frequency)
Overall 100 - 16.000 Hz
(±) | linearity of overall sound is average (17.2% difference to median)
Compared to same class
» 44% of all tested devices in this class were better, 11% similar, 45% worse
» The best had a delta of 6%, average was 18%, worst was 132%
Compared to all devices tested
» 27% of all tested devices were better, 8% similar, 66% worse
» The best had a delta of 4%, average was 25%, worst was 134%
Apple MacBook Pro 16 2021 M1 Pro audio analysis
(+) | speakers can play relatively loud (84.7 dB)
Bass 100 - 315 Hz
(+) | good bass - only 3.8% away from median
(+) | bass is linear (5.2% delta to prev. frequency)
Mids 400 - 2000 Hz
(+) | balanced mids - only 1.3% away from median
(+) | mids are linear (2.1% delta to prev. frequency)
Highs 2 - 16 kHz
(+) | balanced highs - only 1.9% away from median
(+) | highs are linear (2.7% delta to prev. frequency)
Overall 100 - 16.000 Hz
(+) | overall sound is linear (4.6% difference to median)
Compared to same class
» 0% of all tested devices in this class were better, 0% similar, 100% worse
» The best had a delta of 5%, average was 18%, worst was 45%
Compared to all devices tested
» 0% of all tested devices were better, 0% similar, 100% worse
» The best had a delta of 4%, average was 25%, worst was 134%
Energy Management
Power Consumption
Running Witcher 3 would hover around 220 W to be more demanding than what we recorded on last year's model. It's also noticeably higher than the HP Omen Transcend 16 which ships with the same CPU and GPU as our Lenovo. Much of a difference can be attributed to the Core i9 CPU in the Lenovo which maintains a higher power state when the system is set to Performance mode.
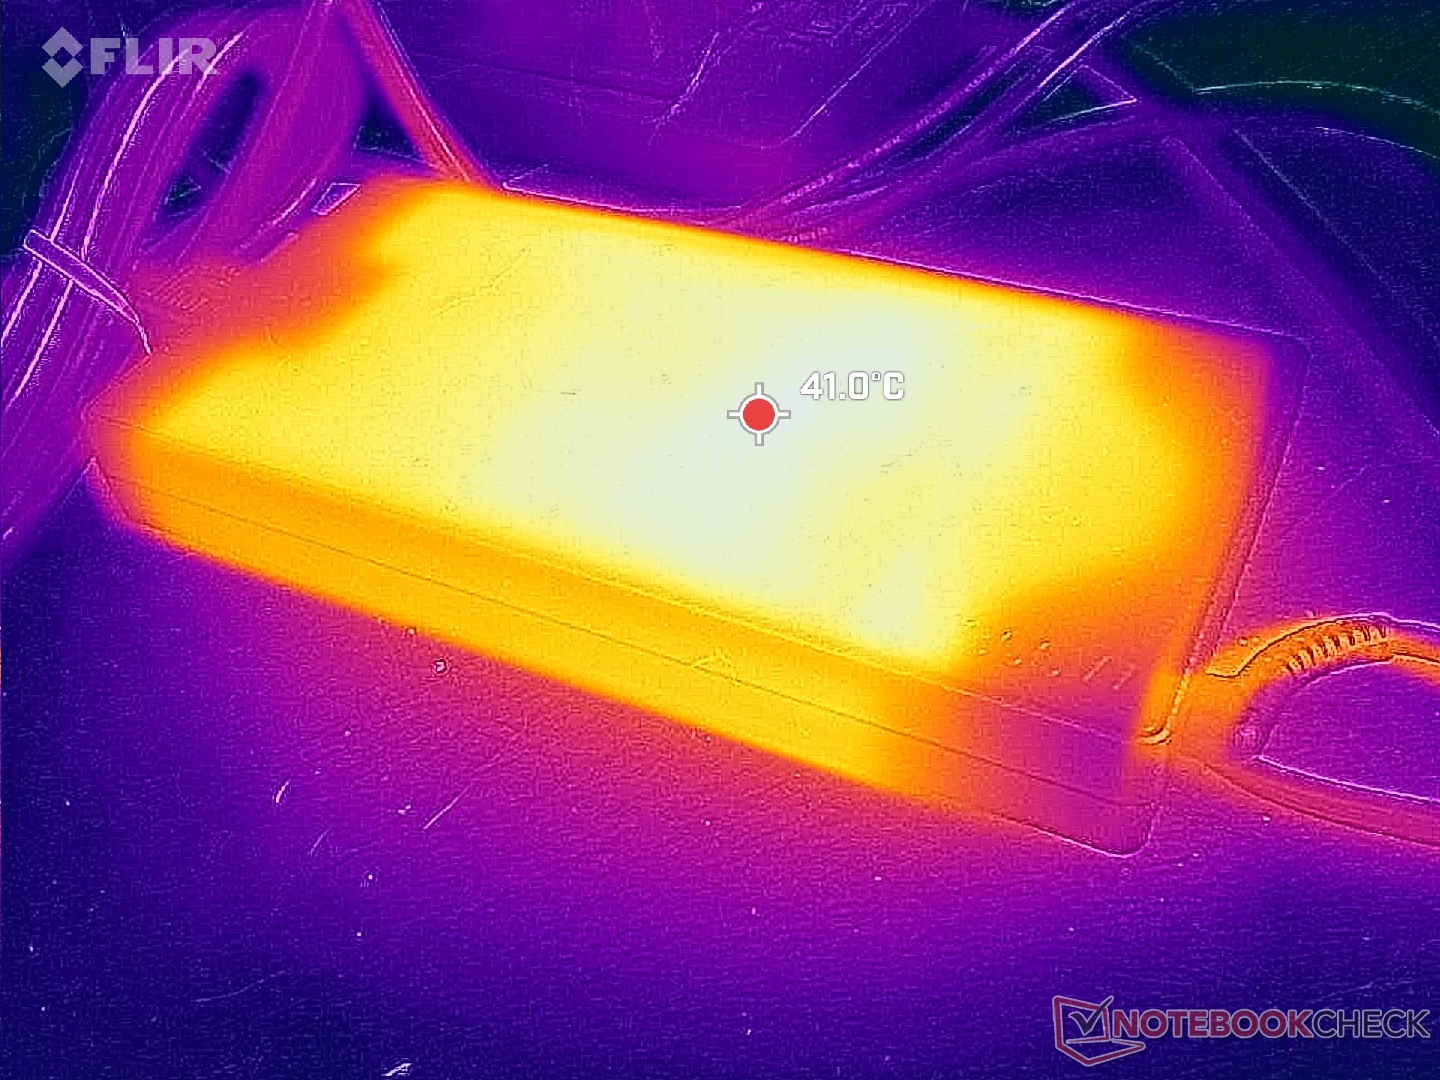
We're able to record a temporary maximum draw of about 274 W when the CPU and GPU are each at 100 percent utilization. The large (~19.9 x 9.9 x 2.6 cm) 300 W AC adapter is the same one that ships with the Legion 5 15, Legion 5 17, and Legion 7 16 models.
(Editor's note: This section will be updated when repairs on our Metrahit Energy multimeter are completed. We apologize for the inconvenience.)
| Lenovo Legion Pro 5 16IRX9 i9-14900HX, NVIDIA GeForce RTX 4070 Laptop GPU, Samsung PM9A1 MZVL21T0HCLR, IPS, 2560x1600, 16.00 | Lenovo Legion Pro 5 16IRX8 i7-13700HX, NVIDIA GeForce RTX 4060 Laptop GPU, SK hynix PC801 HFS512GEJ9X115N, IPS, 2560x1600, 16.00 | Alienware m16 R2 Ultra 7 155H, NVIDIA GeForce RTX 4070 Laptop GPU, Samsung PM9A1 MZVL21T0HCLR, IPS, 2560x1600, 16.00 | HP Omen Transcend 16-u1095ng i9-14900HX, NVIDIA GeForce RTX 4070 Laptop GPU, Kioxia XG8 KXG80ZNV1T02, OLED, 2560x1600, 16.00 | Asus ROG Zephyrus G16 2024 GU605M Ultra 7 155H, NVIDIA GeForce RTX 4070 Laptop GPU, WD PC SN560 SDDPNQE-1T00, OLED, 2560x1600, 16.00 | MSI Stealth 16 Mercedes-AMG Motorsport A13VG i9-13900H, NVIDIA GeForce RTX 4070 Laptop GPU, Samsung PM9A1 MZVL22T0HBLB, OLED, 3840x2400, 16.00 | |
|---|---|---|---|---|---|---|
| Power Consumption | ||||||
| Idle Minimum * | 24.5 | 8.1 | 10 | 8.3 | 11 | |
| Idle Average * | 29.2 | 13 | 18 | 12.5 | 14 | |
| Idle Maximum * | 34.3 | 40.3 | 32 | 12.8 | 28 | |
| Load Average * | 98.7 | 79 | 128 | 71.3 | 83 | |
| Witcher 3 ultra * | 178.6 | 188.1 | 148.4 | 127.5 | 140 | |
| Load Maximum * | 249.6 | 254.9 | 242 | 169.1 | 204 |
* ... smaller is better
Power Consumption Witcher 3 / Stresstest
Power Consumption external Monitor
Battery Life
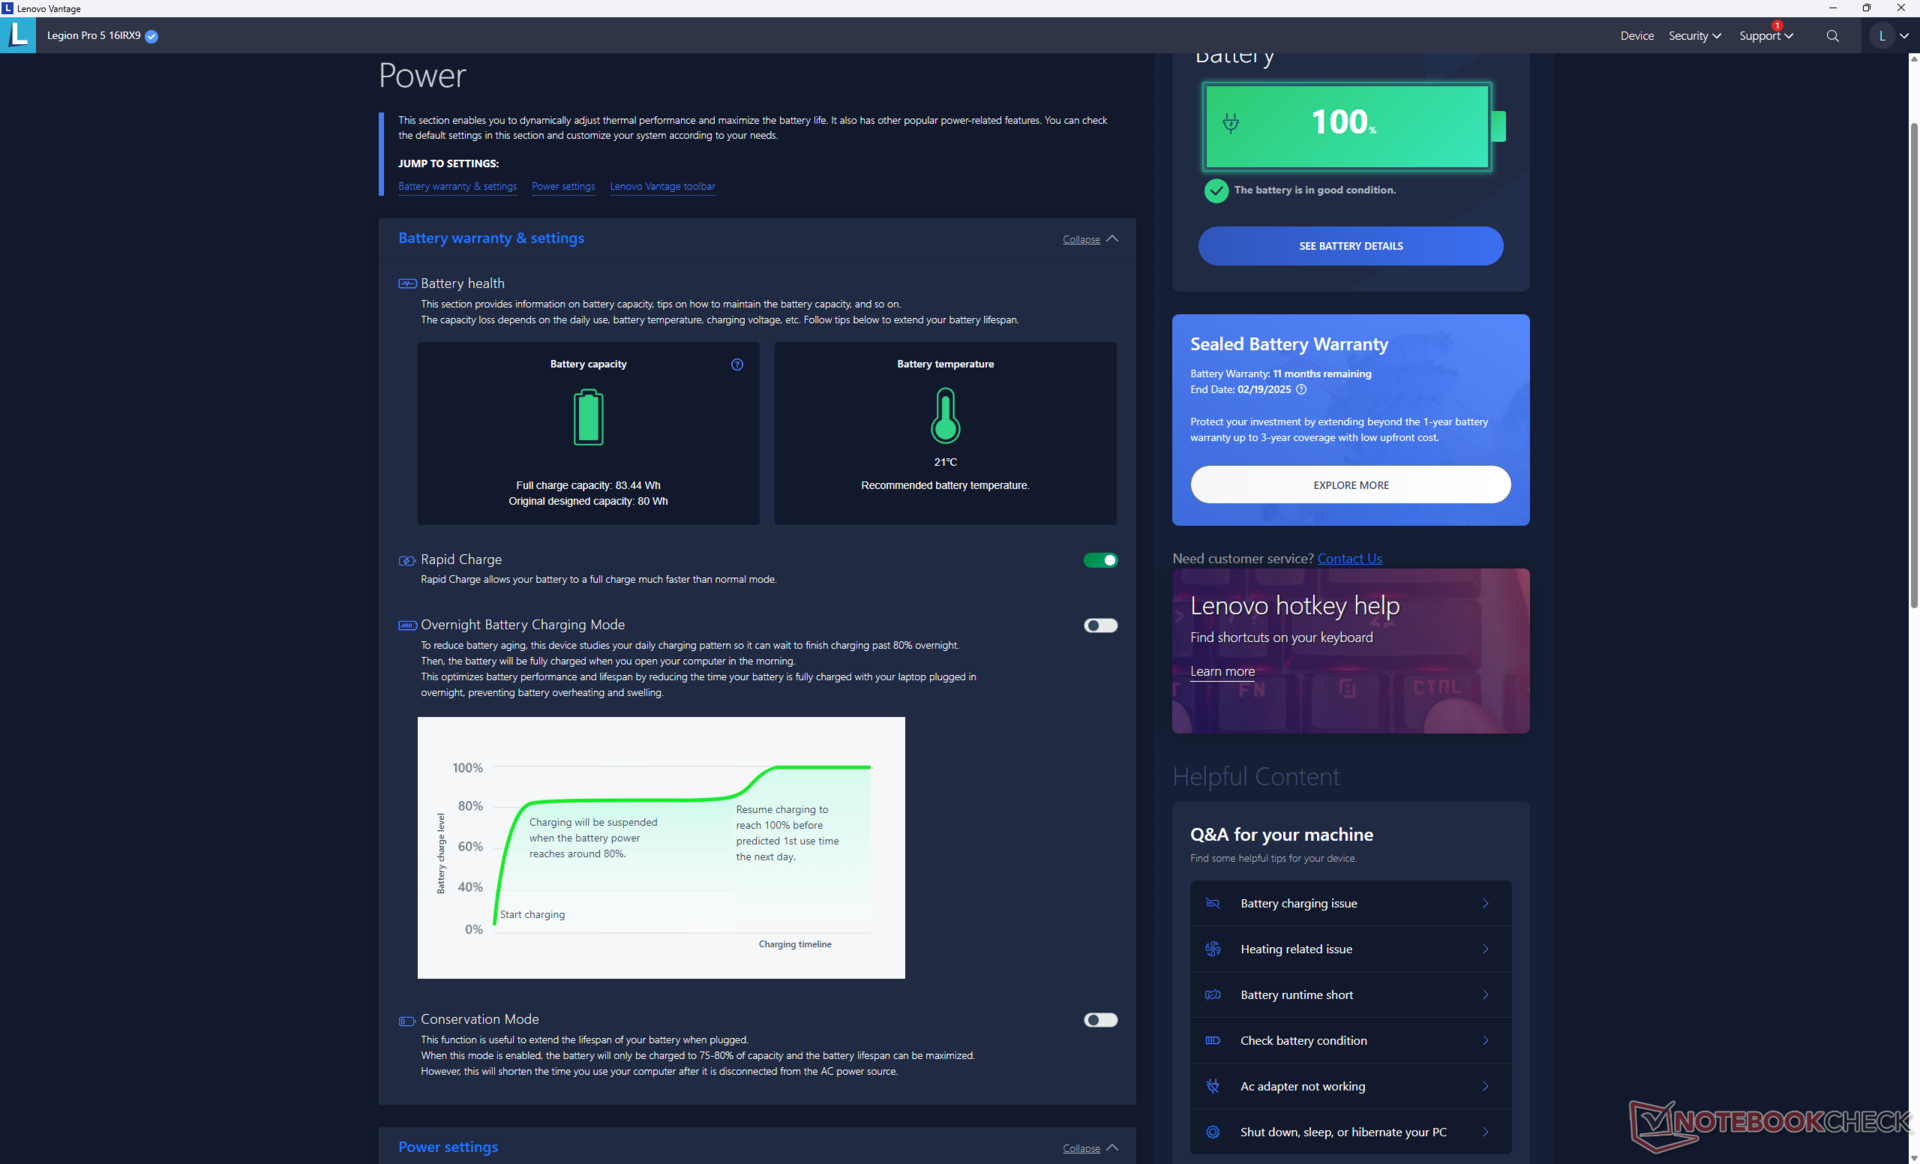
At 80 Wh, battery capacity is smaller than most other 16-inch laptops where 90 Wh or greater is common. Even so, battery life is longer than on last year's Legion Pro 5 16IRX8 by almost 90 minutes. The Zephyrus G16 and Alienware m16 R2 can each last for hours longer, but they also ship with slower Core Ultra 7 CPUs.
Charging from empty to full capacity is very fast at just under an hour compared to 1.5 to 2 hours on most other laptops. Lenovo Rapid Charge is toggled on by default. The system can also be charged with third-party USB-C adapters via the rear USB-C port.
| Lenovo Legion Pro 5 16IRX9 i9-14900HX, NVIDIA GeForce RTX 4070 Laptop GPU, 80 Wh | Lenovo Legion Pro 5 16IRX8 i7-13700HX, NVIDIA GeForce RTX 4060 Laptop GPU, 80 Wh | Alienware m16 R2 Ultra 7 155H, NVIDIA GeForce RTX 4070 Laptop GPU, 90 Wh | HP Omen Transcend 16-u1095ng i9-14900HX, NVIDIA GeForce RTX 4070 Laptop GPU, 97 Wh | Asus ROG Zephyrus G16 2024 GU605M Ultra 7 155H, NVIDIA GeForce RTX 4070 Laptop GPU, 90 Wh | MSI Stealth 16 Mercedes-AMG Motorsport A13VG i9-13900H, NVIDIA GeForce RTX 4070 Laptop GPU, 99.99 Wh | |
|---|---|---|---|---|---|---|
| Battery Runtime | -22% | 49% | 1% | 30% | 34% | |
| Reader / Idle | 403 | 401 0% | 758 88% | |||
| WiFi v1.3 | 290 | 205 -29% | 483 67% | 292 1% | 435 50% | 388 34% |
| Load | 65 | 41 -37% | 60 -8% | 71 9% | ||
| H.264 | 671 |
Pros
Cons
Verdict — Simple Changes For A Similar Experience As Before
Similar to the recent Alienware m18 R2, the Lenovo Legion Pro 5 16 G9 doesn't offer enough over its immediate predecessor to be worthy of an upgrade. It's just as good as before, but it doesn't move the needle very much as it's locked to the same GPU options alongside rebranded Raptor Lake-HX CPUs. In other words, the 2024 Legion Pro 5 16 performs almost identically to the less expensive 2023 version when it comes to gaming. It would be wise to check for any deals on the 2023 SKUs before considering the newer 2024 options.
There are a few minor additions with the most notable being a new DCI-P3 panel option whereas last year's model was limited to sRGB colors only. However, innate drawbacks such as the large size, large AC adapter, and loud fans remain.
Unless if you truly desire DCI-P3 colors, the 2024 Lenovo Legion Pro 5 16IRX9 is almost identical to the now less expensive 2023 model in performance, options, and physical features.
The Legion Pro 5 16 can be attractive to those who prefer Core HX-series CPUs over the slower Core Ultra options. Otherwise, smaller or more portable alternatives like the Asus ROG Zephyrus G16 or Alienware m16 R2 have slower processor performance but with almost the same gaming performance.
Price and Availability
Lenovo is now shipping the Legion 5 Pro 16 starting at $1770 for the Core i7-14650HX and RTX 4060 configuration up to $2000 for our Core i9-14900HX and RTX 4070 configuration.
Lenovo Legion Pro 5 16IRX9
-
03/28/2024 v7
Allen Ngo
More articles related to this device
Lenovo Legion Pro 5 16IRX9 (Legion Pro 5 Series)Related Articles


Transparency
The present review sample was made available to the author as a loan by the manufacturer or a shop for the purposes of review. The lender had no influence on this review, nor did the manufacturer receive a copy of this review before publication. There was no obligation to publish this review.
Pricecompare
