NVIDIA Quadro P5000 Max-Q vs NVIDIA T500 Laptop GPU vs NVIDIA Quadro RTX 4000 (Laptop)
NVIDIA Quadro P5000 Max-Q ► remove from comparison
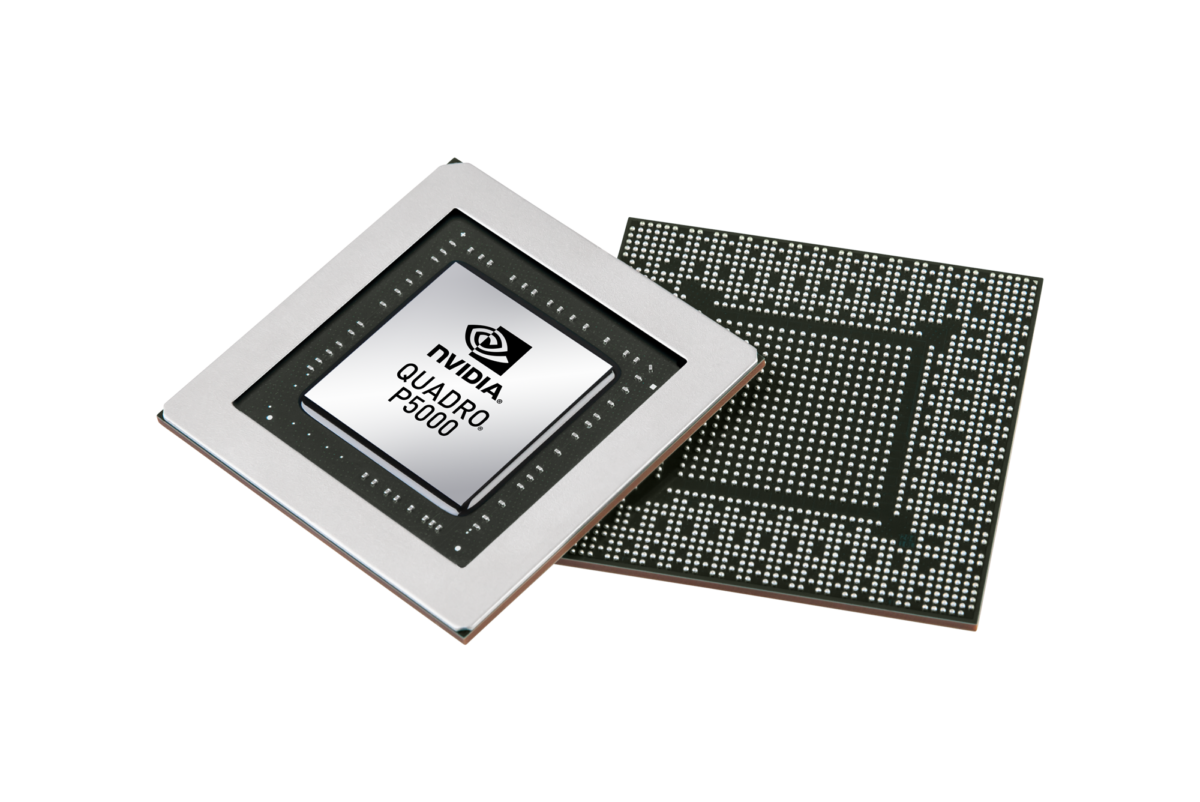
The Nvidia Quadro P5000 Max-Q (official Nvidia Quadro P5000 with Max-Q Design) is a mobile high-end workstation graphics card for notebooks. It is the power efficient variant of the normal Quadro P5000 for laptops and offers slightly reduced clock speeds (1101 - 1366 MHz versus 1164 - 1506 MHz) and a greatly reduced power consumption (80 versus 100 Watt TGP). Similar to the consumer GeForce GTX 1070 Max-Q (Laptop), it is based on a slimmed-down GP104 chip with 2048 shaders. The graphics card is designed for the Kaby Lake generation.
The Quadro GPUs offer certified drivers , which are optimized for stability and performance in professional applications (CAD, DCC, medical, prospection, and visualizing applications). The performance in these areas is therefore much better compared to corresponding consumer GPUs.
Performance
The theoretical performance should be slightly below the normal Quadro P4000 due to the reduced clock speeds.
Power Consumption
With an TGP of 80 Watt, the P5000 Max-Q is only slightly higher rated (5 Watt) as the much slower Quadro P3000 (75 Watt) and therefore similar sized laptops can use the P5000 Max-Q.
NVIDIA T500 Laptop GPU ► remove from comparison
The Nvidia T500 Mobile (formerly known as Quadro T500) for laptops is a professional mobile graphics card that is based on the Turing architecture (TU117 chip). It is based on the consumer GeForce MX450 and features the same 896 cores and a 64 Bit memory bus. Currently it is available with 2 or 4 GB graphics RAM (GDDR5 or GDDR6). The TDP ranges between 18 - 25 Watt depending on the variant. As the MX450, the T500 also supports PCIe 4.0. The chip is manufactured in 12nm FinFET at TSMC.
The Turing generation did not only introduce raytracing for the RTX cards, but also optimized the architecture of the cores and caches. According to Nvidia the CUDA cores offer now a concurrent execution of floating point and integer operations for increased performance in compute-heavy workloads of modern games. Furthermore, the caches were reworked (new unified memory architecture with twice the cache compared to Pascal). This leads to up to 50% more instructions per clock and a 40% more power efficient usage compared to Pascal. In contrary to the faster Quadro RTX cards, the T500 does not feature raytracing and Tensor cores.
NVIDIA Quadro RTX 4000 (Laptop) ► remove from comparison
The Nvidia Quadro RTX 4000 for laptops is a professional high-end graphics card for big and powerful laptops and mobile workstations. It is based on the same TU104 chip as the consumer GeForce RTX 2080 (mobile) but offers less shaders (2,560) and is therefore positioned between the GeForce RTX 2080 (2,944) and 2070 (2,304). Compared to the desktop RTX 4000, the mobile variant offers lower clock speeds.
The Quadro GPUs offer certified drivers , which are optimized for stability and performance in professional applications (CAD, DCC, medical, prospection, and visualizing applications). The performance in these areas is therefore much better compared to corresponding consumer GPUs.
NVIDIA manufacturers the TU104 chip on a 12 nm FinFET process and includes features like Deep Learning Super Sampling (DLSS) and Real-Time Ray Tracing (RTRT), which should combine to create more realistic lighting effects than older GPUs based on the company's Pascal architecture (if the games support it). The Quadro RTX 5000 is also DisplayPort 1.4 ready, while there is also support for HDMI 2.0b, HDR, Simultaneous Multi-Projection (SMP) and H.265 video en/decoding (PlayReady 3.0).
Performance
For professional applications, the Quadro RTX 4000 should slot right in between the RTX 5000 and RTX 3000 cards. In games, the RTX 4000 is between the RTX 2080 and 2070. This means the GPU is located in the high end tier for all applications.
The high power consumption of the RTX4000 makes the card most suited for big and heavy laptops. The slower Max-Q variant is intended for thinner laptops.
NVIDIA Quadro P5000 Max-Q NVIDIA T500 Laptop GPU NVIDIA Quadro RTX 4000 (Laptop) Quadro Turing Series Codename N17E-Q5 Max-Q N19E-Q3 Architecture Pascal Turing Turing Pipelines 2048 - unified 896 - unified 2560 - unified Core Speed 1101 - 1366 (Boost) MHz 1365 - 1695 (Boost) MHz 1110 - 1560 (Boost) MHz Memory Speed 6006 MHz 10000 MHz 14000 MHz Memory Bus Width 256 Bit 64 Bit 256 Bit Memory Type GDDR5 GDDR5, GDDR6 GDDR6 Max. Amount of Memory 16 GB 4 GB 8 GB Shared Memory no no no API DirectX 12_1, Shader 5.0, OpenGL 4.5 DirectX 12_1, OpenGL 4.6 DirectX 12_1, OpenGL 4.6 Power Consumption 100 Watt 25 Watt 110 Watt technology 16 nm 12 nm 12 nm Features Optimus,
PhysX, 3D Vision Pro, nView, Optimus DLSS, Raytraycing, VR Ready, G-SYNC, Vulkan, Multi Monitor Notebook Size large medium sized large Date of Announcement 11.01.2017 27.05.2019 27.05.2019 Link to Manufacturer Page www.nvidia.com Transistors 10.8 Billion
Benchmarks Performance Rating - 3DMark 11 + Fire Strike + Time Spy - T500 Laptop GPU
1.9 pt (6%)
...
...
max:
3DMark - 3DMark Time Spy Score
min: 1627 avg: 1953 median: 1958 (6%) max: 2270 Points
GPU TDP ? TDP 18 W TDP 22 W TDP 25 W 100% 72% 92% 80%
min: 6823 avg: 7362 median: 7362 (21%) max: 7901 Points
GPU TDP ? TDP 18 W TDP 22 W TDP 25 W TDP 110 W 58% 21% 27% 23% 100%
3DMark - 3DMark Time Spy Graphics
min: 1554 avg: 1814 median: 1787.5 (5%) max: 2127 Points
GPU TDP ? TDP 18 W TDP 22 W TDP 25 W 100% 73% 91% 77%
min: 6851 avg: 7284 median: 7284 (19%) max: 7717 Points
GPU TDP ? TDP 18 W TDP 22 W TDP 25 W TDP 110 W 58% 20% 25% 21% 100%
3DMark - 3DMark Ice Storm Unlimited Graphics
445161 Points (50%)
3DMark - 3DMark Cloud Gate Score
min: 15562 avg: 15975 median: 15851 (17%) max: 16513 Points
GPU TDP ? TDP 22 W TDP 25 W 94% 96% 100%
38830 Points (42%)
GPU TDP ? TDP 22 W TDP 25 W 100% 58% 61%
3DMark - 3DMark Cloud Gate Graphics
min: 22719 avg: 24657 median: 23453 (6%) max: 27800 Points
GPU TDP ? TDP 22 W TDP 25 W 100% 84% 82%
119052 Points (31%)
GPU TDP ? TDP 22 W TDP 25 W 100% 32% 31%
3DMark - 3DMark Fire Strike Standard Score
min: 3406 avg: 4047 median: 3973.5 (7%) max: 4833 Points
GPU TDP ? TDP 18 W TDP 22 W TDP 25 W 100% 70% 90% 74%
min: 15912 avg: 16903 median: 16903 (30%) max: 17894 Points
GPU TDP ? TDP 18 W TDP 22 W TDP 25 W TDP 110 W 58% 19% 24% 20% 100%
3DMark - 3DMark Fire Strike Standard Graphics
min: 3696 avg: 4322 median: 4224.5 (5%) max: 5141 Points
GPU TDP ? TDP 18 W TDP 22 W TDP 25 W 100% 72% 90% 74%
min: 17619 avg: 18849 median: 18849 (21%) max: 20079 Points
GPU TDP ? TDP 18 W TDP 22 W TDP 25 W TDP 110 W 57% 18% 23% 19% 100%
3DMark - 3DMark Ice Storm Graphics
80696 Points (10%)
3DMark 11 - 3DM11 Performance Score
min: 6293 avg: 7692 median: 8132 (11%) max: 8212 Points
GPU TDP ? TDP 18 W TDP 22 W TDP 25 W 99% 77% 99% 100%
min: 19880 avg: 21595 median: 21595 (30%) max: 23310 Points
GPU TDP ? TDP 18 W TDP 22 W TDP 25 W TDP 110 W 60% 27% 35% 35% 100%
3DMark 11 - 3DM11 Performance GPU
min: 6767 avg: 7808 median: 7995.5 (7%) max: 8475 Points
GPU TDP ? TDP 18 W TDP 22 W TDP 25 W 100% 80% 95% 93%
min: 23739 avg: 25371 median: 25370.5 (22%) max: 27002 Points
GPU TDP ? TDP 18 W TDP 22 W TDP 25 W TDP 110 W 60% 25% 30% 29% 100%
3DMark Vantage + NVIDIA Quadro RTX 4000 (Laptop) 3DMark Vantage - 3DM Vant. Perf. total
56250 Points (16%)
3DM Vant. Perf. GPU no PhysX + NVIDIA Quadro RTX 4000 (Laptop) 3DMark Vantage - 3DM Vant. Perf. GPU no PhysX
62557 Points (35%)
3DMark 06 3DMark 06 - Standard 1280x1024 + NVIDIA T500 Laptop GPU
31133 Points (41%)
Unigine Valley 1.0 - Unigine Valley 1.0 DX
89.9 fps (29%)
SPECviewperf 12 + NVIDIA Quadro RTX 4000 (Laptop) SPECviewperf 12 - specvp12 sw-03
149.1 fps (37%)
specvp12 snx-02 + NVIDIA Quadro RTX 4000 (Laptop) SPECviewperf 12 - specvp12 snx-02
186 fps (27%)
specvp12 showcase-01 + NVIDIA Quadro RTX 4000 (Laptop) SPECviewperf 12 - specvp12 showcase-01
98 fps (21%)
specvp12 mediacal-01 + NVIDIA Quadro RTX 4000 (Laptop) SPECviewperf 12 - specvp12 mediacal-01
62.4 fps (16%)
specvp12 maya-04 + NVIDIA Quadro RTX 4000 (Laptop) SPECviewperf 12 - specvp12 maya-04
144.1 fps (39%)
specvp12 energy-01 + NVIDIA Quadro RTX 4000 (Laptop) SPECviewperf 12 - specvp12 energy-01
13.9 fps (12%)
specvp12 creo-01 + NVIDIA Quadro RTX 4000 (Laptop) SPECviewperf 12 - specvp12 creo-01
140.7 fps (56%)
specvp12 catia-04 + NVIDIA Quadro RTX 4000 (Laptop) SPECviewperf 12 - specvp12 catia-04
161.9 fps (27%)
SPECviewperf 13 specvp13 sw-04 + NVIDIA T500 Laptop GPU SPECviewperf 13 - specvp13 sw-04
min: 64.9 avg: 80.7 median: 82.1 (22%) max: 93.6 fps
GPU TDP ? TDP 18 W TDP 22 W TDP 25 W 100% 86% 90% 69%
specvp13 sw-04 + NVIDIA Quadro RTX 4000 (Laptop)
min: 125.4 avg: 152.2 median: 152.2 (41%) max: 178.9 fps
GPU TDP ? TDP 18 W TDP 22 W TDP 25 W TDP 110 W 61% 45% 47% 36% 100%
specvp13 snx-03 + NVIDIA T500 Laptop GPU SPECviewperf 13 - specvp13 snx-03
min: 71.2 avg: 79.2 median: 77.5 (9%) max: 90.8 fps
GPU TDP ? TDP 18 W TDP 22 W TDP 25 W 100% 78% 91% 80%
specvp13 snx-03 + NVIDIA Quadro RTX 4000 (Laptop)
min: 271.1 avg: 314.1 median: 314.1 (35%) max: 357.1 fps
GPU TDP ? TDP 18 W TDP 22 W TDP 25 W TDP 110 W 51% 20% 23% 20% 100%
specvp13 showcase-02 + NVIDIA T500 Laptop GPU SPECviewperf 13 - specvp13 showcase-02
min: 16.01 avg: 18.9 median: 16.9 (4%) max: 23.87 fps
GPU TDP ? TDP 18 W TDP 22 W 100% 71% 67%
specvp13 showcase-02 + NVIDIA Quadro RTX 4000 (Laptop)
min: 94 avg: 97.2 median: 97.2 (21%) max: 100.3 fps
GPU TDP ? TDP 18 W TDP 22 W TDP 110 W 59% 17% 16% 100%
specvp13 medical-02 + NVIDIA T500 Laptop GPU SPECviewperf 13 - specvp13 medical-02
min: 24.84 avg: 29.6 median: 28.7 (6%) max: 36.14 fps
GPU TDP ? TDP 18 W TDP 22 W TDP 25 W 100% 73% 86% 69%
specvp13 medical-02 + NVIDIA Quadro RTX 4000 (Laptop)
min: 73.2 avg: 87.9 median: 87.9 (18%) max: 102.5 fps
GPU TDP ? TDP 18 W TDP 22 W TDP 25 W TDP 110 W 53% 26% 30% 24% 100%
specvp13 maya-05 + NVIDIA T500 Laptop GPU SPECviewperf 13 - specvp13 maya-05
min: 48.47 avg: 53.5 median: 51.9 (6%) max: 62 fps
GPU TDP ? TDP 18 W TDP 22 W TDP 25 W 100% 81% 86% 78%
specvp13 maya-05 + NVIDIA Quadro RTX 4000 (Laptop)
min: 207.9 avg: 247 median: 247 (28%) max: 286.1 fps
GPU TDP ? TDP 18 W TDP 22 W TDP 25 W TDP 110 W 47% 18% 19% 17% 100%
specvp13 energy-02 + NVIDIA T500 Laptop GPU SPECviewperf 13 - specvp13 energy-02
min: 8.57 avg: 9.6 median: 8.7 (3%) max: 12.41 fps
GPU TDP ? TDP 18 W TDP 22 W TDP 25 W 100% 69% 71% 69%
specvp13 energy-02 + NVIDIA Quadro RTX 4000 (Laptop)
min: 36.03 avg: 40.5 median: 40.5 (13%) max: 45.02 fps
GPU TDP ? TDP 18 W TDP 22 W TDP 25 W TDP 110 W 54% 19% 20% 19% 100%
specvp13 creo-02 + NVIDIA T500 Laptop GPU SPECviewperf 13 - specvp13 creo-02
min: 55.8 avg: 62.1 median: 59.2 (9%) max: 74.3 fps
GPU TDP ? TDP 18 W TDP 22 W TDP 25 W 100% 77% 83% 75%
specvp13 creo-02 + NVIDIA Quadro RTX 4000 (Laptop)
min: 208 avg: 239 median: 239 (35%) max: 269.9 fps
GPU TDP ? TDP 18 W TDP 22 W TDP 25 W TDP 110 W 52% 21% 23% 21% 100%
specvp13 catia-05 + NVIDIA T500 Laptop GPU SPECviewperf 13 - specvp13 catia-05
min: 81.9 avg: 88.6 median: 88.3 (10%) max: 95.8 fps
GPU TDP ? TDP 18 W TDP 22 W TDP 25 W 100% 88% 97% 85%
specvp13 catia-05 + NVIDIA Quadro RTX 4000 (Laptop)
min: 212.6 avg: 245 median: 245 (27%) max: 277.3 fps
GPU TDP ? TDP 18 W TDP 22 W TDP 25 W TDP 110 W 56% 30% 33% 30% 100%
specvp13 3dsmax-06 + NVIDIA T500 Laptop GPU SPECviewperf 13 - specvp13 3dsmax-06
min: 45.15 avg: 51 median: 50.4 (9%) max: 57.9 fps
GPU TDP ? TDP 18 W TDP 22 W TDP 25 W 100% 83% 91% 78%
specvp13 3dsmax-06 + NVIDIA Quadro RTX 4000 (Laptop)
min: 173 avg: 178.7 median: 178.7 (31%) max: 184.3 fps
GPU TDP ? TDP 18 W TDP 22 W TDP 25 W TDP 110 W 63% 26% 29% 24% 100%
SPECviewperf 2020 specvp2020 solidworks-05 1080p + NVIDIA T500 Laptop GPU SPECviewperf 2020 - specvp2020 solidworks-05 1080p
min: 37.82 avg: 40.2 median: 39.1 (8%) max: 43.59 fps
GPU TDP ? TDP 18 W TDP 25 W 100% 90% 87%
specvp2020 snx-04 1080p + NVIDIA T500 Laptop GPU SPECviewperf 2020 - specvp2020 snx-04 1080p
min: 66.2 avg: 76 median: 68.8 (11%) max: 93.1 fps
GPU TDP ? TDP 18 W TDP 25 W 100% 74% 71%
specvp2020 medical-03 1080p + NVIDIA T500 Laptop GPU SPECviewperf 2020 - specvp2020 medical-03 1080p
min: 10.73 avg: 12.1 median: 11 (8%) max: 14.74 fps
GPU TDP ? TDP 18 W TDP 25 W 100% 74% 73%
specvp2020 maya-06 1080p + NVIDIA T500 Laptop GPU SPECviewperf 2020 - specvp2020 maya-06 1080p
min: 59 avg: 65.5 median: 59.3 (9%) max: 78.1 fps
GPU TDP ? TDP 18 W TDP 25 W 100% 76% 76%
specvp2020 energy-03 1080p + NVIDIA T500 Laptop GPU SPECviewperf 2020 - specvp2020 energy-03 1080p
min: 8.62 avg: 9.7 median: 8.7 (7%) max: 11.96 fps
GPU TDP ? TDP 18 W TDP 25 W 100% 72% 72%
specvp2020 creo-03 1080p + NVIDIA T500 Laptop GPU SPECviewperf 2020 - specvp2020 creo-03 1080p
min: 29.28 avg: 34.7 median: 32.7 (16%) max: 41.95 fps
GPU TDP ? TDP 18 W TDP 25 W 100% 70% 78%
specvp2020 catia-06 1080p + NVIDIA T500 Laptop GPU SPECviewperf 2020 - specvp2020 catia-06 1080p
min: 16.48 avg: 19.2 median: 18 (12%) max: 23.22 fps
GPU TDP ? TDP 18 W TDP 25 W 100% 77% 71%
specvp2020 3dsmax-07 1080p + NVIDIA T500 Laptop GPU SPECviewperf 2020 - specvp2020 3dsmax-07 1080p
min: 19.56 avg: 23.3 median: 21.6 (10%) max: 28.9 fps
GPU TDP ? TDP 18 W TDP 25 W 100% 75% 68%
Cinebench R10 Cinebench R10 Shading (32bit) + NVIDIA Quadro RTX 4000 (Laptop) Cinebench R10 - Cinebench R10 Shading (32bit)
6824 Points (5%)
Cinebench R11.5 Cinebench R11.5 OpenGL 64 Bit + NVIDIA T500 Laptop GPU Cinebench R11.5 - Cinebench R11.5 OpenGL 64 Bit
156.6 fps (54%)
Cinebench R11.5 OpenGL 64 Bit + NVIDIA Quadro RTX 4000 (Laptop)
127.6 fps (44%)
GPU TDP ? TDP 22 W 81% 100%
Cinebench R15 + NVIDIA T500 Laptop GPU Cinebench R15 - Cinebench R15 OpenGL 64 Bit
min: 134 avg: 168.8 median: 173 (10%) max: 195 fps
GPU TDP ? TDP 18 W TDP 22 W TDP 25 W 100% 69% 99% 78%
Cinebench R15 OpenGL 64 Bit + NVIDIA Quadro RTX 4000 (Laptop)
min: 197 avg: 215.5 median: 215.5 (13%) max: 234 fps
GPU TDP ? TDP 18 W TDP 22 W TDP 25 W TDP 110 W 84% 57% 82% 65% 100%
Cinebench R15 OpenGL Ref. Match 64 Bit + NVIDIA T500 Laptop GPU Cinebench R15 - Cinebench R15 OpenGL Ref. Match 64 Bit
99.6 % (100%)
GPU TDP ? TDP 18 W TDP 22 W TDP 25 W 100% 100% 100% 100%
Cinebench R15 OpenGL Ref. Match 64 Bit + NVIDIA Quadro RTX 4000 (Laptop)
min: 99.6 avg: 99.8 median: 99.8 (100%) max: 100 %
GPU TDP ? TDP 18 W TDP 22 W TDP 25 W TDP 110 W 100% 100% 100% 100% 100%
GFXBench - GFXBench Car Chase Offscreen
119 fps (13%)
305.3 fps (34%)
GPU TDP ? TDP 22 W 100% 39%
GFXBench 3.1 - GFXBench Manhattan ES 3.1 Offscreen
183 fps (4%)
440.5 fps (9%)
GPU TDP ? TDP 22 W 100% 42%
GFXBench 3.0 - GFXBench 3.0 Manhattan Offscreen
236 fps (14%)
490.4 fps (29%)
GPU TDP ? TDP 22 W 100% 48%
GFXBench (DX / GLBenchmark) 2.7 + NVIDIA T500 Laptop GPU GFXBench (DX / GLBenchmark) 2.7 - GFXBench T-Rex HD Offscreen C24Z16
503 fps (4%)
GFXBench T-Rex HD Offscreen C24Z16 + NVIDIA Quadro RTX 4000 (Laptop)
1213 fps (10%)
GPU TDP ? TDP 22 W 100% 41%
LuxMark v2.0 64Bit - LuxMark v2.0 Room GPU
653 Samples/s (3%)
2840 Samples/s (13%)
GPU TDP ? TDP 22 W 100% 23%
LuxMark v2.0 64Bit - LuxMark v2.0 Sala GPU
1976 Samples/s (3%)
5927 Samples/s (10%)
GPU TDP ? TDP 22 W 100% 33%
ComputeMark v2.1 - ComputeMark v2.1 Result
4734 Points (5%)
13576 Points (15%)
GPU TDP ? TDP 22 W 100% 35%
Power Consumption - Furmark Stress Test Power Consumption - external Monitor *
min: 45.1 avg: 47.1 median: 47.1 (7%) max: 49 Watt
GPU TDP ? TDP 18 W 100% 101%
Power Consumption - The Witcher 3 Power Consumption - external Monitor *
min: 36.6 avg: 43.7 median: 43.7 (6%) max: 50.8 Watt
GPU TDP ? TDP 18 W 100% 102%
Power Consumption - Witcher 3 Power Consumption *
min: 37.1 avg: 49.9 median: 53 (12%) max: 59.6 Watt
GPU TDP ? TDP 18 W TDP 22 W 102% 106% 100%
min: 137 avg: 159.5 median: 159.5 (35%) max: 182 Watt
GPU TDP ? TDP 18 W TDP 22 W TDP 110 W 132% 153% 145% 100%
Power Consumption - Witcher 3 ultra Power Efficiency
min: 0.3674 avg: 0.4 median: 0.4 (38%) max: 0.4555 fps per Watt
GPU TDP ? TDP 18 W TDP 22 W 92% 100% 81%
min: 0.4341 avg: 0.5 median: 0.5 (43%) max: 0.511 fps per Watt
GPU TDP ? TDP 18 W TDP 22 W TDP 110 W 100% 98% 79% 93%
Power Consumption - Witcher 3 ultra Power Efficiency - external Monitor
min: 0.439 avg: 0.5 median: 0.5 (37%) max: 0.4617 fps per Watt
GPU TDP ? TDP 18 W 95% 100%
Emissions Witcher 3 Fan Noise + NVIDIA T500 Laptop GPU Emissions - Witcher 3 Fan Noise
min: 36.1 avg: 38.1 median: 38.1 (61%) max: 40.1 dB(A)
GPU TDP ? TDP 22 W 90% 100%
Witcher 3 Fan Noise + NVIDIA Quadro RTX 4000 (Laptop)
min: 39.6 avg: 40.8 median: 40.8 (65%) max: 41.9 dB(A)
GPU TDP ? TDP 22 W TDP 110 W 97% 100% 99%
Average Benchmarks NVIDIA T500 Laptop GPU → 0% n= Average Benchmarks NVIDIA Quadro RTX 4000 (Laptop) → 0% n=
- Range of benchmark values for this graphics card
- Average benchmark values for this graphics card
* Smaller numbers mean a higher performance
1 This benchmark is not used for the average calculation
Game Benchmarks The following benchmarks stem from our benchmarks of review laptops. The performance depends on the used graphics memory, clock rate, processor, system settings, drivers, and operating systems. So the results don't have to be representative for all laptops with this GPU. For detailed information on the benchmark results, click on the fps number.
T500 Laptop GPU:
10.9 15 ~ 13 fps
Quadro RTX 4000 (Laptop):
283 fps
Quadro RTX 4000 (Laptop):
207 fps
Quadro RTX 4000 (Laptop):
171 fps
Quadro RTX 4000 (Laptop):
121 fps
Quadro RTX 4000 (Laptop):
89 fps
Quadro RTX 4000 (Laptop):
50 fps
Quadro RTX 4000 (Laptop):
98 fps
Quadro RTX 4000 (Laptop):
77.5 fps
Quadro RTX 4000 (Laptop):
42.6 fps
Quadro RTX 4000 (Laptop):
37.7 fps
Quadro RTX 4000 (Laptop):
22.4 fps
Quadro RTX 4000 (Laptop):
180 fps
Quadro RTX 4000 (Laptop):
122 fps
Quadro RTX 4000 (Laptop):
96 fps
Quadro RTX 4000 (Laptop):
70 fps
Quadro RTX 4000 (Laptop):
47 fps
Quadro RTX 4000 (Laptop):
25 fps
Quadro RTX 4000 (Laptop):
267 fps
Quadro RTX 4000 (Laptop):
180.7 fps
Quadro RTX 4000 (Laptop):
151 fps
Quadro RTX 4000 (Laptop):
85.6 fps
Quadro RTX 4000 (Laptop):
63.3 fps
Quadro RTX 4000 (Laptop):
118 124 ~ 121 fps
Quadro RTX 4000 (Laptop):
102 104 ~ 103 fps
Quadro RTX 4000 (Laptop):
99 103 ~ 101 fps
Quadro RTX 4000 (Laptop):
88 94 ~ 91 fps
Quadro RTX 4000 (Laptop):
72 82 ~ 77 fps
Quadro RTX 4000 (Laptop):
39 46 ~ 43 fps
Quadro RTX 4000 (Laptop):
150 fps
Quadro RTX 4000 (Laptop):
125 fps
Quadro RTX 4000 (Laptop):
93 fps
Quadro RTX 4000 (Laptop):
86 fps
Quadro RTX 4000 (Laptop):
60 fps
Quadro RTX 4000 (Laptop):
33 fps
Quadro RTX 4000 (Laptop):
143.8 fps
Quadro RTX 4000 (Laptop):
119.2 fps
Quadro RTX 4000 (Laptop):
105.2 fps
Quadro RTX 4000 (Laptop):
69.1 fps
Quadro RTX 4000 (Laptop):
34.2 fps
Quadro RTX 4000 (Laptop):
116.7 fps
Quadro RTX 4000 (Laptop):
100.6 fps
Quadro RTX 4000 (Laptop):
86.6 fps
Quadro RTX 4000 (Laptop):
81 fps
Quadro RTX 4000 (Laptop):
65.5 fps
Quadro RTX 4000 (Laptop):
41.8 fps
Quadro RTX 4000 (Laptop):
95.4 fps
Quadro RTX 4000 (Laptop):
93.6 fps
Quadro RTX 4000 (Laptop):
85.8 fps
Quadro RTX 4000 (Laptop):
81.1 fps
Quadro RTX 4000 (Laptop):
72.9 fps
Quadro RTX 4000 (Laptop):
39.4 fps
Quadro RTX 4000 (Laptop):
99 fps
Quadro RTX 4000 (Laptop):
87 fps
Quadro RTX 4000 (Laptop):
75 fps
Quadro RTX 4000 (Laptop):
54 fps
Quadro RTX 4000 (Laptop):
41 fps
Quadro RTX 4000 (Laptop):
28 fps
Quadro RTX 4000 (Laptop):
138.6 fps
Quadro RTX 4000 (Laptop):
105.2 fps
Quadro RTX 4000 (Laptop):
81.6 fps
Quadro RTX 4000 (Laptop):
85 fps
Quadro RTX 4000 (Laptop):
57.1 fps
Quadro RTX 4000 (Laptop):
29.7 fps
T500 Laptop GPU:
108 113 ~ 111 fps
Quadro RTX 4000 (Laptop):
241 fps
Quadro RTX 4000 (Laptop):
180 fps
Quadro RTX 4000 (Laptop):
142 fps
Quadro RTX 4000 (Laptop):
95 fps
Quadro RTX 4000 (Laptop):
76 fps
Quadro RTX 4000 (Laptop):
48 fps
T500 Laptop GPU:
31 72 ~ 52 fps
Quadro RTX 4000 (Laptop):
129 fps
T500 Laptop GPU:
25 34 ~ 30 fps
Quadro RTX 4000 (Laptop):
106 fps
T500 Laptop GPU:
22 33 ~ 28 fps
Quadro RTX 4000 (Laptop):
100 fps
T500 Laptop GPU:
21 32 ~ 27 fps
Quadro RTX 4000 (Laptop):
96 fps
Quadro RTX 4000 (Laptop):
69 fps
Quadro RTX 4000 (Laptop):
36 fps
Quadro RTX 4000 (Laptop):
119 122 ~ 121 fps
Quadro RTX 4000 (Laptop):
107 110 ~ 109 fps
Quadro RTX 4000 (Laptop):
88 90.2 ~ 89 fps
Quadro RTX 4000 (Laptop):
76.6 fps
Quadro RTX 4000 (Laptop):
139.9 fps
Quadro RTX 4000 (Laptop):
98 fps
Quadro RTX 4000 (Laptop):
90.8 fps
Quadro RTX 4000 (Laptop):
52.9 fps
Quadro RTX 4000 (Laptop):
35 fps
Quadro RTX 4000 (Laptop):
289 fps
Quadro RTX 4000 (Laptop):
148 fps
Quadro RTX 4000 (Laptop):
141 fps
Quadro RTX 4000 (Laptop):
109 fps
Quadro RTX 4000 (Laptop):
45.7 fps
Quadro RTX 4000 (Laptop):
199.6 fps
Quadro RTX 4000 (Laptop):
127.8 fps
Quadro RTX 4000 (Laptop):
104.9 fps
Quadro RTX 4000 (Laptop):
45.1 fps
Quadro RTX 4000 (Laptop):
146 152 ~ 149 fps
Quadro RTX 4000 (Laptop):
135 140 ~ 138 fps
Quadro RTX 4000 (Laptop):
130 133 ~ 132 fps
Quadro RTX 4000 (Laptop):
124 129 ~ 127 fps
Quadro RTX 4000 (Laptop):
100 111 ~ 106 fps
Quadro RTX 4000 (Laptop):
303 345 ~ 324 fps
Quadro RTX 4000 (Laptop):
215 254 ~ 235 fps
Quadro RTX 4000 (Laptop):
132 153 ~ 143 fps
Quadro RTX 4000 (Laptop):
70 79 ~ 75 fps
Quadro RTX 4000 (Laptop):
46 56 ~ 51 fps
T500 Laptop GPU:
133 148 ~ 141 fps
T500 Laptop GPU:
19 23.2 ~ 21 fps
NVIDIA T500 Laptop GPU low med. high ultra QHD 4K Cyberpunk 2077 1.0 31 17 13 10.1 Immortals Fenyx Rising 65 35 29 24 Star Wars Squadrons 54.7 47.2 42.4 F1 2020 100 59.8 44 29.3 Strange Brigade 111 34 29 25 17.9 9.6 Far Cry 5 52 30 28 27 X-Plane 11.11 70 63 55 29.4 Final Fantasy XV Benchmark 50 24 17 12.4 5.73 Dota 2 Reborn 128 118 90 79 27.7 The Witcher 3 96 52 29 20 GTA V 141 97 42 21 13.2 14 < 30 fps < 60 fps < 120 fps ≥ 120 fps 3 5 2 2 6 3 6 4 1 7 1 1 3 5
NVIDIA Quadro RTX 4000 (Laptop) low med. high ultra QHD 4K F1 2020 283 207 171 121 89 50 Anno 1800 98 77.5 42.6 37.7 22.4 The Division 2 180 122 96 70 47 25 Dirt Rally 2.0 267 180.7 151 85.6 63.3 Far Cry New Dawn 121 103 101 91 77 43 Just Cause 4 150 125 93 86 60 33 Darksiders III 143.8 119.2 105.2 69.1 34.2 Battlefield V 116.7 100.6 86.6 81 65.5 41.8 Hitman 2 95.4 93.6 85.8 81.1 72.9 39.4 Assassin´s Creed Odyssey 99 87 75 54 41 28 Shadow of the Tomb Raider 138.6 105.2 81.6 85 57.1 29.7 F1 2018 241 180 142 95 76 48 Far Cry 5 129 106 100 96 69 36 X-Plane 11.11 121 109 89 76.6 Ghost Recon Wildlands 139.9 98 90.8 52.9 35 For Honor 289 148 141 109 45.7 Rise of the Tomb Raider 199.6 127.8 104.9 45.1 Dota 2 Reborn 149 138 132 127 106 The Witcher 3 324 235 143 75 51 < 30 fps < 60 fps < 120 fps ≥ 120 fps 3 13 9 10 12 7 3 13 2 4 9 4 12 2
For more games that might be playable and a list of all games and graphics cards visit our Gaming List
v1.27
log 16. 15:53:38
#0 checking url part for id 8084 +0s ... 0s
#1 checking url part for id 10605 +0s ... 0s
#2 checking url part for id 9856 +0s ... 0s
#3 not redirecting to Ajax server +0s ... 0s
#4 did not recreate cache, as it is less than 5 days old! Created at Sun, 16 Jun 2024 05:38:48 +0200 +0.001s ... 0.001s
#5 composed specs +0.124s ... 0.125s
#6 did output specs +0s ... 0.125s
#7 start showIntegratedCPUs +0s ... 0.125s
#8 getting avg benchmarks for device 8084 +0.038s ... 0.163s
#9 got single benchmarks 8084 +0s ... 0.164s
#10 getting avg benchmarks for device 10605 +0.02s ... 0.183s
#11 got single benchmarks 10605 +0.019s ... 0.202s
#12 getting avg benchmarks for device 9856 +0.002s ... 0.204s
#13 got single benchmarks 9856 +0.011s ... 0.216s
#14 got avg benchmarks for devices +0s ... 0.216s
#15 min, max, avg, median took s +0.323s ... 0.539s
#16 before gaming benchmark output +0s ... 0.539s
#17 Got 222 rows for game benchmarks. +0.029s ... 0.568s
#18 composed SQL query for gamebenchmarks +0s ... 0.568s
#19 got data and put it in $dataArray +0.018s ... 0.586s
#20 benchmarks composed for output. +0.052s ... 0.638s
#21 calculated avg scores. +0s ... 0.638s
#22 return log +0.002s ... 0.64s
Please share our article, every link counts!
Redaktion, 2017-09- 8 (Update: 2023-07- 1)
 Deutsch
 English
 Español
 Français
 Italiano
 Nederlands
 Polski
 Português
 Русский
 Türkçe
 Svenska
 Chinese
 Magyar