




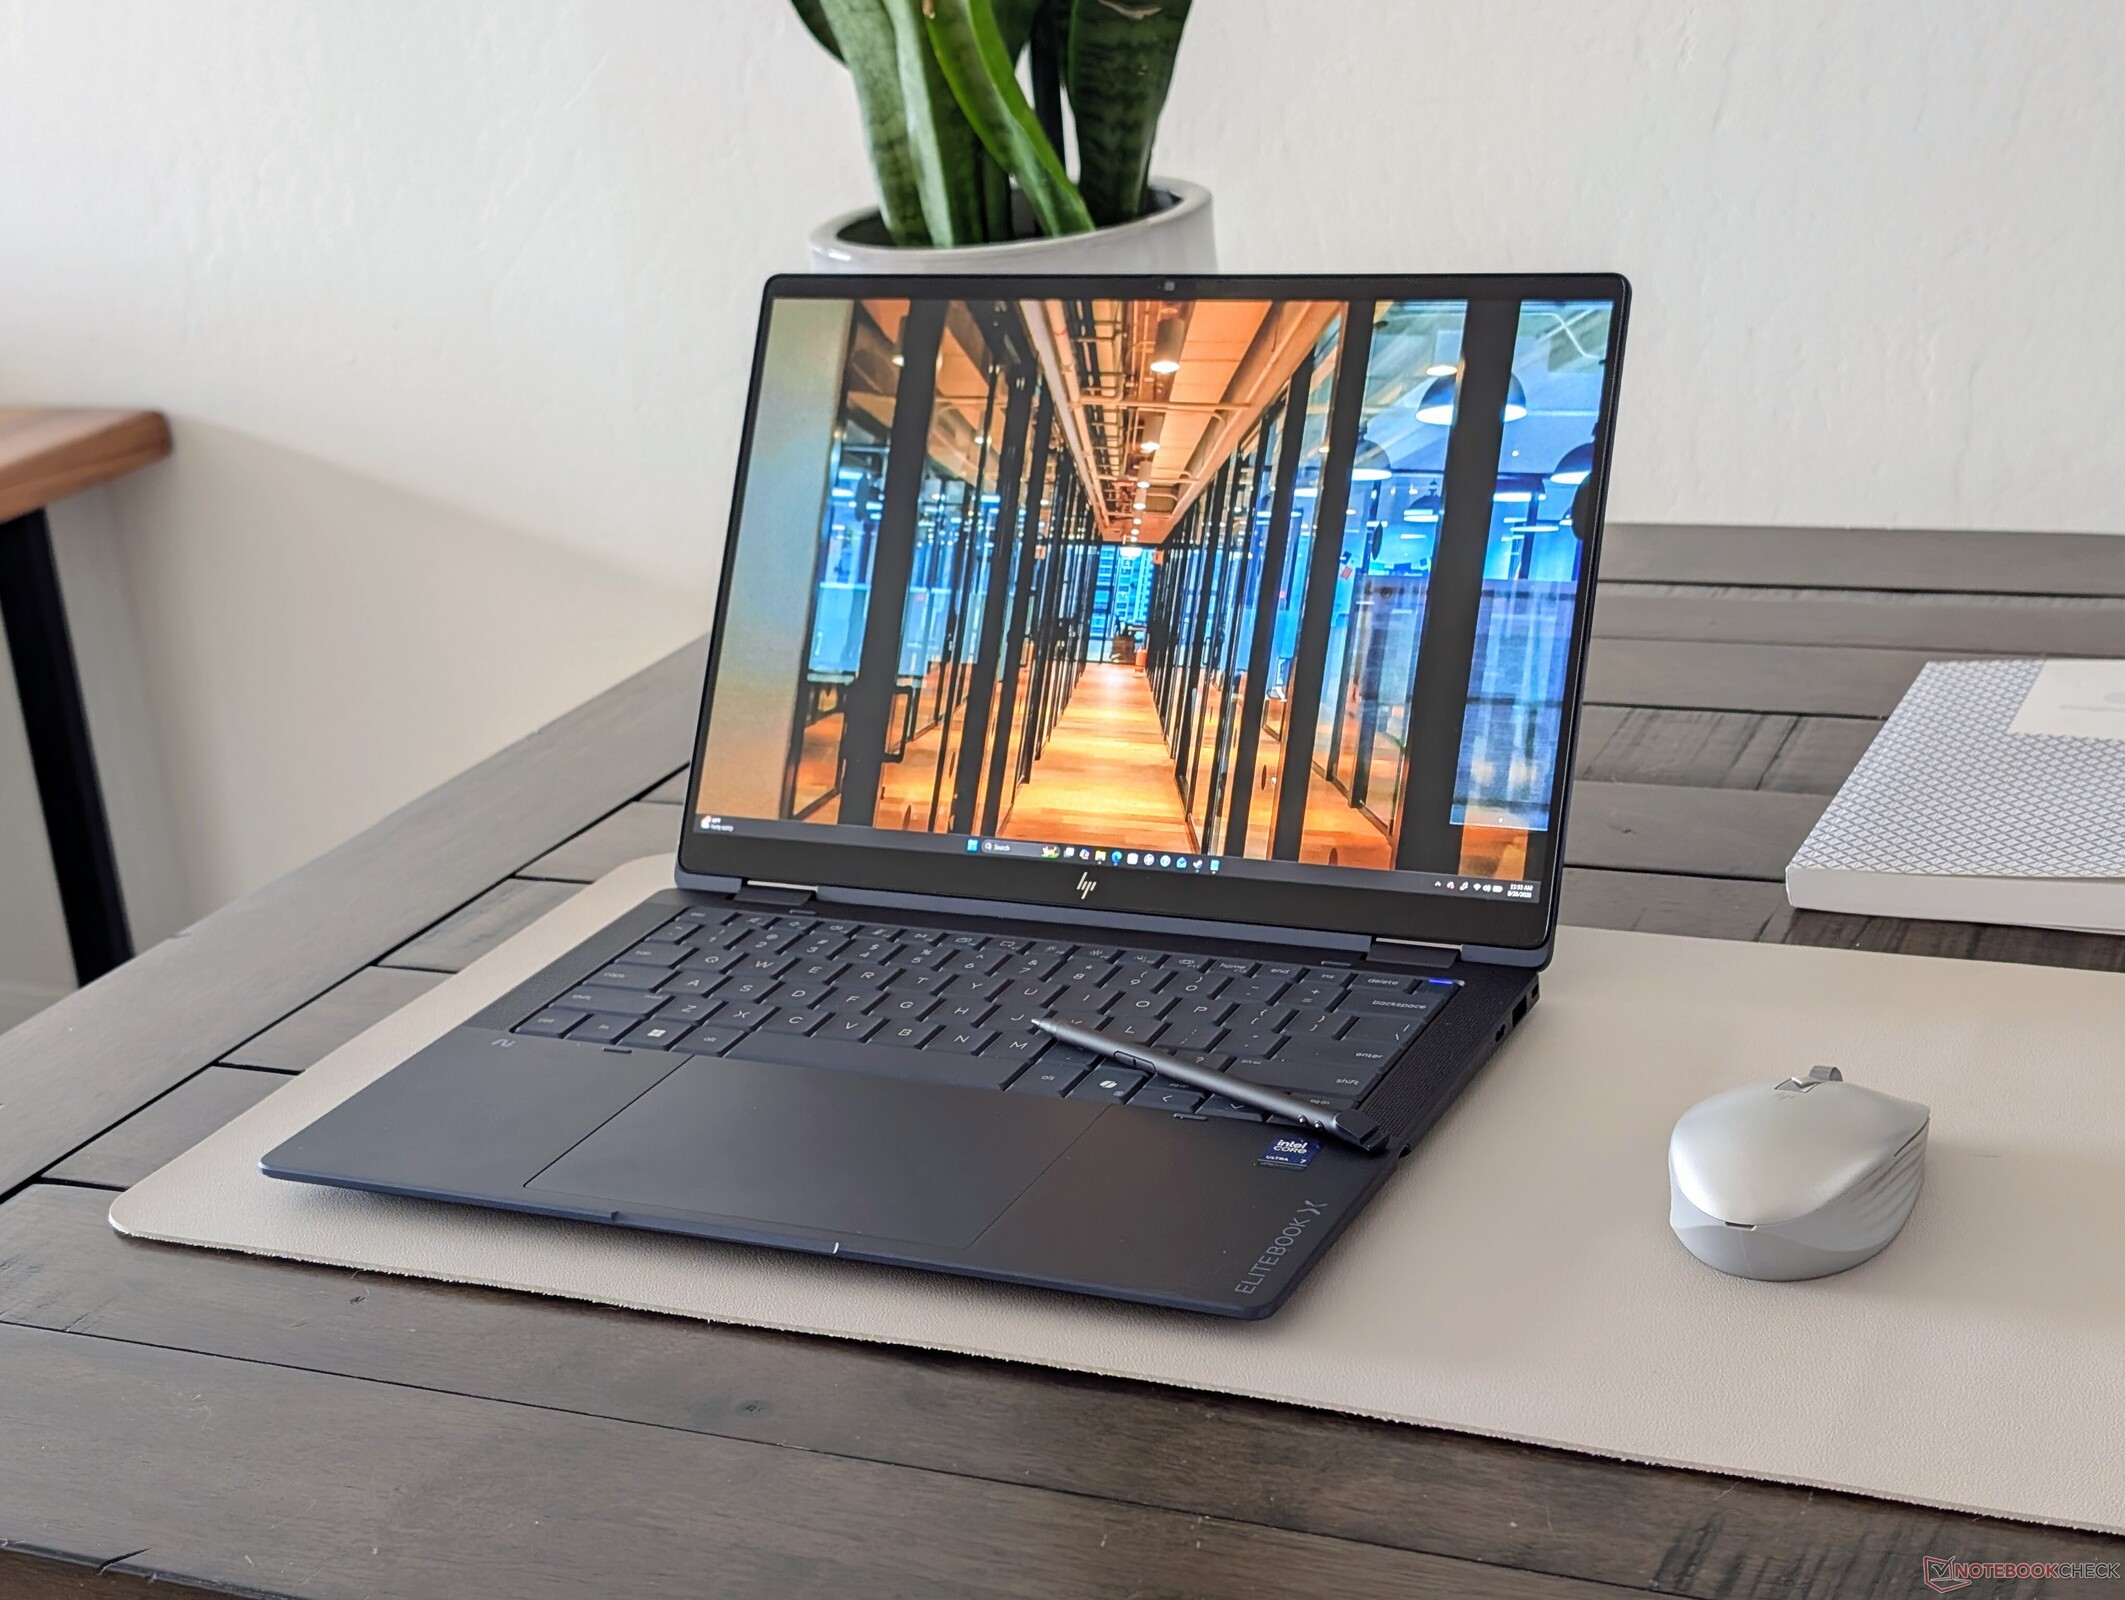
Verdict — Sleek Isn't Cheap
HP EliteBook models from the X series, 1000 series, and Ultra series typically score very well in our tests and the EliteBook X Flip G2i 14 continues the trend. They consistently offer striking external designs without compromising on ports, battery life, configurations, audio quality, and some of the more comfortable keyboards on a business laptop. The number of display options in particular can be staggering when compared to most other convertibles. For this year, the moderate changes make the new EliteBook convertible even lighter and more travel-friendly than before especially for stylus users.
There are a couple of thorns to watch out for. Users who want the sharpest image quality may want to consider the BrightView configurations instead of the grainier matte options. Core temperatures can also become quite warm when running more demanding loads. Power users will want to consider the Core Ultra X7 configurations for significantly faster graphics performance than what was available on last year's model.
Of course, price is increasingly becoming a concern as the HP starts at $2200 up to over $3500 as configured in this review unit. Alternatives like the Dell Pro 14 Plus 2-in-1 start at much cheaper prices even if they happen to be thicker and come with slower Lunar Lake processors.
Pros
Cons
Price and Availability
The HP EliteBook X Flip G2i 14 is now available directly from the manufacturer for $3000 as configured in this review. The model is also available through Best Buy.

The EliteBook X Flip G2i 14 succeeds last year's EliteBook X Flip G1i 14 with both an updated design and newer Panther Lake processor options. It is one of the highest-tier convertibles in HP's 14-inch EliteBook lineup.
Our test unit is a higher-end configuration with the Core Ultra 7 366H and 1800p OLED touchscreen for approximately $3000 to $3500. Other SKUs are available with the Core Ultra X7 or 1200p IPS touchscreen instead.
Alternatives include other flagship business-oriented convertibles like the Dell Latitude 9450 2-in-1, MSI Prestige 14 Flip, or the Lenovo ThinkPad L13 2-in-1 series. The EliteBook should not be confused with the more prosumer-oriented OmniBook series.
More HP reviews:
Specifications
Case
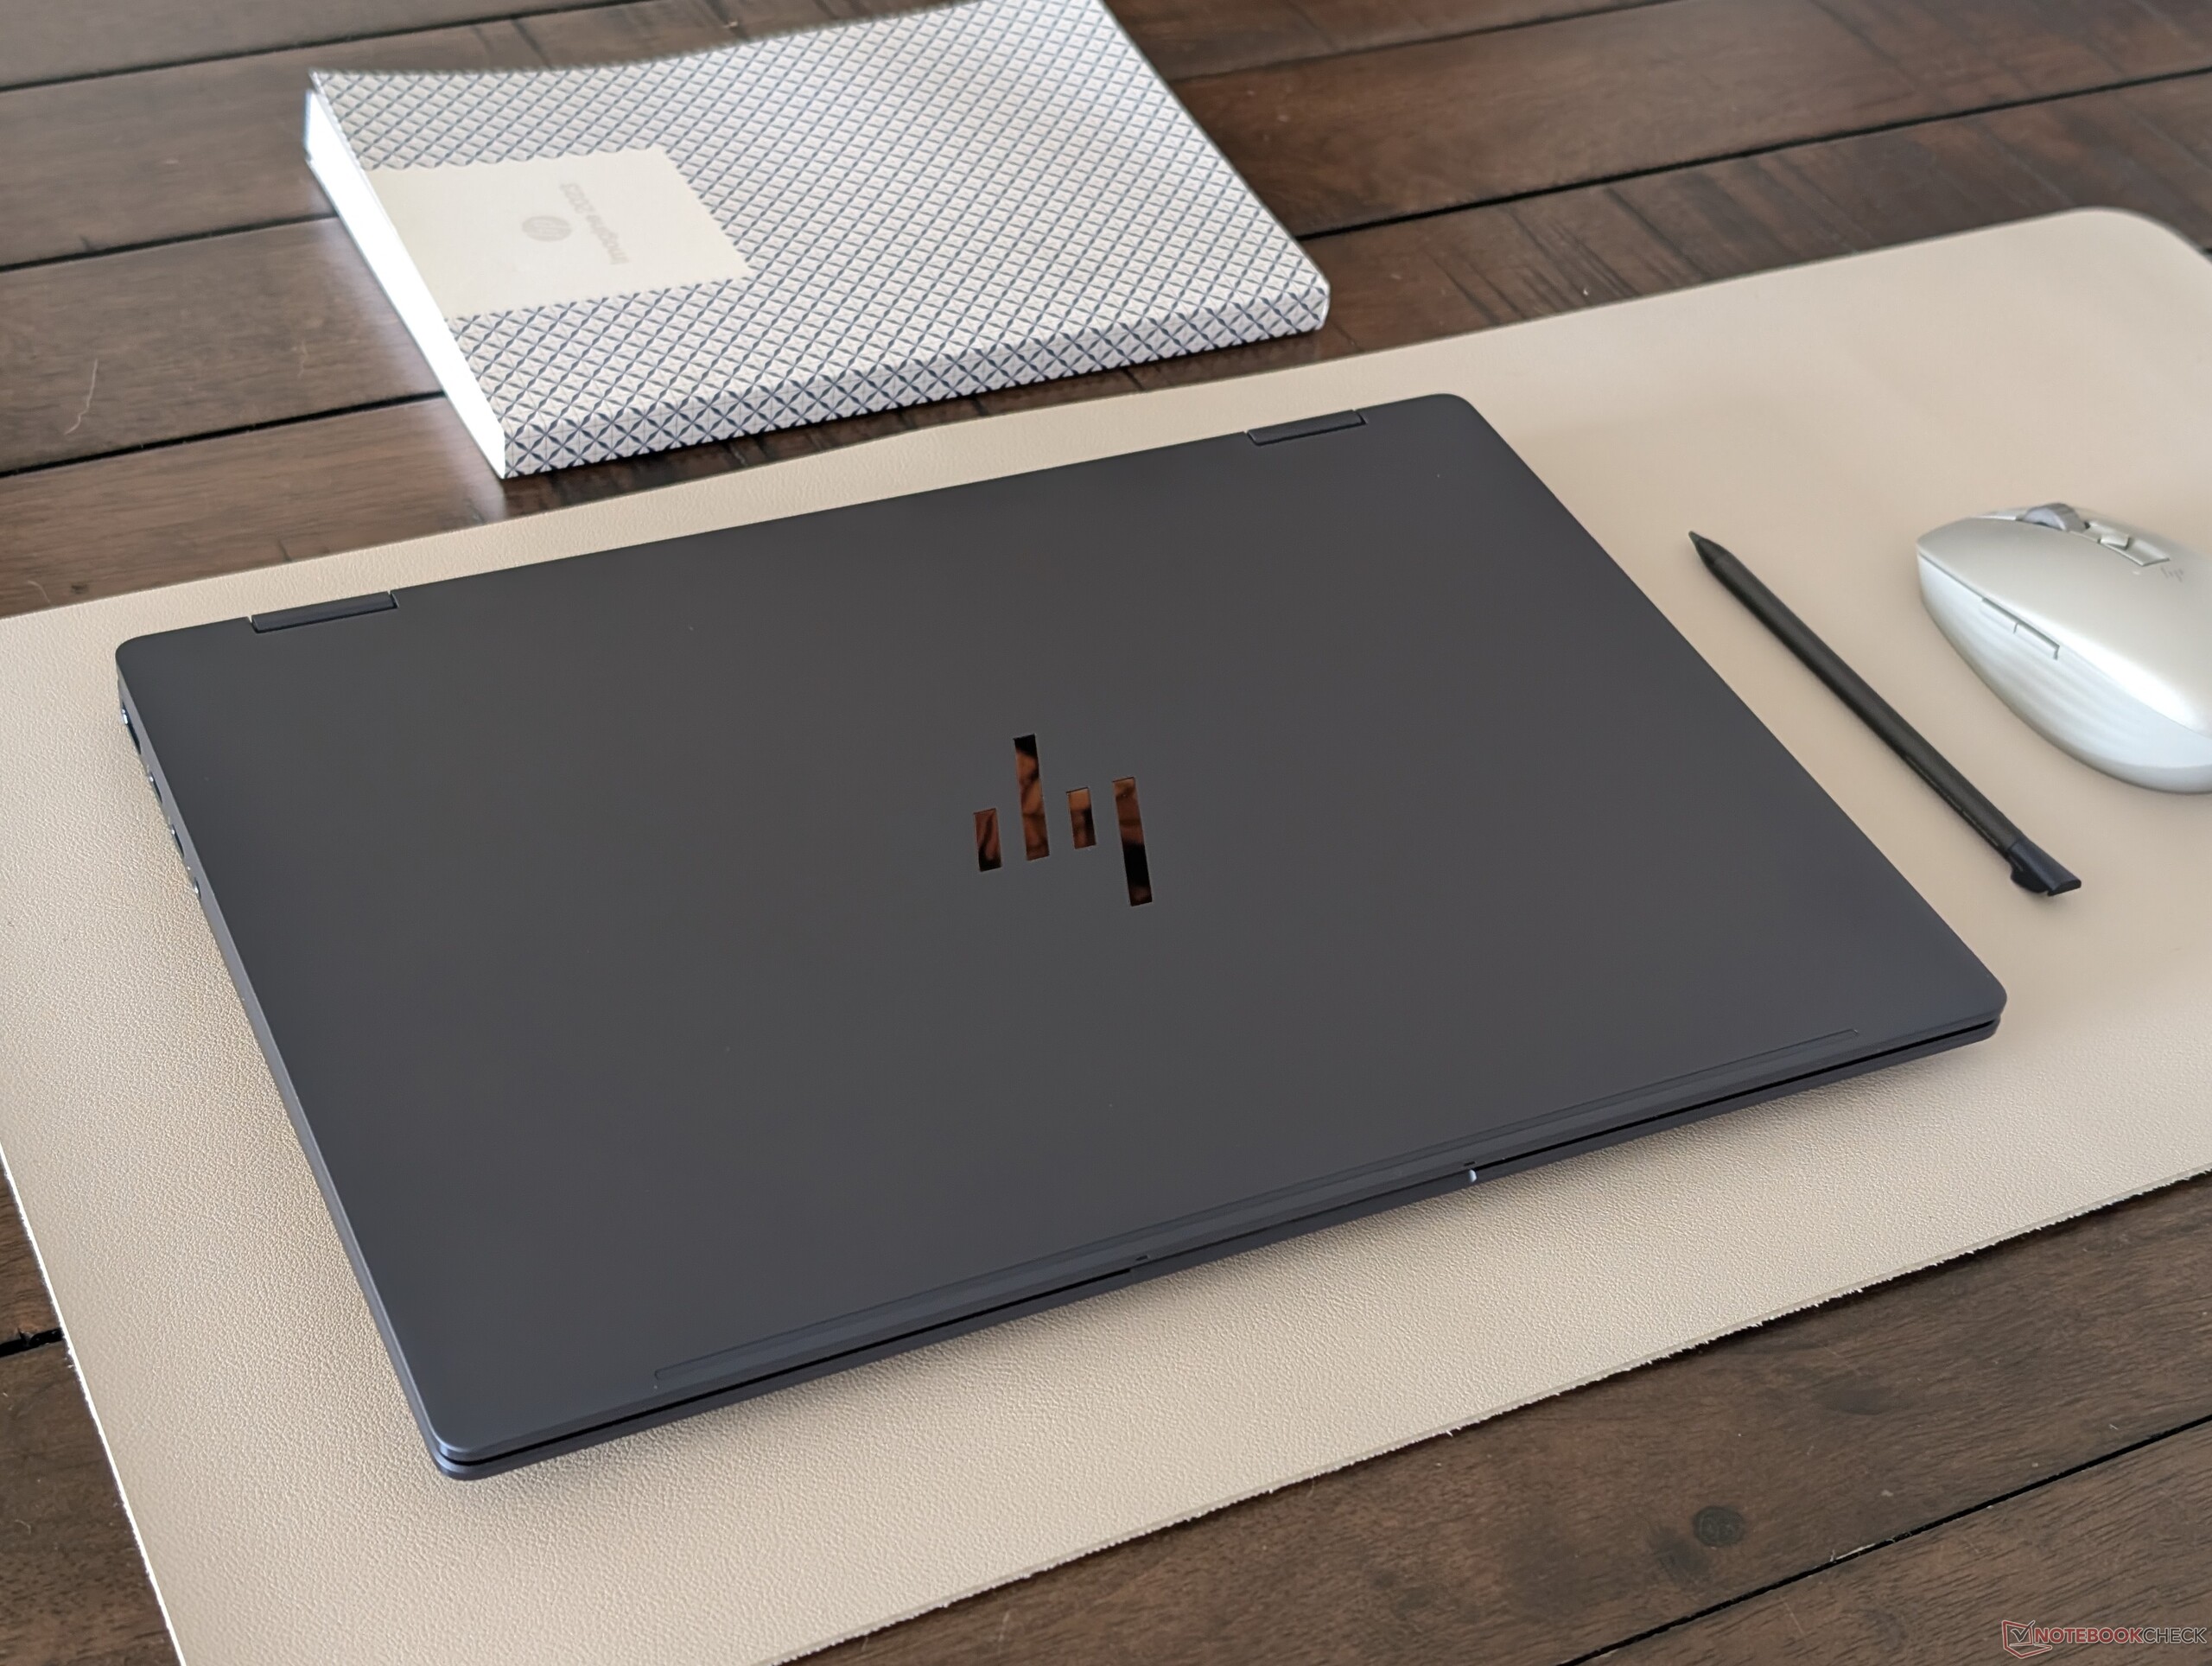
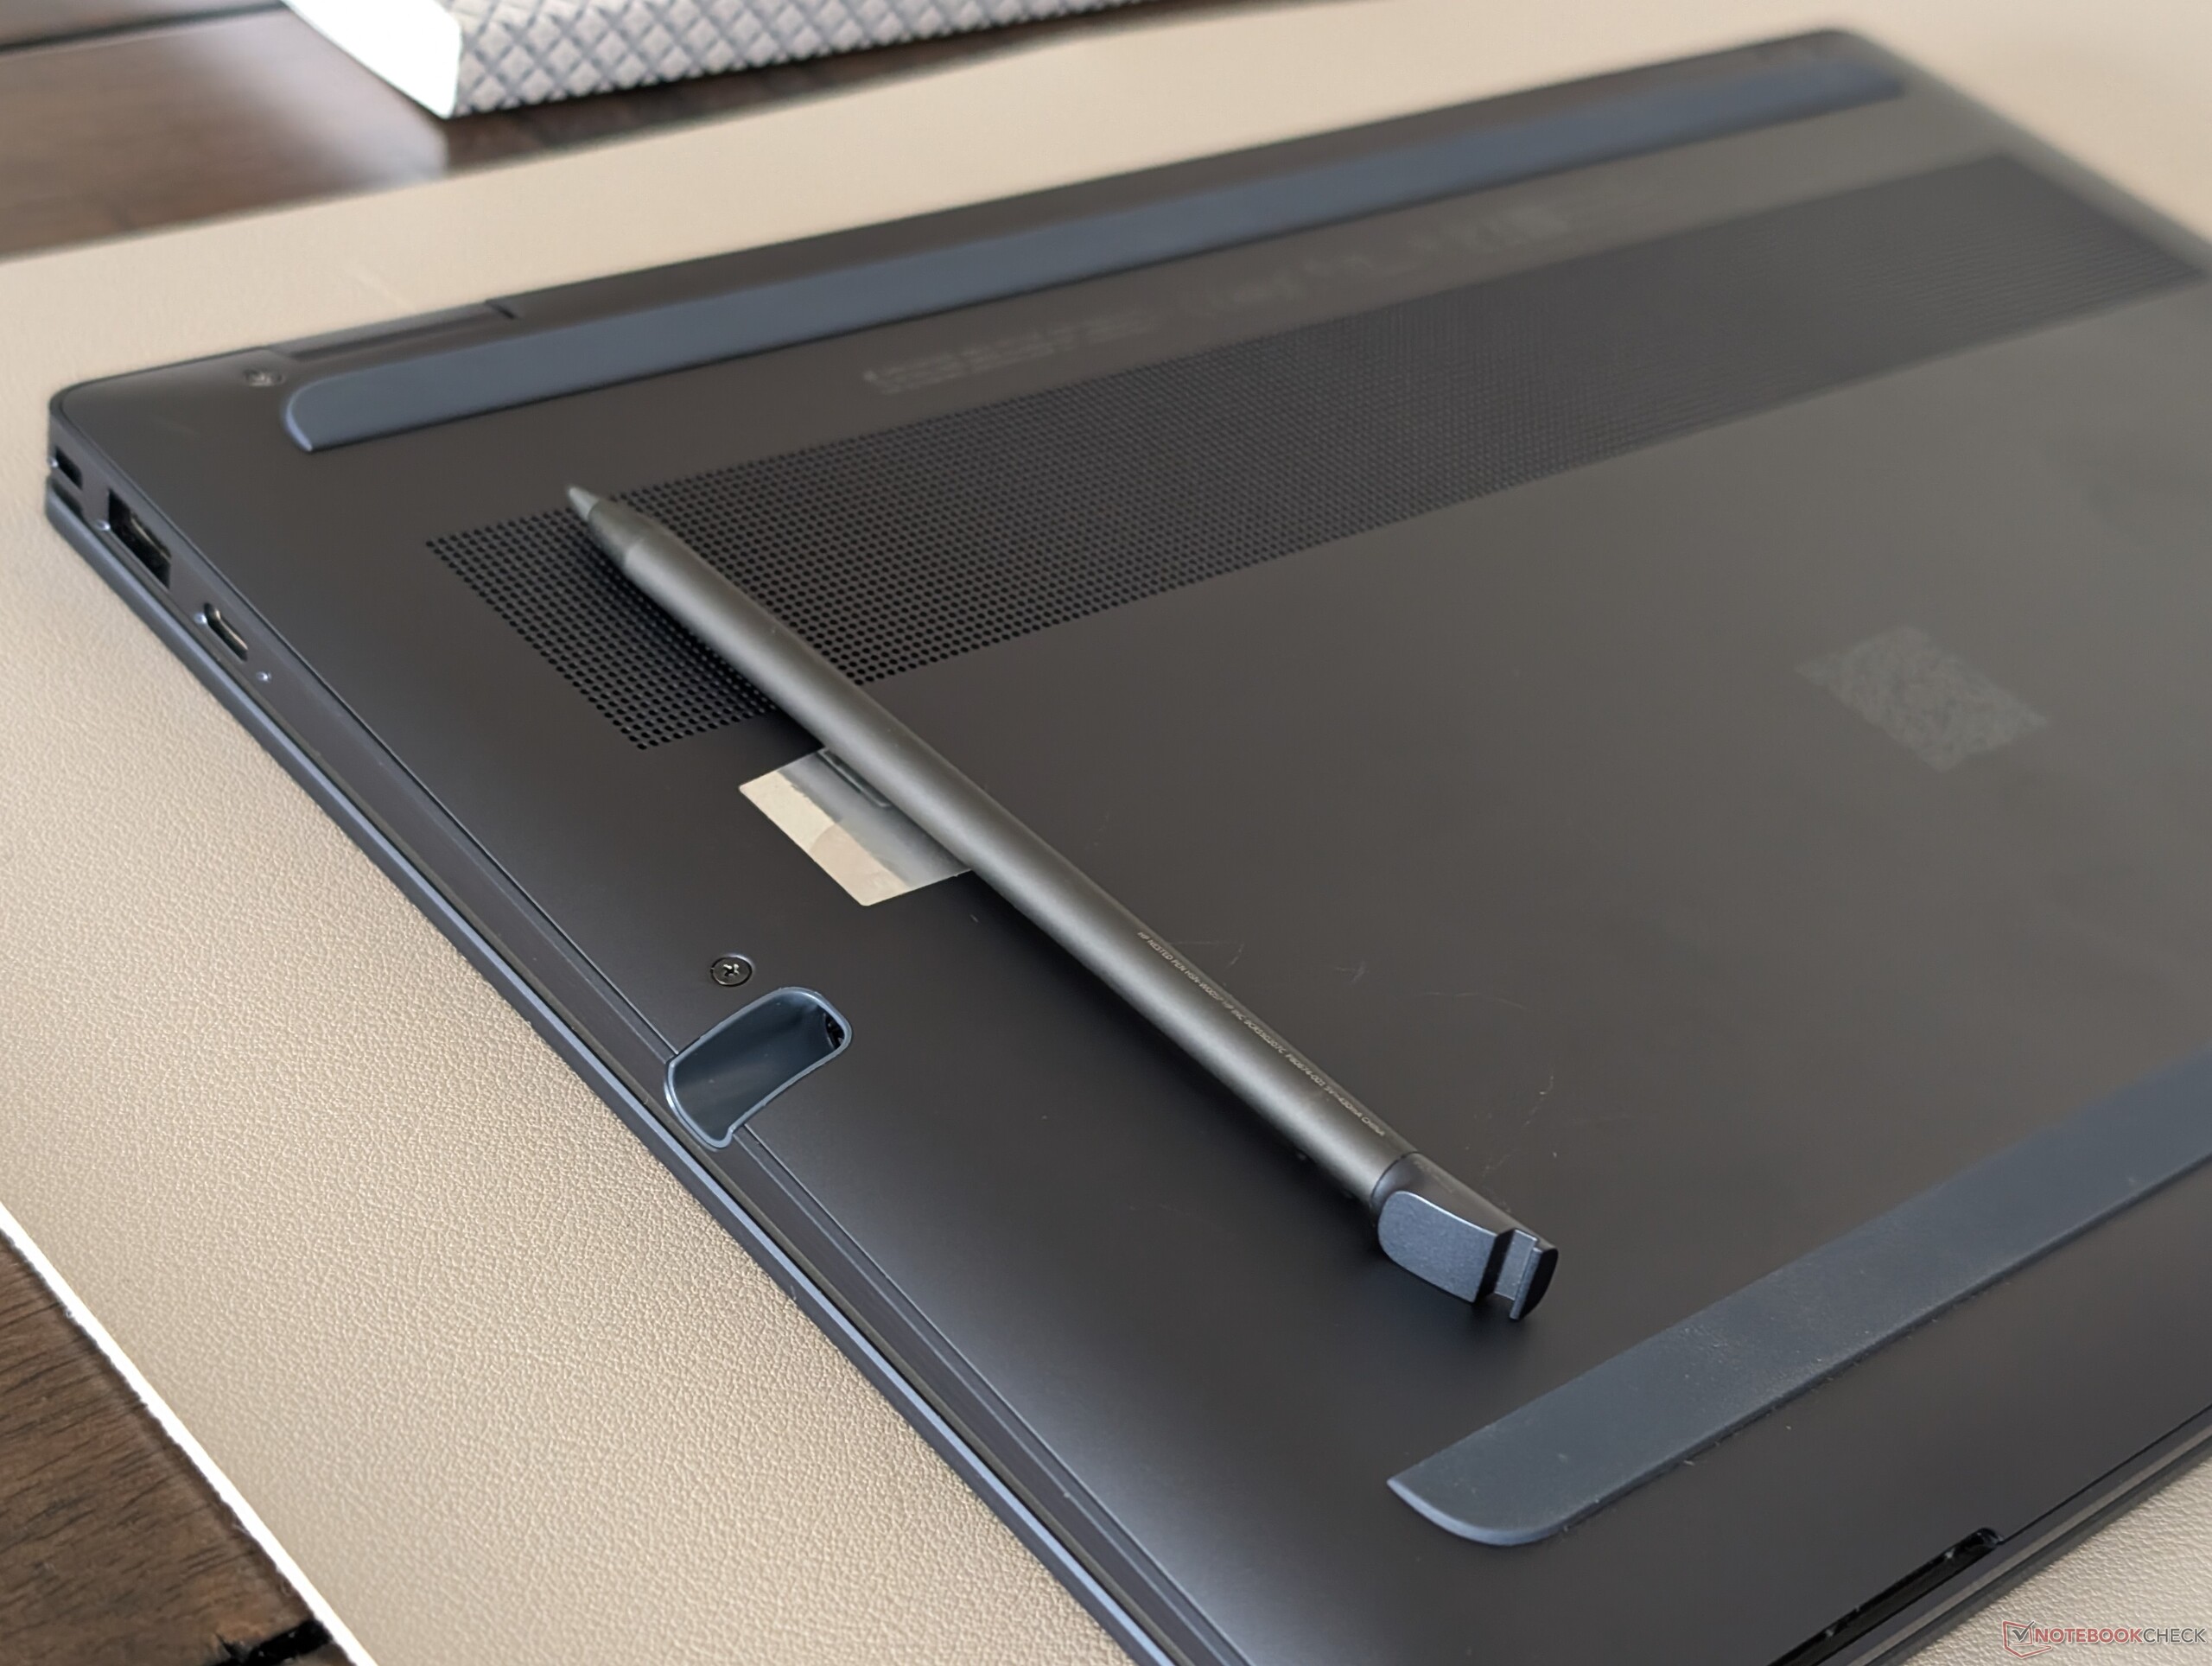
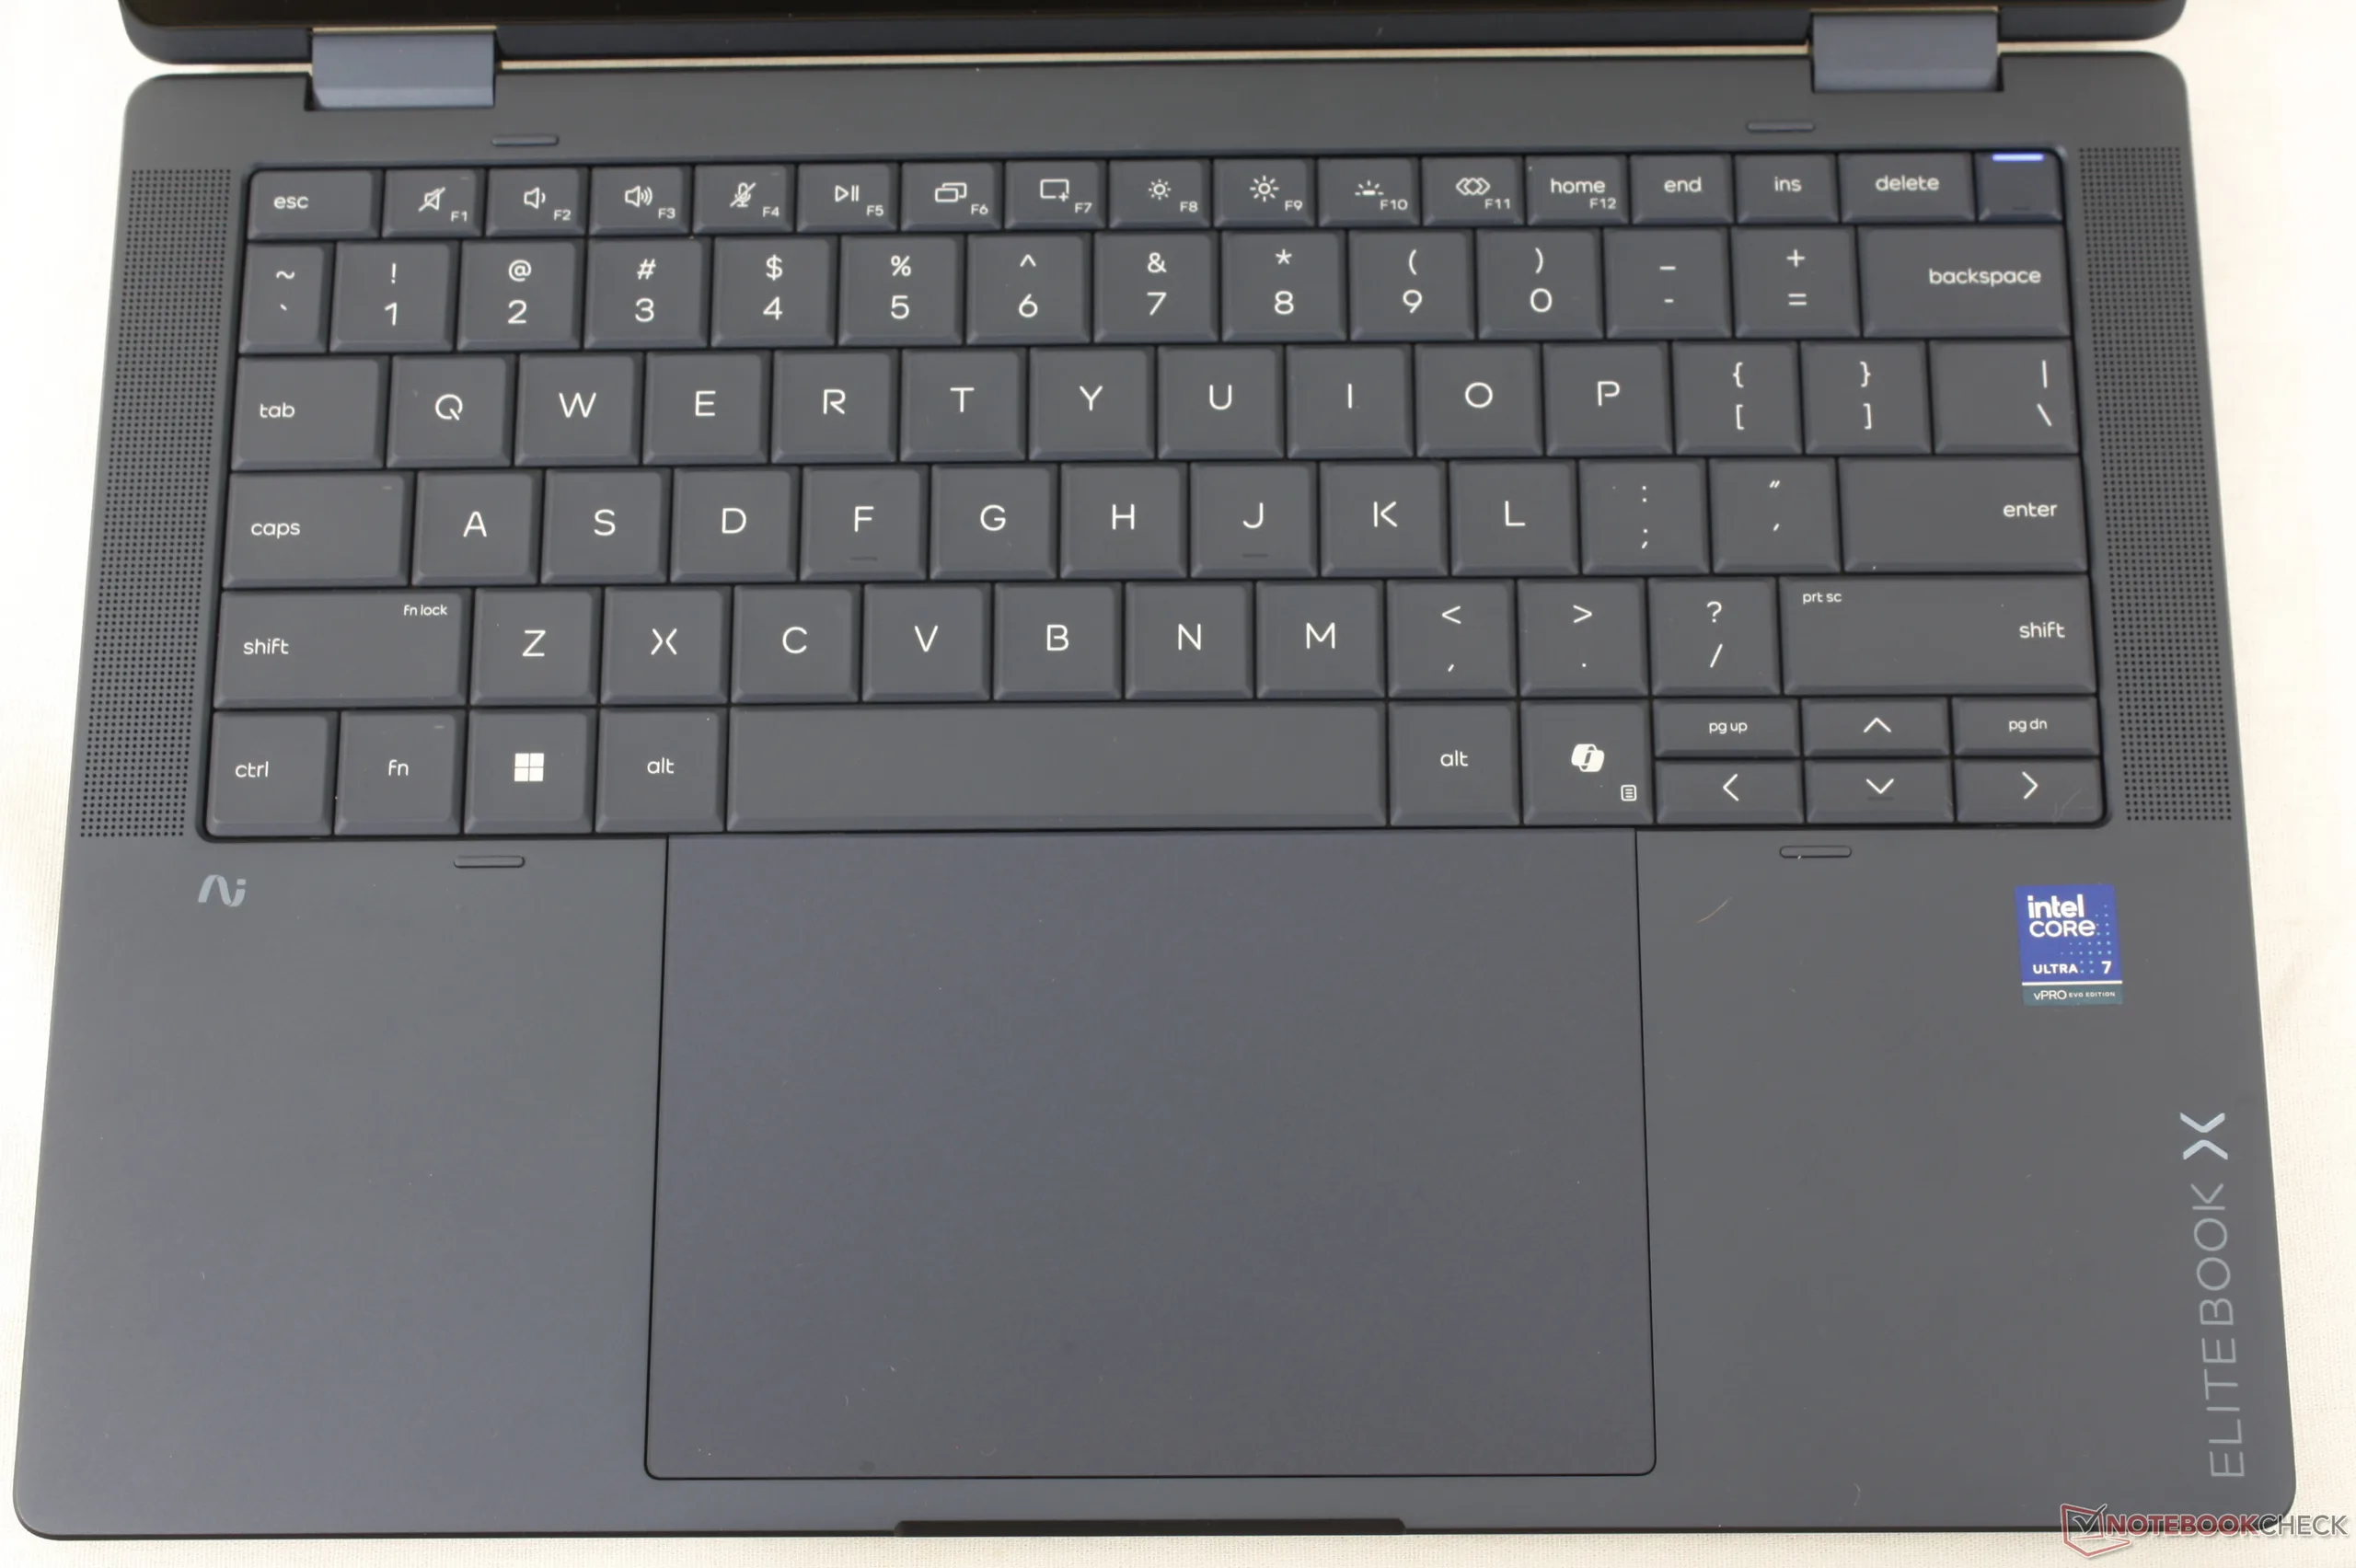
The all-metal chassis includes a few aesthetic changes from last year's EliteBook X Flip G1i 14 such as the flatter edges and corners, chrome-cut perimeter, and slight visual updates to the clickpad and keyboard. Most importantly, the new model now integrates a pen garage along the right edge for safely storing the active pen while managing to be almost 200 grams lighter overall. Port options are otherwise the same as before.
Connectivity


Communication
WAN is optional just as before. If configured with no WAN, then the free M.2 2242 slot can be used for secondary storage.
| Networking | |
| iperf3 receive AXE11000 6GHz | |
| HP EliteBook X Flip G2i 14 AI | |
| HP EliteBook X Flip G1i 14 AI | |
| HP EliteBook x360 1040 G11 | |
| Dell Latitude 9450 2-in-1 | |
| iperf3 transmit AXE11000 6GHz | |
| HP EliteBook X Flip G1i 14 AI | |
| HP EliteBook x360 1040 G11 | |
| HP EliteBook X Flip G2i 14 AI | |
| Dell Latitude 9450 2-in-1 | |
Webcam


Maintenance
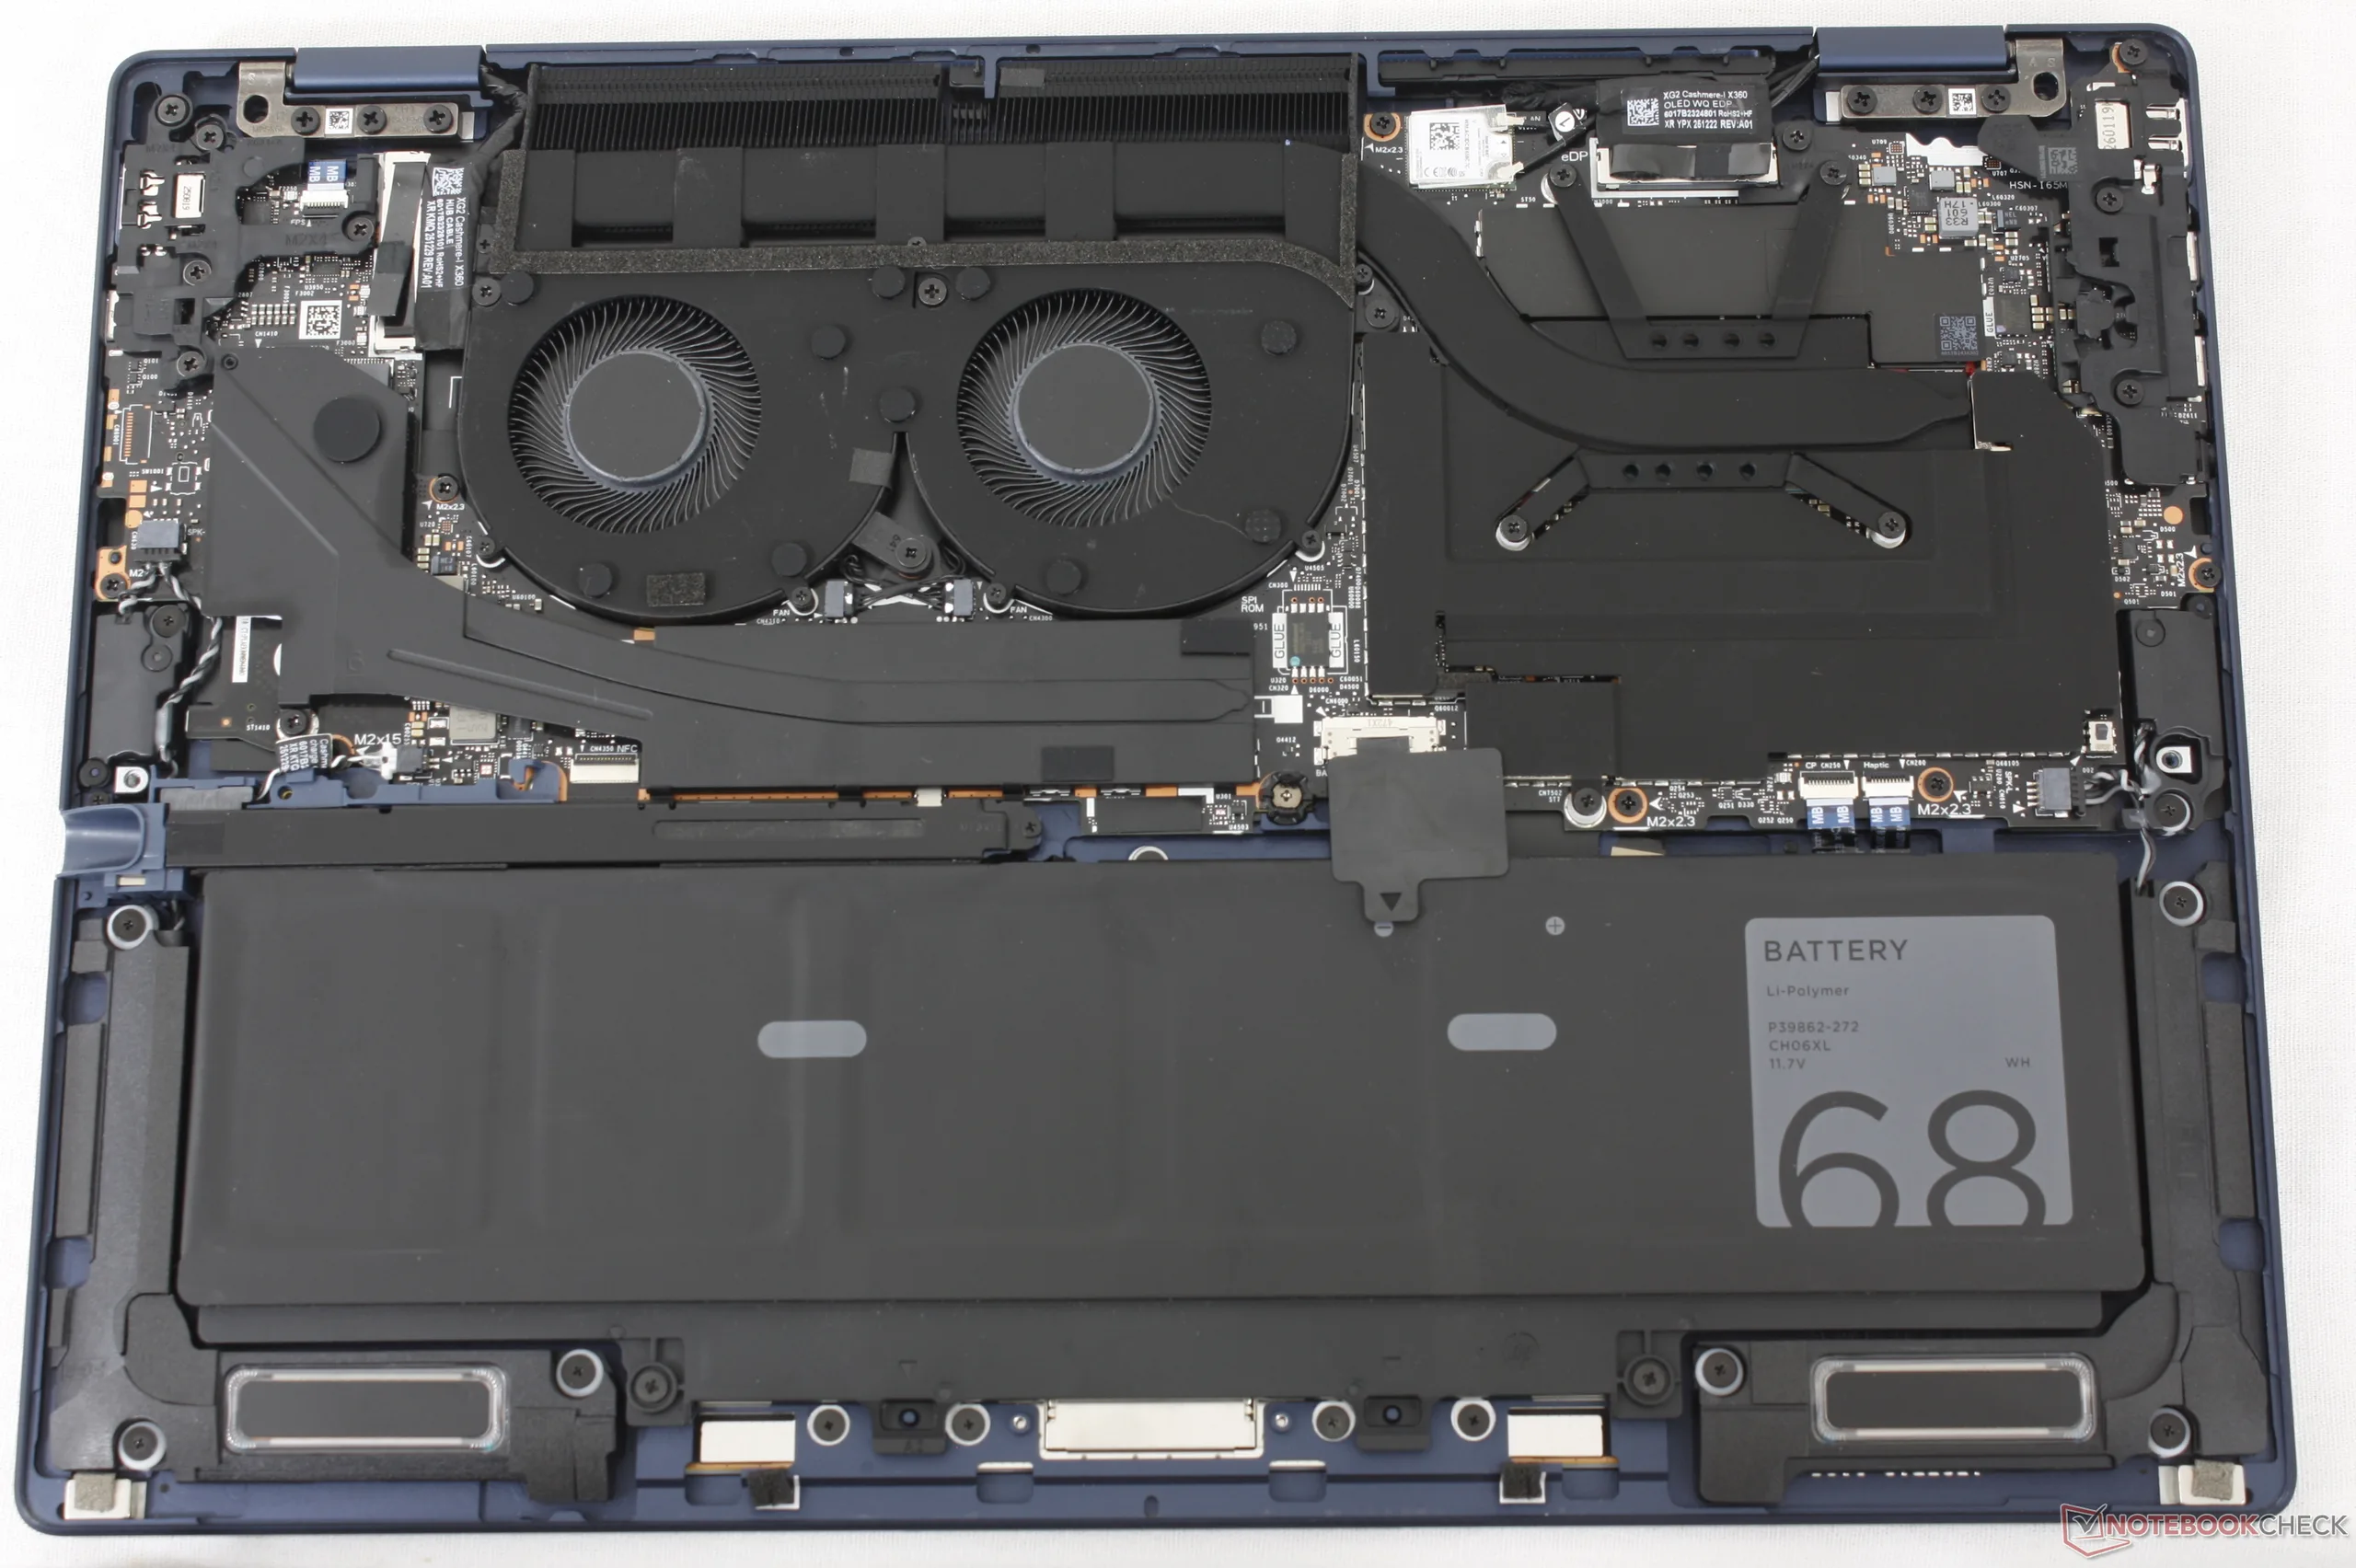
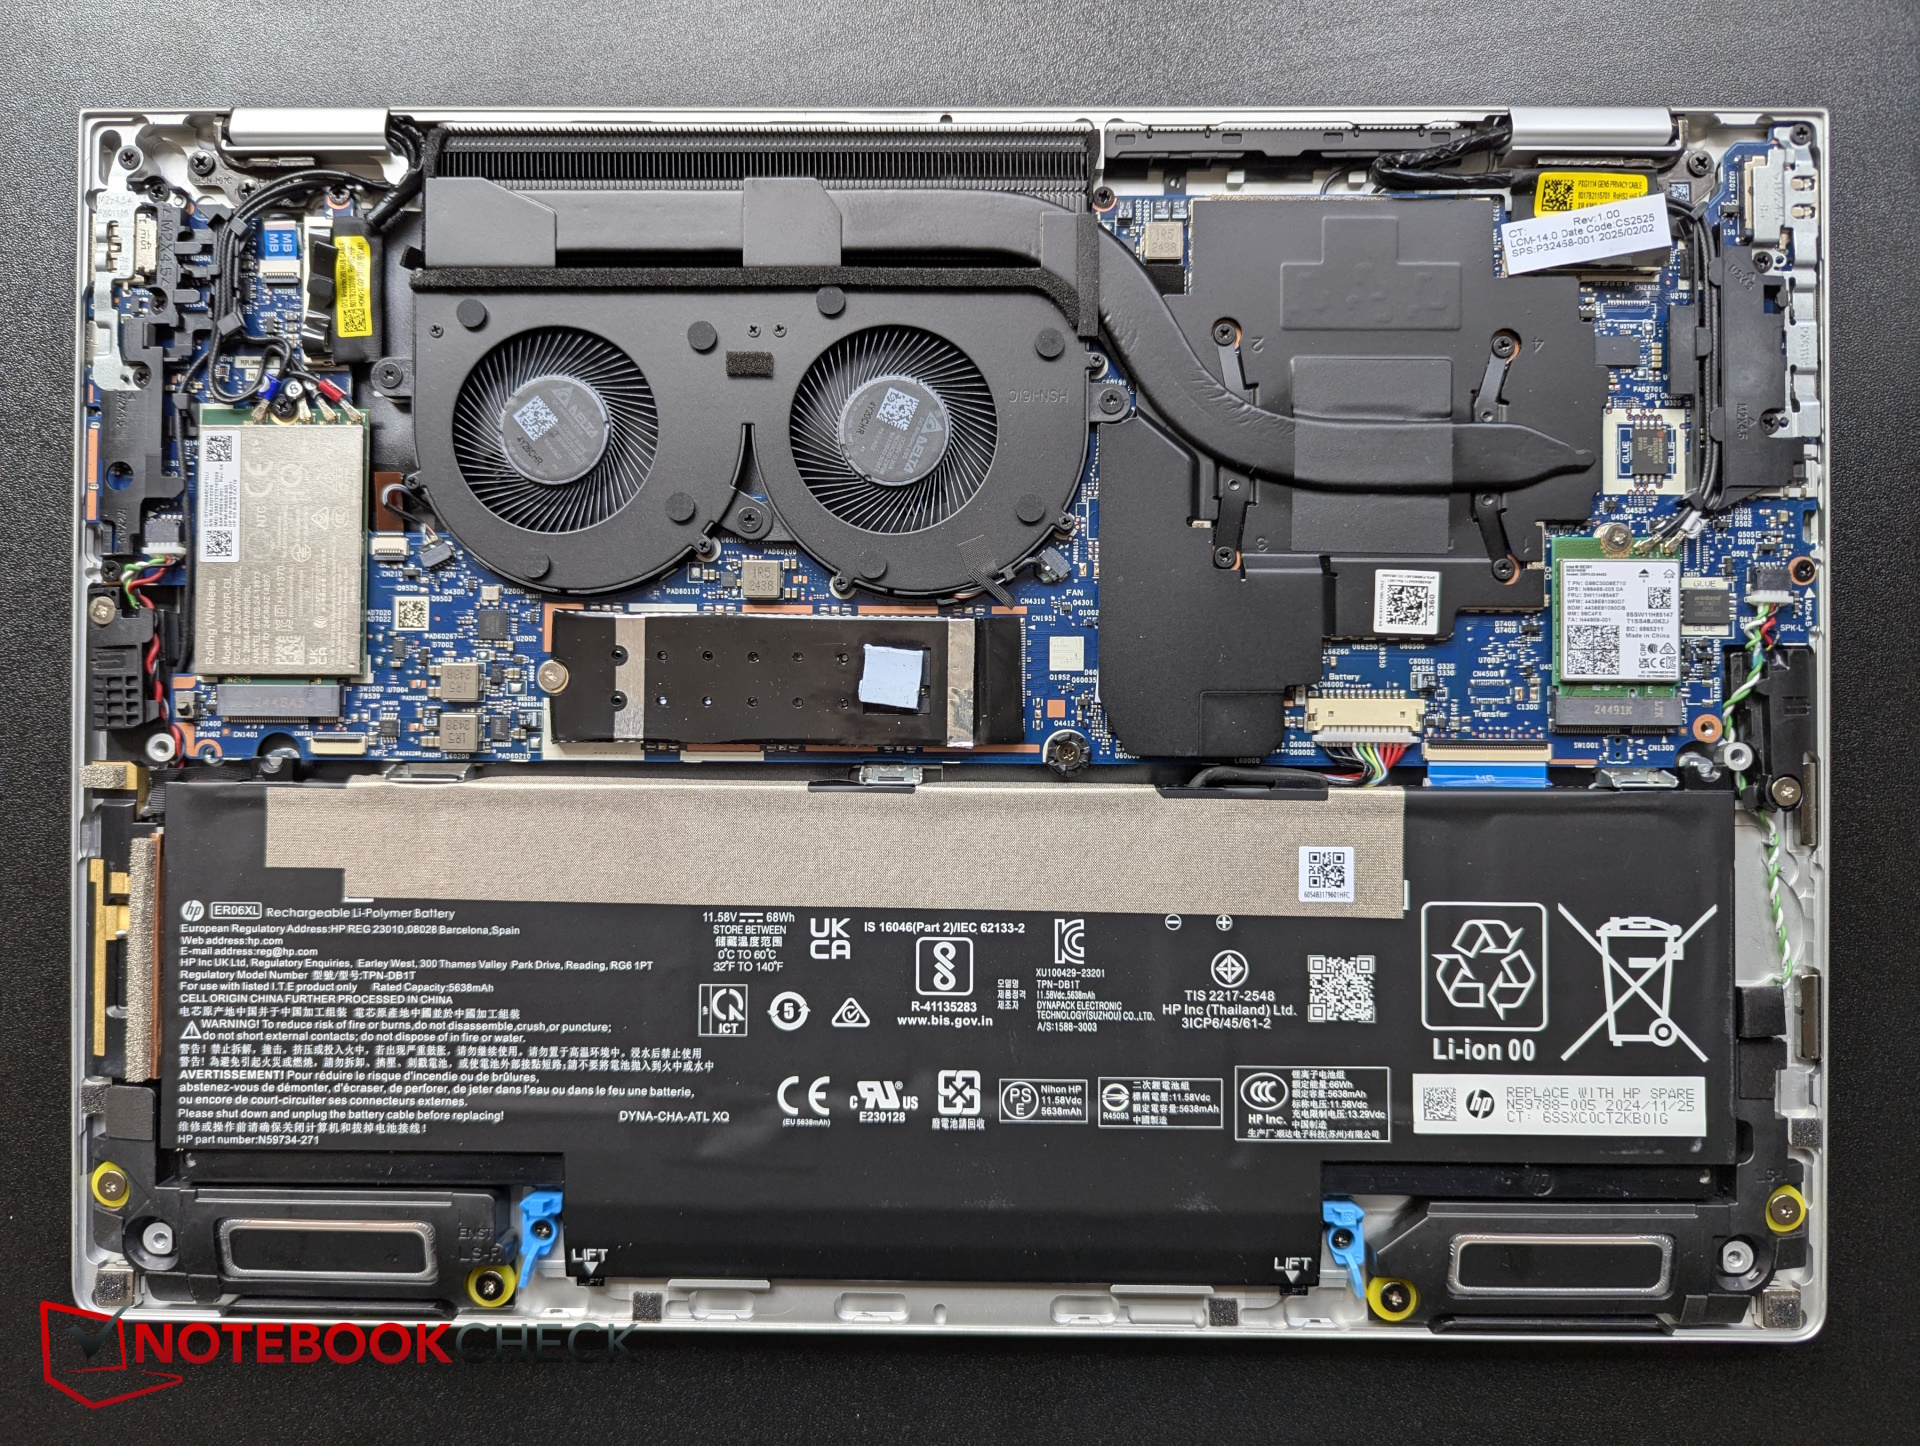
Sustainability
Much like on last year's G1i, this year's model consists of PCC plastic and recycled metals in various percentages. The packaging is plastic-free and fully recyclable.
Accessories And Warranty
An active stylus pen is included in the retail box. A three-year limited manufacturer warranty comes standard if purchased in the US.
Input Devices
Display
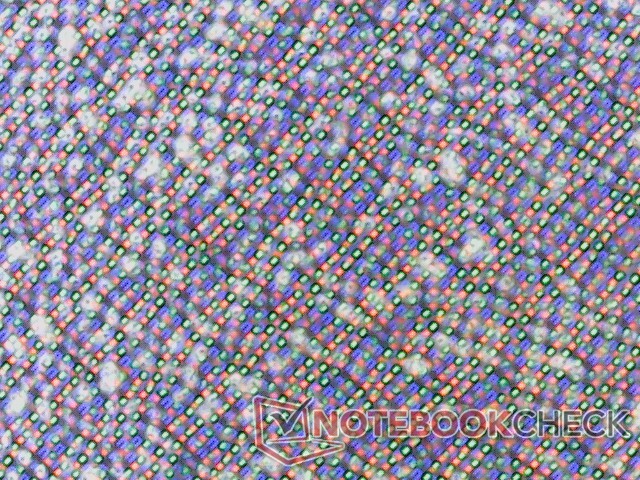
Both 1800p and 1200p display options are available in OLED and IPS, respectively, with further options including Tandem OLED, Sure View, or glossy instead of matte. Our specific test unit ships with the costlier option: 1800p matte Tandem OLED at 120 Hz. While its paper specifications are impressive, keep in mind that the matte overlay appears grainier than most other matte panels and so colors and text don't pop or look as sharp if configuring the EliteBook with a matte display.
Maximum brightness peaks at 1005 nits when HDR is enabled according to our X-Rite colorimeter. Otherwise, SDR content peaks at 469 nits.
| |||||||||||||||||||||||||
Brightness Distribution: 98 %
Center on Battery: 468.9 cd/m²
Contrast: ∞:1 (Black: 0 cd/m²)
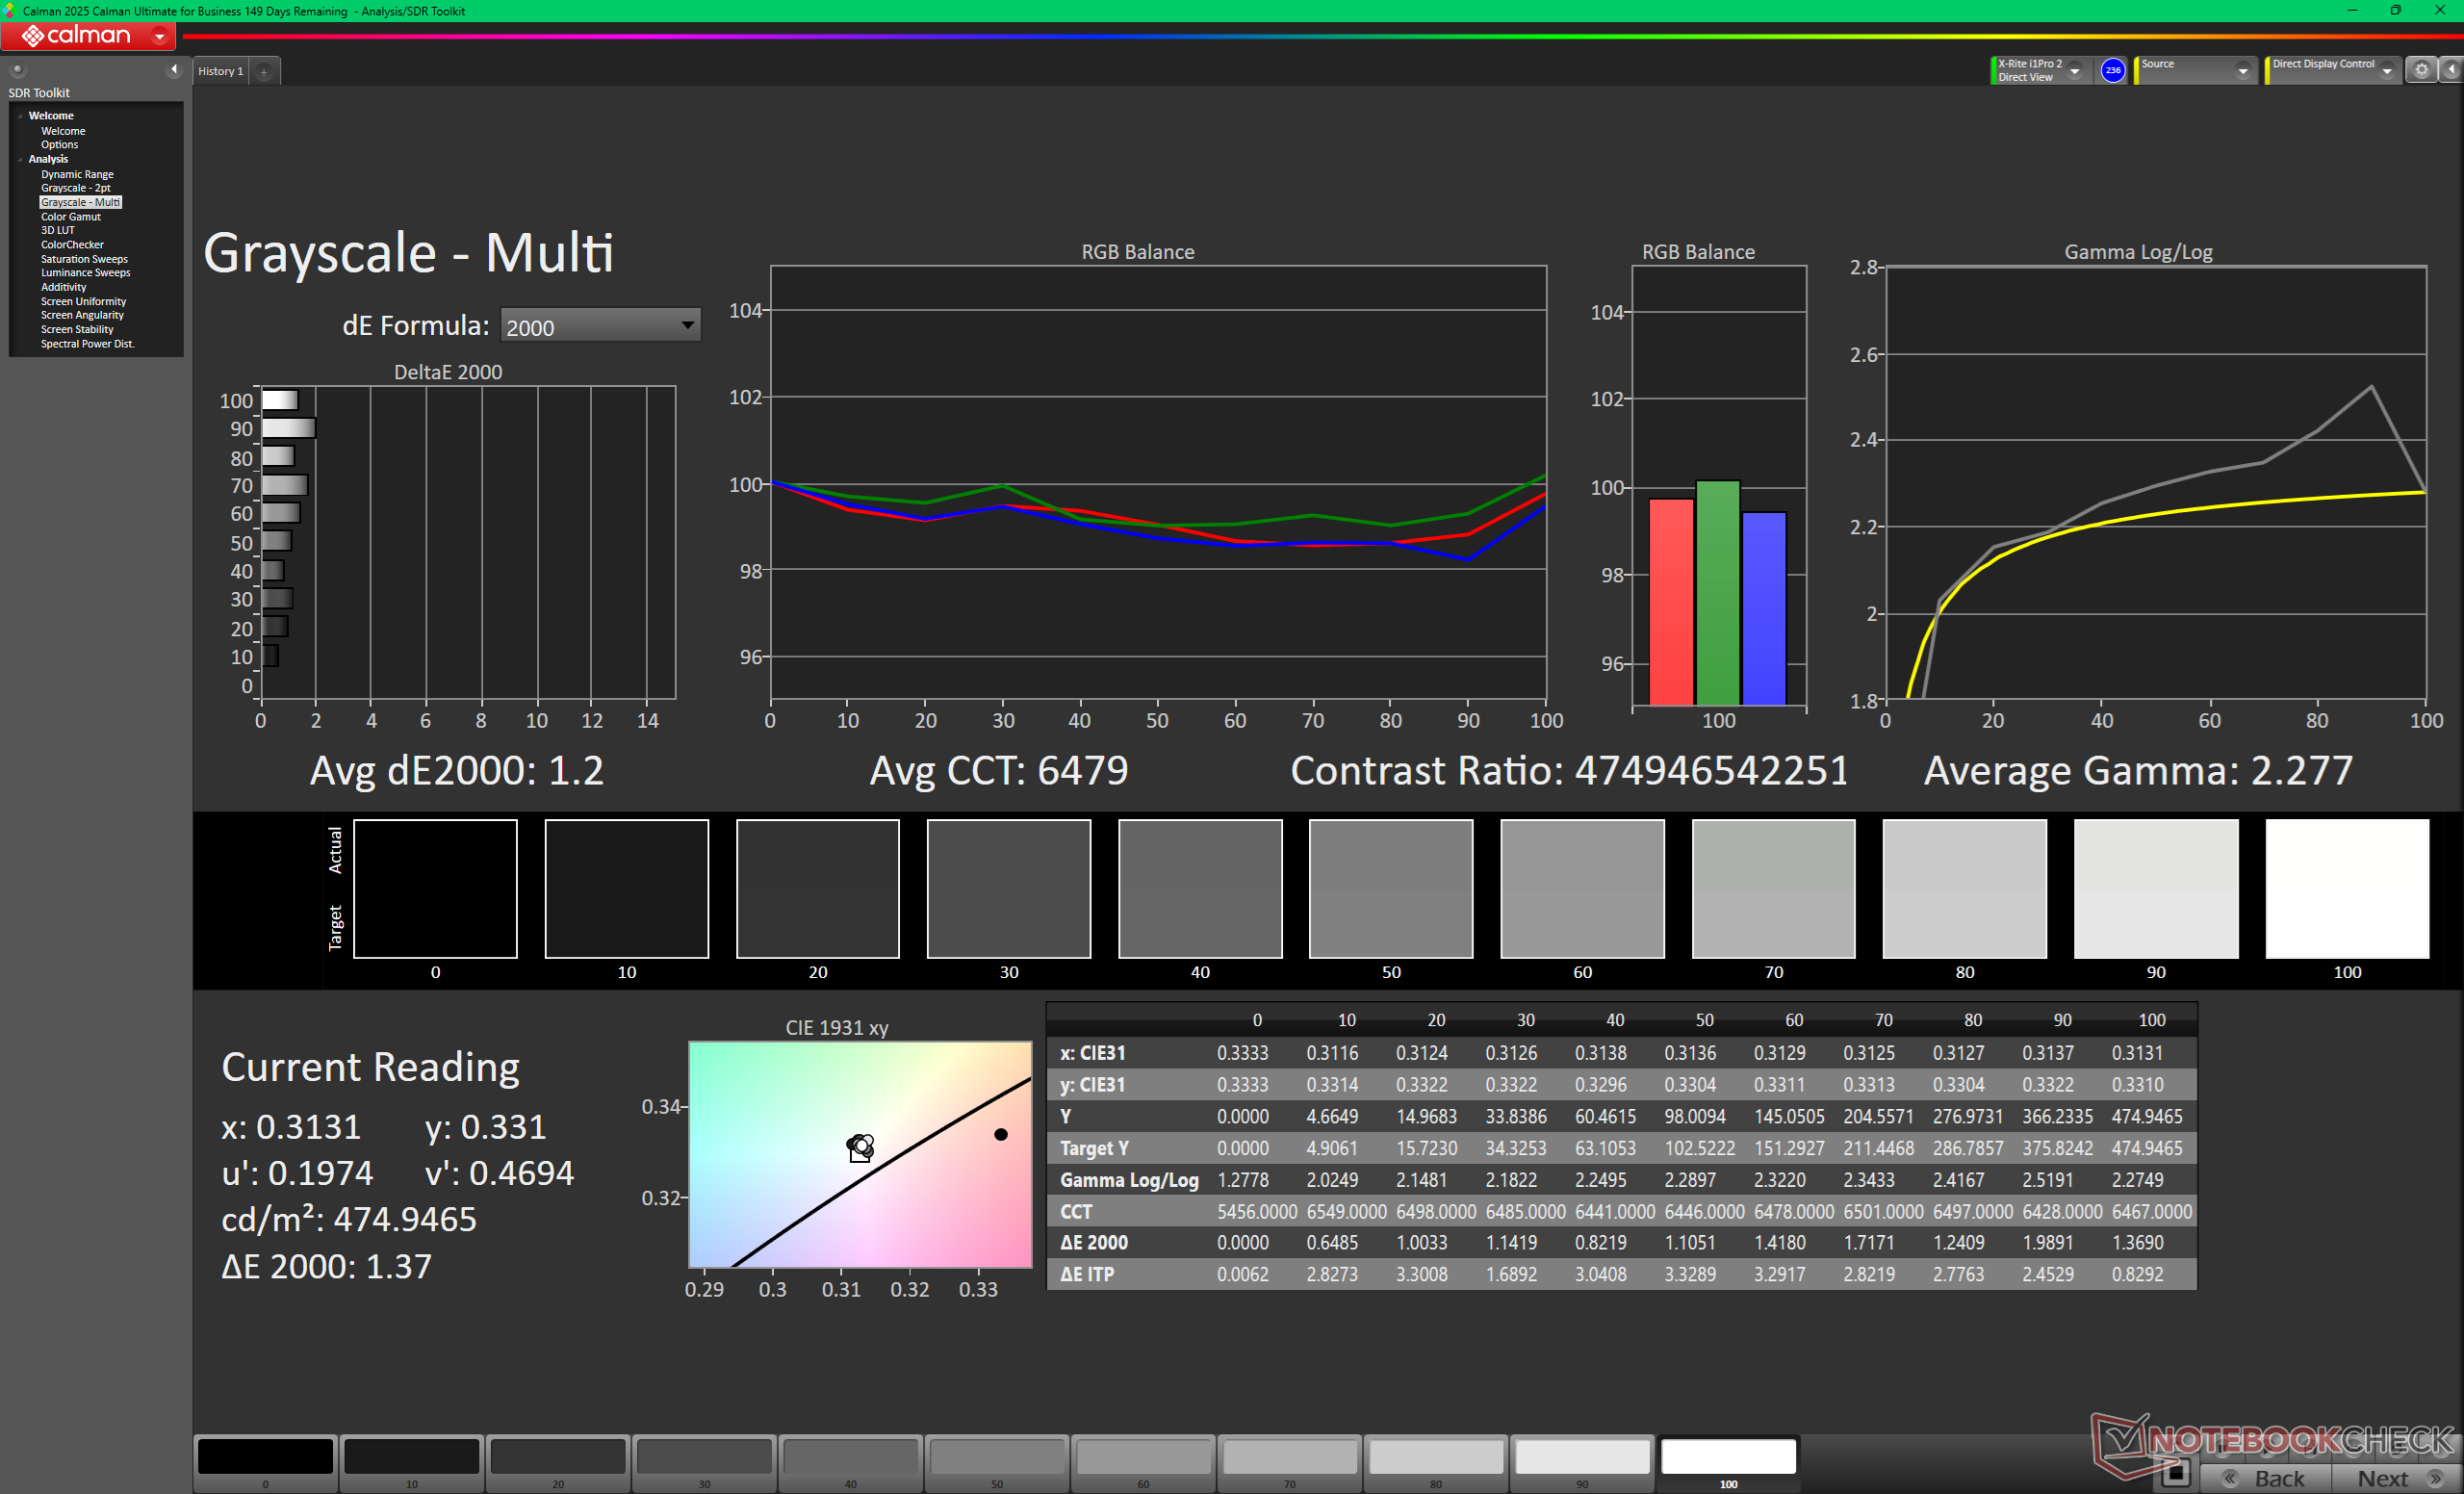
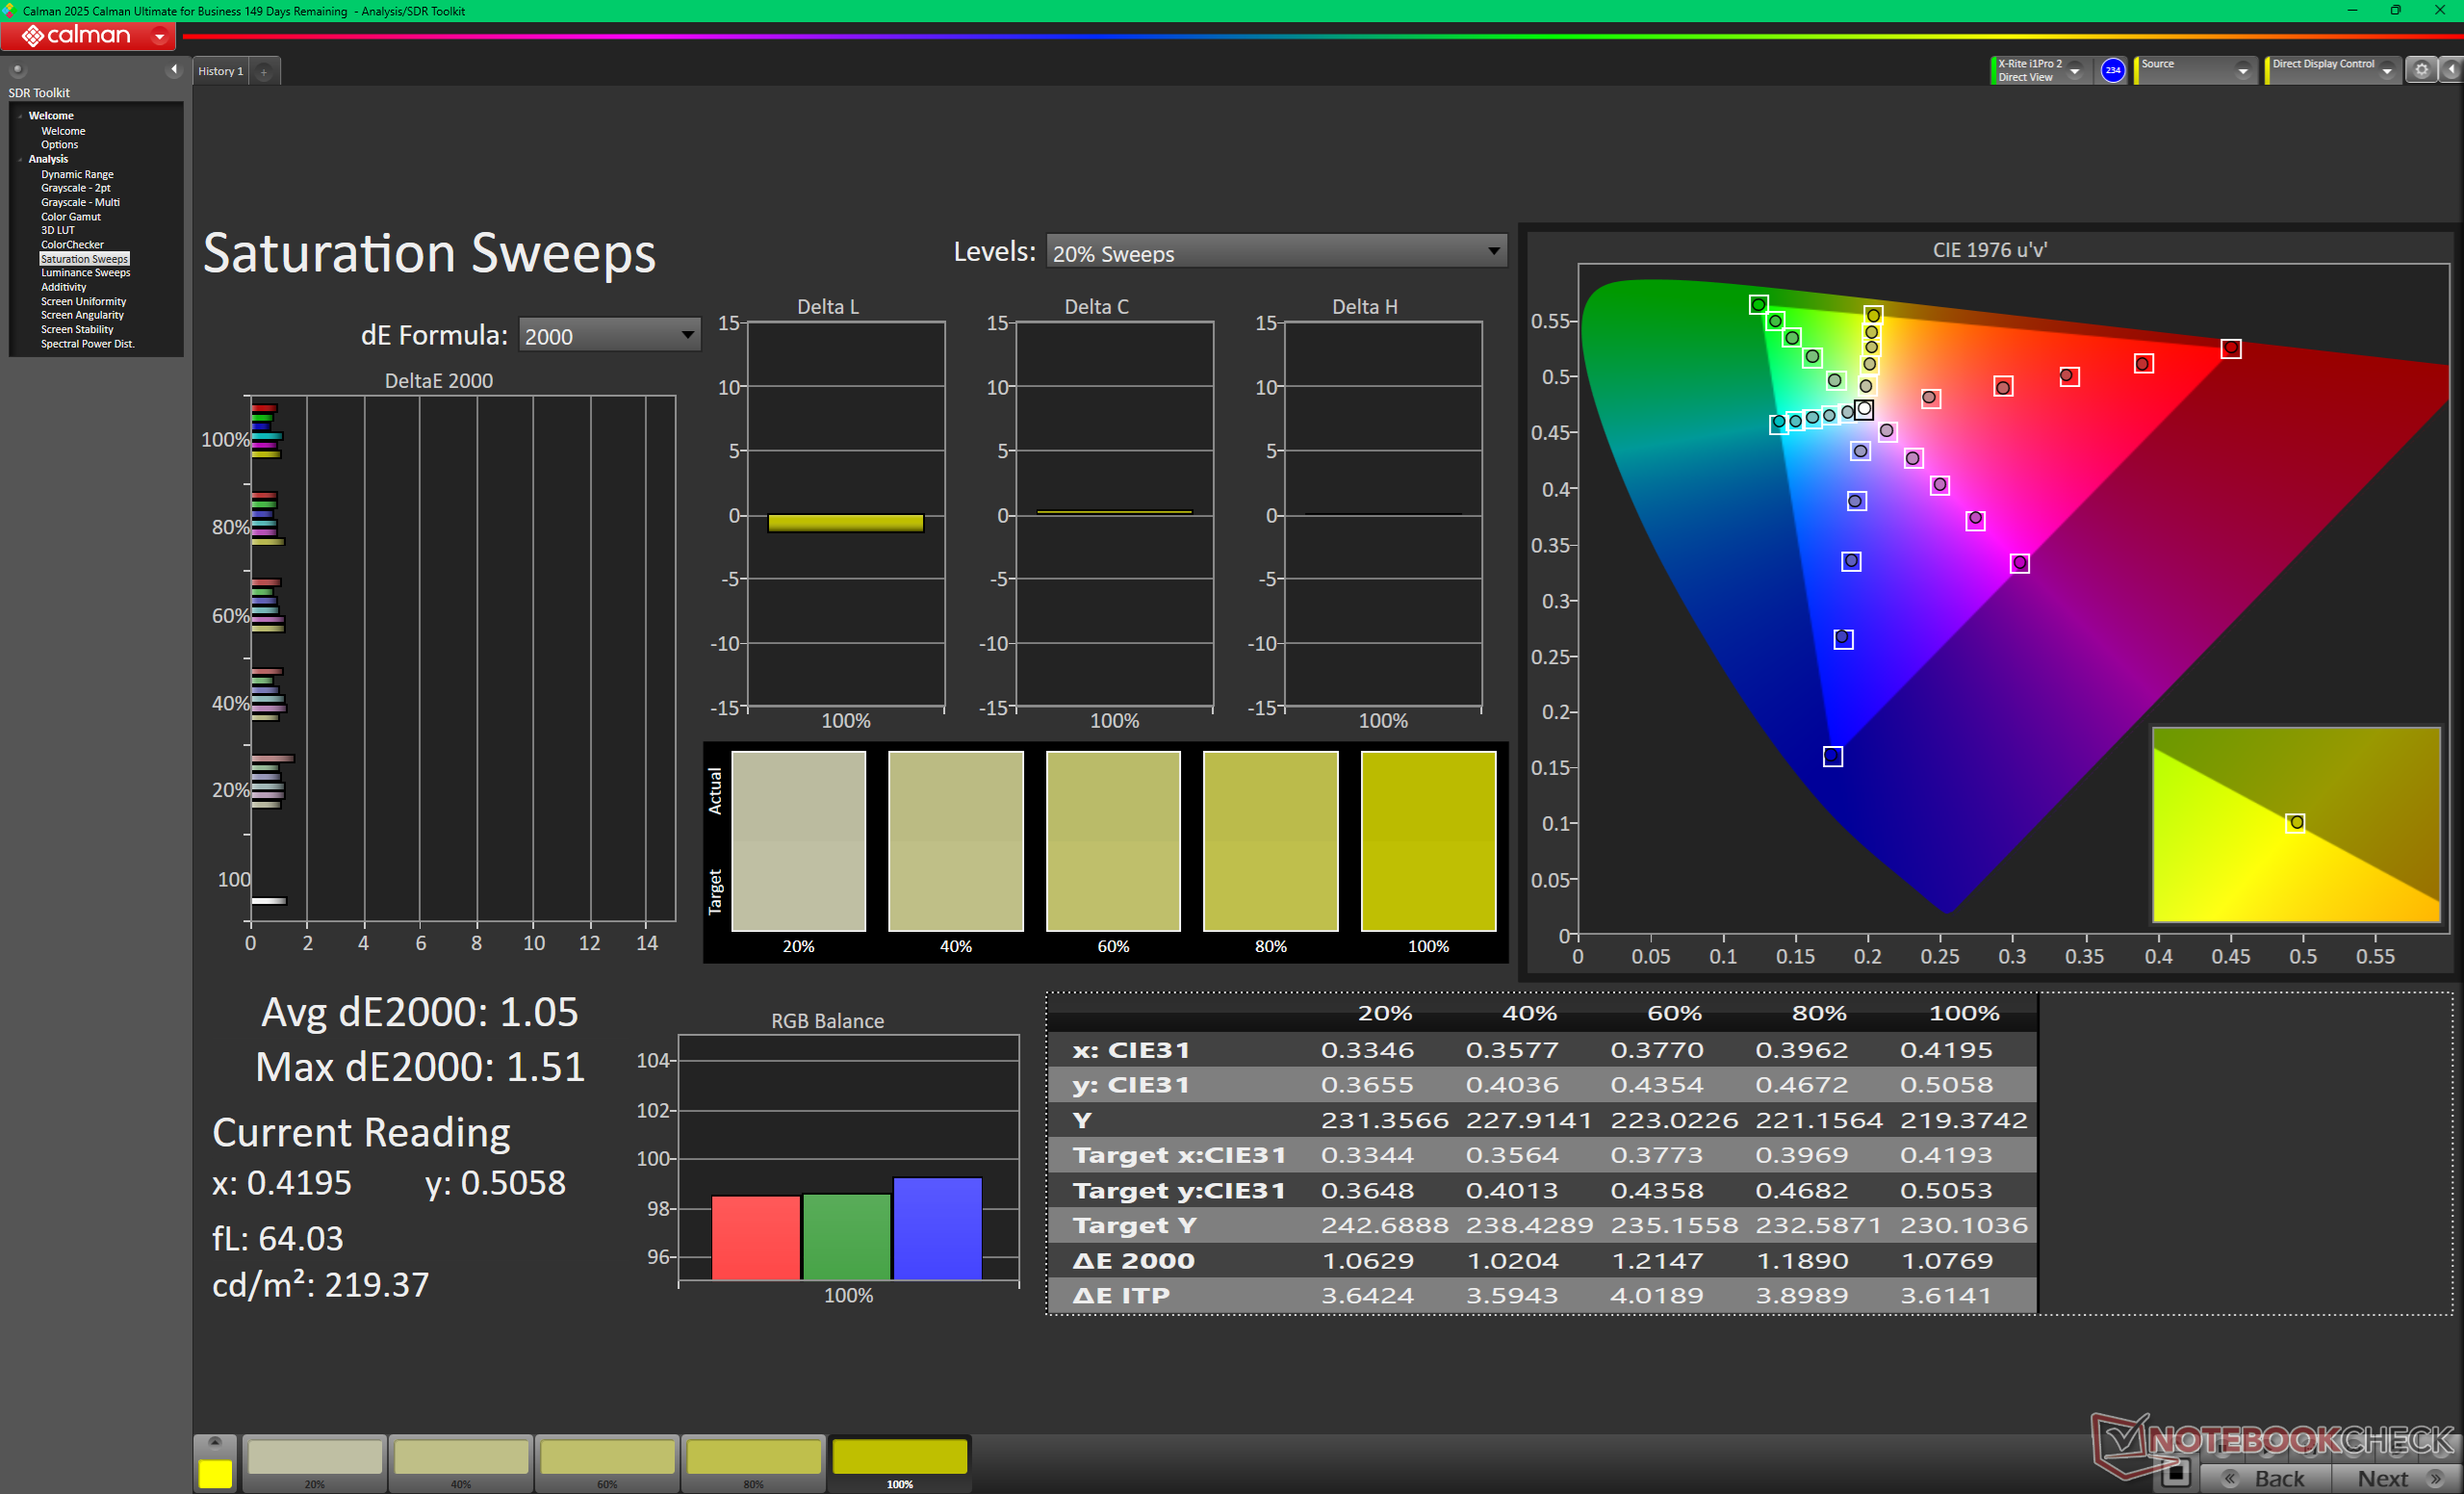
ΔE ColorChecker Calman: 3.26 | ∀{0.5-29.43 Ø4.69}
calibrated: 1.05
ΔE Greyscale Calman: 1.9 | ∀{0.09-98 Ø4.94}
93.5% AdobeRGB 1998 (Argyll 3D)
100% sRGB (Argyll 3D)
99.6% Display P3 (Argyll 3D)
Gamma: 2.33
CCT: 6454 K
| HP EliteBook X Flip G2i 14 AI Samsung SDC422D, OLED, 2880x1800, 14", 120 Hz | HP EliteBook X Flip G1i 14 AI AUO8FB5, IPS, 1920x1200, 14", 60 Hz | HP EliteBook x360 1040 G11 CMN1474, IPS, 1920x1200, 14", 60 Hz | MSI Prestige 14 Flip AI+ 2026 ATNA40KW05-0, OLED, 1920x1200, 14", 60 Hz | Lenovo Yoga 7 2-in-1 14AKP10 Lenovo LEN140WUXGA, OLED, 1920x1200, 14", 60 Hz | Dell Latitude 9450 2-in-1 AU Optronics B140QAN, IPS, 2560x1600, 14", 60 Hz | |
|---|---|---|---|---|---|---|
| Display | -14% | -19% | -1% | 2% | -11% | |
| Display P3 Coverage (%) | 99.6 | 76.7 -23% | 69 -31% | 100 0% | 98.5 -1% | 80.6 -19% |
| sRGB Coverage (%) | 100 | 98.2 -2% | 99.2 -1% | 100 0% | 100 0% | 100 0% |
| AdobeRGB 1998 Coverage (%) | 93.5 | 78.2 -16% | 71.1 -24% | 91.8 -2% | 99.9 7% | 80.1 -14% |
| Response Times | -5362% | -6265% | -95% | -67% | -6851% | |
| Response Time Grey 50% / Grey 80% * (ms) | 0.62 ? | 49.2 ? -7835% | 54.5 ? -8690% | 1.87 ? -202% | 1.5 ? -142% | 59.6 ? -9513% |
| Response Time Black / White * (ms) | 0.83 ? | 24.8 ? -2888% | 32.7 ? -3840% | 1.53 ? -84% | 1.4 ? -69% | 35.6 ? -4189% |
| PWM Frequency (Hz) | 1001 ? | 480 ? | 240 ? | |||
| PWM Amplitude * (%) | 22 | 22 -0% | 20 9% | |||
| Screen | -50% | 4% | 9% | -6% | 8% | |
| Brightness middle (cd/m²) | 468.9 | 572 22% | 351.3 -25% | 292 -38% | 360 -23% | 501.4 7% |
| Brightness (cd/m²) | 470 | 541 15% | 328 -30% | 292 -38% | 357 -24% | 491 4% |
| Brightness Distribution (%) | 98 | 78 -20% | 86 -12% | 98 0% | 97 -1% | 88 -10% |
| Black Level * (cd/m²) | 0.2 | 0.24 | 0.01 | 0.001 | 0.32 | |
| Colorchecker dE 2000 * | 3.26 | 4.19 -29% | 2.29 30% | 1.4 57% | 2.12 35% | 2.52 23% |
| Colorchecker dE 2000 max. * | 6.16 | 8.65 -40% | 4.55 26% | 2.2 64% | 4.59 25% | 4.87 21% |
| Colorchecker dE 2000 calibrated * | 1.05 | 2.11 -101% | 0.49 53% | 1.9 -81% | 0.45 57% | |
| Greyscale dE 2000 * | 1.9 | 5.65 -197% | 2.2 -16% | 1.7 11% | 1.4 26% | 2.8 -47% |
| Gamma | 2.33 94% | 2.45 90% | 2.13 103% | 2.12 104% | 2.187 101% | 2.17 101% |
| CCT | 6454 101% | 5959 109% | 6321 103% | 6510 100% | 6366 102% | 6270 104% |
| Contrast (:1) | 2860 | 1464 | 29200 | 360000 | 1567 | |
| Total Average (Program / Settings) | -1809% /
-926% | -2093% /
-1047% | -29% /
-19% | -24% /
-18% | -2285% /
-1140% |
* ... smaller is better
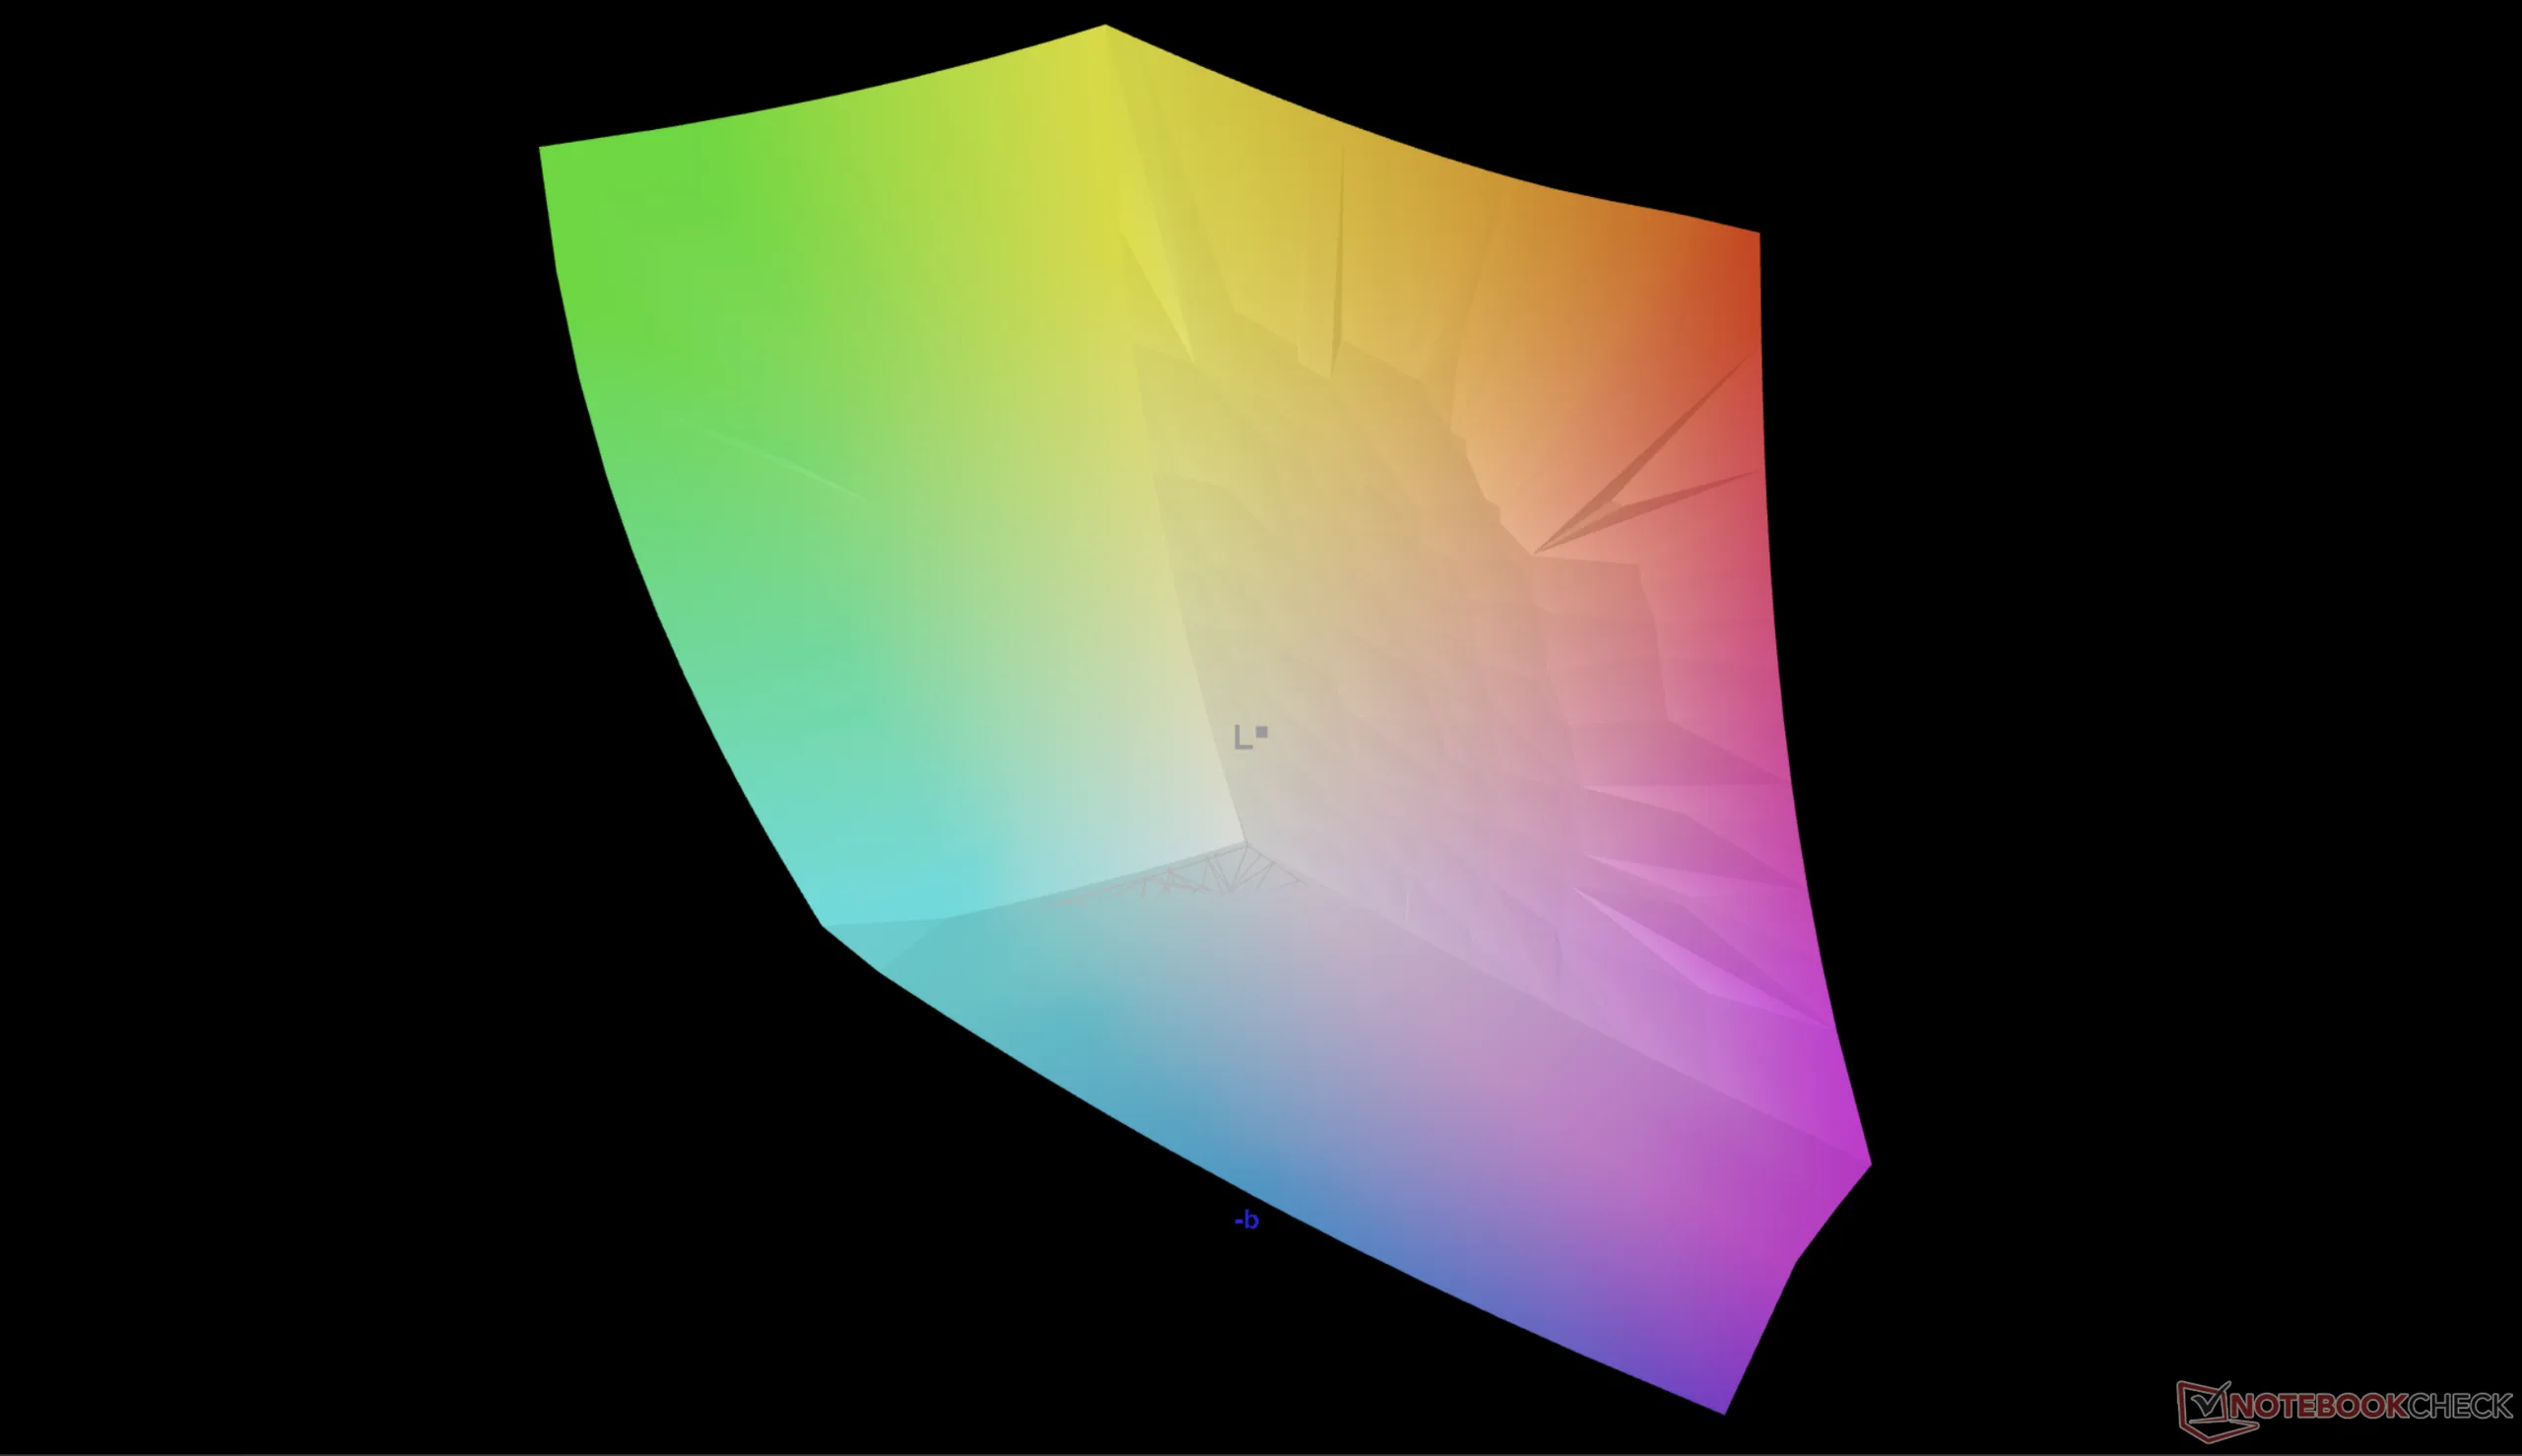
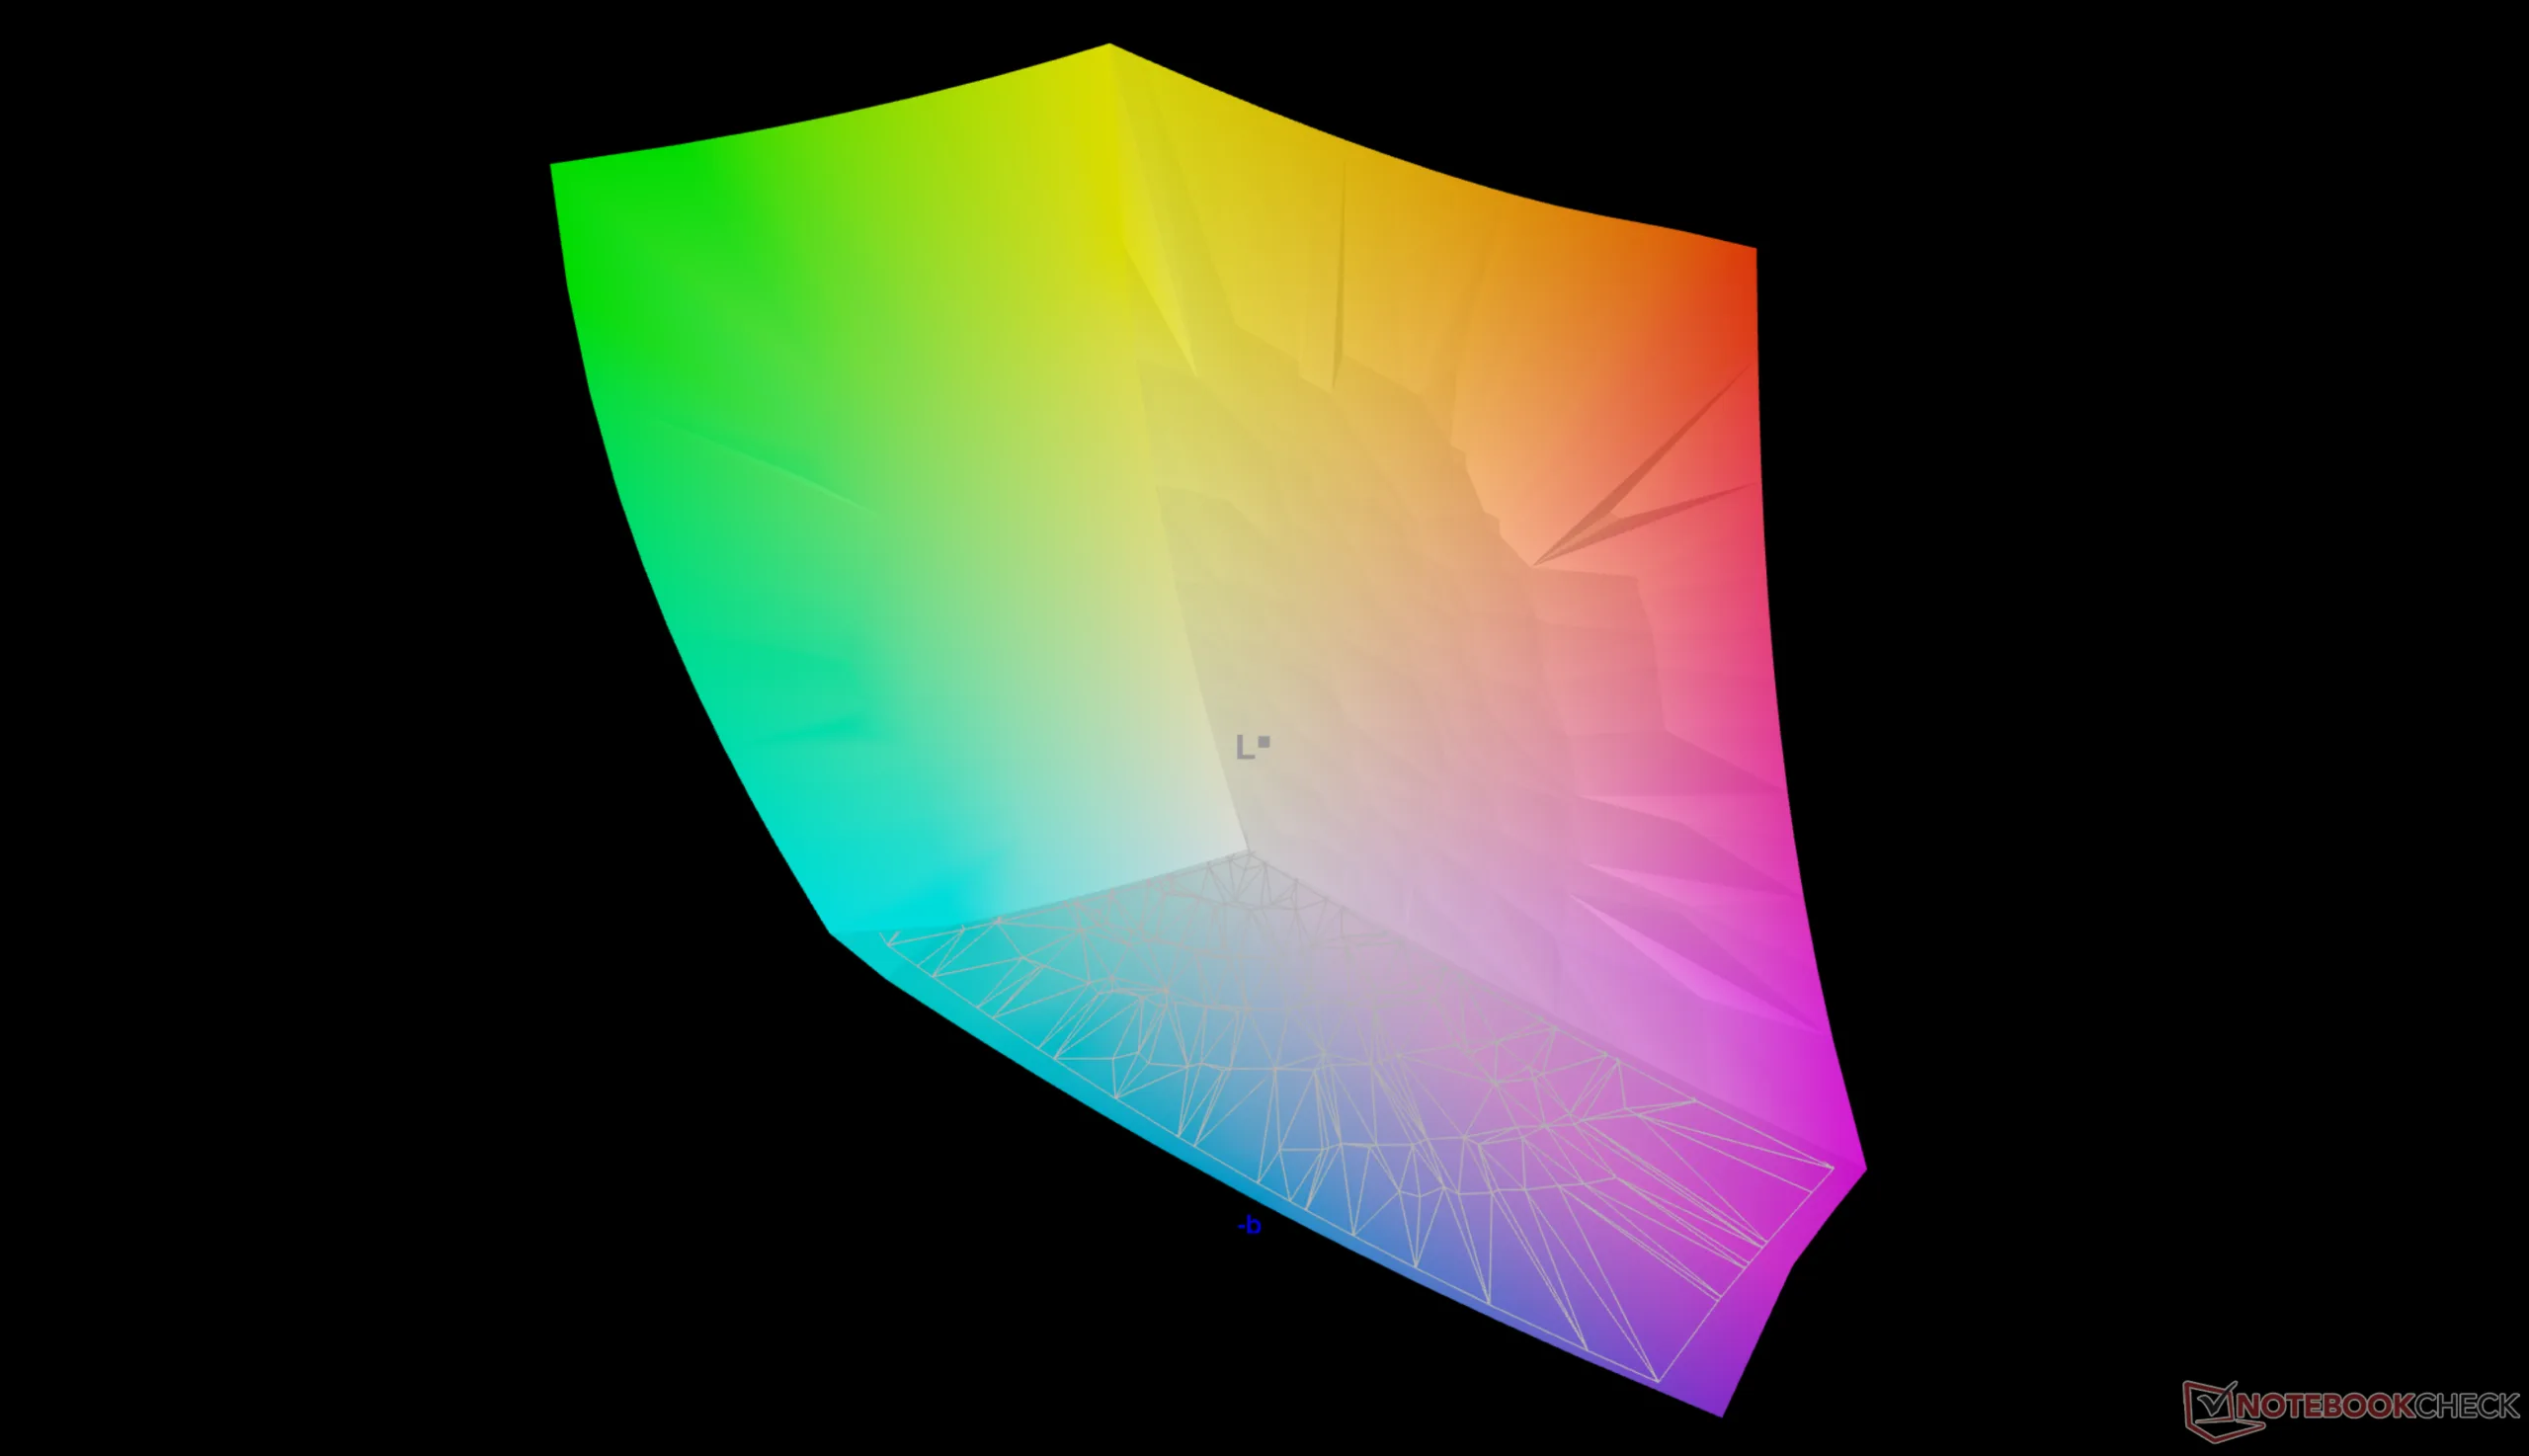
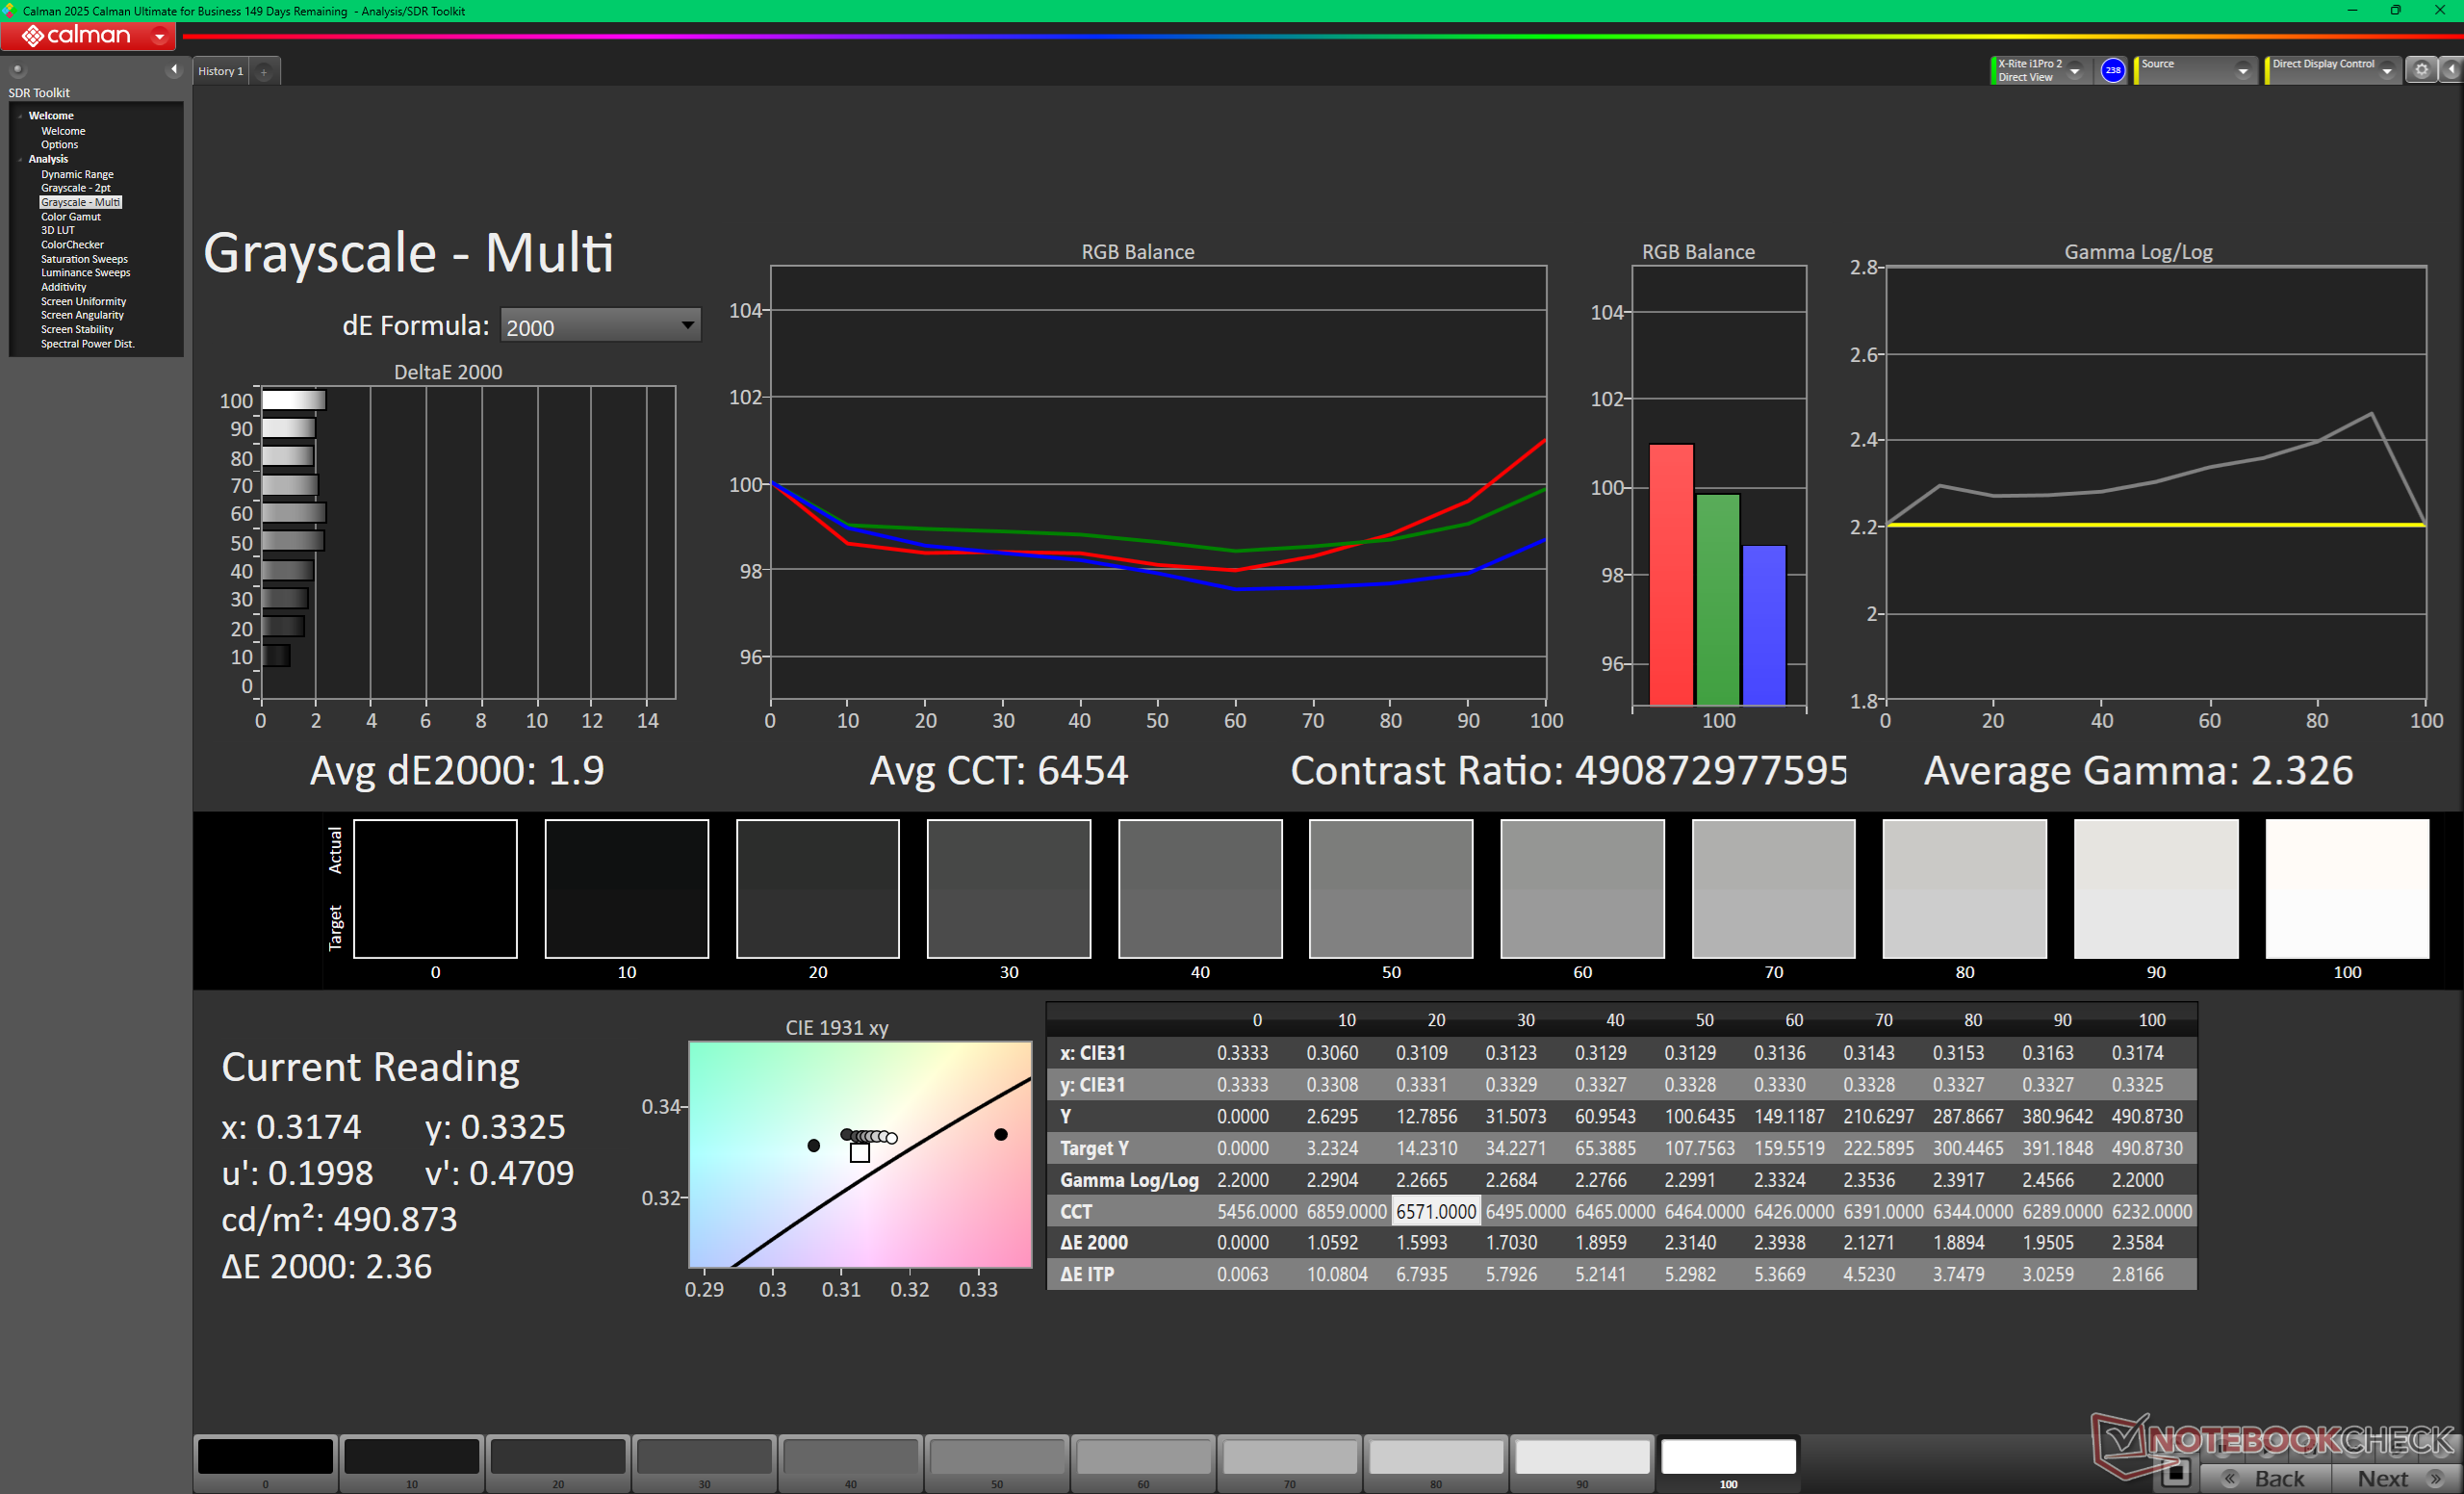
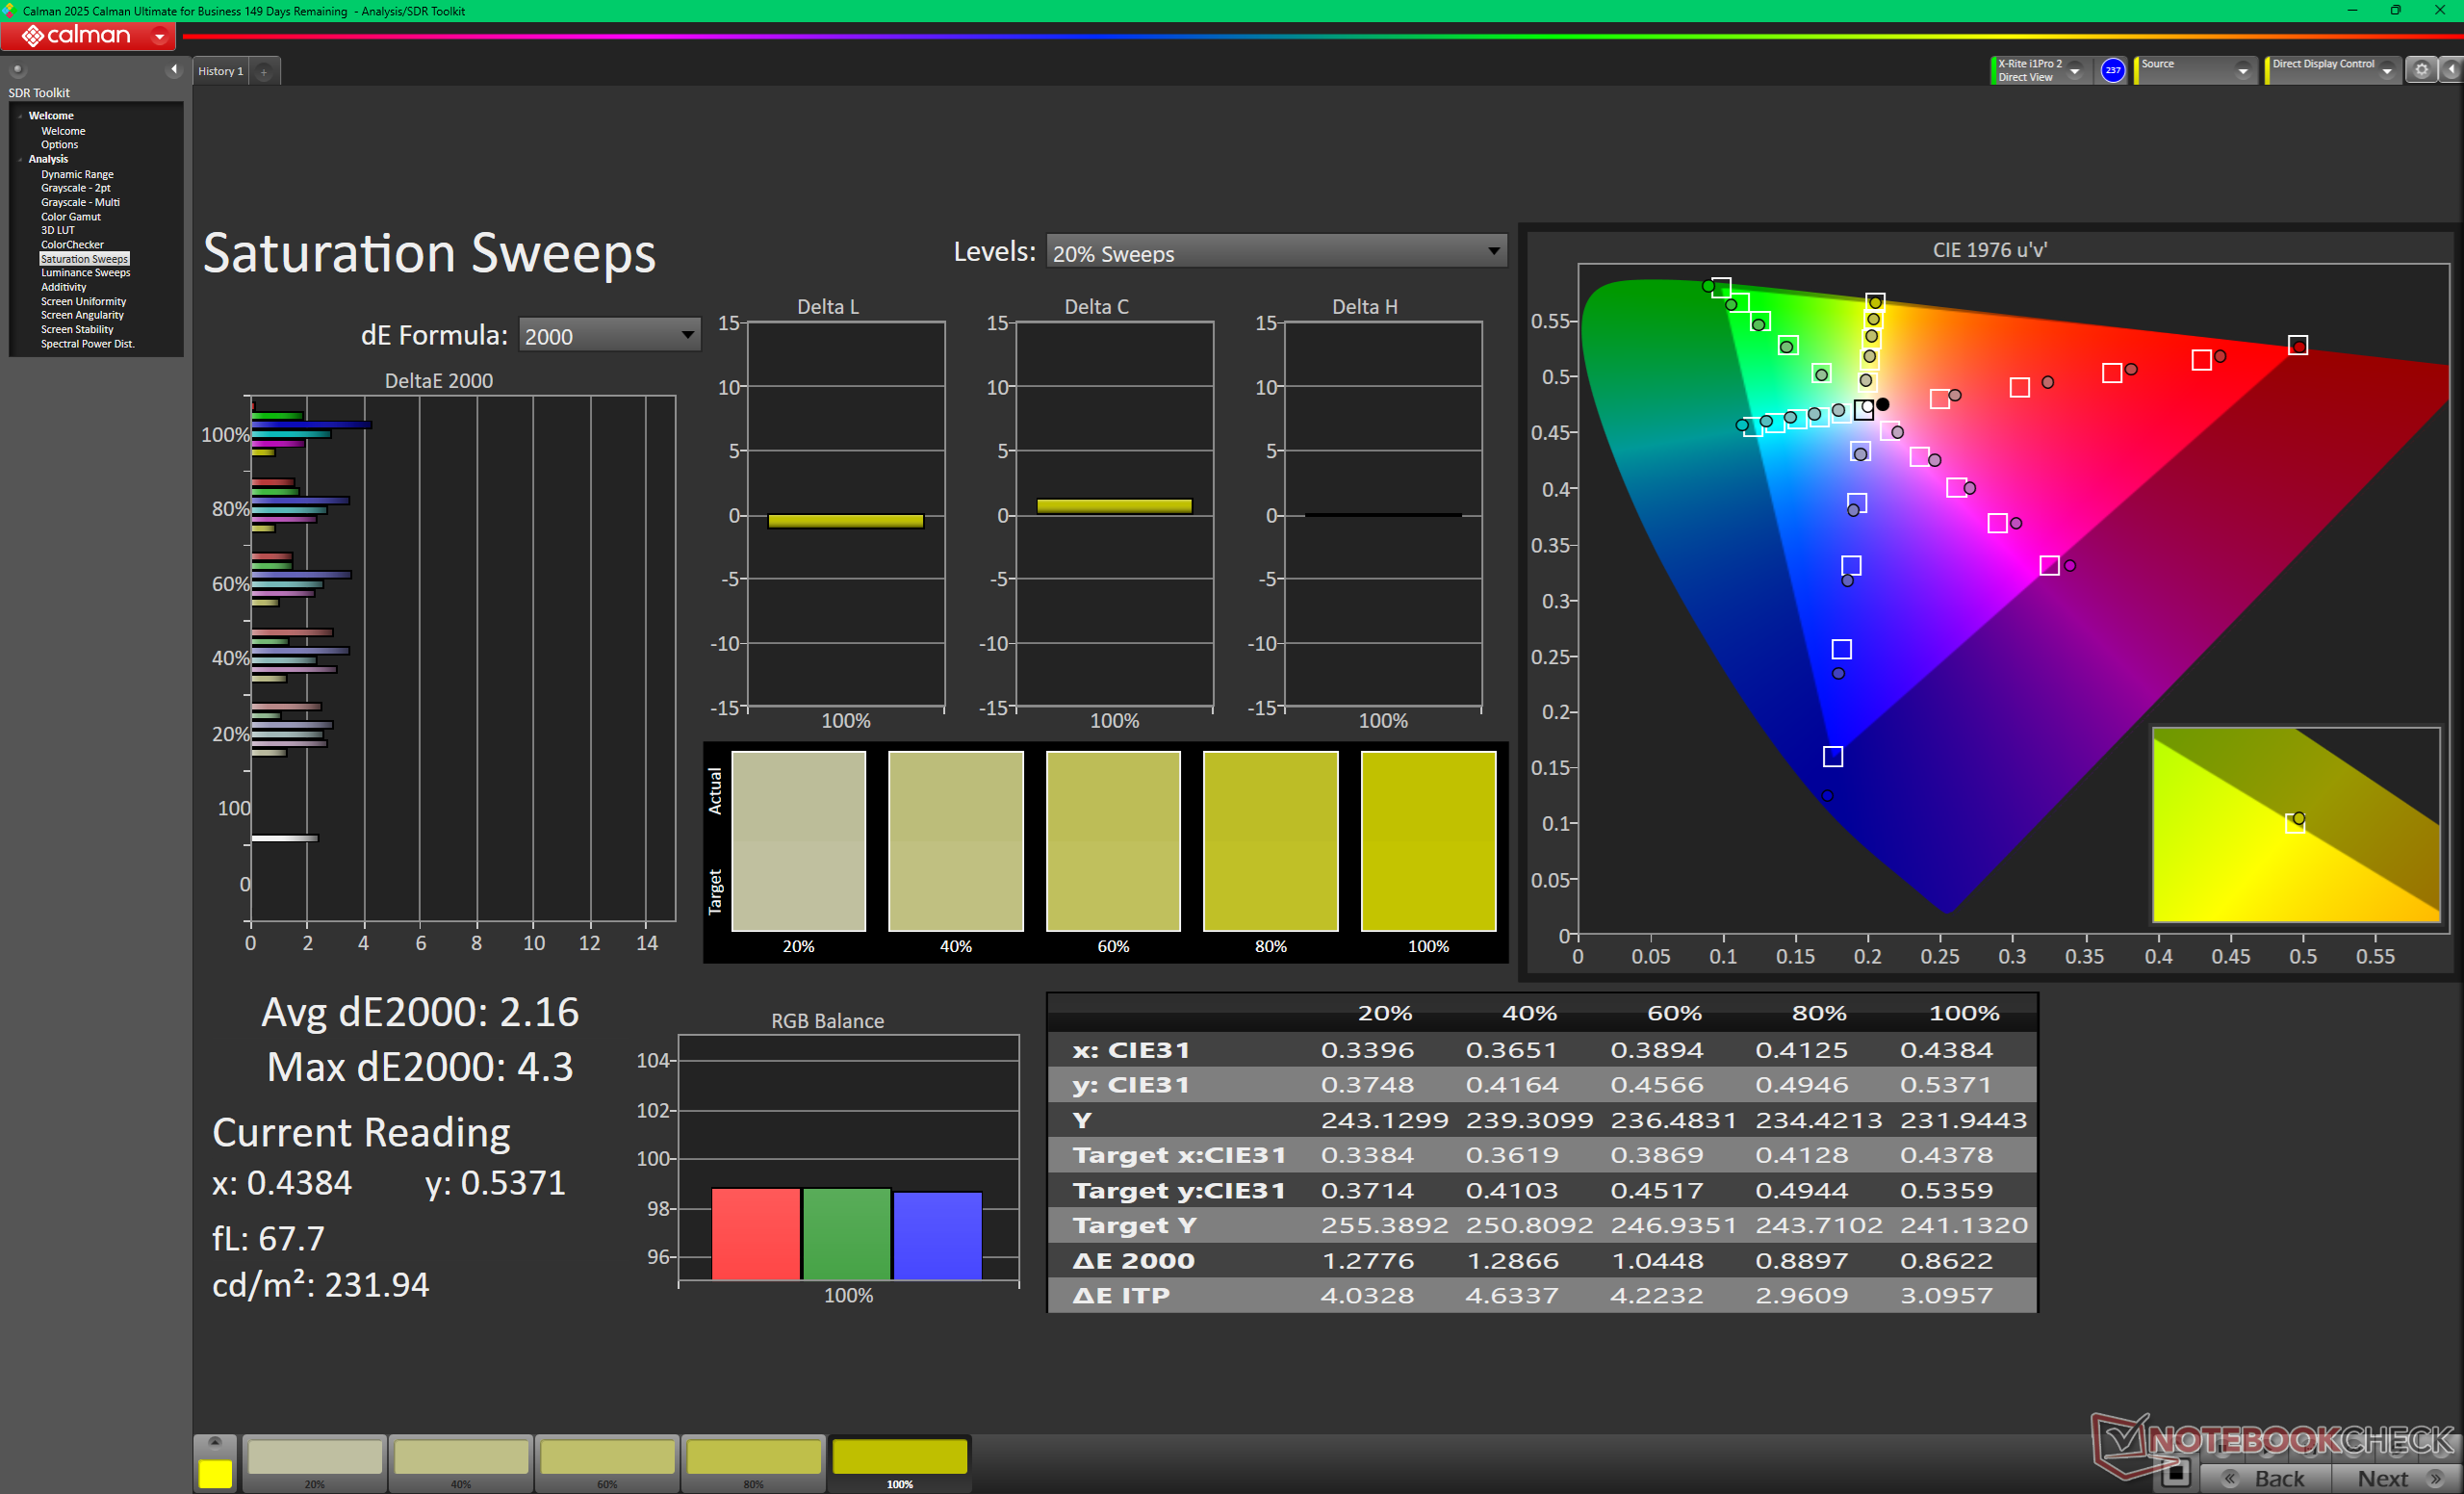


Display Response Times
| ↔ Response Time Black to White | ||
|---|---|---|
| 0.83 ms ... rise ↗ and fall ↘ combined | ↗ 0.37 ms rise | 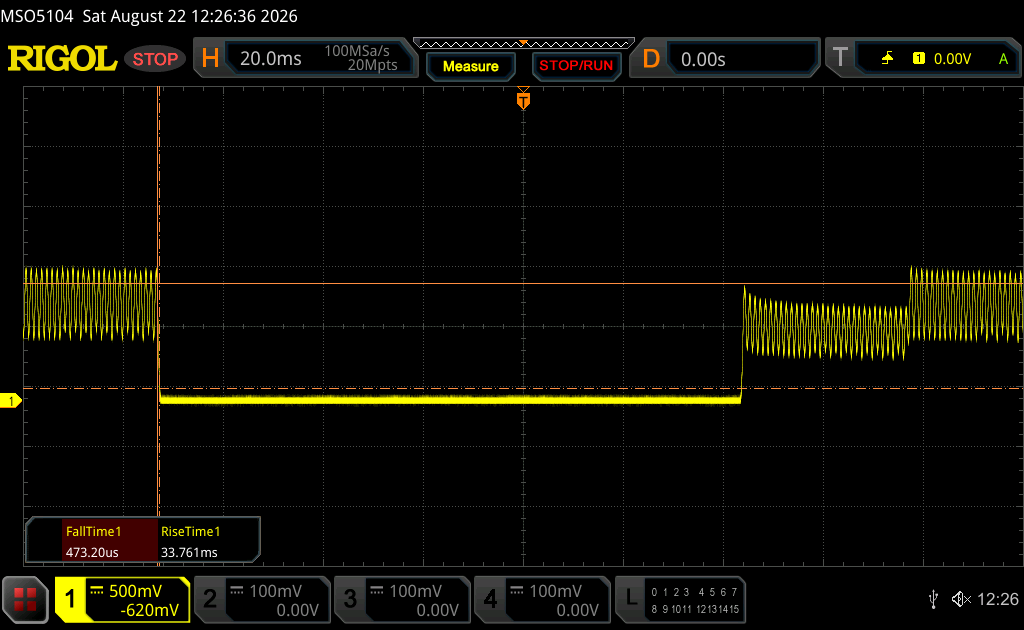 |
| ↘ 0.46 ms fall | ||
| The screen shows very fast response rates in our tests and should be very well suited for fast-paced gaming. In comparison, all tested devices range from 0.1 (minimum) to 240 (maximum) ms. » 3 % of all devices are better. This means that the measured response time is better than the average of all tested devices (19.7 ms). | ||
| ↔ Response Time 50% Grey to 80% Grey | ||
| 0.62 ms ... rise ↗ and fall ↘ combined | ↗ 0.29 ms rise | 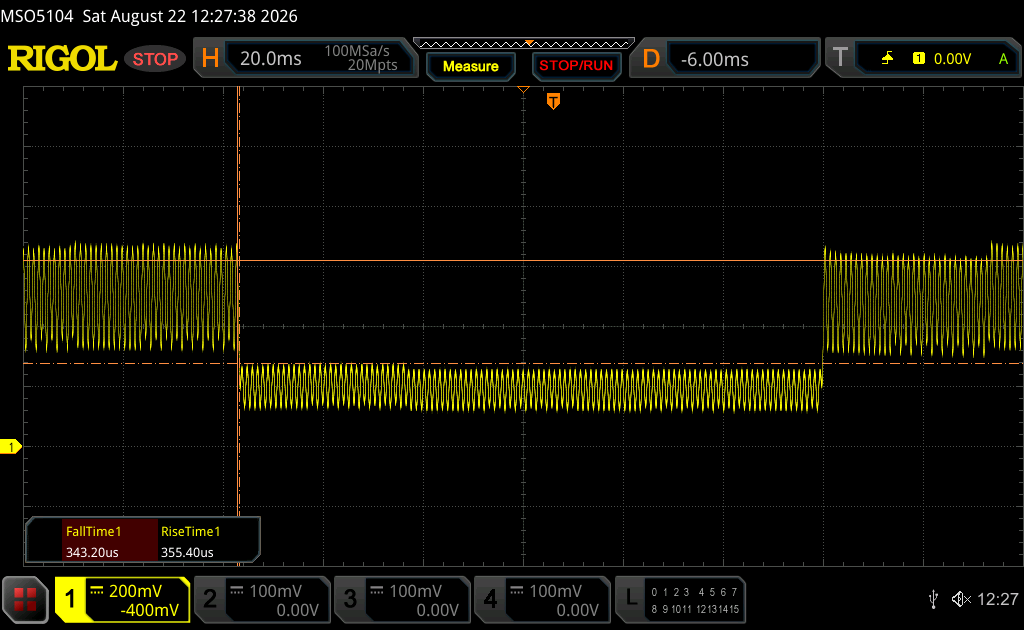 |
| ↘ 0.33 ms fall | ||
| The screen shows very fast response rates in our tests and should be very well suited for fast-paced gaming. In comparison, all tested devices range from 0.13 (minimum) to 636 (maximum) ms. » 2 % of all devices are better. This means that the measured response time is better than the average of all tested devices (30.7 ms). | ||
Screen Flickering / PWM (Pulse-Width Modulation)
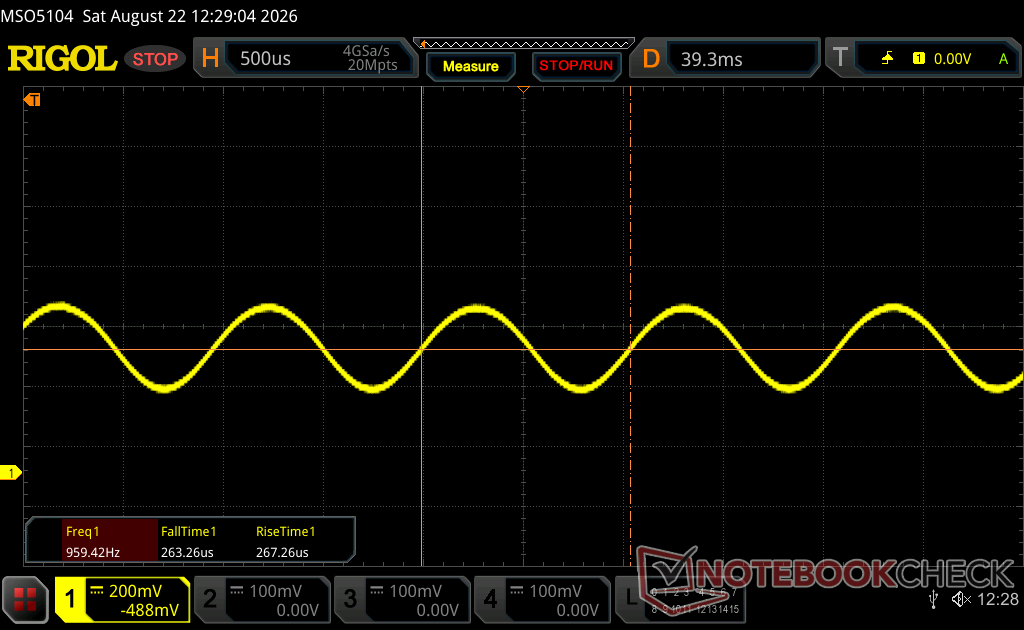
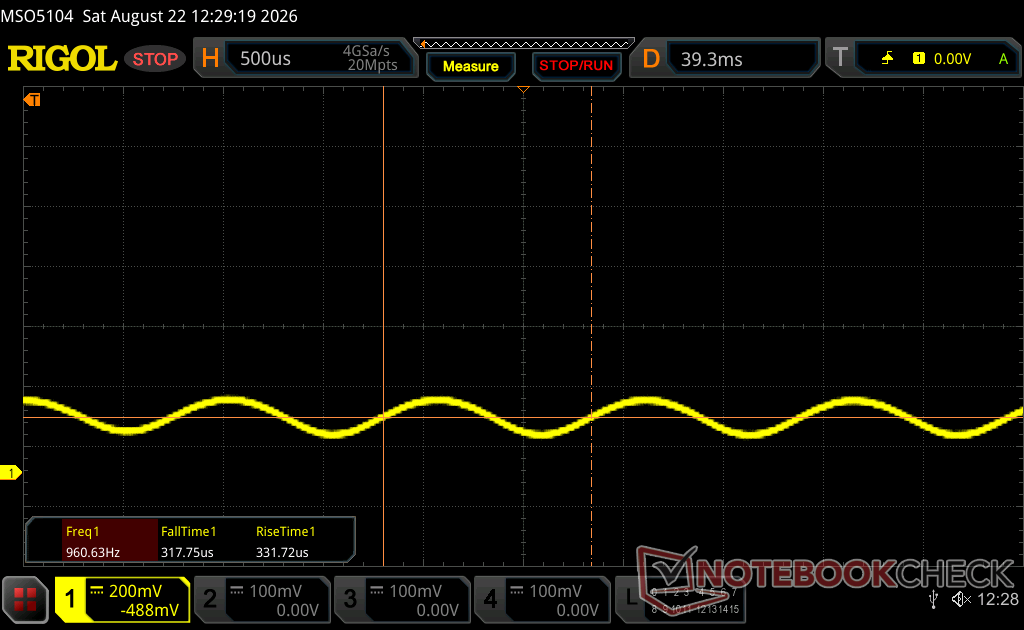
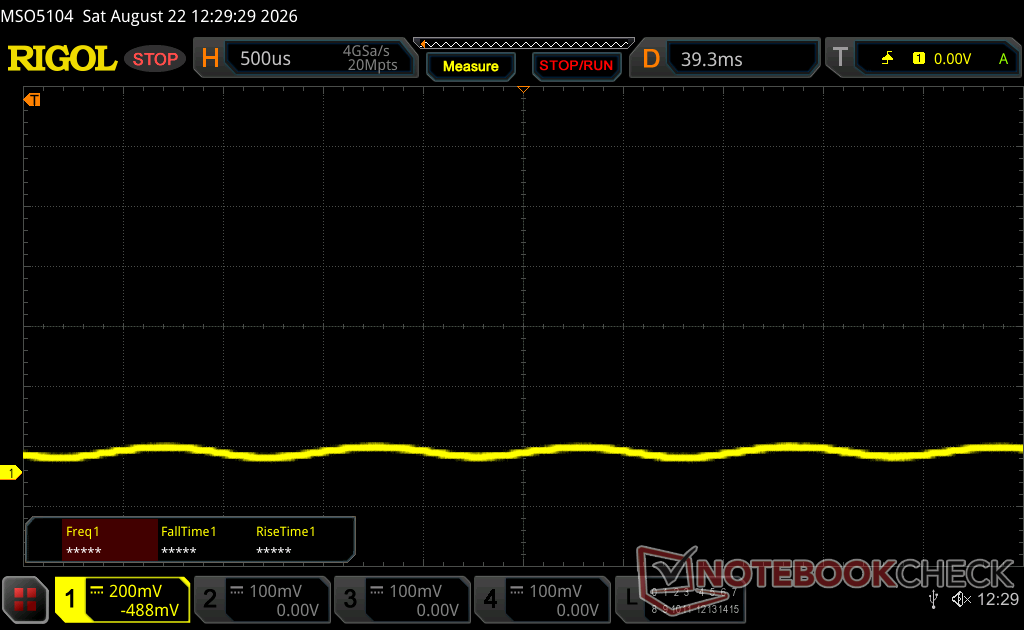
| Screen flickering / PWM detected | 1001 Hz Amplitude: 22 % | ≤ 100 % brightness setting | 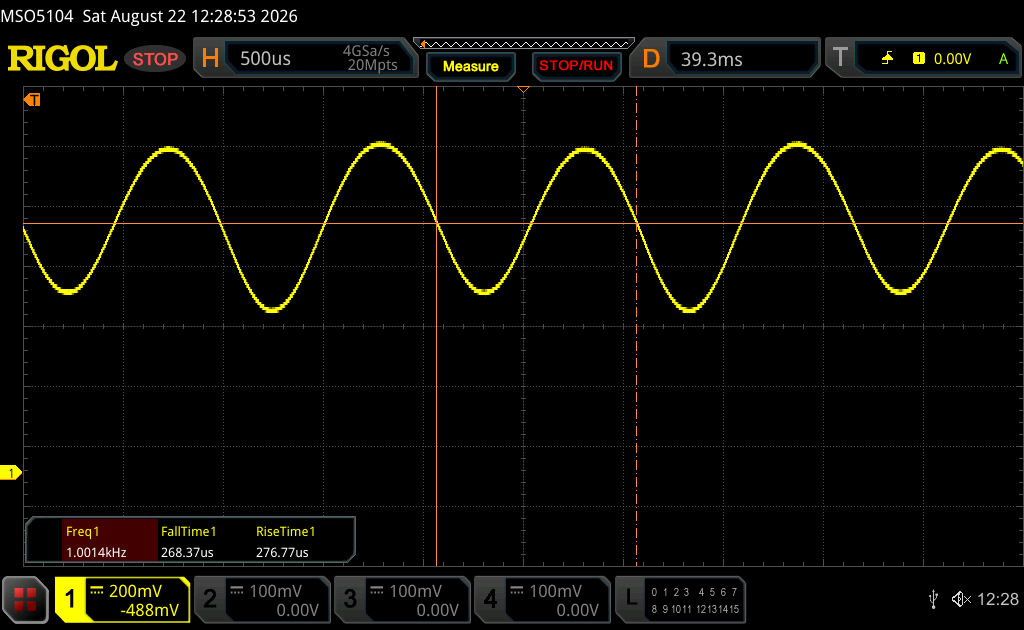 |
The display backlight flickers at 1001 Hz (worst case, e.g., utilizing PWM) Flickering detected at a brightness setting of 100 % and below. There should be no flickering or PWM above this brightness setting. The frequency of 1001 Hz is quite high, so most users sensitive to PWM should not notice any flickering. In comparison: 52 % of all tested devices do not use PWM to dim the display. If PWM was detected, an average of 7611 (minimum: 5 - maximum: 343500) Hz was measured. | |||


Performance
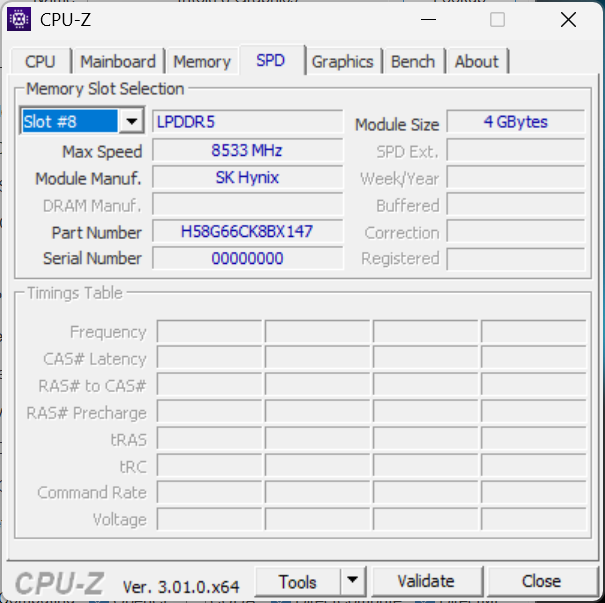
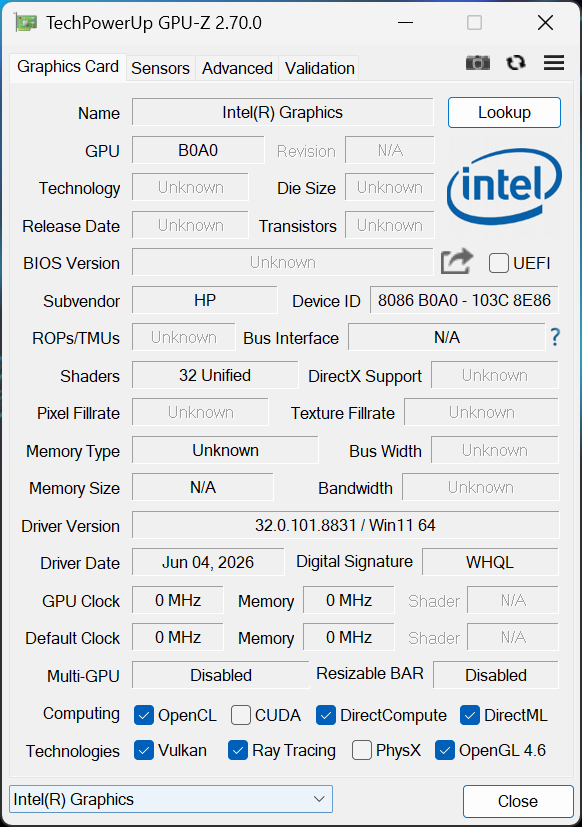
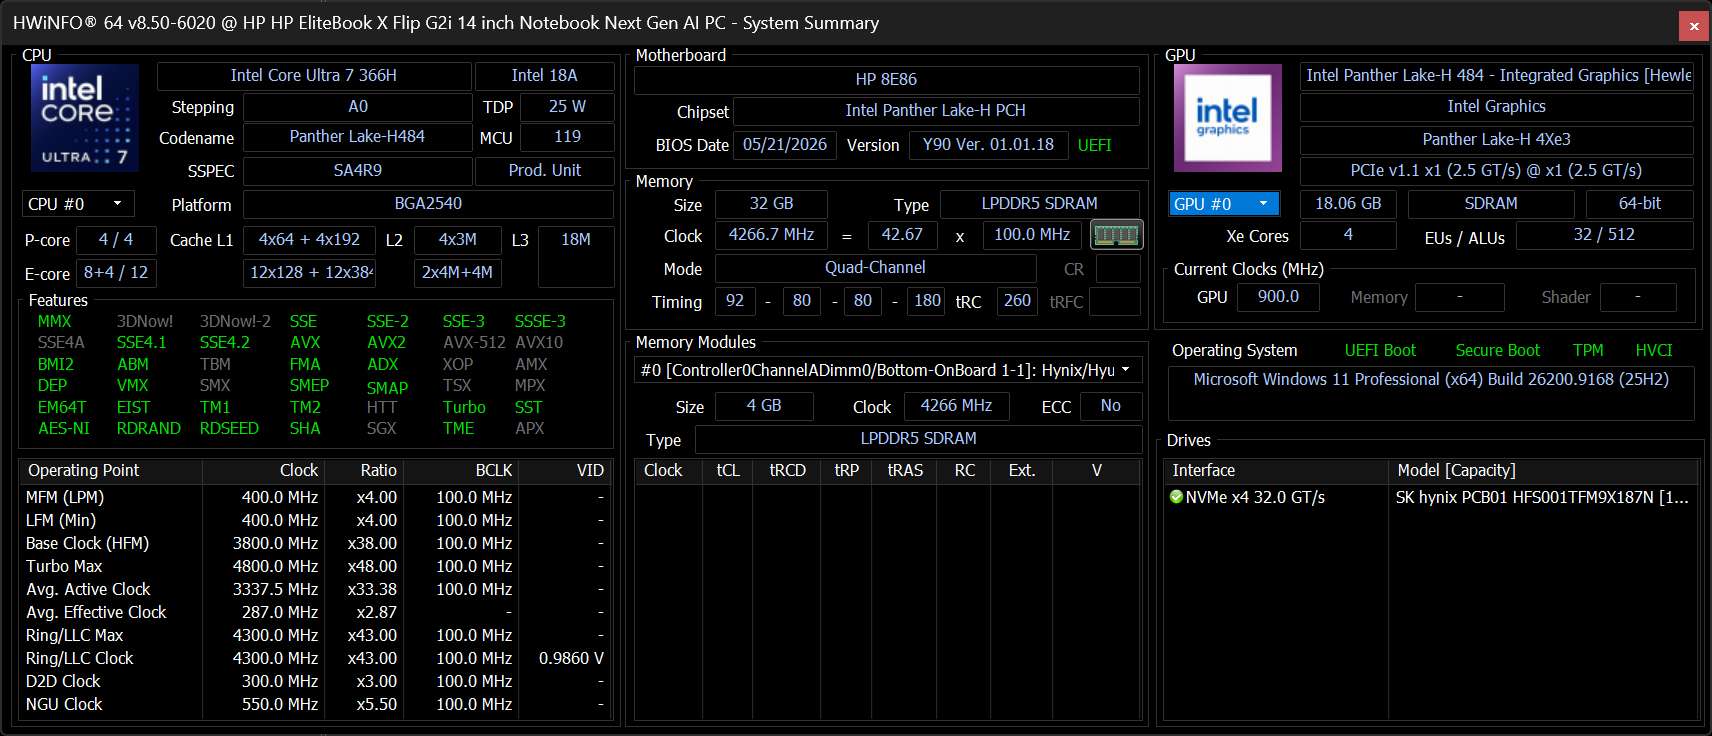
Testing Conditions
We set Windows and the HP software to Performance mode prior to running the benchmarks below.
Processor Performance
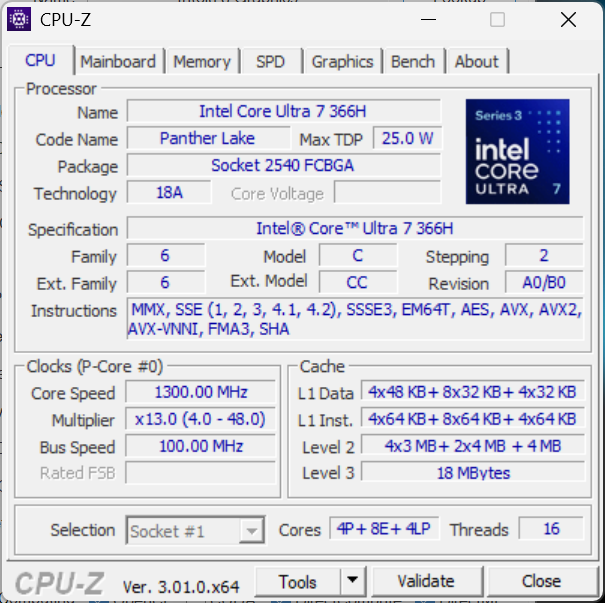
The Core Ultra 7 366H is neck-to-neck with the Core Ultra X7 358H when it comes to raw processor performance.
Upgrading from the base Core Ultra 5 325 configuration to our Core Ultra 7 366H will improve multi-thread performance by up to 80 percent.
Cinebench R15 Multi Loop
Cinebench 2024: CPU Single Core | CPU Multi Core
Cinebench R23: Multi Core | Single Core
Cinebench R20: CPU (Multi Core) | CPU (Single Core)
Cinebench R15: CPU Multi 64Bit | CPU Single 64Bit
Blender: v2.79 BMW27 CPU
7-Zip 18.03: 7z b 4 | 7z b 4 -mmt1
Geekbench 6.7: Multi-Core | Single-Core
Geekbench 5.5: Multi-Core | Single-Core
HWBOT x265 Benchmark v2.2: 4k Preset
LibreOffice : 20 Documents To PDF
R Benchmark 2.5: Overall mean
Cinebench 2024: CPU Single Core | CPU Multi Core
Cinebench R23: Multi Core | Single Core
Cinebench R20: CPU (Multi Core) | CPU (Single Core)
Cinebench R15: CPU Multi 64Bit | CPU Single 64Bit
Blender: v2.79 BMW27 CPU
7-Zip 18.03: 7z b 4 | 7z b 4 -mmt1
Geekbench 6.7: Multi-Core | Single-Core
Geekbench 5.5: Multi-Core | Single-Core
HWBOT x265 Benchmark v2.2: 4k Preset
LibreOffice : 20 Documents To PDF
R Benchmark 2.5: Overall mean
* ... smaller is better
AIDA64: FP32 Ray-Trace | FPU Julia | CPU SHA3 | CPU Queen | FPU SinJulia | FPU Mandel | CPU AES | CPU ZLib | FP64 Ray-Trace | CPU PhotoWorxx | CPU CheckMate
| Performance rating | |
| HP EliteBook X Flip G2i 14 AI -1! | |
| Average Intel Core Ultra 7 366H -1! | |
| MSI Prestige 14 Flip AI+ 2026 -1! | |
| Lenovo Yoga 7 2-in-1 14AKP10 -1! | |
| HP EliteBook x360 1040 G11 -1! | |
| HP EliteBook X Flip G1i 14 AI -1! | |
| Dell Latitude 9450 2-in-1 -1! | |
| AIDA64 / FP32 Ray-Trace | |
| Lenovo Yoga 7 2-in-1 14AKP10 (v6.92.6600) | |
| HP EliteBook X Flip G2i 14 AI (v8.20.8100) | |
| Average Intel Core Ultra 7 366H (14248 - 20583, n=5) | |
| MSI Prestige 14 Flip AI+ 2026 (v8.20.8100) | |
| HP EliteBook x360 1040 G11 (v6.92.6600) | |
| HP EliteBook X Flip G1i 14 AI (v6.92.6600) | |
| Dell Latitude 9450 2-in-1 (v6.92.6600) | |
| AIDA64 / FPU Julia | |
| Average Intel Core Ultra 7 366H (75534 - 107380, n=5) | |
| HP EliteBook X Flip G2i 14 AI (v8.20.8100) | |
| MSI Prestige 14 Flip AI+ 2026 (v8.20.8100) | |
| Lenovo Yoga 7 2-in-1 14AKP10 (v6.92.6600) | |
| HP EliteBook x360 1040 G11 (v6.92.6600) | |
| HP EliteBook X Flip G1i 14 AI (v6.92.6600) | |
| Dell Latitude 9450 2-in-1 (v6.92.6600) | |
| AIDA64 / CPU SHA3 | |
| HP EliteBook X Flip G2i 14 AI (v8.20.8100) | |
| Average Intel Core Ultra 7 366H (3837 - 5249, n=5) | |
| MSI Prestige 14 Flip AI+ 2026 (v8.20.8100) | |
| HP EliteBook x360 1040 G11 (v6.92.6600) | |
| Lenovo Yoga 7 2-in-1 14AKP10 (v6.92.6600) | |
| Dell Latitude 9450 2-in-1 (v6.92.6600) | |
| HP EliteBook X Flip G1i 14 AI (v6.92.6600) | |
| AIDA64 / CPU Queen | |
| HP EliteBook x360 1040 G11 (v6.92.6600) | |
| Lenovo Yoga 7 2-in-1 14AKP10 (v6.92.6600) | |
| HP EliteBook X Flip G1i 14 AI (v6.92.6600) | |
| Dell Latitude 9450 2-in-1 (v6.92.6600) | |
| AIDA64 / FPU SinJulia | |
| Lenovo Yoga 7 2-in-1 14AKP10 (v6.92.6600) | |
| HP EliteBook x360 1040 G11 (v6.92.6600) | |
| HP EliteBook X Flip G2i 14 AI (v8.20.8100) | |
| Average Intel Core Ultra 7 366H (6482 - 7136, n=5) | |
| MSI Prestige 14 Flip AI+ 2026 (v8.20.8100) | |
| Dell Latitude 9450 2-in-1 (v6.92.6600) | |
| HP EliteBook X Flip G1i 14 AI (v6.92.6600) | |
| AIDA64 / FPU Mandel | |
| Average Intel Core Ultra 7 366H (40198 - 57706, n=5) | |
| HP EliteBook X Flip G2i 14 AI (v8.20.8100) | |
| MSI Prestige 14 Flip AI+ 2026 (v8.20.8100) | |
| Lenovo Yoga 7 2-in-1 14AKP10 (v6.92.6600) | |
| HP EliteBook x360 1040 G11 (v6.92.6600) | |
| HP EliteBook X Flip G1i 14 AI (v6.92.6600) | |
| Dell Latitude 9450 2-in-1 (v6.92.6600) | |
| AIDA64 / CPU AES | |
| HP EliteBook x360 1040 G11 (v6.92.6600) | |
| HP EliteBook X Flip G2i 14 AI (v8.20.8100) | |
| Average Intel Core Ultra 7 366H (57542 - 68072, n=5) | |
| Lenovo Yoga 7 2-in-1 14AKP10 (v6.92.6600) | |
| MSI Prestige 14 Flip AI+ 2026 (v8.20.8100) | |
| Dell Latitude 9450 2-in-1 (v6.92.6600) | |
| HP EliteBook X Flip G1i 14 AI (v6.92.6600) | |
| AIDA64 / CPU ZLib | |
| HP EliteBook X Flip G2i 14 AI (v8.20.8100) | |
| Average Intel Core Ultra 7 366H (921 - 1219, n=5) | |
| MSI Prestige 14 Flip AI+ 2026 (v8.20.8100) | |
| HP EliteBook x360 1040 G11 (v6.92.6600) | |
| Lenovo Yoga 7 2-in-1 14AKP10 (v6.92.6600) | |
| Dell Latitude 9450 2-in-1 (v6.92.6600) | |
| HP EliteBook X Flip G1i 14 AI (v6.92.6600) | |
| AIDA64 / FP64 Ray-Trace | |
| Lenovo Yoga 7 2-in-1 14AKP10 (v6.92.6600) | |
| Average Intel Core Ultra 7 366H (7395 - 11027, n=5) | |
| HP EliteBook X Flip G2i 14 AI (v8.20.8100) | |
| MSI Prestige 14 Flip AI+ 2026 (v8.20.8100) | |
| HP EliteBook x360 1040 G11 (v6.92.6600) | |
| HP EliteBook X Flip G1i 14 AI (v6.92.6600) | |
| Dell Latitude 9450 2-in-1 (v6.92.6600) | |
| AIDA64 / CPU PhotoWorxx | |
| HP EliteBook X Flip G2i 14 AI (v8.20.8100) | |
| MSI Prestige 14 Flip AI+ 2026 (v8.20.8100) | |
| Average Intel Core Ultra 7 366H (74842 - 83297, n=5) | |
| HP EliteBook X Flip G1i 14 AI (v6.92.6600) | |
| Dell Latitude 9450 2-in-1 (v6.92.6600) | |
| HP EliteBook x360 1040 G11 (v6.92.6600) | |
| Lenovo Yoga 7 2-in-1 14AKP10 (v6.92.6600) | |
| AIDA64 / CPU CheckMate | |
| MSI Prestige 14 Flip AI+ 2026 (v8.20.8100) | |
| Average Intel Core Ultra 7 366H (4202 - 4591, n=5) | |
| HP EliteBook X Flip G2i 14 AI (v8.20.8100) | |
System Performance
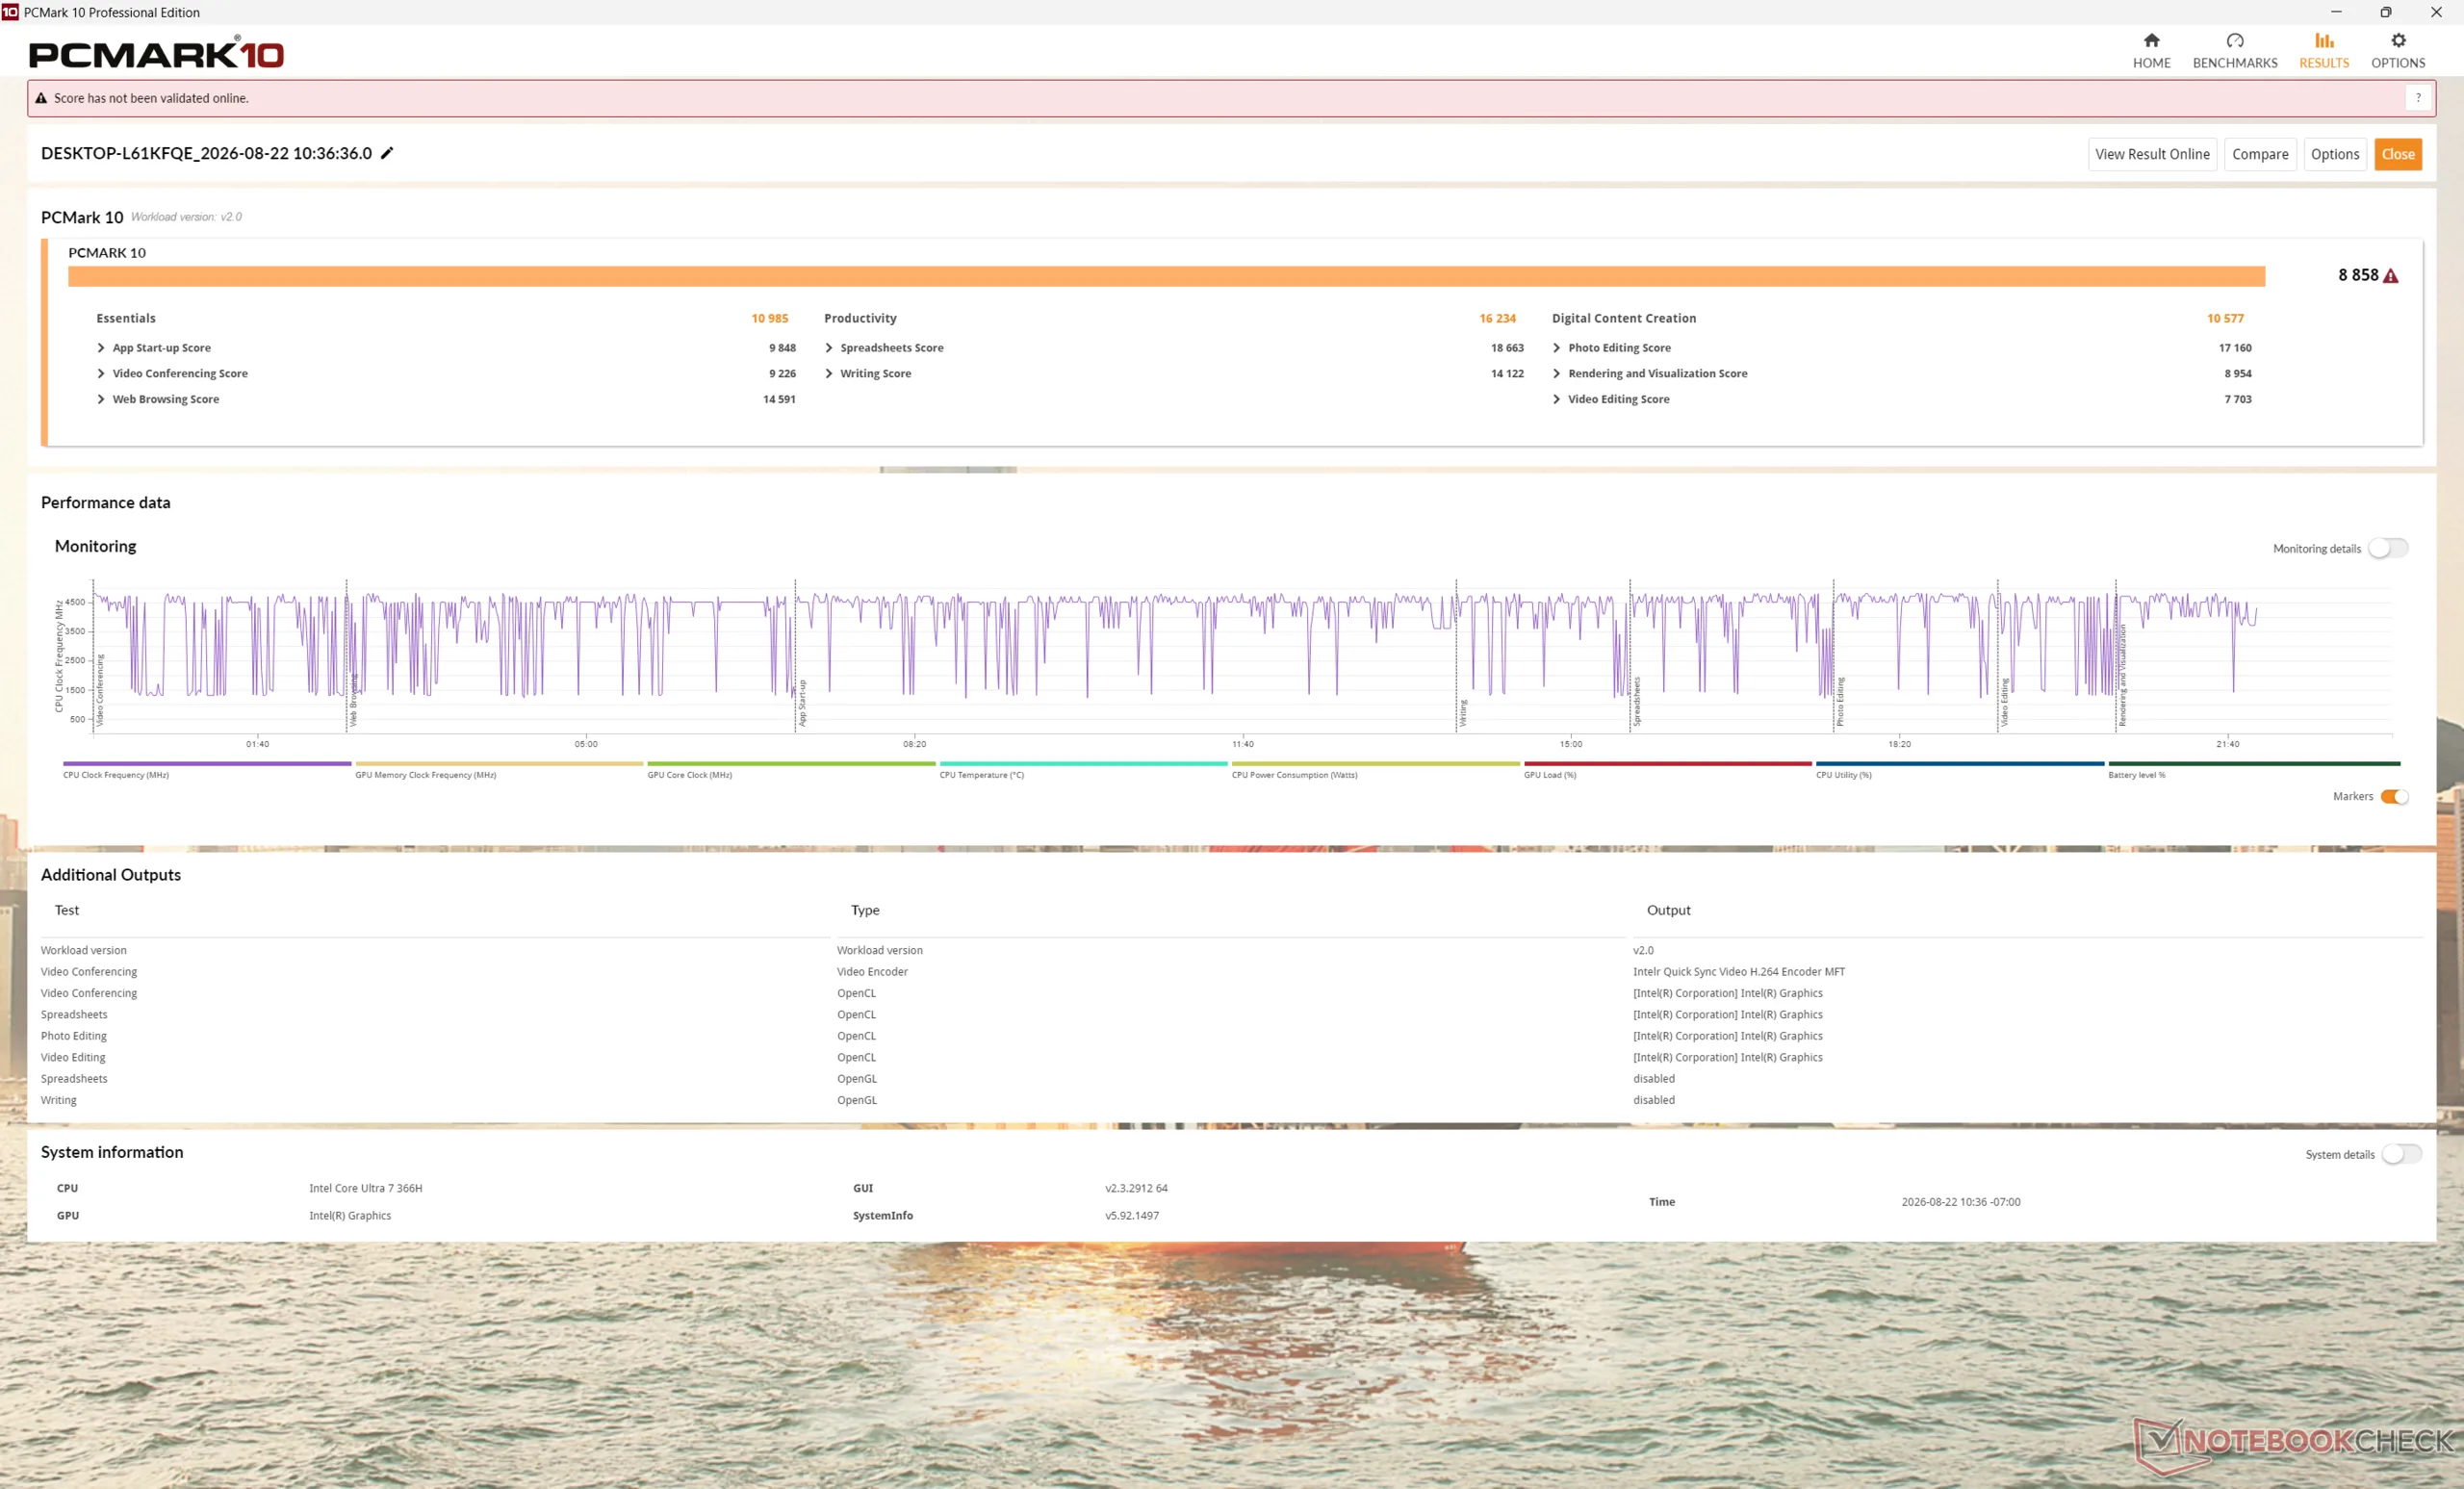
PCMark 10: Score | Essentials | Productivity | Digital Content Creation
CrossMark: Overall | Productivity | Creativity | Responsiveness
WebXPRT 3: Overall
WebXPRT 4: Overall
Mozilla Kraken 1.1: Total
Geekbench AI: Quantized GPU 1.7 | Half Precision GPU 1.7 | Single Precision GPU 1.7
| Performance rating | |
| Average Intel Core Ultra 7 366H, Intel Graphics 4 Xe3 Panther Lake iGPU | |
| HP EliteBook X Flip G2i 14 AI | |
| MSI Prestige 14 Flip AI+ 2026 -3! | |
| HP EliteBook x360 1040 G11 -3! | |
| Lenovo Yoga 7 2-in-1 14AKP10 -5! | |
| HP EliteBook X Flip G1i 14 AI -3! | |
| Dell Latitude 9450 2-in-1 -3! | |
| PCMark 10 / Score | |
| MSI Prestige 14 Flip AI+ 2026 | |
| Average Intel Core Ultra 7 366H, Intel Graphics 4 Xe3 Panther Lake iGPU (8600 - 9352, n=4) | |
| HP EliteBook X Flip G2i 14 AI | |
| HP EliteBook x360 1040 G11 | |
| HP EliteBook X Flip G1i 14 AI | |
| Lenovo Yoga 7 2-in-1 14AKP10 | |
| Dell Latitude 9450 2-in-1 | |
| PCMark 10 / Essentials | |
| Lenovo Yoga 7 2-in-1 14AKP10 | |
| Average Intel Core Ultra 7 366H, Intel Graphics 4 Xe3 Panther Lake iGPU (10985 - 11664, n=4) | |
| Dell Latitude 9450 2-in-1 | |
| MSI Prestige 14 Flip AI+ 2026 | |
| HP EliteBook x360 1040 G11 | |
| HP EliteBook X Flip G2i 14 AI | |
| HP EliteBook X Flip G1i 14 AI | |
| PCMark 10 / Productivity | |
| MSI Prestige 14 Flip AI+ 2026 | |
| Average Intel Core Ultra 7 366H, Intel Graphics 4 Xe3 Panther Lake iGPU (14812 - 17860, n=4) | |
| HP EliteBook X Flip G2i 14 AI | |
| Lenovo Yoga 7 2-in-1 14AKP10 | |
| HP EliteBook X Flip G1i 14 AI | |
| HP EliteBook x360 1040 G11 | |
| Dell Latitude 9450 2-in-1 | |
| PCMark 10 / Digital Content Creation | |
| MSI Prestige 14 Flip AI+ 2026 | |
| HP EliteBook X Flip G2i 14 AI | |
| Average Intel Core Ultra 7 366H, Intel Graphics 4 Xe3 Panther Lake iGPU (10339 - 10655, n=4) | |
| HP EliteBook x360 1040 G11 | |
| HP EliteBook X Flip G1i 14 AI | |
| Lenovo Yoga 7 2-in-1 14AKP10 | |
| Dell Latitude 9450 2-in-1 | |
| CrossMark / Overall | |
| Average Intel Core Ultra 7 366H, Intel Graphics 4 Xe3 Panther Lake iGPU (2152 - 2214, n=4) | |
| HP EliteBook X Flip G2i 14 AI | |
| MSI Prestige 14 Flip AI+ 2026 | |
| HP EliteBook x360 1040 G11 | |
| Lenovo Yoga 7 2-in-1 14AKP10 | |
| HP EliteBook X Flip G1i 14 AI | |
| Dell Latitude 9450 2-in-1 | |
| CrossMark / Productivity | |
| Average Intel Core Ultra 7 366H, Intel Graphics 4 Xe3 Panther Lake iGPU (1957 - 1988, n=4) | |
| HP EliteBook X Flip G2i 14 AI | |
| MSI Prestige 14 Flip AI+ 2026 | |
| HP EliteBook x360 1040 G11 | |
| HP EliteBook X Flip G1i 14 AI | |
| Lenovo Yoga 7 2-in-1 14AKP10 | |
| Dell Latitude 9450 2-in-1 | |
| CrossMark / Creativity | |
| HP EliteBook X Flip G2i 14 AI | |
| Average Intel Core Ultra 7 366H, Intel Graphics 4 Xe3 Panther Lake iGPU (2407 - 2556, n=4) | |
| MSI Prestige 14 Flip AI+ 2026 | |
| HP EliteBook x360 1040 G11 | |
| Lenovo Yoga 7 2-in-1 14AKP10 | |
| HP EliteBook X Flip G1i 14 AI | |
| Dell Latitude 9450 2-in-1 | |
| CrossMark / Responsiveness | |
| Average Intel Core Ultra 7 366H, Intel Graphics 4 Xe3 Panther Lake iGPU (1864 - 1996, n=4) | |
| HP EliteBook X Flip G2i 14 AI | |
| MSI Prestige 14 Flip AI+ 2026 | |
| HP EliteBook x360 1040 G11 | |
| Lenovo Yoga 7 2-in-1 14AKP10 | |
| Dell Latitude 9450 2-in-1 | |
| HP EliteBook X Flip G1i 14 AI | |
| WebXPRT 3 / Overall | |
| Average Intel Core Ultra 7 366H, Intel Graphics 4 Xe3 Panther Lake iGPU (318 - 334, n=4) | |
| MSI Prestige 14 Flip AI+ 2026 | |
| HP EliteBook X Flip G2i 14 AI | |
| HP EliteBook x360 1040 G11 | |
| Dell Latitude 9450 2-in-1 | |
| HP EliteBook X Flip G1i 14 AI | |
| WebXPRT 4 / Overall | |
| Average Intel Core Ultra 7 366H, Intel Graphics 4 Xe3 Panther Lake iGPU (302 - 307, n=4) | |
| MSI Prestige 14 Flip AI+ 2026 | |
| HP EliteBook X Flip G2i 14 AI | |
| HP EliteBook x360 1040 G11 | |
| Dell Latitude 9450 2-in-1 | |
| HP EliteBook X Flip G1i 14 AI | |
| Mozilla Kraken 1.1 / Total | |
| Dell Latitude 9450 2-in-1 | |
| HP EliteBook x360 1040 G11 | |
| HP EliteBook X Flip G1i 14 AI | |
| Lenovo Yoga 7 2-in-1 14AKP10 | |
| HP EliteBook X Flip G2i 14 AI | |
| Average Intel Core Ultra 7 366H, Intel Graphics 4 Xe3 Panther Lake iGPU (449 - 453, n=4) | |
| MSI Prestige 14 Flip AI+ 2026 | |
| Geekbench AI / Quantized GPU 1.7 | |
| HP EliteBook X Flip G2i 14 AI | |
| Average Intel Core Ultra 7 366H, Intel Graphics 4 Xe3 Panther Lake iGPU (4230 - 4509, n=3) | |
| Geekbench AI / Half Precision GPU 1.7 | |
| HP EliteBook X Flip G2i 14 AI | |
| Average Intel Core Ultra 7 366H, Intel Graphics 4 Xe3 Panther Lake iGPU (11904 - 12824, n=3) | |
| Geekbench AI / Single Precision GPU 1.7 | |
| HP EliteBook X Flip G2i 14 AI | |
| Average Intel Core Ultra 7 366H, Intel Graphics 4 Xe3 Panther Lake iGPU (6149 - 6747, n=3) | |
* ... smaller is better
| PCMark 10 Score | 8858 points | |
Help | ||
| AIDA64 / Memory Copy | |
| MSI Prestige 14 Flip AI+ 2026 | |
| HP EliteBook X Flip G2i 14 AI | |
| Average Intel Core Ultra 7 366H (107814 - 120004, n=5) | |
| HP EliteBook X Flip G1i 14 AI | |
| HP EliteBook x360 1040 G11 | |
| Lenovo Yoga 7 2-in-1 14AKP10 | |
| Dell Latitude 9450 2-in-1 | |
| AIDA64 / Memory Read | |
| MSI Prestige 14 Flip AI+ 2026 | |
| HP EliteBook X Flip G2i 14 AI | |
| Average Intel Core Ultra 7 366H (102778 - 111878, n=5) | |
| HP EliteBook x360 1040 G11 | |
| HP EliteBook X Flip G1i 14 AI | |
| Lenovo Yoga 7 2-in-1 14AKP10 | |
| Dell Latitude 9450 2-in-1 | |
| AIDA64 / Memory Write | |
| MSI Prestige 14 Flip AI+ 2026 | |
| HP EliteBook X Flip G2i 14 AI | |
| Average Intel Core Ultra 7 366H (106062 - 120952, n=5) | |
| HP EliteBook X Flip G1i 14 AI | |
| Lenovo Yoga 7 2-in-1 14AKP10 | |
| HP EliteBook x360 1040 G11 | |
| Dell Latitude 9450 2-in-1 | |
| AIDA64 / Memory Latency | |
| Dell Latitude 9450 2-in-1 | |
| HP EliteBook x360 1040 G11 | |
| Lenovo Yoga 7 2-in-1 14AKP10 | |
| HP EliteBook X Flip G1i 14 AI | |
| Average Intel Core Ultra 7 366H (89.5 - 103, n=5) | |
| MSI Prestige 14 Flip AI+ 2026 | |
| HP EliteBook X Flip G2i 14 AI | |
* ... smaller is better
DPC Latency
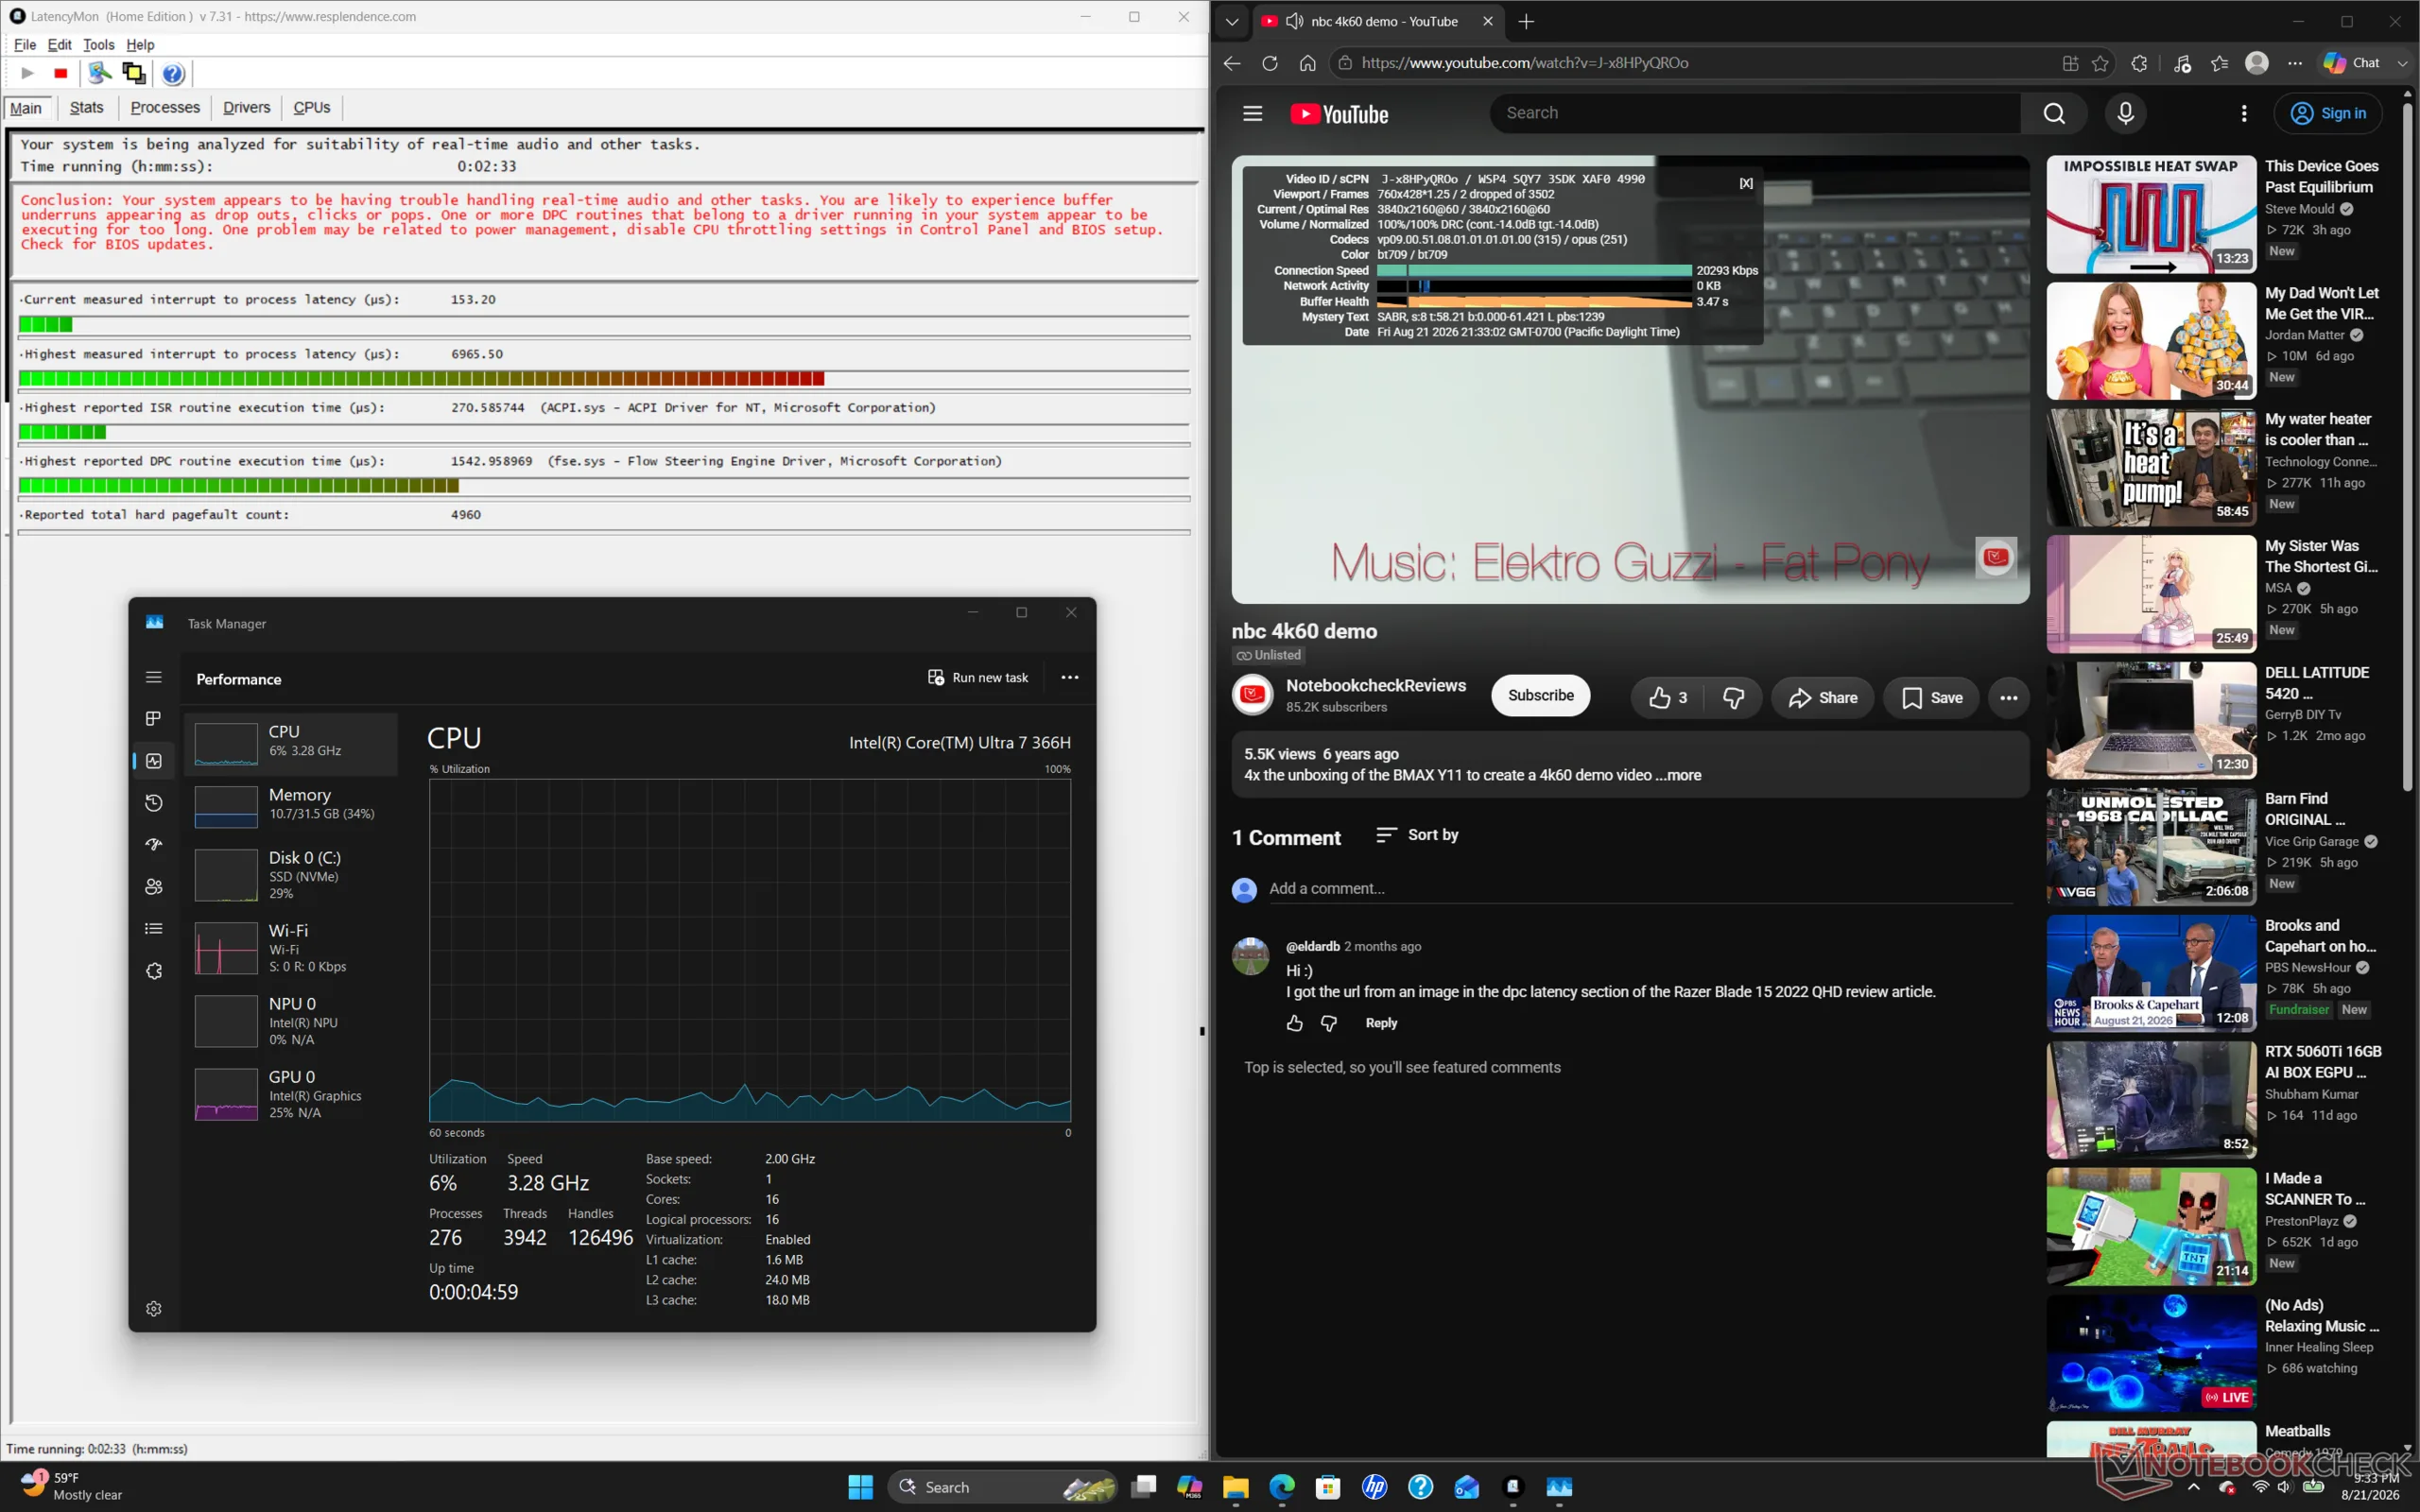
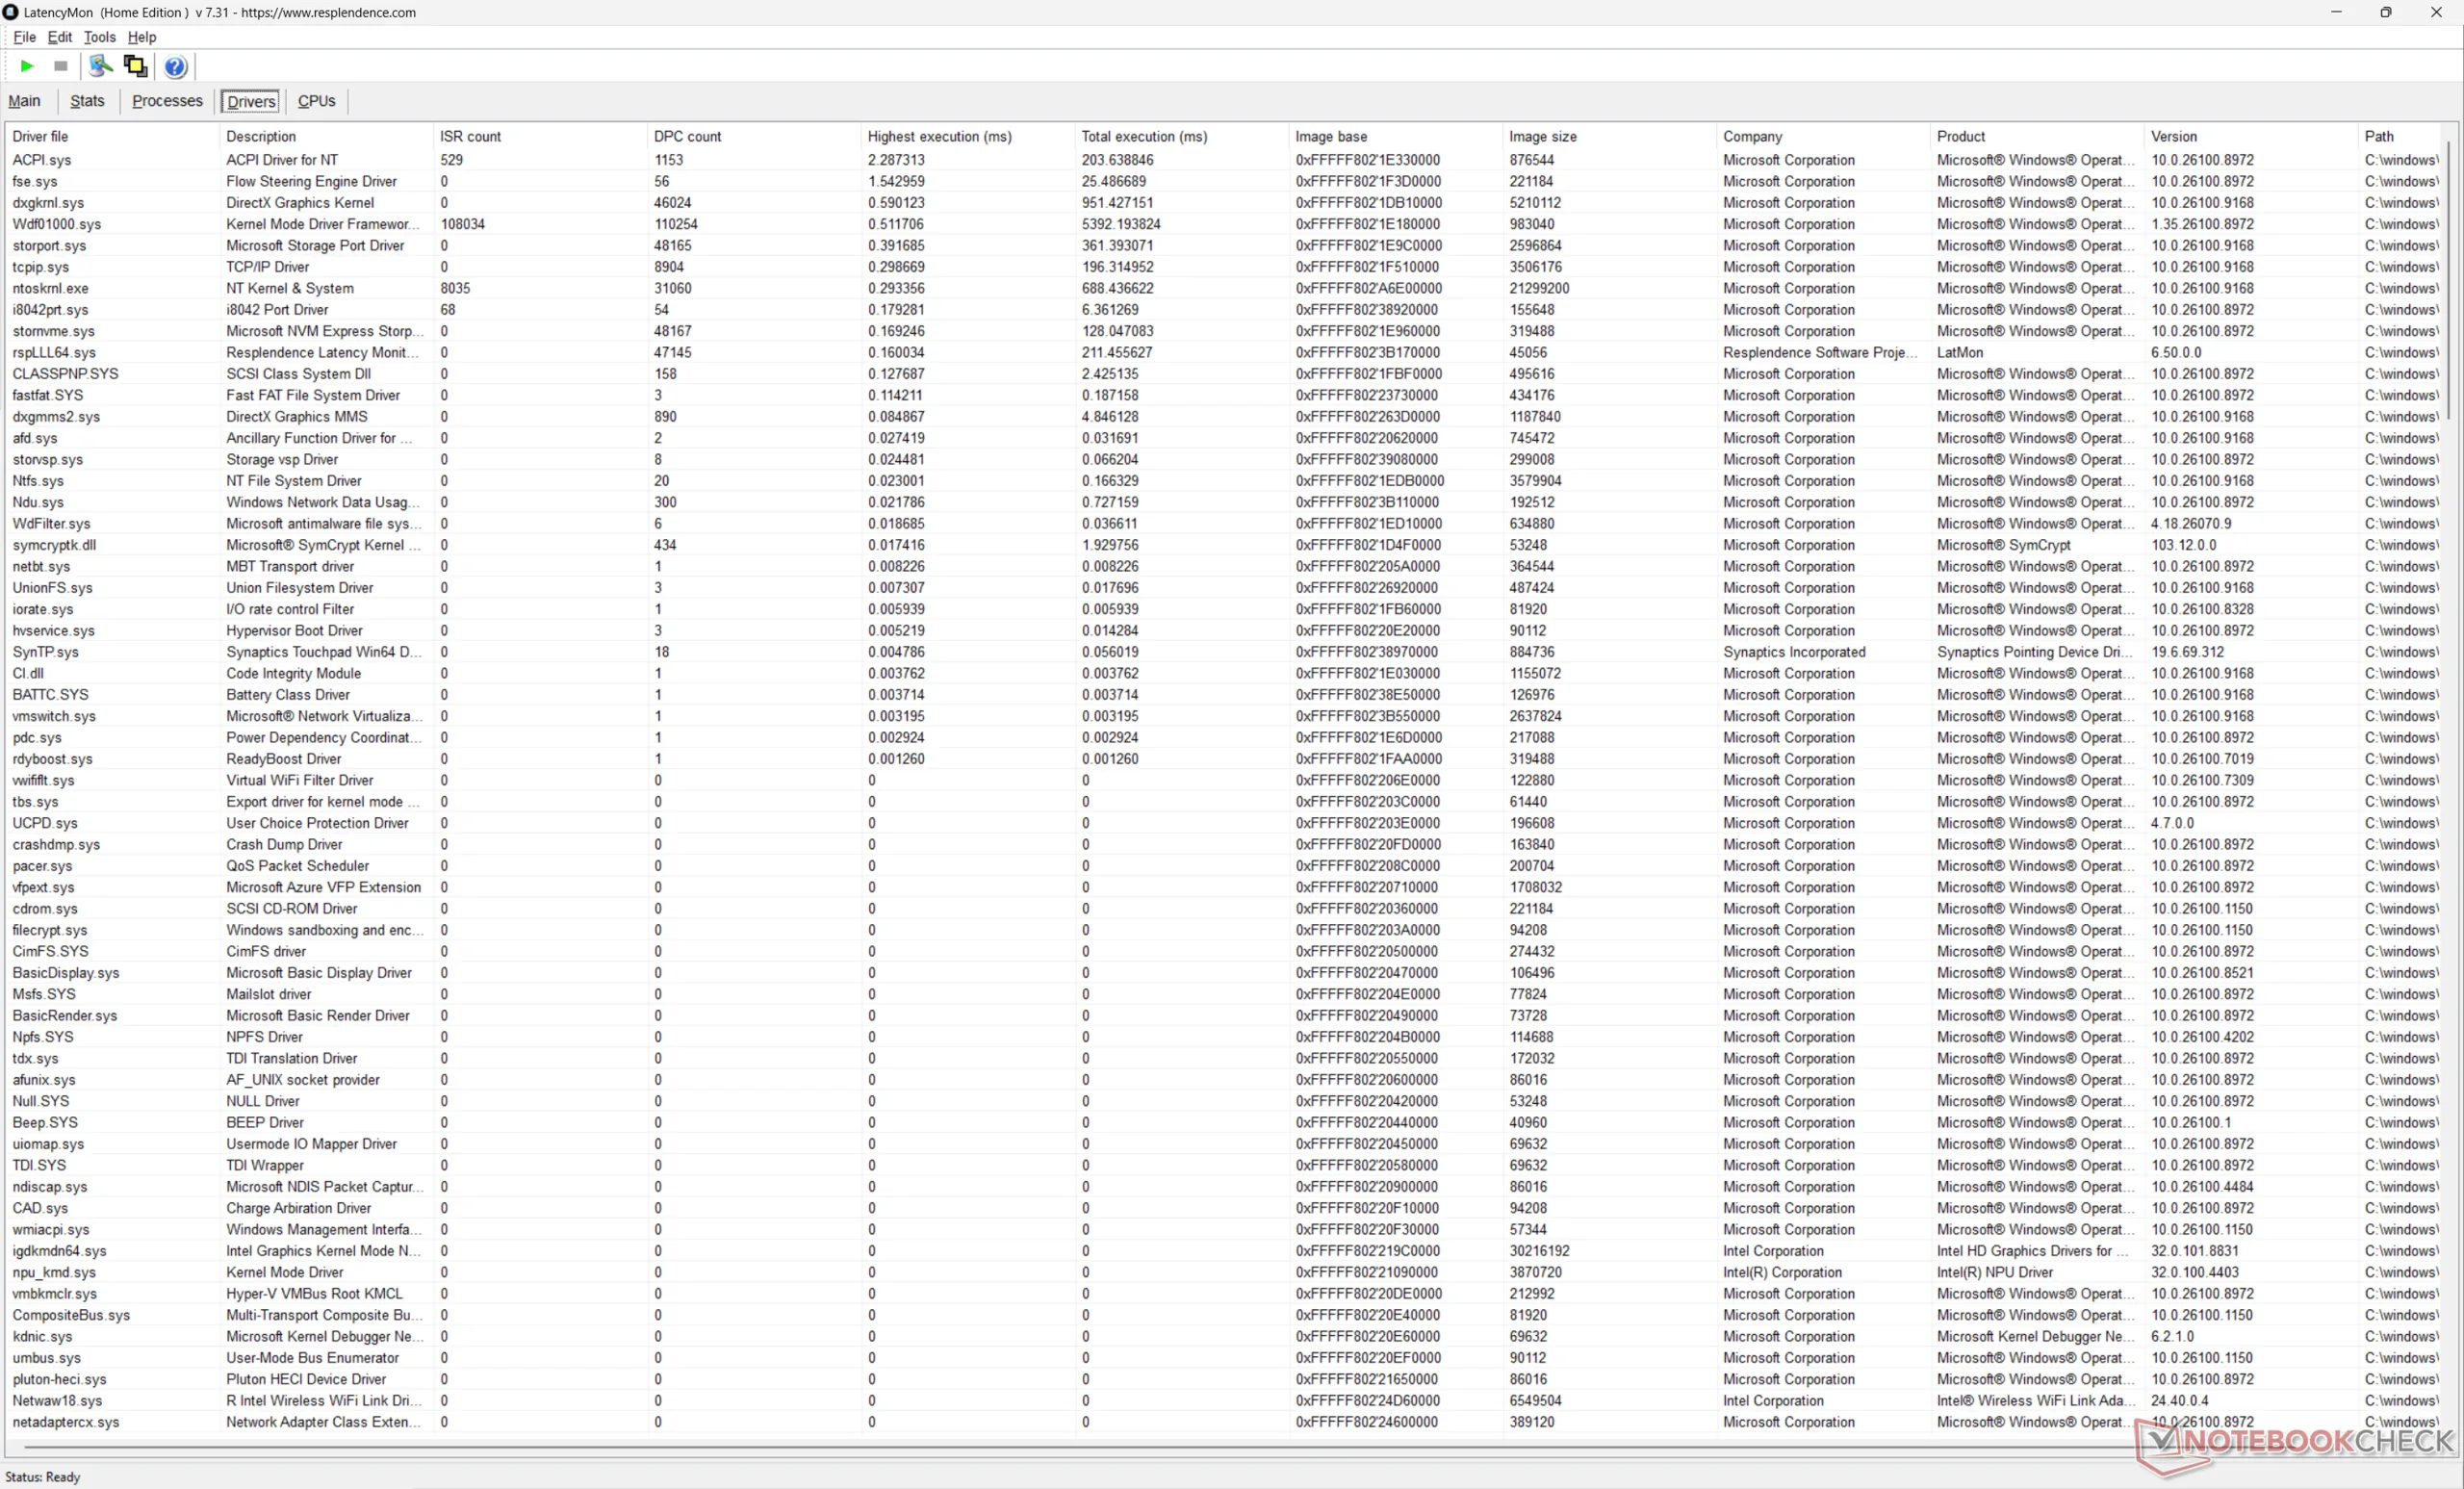
| DPC Latencies / LatencyMon - interrupt to process latency (max), Web, Youtube, Prime95 | |
| Lenovo Yoga 7 2-in-1 14AKP10 | |
| MSI Prestige 14 Flip AI+ 2026 | |
| HP EliteBook X Flip G2i 14 AI | |
| HP EliteBook x360 1040 G11 | |
| Dell Latitude 9450 2-in-1 | |
| HP EliteBook X Flip G1i 14 AI | |
* ... smaller is better
Storage Devices
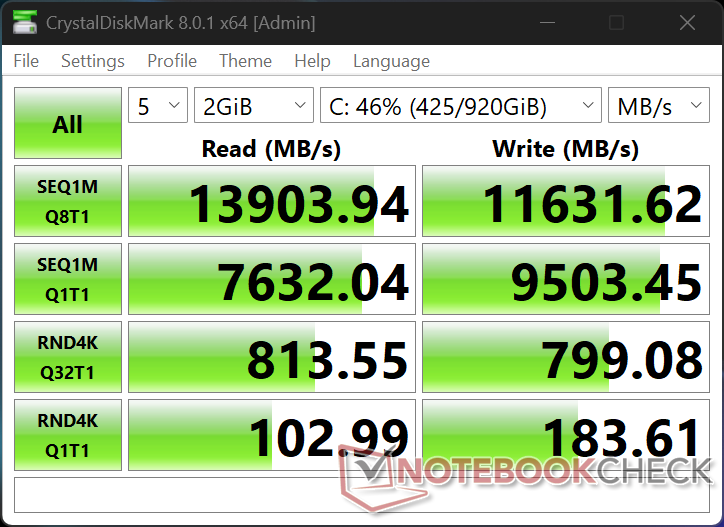
AS SSD would fail to run on our unit and so its results are now provided below.

Disk Throttling: DiskSpd Read Loop, Queue Depth 8
GPU Performance
The Graphics 4 Xe3 is only slightly faster than the much older Iris Xe G7 96 EUs. We recommend configuring with the Core Ultra X7 358H and Arc B390 for an almost 2.5x power boost if graphics performance is a priority.
| Power Profile | Graphics Score | Physics Score | Combined Score |
| Performance Mode | 7229 | 29830 | 2223 |
| Balanced Mode | 7197 | 29241 | 2236 |
| Battery Power | 7183 | 29991 | 2260 |
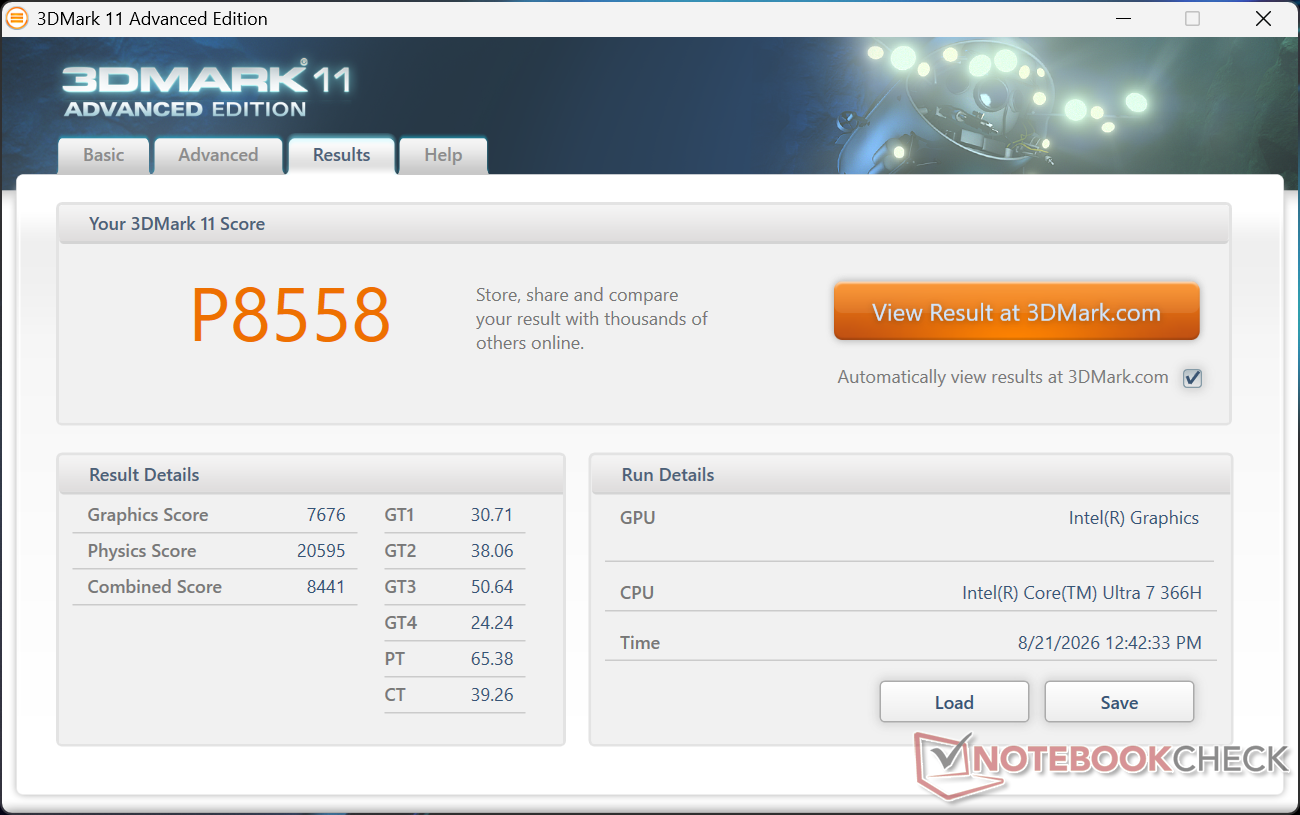
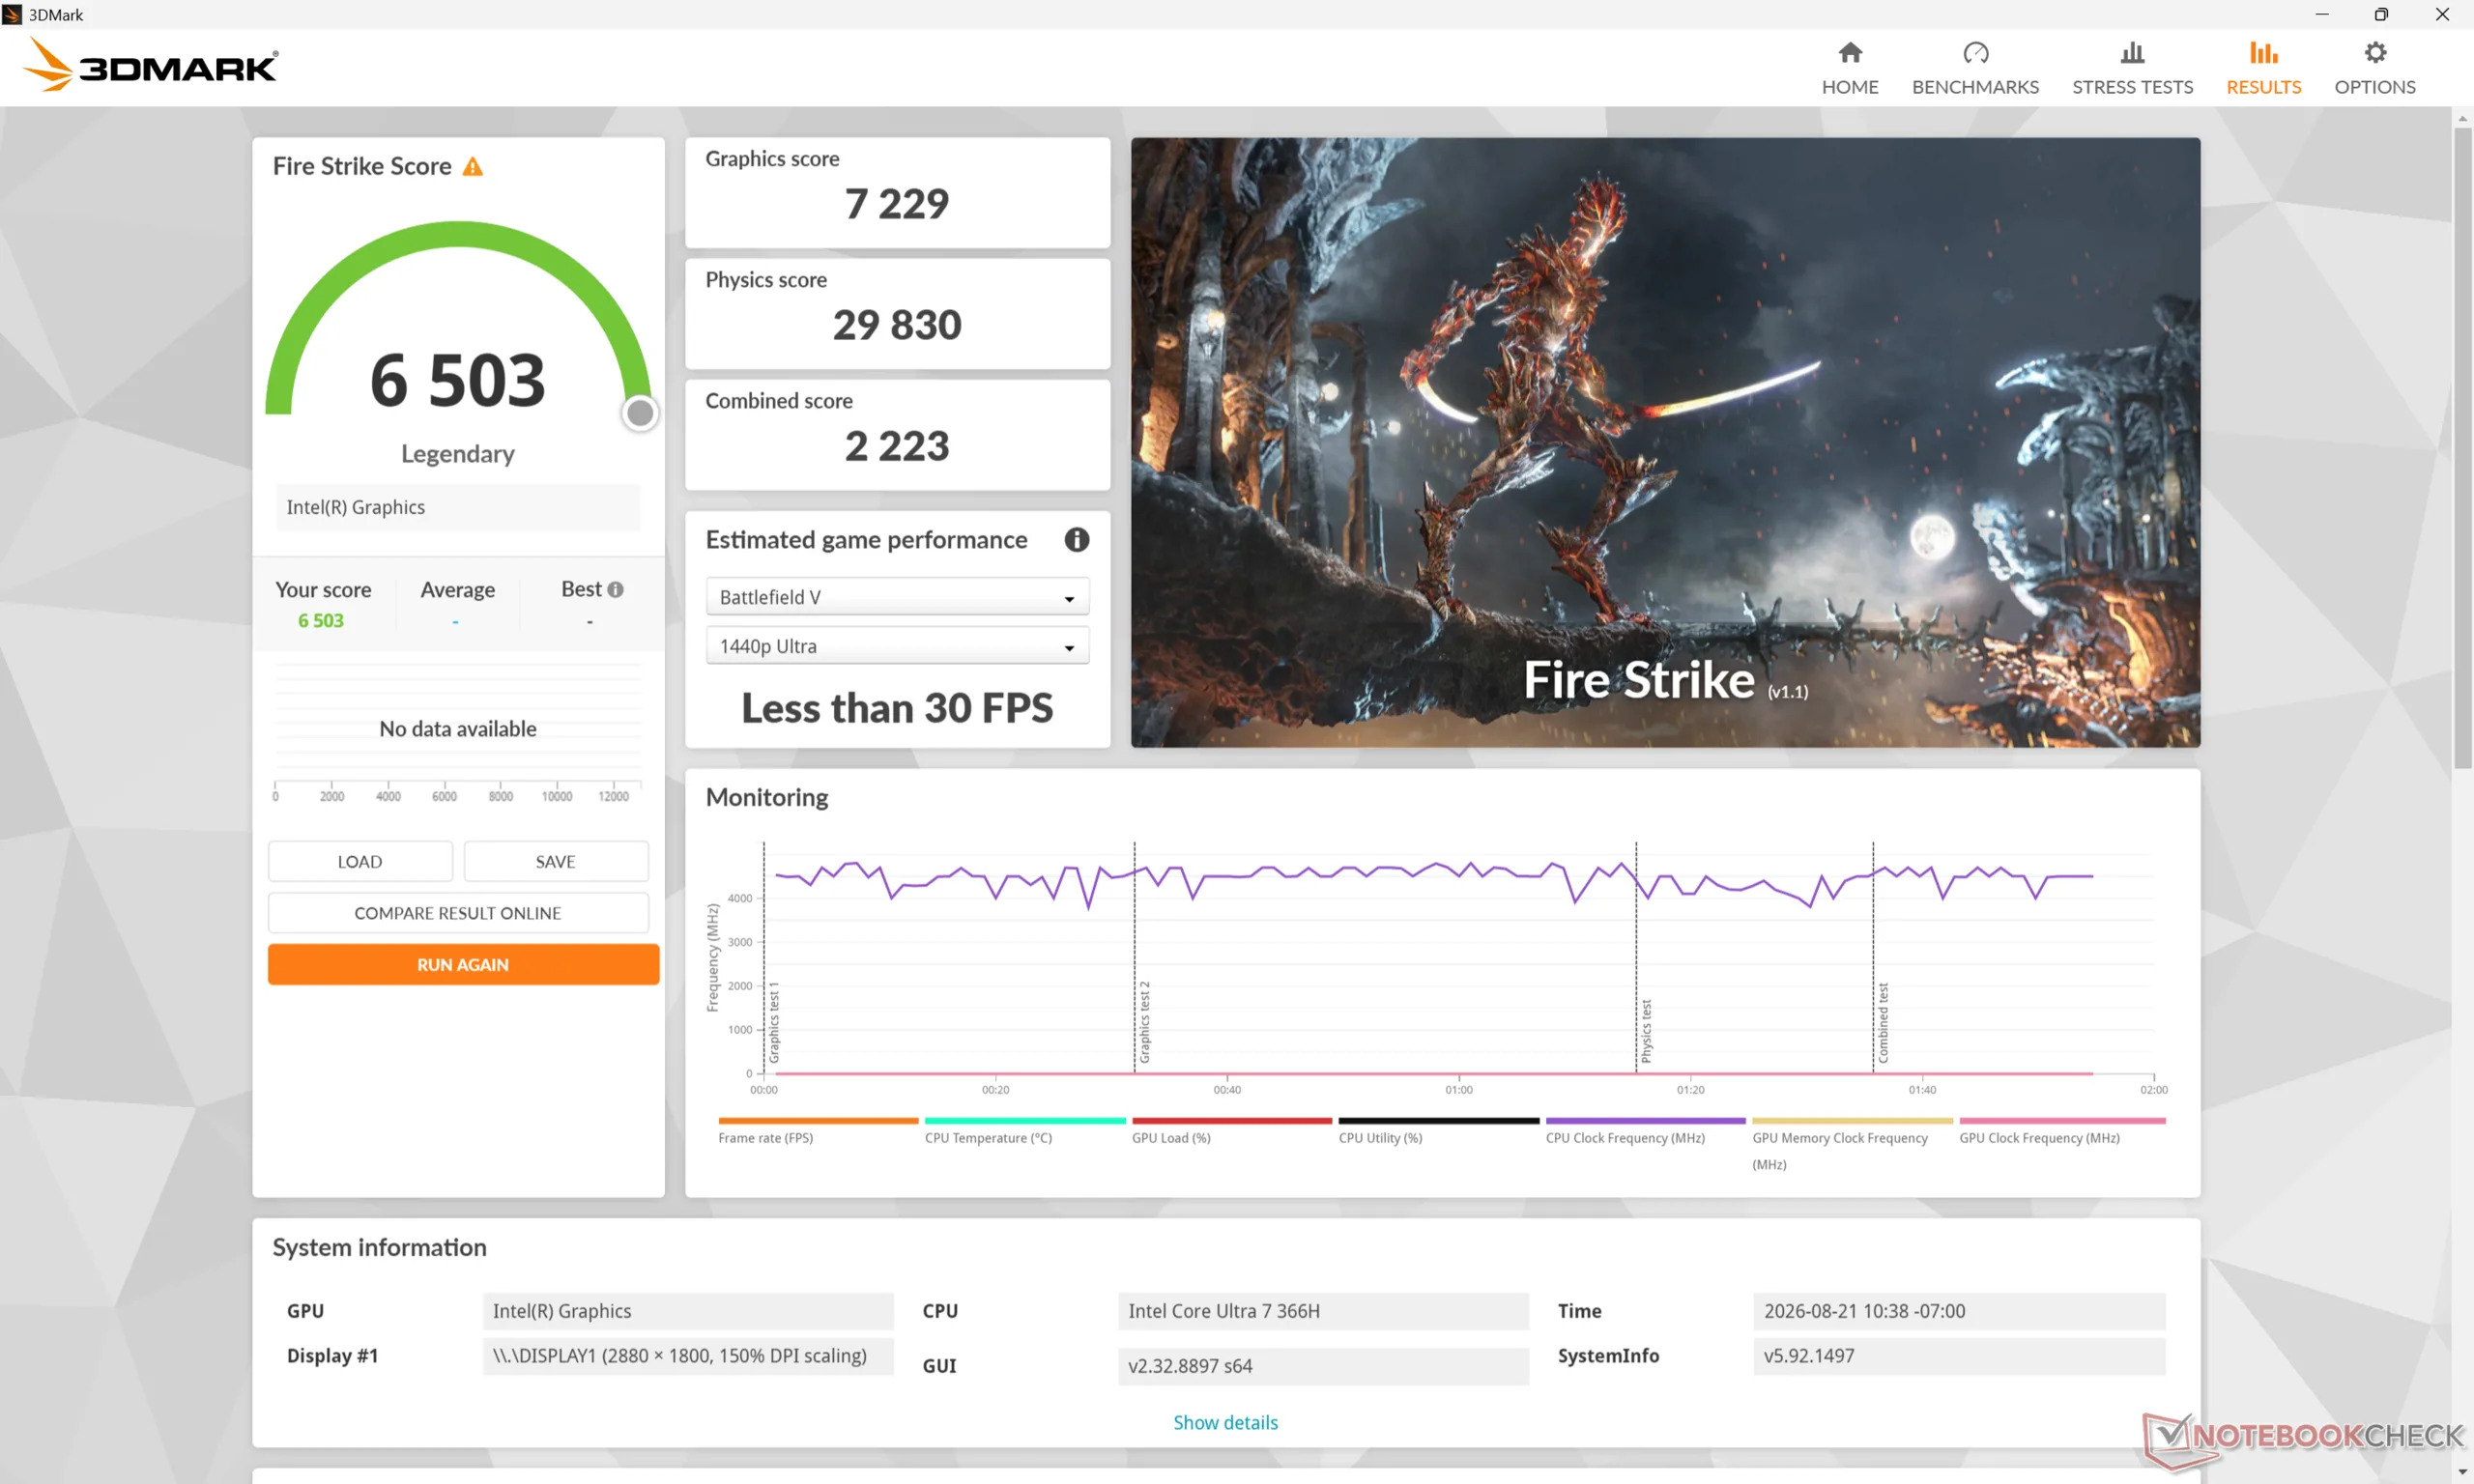
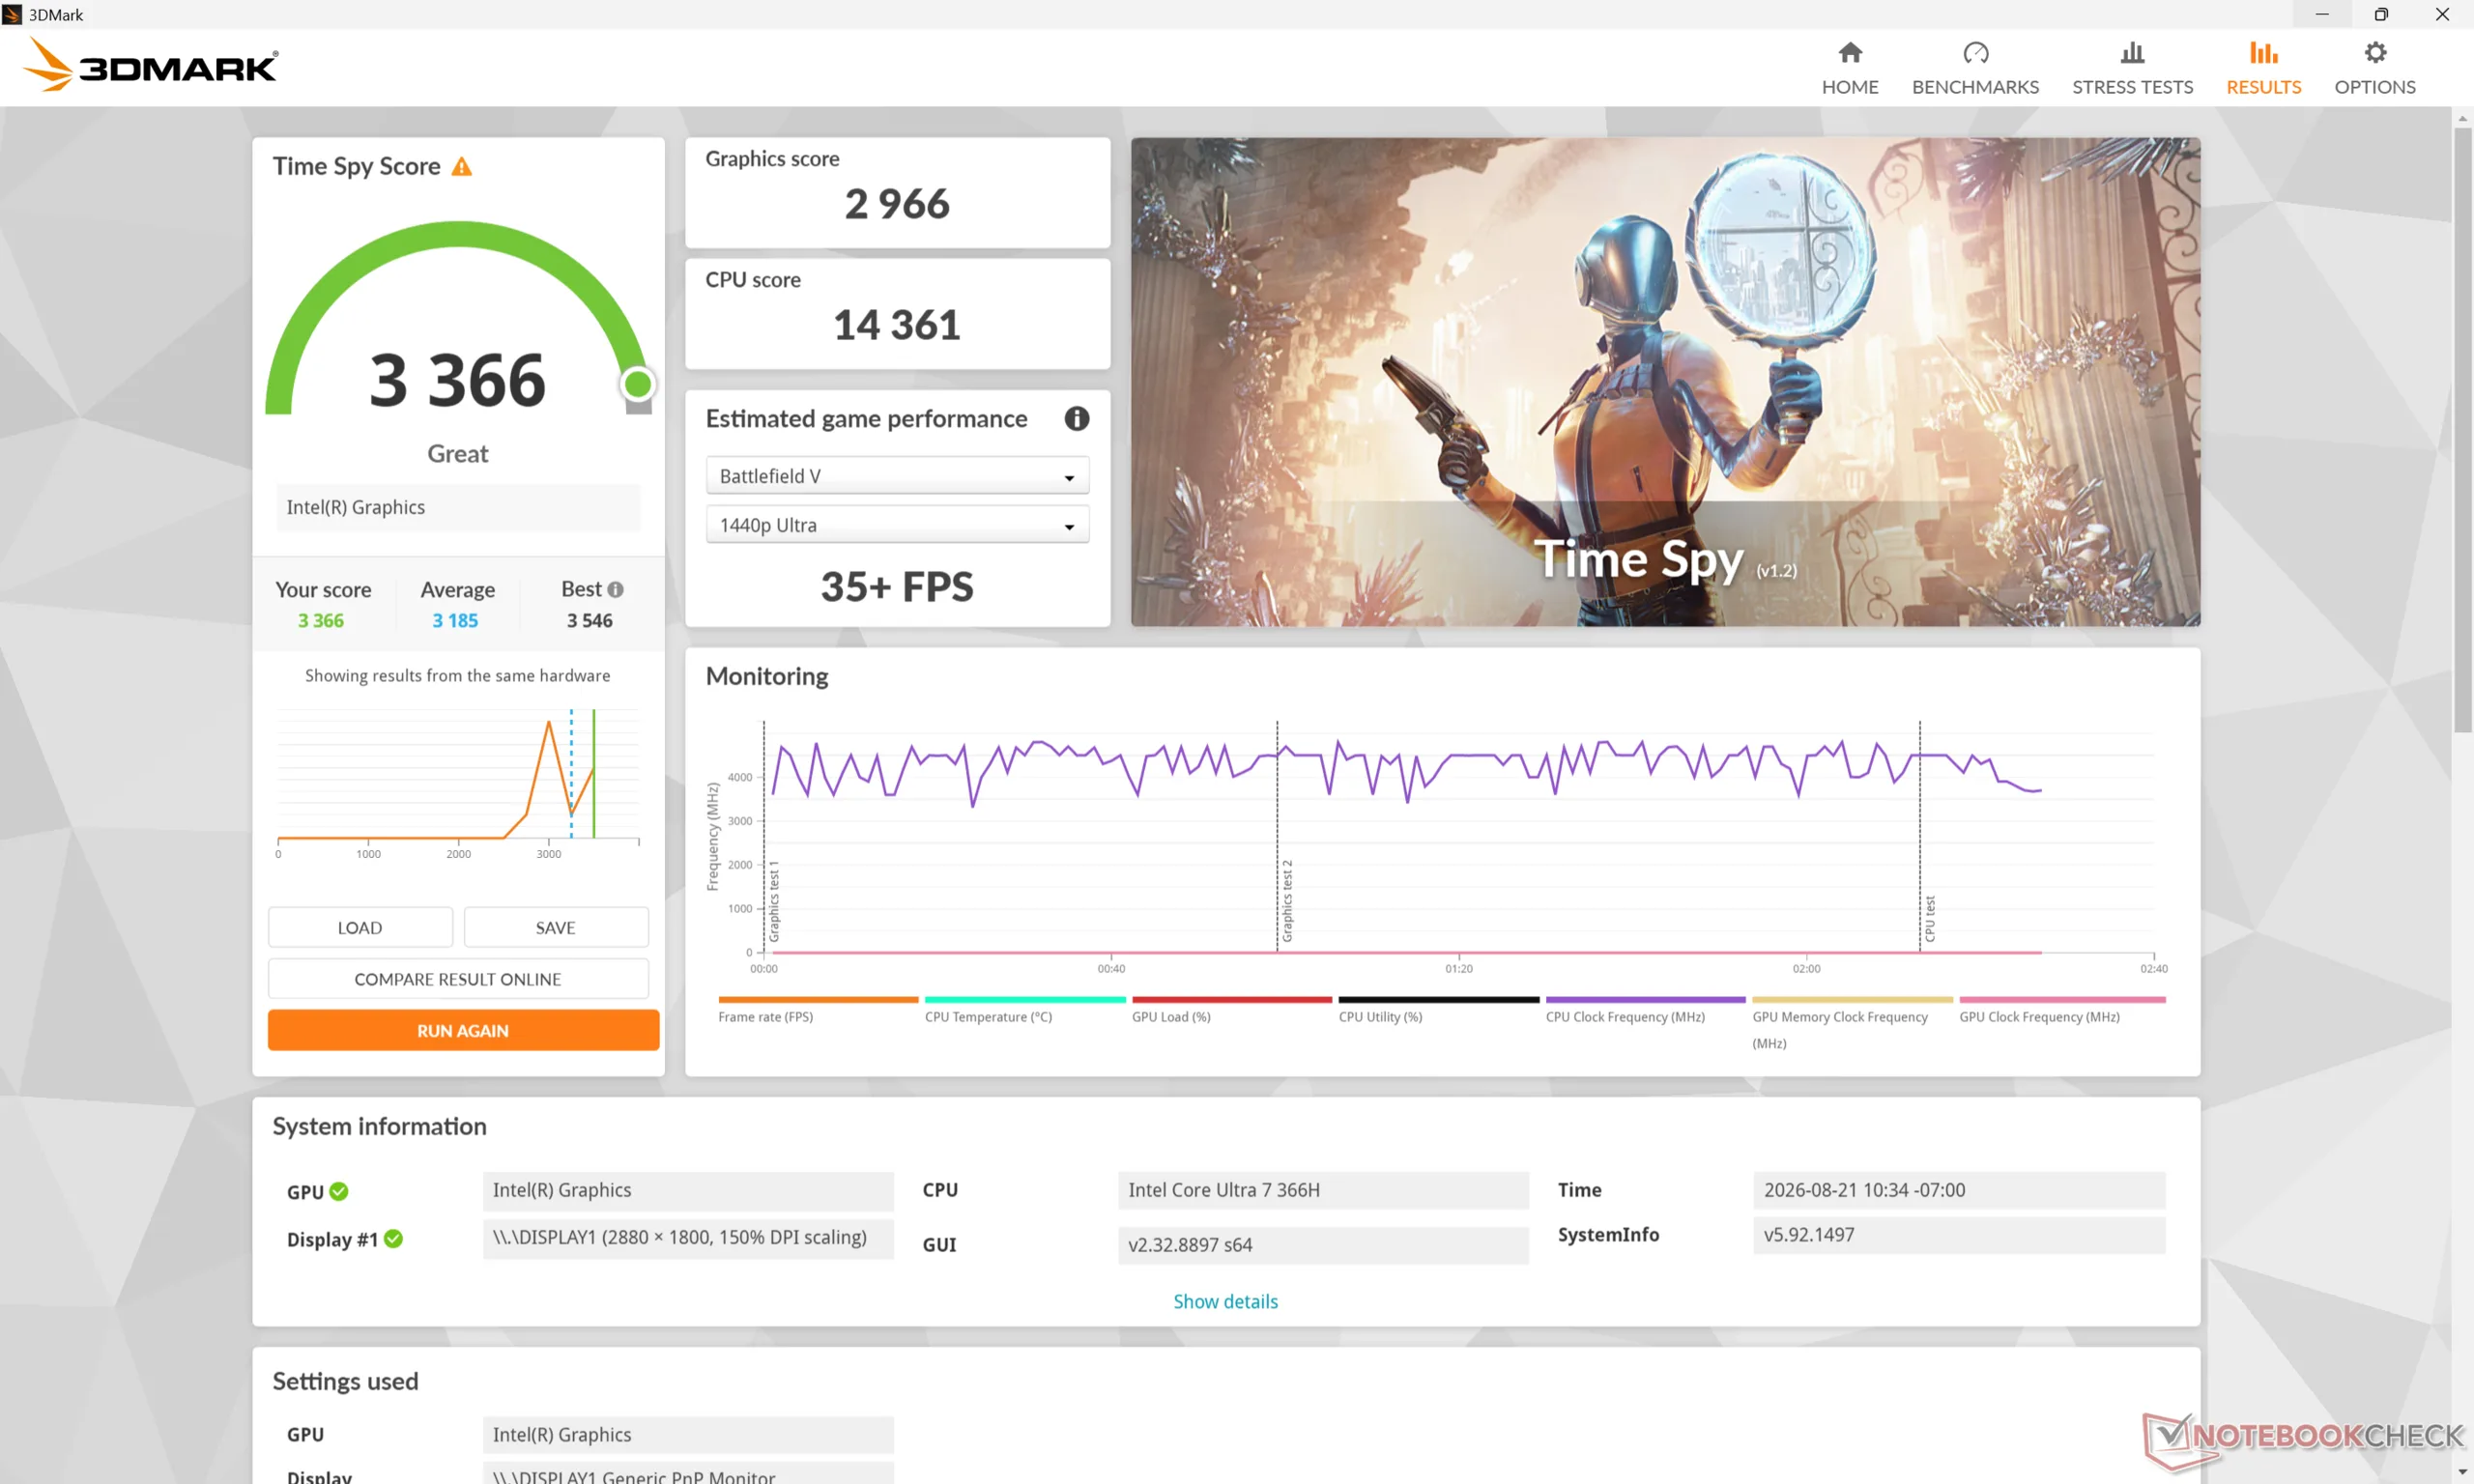
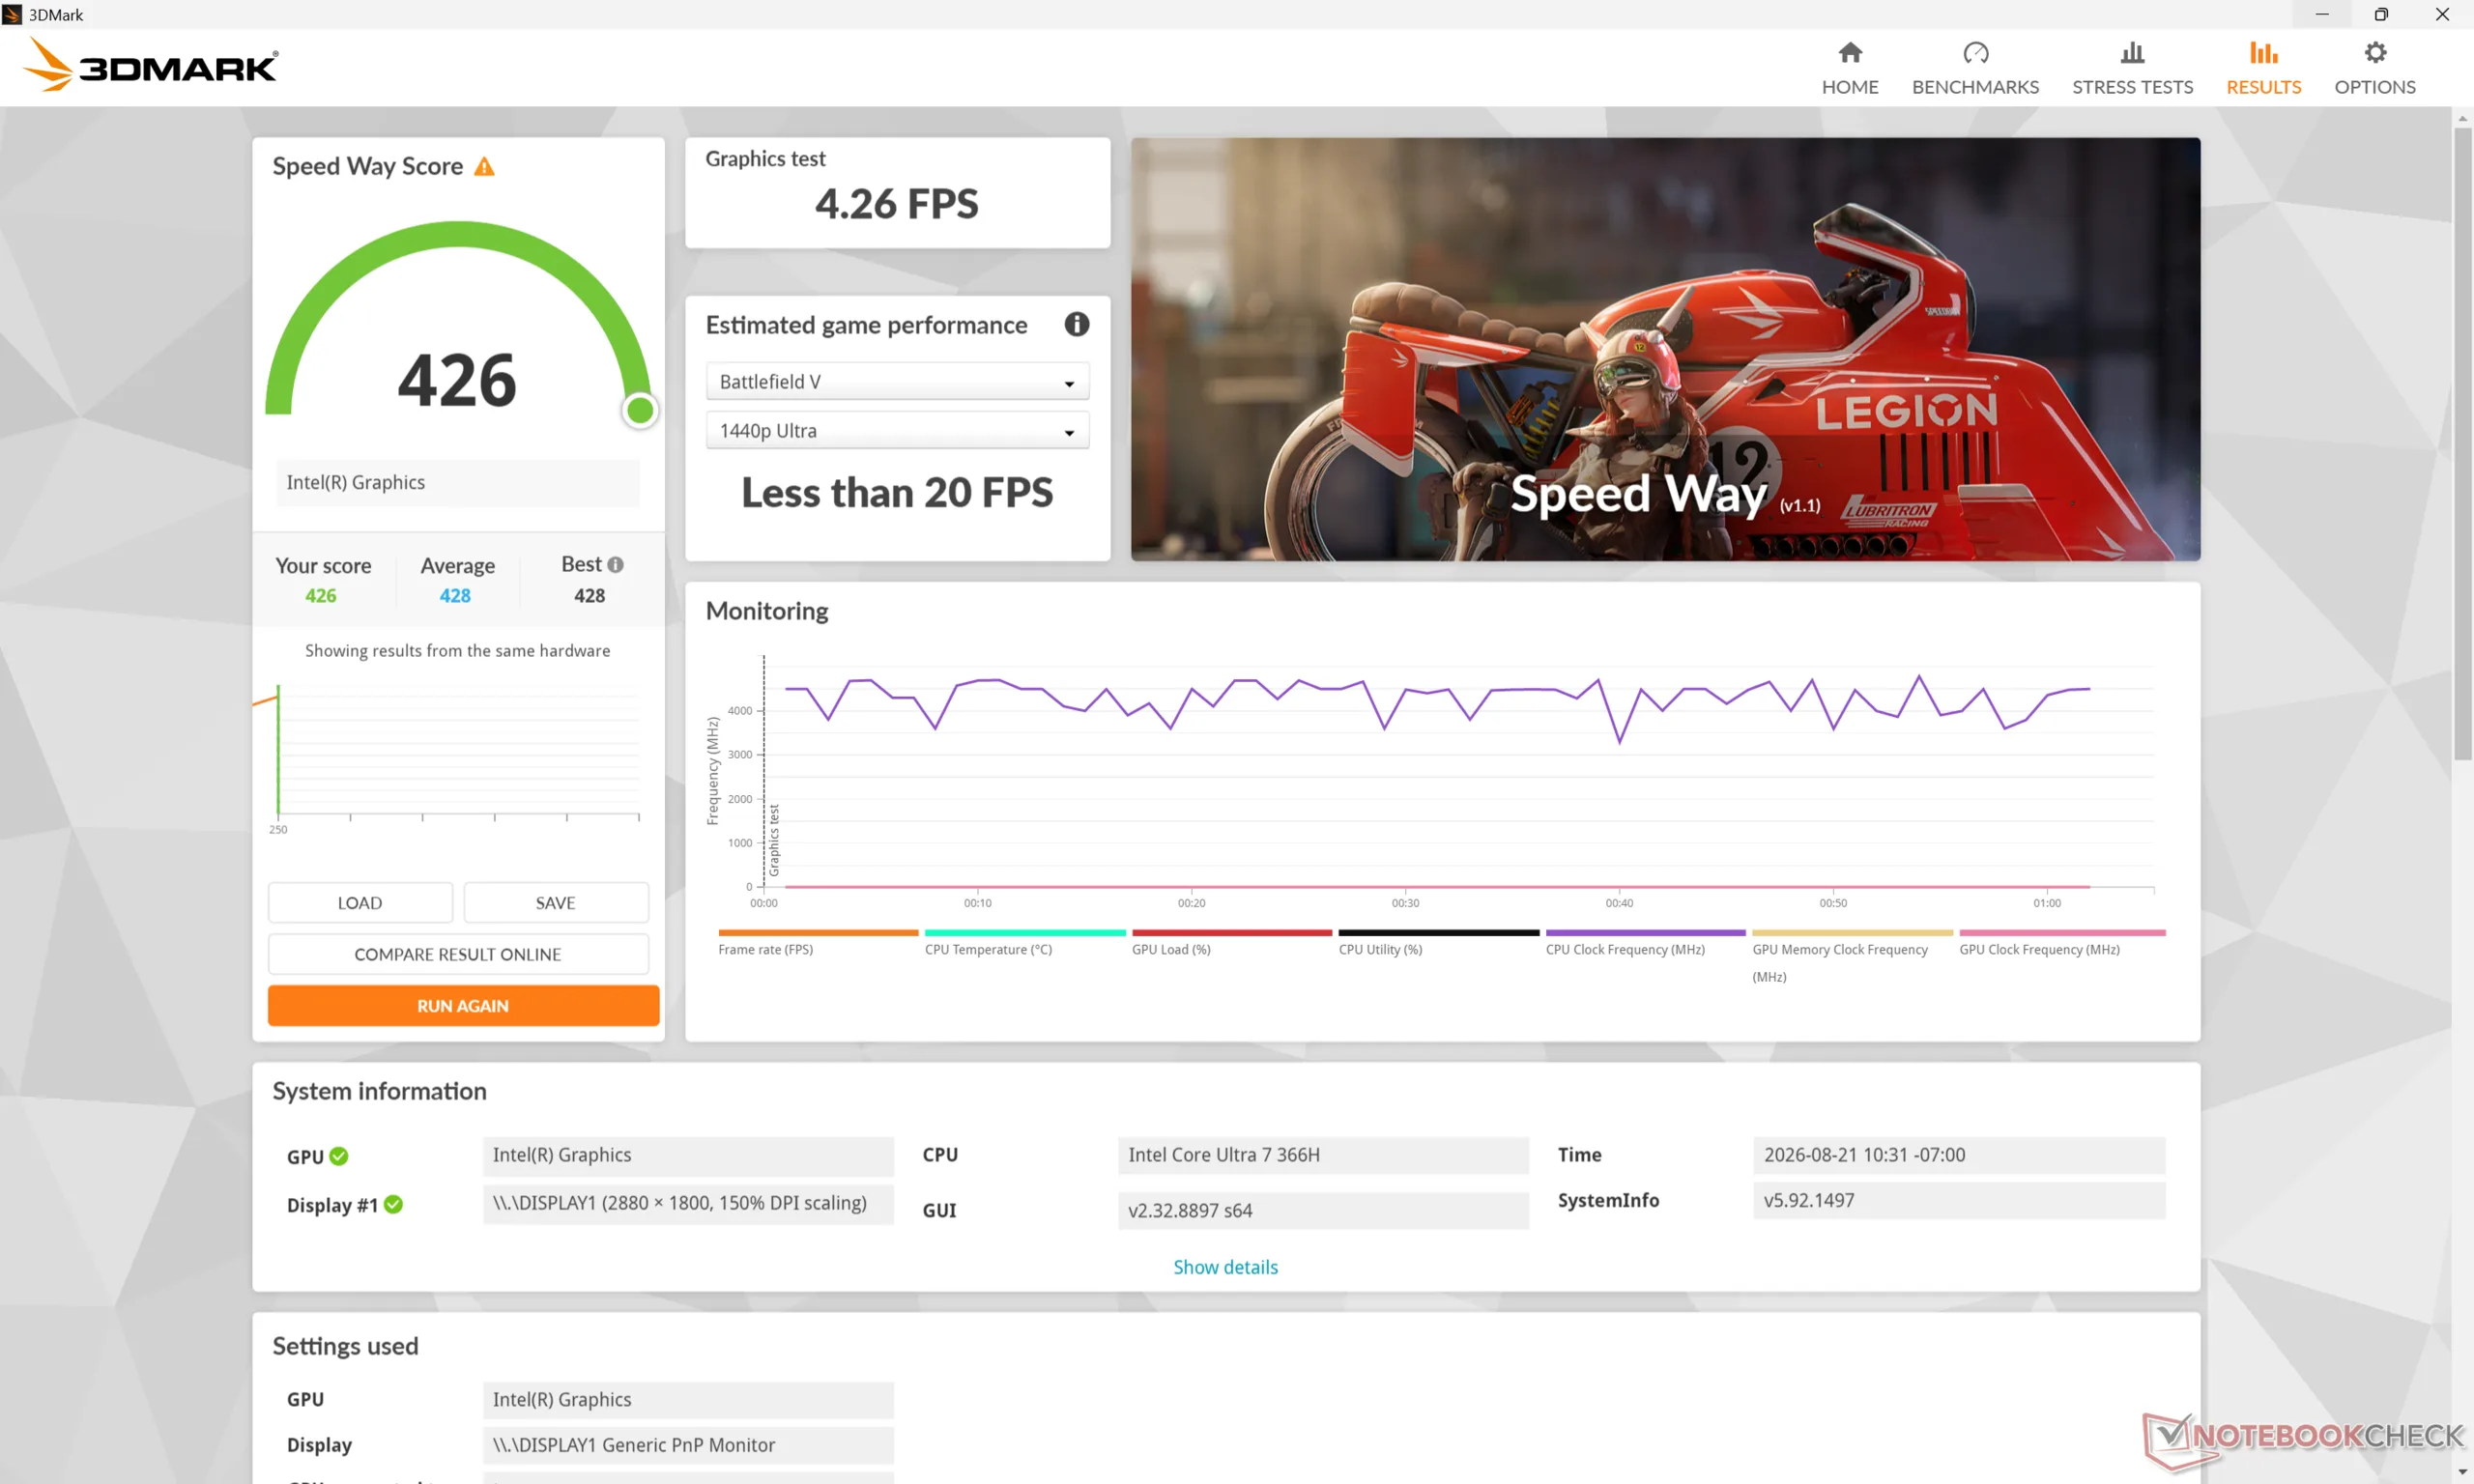
| 3DMark 11 Performance | 8558 points | |
| 3DMark Cloud Gate Standard Score | 34848 points | |
| 3DMark Fire Strike Score | 6503 points | |
| 3DMark Time Spy Score | 3366 points | |
Help | ||
* ... smaller is better
| Performance rating - Percent | |
| MSI Prestige 14 Flip AI+ 2026 | |
| HP EliteBook X Flip G1i 14 AI | |
| HP EliteBook x360 1040 G11 | |
| HP EliteBook X Flip G2i 14 AI | |
| Lenovo Yoga 7 2-in-1 14AKP10 | |
| Dell Latitude 9450 2-in-1 -1! | |
| Cyberpunk 2077 - 1920x1080 Ultra Preset (FSR off) | |
| MSI Prestige 14 Flip AI+ 2026 | |
| HP EliteBook X Flip G1i 14 AI | |
| HP EliteBook x360 1040 G11 | |
| HP EliteBook X Flip G2i 14 AI | |
| Dell Latitude 9450 2-in-1 | |
| Lenovo Yoga 7 2-in-1 14AKP10 | |
| Baldur's Gate 3 - 1920x1080 Ultra Preset AA:T | |
| MSI Prestige 14 Flip AI+ 2026 | |
| HP EliteBook X Flip G1i 14 AI | |
| HP EliteBook X Flip G2i 14 AI | |
| HP EliteBook x360 1040 G11 | |
| Lenovo Yoga 7 2-in-1 14AKP10 | |
| Dell Latitude 9450 2-in-1 | |
| GTA V - 1920x1080 Highest AA:4xMSAA + FX AF:16x | |
| MSI Prestige 14 Flip AI+ 2026 | |
| HP EliteBook X Flip G1i 14 AI | |
| HP EliteBook X Flip G2i 14 AI | |
| Lenovo Yoga 7 2-in-1 14AKP10 | |
| HP EliteBook x360 1040 G11 | |
| Final Fantasy XV Benchmark - 1920x1080 High Quality | |
| MSI Prestige 14 Flip AI+ 2026 | |
| HP EliteBook X Flip G1i 14 AI | |
| HP EliteBook x360 1040 G11 | |
| HP EliteBook X Flip G2i 14 AI | |
| Dell Latitude 9450 2-in-1 | |
| Lenovo Yoga 7 2-in-1 14AKP10 | |
| Strange Brigade - 1920x1080 ultra AA:ultra AF:16 | |
| MSI Prestige 14 Flip AI+ 2026 | |
| HP EliteBook X Flip G1i 14 AI | |
| HP EliteBook x360 1040 G11 | |
| Lenovo Yoga 7 2-in-1 14AKP10 | |
| Dell Latitude 9450 2-in-1 | |
| HP EliteBook X Flip G2i 14 AI | |
| Dota 2 Reborn - 1920x1080 ultra (3/3) best looking | |
| MSI Prestige 14 Flip AI+ 2026 | |
| HP EliteBook X Flip G1i 14 AI | |
| HP EliteBook X Flip G2i 14 AI | |
| HP EliteBook x360 1040 G11 | |
| Lenovo Yoga 7 2-in-1 14AKP10 | |
| Dell Latitude 9450 2-in-1 | |
| X-Plane 11.11 - 1920x1080 high (fps_test=3) | |
| MSI Prestige 14 Flip AI+ 2026 | |
| HP EliteBook x360 1040 G11 | |
| Lenovo Yoga 7 2-in-1 14AKP10 | |
| HP EliteBook X Flip G1i 14 AI | |
| HP EliteBook X Flip G2i 14 AI | |
| Dell Latitude 9450 2-in-1 | |
Cyberpunk 2077 ultra FPS Chart
| low | med. | high | ultra | |
|---|---|---|---|---|
| GTA V (2015) | 182 | 170.6 | 52.4 | 21.8 |
| Dota 2 Reborn (2015) | 129 | 90 | 81.6 | 77.3 |
| Final Fantasy XV Benchmark (2018) | 69.4 | 37.3 | 27.1 | |
| X-Plane 11.11 (2018) | 42.2 | 37.6 | 30.7 | |
| Strange Brigade (2018) | 119.6 | 45.4 | 38.1 | 28.9 |
| Baldur's Gate 3 (2023) | 33.6 | 27.7 | 24.3 | 23.7 |
| Cyberpunk 2077 (2023) | 39 | 29.8 | 25.6 | 21.6 |
| F1 24 (2024) | 66.7 | 62.3 | 46.1 | 14.9 |
Emissions
System Noise
The internal fans remain quiet when running undemanding tasks like browsing or video streaming with minimal pulsing behavior. However, they ramp up quickly in speed and noise once higher loads likes games are introduced.
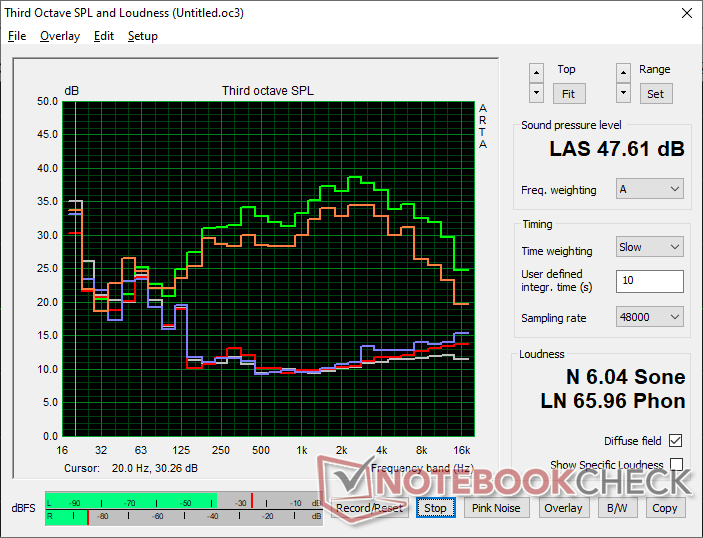
Noise level
| Idle |
| 23.3 / 23.3 / 23.8 dB(A) |
| Load |
| 24 / 47.6 dB(A) |
 | ||
30 dB silent 40 dB(A) audible 50 dB(A) loud |
||
min:  , med: , med:  , max: , max:  Earthworks M23R, Arta (15 cm distance) environment noise: 22.8 dB(A) Earthworks M23R, Arta (15 cm distance) environment noise: 22.8 dB(A) | ||
| HP EliteBook X Flip G2i 14 AI Ultra 7 366H, Intel Graphics 4 Xe3 PTL | HP EliteBook X Flip G1i 14 AI Core Ultra 7 258V, Arc 140V | HP EliteBook x360 1040 G11 Ultra 7 165H, Arc 8-Core | MSI Prestige 14 Flip AI+ 2026 Ultra X7 358H, Arc B390 Panther Lake iGPU | Lenovo Yoga 7 2-in-1 14AKP10 Ryzen AI 5 340, Radeon 840M | Dell Latitude 9450 2-in-1 Ultra 7 165U, Graphics 4-Core iGPU (Arrow Lake) | |
|---|---|---|---|---|---|---|
| Noise | 8% | -4% | -11% | -18% | -10% | |
| off / environment * (dB) | 22.8 | 23 -1% | 23 -1% | 25.4 -11% | 25 -10% | 23.9 -5% |
| Idle Minimum * (dB) | 23.3 | 23 1% | 23 1% | 25.4 -9% | 25 -7% | 23.9 -3% |
| Idle Average * (dB) | 23.3 | 23 1% | 23 1% | 25.4 -9% | 27 -16% | 23.9 -3% |
| Idle Maximum * (dB) | 23.8 | 23 3% | 23 3% | 25.4 -7% | 30 -26% | 23.9 -0% |
| Load Average * (dB) | 24 | 27.14 -13% | 31 -29% | 33.1 -38% | 43 -79% | 36.4 -52% |
| Cyberpunk 2077 ultra * (dB) | 43.9 | 31.65 28% | 45.7 -4% | 46.5 -6% | 42 4% | |
| Load Maximum * (dB) | 47.6 | 31.65 34% | 47.7 -0% | 46.5 2% | 44 8% | 44.7 6% |
| Witcher 3 ultra * (dB) | 44.7 |
* ... smaller is better
Temperature
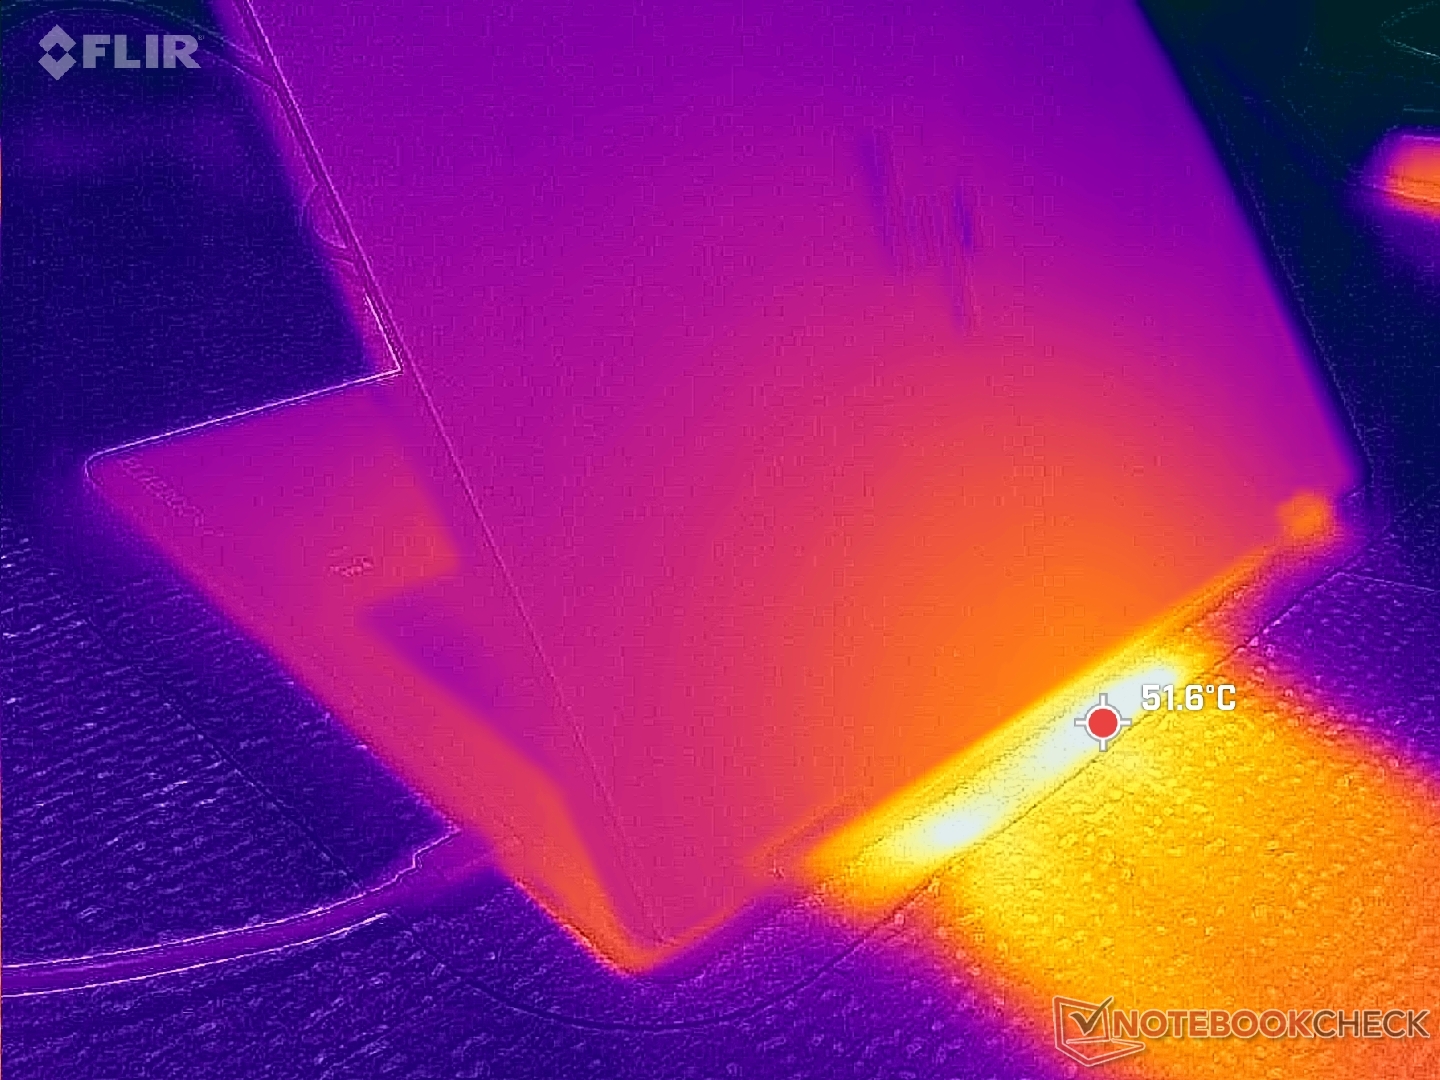
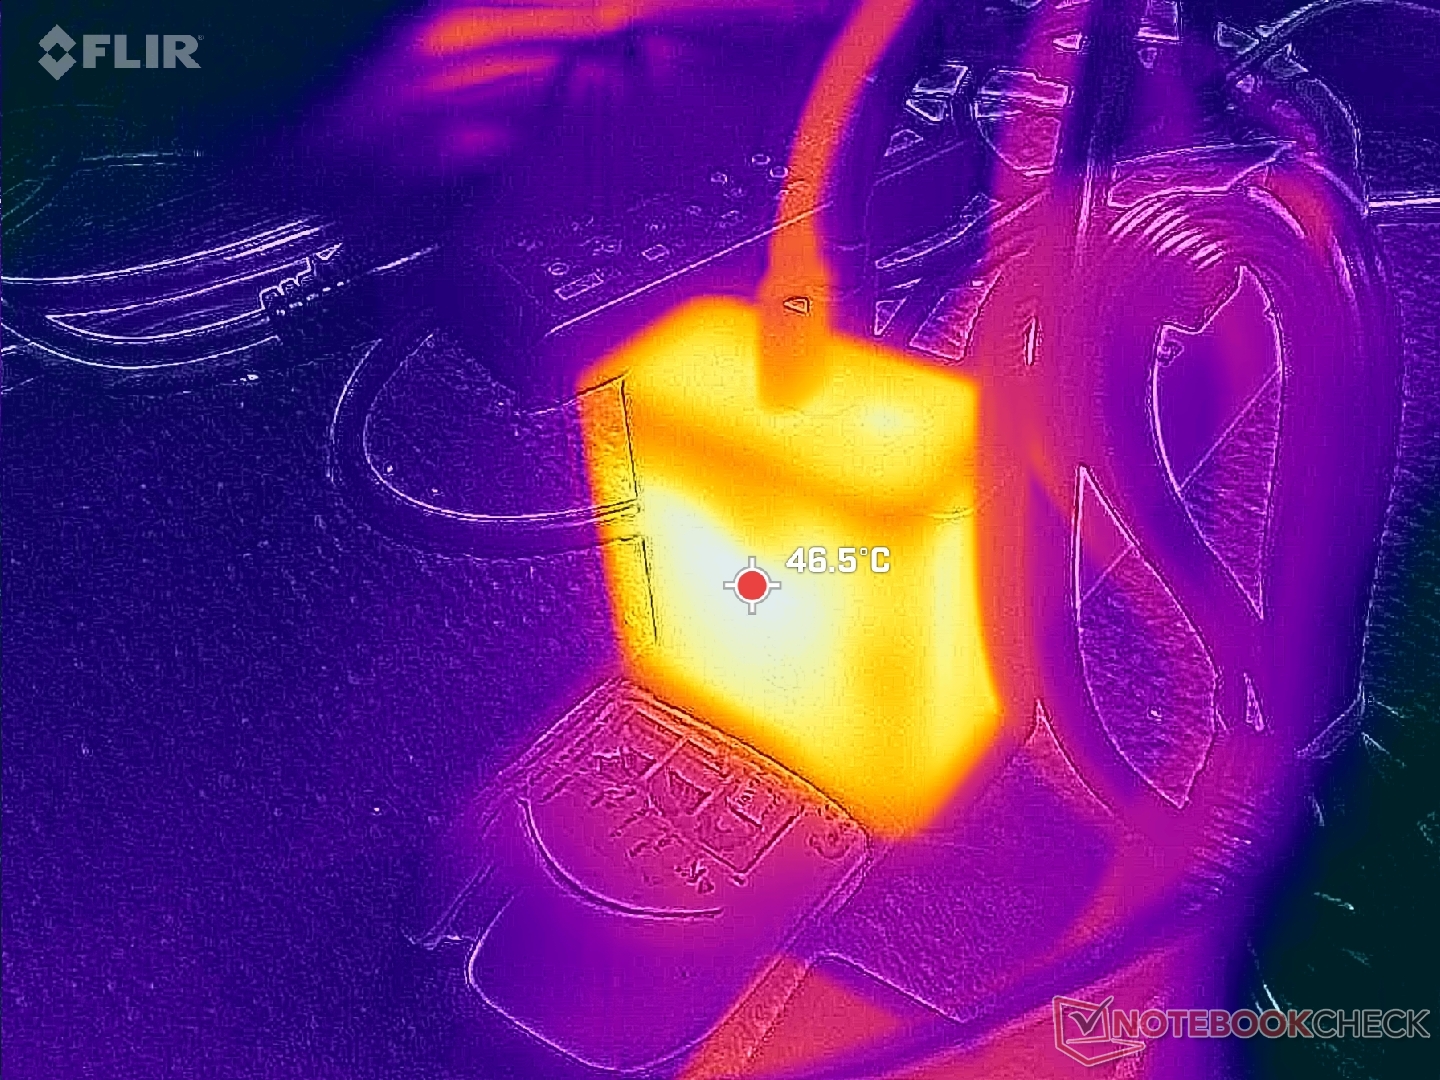
(±) The maximum temperature on the upper side is 43.8 °C / 111 F, compared to the average of 35.4 °C / 96 F, ranging from 19.6 to 60 °C for the class Convertible.
(±) The bottom heats up to a maximum of 43.6 °C / 110 F, compared to the average of 36.9 °C / 98 F
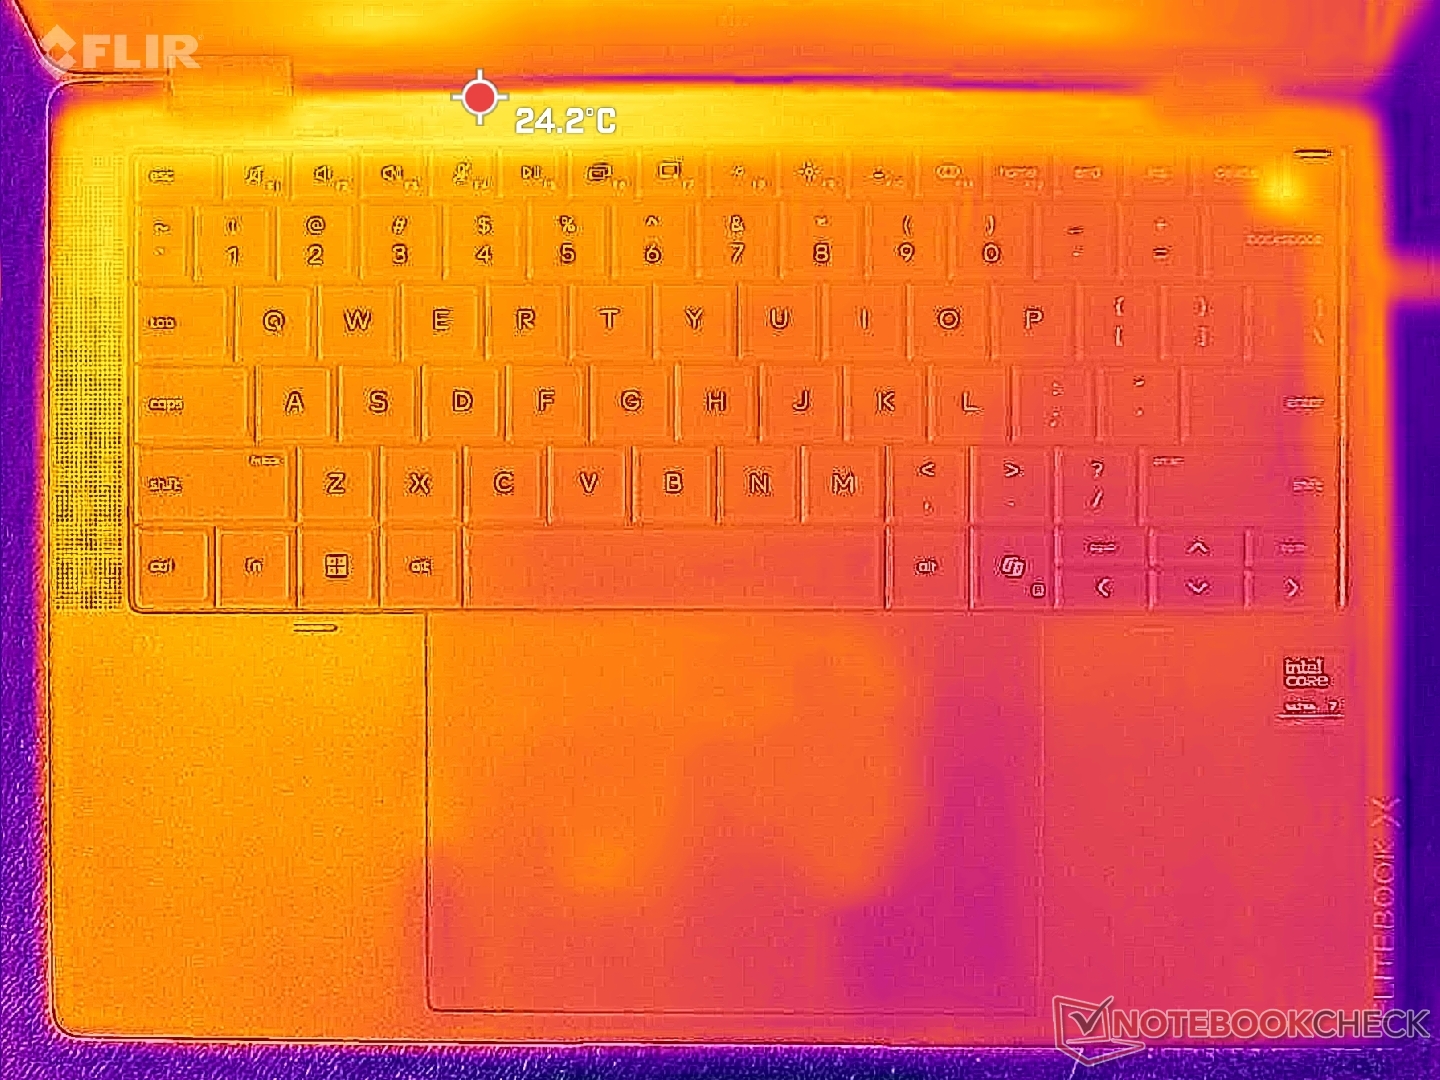
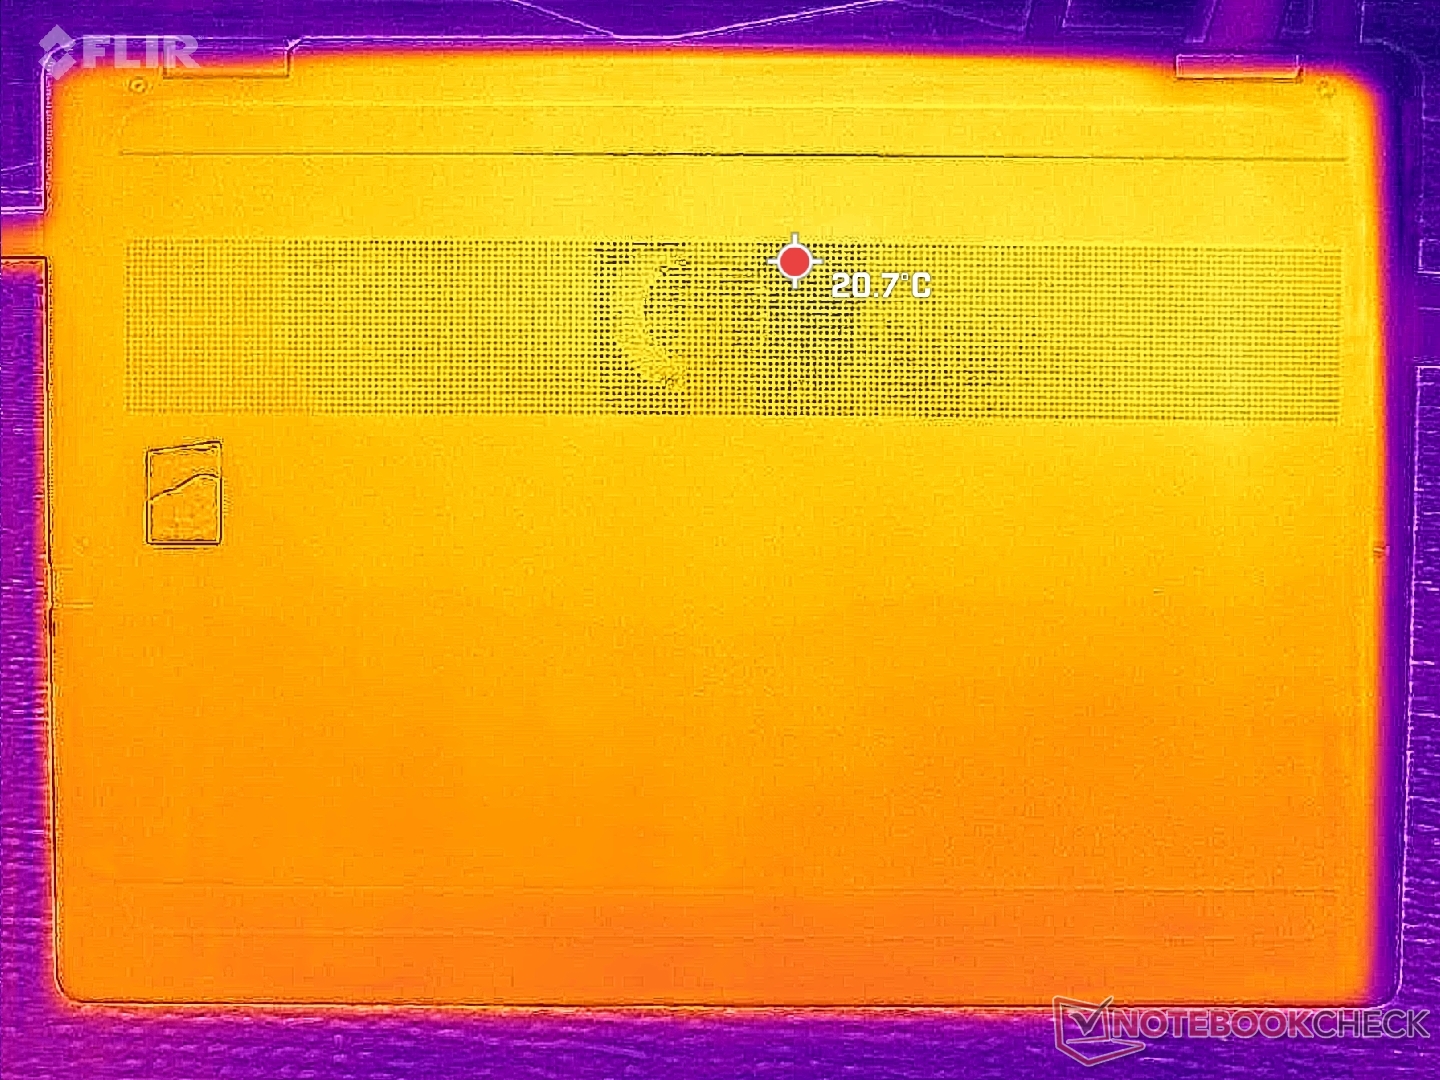
(+) In idle usage, the average temperature for the upper side is 24 °C / 75 F, compared to the device average of 30.3 °C / 87 F.
(±) The palmrests and touchpad can get very hot to the touch with a maximum of 36.6 °C / 97.9 F.
(-) The average temperature of the palmrest area of similar devices was 28 °C / 82.4 F (-8.6 °C / -15.5 F).
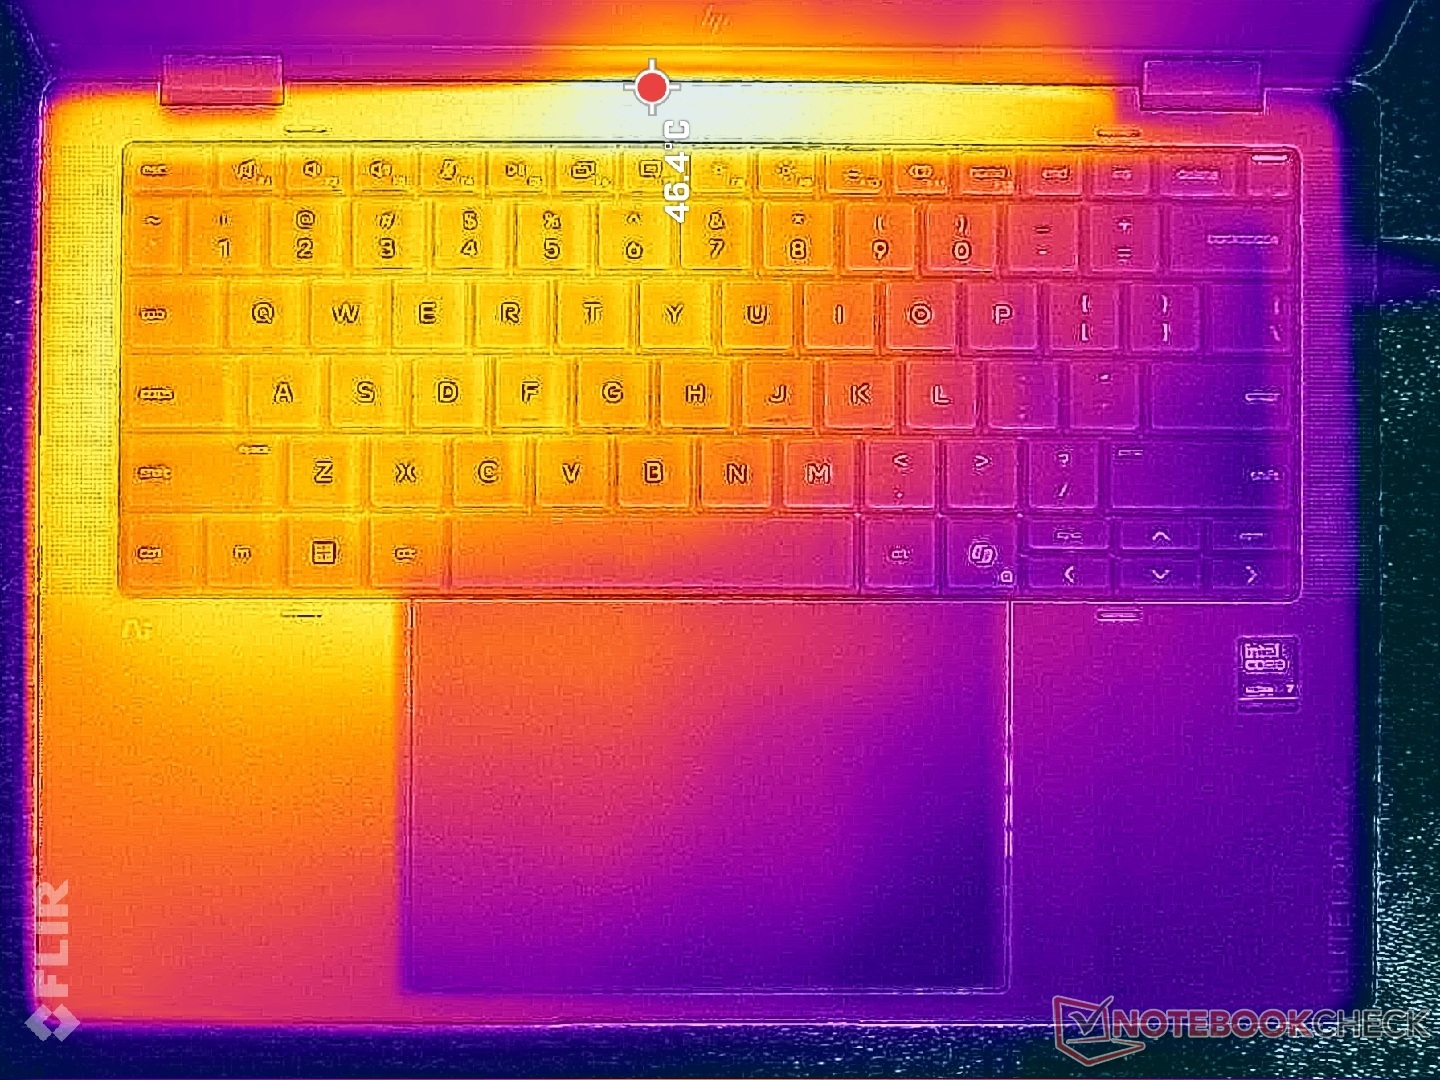
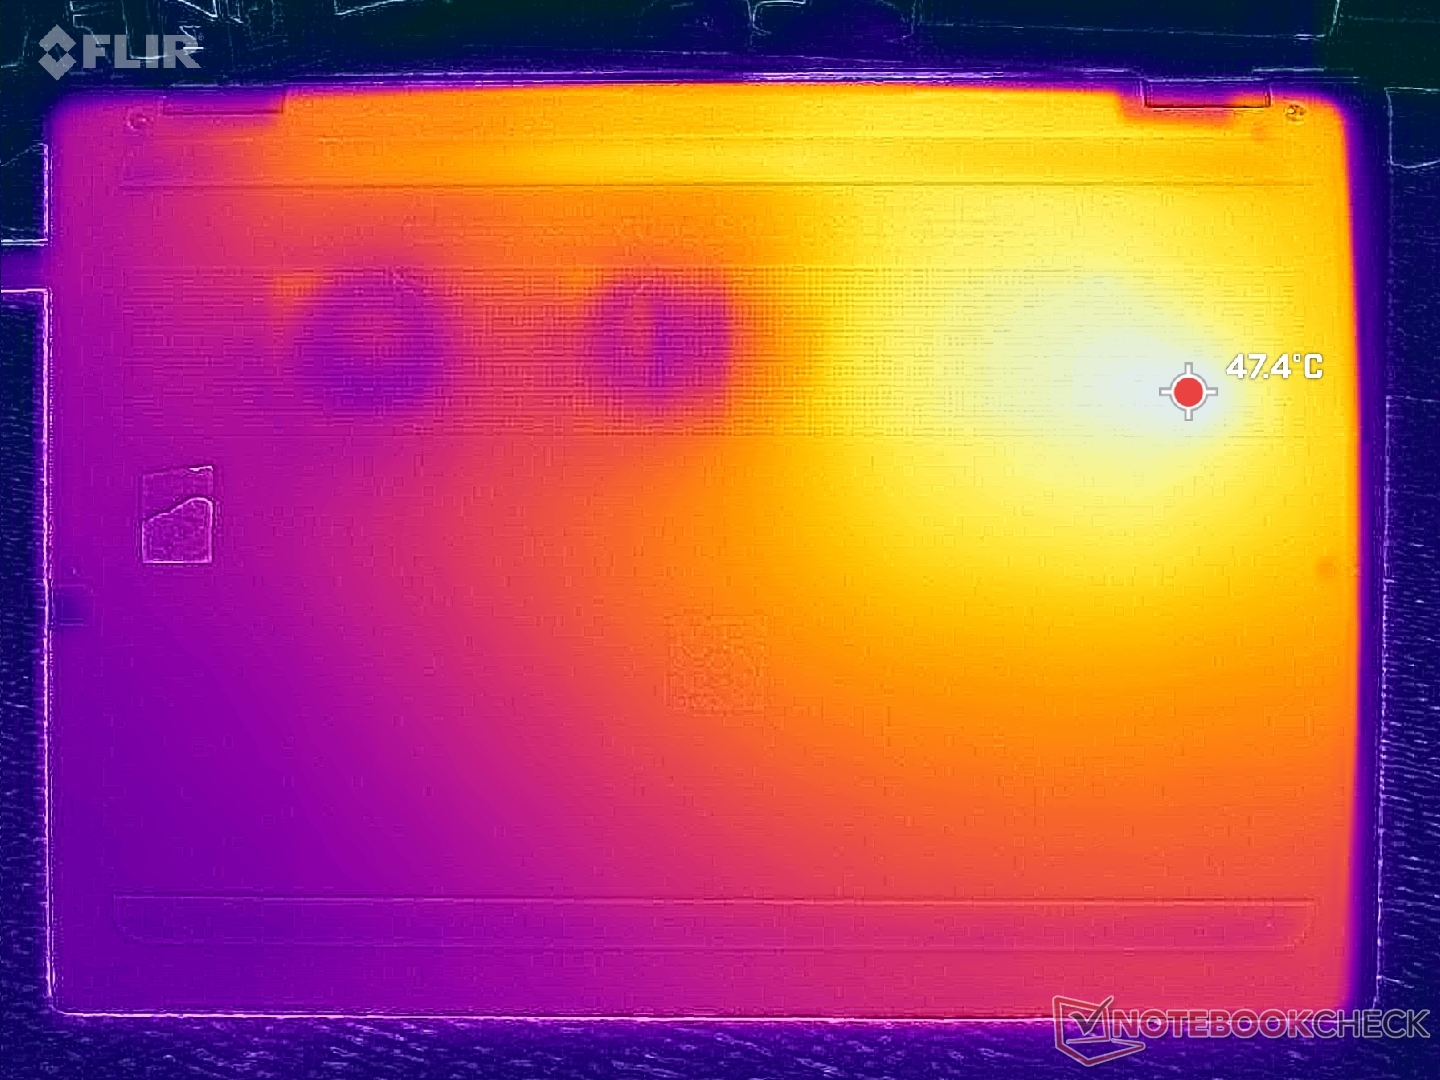
| HP EliteBook X Flip G2i 14 AI Ultra 7 366H, Intel Graphics 4 Xe3 PTL | HP EliteBook X Flip G1i 14 AI Core Ultra 7 258V, Arc 140V | HP EliteBook x360 1040 G11 Ultra 7 165H, Arc 8-Core | MSI Prestige 14 Flip AI+ 2026 Ultra X7 358H, Arc B390 Panther Lake iGPU | Lenovo Yoga 7 2-in-1 14AKP10 Ryzen AI 5 340, Radeon 840M | Dell Latitude 9450 2-in-1 Ultra 7 165U, Graphics 4-Core iGPU (Arrow Lake) | |
|---|---|---|---|---|---|---|
| Heat | 3% | 1% | -3% | -12% | 2% | |
| Maximum Upper Side * (°C) | 43.8 | 36 18% | 39 11% | 47.1 -8% | 47 -7% | 35.4 19% |
| Maximum Bottom * (°C) | 43.6 | 41 6% | 43.6 -0% | 46.2 -6% | 49 -12% | 37.8 13% |
| Idle Upper Side * (°C) | 24.6 | 26 -6% | 24.4 1% | 24.3 1% | 28 -14% | 27.2 -11% |
| Idle Bottom * (°C) | 25.2 | 27 -7% | 27.4 -9% | 24.5 3% | 29 -15% | 28.2 -12% |
* ... smaller is better
Stress Test
Core temperature is higher than expected when running demanding tasks at over 80 C or even 90 C. Turbo Boost sustainability is subsequently limited as shown by the screenshots below which correlate with our CineBench loop results above.
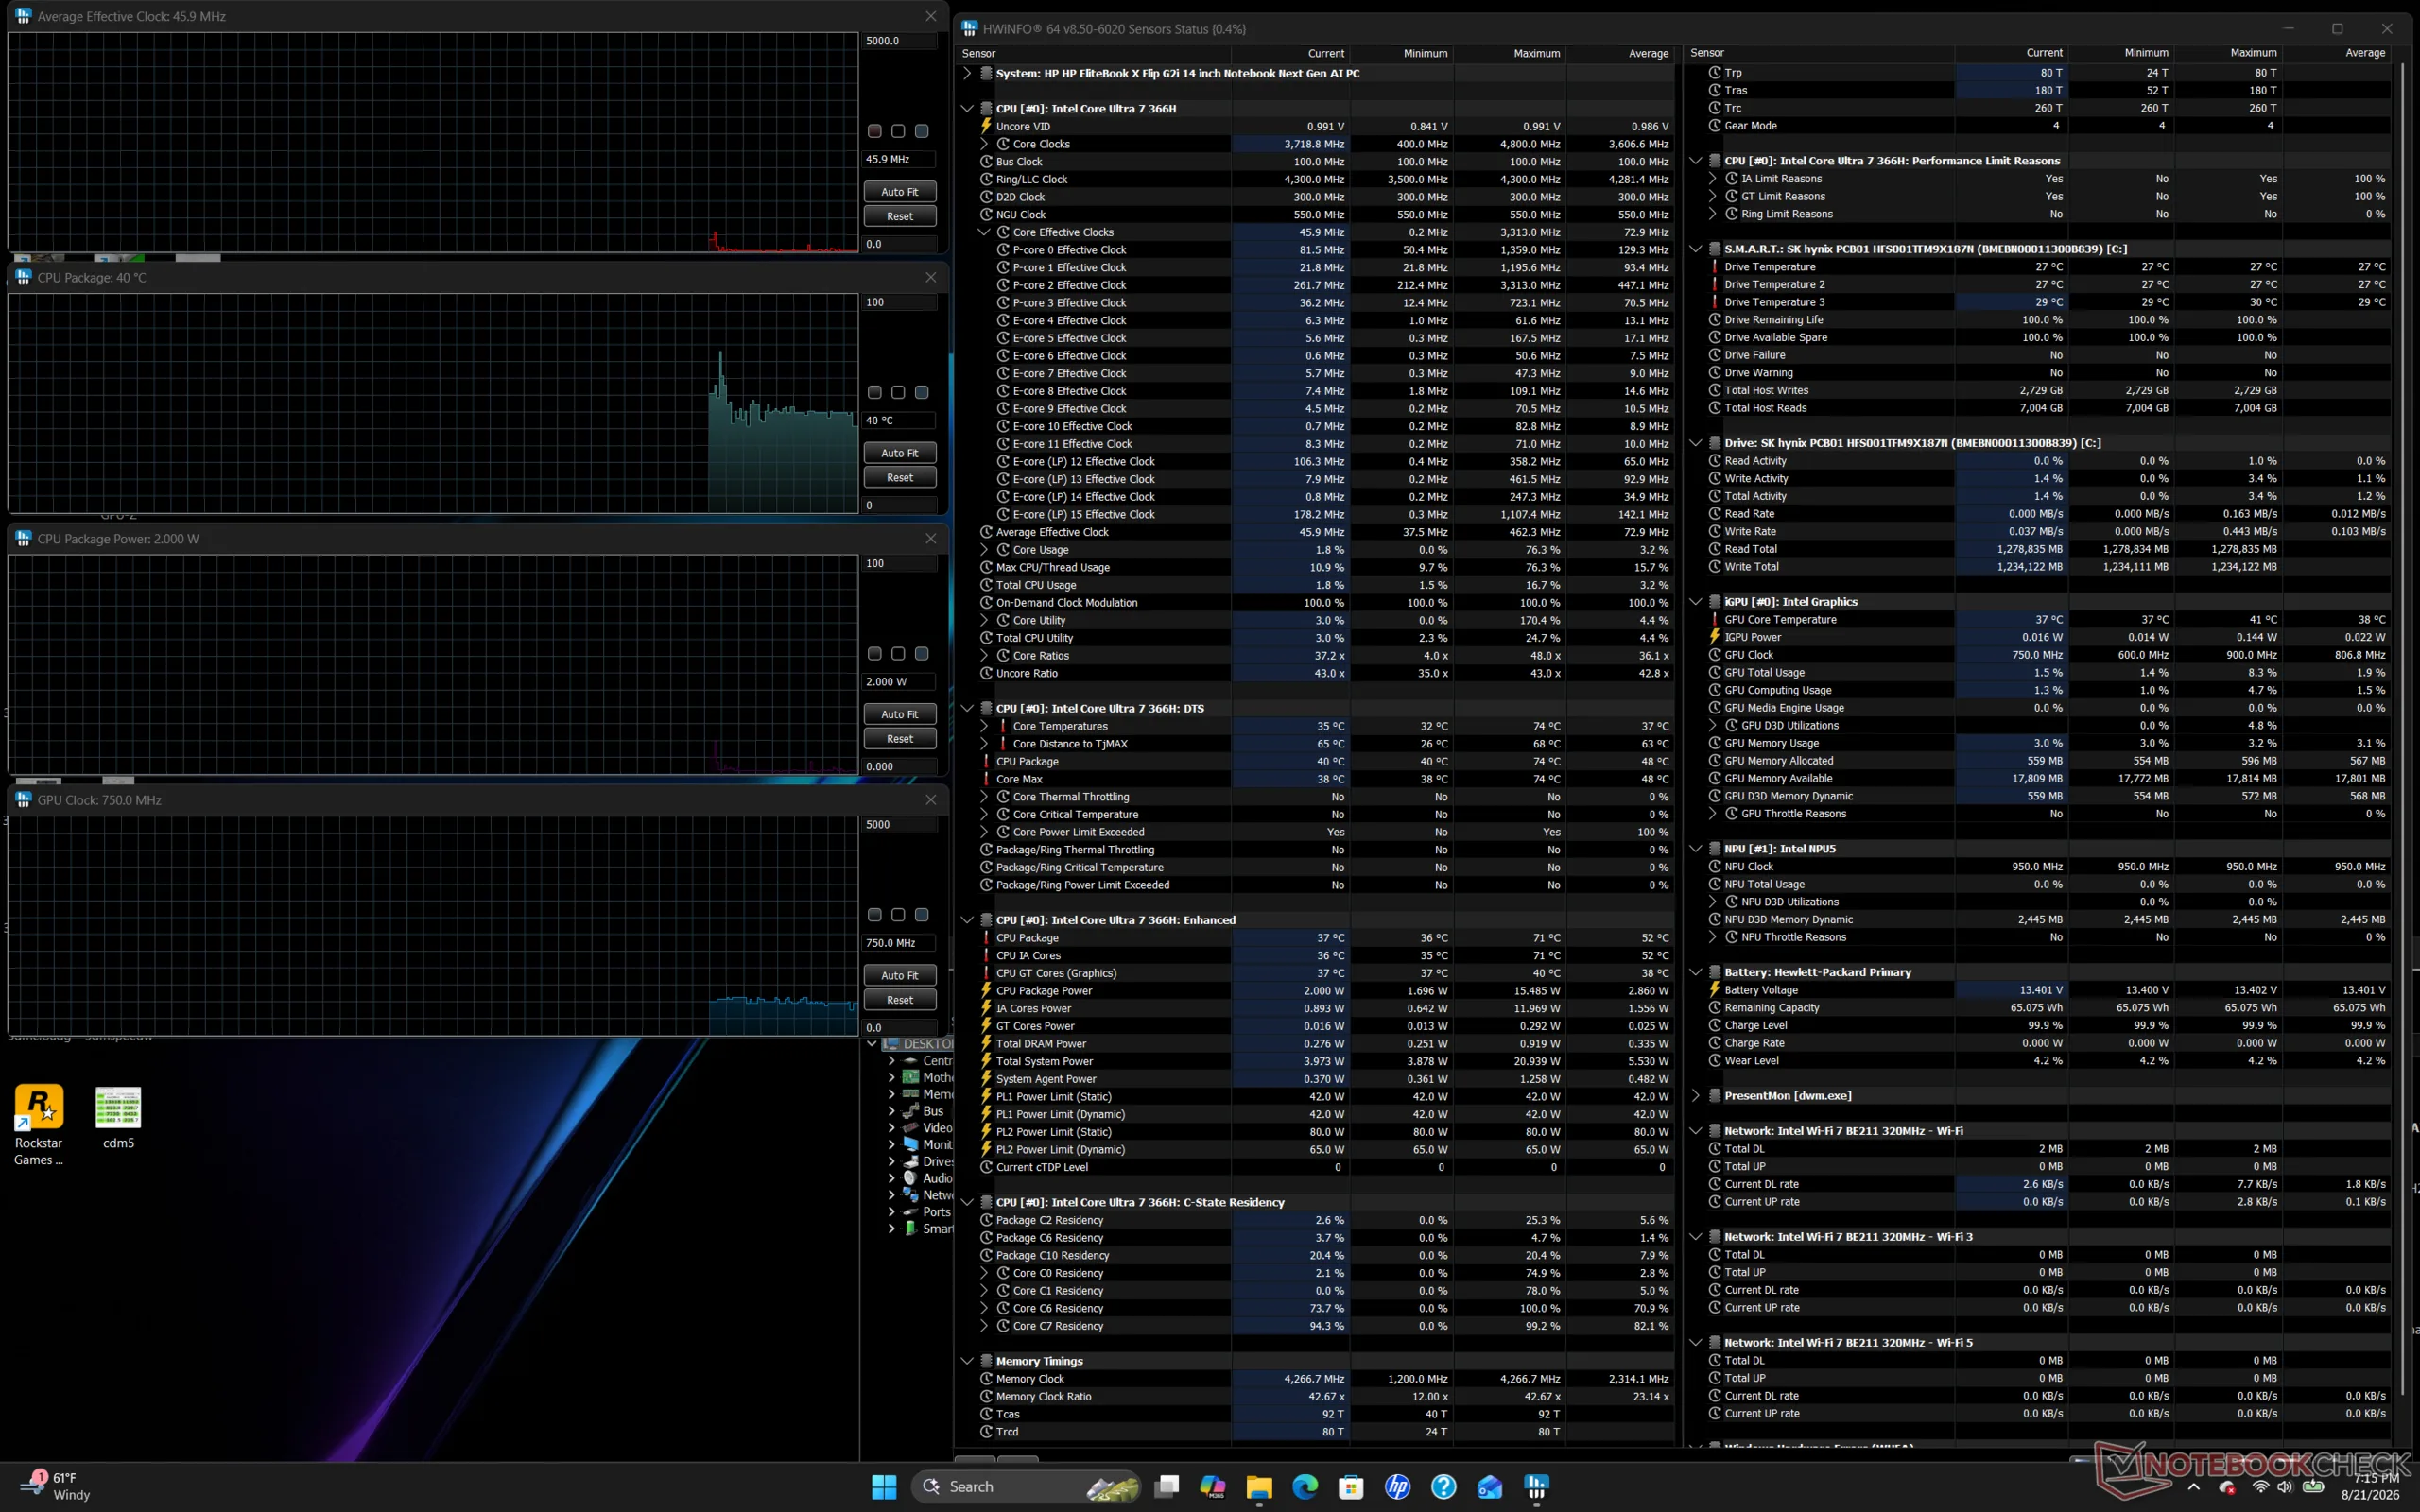
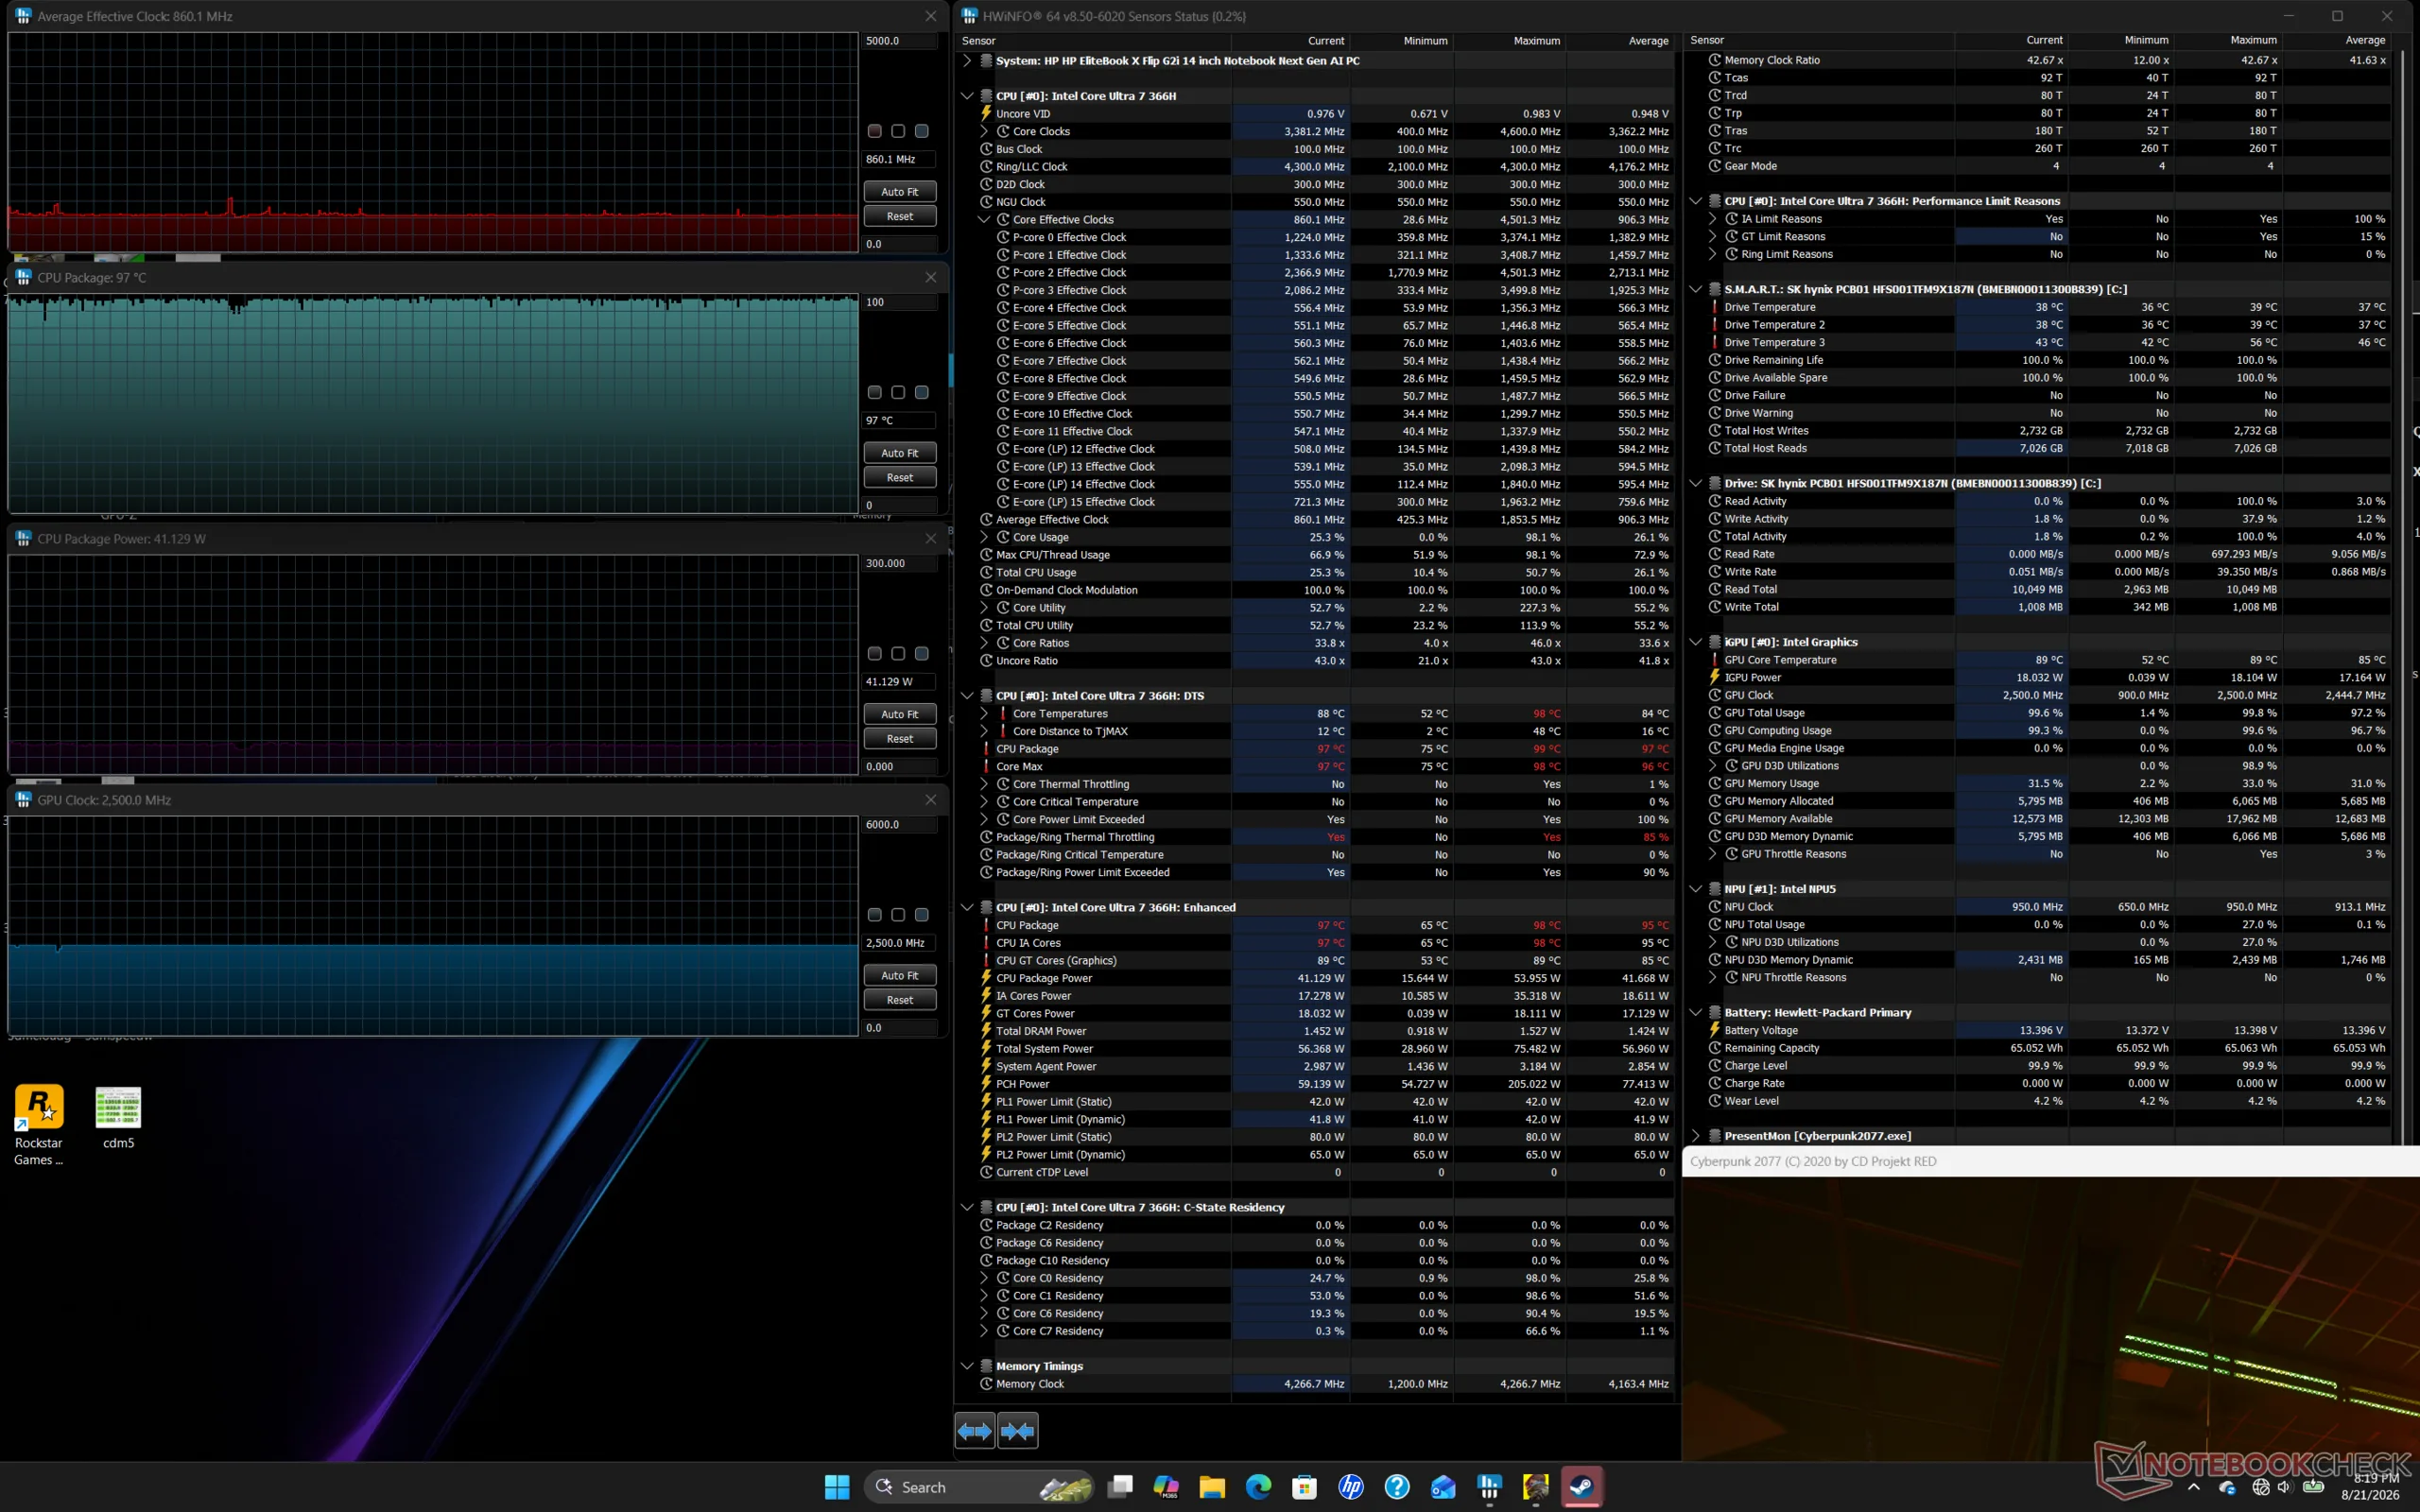
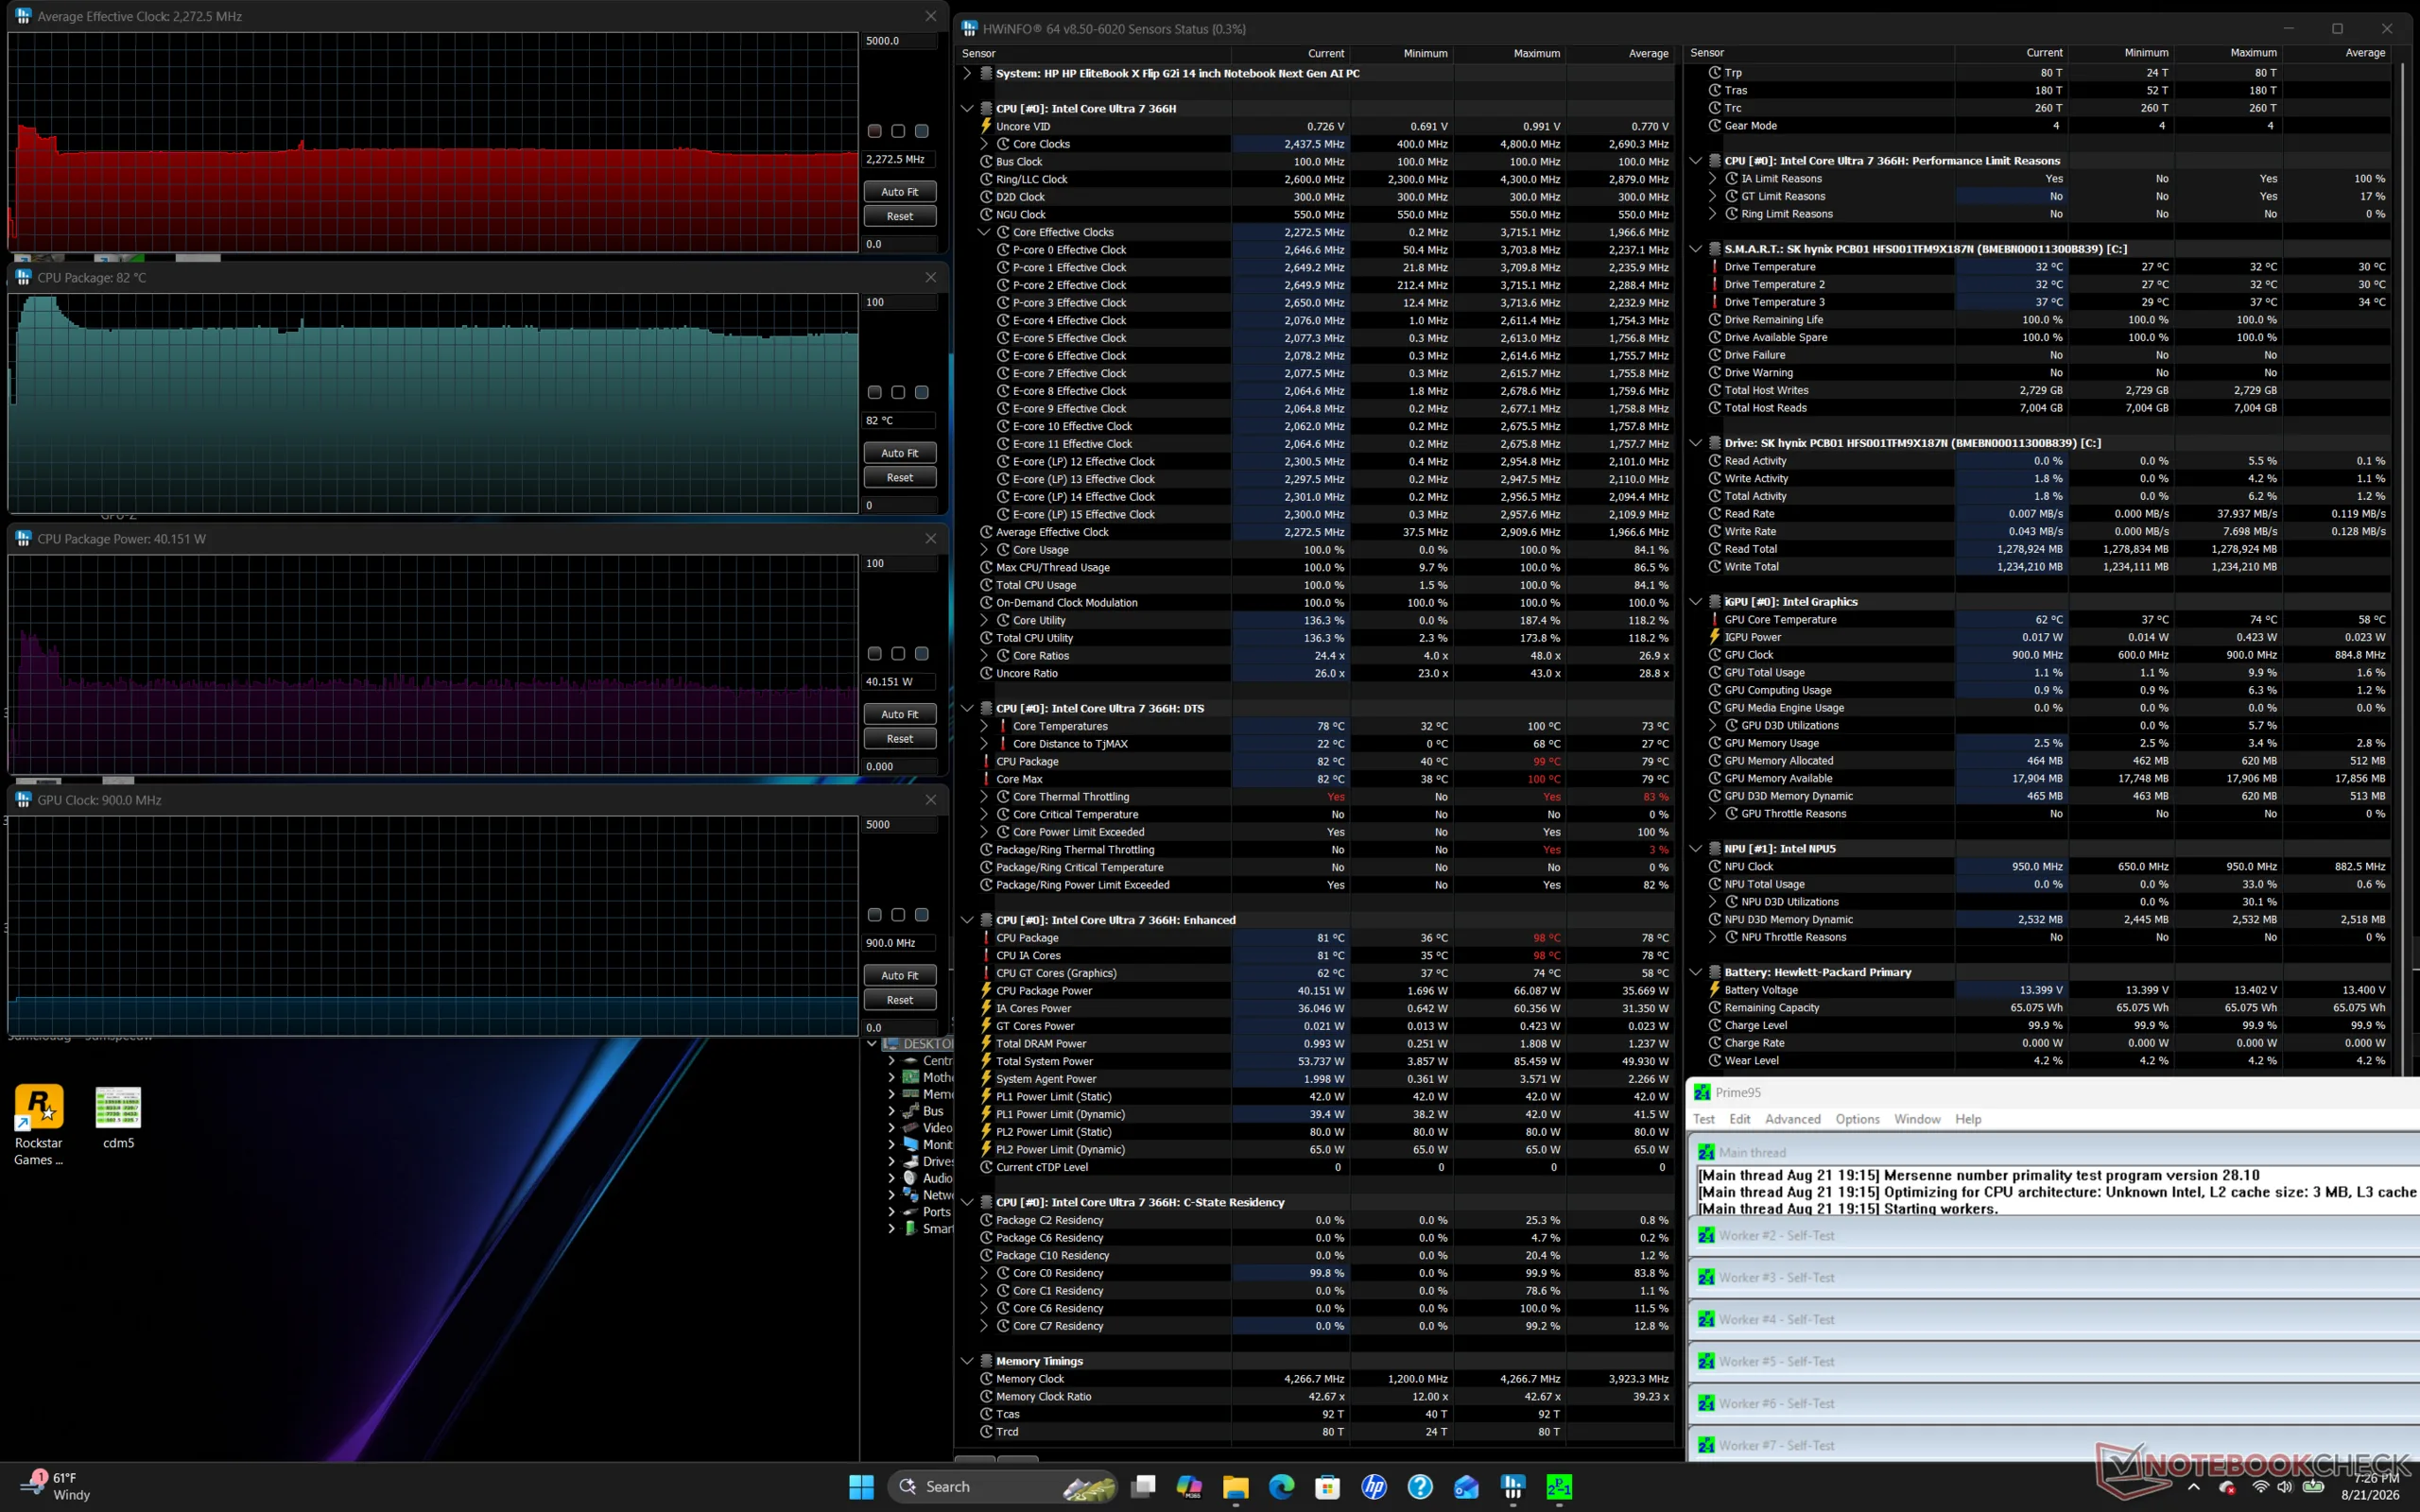
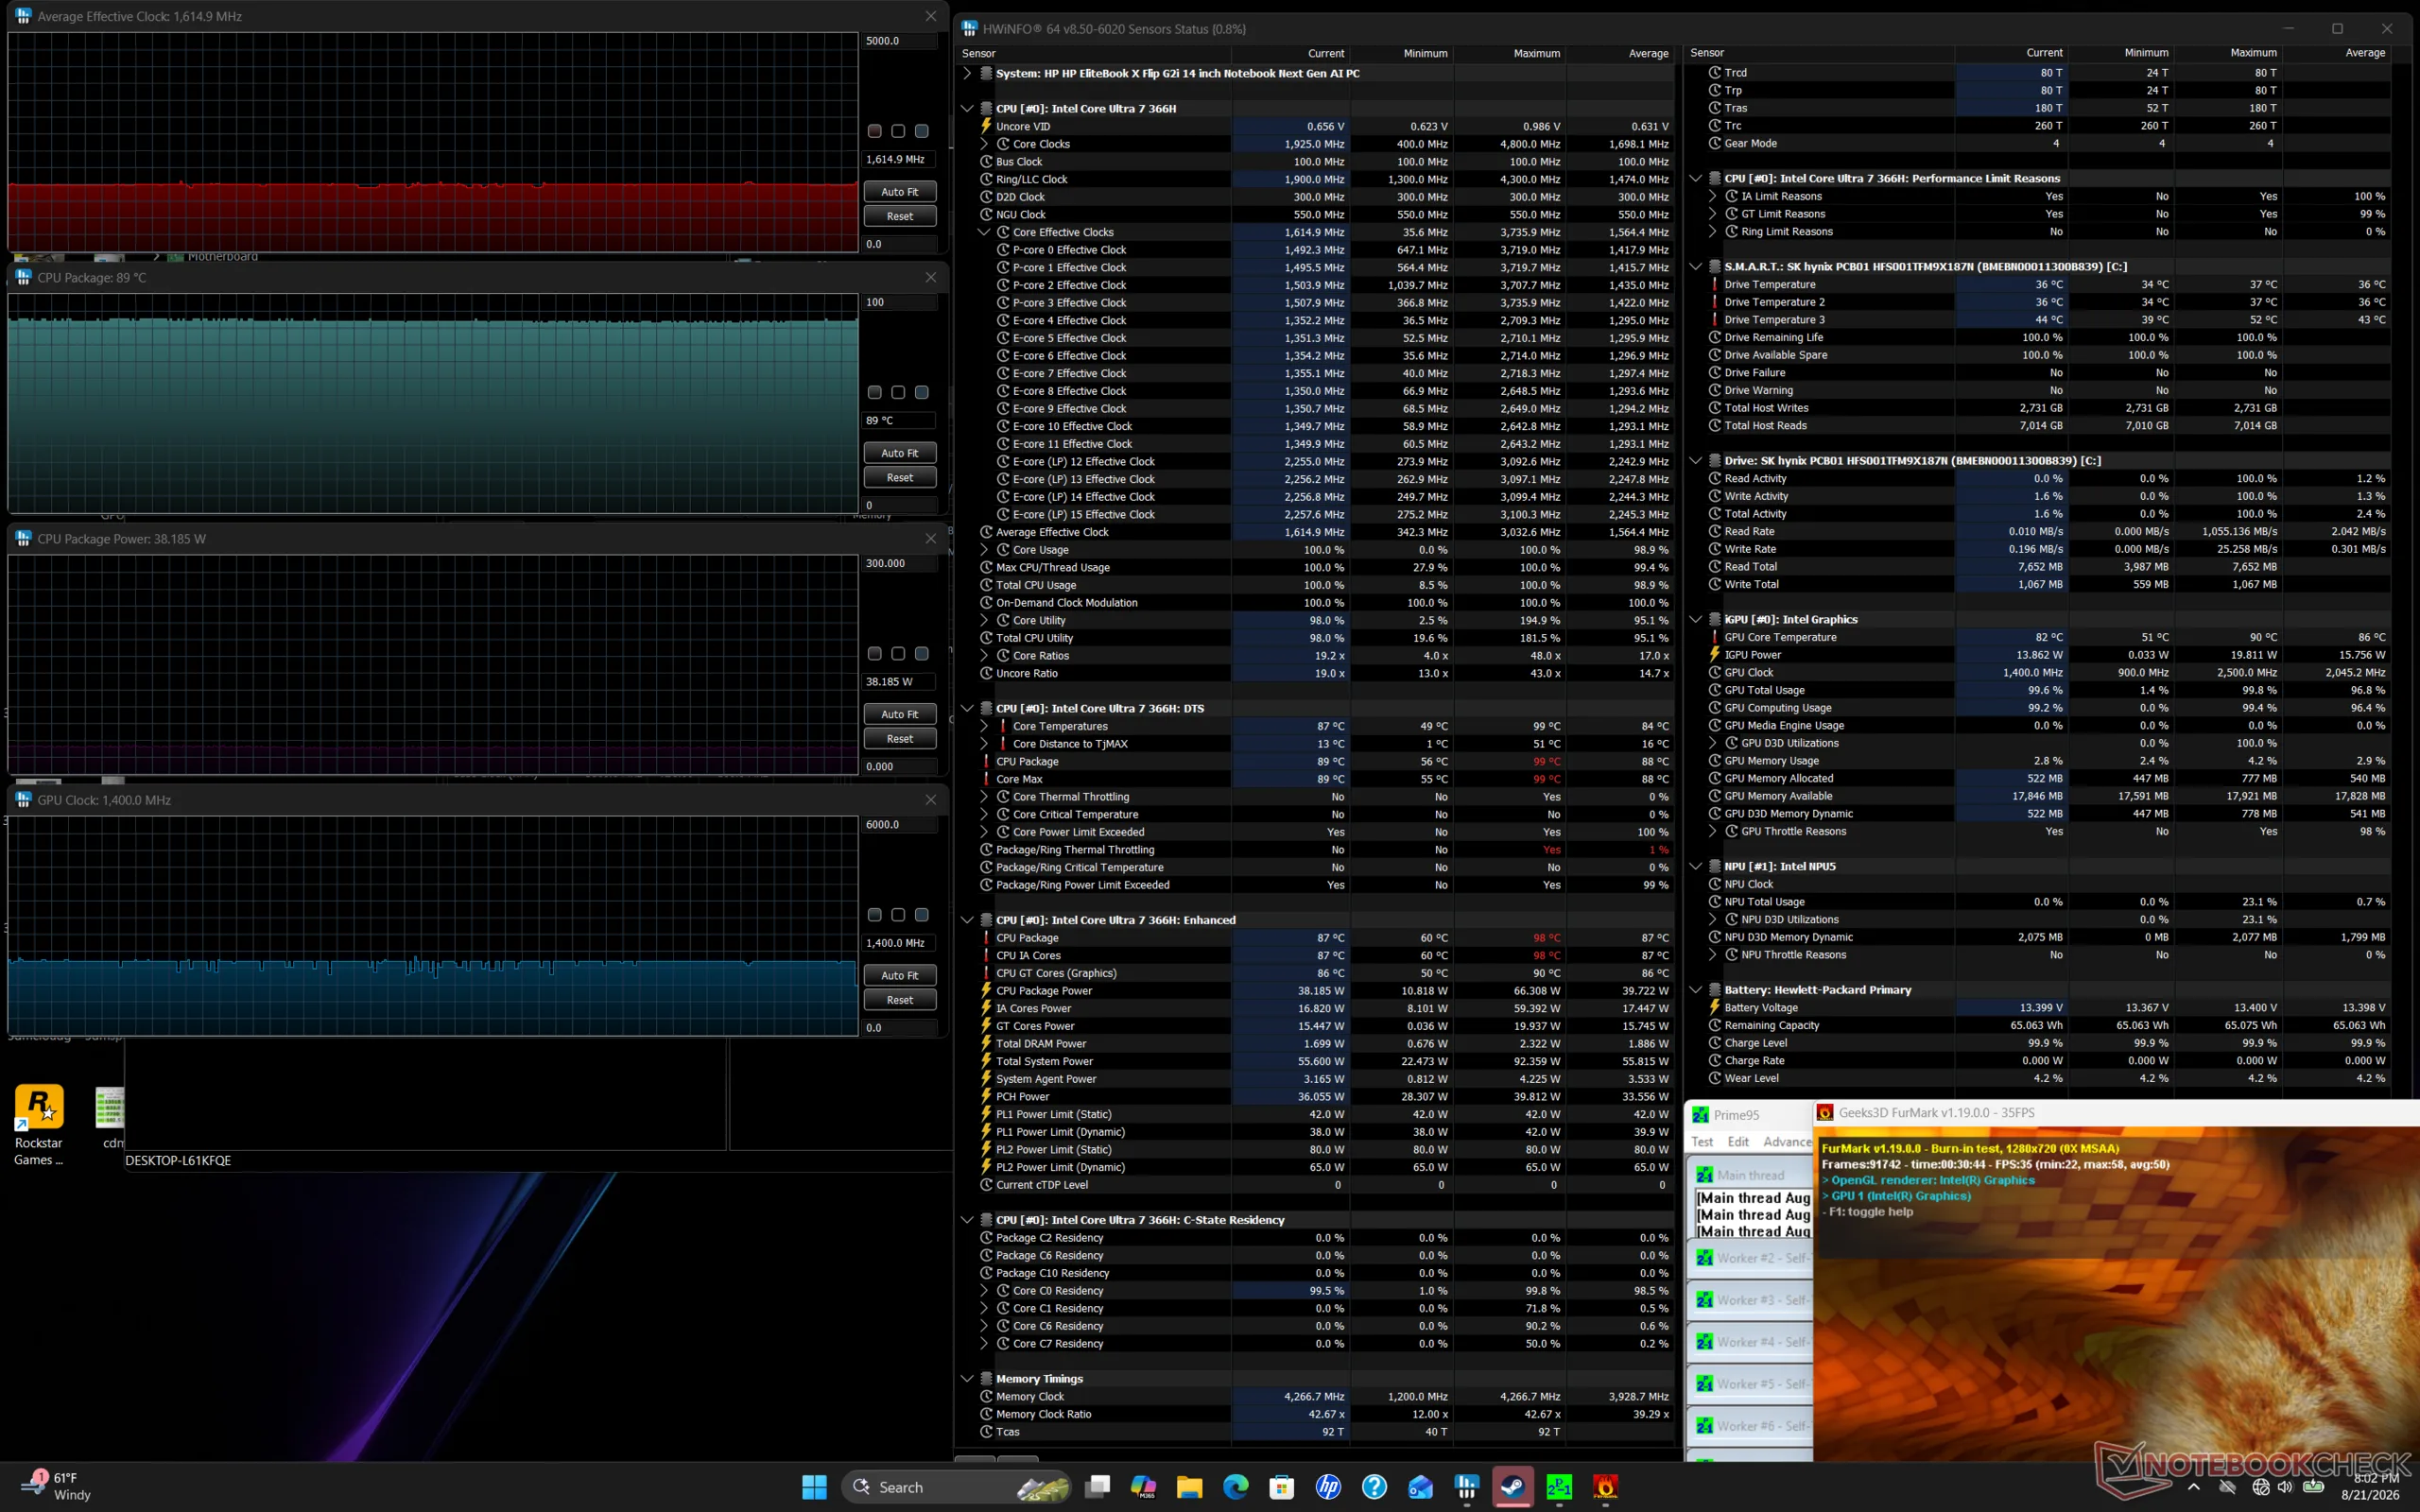
| Average CPU Clock (GHz) | GPU Clock (MHz) | Average CPU Temperature (°C) | |
| System Idle | -- | -- | 49 |
| Prime95 Stress | 2.3 | -- | 82 |
| Prime95 + FurMark Stress | 1.6 | 1400 | 89 |
| Cyberpunk 2077 Stress | 0.9 | 2500 | 97 |
Speakers
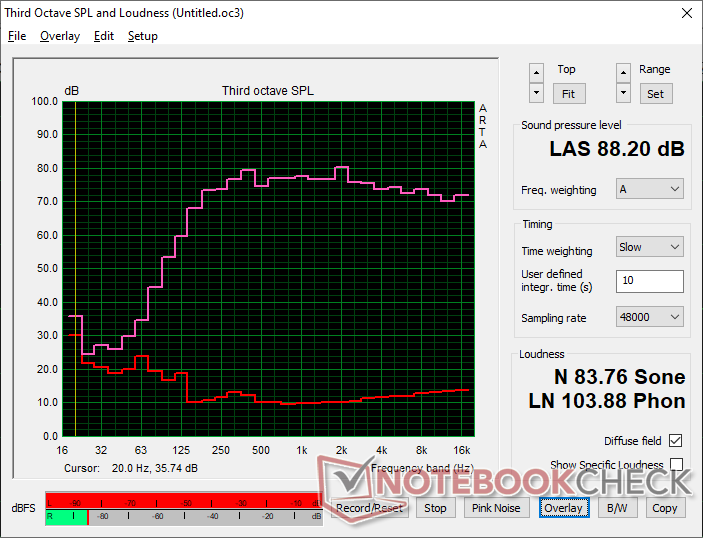
HP EliteBook X Flip G2i 14 AI audio analysis
(+) | speakers can play relatively loud (88.2 dB)
Bass 100 - 315 Hz
(±) | reduced bass - on average 7.8% lower than median
(±) | linearity of bass is average (8.6% delta to prev. frequency)
Mids 400 - 2000 Hz
(+) | balanced mids - only 2.8% away from median
(+) | mids are linear (3% delta to prev. frequency)
Highs 2 - 16 kHz
(+) | balanced highs - only 1.3% away from median
(+) | highs are linear (2.7% delta to prev. frequency)
Overall 100 - 16.000 Hz
(+) | overall sound is linear (6.9% difference to median)
Compared to same class
» 1% of all tested devices in this class were better, 1% similar, 98% worse
» The best had a delta of 6%, average was 20%, worst was 57%
Compared to all devices tested
» 1% of all tested devices were better, 0% similar, 99% worse
» The best had a delta of 4%, average was 23%, worst was 136%
Apple MacBook Pro 16 2021 M1 Pro audio analysis
(+) | speakers can play relatively loud (84.7 dB)
Bass 100 - 315 Hz
(+) | good bass - only 3.8% away from median
(+) | bass is linear (5.2% delta to prev. frequency)
Mids 400 - 2000 Hz
(+) | balanced mids - only 1.3% away from median
(+) | mids are linear (2.1% delta to prev. frequency)
Highs 2 - 16 kHz
(+) | balanced highs - only 1.9% away from median
(+) | highs are linear (2.7% delta to prev. frequency)
Overall 100 - 16.000 Hz
(+) | overall sound is linear (4.6% difference to median)
Compared to same class
» 0% of all tested devices in this class were better, 0% similar, 100% worse
» The best had a delta of 5%, average was 17%, worst was 45%
Compared to all devices tested
» 0% of all tested devices were better, 0% similar, 100% worse
» The best had a delta of 4%, average was 23%, worst was 136%
Energy Management
Power Consumption
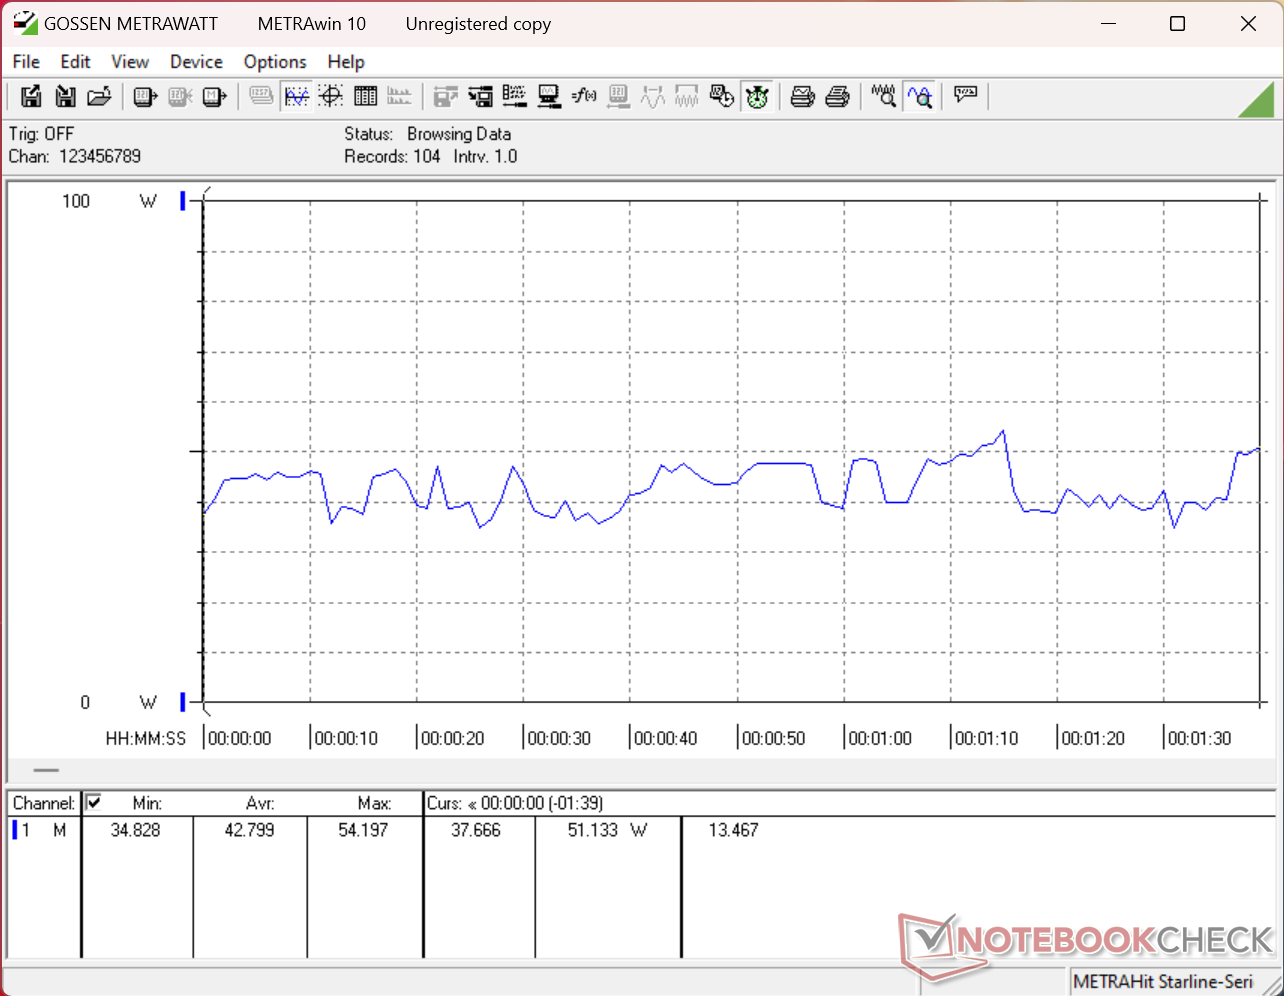
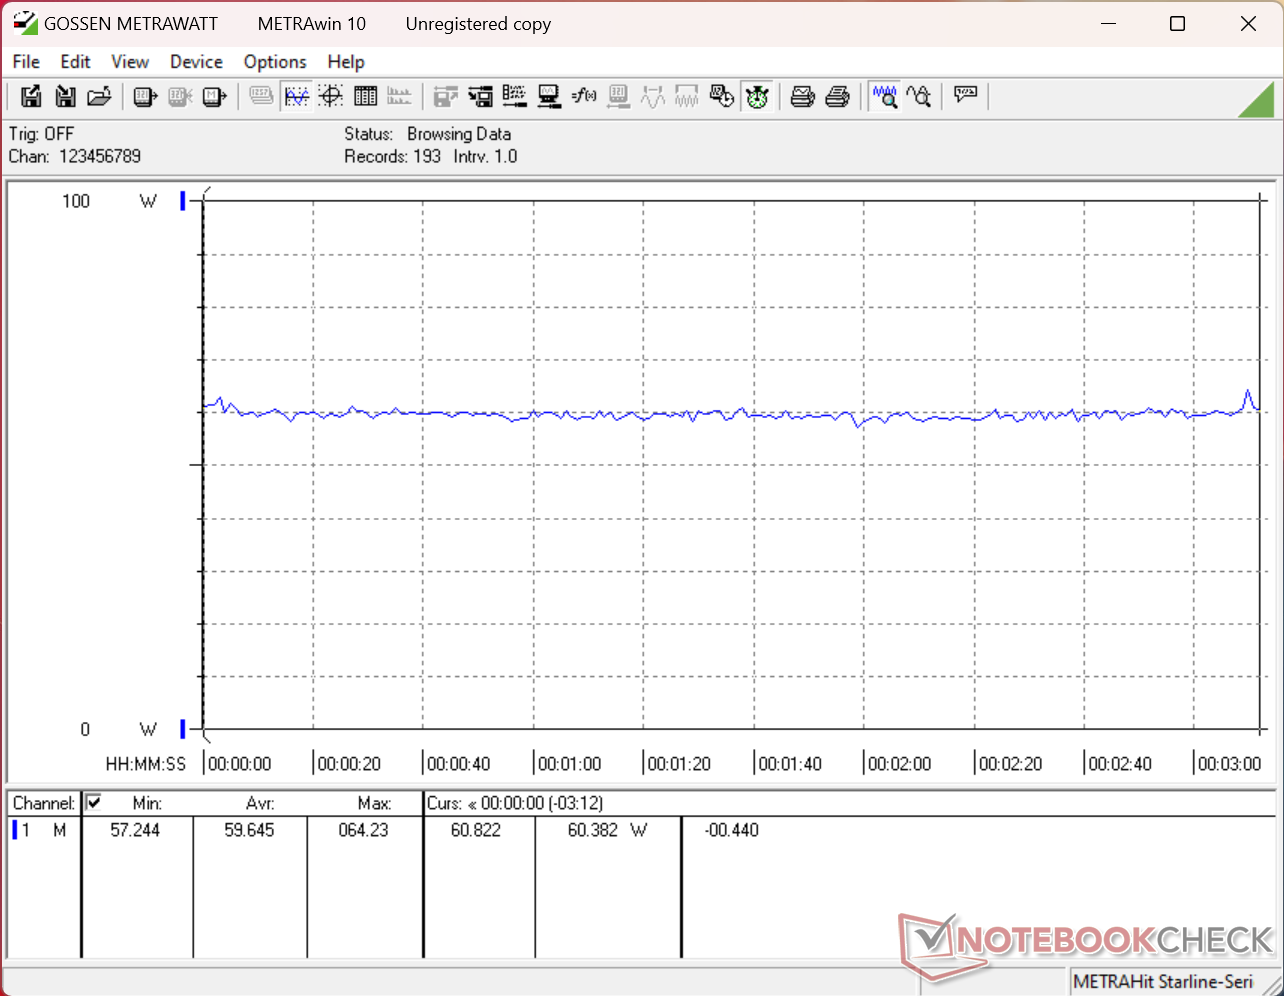
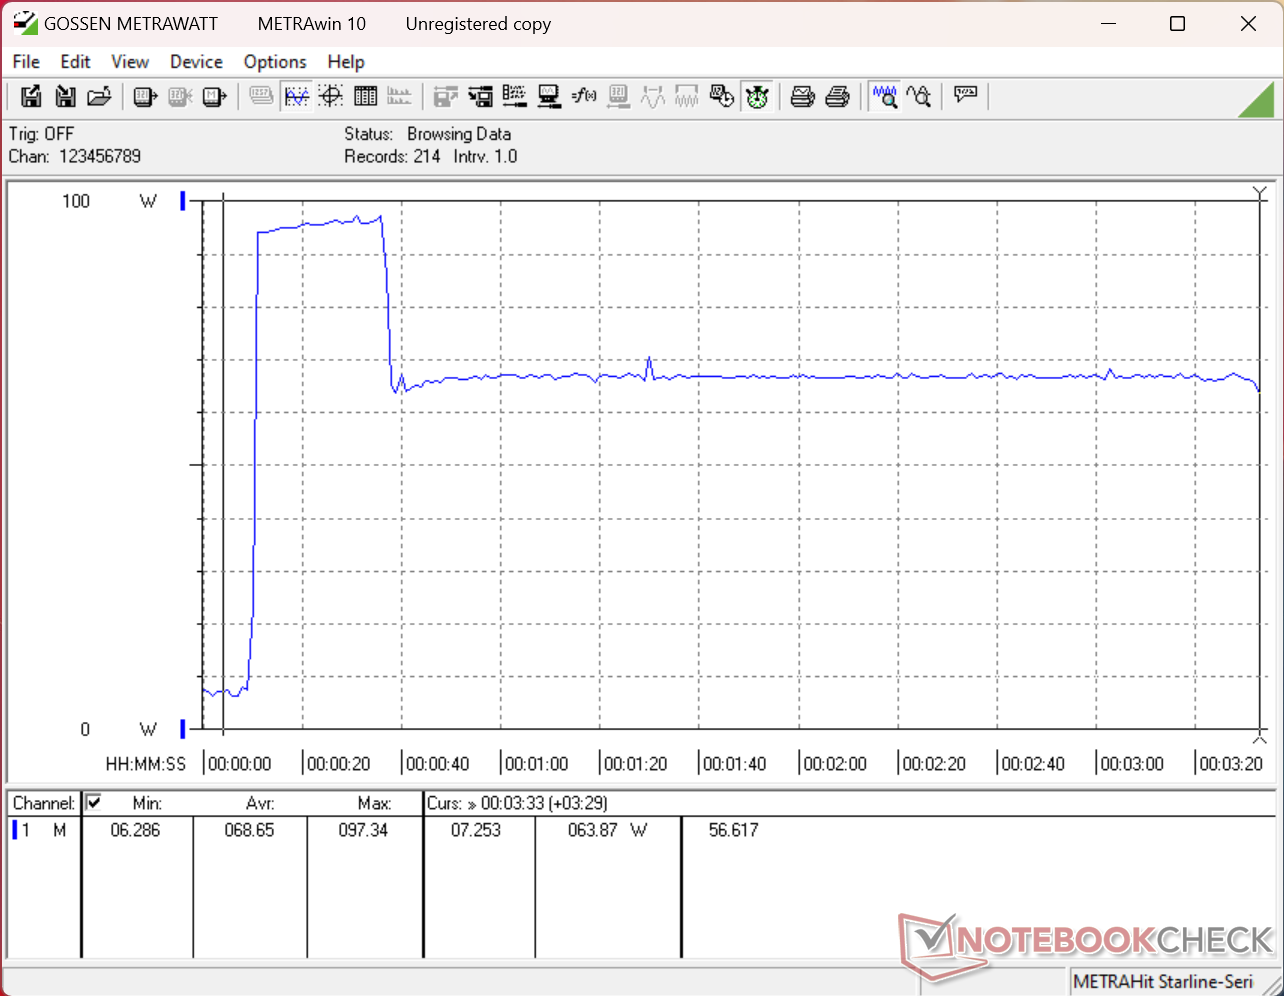
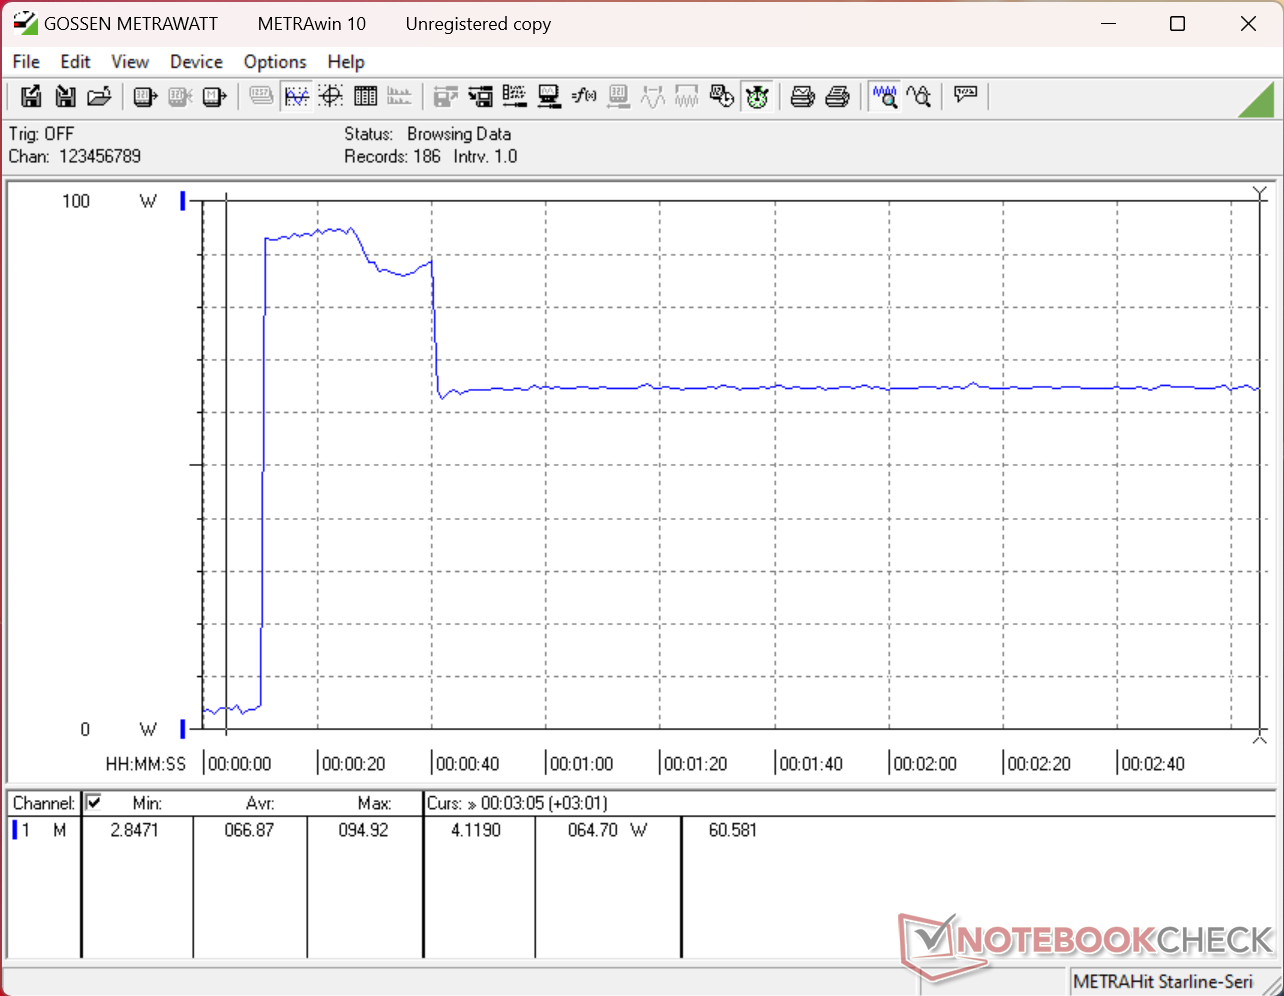
| Off / Standby | 0.3 / 0.68 Watt |
| Idle | 2.9 / 3.8 / 11.9 Watt |
| Load |
42.8 / 97.4 Watt |
   
| |
Key:
min: ,
med: ,
max: Metrahit Energy | |
| HP EliteBook X Flip G2i 14 AI Ultra 7 366H, Intel Graphics 4 Xe3 PTL, , OLED, 2880x1800, 14" | HP EliteBook X Flip G1i 14 AI Core Ultra 7 258V, Arc 140V, Western Digital PC SN5000S SDEPNSJ-1T00-1006, IPS, 1920x1200, 14" | HP EliteBook x360 1040 G11 Ultra 7 165H, Arc 8-Core, Kioxia XG8 KXG80ZNV512G, IPS, 1920x1200, 14" | MSI Prestige 14 Flip AI+ 2026 Ultra X7 358H, Arc B390 Panther Lake iGPU, Phison 1 TB ESR01TBTCCZ-27J, OLED, 1920x1200, 14" | Lenovo Yoga 7 2-in-1 14AKP10 Ryzen AI 5 340, Radeon 840M, WD PC SN7100S SDFPMSL-512G-1101, OLED, 1920x1200, 14" | Dell Latitude 9450 2-in-1 Ultra 7 165U, Graphics 4-Core iGPU (Arrow Lake), , IPS, 2560x1600, 14" | |
|---|---|---|---|---|---|---|
| Power Consumption | 2% | 19% | 11% | 0% | -14% | |
| Idle Minimum * (Watt) | 2.9 | 2.9 -0% | 1.8 38% | 2.8 3% | 4 -38% | 3.2 -10% |
| Idle Average * (Watt) | 3.8 | 8.2 -116% | 4.4 -16% | 4.2 -11% | 5 -32% | 6.4 -68% |
| Idle Maximum * (Watt) | 11.9 | 8.6 28% | 4.5 62% | 4.5 62% | 7 41% | 10.8 9% |
| Load Average * (Watt) | 42.8 | 39.6 7% | 40.7 5% | 48.9 -14% | 52 -21% | 54.6 -28% |
| Cyberpunk 2077 ultra * (Watt) | 59.6 | 41.9 30% | 56.5 5% | 59.9 -1% | 54.8 8% | |
| Cyberpunk 2077 ultra external monitor * (Watt) | 59.6 | 36.4 39% | 54.6 8% | 58.6 2% | 52.6 12% | |
| Load Maximum * (Watt) | 97.4 | 70 28% | 66 32% | 64 34% | 68 30% | 70.2 28% |
| Witcher 3 ultra * (Watt) | 35.5 |
* ... smaller is better
Power Consumption Cyberpunk / Stress Test
Power Consumption external Monitor
Battery Life
| HP EliteBook X Flip G2i 14 AI Ultra 7 366H, Intel Graphics 4 Xe3 PTL, 68 Wh | HP EliteBook X Flip G1i 14 AI Core Ultra 7 258V, Arc 140V, 68 Wh | HP EliteBook x360 1040 G11 Ultra 7 165H, Arc 8-Core, 68 Wh | MSI Prestige 14 Flip AI+ 2026 Ultra X7 358H, Arc B390 Panther Lake iGPU, 81 Wh | Lenovo Yoga 7 2-in-1 14AKP10 Ryzen AI 5 340, Radeon 840M, 70 Wh | Dell Latitude 9450 2-in-1 Ultra 7 165U, Graphics 4-Core iGPU (Arrow Lake), 60 Wh | |
|---|---|---|---|---|---|---|
| Battery runtime | 21% | 7% | 29% | -25% | -11% | |
| WiFi v1.3 (h) | 15.2 | 18.4 21% | 16.2 7% | 19.6 29% | 11.4 -25% | 13.6 -11% |
| H.264 (h) | 20.6 | |||||
| Load (h) | 2.1 | 1.7 | 2.4 | |||
| Reader / Idle (h) | 55.9 | 21.7 |
Notebookcheck Rating
An improvement over the original EliteBook X Flip G1i 14 in almost every way from performance to weight and aesthetics, but the grainy matte panel may bother some.
HP EliteBook X Flip G2i 14 AI
- 08/26/2026 v8
Allen Ngo
 Total Sustainability Score:
 Potential Competitors in Comparison
Image | Model / Review | Price | Weight | Height | Display |
|---|---|---|---|---|---|
1. 90.7%  | HP EliteBook X Flip G2i 14 AI Intel Core Ultra 7 366H ⎘ Intel Graphics 4 Xe3 Panther Lake iGPU ⎘ 32 GB Memory | List Price: 3500 USD | 1.3 kg | 17.2 mm | 14.00" 2880x1800 243 PPI OLED |
2. 89.9%  | HP EliteBook X Flip G1i 14 AI Intel Core Ultra 7 258V ⎘ Intel Arc Graphics 140V ⎘ 32 GB Memory, 1000 GB SSD | List Price: 2889 Euro | 1.5 kg | 14.7 mm | 14.00" 1920x1200 162 PPI IPS |
3. 87.2%  | HP EliteBook x360 1040 G11 Intel Core Ultra 7 165H ⎘ Intel Arc 8-Core iGPU ⎘ 16 GB Memory, 512 GB SSD | List Price: 2800 USD | 1.5 kg | 14.7 mm | 14.00" 1920x1200 162 PPI IPS |
4. 84.2%  | MSI Prestige 14 Flip AI+ 2026 Intel Core Ultra X7 358H ⎘ Intel Arc B390 12 Xe3 Panther Lake iGPU ⎘ 32 GB Memory, 1000 GB SSD | Amazon: 1. $2,499.99 EXCaliberPC [2026] MSI Prest... 2. $2,799.00 EXCaliberPC [2026] MSI Prest... 3. $1,974.94 msi Prestige 16 Flip AI+ 16"... List Price: 1549€ | 1.4 kg | 13.9 mm | 14.00" 1920x1200 162 PPI OLED |
5. 84.8%  | Lenovo Yoga 7 2-in-1 14AKP10 AMD Ryzen AI 5 340 ⎘ AMD Radeon 840M ⎘ 16 GB Memory, 512 GB SSD | List Price: 1000 EUR | 1.4 kg | 16.5 mm | 14.00" 1920x1200 162 PPI OLED |
6. 88.3% v7 (old)  | Dell Latitude 9450 2-in-1 Intel Core Ultra 7 165U ⎘ Intel Graphics 4-Core iGPU (Meteor / Arrow Lake) ⎘ 32 GB Memory | Amazon: $1,759.00 List Price: 3000 USD | 1.6 kg | 16.28 mm | 14.00" 2560x1600 216 PPI IPS |
Transparency
The selection of devices to be reviewed is made by our editorial team. The test sample was provided to the author as a loan by the manufacturer or retailer for the purpose of this review. The lender had no influence on this review, nor did the manufacturer receive a copy of this review before publication. There was no obligation to publish this review. As an independent media company, Notebookcheck is not subjected to the authority of manufacturers, retailers or publishers.
This is how Notebookcheck is testing
Every year, Notebookcheck independently reviews hundreds of laptops and smartphones using standardized procedures to ensure that all results are comparable. We have continuously developed our test methods for around 20 years and set industry standards in the process. In our test labs, high-quality measuring equipment is utilized by experienced technicians and editors. These tests involve a multi-stage validation process. Our complex rating system is based on hundreds of well-founded measurements and benchmarks, which maintains objectivity. Further information on our test methods can be found here.
 Add as a preferred source on Google


