Notebookcheck Logo
Teaser

HP HyperX Omen 16 review: One of the fastest AMD CPUs for mainstream gamers

New HyperX beginnings.

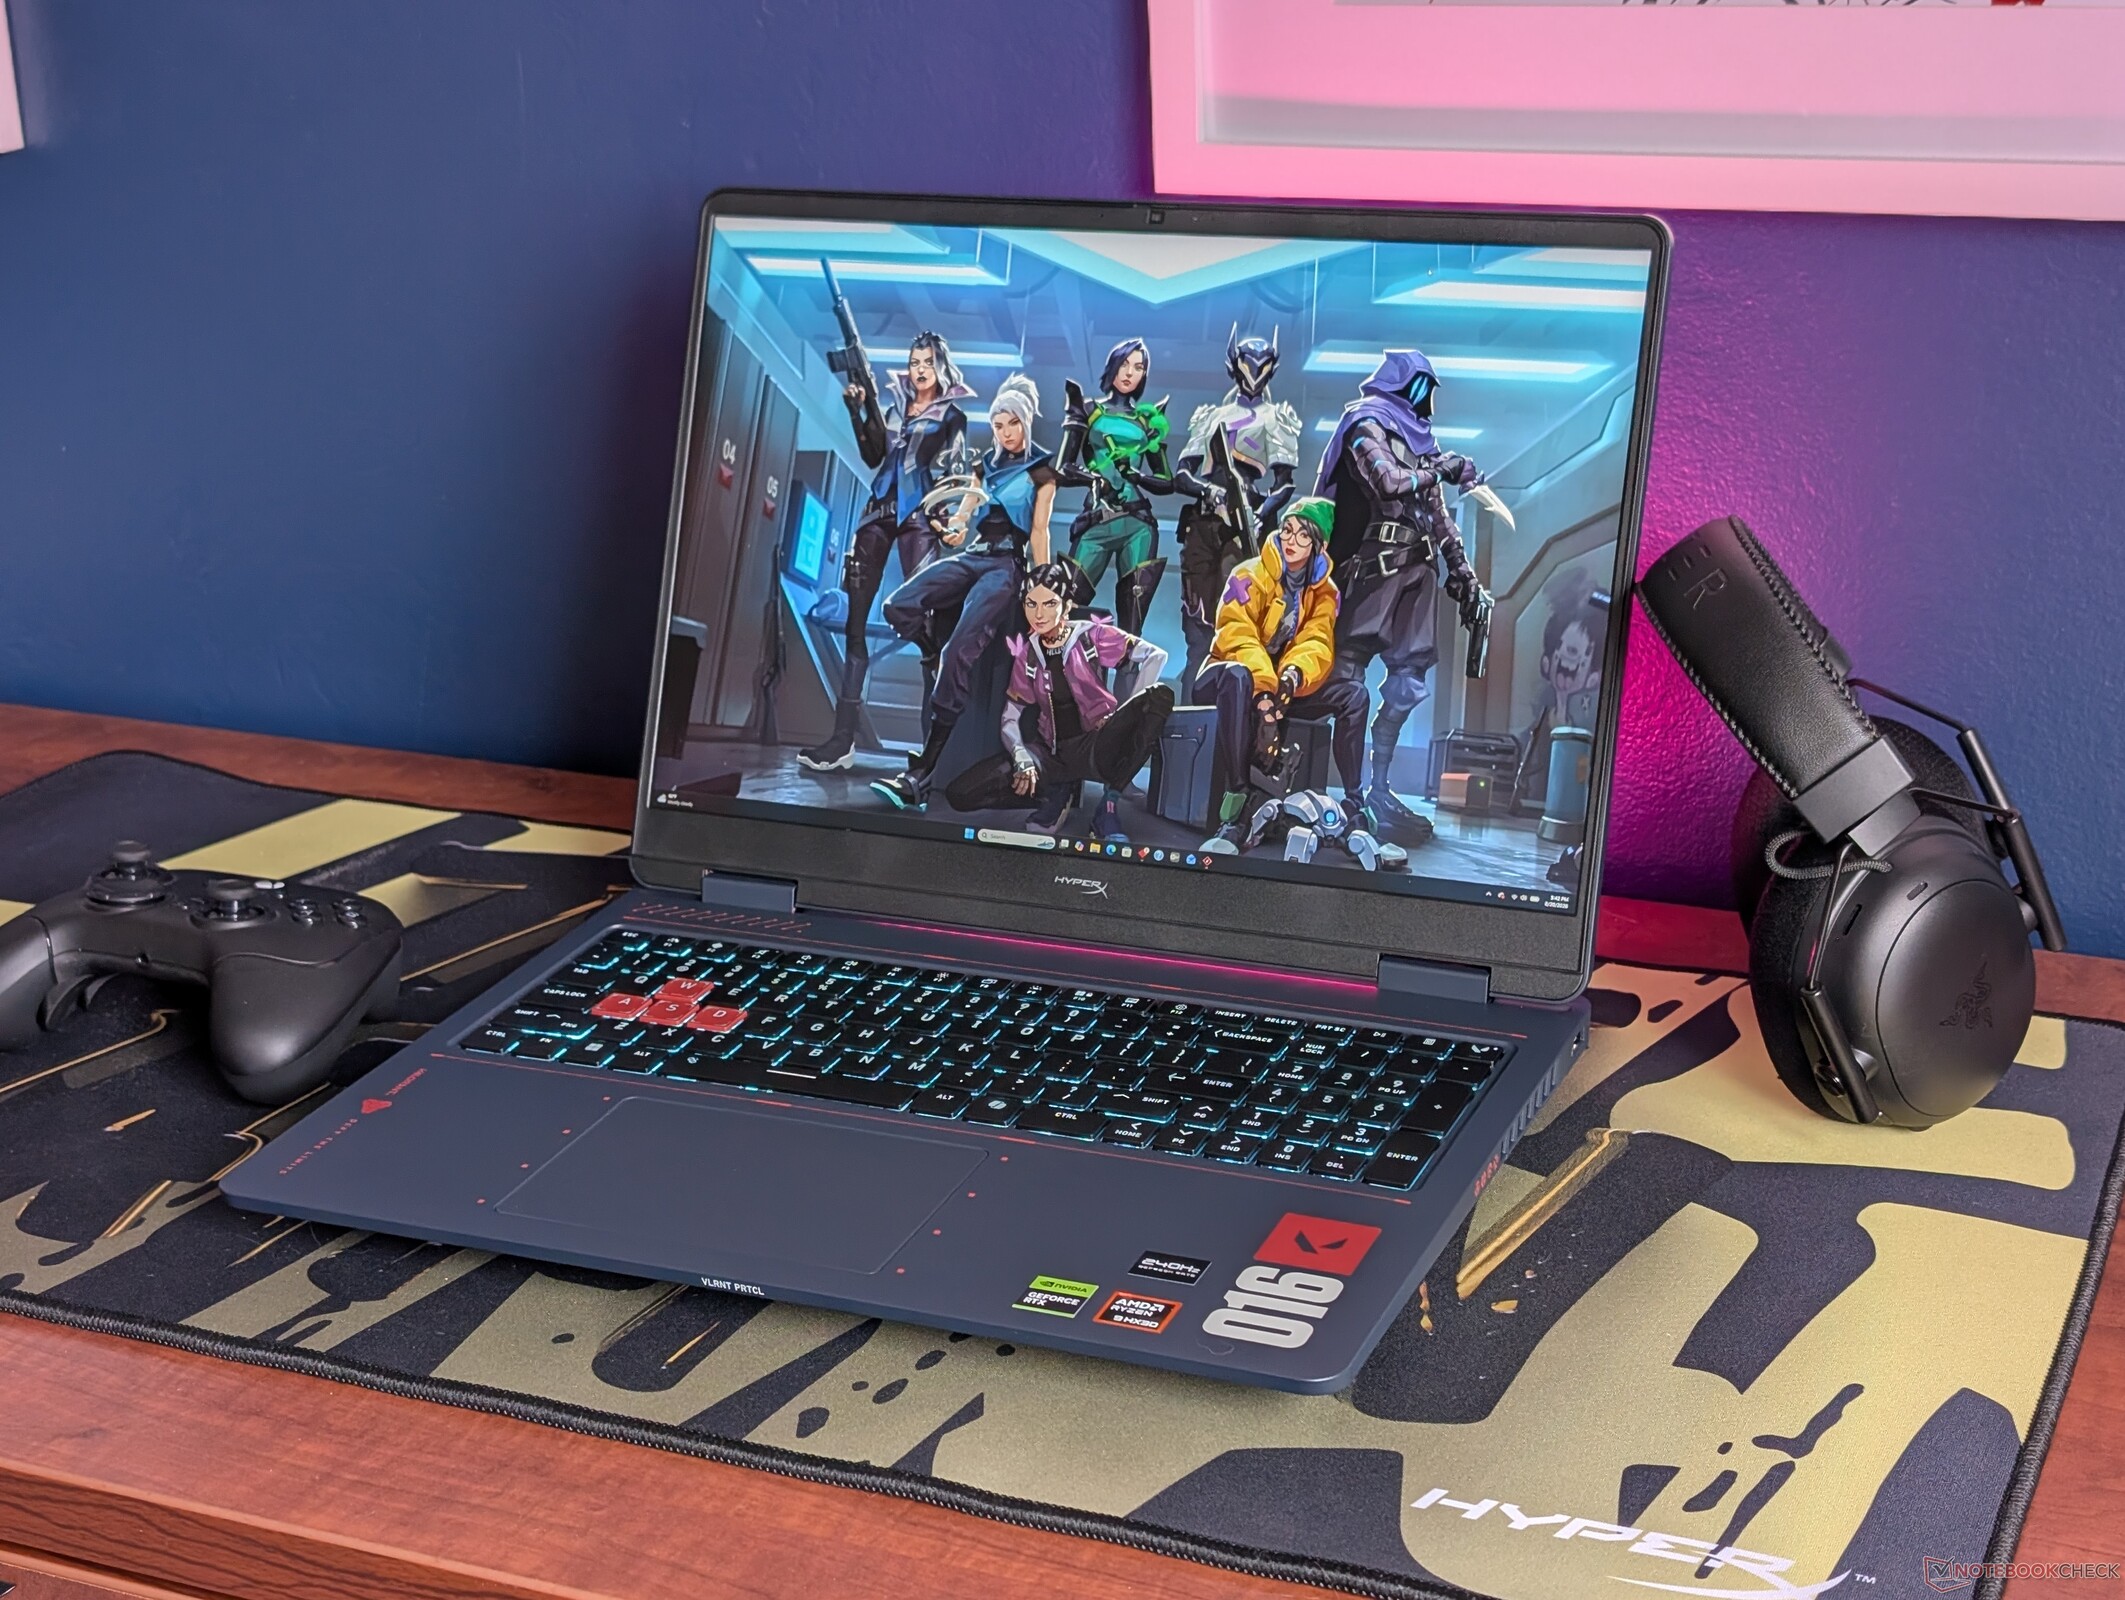
Despite reusing the same chassis design and ports as the 2025 Omen 16, the 2026 model introduces a stronger CPU, faster and higher resolution display, and a cleaner keyboard layout that even occasional gamers can appreciate. Moreover, the Valorant Edition skin is surprisingly attractive on an otherwise midrange model.
Allen Ngo 👁 Published

Verdict — Balanced For FPS

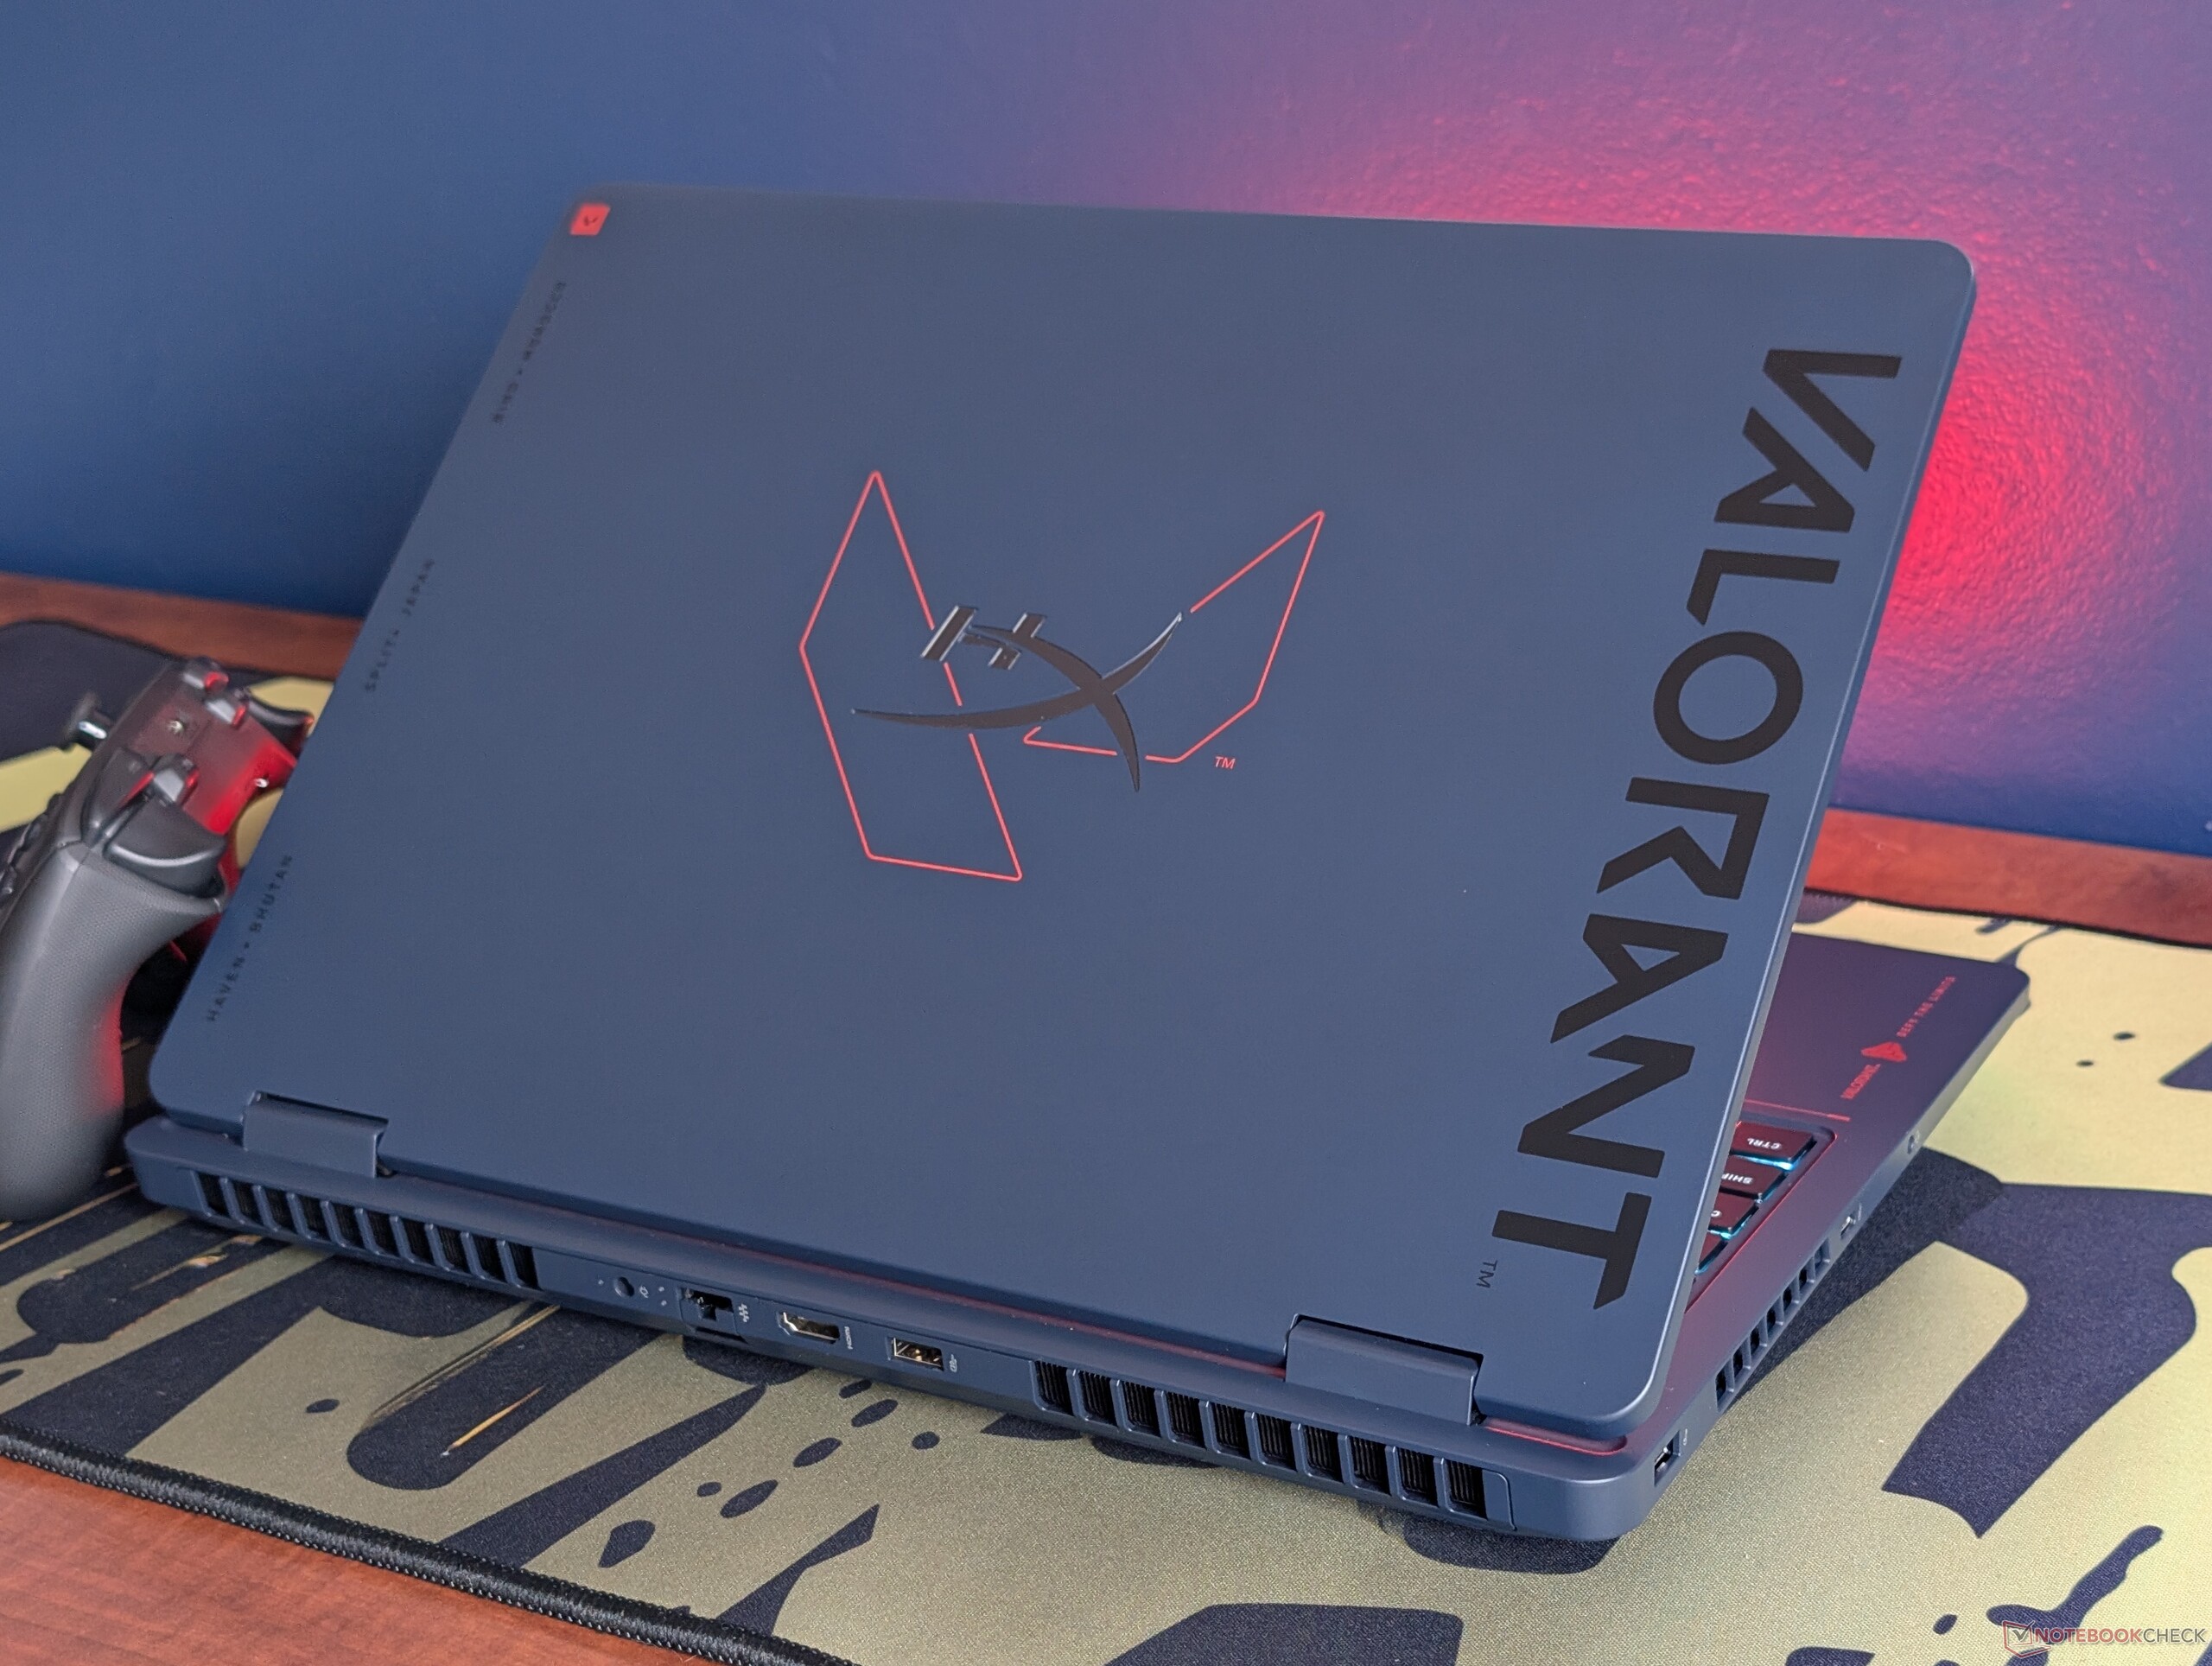
Firstly, we have to commend HP for designing a themed gaming laptop that's actually pleasant to the eyes. More often than not, limited edition skins tend to be overembellished or gaudy and may age poorly as a result. The HyperX Omen 16 Valorant Edition is minimally decorated relying more on simple iconography and sparse colors to represent the game rather than complicated characters or bright graphics. The resulting look is arguably better than the base Omen 16 so long as owners can tolerate the inevitable fingerprint smudges.

Valorant itself also pairs nicely with the given specifications of the machine. Since the game can be quite demanding on the CPU when targeting high frame rates, the Ryzen 9 9955HX3D is one of the best mobile AMD processors for the job. Cut corners to G-Sync and per-key RGB lighting are arguably more acceptable than a cheaper display.

Beyond the skin deep improvements, the 2026 HyperX Omen 16 is nevertheless only a minor update over the 2025 Omen 16 as the underlying skeleton and motherboard are mostly unchanged. Instead, its the faster Zen 5 CPU, improved IPS display, and modified keyboard that help to distinguish the 2026 model from the previous year. Keep in mind that many of these changes entail higher power consumption levels than before for an overall shorter battery life. Headphones are also recommended as fan noise can be an issue if not gaming on Balanced mode.

Pros

+ easy serviceablity; supports 2x SODIMM + 2x M.2 SSDs
+ quality 240 Hz QHD IPS display with full sRGB colors
+ comfortable keys with integrated numpad
+ very fast raw CPU performance
+ visually pleasing Valorant skin

Cons

- short battery life; high power consumption
- very loud fans on Unleashed mode
- speakers could be louder
- tri-zone key lighting only
- fingerprint magnet
- no G-Sync

Price and Availability

HP is currently shipping the HyperX Omen 16 Valorant Edition for $2250.

Amazon Logo
$1,590.89
HP OMEN MAX 16-ak0047nr 16" WQXGA 240Hz Gaming Laptop, AMD Ryzen AI 7 H 3

The 2026 HyperX Omen 16 is a midrange gaming laptop to supplant last year's 2025 Omen 16. HP has been slowly rebranding many of its Omen models into HyperX as revealed during CES 2026 and so the new HyperX Omen 16 is one of the first to sport the updated name.

Our test unit is the Valorant Edition of the HyperX Omen 16 with themed red markings. beyond the superficial differences, however, the chassis is otherwise identical to the 2025 Omen 16. The sole Valorant Edition configuration comes equipped with the relatively uncommon AMD Ryzen 9 9955HX3D CPU, 115 W GeForce RTX 5070 GPU, and 240 Hz 1600p IPS display for approximately $2250.

Competitors in this space include other mainstream 16-inch gaming laptops like the MSI Crosshair A16, Lenovo Legion Pro 5 16, or the Alienware 16X Aurora.

More HP reviews:

Specifications

HP HyperX Omen 16 16-ap1931nr
Processor
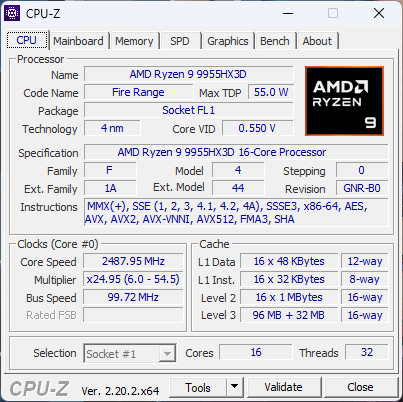
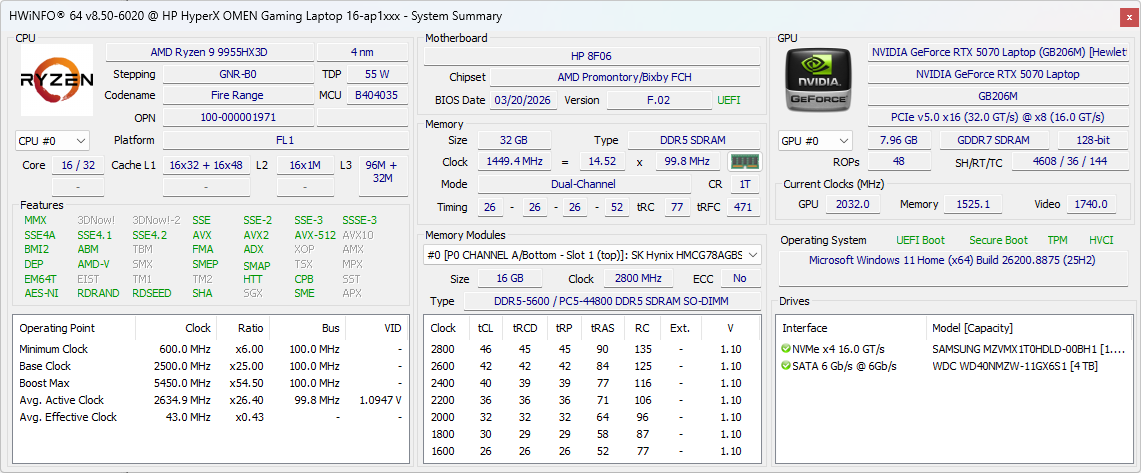
AMD Ryzen 9 9955HX3D 16c/32t, 16 x 5.4 GHz AMD Zen 5, 117 W PL2 / Short Burst, 105 W PL1 / Sustained, Fire Range-HX (Zen 5)
Graphics adapter
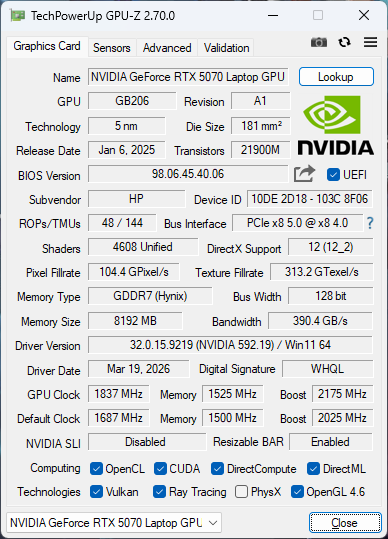
NVIDIA GeForce RTX 5070 Laptop - 8 GB VRAM, Core: 2175 MHz, RAM: 1525 MHz, 115 W TDP, GDDR7, 592.19, Advanced Optimus
Memory
32 GB 
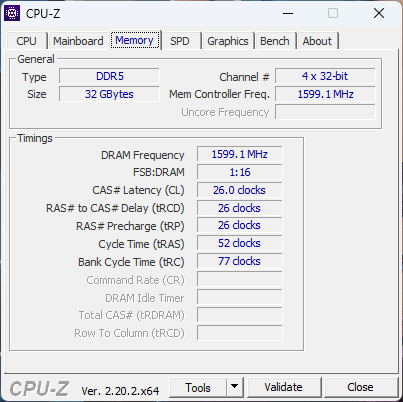
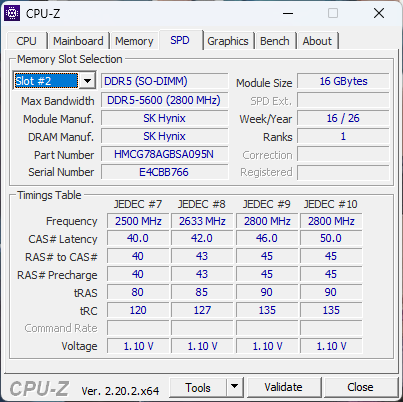
, SK Hynix, DDR5-5600, Dual-Channel, 2x SODIMM
Display
16.00 inch 16:10, 2560 x 1600 pixel 189 PPI, BOE0CD1, IPS, glossy: no, 240 Hz
Mainboard
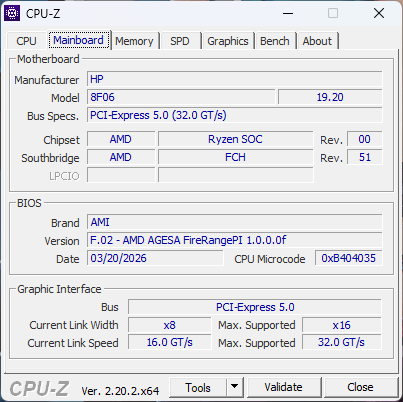
AMD Promontory/Bixby FCH
Soundcard
AMD Zen - Audio Processor - HD Audio Controller
Connections
2 USB 3.0 / 3.1 Gen1, 2 USB 3.1 Gen2, USB-C Power Delivery (PD), 1 HDMI, 1 DisplayPort, Audio Connections: 3.5 mm combo
Networking
Realtek RTL8168/8111 Gigabit-LAN (10/100/1000MBit/s), Mediatek Wi-Fi 7 MT7925 Wireless LAN Card (a/b/g/ac = Wi-Fi 5/ax = Wi-Fi 6/ Wi-Fi 6E 6 GHz be = Wi-Fi 7), Bluetooth 6.0
Size
height x width x depth (in mm): 30 x 357 x 269 ( = 1.18 x 14.06 x 10.59 in)
Battery
83 Wh Lithium-Polymer, 8-cell
Operating System
Microsoft Windows 11 Home
Camera
Webcam: 1080p30
Primary Camera: 2 MPix
Additional features
Speakers: Stereo, Keyboard: Chiclet, Keyboard Light: yes, HP Smart, Omen Gaming Hub, 12 Months Warranty
Weight
2.439 kg ( = 86.03 oz / 5.38 pounds), Power Supply: 866 g ( = 30.55 oz / 1.91 pounds)
Price
2250 USD
Amazon
Note: The manufacturer may use components from different suppliers including display panels, drives or memory sticks with similar specifications.


Case

The chassis is identical to the 2025 model but with two important changes. Firstly, the keyboard has been revised with larger arrow keys and a cleaner layout. Secondly, the Omen logos on the inner bezel and outer lid have been replaced with HyperX. The base design is otherwise unchanged down to even the ports.
Size Comparison

364.38 mm / 14.3 in 268.06 mm / 10.6 in 25.95 mm / 1.022 in 2.3 kg5.03 lbs363 mm / 14.3 in 269.7 mm / 10.6 in 25.55 mm / 1.006 in 2.3 kg4.98 lbs357 mm / 14.1 in 269 mm / 10.6 in 30 mm / 1.181 in 2.4 kg5.38 lbs357.5 mm / 14.1 in 269 mm / 10.6 in 23.7 mm / 0.933 in 2.4 kg5.28 lbs356.98 mm / 14.1 in 265.43 mm / 10.4 in 23.4 mm / 0.921 in 2.6 kg5.71 lbs354 mm / 13.9 in 269 mm / 10.6 in 25.7 mm / 1.012 in 2.2 kg4.88 lbs297 mm / 11.7 in 210 mm / 8.27 in 1 mm / 0.03937 in 5.7 g0.01257 lbs

Connectivity

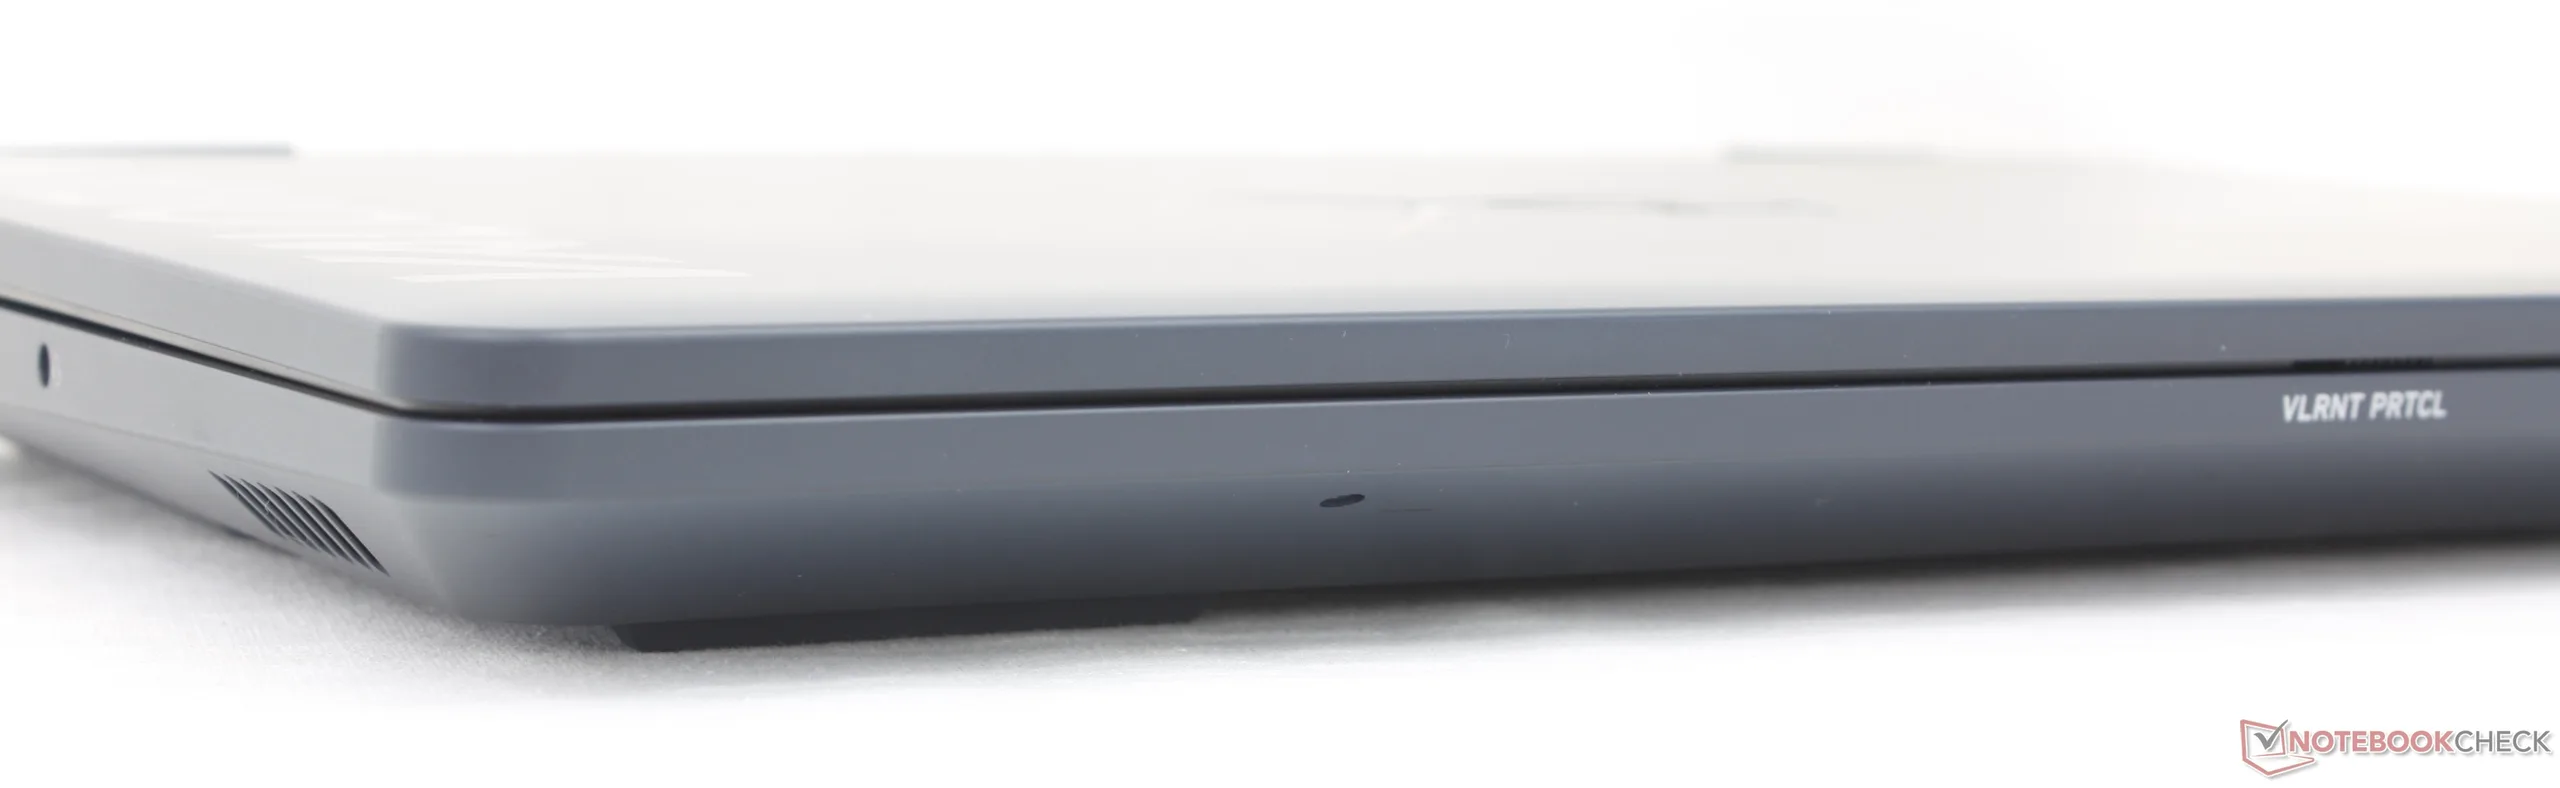
Front: No ports
Front: No ports
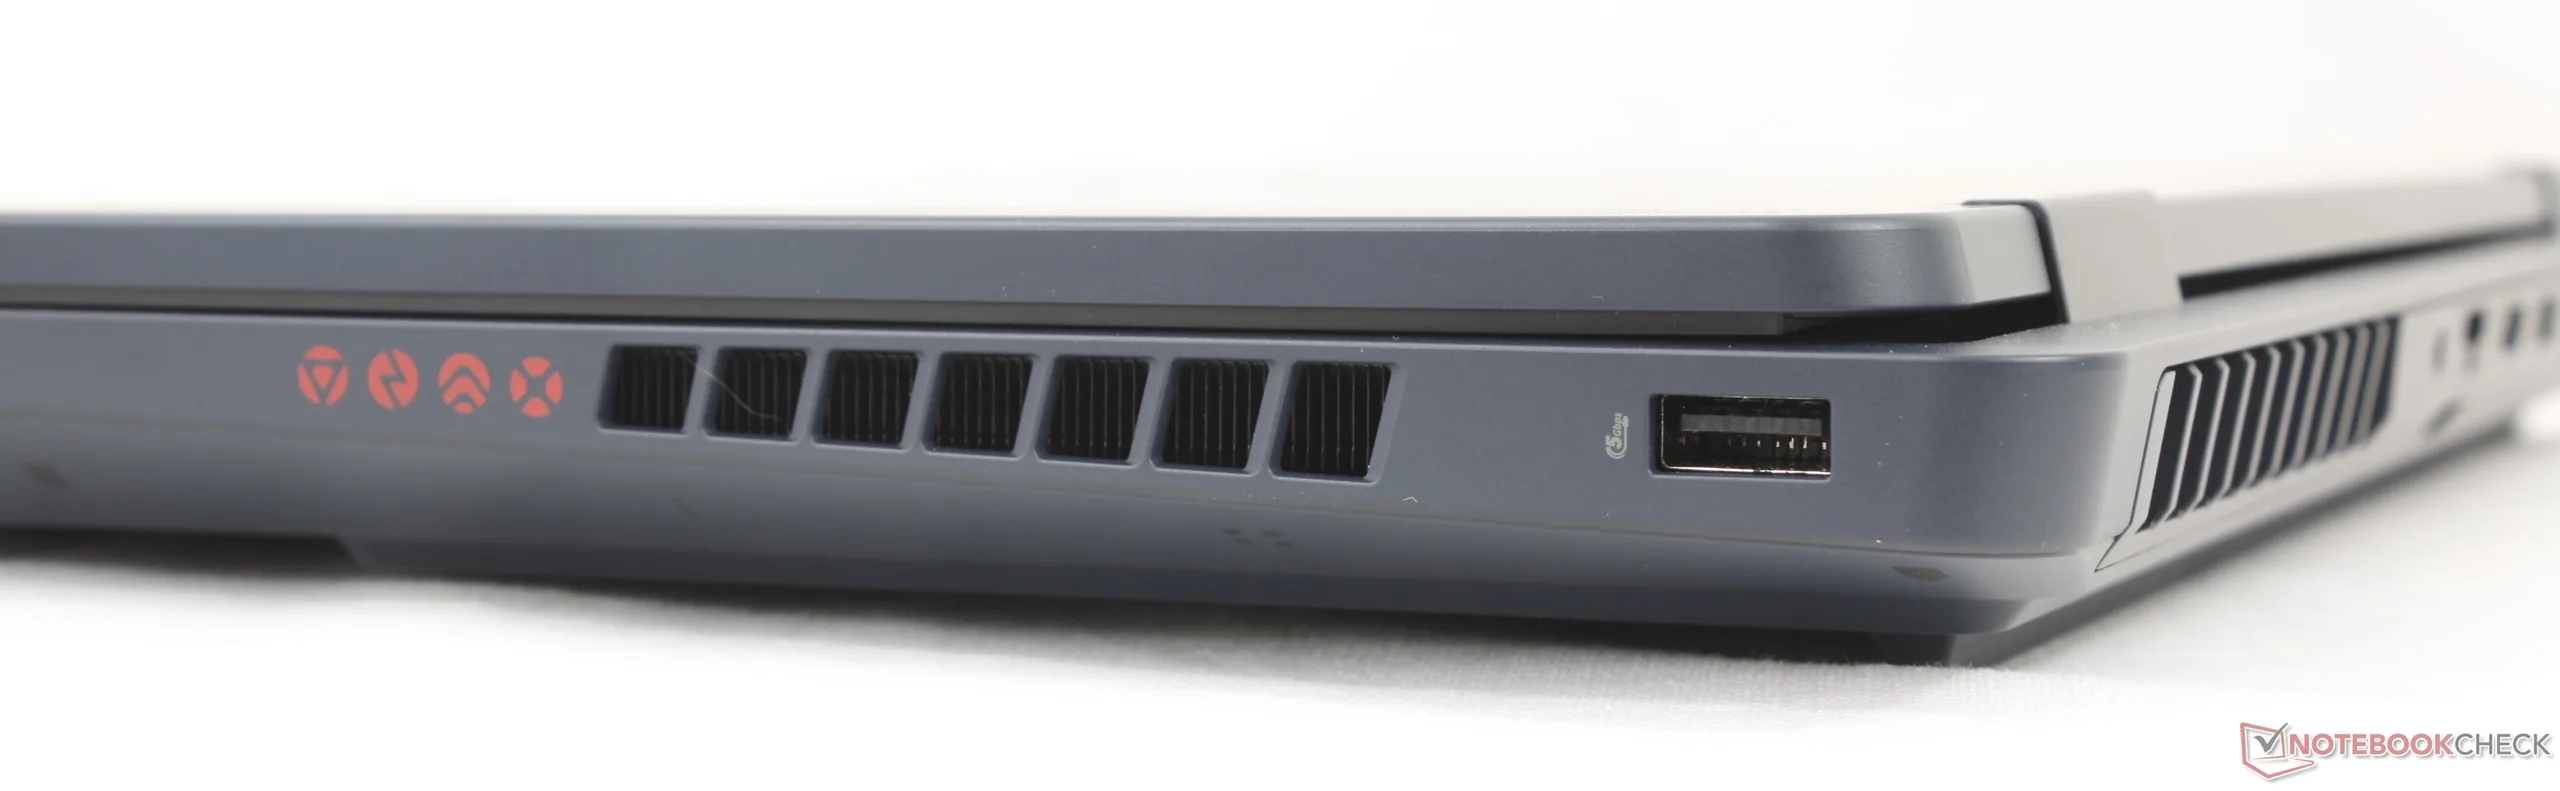
Right: USB-A (5 Gbitps)
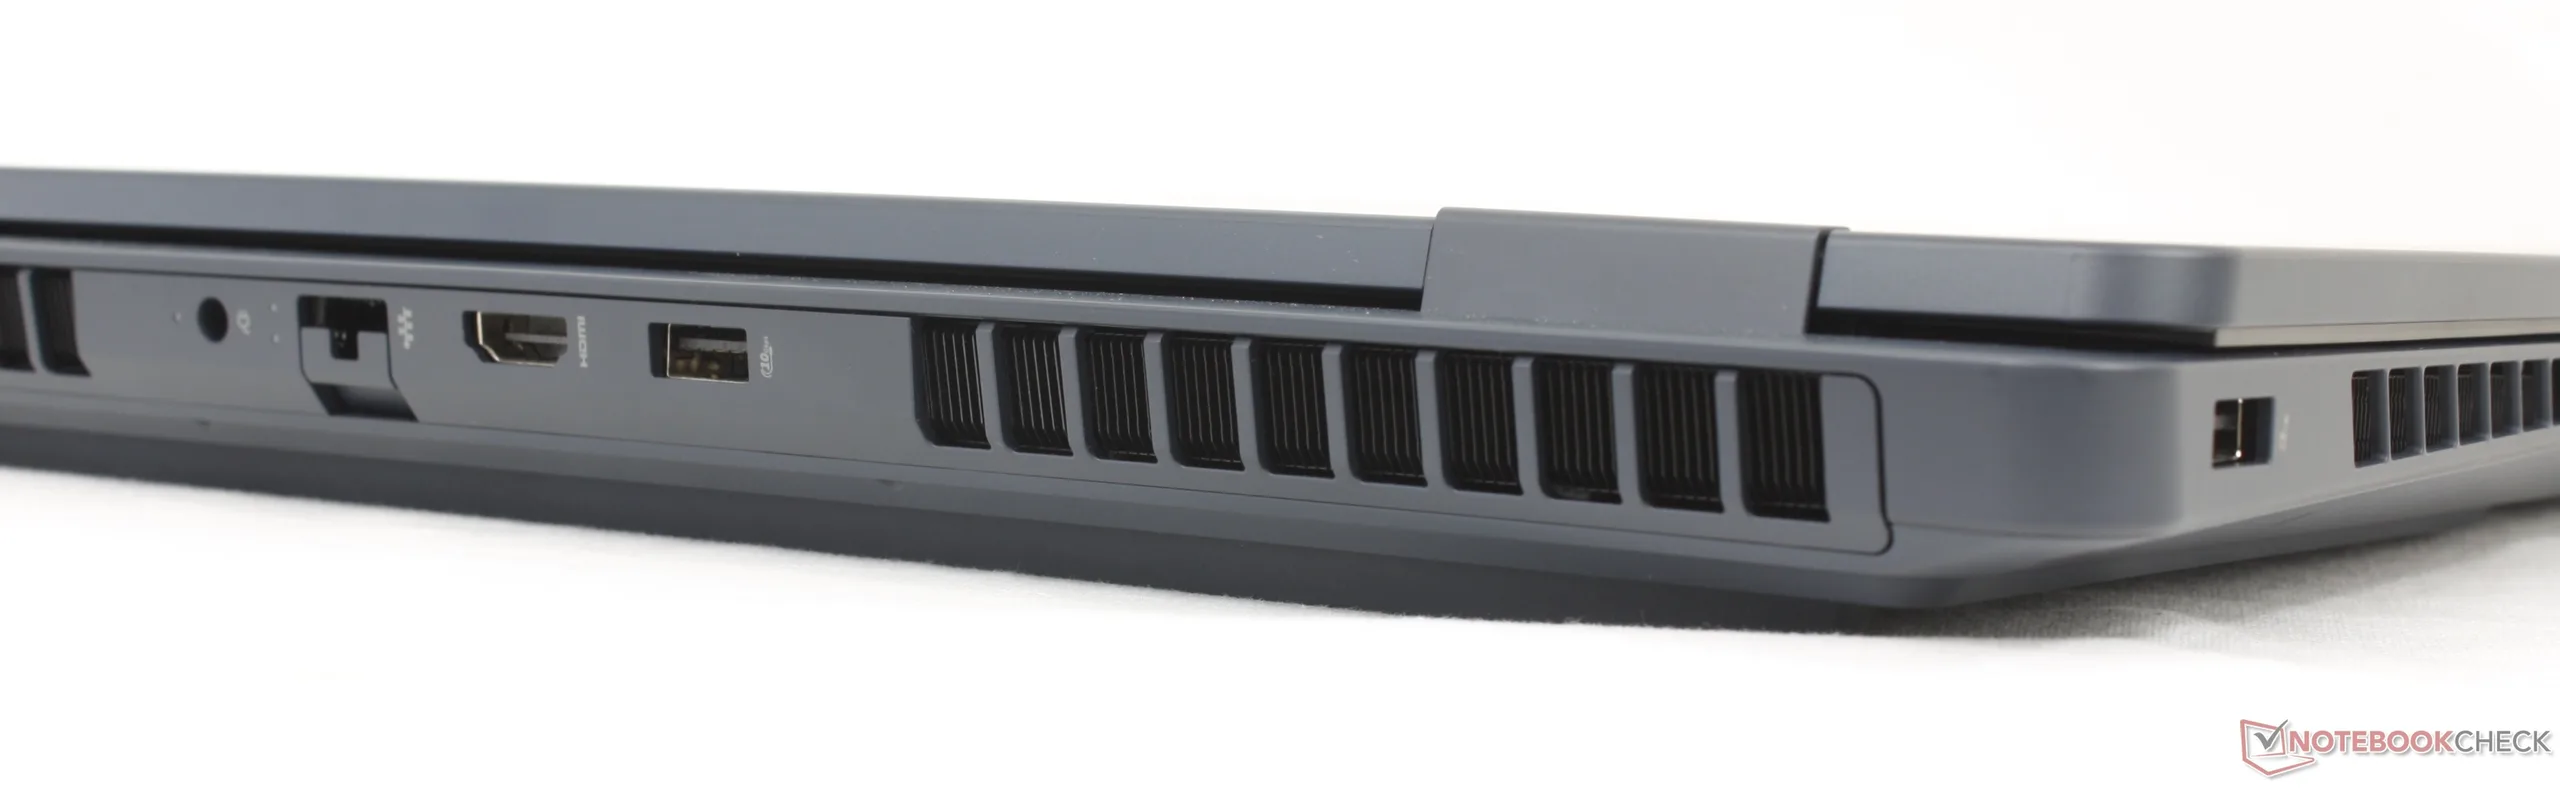
Rear: AC adapter, RJ-45 (1 Gbps), HDMI 2.1, USB-A (10 Gbitps)
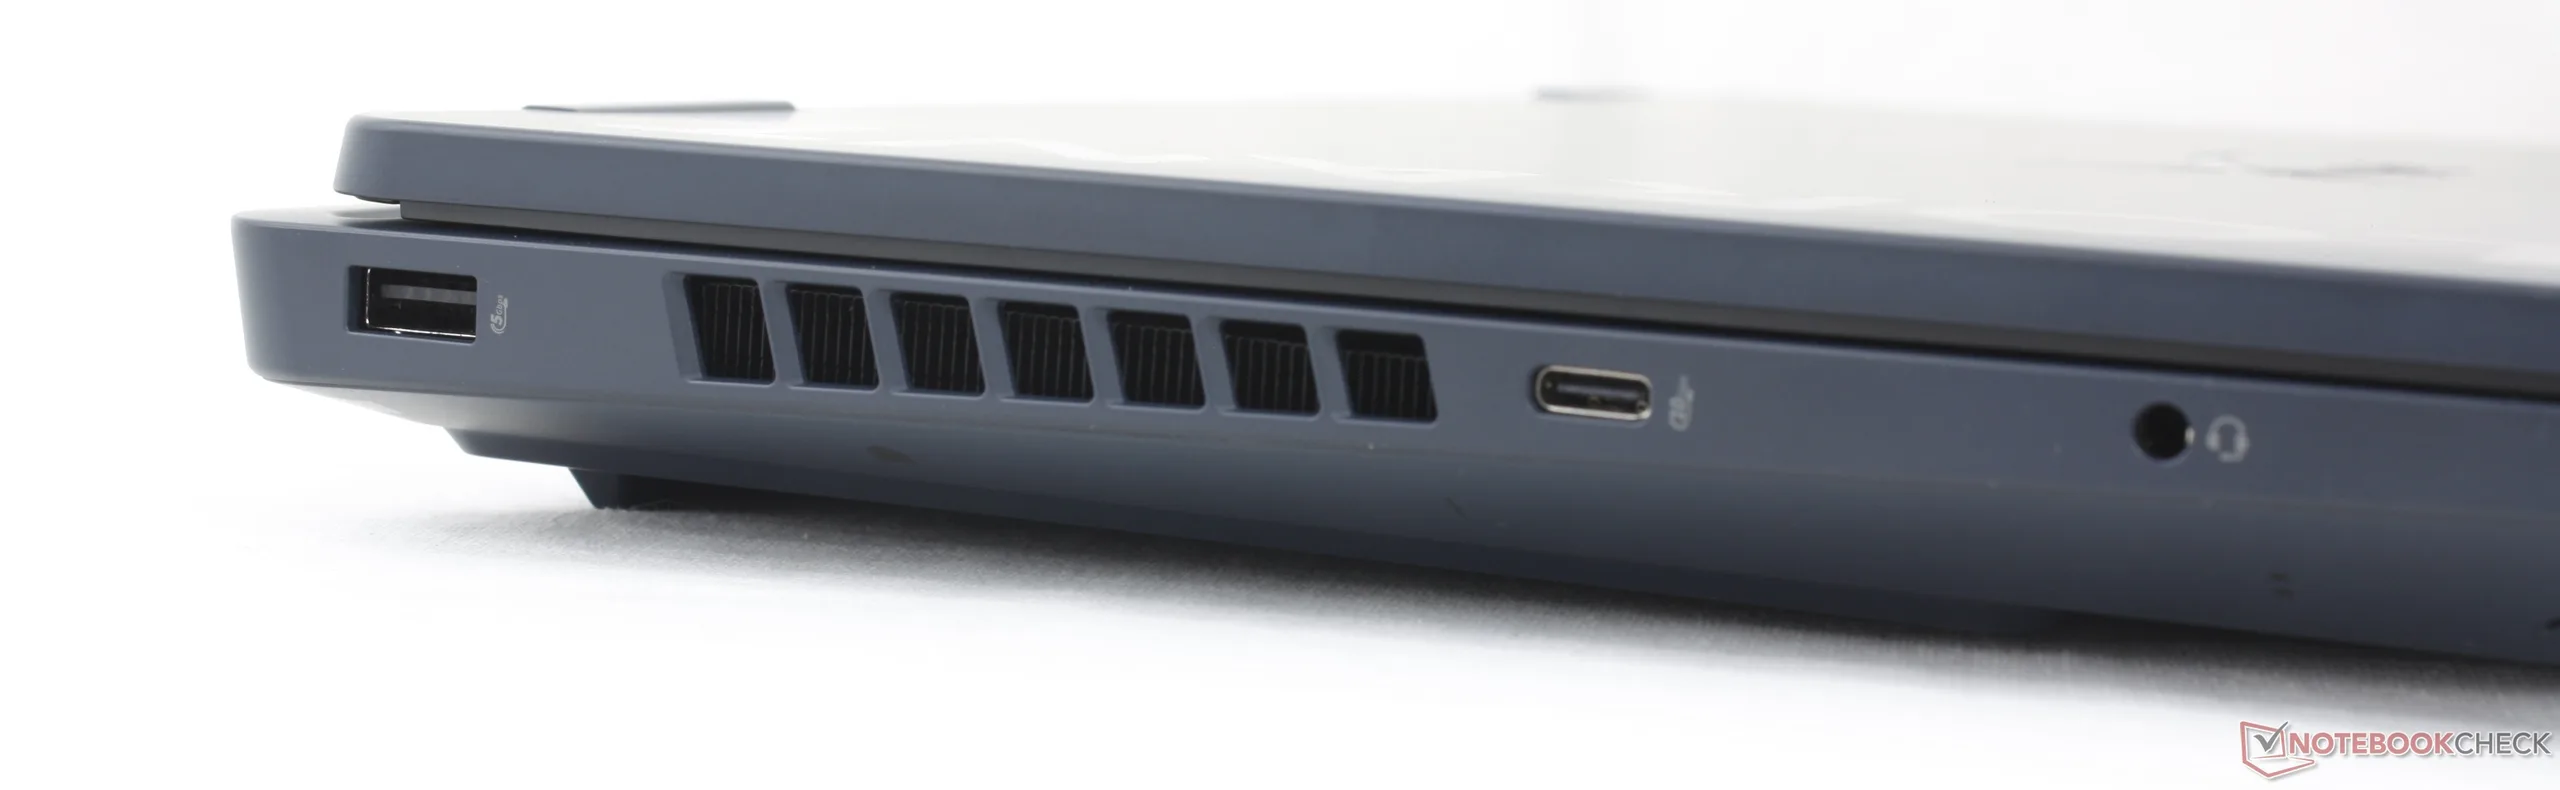
Left: USB-A (5 Gbitps), USB-C (10 Gbitps), 3.5 mm headset

Communication

Networking
iperf3 receive AXE11000 6GHz
HP HyperX Omen 16 16-ap1931nr
Mediatek Wi-Fi 7 MT7925 Wireless LAN Card
1744 (1715min - 1767max) MBit/s
MSI Crosshair A16 HX E8WGK
MediaTek Wi-Fi 6E MT7922 160MHz Wireless LAN Card
1693 (1555min - 1755max) MBit/s -3%
Alienware 16X Aurora Core Ultra 9 290HX Plus
Mediatek Wi-Fi 7 MT7925 Wireless LAN Card
1506 (1352min - 1594max) MBit/s -14%
iperf3 transmit AXE11000 6GHz
Lenovo Legion Pro 5 16IAX10, RTX 5070
Mediatek Wi-Fi 7 MT7925 Wireless LAN Card
1868 (897min - 1974max) MBit/s +18%
MSI Crosshair A16 HX E8WGK
MediaTek Wi-Fi 6E MT7922 160MHz Wireless LAN Card
1781 (1713min - 1841max) MBit/s +13%
Alienware 16X Aurora Core Ultra 9 290HX Plus
Mediatek Wi-Fi 7 MT7925 Wireless LAN Card
1611 (1515min - 1687max) MBit/s +2%
HP HyperX Omen 16 16-ap1931nr
Mediatek Wi-Fi 7 MT7925 Wireless LAN Card
1581 (1434min - 1686max) MBit/s
010020030040050060070080090010001100120013001400150016001700Tooltip
HP HyperX Omen 16 16-ap1931nr; iperf3 receive AXE11000 6GHz; iperf 3.1.3: Ø1744 (1715-1767) MBit/s
HP HyperX Omen 16 16-ap1931nr; iperf3 receive AXE11000; iperf 3.1.3: Ø1436 (1250-1633) MBit/s

Webcam

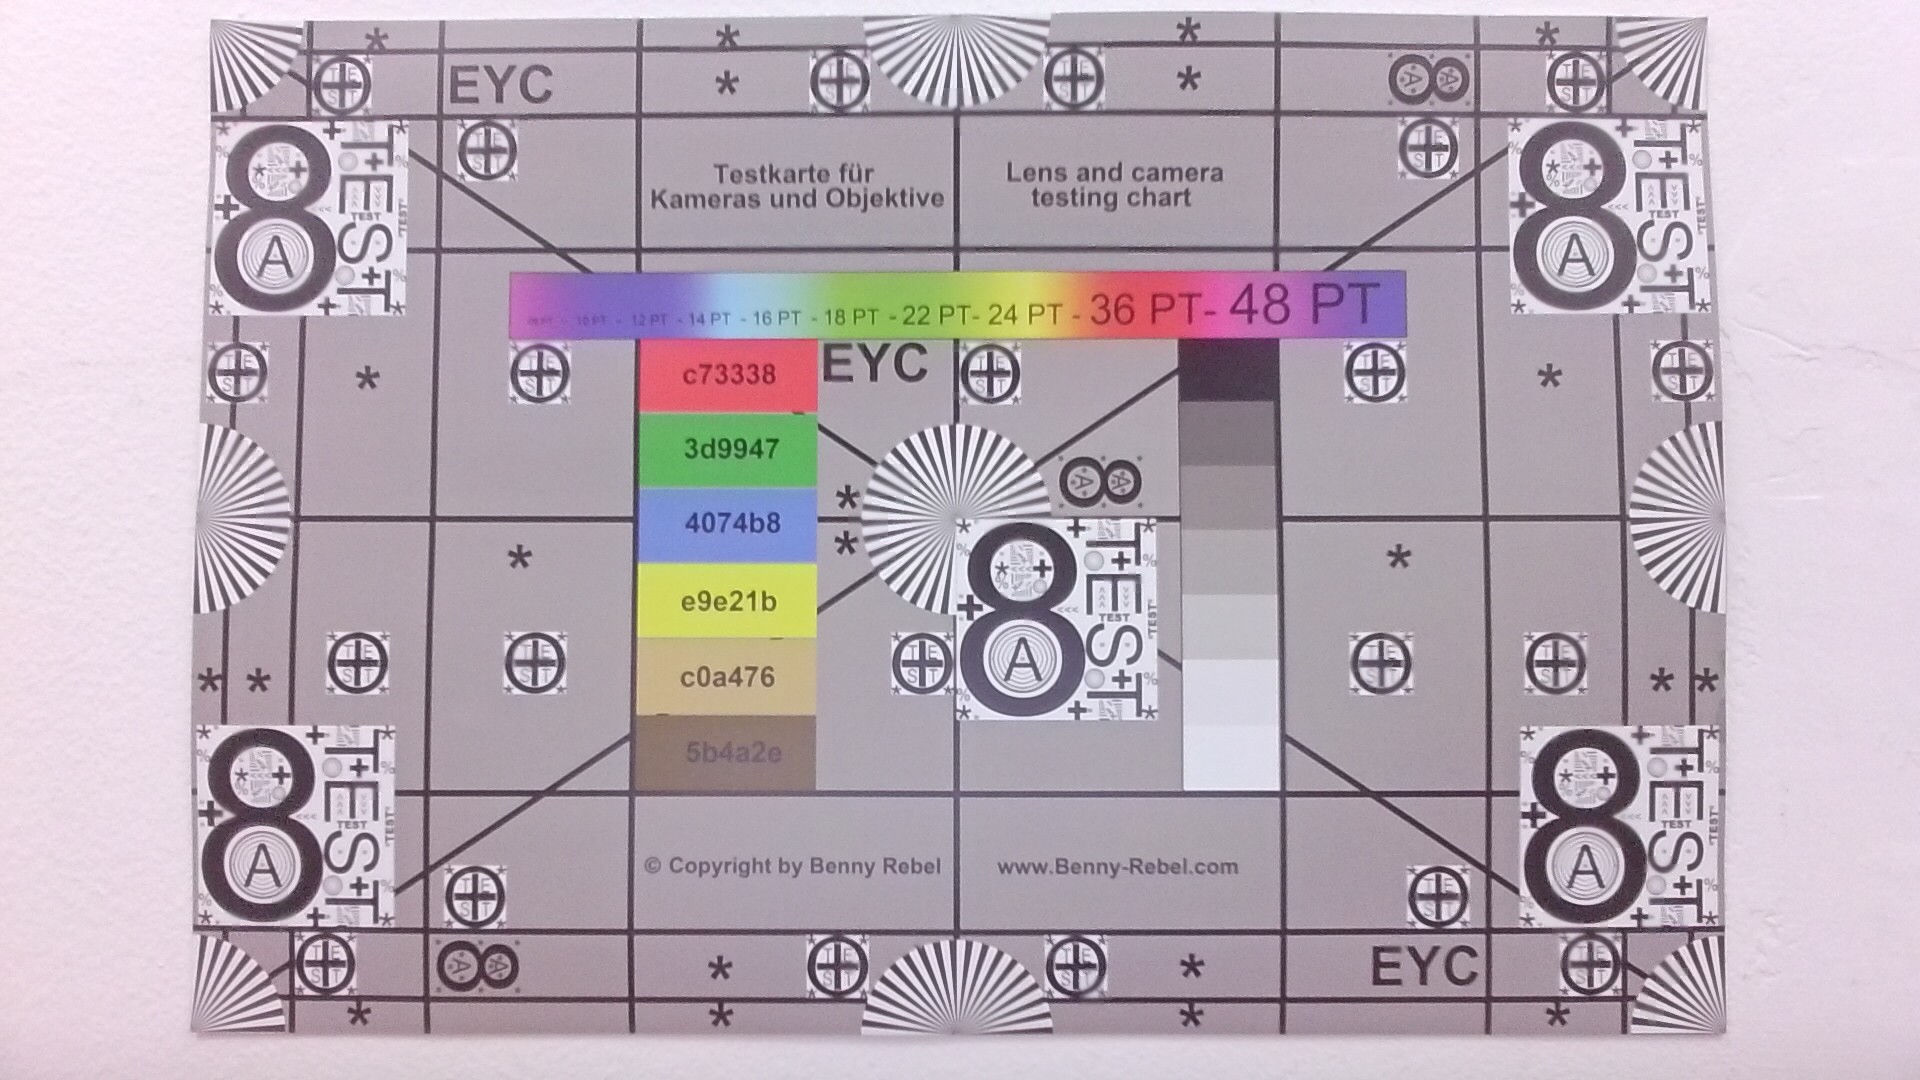
The 1080p camera includes a built-in privacy shutter but no IR.

ColorChecker
9.1 ∆E
12.1 ∆E
11.1 ∆E
16.4 ∆E
15.3 ∆E
16.6 ∆E
12.8 ∆E
13.2 ∆E
13.2 ∆E
11.2 ∆E
15.2 ∆E
22.5 ∆E
11.7 ∆E
17.8 ∆E
18.4 ∆E
15.5 ∆E
18.2 ∆E
24.1 ∆E
1.6 ∆E
10.2 ∆E
19.2 ∆E
20.7 ∆E
19.3 ∆E
10.8 ∆E
ColorChecker HP HyperX Omen 16 16-ap1931nr: 14.84 ∆E min: 1.57 - max: 24.1 ∆E

Maintenance

Much like with the minor external updates, the 2026 Omen 16 is internally quite similar to last year's model with similar 2x M.2 SSD and 2x SODIMM upgrade features.
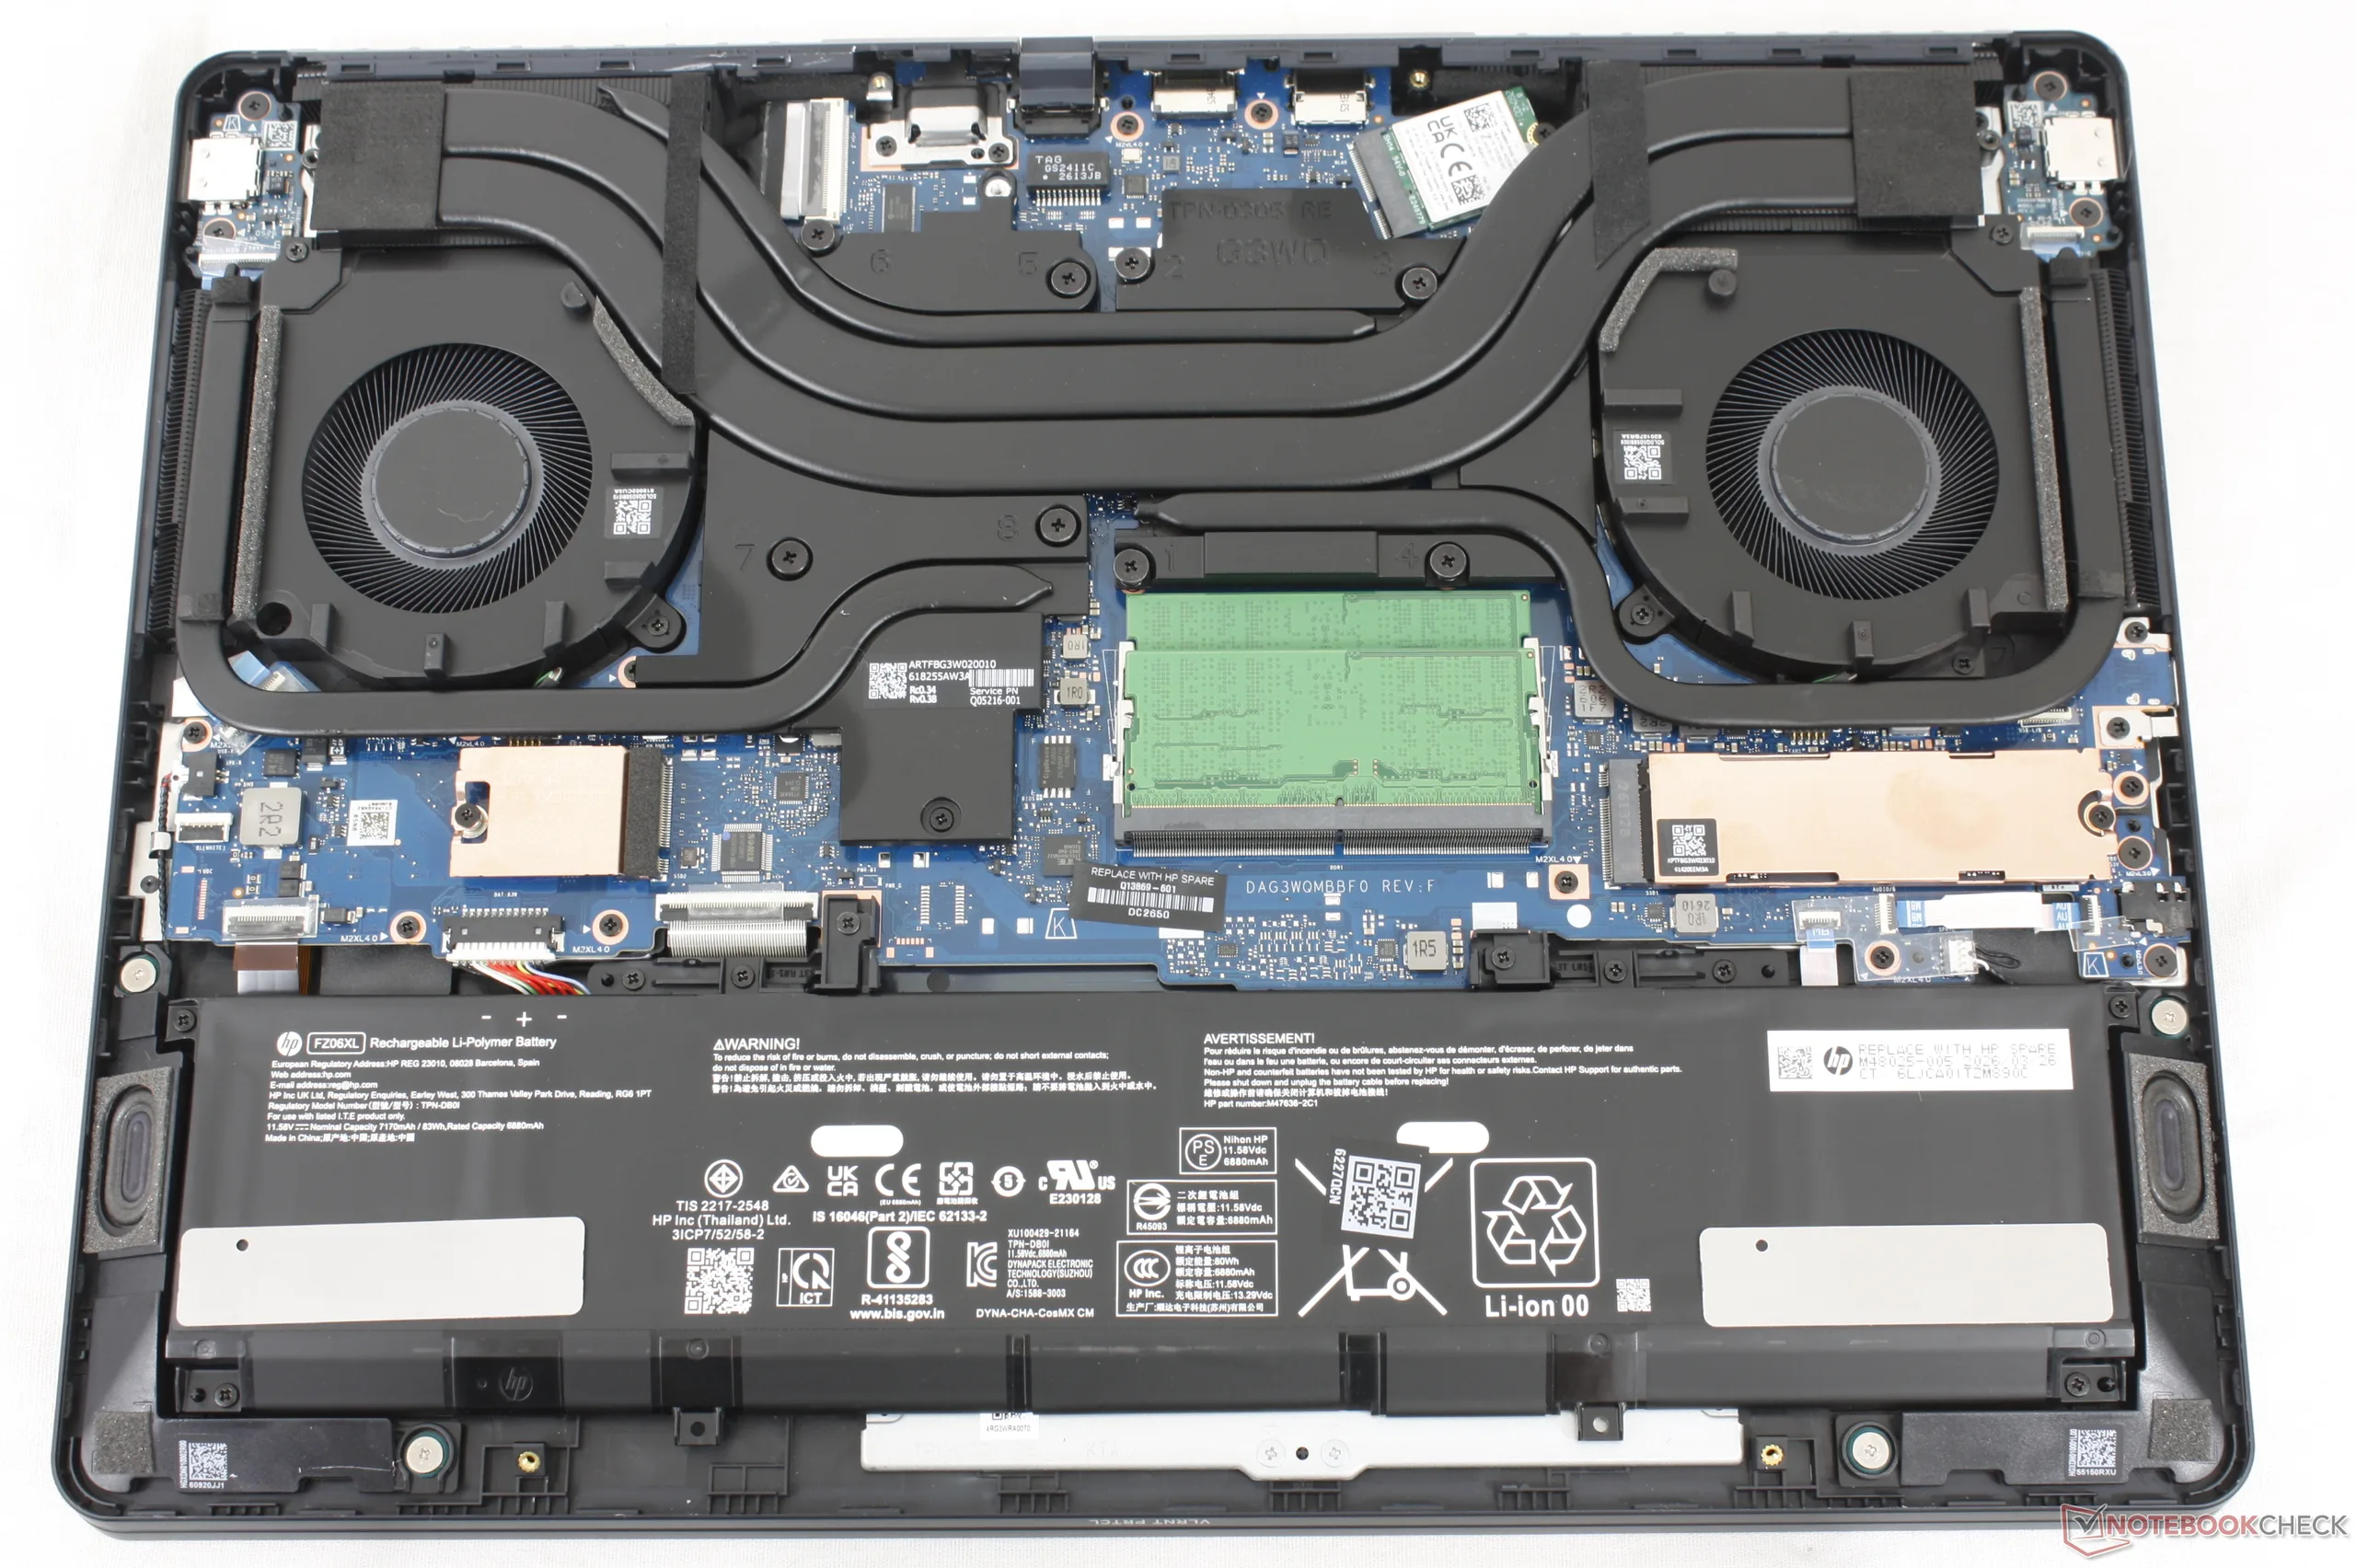
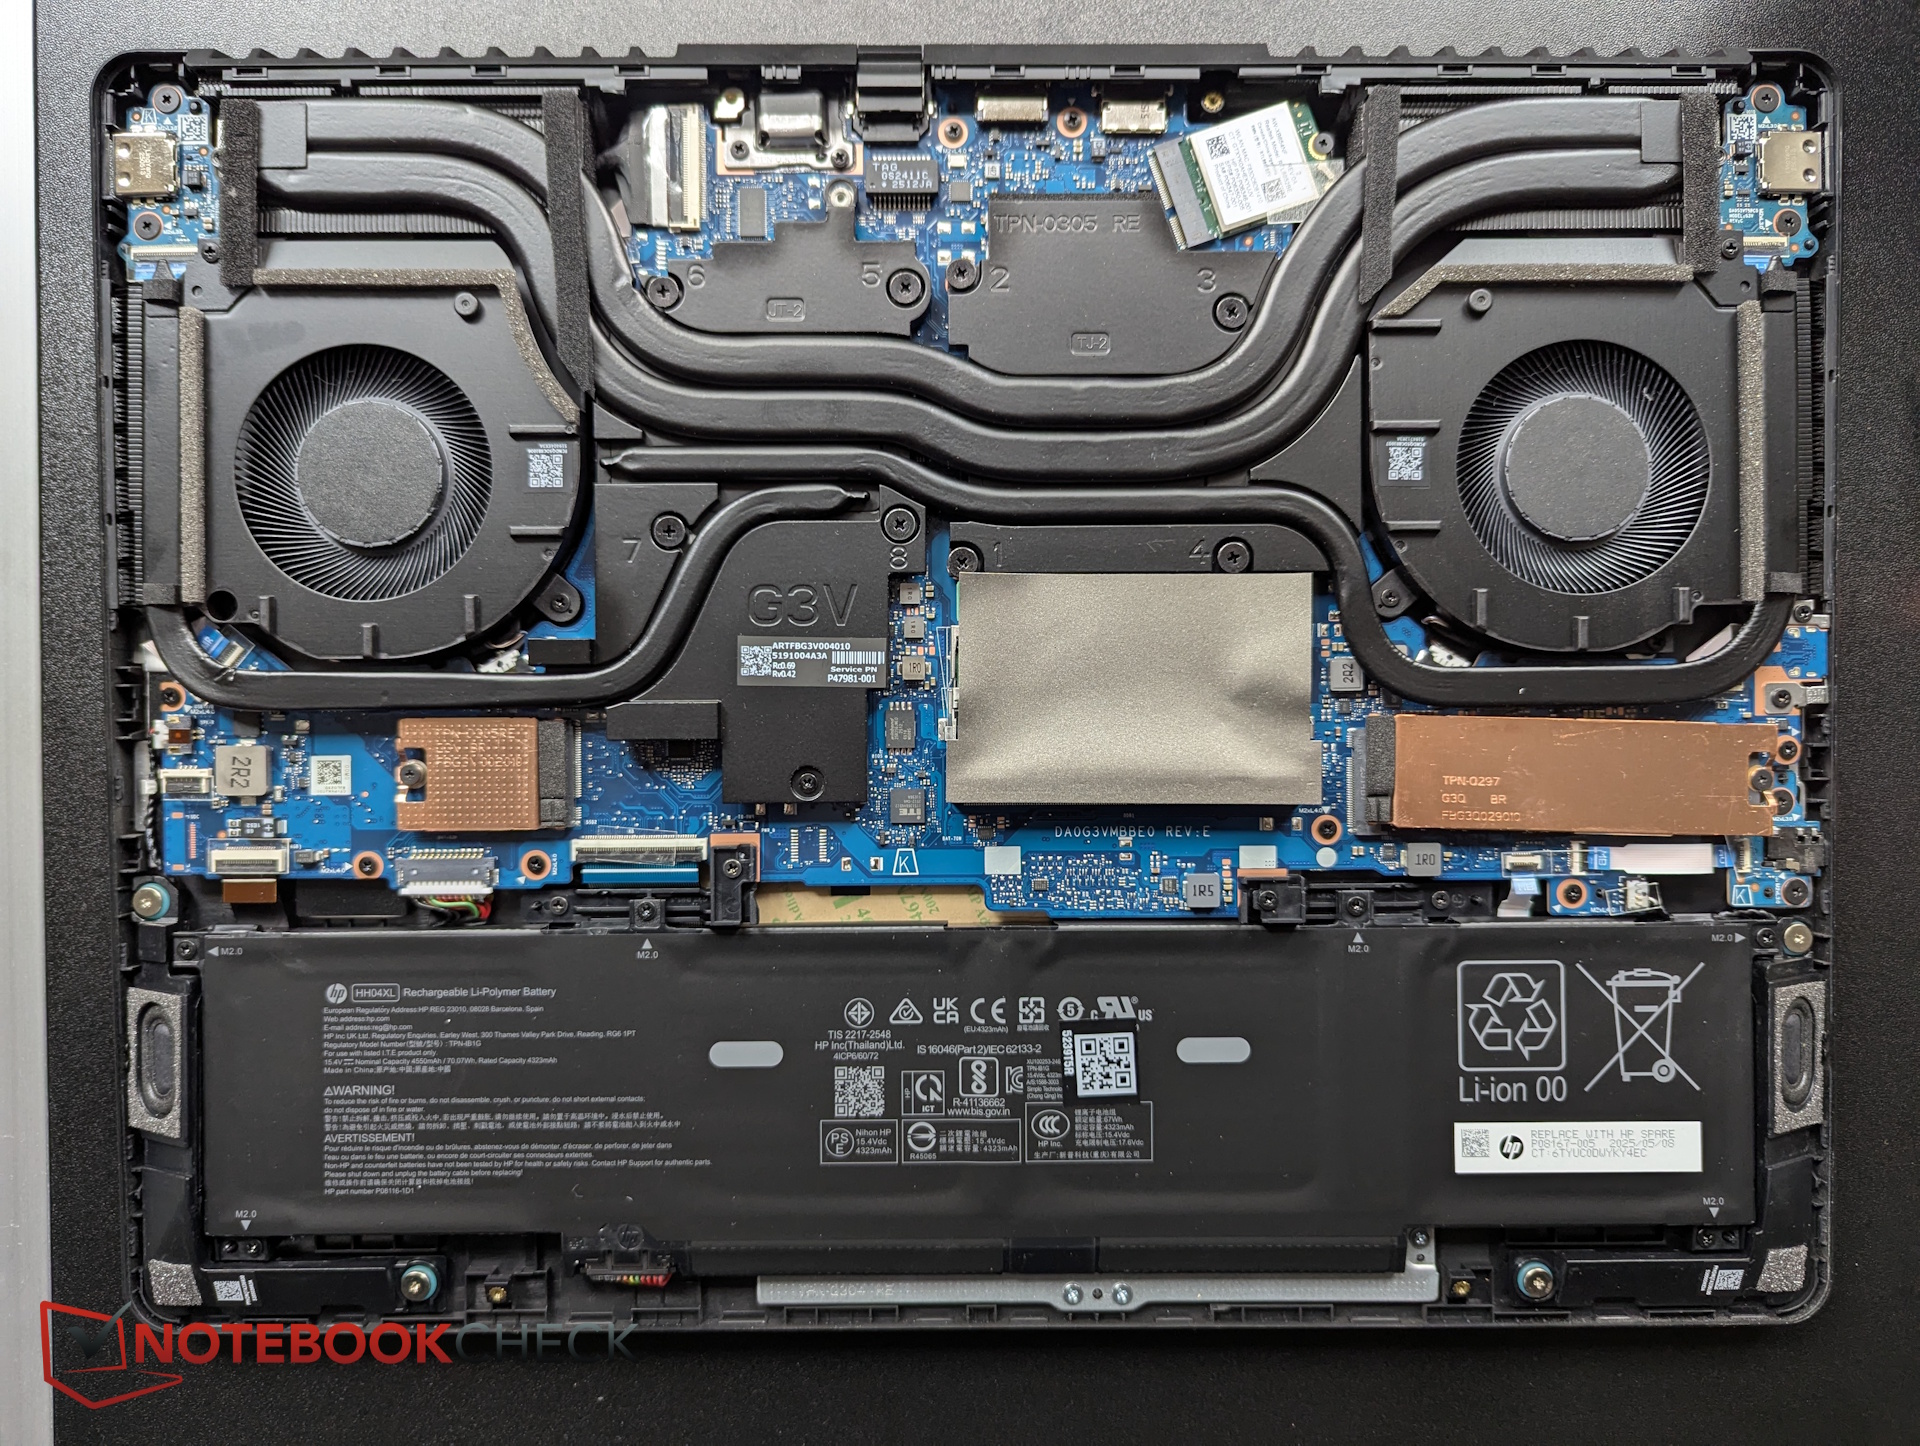
2026 Omen 16
2026 Omen 16
2025 Omen 16 for comparison

Sustainability

The keyboard keycaps consist of post-consumer recycled plastics with no mention of other parts or recycled amounts. The packaging uses a bit of plastic for the AC adapter wrapping.

Accessories And Warranty

There are no extras in the box beyond the AC adapter and paperwork. A one-year limited manufacturer warranty applies if purchased in the US.

Input Devices

Keyboard has been revamped from the 2025 Omen 16 to include larger arrow keys and a cleaner font layout. The clickpad, however, remains the same at 12.5 x 8 cm.
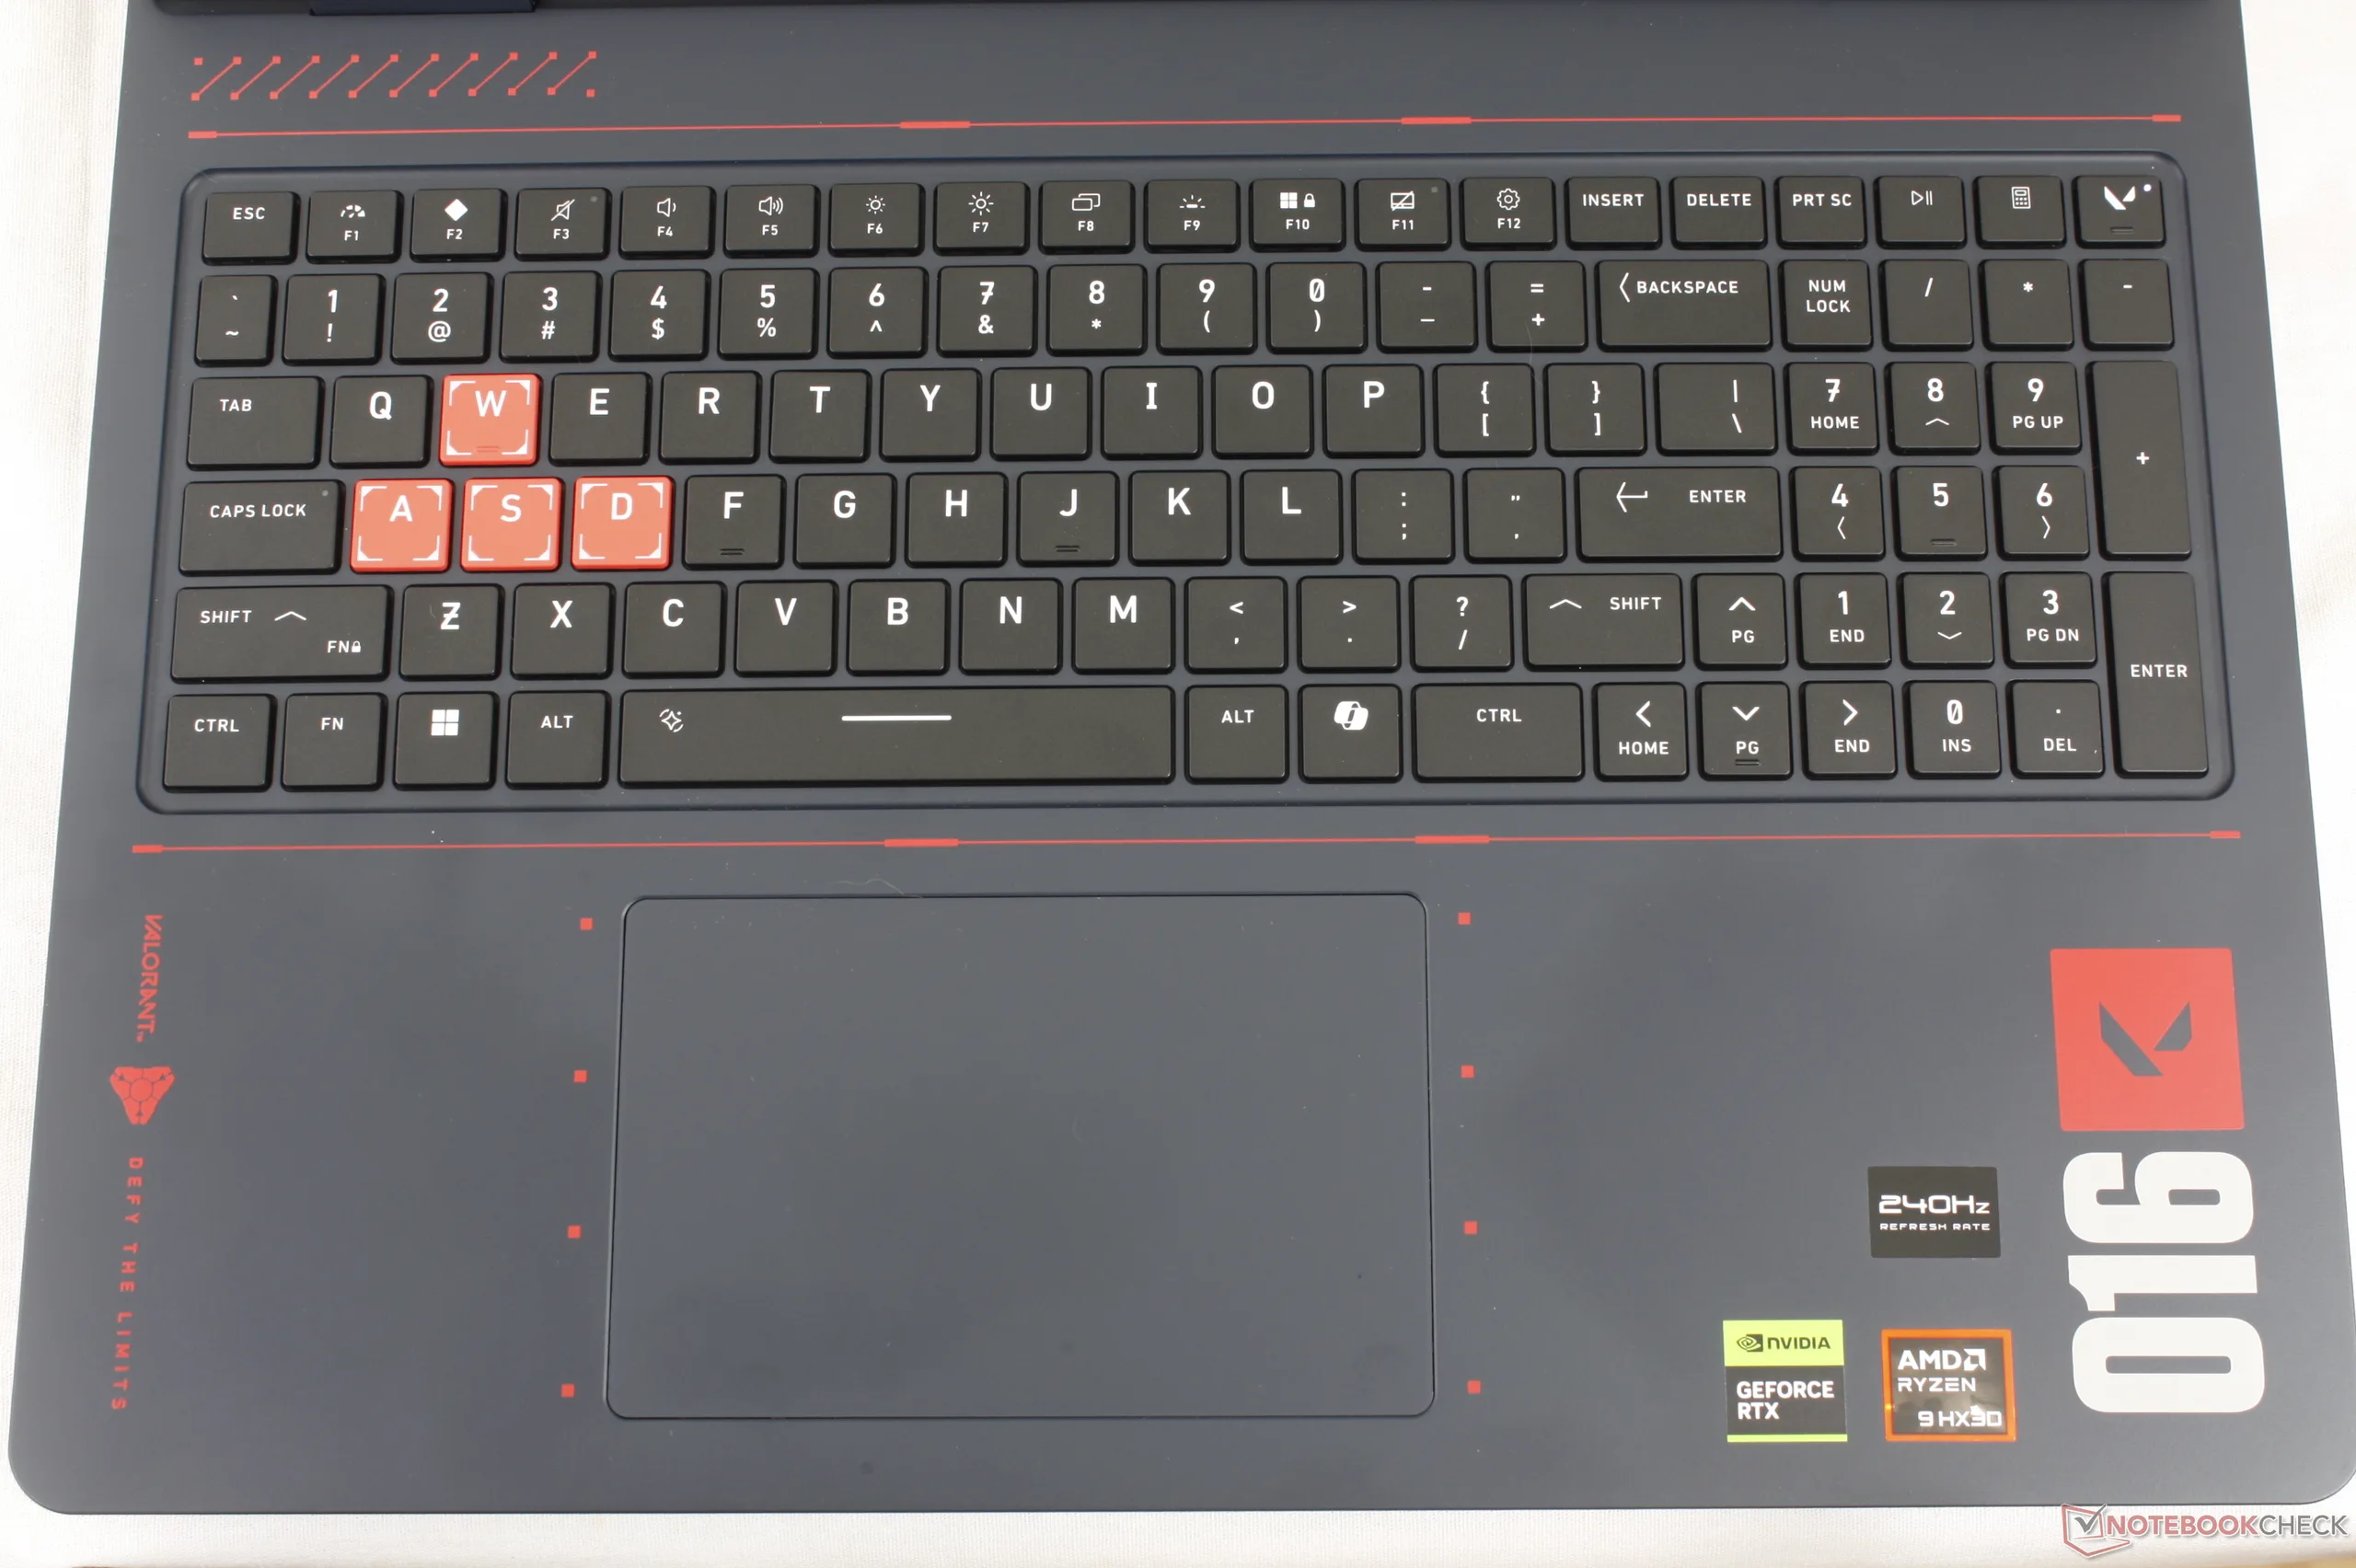
RGB lighting is limited to three zones instead of per-key RGB

Display

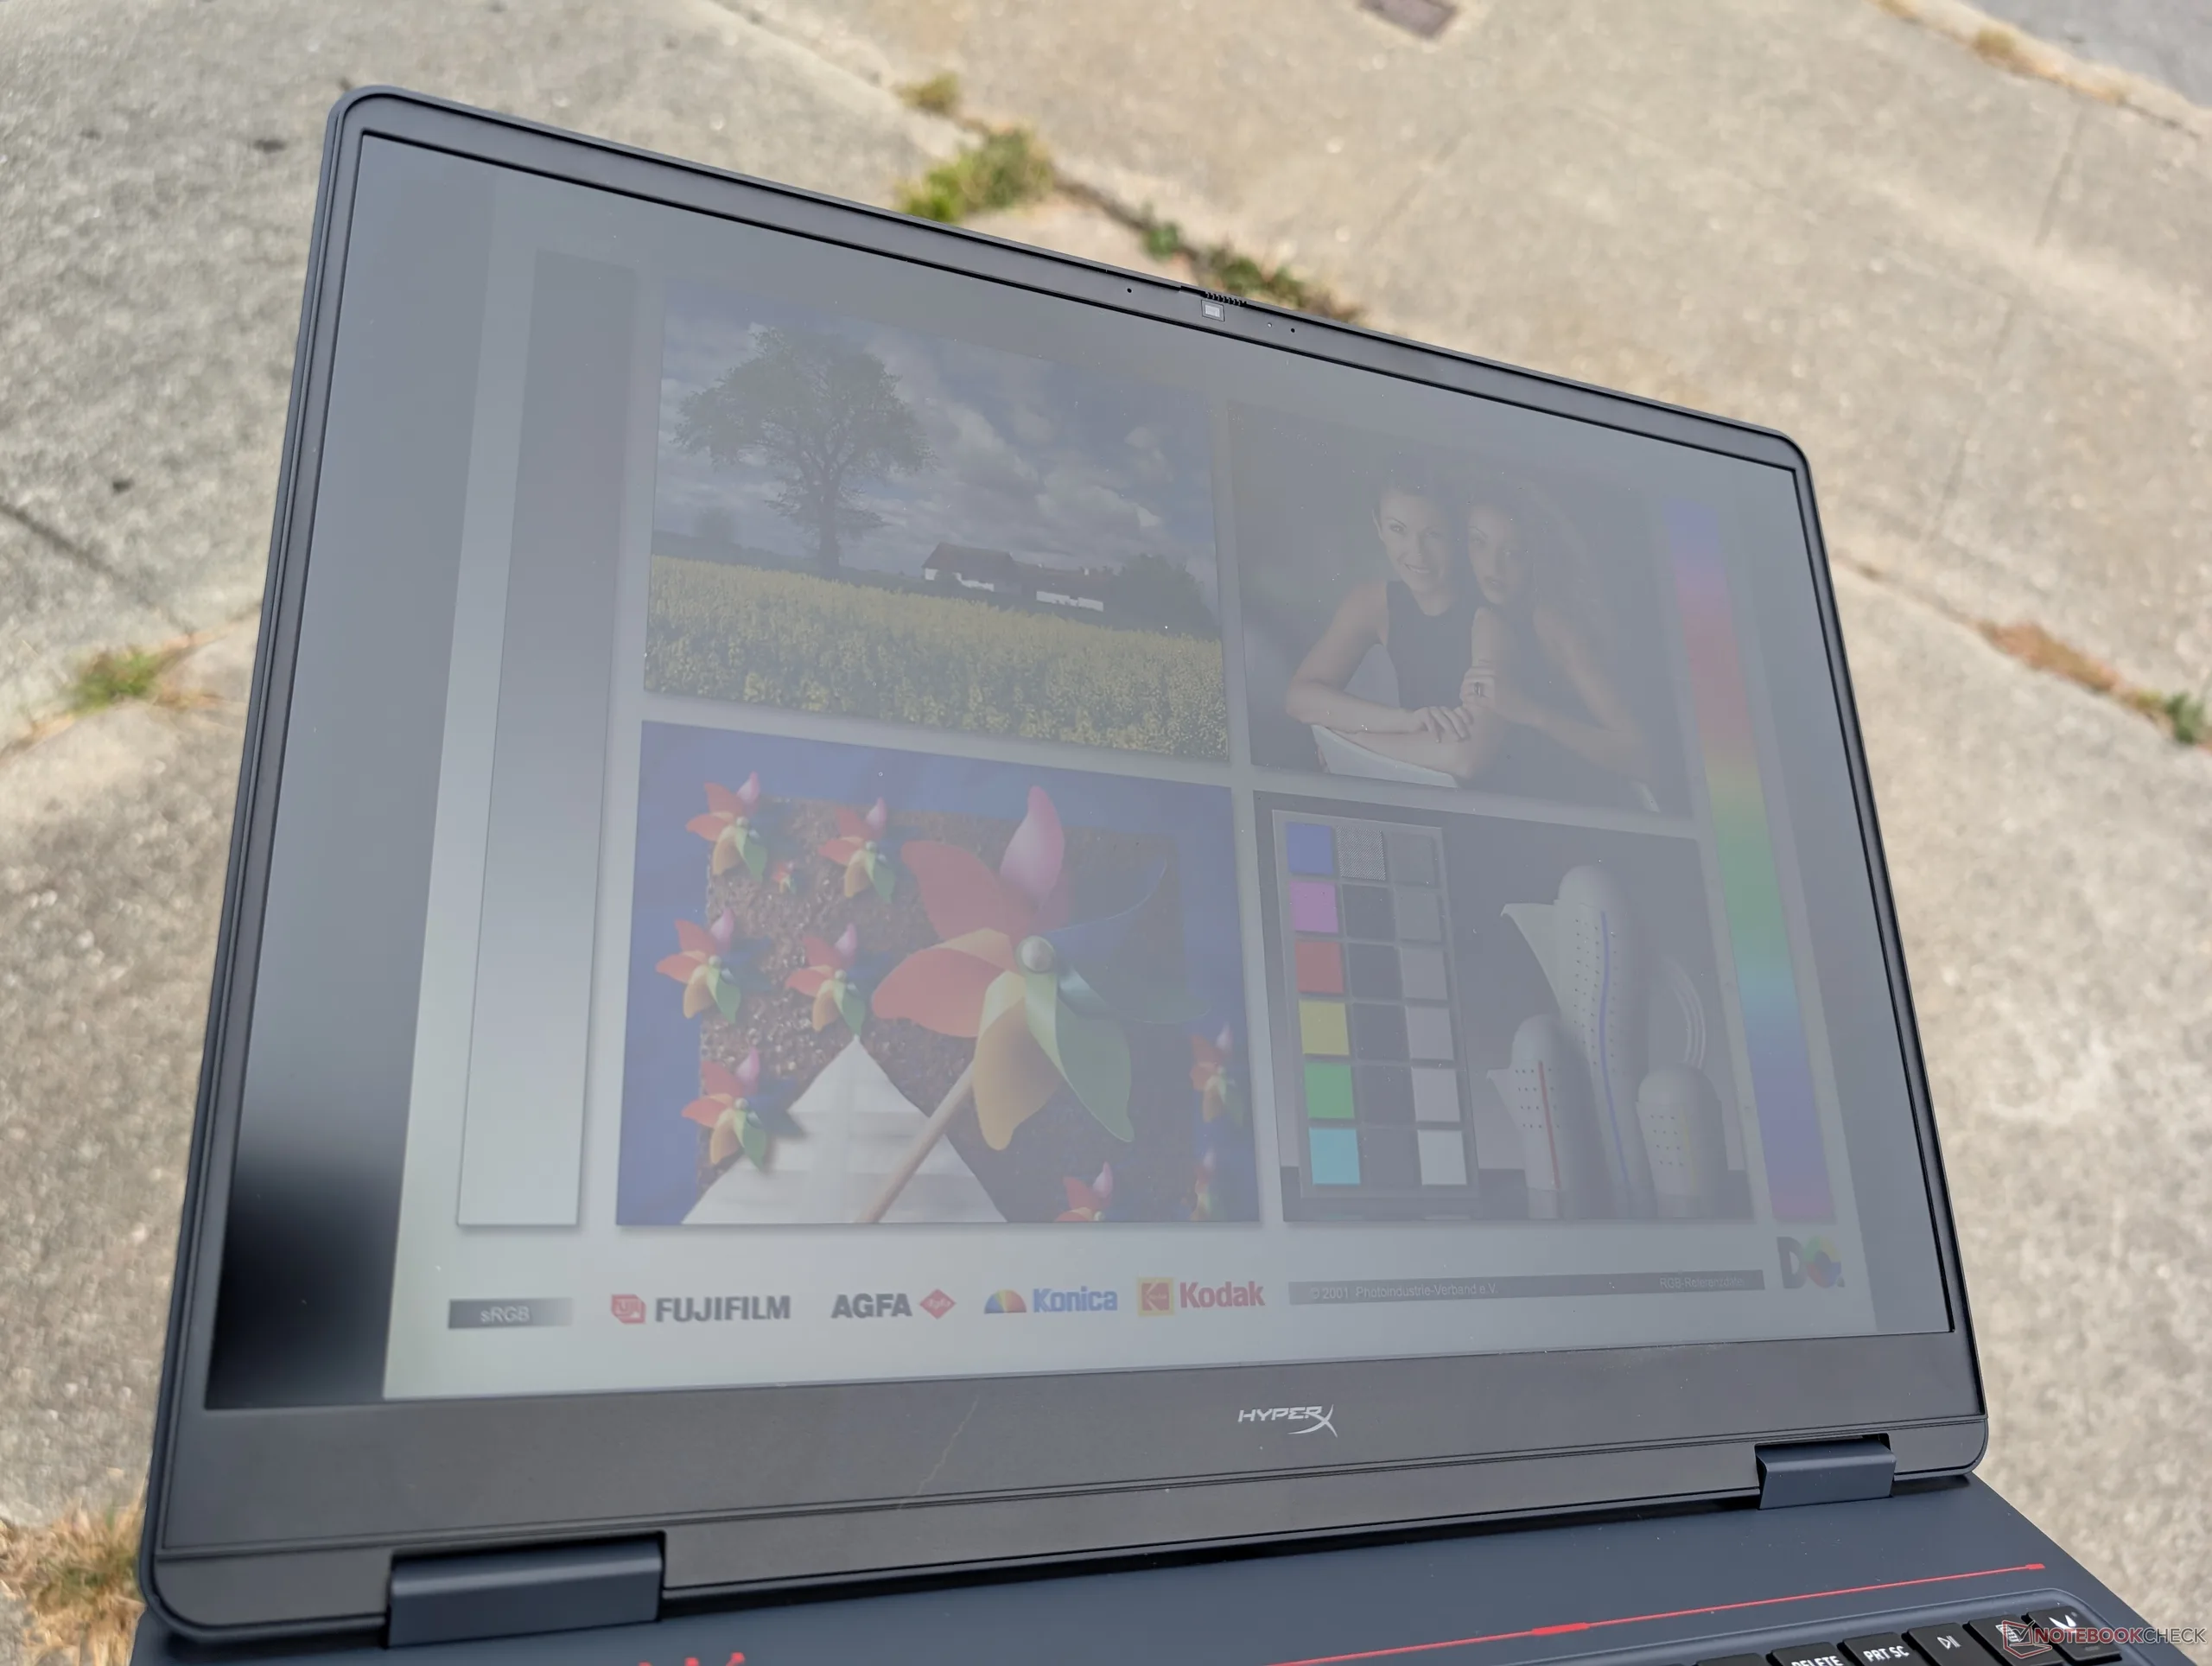
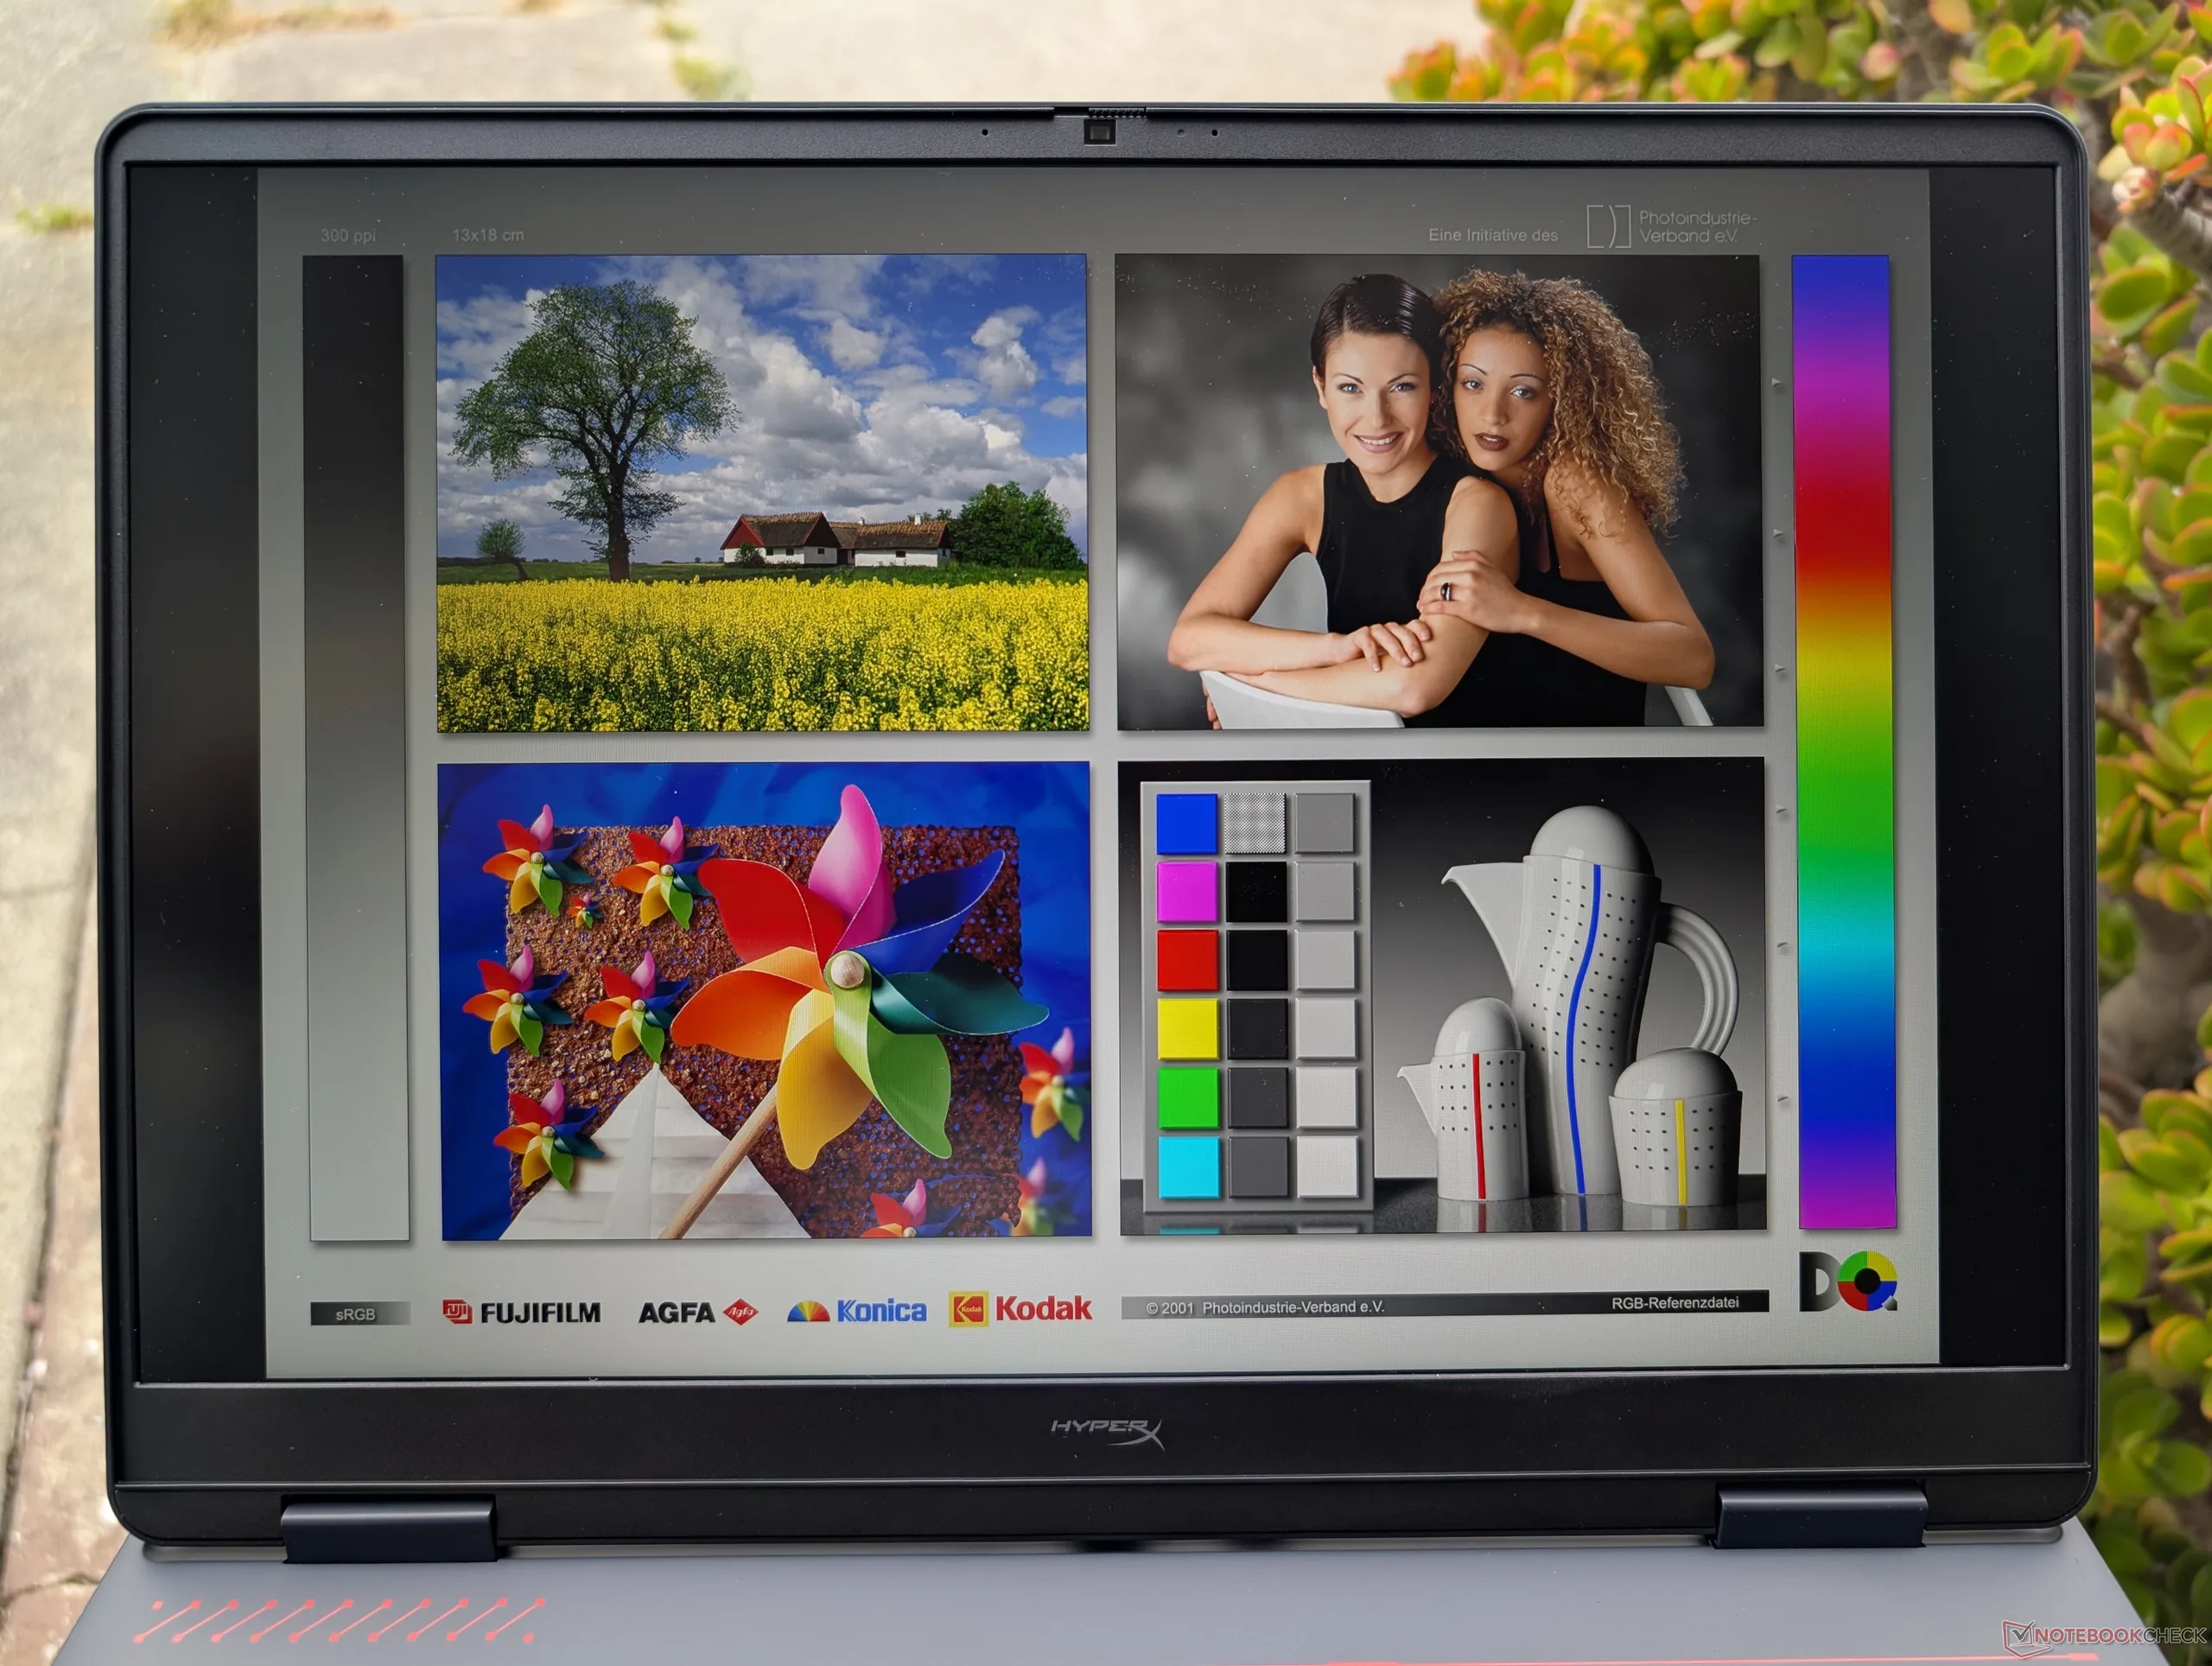
It may not be OLED, but the IPS display is otherwise optimized for fast-paced gaming including its high 240 Hz refresh rate, fast black-white response times to reduce ghosting, calibrated sRGB colors, and a bright 500-nit backlight. It unfortunately does not support G-Sync or HDR with the latter being due to the mediocre black levels.


Matte panel is slightly grainier than a glossy alternative
Moderate uneven backlight bleeding along the corners
512.1
cd/m²
549.4
cd/m²
552.5
cd/m²
546.6
cd/m²
569.7
cd/m²
557.7
cd/m²
539.3
cd/m²
532.8
cd/m²
546.6
cd/m²
Distribution of brightness
BOE0CD1 tested with X-Rite i1Pro 3
Maximum: 569.7 cd/m² (Nits) Average: 545.2 cd/m² Minimum: 29.7 cd/m²
Brightness Distribution: 90 %
Center on Battery: 569.7 cd/m²
Contrast: 1212:1 (Black: 0.47 cd/m²)
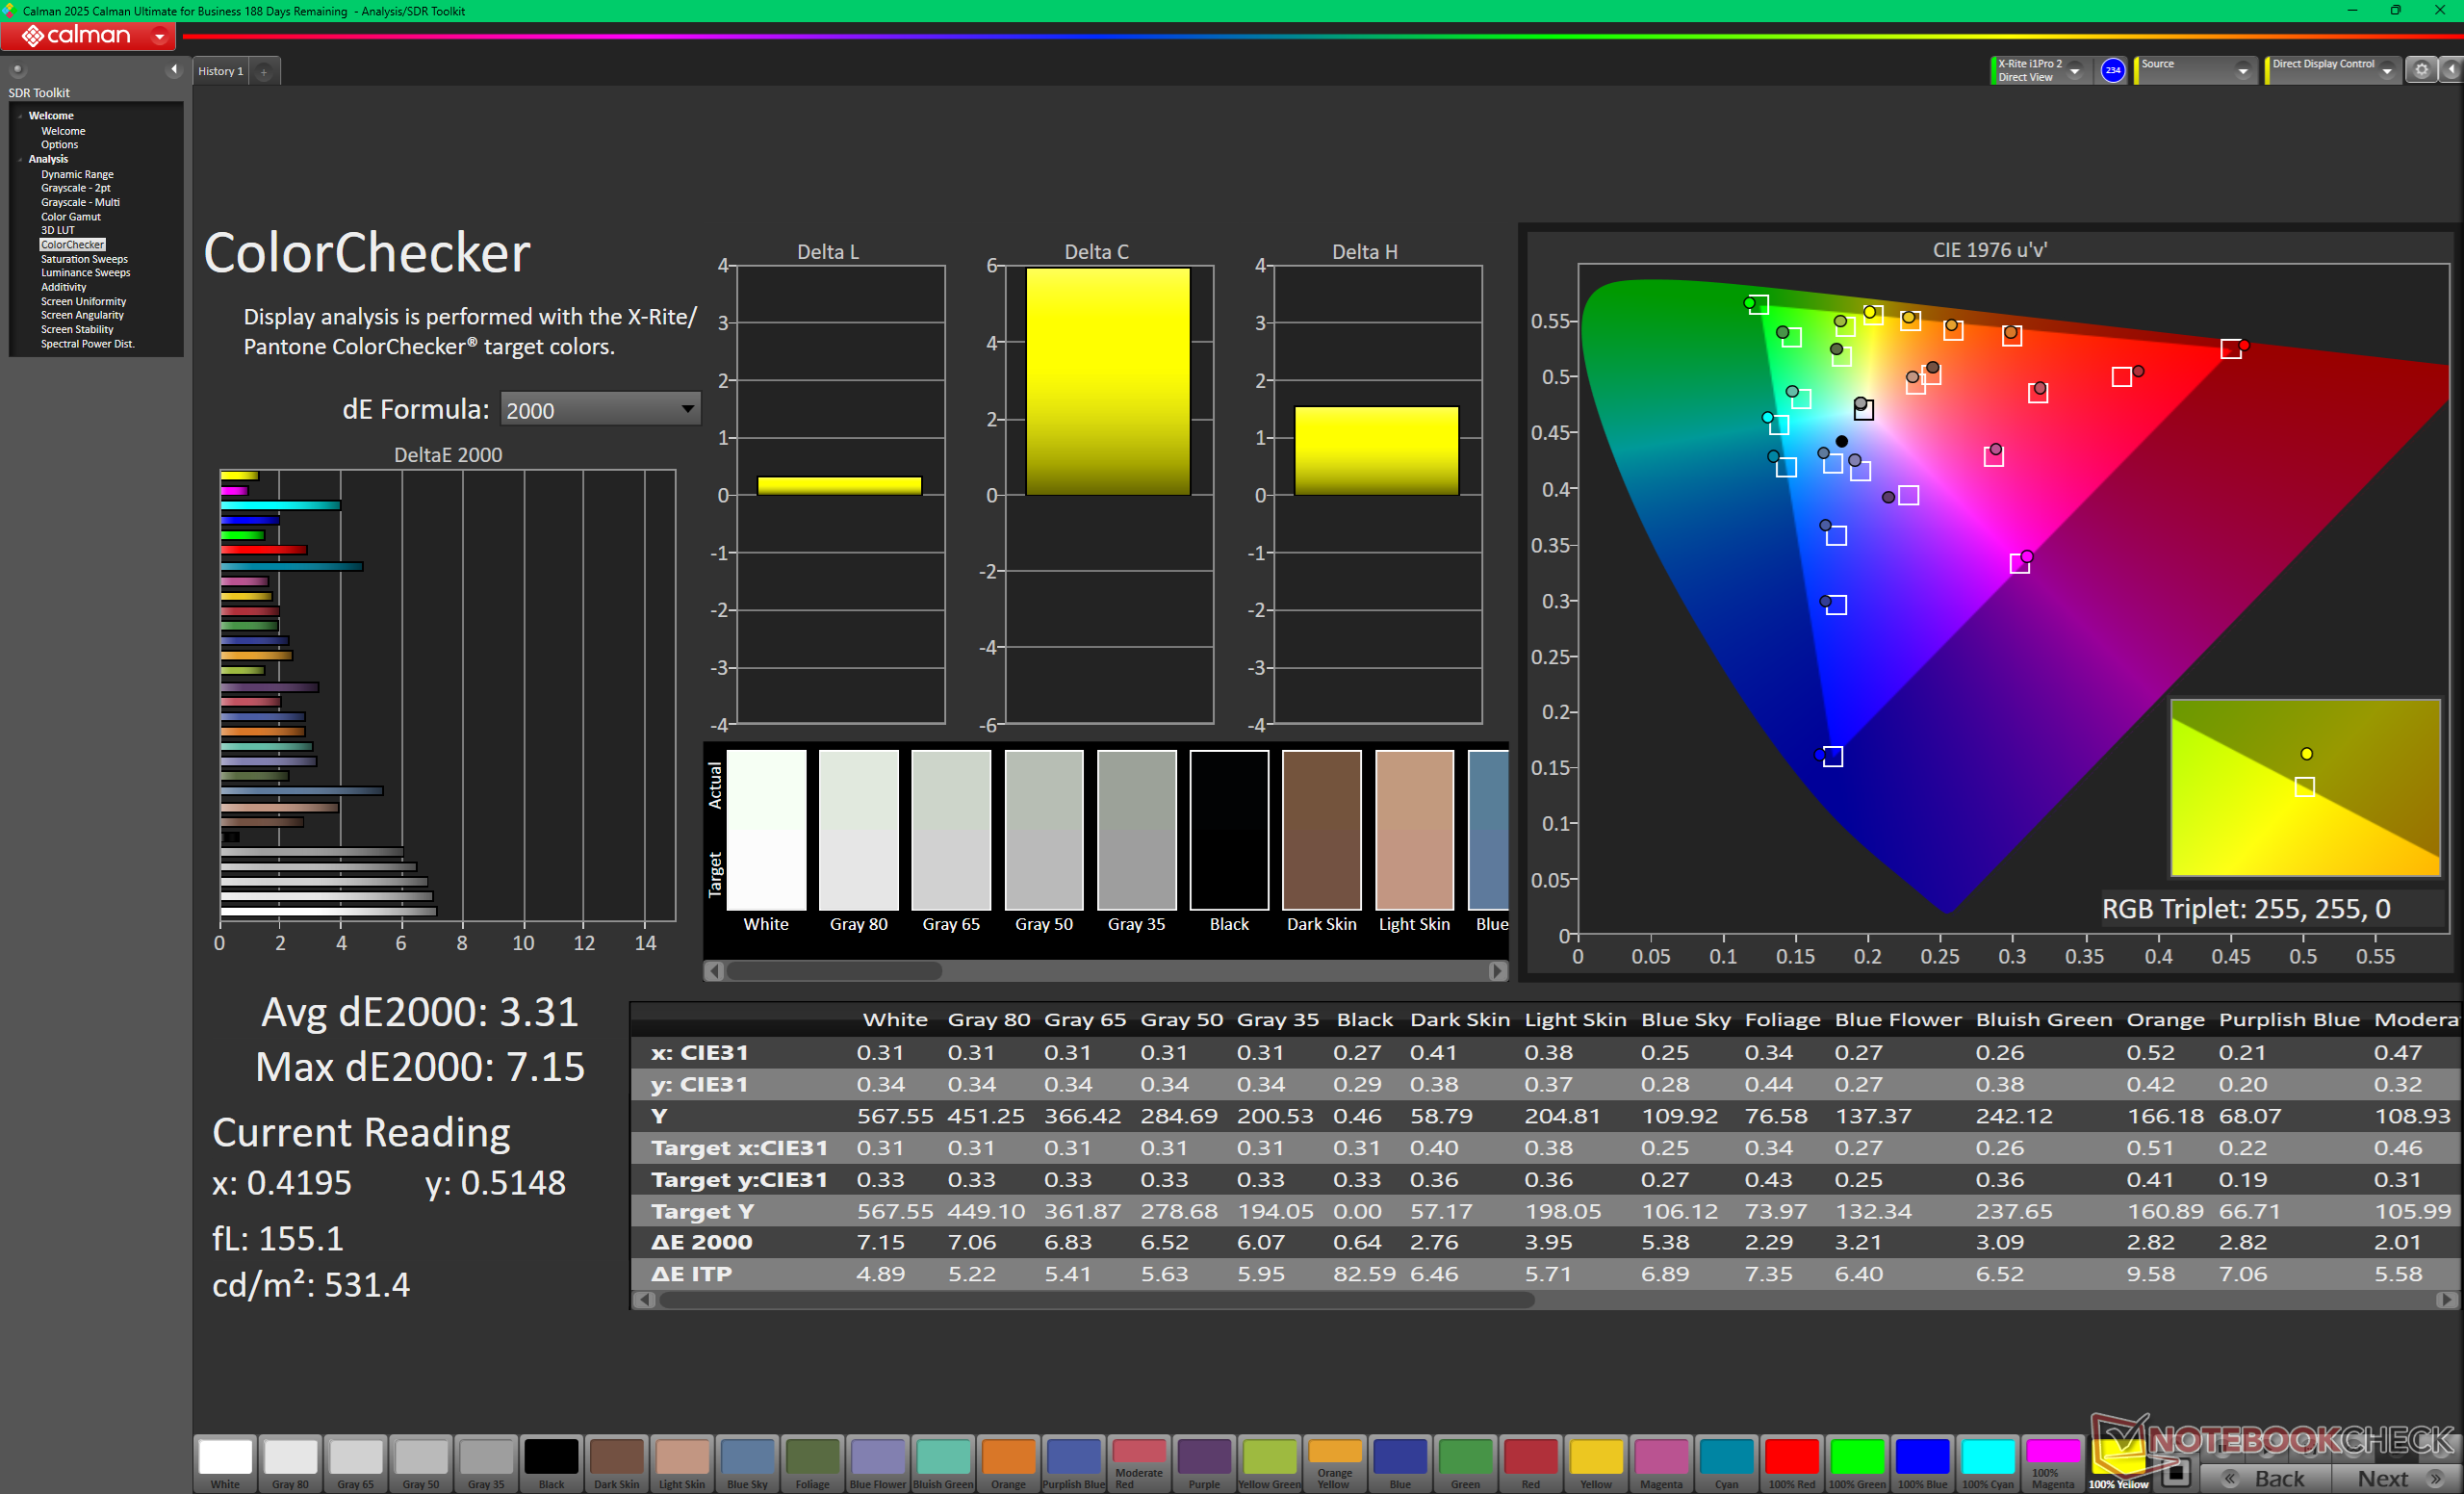
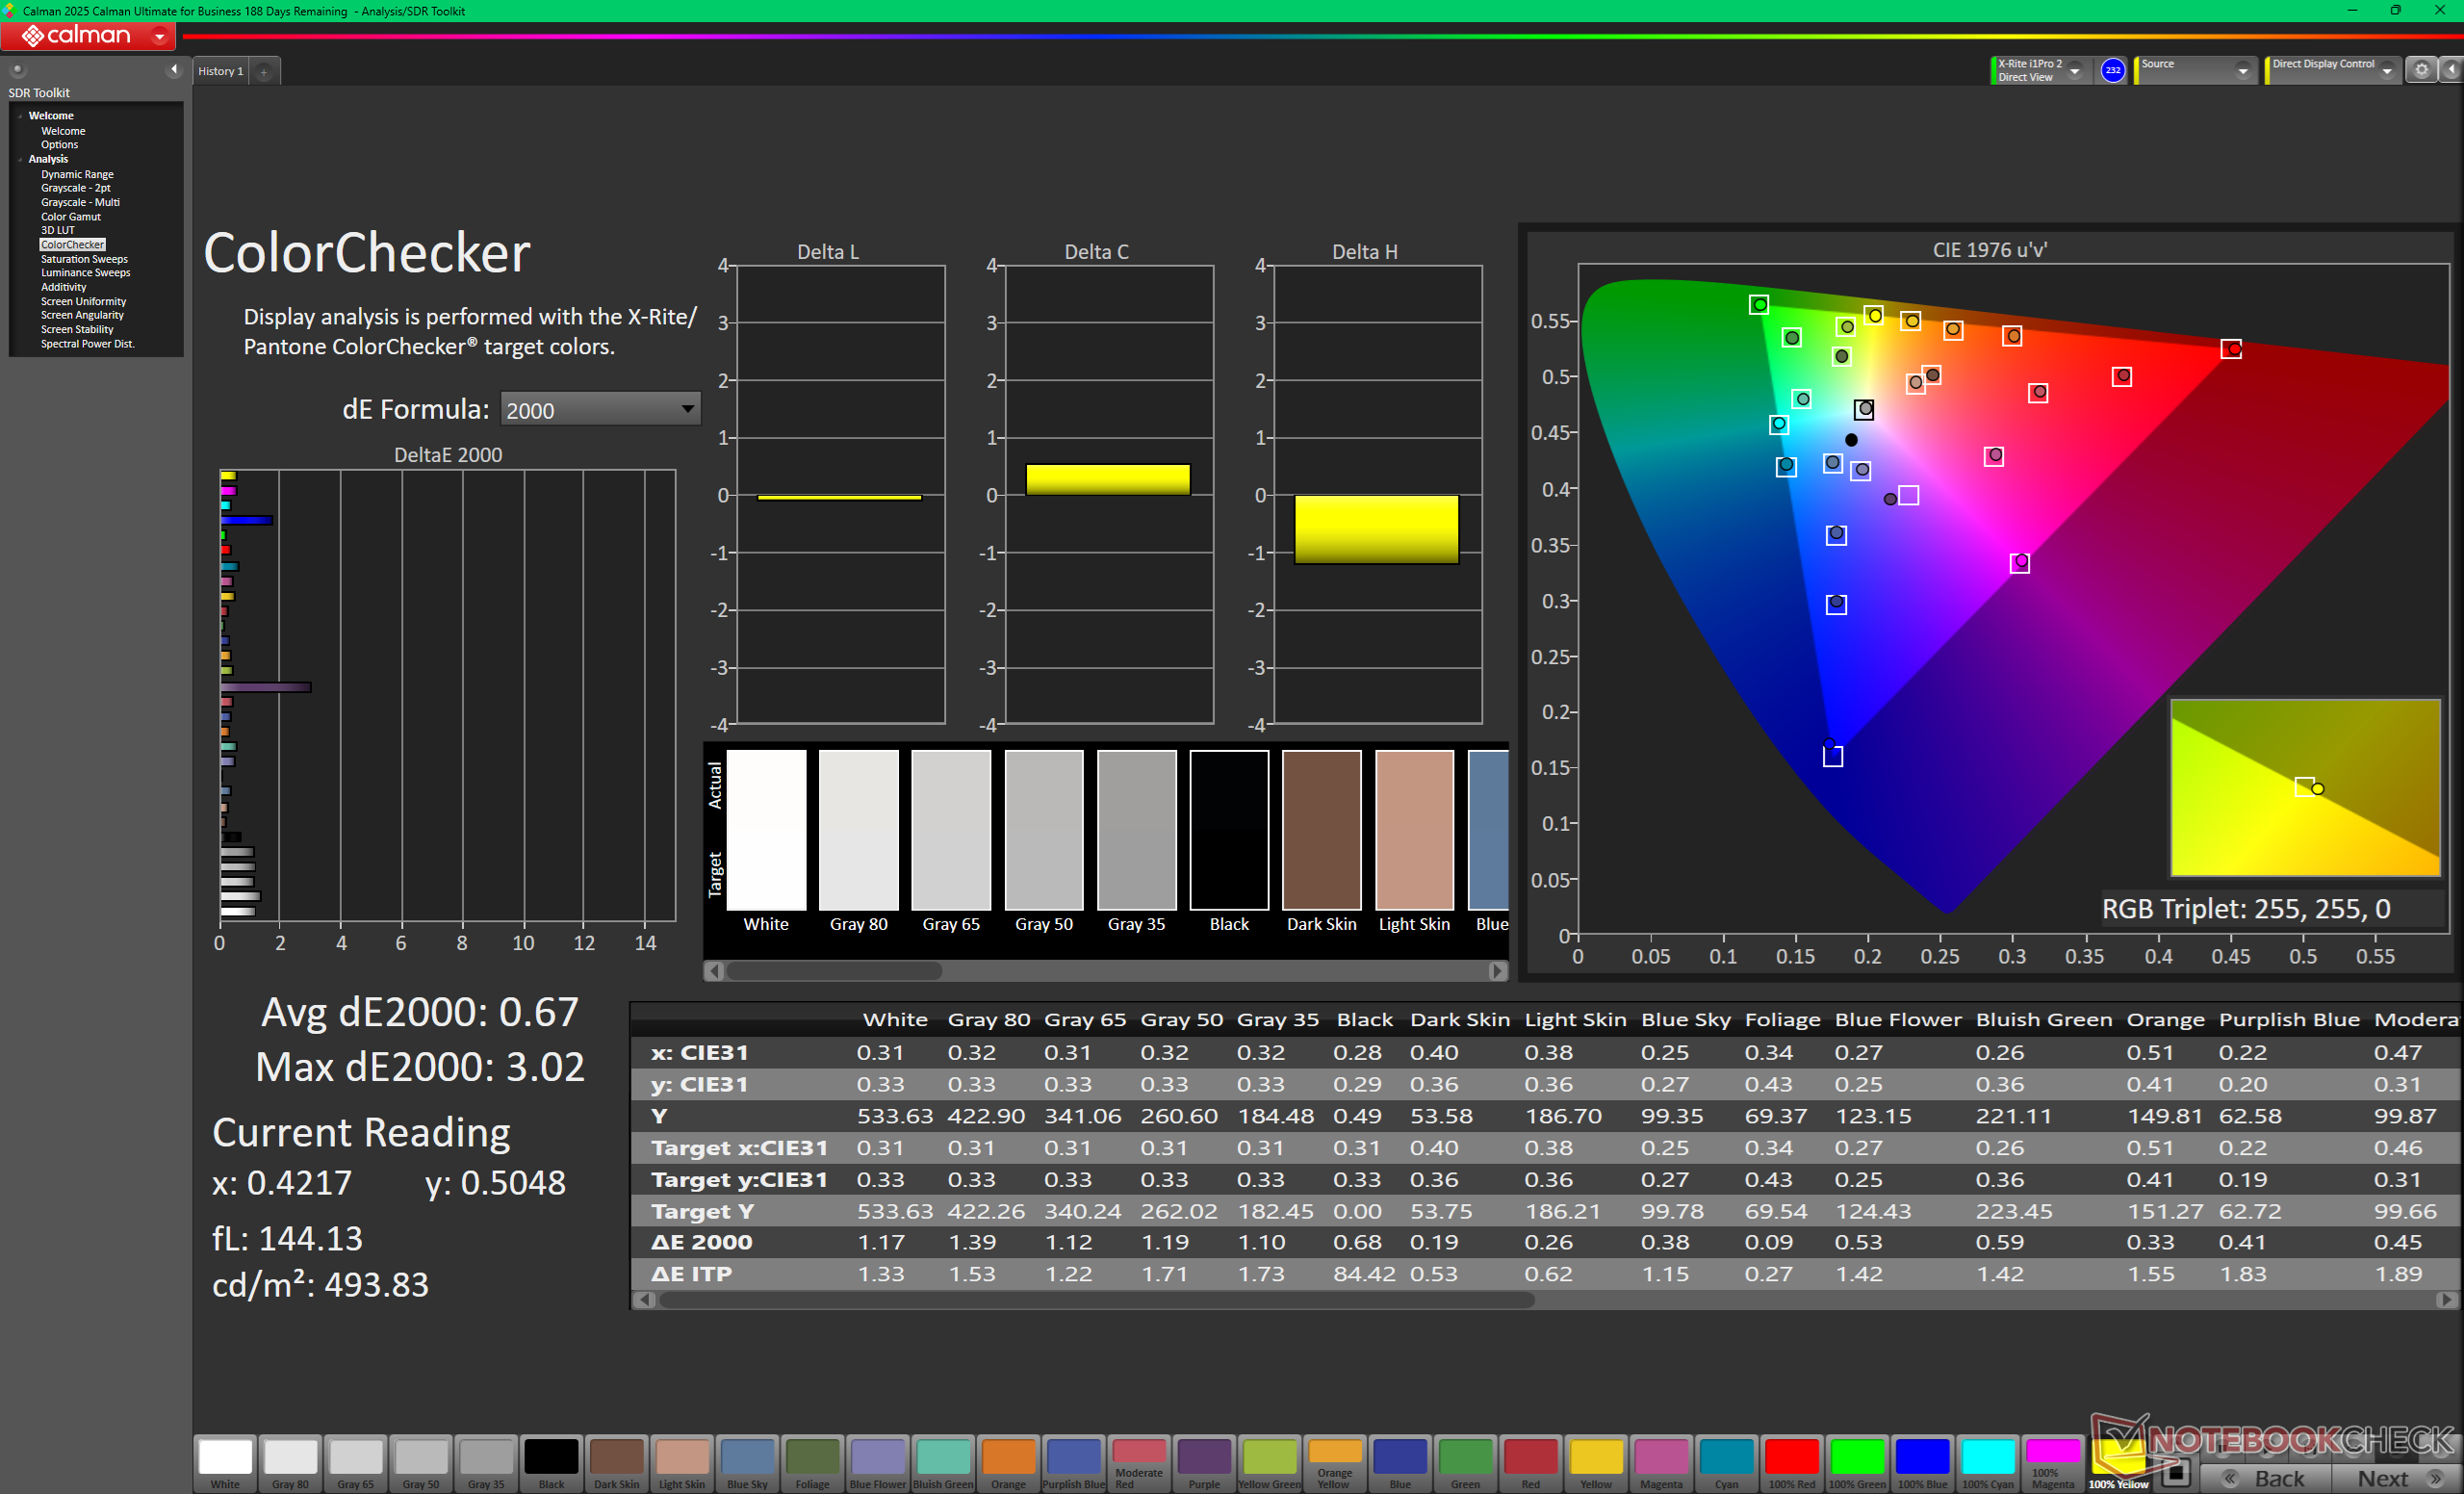
ΔE ColorChecker Calman: 3.31 | ∀{0.5-29.43 Ø4.7}
calibrated: 0.67
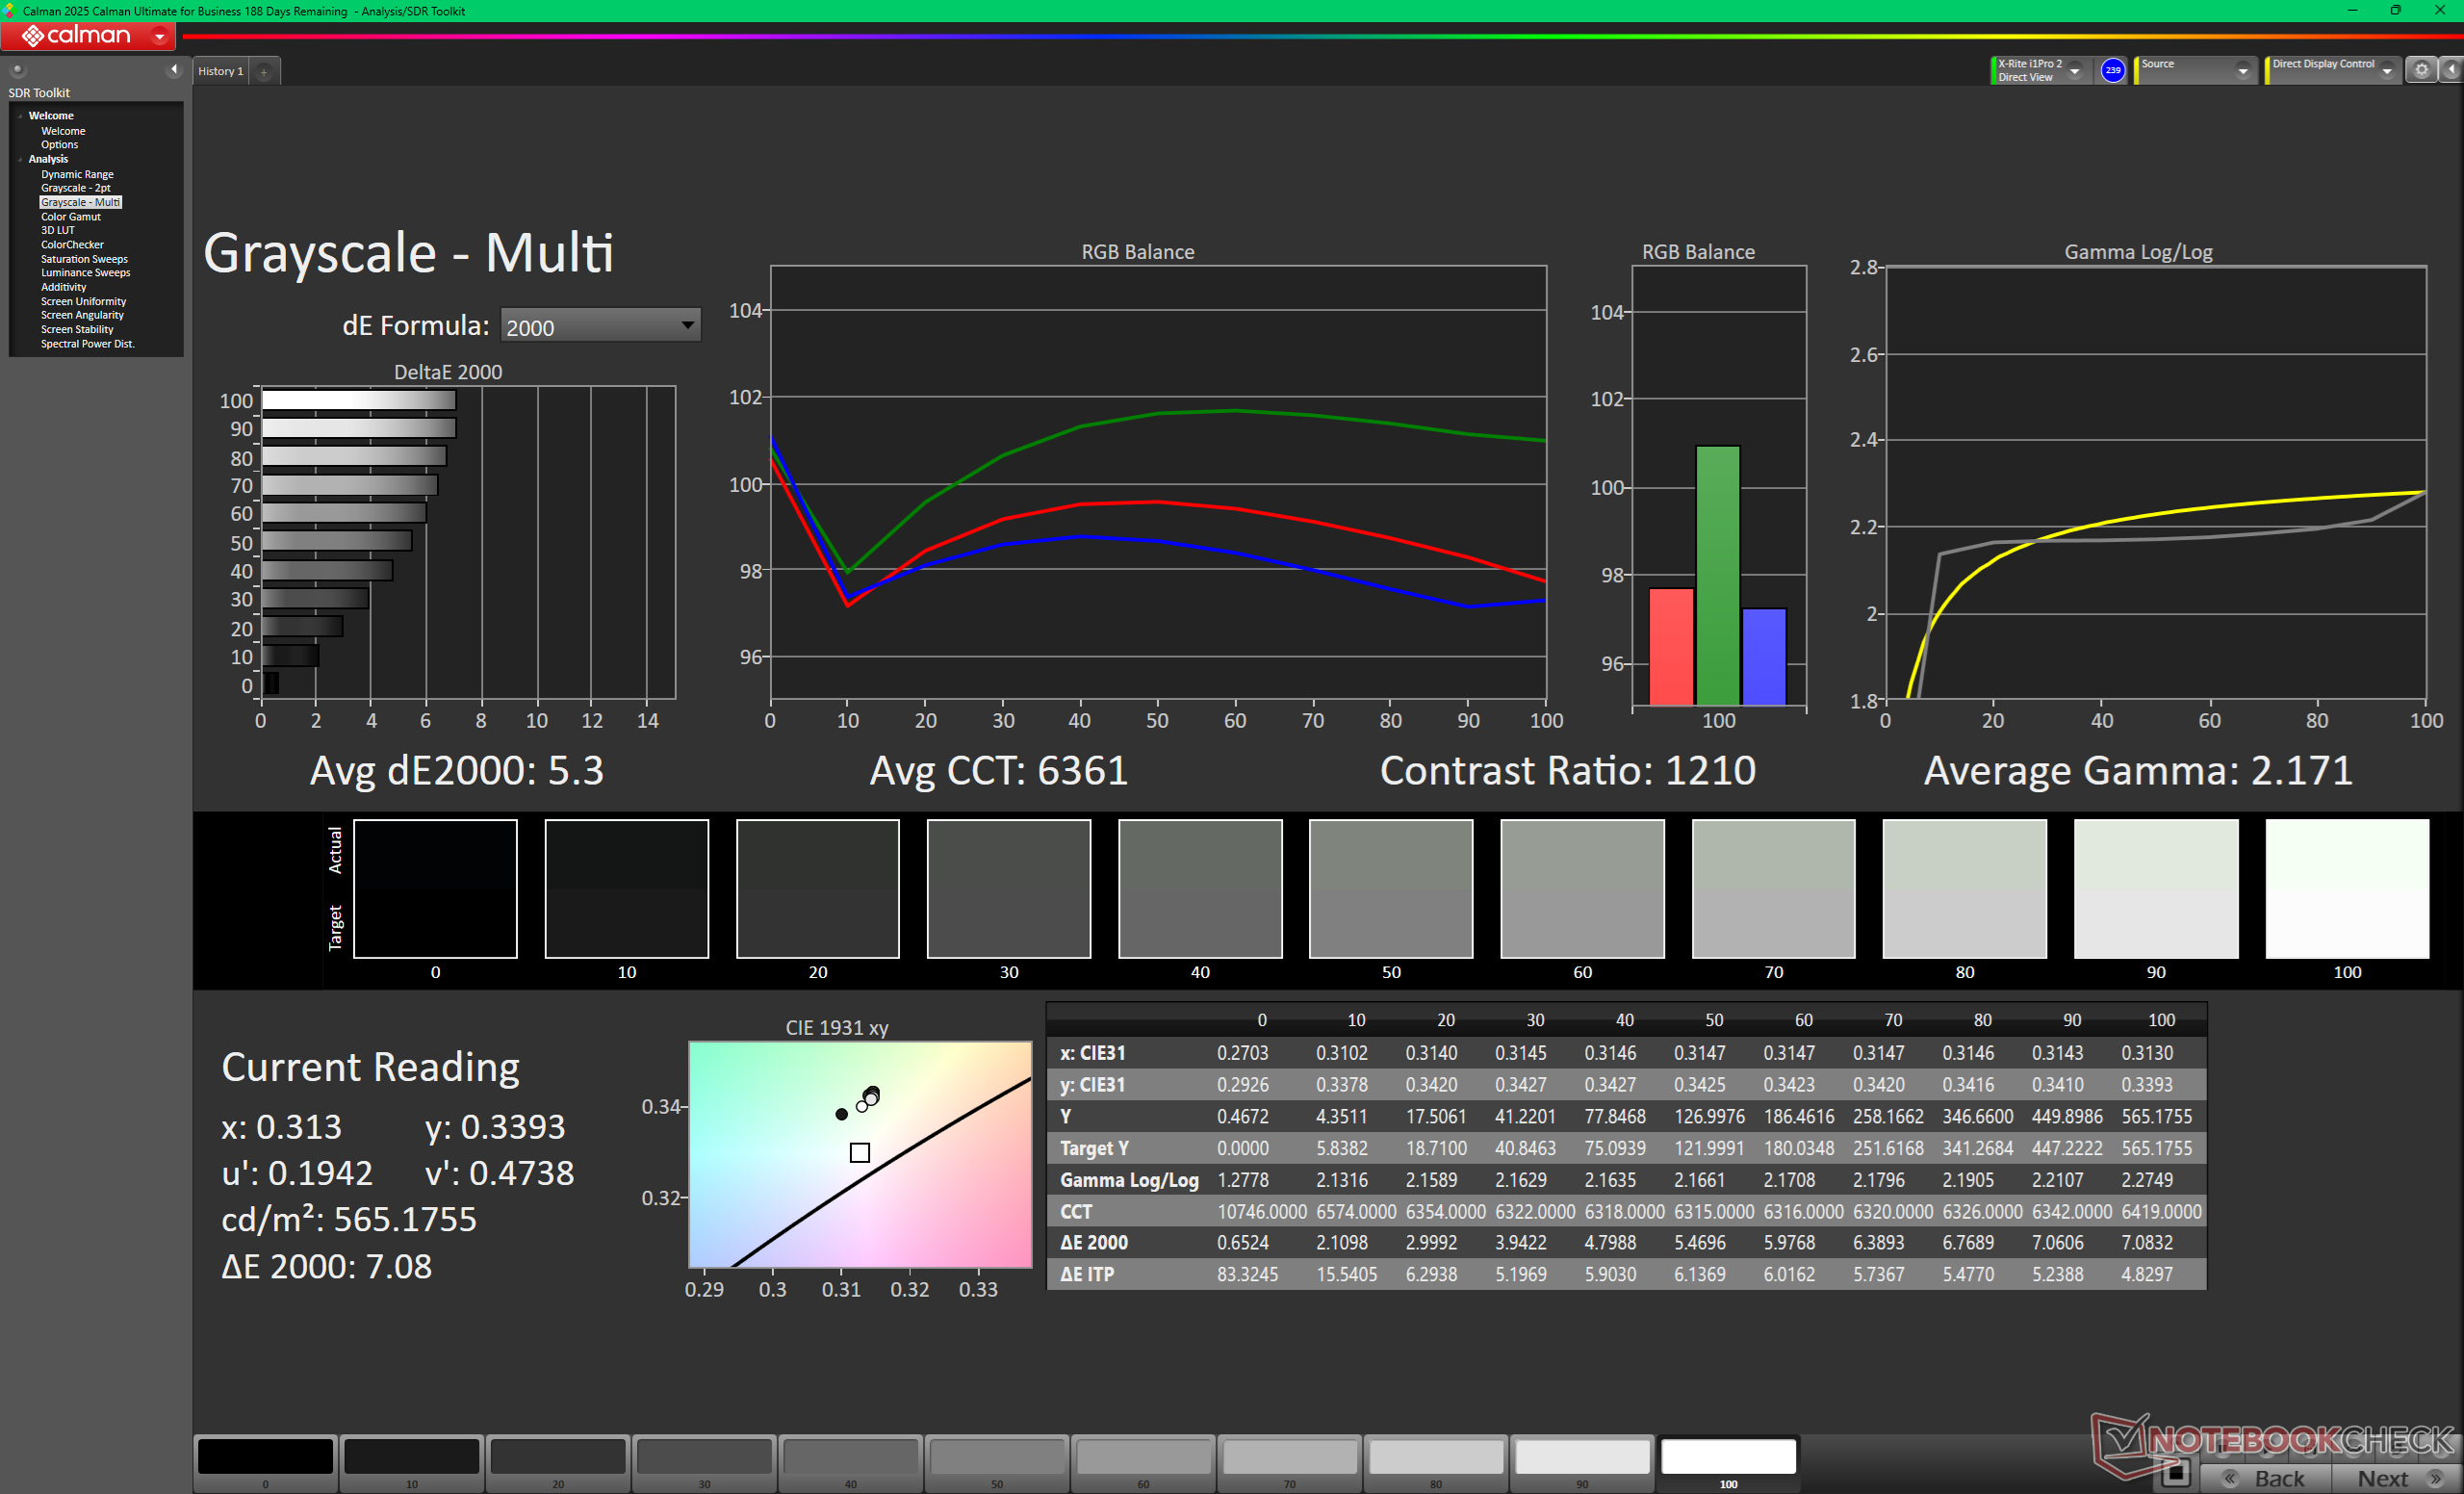
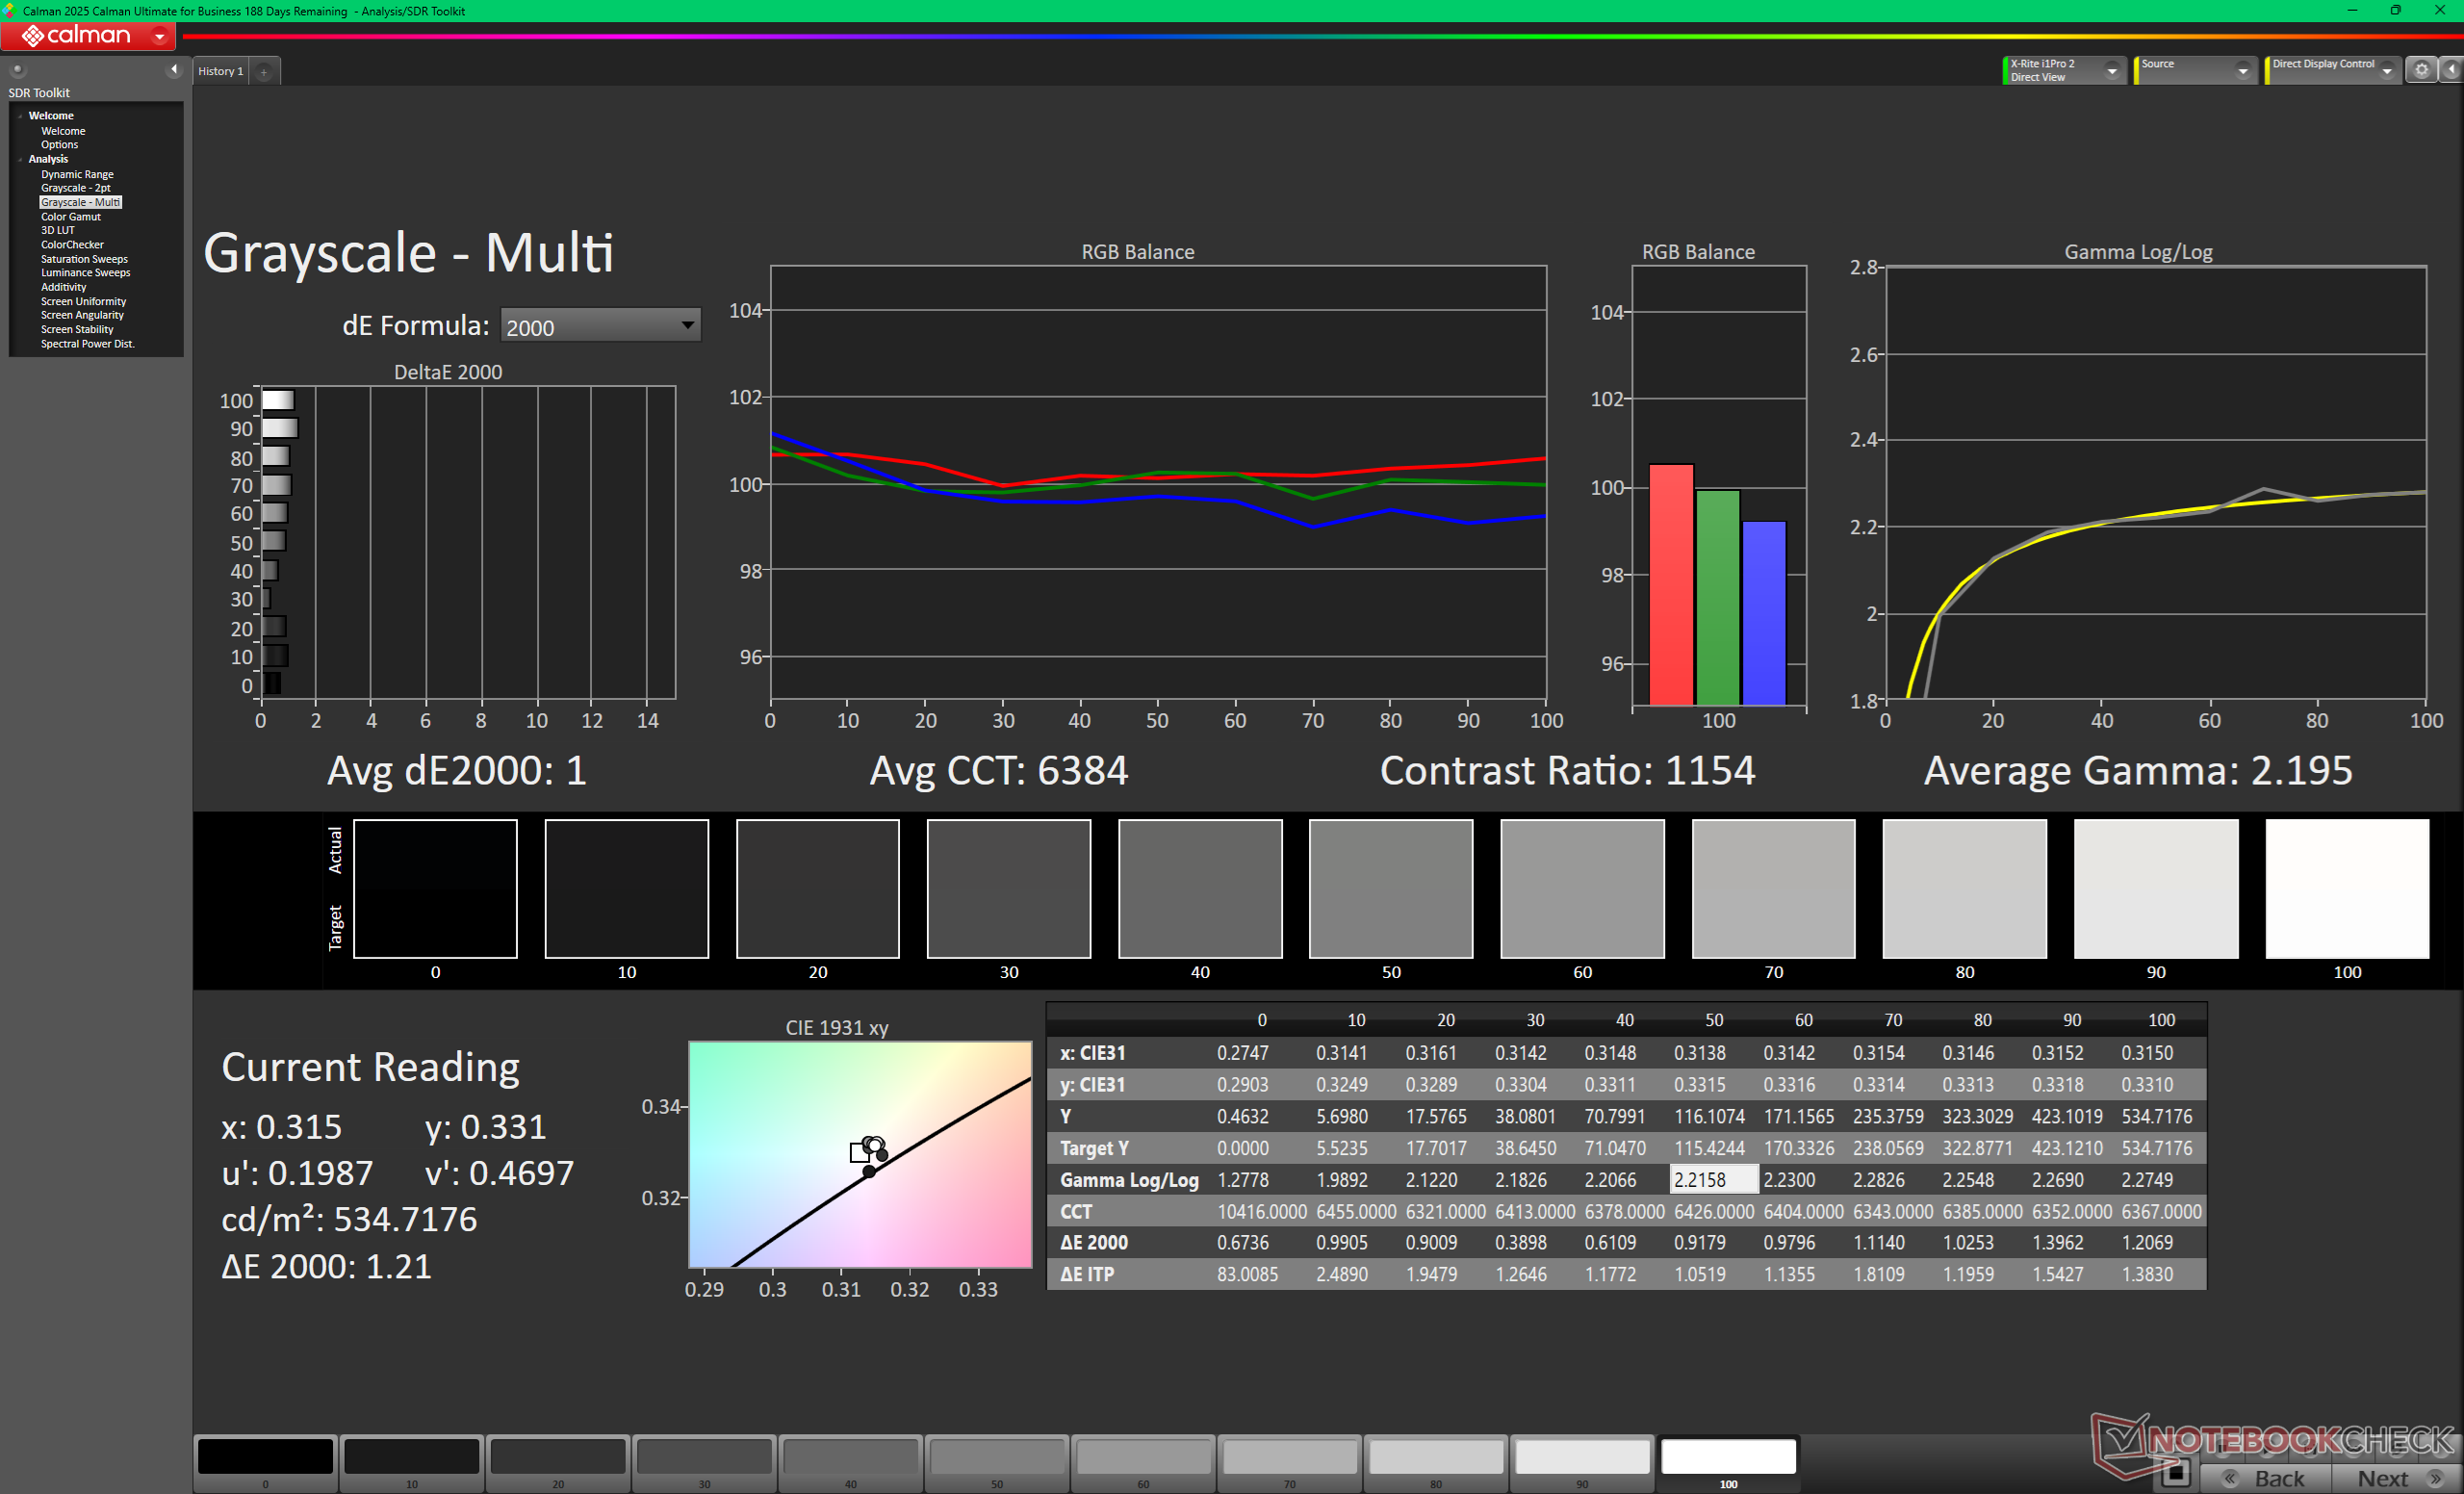
ΔE Greyscale Calman: 5.3 | ∀{0.09-98 Ø4.95}
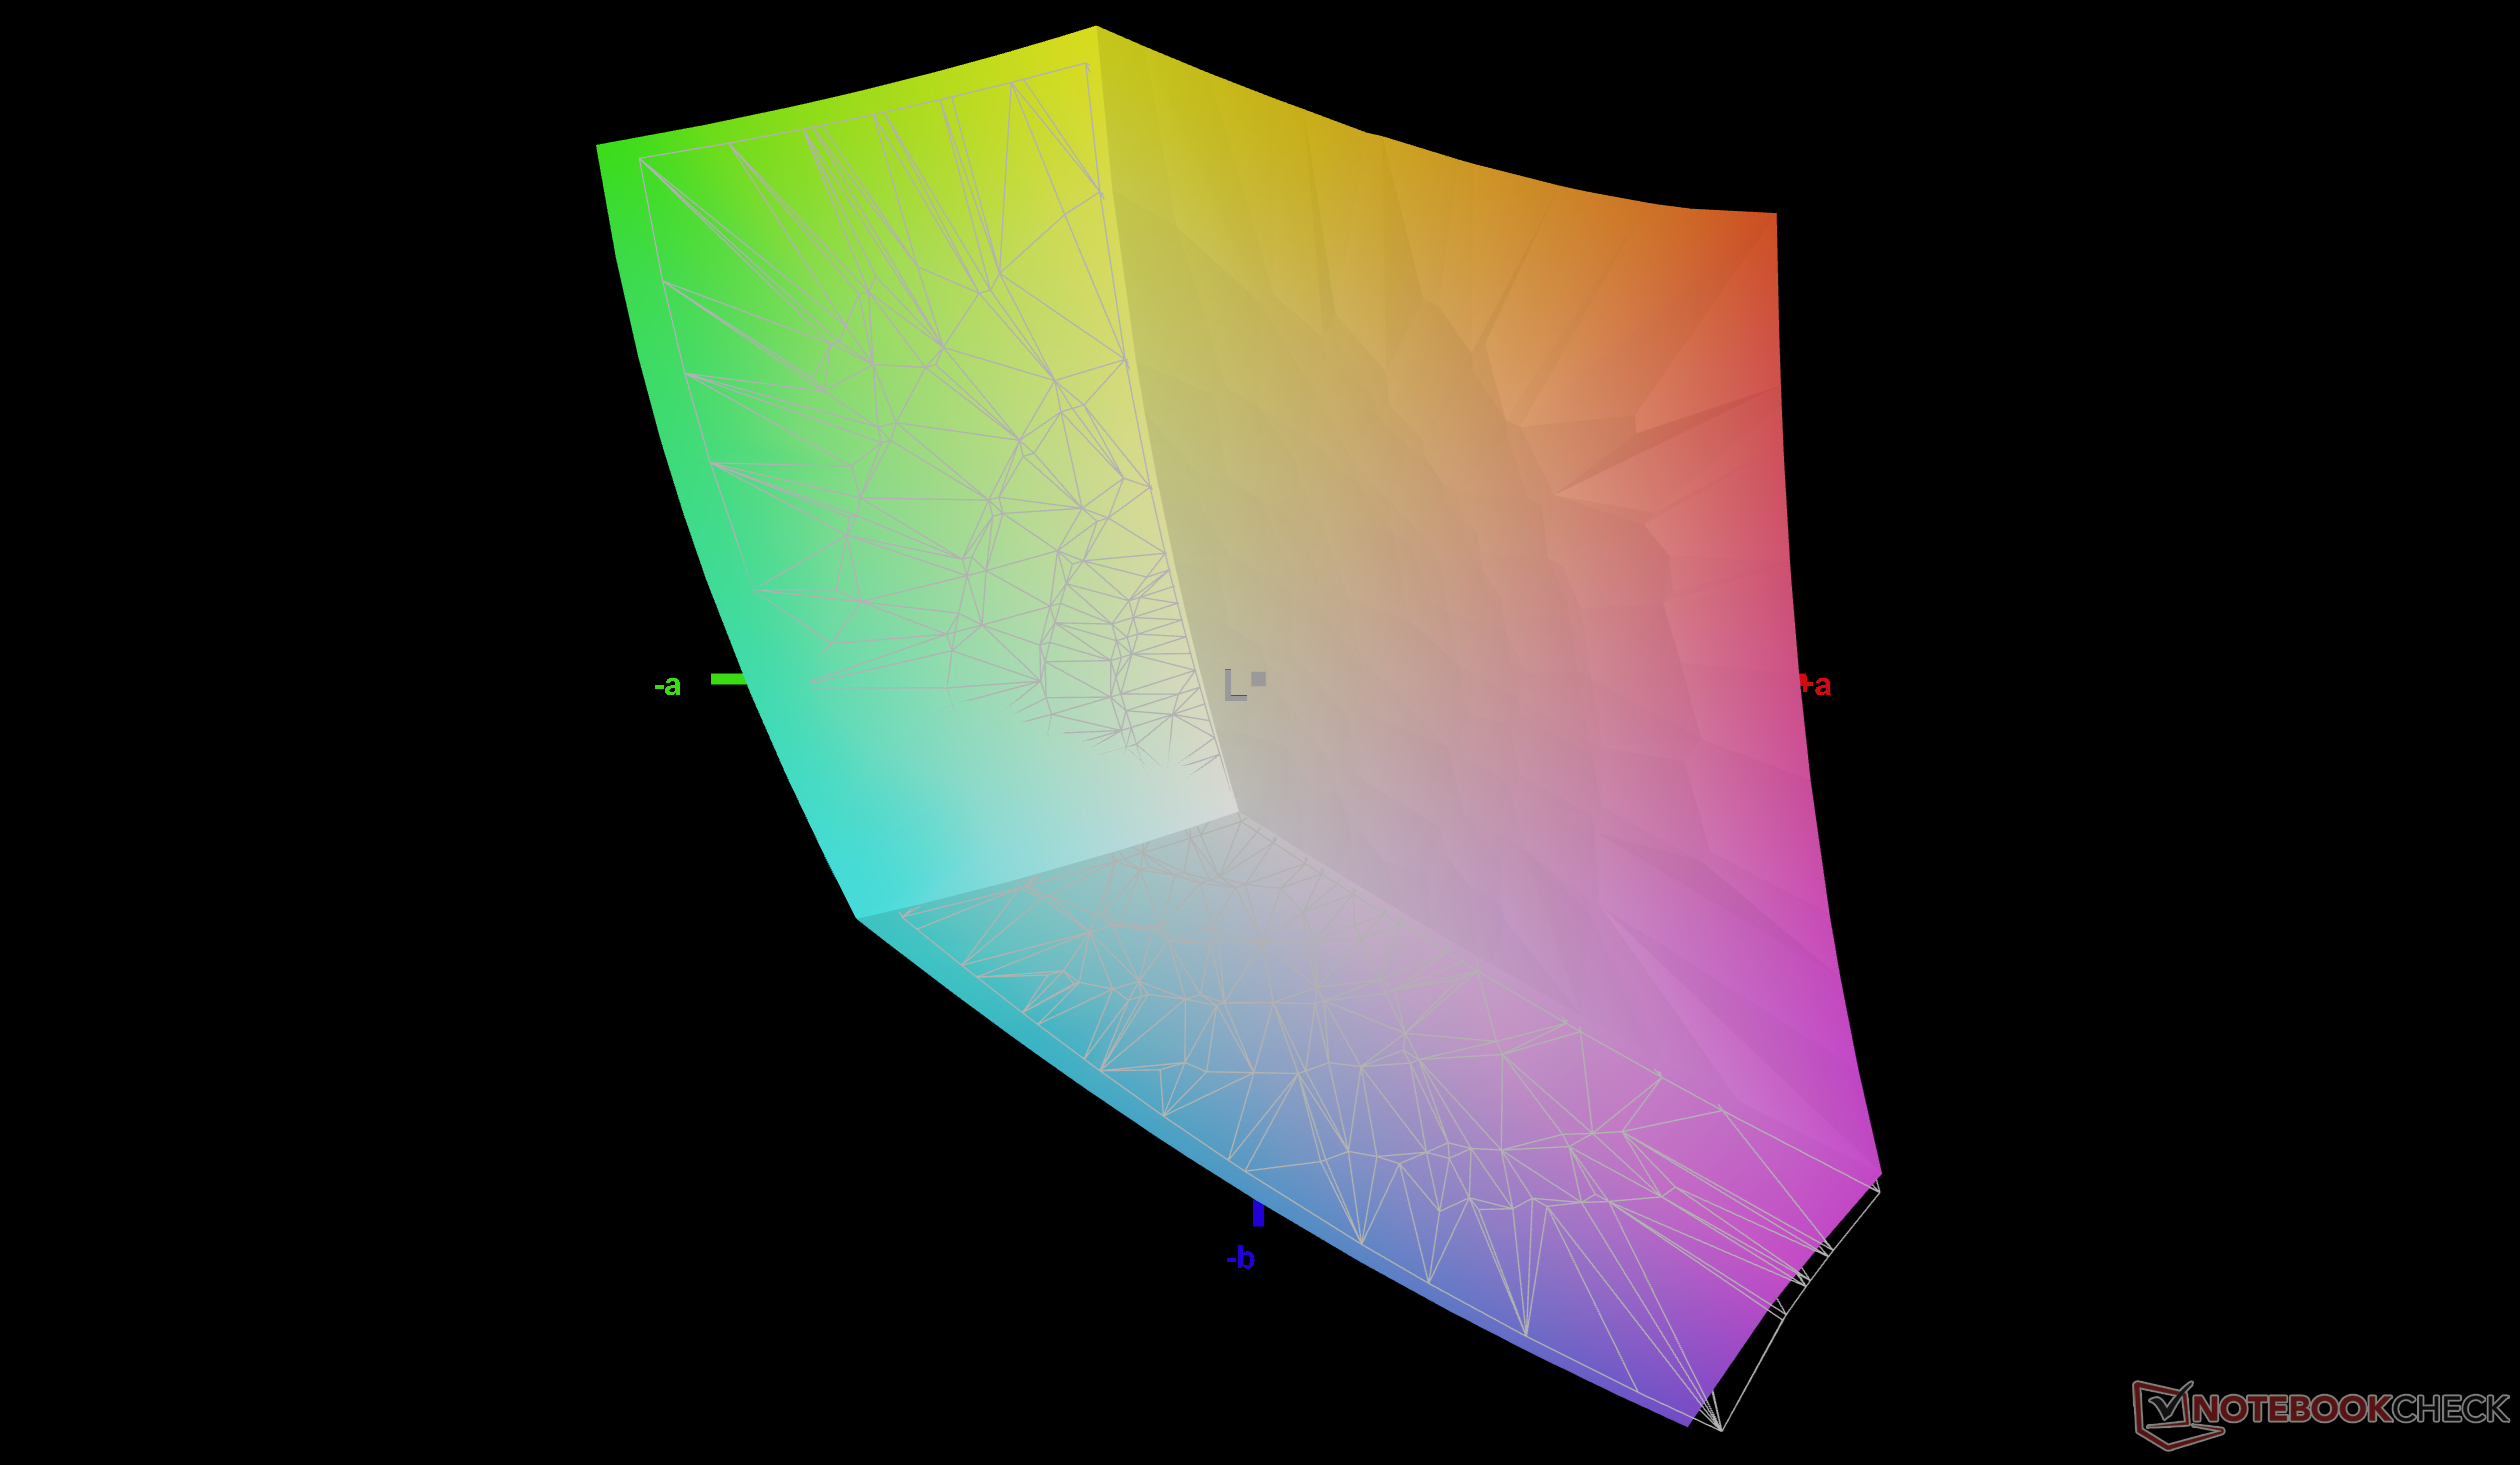
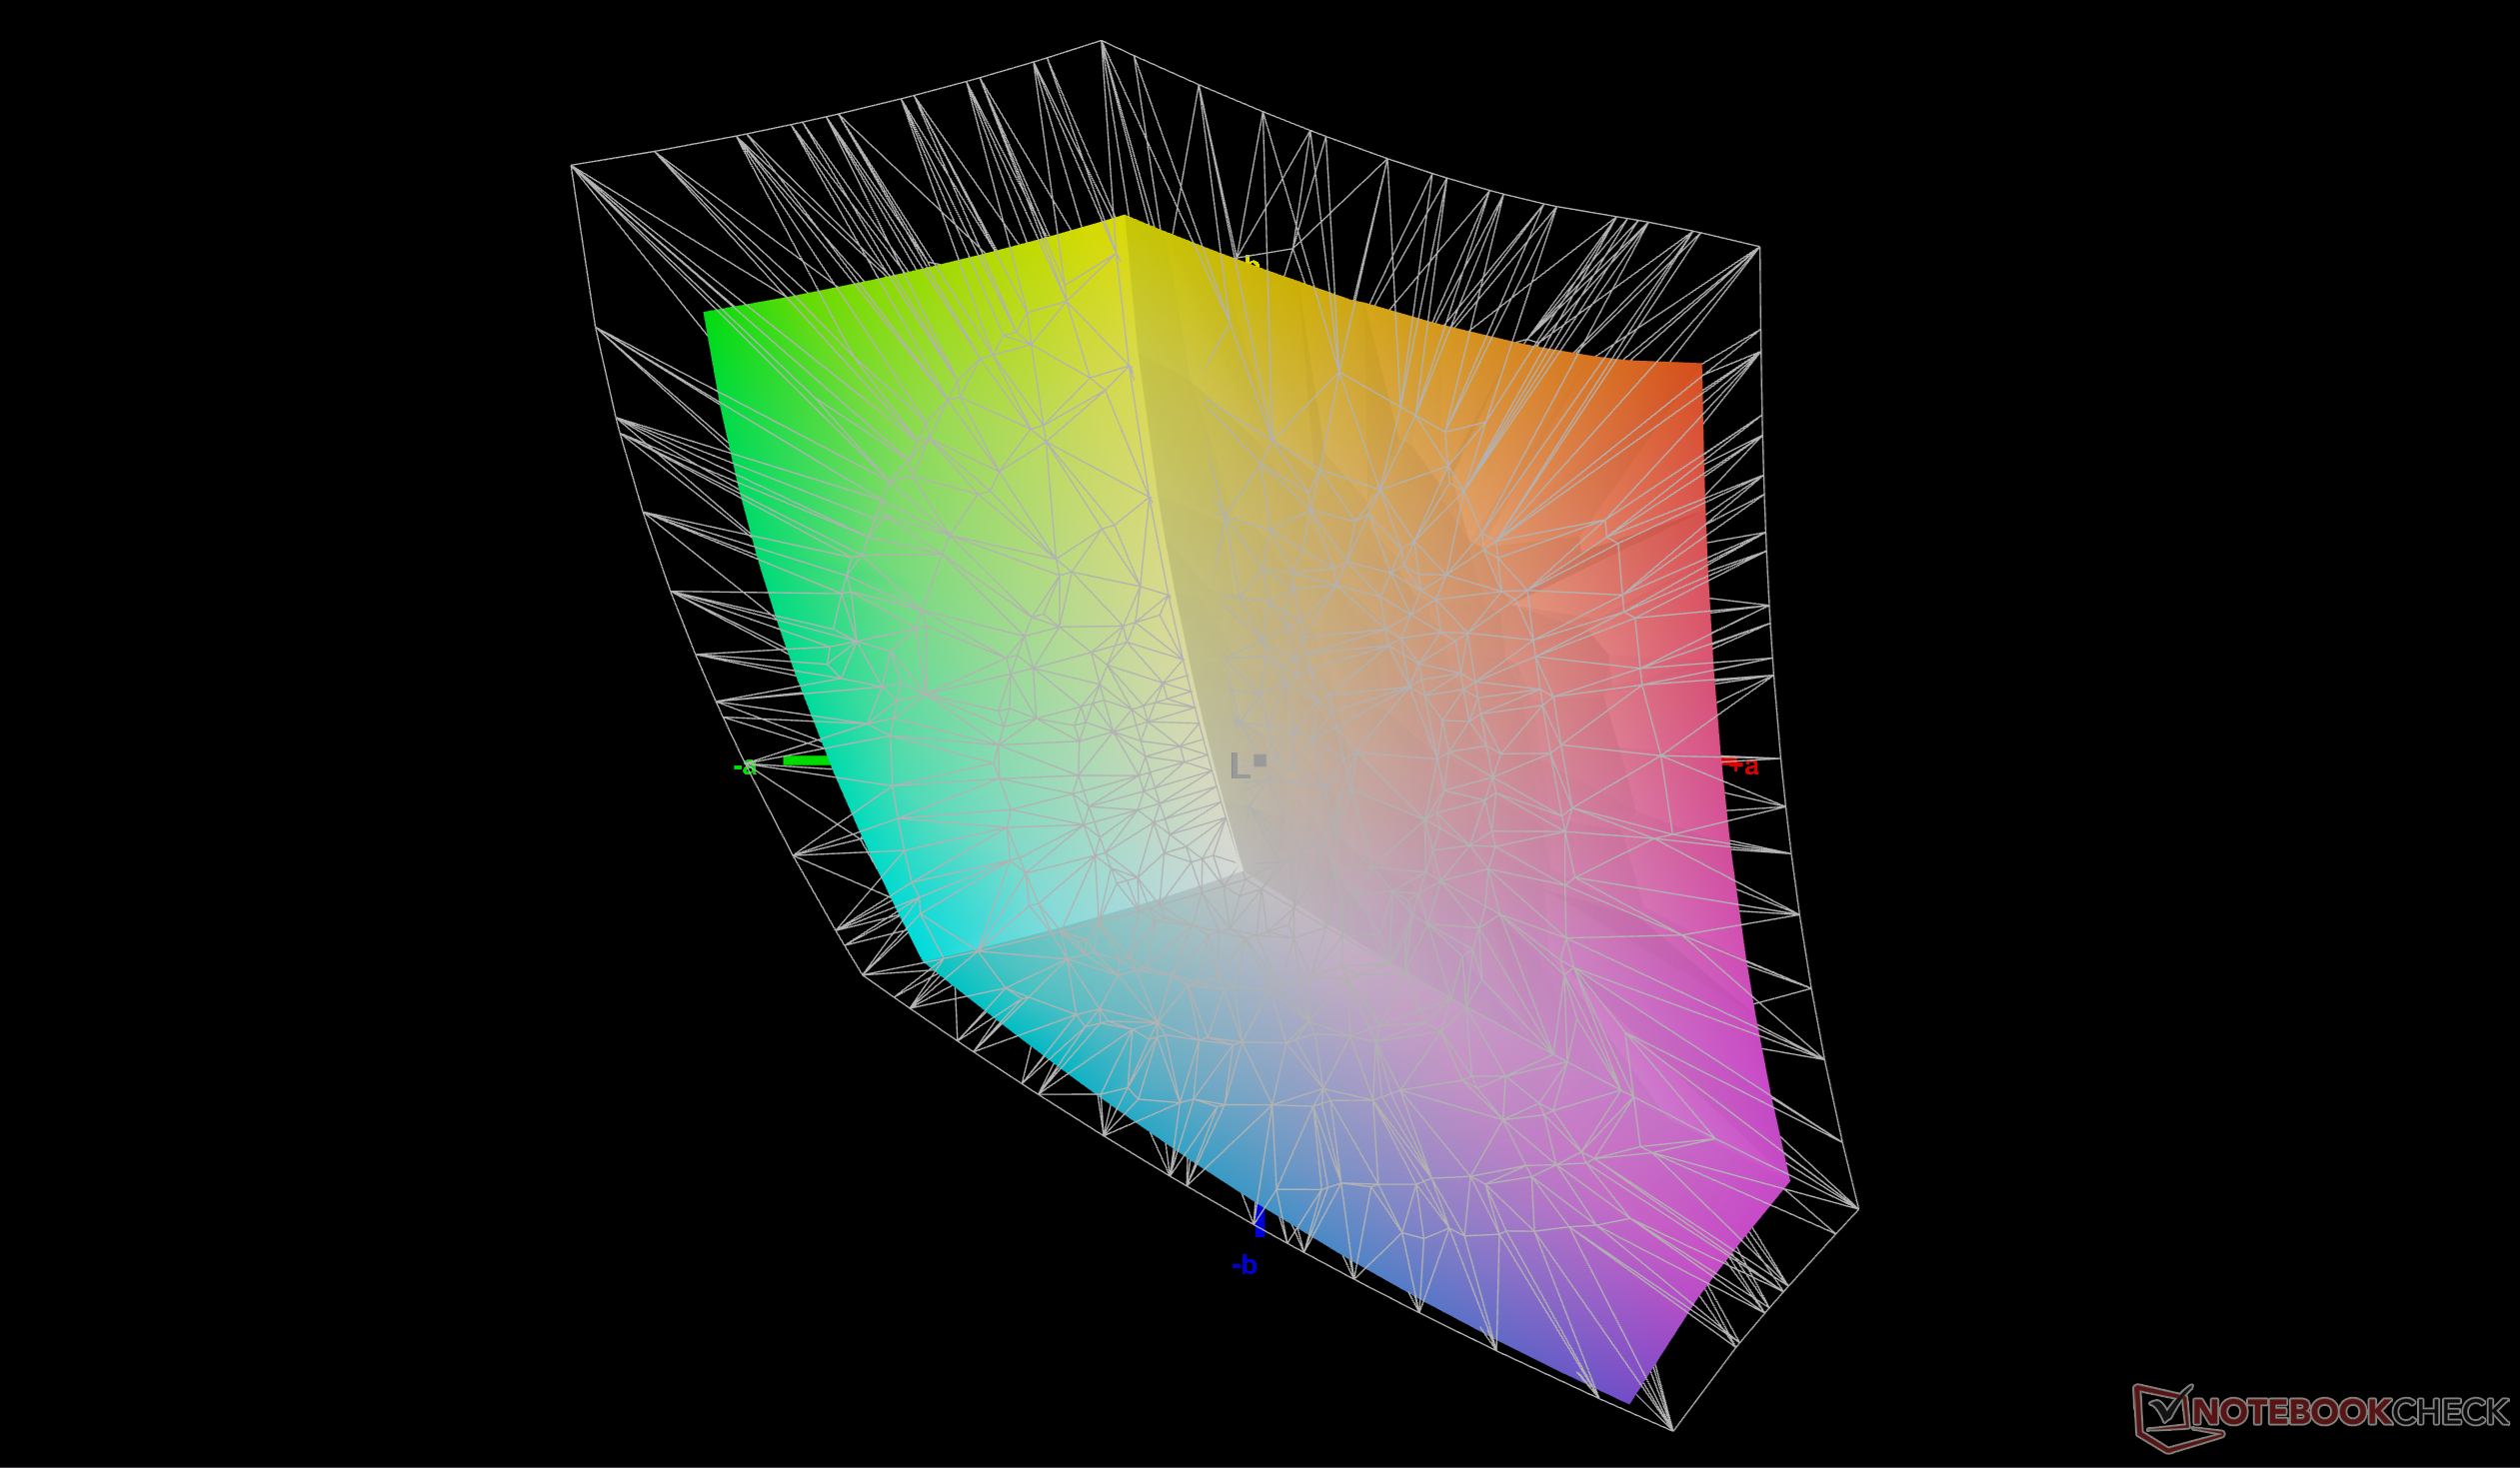
75% AdobeRGB 1998 (Argyll 3D)
98.8% sRGB (Argyll 3D)
73% Display P3 (Argyll 3D)
Gamma: 2.17
CCT: 6361 K
HP HyperX Omen 16 16-ap1931nr
BOE0CD1, IPS, 2560x1600, 16", 240 Hz
HP Omen 16-ap0091ng
AUODBB2, IPS, 1920x1200, 16", 144 Hz
MSI Crosshair A16 HX E8WGK
AU Optronics B160QAN02.3, IPS, 2560x1600, 16", 240 Hz
Alienware 16X Aurora Core Ultra 9 290HX Plus
Samsung 160HU05, OLED, 2560x1600, 16", 240 Hz
Lenovo Legion Pro 5 16IAX10, RTX 5070
ATNA60HS01-0 (Samsung SDC420A), OLED, 2650x1600, 16", 165 Hz
Asus TUF Gaming A16 FA608UP
MNG007DA5-3, IPS, 2560x1600, 16", 165 Hz
Display
-45%
14%
21%
21%
-4%
Display P3 Coverage (%)
73
40
-45%
94.9
30%
99.6
36%
99.3
36%
69.4
-5%
sRGB Coverage (%)
98.8
58.1
-41%
99.6
1%
100
1%
100
1%
97.2
-2%
AdobeRGB 1998 Coverage (%)
75
38.7
-48%
83.1
11%
93.9
25%
93.9
25%
71.9
-4%
Response Times
-237%
20%
96%
76%
21%
Response Time Grey 50% / Grey 80% * (ms)
5.6 ?(2.8, 2.8)
27.6 ?(12.9, 14.7)
-393%
4.2 ?(1.8, 2.4)
25%
0.29 ?(0.15, 0.14)
95%
2 ?(1, 1)
64%
6.3 ?(2.8, 3.5)
-13%
Response Time Black / White * (ms)
10.7 ?(5.5, 5.2)
19.4 ?(9.6, 9.8)
-81%
9.2 ?(4.9, 4.3)
14%
0.45 ?(0.23, 0.22)
96%
1.4 ?(0.8, 0.6)
87%
4.8 ?(1.7, 3.1)
55%
PWM Frequency (Hz)
1439.8 ?(100)
1300
PWM Amplitude * (%)
29
16.7
Screen
-77%
-14%
-3%
42%
15%
Brightness middle (cd/m²)
569.7
328
-42%
512.4
-10%
380.5
-33%
521
-9%
480
-16%
Brightness (cd/m²)
545
313
-43%
476
-13%
384
-30%
519
-5%
456
-16%
Brightness Distribution (%)
90
91
1%
89
-1%
98
9%
98
9%
91
1%
Black Level * (cd/m²)
0.47
0.26
45%
0.39
17%
0.075
84%
0.32
32%
Contrast (:1)
1212
1262
4%
1314
8%
6947
473%
1500
24%
Colorchecker dE 2000 *
3.31
4.73
-43%
4.65
-40%
3.27
1%
2.5
24%
1.4
58%
Colorchecker dE 2000 max. *
7.15
17.47
-144%
8.33
-17%
6.31
12%
4.85
32%
2.5
65%
Colorchecker dE 2000 calibrated *
0.67
4.22
-530%
1.3
-94%
1.1
-64%
2.5
-273%
1.3
-94%
Greyscale dE 2000 *
5.3
2.05
61%
3.9
26%
1
81%
3.17
40%
1.2
77%
Gamma
2.17 101%
2.63 84%
2.57 86%
2.23 99%
2.35 94%
2.16 102%
CCT
6361 102%
6718 97%
6813 95%
6410 101%
6454 101%
6620 98%
Total Average (Program / Settings)
-120% / -93%
7% / -3%
38% / 19%
46% / 42%
11% / 12%

* ... smaller is better

vs. sRGB
vs. sRGB
vs. P3
vs. P3
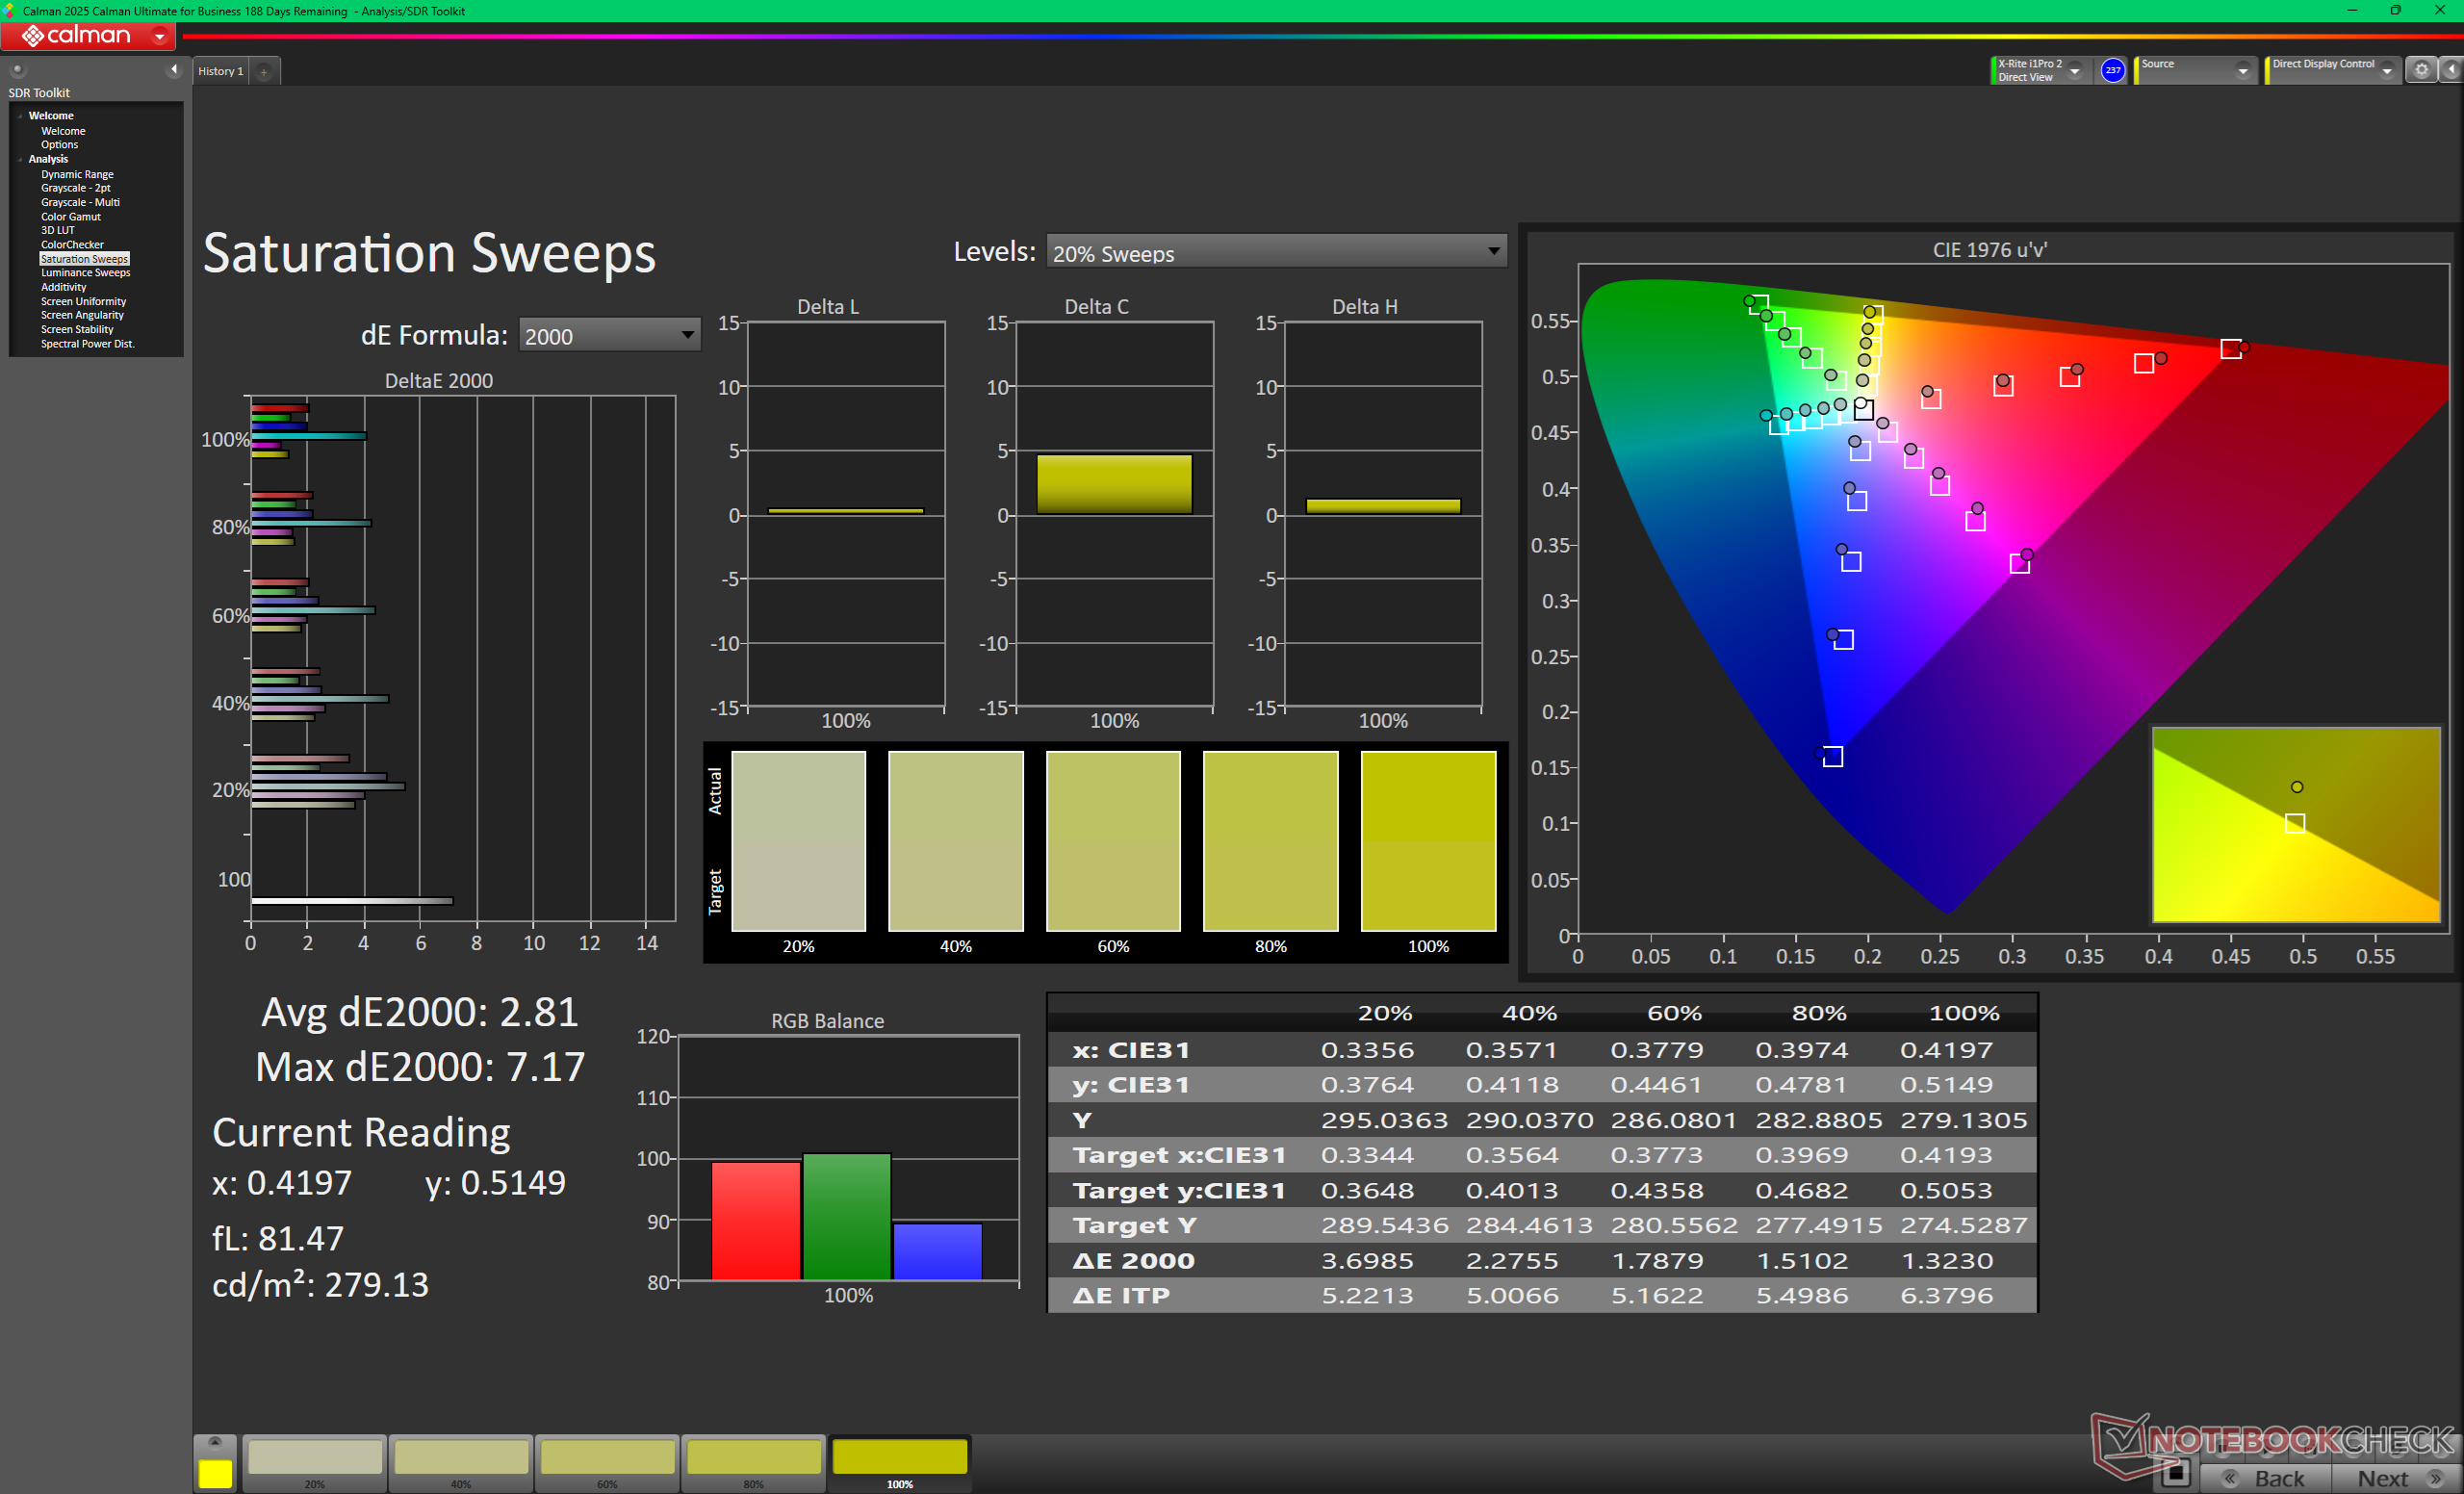
Grayscale before calibration (sRGB)
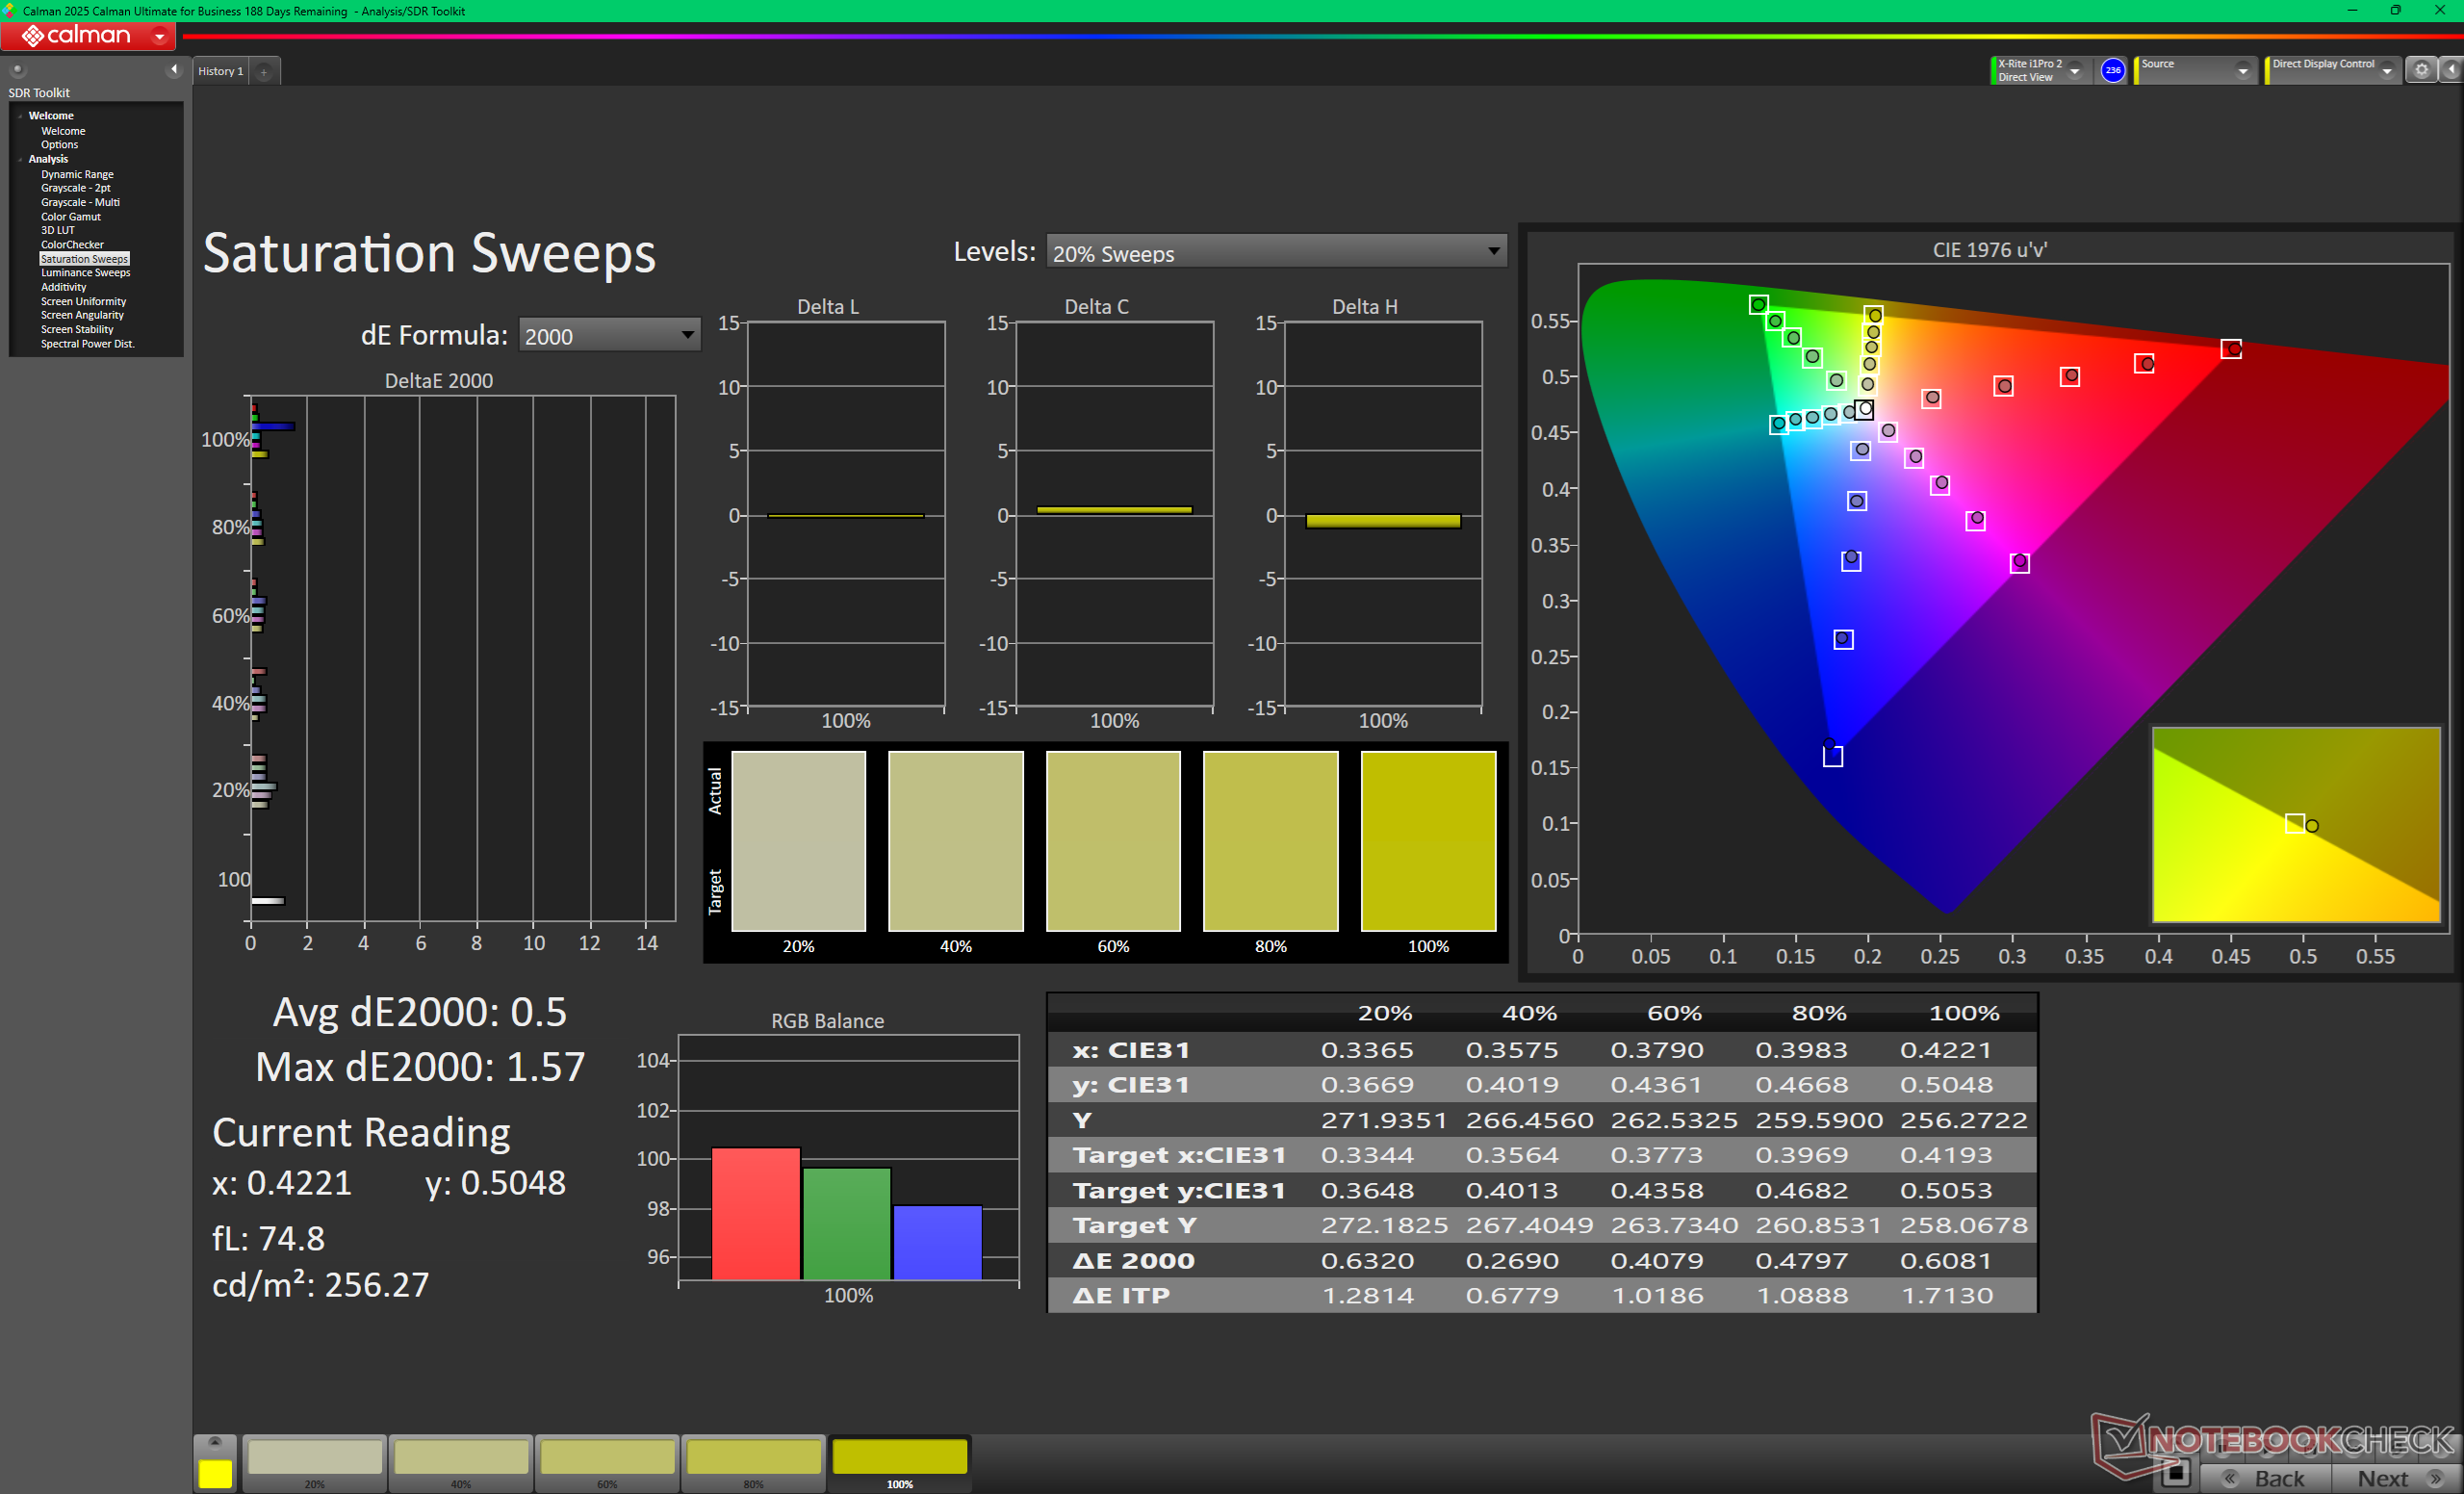
Saturation Sweeps before calibration (sRGB)
ColorChecker before calibration (sRGB)
Grayscale after calibration (sRGB)
Saturation Sweeps after calibration (sRGB)
ColorChecker after calibration (sRGB)

Display Response Times

Display response times show how fast the screen is able to change from one color to the next. Slow response times can lead to afterimages and can cause moving objects to appear blurry (ghosting). Gamers of fast-paced 3D titles should pay special attention to fast response times.
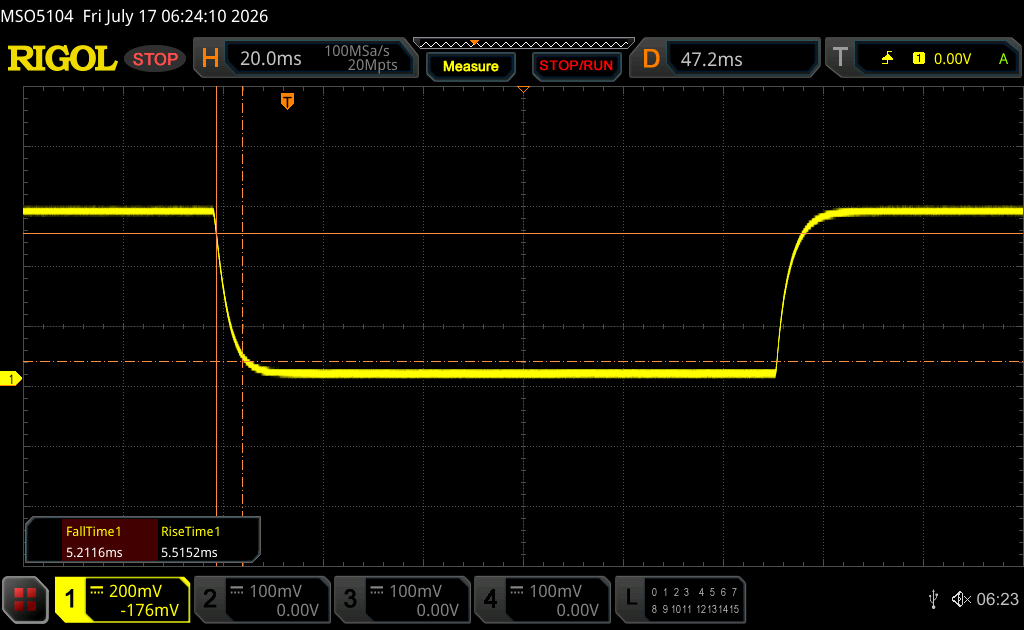
       Response Time Black to White
10.7 ms ... rise ↗ and fall ↘ combined↗ 5.5 ms rise
↘ 5.2 ms fall
The screen shows good response rates in our tests, but may be too slow for competitive gamers.
In comparison, all tested devices range from 0.1 (minimum) to 240 (maximum) ms. » 29 % of all devices are better.
This means that the measured response time is better than the average of all tested devices (19.7 ms).
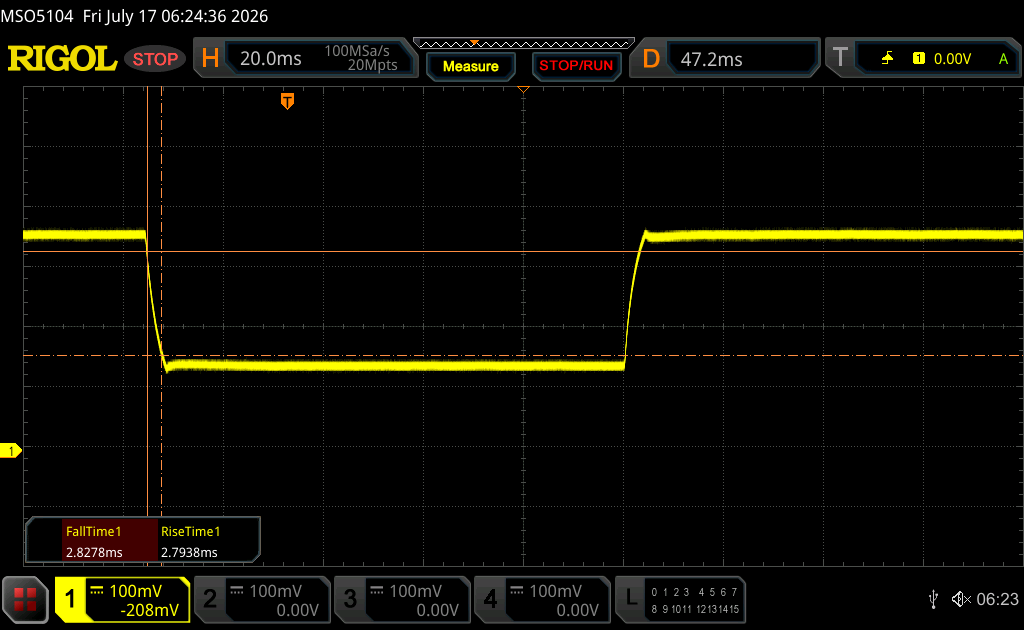
       Response Time 50% Grey to 80% Grey
5.6 ms ... rise ↗ and fall ↘ combined↗ 2.8 ms rise
↘ 2.8 ms fall
The screen shows very fast response rates in our tests and should be very well suited for fast-paced gaming.
In comparison, all tested devices range from 0.13 (minimum) to 636 (maximum) ms. » 18 % of all devices are better.
This means that the measured response time is better than the average of all tested devices (30.8 ms).

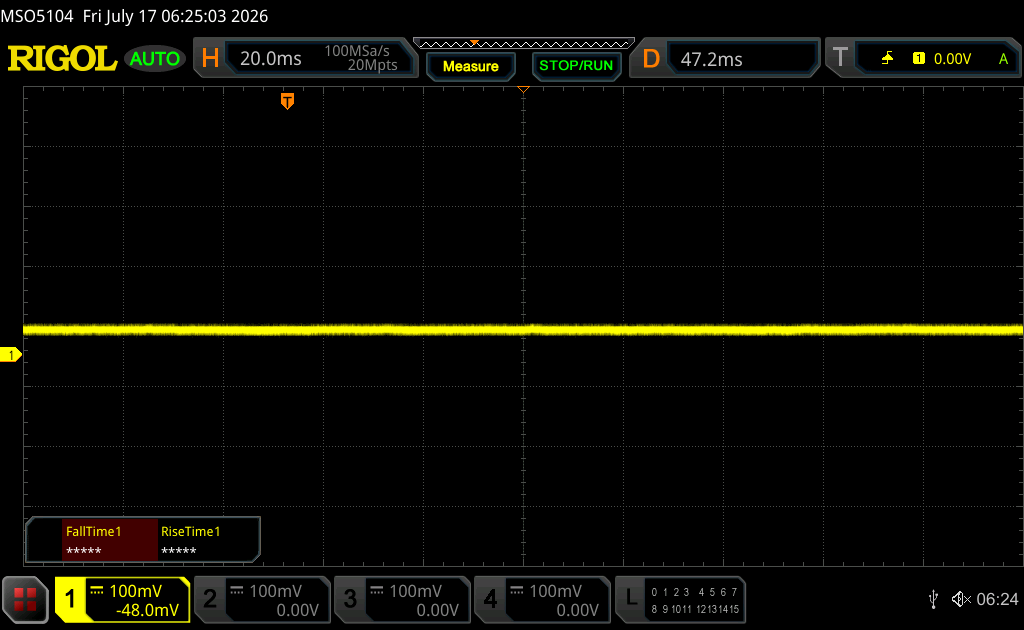
Screen Flickering / PWM (Pulse-Width Modulation)

To dim the screen, some notebooks will simply cycle the backlight on and off in rapid succession - a method called Pulse Width Modulation (PWM) . This cycling frequency should ideally be undetectable to the human eye. If said frequency is too low, users with sensitive eyes may experience strain or headaches or even notice the flickering altogether.
Screen flickering / PWM not detected

In comparison: 52 % of all tested devices do not use PWM to dim the display. If PWM was detected, an average of 7686 (minimum: 5 - maximum: 343500) Hz was measured.

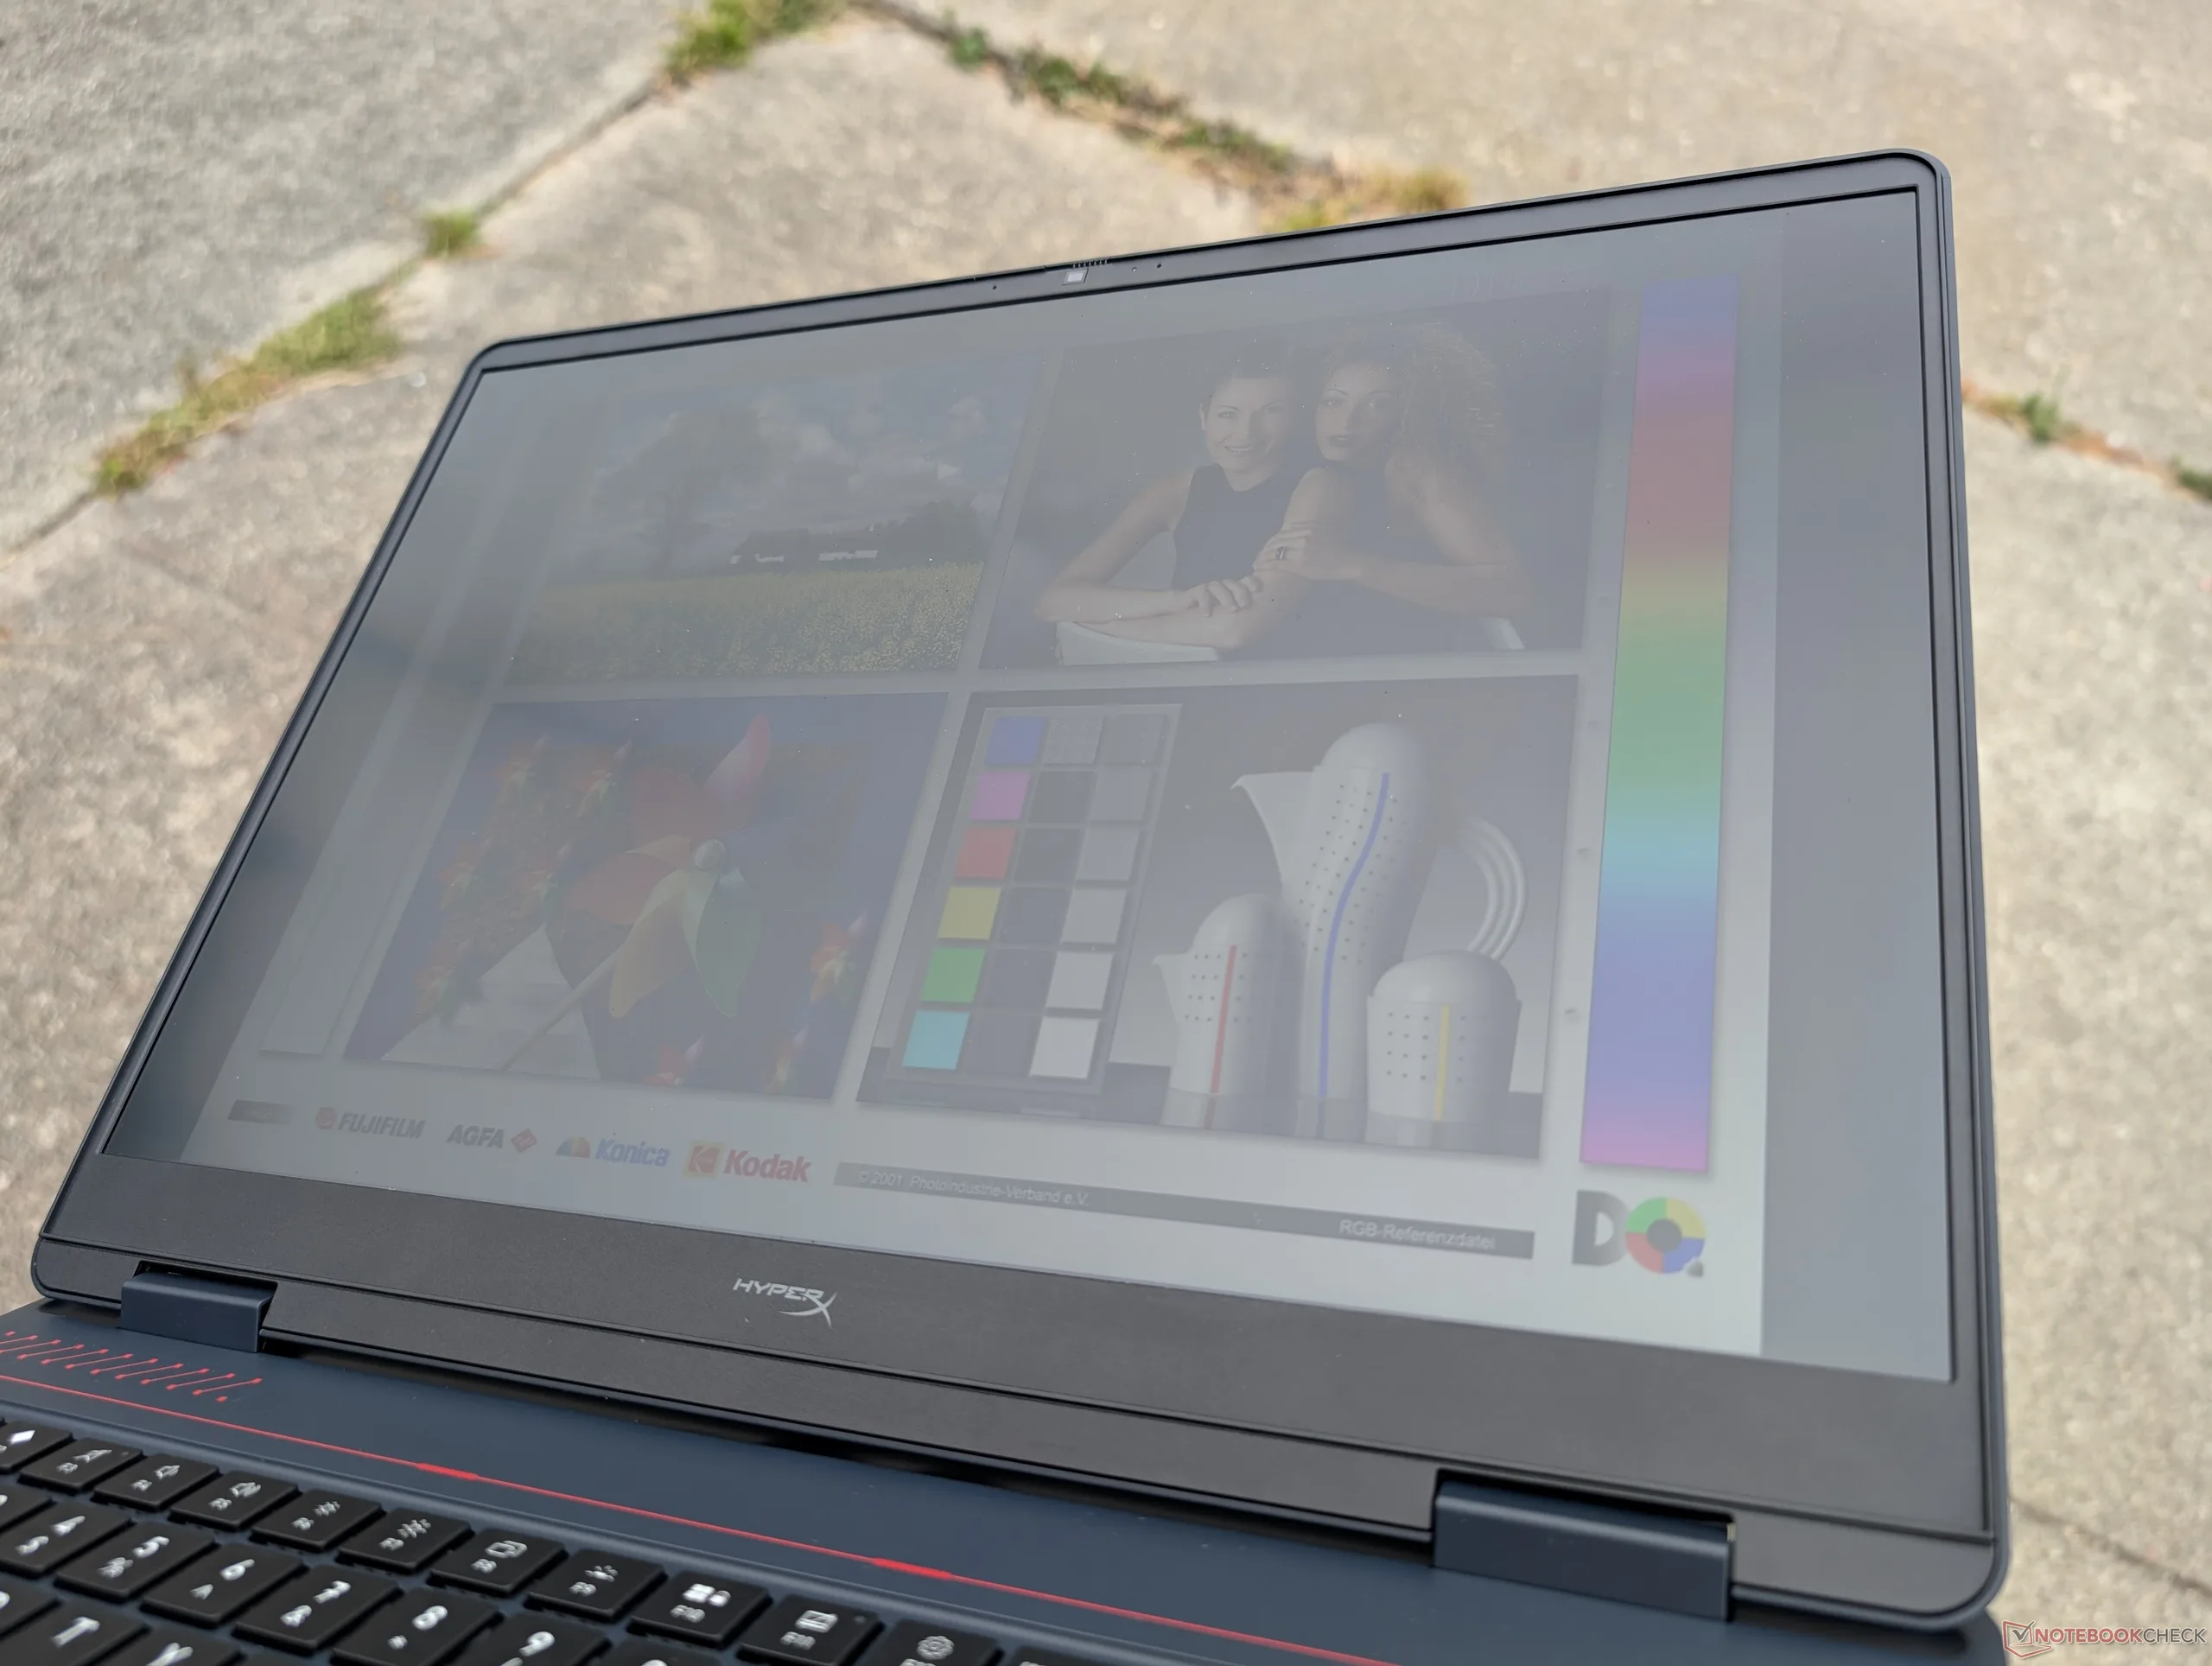
Outdoors under bright overcast
Outdoors under shade
Outdoors under bright overcast
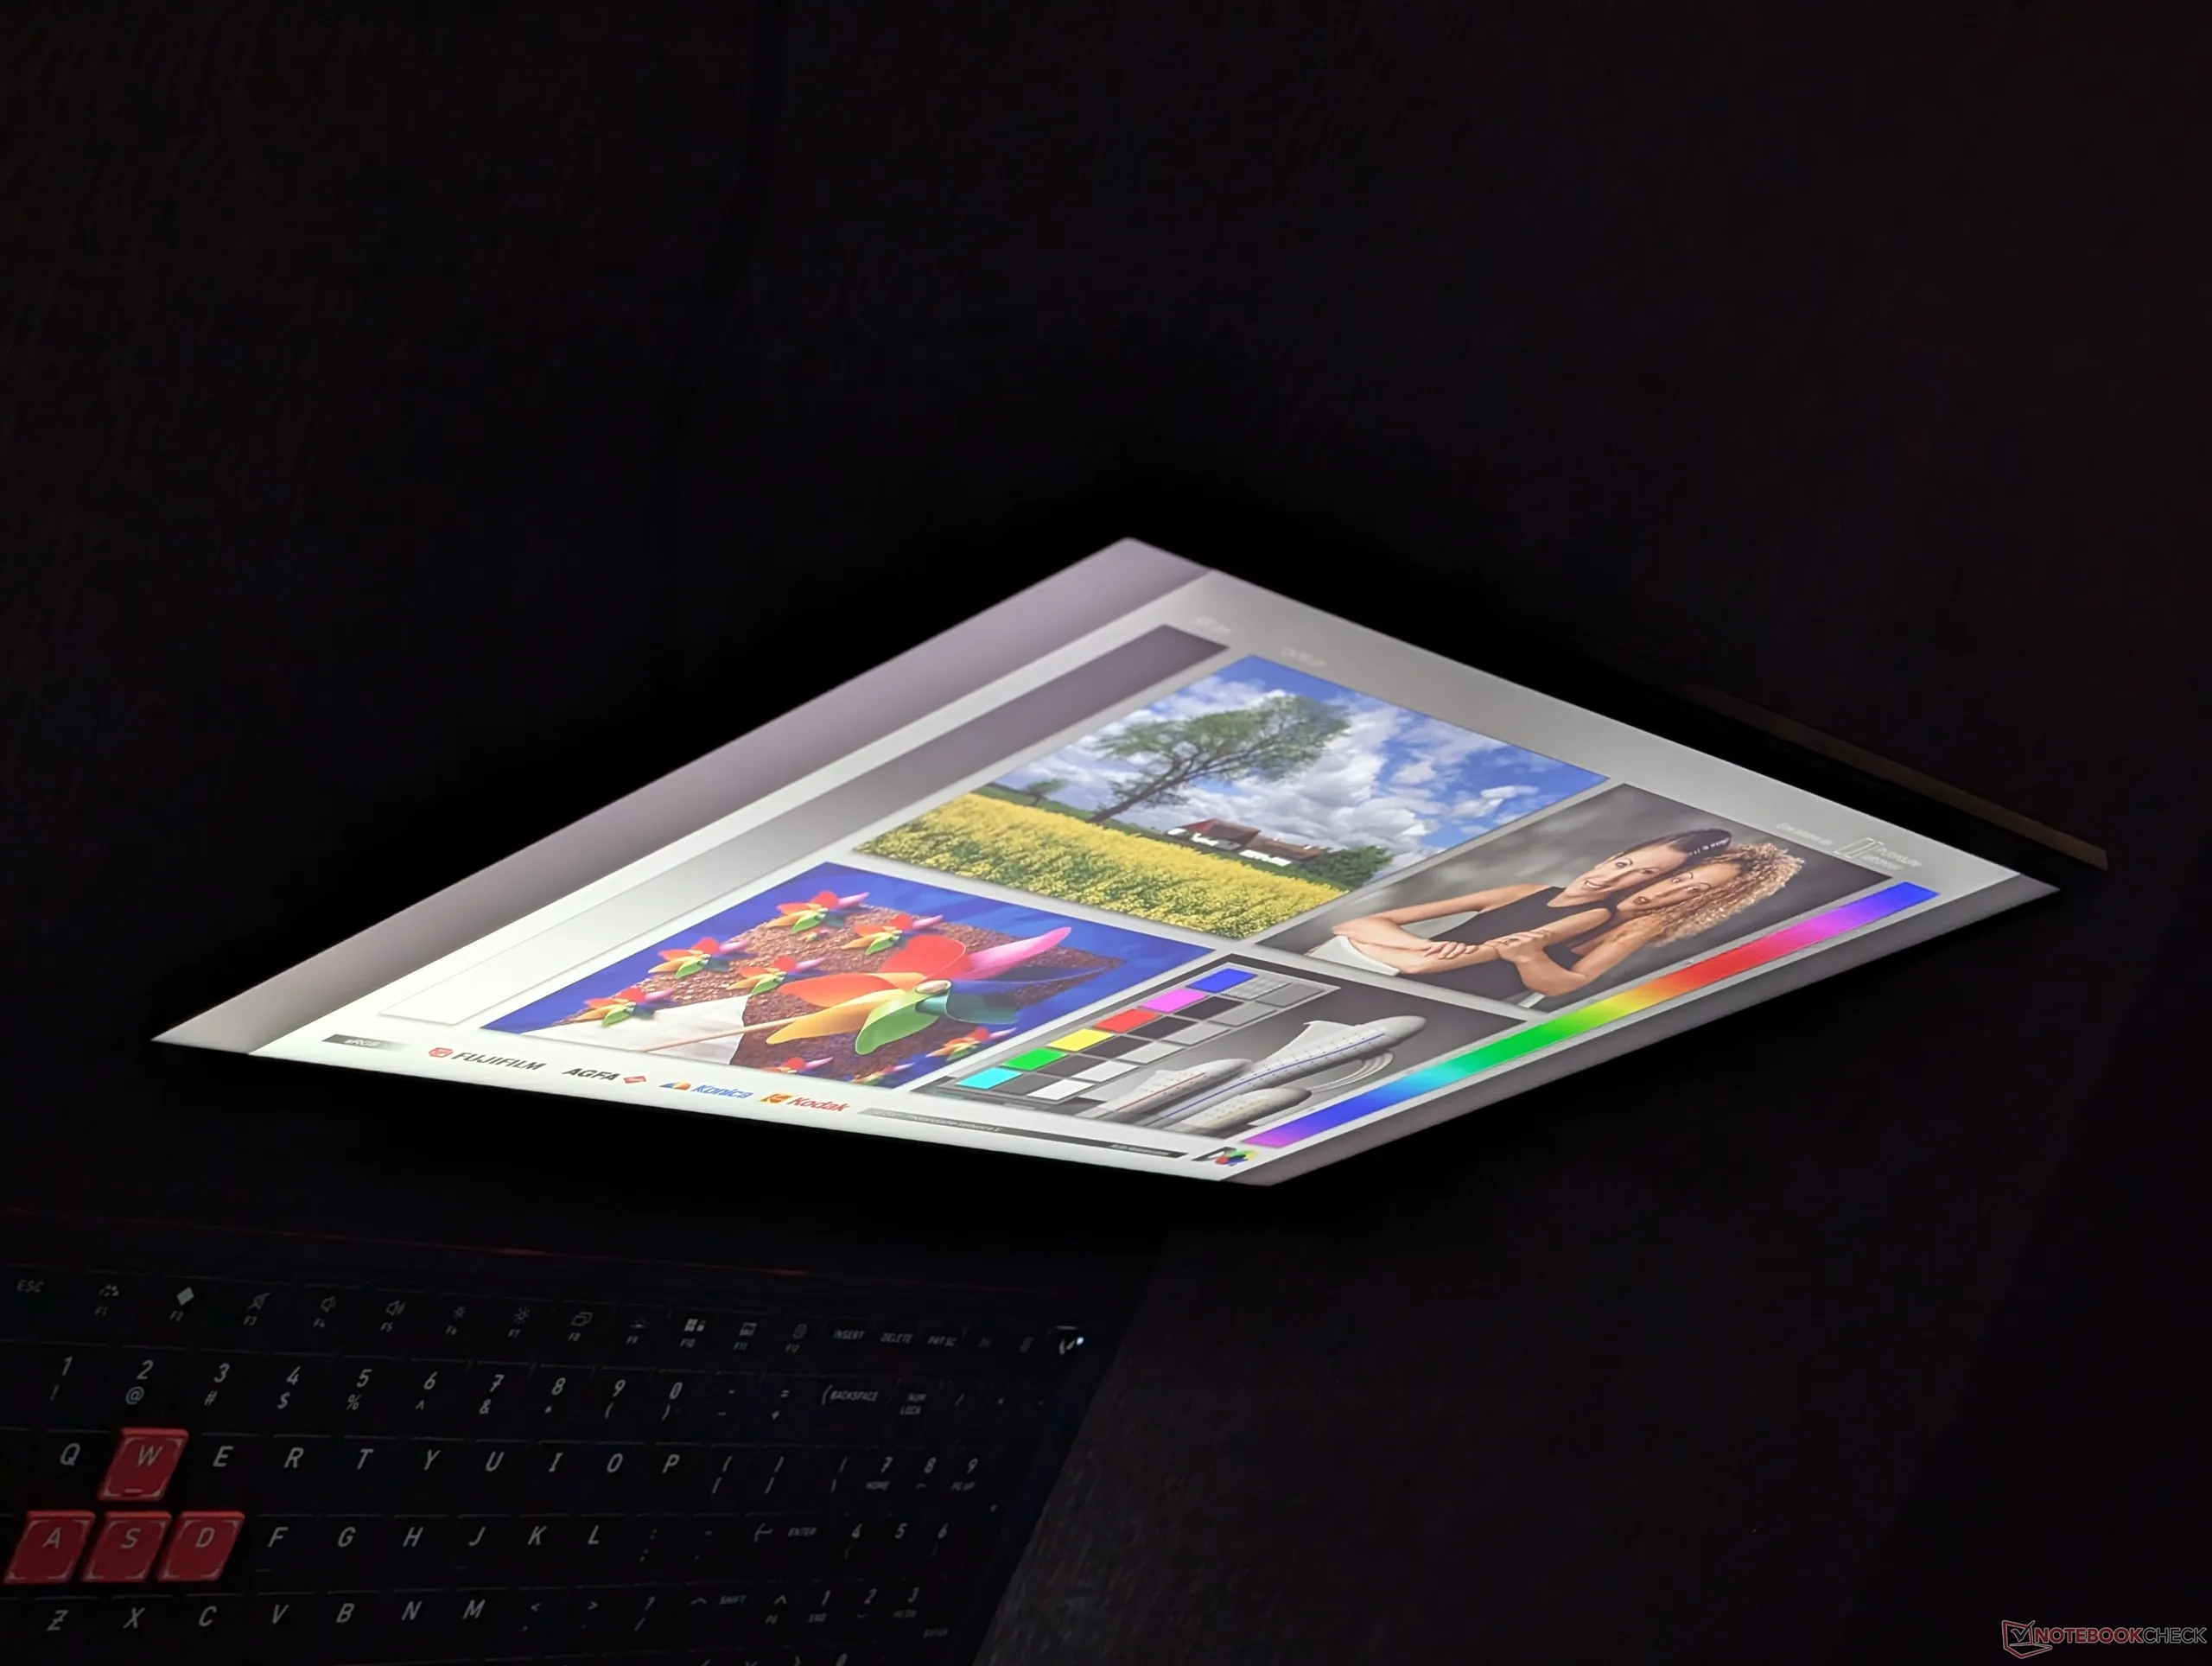
Wide IPS viewing angles

Performance

Testing Conditions

We set the system to Unleashed mode and discrete graphics mode prior to running the benchmarks below.

Processor Performance

Overall processor performance is only a hair slower than laptops with the Core Ultra 9 290HX Plus such as the Alienware 16X Aurora. The Ryzen 9 9955HXD is otherwise nearly identical to the Ryzen 9 9955HX outside of their L3 cache sizes.

Cinebench R15 Multi Loop

01202403604806007208409601080120013201440156016801800192020402160228024002520264027602880300031203240336034803600372038403960408042004320444045604680480049205040516052805400552056405760Tooltip
HP HyperX Omen 16 16-ap1931nr AMD Ryzen 9 9955HX3D: Ø5663 (5471.21-5839.42) Points
HP Omen 16-ap0091ng AMD Ryzen 9 8940HX: Ø4084 (4037.14-4295.53) Points
MSI Crosshair A16 HX E8WGK AMD Ryzen 9 8940HX: Ø5290 (5233.55-5355.47) Points
Alienware 16X Aurora Core Ultra 9 290HX Plus Intel Core Ultra 9 290HX Plus: Ø5102 (4340.28-5617.19) Points
Lenovo Legion Pro 5 16IAX10, RTX 5070 Intel Core Ultra 7 255HX: Ø4910 (4795.01-5190.09) Points
Asus TUF Gaming A16 FA608UP AMD Ryzen 7 260: Ø2740 (2520.16-2768.93) Points
CPU Performance rating: Percent
Cinebench R23: Multi Core | Single Core
Cinebench R20: CPU (Multi Core) | CPU (Single Core)
Cinebench R15: CPU Multi 64Bit | CPU Single 64Bit
Blender: v2.79 BMW27 CPU
7-Zip 18.03: 7z b 4 | 7z b 4 -mmt1
Geekbench 6.7: Multi-Core | Single-Core
Geekbench 5.5: Multi-Core | Single-Core
HWBOT x265 Benchmark v2.2: 4k Preset
LibreOffice : 20 Documents To PDF
R Benchmark 2.5: Overall mean
CPU Performance rating
Average AMD Ryzen 9 9955HX3D
 
85 pt
Schenker XMG APEX 16 MAX
AMD Ryzen 9 9955HX
84.8 pt
Alienware 16X Aurora Core Ultra 9 290HX Plus
Intel Core Ultra 9 290HX Plus
83 pt
HP HyperX Omen 16 16-ap1931nr
AMD Ryzen 9 9955HX3D
82.4 pt
Acer Predator Helios Neo 16S AI PHN16S-71-94L9
Intel Core Ultra 9 275HX
77.6 pt
Lenovo Legion Pro 5 16IAX10, RTX 5070
Intel Core Ultra 7 255HX
77.5 pt
MSI Crosshair A16 HX E8WGK
AMD Ryzen 9 8940HX
75.6 pt
Lenovo Legion 9 16IRX9, RTX 4090
Intel Core i9-14900HX
67.1 pt
HP Omen 16-ap0091ng
AMD Ryzen 9 8940HX
65.6 pt
Alienware m16 R1 Intel
Intel Core i7-13700HX
59 pt
Asus TUF Gaming A16 FA608UP
AMD Ryzen 7 260
52.7 pt
Cinebench R23 / Multi Core
Average AMD Ryzen 9 9955HX3D
  (36580 - 39266, n=4)
38042 Points +4%
Alienware 16X Aurora Core Ultra 9 290HX Plus
Intel Core Ultra 9 290HX Plus
37038 (32828min - 37037.5max) Points +1%
HP HyperX Omen 16 16-ap1931nr
AMD Ryzen 9 9955HX3D
36580 (35337.4min - 36580.1max) Points
Schenker XMG APEX 16 MAX
AMD Ryzen 9 9955HX
35960 Points -2%
Lenovo Legion Pro 5 16IAX10, RTX 5070
Intel Core Ultra 7 255HX
34005 Points -7%
MSI Crosshair A16 HX E8WGK
AMD Ryzen 9 8940HX
32745 (32277.9min - 32745.3max) Points -10%
Lenovo Legion 9 16IRX9, RTX 4090
Intel Core i9-14900HX
31889 Points -13%
Acer Predator Helios Neo 16S AI PHN16S-71-94L9
Intel Core Ultra 9 275HX
31727 Points -13%
HP Omen 16-ap0091ng
AMD Ryzen 9 8940HX
27145 Points -26%
Alienware m16 R1 Intel
Intel Core i7-13700HX
21889 Points -40%
Asus TUF Gaming A16 FA608UP
AMD Ryzen 7 260
17277 Points -53%
Cinebench R23 / Single Core
Alienware 16X Aurora Core Ultra 9 290HX Plus
Intel Core Ultra 9 290HX Plus
2330 Points +8%
Acer Predator Helios Neo 16S AI PHN16S-71-94L9
Intel Core Ultra 9 275HX
2250 Points +4%
Schenker XMG APEX 16 MAX
AMD Ryzen 9 9955HX
2172 Points +1%
Lenovo Legion Pro 5 16IAX10, RTX 5070
Intel Core Ultra 7 255HX
2163 Points 0%
Average AMD Ryzen 9 9955HX3D
  (2150 - 2179, n=4)
2162 Points 0%
HP HyperX Omen 16 16-ap1931nr
AMD Ryzen 9 9955HX3D
2154 Points
Alienware m16 R1 Intel
Intel Core i7-13700HX
1933 Points -10%
HP Omen 16-ap0091ng
AMD Ryzen 9 8940HX
1917 Points -11%
MSI Crosshair A16 HX E8WGK
AMD Ryzen 9 8940HX
1886 Points -12%
Asus TUF Gaming A16 FA608UP
AMD Ryzen 7 260
1760 Points -18%
Lenovo Legion 9 16IRX9, RTX 4090
Intel Core i9-14900HX
1720 Points -20%
Cinebench R20 / CPU (Multi Core)
Average AMD Ryzen 9 9955HX3D
  (14209 - 15177, n=4)
14831 Points +4%
Alienware 16X Aurora Core Ultra 9 290HX Plus
Intel Core Ultra 9 290HX Plus
14397 Points +1%
HP HyperX Omen 16 16-ap1931nr
AMD Ryzen 9 9955HX3D
14209 Points
Schenker XMG APEX 16 MAX
AMD Ryzen 9 9955HX
13963 Points -2%
Lenovo Legion Pro 5 16IAX10, RTX 5070
Intel Core Ultra 7 255HX
13056 Points -8%
MSI Crosshair A16 HX E8WGK
AMD Ryzen 9 8940HX
12785 Points -10%
Acer Predator Helios Neo 16S AI PHN16S-71-94L9
Intel Core Ultra 9 275HX
12542 Points -12%
Lenovo Legion 9 16IRX9, RTX 4090
Intel Core i9-14900HX
11960 Points -16%
HP Omen 16-ap0091ng
AMD Ryzen 9 8940HX
10439 Points -27%
Alienware m16 R1 Intel
Intel Core i7-13700HX
8062 Points -43%
Asus TUF Gaming A16 FA608UP
AMD Ryzen 7 260
6770 Points -52%
Cinebench R20 / CPU (Single Core)
Acer Predator Helios Neo 16S AI PHN16S-71-94L9
Intel Core Ultra 9 275HX
865 Points +2%
Alienware 16X Aurora Core Ultra 9 290HX Plus
Intel Core Ultra 9 290HX Plus
864 Points +2%
Schenker XMG APEX 16 MAX
AMD Ryzen 9 9955HX
856 Points +1%
HP HyperX Omen 16 16-ap1931nr
AMD Ryzen 9 9955HX3D
845 Points
Average AMD Ryzen 9 9955HX3D
  (790 - 851, n=4)
833 Points -1%
Lenovo Legion Pro 5 16IAX10, RTX 5070
Intel Core Ultra 7 255HX
831 Points -2%
HP Omen 16-ap0091ng
AMD Ryzen 9 8940HX
745 Points -12%
Alienware m16 R1 Intel
Intel Core i7-13700HX
738 Points -13%
MSI Crosshair A16 HX E8WGK
AMD Ryzen 9 8940HX
736 Points -13%
Asus TUF Gaming A16 FA608UP
AMD Ryzen 7 260
679 Points -20%
Lenovo Legion 9 16IRX9, RTX 4090
Intel Core i9-14900HX
657 Points -22%
Cinebench R15 / CPU Multi 64Bit
Average AMD Ryzen 9 9955HX3D
  (5839 - 6068, n=4)
5998 Points +3%
HP HyperX Omen 16 16-ap1931nr
AMD Ryzen 9 9955HX3D
5839 (5471.21min - 5839.42max) Points
Schenker XMG APEX 16 MAX
AMD Ryzen 9 9955HX
5624 (5340.45min - 5623.51max) Points -4%
Alienware 16X Aurora Core Ultra 9 290HX Plus
Intel Core Ultra 9 290HX Plus
5617 (4340.28min - 5617.19max) Points -4%
MSI Crosshair A16 HX E8WGK
AMD Ryzen 9 8940HX
5355 (5233.55min - 5355.47max) Points -8%
Lenovo Legion Pro 5 16IAX10, RTX 5070
Intel Core Ultra 7 255HX
5190 (4795.01min - 5190.09max) Points -11%
Lenovo Legion 9 16IRX9, RTX 4090
Intel Core i9-14900HX
4879 (4505.52min - 4878.64max) Points -16%
Acer Predator Helios Neo 16S AI PHN16S-71-94L9
Intel Core Ultra 9 275HX
4737 (4180.6min - 4737.09max) Points -19%
HP Omen 16-ap0091ng
AMD Ryzen 9 8940HX
4296 (4037.14min - 4295.53max) Points -26%
Alienware m16 R1 Intel
Intel Core i7-13700HX
3183 Points -45%
Asus TUF Gaming A16 FA608UP
AMD Ryzen 7 260
2769 (2520.16min - 2768.93max) Points -53%
Cinebench R15 / CPU Single 64Bit
Alienware 16X Aurora Core Ultra 9 290HX Plus
Intel Core Ultra 9 290HX Plus
340 Points +1%
Schenker XMG APEX 16 MAX
AMD Ryzen 9 9955HX
336 Points 0%
Acer Predator Helios Neo 16S AI PHN16S-71-94L9
Intel Core Ultra 9 275HX
335 Points 0%
HP HyperX Omen 16 16-ap1931nr
AMD Ryzen 9 9955HX3D
335 Points
Average AMD Ryzen 9 9955HX3D
  (321 - 335, n=4)
330 Points -1%
Lenovo Legion Pro 5 16IAX10, RTX 5070
Intel Core Ultra 7 255HX
328 Points -2%
MSI Crosshair A16 HX E8WGK
AMD Ryzen 9 8940HX
301 Points -10%
HP Omen 16-ap0091ng
AMD Ryzen 9 8940HX
292 Points -13%
Alienware m16 R1 Intel
Intel Core i7-13700HX
277 Points -17%
Asus TUF Gaming A16 FA608UP
AMD Ryzen 7 260
275 Points -18%
Lenovo Legion 9 16IRX9, RTX 4090
Intel Core i9-14900HX
247 Points -26%
Blender / v2.79 BMW27 CPU
Asus TUF Gaming A16 FA608UP
AMD Ryzen 7 260
182 Seconds * -100%
Alienware m16 R1 Intel
Intel Core i7-13700HX
159 Seconds * -75%
HP Omen 16-ap0091ng
AMD Ryzen 9 8940HX
116 Seconds * -27%
Acer Predator Helios Neo 16S AI PHN16S-71-94L9
Intel Core Ultra 9 275HX
112 Seconds * -23%
Lenovo Legion 9 16IRX9, RTX 4090
Intel Core i9-14900HX
106 Seconds * -16%
Lenovo Legion Pro 5 16IAX10, RTX 5070
Intel Core Ultra 7 255HX
104 Seconds * -14%
MSI Crosshair A16 HX E8WGK
AMD Ryzen 9 8940HX
96 Seconds * -5%
Alienware 16X Aurora Core Ultra 9 290HX Plus
Intel Core Ultra 9 290HX Plus
94 Seconds * -3%
HP HyperX Omen 16 16-ap1931nr
AMD Ryzen 9 9955HX3D
91 Seconds *
Schenker XMG APEX 16 MAX
AMD Ryzen 9 9955HX
85 Seconds * +7%
Average AMD Ryzen 9 9955HX3D
  (80 - 91, n=4)
83.3 Seconds * +8%
7-Zip 18.03 / 7z b 4
Average AMD Ryzen 9 9955HX3D
  (130158 - 148086, n=4)
142262 MIPS +9%
Schenker XMG APEX 16 MAX
AMD Ryzen 9 9955HX
139824 MIPS +7%
MSI Crosshair A16 HX E8WGK
AMD Ryzen 9 8940HX
137645 MIPS +6%
HP HyperX Omen 16 16-ap1931nr
AMD Ryzen 9 9955HX3D
130158 MIPS
Lenovo Legion 9 16IRX9, RTX 4090
Intel Core i9-14900HX
125676 MIPS -3%
Lenovo Legion Pro 5 16IAX10, RTX 5070
Intel Core Ultra 7 255HX
104055 MIPS -20%
Alienware 16X Aurora Core Ultra 9 290HX Plus
Intel Core Ultra 9 290HX Plus
103986 MIPS -20%
HP Omen 16-ap0091ng
AMD Ryzen 9 8940HX
103455 MIPS -21%
Acer Predator Helios Neo 16S AI PHN16S-71-94L9
Intel Core Ultra 9 275HX
102844 MIPS -21%
Alienware m16 R1 Intel
Intel Core i7-13700HX
83449 MIPS -36%
Asus TUF Gaming A16 FA608UP
AMD Ryzen 7 260
72400 MIPS -44%
7-Zip 18.03 / 7z b 4 -mmt1
HP Omen 16-ap0091ng
AMD Ryzen 9 8940HX
7407 MIPS +6%
Schenker XMG APEX 16 MAX
AMD Ryzen 9 9955HX
7374 MIPS +6%
MSI Crosshair A16 HX E8WGK
AMD Ryzen 9 8940HX
7220 MIPS +4%
Average AMD Ryzen 9 9955HX3D
  (6960 - 7382, n=4)
7198 MIPS +3%
Acer Predator Helios Neo 16S AI PHN16S-71-94L9
Intel Core Ultra 9 275HX
6981 MIPS 0%
HP HyperX Omen 16 16-ap1931nr
AMD Ryzen 9 9955HX3D
6960 MIPS
Lenovo Legion Pro 5 16IAX10, RTX 5070
Intel Core Ultra 7 255HX
6576 MIPS -6%
Alienware 16X Aurora Core Ultra 9 290HX Plus
Intel Core Ultra 9 290HX Plus
6562 MIPS -6%
Alienware m16 R1 Intel
Intel Core i7-13700HX
6409 MIPS -8%
Asus TUF Gaming A16 FA608UP
AMD Ryzen 7 260
6101 MIPS -12%
Lenovo Legion 9 16IRX9, RTX 4090
Intel Core i9-14900HX
5452 MIPS -22%
Geekbench 6.7 / Multi-Core
Average AMD Ryzen 9 9955HX3D
  (19418 - 20551, n=6)
20040 Points +3%
Alienware 16X Aurora Core Ultra 9 290HX Plus
Intel Core Ultra 9 290HX Plus
19855 Points +2%
Schenker XMG APEX 16 MAX
AMD Ryzen 9 9955HX
19725 Points +2%
Acer Predator Helios Neo 16S AI PHN16S-71-94L9
Intel Core Ultra 9 275HX
19675 Points +1%
Lenovo Legion Pro 5 16IAX10, RTX 5070
Intel Core Ultra 7 255HX
19623 Points +1%
HP HyperX Omen 16 16-ap1931nr
AMD Ryzen 9 9955HX3D
19418 Points
Lenovo Legion 9 16IRX9, RTX 4090
Intel Core i9-14900HX
17499 Points -10%
MSI Crosshair A16 HX E8WGK
AMD Ryzen 9 8940HX
16483 Points -15%
Alienware m16 R1 Intel
Intel Core i7-13700HX
14402 Points -26%
Asus TUF Gaming A16 FA608UP
AMD Ryzen 7 260
13299 Points -32%
HP Omen 16-ap0091ng
AMD Ryzen 9 8940HX
11447 Points -41%
Geekbench 6.7 / Single-Core
Schenker XMG APEX 16 MAX
AMD Ryzen 9 9955HX
3259 Points +3%
Average AMD Ryzen 9 9955HX3D
  (3146 - 3237, n=6)
3186 Points +1%
HP HyperX Omen 16 16-ap1931nr
AMD Ryzen 9 9955HX3D
3159 Points
Alienware 16X Aurora Core Ultra 9 290HX Plus
Intel Core Ultra 9 290HX Plus
3147 Points 0%
Acer Predator Helios Neo 16S AI PHN16S-71-94L9
Intel Core Ultra 9 275HX
3113 Points -1%
Lenovo Legion Pro 5 16IAX10, RTX 5070
Intel Core Ultra 7 255HX
3028 Points -4%
MSI Crosshair A16 HX E8WGK
AMD Ryzen 9 8940HX
2839 Points -10%
HP Omen 16-ap0091ng
AMD Ryzen 9 8940HX
2816 Points -11%
Asus TUF Gaming A16 FA608UP
AMD Ryzen 7 260
2673 Points -15%
Alienware m16 R1 Intel
Intel Core i7-13700HX
2638 Points -16%
Lenovo Legion 9 16IRX9, RTX 4090
Intel Core i9-14900HX
2419 Points -23%
Geekbench 5.5 / Multi-Core
Alienware 16X Aurora Core Ultra 9 290HX Plus
Intel Core Ultra 9 290HX Plus
23839 Points +12%
Average AMD Ryzen 9 9955HX3D
  (21223 - 23669, n=4)
23005 Points +8%
Schenker XMG APEX 16 MAX
AMD Ryzen 9 9955HX
22716 Points +7%
Acer Predator Helios Neo 16S AI PHN16S-71-94L9
Intel Core Ultra 9 275HX
22082 Points +4%
Lenovo Legion 9 16IRX9, RTX 4090
Intel Core i9-14900HX
21642 Points +2%
HP HyperX Omen 16 16-ap1931nr
AMD Ryzen 9 9955HX3D
21223 Points
Lenovo Legion Pro 5 16IAX10, RTX 5070
Intel Core Ultra 7 255HX
20532 Points -3%
MSI Crosshair A16 HX E8WGK
AMD Ryzen 9 8940HX
19054 Points -10%
Alienware m16 R1 Intel
Intel Core i7-13700HX
14448 Points -32%
HP Omen 16-ap0091ng
AMD Ryzen 9 8940HX
13357 Points -37%
Asus TUF Gaming A16 FA608UP
AMD Ryzen 7 260
12239 Points -42%
Geekbench 5.5 / Single-Core
Schenker XMG APEX 16 MAX
AMD Ryzen 9 9955HX
2474 Points +6%
Average AMD Ryzen 9 9955HX3D
  (2326 - 2406, n=4)
2379 Points +2%
HP HyperX Omen 16 16-ap1931nr
AMD Ryzen 9 9955HX3D
2326 Points
Alienware 16X Aurora Core Ultra 9 290HX Plus
Intel Core Ultra 9 290HX Plus
2282 Points -2%
Lenovo Legion Pro 5 16IAX10, RTX 5070
Intel Core Ultra 7 255HX
2211 Points -5%
Acer Predator Helios Neo 16S AI PHN16S-71-94L9
Intel Core Ultra 9 275HX
2196 Points -6%
MSI Crosshair A16 HX E8WGK
AMD Ryzen 9 8940HX
2025 Points -13%
HP Omen 16-ap0091ng
AMD Ryzen 9 8940HX
1961 Points -16%
Asus TUF Gaming A16 FA608UP
AMD Ryzen 7 260
1954 Points -16%
Alienware m16 R1 Intel
Intel Core i7-13700HX
1845 Points -21%
Lenovo Legion 9 16IRX9, RTX 4090
Intel Core i9-14900HX
1729 Points -26%
HWBOT x265 Benchmark v2.2 / 4k Preset
Average AMD Ryzen 9 9955HX3D
  (39 - 43, n=4)
41.8 fps +7%
Schenker XMG APEX 16 MAX
AMD Ryzen 9 9955HX
39.7 fps +2%
HP HyperX Omen 16 16-ap1931nr
AMD Ryzen 9 9955HX3D
39 fps
Alienware 16X Aurora Core Ultra 9 290HX Plus
Intel Core Ultra 9 290HX Plus
38.2 fps -2%
Lenovo Legion Pro 5 16IAX10, RTX 5070
Intel Core Ultra 7 255HX
36.9 fps -5%
MSI Crosshair A16 HX E8WGK
AMD Ryzen 9 8940HX
35.7 fps -8%
Acer Predator Helios Neo 16S AI PHN16S-71-94L9
Intel Core Ultra 9 275HX
33.4 fps -14%
Lenovo Legion 9 16IRX9, RTX 4090
Intel Core i9-14900HX
30.7 fps -21%
HP Omen 16-ap0091ng
AMD Ryzen 9 8940HX
25.7 fps -34%
Alienware m16 R1 Intel
Intel Core i7-13700HX
22.4 fps -43%
Asus TUF Gaming A16 FA608UP
AMD Ryzen 7 260
21.4 fps -45%
LibreOffice / 20 Documents To PDF
Asus TUF Gaming A16 FA608UP
AMD Ryzen 7 260
57.1 s * -10%
Lenovo Legion 9 16IRX9, RTX 4090
Intel Core i9-14900HX
53.6 s * -3%
Average AMD Ryzen 9 9955HX3D
  (44.9 - 71.8, n=5)
53.4 s * -3%
HP HyperX Omen 16 16-ap1931nr
AMD Ryzen 9 9955HX3D
51.9 s *
HP HyperX Omen 16 16-ap1931nr
AMD Ryzen 9 9955HX3D
51.9 s * -0%
Schenker XMG APEX 16 MAX
AMD Ryzen 9 9955HX
48.7 s * +6%
HP Omen 16-ap0091ng
AMD Ryzen 9 8940HX
45.9 s * +12%
Lenovo Legion Pro 5 16IAX10, RTX 5070
Intel Core Ultra 7 255HX
45.9 s * +12%
Alienware m16 R1 Intel
Intel Core i7-13700HX
45.4 s * +13%
Acer Predator Helios Neo 16S AI PHN16S-71-94L9
Intel Core Ultra 9 275HX
44.6 s * +14%
MSI Crosshair A16 HX E8WGK
AMD Ryzen 9 8940HX
43.6 s * +16%
Alienware 16X Aurora Core Ultra 9 290HX Plus
Intel Core Ultra 9 290HX Plus
39.4 s * +24%
R Benchmark 2.5 / Overall mean
Lenovo Legion 9 16IRX9, RTX 4090
Intel Core i9-14900HX
0.4859 sec * -35%
Asus TUF Gaming A16 FA608UP
AMD Ryzen 7 260
0.4479 sec * -24%
Alienware m16 R1 Intel
Intel Core i7-13700HX
0.4422 sec * -22%
MSI Crosshair A16 HX E8WGK
AMD Ryzen 9 8940HX
0.4286 sec * -19%
Lenovo Legion Pro 5 16IAX10, RTX 5070
Intel Core Ultra 7 255HX
0.4269 sec * -18%
HP Omen 16-ap0091ng
AMD Ryzen 9 8940HX
0.4215 sec * -17%
Acer Predator Helios Neo 16S AI PHN16S-71-94L9
Intel Core Ultra 9 275HX
0.401 sec * -11%
Alienware 16X Aurora Core Ultra 9 290HX Plus
Intel Core Ultra 9 290HX Plus
0.391 sec * -8%
HP HyperX Omen 16 16-ap1931nr
AMD Ryzen 9 9955HX3D
0.3611 sec *
Average AMD Ryzen 9 9955HX3D
  (0.3552 - 0.3677, n=4)
0.3602 sec * -0%
Schenker XMG APEX 16 MAX
AMD Ryzen 9 9955HX
0.3439 sec * +5%

* ... smaller is better

Cinebench R15 CPU Multi 64Bit
5839 Points
Cinebench R15 OpenGL 64Bit
337 fps
Cinebench R15 Ref. Match 64Bit
99.6 %
Cinebench R15 CPU Single 64Bit
335 Points
Cinebench R20 CPU (Multi Core)
14209 Points
Cinebench R20 CPU (Single Core)
845 Points
Cinebench R23 Multi Core
36580 Points
Cinebench R23 Single Core
2154 Points
Cinebench 2024 CPU Multi Core
2015 Points
Cinebench 2024 CPU Single Core
128.2 Points
Cinebench 2026 CPU Multi
8296 Points
Cinebench 2026 CPU Single Thread
522 Points
Help
Performance rating
HP HyperX Omen 16 16-ap1931nr -1!
AMD Ryzen 9 9955HX3D, GeForce RTX 5070 Laptop
94.5 pt
Average AMD Ryzen 9 9955HX3D
 
94.3 pt
MSI Crosshair A16 HX E8WGK -1!
AMD Ryzen 9 8940HX, GeForce RTX 5070 Laptop
75.7 pt
HP Omen 16-ap0091ng -1!
AMD Ryzen 9 8940HX, GeForce RTX 5060 Laptop
66 pt
Lenovo Legion Pro 5 16IAX10, RTX 5070 -1!
Intel Core Ultra 7 255HX, GeForce RTX 5070 Laptop
61.6 pt
Alienware 16X Aurora Core Ultra 9 290HX Plus -1!
Intel Core Ultra 9 290HX Plus, GeForce RTX 5070 Ti Laptop
59.8 pt
Asus TUF Gaming A16 FA608UP -1!
AMD Ryzen 7 260, GeForce RTX 5070 Laptop
47.3 pt
AIDA64 / FP32 Ray-Trace
Average AMD Ryzen 9 9955HX3D
  (76012 - 84943, n=4)
80661 KRay/s +6%
HP HyperX Omen 16 16-ap1931nr
AMD Ryzen 9 9955HX3D, GeForce RTX 5070 Laptop (v8.20.8100)
76012 KRay/s
MSI Crosshair A16 HX E8WGK
AMD Ryzen 9 8940HX, GeForce RTX 5070 Laptop (v8.20.8100)
53747 KRay/s -29%
HP Omen 16-ap0091ng
AMD Ryzen 9 8940HX, GeForce RTX 5060 Laptop (v6.92.6600)
43311 KRay/s -43%
Alienware 16X Aurora Core Ultra 9 290HX Plus
Intel Core Ultra 9 290HX Plus, GeForce RTX 5070 Ti Laptop (v8.20.8100)
34761 KRay/s -54%
Lenovo Legion Pro 5 16IAX10, RTX 5070
Intel Core Ultra 7 255HX, GeForce RTX 5070 Laptop (v6.92.6600)
34250 KRay/s -55%
Asus TUF Gaming A16 FA608UP
AMD Ryzen 7 260, GeForce RTX 5070 Laptop (v6.92.6600)
28399 KRay/s -63%
AIDA64 / FPU Julia
HP HyperX Omen 16 16-ap1931nr
AMD Ryzen 9 9955HX3D, GeForce RTX 5070 Laptop (v8.20.8100)
358092 Points
Average AMD Ryzen 9 9955HX3D
  (230738 - 372155, n=4)
299853 Points -16%
MSI Crosshair A16 HX E8WGK
AMD Ryzen 9 8940HX, GeForce RTX 5070 Laptop (v8.20.8100)
218716 Points -39%
Alienware 16X Aurora Core Ultra 9 290HX Plus
Intel Core Ultra 9 290HX Plus, GeForce RTX 5070 Ti Laptop (v8.20.8100)
174665 Points -51%
HP Omen 16-ap0091ng
AMD Ryzen 9 8940HX, GeForce RTX 5060 Laptop (v6.92.6600)
171374 Points -52%
Lenovo Legion Pro 5 16IAX10, RTX 5070
Intel Core Ultra 7 255HX, GeForce RTX 5070 Laptop (v6.92.6600)
167758 Points -53%
Asus TUF Gaming A16 FA608UP
AMD Ryzen 7 260, GeForce RTX 5070 Laptop (v6.92.6600)
117226 Points -67%
AIDA64 / CPU SHA3
Average AMD Ryzen 9 9955HX3D
  (9393 - 9750, n=4)
9607 MB/s +2%
MSI Crosshair A16 HX E8WGK
AMD Ryzen 9 8940HX, GeForce RTX 5070 Laptop (v8.20.8100)
9427 MB/s 0%
HP HyperX Omen 16 16-ap1931nr
AMD Ryzen 9 9955HX3D, GeForce RTX 5070 Laptop (v8.20.8100)
9393 MB/s
Alienware 16X Aurora Core Ultra 9 290HX Plus
Intel Core Ultra 9 290HX Plus, GeForce RTX 5070 Ti Laptop (v8.20.8100)
8352 MB/s -11%
HP Omen 16-ap0091ng
AMD Ryzen 9 8940HX, GeForce RTX 5060 Laptop (v6.92.6600)
7988 MB/s -15%
Lenovo Legion Pro 5 16IAX10, RTX 5070
Intel Core Ultra 7 255HX, GeForce RTX 5070 Laptop (v6.92.6600)
7694 MB/s -18%
Asus TUF Gaming A16 FA608UP
AMD Ryzen 7 260, GeForce RTX 5070 Laptop (v6.92.6600)
5002 MB/s -47%
AIDA64 / CPU Queen
Average AMD Ryzen 9 9955HX3D
  (171718 - 173351, n=2)
172535 Points
HP Omen 16-ap0091ng
AMD Ryzen 9 8940HX, GeForce RTX 5060 Laptop (v6.92.6600)
169334 Points
Lenovo Legion Pro 5 16IAX10, RTX 5070
Intel Core Ultra 7 255HX, GeForce RTX 5070 Laptop (v6.92.6600)
135237 Points
Asus TUF Gaming A16 FA608UP
AMD Ryzen 7 260, GeForce RTX 5070 Laptop (v6.92.6600)
119010 Points
AIDA64 / FPU SinJulia
Average AMD Ryzen 9 9955HX3D
  (31654 - 33636, n=4)
32633 Points +3%
HP HyperX Omen 16 16-ap1931nr
AMD Ryzen 9 9955HX3D, GeForce RTX 5070 Laptop (v8.20.8100)
31654 Points
MSI Crosshair A16 HX E8WGK
AMD Ryzen 9 8940HX, GeForce RTX 5070 Laptop (v8.20.8100)
29886 Points -6%
HP Omen 16-ap0091ng
AMD Ryzen 9 8940HX, GeForce RTX 5060 Laptop (v6.92.6600)
26855 Points -15%
Asus TUF Gaming A16 FA608UP
AMD Ryzen 7 260, GeForce RTX 5070 Laptop (v6.92.6600)
15283 Points -52%
Alienware 16X Aurora Core Ultra 9 290HX Plus
Intel Core Ultra 9 290HX Plus, GeForce RTX 5070 Ti Laptop (v8.20.8100)
13687 Points -57%
Lenovo Legion Pro 5 16IAX10, RTX 5070
Intel Core Ultra 7 255HX, GeForce RTX 5070 Laptop (v6.92.6600)
12286 Points -61%
AIDA64 / FPU Mandel
HP HyperX Omen 16 16-ap1931nr
AMD Ryzen 9 9955HX3D, GeForce RTX 5070 Laptop (v8.20.8100)
189485 Points
Average AMD Ryzen 9 9955HX3D
  (122088 - 196829, n=4)
158765 Points -16%
MSI Crosshair A16 HX E8WGK
AMD Ryzen 9 8940HX, GeForce RTX 5070 Laptop (v8.20.8100)
117231 Points -38%
Alienware 16X Aurora Core Ultra 9 290HX Plus
Intel Core Ultra 9 290HX Plus, GeForce RTX 5070 Ti Laptop (v8.20.8100)
91215 Points -52%
HP Omen 16-ap0091ng
AMD Ryzen 9 8940HX, GeForce RTX 5060 Laptop (v6.92.6600)
90684 Points -52%
Lenovo Legion Pro 5 16IAX10, RTX 5070
Intel Core Ultra 7 255HX, GeForce RTX 5070 Laptop (v6.92.6600)
87947 Points -54%
Asus TUF Gaming A16 FA608UP
AMD Ryzen 7 260, GeForce RTX 5070 Laptop (v6.92.6600)
63212 Points -67%
AIDA64 / CPU AES
MSI Crosshair A16 HX E8WGK
AMD Ryzen 9 8940HX, GeForce RTX 5070 Laptop (v8.20.8100)
175214 MB/s +15%
Average AMD Ryzen 9 9955HX3D
  (152883 - 163423, n=4)
159710 MB/s +4%
HP HyperX Omen 16 16-ap1931nr
AMD Ryzen 9 9955HX3D, GeForce RTX 5070 Laptop (v8.20.8100)
152883 MB/s
HP Omen 16-ap0091ng
AMD Ryzen 9 8940HX, GeForce RTX 5060 Laptop (v6.92.6600)
150768 MB/s -1%
Alienware 16X Aurora Core Ultra 9 290HX Plus
Intel Core Ultra 9 290HX Plus, GeForce RTX 5070 Ti Laptop (v8.20.8100)
127585 MB/s -17%
Lenovo Legion Pro 5 16IAX10, RTX 5070
Intel Core Ultra 7 255HX, GeForce RTX 5070 Laptop (v6.92.6600)
115838 MB/s -24%
Asus TUF Gaming A16 FA608UP
AMD Ryzen 7 260, GeForce RTX 5070 Laptop (v6.92.6600)
90394 MB/s -41%
AIDA64 / CPU ZLib
Average AMD Ryzen 9 9955HX3D
  (2324 - 2517, n=4)
2444 MB/s +5%
HP HyperX Omen 16 16-ap1931nr
AMD Ryzen 9 9955HX3D, GeForce RTX 5070 Laptop (v8.20.8100)
2324 MB/s
MSI Crosshair A16 HX E8WGK
AMD Ryzen 9 8940HX, GeForce RTX 5070 Laptop (v8.20.8100)
2122 MB/s -9%
Alienware 16X Aurora Core Ultra 9 290HX Plus
Intel Core Ultra 9 290HX Plus, GeForce RTX 5070 Ti Laptop (v8.20.8100)
1967 MB/s -15%
Lenovo Legion Pro 5 16IAX10, RTX 5070
Intel Core Ultra 7 255HX, GeForce RTX 5070 Laptop (v6.92.6600)
1850 MB/s -20%
HP Omen 16-ap0091ng
AMD Ryzen 9 8940HX, GeForce RTX 5060 Laptop (v6.92.6600)
1784 MB/s -23%
Asus TUF Gaming A16 FA608UP
AMD Ryzen 7 260, GeForce RTX 5070 Laptop (v6.92.6600)
1039 MB/s -55%
AIDA64 / FP64 Ray-Trace
Average AMD Ryzen 9 9955HX3D
  (40864 - 45384, n=4)
43001 KRay/s +5%
HP HyperX Omen 16 16-ap1931nr
AMD Ryzen 9 9955HX3D, GeForce RTX 5070 Laptop (v8.20.8100)
40864 KRay/s
MSI Crosshair A16 HX E8WGK
AMD Ryzen 9 8940HX, GeForce RTX 5070 Laptop (v8.20.8100)
28773 KRay/s -30%
HP Omen 16-ap0091ng
AMD Ryzen 9 8940HX, GeForce RTX 5060 Laptop (v6.92.6600)
23193 KRay/s -43%
Alienware 16X Aurora Core Ultra 9 290HX Plus
Intel Core Ultra 9 290HX Plus, GeForce RTX 5070 Ti Laptop (v8.20.8100)
18611 KRay/s -54%
Lenovo Legion Pro 5 16IAX10, RTX 5070
Intel Core Ultra 7 255HX, GeForce RTX 5070 Laptop (v6.92.6600)
18315 KRay/s -55%
Asus TUF Gaming A16 FA608UP
AMD Ryzen 7 260, GeForce RTX 5070 Laptop (v6.92.6600)
15351 KRay/s -62%
AIDA64 / CPU PhotoWorxx
Lenovo Legion Pro 5 16IAX10, RTX 5070
Intel Core Ultra 7 255HX, GeForce RTX 5070 Laptop (v6.92.6600)
54070 MPixel/s +23%
Alienware 16X Aurora Core Ultra 9 290HX Plus
Intel Core Ultra 9 290HX Plus, GeForce RTX 5070 Ti Laptop (v8.20.8100)
51199 MPixel/s +16%
HP HyperX Omen 16 16-ap1931nr
AMD Ryzen 9 9955HX3D, GeForce RTX 5070 Laptop (v8.20.8100)
43964 MPixel/s
Average AMD Ryzen 9 9955HX3D
  (38765 - 44266, n=4)
42507 MPixel/s -3%
Asus TUF Gaming A16 FA608UP
AMD Ryzen 7 260, GeForce RTX 5070 Laptop (v6.92.6600)
39936 MPixel/s -9%
MSI Crosshair A16 HX E8WGK
AMD Ryzen 9 8940HX, GeForce RTX 5070 Laptop (v8.20.8100)
35274 MPixel/s -20%
HP Omen 16-ap0091ng
AMD Ryzen 9 8940HX, GeForce RTX 5060 Laptop (v6.92.6600)
18283 MPixel/s -58%
AIDA64 / CPU CheckMate
Average AMD Ryzen 9 9955HX3D
  (19603 - 20751, n=2)
20177 MP/s +3%
HP HyperX Omen 16 16-ap1931nr
AMD Ryzen 9 9955HX3D, GeForce RTX 5070 Laptop (v8.20.8100)
19603 MP/s
MSI Crosshair A16 HX E8WGK
AMD Ryzen 9 8940HX, GeForce RTX 5070 Laptop (v8.20.8100)
11788 MP/s -40%
Alienware 16X Aurora Core Ultra 9 290HX Plus
Intel Core Ultra 9 290HX Plus, GeForce RTX 5070 Ti Laptop (v8.20.8100)
7624 MP/s -61%

System Performance

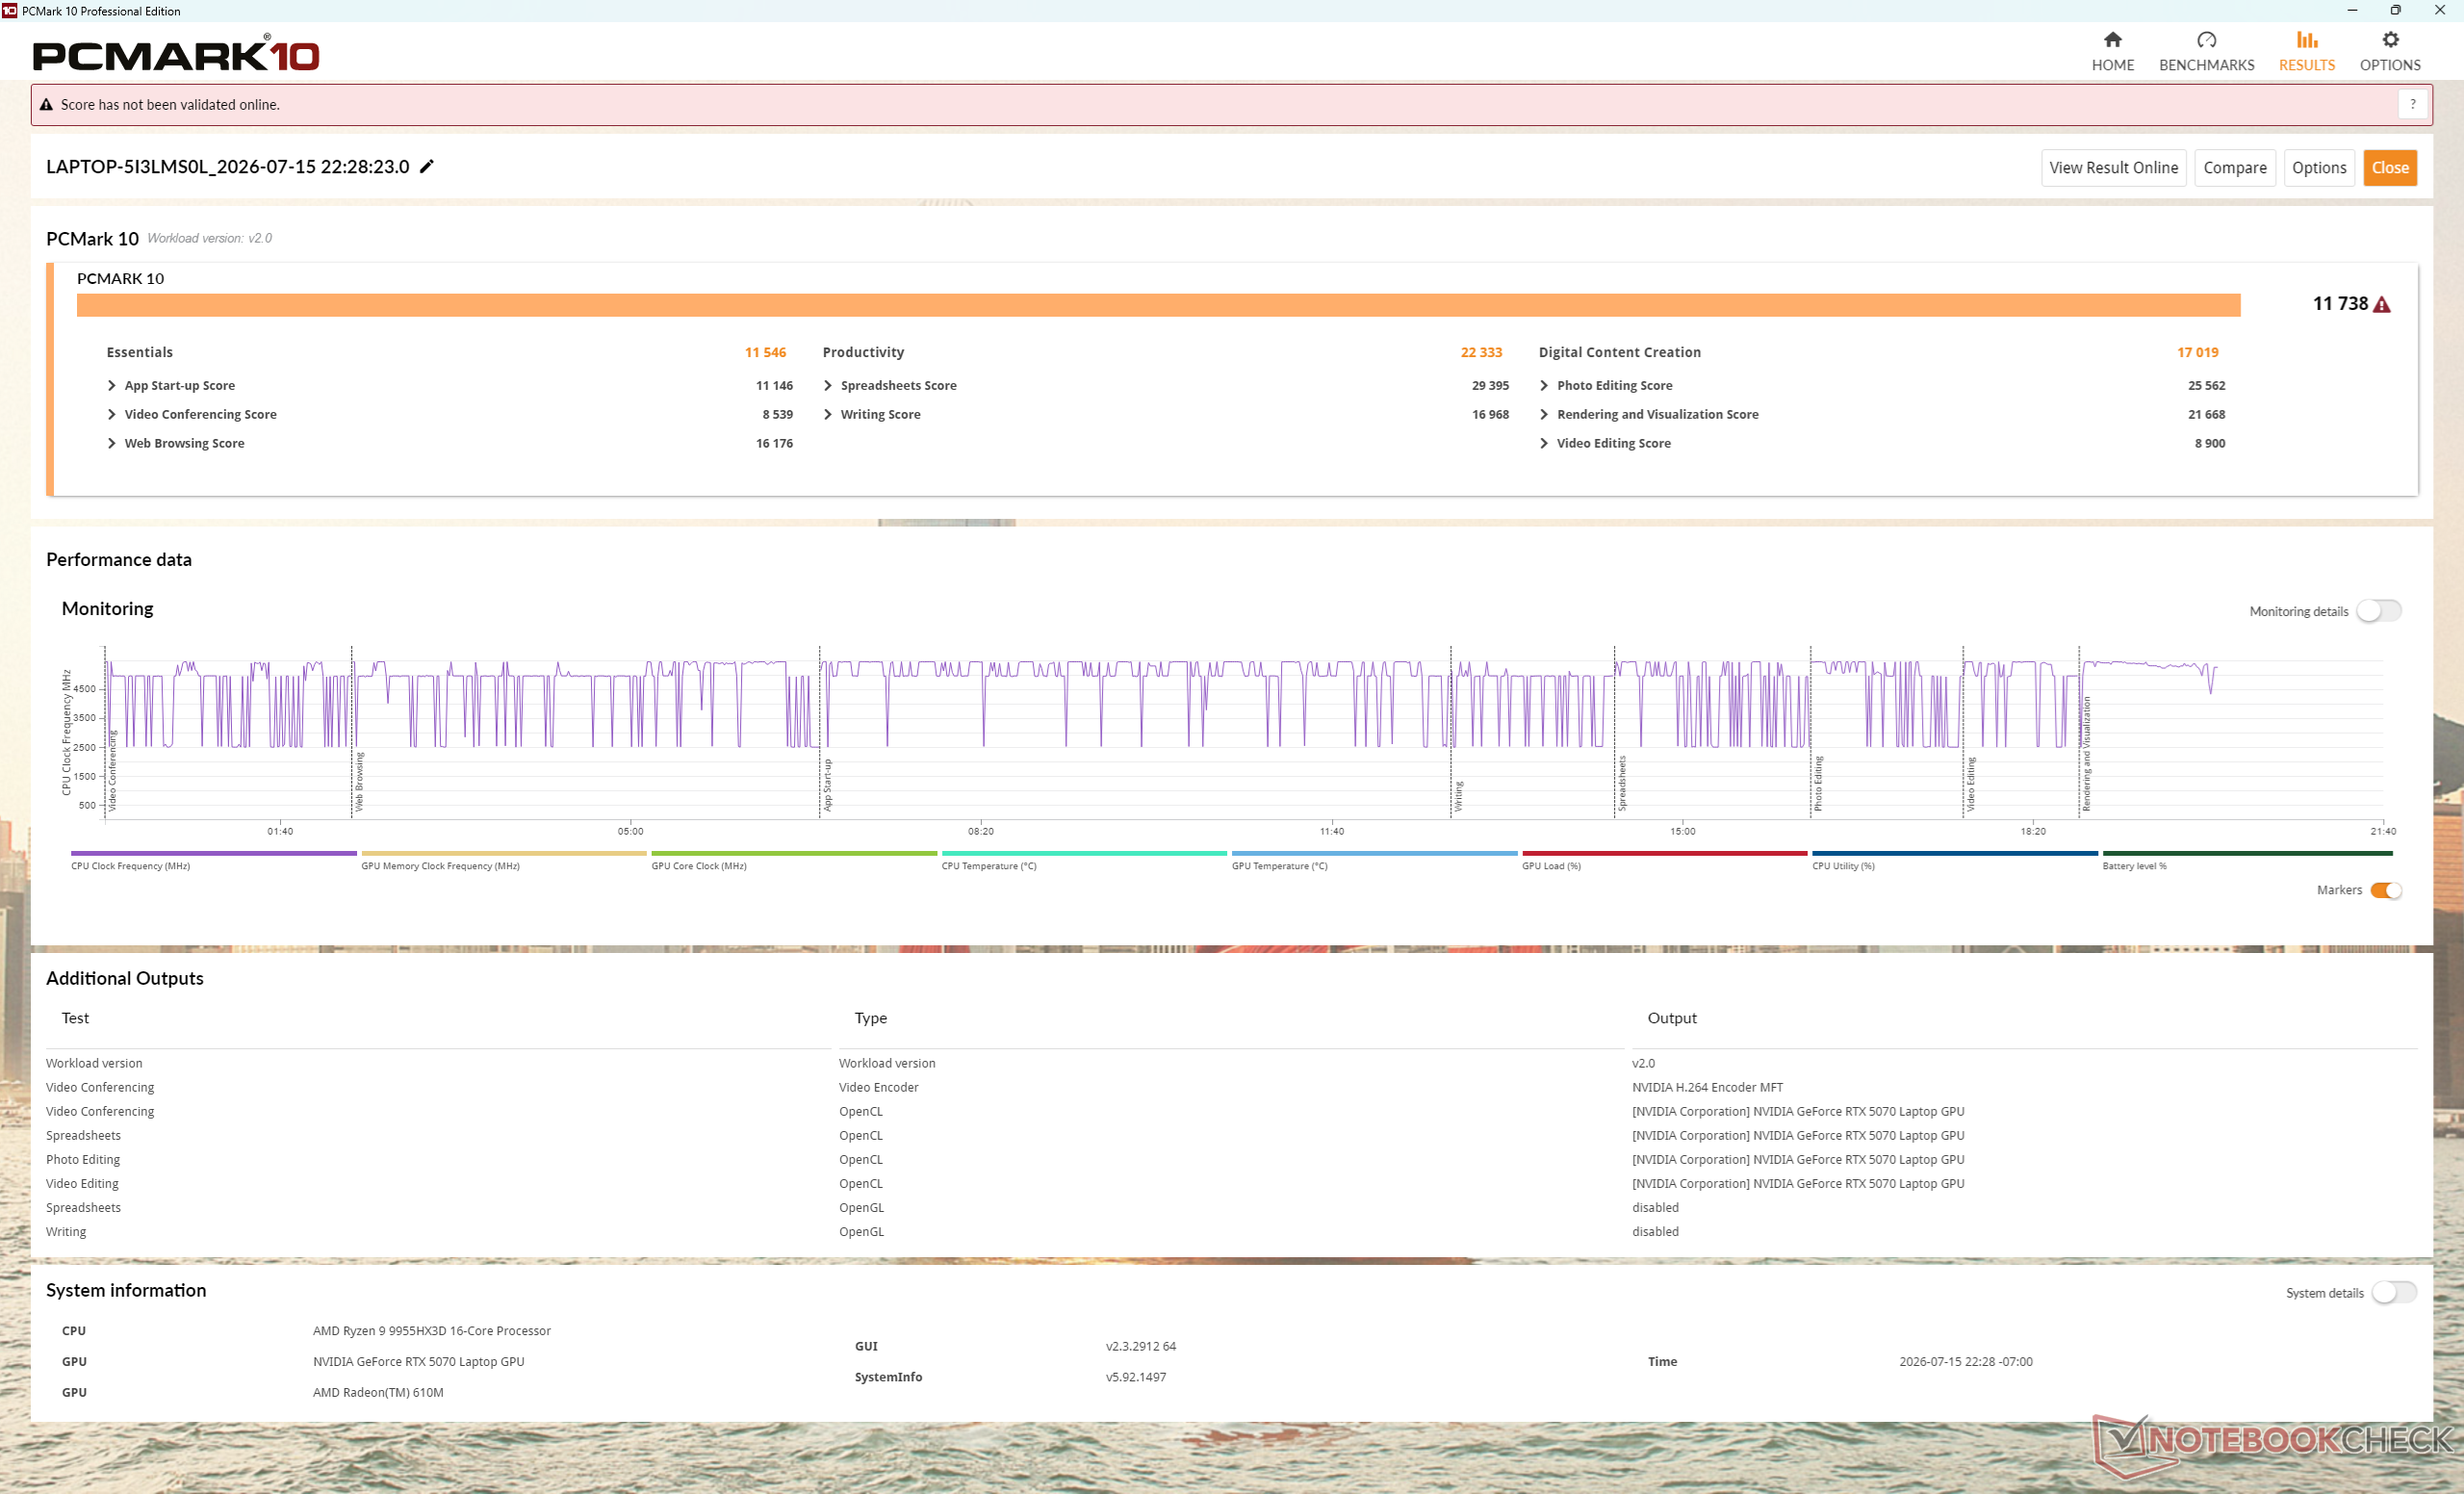
Excellent PCMark 10 score buoyed by the very high Productivity subscore from the 16-core CPU
Performance rating
Alienware 16X Aurora Core Ultra 9 290HX Plus
GeForce RTX 5070 Ti Laptop, Ultra 9 290HX Plus
92.6 pt
HP HyperX Omen 16 16-ap1931nr
GeForce RTX 5070 Laptop, R9 9955HX3D
85 pt
MSI Crosshair A16 HX E8WGK
GeForce RTX 5070 Laptop, R9 8940HX, Micron 2500 1TB MTFDKBA1T0QGN
84.5 pt
Lenovo Legion Pro 5 16IAX10, RTX 5070
GeForce RTX 5070 Laptop, Ultra 7 255HX, SK Hynix HFS001TEJ9X115N
80.7 pt
Asus TUF Gaming A16 FA608UP -4!
GeForce RTX 5070 Laptop, R7 260, Western Digital PC SN5000S SDEQNSJ-1T00
68.5 pt
HP Omen 16-ap0091ng
GeForce RTX 5060 Laptop, R9 8940HX, Samsung PM9C1b MZVL81T0HFLB-00BH1
68.1 pt
PCMark 10 / Score
HP HyperX Omen 16 16-ap1931nr
GeForce RTX 5070 Laptop, R9 9955HX3D
11738 Points
MSI Crosshair A16 HX E8WGK
GeForce RTX 5070 Laptop, R9 8940HX, Micron 2500 1TB MTFDKBA1T0QGN
11334 Points -3%
Alienware 16X Aurora Core Ultra 9 290HX Plus
GeForce RTX 5070 Ti Laptop, Ultra 9 290HX Plus
10891 Points -7%
Lenovo Legion Pro 5 16IAX10, RTX 5070
GeForce RTX 5070 Laptop, Ultra 7 255HX, SK Hynix HFS001TEJ9X115N
8910 Points -24%
HP Omen 16-ap0091ng
GeForce RTX 5060 Laptop, R9 8940HX, Samsung PM9C1b MZVL81T0HFLB-00BH1
8054 Points -31%
PCMark 10 / Essentials
Alienware 16X Aurora Core Ultra 9 290HX Plus
GeForce RTX 5070 Ti Laptop, Ultra 9 290HX Plus
11935 Points +3%
HP HyperX Omen 16 16-ap1931nr
GeForce RTX 5070 Laptop, R9 9955HX3D
11546 Points
MSI Crosshair A16 HX E8WGK
GeForce RTX 5070 Laptop, R9 8940HX, Micron 2500 1TB MTFDKBA1T0QGN
11393 Points -1%
Lenovo Legion Pro 5 16IAX10, RTX 5070
GeForce RTX 5070 Laptop, Ultra 7 255HX, SK Hynix HFS001TEJ9X115N
11229 Points -3%
HP Omen 16-ap0091ng
GeForce RTX 5060 Laptop, R9 8940HX, Samsung PM9C1b MZVL81T0HFLB-00BH1
10709 Points -7%
PCMark 10 / Productivity
HP HyperX Omen 16 16-ap1931nr
GeForce RTX 5070 Laptop, R9 9955HX3D
22333 Points
MSI Crosshair A16 HX E8WGK
GeForce RTX 5070 Laptop, R9 8940HX, Micron 2500 1TB MTFDKBA1T0QGN
21327 Points -5%
Alienware 16X Aurora Core Ultra 9 290HX Plus
GeForce RTX 5070 Ti Laptop, Ultra 9 290HX Plus
16565 Points -26%
Lenovo Legion Pro 5 16IAX10, RTX 5070
GeForce RTX 5070 Laptop, Ultra 7 255HX, SK Hynix HFS001TEJ9X115N
9938 Points -56%
HP Omen 16-ap0091ng
GeForce RTX 5060 Laptop, R9 8940HX, Samsung PM9C1b MZVL81T0HFLB-00BH1
9831 Points -56%
PCMark 10 / Digital Content Creation
Alienware 16X Aurora Core Ultra 9 290HX Plus
GeForce RTX 5070 Ti Laptop, Ultra 9 290HX Plus
17730 Points +4%
Lenovo Legion Pro 5 16IAX10, RTX 5070
GeForce RTX 5070 Laptop, Ultra 7 255HX, SK Hynix HFS001TEJ9X115N
17200 Points +1%
HP HyperX Omen 16 16-ap1931nr
GeForce RTX 5070 Laptop, R9 9955HX3D
17019 Points
MSI Crosshair A16 HX E8WGK
GeForce RTX 5070 Laptop, R9 8940HX, Micron 2500 1TB MTFDKBA1T0QGN
16259 Points -4%
HP Omen 16-ap0091ng
GeForce RTX 5060 Laptop, R9 8940HX, Samsung PM9C1b MZVL81T0HFLB-00BH1
13465 Points -21%
CrossMark / Overall
Alienware 16X Aurora Core Ultra 9 290HX Plus
GeForce RTX 5070 Ti Laptop, Ultra 9 290HX Plus
2390 Points +20%
Lenovo Legion Pro 5 16IAX10, RTX 5070
GeForce RTX 5070 Laptop, Ultra 7 255HX, SK Hynix HFS001TEJ9X115N
2056 Points +3%
MSI Crosshair A16 HX E8WGK
GeForce RTX 5070 Laptop, R9 8940HX, Micron 2500 1TB MTFDKBA1T0QGN
2011 Points +1%
HP HyperX Omen 16 16-ap1931nr
GeForce RTX 5070 Laptop, R9 9955HX3D
1990 Points
HP Omen 16-ap0091ng
GeForce RTX 5060 Laptop, R9 8940HX, Samsung PM9C1b MZVL81T0HFLB-00BH1
1903 Points -4%
Asus TUF Gaming A16 FA608UP
GeForce RTX 5070 Laptop, R7 260, Western Digital PC SN5000S SDEQNSJ-1T00
1712 Points -14%
CrossMark / Productivity
Alienware 16X Aurora Core Ultra 9 290HX Plus
GeForce RTX 5070 Ti Laptop, Ultra 9 290HX Plus
2254 Points +22%
Lenovo Legion Pro 5 16IAX10, RTX 5070
GeForce RTX 5070 Laptop, Ultra 7 255HX, SK Hynix HFS001TEJ9X115N
1926 Points +5%
MSI Crosshair A16 HX E8WGK
GeForce RTX 5070 Laptop, R9 8940HX, Micron 2500 1TB MTFDKBA1T0QGN
1869 Points +1%
HP HyperX Omen 16 16-ap1931nr
GeForce RTX 5070 Laptop, R9 9955HX3D
1843 Points
HP Omen 16-ap0091ng
GeForce RTX 5060 Laptop, R9 8940HX, Samsung PM9C1b MZVL81T0HFLB-00BH1
1831 Points -1%
Asus TUF Gaming A16 FA608UP
GeForce RTX 5070 Laptop, R7 260, Western Digital PC SN5000S SDEQNSJ-1T00
1648 Points -11%
CrossMark / Creativity
Alienware 16X Aurora Core Ultra 9 290HX Plus
GeForce RTX 5070 Ti Laptop, Ultra 9 290HX Plus
2571 Points +13%
Lenovo Legion Pro 5 16IAX10, RTX 5070
GeForce RTX 5070 Laptop, Ultra 7 255HX, SK Hynix HFS001TEJ9X115N
2317 Points +2%
MSI Crosshair A16 HX E8WGK
GeForce RTX 5070 Laptop, R9 8940HX, Micron 2500 1TB MTFDKBA1T0QGN
2298 Points +1%
HP HyperX Omen 16 16-ap1931nr
GeForce RTX 5070 Laptop, R9 9955HX3D
2267 Points
HP Omen 16-ap0091ng
GeForce RTX 5060 Laptop, R9 8940HX, Samsung PM9C1b MZVL81T0HFLB-00BH1
2112 Points -7%
Asus TUF Gaming A16 FA608UP
GeForce RTX 5070 Laptop, R7 260, Western Digital PC SN5000S SDEQNSJ-1T00
1879 Points -17%
CrossMark / Responsiveness
Alienware 16X Aurora Core Ultra 9 290HX Plus
GeForce RTX 5070 Ti Laptop, Ultra 9 290HX Plus
2289 Points +35%
Lenovo Legion Pro 5 16IAX10, RTX 5070
GeForce RTX 5070 Laptop, Ultra 7 255HX, SK Hynix HFS001TEJ9X115N
1748 Points +3%
HP HyperX Omen 16 16-ap1931nr
GeForce RTX 5070 Laptop, R9 9955HX3D
1691 Points
MSI Crosshair A16 HX E8WGK
GeForce RTX 5070 Laptop, R9 8940HX, Micron 2500 1TB MTFDKBA1T0QGN
1680 Points -1%
HP Omen 16-ap0091ng
GeForce RTX 5060 Laptop, R9 8940HX, Samsung PM9C1b MZVL81T0HFLB-00BH1
1562 Points -8%
Asus TUF Gaming A16 FA608UP
GeForce RTX 5070 Laptop, R7 260, Western Digital PC SN5000S SDEQNSJ-1T00
1454 Points -14%
WebXPRT 3 / Overall
Alienware 16X Aurora Core Ultra 9 290HX Plus
GeForce RTX 5070 Ti Laptop, Ultra 9 290HX Plus
375 Points +11%
HP HyperX Omen 16 16-ap1931nr
GeForce RTX 5070 Laptop, R9 9955HX3D
339 Points
Lenovo Legion Pro 5 16IAX10, RTX 5070
GeForce RTX 5070 Laptop, Ultra 7 255HX, SK Hynix HFS001TEJ9X115N
335 Points -1%
HP Omen 16-ap0091ng
GeForce RTX 5060 Laptop, R9 8940HX, Samsung PM9C1b MZVL81T0HFLB-00BH1
322 Points -5%
MSI Crosshair A16 HX E8WGK
GeForce RTX 5070 Laptop, R9 8940HX, Micron 2500 1TB MTFDKBA1T0QGN
322 Points -5%
Asus TUF Gaming A16 FA608UP
GeForce RTX 5070 Laptop, R7 260, Western Digital PC SN5000S SDEQNSJ-1T00
297 Points -12%
WebXPRT 4 / Overall
Alienware 16X Aurora Core Ultra 9 290HX Plus
GeForce RTX 5070 Ti Laptop, Ultra 9 290HX Plus
345 Points +8%
Lenovo Legion Pro 5 16IAX10, RTX 5070
GeForce RTX 5070 Laptop, Ultra 7 255HX, SK Hynix HFS001TEJ9X115N
326 Points +3%
HP HyperX Omen 16 16-ap1931nr
GeForce RTX 5070 Laptop, R9 9955HX3D
318 Points
MSI Crosshair A16 HX E8WGK
GeForce RTX 5070 Laptop, R9 8940HX, Micron 2500 1TB MTFDKBA1T0QGN
283 Points -11%
HP Omen 16-ap0091ng
GeForce RTX 5060 Laptop, R9 8940HX, Samsung PM9C1b MZVL81T0HFLB-00BH1
253 Points -20%
Asus TUF Gaming A16 FA608UP
GeForce RTX 5070 Laptop, R7 260, Western Digital PC SN5000S SDEQNSJ-1T00
239 Points -25%
Mozilla Kraken 1.1 / Total
Asus TUF Gaming A16 FA608UP
GeForce RTX 5070 Laptop, R7 260, Western Digital PC SN5000S SDEQNSJ-1T00
562 ms * -40%
HP Omen 16-ap0091ng
GeForce RTX 5060 Laptop, R9 8940HX, Samsung PM9C1b MZVL81T0HFLB-00BH1
509 ms * -27%
MSI Crosshair A16 HX E8WGK
GeForce RTX 5070 Laptop, R9 8940HX, Micron 2500 1TB MTFDKBA1T0QGN
474 ms * -18%
Lenovo Legion Pro 5 16IAX10, RTX 5070
GeForce RTX 5070 Laptop, Ultra 7 255HX, SK Hynix HFS001TEJ9X115N
429 ms * -7%
HP HyperX Omen 16 16-ap1931nr
GeForce RTX 5070 Laptop, R9 9955HX3D
402 ms *
Alienware 16X Aurora Core Ultra 9 290HX Plus
GeForce RTX 5070 Ti Laptop, Ultra 9 290HX Plus
394 ms * +2%
Geekbench AI / Quantized GPU 1.7
Alienware 16X Aurora Core Ultra 9 290HX Plus
GeForce RTX 5070 Ti Laptop, Ultra 9 290HX Plus
19163 Points +14%
MSI Crosshair A16 HX E8WGK
GeForce RTX 5070 Laptop, R9 8940HX, Micron 2500 1TB MTFDKBA1T0QGN
18147 Points +8%
Lenovo Legion Pro 5 16IAX10, RTX 5070
GeForce RTX 5070 Laptop, Ultra 7 255HX, SK Hynix HFS001TEJ9X115N
17210 Points +2%
HP HyperX Omen 16 16-ap1931nr
GeForce RTX 5070 Laptop, R9 9955HX3D
16797 Points
Asus TUF Gaming A16 FA608UP
GeForce RTX 5070 Laptop, R7 260, Western Digital PC SN5000S SDEQNSJ-1T00
16466 Points -2%
HP Omen 16-ap0091ng
GeForce RTX 5060 Laptop, R9 8940HX, Samsung PM9C1b MZVL81T0HFLB-00BH1
13288 Points -21%
Geekbench AI / Half Precision GPU 1.7
MSI Crosshair A16 HX E8WGK
GeForce RTX 5070 Laptop, R9 8940HX, Micron 2500 1TB MTFDKBA1T0QGN
45382 Points +17%
Alienware 16X Aurora Core Ultra 9 290HX Plus
GeForce RTX 5070 Ti Laptop, Ultra 9 290HX Plus
45324 Points +17%
Lenovo Legion Pro 5 16IAX10, RTX 5070
GeForce RTX 5070 Laptop, Ultra 7 255HX, SK Hynix HFS001TEJ9X115N
41962 Points +8%
HP HyperX Omen 16 16-ap1931nr
GeForce RTX 5070 Laptop, R9 9955HX3D
38675 Points
Asus TUF Gaming A16 FA608UP
GeForce RTX 5070 Laptop, R7 260, Western Digital PC SN5000S SDEQNSJ-1T00
38118 Points -1%
HP Omen 16-ap0091ng
GeForce RTX 5060 Laptop, R9 8940HX, Samsung PM9C1b MZVL81T0HFLB-00BH1
27029 Points -30%
Geekbench AI / Single Precision GPU 1.7
Alienware 16X Aurora Core Ultra 9 290HX Plus
GeForce RTX 5070 Ti Laptop, Ultra 9 290HX Plus
24661 Points +16%
MSI Crosshair A16 HX E8WGK
GeForce RTX 5070 Laptop, R9 8940HX, Micron 2500 1TB MTFDKBA1T0QGN
23474 Points +10%
Lenovo Legion Pro 5 16IAX10, RTX 5070
GeForce RTX 5070 Laptop, Ultra 7 255HX, SK Hynix HFS001TEJ9X115N
22431 Points +6%
HP HyperX Omen 16 16-ap1931nr
GeForce RTX 5070 Laptop, R9 9955HX3D
21259 Points
Asus TUF Gaming A16 FA608UP
GeForce RTX 5070 Laptop, R7 260, Western Digital PC SN5000S SDEQNSJ-1T00
21012 Points -1%
HP Omen 16-ap0091ng
GeForce RTX 5060 Laptop, R9 8940HX, Samsung PM9C1b MZVL81T0HFLB-00BH1
16368 Points -23%

* ... smaller is better

PCMark 10 Score
11738 points
Help
AIDA64 / Memory Copy
Lenovo Legion Pro 5 16IAX10, RTX 5070
Intel Core Ultra 7 255HX, GeForce RTX 5070 Laptop
85286 MB/s +35%
Alienware 16X Aurora Core Ultra 9 290HX Plus
Intel Core Ultra 9 290HX Plus, GeForce RTX 5070 Ti Laptop
76912 MB/s +22%
Asus TUF Gaming A16 FA608UP
AMD Ryzen 7 260, GeForce RTX 5070 Laptop
67750 MB/s +7%
HP HyperX Omen 16 16-ap1931nr
AMD Ryzen 9 9955HX3D, GeForce RTX 5070 Laptop
63072 MB/s
Average AMD Ryzen 9 9955HX3D
  (56383 - 63173, n=4)
61040 MB/s -3%
MSI Crosshair A16 HX E8WGK
AMD Ryzen 9 8940HX, GeForce RTX 5070 Laptop
55263 MB/s -12%
HP Omen 16-ap0091ng
AMD Ryzen 9 8940HX, GeForce RTX 5060 Laptop
29102 MB/s -54%
AIDA64 / Memory Read
Lenovo Legion Pro 5 16IAX10, RTX 5070
Intel Core Ultra 7 255HX, GeForce RTX 5070 Laptop
95821 MB/s +44%
Alienware 16X Aurora Core Ultra 9 290HX Plus
Intel Core Ultra 9 290HX Plus, GeForce RTX 5070 Ti Laptop
84638 MB/s +28%
HP HyperX Omen 16 16-ap1931nr
AMD Ryzen 9 9955HX3D, GeForce RTX 5070 Laptop
66378 MB/s
MSI Crosshair A16 HX E8WGK
AMD Ryzen 9 8940HX, GeForce RTX 5070 Laptop
66207 MB/s 0%
Average AMD Ryzen 9 9955HX3D
  (59750 - 66539, n=4)
64509 MB/s -3%
Asus TUF Gaming A16 FA608UP
AMD Ryzen 7 260, GeForce RTX 5070 Laptop
61170 MB/s -8%
HP Omen 16-ap0091ng
AMD Ryzen 9 8940HX, GeForce RTX 5060 Laptop
35634 MB/s -46%
AIDA64 / Memory Write
Asus TUF Gaming A16 FA608UP
AMD Ryzen 7 260, GeForce RTX 5070 Laptop
86401 MB/s +25%
Lenovo Legion Pro 5 16IAX10, RTX 5070
Intel Core Ultra 7 255HX, GeForce RTX 5070 Laptop
84882 MB/s +23%
Alienware 16X Aurora Core Ultra 9 290HX Plus
Intel Core Ultra 9 290HX Plus, GeForce RTX 5070 Ti Laptop
76094 MB/s +10%
HP HyperX Omen 16 16-ap1931nr
AMD Ryzen 9 9955HX3D, GeForce RTX 5070 Laptop
69285 MB/s
Average AMD Ryzen 9 9955HX3D
  (59506 - 72898, n=4)
67780 MB/s -2%
MSI Crosshair A16 HX E8WGK
AMD Ryzen 9 8940HX, GeForce RTX 5070 Laptop
61853 MB/s -11%
HP Omen 16-ap0091ng
AMD Ryzen 9 8940HX, GeForce RTX 5060 Laptop
32239 MB/s -53%
AIDA64 / Memory Latency
Alienware 16X Aurora Core Ultra 9 290HX Plus
Intel Core Ultra 9 290HX Plus, GeForce RTX 5070 Ti Laptop
108.4 ns * -11%
Lenovo Legion Pro 5 16IAX10, RTX 5070
Intel Core Ultra 7 255HX, GeForce RTX 5070 Laptop
104.2 ns * -6%
Average AMD Ryzen 9 9955HX3D
  (96.1 - 103.6, n=4)
99.5 ns * -2%
HP HyperX Omen 16 16-ap1931nr
AMD Ryzen 9 9955HX3D, GeForce RTX 5070 Laptop
98 ns *
Asus TUF Gaming A16 FA608UP
AMD Ryzen 7 260, GeForce RTX 5070 Laptop
93.8 ns * +4%
MSI Crosshair A16 HX E8WGK
AMD Ryzen 9 8940HX, GeForce RTX 5070 Laptop
87.1 ns * +11%
HP Omen 16-ap0091ng
AMD Ryzen 9 8940HX, GeForce RTX 5060 Laptop
83.5 ns * +15%

* ... smaller is better

DPC Latency

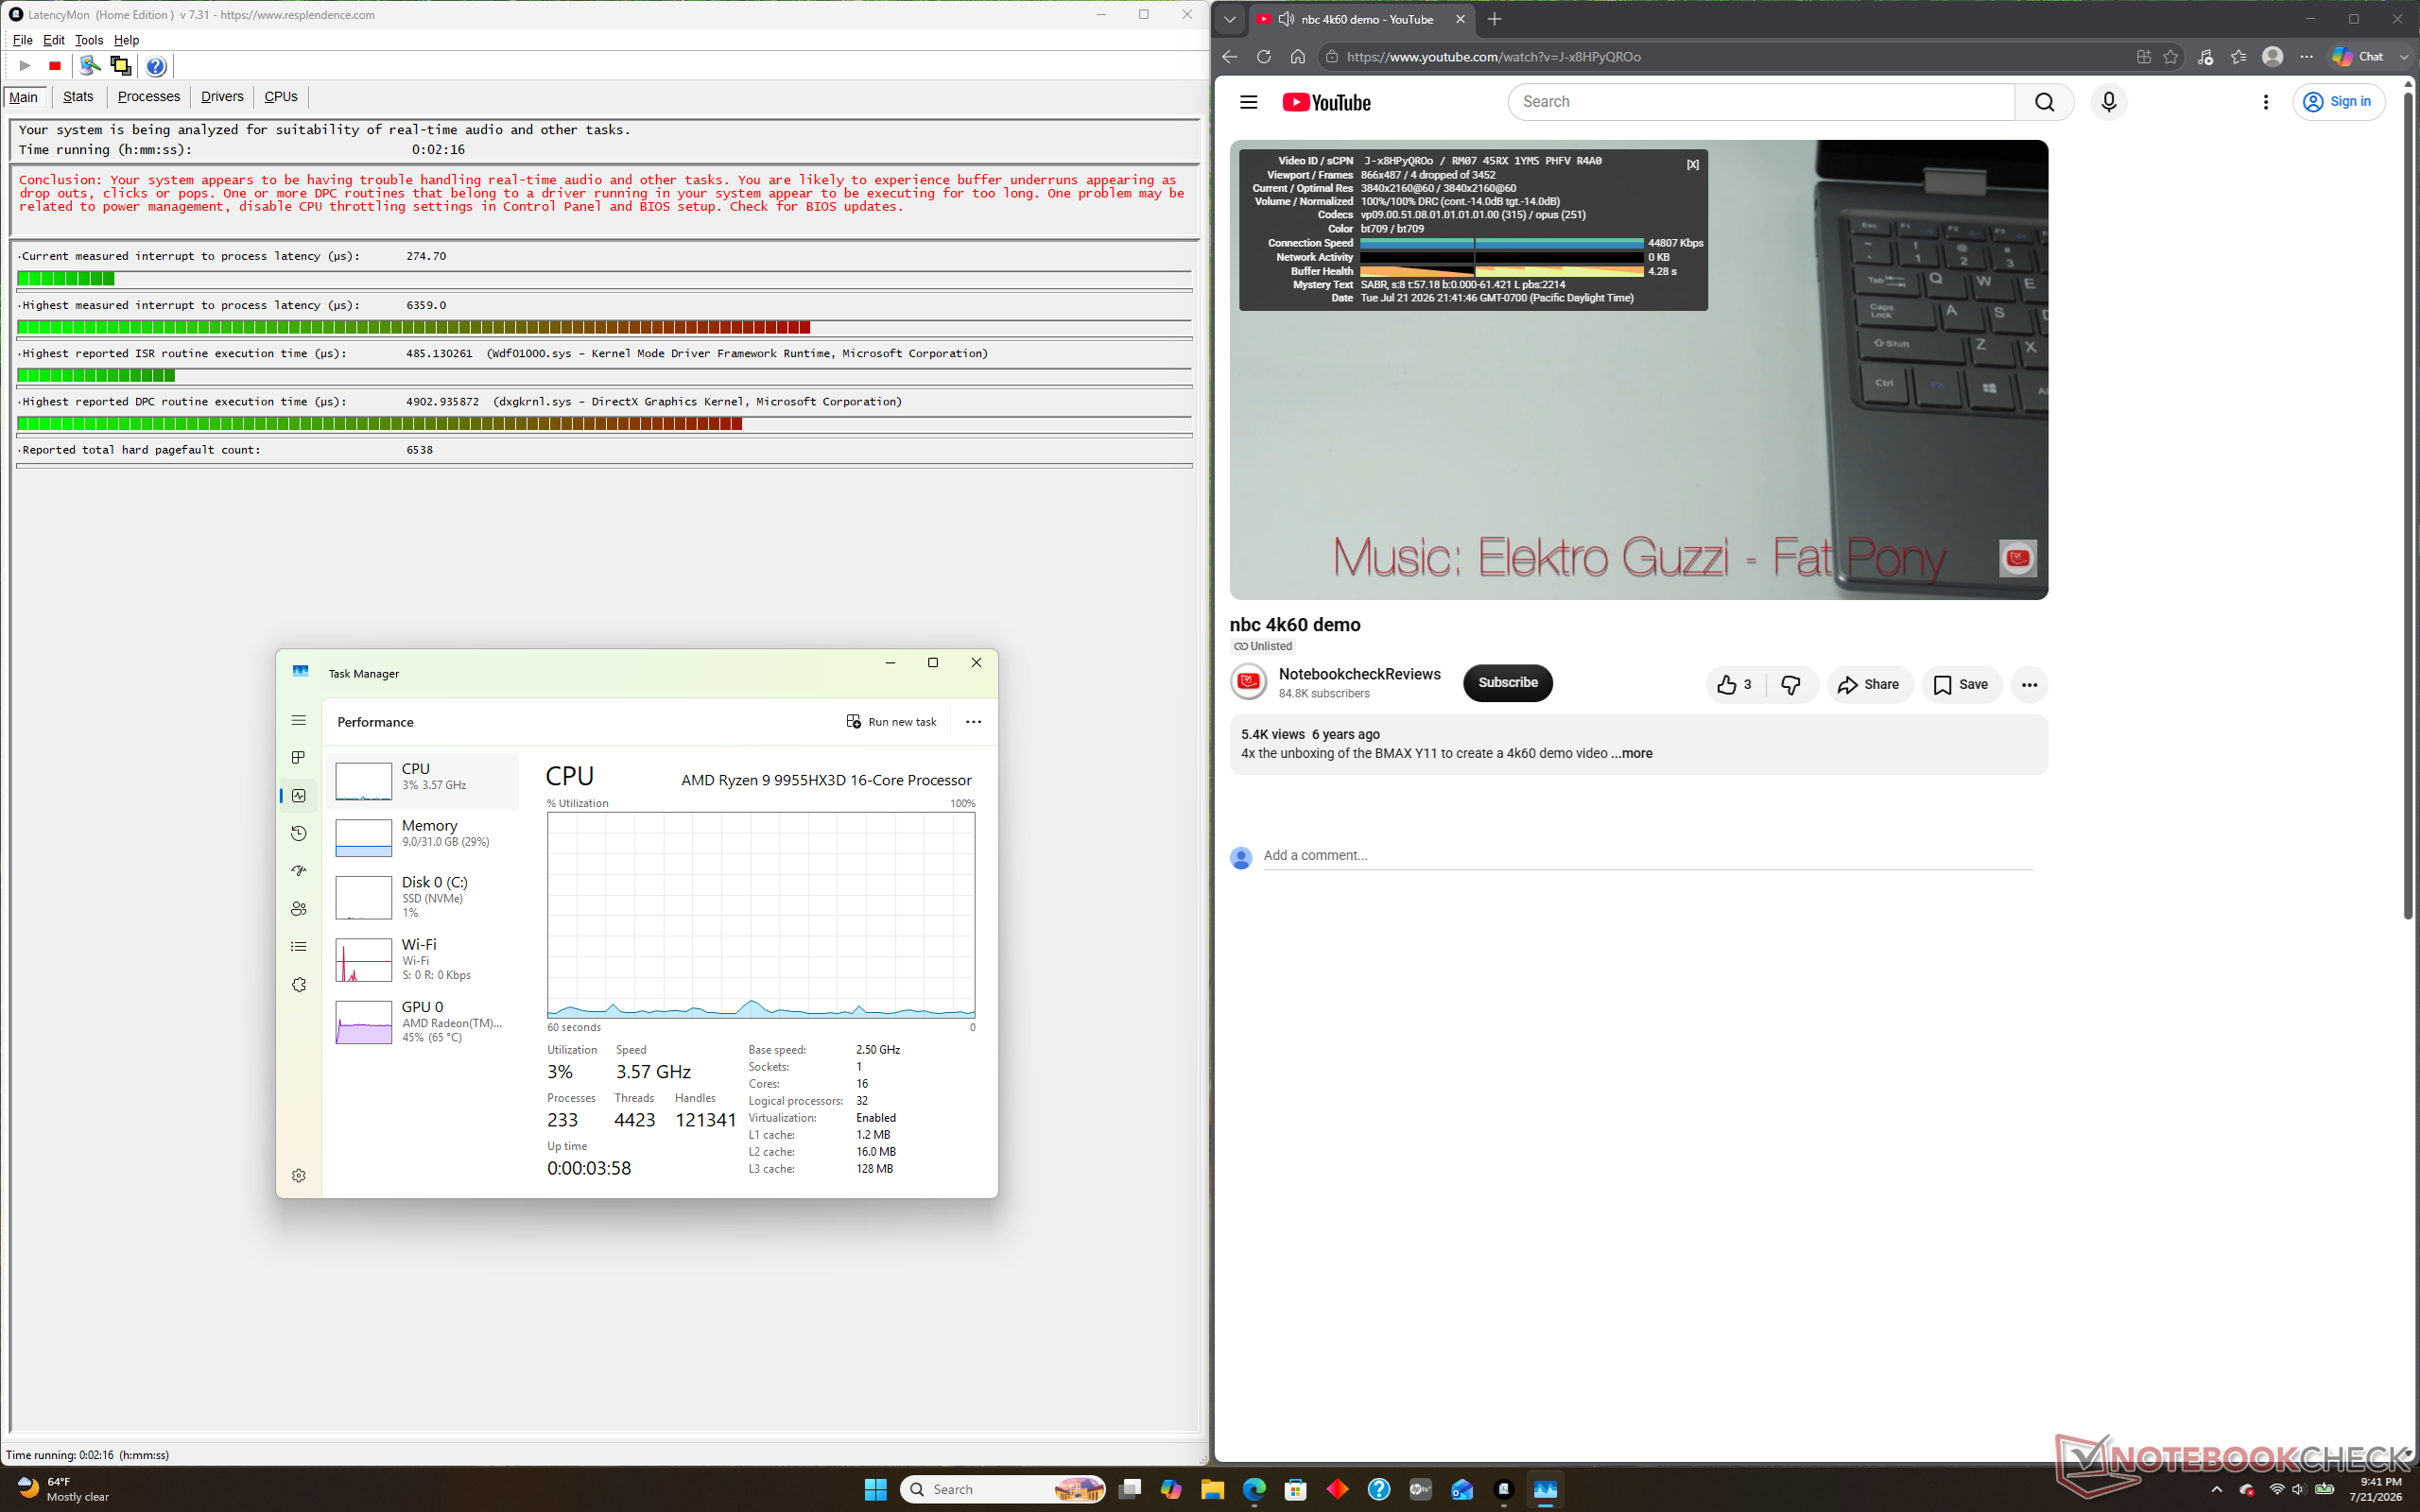
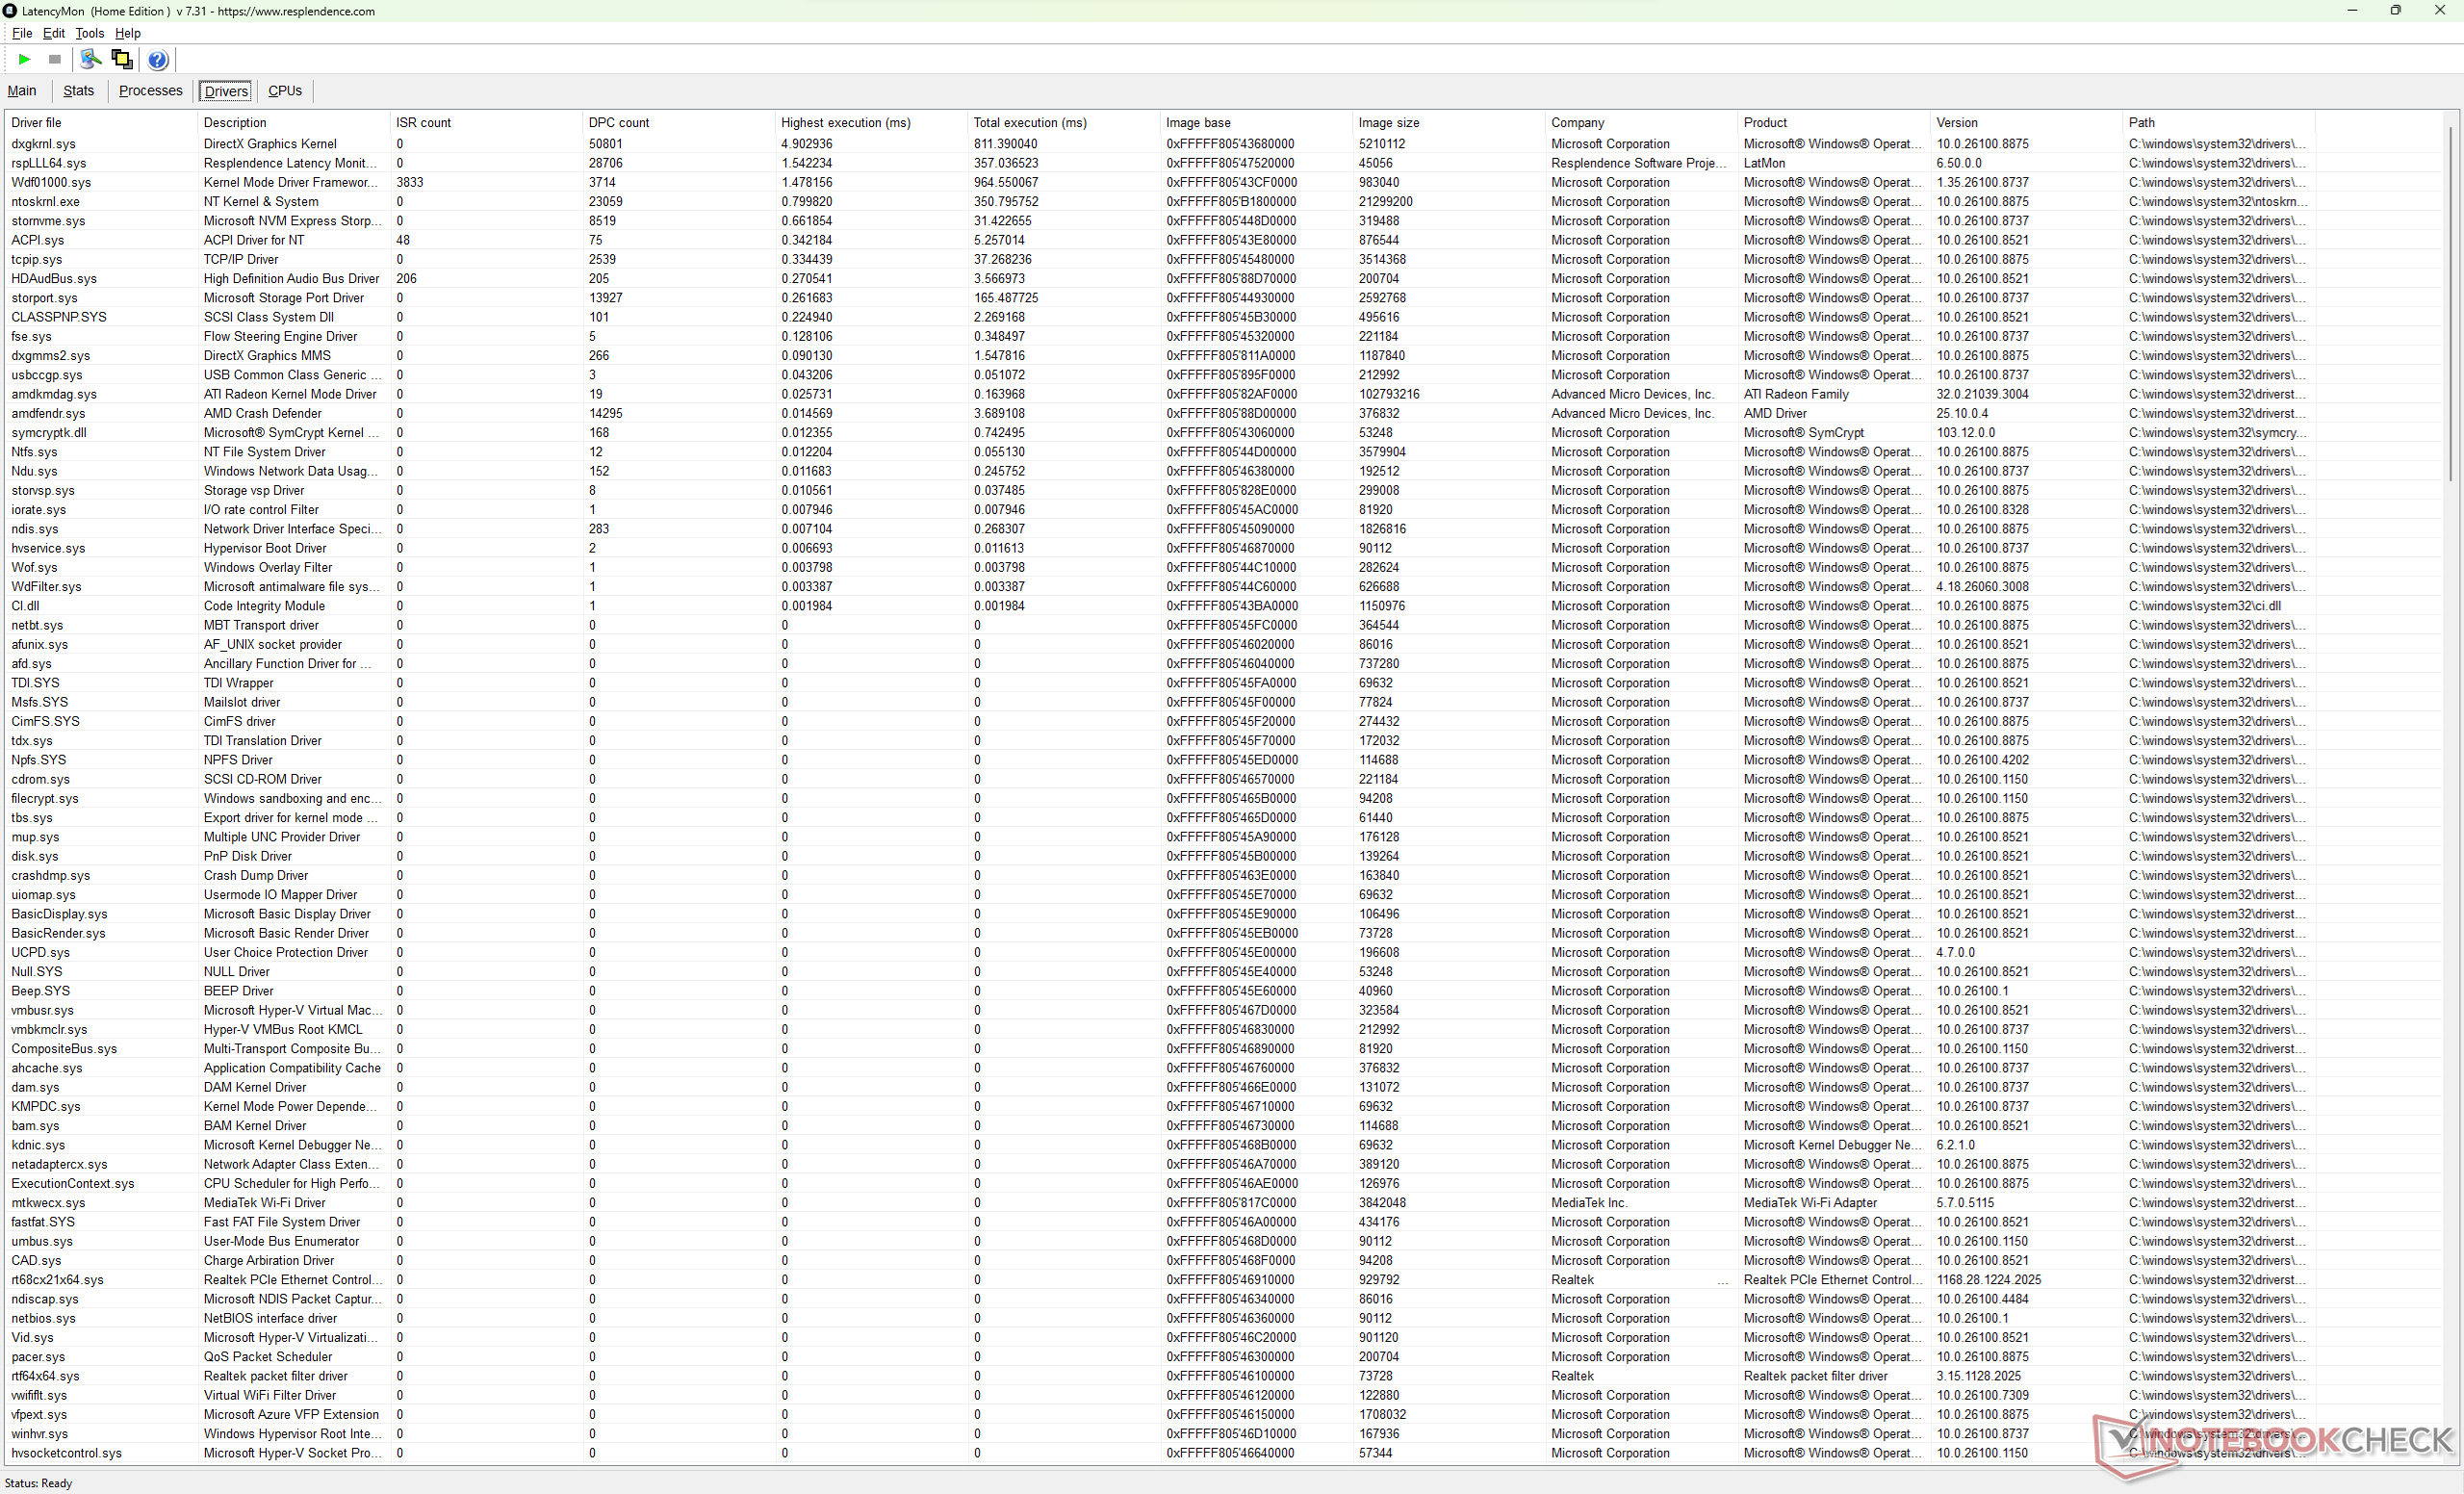
LatencyMon shows DPC issues and 4 dropped frames when playing 4K60 video content even after multiple retries
Drivers list
Drivers list
DPC Latencies / LatencyMon - interrupt to process latency (max), Web, Youtube, Prime95
HP HyperX Omen 16 16-ap1931nr
GeForce RTX 5070 Laptop, R9 9955HX3D
6359 μs *
Alienware 16X Aurora Core Ultra 9 290HX Plus
GeForce RTX 5070 Ti Laptop, Ultra 9 290HX Plus
4122.5 μs * +35%
MSI Crosshair A16 HX E8WGK
GeForce RTX 5070 Laptop, R9 8940HX, Micron 2500 1TB MTFDKBA1T0QGN
1690 μs * +73%
HP Omen 16-ap0091ng
GeForce RTX 5060 Laptop, R9 8940HX, Samsung PM9C1b MZVL81T0HFLB-00BH1
1425.3 μs * +78%
Lenovo Legion Pro 5 16IAX10, RTX 5070
GeForce RTX 5070 Laptop, Ultra 7 255HX, SK Hynix HFS001TEJ9X115N
810.5 μs * +87%
Asus TUF Gaming A16 FA608UP
GeForce RTX 5070 Laptop, R7 260, Western Digital PC SN5000S SDEQNSJ-1T00
563.8 μs * +91%

* ... smaller is better

Storage Devices
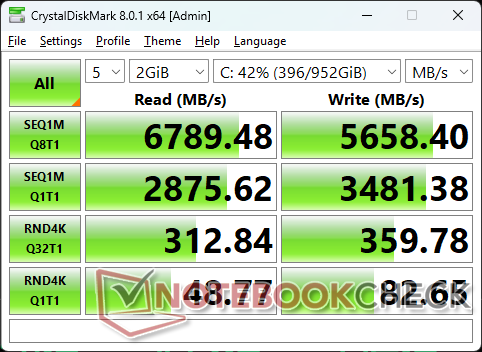
CDM 8
CDM 8
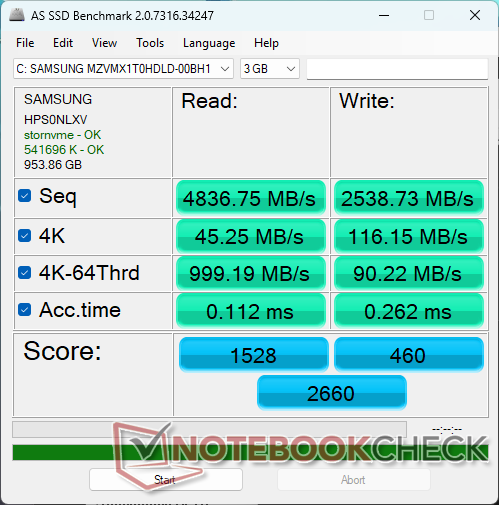
AS SSD
AS SSD
Sequential Read: 4836.75MB/s
Sequential Write: 2538.73MB/s
4K Read: 45.25MB/s
4K Write: 116.15MB/s
4K-64 Read: 999.19MB/s
4K-64 Write: 90.22MB/s
Access Time Read: 0.112ms
Access Time Write: 0.262ms
Copy ISO: 3127.57MB/s
Copy Program: 958.69MB/s
Copy Game: 287.74MB/s
Score Read: 1528Points
Score Write: 460Points
Score Total: 2660Points
Drive Performance rating - Percent
Alienware 16X Aurora Core Ultra 9 290HX Plus
 
95.5 pt
Lenovo Legion Pro 5 16IAX10, RTX 5070
SK Hynix HFS001TEJ9X115N
78.8 pt
MSI Crosshair A16 HX E8WGK
Micron 2500 1TB MTFDKBA1T0QGN
62.6 pt
HP Omen 16-ap0091ng
Samsung PM9C1b MZVL81T0HFLB-00BH1
55.5 pt
Asus TUF Gaming A16 FA608UP
Western Digital PC SN5000S SDEQNSJ-1T00
55.2 pt
HP HyperX Omen 16 16-ap1931nr
 
38.1 pt
DiskSpd
seq read
Lenovo Legion Pro 5 16IAX10, RTX 5070
SK Hynix HFS001TEJ9X115N
4778 (4600.31min - 4777.52max) MB/s +45%
Alienware 16X Aurora Core Ultra 9 290HX Plus
 
4669 (4086.52min - 4669.2max) MB/s +42%
HP HyperX Omen 16 16-ap1931nr
 
3291 (3274.91min - 3291.27max) MB/s
MSI Crosshair A16 HX E8WGK
Micron 2500 1TB MTFDKBA1T0QGN
3253 (3214.59min - 3253.1max) MB/s -1%
HP Omen 16-ap0091ng
Samsung PM9C1b MZVL81T0HFLB-00BH1
3031 (2761.74min - 3031.45max) MB/s -8%
Asus TUF Gaming A16 FA608UP
Western Digital PC SN5000S SDEQNSJ-1T00
1717 (1605.72min - 1717.49max) MB/s -48%
seq write
Alienware 16X Aurora Core Ultra 9 290HX Plus
 
5645 (1502.75min - 5644.73max) MB/s +258%
MSI Crosshair A16 HX E8WGK
Micron 2500 1TB MTFDKBA1T0QGN
4062 (3914.68min - 4062.45max) MB/s +157%
Asus TUF Gaming A16 FA608UP
Western Digital PC SN5000S SDEQNSJ-1T00
3830 (3464.7min - 3830.45max) MB/s +143%
HP Omen 16-ap0091ng
Samsung PM9C1b MZVL81T0HFLB-00BH1
3704 (3259.18min - 3704.34max) MB/s +135%
Lenovo Legion Pro 5 16IAX10, RTX 5070
SK Hynix HFS001TEJ9X115N
1793 (1679.19min - 1792.86max) MB/s +14%
HP HyperX Omen 16 16-ap1931nr
 
1578 (1318.06min - 1577.89max) MB/s
seq q8 t1 read
MSI Crosshair A16 HX E8WGK
Micron 2500 1TB MTFDKBA1T0QGN
7324 (6376.43min - 7324.33max) MB/s +2%
HP Omen 16-ap0091ng
Samsung PM9C1b MZVL81T0HFLB-00BH1
7258 (6649.77min - 7257.61max) MB/s +1%
HP HyperX Omen 16 16-ap1931nr
 
7169 (3534.12min - 7168.9max) MB/s
Lenovo Legion Pro 5 16IAX10, RTX 5070
SK Hynix HFS001TEJ9X115N
7146 (5921.52min - 7145.87max) MB/s 0%
Alienware 16X Aurora Core Ultra 9 290HX Plus
 
7035 (6225.19min - 7034.67max) MB/s -2%
Asus TUF Gaming A16 FA608UP
Western Digital PC SN5000S SDEQNSJ-1T00
6365 (5802.54min - 6364.58max) MB/s -11%
seq q8 t1 write
Alienware 16X Aurora Core Ultra 9 290HX Plus
 
6525 (6509.96min - 6524.66max) MB/s +80%
MSI Crosshair A16 HX E8WGK
Micron 2500 1TB MTFDKBA1T0QGN
6109 (6054.95min - 6109.42max) MB/s +68%
Lenovo Legion Pro 5 16IAX10, RTX 5070
SK Hynix HFS001TEJ9X115N
6086 (6054.06min - 6085.94max) MB/s +68%
HP Omen 16-ap0091ng
Samsung PM9C1b MZVL81T0HFLB-00BH1
5750 (5600.99min - 5749.76max) MB/s +59%
Asus TUF Gaming A16 FA608UP
Western Digital PC SN5000S SDEQNSJ-1T00
5576 (5054.3min - 5575.91max) MB/s +54%
HP HyperX Omen 16 16-ap1931nr
 
3626 (170.08min - 3625.89max) MB/s
4k q1 t1 read
Alienware 16X Aurora Core Ultra 9 290HX Plus
 
79.5 (77.33min - 79.48max) MB/s +61%
Asus TUF Gaming A16 FA608UP
Western Digital PC SN5000S SDEQNSJ-1T00
71.9 (71.68min - 71.87max) MB/s +45%
MSI Crosshair A16 HX E8WGK
Micron 2500 1TB MTFDKBA1T0QGN
63.4 (63.17min - 63.39max) MB/s +28%
Lenovo Legion Pro 5 16IAX10, RTX 5070
SK Hynix HFS001TEJ9X115N
61.5 (61.03min - 61.51max) MB/s +24%
HP Omen 16-ap0091ng
Samsung PM9C1b MZVL81T0HFLB-00BH1
51.7 (50.4min - 51.66max) MB/s +4%
HP HyperX Omen 16 16-ap1931nr
 
49.5 (48.58min - 49.45max) MB/s
4k q1 t1 write
Alienware 16X Aurora Core Ultra 9 290HX Plus
 
338 (317.84min - 337.66max) MB/s +188%
MSI Crosshair A16 HX E8WGK
Micron 2500 1TB MTFDKBA1T0QGN
165.1 (163.36min - 165.14max) MB/s +41%
Lenovo Legion Pro 5 16IAX10, RTX 5070
SK Hynix HFS001TEJ9X115N
154 (87.61min - 154.04max) MB/s +31%
Asus TUF Gaming A16 FA608UP
Western Digital PC SN5000S SDEQNSJ-1T00
143.8 (140.01min - 143.77max) MB/s +22%
HP HyperX Omen 16 16-ap1931nr
 
117.4 (92.53min - 117.43max) MB/s
HP Omen 16-ap0091ng
Samsung PM9C1b MZVL81T0HFLB-00BH1
96.7 (95.77min - 96.65max) MB/s -18%
4k q32 t16 read
Alienware 16X Aurora Core Ultra 9 290HX Plus
 
4999 (4701.95min - 4999.05max) MB/s +398%
Lenovo Legion Pro 5 16IAX10, RTX 5070
SK Hynix HFS001TEJ9X115N
4691 (4642.12min - 4690.75max) MB/s +368%
Asus TUF Gaming A16 FA608UP
Western Digital PC SN5000S SDEQNSJ-1T00
1036 (949.61min - 1035.55max) MB/s +3%
HP HyperX Omen 16 16-ap1931nr
 
1003 (969.75min - 1003.25max) MB/s
MSI Crosshair A16 HX E8WGK
Micron 2500 1TB MTFDKBA1T0QGN
994 (979.79min - 994.26max) MB/s -1%
HP Omen 16-ap0091ng
Samsung PM9C1b MZVL81T0HFLB-00BH1
889 (844.18min - 889.18max) MB/s -11%
4k q32 t16 write
Alienware 16X Aurora Core Ultra 9 290HX Plus
 
4388 (1358.14min - 4387.65max) MB/s +810%
Lenovo Legion Pro 5 16IAX10, RTX 5070
SK Hynix HFS001TEJ9X115N
4001 (3124.4min - 4001.37max) MB/s +730%
HP HyperX Omen 16 16-ap1931nr
 
482 (286.45min - 482.02max) MB/s
Asus TUF Gaming A16 FA608UP
Western Digital PC SN5000S SDEQNSJ-1T00
455 (405.09min - 455.15max) MB/s -6%
MSI Crosshair A16 HX E8WGK
Micron 2500 1TB MTFDKBA1T0QGN
436 (430.48min - 436.24max) MB/s -10%
HP Omen 16-ap0091ng
Samsung PM9C1b MZVL81T0HFLB-00BH1
356 (352.83min - 355.66max) MB/s -26%
AS SSD
Score Total
Alienware 16X Aurora Core Ultra 9 290HX Plus
 
9593 Points +261%
Lenovo Legion Pro 5 16IAX10, RTX 5070
SK Hynix HFS001TEJ9X115N
8115 Points +205%
MSI Crosshair A16 HX E8WGK
Micron 2500 1TB MTFDKBA1T0QGN
6234 Points +134%
HP Omen 16-ap0091ng
Samsung PM9C1b MZVL81T0HFLB-00BH1
5084 Points +91%
Asus TUF Gaming A16 FA608UP
Western Digital PC SN5000S SDEQNSJ-1T00
4498 Points +69%
HP HyperX Omen 16 16-ap1931nr
 
2660 Points
Score Read
Lenovo Legion Pro 5 16IAX10, RTX 5070
SK Hynix HFS001TEJ9X115N
3166 Points +107%
Alienware 16X Aurora Core Ultra 9 290HX Plus
 
2811 Points +84%
MSI Crosshair A16 HX E8WGK
Micron 2500 1TB MTFDKBA1T0QGN
1629 Points +7%
HP HyperX Omen 16 16-ap1931nr
 
1528 Points
HP Omen 16-ap0091ng
Samsung PM9C1b MZVL81T0HFLB-00BH1
1384 Points -9%
Asus TUF Gaming A16 FA608UP
Western Digital PC SN5000S SDEQNSJ-1T00
1333 Points -13%
Score Write
Alienware 16X Aurora Core Ultra 9 290HX Plus
 
5340 Points +1061%
MSI Crosshair A16 HX E8WGK
Micron 2500 1TB MTFDKBA1T0QGN
3890 Points +746%
Lenovo Legion Pro 5 16IAX10, RTX 5070
SK Hynix HFS001TEJ9X115N
3493 Points +659%
HP Omen 16-ap0091ng
Samsung PM9C1b MZVL81T0HFLB-00BH1
3046 Points +562%
Asus TUF Gaming A16 FA608UP
Western Digital PC SN5000S SDEQNSJ-1T00
2553 Points +455%
HP HyperX Omen 16 16-ap1931nr
 
460 Points
Seq Read
Alienware 16X Aurora Core Ultra 9 290HX Plus
 
5862.72 MB/s +21%
Lenovo Legion Pro 5 16IAX10, RTX 5070
SK Hynix HFS001TEJ9X115N
5856 MB/s +21%
MSI Crosshair A16 HX E8WGK
Micron 2500 1TB MTFDKBA1T0QGN
5611.82 MB/s +16%
HP HyperX Omen 16 16-ap1931nr
 
4836.75 MB/s
HP Omen 16-ap0091ng
Samsung PM9C1b MZVL81T0HFLB-00BH1
4595 MB/s -5%
Asus TUF Gaming A16 FA608UP
Western Digital PC SN5000S SDEQNSJ-1T00
4346 MB/s -10%
Seq Write
Alienware 16X Aurora Core Ultra 9 290HX Plus
 
5723.88 MB/s +125%
HP Omen 16-ap0091ng
Samsung PM9C1b MZVL81T0HFLB-00BH1
3249 MB/s +28%
MSI Crosshair A16 HX E8WGK
Micron 2500 1TB MTFDKBA1T0QGN
3051.42 MB/s +20%
Lenovo Legion Pro 5 16IAX10, RTX 5070
SK Hynix HFS001TEJ9X115N
2720 MB/s +7%
Asus TUF Gaming A16 FA608UP
Western Digital PC SN5000S SDEQNSJ-1T00
2619 MB/s +3%
HP HyperX Omen 16 16-ap1931nr
 
2538.73 MB/s
4K Read
Alienware 16X Aurora Core Ultra 9 290HX Plus
 
87.34 MB/s +93%
Asus TUF Gaming A16 FA608UP
Western Digital PC SN5000S SDEQNSJ-1T00
66.2 MB/s +46%
Lenovo Legion Pro 5 16IAX10, RTX 5070
SK Hynix HFS001TEJ9X115N
60 MB/s +33%
HP Omen 16-ap0091ng
Samsung PM9C1b MZVL81T0HFLB-00BH1
58.8 MB/s +30%
MSI Crosshair A16 HX E8WGK
Micron 2500 1TB MTFDKBA1T0QGN
58.74 MB/s +30%
HP HyperX Omen 16 16-ap1931nr
 
45.25 MB/s
4K Write
Alienware 16X Aurora Core Ultra 9 290HX Plus
 
284.01 MB/s +145%
Lenovo Legion Pro 5 16IAX10, RTX 5070
SK Hynix HFS001TEJ9X115N
250 MB/s +115%
MSI Crosshair A16 HX E8WGK
Micron 2500 1TB MTFDKBA1T0QGN
192.85 MB/s +66%
HP Omen 16-ap0091ng
Samsung PM9C1b MZVL81T0HFLB-00BH1
189.4 MB/s +63%
Asus TUF Gaming A16 FA608UP
Western Digital PC SN5000S SDEQNSJ-1T00
156.3 MB/s +35%
HP HyperX Omen 16 16-ap1931nr
 
116.15 MB/s
4K-64 Read
Lenovo Legion Pro 5 16IAX10, RTX 5070
SK Hynix HFS001TEJ9X115N
2520 MB/s +152%
Alienware 16X Aurora Core Ultra 9 290HX Plus
 
2137.32 MB/s +114%
MSI Crosshair A16 HX E8WGK
Micron 2500 1TB MTFDKBA1T0QGN
1008.8 MB/s +1%
HP HyperX Omen 16 16-ap1931nr
 
999.19 MB/s
HP Omen 16-ap0091ng
Samsung PM9C1b MZVL81T0HFLB-00BH1
866 MB/s -13%
Asus TUF Gaming A16 FA608UP
Western Digital PC SN5000S SDEQNSJ-1T00
832 MB/s -17%
4K-64 Write
Alienware 16X Aurora Core Ultra 9 290HX Plus
 
4483.37 MB/s +4869%
MSI Crosshair A16 HX E8WGK
Micron 2500 1TB MTFDKBA1T0QGN
3391.95 MB/s +3660%
Lenovo Legion Pro 5 16IAX10, RTX 5070
SK Hynix HFS001TEJ9X115N
2970 MB/s +3192%
HP Omen 16-ap0091ng
Samsung PM9C1b MZVL81T0HFLB-00BH1
2532 MB/s +2706%
Asus TUF Gaming A16 FA608UP
Western Digital PC SN5000S SDEQNSJ-1T00
2134 MB/s +2265%
HP HyperX Omen 16 16-ap1931nr
 
90.22 MB/s
Access Time Read
HP HyperX Omen 16 16-ap1931nr
 
0.112 ms *
HP Omen 16-ap0091ng
Samsung PM9C1b MZVL81T0HFLB-00BH1
0.098 ms * +12%
MSI Crosshair A16 HX E8WGK
Micron 2500 1TB MTFDKBA1T0QGN
0.078 ms * +30%
Asus TUF Gaming A16 FA608UP
Western Digital PC SN5000S SDEQNSJ-1T00
0.054 ms * +52%
Lenovo Legion Pro 5 16IAX10, RTX 5070
SK Hynix HFS001TEJ9X115N
0.052 ms * +54%
Alienware 16X Aurora Core Ultra 9 290HX Plus
 
0.042 ms * +62%
Access Time Write
HP HyperX Omen 16 16-ap1931nr
 
0.262 ms *
MSI Crosshair A16 HX E8WGK
Micron 2500 1TB MTFDKBA1T0QGN
0.06 ms * +77%
Alienware 16X Aurora Core Ultra 9 290HX Plus
 
0.041 ms * +84%
Asus TUF Gaming A16 FA608UP
Western Digital PC SN5000S SDEQNSJ-1T00
0.03 ms * +89%
HP Omen 16-ap0091ng
Samsung PM9C1b MZVL81T0HFLB-00BH1
0.022 ms * +92%
Lenovo Legion Pro 5 16IAX10, RTX 5070
SK Hynix HFS001TEJ9X115N
0.018 ms * +93%

* ... smaller is better

Disk Throttling: DiskSpd Read Loop, Queue Depth 8

0150300450600750900105012001350150016501800195021002250240025502700285030003150330034503600375039004050420043504500465048004950510052505400555057005850600061506300645066006750690070507200Tooltip
HP HyperX Omen 16 16-ap1931nr  ; diskspd 2.0.17 f: Ø6849 (4957.67-6914.73) MB/s
HP Omen 16-ap0091ng Samsung PM9C1b MZVL81T0HFLB-00BH1; diskspd 2.0.17 f: Ø7228 (5964.95-7269.15) MB/s

GPU Performance

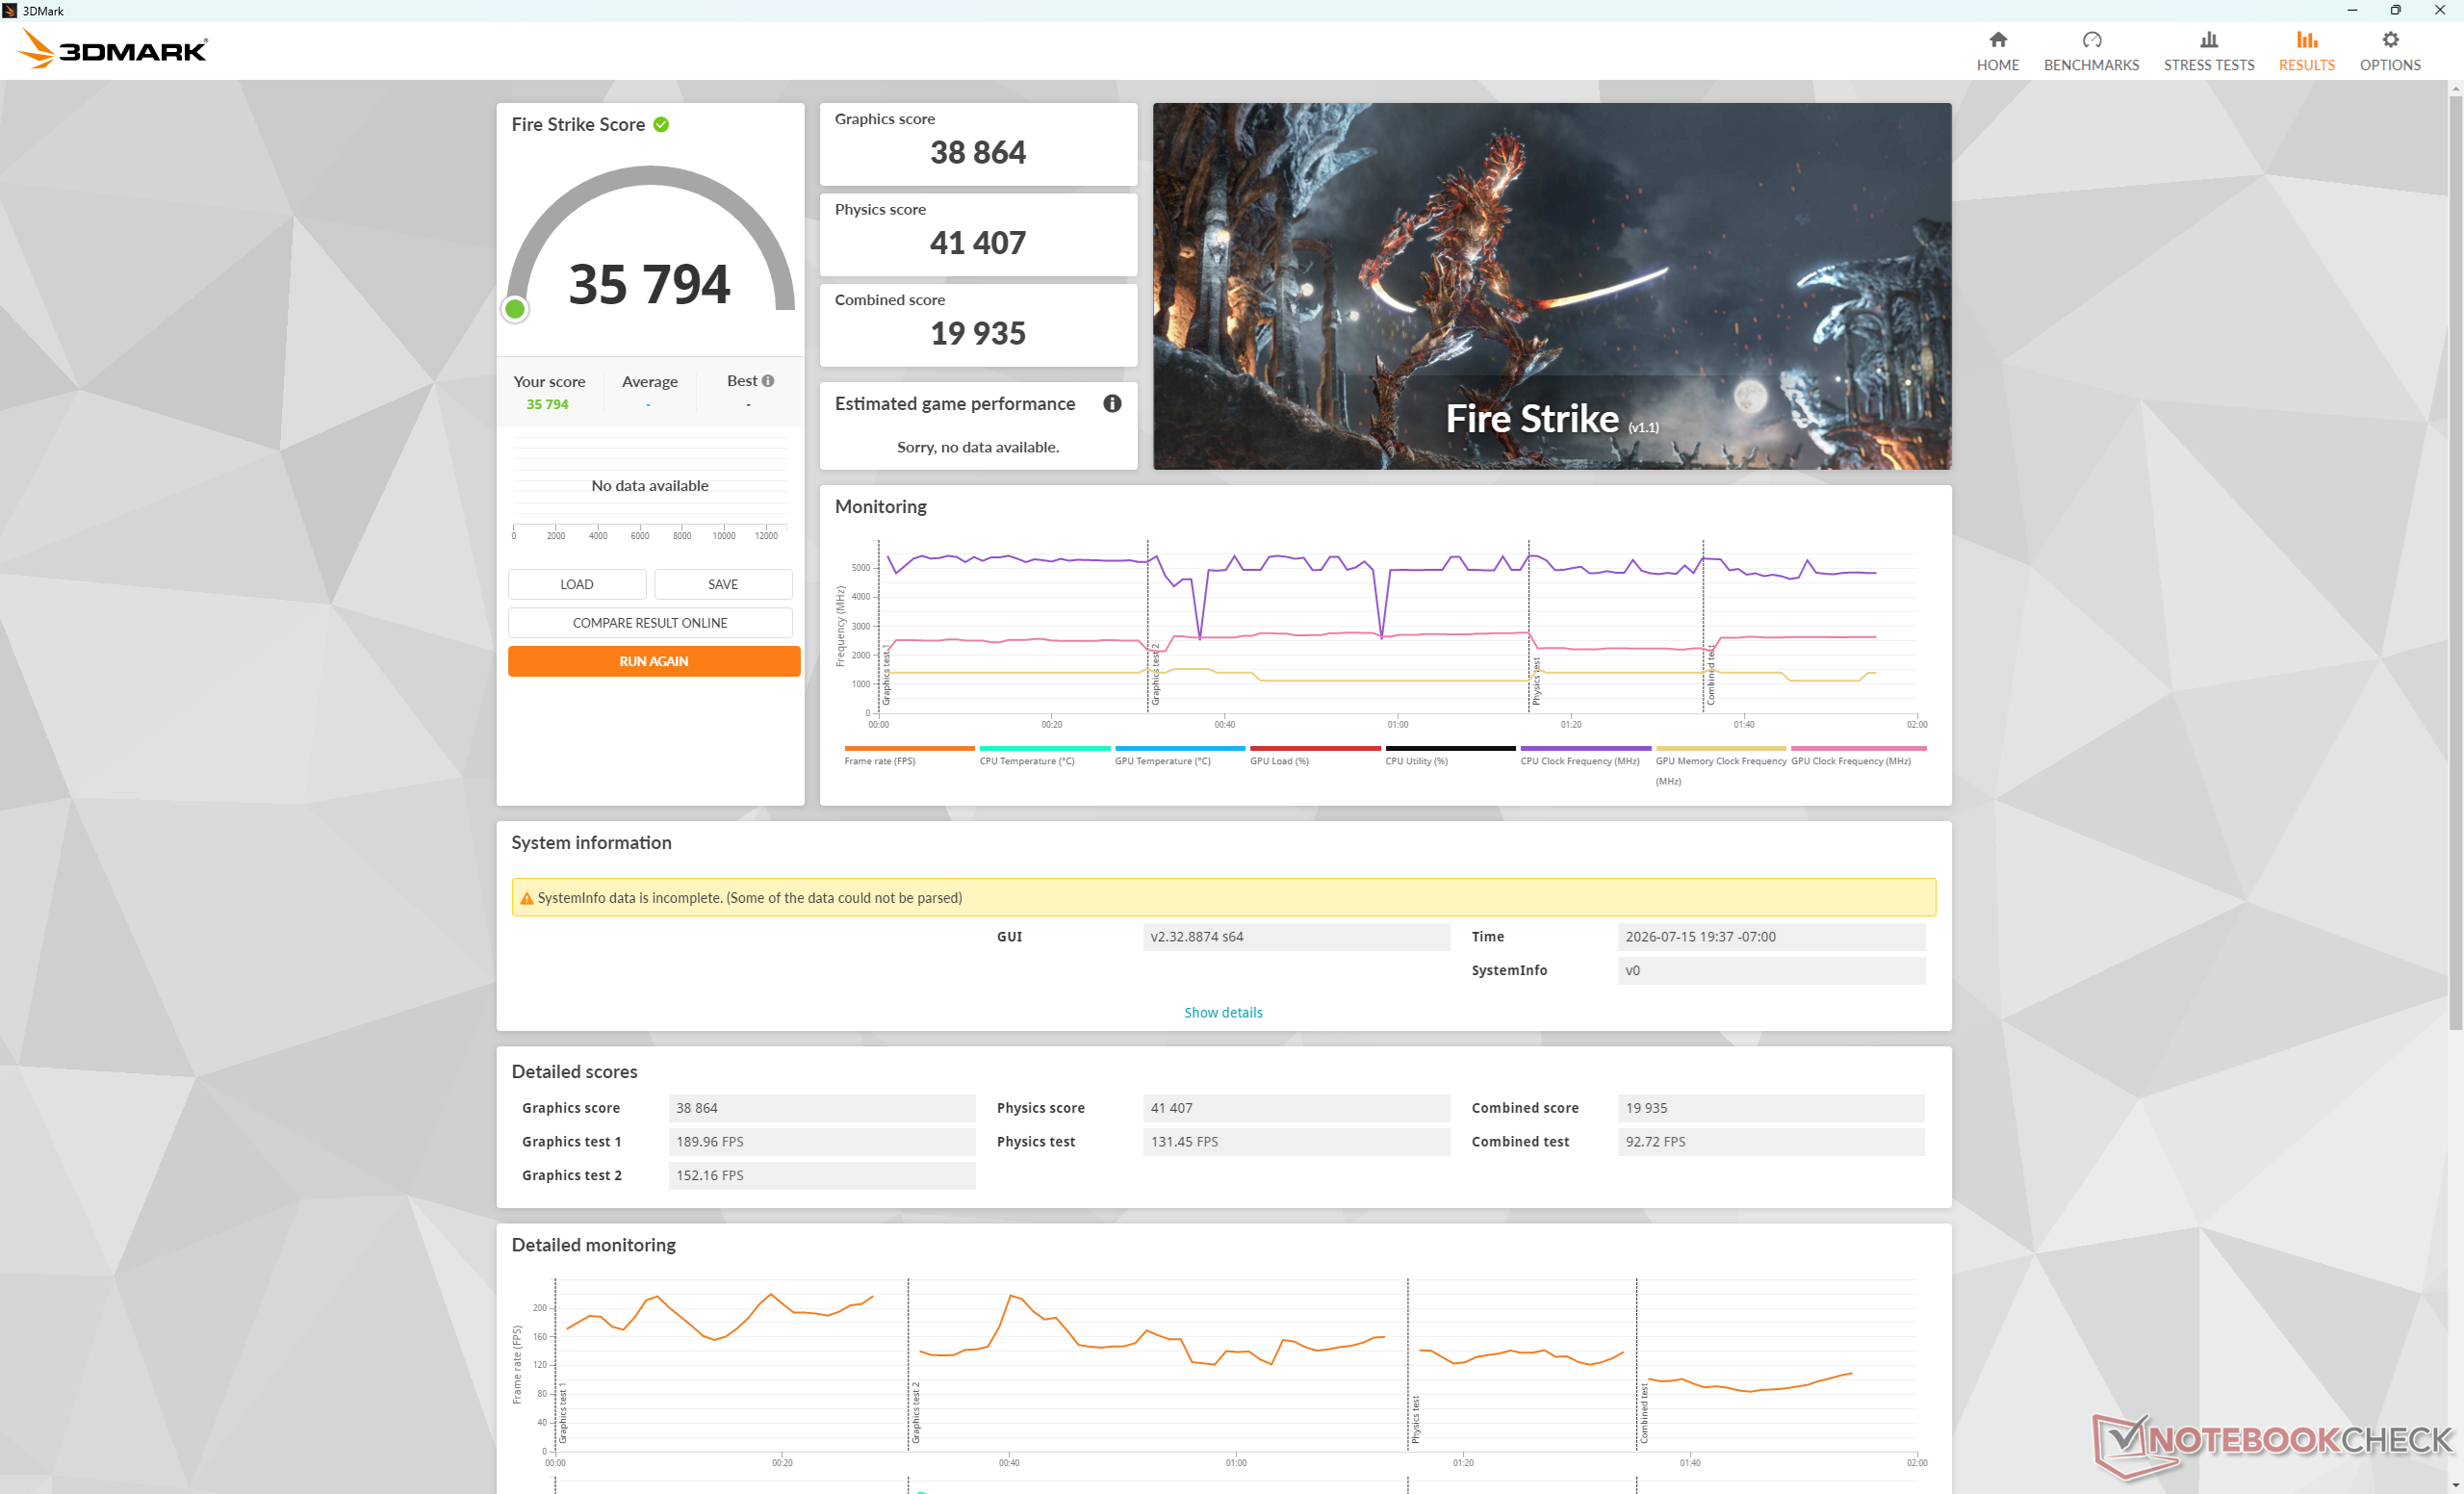
The 115 W GeForce RTX 5070 runs 5 to 10 percent faster than the average laptop in our database with the same GPU option. We recommend running on Performance mode or higher when gaming as running on Balanced mode would impact graphics performance by as much as 13 percent as shown by our Fire Strike results below.

Power ProfileGraphics ScorePhysics ScoreCombined Score
Unleashed Mode388644140719935
Performance Mode38484 (-1%)39567 (-4%)18485 (-7%)
Balanced Mode33847 (-13%)33778 (-18%)16119 (-19%)
Battery Power14105 (-64%)24832 (-40%)4124 (-79%)
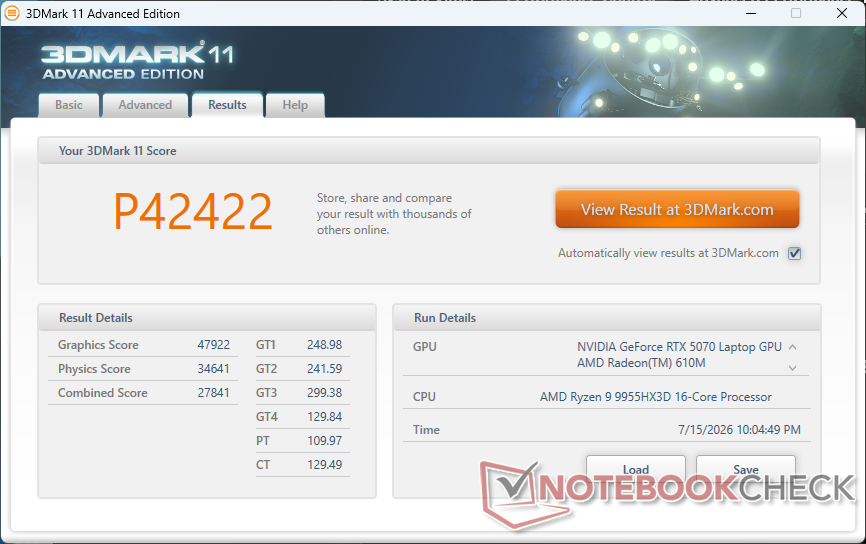
3DMark 11
3DMark 11
Fire Strike
Fire Strike
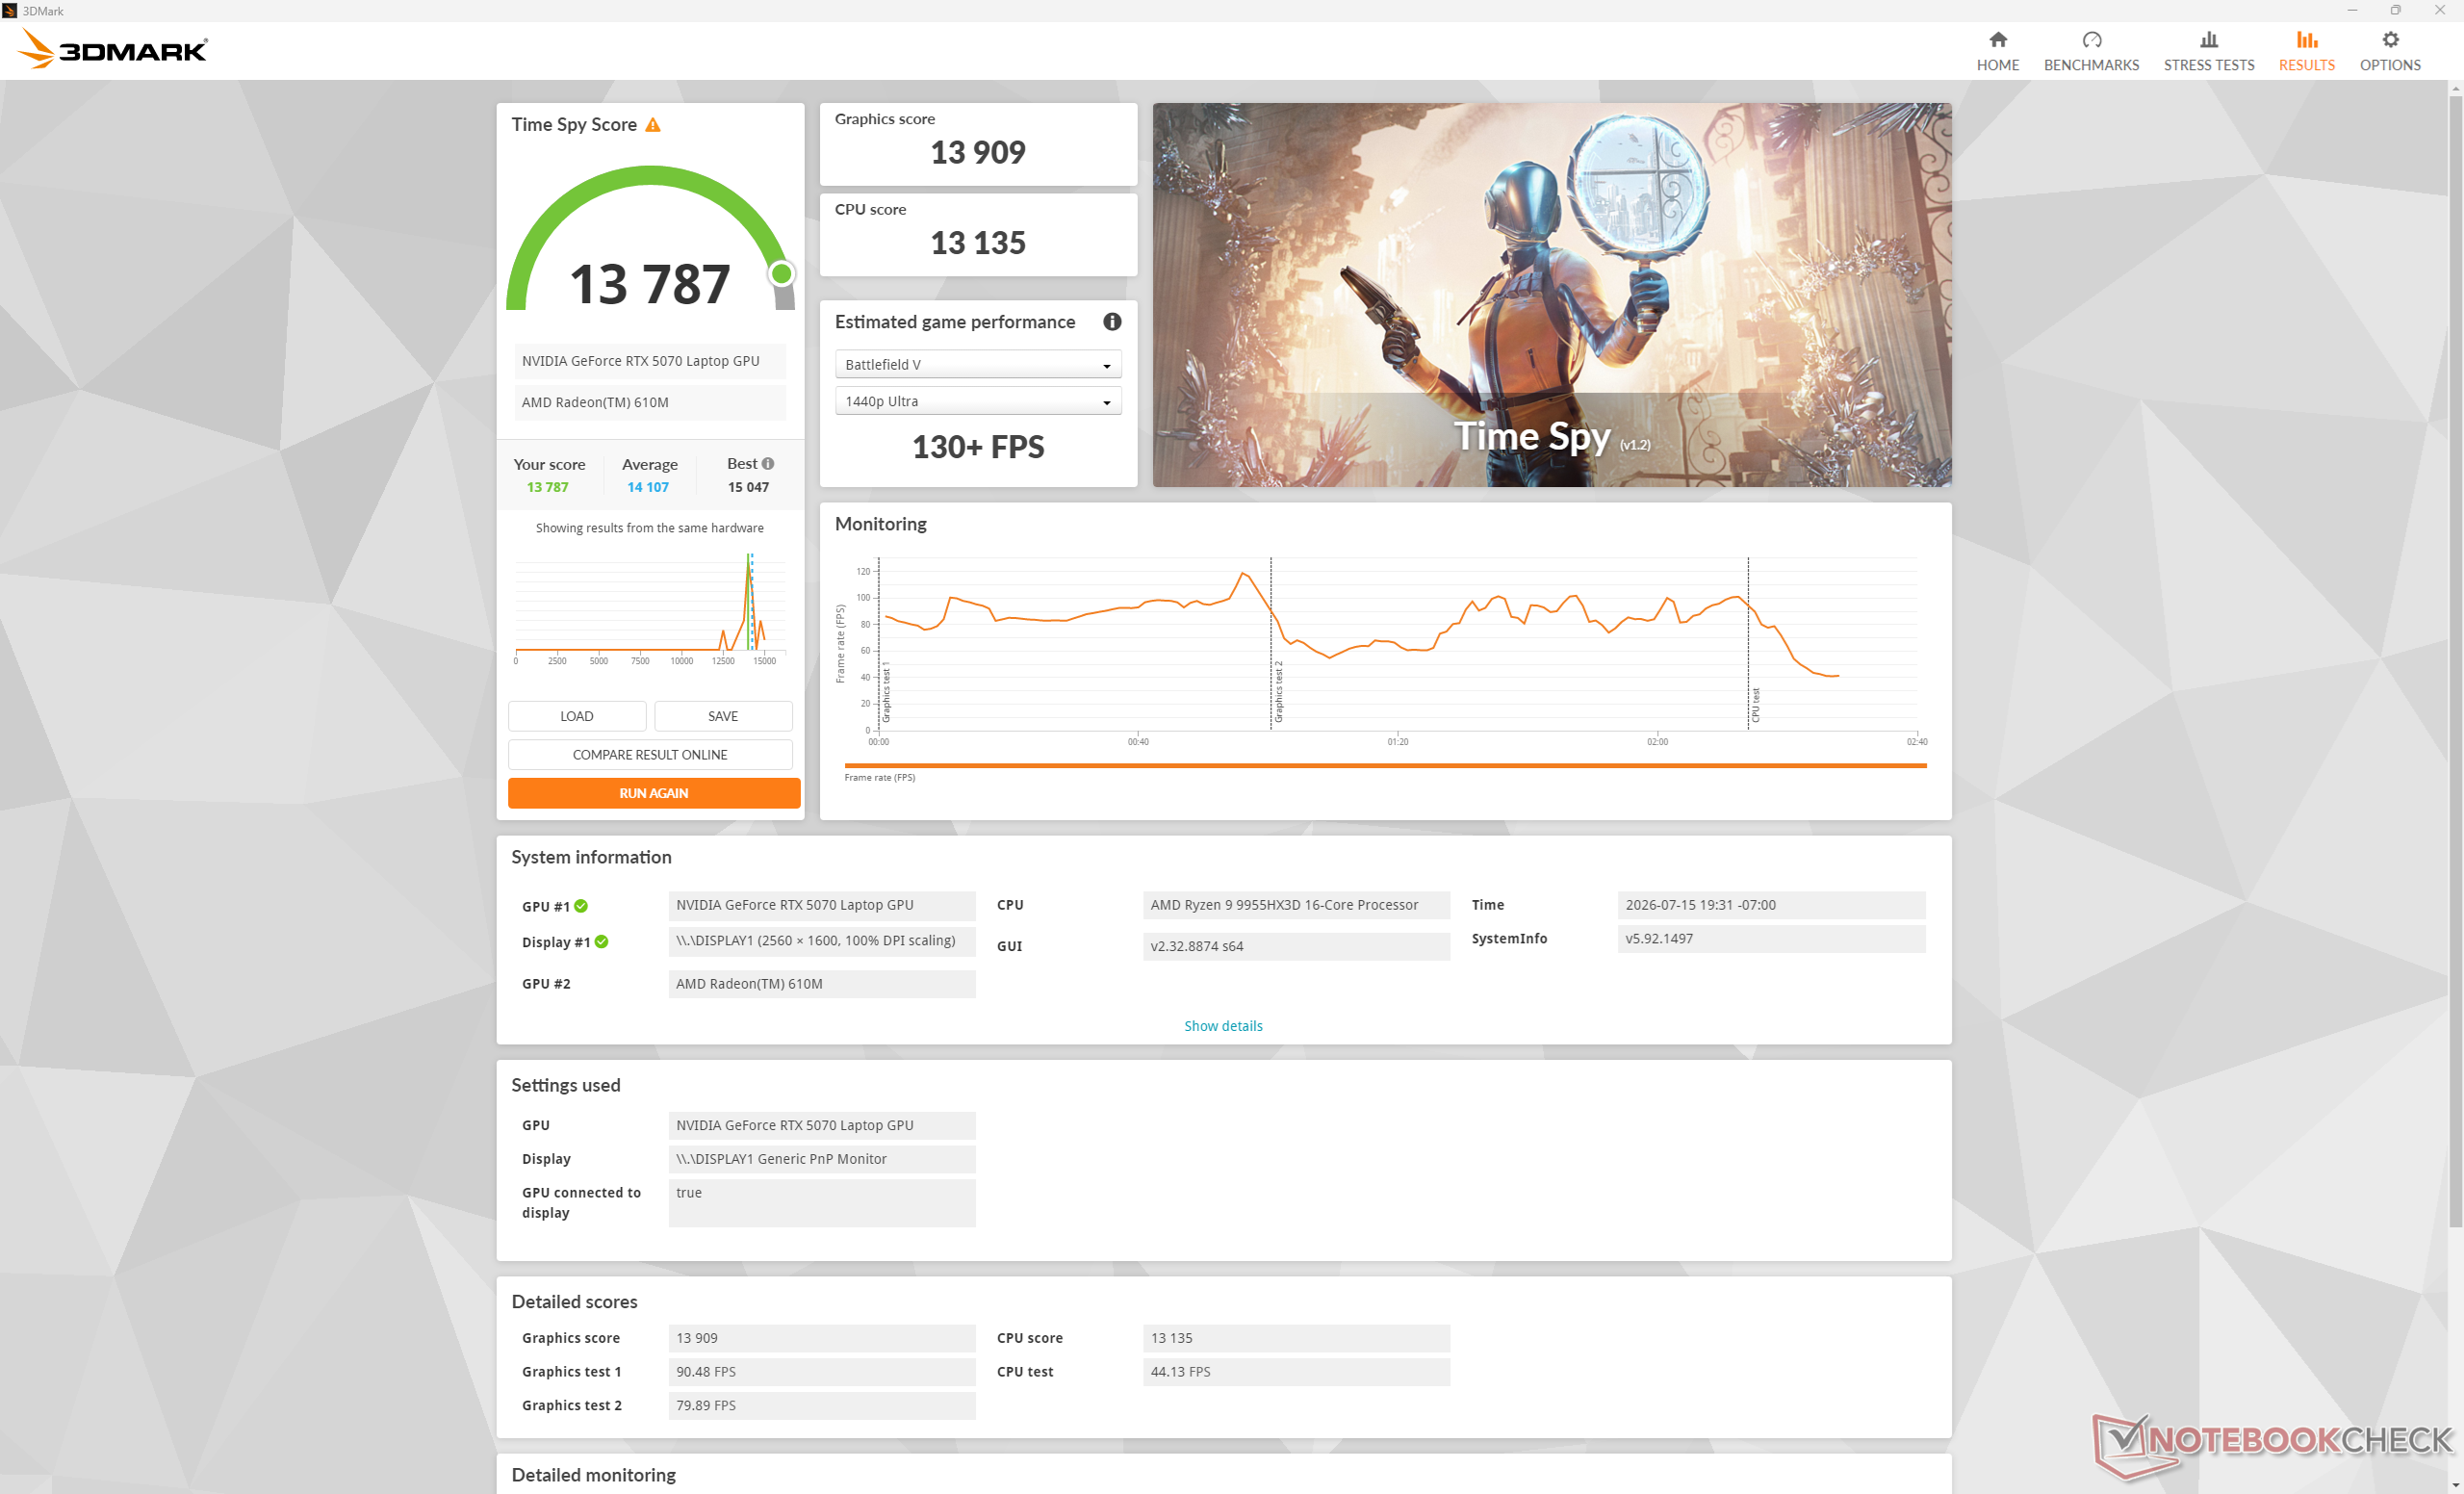
Time Spy
Time Spy
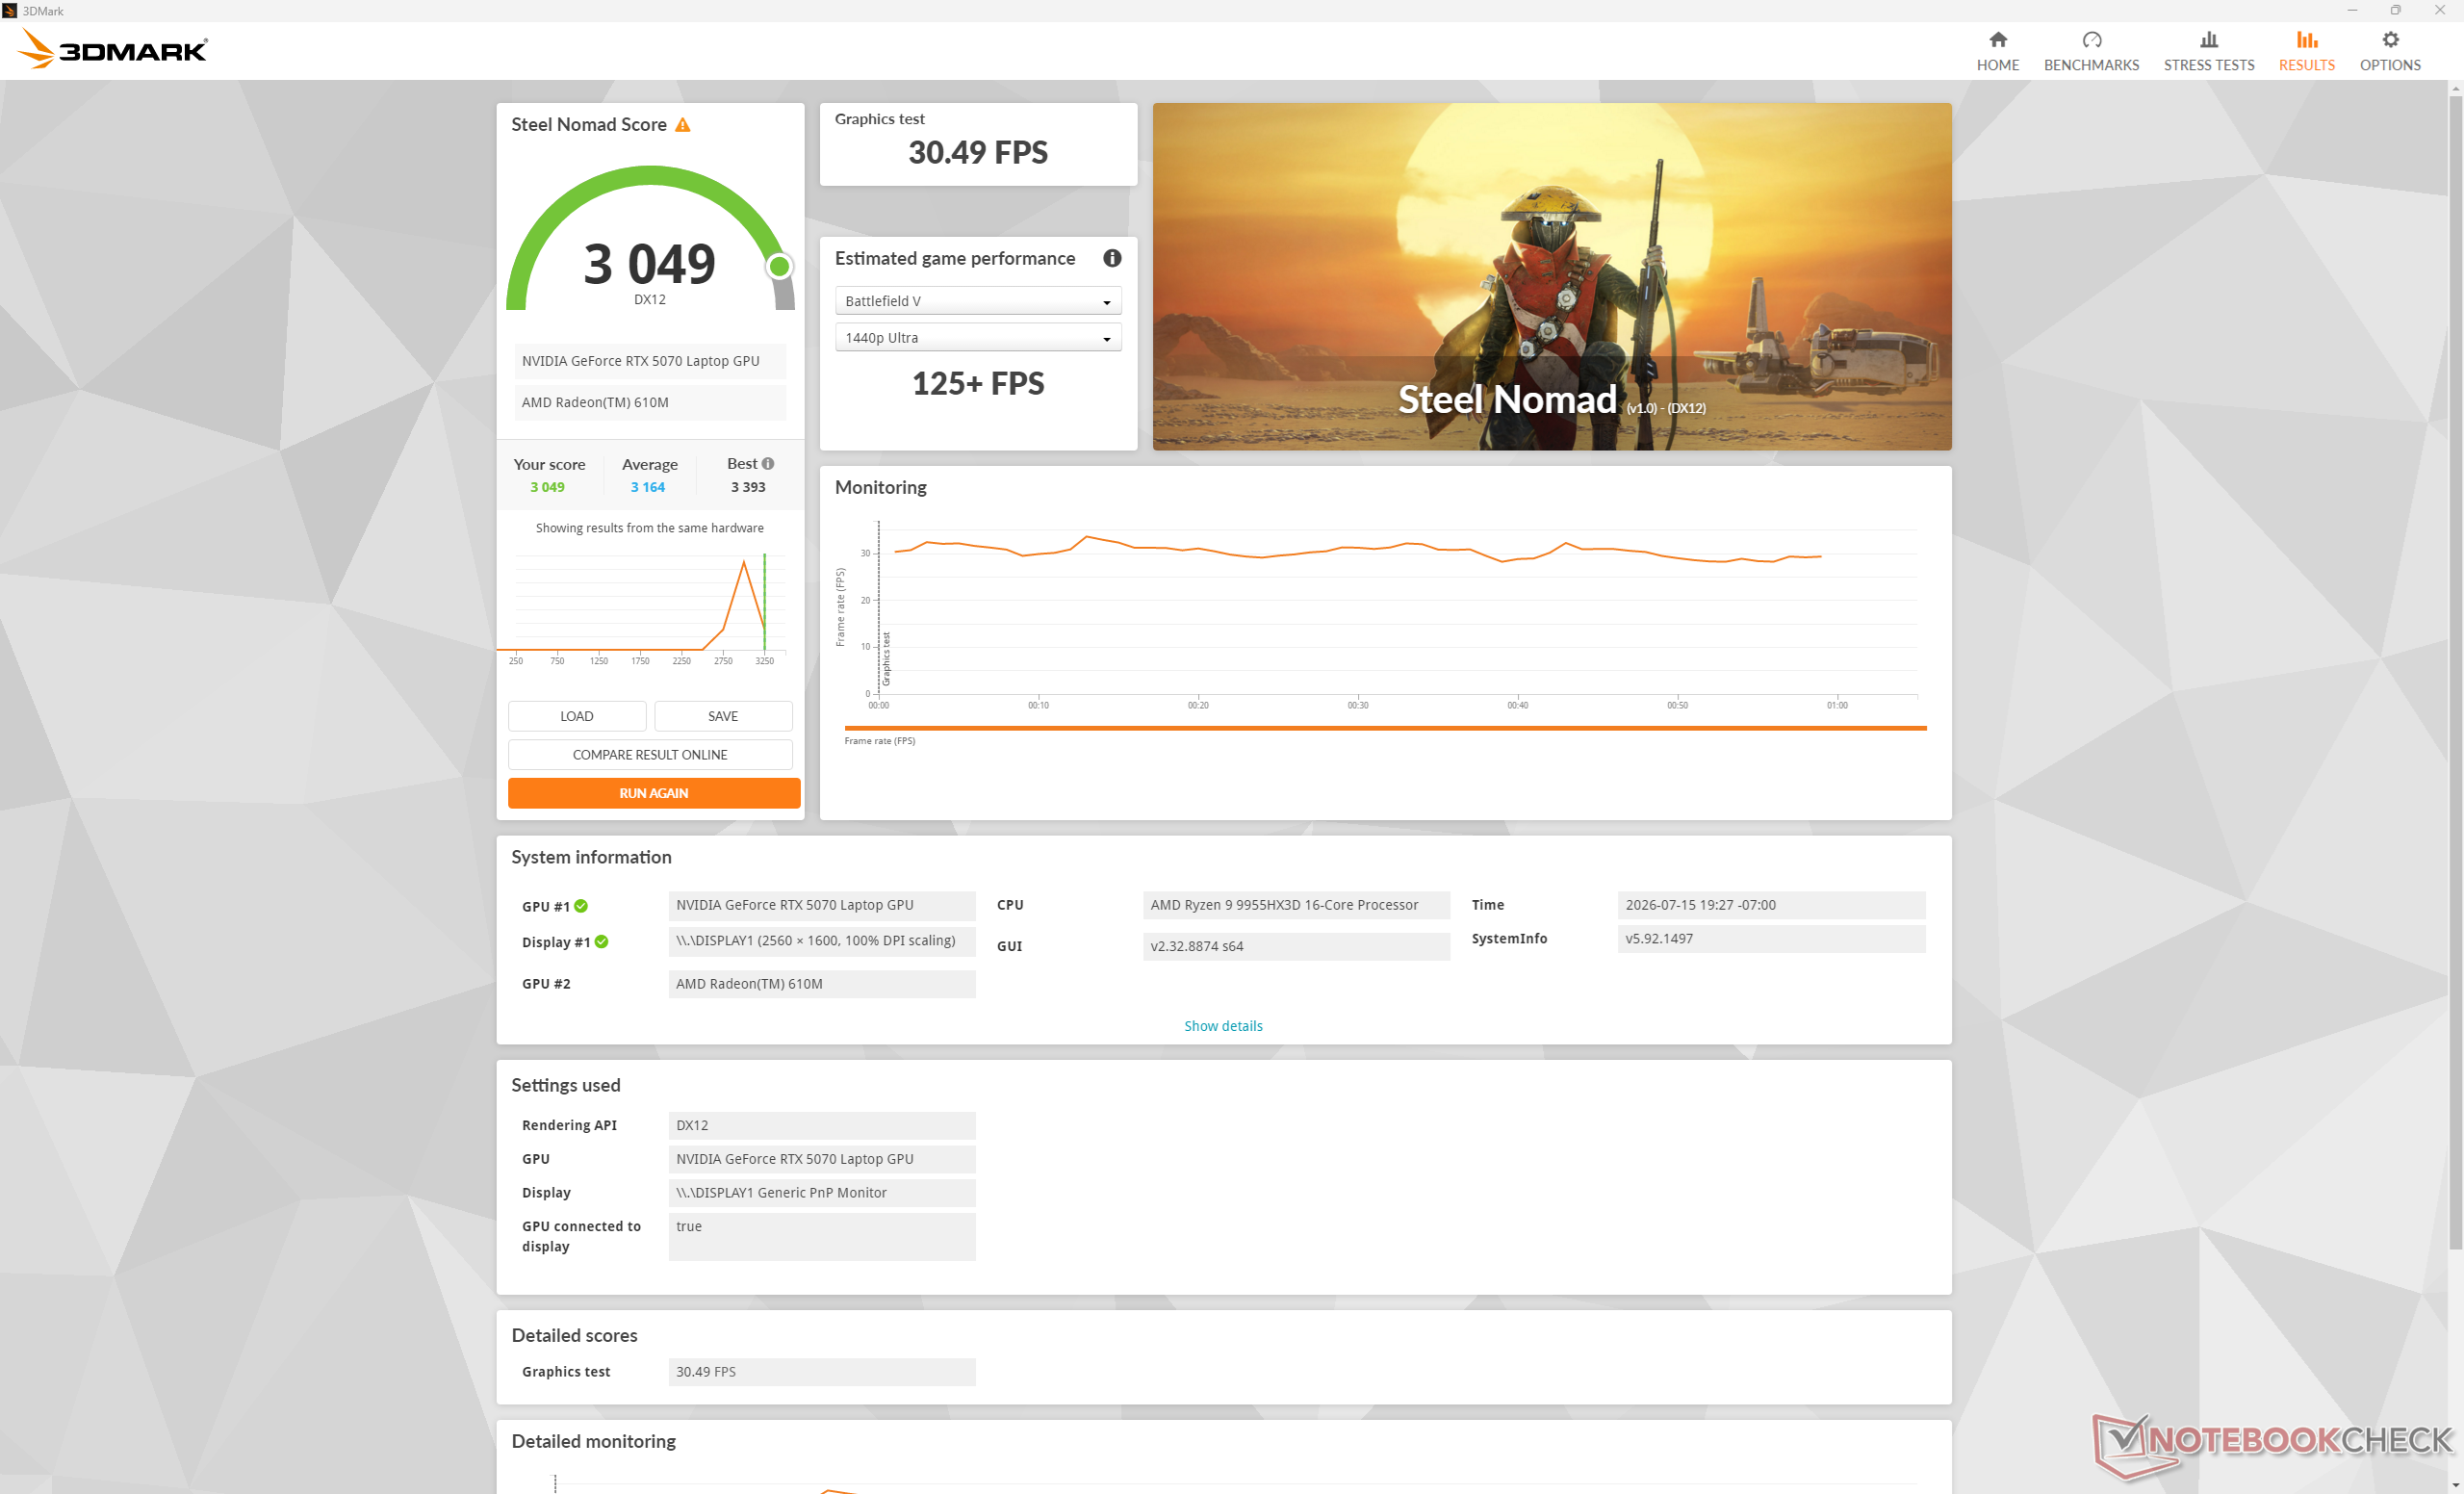
Steel Nomad
Steel Nomad
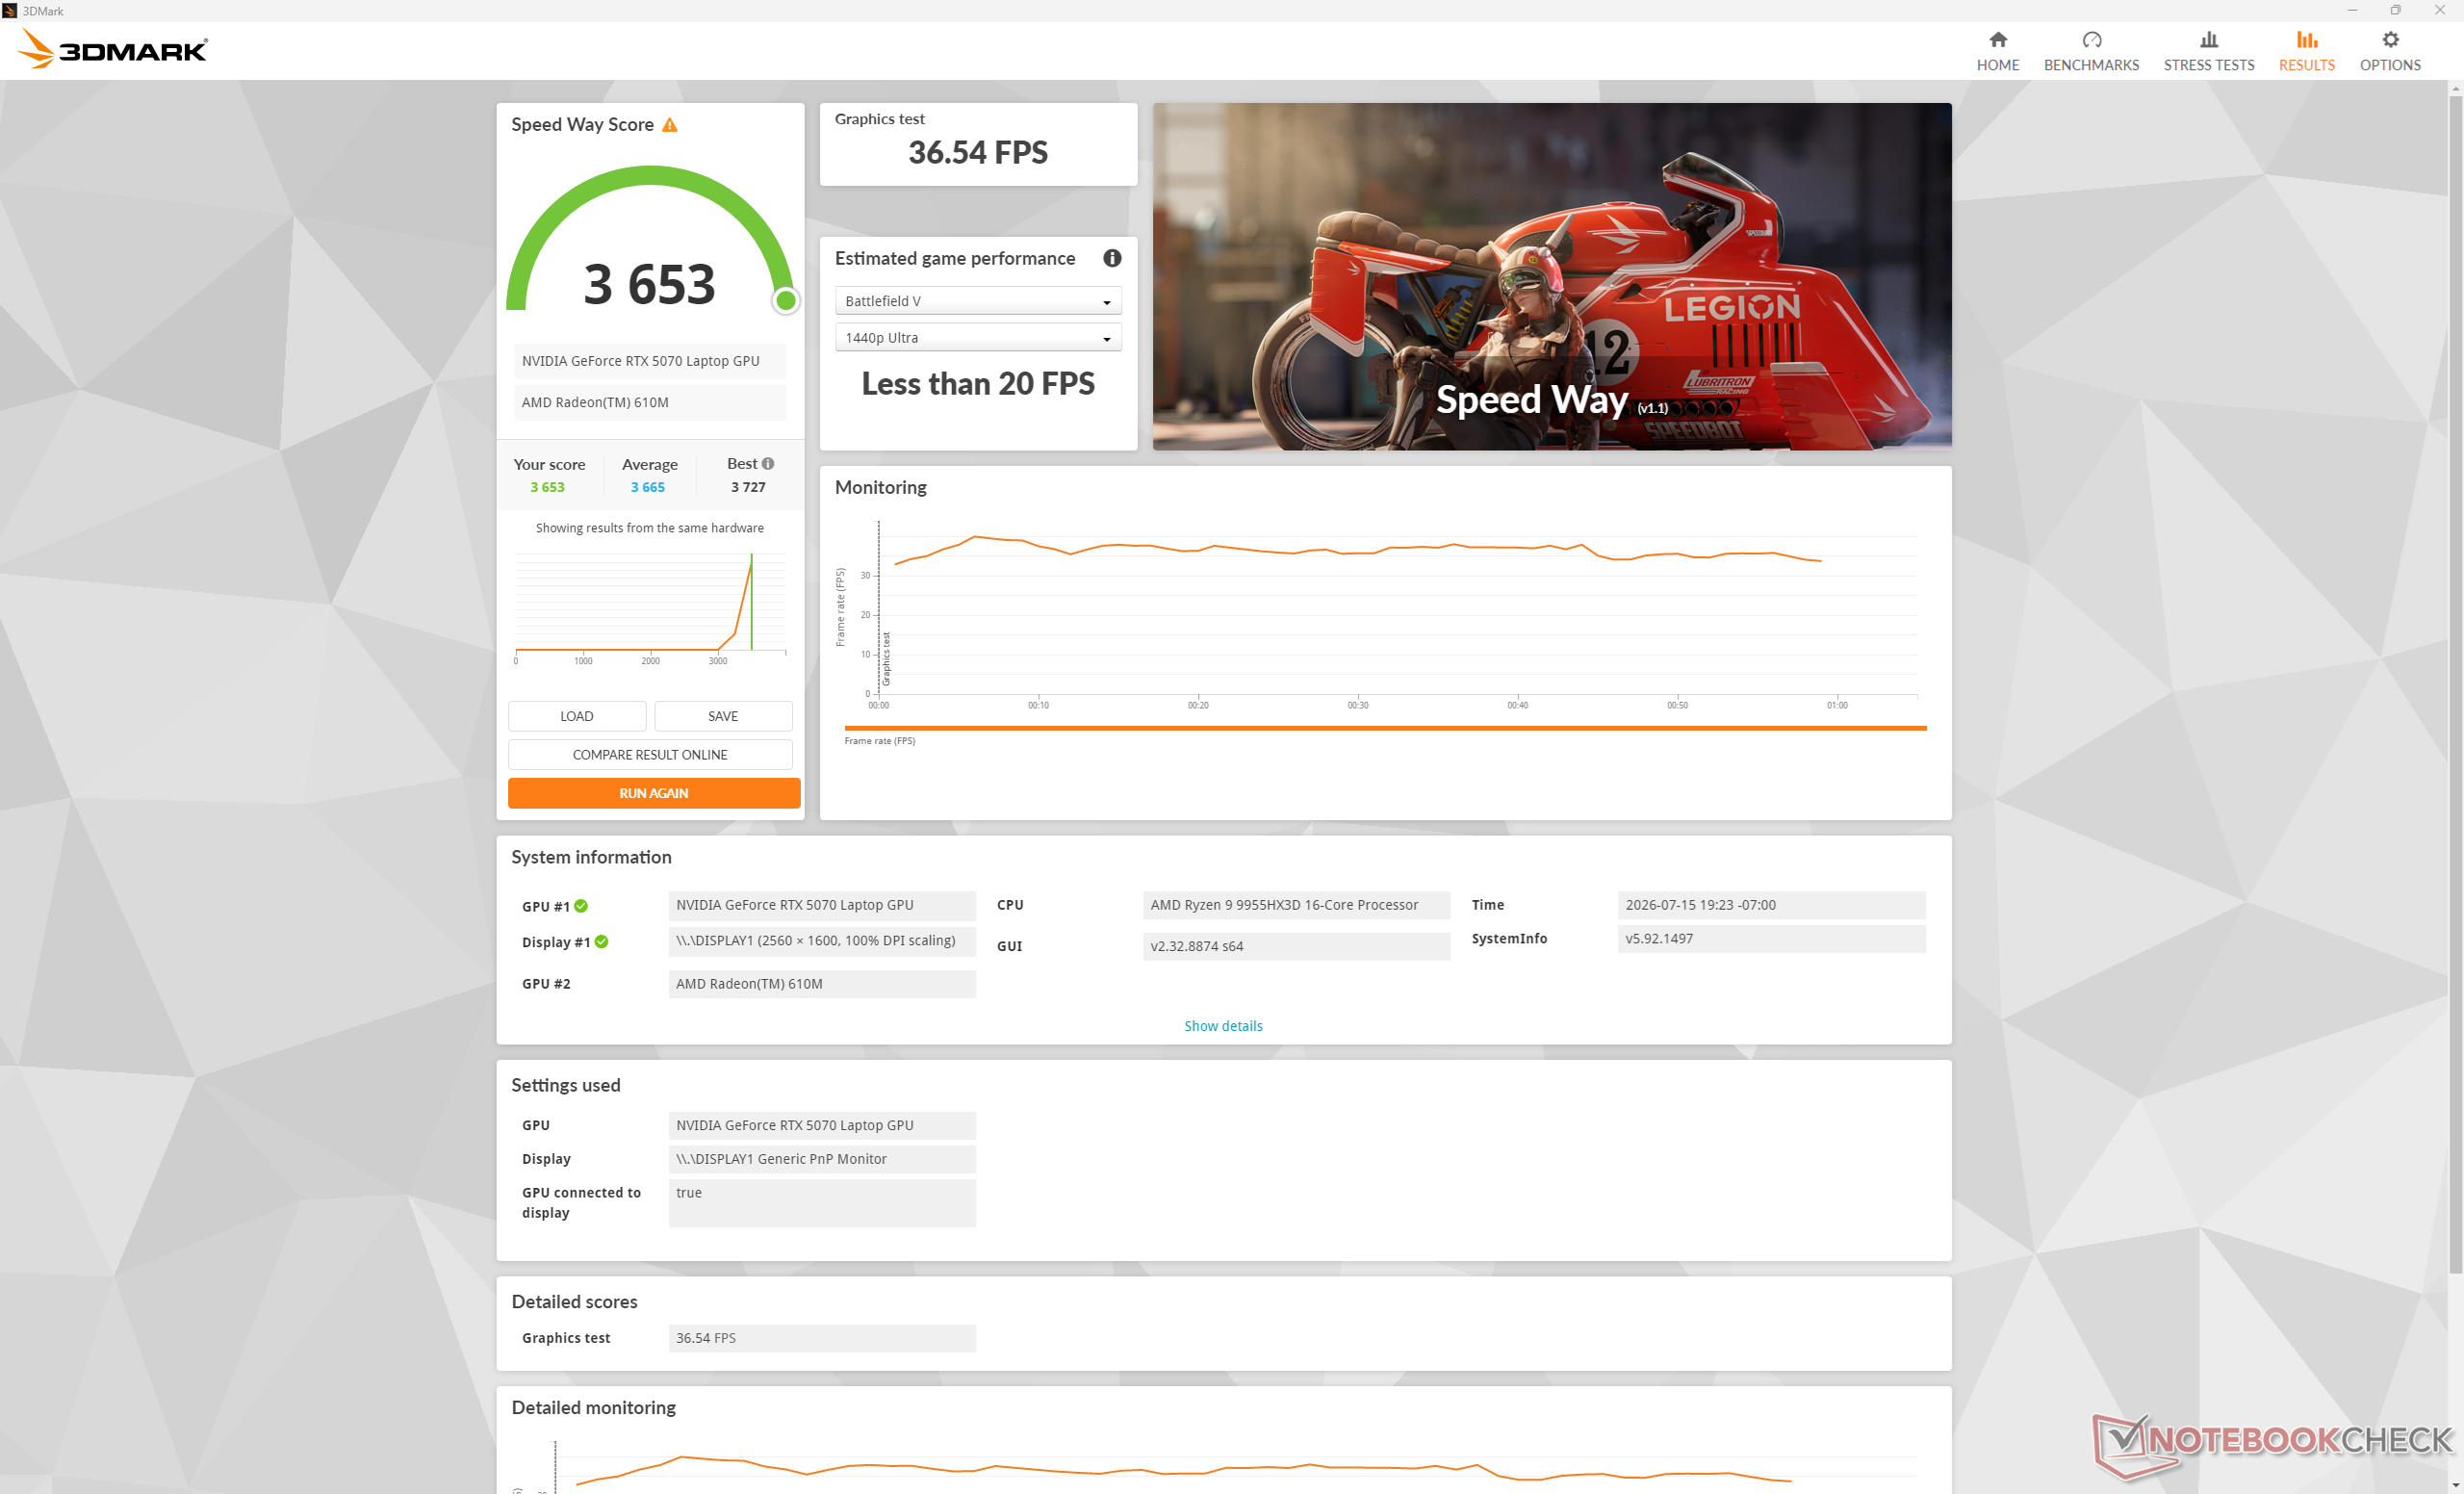
Speed Way
Speed Way
3DMark Performance rating - Percent
NVIDIA KFA2 GeForce RTX 5070 1-Click OC
NVIDIA GeForce RTX 5070, AMD Ryzen 7 9800X3D
99 pt
Lenovo Legion 9 16IRX9, RTX 4090 -2!
NVIDIA GeForce RTX 4090 Laptop GPU, Intel Core i9-14900HX
87.6 pt
Aorus Master 16 AM6J -2!
NVIDIA GeForce RTX 5080 Laptop, AMD Ryzen 9 9955HX3D
85.3 pt
Schenker XMG APEX 16 MAX -1!
NVIDIA GeForce RTX 5070 Ti Laptop, AMD Ryzen 9 9955HX
77.6 pt
Alienware 16X Aurora Core Ultra 9 290HX Plus
NVIDIA GeForce RTX 5070 Ti Laptop, Intel Core Ultra 9 290HX Plus
74 pt
Acer Predator Helios Neo 16S AI PHN16S-71-94L9 -2!
NVIDIA GeForce RTX 5070 Ti Laptop, Intel Core Ultra 9 275HX
66.5 pt
Lenovo Legion Pro 5 16IAX10, RTX 5070 -2!
NVIDIA GeForce RTX 5070 Laptop, Intel Core Ultra 7 255HX
64.7 pt
HP HyperX Omen 16 16-ap1931nr
NVIDIA GeForce RTX 5070 Laptop, AMD Ryzen 9 9955HX3D
63 pt
MSI Crosshair A16 HX E8WGK
NVIDIA GeForce RTX 5070 Laptop, AMD Ryzen 9 8940HX
63 pt
Average NVIDIA GeForce RTX 5070 Laptop
 
59.2 pt
HP Omen 16-ap0091ng -2!
NVIDIA GeForce RTX 5060 Laptop, AMD Ryzen 9 8940HX
52.6 pt
Alienware m16 R1 Intel -1!
NVIDIA GeForce RTX 4060 Laptop GPU, Intel Core i7-13700HX
48.6 pt
3DMark 11 - 1280x720 Performance GPU
NVIDIA KFA2 GeForce RTX 5070 1-Click OC
NVIDIA GeForce RTX 5070, AMD Ryzen 7 9800X3D
71642 Points +49%
Lenovo Legion 9 16IRX9, RTX 4090
NVIDIA GeForce RTX 4090 Laptop GPU, Intel Core i9-14900HX
64341 Points +34%
Aorus Master 16 AM6J
NVIDIA GeForce RTX 5080 Laptop, AMD Ryzen 9 9955HX3D
61571 Points +28%
Schenker XMG APEX 16 MAX
NVIDIA GeForce RTX 5070 Ti Laptop, AMD Ryzen 9 9955HX
57140 Points +19%
Alienware 16X Aurora Core Ultra 9 290HX Plus
NVIDIA GeForce RTX 5070 Ti Laptop, Intel Core Ultra 9 290HX Plus
54767 Points +14%
Acer Predator Helios Neo 16S AI PHN16S-71-94L9
NVIDIA GeForce RTX 5070 Ti Laptop, Intel Core Ultra 9 275HX
49092 Points +2%
Lenovo Legion Pro 5 16IAX10, RTX 5070
NVIDIA GeForce RTX 5070 Laptop, Intel Core Ultra 7 255HX
48777 Points +2%
HP HyperX Omen 16 16-ap1931nr
NVIDIA GeForce RTX 5070 Laptop, AMD Ryzen 9 9955HX3D
47922 Points
MSI Crosshair A16 HX E8WGK
NVIDIA GeForce RTX 5070 Laptop, AMD Ryzen 9 8940HX
45691 Points -5%
Average NVIDIA GeForce RTX 5070 Laptop
  (36721 - 49568, n=29)
44394 Points -7%
Alienware m16 R1 Intel
NVIDIA GeForce RTX 4060 Laptop GPU, Intel Core i7-13700HX
37496 Points -22%
HP Omen 16-ap0091ng
NVIDIA GeForce RTX 5060 Laptop, AMD Ryzen 9 8940HX
36563 Points -24%
3DMark
1920x1080 Fire Strike Graphics
NVIDIA KFA2 GeForce RTX 5070 1-Click OC
NVIDIA GeForce RTX 5070, AMD Ryzen 7 9800X3D
58426 Points +50%
Aorus Master 16 AM6J
NVIDIA GeForce RTX 5080 Laptop, AMD Ryzen 9 9955HX3D
46816 Points +20%
Schenker XMG APEX 16 MAX
NVIDIA GeForce RTX 5070 Ti Laptop, AMD Ryzen 9 9955HX
44206 Points +14%
Alienware 16X Aurora Core Ultra 9 290HX Plus
NVIDIA GeForce RTX 5070 Ti Laptop, Intel Core Ultra 9 290HX Plus
43581 Points +12%
Lenovo Legion 9 16IRX9, RTX 4090
NVIDIA GeForce RTX 4090 Laptop GPU, Intel Core i9-14900HX
43518 Points +12%
MSI Crosshair A16 HX E8WGK
NVIDIA GeForce RTX 5070 Laptop, AMD Ryzen 9 8940HX
38954 Points 0%
HP HyperX Omen 16 16-ap1931nr
NVIDIA GeForce RTX 5070 Laptop, AMD Ryzen 9 9955HX3D
38864 Points
Lenovo Legion Pro 5 16IAX10, RTX 5070
NVIDIA GeForce RTX 5070 Laptop, Intel Core Ultra 7 255HX
37831 Points -3%
Acer Predator Helios Neo 16S AI PHN16S-71-94L9
NVIDIA GeForce RTX 5070 Ti Laptop, Intel Core Ultra 9 275HX
36184 Points -7%
Average NVIDIA GeForce RTX 5070 Laptop
  (28759 - 38954, n=34)
35449 Points -9%
HP Omen 16-ap0091ng
NVIDIA GeForce RTX 5060 Laptop, AMD Ryzen 9 8940HX
30913 Points -20%
Alienware m16 R1 Intel
NVIDIA GeForce RTX 4060 Laptop GPU, Intel Core i7-13700HX
27506 Points -29%
2560x1440 Time Spy Graphics
NVIDIA KFA2 GeForce RTX 5070 1-Click OC
NVIDIA GeForce RTX 5070, AMD Ryzen 7 9800X3D
22423 Points +61%
Lenovo Legion 9 16IRX9, RTX 4090
NVIDIA GeForce RTX 4090 Laptop GPU, Intel Core i9-14900HX
20416 Points +47%
Aorus Master 16 AM6J
NVIDIA GeForce RTX 5080 Laptop, AMD Ryzen 9 9955HX3D
19673 Points +41%
Schenker XMG APEX 16 MAX
NVIDIA GeForce RTX 5070 Ti Laptop, AMD Ryzen 9 9955HX
17914 Points +29%
Alienware 16X Aurora Core Ultra 9 290HX Plus
NVIDIA GeForce RTX 5070 Ti Laptop, Intel Core Ultra 9 290HX Plus
16458 Points +18%
Acer Predator Helios Neo 16S AI PHN16S-71-94L9
NVIDIA GeForce RTX 5070 Ti Laptop, Intel Core Ultra 9 275HX
14615 Points +5%
MSI Crosshair A16 HX E8WGK
NVIDIA GeForce RTX 5070 Laptop, AMD Ryzen 9 8940HX
14118 Points +2%
HP HyperX Omen 16 16-ap1931nr
NVIDIA GeForce RTX 5070 Laptop, AMD Ryzen 9 9955HX3D
13909 Points
Lenovo Legion Pro 5 16IAX10, RTX 5070
NVIDIA GeForce RTX 5070 Laptop, Intel Core Ultra 7 255HX
13510 Points -3%
Average NVIDIA GeForce RTX 5070 Laptop
  (10851 - 14771, n=34)
13264 Points -5%
HP Omen 16-ap0091ng
NVIDIA GeForce RTX 5060 Laptop, AMD Ryzen 9 8940HX
11655 Points -16%
Alienware m16 R1 Intel
NVIDIA GeForce RTX 4060 Laptop GPU, Intel Core i7-13700HX
10591 Points -24%
2560x1440 Time Spy Score
NVIDIA KFA2 GeForce RTX 5070 1-Click OC
NVIDIA GeForce RTX 5070, AMD Ryzen 7 9800X3D
21110 Points +53%
Lenovo Legion 9 16IRX9, RTX 4090
NVIDIA GeForce RTX 4090 Laptop GPU, Intel Core i9-14900HX
20099 Points +46%
Aorus Master 16 AM6J
NVIDIA GeForce RTX 5080 Laptop, AMD Ryzen 9 9955HX3D
18453 Points +34%
Schenker XMG APEX 16 MAX
NVIDIA GeForce RTX 5070 Ti Laptop, AMD Ryzen 9 9955HX
17095 Points +24%
Alienware 16X Aurora Core Ultra 9 290HX Plus
NVIDIA GeForce RTX 5070 Ti Laptop, Intel Core Ultra 9 290HX Plus
16581 Points +20%
Acer Predator Helios Neo 16S AI PHN16S-71-94L9
NVIDIA GeForce RTX 5070 Ti Laptop, Intel Core Ultra 9 275HX
14888 Points +8%
MSI Crosshair A16 HX E8WGK
NVIDIA GeForce RTX 5070 Laptop, AMD Ryzen 9 8940HX
13964 Points +1%
Lenovo Legion Pro 5 16IAX10, RTX 5070
NVIDIA GeForce RTX 5070 Laptop, Intel Core Ultra 7 255HX
13880 Points +1%
HP HyperX Omen 16 16-ap1931nr
NVIDIA GeForce RTX 5070 Laptop, AMD Ryzen 9 9955HX3D
13787 Points
Average NVIDIA GeForce RTX 5070 Laptop
  (11192 - 14448, n=34)
13120 Points -5%
HP Omen 16-ap0091ng
NVIDIA GeForce RTX 5060 Laptop, AMD Ryzen 9 8940HX
11484 Points -17%
Alienware m16 R1 Intel
NVIDIA GeForce RTX 4060 Laptop GPU, Intel Core i7-13700HX
11090 Points -20%
2560x1440 Speed Way Score
NVIDIA KFA2 GeForce RTX 5070 1-Click OC
NVIDIA GeForce RTX 5070, AMD Ryzen 7 9800X3D
5895 Points +61%
Alienware 16X Aurora Core Ultra 9 290HX Plus
NVIDIA GeForce RTX 5070 Ti Laptop, Intel Core Ultra 9 290HX Plus
4313 Points +18%
MSI Crosshair A16 HX E8WGK
NVIDIA GeForce RTX 5070 Laptop, AMD Ryzen 9 8940HX
3682 Points +1%
HP HyperX Omen 16 16-ap1931nr
NVIDIA GeForce RTX 5070 Laptop, AMD Ryzen 9 9955HX3D
3653 Points
Average NVIDIA GeForce RTX 5070 Laptop
  (2796 - 3682, n=10)
3418 Points -6%
Alienware m16 R1 Intel
NVIDIA GeForce RTX 4060 Laptop GPU, Intel Core i7-13700HX
2591 Points -29%
Steel Nomad Score
NVIDIA KFA2 GeForce RTX 5070 1-Click OC
NVIDIA GeForce RTX 5070, AMD Ryzen 7 9800X3D
5521 Points +81%
NVIDIA KFA2 GeForce RTX 5070 1-Click OC
NVIDIA GeForce RTX 5070, AMD Ryzen 7 9800X3D
4866 Points +60%
Schenker XMG APEX 16 MAX
NVIDIA GeForce RTX 5070 Ti Laptop, AMD Ryzen 9 9955HX
3953 Points +30%
Alienware 16X Aurora Core Ultra 9 290HX Plus
NVIDIA GeForce RTX 5070 Ti Laptop, Intel Core Ultra 9 290HX Plus
3741 Points +23%
MSI Crosshair A16 HX E8WGK
NVIDIA GeForce RTX 5070 Laptop, AMD Ryzen 9 8940HX
3087 Points +1%
HP HyperX Omen 16 16-ap1931nr
NVIDIA GeForce RTX 5070 Laptop, AMD Ryzen 9 9955HX3D
3049 Points
Average NVIDIA GeForce RTX 5070 Laptop
  (2441 - 3195, n=21)
2952 Points -3%
3DMark 11 Performance
42422 points
3DMark Cloud Gate Standard Score
77325 points
3DMark Fire Strike Score
35794 points
3DMark Time Spy Score
13787 points
3DMark Steel Nomad Score
3049 points
Help
Blender
v3.3 Classroom OPTIX/RTX
HP Omen 16-ap0091ng
NVIDIA GeForce RTX 5060 Laptop, AMD Ryzen 9 8940HX
21 Seconds * -24%
Asus TUF Gaming A16 FA608UP
NVIDIA GeForce RTX 5070 Laptop, AMD Ryzen 7 260
20 Seconds * -18%
Lenovo Legion Pro 5 16IAX10, RTX 5070
NVIDIA GeForce RTX 5070 Laptop, Intel Core Ultra 7 255HX
18 Seconds * -6%
MSI Crosshair A16 HX E8WGK
NVIDIA GeForce RTX 5070 Laptop, AMD Ryzen 9 8940HX
17 Seconds * -0%
HP HyperX Omen 16 16-ap1931nr
NVIDIA GeForce RTX 5070 Laptop, AMD Ryzen 9 9955HX3D
17 Seconds *
Alienware 16X Aurora Core Ultra 9 290HX Plus
NVIDIA GeForce RTX 5070 Ti Laptop, Intel Core Ultra 9 290HX Plus
14 Seconds * +18%
v3.3 Classroom CUDA
HP Omen 16-ap0091ng
NVIDIA GeForce RTX 5060 Laptop, AMD Ryzen 9 8940HX
38 Seconds * -27%
Asus TUF Gaming A16 FA608UP
NVIDIA GeForce RTX 5070 Laptop, AMD Ryzen 7 260
33.1 Seconds * -10%
MSI Crosshair A16 HX E8WGK
NVIDIA GeForce RTX 5070 Laptop, AMD Ryzen 9 8940HX
30 Seconds * -0%
HP HyperX Omen 16 16-ap1931nr
NVIDIA GeForce RTX 5070 Laptop, AMD Ryzen 9 9955HX3D
30 Seconds *
Lenovo Legion Pro 5 16IAX10, RTX 5070
NVIDIA GeForce RTX 5070 Laptop, Intel Core Ultra 7 255HX
29 Seconds * +3%
Alienware 16X Aurora Core Ultra 9 290HX Plus
NVIDIA GeForce RTX 5070 Ti Laptop, Intel Core Ultra 9 290HX Plus
25 Seconds * +17%
v3.3 Classroom CPU
Asus TUF Gaming A16 FA608UP
NVIDIA GeForce RTX 5070 Laptop, AMD Ryzen 7 260
292 Seconds * -112%
HP Omen 16-ap0091ng
NVIDIA GeForce RTX 5060 Laptop, AMD Ryzen 9 8940HX
195 Seconds * -41%
Lenovo Legion Pro 5 16IAX10, RTX 5070
NVIDIA GeForce RTX 5070 Laptop, Intel Core Ultra 7 255HX
171 Seconds * -24%
Alienware 16X Aurora Core Ultra 9 290HX Plus
NVIDIA GeForce RTX 5070 Ti Laptop, Intel Core Ultra 9 290HX Plus
155 Seconds * -12%
MSI Crosshair A16 HX E8WGK
NVIDIA GeForce RTX 5070 Laptop, AMD Ryzen 9 8940HX
150 Seconds * -9%
HP HyperX Omen 16 16-ap1931nr
NVIDIA GeForce RTX 5070 Laptop, AMD Ryzen 9 9955HX3D
138 Seconds *
v4.3 Barbershop CPU
Alienware 16X Aurora Core Ultra 9 290HX Plus
NVIDIA GeForce RTX 5070 Ti Laptop, Intel Core Ultra 9 290HX Plus
766 Seconds * -10%
MSI Crosshair A16 HX E8WGK
NVIDIA GeForce RTX 5070 Laptop, AMD Ryzen 9 8940HX
716 Seconds * -3%
HP HyperX Omen 16 16-ap1931nr
NVIDIA GeForce RTX 5070 Laptop, AMD Ryzen 9 9955HX3D
694 Seconds *
v4.3 Barbershop OPTIX
MSI Crosshair A16 HX E8WGK
NVIDIA GeForce RTX 5070 Laptop, AMD Ryzen 9 8940HX
86 Seconds * -1%
HP HyperX Omen 16 16-ap1931nr
NVIDIA GeForce RTX 5070 Laptop, AMD Ryzen 9 9955HX3D
85 Seconds *
Alienware 16X Aurora Core Ultra 9 290HX Plus
NVIDIA GeForce RTX 5070 Ti Laptop, Intel Core Ultra 9 290HX Plus
73 Seconds * +14%

* ... smaller is better

Performance rating - Percent
Alienware 16X Aurora Core Ultra 9 290HX Plus
Intel Core Ultra 9 290HX Plus, NVIDIA GeForce RTX 5070 Ti Laptop
97.7 pt
HP HyperX Omen 16 16-ap1931nr
AMD Ryzen 9 9955HX3D, NVIDIA GeForce RTX 5070 Laptop
92.3 pt
MSI Crosshair A16 HX E8WGK
AMD Ryzen 9 8940HX, NVIDIA GeForce RTX 5070 Laptop
89.2 pt
Lenovo Legion Pro 5 16IAX10, RTX 5070
Intel Core Ultra 7 255HX, NVIDIA GeForce RTX 5070 Laptop
86.4 pt
Asus TUF Gaming A16 FA608UP
AMD Ryzen 7 260, NVIDIA GeForce RTX 5070 Laptop
77.1 pt
HP Omen 16-ap0091ng
AMD Ryzen 9 8940HX, NVIDIA GeForce RTX 5060 Laptop
74.5 pt
Cyberpunk 2077 - 1920x1080 Ultra Preset (FSR off)
Alienware 16X Aurora Core Ultra 9 290HX Plus
Intel Core Ultra 9 290HX Plus, NVIDIA GeForce RTX 5070 Ti Laptop
114.9 (92.5min, 83.6P1) fps +6%
MSI Crosshair A16 HX E8WGK
AMD Ryzen 9 8940HX, NVIDIA GeForce RTX 5070 Laptop
112.1 (90.9min, 85.1P1) fps +3%
Asus TUF Gaming A16 FA608UP
AMD Ryzen 7 260, NVIDIA GeForce RTX 5070 Laptop
109.4 (88.6min) fps +1%
HP HyperX Omen 16 16-ap1931nr
AMD Ryzen 9 9955HX3D, NVIDIA GeForce RTX 5070 Laptop
108.8 (88.3min, 83.2P1) fps
Lenovo Legion Pro 5 16IAX10, RTX 5070
Intel Core Ultra 7 255HX, NVIDIA GeForce RTX 5070 Laptop
107 (88.7min) fps -2%
HP Omen 16-ap0091ng
AMD Ryzen 9 8940HX, NVIDIA GeForce RTX 5060 Laptop
86.6 (59min) fps -20%
Baldur's Gate 3 - 1920x1080 Ultra Preset AA:T
Alienware 16X Aurora Core Ultra 9 290HX Plus
Intel Core Ultra 9 290HX Plus, NVIDIA GeForce RTX 5070 Ti Laptop
159.3 (127.7min, 136P0.1, 144.7P1) fps +18%
HP HyperX Omen 16 16-ap1931nr
AMD Ryzen 9 9955HX3D, NVIDIA GeForce RTX 5070 Laptop
134.5 (79.5min, 79.7P0.1, 80P1) fps
MSI Crosshair A16 HX E8WGK
AMD Ryzen 9 8940HX, NVIDIA GeForce RTX 5070 Laptop
133.2 (79.7min, 79.7P0.1, 79.9P1) fps -1%
Lenovo Legion Pro 5 16IAX10, RTX 5070
Intel Core Ultra 7 255HX, NVIDIA GeForce RTX 5070 Laptop
130.6 fps -3%
Asus TUF Gaming A16 FA608UP
AMD Ryzen 7 260, NVIDIA GeForce RTX 5070 Laptop
127.5 fps -5%
HP Omen 16-ap0091ng
AMD Ryzen 9 8940HX, NVIDIA GeForce RTX 5060 Laptop
109.1 fps -19%
GTA V - 1920x1080 Highest AA:4xMSAA + FX AF:16x
HP HyperX Omen 16 16-ap1931nr
AMD Ryzen 9 9955HX3D, NVIDIA GeForce RTX 5070 Laptop
171.5 (1.578min, 111.1P1) fps
Alienware 16X Aurora Core Ultra 9 290HX Plus
Intel Core Ultra 9 290HX Plus, NVIDIA GeForce RTX 5070 Ti Laptop
159.2 (5.59min, 111.1P1) fps -7%
Lenovo Legion Pro 5 16IAX10, RTX 5070
Intel Core Ultra 7 255HX, NVIDIA GeForce RTX 5070 Laptop
153.2 (2.31min, 111.1P1) fps -11%
MSI Crosshair A16 HX E8WGK
AMD Ryzen 9 8940HX, NVIDIA GeForce RTX 5070 Laptop
152.6 (3.83min, 100P1) fps -11%
HP Omen 16-ap0091ng
AMD Ryzen 9 8940HX, NVIDIA GeForce RTX 5060 Laptop
127.5 (2.93min, 83.3P1) fps -26%
Asus TUF Gaming A16 FA608UP
AMD Ryzen 7 260, NVIDIA GeForce RTX 5070 Laptop
124.8 (4.67min, 90.9P1) fps -27%
Final Fantasy XV Benchmark - 1920x1080 High Quality
Alienware 16X Aurora Core Ultra 9 290HX Plus
Intel Core Ultra 9 290HX Plus, NVIDIA GeForce RTX 5070 Ti Laptop
161.1 fps +19%
Lenovo Legion Pro 5 16IAX10, RTX 5070
Intel Core Ultra 7 255HX, NVIDIA GeForce RTX 5070 Laptop
144.5 fps +7%
Asus TUF Gaming A16 FA608UP
AMD Ryzen 7 260, NVIDIA GeForce RTX 5070 Laptop
142.3 fps +5%
MSI Crosshair A16 HX E8WGK
AMD Ryzen 9 8940HX, NVIDIA GeForce RTX 5070 Laptop
140 fps +4%
HP HyperX Omen 16 16-ap1931nr
AMD Ryzen 9 9955HX3D, NVIDIA GeForce RTX 5070 Laptop
135.2 fps
HP Omen 16-ap0091ng
AMD Ryzen 9 8940HX, NVIDIA GeForce RTX 5060 Laptop
111 fps -18%
Strange Brigade - 1920x1080 ultra AA:ultra AF:16
Alienware 16X Aurora Core Ultra 9 290HX Plus
Intel Core Ultra 9 290HX Plus, NVIDIA GeForce RTX 5070 Ti Laptop
314 (155.9min, 229P1) fps +21%
HP HyperX Omen 16 16-ap1931nr
AMD Ryzen 9 9955HX3D, NVIDIA GeForce RTX 5070 Laptop
260 (56.4min, 196P1) fps
MSI Crosshair A16 HX E8WGK
AMD Ryzen 9 8940HX, NVIDIA GeForce RTX 5070 Laptop
258 (159.7min, 195.8P1) fps -1%
Lenovo Legion Pro 5 16IAX10, RTX 5070
Intel Core Ultra 7 255HX, NVIDIA GeForce RTX 5070 Laptop
246 (9min, 185.2P1) fps -5%
Asus TUF Gaming A16 FA608UP
AMD Ryzen 7 260, NVIDIA GeForce RTX 5070 Laptop
219 (128min, 164.3P1) fps -16%
HP Omen 16-ap0091ng
AMD Ryzen 9 8940HX, NVIDIA GeForce RTX 5060 Laptop
217.8 (86.3min, 152.5P1) fps -16%
Dota 2 Reborn - 1920x1080 ultra (3/3) best looking
HP HyperX Omen 16 16-ap1931nr
AMD Ryzen 9 9955HX3D, NVIDIA GeForce RTX 5070 Laptop
200 (161.1min) fps
Alienware 16X Aurora Core Ultra 9 290HX Plus
Intel Core Ultra 9 290HX Plus, NVIDIA GeForce RTX 5070 Ti Laptop
184.7 (155.7min) fps -8%
MSI Crosshair A16 HX E8WGK
AMD Ryzen 9 8940HX, NVIDIA GeForce RTX 5070 Laptop
183.3 (152.5min) fps -8%
Lenovo Legion Pro 5 16IAX10, RTX 5070
Intel Core Ultra 7 255HX, NVIDIA GeForce RTX 5070 Laptop
162.4 (136.4min) fps -19%
HP Omen 16-ap0091ng
AMD Ryzen 9 8940HX, NVIDIA GeForce RTX 5060 Laptop
161.6 (132.4min) fps -19%
Asus TUF Gaming A16 FA608UP
AMD Ryzen 7 260, NVIDIA GeForce RTX 5070 Laptop
123.2 (104.7min) fps -38%
X-Plane 11.11 - 1920x1080 high (fps_test=3)
HP HyperX Omen 16 16-ap1931nr
AMD Ryzen 9 9955HX3D, NVIDIA GeForce RTX 5070 Laptop
111.9 fps
Alienware 16X Aurora Core Ultra 9 290HX Plus
Intel Core Ultra 9 290HX Plus, NVIDIA GeForce RTX 5070 Ti Laptop
110.4 fps -1%
MSI Crosshair A16 HX E8WGK
AMD Ryzen 9 8940HX, NVIDIA GeForce RTX 5070 Laptop
104.8 fps -6%
Lenovo Legion Pro 5 16IAX10, RTX 5070
Intel Core Ultra 7 255HX, NVIDIA GeForce RTX 5070 Laptop
101.6 fps -9%
HP Omen 16-ap0091ng
AMD Ryzen 9 8940HX, NVIDIA GeForce RTX 5060 Laptop
93.9 fps -16%
Asus TUF Gaming A16 FA608UP
AMD Ryzen 7 260, NVIDIA GeForce RTX 5070 Laptop
80.7 fps -28%
GTA V - 2560x1440 Highest AA:4xMSAA + FX AF:16x
Schenker XMG APEX 16 MAX
AMD Ryzen 9 9955HX, NVIDIA GeForce RTX 5070 Ti Laptop
157.3 (3.68min, 111.1P1) fps +18%
Lenovo Legion 9 16IRX9, RTX 4090
Intel Core i9-14900HX, NVIDIA GeForce RTX 4090 Laptop GPU
138.9 (0.96min, 100P1) fps +4%
Alienware 16X Aurora Core Ultra 9 290HX Plus
Intel Core Ultra 9 290HX Plus, NVIDIA GeForce RTX 5070 Ti Laptop
134.4 (26.2min, 90.9P1) fps +1%
HP HyperX Omen 16 16-ap1931nr
AMD Ryzen 9 9955HX3D, NVIDIA GeForce RTX 5070 Laptop
133.2 (6.74min, 83.3P1) fps
MSI Crosshair A16 HX E8WGK
AMD Ryzen 9 8940HX, NVIDIA GeForce RTX 5070 Laptop
129.7 (6.57min, 83.3P1) fps -3%
Lenovo Legion Pro 5 16IAX10, RTX 5070
Intel Core Ultra 7 255HX, NVIDIA GeForce RTX 5070 Laptop
126 (4.91min, 90.9P1) fps -5%
Average NVIDIA GeForce RTX 5070 Laptop
  (96 - 133.2, n=25)
116.4 fps -13%
Final Fantasy XV Benchmark
1920x1080 High Quality
NVIDIA KFA2 GeForce RTX 5070 1-Click OC
AMD Ryzen 7 9800X3D, NVIDIA GeForce RTX 5070
206 fps +52%
Lenovo Legion 9 16IRX9, RTX 4090
Intel Core i9-14900HX, NVIDIA GeForce RTX 4090 Laptop GPU
165.1 fps +22%
Alienware 16X Aurora Core Ultra 9 290HX Plus
Intel Core Ultra 9 290HX Plus, NVIDIA GeForce RTX 5070 Ti Laptop
161.1 fps +19%
Schenker XMG APEX 16 MAX
AMD Ryzen 9 9955HX, NVIDIA GeForce RTX 5070 Ti Laptop
158.2 fps +17%
Lenovo Legion Pro 5 16IAX10, RTX 5070
Intel Core Ultra 7 255HX, NVIDIA GeForce RTX 5070 Laptop
144.5 fps +7%
MSI Crosshair A16 HX E8WGK
AMD Ryzen 9 8940HX, NVIDIA GeForce RTX 5070 Laptop
140 fps +4%
HP HyperX Omen 16 16-ap1931nr
AMD Ryzen 9 9955HX3D, NVIDIA GeForce RTX 5070 Laptop
135.2 fps
Average NVIDIA GeForce RTX 5070 Laptop
  (96 - 150.7, n=27)
133.7 fps -1%
HP Omen 16-ap0091ng
AMD Ryzen 9 8940HX, NVIDIA GeForce RTX 5060 Laptop
111 fps -18%
Alienware m16 R1 Intel
Intel Core i7-13700HX, NVIDIA GeForce RTX 4060 Laptop GPU
104.7 fps -23%
2560x1440 High Quality
NVIDIA KFA2 GeForce RTX 5070 1-Click OC
AMD Ryzen 7 9800X3D, NVIDIA GeForce RTX 5070
162.4 fps +62%
Lenovo Legion 9 16IRX9, RTX 4090
Intel Core i9-14900HX, NVIDIA GeForce RTX 4090 Laptop GPU
142 fps +42%
Schenker XMG APEX 16 MAX
AMD Ryzen 9 9955HX, NVIDIA GeForce RTX 5070 Ti Laptop
121.8 fps +22%
Alienware 16X Aurora Core Ultra 9 290HX Plus
Intel Core Ultra 9 290HX Plus, NVIDIA GeForce RTX 5070 Ti Laptop
120.3 fps +20%
Lenovo Legion Pro 5 16IAX10, RTX 5070
Intel Core Ultra 7 255HX, NVIDIA GeForce RTX 5070 Laptop
106.8 fps +7%
MSI Crosshair A16 HX E8WGK
AMD Ryzen 9 8940HX, NVIDIA GeForce RTX 5070 Laptop
102 fps +2%
HP HyperX Omen 16 16-ap1931nr
AMD Ryzen 9 9955HX3D, NVIDIA GeForce RTX 5070 Laptop
100.2 fps
Average NVIDIA GeForce RTX 5070 Laptop
  (82.5 - 110, n=26)
99.2 fps -1%
Alienware m16 R1 Intel
Intel Core i7-13700HX, NVIDIA GeForce RTX 4060 Laptop GPU
77.1 fps -23%
X-Plane 11.11 - 1920x1080 high (fps_test=3)
NVIDIA KFA2 GeForce RTX 5070 1-Click OC
AMD Ryzen 7 9800X3D, NVIDIA GeForce RTX 5070
183.9 fps +64%
Aorus Master 16 AM6J
AMD Ryzen 9 9955HX3D, NVIDIA GeForce RTX 5080 Laptop
148.5 fps +33%
Lenovo Legion 9 16IRX9, RTX 4090
Intel Core i9-14900HX, NVIDIA GeForce RTX 4090 Laptop GPU
125.6 fps +12%
Alienware m16 R1 Intel
Intel Core i7-13700HX, NVIDIA GeForce RTX 4060 Laptop GPU
120.4 fps +8%
HP HyperX Omen 16 16-ap1931nr
AMD Ryzen 9 9955HX3D, NVIDIA GeForce RTX 5070 Laptop
111.9 fps
Alienware 16X Aurora Core Ultra 9 290HX Plus
Intel Core Ultra 9 290HX Plus, NVIDIA GeForce RTX 5070 Ti Laptop
110.4 fps -1%
Acer Predator Helios Neo 16S AI PHN16S-71-94L9
Intel Core Ultra 9 275HX, NVIDIA GeForce RTX 5070 Ti Laptop
109.4 fps -2%
Schenker XMG APEX 16 MAX
AMD Ryzen 9 9955HX, NVIDIA GeForce RTX 5070 Ti Laptop
105.6 fps -6%
MSI Crosshair A16 HX E8WGK
AMD Ryzen 9 8940HX, NVIDIA GeForce RTX 5070 Laptop
104.8 fps -6%
Lenovo Legion Pro 5 16IAX10, RTX 5070
Intel Core Ultra 7 255HX, NVIDIA GeForce RTX 5070 Laptop
101.6 fps -9%
Average NVIDIA GeForce RTX 5070 Laptop
  (73.5 - 116.3, n=29)
94.7 fps -15%
HP Omen 16-ap0091ng
AMD Ryzen 9 8940HX, NVIDIA GeForce RTX 5060 Laptop
93.9 fps -16%
Strange Brigade
1920x1080 ultra AA:ultra AF:16
NVIDIA KFA2 GeForce RTX 5070 1-Click OC
AMD Ryzen 7 9800X3D, NVIDIA GeForce RTX 5070
437 (139min, 310P1) fps +68%
Lenovo Legion 9 16IRX9, RTX 4090
Intel Core i9-14900HX, NVIDIA GeForce RTX 4090 Laptop GPU
369 (5min, 269P1) fps +42%
Schenker XMG APEX 16 MAX
AMD Ryzen 9 9955HX, NVIDIA GeForce RTX 5070 Ti Laptop
340 (59.4min, 243P1) fps +31%
Alienware 16X Aurora Core Ultra 9 290HX Plus
Intel Core Ultra 9 290HX Plus, NVIDIA GeForce RTX 5070 Ti Laptop
314 (155.9min, 229P1) fps +21%
HP HyperX Omen 16 16-ap1931nr
AMD Ryzen 9 9955HX3D, NVIDIA GeForce RTX 5070 Laptop
260 (56.4min, 196P1) fps
MSI Crosshair A16 HX E8WGK
AMD Ryzen 9 8940HX, NVIDIA GeForce RTX 5070 Laptop
258 (159.7min, 195.8P1) fps -1%
Lenovo Legion Pro 5 16IAX10, RTX 5070
Intel Core Ultra 7 255HX, NVIDIA GeForce RTX 5070 Laptop
246 (9min, 185.2P1) fps -5%
Average NVIDIA GeForce RTX 5070 Laptop
  (203 - 261, n=25)
240 fps -8%
HP Omen 16-ap0091ng
AMD Ryzen 9 8940HX, NVIDIA GeForce RTX 5060 Laptop
217.8 (86.3min, 152.5P1) fps -16%
Alienware m16 R1 Intel
Intel Core i7-13700HX, NVIDIA GeForce RTX 4060 Laptop GPU
190.3 (52.8min, 139.4P1) fps -27%
2560x1440 ultra AA:ultra AF:16
NVIDIA KFA2 GeForce RTX 5070 1-Click OC
AMD Ryzen 7 9800X3D, NVIDIA GeForce RTX 5070
318 (147.4min, 246P1) fps +86%
Lenovo Legion 9 16IRX9, RTX 4090
Intel Core i9-14900HX, NVIDIA GeForce RTX 4090 Laptop GPU
290 (38.6min, 219P1) fps +70%
Schenker XMG APEX 16 MAX
AMD Ryzen 9 9955HX, NVIDIA GeForce RTX 5070 Ti Laptop
236 (150.4min, 187.7P1) fps +38%
Alienware 16X Aurora Core Ultra 9 290HX Plus
Intel Core Ultra 9 290HX Plus, NVIDIA GeForce RTX 5070 Ti Laptop
210 (99.1min, 166.2P1) fps +23%
Lenovo Legion Pro 5 16IAX10, RTX 5070
Intel Core Ultra 7 255HX, NVIDIA GeForce RTX 5070 Laptop
177.4 (31.7min, 147.8P1) fps +4%
HP HyperX Omen 16 16-ap1931nr
AMD Ryzen 9 9955HX3D, NVIDIA GeForce RTX 5070 Laptop
170.6 (115.5min, 139.3P1) fps
MSI Crosshair A16 HX E8WGK
AMD Ryzen 9 8940HX, NVIDIA GeForce RTX 5070 Laptop
170.4 (127.2min, 139P1) fps 0%
Average NVIDIA GeForce RTX 5070 Laptop
  (137 - 230, n=23)
166.6 fps -2%
HP Omen 16-ap0091ng
AMD Ryzen 9 8940HX, NVIDIA GeForce RTX 5060 Laptop
155.7 fps -9%
Alienware m16 R1 Intel
Intel Core i7-13700HX, NVIDIA GeForce RTX 4060 Laptop GPU
128.5 (88.2min, 103.1P1) fps -25%
Baldur's Gate 3
1920x1080 Ultra Preset AA:T
NVIDIA KFA2 GeForce RTX 5070 1-Click OC
AMD Ryzen 7 9800X3D, NVIDIA GeForce RTX 5070
190.6 (164.5min, 170.2P0.1, 175.4P1) fps +42%
Aorus Master 16 AM6J
AMD Ryzen 9 9955HX3D, NVIDIA GeForce RTX 5080 Laptop
175 (65min) fps +30%
Alienware 16X Aurora Core Ultra 9 290HX Plus
Intel Core Ultra 9 290HX Plus, NVIDIA GeForce RTX 5070 Ti Laptop
159.3 (127.7min, 136P0.1, 144.7P1) fps +18%
Schenker XMG APEX 16 MAX
AMD Ryzen 9 9955HX, NVIDIA GeForce RTX 5070 Ti Laptop
155.6 (107.2min, 130P0.1, 140P1) fps +16%
HP HyperX Omen 16 16-ap1931nr
AMD Ryzen 9 9955HX3D, NVIDIA GeForce RTX 5070 Laptop
134.5 (79.5min, 79.7P0.1, 80P1) fps
MSI Crosshair A16 HX E8WGK
AMD Ryzen 9 8940HX, NVIDIA GeForce RTX 5070 Laptop
133.2 (79.7min, 79.7P0.1, 79.9P1) fps -1%
Lenovo Legion Pro 5 16IAX10, RTX 5070
Intel Core Ultra 7 255HX, NVIDIA GeForce RTX 5070 Laptop
130.6 fps -3%
Acer Predator Helios Neo 16S AI PHN16S-71-94L9
Intel Core Ultra 9 275HX, NVIDIA GeForce RTX 5070 Ti Laptop
122.8 (52.2min, 71.3P0.1, 104.9P1) fps -9%
Average NVIDIA GeForce RTX 5070 Laptop
  (87.3 - 141.4, n=34)
121.6 fps -10%
HP Omen 16-ap0091ng
AMD Ryzen 9 8940HX, NVIDIA GeForce RTX 5060 Laptop
109.1 fps -19%
2560x1440 Ultra Preset AA:T
NVIDIA KFA2 GeForce RTX 5070 1-Click OC
AMD Ryzen 7 9800X3D, NVIDIA GeForce RTX 5070
138.3 (120.1min, 122.3P0.1, 125.1P1) fps +48%
Aorus Master 16 AM6J
AMD Ryzen 9 9955HX3D, NVIDIA GeForce RTX 5080 Laptop
123 (79min) fps +32%
Schenker XMG APEX 16 MAX
AMD Ryzen 9 9955HX, NVIDIA GeForce RTX 5070 Ti Laptop
110.5 (92.1min, 95.8P0.1, 99P1) fps +18%
Alienware 16X Aurora Core Ultra 9 290HX Plus
Intel Core Ultra 9 290HX Plus, NVIDIA GeForce RTX 5070 Ti Laptop
109.5 (15.7min, 54.3P0.1, 93.4P1) fps +17%
HP HyperX Omen 16 16-ap1931nr
AMD Ryzen 9 9955HX3D, NVIDIA GeForce RTX 5070 Laptop
93.4 (60min, 72.2P0.1, 79.6P1) fps
MSI Crosshair A16 HX E8WGK
AMD Ryzen 9 8940HX, NVIDIA GeForce RTX 5070 Laptop
90.3 (60min, 60P0.1, 79.6P1) fps -3%
Lenovo Legion Pro 5 16IAX10, RTX 5070
Intel Core Ultra 7 255HX, NVIDIA GeForce RTX 5070 Laptop
90 fps -4%
Average NVIDIA GeForce RTX 5070 Laptop
  (61 - 96.4, n=31)
83.9 fps -10%
HP Omen 16-ap0091ng
AMD Ryzen 9 8940HX, NVIDIA GeForce RTX 5060 Laptop
75.5 fps -19%
2560x1440 Ultra Preset + Quality DLSS
Alienware 16X Aurora Core Ultra 9 290HX Plus
Intel Core Ultra 9 290HX Plus, NVIDIA GeForce RTX 5070 Ti Laptop
157.7 (17.7min, 106.2P0.1, 144.9P1) fps +16%
HP HyperX Omen 16 16-ap1931nr
AMD Ryzen 9 9955HX3D, NVIDIA GeForce RTX 5070 Laptop
136.3 (79.7min, 79.8P0.1, 80P1) fps
Lenovo Legion Pro 5 16IAX10, RTX 5070
Intel Core Ultra 7 255HX, NVIDIA GeForce RTX 5070 Laptop
135.8 fps 0%
MSI Crosshair A16 HX E8WGK
AMD Ryzen 9 8940HX, NVIDIA GeForce RTX 5070 Laptop
129.6 (79.7min, 79.7P0.1, 79.9P1) fps -5%
Average NVIDIA GeForce RTX 5070 Laptop
  (97.7 - 140, n=10)
127.5 fps -6%
HP Omen 16-ap0091ng
AMD Ryzen 9 8940HX, NVIDIA GeForce RTX 5060 Laptop
114.3 fps -16%
Cyberpunk 2077
1920x1080 High Preset (FSR off)
NVIDIA KFA2 GeForce RTX 5070 1-Click OC
AMD Ryzen 7 9800X3D, NVIDIA GeForce RTX 5070
187.6 (156.6min) fps +52%
Aorus Master 16 AM6J
AMD Ryzen 9 9955HX3D, NVIDIA GeForce RTX 5080 Laptop
169.3 (139min) fps +37%
Schenker XMG APEX 16 MAX
AMD Ryzen 9 9955HX, NVIDIA GeForce RTX 5070 Ti Laptop
140.6 (116.9min) fps +14%
Alienware 16X Aurora Core Ultra 9 290HX Plus
Intel Core Ultra 9 290HX Plus, NVIDIA GeForce RTX 5070 Ti Laptop
126.1 (103min, 95.3P1) fps +2%
MSI Crosshair A16 HX E8WGK
AMD Ryzen 9 8940HX, NVIDIA GeForce RTX 5070 Laptop
124.8 (103.1min, 96.5P1) fps +1%
HP HyperX Omen 16 16-ap1931nr
AMD Ryzen 9 9955HX3D, NVIDIA GeForce RTX 5070 Laptop
123.7 (103.3min, 97.1P1) fps
Lenovo Legion Pro 5 16IAX10, RTX 5070
Intel Core Ultra 7 255HX, NVIDIA GeForce RTX 5070 Laptop
122 (103.1min) fps -1%
Acer Predator Helios Neo 16S AI PHN16S-71-94L9
Intel Core Ultra 9 275HX, NVIDIA GeForce RTX 5070 Ti Laptop
112 (94min) fps -9%
Average NVIDIA GeForce RTX 5070 Laptop
  (84.5 - 124.8, n=27)
111.1 fps -10%
HP Omen 16-ap0091ng
AMD Ryzen 9 8940HX, NVIDIA GeForce RTX 5060 Laptop
95.3 fps -23%
1920x1080 Ultra Preset (FSR off)
NVIDIA KFA2 GeForce RTX 5070 1-Click OC
AMD Ryzen 7 9800X3D, NVIDIA GeForce RTX 5070
170.3 (140.8min) fps +57%
Aorus Master 16 AM6J
AMD Ryzen 9 9955HX3D, NVIDIA GeForce RTX 5080 Laptop
144.5 (116min) fps +33%
Schenker XMG APEX 16 MAX
AMD Ryzen 9 9955HX, NVIDIA GeForce RTX 5070 Ti Laptop
128 (103min) fps +18%
Lenovo Legion 9 16IRX9, RTX 4090
Intel Core i9-14900HX, NVIDIA GeForce RTX 4090 Laptop GPU
127 (70.6min) fps +17%
Alienware 16X Aurora Core Ultra 9 290HX Plus
Intel Core Ultra 9 290HX Plus, NVIDIA GeForce RTX 5070 Ti Laptop
114.9 (92.5min, 83.6P1) fps +6%
MSI Crosshair A16 HX E8WGK
AMD Ryzen 9 8940HX, NVIDIA GeForce RTX 5070 Laptop
112.1 (90.9min, 85.1P1) fps +3%
HP HyperX Omen 16 16-ap1931nr
AMD Ryzen 9 9955HX3D, NVIDIA GeForce RTX 5070 Laptop
108.8 (88.3min, 83.2P1) fps
Lenovo Legion Pro 5 16IAX10, RTX 5070
Intel Core Ultra 7 255HX, NVIDIA GeForce RTX 5070 Laptop
107 (88.7min) fps -2%
Acer Predator Helios Neo 16S AI PHN16S-71-94L9
Intel Core Ultra 9 275HX, NVIDIA GeForce RTX 5070 Ti Laptop
100.8 (80min) fps -7%
Average NVIDIA GeForce RTX 5070 Laptop
  (81.5 - 112.1, n=34)
99.4 fps -9%
HP Omen 16-ap0091ng
AMD Ryzen 9 8940HX, NVIDIA GeForce RTX 5060 Laptop
86.6 (59min) fps -20%
1920x1080 Ray Tracing Ultra Preset (DLSS off)
NVIDIA KFA2 GeForce RTX 5070 1-Click OC
AMD Ryzen 7 9800X3D, NVIDIA GeForce RTX 5070
75 (65.9min) fps +56%
Alienware 16X Aurora Core Ultra 9 290HX Plus
Intel Core Ultra 9 290HX Plus, NVIDIA GeForce RTX 5070 Ti Laptop
52.5 (45min, 42.4P1) fps +9%
MSI Crosshair A16 HX E8WGK
AMD Ryzen 9 8940HX, NVIDIA GeForce RTX 5070 Laptop
48.5 (42.4min, 40.5P1) fps +1%
HP HyperX Omen 16 16-ap1931nr
AMD Ryzen 9 9955HX3D, NVIDIA GeForce RTX 5070 Laptop
48 (41.9min, 40P1) fps
Average NVIDIA GeForce RTX 5070 Laptop
  (35.3 - 48.5, n=7)
44.6 fps -7%
2560x1440 Ultra Preset (FSR off)
NVIDIA KFA2 GeForce RTX 5070 1-Click OC
AMD Ryzen 7 9800X3D, NVIDIA GeForce RTX 5070
111.8 (94.3min) fps +63%
Aorus Master 16 AM6J
AMD Ryzen 9 9955HX3D, NVIDIA GeForce RTX 5080 Laptop
99.8 (84min) fps +46%
Lenovo Legion 9 16IRX9, RTX 4090
Intel Core i9-14900HX, NVIDIA GeForce RTX 4090 Laptop GPU
86 (70.4min) fps +26%
Schenker XMG APEX 16 MAX
AMD Ryzen 9 9955HX, NVIDIA GeForce RTX 5070 Ti Laptop
82.9 (69.5min) fps +21%
Alienware 16X Aurora Core Ultra 9 290HX Plus
Intel Core Ultra 9 290HX Plus, NVIDIA GeForce RTX 5070 Ti Laptop
75.1 (61.7min, 58.1P1) fps +10%
MSI Crosshair A16 HX E8WGK
AMD Ryzen 9 8940HX, NVIDIA GeForce RTX 5070 Laptop
68.8 (58.4min, 56.1P1) fps +1%
HP HyperX Omen 16 16-ap1931nr
AMD Ryzen 9 9955HX3D, NVIDIA GeForce RTX 5070 Laptop
68.4 (58min, 55.5P1) fps
Lenovo Legion Pro 5 16IAX10, RTX 5070
Intel Core Ultra 7 255HX, NVIDIA GeForce RTX 5070 Laptop
68.3 (58.1min) fps 0%
Average NVIDIA GeForce RTX 5070 Laptop
  (51.9 - 68.8, n=31)
63.3 fps -7%
HP Omen 16-ap0091ng
AMD Ryzen 9 8940HX, NVIDIA GeForce RTX 5060 Laptop
56.1 fps -18%
2560x1440 Ultra Preset DLSS4 quality no FG
NVIDIA KFA2 GeForce RTX 5070 1-Click OC
AMD Ryzen 7 9800X3D, NVIDIA GeForce RTX 5070
128.7 (111.7min) fps +61%
Schenker XMG APEX 16 MAX
AMD Ryzen 9 9955HX, NVIDIA GeForce RTX 5070 Ti Laptop
96.1 (82.8min) fps +20%
Alienware 16X Aurora Core Ultra 9 290HX Plus
Intel Core Ultra 9 290HX Plus, NVIDIA GeForce RTX 5070 Ti Laptop
86.9 (74.9min, 70.5P1) fps +9%
MSI Crosshair A16 HX E8WGK
AMD Ryzen 9 8940HX, NVIDIA GeForce RTX 5070 Laptop
81.9 (71.5min, 67.2P1) fps +3%
Lenovo Legion Pro 5 16IAX10, RTX 5070
Intel Core Ultra 7 255HX, NVIDIA GeForce RTX 5070 Laptop
80.7 (70.5min) fps +1%
HP HyperX Omen 16 16-ap1931nr
AMD Ryzen 9 9955HX3D, NVIDIA GeForce RTX 5070 Laptop
79.9 (69.7min, 66.3P1) fps
Average NVIDIA GeForce RTX 5070 Laptop
  (61.4 - 81.9, n=18)
74.3 fps -7%
HP Omen 16-ap0091ng
AMD Ryzen 9 8940HX, NVIDIA GeForce RTX 5060 Laptop
65.2 fps -18%
F1 24
1920x1080 Ultra High Preset AA:T AF:16x
NVIDIA KFA2 GeForce RTX 5070 1-Click OC
AMD Ryzen 7 9800X3D, NVIDIA GeForce RTX 5070
138.2 (96min, 107P1) fps +56%
Lenovo Legion 9 16IRX9, RTX 4090
Intel Core i9-14900HX, NVIDIA GeForce RTX 4090 Laptop GPU
113.6 (14min, 69P1) fps +28%
Schenker XMG APEX 16 MAX
AMD Ryzen 9 9955HX, NVIDIA GeForce RTX 5070 Ti Laptop
110.6 (70min, 84P1) fps +25%
Alienware 16X Aurora Core Ultra 9 290HX Plus
Intel Core Ultra 9 290HX Plus, NVIDIA GeForce RTX 5070 Ti Laptop
97.7 (64min, 74P1) fps +10%
MSI Crosshair A16 HX E8WGK
AMD Ryzen 9 8940HX, NVIDIA GeForce RTX 5070 Laptop
94.7 (68min, 75P1) fps +7%
HP HyperX Omen 16 16-ap1931nr
AMD Ryzen 9 9955HX3D, NVIDIA GeForce RTX 5070 Laptop
88.6 (68min, 70P1) fps
Average NVIDIA GeForce RTX 5070 Laptop
  (63.8 - 94.7, n=19)
83.5 fps -6%
2560x1440 Ultra High Preset AA:T AF:16x
NVIDIA KFA2 GeForce RTX 5070 1-Click OC
AMD Ryzen 7 9800X3D, NVIDIA GeForce RTX 5070
88.3 (71min, 72P1) fps +58%
Lenovo Legion 9 16IRX9, RTX 4090
Intel Core i9-14900HX, NVIDIA GeForce RTX 4090 Laptop GPU
72.1 (2min, 56P1) fps +29%
Schenker XMG APEX 16 MAX
AMD Ryzen 9 9955HX, NVIDIA GeForce RTX 5070 Ti Laptop
72 (58min, 58P1) fps +29%
Alienware 16X Aurora Core Ultra 9 290HX Plus
Intel Core Ultra 9 290HX Plus, NVIDIA GeForce RTX 5070 Ti Laptop
62.8 (49min, 50P1) fps +12%
MSI Crosshair A16 HX E8WGK
AMD Ryzen 9 8940HX, NVIDIA GeForce RTX 5070 Laptop
59.3 (47min, 47P1) fps +6%
HP HyperX Omen 16 16-ap1931nr
AMD Ryzen 9 9955HX3D, NVIDIA GeForce RTX 5070 Laptop
56 (45min, 44P1) fps
Average NVIDIA GeForce RTX 5070 Laptop
  (40.3 - 59.3, n=19)
52.3 fps -7%
2560x1440 Ultra High Preset + Quality DLSS AF:16x
NVIDIA KFA2 GeForce RTX 5070 1-Click OC
AMD Ryzen 7 9800X3D, NVIDIA GeForce RTX 5070
138.7 (103min, 109P1) fps +61%
Schenker XMG APEX 16 MAX
AMD Ryzen 9 9955HX, NVIDIA GeForce RTX 5070 Ti Laptop
112.4 (67min, 80P1) fps +31%
Alienware 16X Aurora Core Ultra 9 290HX Plus
Intel Core Ultra 9 290HX Plus, NVIDIA GeForce RTX 5070 Ti Laptop
99 (58min, 72P1) fps +15%
MSI Crosshair A16 HX E8WGK
AMD Ryzen 9 8940HX, NVIDIA GeForce RTX 5070 Laptop
93.1 (65min, 71P1) fps +8%
HP HyperX Omen 16 16-ap1931nr
AMD Ryzen 9 9955HX3D, NVIDIA GeForce RTX 5070 Laptop
86.1 (66min, 65P1) fps
Average NVIDIA GeForce RTX 5070 Laptop
  (62.9 - 93.1, n=16)
80.9 fps -6%

Cyberpunk 2077 ultra FPS Chart

05101520253035404550556065707580859095100105110Tooltip
HP HyperX Omen 16 16-ap1931nr R9 9955HX3D, GeForce RTX 5070 Laptop: Ø110.6 (102.1-113.7) fps
HP Omen 16-ap0091ng R9 8940HX, GeForce RTX 5060 Laptop: Ø78.2 (74.1-78.9) fps
lowmed.highultraQHD DLSSQHD
GTA V (2015) 188.1 187.9 188 171.5 133.2
Dota 2 Reborn (2015) 260 225 214 200
Final Fantasy XV Benchmark (2018) 229 182.2 135.2 100.2
X-Plane 11.11 (2018) 157.6 144 111.9
Strange Brigade (2018) 593 376 301 260 170.6
Valorant (2020) 641.5 397.2
Baldur's Gate 3 (2023) 134.5 136.3 93.4
Cyberpunk 2077 (2023) 177.6 148.7 123.7 108.8 79.9 68.4
F1 24 (2024) 383 327 250 88.6 86.1 56
Black Myth: Wukong (2024) 60 36 38 26

Emissions

System Noise

Fan noise would readily spike quite frequently and loudly if on Performance or Unleashed modes even when simply browsing or video streaming. Thus, we recommend running on Balanced mode or lower when not gaming.

Fan noise averages 43.4 dB(A), 49.7 dB(A), and 54.7 dB(A) when gaming on Balanced, Performance, and Unleashed modes, respectively. 
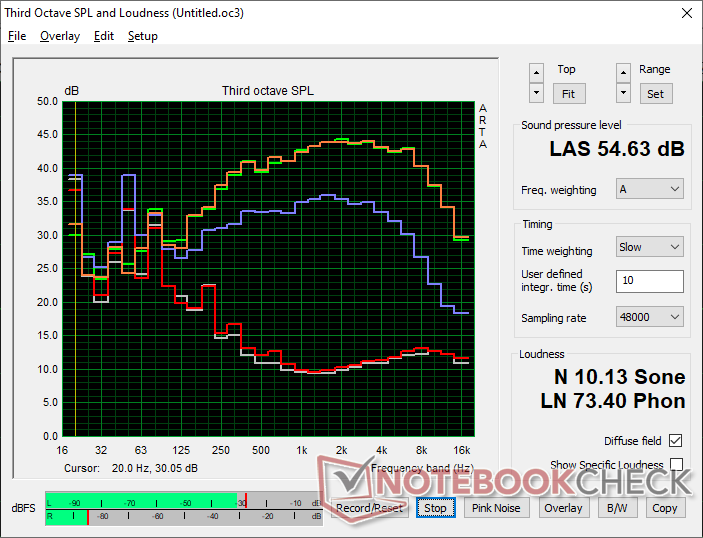
Fan noise profile (White: Background, Red: System idle, Blue: 3DMark 06, Orange: Cyberpunk 2077, Green: Prime95+FurMark stress)

Noise level

Idle
24.2 / 24.2 / 25.3 dB(A)
Load
45.7 / 54.7 dB(A)
  red to green bar
 
 
30 dB
silent
40 dB(A)
audible
50 dB(A)
loud
 
min: dark, med: mid, max: light   Earthworks M23R, Arta (15 cm distance)   environment noise: 23.8 dB(A)
dB(A) 0102030405060708090Deep BassMiddle BassHigh BassLower RangeMidsHigher MidsLower HighsMid HighsUpper HighsSuper Highs2031.63936.838.430.1252426.72423.927.23123.725.3212023.44028.228.927.325.927.95024.43933.933.825.76328.13023.624.227.68033.233.13131.533.910028.527.922.422.429.212528.126.619.92129.21603327.819.118.832.820034.130.722.422.633.925037.53115.314.636.931539.431.716.7153940040.933.613.11241.150039.733.412.110.939.463041.633.612.710.840.88004133.310.79.841100042.434.99.89.542.7125043.235.49.59.443.3160043.935.99.99.443.9200043.935.410.39.844.4250043.834.610.510.343.631504434.911.210.943.9400043.133.411.410.943500042.532.111.811.642.4630042.930.212.712.142.9800040.326.713.212.340.41000037.422.712.812.637.41250034.219.412.212.334.21600029.718.411.710.829.2SPL54.745.724.223.754.6N10.25.40.60.510.1median 40.9median 32.1median 12.2median 11.6median 40.8Delta4.93.62.32.24.9hearing rangehide median Fan NoiseHP HyperX Omen 16 16-ap1931nr
HP HyperX Omen 16 16-ap1931nr
R9 9955HX3D, GeForce RTX 5070 Laptop
HP Omen 16-ap0091ng
R9 8940HX, GeForce RTX 5060 Laptop
MSI Crosshair A16 HX E8WGK
R9 8940HX, GeForce RTX 5070 Laptop
Alienware 16X Aurora Core Ultra 9 290HX Plus
Ultra 9 290HX Plus, GeForce RTX 5070 Ti Laptop
Lenovo Legion Pro 5 16IAX10, RTX 5070
Ultra 7 255HX, GeForce RTX 5070 Laptop
Asus TUF Gaming A16 FA608UP
R7 260, GeForce RTX 5070 Laptop
Noise
1%
-8%
-4%
5%
-12%
off / environment * (dB)
23.8
23
3%
23.4
2%
23.4
2%
23
3%
25.1
-5%
Idle Minimum * (dB)
24.2
23
5%
29.1
-20%
23.8
2%
23
5%
32.2
-33%
Idle Average * (dB)
24.2
23
5%
29.1
-20%
23.8
2%
23
5%
32.2
-33%
Idle Maximum * (dB)
25.3
27.64
-9%
29.1
-15%
31.4
-24%
23
9%
32.2
-27%
Load Average * (dB)
45.7
49.5
-8%
41.7
9%
48.7
-7%
43.85
4%
38.1
17%
Cyberpunk 2077 ultra * (dB)
54.7
49.5
10%
58.7
-7%
51.5
6%
50.27
8%
53.9
1%
Load Maximum * (dB)
54.7
52.73
4%
59
-8%
59.8
-9%
52.9
3%
57.1
-4%

* ... smaller is better

Temperature

Four sets of exhaust vents along the rear and sides
AC adapter reaches over 47 C when running demanding loads
Max. Load
 39 °C
102 F
39.4 °C
103 F
36.8 °C
98 F
 
 39 °C
102 F
38.8 °C
102 F
40.2 °C
104 F
 
 27.8 °C
82 F
29.2 °C
85 F
27.8 °C
82 F
 
Maximum: 40.2 °C = 104 F
Average: 35.3 °C = 96 F
43 °C
109 F
41 °C
106 F
42.4 °C
108 F
37.4 °C
99 F
39.4 °C
103 F
39.4 °C
103 F
27.6 °C
82 F
28.2 °C
83 F
29 °C
84 F
Maximum: 43 °C = 109 F
Average: 36.4 °C = 98 F
Power Supply (max.)  52 °C = 126 F | Room Temperature 23 °C = 73 F | Fluke 62 Mini IR Thermometer
(±) The average temperature for the upper side under maximal load is 35.3 °C / 96 F, compared to the average of 33.9 °C / 93 F for the devices in the class Gaming.
(±) The maximum temperature on the upper side is 40.2 °C / 104 F, compared to the average of 40.4 °C / 105 F, ranging from 21.2 to 68.8 °C for the class Gaming.
(±) The bottom heats up to a maximum of 43 °C / 109 F, compared to the average of 43.2 °C / 110 F
(+) In idle usage, the average temperature for the upper side is 27.1 °C / 81 F, compared to the device average of 33.9 °C / 93 F.
(+) 3: The average temperature for the upper side is 31.8 °C / 89 F, compared to the average of 33.9 °C / 93 F for the class Gaming.
(+) The palmrests and touchpad are cooler than skin temperature with a maximum of 29.2 °C / 84.6 F and are therefore cool to the touch.
(±) The average temperature of the palmrest area of similar devices was 28.8 °C / 83.8 F (-0.4 °C / -0.8 F).
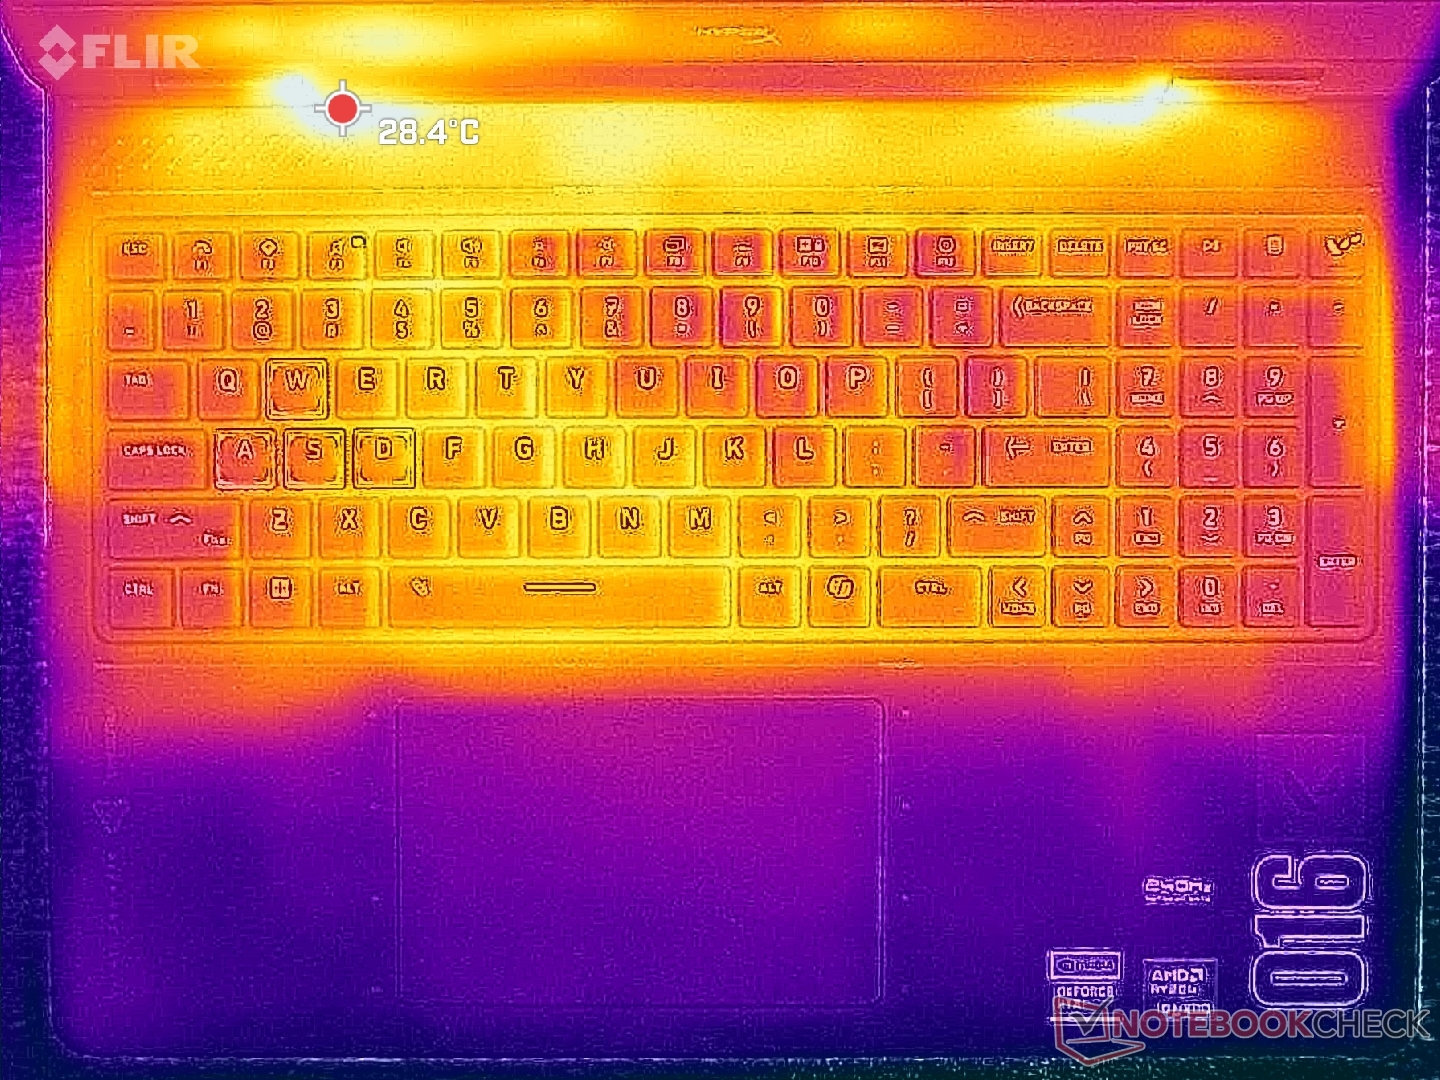
System idle (C cover)
System idle (D cover)
Cyberpunk 2077 stress (C cover)
Cyberpunk 2077 stress (D cover)
Prime95+FurMark stress (C cover)
Prime95+FurMark stress (D cover)
HP HyperX Omen 16 16-ap1931nr
R9 9955HX3D, GeForce RTX 5070 Laptop
HP Omen 16-ap0091ng
R9 8940HX, GeForce RTX 5060 Laptop
MSI Crosshair A16 HX E8WGK
R9 8940HX, GeForce RTX 5070 Laptop
Alienware 16X Aurora Core Ultra 9 290HX Plus
Ultra 9 290HX Plus, GeForce RTX 5070 Ti Laptop
Lenovo Legion Pro 5 16IAX10, RTX 5070
Ultra 7 255HX, GeForce RTX 5070 Laptop
Asus TUF Gaming A16 FA608UP
R7 260, GeForce RTX 5070 Laptop
Heat
7%
-9%
3%
-5%
9%
Maximum Upper Side * (°C)
40.2
36
10%
41.8
-4%
48.2
-20%
42
-4%
39.5
2%
Maximum Bottom * (°C)
43
37
14%
50.6
-18%
41
5%
44
-2%
45.1
-5%
Idle Upper Side * (°C)
30
30
-0%
30.8
-3%
28.2
6%
33
-10%
25.7
14%
Idle Bottom * (°C)
33
32
3%
36
-9%
26.2
21%
34
-3%
25.5
23%

* ... smaller is better

Stress Test

The CPU would boost to 4.1 GHz and 118 W when running Prime95 stress before dropping slightly to 3.8 GHz, 105 W, and 76 C shortly thereafter. TGP would average 93 W, 111 W, and 111 W when running Cyberpunk 2077 on Balanced, Performance, and Unleashed modes, respectively, meaning that the quieter fans of Balanced mode entail slight performance losses when gaming.
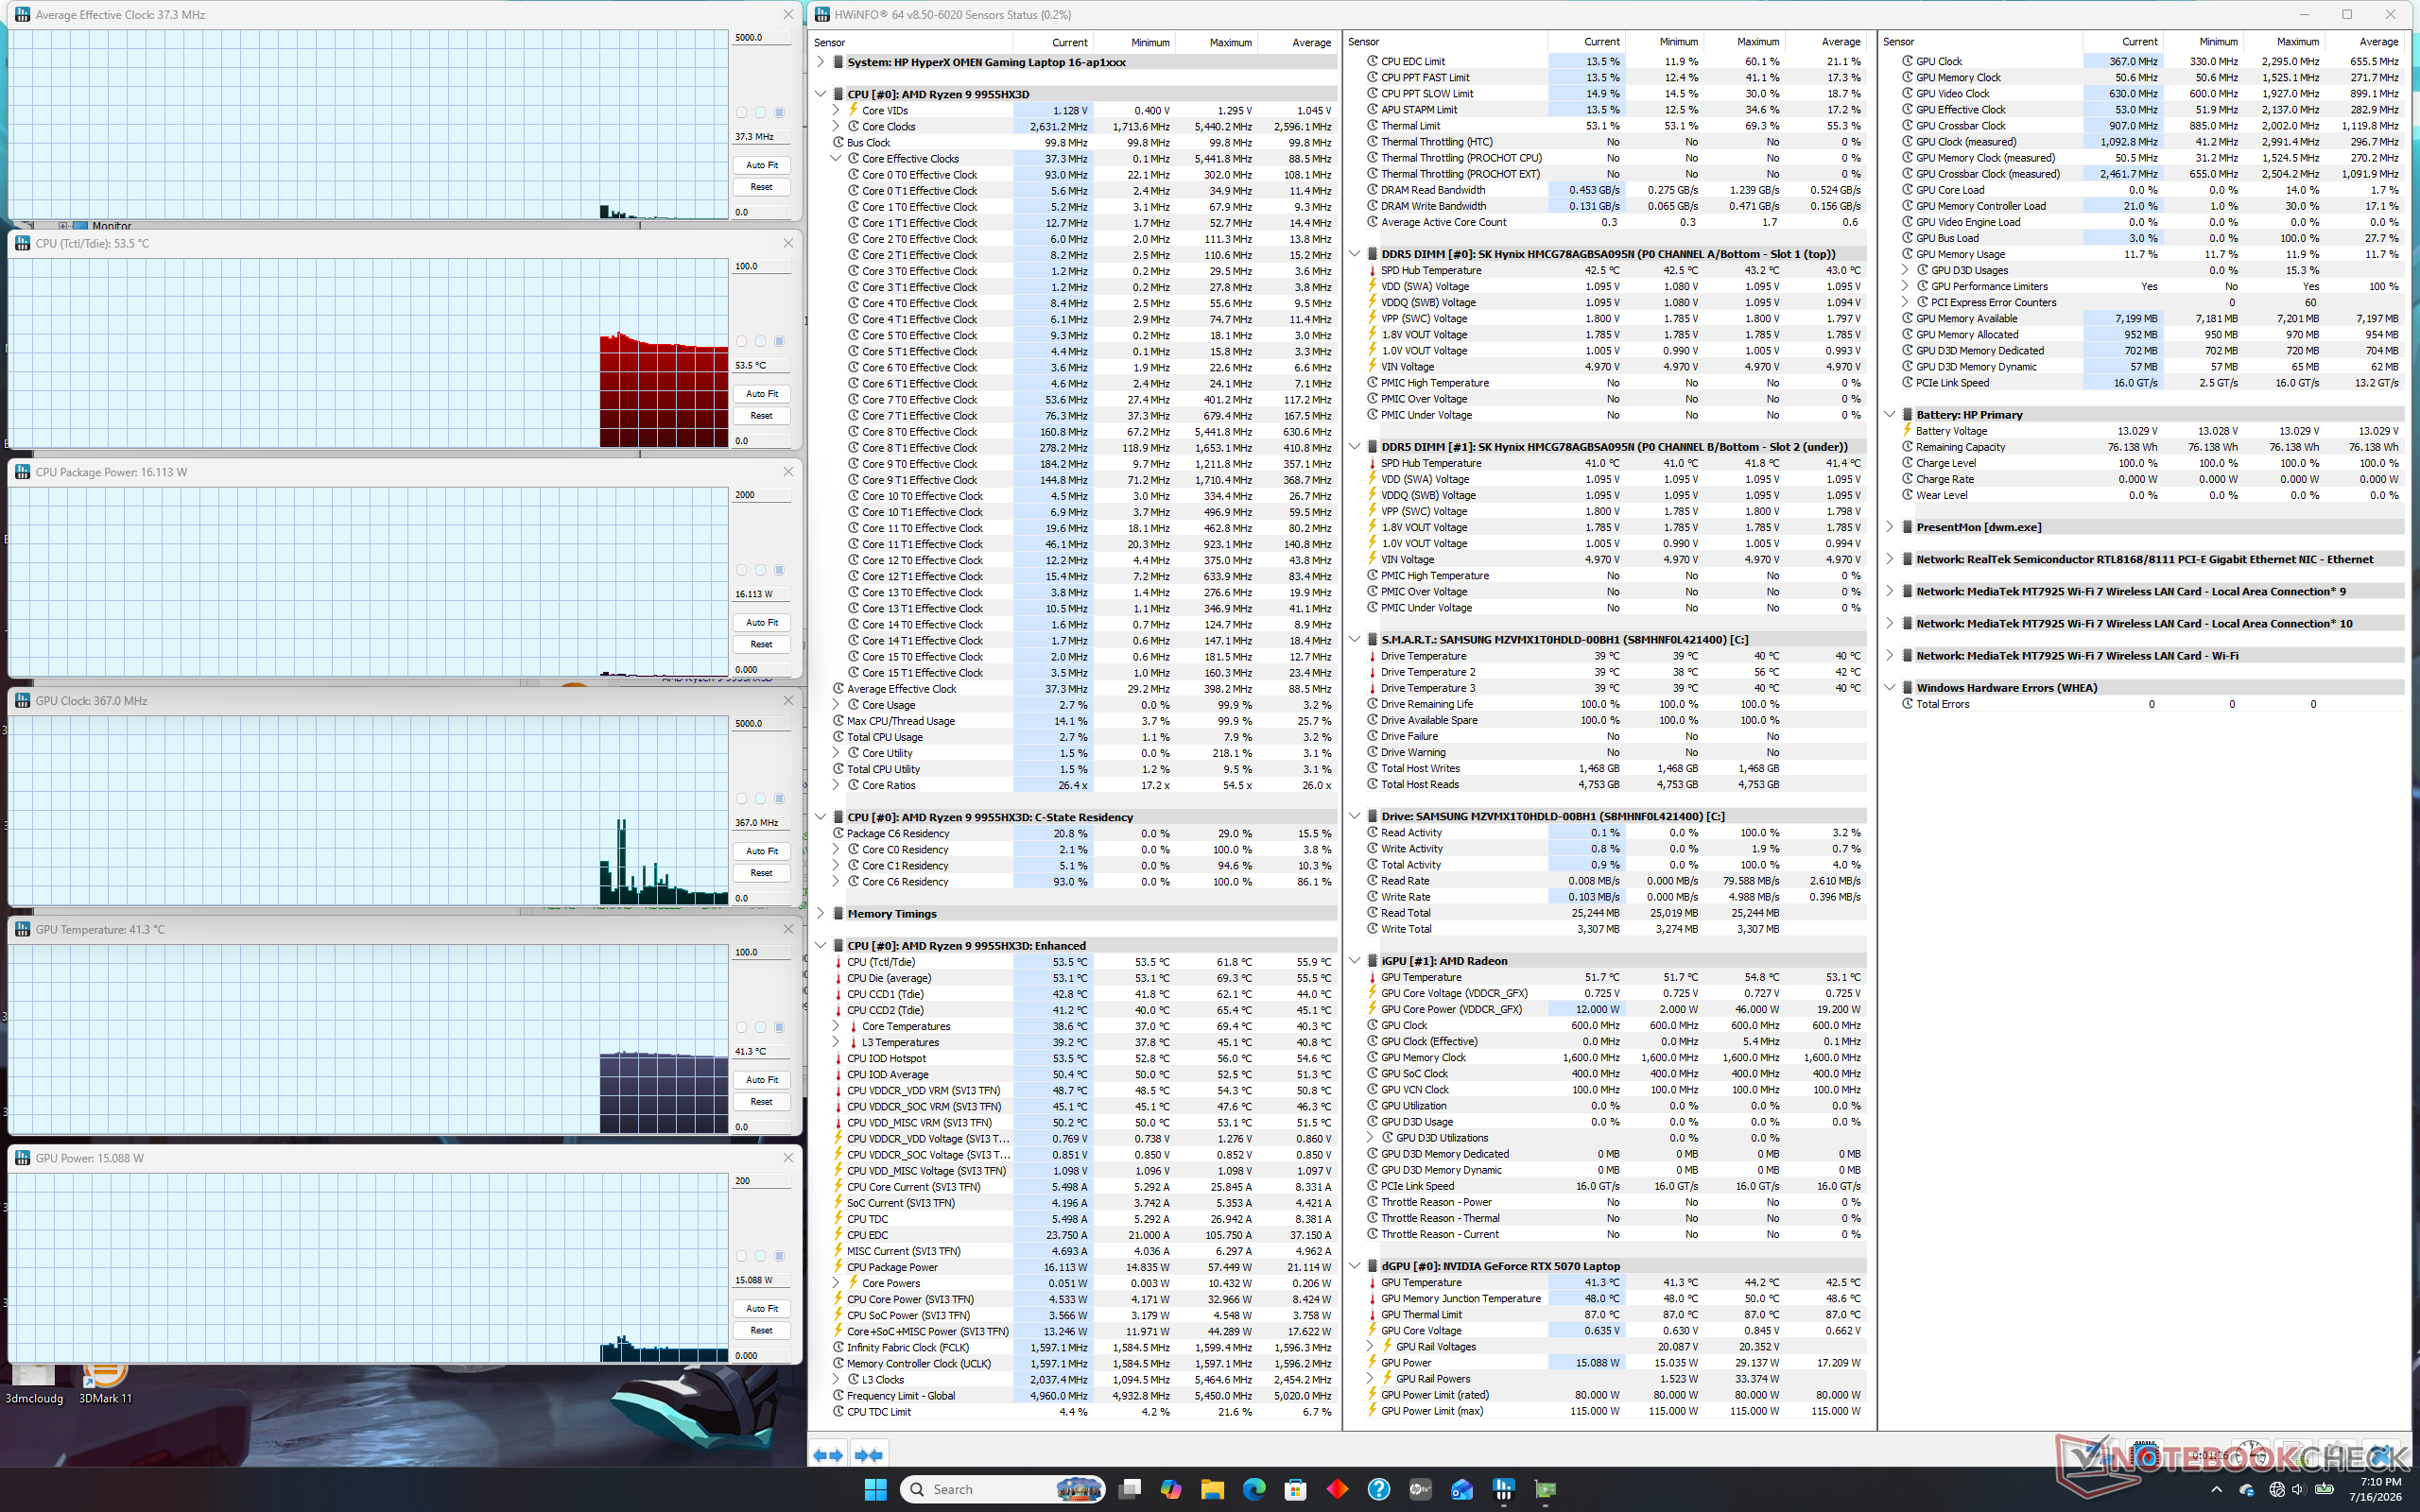
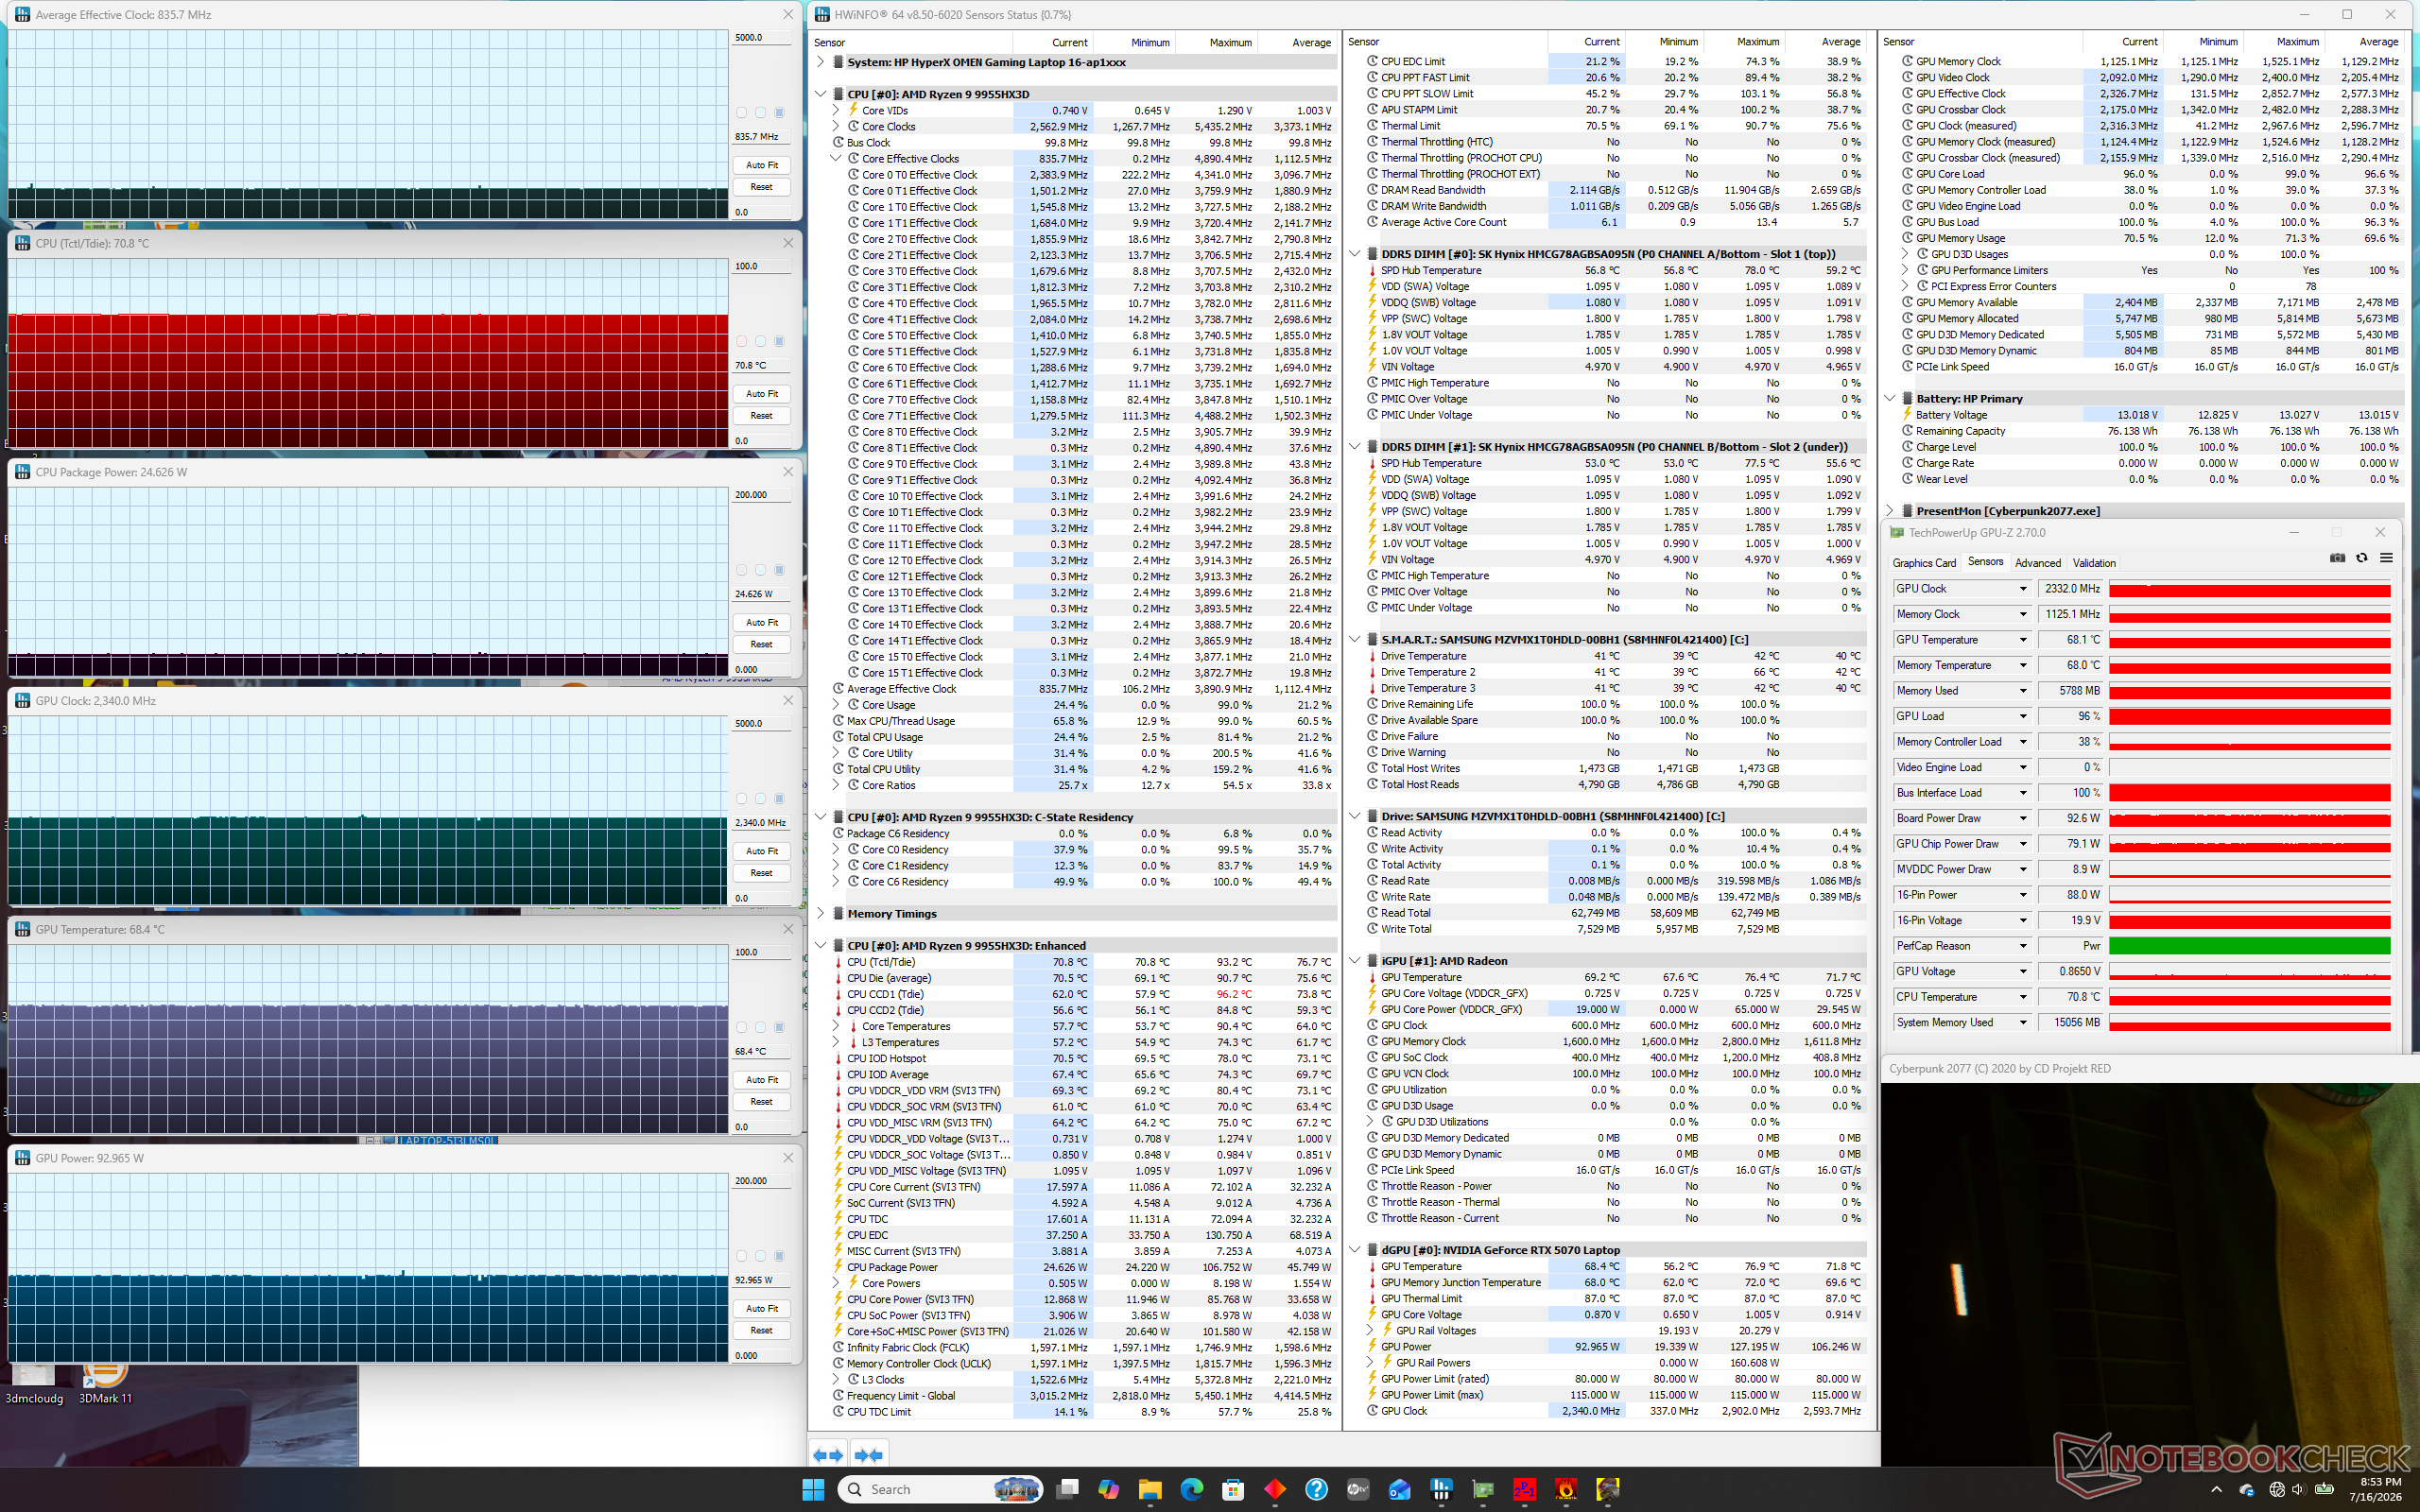
System idle
System idle
Cyberpunk 2077 (Balanced mode)
Prime95 stress
Prime95 stress
Cyberpunk 2077 (Performance mode)
Prime95+FurMark stress
Cyberpunk 2077 (Unleashed mode)
CPU Clock (GHz) GPU Clock (MHz) Average CPU Temperature (°C) Average GPU Temperature (°C)
System Idle -- 367 54 41
Prime95 Stress
Prime95 + FurMark Stress 3.3 2250 81 79
Cyberpunk 2077 Stress (Balanced mode) 0.8 2340 71 68
Cyberpunk 2077 Stress (Performance mode) 1.2 2685 75 72
Cyberpunk 2077 Stress (Unleashed mode) 1.2 2455 89 74

Speakers

Pink noise shows a relatively weak maximum volume of 78 dB(A) as most 16-inch multimedia laptops average slightly above 80 dB(A)
dB(A) 0102030405060708090Deep BassMiddle BassHigh BassLower RangeMidsHigher MidsLower HighsMid HighsUpper HighsSuper Highs2036.832.1252424.9312121.54027.3275033.924.96323.624.5803131.310022.428.612519.936.916019.146.620022.454.825015.359.731516.762.540013.165.950012.163.663012.766.780010.771.810009.870.312509.567.716009.968.2200010.368.4250010.563.8315011.264.6400011.466.3500011.863.7630012.762.3800013.263.31000012.8671250012.266.21600011.761.9SPL24.278.9N0.646.3median 12.2median 63.8Delta2.35.726.325.821.422.12624.925.127.622.532.523.448.72655.818.860.922.167.2267019.372.317.674.217.774.319.575.31571.711.871.311.27410.574.21072.710.17210.67210.97511.374.811.671.71269.71269.612.371.112.669.61270.111.269.824.784.70.666.6median 12median 71.73.42.2hearing rangehide median Pink NoiseHP HyperX Omen 16 16-ap1931nrApple MacBook Pro 16 2021 M1 Pro
Frequency diagram (checkboxes can be checked and unchecked to compare devices)
HP HyperX Omen 16 16-ap1931nr audio analysis

(±) | speaker loudness is average but good (78.9 dB)
Bass 100 - 315 Hz
(-) | nearly no bass - on average 15.6% lower than median
(±) | linearity of bass is average (11.8% delta to prev. frequency)
Mids 400 - 2000 Hz
(+) | balanced mids - only 4.1% away from median
(+) | mids are linear (4.5% delta to prev. frequency)
Highs 2 - 16 kHz
(+) | balanced highs - only 1.2% away from median
(+) | highs are linear (4.4% delta to prev. frequency)
Overall 100 - 16.000 Hz
(+) | overall sound is linear (13.3% difference to median)
Compared to same class
» 19% of all tested devices in this class were better, 5% similar, 76% worse
» The best had a delta of 6%, average was 18%, worst was 132%
Compared to all devices tested
» 14% of all tested devices were better, 3% similar, 83% worse
» The best had a delta of 4%, average was 23%, worst was 134%

Apple MacBook Pro 16 2021 M1 Pro audio analysis

(+) | speakers can play relatively loud (84.7 dB)
Bass 100 - 315 Hz
(+) | good bass - only 3.8% away from median
(+) | bass is linear (5.2% delta to prev. frequency)
Mids 400 - 2000 Hz
(+) | balanced mids - only 1.3% away from median
(+) | mids are linear (2.1% delta to prev. frequency)
Highs 2 - 16 kHz
(+) | balanced highs - only 1.9% away from median
(+) | highs are linear (2.7% delta to prev. frequency)
Overall 100 - 16.000 Hz
(+) | overall sound is linear (4.6% difference to median)
Compared to same class
» 0% of all tested devices in this class were better, 0% similar, 100% worse
» The best had a delta of 5%, average was 17%, worst was 45%
Compared to all devices tested
» 0% of all tested devices were better, 0% similar, 100% worse
» The best had a delta of 4%, average was 23%, worst was 134%

Energy Management

Power Consumption

Overall consumption is very high largely thanks to the Ryzen 9 9955HX3D CPU. Running Prime95, for example, would already demand 180 W to be more than most other gaming laptops under similar conditions. The relatively short battery life in the next section below is therefore unsurprising.
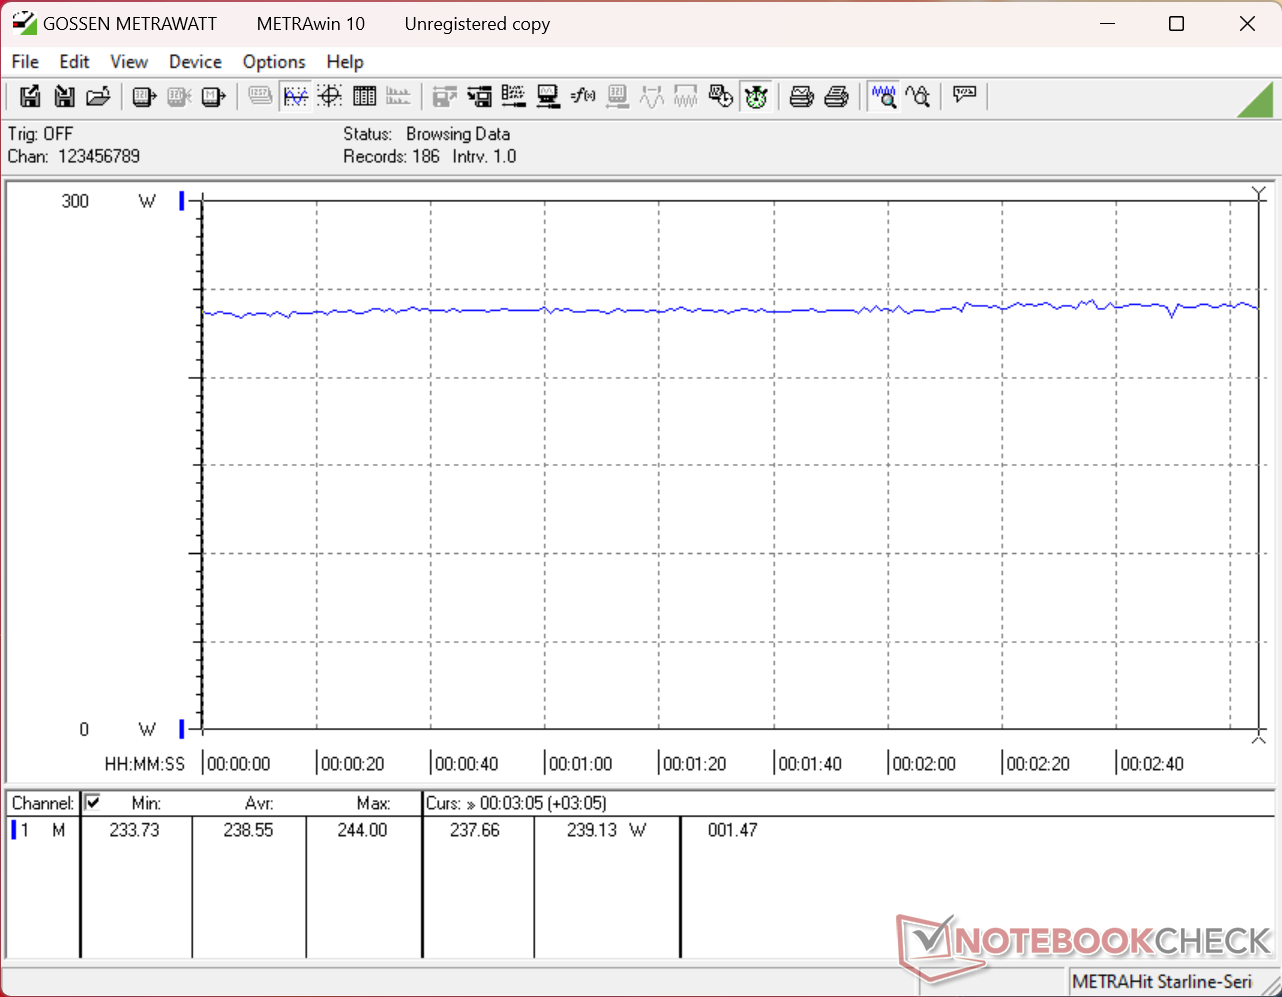
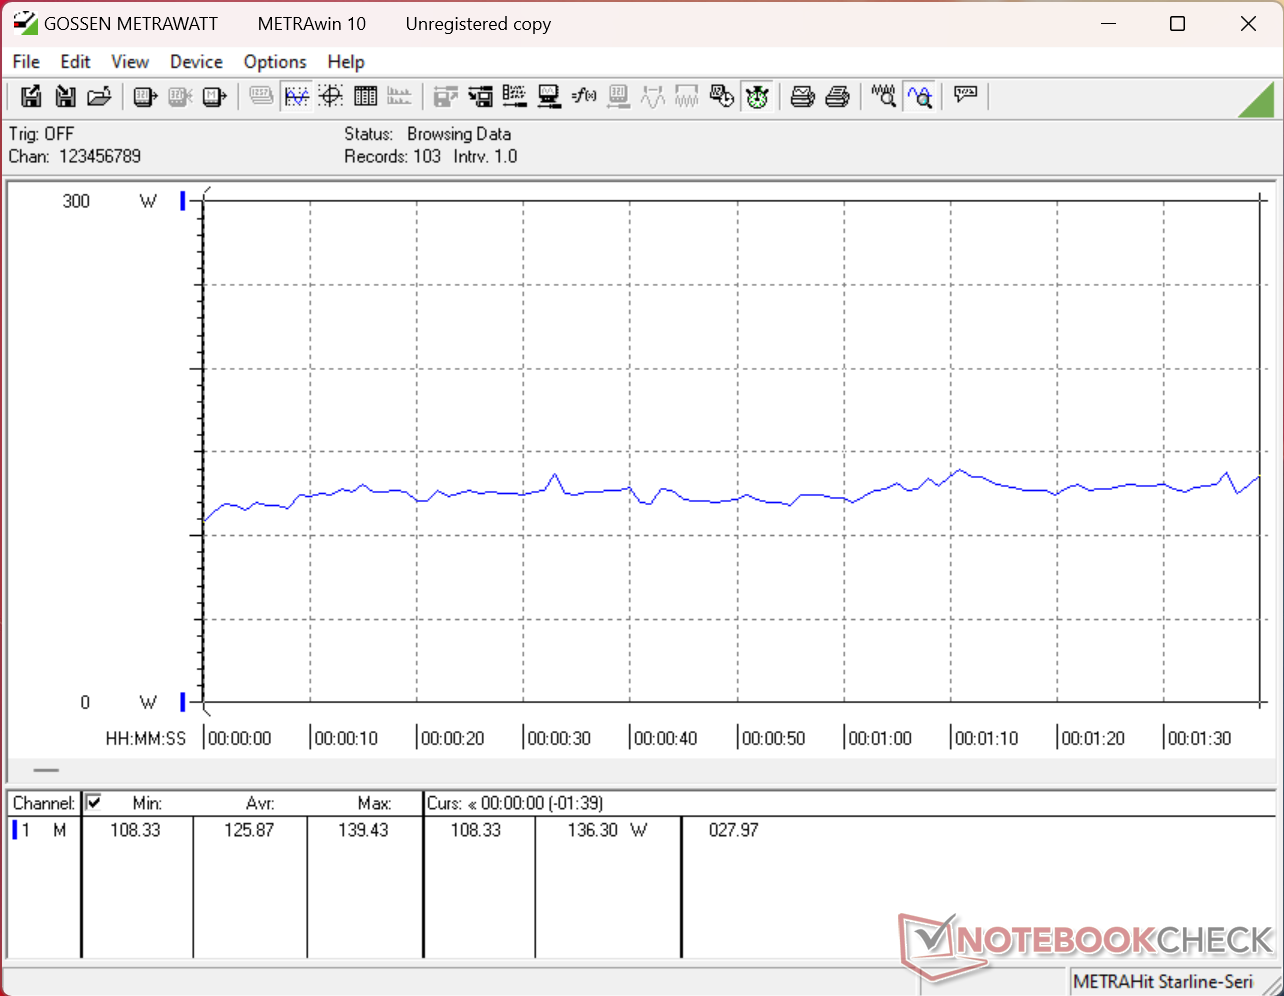
Cyberpunk 2077 1080p Ultra consumption
3DMark06 consumption
Consumption would spike to 198 W when initiating Prime95 stress before quickly dropping to 181 W
Prime95+FurMark stress initiated at 10s mark. System pulls up to 260 W from the relatively large (~18 x 9 x 2.5 cm) 280 W AC adapter
Power Consumption
Off / Standbydarklight 0.02 / 0.3 Watt
Idledarkmidlight 10.7 / 15.4 / 44.1 Watt
Load midlight 125.9 / 269.2 Watt
 color bar
Key: min: dark, med: mid, max: light        Metrahit Energy
HP HyperX Omen 16 16-ap1931nr
R9 9955HX3D, GeForce RTX 5070 Laptop, , IPS, 2560x1600, 16"
HP Omen 16-ap0091ng
R9 8940HX, GeForce RTX 5060 Laptop, Samsung PM9C1b MZVL81T0HFLB-00BH1, IPS, 1920x1200, 16"
MSI Crosshair A16 HX E8WGK
R9 8940HX, GeForce RTX 5070 Laptop, Micron 2500 1TB MTFDKBA1T0QGN, IPS, 2560x1600, 16"
Alienware 16X Aurora Core Ultra 9 290HX Plus
Ultra 9 290HX Plus, GeForce RTX 5070 Ti Laptop, , OLED, 2560x1600, 16"
Lenovo Legion Pro 5 16IAX10, RTX 5070
Ultra 7 255HX, GeForce RTX 5070 Laptop, SK Hynix HFS001TEJ9X115N, OLED, 2650x1600, 16"
Asus TUF Gaming A16 FA608UP
R7 260, GeForce RTX 5070 Laptop, Western Digital PC SN5000S SDEQNSJ-1T00, IPS, 2560x1600, 16"
Power Consumption
28%
-4%
20%
16%
37%
Idle Minimum * (Watt)
10.7
7.8
27%
12.3
-15%
6.9
36%
10.6
1%
4.6
57%
Idle Average * (Watt)
15.4
8.8
43%
17.1
-11%
8.1
47%
12.3
20%
9.8
36%
Idle Maximum * (Watt)
44.1
21.5
51%
42.4
4%
31
30%
18.6
58%
10.2
77%
Load Average * (Watt)
125.9
119
5%
130.2
-3%
131.6
-5%
104
17%
76.1
40%
Cyberpunk 2077 ultra external monitor * (Watt)
236
164.5
30%
242
-3%
172.1
27%
227
4%
198.1
16%
Cyberpunk 2077 ultra * (Watt)
239
192
20%
246
-3%
198.3
17%
231
3%
198.9
17%
Load Maximum * (Watt)
269.2
208
23%
264.3
2%
300.1
-11%
248
8%
235.2
13%

* ... smaller is better

Power Consumption Cyberpunk / Stress Test

0102030405060708090100110120130140150160170180190200210220230240250260Tooltip
HP HyperX Omen 16 16-ap1931nr R9 9955HX3D, GeForce RTX 5070 Laptop; 1280x720 Prime95 28.10 and Furmark 1.25: Ø258 (248-269) Watt
Lenovo Pro 9 16IPH11 Ultra 9 386H, GeForce RTX 5060 Laptop; 1280x720 Prime95 28.10 and Furmark 1.25: Ø186.7 (163.6-231) Watt
HP HyperX Omen 16 16-ap1931nr R9 9955HX3D, GeForce RTX 5070 Laptop; Idle 150cd/m2: Ø11.4 (9.29-17.2) Watt
Lenovo Pro 9 16IPH11 Ultra 9 386H, GeForce RTX 5060 Laptop; Idle 150cd/m2: Ø15.4 (14.7-17.6) Watt
HP HyperX Omen 16 16-ap1931nr R9 9955HX3D, GeForce RTX 5070 Laptop; Cyberpunk 2077 FHD ultra no FSR 150cd: Ø239 (234-244) Watt
Lenovo Pro 9 16IPH11 Ultra 9 386H, GeForce RTX 5060 Laptop; Cyberpunk 2077 FHD ultra no FSR 150cd: Ø161.2 (155-171.2) Watt

Power Consumption external Monitor

05101520253035404550556065707580859095100105110115120125130135140145150155160165170175180185190195200205210215220225230235240245250Tooltip
HP HyperX Omen 16 16-ap1931nr R9 9955HX3D, GeForce RTX 5070 Laptop; Prime95 V2810 Stress (external Monitor): Ø179.6 (174.2-198.2) Watt
HP Omen 16-ap0091ng R9 8940HX, GeForce RTX 5060 Laptop; Prime95 V2810 Stress (external Monitor): Ø94.9 (92.08-120.03) Watt
HP Omen 16-ap0091ng R9 8940HX, GeForce RTX 5060 Laptop; Cinebench R15 Multi (external Monitor): Ø103.5 (94.29-121.45) Watt
HP HyperX Omen 16 16-ap1931nr R9 9955HX3D, GeForce RTX 5070 Laptop; Cinebench R23 Multi (external Monitor): Ø182.5 (172.2-202) Watt
HP Omen 16-ap0091ng R9 8940HX, GeForce RTX 5060 Laptop; Cinebench R23 Multi (external Monitor): Ø95.1 (82.09-122.09) Watt
HP HyperX Omen 16 16-ap1931nr R9 9955HX3D, GeForce RTX 5070 Laptop; 1280x720 FurMark 1.19 GPU Stress Test (external Monitor): Ø156.6 (146.9-164.1) Watt
HP Omen 16-ap0091ng R9 8940HX, GeForce RTX 5060 Laptop; 1280x720 FurMark 1.19 GPU Stress Test (external Monitor): Ø161.3 (147.46-176.63) Watt
HP HyperX Omen 16 16-ap1931nr R9 9955HX3D, GeForce RTX 5070 Laptop; Idle 1min (external Monitor): Ø10.7 (8.18-16.7) Watt
HP Omen 16-ap0091ng R9 8940HX, GeForce RTX 5060 Laptop; Idle 1min (external Monitor): Ø26.4 (17.347-34.44) Watt
HP HyperX Omen 16 16-ap1931nr R9 9955HX3D, GeForce RTX 5070 Laptop; Cyberpunk 2077 FHD ultra no FSR (external Monitor): Ø236 (223-250) Watt
HP Omen 16-ap0091ng R9 8940HX, GeForce RTX 5060 Laptop; Cyberpunk 2077 FHD ultra no FSR (external Monitor): Ø164.5 (161.25-168.08) Watt

Battery Life

Battery Runtime
WiFi Websurfing
3h 54min
HP HyperX Omen 16 16-ap1931nr
R9 9955HX3D, GeForce RTX 5070 Laptop, 83 Wh
HP Omen 16-ap0091ng
R9 8940HX, GeForce RTX 5060 Laptop, 70 Wh
MSI Crosshair A16 HX E8WGK
R9 8940HX, GeForce RTX 5070 Laptop, 80 Wh
Alienware 16X Aurora Core Ultra 9 290HX Plus
Ultra 9 290HX Plus, GeForce RTX 5070 Ti Laptop, 96 Wh
Lenovo Legion Pro 5 16IAX10, RTX 5070
Ultra 7 255HX, GeForce RTX 5070 Laptop, 80 Wh
Asus TUF Gaming A16 FA608UP
R7 260, GeForce RTX 5070 Laptop, 90 Wh
Battery runtime
28%
41%
90%
59%
233%
WiFi v1.3 (h)
3.9
5
28%
5.5
41%
7.4
90%
6.2
59%
13
233%
H.264 (h)
5.1
6.1
Load (h)
1.3
1.8

Notebookcheck Rating

The HyperX Omen 16 includes only minor external changes but with more major updates to the CPU and display especially with regards to its extreme Ryzen 9 9955HX3D CPU.

HP HyperX Omen 16 16-ap1931nr - 08/21/2026 v8
Allen Ngo

Chassis
86 / 98 → 88%
Keyboard
91%
Pointing Device
88%
Connectivity
62 / 80 → 77%
Weight
60 / 10-68 → 86%
Battery
57 / 95 → 60%
Display
83%
Games Performance
92%
Application Performance
93%
AI Performance
96%
Temperature
92 / 95 → 97%
Noise
70 / 90 → 78%
Audio
74%
Camera
38 / 75 → 51%
Average
68%
85%
Gaming - Weighted Average
CO2 Emissions
50%
Materials
40%
Packaging
50%
Power Use
88.3%
Repairability
42%
Software Updates
22.3%
Recycle Logo Total Sustainability Score: 48.8%

Potential Competitors in Comparison

Image
Model / Review
Price
Weight
Height
Display
1.
84.9%
HP HyperX Omen 16 16-ap1931nr
AMD Ryzen 9 9955HX3D ⎘
NVIDIA GeForce RTX 5070 Laptop ⎘
32 GB Memory
Amazon:
1. $1,909.00
HP Omen 16 Gaming AI Laptop ...
2. $1,099.99
HP Omen 16 Slim Gaming Lapto...
3. $2,059.99
HP OMEN Slim 16 AI Gaming La...
List Price: 2250 USD
2.4 kg30 mm16.00"
2560x1600
189 PPI
IPS
2.
82.5%
HP Omen 16-ap0091ng
HP Omen 16-ap0091ng
AMD Ryzen 9 8940HX ⎘
NVIDIA GeForce RTX 5060 Laptop ⎘
16 GB Memory, 1000 GB SSD
Amazon: List Price: 1500 Euro2.4 kg23.7 mm16.00"
1920x1200
162 PPI
IPS
3.
82.5%
MSI Crosshair A16 HX E8WGK
AMD Ryzen 9 8940HX ⎘
NVIDIA GeForce RTX 5070 Laptop ⎘
32 GB Memory, 1024 GB SSD
Amazon: $2,699.00
List Price: 2700 USD
2.3 kg25.55 mm16.00"
2560x1600
189 PPI
IPS
4.
86.1%
Alienware 16X Aurora Core Ultra 9 290HX Plus
Intel Core Ultra 9 290HX Plus ⎘
NVIDIA GeForce RTX 5070 Ti Laptop ⎘
32 GB Memory
Amazon: List Price: 3000 USD2.6 kg23.4 mm16.00"
2560x1600
189 PPI
OLED
5.
86.4%
Lenovo Legion Pro 5 16IAX10, RTX 5070
Intel Core Ultra 7 255HX ⎘
NVIDIA GeForce RTX 5070 Laptop ⎘
32 GB Memory, 1024 GB SSD
Amazon: List Price: 1800 Euro2.3 kg25.95 mm16.00"
2650x1600
189 PPI
OLED
6.
83.8%
Asus TUF Gaming A16 FA608UP
AMD Ryzen 7 260 ⎘
NVIDIA GeForce RTX 5070 Laptop ⎘
32 GB Memory, 1024 GB SSD
Amazon: List Price: 2199€2.2 kg25.7 mm16.00"
2560x1600
189 PPI
IPS

Transparency

The selection of devices to be reviewed is made by our editorial team. The test sample was provided to the author as a loan by the manufacturer or retailer for the purpose of this review. The lender had no influence on this review, nor did the manufacturer receive a copy of this review before publication. There was no obligation to publish this review. As an independent media company, Notebookcheck is not subjected to the authority of manufacturers, retailers or publishers.

This is how Notebookcheck is testing

Every year, Notebookcheck independently reviews hundreds of laptops and smartphones using standardized procedures to ensure that all results are comparable. We have continuously developed our test methods for around 20 years and set industry standards in the process. In our test labs, high-quality measuring equipment is utilized by experienced technicians and editors. These tests involve a multi-stage validation process. Our complex rating system is based on hundreds of well-founded measurements and benchmarks, which maintains objectivity. Further information on our test methods can be found here.

Google LogoAdd as a preferred source on Google
Mail Logo

No comments for this article

Got questions or something to add to our article? Even without registering you can post in the comments!
No comments for this article / reply

static version load dynamic
Loading Comments
> Expert Reviews and News on Laptops, Smartphones and Tech Innovations > Reviews > HP HyperX Omen 16 review: One of the fastest AMD CPUs for mainstream gamers
Allen Ngo, 2026-08-21 (Update: 2026-08-21)