Notebookcheck Logo
Teaser

Did Gigabyte go too far? Aorus Master 16 gaming laptop with AMD Zen 5 review

High performance at the cost of high noise levels.

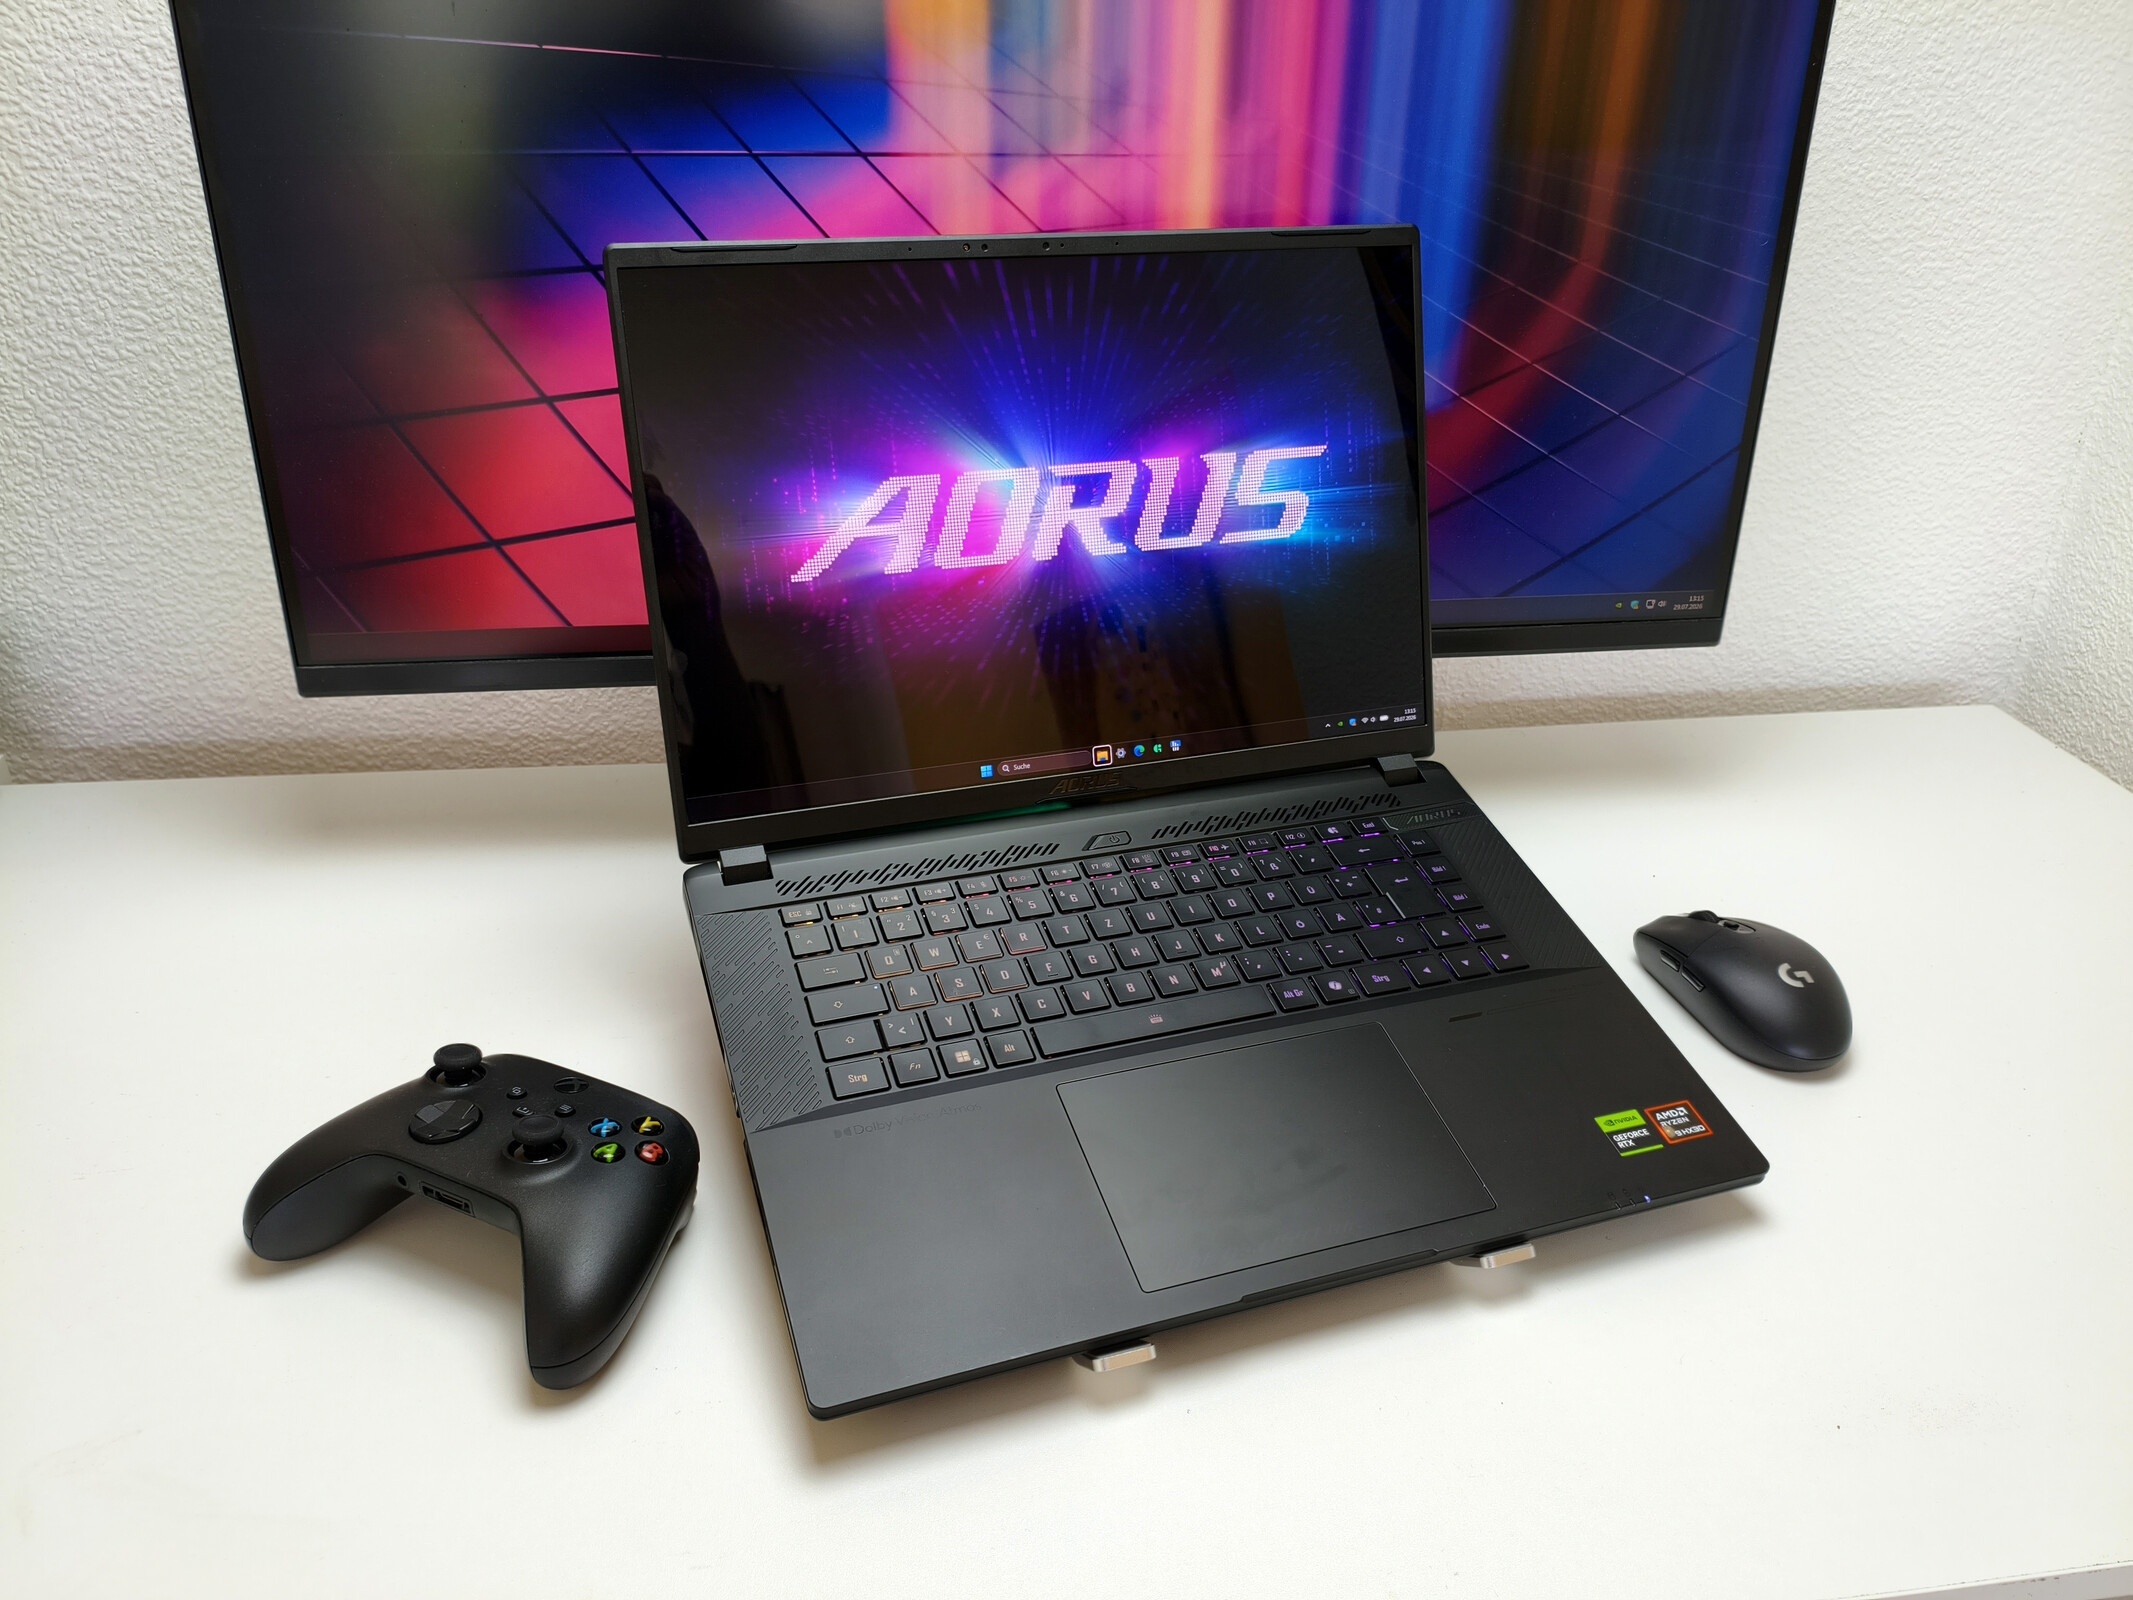
The Aorus Master 16 is equipped with the Ryzen 9 9955HX3D, one of the most powerful laptop processors on the market. Paired with a GeForce RTX 5080, it promises plenty of performance, but other aspects suffer as a result. Read on to find out whether the overall package succeeds or Gigabyte has backed the wrong horse.
Florian Glaser, 👁 Florian Glaser, Ninh Duy (translated by DeepL / Ninh Duy) Published 🇩🇪 🇳🇱 ...
Gaming Laptop AMD Zen 5 Nvidia Geforce

Verdict

With the Aorus Master 16, raw performance is clearly the top priority. Thanks to its high TDP and TGP settings, the processor and graphics card perform exceptionally well and get to flex their muscles. The rest of our AM6J test configuration is also well equipped, with 2 × 16 GB of DDR5 RAM and two 1 TB SSDs. Gigabyte did not cut corners on the display either: The fast 240 Hz OLED panel stands out with its respectable brightness, wide color gamut, and crisp contrast.

There is also little to complain about in terms of ports; for example, one of the USB-C ports supports USB4. The main compromises concern noise and heat. Under load, the 16-inch laptop gets quite warm and, above all, loud. Its fan control is less than ideal even when idling, as we will discuss later. Battery life is not particularly generous either: Despite its 99 Wh battery, the gaming laptop runs out of steam fairly quickly.

Pros

+ Vibrant and bright OLED display
+ Good performance

Cons

- Rather mediocre battery life
- Annoying fan noise

Price and availability

A comparable configuration with a Core Ultra 9 275HX and GeForce RTX 5080 was listed starting at around €3,200 at the time of testing (e.g., at Computeruniverse).

Translator’s note: In the US, the same Intel-based Aorus Master 16 configuration is available from Amazon for around $3,000.

Amazon Logo
$2,999.99
GIGABYTE - AORUS Master 16 Gaming Laptop - 240Hz 2560x1600 OLED - NVIDIA GeForce RTX 5080 - Intel Core Ultra 9 275HX - 1TB SSD with 32GB DDR5 RAM - Windows 11 Home AD, Dark Tide

Specifications

Aorus Master 16 AM6J (Master 16 Series)
Processor
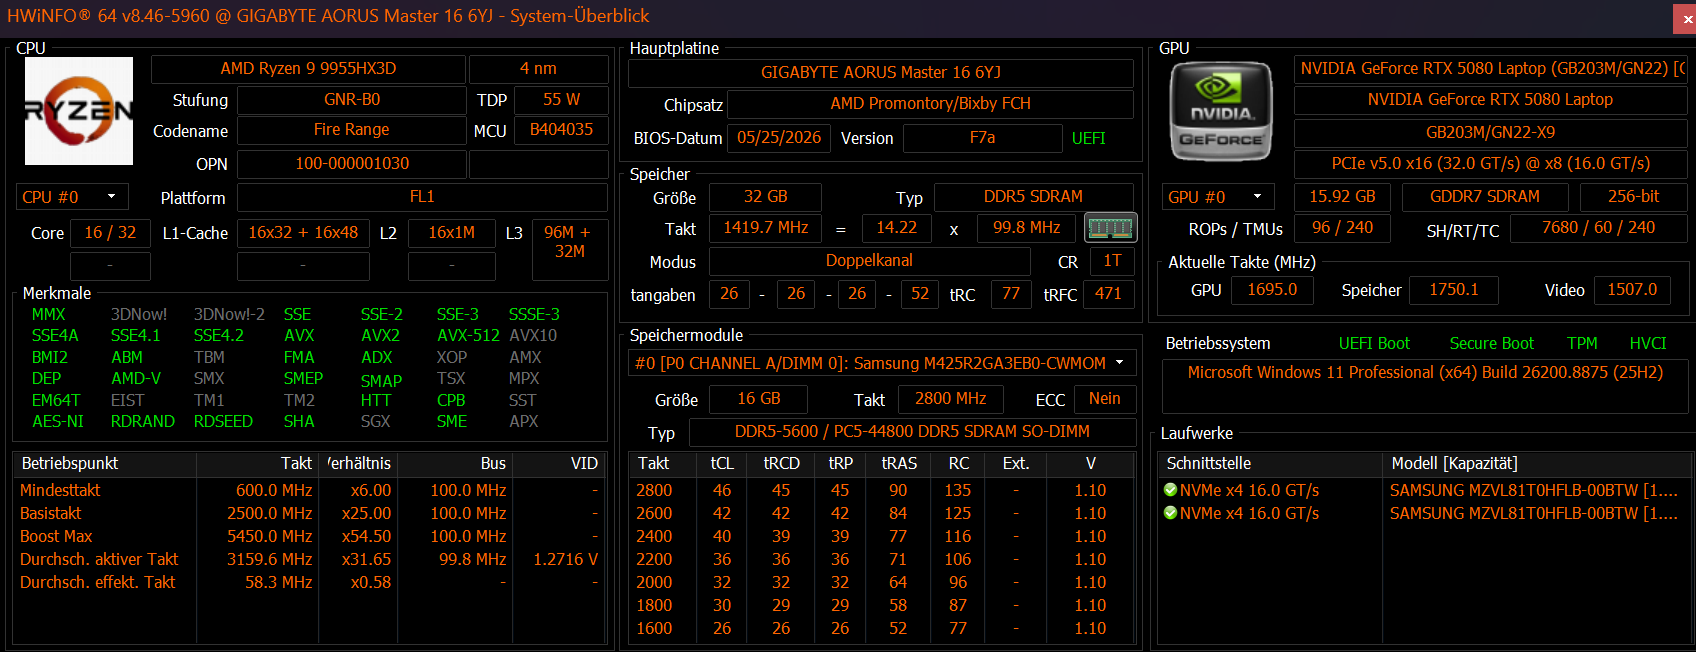
AMD Ryzen 9 9955HX3D 16c/32t, 16 x 5.4 GHz AMD Zen 5, 145 W PL2 / Short Burst, 145 W PL1 / Sustained, Fire Range-HX (Zen 5)
Graphics adapter
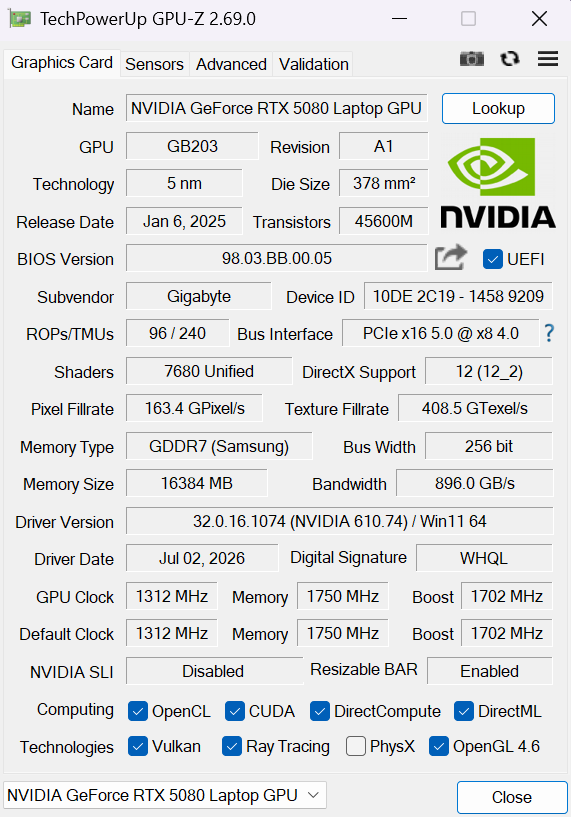
NVIDIA GeForce RTX 5080 Laptop - 16 GB VRAM, Core: 1702 MHz, RAM: 1750 MHz, 175 W TDP, GDDR7, ForceWare 610.74, MUX Switch
Memory
32 GB 
, 2x 16 GB DDR5-5600, two SO-DIMM-slots (both in use)
Display
16.00 inch 16:10, 2560 x 1600 pixel 189 PPI, Samsung ATNA60HU02-0, OLED, Pantone validated, glossy: yes, HDR, 240 Hz
Mainboard
AMD Promontory/Bixby FCH
Storage
Samsung PM9C1b MZVL81T0HFLB-00BTW, 1000 GB 
, 2x 1 TB NVMe-SSD, two M.2 2280 slots (both in use)
Soundcard
Realtek ALC245 @ AMD K1A.4 - Audio Processor - High Definition Audio Controller
Connections
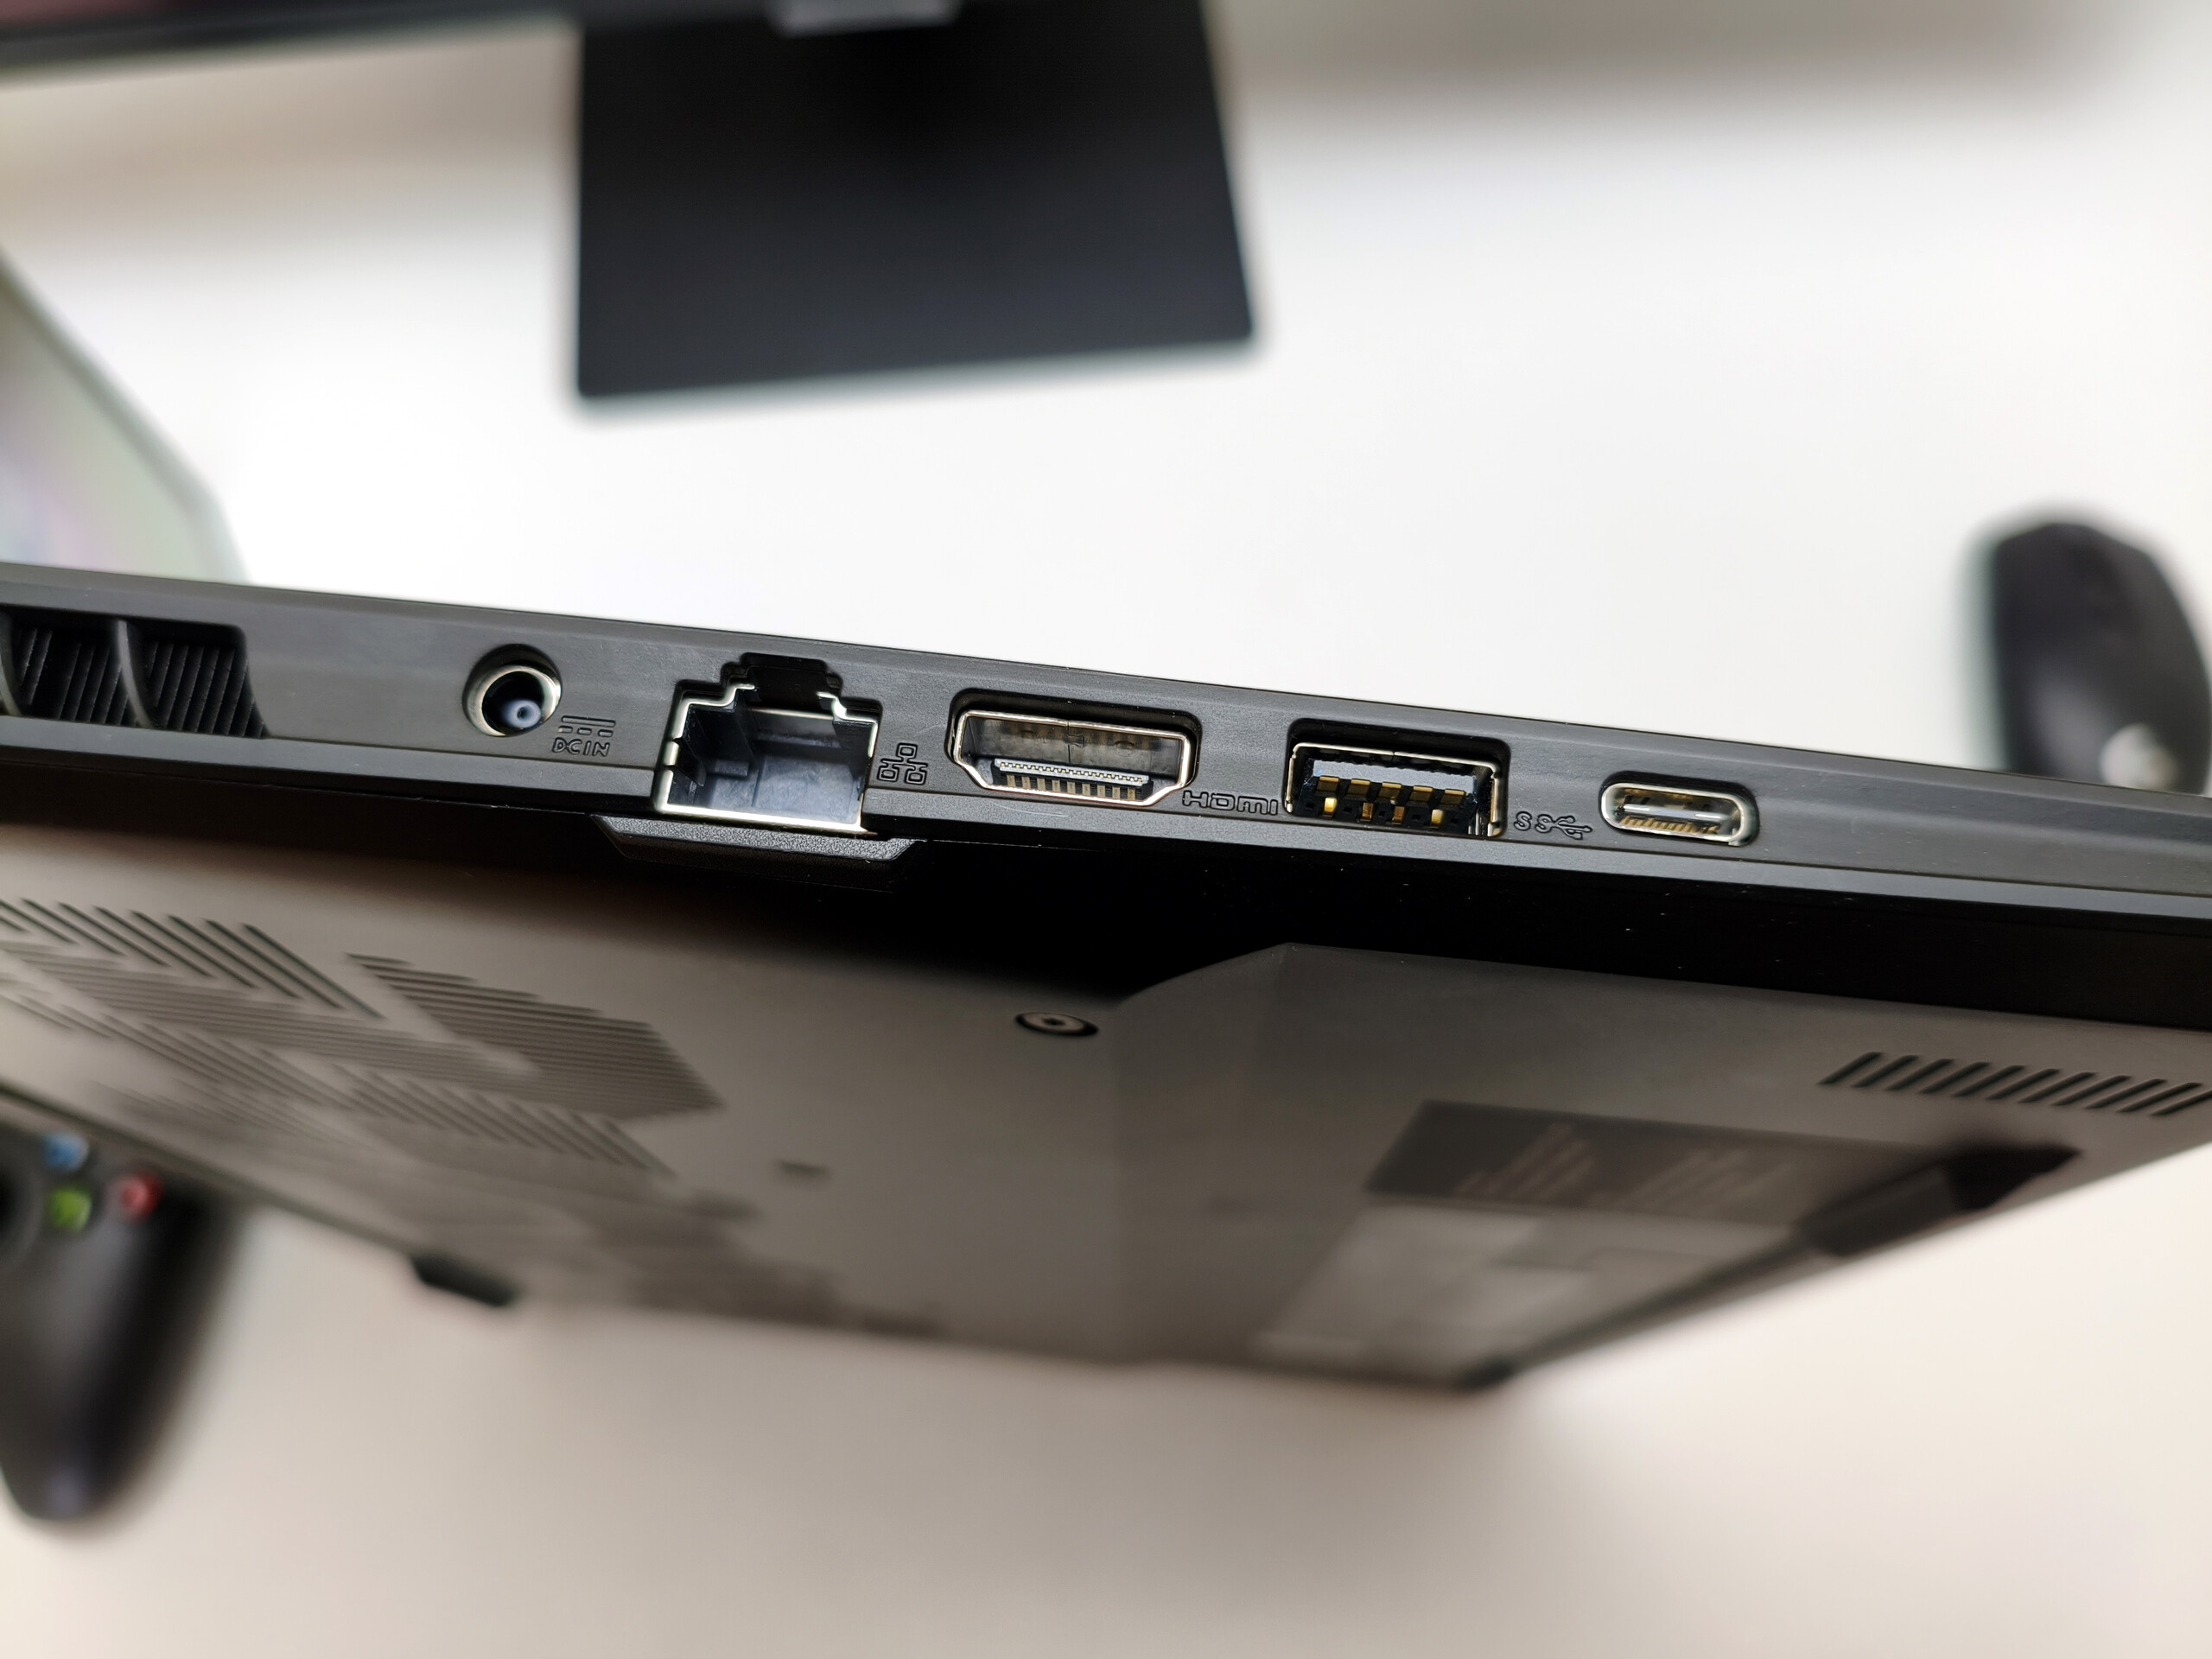
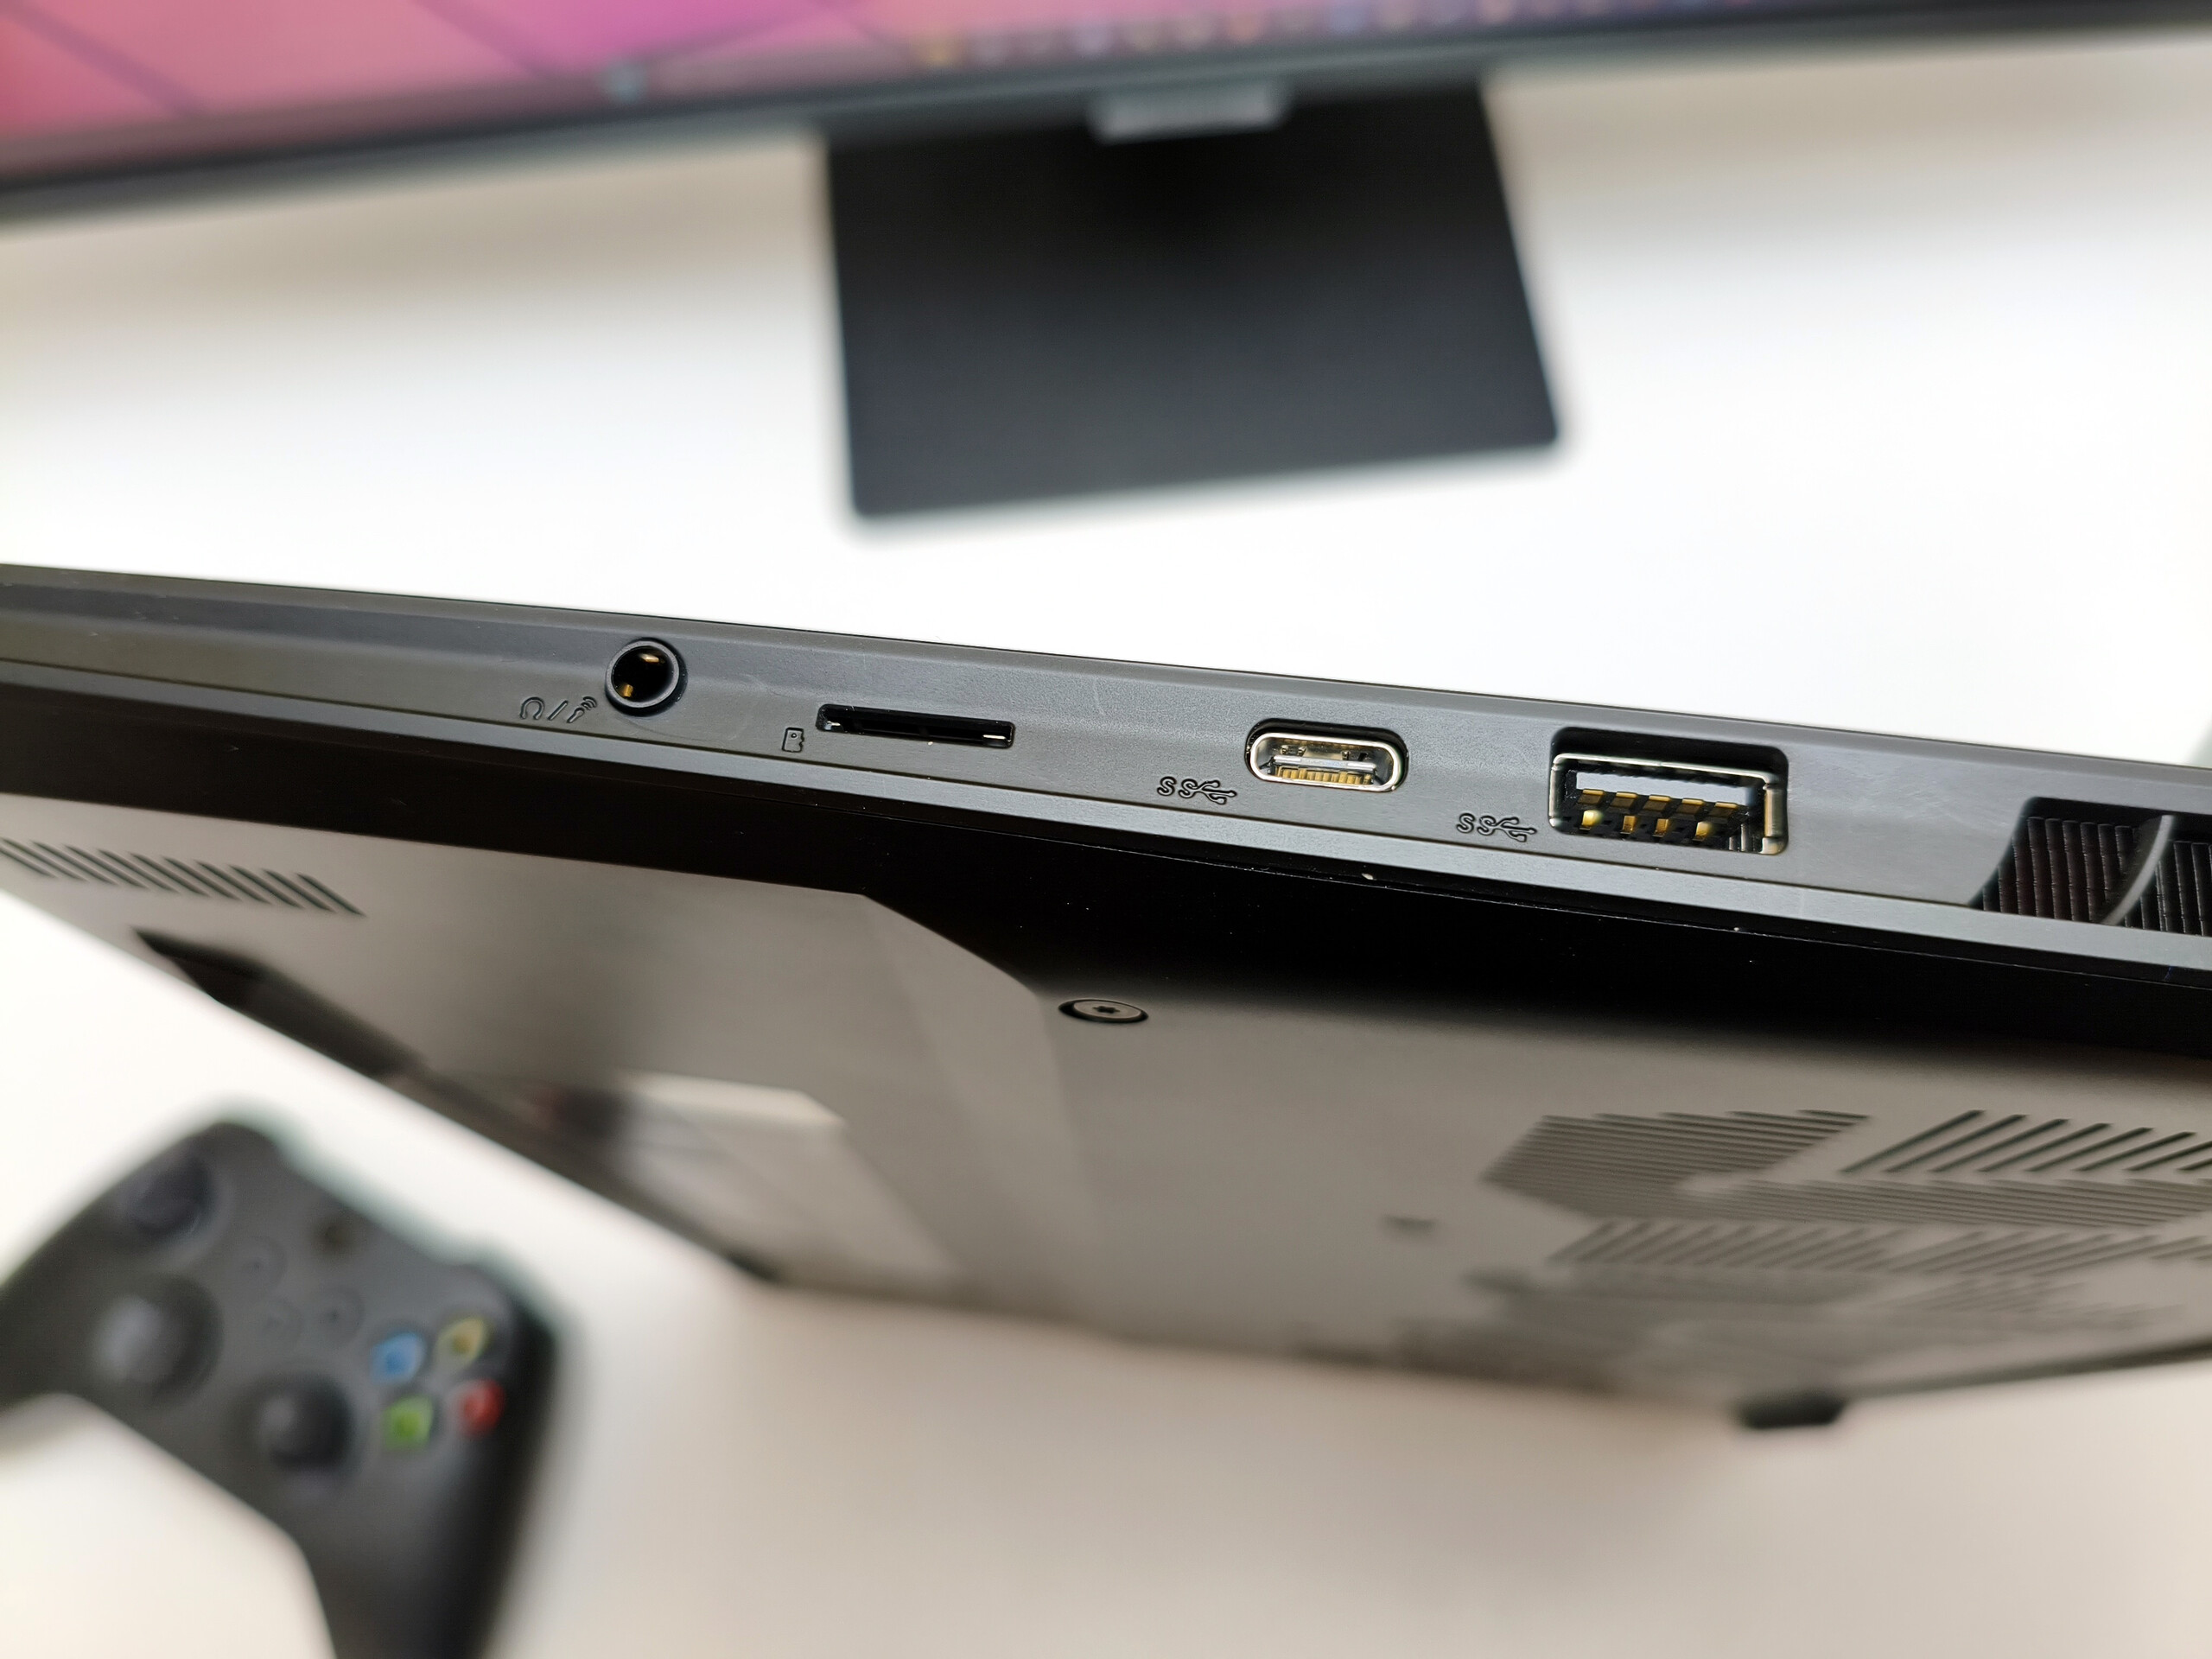
3 USB 3.1 Gen2, 1 USB4 40 Gbps, USB-C Power Delivery (PD), 1 HDMI, Audio Connections: 3.5 mm, Card Reader: microSD
Networking
Realtek PCIe GBE Family Controller (10/100/1000MBit/s), Realtek 8922AE WiFi 7 PCI-E NIC (a/b/g/n = Wi-Fi 4/ac = Wi-Fi 5/ax = Wi-Fi 6/ Wi-Fi 6E 6 GHz be = Wi-Fi 7), Bluetooth 5.4
Size
height x width x depth (in mm): 24.5 x 357 x 255 ( = 0.96 x 14.06 x 10.04 in)
Battery
99 Wh Lithium-Polymer
Operating System
Microsoft Windows 11 Pro
Camera
Webcam: FHD IR
Primary Camera: 2 MPix
Additional features
Speakers: 4x 2W, Keyboard: 3 Zone Chiclet RGB, Keyboard Light: yes, 330 W Power Supply, GiMATE, 24 Months Warranty
Weight
2.3 kg ( = 81.13 oz / 5.07 pounds), Power Supply: 714 g ( = 25.19 oz / 1.57 pounds)
Note: The manufacturer may use components from different suppliers including display panels, drives or memory sticks with similar specifications.


Case, features, and input devices

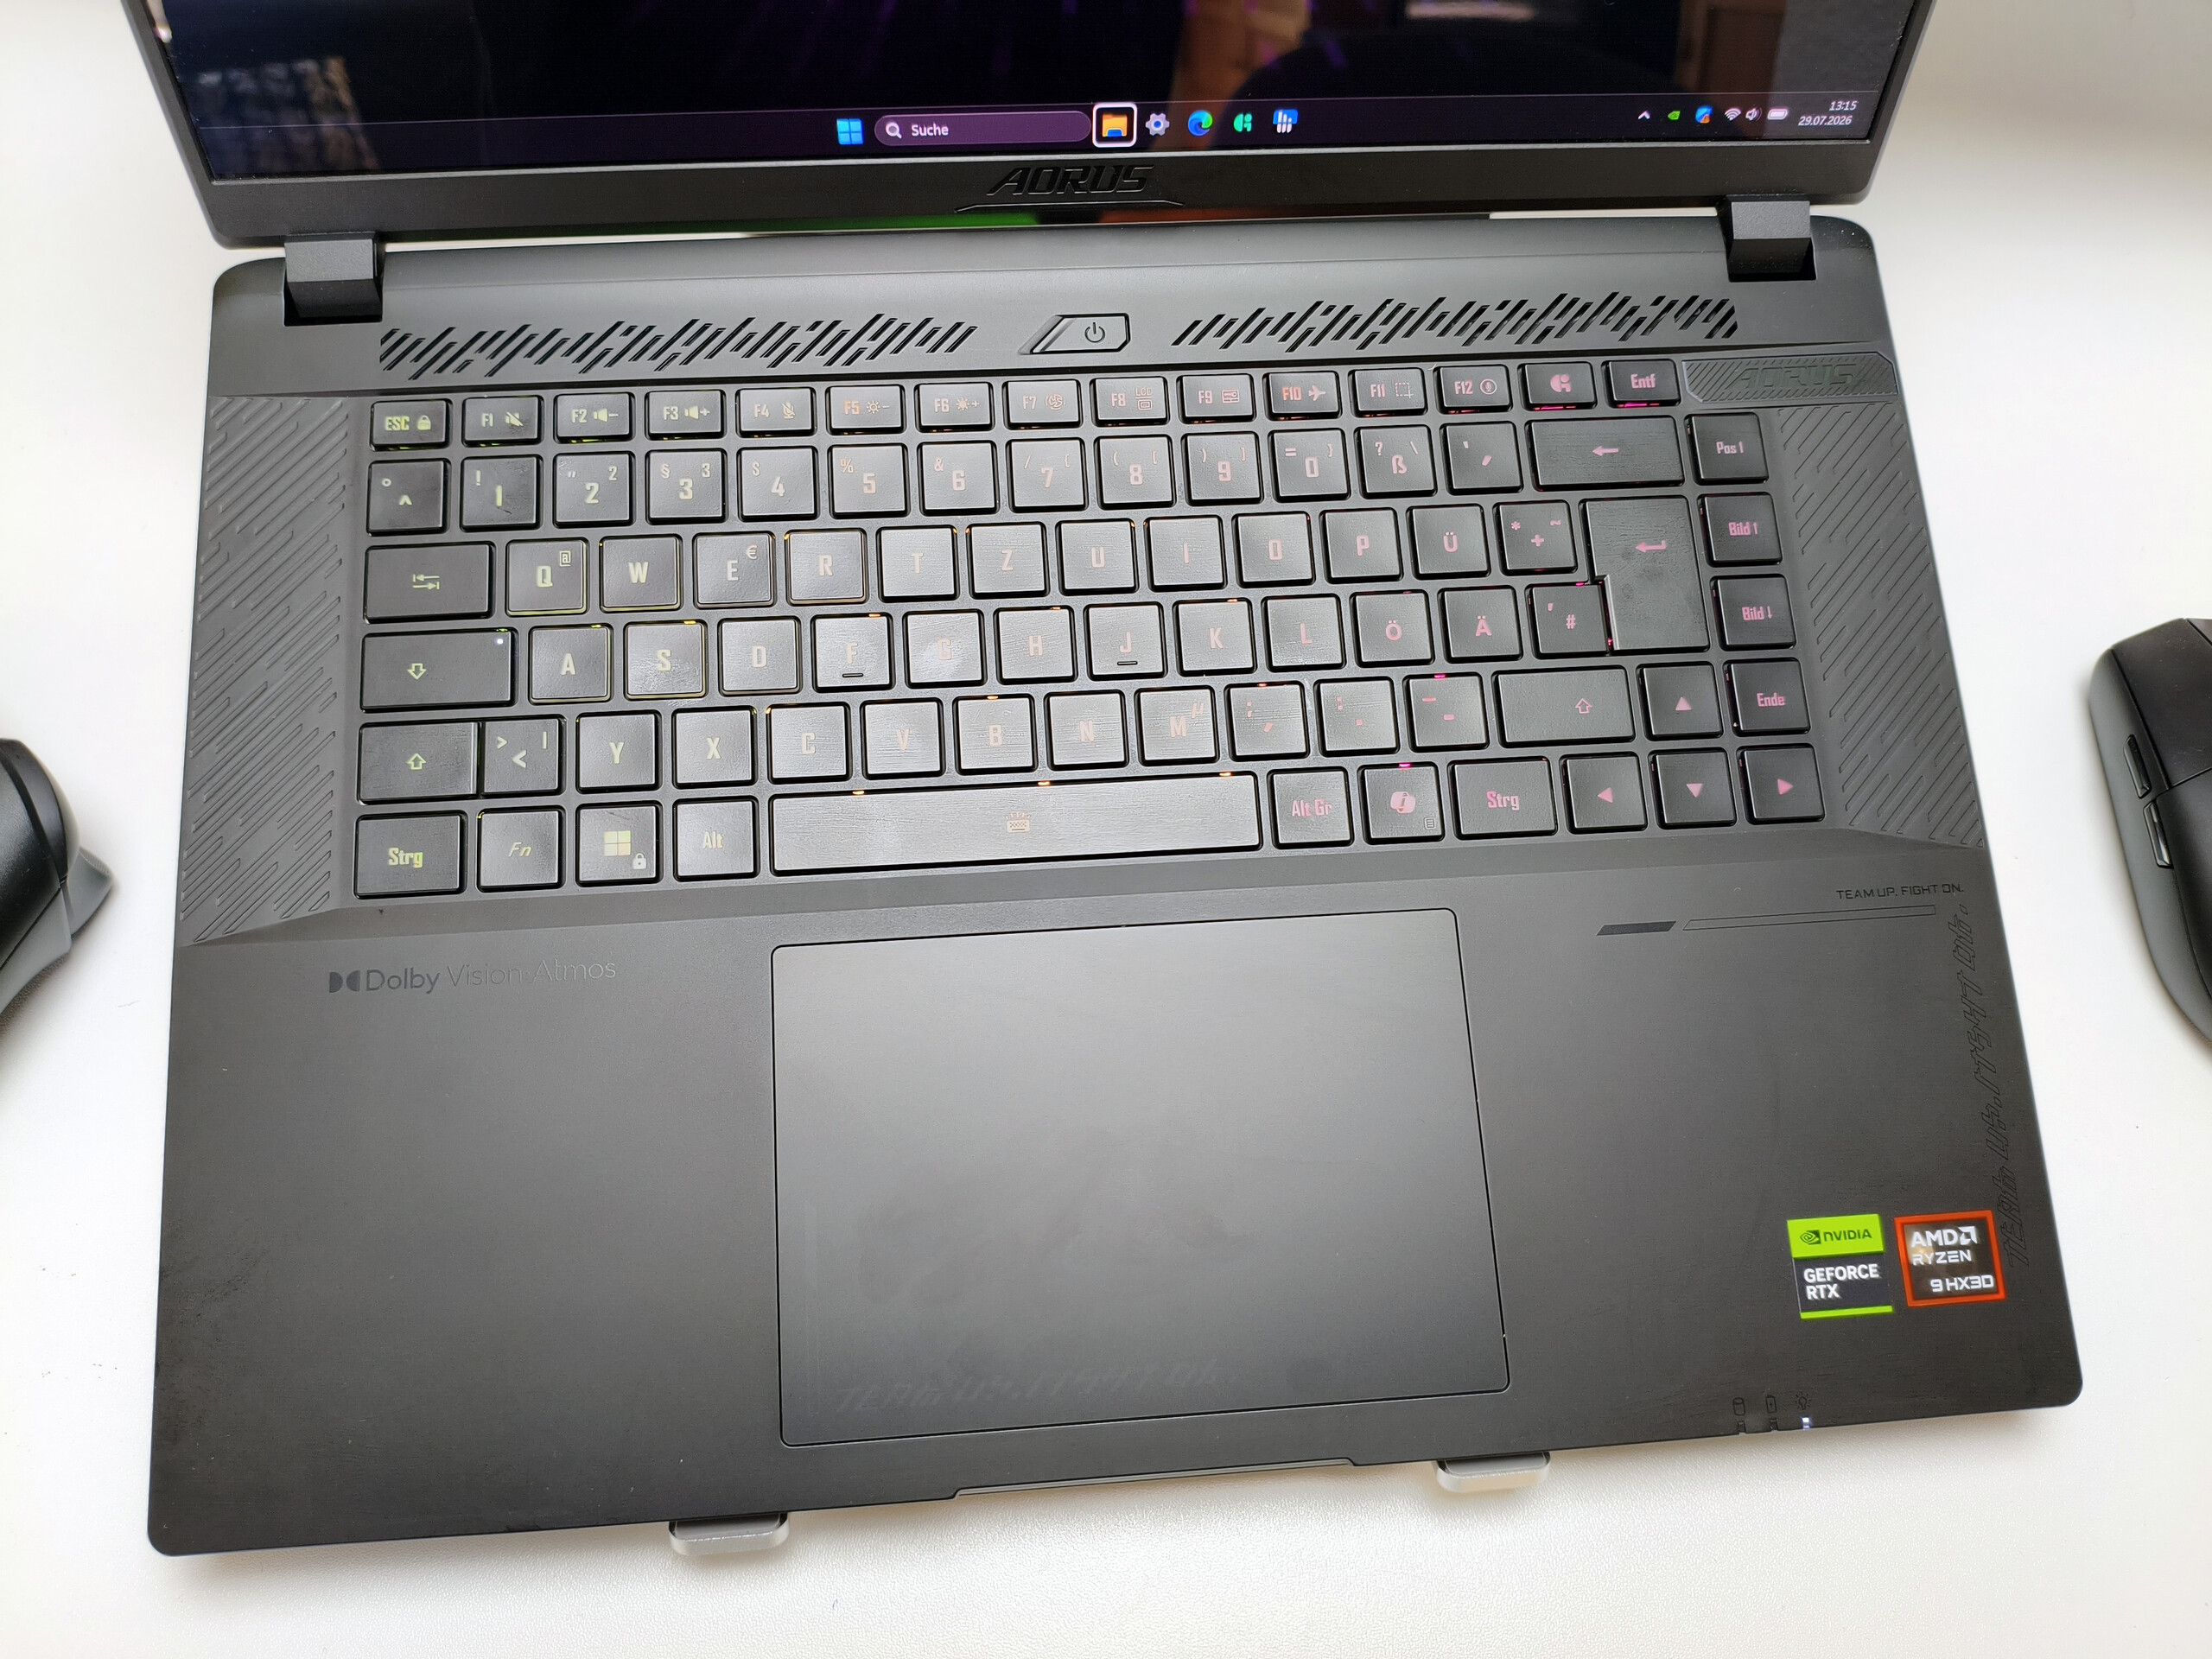
Although the Master 16 is quite expensive, its chassis is made largely of plastic. That said, the base unit is more than adequately rigid. The lid, however, could offer greater resistance to twisting. The same applies to the hinges, which could be somewhat firmer, especially given that the maximum opening angle is severely limited to just under 130°. Buyers will also have to live with the dark surfaces quickly collecting fingerprints. The build quality, however, leaves little room for criticism. At around 2.3 kg, the Aorus is the lightest 16-inch laptop in our comparison group. Its competitors weigh between 2.6 and 3.3 kg.

There is some room for improvement in the wireless module. Despite supporting Wi-Fi 7, it delivered only mediocre transfer rates in our testing. The Full HD webcam is similarly mediocre. By contrast, the microSD card reader is surprisingly fast. As for physical connectivity, the laptop offers four USB ports in addition to HDMI 2.1, an audio jack, and an RJ45 Ethernet port (see photos). The USB-C ports support Power Delivery and DisplayPort.

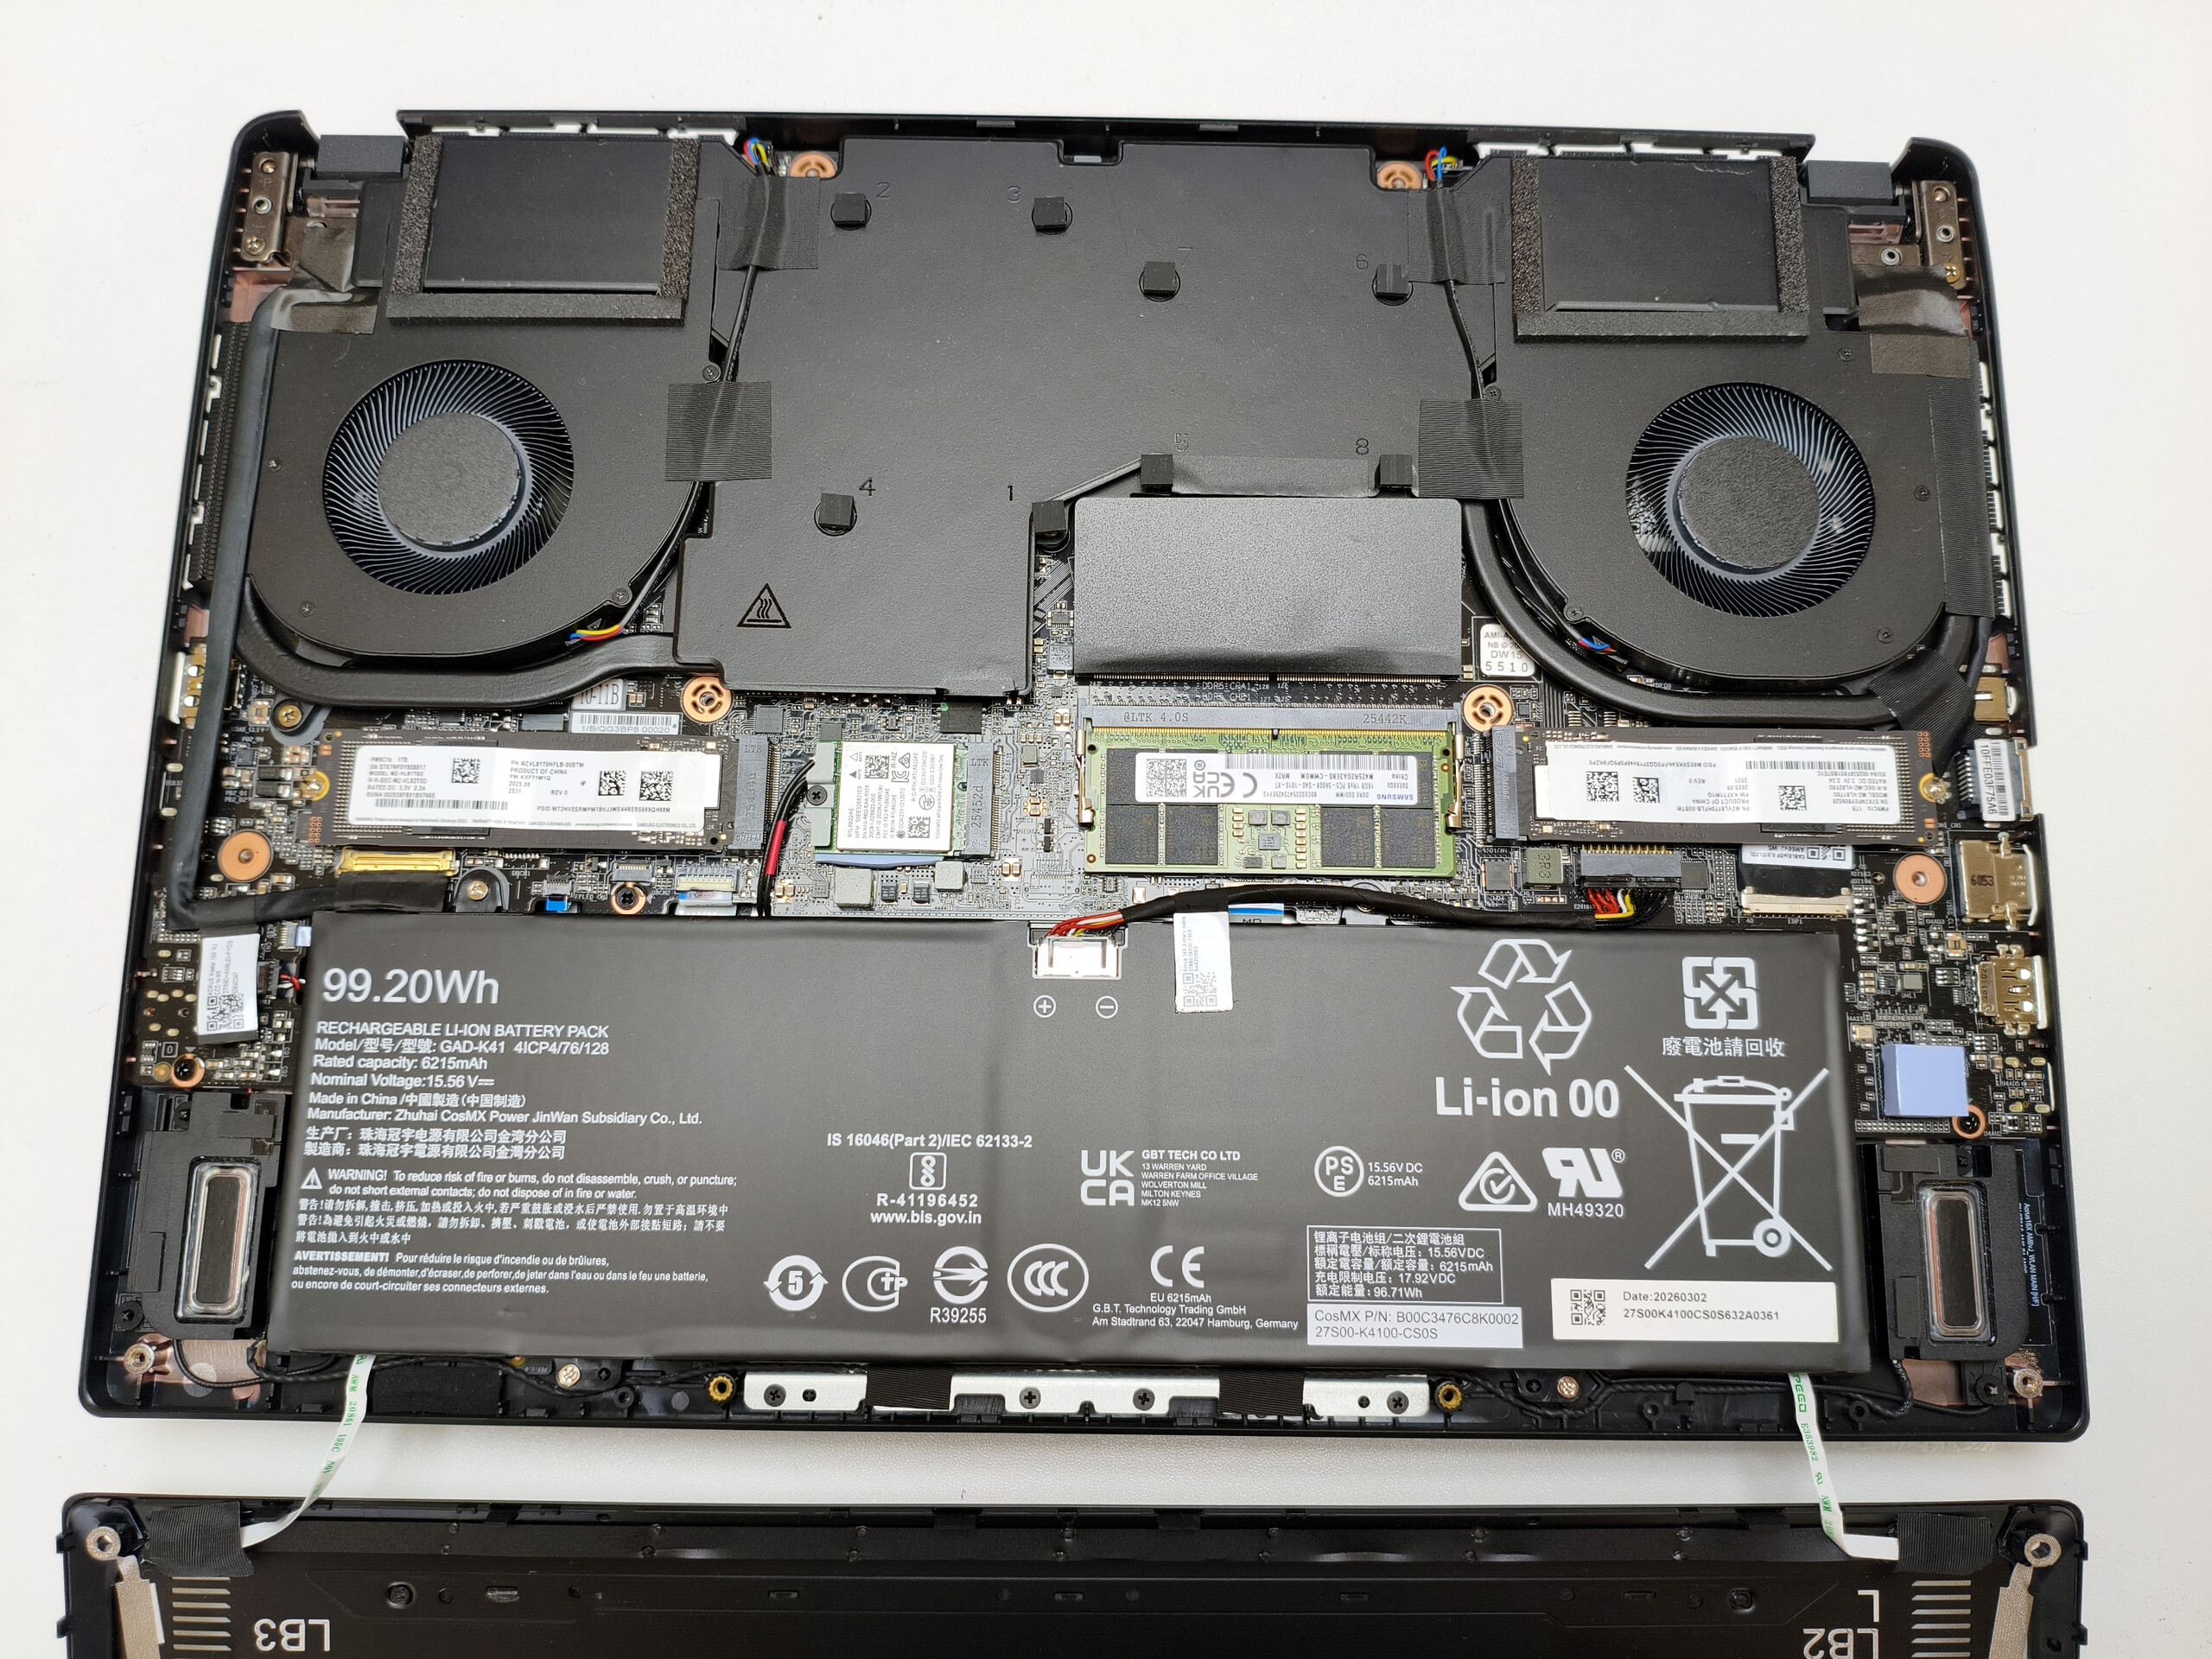
Opening the chassis requires removing 10 Torx screws. Be careful: The front light bar is connected by a cable to the bottom cover. Inside, the Master 16 has two SO-DIMM slots and two M.2 slots, all of which are already occupied. We would describe the gaming laptop’s input devices as relatively good, but not outstanding. The layout of the keyboard, which features three-zone RGB backlighting, takes some getting used to. The touchpad’s main strength is its generous 13.5 × 9 cm size.
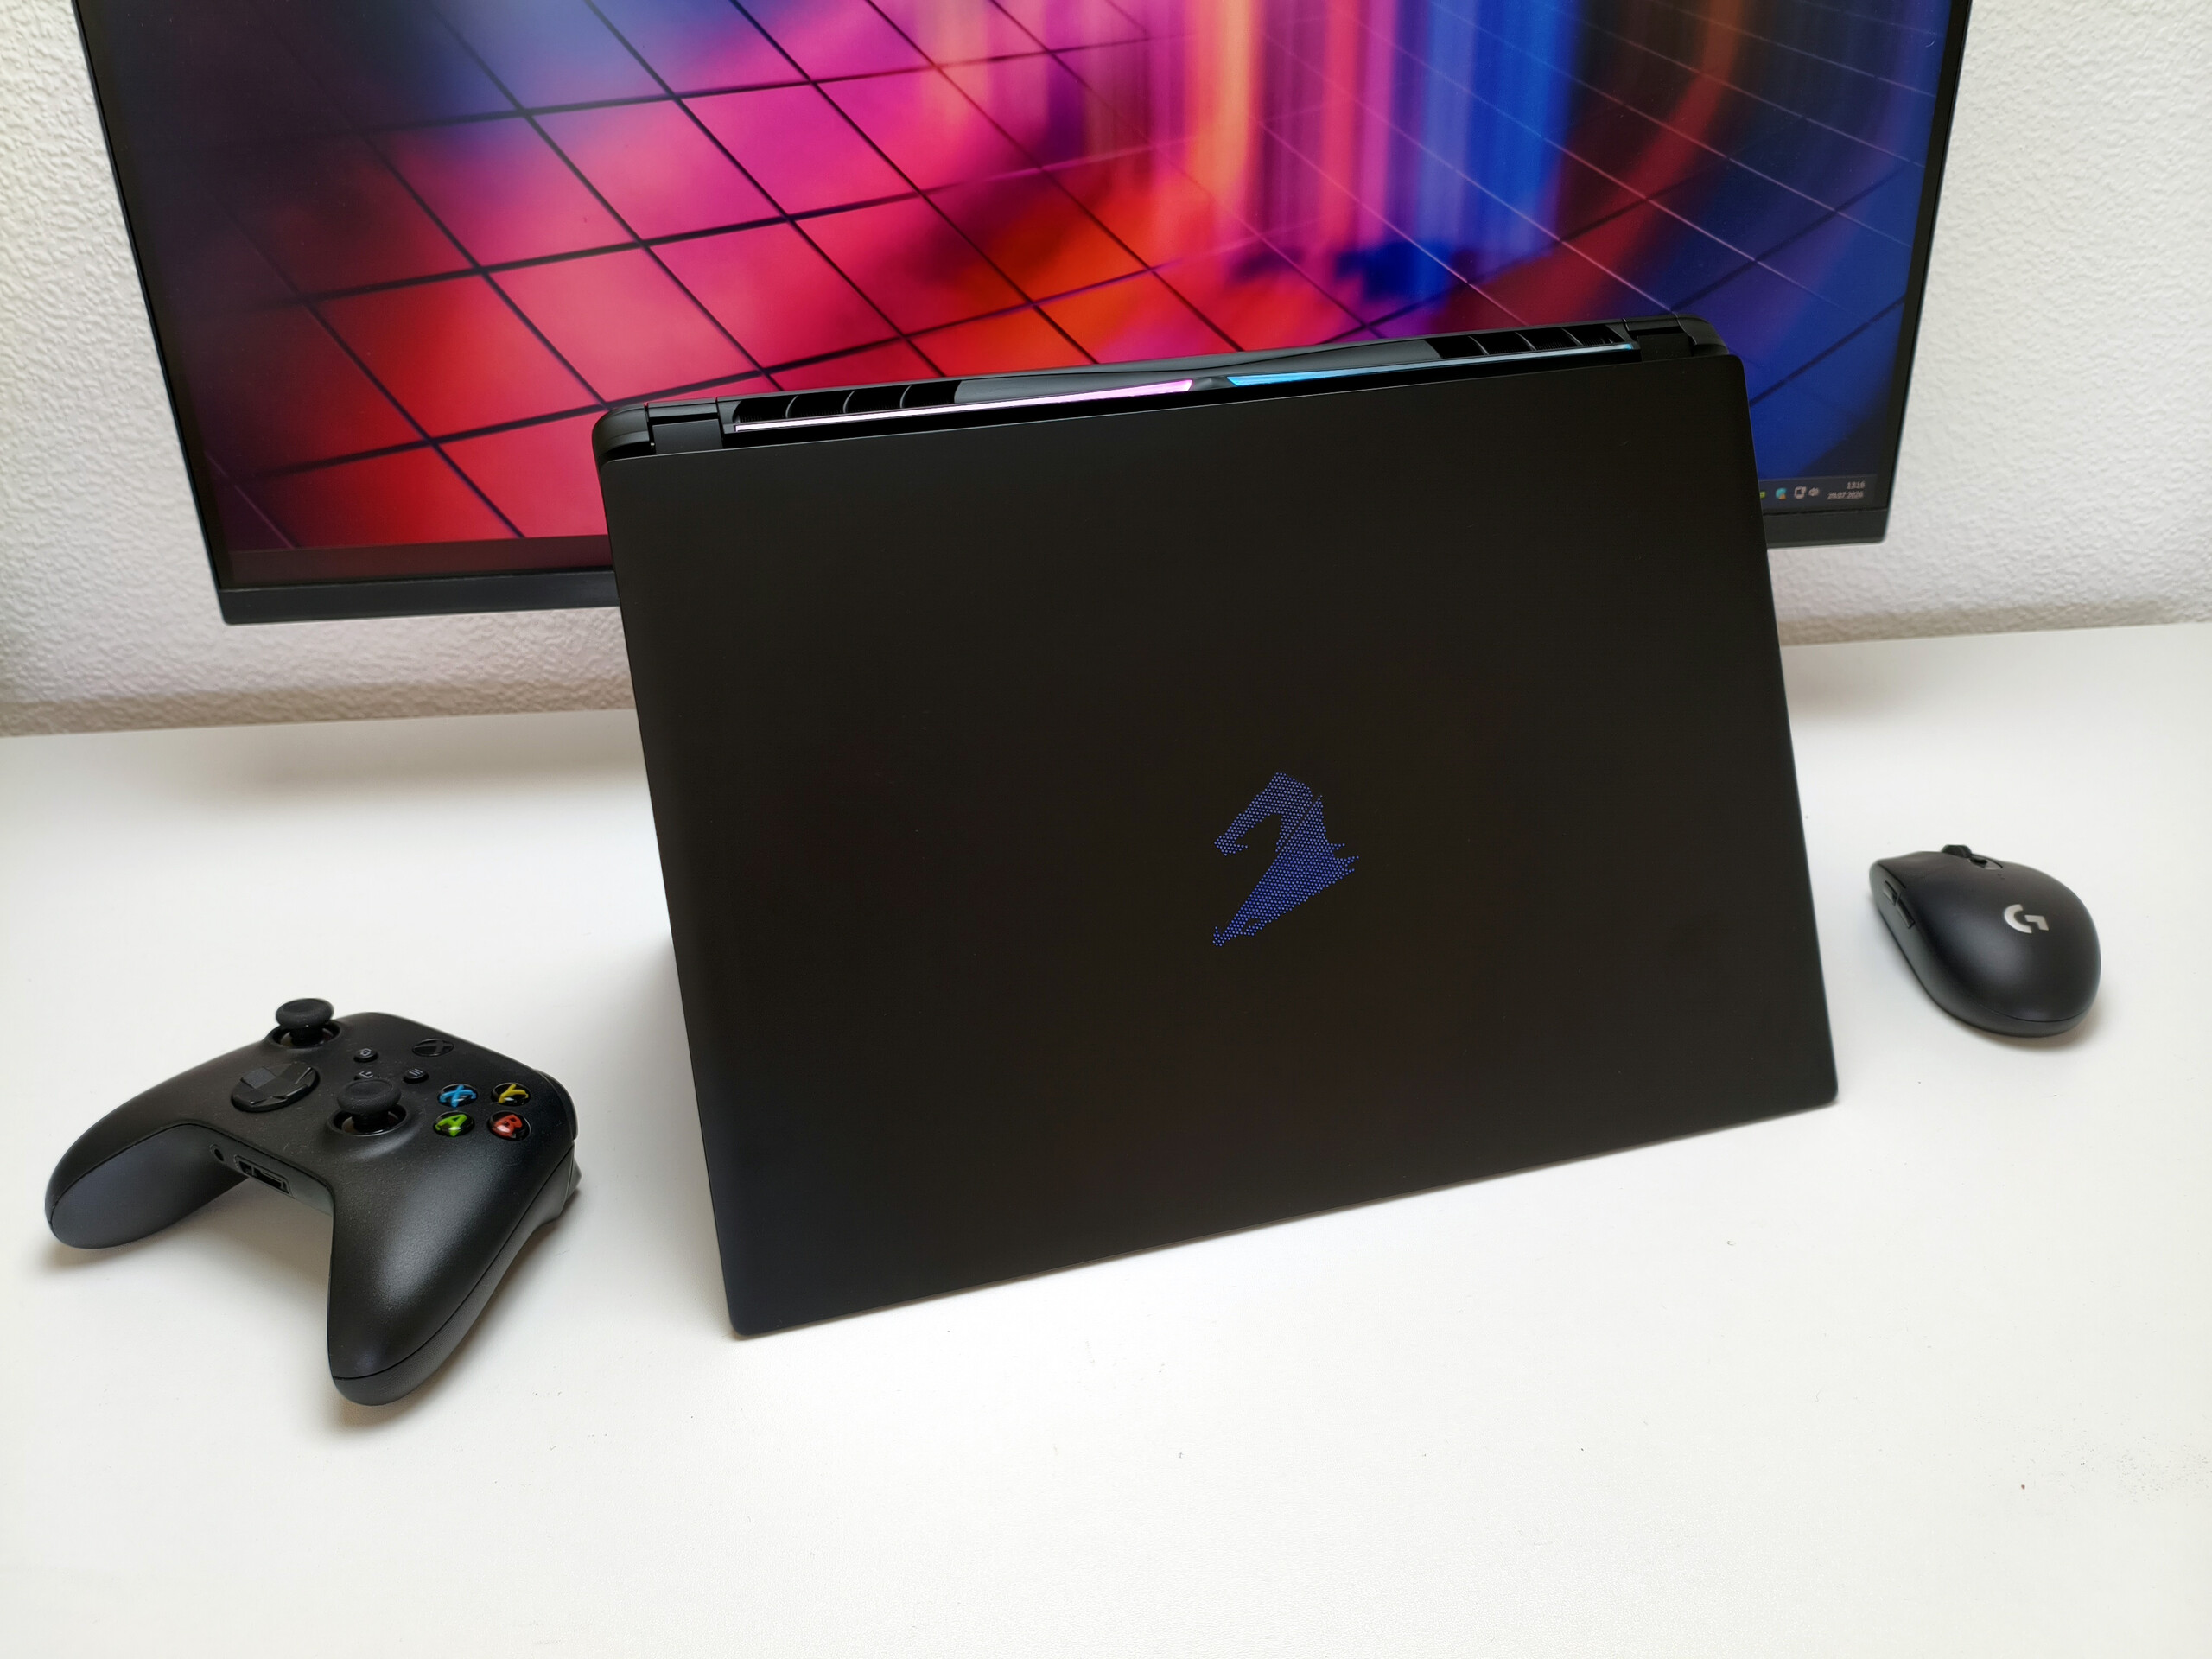
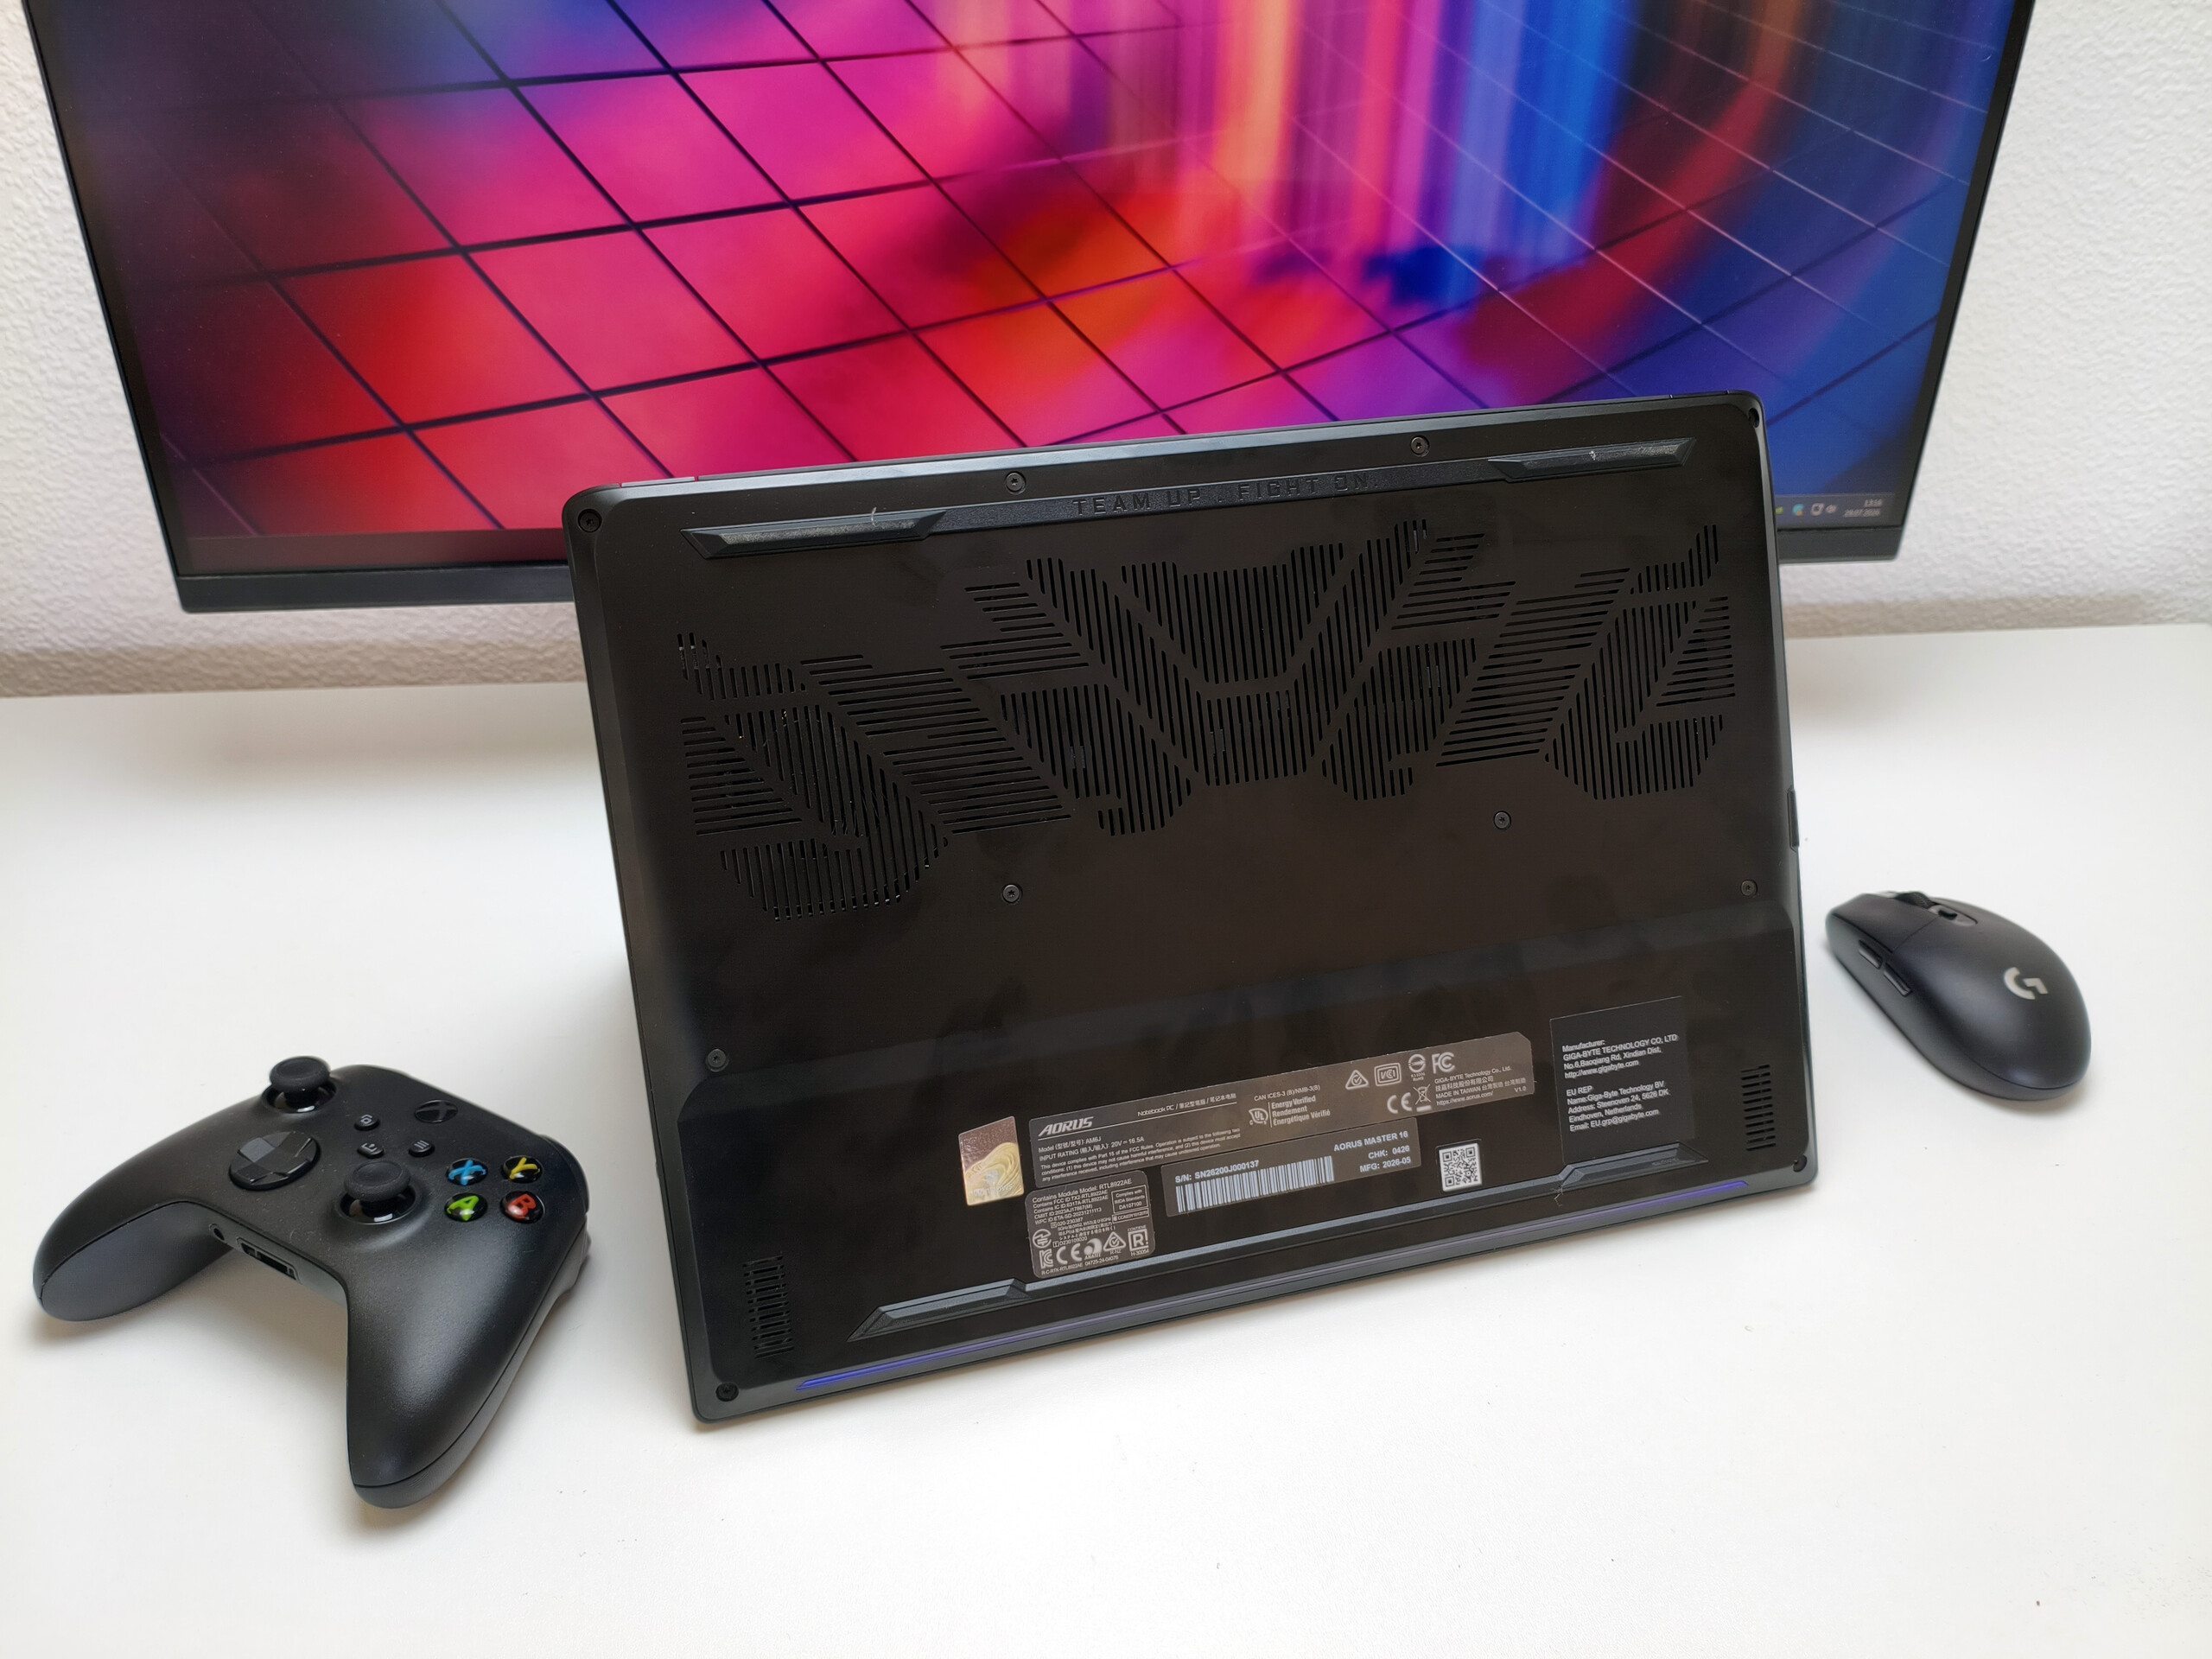
Aorus Master 16
Aorus Master 16
Aorus Master 16
Aorus Master 16
Aorus Master 16
Aorus Master 16

Size comparison

365 mm / 14.4 in 290 mm / 11.4 in 28.5 mm / 1.122 in 3.3 kg7.27 lbs364.38 mm / 14.3 in 275.94 mm / 10.9 in 26.65 mm / 1.049 in 2.6 kg5.83 lbs357 mm / 14.1 in 254 mm / 10 in 29.9 mm / 1.177 in 2.5 kg5.5 lbs354 mm / 13.9 in 268 mm / 10.6 in 30.8 mm / 1.213 in 2.6 kg5.75 lbs356.7 mm / 14 in 259.9 mm / 10.2 in 27.9 mm / 1.098 in 2.9 kg6.29 lbs357 mm / 14.1 in 255 mm / 10 in 24.5 mm / 0.965 in 2.3 kg5.07 lbs297 mm / 11.7 in 210 mm / 8.27 in 1 mm / 0.03937 in 5.7 g0.01257 lbs
Networking
iperf3 transmit Wi-Fi6/7 RT-BE96U
Average of class Gaming
  (718 - 4473, n=7, last 2 years)
2139 MBit/s +198%
Asus TUF Gaming A18 FA808UM
MediaTek Wi-Fi 6E MT7922 160MHz Wireless LAN Card
1864 (1447min - 2033max) MBit/s +160%
Average Realtek 8922AE WiFi 7 PCI-E NIC
  (718 - 1772, n=2)
1245 MBit/s +73%
Aorus Master 16 AM6J
Realtek 8922AE WiFi 7 PCI-E NIC
718 (672min - 755max) MBit/s
iperf3 receive Wi-Fi6/7 RT-BE96U
Average of class Gaming
  (788 - 3208, n=7, last 2 years)
2019 MBit/s +23%
Asus TUF Gaming A18 FA808UM
MediaTek Wi-Fi 6E MT7922 160MHz Wireless LAN Card
1910 (1891min - 1930max) MBit/s +16%
Average Realtek 8922AE WiFi 7 PCI-E NIC
  (1642 - 1791, n=2)
1717 MBit/s +5%
Aorus Master 16 AM6J
Realtek 8922AE WiFi 7 PCI-E NIC
1642 (1406min - 1855max) MBit/s
010020030040050060070080090010001100120013001400150016001700180019002000Tooltip
Aorus Master 16 AM6J Realtek 8922AE WiFi 7 PCI-E NIC; iperf3 transmit Wi-Fi6/7 RT-BE96U; iperf 3.21: Ø719 (672-755) MBit/s
Asus TUF Gaming A18 FA808UM MediaTek Wi-Fi 6E MT7922 160MHz Wireless LAN Card; iperf3 transmit Wi-Fi6/7 RT-BE96U; iperf 3.21: Ø1864 (1447-2033) MBit/s
Aorus Master 16 AM6J Realtek 8922AE WiFi 7 PCI-E NIC; iperf3 receive Wi-Fi6/7 RT-BE96U; iperf 3.21: Ø1643 (1406-1855) MBit/s
Asus TUF Gaming A18 FA808UM MediaTek Wi-Fi 6E MT7922 160MHz Wireless LAN Card; iperf3 receive Wi-Fi6/7 RT-BE96U; iperf 3.21: Ø1910 (1891-1930) MBit/s
ColorChecker
11.8 ∆E
12.8 ∆E
15.6 ∆E
15.4 ∆E
11.6 ∆E
11.1 ∆E
10.8 ∆E
17.7 ∆E
12.3 ∆E
8.9 ∆E
11.4 ∆E
8.5 ∆E
8.5 ∆E
15.9 ∆E
11.1 ∆E
8.4 ∆E
10.3 ∆E
17.7 ∆E
2.7 ∆E
11.8 ∆E
12.6 ∆E
13.5 ∆E
10.5 ∆E
8.9 ∆E
ColorChecker Aorus Master 16 AM6J: 11.66 ∆E min: 2.75 - max: 17.74 ∆E

Display

As with the previously reviewed sibling model featuring a Core Ultra 9 275HX and GeForce RTX 5090, Gigabyte equips this version with a 16:10 OLED display. The panel has a resolution of 2,560 × 1,600 pixels and supports HDR. Despite its good average brightness of 467 cd/m², its highly reflective surface makes it poorly suited for outdoor use.

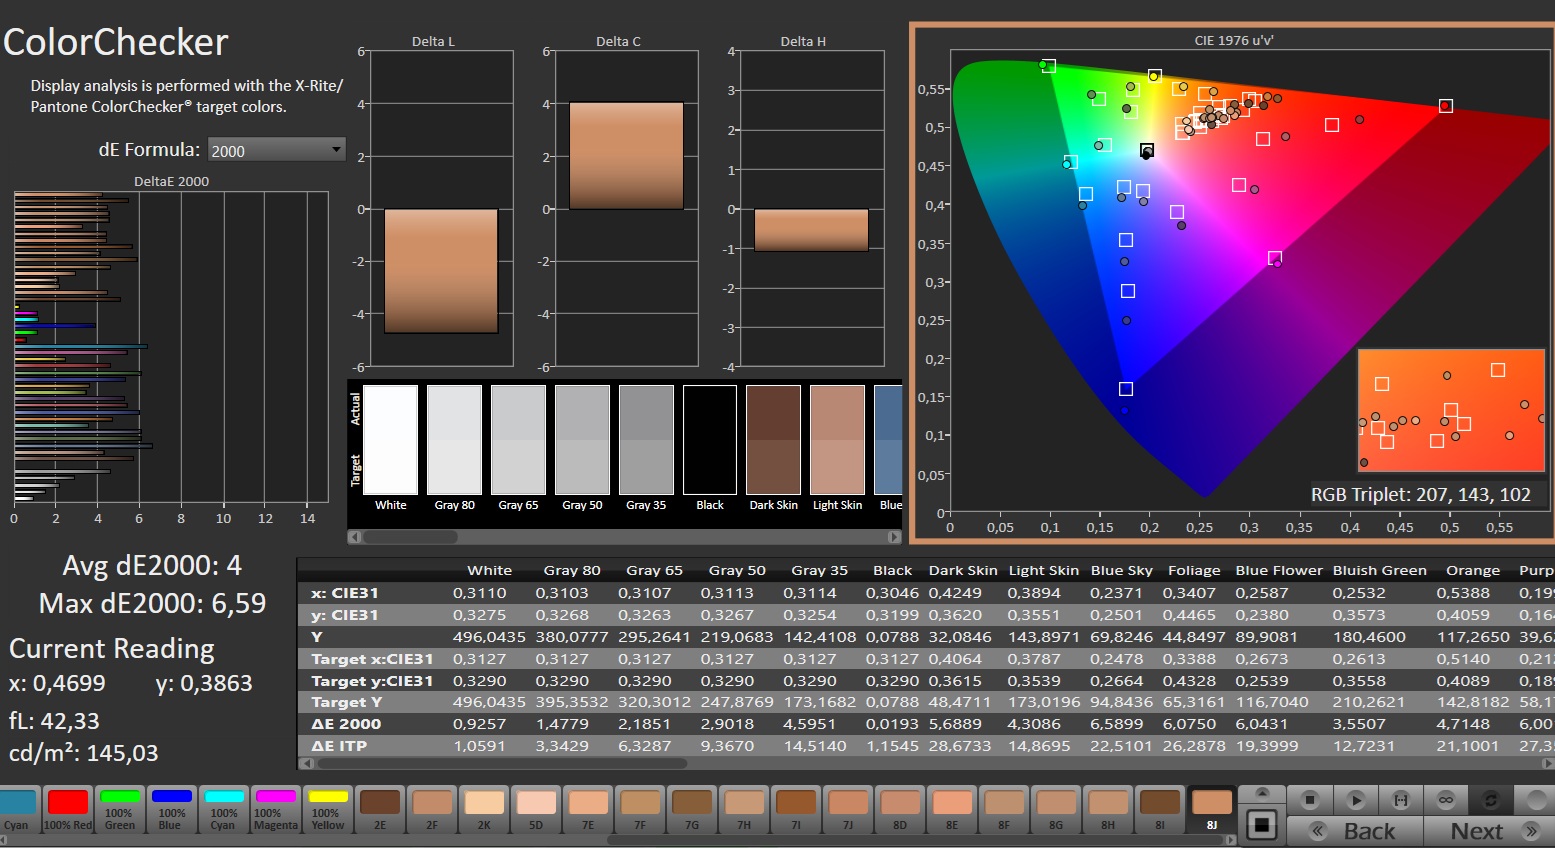
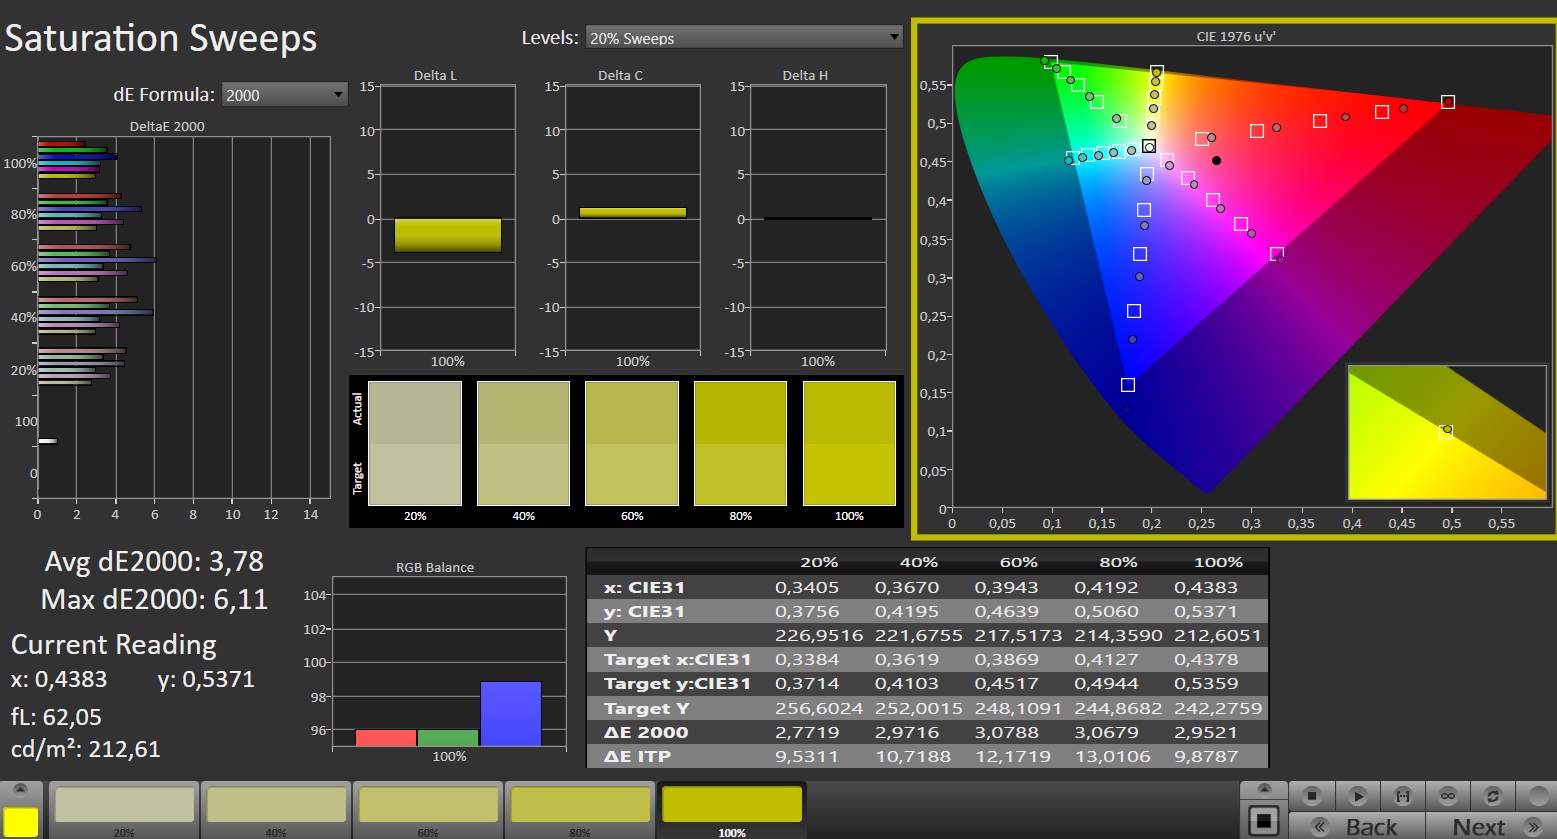
Thanks in no small part to its factory calibration, the display offers reasonably accurate colors, although there is still room for improvement. Other highlights include fast response times and an excellent black level. However, the screen also exhibits typical OLED weaknesses, such as flickering.
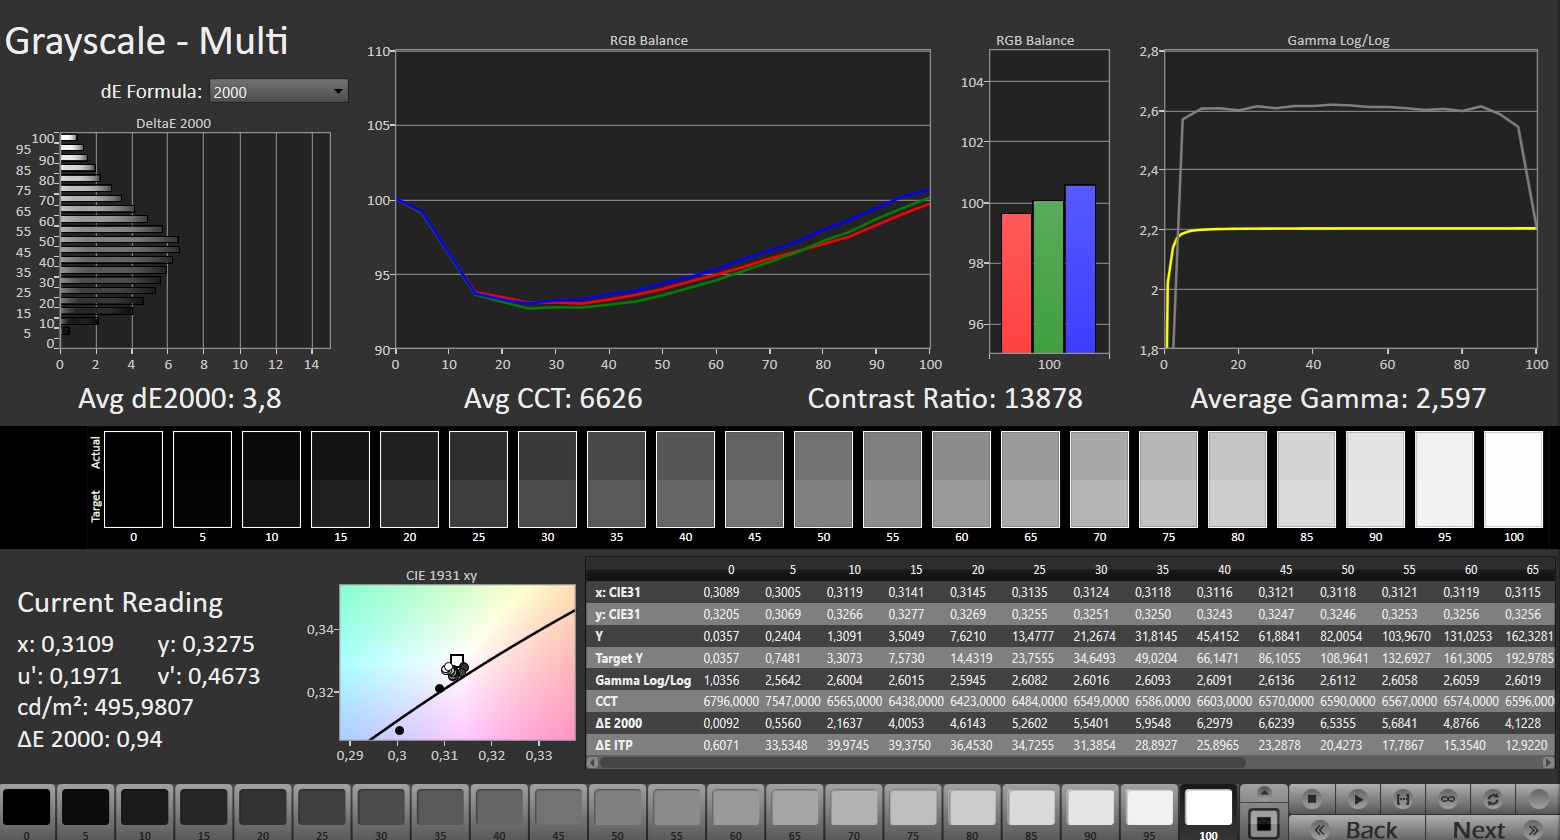
Calman: Grayscale
Calman: Grayscale
Calman: Color Saturation
Calman: ColorChecker
Aorus Master 16 vs. sRGB
Aorus Master 16 vs. AdobeRGB
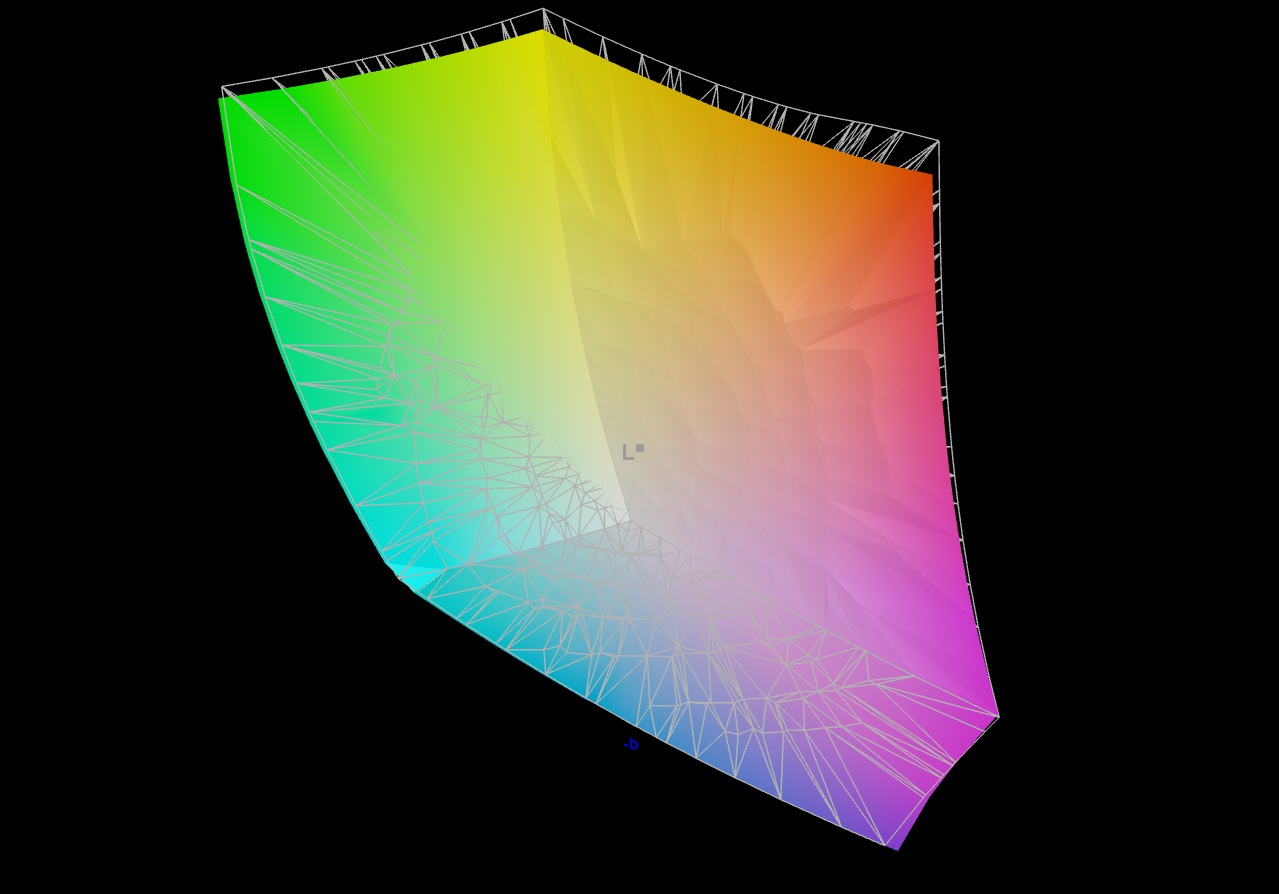
Aorus Master 16 vs. DCI-P3
475
cd/m²
475
cd/m²
471
cd/m²
468
cd/m²
468
cd/m²
470
cd/m²
456
cd/m²
457
cd/m²
467
cd/m²
Distribution of brightness
Samsung ATNA60HU02-0 tested with X-Rite i1Pro 3
Maximum: 475 cd/m² (Nits) Average: 467.4 cd/m² Minimum: 4 cd/m²
Brightness Distribution: 96 %
Center on Battery: 468 cd/m²
Contrast: 15600:1 (Black: 0.03 cd/m²)
ΔE ColorChecker Calman: 4 | ∀{0.5-29.43 Ø4.71}
ΔE Greyscale Calman: 3.8 | ∀{0.09-98 Ø4.96}
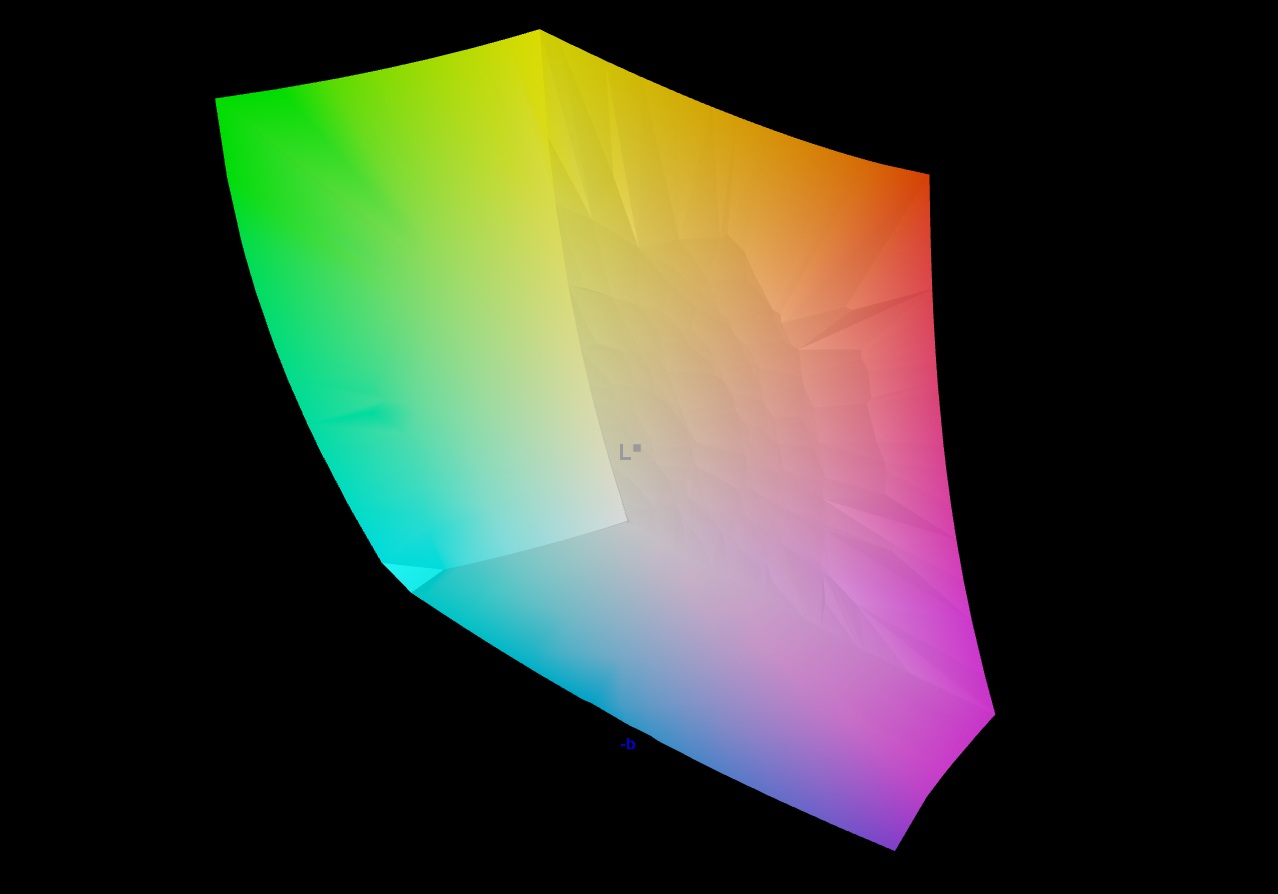
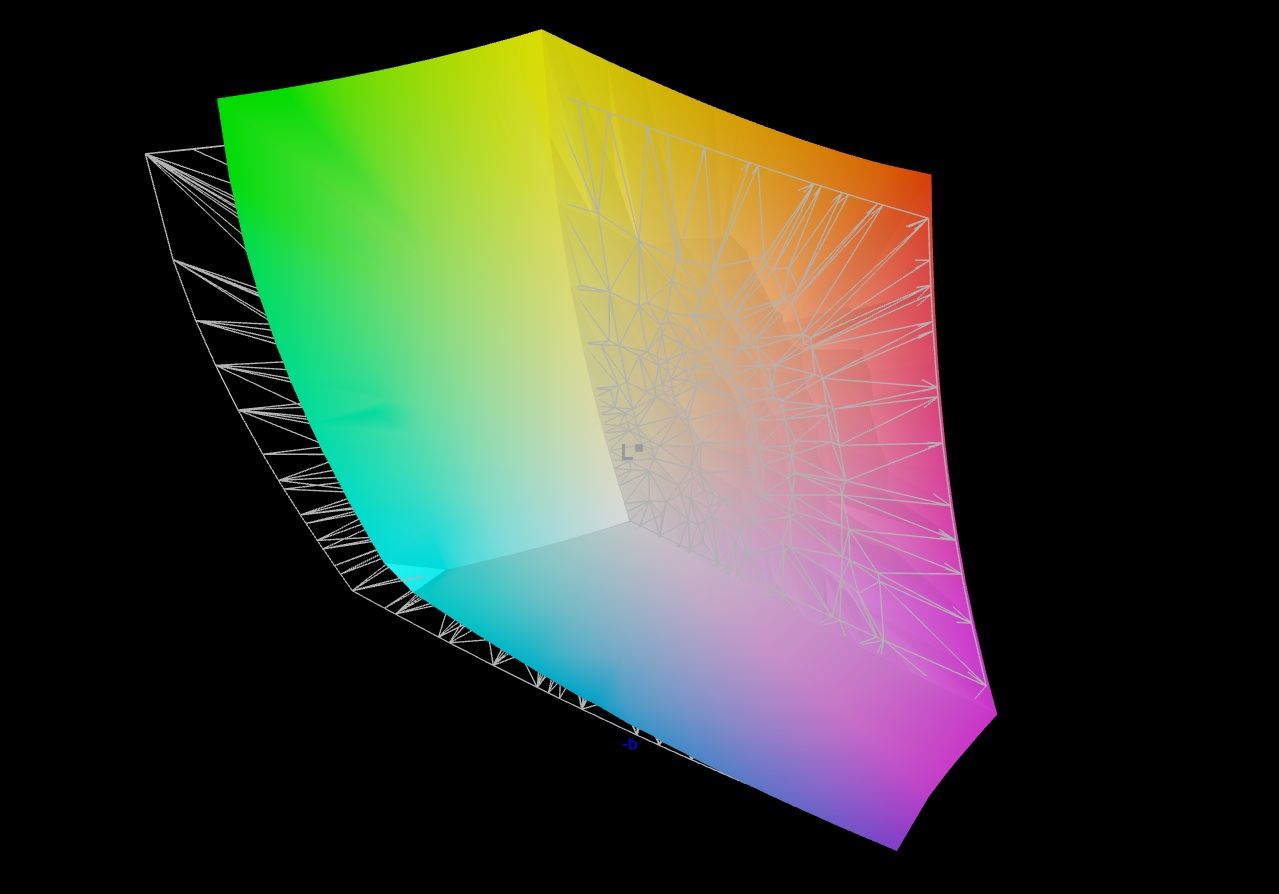
88.2% AdobeRGB 1998 (Argyll 3D)
100% sRGB (Argyll 3D)
95.9% Display P3 (Argyll 3D)
Gamma: 2.597
CCT: 6626 K
Aorus Master 16 AM6J
Samsung ATNA60HU02-0, OLED, 2560x1600, 16", 240 Hz
Alienware 16 Area-51
AU Optronics B160QAN, IPS, 2560x1600, 16", 240 Hz
Asus ROG Strix G16 G615
NE160QDM-NZC, IPS, 2560x1600, 16", 240 Hz
Lenovo Legion Pro 7i 16 Gen 10
Samsung ATNA60HU01-0, OLED, 2560x1600, 16", 240 Hz
Aorus MASTER 16 AM6H
ATNA60DL03-0 (SDC41AB), OLED, 2560x1600, 16", 240 Hz
Schenker XMG Neo 16 A25 5090
NE160QDM-NM9, Mini-LED, 2560x1600, 16", 300 Hz
Display
0%
1%
4%
2%
1%
Display P3 Coverage (%)
95.9
96
0%
99.1
3%
99.5
4%
95.3
-1%
99.9
4%
sRGB Coverage (%)
100
100
0%
99.9
0%
100
0%
98.8
-1%
100
0%
AdobeRGB 1998 Coverage (%)
88.2
89.2
1%
89.1
1%
94.4
7%
94.1
7%
88.5
0%
Response Times
-2295%
-2001%
-19%
-31%
-3630%
Response Time Grey 50% / Grey 80% * (ms)
0.371 ?(0.289, 0.082)
4.8 ?(2, 2.8)
-1194%
4.6 ?(2.1, 2.5)
-1140%
0.28 ?(0.14, 0.14)
25%
0.24 ?(0.12, 0.12)
35%
17.4 ?(8.4, 9)
-4590%
Response Time Black / White * (ms)
0.206 ?(0.112, 0.094)
7.2 ?(3.8, 3.4)
-3395%
6.1 ?(1.6, 4.5)
-2861%
0.43 ?(0.22, 0.21)
-109%
0.43 ?(0.18, 0.25)
-109%
13 ?(4.6, 8.4)
-6211%
PWM Frequency (Hz)
1158 ?(99)
1438 ?(100)
960
20253
PWM Amplitude * (%)
40
29
27%
47
-18%
75
-88%
Screen
-215%
-150%
19%
-20%
34%
Brightness middle (cd/m²)
468
554
18%
545
16%
490.4
5%
435
-7%
888
90%
Brightness (cd/m²)
467
532
14%
536
15%
498
7%
437
-6%
859
84%
Brightness Distribution (%)
96
88
-8%
89
-7%
97
1%
96
0%
94
-2%
Black Level * (cd/m²)
0.03
0.52
-1633%
0.41
-1267%
0.08
-167%
Contrast (:1)
15600
1065
-93%
1329
-91%
5438
-65%
Colorchecker dE 2000 *
4
2.81
30%
1.6
60%
3.2
20%
2.42
39%
3.3
17%
Colorchecker dE 2000 max. *
6.59
8.32
-26%
4
39%
6.04
8%
4.81
27%
5.5
17%
Greyscale dE 2000 *
3.8
4.7
-24%
2.4
37%
1
74%
3.11
18%
3.8
-0%
Gamma
2.597 85%
2.3 96%
2.25 98%
2.24 98%
2.48 89%
2.46 89%
CCT
6626 98%
6476 100%
6737 96%
6373 102%
6270 104%
6267 104%
Colorchecker dE 2000 calibrated *
0.65
0.8
0.84
2.03
1.5
Total Average (Program / Settings)
-837% / -485%
-717% / -400%
1% / 6%
-16% / -18%
-1198% / -890%

* ... smaller is better

Display Response Times

Display response times show how fast the screen is able to change from one color to the next. Slow response times can lead to afterimages and can cause moving objects to appear blurry (ghosting). Gamers of fast-paced 3D titles should pay special attention to fast response times.
       Response Time Black to White
0.206 ms ... rise ↗ and fall ↘ combined↗ 0.112 ms rise
↘ 0.094 ms fall
The screen shows very fast response rates in our tests and should be very well suited for fast-paced gaming.
In comparison, all tested devices range from 0.1 (minimum) to 240 (maximum) ms. » 0 % of all devices are better.
This means that the measured response time is better than the average of all tested devices (19.8 ms).
       Response Time 50% Grey to 80% Grey
0.371 ms ... rise ↗ and fall ↘ combined↗ 0.289 ms rise
↘ 0.082 ms fall
The screen shows very fast response rates in our tests and should be very well suited for fast-paced gaming.
In comparison, all tested devices range from 0.165 (minimum) to 636 (maximum) ms. » 1 % of all devices are better.
This means that the measured response time is better than the average of all tested devices (30.9 ms).

Screen Flickering / PWM (Pulse-Width Modulation)

To dim the screen, some notebooks will simply cycle the backlight on and off in rapid succession - a method called Pulse Width Modulation (PWM) . This cycling frequency should ideally be undetectable to the human eye. If said frequency is too low, users with sensitive eyes may experience strain or headaches or even notice the flickering altogether.
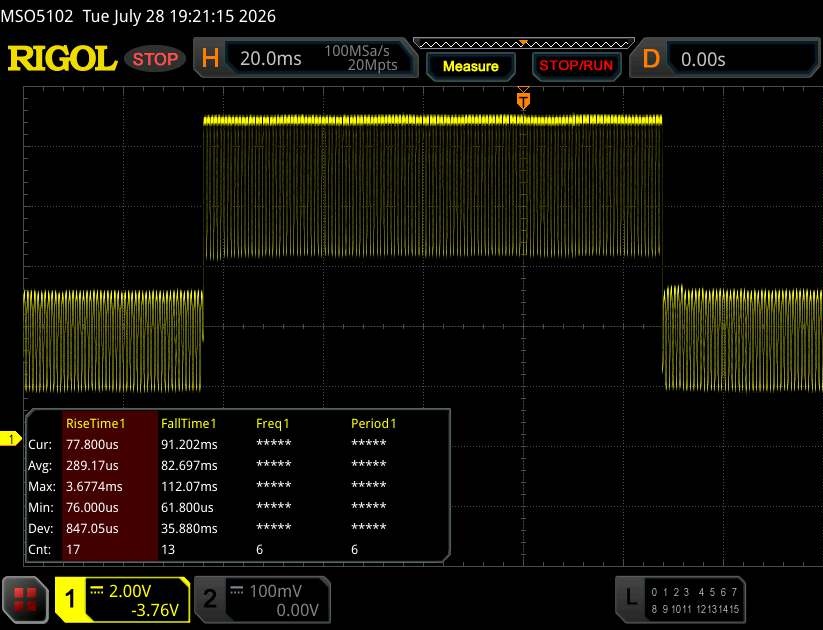
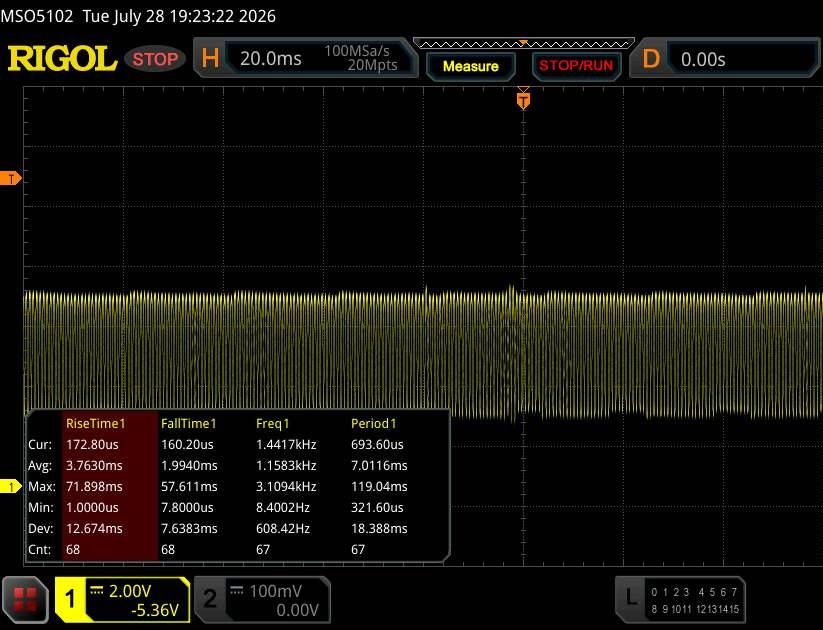
Screen flickering / PWM detected 1158 Hz
Amplitude: 40 %
≤ 99 % brightness setting

The display backlight flickers at 1158 Hz (worst case, e.g., utilizing PWM) Flickering detected at a brightness setting of 99 % and below. There should be no flickering or PWM above this brightness setting.

The frequency of 1158 Hz is quite high, so most users sensitive to PWM should not notice any flickering.

In comparison: 52 % of all tested devices do not use PWM to dim the display. If PWM was detected, an average of 7738 (minimum: 5 - maximum: 343500) Hz was measured.

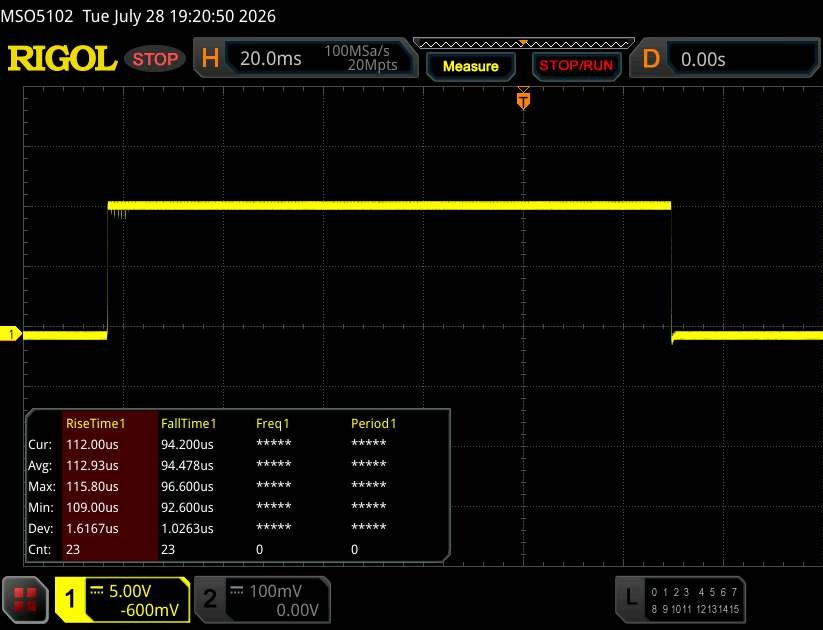
100% brightness
100% brightness
50% brightness
50% brightness
0% brightness
0% brightness

Performance

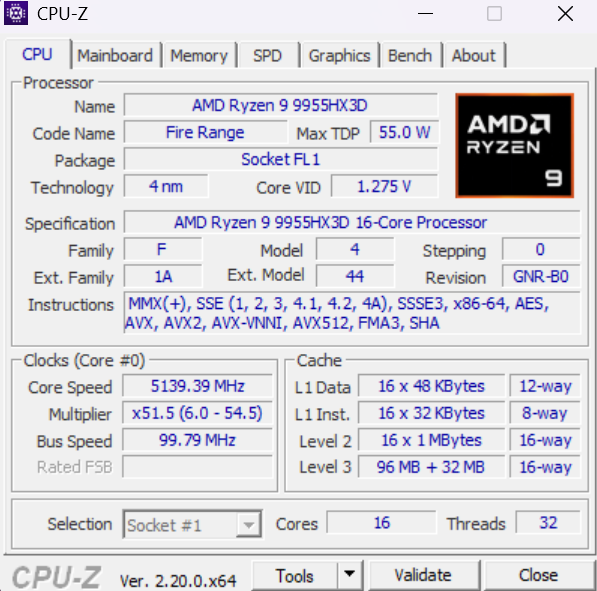
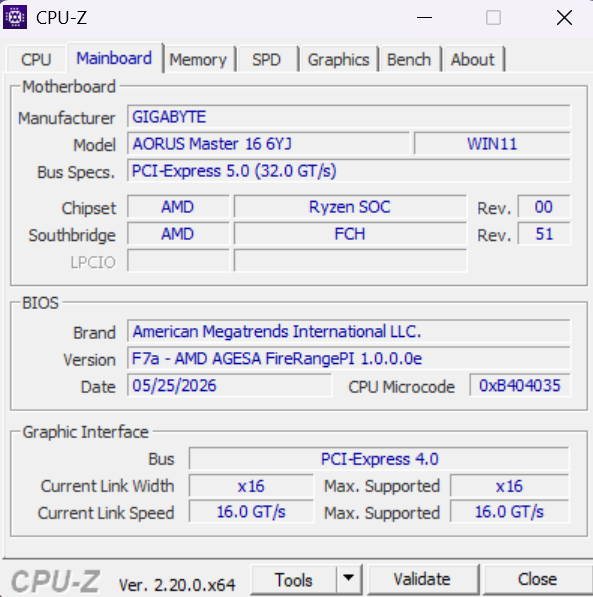
The test configuration clearly belongs in the high-end category. The Zen 5-based AMD processor, in particular, is a real powerhouse.
CPU-Z
CPU-Z
CPU-Z
CPU-Z
GPU-Z
HWiNFO

Test Conditions

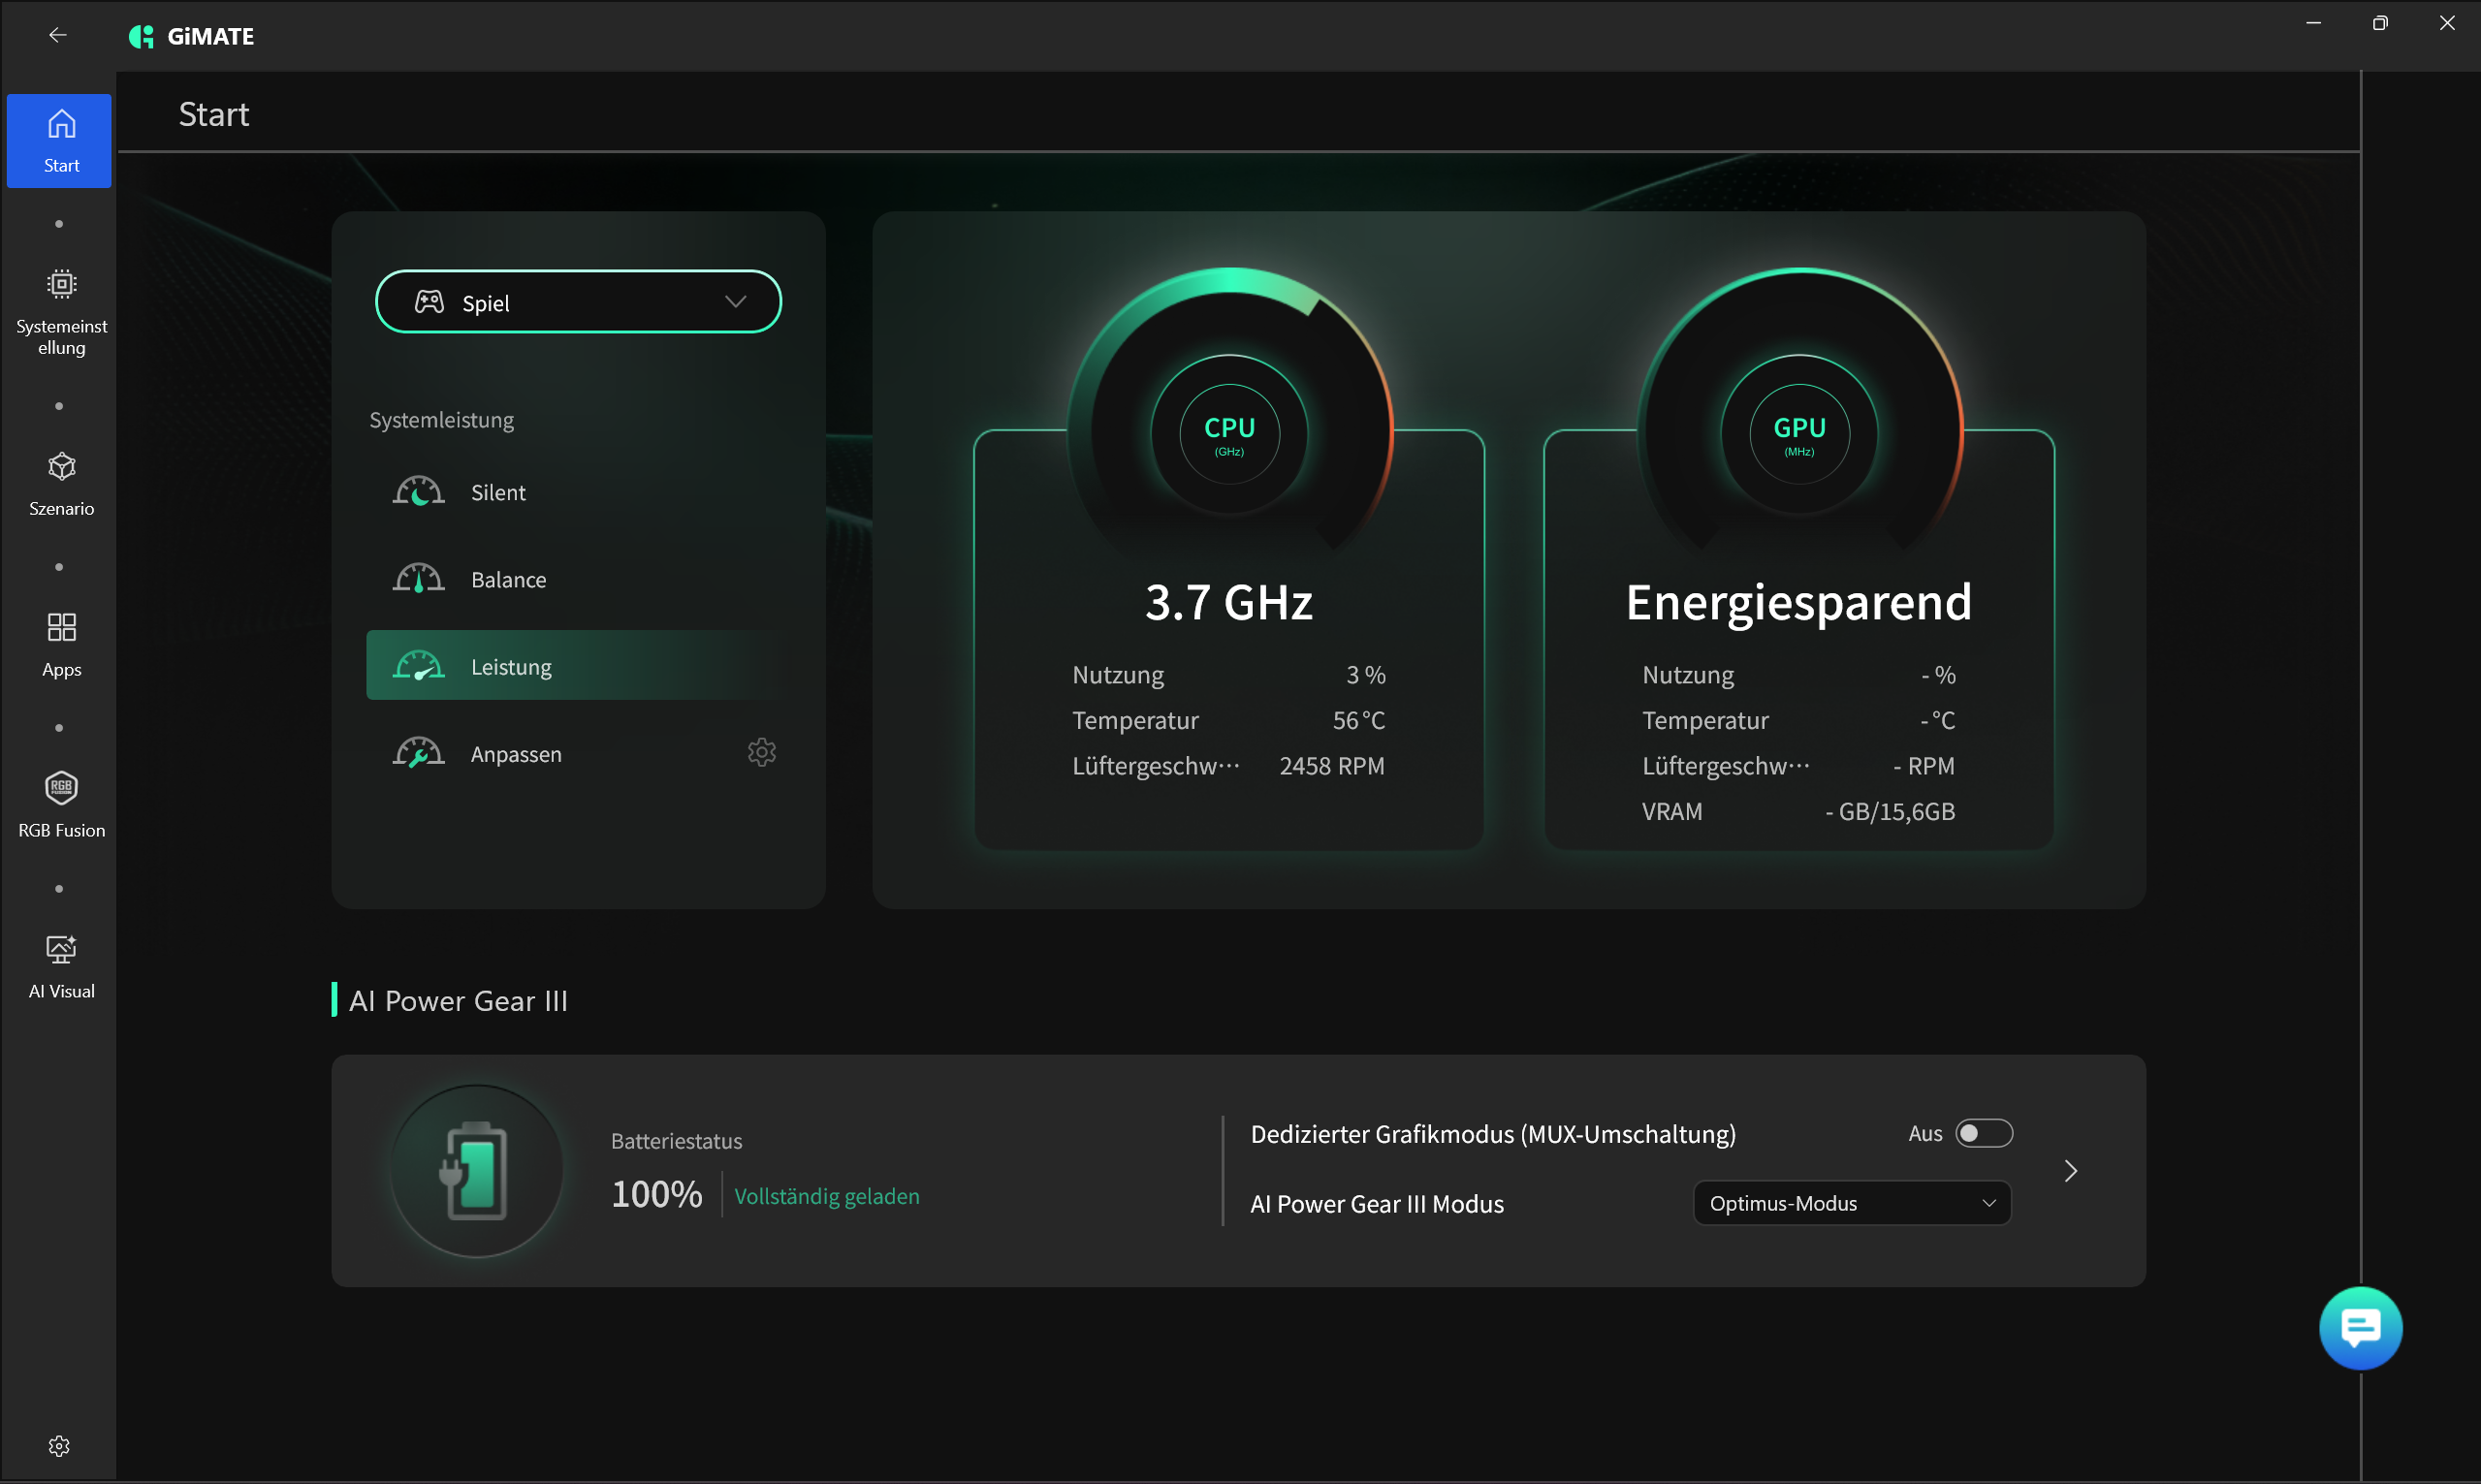
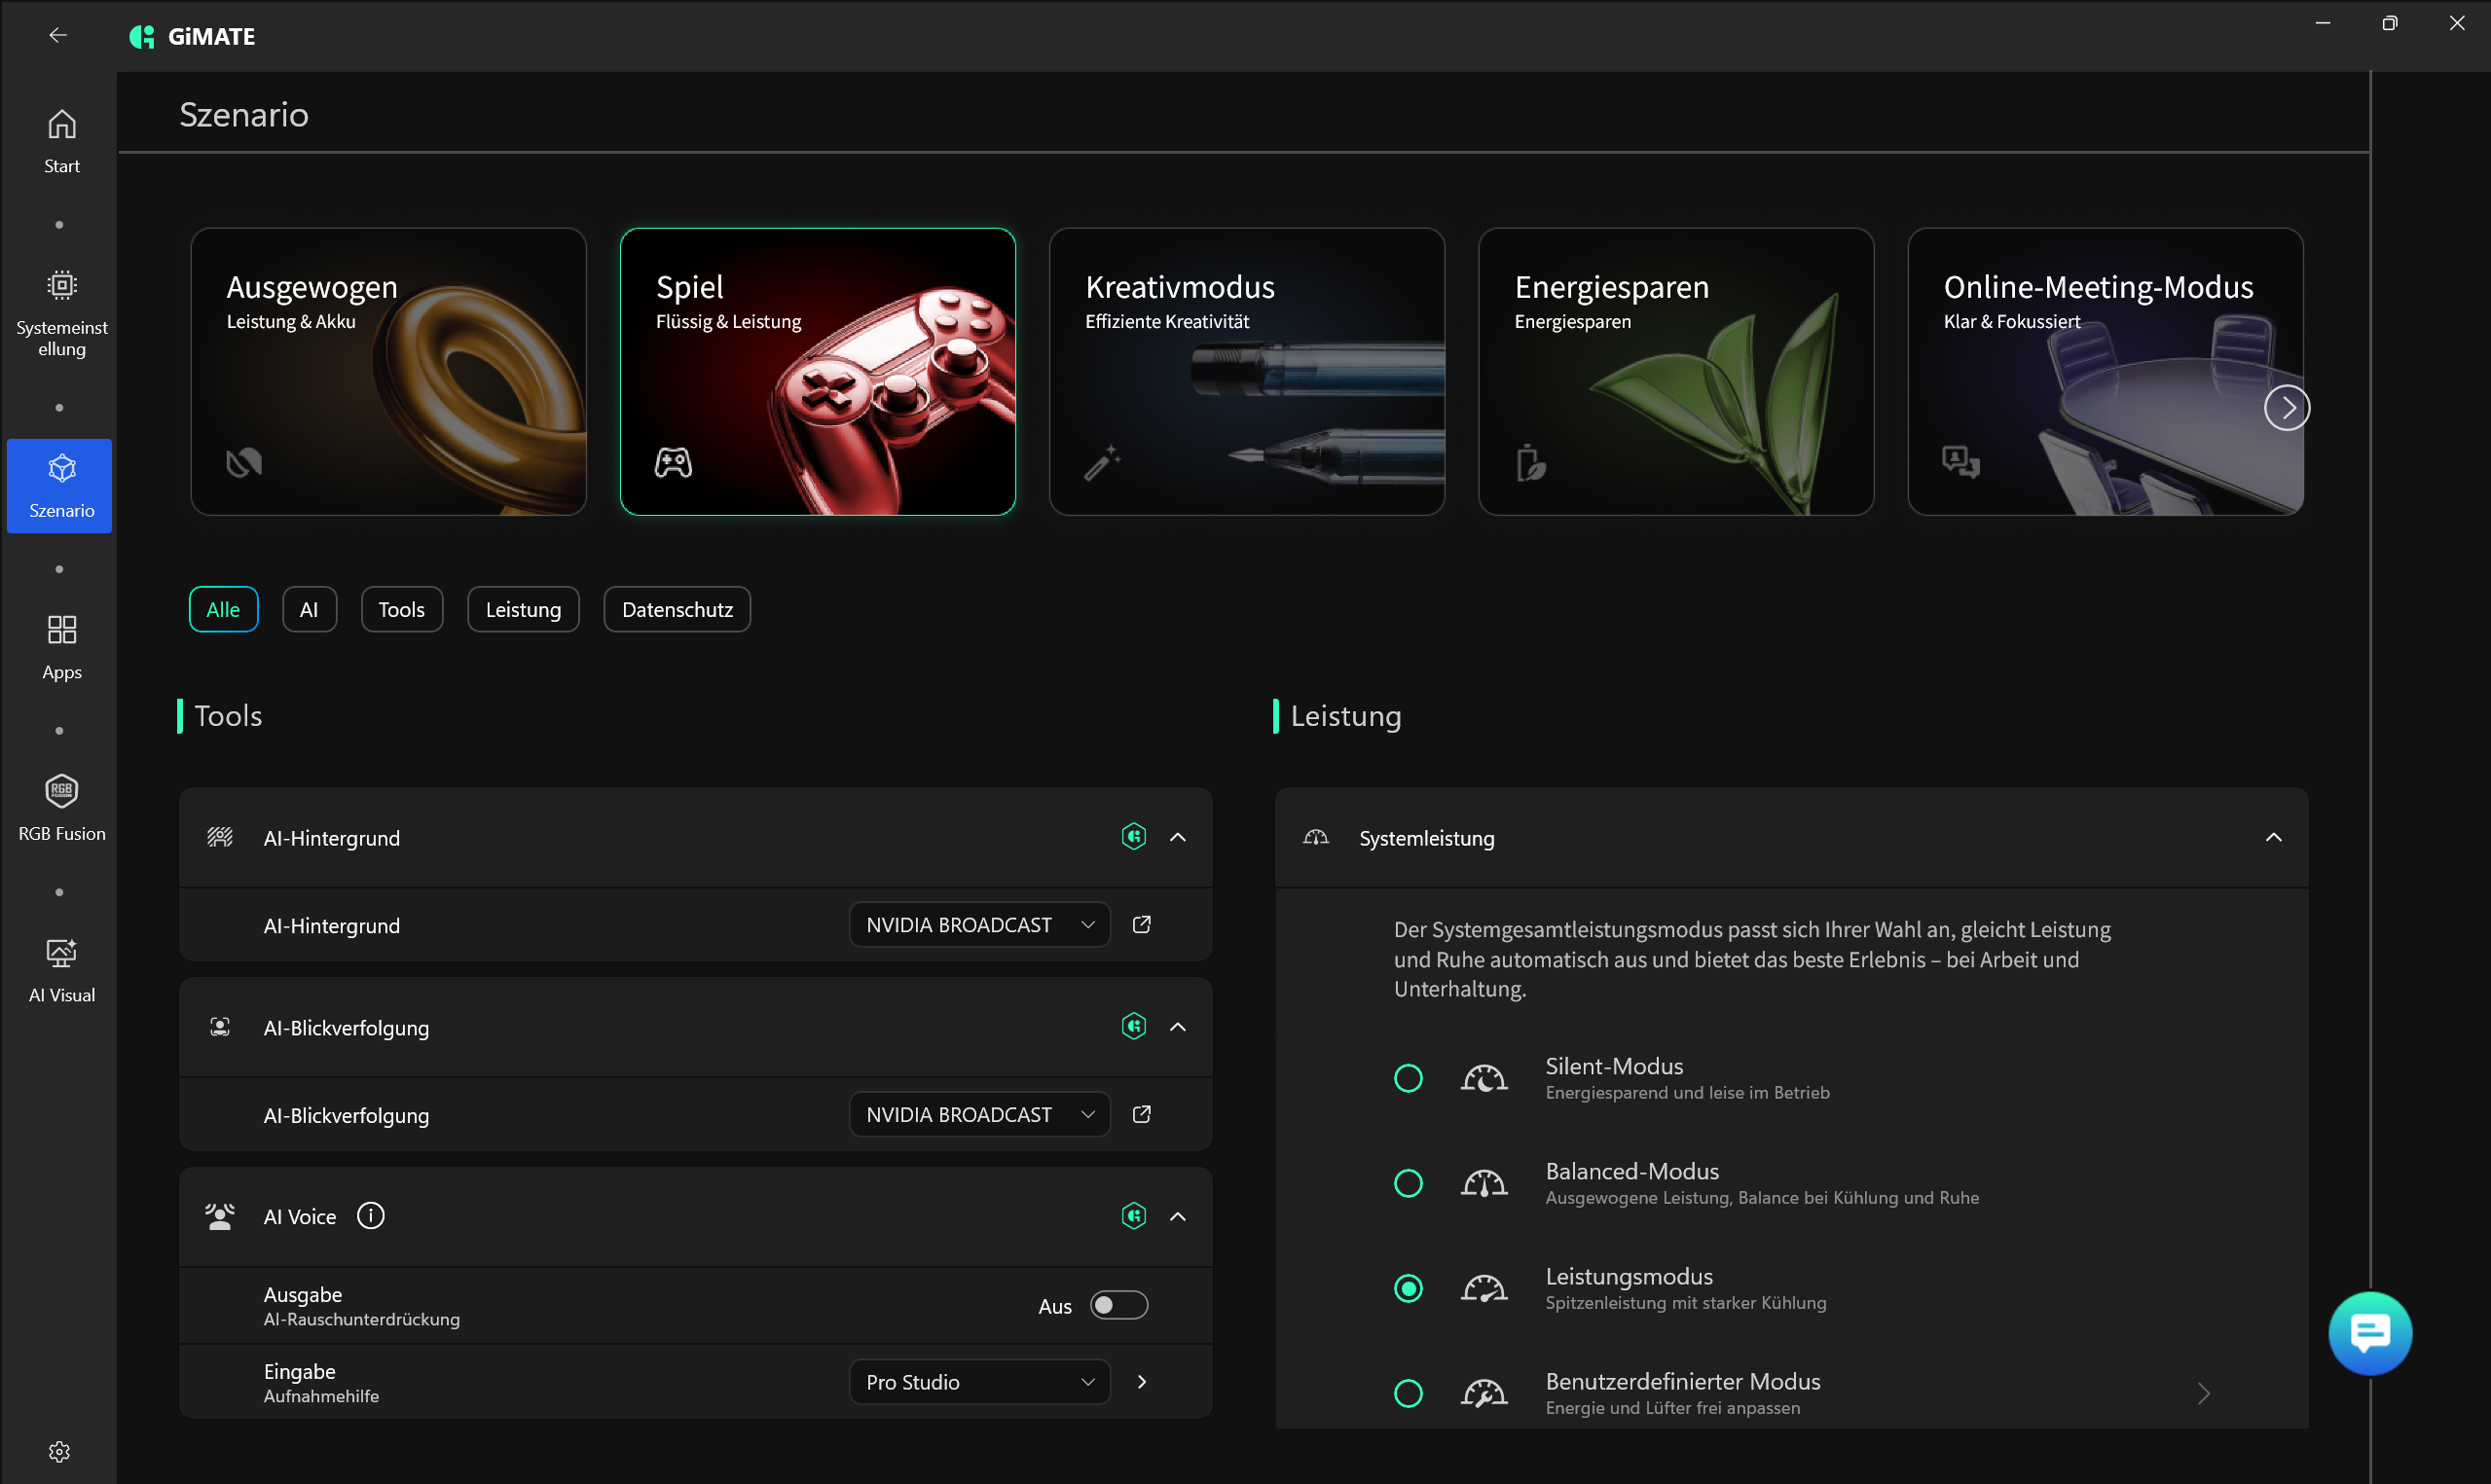
The preinstalled GiMATE utility offers several performance profiles, and we used Game mode for our measurements. For everyday use, however, we recommend using no more than Balanced mode because of the extremely high noise levels. This profile keeps the system noticeably quieter (see table).
GiMATE
GiMATE
Mode Energy Saving Balanced Gaming
Cyberpunk 2077 noise level 41 dB(A) 51 dB(A) 59 dB(A)
Cyberpunk 2077 frame rate (FHD/Ultra) 111.6 fps 135.4 fps 144.5 fps
GPU power draw 100 W 150 W 165 W
CPU PL1 65 W 90 W 145 W
CPU PL2 140 W 140 W 145 W
Cinebench R15 Multi score 4,972 points 5,806 points 5,893 points

Processor performance

The Ryzen 9 9955HX3D not only rivals Intel’s flagship Core Ultra 9 275HX, but even outperforms it by a few percent overall. Its 16 cores, 32 threads, and 128 MB of L3 cache speak volumes. The processor also deserves praise for its consistent sustained performance, as demonstrated by our Cinebench loop test.

Cinebench R15 Multi Endurance Test

012525037550062575087510001125125013751500162517501875200021252250237525002625275028753000312532503375350036253750387540004125425043754500462547504875500051255250537555005625575058756000Tooltip
Aorus Master 16 AM6J AMD Ryzen 9 9955HX3D: Ø5951 (5802.15-6067.96) Points
Alienware 16 Area-51 Intel Core Ultra 9 275HX: Ø4729 (4696.49-4755.68) Points
Asus ROG Strix G16 G615 Intel Core Ultra 9 275HX: Ø5851 (5702.07-5999.7) Points
Lenovo Legion Pro 7i 16 Gen 10 Intel Core Ultra 9 275HX: Ø5698 (5601.46-5746.3) Points
Aorus MASTER 16 AM6H Intel Core Ultra 9 275HX: Ø5596 (5505.09-5679.4) Points
Schenker XMG Neo 16 A25 5090 AMD Ryzen 9 9955HX3D: Ø5974 (5932.08-6044.12) Points
CPU Performance rating - Percent
Schenker XMG Neo 16 A25 5090
AMD Ryzen 9 9955HX3D
86.8 pt
Average AMD Ryzen 9 9955HX3D
 
85.4 pt
Aorus Master 16 AM6J
AMD Ryzen 9 9955HX3D
83.5 pt
Asus ROG Strix G16 G615
Intel Core Ultra 9 275HX
82.4 pt
Lenovo Legion Pro 7i 16 Gen 10
Intel Core Ultra 9 275HX
81.3 pt
Aorus MASTER 16 AM6H
Intel Core Ultra 9 275HX
80.1 pt
Alienware 16 Area-51
Intel Core Ultra 9 275HX
74.1 pt
Average of class Gaming
 
66.1 pt
Cinebench R23
Multi Core
Schenker XMG Neo 16 A25 5090
AMD Ryzen 9 9955HX3D
39266 Points +5%
Average AMD Ryzen 9 9955HX3D
  (37459 - 39266, n=3)
38530 Points +3%
Aorus Master 16 AM6J
AMD Ryzen 9 9955HX3D
37459 Points
Lenovo Legion Pro 7i 16 Gen 10
Intel Core Ultra 9 275HX
36597 (34151.5min - 36596.9max) Points -2%
Aorus MASTER 16 AM6H
Intel Core Ultra 9 275HX
36329 Points -3%
Asus ROG Strix G16 G615
Intel Core Ultra 9 275HX
34981 Points -7%
Alienware 16 Area-51
Intel Core Ultra 9 275HX
31707 (30018.3min - 31706.7max) Points -15%
Average of class Gaming
  (10488 - 42661, n=103, last 2 years)
26913 Points -28%
Single Core
Aorus MASTER 16 AM6H
Intel Core Ultra 9 275HX
2216 Points +3%
Lenovo Legion Pro 7i 16 Gen 10
Intel Core Ultra 9 275HX
2195 Points +2%
Asus ROG Strix G16 G615
Intel Core Ultra 9 275HX
2192 Points +2%
Schenker XMG Neo 16 A25 5090
AMD Ryzen 9 9955HX3D
2179 Points +1%
Average AMD Ryzen 9 9955HX3D
  (2150 - 2179, n=3)
2165 Points +1%
Aorus Master 16 AM6J
AMD Ryzen 9 9955HX3D
2150 Points
Average of class Gaming
  (1601 - 2415, n=103, last 2 years)
2031 Points -6%
Alienware 16 Area-51
Intel Core Ultra 9 275HX
2009 Points -7%
Cinebench R20
CPU (Multi Core)
Schenker XMG Neo 16 A25 5090
AMD Ryzen 9 9955HX3D
15177 Points +3%
Average AMD Ryzen 9 9955HX3D
  (14793 - 15177, n=3)
15039 Points +2%
Aorus Master 16 AM6J
AMD Ryzen 9 9955HX3D
14793 Points
Aorus MASTER 16 AM6H
Intel Core Ultra 9 275HX
14307 Points -3%
Lenovo Legion Pro 7i 16 Gen 10
Intel Core Ultra 9 275HX
14183 Points -4%
Asus ROG Strix G16 G615
Intel Core Ultra 9 275HX
13934 Points -6%
Alienware 16 Area-51
Intel Core Ultra 9 275HX
12429 Points -16%
Average of class Gaming
  (4029 - 16433, n=102, last 2 years)
10469 Points -29%
CPU (Single Core)
Asus ROG Strix G16 G615
Intel Core Ultra 9 275HX
859 Points +9%
Aorus MASTER 16 AM6H
Intel Core Ultra 9 275HX
854 Points +8%
Schenker XMG Neo 16 A25 5090
AMD Ryzen 9 9955HX3D
847 Points +7%
Lenovo Legion Pro 7i 16 Gen 10
Intel Core Ultra 9 275HX
831 Points +5%
Average AMD Ryzen 9 9955HX3D
  (790 - 851, n=3)
829 Points +5%
Aorus Master 16 AM6J
AMD Ryzen 9 9955HX3D
790 Points
Average of class Gaming
  (622 - 913, n=102, last 2 years)
786 Points -1%
Alienware 16 Area-51
Intel Core Ultra 9 275HX
774 Points -2%
Cinebench R15
CPU Multi 64Bit
Aorus Master 16 AM6J
AMD Ryzen 9 9955HX3D
6068 (5802.15min - 6067.96max) Points
Average AMD Ryzen 9 9955HX3D
  (6041 - 6068, n=3)
6051 Points 0%
Schenker XMG Neo 16 A25 5090
AMD Ryzen 9 9955HX3D
6044 (5932.08min - 6044.12max) Points 0%
Asus ROG Strix G16 G615
Intel Core Ultra 9 275HX
6000 (5702.07min - 5999.7max) Points -1%
Lenovo Legion Pro 7i 16 Gen 10
Intel Core Ultra 9 275HX
5746 (5601.46min - 5746.3max) Points -5%
Aorus MASTER 16 AM6H
Intel Core Ultra 9 275HX
5679 (5505.09min - 5679.4max) Points -6%
Alienware 16 Area-51
Intel Core Ultra 9 275HX
4756 (4696.49min - 4755.68max) Points -22%
Average of class Gaming
  (1578 - 6330, n=101, last 2 years)
4178 Points -31%
CPU Single 64Bit
Asus ROG Strix G16 G615
Intel Core Ultra 9 275HX
340 Points +3%
Lenovo Legion Pro 7i 16 Gen 10
Intel Core Ultra 9 275HX
336 Points +2%
Schenker XMG Neo 16 A25 5090
AMD Ryzen 9 9955HX3D
333 Points +1%
Aorus MASTER 16 AM6H
Intel Core Ultra 9 275HX
331 Points 0%
Aorus Master 16 AM6J
AMD Ryzen 9 9955HX3D
331 Points
Average AMD Ryzen 9 9955HX3D
  (321 - 333, n=3)
328 Points -1%
Alienware 16 Area-51
Intel Core Ultra 9 275HX
306 Points -8%
Average of class Gaming
  (188.8 - 350, n=102, last 2 years)
299 Points -10%
Blender - v2.79 BMW27 CPU
Average of class Gaming
  (79 - 330, n=100, last 2 years)
146.5 Seconds * -79%
Alienware 16 Area-51
Intel Core Ultra 9 275HX
99 Seconds * -21%
Aorus MASTER 16 AM6H
Intel Core Ultra 9 275HX
93 Seconds * -13%
Lenovo Legion Pro 7i 16 Gen 10
Intel Core Ultra 9 275HX
90 Seconds * -10%
Asus ROG Strix G16 G615
Intel Core Ultra 9 275HX
86 Seconds * -5%
Aorus Master 16 AM6J
AMD Ryzen 9 9955HX3D
82 Seconds *
Average AMD Ryzen 9 9955HX3D
  (80 - 82, n=3)
80.7 Seconds * +2%
Schenker XMG Neo 16 A25 5090
AMD Ryzen 9 9955HX3D
80 Seconds * +2%
7-Zip 18.03
7z b 4
Schenker XMG Neo 16 A25 5090
AMD Ryzen 9 9955HX3D
148086 MIPS +2%
Average AMD Ryzen 9 9955HX3D
  (145000 - 148086, n=3)
146296 MIPS +1%
Aorus Master 16 AM6J
AMD Ryzen 9 9955HX3D
145000 MIPS
Asus ROG Strix G16 G615
Intel Core Ultra 9 275HX
118614 MIPS -18%
Lenovo Legion Pro 7i 16 Gen 10
Intel Core Ultra 9 275HX
117940 MIPS -19%
Aorus MASTER 16 AM6H
Intel Core Ultra 9 275HX
112410 MIPS -22%
Alienware 16 Area-51
Intel Core Ultra 9 275HX
109219 MIPS -25%
Average of class Gaming
  (33491 - 148086, n=101, last 2 years)
92381 MIPS -36%
7z b 4 -mmt1
Aorus Master 16 AM6J
AMD Ryzen 9 9955HX3D
7382 MIPS
Schenker XMG Neo 16 A25 5090
AMD Ryzen 9 9955HX3D
7300 MIPS -1%
Average AMD Ryzen 9 9955HX3D
  (7151 - 7382, n=3)
7278 MIPS -1%
Asus ROG Strix G16 G615
Intel Core Ultra 9 275HX
7036 MIPS -5%
Aorus MASTER 16 AM6H
Intel Core Ultra 9 275HX
6669 MIPS -10%
Lenovo Legion Pro 7i 16 Gen 10
Intel Core Ultra 9 275HX
6607 MIPS -10%
Average of class Gaming
  (4824 - 7436, n=101, last 2 years)
6476 MIPS -12%
Alienware 16 Area-51
Intel Core Ultra 9 275HX
6289 MIPS -15%
Geekbench 6.7
Multi-Core
Schenker XMG Neo 16 A25 5090
AMD Ryzen 9 9955HX3D
20540 Points +3%
Average AMD Ryzen 9 9955HX3D
  (19788 - 20551, n=5)
20165 Points +1%
Aorus Master 16 AM6J
AMD Ryzen 9 9955HX3D
20023 Points
Asus ROG Strix G16 G615
Intel Core Ultra 9 275HX
19535 Points -2%
Aorus MASTER 16 AM6H
Intel Core Ultra 9 275HX
19299 Points -4%
Lenovo Legion Pro 7i 16 Gen 10
Intel Core Ultra 9 275HX
19081 Points -5%
Alienware 16 Area-51
Intel Core Ultra 9 275HX
18978 Points -5%
Average of class Gaming
  (6625 - 22850, n=102, last 2 years)
16221 Points -19%
Single-Core
Schenker XMG Neo 16 A25 5090
AMD Ryzen 9 9955HX3D
3214 Points 0%
Aorus Master 16 AM6J
AMD Ryzen 9 9955HX3D
3203 Points
Average AMD Ryzen 9 9955HX3D
  (3146 - 3237, n=5)
3191 Points 0%
Lenovo Legion Pro 7i 16 Gen 10
Intel Core Ultra 9 275HX
3052 Points -5%
Aorus MASTER 16 AM6H
Intel Core Ultra 9 275HX
3046 Points -5%
Asus ROG Strix G16 G615
Intel Core Ultra 9 275HX
3012 Points -6%
Alienware 16 Area-51
Intel Core Ultra 9 275HX
2925 Points -9%
Average of class Gaming
  (1982 - 3259, n=102, last 2 years)
2877 Points -10%
Geekbench 5.5
Multi-Core
Schenker XMG Neo 16 A25 5090
AMD Ryzen 9 9955HX3D
23669 Points 0%
Aorus Master 16 AM6J
AMD Ryzen 9 9955HX3D
23661 Points
Average AMD Ryzen 9 9955HX3D
  (23468 - 23669, n=3)
23599 Points 0%
Asus ROG Strix G16 G615
Intel Core Ultra 9 275HX
23308 Points -1%
Lenovo Legion Pro 7i 16 Gen 10
Intel Core Ultra 9 275HX
22414 Points -5%
Aorus MASTER 16 AM6H
Intel Core Ultra 9 275HX
22218 Points -6%
Alienware 16 Area-51
Intel Core Ultra 9 275HX
21612 Points -9%
Average of class Gaming
  (6460 - 28263, n=101, last 2 years)
17596 Points -26%
Single-Core
Aorus Master 16 AM6J
AMD Ryzen 9 9955HX3D
2406 Points
Average AMD Ryzen 9 9955HX3D
  (2381 - 2406, n=3)
2396 Points 0%
Schenker XMG Neo 16 A25 5090
AMD Ryzen 9 9955HX3D
2381 Points -1%
Aorus MASTER 16 AM6H
Intel Core Ultra 9 275HX
2214 Points -8%
Lenovo Legion Pro 7i 16 Gen 10
Intel Core Ultra 9 275HX
2199 Points -9%
Asus ROG Strix G16 G615
Intel Core Ultra 9 275HX
2177 Points -10%
Alienware 16 Area-51
Intel Core Ultra 9 275HX
2133 Points -11%
Average of class Gaming
  (1403 - 2474, n=101, last 2 years)
2083 Points -13%
HWBOT x265 Benchmark v2.2 - 4k Preset
Aorus Master 16 AM6J
AMD Ryzen 9 9955HX3D
43 fps
Average AMD Ryzen 9 9955HX3D
  (42.3 - 43, n=3)
42.7 fps -1%
Schenker XMG Neo 16 A25 5090
AMD Ryzen 9 9955HX3D
42.3 fps -2%
Asus ROG Strix G16 G615
Intel Core Ultra 9 275HX
40.2 fps -7%
Lenovo Legion Pro 7i 16 Gen 10
Intel Core Ultra 9 275HX
38.9 fps -10%
Aorus MASTER 16 AM6H
Intel Core Ultra 9 275HX
36 fps -16%
Alienware 16 Area-51
Intel Core Ultra 9 275HX
30.7 fps -29%
Average of class Gaming
  (11.5 - 44.4, n=101, last 2 years)
29.4 fps -32%
LibreOffice - 20 Documents To PDF
Aorus Master 16 AM6J
AMD Ryzen 9 9955HX3D
71.8 s *
Average AMD Ryzen 9 9955HX3D
  (44.9 - 71.8, n=3)
54.4 s * +24%
Average of class Gaming
  (33.2 - 88.8, n=101, last 2 years)
50.2 s * +30%
Schenker XMG Neo 16 A25 5090
AMD Ryzen 9 9955HX3D
46.6 s * +35%
Aorus MASTER 16 AM6H
Intel Core Ultra 9 275HX
40.46 s * +44%
Asus ROG Strix G16 G615
Intel Core Ultra 9 275HX
39.8 s * +45%
Alienware 16 Area-51
Intel Core Ultra 9 275HX
37.7 s * +47%
Lenovo Legion Pro 7i 16 Gen 10
Intel Core Ultra 9 275HX
36.9 s * +49%
R Benchmark 2.5 - Overall mean
Aorus MASTER 16 AM6H
Intel Core Ultra 9 275HX
0.43 sec * -21%
Alienware 16 Area-51
Intel Core Ultra 9 275HX
0.4296 sec * -20%
Average of class Gaming
  (0.3439 - 0.59, n=101, last 2 years)
0.4234 sec * -19%
Lenovo Legion Pro 7i 16 Gen 10
Intel Core Ultra 9 275HX
0.4132 sec * -16%
Asus ROG Strix G16 G615
Intel Core Ultra 9 275HX
0.3978 sec * -12%
Average AMD Ryzen 9 9955HX3D
  (0.3552 - 0.3677, n=3)
0.3598 sec * -1%
Aorus Master 16 AM6J
AMD Ryzen 9 9955HX3D
0.3566 sec *
Schenker XMG Neo 16 A25 5090
AMD Ryzen 9 9955HX3D
0.3552 sec * -0%

* ... smaller is better

Cinebench R15 CPU Single 64Bit
331 Points
Cinebench R15 CPU Multi 64Bit
6068 Points
Cinebench R15 OpenGL 64Bit
320 fps
Cinebench R15 Ref. Match 64Bit
99.6 %
Cinebench R20 CPU (Multi Core)
14793 Points
Cinebench R20 CPU (Single Core)
790 Points
Cinebench R23 Single Core
2150 Points
Cinebench R23 Multi Core
37459 Points
Cinebench 2024 CPU Multi Core
2090 Points
Cinebench 2024 CPU Single Core
130 Points
Help
Performance rating
Aorus Master 16 AM6J
AMD Ryzen 9 9955HX3D, GeForce RTX 5080 Laptop
97.1 pt
Average AMD Ryzen 9 9955HX3D
 
92.1 pt
Schenker XMG Neo 16 A25 5090
AMD Ryzen 9 9955HX3D, GeForce RTX 5090 Laptop
88.9 pt
Asus ROG Strix G16 G615
Intel Core Ultra 9 275HX, GeForce RTX 5080 Laptop
66.7 pt
Lenovo Legion Pro 7i 16 Gen 10
Intel Core Ultra 9 275HX, GeForce RTX 5080 Laptop
65 pt
Aorus MASTER 16 AM6H
Intel Core Ultra 9 275HX, GeForce RTX 5090 Laptop
64.7 pt
Alienware 16 Area-51
Intel Core Ultra 9 275HX, GeForce RTX 5080 Laptop
62.6 pt
Average of class Gaming
 
54.2 pt
AIDA64 / FP32 Ray-Trace
Average AMD Ryzen 9 9955HX3D
  (80619 - 84943, n=3)
82211 KRay/s +1%
Aorus Master 16 AM6J
AMD Ryzen 9 9955HX3D, GeForce RTX 5080 Laptop (v8.20.8100)
81070 KRay/s
Schenker XMG Neo 16 A25 5090
AMD Ryzen 9 9955HX3D, GeForce RTX 5090 Laptop (v6.92.6600)
80619 KRay/s -1%
Asus ROG Strix G16 G615
Intel Core Ultra 9 275HX, GeForce RTX 5080 Laptop (v6.92.6600)
39164 KRay/s -52%
Aorus MASTER 16 AM6H
Intel Core Ultra 9 275HX, GeForce RTX 5090 Laptop (v6.92.6600)
38066 KRay/s -53%
Lenovo Legion Pro 7i 16 Gen 10
Intel Core Ultra 9 275HX, GeForce RTX 5080 Laptop (v6.92.6600)
35760 KRay/s -56%
Alienware 16 Area-51
Intel Core Ultra 9 275HX, GeForce RTX 5080 Laptop (v6.92.6600)
34403 KRay/s -58%
Average of class Gaming
  (10227 - 85542, n=101, last 2 years)
33576 KRay/s -59%
AIDA64 / FPU Julia
Aorus Master 16 AM6J
AMD Ryzen 9 9955HX3D, GeForce RTX 5080 Laptop (v8.20.8100)
372155 Points
Average AMD Ryzen 9 9955HX3D
  (230738 - 372155, n=3)
280440 Points -25%
Schenker XMG Neo 16 A25 5090
AMD Ryzen 9 9955HX3D, GeForce RTX 5090 Laptop (v6.92.6600)
230738 Points -38%
Asus ROG Strix G16 G615
Intel Core Ultra 9 275HX, GeForce RTX 5080 Laptop (v6.92.6600)
192417 Points -48%
Aorus MASTER 16 AM6H
Intel Core Ultra 9 275HX, GeForce RTX 5090 Laptop (v6.92.6600)
189130 Points -49%
Lenovo Legion Pro 7i 16 Gen 10
Intel Core Ultra 9 275HX, GeForce RTX 5080 Laptop (v6.92.6600)
183428 Points -51%
Alienware 16 Area-51
Intel Core Ultra 9 275HX, GeForce RTX 5080 Laptop (v6.92.6600)
172754 Points -54%
Average of class Gaming
  (51376 - 372155, n=101, last 2 years)
145198 Points -61%
AIDA64 / CPU SHA3
Average AMD Ryzen 9 9955HX3D
  (9630 - 9750, n=3)
9679 MB/s +1%
Schenker XMG Neo 16 A25 5090
AMD Ryzen 9 9955HX3D, GeForce RTX 5090 Laptop (v6.92.6600)
9656 MB/s 0%
Aorus Master 16 AM6J
AMD Ryzen 9 9955HX3D, GeForce RTX 5080 Laptop (v8.20.8100)
9630 MB/s
Asus ROG Strix G16 G615
Intel Core Ultra 9 275HX, GeForce RTX 5080 Laptop (v6.92.6600)
9458 MB/s -2%
Aorus MASTER 16 AM6H
Intel Core Ultra 9 275HX, GeForce RTX 5090 Laptop (v6.92.6600)
9025 MB/s -6%
Lenovo Legion Pro 7i 16 Gen 10
Intel Core Ultra 9 275HX, GeForce RTX 5080 Laptop (v6.92.6600)
8828 MB/s -8%
Alienware 16 Area-51
Intel Core Ultra 9 275HX, GeForce RTX 5080 Laptop (v6.92.6600)
8335 MB/s -13%
Average of class Gaming
  (2180 - 10115, n=101, last 2 years)
6523 MB/s -32%
AIDA64 / FPU SinJulia
Schenker XMG Neo 16 A25 5090
AMD Ryzen 9 9955HX3D, GeForce RTX 5090 Laptop (v6.92.6600)
32989 Points +2%
Average AMD Ryzen 9 9955HX3D
  (32252 - 33636, n=3)
32959 Points +2%
Aorus Master 16 AM6J
AMD Ryzen 9 9955HX3D, GeForce RTX 5080 Laptop (v8.20.8100)
32252 Points
Average of class Gaming
  (4424 - 33636, n=101, last 2 years)
14994 Points -54%
Lenovo Legion Pro 7i 16 Gen 10
Intel Core Ultra 9 275HX, GeForce RTX 5080 Laptop (v6.92.6600)
13969 Points -57%
Asus ROG Strix G16 G615
Intel Core Ultra 9 275HX, GeForce RTX 5080 Laptop (v6.92.6600)
13926 Points -57%
Alienware 16 Area-51
Intel Core Ultra 9 275HX, GeForce RTX 5080 Laptop (v6.92.6600)
13580 Points -58%
Aorus MASTER 16 AM6H
Intel Core Ultra 9 275HX, GeForce RTX 5090 Laptop (v6.92.6600)
13522 Points -58%
AIDA64 / FPU Mandel
Aorus Master 16 AM6J
AMD Ryzen 9 9955HX3D, GeForce RTX 5080 Laptop (v8.20.8100)
196829 Points
Average AMD Ryzen 9 9955HX3D
  (122088 - 196829, n=3)
148525 Points -25%
Schenker XMG Neo 16 A25 5090
AMD Ryzen 9 9955HX3D, GeForce RTX 5090 Laptop (v6.92.6600)
122088 Points -38%
Asus ROG Strix G16 G615
Intel Core Ultra 9 275HX, GeForce RTX 5080 Laptop (v6.92.6600)
102847 Points -48%
Aorus MASTER 16 AM6H
Intel Core Ultra 9 275HX, GeForce RTX 5090 Laptop (v6.92.6600)
98724 Points -50%
Lenovo Legion Pro 7i 16 Gen 10
Intel Core Ultra 9 275HX, GeForce RTX 5080 Laptop (v6.92.6600)
95742 Points -51%
Alienware 16 Area-51
Intel Core Ultra 9 275HX, GeForce RTX 5080 Laptop (v6.92.6600)
89547 Points -55%
Average of class Gaming
  (25115 - 196829, n=101, last 2 years)
76339 Points -61%
AIDA64 / CPU AES
Average AMD Ryzen 9 9955HX3D
  (160619 - 163423, n=3)
161985 MB/s +1%
Schenker XMG Neo 16 A25 5090
AMD Ryzen 9 9955HX3D, GeForce RTX 5090 Laptop (v6.92.6600)
161913 MB/s +1%
Aorus Master 16 AM6J
AMD Ryzen 9 9955HX3D, GeForce RTX 5080 Laptop (v8.20.8100)
160619 MB/s
Asus ROG Strix G16 G615
Intel Core Ultra 9 275HX, GeForce RTX 5080 Laptop (v6.92.6600)
134429 MB/s -16%
Lenovo Legion Pro 7i 16 Gen 10
Intel Core Ultra 9 275HX, GeForce RTX 5080 Laptop (v6.92.6600)
134042 MB/s -17%
Alienware 16 Area-51
Intel Core Ultra 9 275HX, GeForce RTX 5080 Laptop (v6.92.6600)
130255 MB/s -19%
Aorus MASTER 16 AM6H
Intel Core Ultra 9 275HX, GeForce RTX 5090 Laptop (v6.92.6600)
129745 MB/s -19%
Average of class Gaming
  (39258 - 247074, n=101, last 2 years)
110236 MB/s -31%
AIDA64 / CPU ZLib
Schenker XMG Neo 16 A25 5090
AMD Ryzen 9 9955HX3D, GeForce RTX 5090 Laptop (v6.92.6600)
2497 MB/s +3%
Average AMD Ryzen 9 9955HX3D
  (2436 - 2517, n=3)
2483 MB/s +2%
Aorus Master 16 AM6J
AMD Ryzen 9 9955HX3D, GeForce RTX 5080 Laptop (v8.20.8100)
2436 MB/s
Asus ROG Strix G16 G615
Intel Core Ultra 9 275HX, GeForce RTX 5080 Laptop (v6.92.6600)
2202 MB/s -10%
Aorus MASTER 16 AM6H
Intel Core Ultra 9 275HX, GeForce RTX 5090 Laptop (v6.92.6600)
2076 MB/s -15%
Lenovo Legion Pro 7i 16 Gen 10
Intel Core Ultra 9 275HX, GeForce RTX 5080 Laptop (v6.92.6600)
2067 MB/s -15%
Alienware 16 Area-51
Intel Core Ultra 9 275HX, GeForce RTX 5080 Laptop (v6.92.6600)
1991 MB/s -18%
Average of class Gaming
  (574 - 2531, n=101, last 2 years)
1602 MB/s -34%
AIDA64 / FP64 Ray-Trace
Average AMD Ryzen 9 9955HX3D
  (42676 - 45384, n=3)
43714 KRay/s +1%
Aorus Master 16 AM6J
AMD Ryzen 9 9955HX3D, GeForce RTX 5080 Laptop (v8.20.8100)
43081 KRay/s
Schenker XMG Neo 16 A25 5090
AMD Ryzen 9 9955HX3D, GeForce RTX 5090 Laptop (v6.92.6600)
42676 KRay/s -1%
Asus ROG Strix G16 G615
Intel Core Ultra 9 275HX, GeForce RTX 5080 Laptop (v6.92.6600)
21122 KRay/s -51%
Aorus MASTER 16 AM6H
Intel Core Ultra 9 275HX, GeForce RTX 5090 Laptop (v6.92.6600)
20602 KRay/s -52%
Lenovo Legion Pro 7i 16 Gen 10
Intel Core Ultra 9 275HX, GeForce RTX 5080 Laptop (v6.92.6600)
19630 KRay/s -54%
Alienware 16 Area-51
Intel Core Ultra 9 275HX, GeForce RTX 5080 Laptop (v6.92.6600)
18630 KRay/s -57%
Average of class Gaming
  (5509 - 45446, n=101, last 2 years)
17959 KRay/s -58%
AIDA64 / CPU PhotoWorxx
Lenovo Legion Pro 7i 16 Gen 10
Intel Core Ultra 9 275HX, GeForce RTX 5080 Laptop (v6.92.6600)
53522 MPixel/s +21%
Alienware 16 Area-51
Intel Core Ultra 9 275HX, GeForce RTX 5080 Laptop (v6.92.6600)
53502 MPixel/s +21%
Aorus MASTER 16 AM6H
Intel Core Ultra 9 275HX, GeForce RTX 5090 Laptop (v6.92.6600)
48187 MPixel/s +9%
Asus ROG Strix G16 G615
Intel Core Ultra 9 275HX, GeForce RTX 5080 Laptop (v6.92.6600)
47726 MPixel/s +8%
Average of class Gaming
  (12271 - 89891, n=101, last 2 years)
44666 MPixel/s +1%
Aorus Master 16 AM6J
AMD Ryzen 9 9955HX3D, GeForce RTX 5080 Laptop (v8.20.8100)
44266 MPixel/s
Schenker XMG Neo 16 A25 5090
AMD Ryzen 9 9955HX3D, GeForce RTX 5090 Laptop (v6.92.6600)
43032 MPixel/s -3%
Average AMD Ryzen 9 9955HX3D
  (38765 - 44266, n=3)
42021 MPixel/s -5%

System and storage performance

Accordingly, it comes as no surprise that the Master 16 also ranks near the top of the comparison group in the system benchmarks. Its fast SSDs contribute to these results, although some competitors perform slightly better in this area.

Performance rating: Percent
PCMark 10: Score | Essentials | Productivity | Digital Content Creation
CrossMark: Overall | Productivity | Creativity | Responsiveness
WebXPRT 3: Overall
WebXPRT 4: Overall
Mozilla Kraken 1.1: Total
Performance rating
Aorus Master 16 AM6J
GeForce RTX 5080 Laptop, R9 9955HX3D, Samsung PM9C1b MZVL81T0HFLB-00BTW
84.5 pt
Average AMD Ryzen 9 9955HX3D, NVIDIA GeForce RTX 5080 Laptop
 
83.9 pt
Schenker XMG Neo 16 A25 5090
GeForce RTX 5090 Laptop, R9 9955HX3D, Kingston Fury Renegade SFYRS1000G
83.8 pt
Alienware 16 Area-51
GeForce RTX 5080 Laptop, Ultra 9 275HX, Samsung PM9C1a MZ9L81T0HDLB
81.7 pt
Asus ROG Strix G16 G615
GeForce RTX 5080 Laptop, Ultra 9 275HX, Micron 2500 1TB MTFDKBA1T0QGN
81.7 pt
Aorus MASTER 16 AM6H
GeForce RTX 5090 Laptop, Ultra 9 275HX, Kingston OM8PGP41024Q-A0
81.1 pt
Lenovo Legion Pro 7i 16 Gen 10
GeForce RTX 5080 Laptop, Ultra 9 275HX, SK Hynix HFS001TEJ9X115N
80.2 pt
Average of class Gaming
 
74.3 pt
PCMark 10 / Score
Aorus Master 16 AM6J
GeForce RTX 5080 Laptop, R9 9955HX3D, Samsung PM9C1b MZVL81T0HFLB-00BTW
10636 Points
Average AMD Ryzen 9 9955HX3D, NVIDIA GeForce RTX 5080 Laptop
  (8859 - 10636, n=2)
9748 Points -8%
Schenker XMG Neo 16 A25 5090
GeForce RTX 5090 Laptop, R9 9955HX3D, Kingston Fury Renegade SFYRS1000G
9647 Points -9%
Lenovo Legion Pro 7i 16 Gen 10
GeForce RTX 5080 Laptop, Ultra 9 275HX, SK Hynix HFS001TEJ9X115N
9153 Points -14%
Asus ROG Strix G16 G615
GeForce RTX 5080 Laptop, Ultra 9 275HX, Micron 2500 1TB MTFDKBA1T0QGN
8856 Points -17%
Alienware 16 Area-51
GeForce RTX 5080 Laptop, Ultra 9 275HX, Samsung PM9C1a MZ9L81T0HDLB
8767 Points -18%
Average of class Gaming
  (5828 - 12414, n=92, last 2 years)
8509 Points -20%
Aorus MASTER 16 AM6H
GeForce RTX 5090 Laptop, Ultra 9 275HX, Kingston OM8PGP41024Q-A0
8241 Points -23%
PCMark 10 / Essentials
Schenker XMG Neo 16 A25 5090
GeForce RTX 5090 Laptop, R9 9955HX3D, Kingston Fury Renegade SFYRS1000G
11728 Points +1%
Average AMD Ryzen 9 9955HX3D, NVIDIA GeForce RTX 5080 Laptop
  (11564 - 11806, n=2)
11685 Points +1%
Aorus Master 16 AM6J
GeForce RTX 5080 Laptop, R9 9955HX3D, Samsung PM9C1b MZVL81T0HFLB-00BTW
11564 Points
Lenovo Legion Pro 7i 16 Gen 10
GeForce RTX 5080 Laptop, Ultra 9 275HX, SK Hynix HFS001TEJ9X115N
11215 Points -3%
Asus ROG Strix G16 G615
GeForce RTX 5080 Laptop, Ultra 9 275HX, Micron 2500 1TB MTFDKBA1T0QGN
11177 Points -3%
Alienware 16 Area-51
GeForce RTX 5080 Laptop, Ultra 9 275HX, Samsung PM9C1a MZ9L81T0HDLB
11139 Points -4%
Average of class Gaming
  (8810 - 11935, n=96, last 2 years)
10677 Points -8%
Aorus MASTER 16 AM6H
GeForce RTX 5090 Laptop, Ultra 9 275HX, Kingston OM8PGP41024Q-A0
9994 Points -14%
PCMark 10 / Productivity
Aorus Master 16 AM6J
GeForce RTX 5080 Laptop, R9 9955HX3D, Samsung PM9C1b MZVL81T0HFLB-00BTW
19653 Points
Average AMD Ryzen 9 9955HX3D, NVIDIA GeForce RTX 5080 Laptop
  (10793 - 19653, n=2)
15223 Points -23%
Average of class Gaming
  (6845 - 25323, n=94, last 2 years)
11345 Points -42%
Schenker XMG Neo 16 A25 5090
GeForce RTX 5090 Laptop, R9 9955HX3D, Kingston Fury Renegade SFYRS1000G
11003 Points -44%
Lenovo Legion Pro 7i 16 Gen 10
GeForce RTX 5080 Laptop, Ultra 9 275HX, SK Hynix HFS001TEJ9X115N
9590 Points -51%
Aorus MASTER 16 AM6H
GeForce RTX 5090 Laptop, Ultra 9 275HX, Kingston OM8PGP41024Q-A0
9300 Points -53%
Alienware 16 Area-51
GeForce RTX 5080 Laptop, Ultra 9 275HX, Samsung PM9C1a MZ9L81T0HDLB
9270 Points -53%
Asus ROG Strix G16 G615
GeForce RTX 5080 Laptop, Ultra 9 275HX, Micron 2500 1TB MTFDKBA1T0QGN
9212 Points -53%
PCMark 10 / Digital Content Creation
Lenovo Legion Pro 7i 16 Gen 10
GeForce RTX 5080 Laptop, Ultra 9 275HX, SK Hynix HFS001TEJ9X115N
19351 Points +35%
Schenker XMG Neo 16 A25 5090
GeForce RTX 5090 Laptop, R9 9955HX3D, Kingston Fury Renegade SFYRS1000G
18879 Points +31%
Asus ROG Strix G16 G615
GeForce RTX 5080 Laptop, Ultra 9 275HX, Micron 2500 1TB MTFDKBA1T0QGN
18305 Points +27%
Alienware 16 Area-51
GeForce RTX 5080 Laptop, Ultra 9 275HX, Samsung PM9C1a MZ9L81T0HDLB
17709 Points +23%
Aorus MASTER 16 AM6H
GeForce RTX 5090 Laptop, Ultra 9 275HX, Kingston OM8PGP41024Q-A0
16344 Points +14%
Average AMD Ryzen 9 9955HX3D, NVIDIA GeForce RTX 5080 Laptop
  (14368 - 14805, n=2)
14587 Points +2%
Aorus Master 16 AM6J
GeForce RTX 5080 Laptop, R9 9955HX3D, Samsung PM9C1b MZVL81T0HFLB-00BTW
14368 Points
Average of class Gaming
  (7602 - 19954, n=94, last 2 years)
14120 Points -2%
CrossMark / Overall
Aorus MASTER 16 AM6H
GeForce RTX 5090 Laptop, Ultra 9 275HX, Kingston OM8PGP41024Q-A0
2253 Points +6%
Schenker XMG Neo 16 A25 5090
GeForce RTX 5090 Laptop, R9 9955HX3D, Kingston Fury Renegade SFYRS1000G
2199 Points +3%
Average AMD Ryzen 9 9955HX3D, NVIDIA GeForce RTX 5080 Laptop
  (2126 - 2265, n=2)
2196 Points +3%
Alienware 16 Area-51
GeForce RTX 5080 Laptop, Ultra 9 275HX, Samsung PM9C1a MZ9L81T0HDLB
2174 Points +2%
Asus ROG Strix G16 G615
GeForce RTX 5080 Laptop, Ultra 9 275HX, Micron 2500 1TB MTFDKBA1T0QGN
2165 Points +2%
Aorus Master 16 AM6J
GeForce RTX 5080 Laptop, R9 9955HX3D, Samsung PM9C1b MZVL81T0HFLB-00BTW
2126 Points
Lenovo Legion Pro 7i 16 Gen 10
GeForce RTX 5080 Laptop, Ultra 9 275HX, SK Hynix HFS001TEJ9X115N
2017 Points -5%
Average of class Gaming
  (1366 - 2409, n=93, last 2 years)
1990 Points -6%
CrossMark / Productivity
Aorus MASTER 16 AM6H
GeForce RTX 5090 Laptop, Ultra 9 275HX, Kingston OM8PGP41024Q-A0
2106 Points +10%
Alienware 16 Area-51
GeForce RTX 5080 Laptop, Ultra 9 275HX, Samsung PM9C1a MZ9L81T0HDLB
2023 Points +6%
Asus ROG Strix G16 G615
GeForce RTX 5080 Laptop, Ultra 9 275HX, Micron 2500 1TB MTFDKBA1T0QGN
2014 Points +5%
Average AMD Ryzen 9 9955HX3D, NVIDIA GeForce RTX 5080 Laptop
  (1914 - 2017, n=2)
1966 Points +3%
Schenker XMG Neo 16 A25 5090
GeForce RTX 5090 Laptop, R9 9955HX3D, Kingston Fury Renegade SFYRS1000G
1958 Points +2%
Lenovo Legion Pro 7i 16 Gen 10
GeForce RTX 5080 Laptop, Ultra 9 275HX, SK Hynix HFS001TEJ9X115N
1922 Points 0%
Aorus Master 16 AM6J
GeForce RTX 5080 Laptop, R9 9955HX3D, Samsung PM9C1b MZVL81T0HFLB-00BTW
1914 Points
Average of class Gaming
  (1386 - 2254, n=93, last 2 years)
1858 Points -3%
CrossMark / Creativity
Schenker XMG Neo 16 A25 5090
GeForce RTX 5090 Laptop, R9 9955HX3D, Kingston Fury Renegade SFYRS1000G
2651 Points +4%
Average AMD Ryzen 9 9955HX3D, NVIDIA GeForce RTX 5080 Laptop
  (2547 - 2729, n=2)
2638 Points +4%
Aorus Master 16 AM6J
GeForce RTX 5080 Laptop, R9 9955HX3D, Samsung PM9C1b MZVL81T0HFLB-00BTW
2547 Points
Aorus MASTER 16 AM6H
GeForce RTX 5090 Laptop, Ultra 9 275HX, Kingston OM8PGP41024Q-A0
2452 Points -4%
Asus ROG Strix G16 G615
GeForce RTX 5080 Laptop, Ultra 9 275HX, Micron 2500 1TB MTFDKBA1T0QGN
2451 Points -4%
Alienware 16 Area-51
GeForce RTX 5080 Laptop, Ultra 9 275HX, Samsung PM9C1a MZ9L81T0HDLB
2396 Points -6%
Lenovo Legion Pro 7i 16 Gen 10
GeForce RTX 5080 Laptop, Ultra 9 275HX, SK Hynix HFS001TEJ9X115N
2288 Points -10%
Average of class Gaming
  (1343 - 2786, n=93, last 2 years)
2252 Points -12%
CrossMark / Responsiveness
Aorus MASTER 16 AM6H
GeForce RTX 5090 Laptop, Ultra 9 275HX, Kingston OM8PGP41024Q-A0
2139 Points +26%
Alienware 16 Area-51
GeForce RTX 5080 Laptop, Ultra 9 275HX, Samsung PM9C1a MZ9L81T0HDLB
2016 Points +19%
Asus ROG Strix G16 G615
GeForce RTX 5080 Laptop, Ultra 9 275HX, Micron 2500 1TB MTFDKBA1T0QGN
1853 Points +10%
Schenker XMG Neo 16 A25 5090
GeForce RTX 5090 Laptop, R9 9955HX3D, Kingston Fury Renegade SFYRS1000G
1776 Points +5%
Average AMD Ryzen 9 9955HX3D, NVIDIA GeForce RTX 5080 Laptop
  (1691 - 1833, n=2)
1762 Points +4%
Average of class Gaming
  (1226 - 2334, n=93, last 2 years)
1704 Points +1%
Aorus Master 16 AM6J
GeForce RTX 5080 Laptop, R9 9955HX3D, Samsung PM9C1b MZVL81T0HFLB-00BTW
1691 Points
Lenovo Legion Pro 7i 16 Gen 10
GeForce RTX 5080 Laptop, Ultra 9 275HX, SK Hynix HFS001TEJ9X115N
1597 Points -6%
WebXPRT 3 / Overall
Lenovo Legion Pro 7i 16 Gen 10
GeForce RTX 5080 Laptop, Ultra 9 275HX, SK Hynix HFS001TEJ9X115N
359 Points +7%
Average AMD Ryzen 9 9955HX3D, NVIDIA GeForce RTX 5080 Laptop
  (335 - 366, n=2)
351 Points +5%
Alienware 16 Area-51
GeForce RTX 5080 Laptop, Ultra 9 275HX, Samsung PM9C1a MZ9L81T0HDLB
348 Points +4%
Asus ROG Strix G16 G615
GeForce RTX 5080 Laptop, Ultra 9 275HX, Micron 2500 1TB MTFDKBA1T0QGN
347 Points +4%
Aorus MASTER 16 AM6H
GeForce RTX 5090 Laptop, Ultra 9 275HX, Kingston OM8PGP41024Q-A0
346 Points +3%
Schenker XMG Neo 16 A25 5090
GeForce RTX 5090 Laptop, R9 9955HX3D, Kingston Fury Renegade SFYRS1000G
342 Points +2%
Aorus Master 16 AM6J
GeForce RTX 5080 Laptop, R9 9955HX3D, Samsung PM9C1b MZVL81T0HFLB-00BTW
335 Points
Average of class Gaming
  (220 - 532, n=97, last 2 years)
319 Points -5%
WebXPRT 4 / Overall
Asus ROG Strix G16 G615
GeForce RTX 5080 Laptop, Ultra 9 275HX, Micron 2500 1TB MTFDKBA1T0QGN
336 Points +9%
Aorus MASTER 16 AM6H
GeForce RTX 5090 Laptop, Ultra 9 275HX, Kingston OM8PGP41024Q-A0
333 Points +8%
Lenovo Legion Pro 7i 16 Gen 10
GeForce RTX 5080 Laptop, Ultra 9 275HX, SK Hynix HFS001TEJ9X115N
333 Points +8%
Alienware 16 Area-51
GeForce RTX 5080 Laptop, Ultra 9 275HX, Samsung PM9C1a MZ9L81T0HDLB
331 Points +7%
Average AMD Ryzen 9 9955HX3D, NVIDIA GeForce RTX 5080 Laptop
  (309 - 333, n=2)
321 Points +4%
Schenker XMG Neo 16 A25 5090
GeForce RTX 5090 Laptop, R9 9955HX3D, Kingston Fury Renegade SFYRS1000G
320 Points +4%
Aorus Master 16 AM6J
GeForce RTX 5080 Laptop, R9 9955HX3D, Samsung PM9C1b MZVL81T0HFLB-00BTW
309 Points
Average of class Gaming
  (165 - 354, n=97, last 2 years)
286 Points -7%
Mozilla Kraken 1.1 / Total
Average of class Gaming
  (391 - 590, n=99, last 2 years)
457 ms * -13%
Aorus MASTER 16 AM6H
GeForce RTX 5090 Laptop, Ultra 9 275HX, Kingston OM8PGP41024Q-A0
411 ms * -1%
Alienware 16 Area-51
GeForce RTX 5080 Laptop, Ultra 9 275HX, Samsung PM9C1a MZ9L81T0HDLB
410 ms * -1%
Lenovo Legion Pro 7i 16 Gen 10
GeForce RTX 5080 Laptop, Ultra 9 275HX, SK Hynix HFS001TEJ9X115N
408 ms * -1%
Asus ROG Strix G16 G615
GeForce RTX 5080 Laptop, Ultra 9 275HX, Micron 2500 1TB MTFDKBA1T0QGN
405 ms * -0%
Aorus Master 16 AM6J
GeForce RTX 5080 Laptop, R9 9955HX3D, Samsung PM9C1b MZVL81T0HFLB-00BTW
405 ms *
Average AMD Ryzen 9 9955HX3D, NVIDIA GeForce RTX 5080 Laptop
  (397 - 405, n=2)
401 ms * +1%
Schenker XMG Neo 16 A25 5090
GeForce RTX 5090 Laptop, R9 9955HX3D, Kingston Fury Renegade SFYRS1000G
397 ms * +2%

* ... smaller is better

PCMark 10 Score
10636 points
Help
AIDA64 / Memory Copy
Asus ROG Strix G16 G615
Intel Core Ultra 9 275HX, GeForce RTX 5080 Laptop
86549 MB/s +37%
Alienware 16 Area-51
Intel Core Ultra 9 275HX, GeForce RTX 5080 Laptop
85681 MB/s +36%
Lenovo Legion Pro 7i 16 Gen 10
Intel Core Ultra 9 275HX, GeForce RTX 5080 Laptop
85644 MB/s +36%
Aorus MASTER 16 AM6H
Intel Core Ultra 9 275HX, GeForce RTX 5090 Laptop
75982 MB/s +20%
Average of class Gaming
  (21750 - 129946, n=101, last 2 years)
72014 MB/s +14%
Aorus Master 16 AM6J
AMD Ryzen 9 9955HX3D, GeForce RTX 5080 Laptop
63173 MB/s
Schenker XMG Neo 16 A25 5090
AMD Ryzen 9 9955HX3D, GeForce RTX 5090 Laptop
61533 MB/s -3%
Average AMD Ryzen 9 9955HX3D
  (56383 - 63173, n=3)
60363 MB/s -4%
AIDA64 / Memory Read
Lenovo Legion Pro 7i 16 Gen 10
Intel Core Ultra 9 275HX, GeForce RTX 5080 Laptop
95542 MB/s +44%
Alienware 16 Area-51
Intel Core Ultra 9 275HX, GeForce RTX 5080 Laptop
92886 MB/s +40%
Asus ROG Strix G16 G615
Intel Core Ultra 9 275HX, GeForce RTX 5080 Laptop
83408 MB/s +25%
Aorus MASTER 16 AM6H
Intel Core Ultra 9 275HX, GeForce RTX 5090 Laptop
82625 MB/s +24%
Average of class Gaming
  (22956 - 118858, n=101, last 2 years)
74369 MB/s +12%
Aorus Master 16 AM6J
AMD Ryzen 9 9955HX3D, GeForce RTX 5080 Laptop
66539 MB/s
Schenker XMG Neo 16 A25 5090
AMD Ryzen 9 9955HX3D, GeForce RTX 5090 Laptop
65369 MB/s -2%
Average AMD Ryzen 9 9955HX3D
  (59750 - 66539, n=3)
63886 MB/s -4%
AIDA64 / Memory Write
Lenovo Legion Pro 7i 16 Gen 10
Intel Core Ultra 9 275HX, GeForce RTX 5080 Laptop
84581 MB/s +22%
Alienware 16 Area-51
Intel Core Ultra 9 275HX, GeForce RTX 5080 Laptop
83280 MB/s +20%
Average of class Gaming
  (22297 - 135096, n=101, last 2 years)
76584 MB/s +10%
Asus ROG Strix G16 G615
Intel Core Ultra 9 275HX, GeForce RTX 5080 Laptop
73246 MB/s +5%
Aorus MASTER 16 AM6H
Intel Core Ultra 9 275HX, GeForce RTX 5090 Laptop
73095 MB/s +5%
Schenker XMG Neo 16 A25 5090
AMD Ryzen 9 9955HX3D, GeForce RTX 5090 Laptop
72898 MB/s +5%
Aorus Master 16 AM6J
AMD Ryzen 9 9955HX3D, GeForce RTX 5080 Laptop
69431 MB/s
Average AMD Ryzen 9 9955HX3D
  (59506 - 72898, n=3)
67278 MB/s -3%
AIDA64 / Memory Latency
Alienware 16 Area-51
Intel Core Ultra 9 275HX, GeForce RTX 5080 Laptop
131.1 ns * -31%
Aorus MASTER 16 AM6H
Intel Core Ultra 9 275HX, GeForce RTX 5090 Laptop
111.9 ns * -11%
Asus ROG Strix G16 G615
Intel Core Ultra 9 275HX, GeForce RTX 5080 Laptop
111.7 ns * -11%
Lenovo Legion Pro 7i 16 Gen 10
Intel Core Ultra 9 275HX, GeForce RTX 5080 Laptop
109.3 ns * -9%
Average of class Gaming
  (75.3 - 165.4, n=101, last 2 years)
104.3 ns * -4%
Schenker XMG Neo 16 A25 5090
AMD Ryzen 9 9955HX3D, GeForce RTX 5090 Laptop
103.6 ns * -3%
Aorus Master 16 AM6J
AMD Ryzen 9 9955HX3D, GeForce RTX 5080 Laptop
100.4 ns *
Average AMD Ryzen 9 9955HX3D
  (96.1 - 103.6, n=3)
100 ns * -0%

* ... smaller is better

Samsung PM9C1b MZVL81T0HFLB-00BTW
Sequential Read: 5721.12MB/s
Sequential Write: 4108.74MB/s
4K Read: 70.8MB/s
4K Write: 206.42MB/s
4K-64 Read: 2784.09MB/s
4K-64 Write: 3631.52MB/s
Access Time Read: 0.068ms
Access Time Write: 0.021ms
Score Read: 3427Points
Score Write: 4249Points
Score Total: 9344Points
Drive Performance rating - Percent
Schenker XMG Neo 16 A25 5090
Kingston Fury Renegade SFYRS1000G
76.5 pt
Alienware 16 Area-51
Samsung PM9C1a MZ9L81T0HDLB
71.3 pt
Aorus Master 16 AM6J
Samsung PM9C1b MZVL81T0HFLB-00BTW
69.9 pt
Aorus MASTER 16 AM6H
Kingston OM8PGP41024Q-A0
61.5 pt
Lenovo Legion Pro 7i 16 Gen 10
SK Hynix HFS001TEJ9X115N
61.1 pt
Average of class Gaming
 
60.4 pt
Average Samsung PM9C1b MZVL81T0HFLB-00BTW
 
59.3 pt
Asus ROG Strix G16 G615
Micron 2500 1TB MTFDKBA1T0QGN
58.8 pt
DiskSpd
seq read
Schenker XMG Neo 16 A25 5090
Kingston Fury Renegade SFYRS1000G
7029 (6966.86min - 7029.44max) MB/s +108%
Lenovo Legion Pro 7i 16 Gen 10
SK Hynix HFS001TEJ9X115N
3998 (3658.3min - 3998.4max) MB/s +18%
Average of class Gaming
  (281 - 9494, n=98, last 2 years)
3517 MB/s +4%
Aorus Master 16 AM6J
Samsung PM9C1b MZVL81T0HFLB-00BTW
3378 (3230.45min - 3378.26max) MB/s
Aorus MASTER 16 AM6H
Kingston OM8PGP41024Q-A0
3268 (3226.52min - 3267.96max) MB/s -3%
Average Samsung PM9C1b MZVL81T0HFLB-00BTW
  (2395 - 3686, n=4)
3179 MB/s -6%
Alienware 16 Area-51
Samsung PM9C1a MZ9L81T0HDLB
2874 (2861.08min - 2873.64max) MB/s -15%
Asus ROG Strix G16 G615
Micron 2500 1TB MTFDKBA1T0QGN
348 (183.29min - 348.13max) MB/s -90%
seq write
Schenker XMG Neo 16 A25 5090
Kingston Fury Renegade SFYRS1000G
5592 (5439.62min - 5591.78max) MB/s +60%
Alienware 16 Area-51
Samsung PM9C1a MZ9L81T0HDLB
4495 (4454.56min - 4495.48max) MB/s +29%
Average of class Gaming
  (1057 - 9832, n=98, last 2 years)
3924 MB/s +12%
Aorus MASTER 16 AM6H
Kingston OM8PGP41024Q-A0
3906 (3851.27min - 3906.37max) MB/s +12%
Average Samsung PM9C1b MZVL81T0HFLB-00BTW
  (3282 - 4939, n=4)
3839 MB/s +10%
Aorus Master 16 AM6J
Samsung PM9C1b MZVL81T0HFLB-00BTW
3491 (3110.85min - 3490.71max) MB/s
Asus ROG Strix G16 G615
Micron 2500 1TB MTFDKBA1T0QGN
2759 (2615.78min - 2759.16max) MB/s -21%
Lenovo Legion Pro 7i 16 Gen 10
SK Hynix HFS001TEJ9X115N
1922 (1819.62min - 1921.76max) MB/s -45%
seq q8 t1 read
Schenker XMG Neo 16 A25 5090
Kingston Fury Renegade SFYRS1000G
14313 (12003.9min - 14312.6max) MB/s +156%
Average of class Gaming
  (3772 - 17459, n=98, last 2 years)
7540 MB/s +35%
Lenovo Legion Pro 7i 16 Gen 10
SK Hynix HFS001TEJ9X115N
7069 (5962.41min - 7069.08max) MB/s +26%
Asus ROG Strix G16 G615
Micron 2500 1TB MTFDKBA1T0QGN
6749 (5697.47min - 6748.77max) MB/s +21%
Average Samsung PM9C1b MZVL81T0HFLB-00BTW
  (5597 - 7013, n=4)
6624 MB/s +18%
Alienware 16 Area-51
Samsung PM9C1a MZ9L81T0HDLB
6190 (5787.05min - 6190.16max) MB/s +11%
Aorus Master 16 AM6J
Samsung PM9C1b MZVL81T0HFLB-00BTW
5597 (4952.59min - 5597.43max) MB/s
Aorus MASTER 16 AM6H
Kingston OM8PGP41024Q-A0
4799 (4213.14min - 4799.33max) MB/s -14%
seq q8 t1 write
Schenker XMG Neo 16 A25 5090
Kingston Fury Renegade SFYRS1000G
10800 (10111.1min - 10799.7max) MB/s +191%
Lenovo Legion Pro 7i 16 Gen 10
SK Hynix HFS001TEJ9X115N
6169 (6112.09min - 6168.56max) MB/s +67%
Average of class Gaming
  (1218 - 13519, n=98, last 2 years)
5935 MB/s +60%
Asus ROG Strix G16 G615
Micron 2500 1TB MTFDKBA1T0QGN
5343 (5220.28min - 5342.91max) MB/s +44%
Average Samsung PM9C1b MZVL81T0HFLB-00BTW
  (3705 - 5771, n=4)
4990 MB/s +35%
Alienware 16 Area-51
Samsung PM9C1a MZ9L81T0HDLB
4809 (4768.82min - 4809.43max) MB/s +30%
Aorus MASTER 16 AM6H
Kingston OM8PGP41024Q-A0
3905 (3856.71min - 3905.27max) MB/s +5%
Aorus Master 16 AM6J
Samsung PM9C1b MZVL81T0HFLB-00BTW
3705 (3255.83min - 3704.62max) MB/s
4k q1 t1 read
Alienware 16 Area-51
Samsung PM9C1a MZ9L81T0HDLB
85.2 (83.53min - 85.24max) MB/s +10%
Aorus Master 16 AM6J
Samsung PM9C1b MZVL81T0HFLB-00BTW
77.4 (74.48min - 77.41max) MB/s
Asus ROG Strix G16 G615
Micron 2500 1TB MTFDKBA1T0QGN
70.9 (23.28min - 70.91max) MB/s -8%
Average of class Gaming
  (32.2 - 111.2, n=98, last 2 years)
70.2 MB/s -9%
Schenker XMG Neo 16 A25 5090
Kingston Fury Renegade SFYRS1000G
69.8 (69.45min - 69.83max) MB/s -10%
Aorus MASTER 16 AM6H
Kingston OM8PGP41024Q-A0
68.4 (66.54min - 68.38max) MB/s -12%
Lenovo Legion Pro 7i 16 Gen 10
SK Hynix HFS001TEJ9X115N
68.3 (67.41min - 68.26max) MB/s -12%
Average Samsung PM9C1b MZVL81T0HFLB-00BTW
  (45.1 - 81.4, n=4)
65.8 MB/s -15%
4k q1 t1 write
Aorus MASTER 16 AM6H
Kingston OM8PGP41024Q-A0
317 (306.21min - 316.5max) MB/s +40%
Alienware 16 Area-51
Samsung PM9C1a MZ9L81T0HDLB
279 (276.45min - 278.98max) MB/s +23%
Average Samsung PM9C1b MZVL81T0HFLB-00BTW
  (193 - 253, n=4)
230 MB/s +2%
Aorus Master 16 AM6J
Samsung PM9C1b MZVL81T0HFLB-00BTW
226 (220.4min - 226.16max) MB/s
Average of class Gaming
  (78 - 345, n=98, last 2 years)
194.9 MB/s -14%
Asus ROG Strix G16 G615
Micron 2500 1TB MTFDKBA1T0QGN
178.9 (178.49min - 178.93max) MB/s -21%
Schenker XMG Neo 16 A25 5090
Kingston Fury Renegade SFYRS1000G
170.3 (168.43min - 170.32max) MB/s -25%
Lenovo Legion Pro 7i 16 Gen 10
SK Hynix HFS001TEJ9X115N
153.8 (106.82min - 153.79max) MB/s -32%
4k q32 t16 read
Lenovo Legion Pro 7i 16 Gen 10
SK Hynix HFS001TEJ9X115N
4760 (4699.8min - 4760.03max) MB/s +17%
Aorus Master 16 AM6J
Samsung PM9C1b MZVL81T0HFLB-00BTW
4063 (4026.11min - 4063.09max) MB/s
Alienware 16 Area-51
Samsung PM9C1a MZ9L81T0HDLB
3671 (3657.2min - 3670.82max) MB/s -10%
Aorus MASTER 16 AM6H
Kingston OM8PGP41024Q-A0
2809 (2804.8min - 2809.03max) MB/s -31%
Average of class Gaming
  (539 - 8067, n=98, last 2 years)
2244 MB/s -45%
Average Samsung PM9C1b MZVL81T0HFLB-00BTW
  (708 - 4063, n=4)
2235 MB/s -45%
Schenker XMG Neo 16 A25 5090
Kingston Fury Renegade SFYRS1000G
1112 (1085.98min - 1112.27max) MB/s -73%
Asus ROG Strix G16 G615
Micron 2500 1TB MTFDKBA1T0QGN
722 (696.56min - 722.01max) MB/s -82%
4k q32 t16 write
Lenovo Legion Pro 7i 16 Gen 10
SK Hynix HFS001TEJ9X115N
4433 (4354.58min - 4433.43max) MB/s +71%
Aorus MASTER 16 AM6H
Kingston OM8PGP41024Q-A0
3711 (3674.85min - 3711.4max) MB/s +43%
Alienware 16 Area-51
Samsung PM9C1a MZ9L81T0HDLB
3400 (3262.44min - 3400.47max) MB/s +31%
Aorus Master 16 AM6J
Samsung PM9C1b MZVL81T0HFLB-00BTW
2590 (2147.15min - 2589.9max) MB/s
Average of class Gaming
  (227 - 5653, n=98, last 2 years)
1812 MB/s -30%
Average Samsung PM9C1b MZVL81T0HFLB-00BTW
  (505 - 2590, n=4)
1415 MB/s -45%
Schenker XMG Neo 16 A25 5090
Kingston Fury Renegade SFYRS1000G
618 (609.25min - 617.87max) MB/s -76%
Asus ROG Strix G16 G615
Micron 2500 1TB MTFDKBA1T0QGN
572 (544.97min - 572.01max) MB/s -78%
AS SSD
Score Total
Aorus Master 16 AM6J
Samsung PM9C1b MZVL81T0HFLB-00BTW
9344 Points
Alienware 16 Area-51
Samsung PM9C1a MZ9L81T0HDLB
8686 Points -7%
Schenker XMG Neo 16 A25 5090
Kingston Fury Renegade SFYRS1000G
8146 Points -13%
Asus ROG Strix G16 G615
Micron 2500 1TB MTFDKBA1T0QGN
7478 Points -20%
Average Samsung PM9C1b MZVL81T0HFLB-00BTW
  (5124 - 9344, n=4)
6984 Points -25%
Average of class Gaming
  (2912 - 14159, n=96, last 2 years)
6865 Points -27%
Aorus MASTER 16 AM6H
Kingston OM8PGP41024Q-A0
6720 Points -28%
Lenovo Legion Pro 7i 16 Gen 10
SK Hynix HFS001TEJ9X115N
6515 Points -30%
Score Read
Aorus Master 16 AM6J
Samsung PM9C1b MZVL81T0HFLB-00BTW
3427 Points
Alienware 16 Area-51
Samsung PM9C1a MZ9L81T0HDLB
3329 Points -3%
Lenovo Legion Pro 7i 16 Gen 10
SK Hynix HFS001TEJ9X115N
3234 Points -6%
Aorus MASTER 16 AM6H
Kingston OM8PGP41024Q-A0
2761 Points -19%
Average Samsung PM9C1b MZVL81T0HFLB-00BTW
  (1188 - 3427, n=4)
2335 Points -32%
Average of class Gaming
  (953 - 5082, n=96, last 2 years)
2245 Points -34%
Schenker XMG Neo 16 A25 5090
Kingston Fury Renegade SFYRS1000G
1869 Points -45%
Asus ROG Strix G16 G615
Micron 2500 1TB MTFDKBA1T0QGN
1667 Points -51%
Score Write
Schenker XMG Neo 16 A25 5090
Kingston Fury Renegade SFYRS1000G
5482 Points +29%
Asus ROG Strix G16 G615
Micron 2500 1TB MTFDKBA1T0QGN
5036 Points +19%
Aorus Master 16 AM6J
Samsung PM9C1b MZVL81T0HFLB-00BTW
4249 Points
Alienware 16 Area-51
Samsung PM9C1a MZ9L81T0HDLB
3702 Points -13%
Average of class Gaming
  (1136 - 6457, n=96, last 2 years)
3545 Points -17%
Average Samsung PM9C1b MZVL81T0HFLB-00BTW
  (3208 - 4249, n=4)
3533 Points -17%
Aorus MASTER 16 AM6H
Kingston OM8PGP41024Q-A0
2588 Points -39%
Lenovo Legion Pro 7i 16 Gen 10
SK Hynix HFS001TEJ9X115N
1837 Points -57%
Seq Read
Schenker XMG Neo 16 A25 5090
Kingston Fury Renegade SFYRS1000G
9484 MB/s +66%
Aorus Master 16 AM6J
Samsung PM9C1b MZVL81T0HFLB-00BTW
5721.12 MB/s
Lenovo Legion Pro 7i 16 Gen 10
SK Hynix HFS001TEJ9X115N
5688.57 MB/s -1%
Average of class Gaming
  (2346 - 10091, n=96, last 2 years)
5590 MB/s -2%
Average Samsung PM9C1b MZVL81T0HFLB-00BTW
  (4948 - 5721, n=4)
5422 MB/s -5%
Asus ROG Strix G16 G615
Micron 2500 1TB MTFDKBA1T0QGN
5315 MB/s -7%
Alienware 16 Area-51
Samsung PM9C1a MZ9L81T0HDLB
5171.8 MB/s -10%
Aorus MASTER 16 AM6H
Kingston OM8PGP41024Q-A0
4092 MB/s -28%
Seq Write
Schenker XMG Neo 16 A25 5090
Kingston Fury Renegade SFYRS1000G
6039 MB/s +47%
Alienware 16 Area-51
Samsung PM9C1a MZ9L81T0HDLB
4188.64 MB/s +2%
Aorus Master 16 AM6J
Samsung PM9C1b MZVL81T0HFLB-00BTW
4108.74 MB/s
Average of class Gaming
  (114.5 - 10726, n=96, last 2 years)
3948 MB/s -4%
Average Samsung PM9C1b MZVL81T0HFLB-00BTW
  (2567 - 4528, n=4)
3683 MB/s -10%
Asus ROG Strix G16 G615
Micron 2500 1TB MTFDKBA1T0QGN
3444 MB/s -16%
Aorus MASTER 16 AM6H
Kingston OM8PGP41024Q-A0
3060 MB/s -26%
Lenovo Legion Pro 7i 16 Gen 10
SK Hynix HFS001TEJ9X115N
1587.46 MB/s -61%
4K Read
Aorus MASTER 16 AM6H
Kingston OM8PGP41024Q-A0
85 MB/s +20%
Alienware 16 Area-51
Samsung PM9C1a MZ9L81T0HDLB
81.16 MB/s +15%
Asus ROG Strix G16 G615
Micron 2500 1TB MTFDKBA1T0QGN
72.3 MB/s +2%
Average of class Gaming
  (36.4 - 108.4, n=96, last 2 years)
71.1 MB/s 0%
Aorus Master 16 AM6J
Samsung PM9C1b MZVL81T0HFLB-00BTW
70.8 MB/s
Average Samsung PM9C1b MZVL81T0HFLB-00BTW
  (65.7 - 74.7, n=4)
70.2 MB/s -1%
Schenker XMG Neo 16 A25 5090
Kingston Fury Renegade SFYRS1000G
66.4 MB/s -6%
Lenovo Legion Pro 7i 16 Gen 10
SK Hynix HFS001TEJ9X115N
63.16 MB/s -11%
4K Write
Asus ROG Strix G16 G615
Micron 2500 1TB MTFDKBA1T0QGN
283 MB/s +37%
Aorus MASTER 16 AM6H
Kingston OM8PGP41024Q-A0
271 MB/s +31%
Alienware 16 Area-51
Samsung PM9C1a MZ9L81T0HDLB
251.3 MB/s +22%
Lenovo Legion Pro 7i 16 Gen 10
SK Hynix HFS001TEJ9X115N
250.73 MB/s +21%
Schenker XMG Neo 16 A25 5090
Kingston Fury Renegade SFYRS1000G
225 MB/s +9%
Average of class Gaming
  (75.6 - 307, n=96, last 2 years)
215 MB/s +4%
Aorus Master 16 AM6J
Samsung PM9C1b MZVL81T0HFLB-00BTW
206.42 MB/s
Average Samsung PM9C1b MZVL81T0HFLB-00BTW
  (153.1 - 225, n=4)
202 MB/s -2%
4K-64 Read
Aorus Master 16 AM6J
Samsung PM9C1b MZVL81T0HFLB-00BTW
2784.09 MB/s
Alienware 16 Area-51
Samsung PM9C1a MZ9L81T0HDLB
2730.17 MB/s -2%
Lenovo Legion Pro 7i 16 Gen 10
SK Hynix HFS001TEJ9X115N
2602.02 MB/s -7%
Aorus MASTER 16 AM6H
Kingston OM8PGP41024Q-A0
2266 MB/s -19%
Average Samsung PM9C1b MZVL81T0HFLB-00BTW
  (583 - 2784, n=4)
1723 MB/s -38%
Average of class Gaming
  (517 - 3977, n=96, last 2 years)
1615 MB/s -42%
Asus ROG Strix G16 G615
Micron 2500 1TB MTFDKBA1T0QGN
1063 MB/s -62%
Schenker XMG Neo 16 A25 5090
Kingston Fury Renegade SFYRS1000G
854 MB/s -69%
4K-64 Write
Schenker XMG Neo 16 A25 5090
Kingston Fury Renegade SFYRS1000G
4653 MB/s +28%
Asus ROG Strix G16 G615
Micron 2500 1TB MTFDKBA1T0QGN
4408 MB/s +21%
Aorus Master 16 AM6J
Samsung PM9C1b MZVL81T0HFLB-00BTW
3631.52 MB/s
Alienware 16 Area-51
Samsung PM9C1a MZ9L81T0HDLB
3031.59 MB/s -17%
Average Samsung PM9C1b MZVL81T0HFLB-00BTW
  (2596 - 3632, n=4)
2963 MB/s -18%
Average of class Gaming
  (850 - 5356, n=96, last 2 years)
2936 MB/s -19%
Aorus MASTER 16 AM6H
Kingston OM8PGP41024Q-A0
2011 MB/s -45%
Lenovo Legion Pro 7i 16 Gen 10
SK Hynix HFS001TEJ9X115N
1427.9 MB/s -61%
Access Time Read
Aorus MASTER 16 AM6H
Kingston OM8PGP41024Q-A0
0.092 ms * -35%
Average Samsung PM9C1b MZVL81T0HFLB-00BTW
  (0.047 - 0.121, n=4)
0.07775 ms * -14%
Aorus Master 16 AM6J
Samsung PM9C1b MZVL81T0HFLB-00BTW
0.068 ms *
Average of class Gaming
  (0.017 - 0.623, n=96, last 2 years)
0.0639 ms * +6%
Alienware 16 Area-51
Samsung PM9C1a MZ9L81T0HDLB
0.06 ms * +12%
Lenovo Legion Pro 7i 16 Gen 10
SK Hynix HFS001TEJ9X115N
0.033 ms * +51%
Asus ROG Strix G16 G615
Micron 2500 1TB MTFDKBA1T0QGN
0.032 ms * +53%
Schenker XMG Neo 16 A25 5090
Kingston Fury Renegade SFYRS1000G
0.024 ms * +65%
Access Time Write
Lenovo Legion Pro 7i 16 Gen 10
SK Hynix HFS001TEJ9X115N
0.073 ms * -248%
Alienware 16 Area-51
Samsung PM9C1a MZ9L81T0HDLB
0.044 ms * -110%
Aorus MASTER 16 AM6H
Kingston OM8PGP41024Q-A0
0.04 ms * -90%
Average of class Gaming
  (0.012 - 0.277, n=96, last 2 years)
0.03814 ms * -82%
Aorus Master 16 AM6J
Samsung PM9C1b MZVL81T0HFLB-00BTW
0.021 ms *
Average Samsung PM9C1b MZVL81T0HFLB-00BTW
  (0.017 - 0.025, n=4)
0.0205 ms * +2%
Schenker XMG Neo 16 A25 5090
Kingston Fury Renegade SFYRS1000G
0.017 ms * +19%
Asus ROG Strix G16 G615
Micron 2500 1TB MTFDKBA1T0QGN
0.014 ms * +33%

* ... smaller is better

Sustained Read Performance: DiskSpd Read Loop, Queue Depth 8

02905808701160145017402030232026102900319034803770406043504640493052205510580060906380667069607250754078308120841087008990928095709860101501044010730110201131011600118901218012470127601305013340136301392014210Tooltip
Aorus Master 16 AM6J Samsung PM9C1b MZVL81T0HFLB-00BTW; diskspd 2.0.17 f: Ø5357 (5165.5-5625.19) MB/s
Alienware 16 Area-51 Samsung PM9C1a MZ9L81T0HDLB; diskspd 2.0.17 f: Ø6174 (5666.29-6193.3) MB/s
Asus ROG Strix G16 G615 Micron 2500 1TB MTFDKBA1T0QGN; diskspd 2.0.17 f: Ø6701 (2591.93-6810.51) MB/s
Lenovo Legion Pro 7i 16 Gen 10 SK Hynix HFS001TEJ9X115N; diskspd 2.0.17 f: Ø6982 (5720.4-7017.72) MB/s
Aorus MASTER 16 AM6H Kingston OM8PGP41024Q-A0; diskspd 2.0.17 f: Ø4793 (4467.44-4803.95) MB/s
Schenker XMG Neo 16 A25 5090 Kingston Fury Renegade SFYRS1000G; diskspd 2.0.17 f: Ø14274 (12676.44-14430.92) MB/s

GPU and gaming performance

The GeForce RTX 5080 is currently Nvidia’s second-fastest laptop GPU. Its 16 GB of GDDR7 VRAM is adequate in 2026, and the 16-inch laptop rarely runs into VRAM limitations, even in demanding games. Like the CPU, the graphics card delivered pleasingly consistent performance. We also encountered no anomalies in the 3DMark tests or our gaming benchmark suite. In general, the Master 16 can run nearly every game smoothly at maximum settings at its native QHD+ resolution of 2,560 × 1,600 pixels, even with ray tracing enabled.

3DMark Performance rating - Percent
Schenker XMG Neo 16 A25 5090
NVIDIA GeForce RTX 5090 Laptop
99 pt
Aorus MASTER 16 AM6H -1!
NVIDIA GeForce RTX 5090 Laptop
91.1 pt
Lenovo Legion Pro 7i 16 Gen 10
NVIDIA GeForce RTX 5080 Laptop
90.6 pt
Alienware 16 Area-51
NVIDIA GeForce RTX 5080 Laptop
85.2 pt
Aorus Master 16 AM6J
NVIDIA GeForce RTX 5080 Laptop
81.7 pt
Average NVIDIA GeForce RTX 5080 Laptop
 
81.6 pt
Asus ROG Strix G16 G615
NVIDIA GeForce RTX 5080 Laptop
81.4 pt
Average of class Gaming
 
66.3 pt
3DMark 11 - 1280x720 Performance GPU
Lenovo Legion Pro 7i 16 Gen 10
NVIDIA GeForce RTX 5080 Laptop
71866 Points +17%
Aorus MASTER 16 AM6H
NVIDIA GeForce RTX 5090 Laptop
70815 Points +15%
Schenker XMG Neo 16 A25 5090
NVIDIA GeForce RTX 5090 Laptop
69089 Points +12%
Alienware 16 Area-51
NVIDIA GeForce RTX 5080 Laptop
64943 Points +5%
Aorus Master 16 AM6J
NVIDIA GeForce RTX 5080 Laptop
61571 Points
Asus ROG Strix G16 G615
NVIDIA GeForce RTX 5080 Laptop
61156 Points -1%
Average NVIDIA GeForce RTX 5080 Laptop
  (26017 - 71866, n=18)
60125 Points -2%
Average of class Gaming
  (21841 - 80022, n=102, last 2 years)
50440 Points -18%
3DMark
1920x1080 Fire Strike Graphics
Schenker XMG Neo 16 A25 5090
NVIDIA GeForce RTX 5090 Laptop
62849 Points +34%
Lenovo Legion Pro 7i 16 Gen 10
NVIDIA GeForce RTX 5080 Laptop
49153 Points +5%
Asus ROG Strix G16 G615
NVIDIA GeForce RTX 5080 Laptop
48891 Points +4%
Average NVIDIA GeForce RTX 5080 Laptop
  (39184 - 58176, n=19)
48054 Points +3%
Alienware 16 Area-51
NVIDIA GeForce RTX 5080 Laptop
47367 Points +1%
Aorus MASTER 16 AM6H
NVIDIA GeForce RTX 5090 Laptop
47034 Points 0%
Aorus Master 16 AM6J
NVIDIA GeForce RTX 5080 Laptop
46816 Points
Average of class Gaming
  (18629 - 62849, n=112, last 2 years)
39465 Points -16%
2560x1440 Time Spy Graphics
Aorus MASTER 16 AM6H
NVIDIA GeForce RTX 5090 Laptop
24563 Points +25%
Schenker XMG Neo 16 A25 5090
NVIDIA GeForce RTX 5090 Laptop
24483 Points +24%
Lenovo Legion Pro 7i 16 Gen 10
NVIDIA GeForce RTX 5080 Laptop
23003 Points +17%
Alienware 16 Area-51
NVIDIA GeForce RTX 5080 Laptop
21724 Points +10%
Asus ROG Strix G16 G615
NVIDIA GeForce RTX 5080 Laptop
21571 Points +10%
Average NVIDIA GeForce RTX 5080 Laptop
  (16465 - 23269, n=17)
20846 Points +6%
Aorus Master 16 AM6J
NVIDIA GeForce RTX 5080 Laptop
19673 Points
Average of class Gaming
  (6387 - 26212, n=112, last 2 years)
16097 Points -18%
2560x1440 Port Royal Graphics
Schenker XMG Neo 16 A25 5090
NVIDIA GeForce RTX 5090 Laptop
16143 Points +16%
Lenovo Legion Pro 7i 16 Gen 10
NVIDIA GeForce RTX 5080 Laptop
14620 Points +5%
Alienware 16 Area-51
NVIDIA GeForce RTX 5080 Laptop
14014 Points 0%
Aorus Master 16 AM6J
NVIDIA GeForce RTX 5080 Laptop
13967 Points
Average NVIDIA GeForce RTX 5080 Laptop
  (10898 - 14853, n=13)
13124 Points -6%
Asus ROG Strix G16 G615
NVIDIA GeForce RTX 5080 Laptop
12068 Points -14%
Average of class Gaming
  (4395 - 17286, n=71, last 2 years)
10797 Points -23%
3DMark 11 Performance
50397 points
3DMark Fire Strike Score
41128 points
3DMark Time Spy Score
18453 points
Help
Blender
v3.3 Classroom OPTIX/RTX
Average of class Gaming
  (9 - 32, n=102, last 2 years)
18.1 Seconds * -29%
Aorus Master 16 AM6J
NVIDIA GeForce RTX 5080 Laptop, AMD Ryzen 9 9955HX3D
14 Seconds *
Average NVIDIA GeForce RTX 5080 Laptop
  (11 - 17, n=15)
13.3 Seconds * +5%
Alienware 16 Area-51
NVIDIA GeForce RTX 5080 Laptop, Intel Core Ultra 9 275HX
13 Seconds * +7%
Lenovo Legion Pro 7i 16 Gen 10
NVIDIA GeForce RTX 5080 Laptop, Intel Core Ultra 9 275HX
12 Seconds * +14%
Asus ROG Strix G16 G615
NVIDIA GeForce RTX 5080 Laptop, Intel Core Ultra 9 275HX
11.6 Seconds * +17%
Aorus MASTER 16 AM6H
NVIDIA GeForce RTX 5090 Laptop, Intel Core Ultra 9 275HX
11 Seconds * +21%
Schenker XMG Neo 16 A25 5090
NVIDIA GeForce RTX 5090 Laptop, AMD Ryzen 9 9955HX3D
9 Seconds * +36%
v3.3 Classroom CUDA
Average of class Gaming
  (15 - 228, n=102, last 2 years)
32 Seconds * -45%
Average NVIDIA GeForce RTX 5080 Laptop
  (18 - 49, n=17)
22.1 Seconds * -0%
Aorus Master 16 AM6J
NVIDIA GeForce RTX 5080 Laptop, AMD Ryzen 9 9955HX3D
22 Seconds *
Asus ROG Strix G16 G615
NVIDIA GeForce RTX 5080 Laptop, Intel Core Ultra 9 275HX
20 Seconds * +9%
Alienware 16 Area-51
NVIDIA GeForce RTX 5080 Laptop, Intel Core Ultra 9 275HX
19 Seconds * +14%
Lenovo Legion Pro 7i 16 Gen 10
NVIDIA GeForce RTX 5080 Laptop, Intel Core Ultra 9 275HX
18 Seconds * +18%
Aorus MASTER 16 AM6H
NVIDIA GeForce RTX 5090 Laptop, Intel Core Ultra 9 275HX
16 Seconds * +27%
Schenker XMG Neo 16 A25 5090
NVIDIA GeForce RTX 5090 Laptop, AMD Ryzen 9 9955HX3D
15 Seconds * +32%

* ... smaller is better

Performance rating - Percent
Schenker XMG Neo 16 A25 5090
GeForce RTX 5090 Laptop, R9 9955HX3D
96.1 pt
Aorus Master 16 AM6J
GeForce RTX 5080 Laptop, R9 9955HX3D
96 pt
Lenovo Legion Pro 7i 16 Gen 10
GeForce RTX 5080 Laptop, Ultra 9 275HX
84.7 pt
Asus ROG Strix G16 G615
GeForce RTX 5080 Laptop, Ultra 9 275HX
77.4 pt
Aorus MASTER 16 AM6H
GeForce RTX 5090 Laptop, Ultra 9 275HX
75.4 pt
Alienware 16 Area-51
GeForce RTX 5080 Laptop, Ultra 9 275HX
73.8 pt
Average of class Gaming
 
65.8 pt
Cyberpunk 2077 - 1920x1080 Ultra Preset (FSR off)
Schenker XMG Neo 16 A25 5090
GeForce RTX 5090 Laptop, R9 9955HX3D
164 (130.9min) fps +13%
Lenovo Legion Pro 7i 16 Gen 10
GeForce RTX 5080 Laptop, Ultra 9 275HX
156.2 (125.7min, 114.4P1) fps +8%
Aorus Master 16 AM6J
GeForce RTX 5080 Laptop, R9 9955HX3D
144.5 (116min) fps
Asus ROG Strix G16 G615
GeForce RTX 5080 Laptop, Ultra 9 275HX
144.3 (118.2min) fps 0%
Aorus MASTER 16 AM6H
GeForce RTX 5090 Laptop, Ultra 9 275HX
137.5 (102min) fps -5%
Alienware 16 Area-51
GeForce RTX 5080 Laptop, Ultra 9 275HX
135.1 (102.3min, 90.4P1) fps -7%
Average of class Gaming
  (47.3 - 169.9, n=111, last 2 years)
111.4 fps -23%
Dota 2 Reborn - 1920x1080 ultra (3/3) best looking
Aorus Master 16 AM6J
GeForce RTX 5080 Laptop, R9 9955HX3D
252 (201.5min) fps
Schenker XMG Neo 16 A25 5090
GeForce RTX 5090 Laptop, R9 9955HX3D
248 (195.9min) fps -2%
Lenovo Legion Pro 7i 16 Gen 10
GeForce RTX 5080 Laptop, Ultra 9 275HX
188.9 (155.7min) fps -25%
Asus ROG Strix G16 G615
GeForce RTX 5080 Laptop, Ultra 9 275HX
175.5 (149.8min) fps -30%
Aorus MASTER 16 AM6H
GeForce RTX 5090 Laptop, Ultra 9 275HX
166.4 (141.2min) fps -34%
Alienware 16 Area-51
GeForce RTX 5080 Laptop, Ultra 9 275HX
160.4 (131.9min) fps -36%
Average of class Gaming
  (84.8 - 252, n=103, last 2 years)
156.2 fps -38%
X-Plane 11.11 - 1920x1080 high (fps_test=3)
Aorus Master 16 AM6J
GeForce RTX 5080 Laptop, R9 9955HX3D
148.5 fps
Schenker XMG Neo 16 A25 5090
GeForce RTX 5090 Laptop, R9 9955HX3D
133.6 fps -10%
Lenovo Legion Pro 7i 16 Gen 10
GeForce RTX 5080 Laptop, Ultra 9 275HX
124.5 fps -16%
Aorus MASTER 16 AM6H
GeForce RTX 5090 Laptop, Ultra 9 275HX
113.2 fps -24%
Alienware 16 Area-51
GeForce RTX 5080 Laptop, Ultra 9 275HX
111.9 fps -25%
Asus ROG Strix G16 G615
GeForce RTX 5080 Laptop, Ultra 9 275HX
110.6 fps -26%
Average of class Gaming
  (55.5 - 148.5, n=105, last 2 years)
100.2 fps -33%
lowmed.highultraQHD
Dota 2 Reborn (2015) 280 252
X-Plane 11.11 (2018) 148.5
Baldur's Gate 3 (2023) 177 175 123
Cyberpunk 2077 (2023) 169.3 144.5 99.8
Resident Evil Requiem (2026) 168.3 87.5 56.9
Death Stranding 2 (2026) 109.5 87.5 67
Crimson Desert (2026) 106.8 94.9 73.2
Pragmata (2026) 140 101.9
007 First Light (2026) 100.9 96.3 66.4
Assassin's Creed Black Flag Resynced (2026) 97 64 50

Cyberpunk 2077 Ultra FPS Chart

05101520253035404550556065707580859095100105110115120125130135140145150155Tooltip
Aorus Master 16 AM6J R9 9955HX3D, GeForce RTX 5080 Laptop: Ø131.8 (127.2-134.8) fps
Alienware 16 Area-51 Ultra 9 275HX, GeForce RTX 5080 Laptop: Ø129.1 (108.4-139.7) fps
Asus ROG Strix G16 G615 Ultra 9 275HX, GeForce RTX 5080 Laptop: Ø128.4 (121.7-130.5) fps
Lenovo Legion Pro 7i 16 Gen 10 Ultra 9 275HX, GeForce RTX 5080 Laptop: Ø140.9 (134-145) fps
Aorus MASTER 16 AM6H Ultra 9 275HX, GeForce RTX 5090 Laptop: Ø135 (123.2-138.2) fps
Schenker XMG Neo 16 A25 5090 R9 9955HX3D, GeForce RTX 5090 Laptop: Ø152.6 (146-156) fps

Emissions & energy

System noise

By far the biggest drawback of the 16-inch laptop is its excessive fan noise. Under load, the system approaches 60 dB(A) in Game mode, a level that most users will find uncomfortably loud. The fans also ramp up considerably at times while the laptop is idling or performing simple tasks—an area in which other manufacturers do a better job.

Noise level

Idle
28 / 29 / 35 dB(A)
Load
58 / 60 dB(A)
  red to green bar
 
 
30 dB
silent
40 dB(A)
audible
50 dB(A)
loud
 
min: dark, med: mid, max: light   Earthworks M23R, Arta (15 cm distance)   environment noise: 25 dB(A)
Aorus Master 16 AM6J
R9 9955HX3D, GeForce RTX 5080 Laptop
Alienware 16 Area-51
Ultra 9 275HX, GeForce RTX 5080 Laptop
Asus ROG Strix G16 G615
Ultra 9 275HX, GeForce RTX 5080 Laptop
Lenovo Legion Pro 7i 16 Gen 10
Ultra 9 275HX, GeForce RTX 5080 Laptop
Aorus MASTER 16 AM6H
Ultra 9 275HX, GeForce RTX 5090 Laptop
Schenker XMG Neo 16 A25 5090
R9 9955HX3D, GeForce RTX 5090 Laptop
Noise
16%
11%
20%
16%
12%
off / environment * (dB)
25
23.6
6%
24
4%
22.9
8%
23
8%
24.1
4%
Idle Minimum * (dB)
28
25.4
9%
24
14%
22.9
18%
23
18%
25.6
9%
Idle Average * (dB)
29
27.8
4%
30.1
-4%
22.9
21%
23
21%
25.6
12%
Idle Maximum * (dB)
35
28.1
20%
30.1
14%
26.3
25%
23
34%
25.6
27%
Load Average * (dB)
58
28.8
50%
41.1
29%
27.8
52%
40.46
30%
47.2
19%
Cyberpunk 2077 ultra * (dB)
59
50.4
15%
54.2
8%
54.2
8%
59.75
-1%
55.5
6%
Load Maximum * (dB)
60
56.4
6%
54.2
10%
53.9
10%
59.75
-0%
55.5
7%

* ... smaller is better

Temperature

In addition to producing more noise, the Master 16 also reaches higher temperatures than some of its competitors in certain areas. During our stress test with FurMark and Prime95, parts of both the top and bottom surfaces exceeded 50 °C.
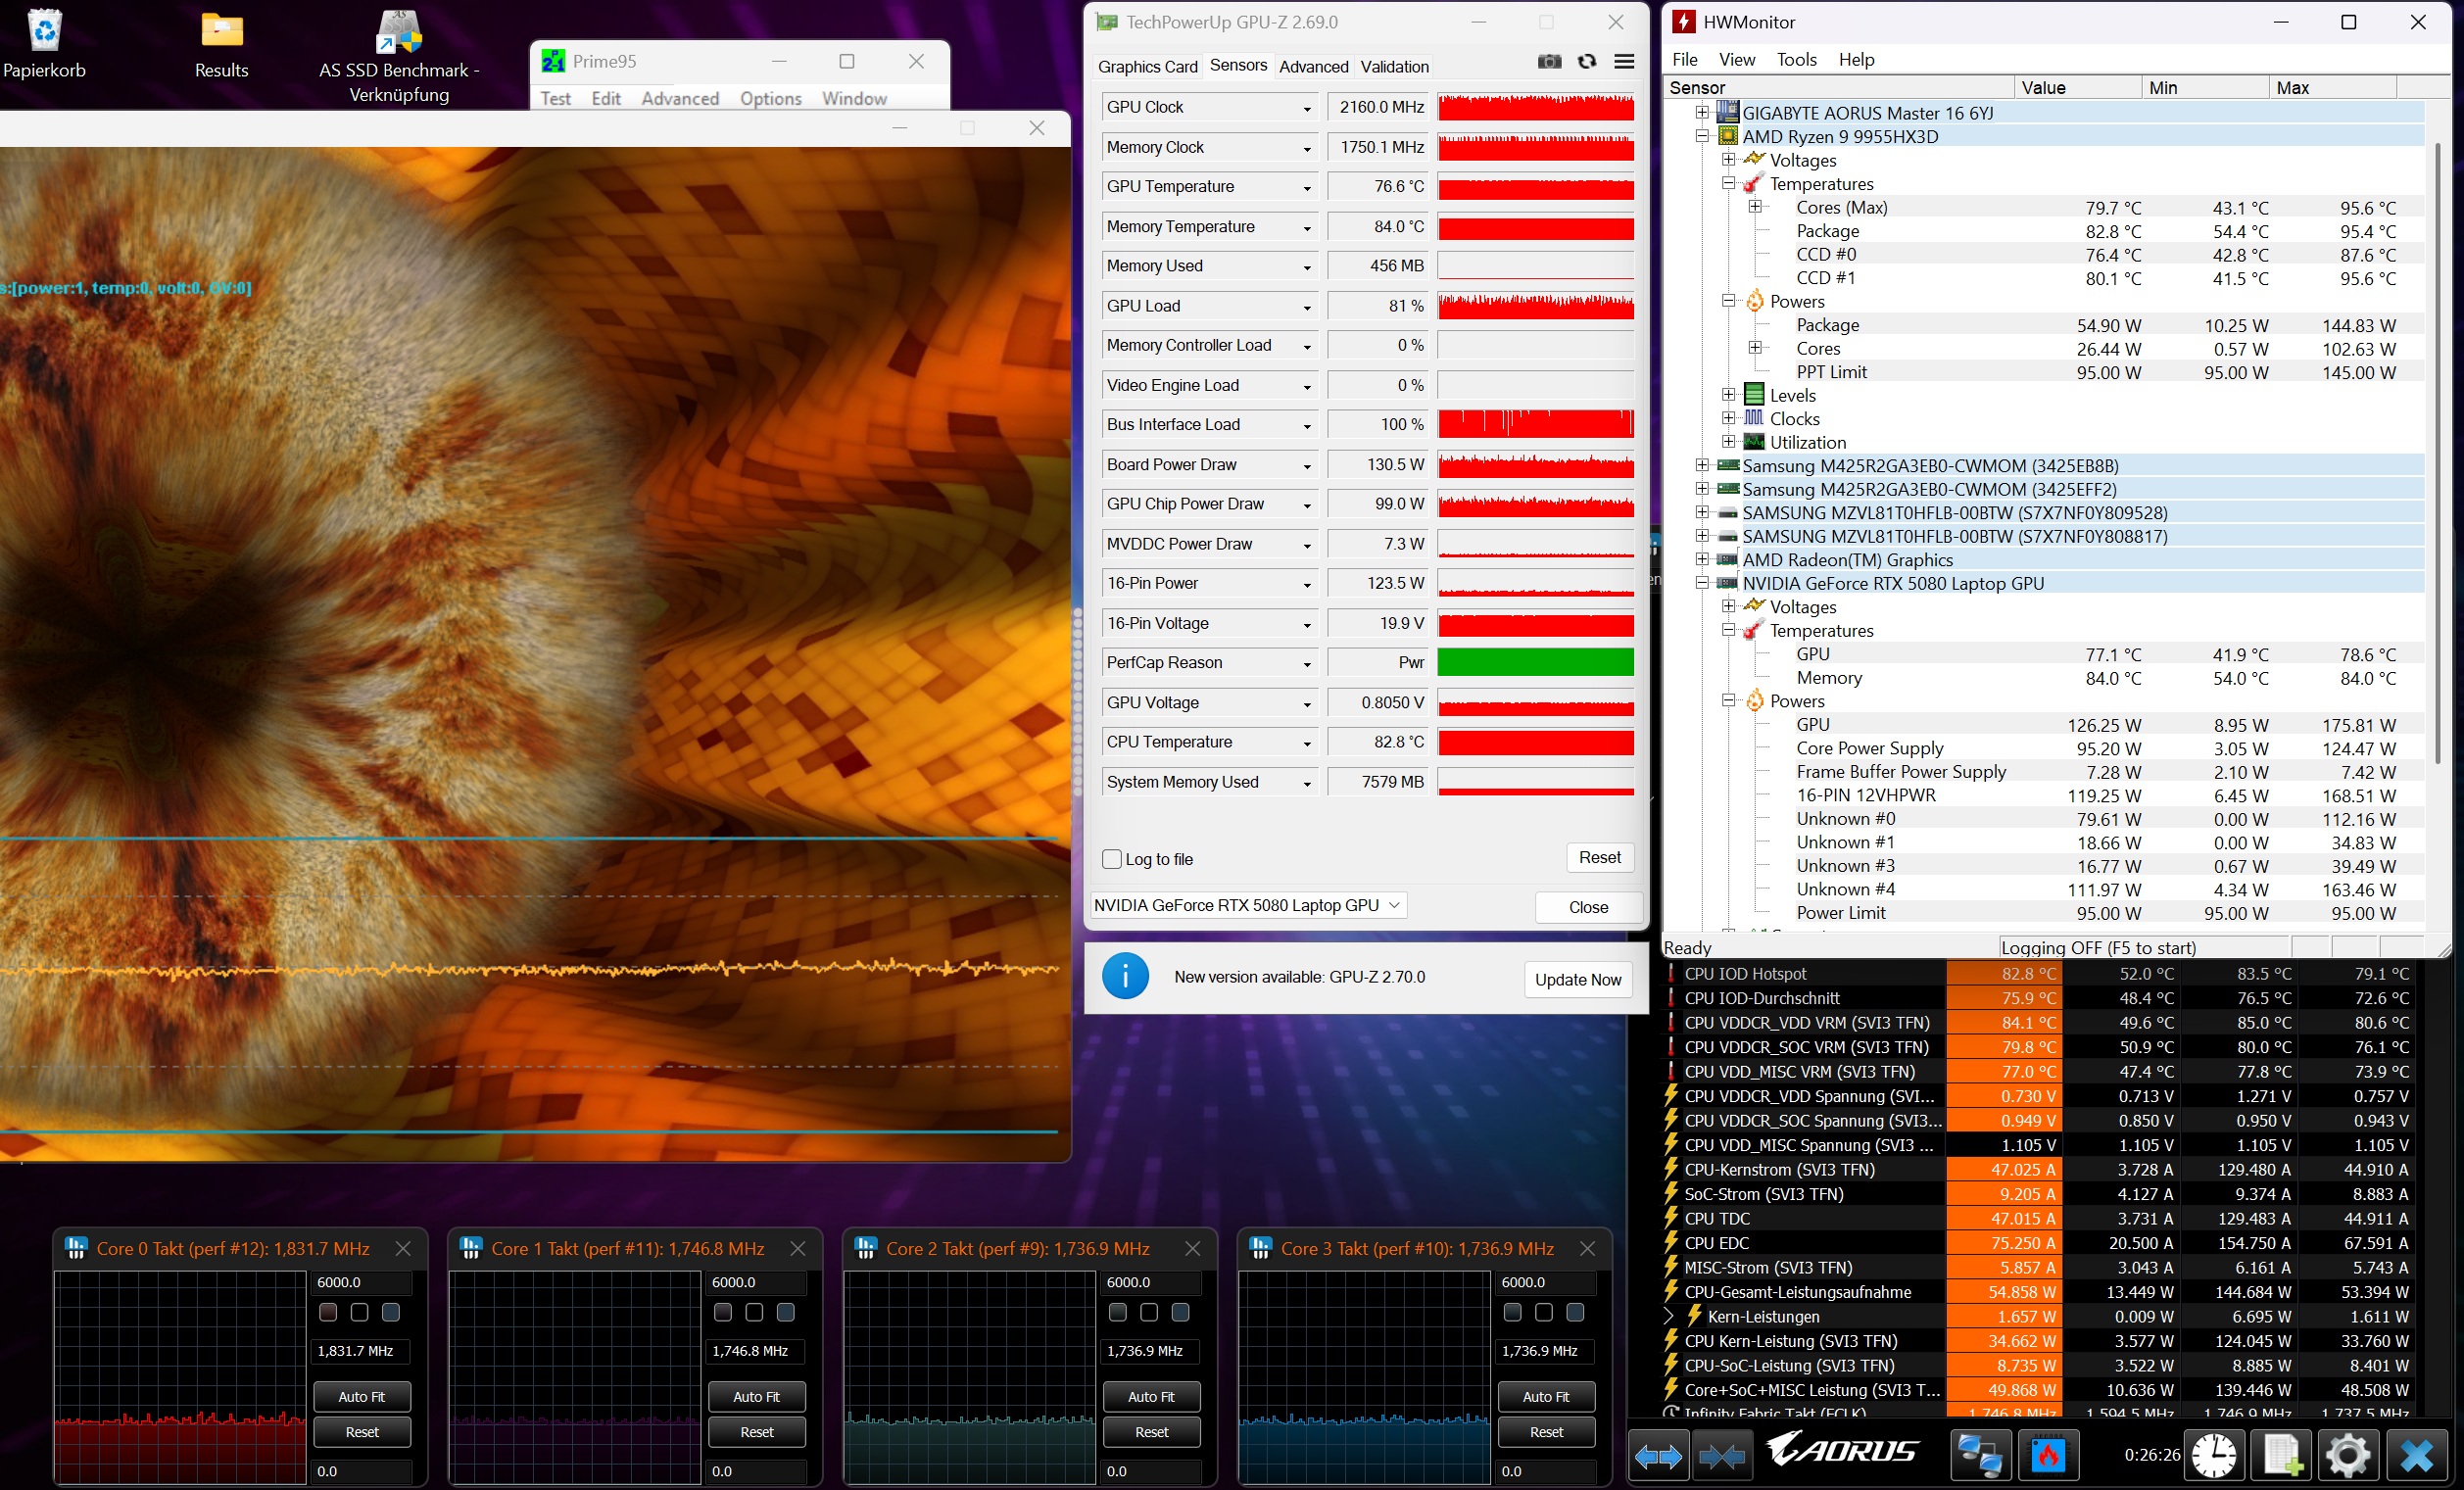
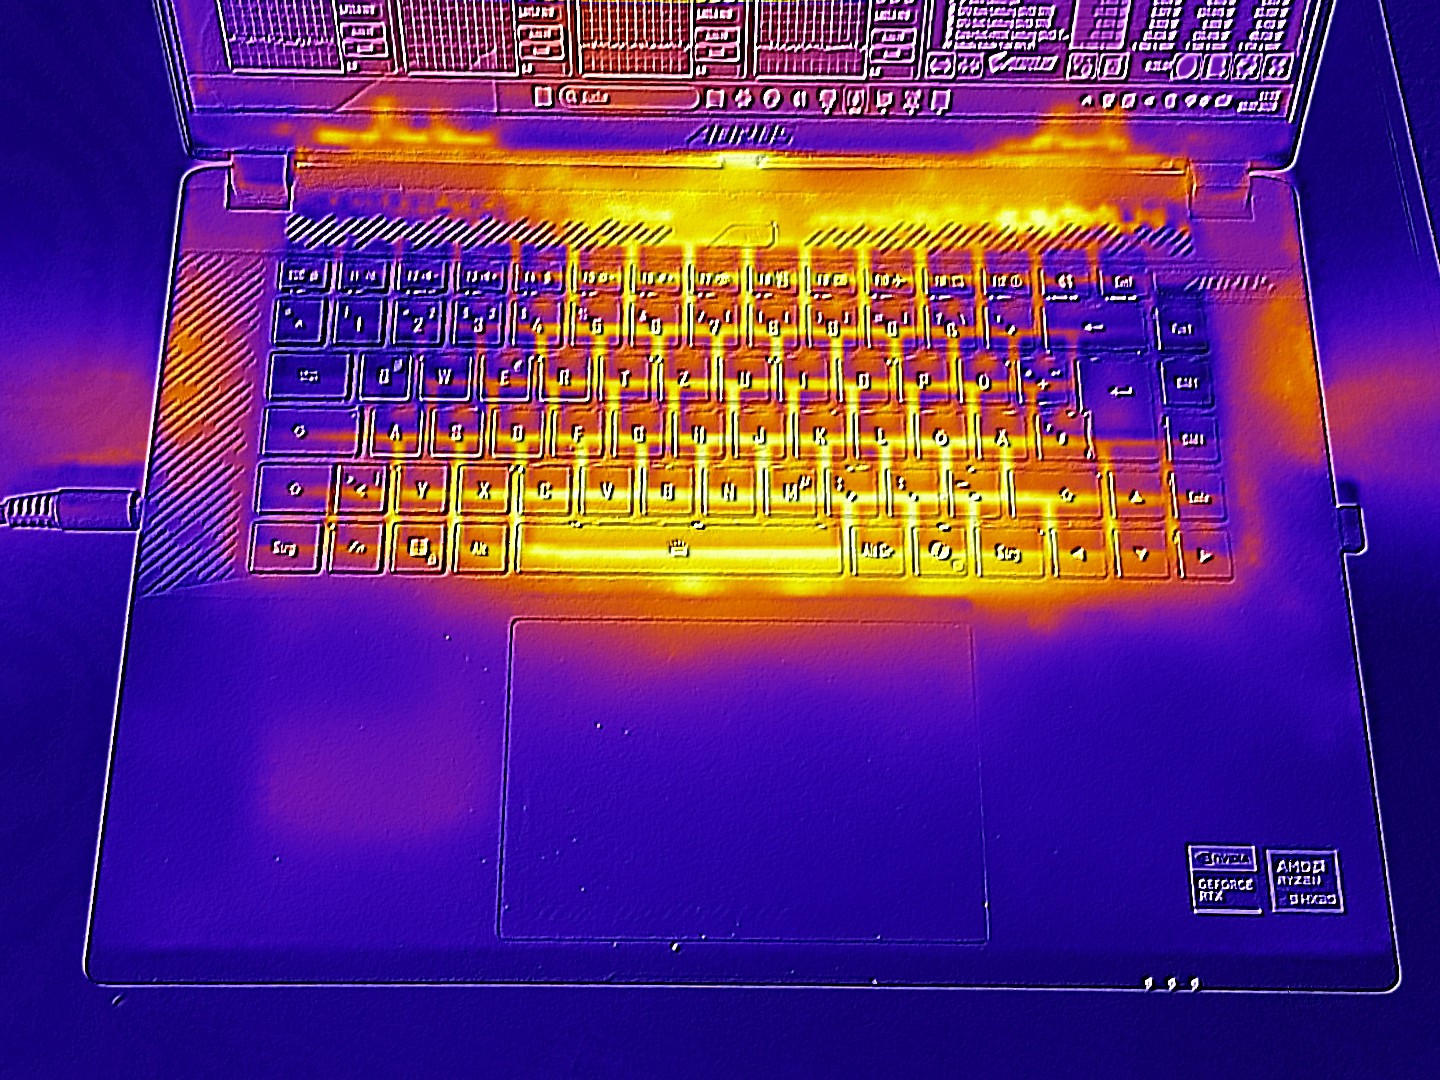
Stress Test
Stress Test
Stress Test
Max. Load
 48 °C
118 F
50 °C
122 F
49 °C
120 F
 
 48 °C
118 F
49 °C
120 F
48 °C
118 F
 
 32 °C
90 F
35 °C
95 F
29 °C
84 F
 
Maximum: 50 °C = 122 F
Average: 43.1 °C = 110 F
51 °C
124 F
52 °C
126 F
45 °C
113 F
44 °C
111 F
46 °C
115 F
40 °C
104 F
37 °C
99 F
37 °C
99 F
35 °C
95 F
Maximum: 52 °C = 126 F
Average: 43 °C = 109 F
Power Supply (max.)  54 °C = 129 F | Room Temperature 23 °C = 73 F | Fluke t3000FC (calibrated), Voltcraft IR-900
(-) The average temperature for the upper side under maximal load is 43.1 °C / 110 F, compared to the average of 33.9 °C / 93 F for the devices in the class Gaming.
(-) The maximum temperature on the upper side is 50 °C / 122 F, compared to the average of 40.4 °C / 105 F, ranging from 21.2 to 68.8 °C for the class Gaming.
(-) The bottom heats up to a maximum of 52 °C / 126 F, compared to the average of 43.2 °C / 110 F
(+) The palmrests and touchpad are reaching skin temperature as a maximum (35 °C / 95 F) and are therefore not hot.
(-) The average temperature of the palmrest area of similar devices was 28.8 °C / 83.8 F (-6.2 °C / -11.2 F).
Aorus Master 16 AM6J
R9 9955HX3D, GeForce RTX 5080 Laptop
Alienware 16 Area-51
Ultra 9 275HX, GeForce RTX 5080 Laptop
Asus ROG Strix G16 G615
Ultra 9 275HX, GeForce RTX 5080 Laptop
Lenovo Legion Pro 7i 16 Gen 10
Ultra 9 275HX, GeForce RTX 5080 Laptop
Aorus MASTER 16 AM6H
Ultra 9 275HX, GeForce RTX 5090 Laptop
Schenker XMG Neo 16 A25 5090
R9 9955HX3D, GeForce RTX 5090 Laptop
Heat
18%
13%
18%
12%
11%
Maximum Upper Side * (°C)
50
43.8
12%
39.6
21%
42.6
15%
39
22%
46.3
7%
Maximum Bottom * (°C)
52
40
23%
49.7
4%
41.2
21%
51
2%
44.3
15%
Idle Upper Side * (°C)
35.8
26.3
32.6
36
30
Idle Bottom * (°C)
35.2
27.3
32.4
38
31.1

* ... smaller is better

Speakers

Sound quality is decent to good overall, with the usual weakness in bass reproduction.

dB(A) 0102030405060708090Deep BassMiddle BassHigh BassLower RangeMidsHigher MidsLower HighsMid HighsUpper HighsSuper Highs2041.340.12536.436.4314641.54031.233.25040.340.46322.736.18018.339.910016.346.612515.253.616016.855.720020.658.525015.463.631513.871.140012.675.650011.776.463012.477.580011.974.9100011.671.9125011.872.6160011.472.6200011.371.725001271.731501367.740001366.9500013.164630013.265.7800013.359.61000012.955.81250012.753.81600012.751.4SPL24.983.5N0.659median 12.9median 66.9Delta1.1734.938.834.92826.12826.722.426.725.620.225.629.326.529.328.524.328.529.523.129.530.121.930.134.516.434.546.117.746.159.219.959.268.419.568.474.721.474.774.220.774.271.719.571.773.417.873.477.316.977.376.117.476.172.616.672.673.216.673.27414.87473.715.273.77613.37678.312.378.381.312.281.381.112.181.177.31277.375.511.975.570.311.970.367.910.967.988.927.888.982.8182.8median 74median 16.6median 7463.7643.542.930.238.225.837.129.943.925.83823.836.319.647.520.353.817.25815.756.518.862.9206416.569.31268.410.268.310.271.21071.710.467.89.869.210.773.111.175.311.463.611.66311.966.712.172.412.668.112.569.512.764.71461.712.956.52482.20.556.8median 12.1median 67.82.63.533.231.533.225.322.825.32223.52226.521.126.521.921.521.929.12329.140.12240.145.717.645.752.314.352.36114.96167.113.267.167.612.667.664.312.764.368.411.368.471.910.571.974.211.374.274.89.374.868.49.268.468.49.568.470.71070.772.410.272.467.210.767.263.81163.86512.36565146563.512.763.568.613.668.666.713.766.764.114.564.159.116.559.181.423.981.455.10.555.1median 67.1median 12.6median 67.12.51.82.531.530.231.539.731.539.738.932.138.925.532.425.529.53329.531.622.531.634.81434.833.515.833.538.613.838.647.713.447.753.115.853.15918.45959.119.259.160.711.660.763.99.663.966.87.866.86686664.78.464.761.18.361.164.19.264.163.39.663.362.810.662.859.710.859.761.111.461.164.511.664.565.311.965.362.912.362.961.11361.156.612.156.646.612.246.675.423.375.438.50.538.5median 61.1median 11.6median 61.15.92.45.936.344.528.735.227.129.528.728.724.431.923.435.519.841.818.452.417.35717.955.418.362.117.963.715.96712.268.311.172.610.176.310.577.810.474.510.773.810.772.710.671.811.463.112.365.412.469.812.267.812.270.612.366.312.464.912.259.311.755.82483.80.561.3median 12.2median 672.35.6hearing rangehide median Pink NoiseAorus Master 16 AM6JAlienware 16 Area-51Asus ROG Strix G16 G615Lenovo Legion Pro 7i 16 Gen 10Aorus MASTER 16 AM6HSchenker XMG Neo 16 A25 5090
Frequency diagram (checkboxes can be checked and unchecked to compare devices)
Aorus Master 16 AM6J audio analysis

(+) | speakers can play relatively loud (84 dB)
Bass 100 - 315 Hz
(±) | reduced bass - on average 10.1% lower than median
(±) | linearity of bass is average (9.6% delta to prev. frequency)
Mids 400 - 2000 Hz
(±) | higher mids - on average 7.2% higher than median
(+) | mids are linear (3.2% delta to prev. frequency)
Highs 2 - 16 kHz
(+) | balanced highs - only 4% away from median
(+) | highs are linear (5.1% delta to prev. frequency)
Overall 100 - 16.000 Hz
(+) | overall sound is linear (14.8% difference to median)
Compared to same class
» 29% of all tested devices in this class were better, 7% similar, 63% worse
» The best had a delta of 6%, average was 18%, worst was 132%
Compared to all devices tested
» 20% of all tested devices were better, 4% similar, 76% worse
» The best had a delta of 4%, average was 23%, worst was 134%

Alienware 16 Area-51 audio analysis

(+) | speakers can play relatively loud (88.9 dB)
Bass 100 - 315 Hz
(-) | nearly no bass - on average 22.1% lower than median
(±) | linearity of bass is average (13.1% delta to prev. frequency)
Mids 400 - 2000 Hz
(+) | balanced mids - only 1.4% away from median
(+) | mids are linear (3.2% delta to prev. frequency)
Highs 2 - 16 kHz
(+) | balanced highs - only 3.7% away from median
(+) | highs are linear (3.4% delta to prev. frequency)
Overall 100 - 16.000 Hz
(+) | overall sound is linear (14.1% difference to median)
Compared to same class
» 24% of all tested devices in this class were better, 8% similar, 68% worse
» The best had a delta of 6%, average was 18%, worst was 132%
Compared to all devices tested
» 17% of all tested devices were better, 4% similar, 79% worse
» The best had a delta of 4%, average was 23%, worst was 134%

Asus ROG Strix G16 G615 audio analysis

(+) | speakers can play relatively loud (82.2 dB)
Bass 100 - 315 Hz
(±) | reduced bass - on average 7.5% lower than median
(±) | linearity of bass is average (7.4% delta to prev. frequency)
Mids 400 - 2000 Hz
(+) | balanced mids - only 2.9% away from median
(+) | mids are linear (3.6% delta to prev. frequency)
Highs 2 - 16 kHz
(+) | balanced highs - only 2.8% away from median
(±) | linearity of highs is average (8.3% delta to prev. frequency)
Overall 100 - 16.000 Hz
(+) | overall sound is linear (9.4% difference to median)
Compared to same class
» 3% of all tested devices in this class were better, 2% similar, 95% worse
» The best had a delta of 6%, average was 18%, worst was 132%
Compared to all devices tested
» 4% of all tested devices were better, 1% similar, 96% worse
» The best had a delta of 4%, average was 23%, worst was 134%

Lenovo Legion Pro 7i 16 Gen 10 audio analysis

(±) | speaker loudness is average but good (81.4 dB)
Bass 100 - 315 Hz
(±) | reduced bass - on average 7.6% lower than median
(±) | linearity of bass is average (9.4% delta to prev. frequency)
Mids 400 - 2000 Hz
(+) | balanced mids - only 4.1% away from median
(+) | mids are linear (4.8% delta to prev. frequency)
Highs 2 - 16 kHz
(+) | balanced highs - only 1.9% away from median
(+) | highs are linear (4.8% delta to prev. frequency)
Overall 100 - 16.000 Hz
(+) | overall sound is linear (9.4% difference to median)
Compared to same class
» 3% of all tested devices in this class were better, 2% similar, 95% worse
» The best had a delta of 6%, average was 18%, worst was 132%
Compared to all devices tested
» 4% of all tested devices were better, 1% similar, 96% worse
» The best had a delta of 4%, average was 23%, worst was 134%

Aorus MASTER 16 AM6H audio analysis

(±) | speaker loudness is average but good (75.36 dB)
Bass 100 - 315 Hz
(±) | reduced bass - on average 12.6% lower than median
(±) | linearity of bass is average (9% delta to prev. frequency)
Mids 400 - 2000 Hz
(+) | balanced mids - only 2.8% away from median
(+) | mids are linear (4.4% delta to prev. frequency)
Highs 2 - 16 kHz
(+) | balanced highs - only 1.8% away from median
(+) | highs are linear (3.8% delta to prev. frequency)
Overall 100 - 16.000 Hz
(+) | overall sound is linear (13.5% difference to median)
Compared to same class
» 20% of all tested devices in this class were better, 7% similar, 73% worse
» The best had a delta of 6%, average was 18%, worst was 132%
Compared to all devices tested
» 14% of all tested devices were better, 4% similar, 82% worse
» The best had a delta of 4%, average was 23%, worst was 134%

Schenker XMG Neo 16 A25 5090 audio analysis

(+) | speakers can play relatively loud (83.8 dB)
Bass 100 - 315 Hz
(±) | reduced bass - on average 7.3% lower than median
(±) | linearity of bass is average (8.6% delta to prev. frequency)
Mids 400 - 2000 Hz
(±) | higher mids - on average 6.5% higher than median
(+) | mids are linear (3.8% delta to prev. frequency)
Highs 2 - 16 kHz
(+) | balanced highs - only 2.2% away from median
(+) | highs are linear (6.8% delta to prev. frequency)
Overall 100 - 16.000 Hz
(+) | overall sound is linear (11.2% difference to median)
Compared to same class
» 8% of all tested devices in this class were better, 4% similar, 88% worse
» The best had a delta of 6%, average was 18%, worst was 132%
Compared to all devices tested
» 7% of all tested devices were better, 2% similar, 91% worse
» The best had a delta of 4%, average was 23%, worst was 134%

Power consumption and battery life

While the Intel/RTX 5090 version appeared to be affected by an idle-power-consumption bug, the current model posted unremarkable readings of around 14 to 19 watts.

The older test unit performed better on battery power, however. Whereas it lasted just under 7 hours in our Wi-Fi test, the AMD/RTX 5080 version managed only a little over 5 hours.

Power Consumption
Off / Standbydarklight 0.1 / 1.4 Watt
Idledarkmidlight 14.4 / 16.8 / 19.3 Watt
Load midlight 151 / 338 Watt
 color bar
Key: min: dark, med: mid, max: light        Metrahit Energy
Aorus Master 16 AM6J
R9 9955HX3D, GeForce RTX 5080 Laptop
Alienware 16 Area-51
Ultra 9 275HX, GeForce RTX 5080 Laptop
Asus ROG Strix G16 G615
Ultra 9 275HX, GeForce RTX 5080 Laptop
Lenovo Legion Pro 7i 16 Gen 10
Ultra 9 275HX, GeForce RTX 5080 Laptop
Aorus MASTER 16 AM6H
Ultra 9 275HX, GeForce RTX 5090 Laptop
Schenker XMG Neo 16 A25 5090
R9 9955HX3D, GeForce RTX 5090 Laptop
Average of class Gaming
 
Power Consumption
-48%
3%
-64%
-31%
-2%
3%
Idle Minimum * (Watt)
14.4
27
-88%
10.8
25%
28.5
-98%
25
-74%
13.2
8%
Idle Average * (Watt)
16.8
33.5
-99%
17.7
-5%
38.8
-131%
29.4
-75%
16.8
-0%
Idle Maximum * (Watt)
19.3
41.4
-115%
18.8
3%
45.6
-136%
31
-61%
17.1
11%
Load Average * (Watt)
151
124.7
17%
139.4
8%
132.2
12%
109
28%
164.2
-9%
Cyberpunk 2077 ultra * (Watt)
272
256
6%
295
-8%
318
-17%
290
-7%
284
-4%
Load Maximum * (Watt)
338
367.2
-9%
359.3
-6%
384
-14%
325
4%
392.8
-16%
Cyberpunk 2077 ultra external monitor * (Watt)
249
291
319
292
282

* ... smaller is better

Battery Runtime
WiFi Websurfing
5h 14min
Aorus Master 16 AM6J
R9 9955HX3D, GeForce RTX 5080 Laptop, 99 Wh
Alienware 16 Area-51
Ultra 9 275HX, GeForce RTX 5080 Laptop, 96 Wh
Asus ROG Strix G16 G615
Ultra 9 275HX, GeForce RTX 5080 Laptop, 90 Wh
Lenovo Legion Pro 7i 16 Gen 10
Ultra 9 275HX, GeForce RTX 5080 Laptop, 99 Wh
Aorus MASTER 16 AM6H
Ultra 9 275HX, GeForce RTX 5090 Laptop, 99 Wh
Schenker XMG Neo 16 A25 5090
R9 9955HX3D, GeForce RTX 5090 Laptop, 99.8 Wh
Average of class Gaming
 
Battery runtime
-46%
50%
4%
29%
13%
36%
WiFi v1.3 (h)
5.2
2.8
-46%
7.8
50%
5.4
4%
6.7
29%
5.9
13%
Reader / Idle (h)
3.1
H.264 (h)
11
5.8
Cyberpunk 2077 ultra 150cd (h)
0.8
Load (h)
1.5
0.8
1.8

Notebookcheck overall rating

Those who can tolerate the sometimes excessive fan noise—or switch to a more moderate performance mode from the outset—will find the Aorus Master 16 to be a very powerful gaming laptop.

Aorus Master 16 AM6J - 07/29/2026 v8
Florian Glaser

Chassis
79 / 98 → 81%
Keyboard
83%
Pointing Device
83%
Connectivity
68 / 80 → 84%
Weight
61 / 10-68 → 88%
Battery
65 / 95 → 68%
Display
85%
Games Performance
93%
Application Performance
94%
AI Performance
90%
Temperature
86 / 95 → 90%
Noise
47 / 90 → 52%
Audio
80%
Camera
38 / 75 → 51%
Average
63%
84%
Gaming - Weighted Average
CO2 Emissions
No Data
Materials
0%
Packaging
75%
Power Use
82.1%
Repairability
50%
Software Updates
22.3%
Recycle Logo Total Sustainability Score: 38.2%

Comparison of possible alternatives

Image
Model / Review
Price
Weight
Height
Display
1.
83.5%
Aorus Master 16 AM6J
AMD Ryzen 9 9955HX3D ⎘
NVIDIA GeForce RTX 5080 Laptop ⎘
32 GB Memory, 1000 GB SSD
Amazon:
1. $4,899.99
GIGABYTE - AORUS Master 16 G...
2. $3,499.99
GIGABYTE - AORUS Master 16 G...
3. 
GIGABYTE - AORUS MASTER 16 G...
2.3 kg24.5 mm16.00"
2560x1600
189 PPI
OLED
2.
85.7%
Alienware 16 Area-51
Intel Core Ultra 9 275HX ⎘
NVIDIA GeForce RTX 5080 Laptop ⎘
32 GB Memory, 1024 GB SSD
Amazon:
1. $2,426.16
Alienware 16 Area-51 Gaming ...
2. $3,799.99
Alienware 16 Area-51 Gaming ...
3. $3,358.57
Alienware 18 Area-51 Gaming ...
List Price: 3500 USD
3.3 kg28.5 mm16.00"
2560x1600
189 PPI
IPS
3.
87.3%
Asus ROG Strix G16 G615
Intel Core Ultra 9 275HX ⎘
NVIDIA GeForce RTX 5080 Laptop ⎘
32 GB Memory, 1024 GB SSD
Amazon:
1. $1,323.97
ASUS ROG Strix G16 (2025) Ga...
2. $2,355.00
ASUS ROG Strix G16 (2025) Ga...
3. $2,424.99
ASUS ROG Strix G16 (2025) Ga...
List Price: 3299€
2.6 kg30.8 mm16.00"
2560x1600
189 PPI
IPS
4.
87.5%
Lenovo Legion Pro 7i 16 Gen 10
Intel Core Ultra 9 275HX ⎘
NVIDIA GeForce RTX 5080 Laptop ⎘
32 GB Memory, 1024 GB SSD
Amazon: List Price: 4200 USD2.6 kg26.65 mm16.00"
2560x1600
189 PPI
OLED
5.
85.1%
Aorus MASTER 16 AM6H
Intel Core Ultra 9 275HX ⎘
NVIDIA GeForce RTX 5090 Laptop ⎘
32 GB Memory, 1024 GB SSD
Amazon: List Price: 4.75 Euro2.5 kg29.9 mm16.00"
2560x1600
189 PPI
OLED
6.
89.4%
Schenker XMG Neo 16 A25 5090
AMD Ryzen 9 9955HX3D ⎘
NVIDIA GeForce RTX 5090 Laptop ⎘
32 GB Memory, 1024 GB NVMe
Amazon:
List Price: 4480€
2.9 kg27.9 mm16.00"
2560x1600
189 PPI
Mini-LED

Transparency

The selection of devices to be reviewed is made by our editorial team. The test sample was provided to the author as a loan by the manufacturer or retailer for the purpose of this review. The lender had no influence on this review, nor did the manufacturer receive a copy of this review before publication. There was no obligation to publish this review. As an independent media company, Notebookcheck is not subjected to the authority of manufacturers, retailers or publishers.

This is how Notebookcheck is testing

Every year, Notebookcheck independently reviews hundreds of laptops and smartphones using standardized procedures to ensure that all results are comparable. We have continuously developed our test methods for around 20 years and set industry standards in the process. In our test labs, high-quality measuring equipment is utilized by experienced technicians and editors. These tests involve a multi-stage validation process. Our complex rating system is based on hundreds of well-founded measurements and benchmarks, which maintains objectivity. Further information on our test methods can be found here.

Google LogoAdd as a preferred source on Google
Mail Logo
static version load dynamic
Loading Comments
Comment on this article
> Expert Reviews and News on Laptops, Smartphones and Tech Innovations > Reviews > Did Gigabyte go too far? Aorus Master 16 gaming laptop with AMD Zen 5 review
Florian Glaser, 2026-08- 7 (Update: 2026-08- 7)