




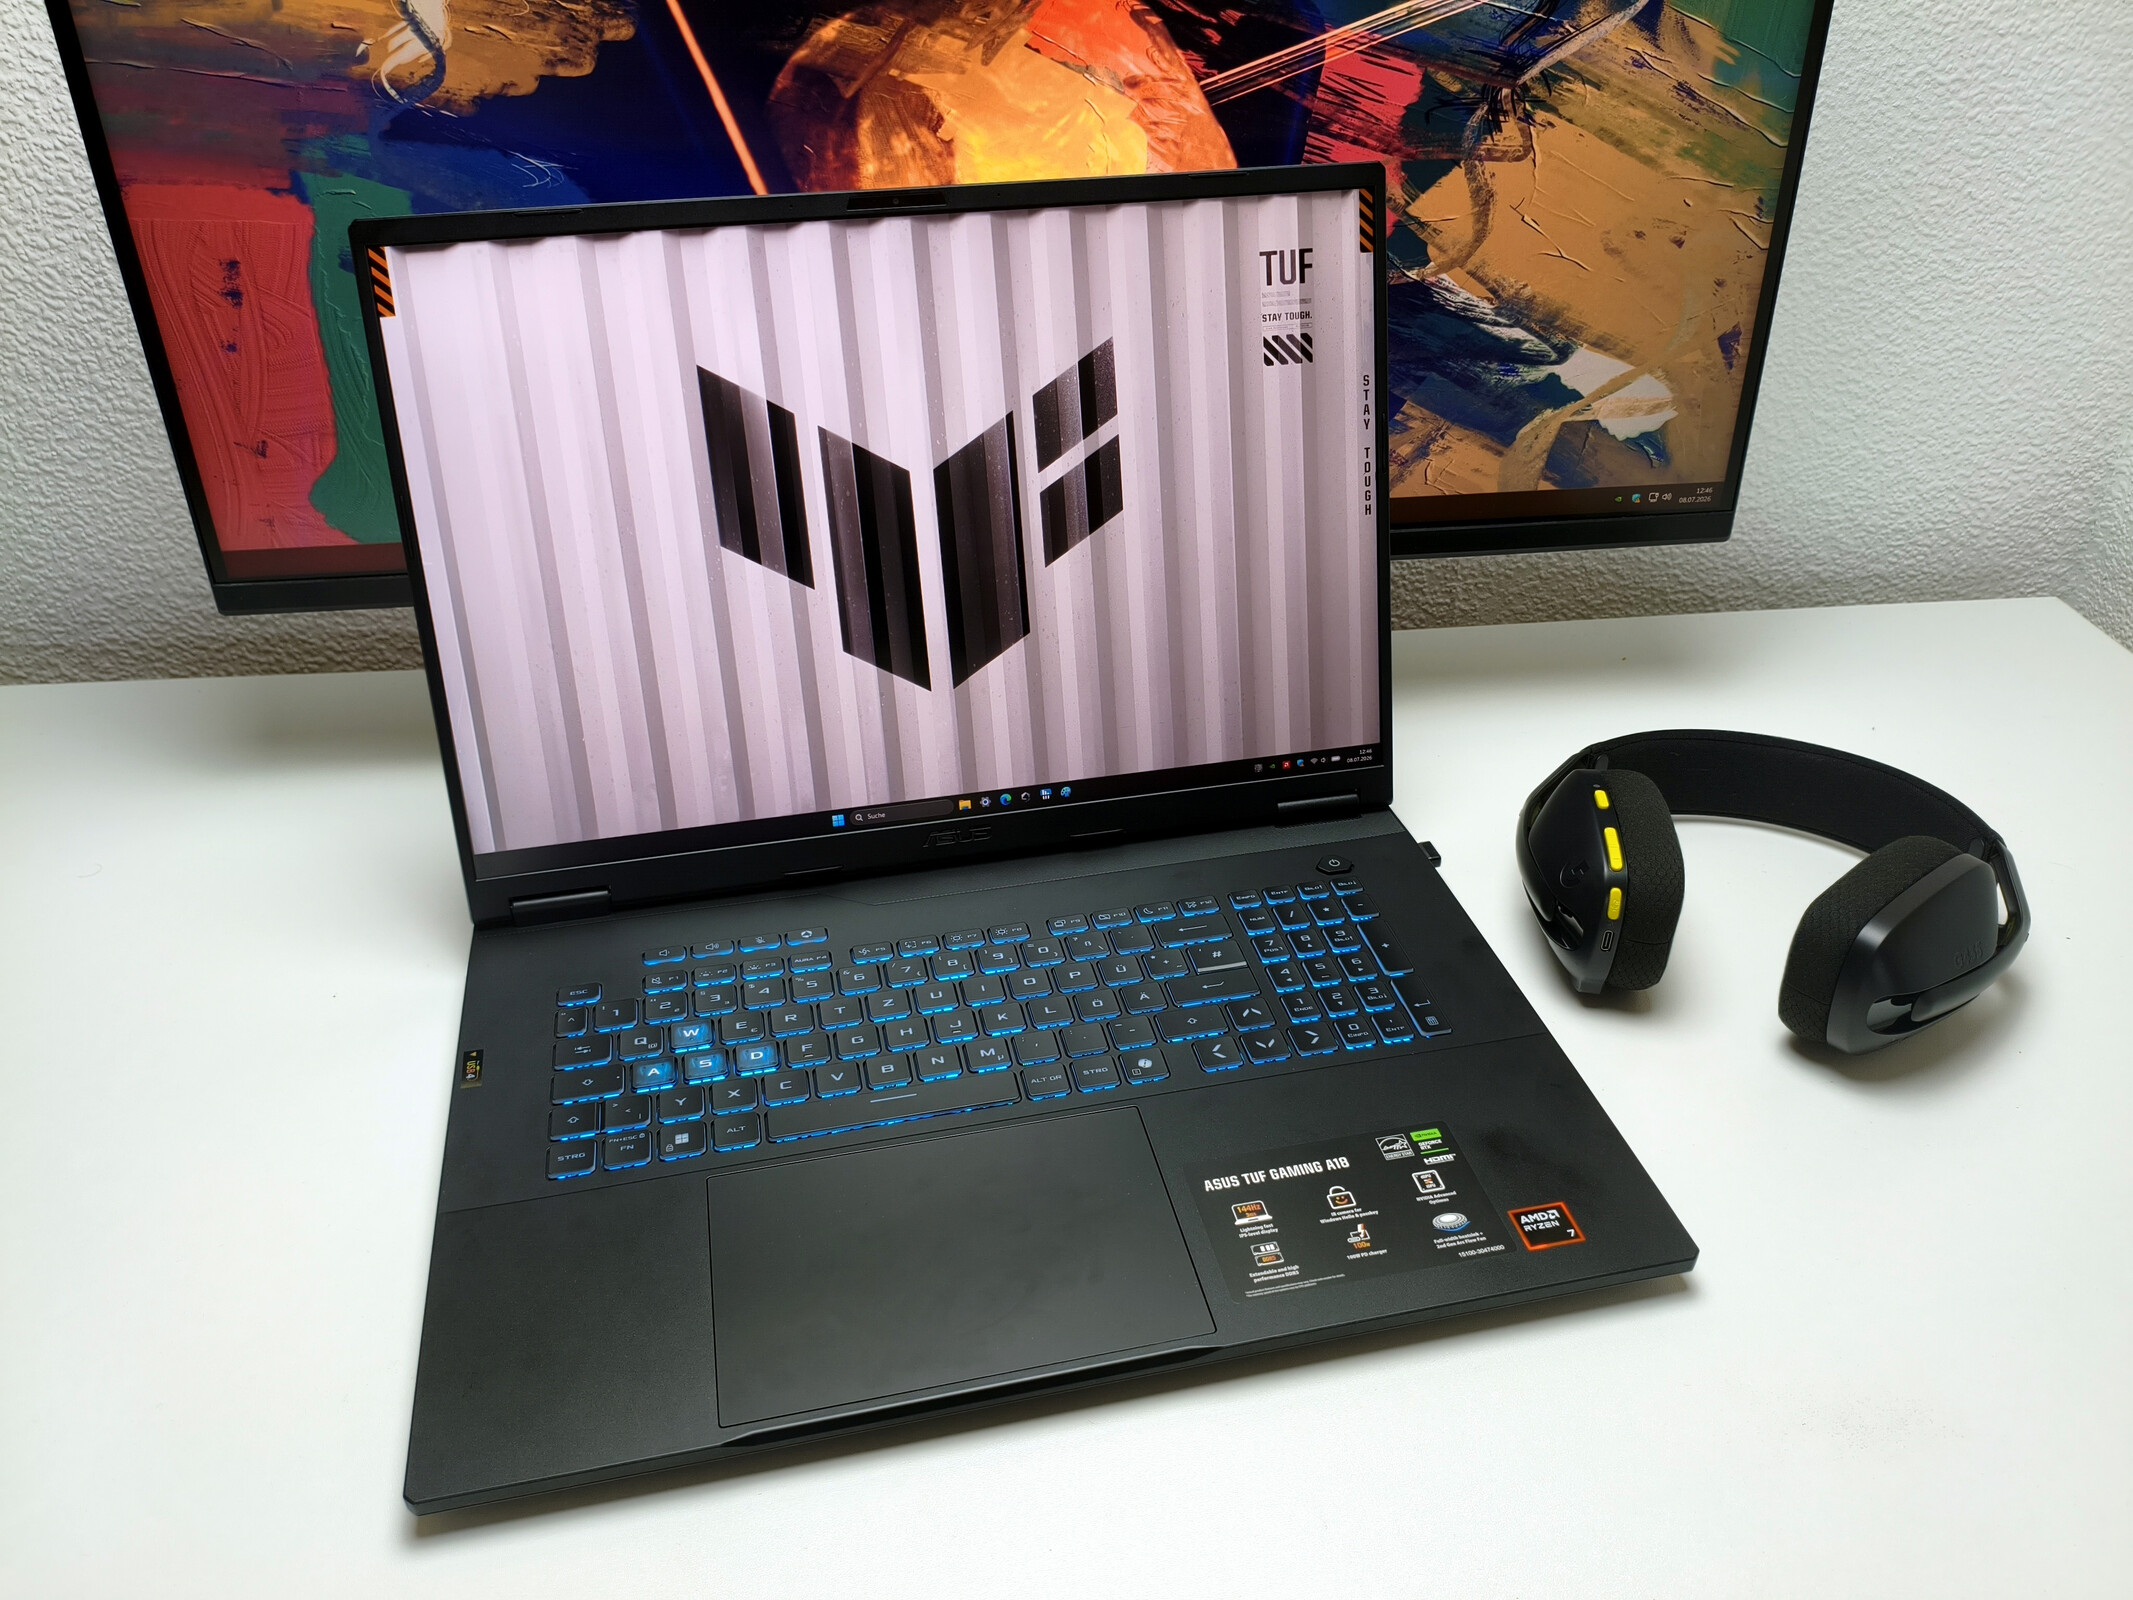
Verdict
Having previously reviewed a GeForce RTX 5070 configuration, we found the RTX 5060 version of the TUF Gaming A18 to be another well-rounded 18-inch laptop at a relatively fair price. Our FA808UM-S8060W test configuration comes with 16 GB of DDR5 RAM in a dual-channel 2 × 8 GB setup and a 1 TB NVMe SSD. Once again, the display is limited to a resolution of 1,920 × 1,200 pixels, which feels rather modest for such a large panel. The upside is that almost every game runs smoothly at the native resolution with maximum details. Image quality is largely appropriate for the price, particularly in terms of contrast and colour-space coverage. Apart from the extremely loud Turbo mode, emissions under load remain reasonably well controlled. The speakers, input devices and port selection also leave little room for criticism. Battery life impressed us most of all, with the TUF Gaming A18 outlasting every competitor in our comparison.
Pros
Cons
Price and availability
The Asus TUF Gaming A18 FA808UM-S8060W tested here is available from various European online retailers, including Galaxus, with prices starting at around €1,300. This is roughly equivalent to £1,125 or US$1,525, although local pricing, taxes and availability may vary by region.

- $1,125.64ASUS 2025 TUF Gaming A18 18” WUXGA 144Hz IPS Laptop 8-Core AMD Ryzen 7 260 NVIDIA GeForce RTX 5060 16GB DDR5 1TB NVMe SSD WiFi AX RJ-45 BT Webcam HDMI2.1 RGB Backlit KB Windows 11 Home w/RE USB
- $1,509.00ASUS TUF A18 Gaming Laptop, NVIDIA RTX 5060, 16GB DDR5, 1TB SSD
- $1,629.00ASUS TUF Gaming A18 AI Laptop 18" WUXGA IPS 144Hz (100% sRGB, GSYNC) AMD 8-core Ryzen 7 260 16GB RAM 1TB SSD GeForce RTX 5060 GDDR7 (Up to 572 AI Tops) RGB Backlit USB4 Win11Pro ICP Acc
Specifications
Case, features and input devices
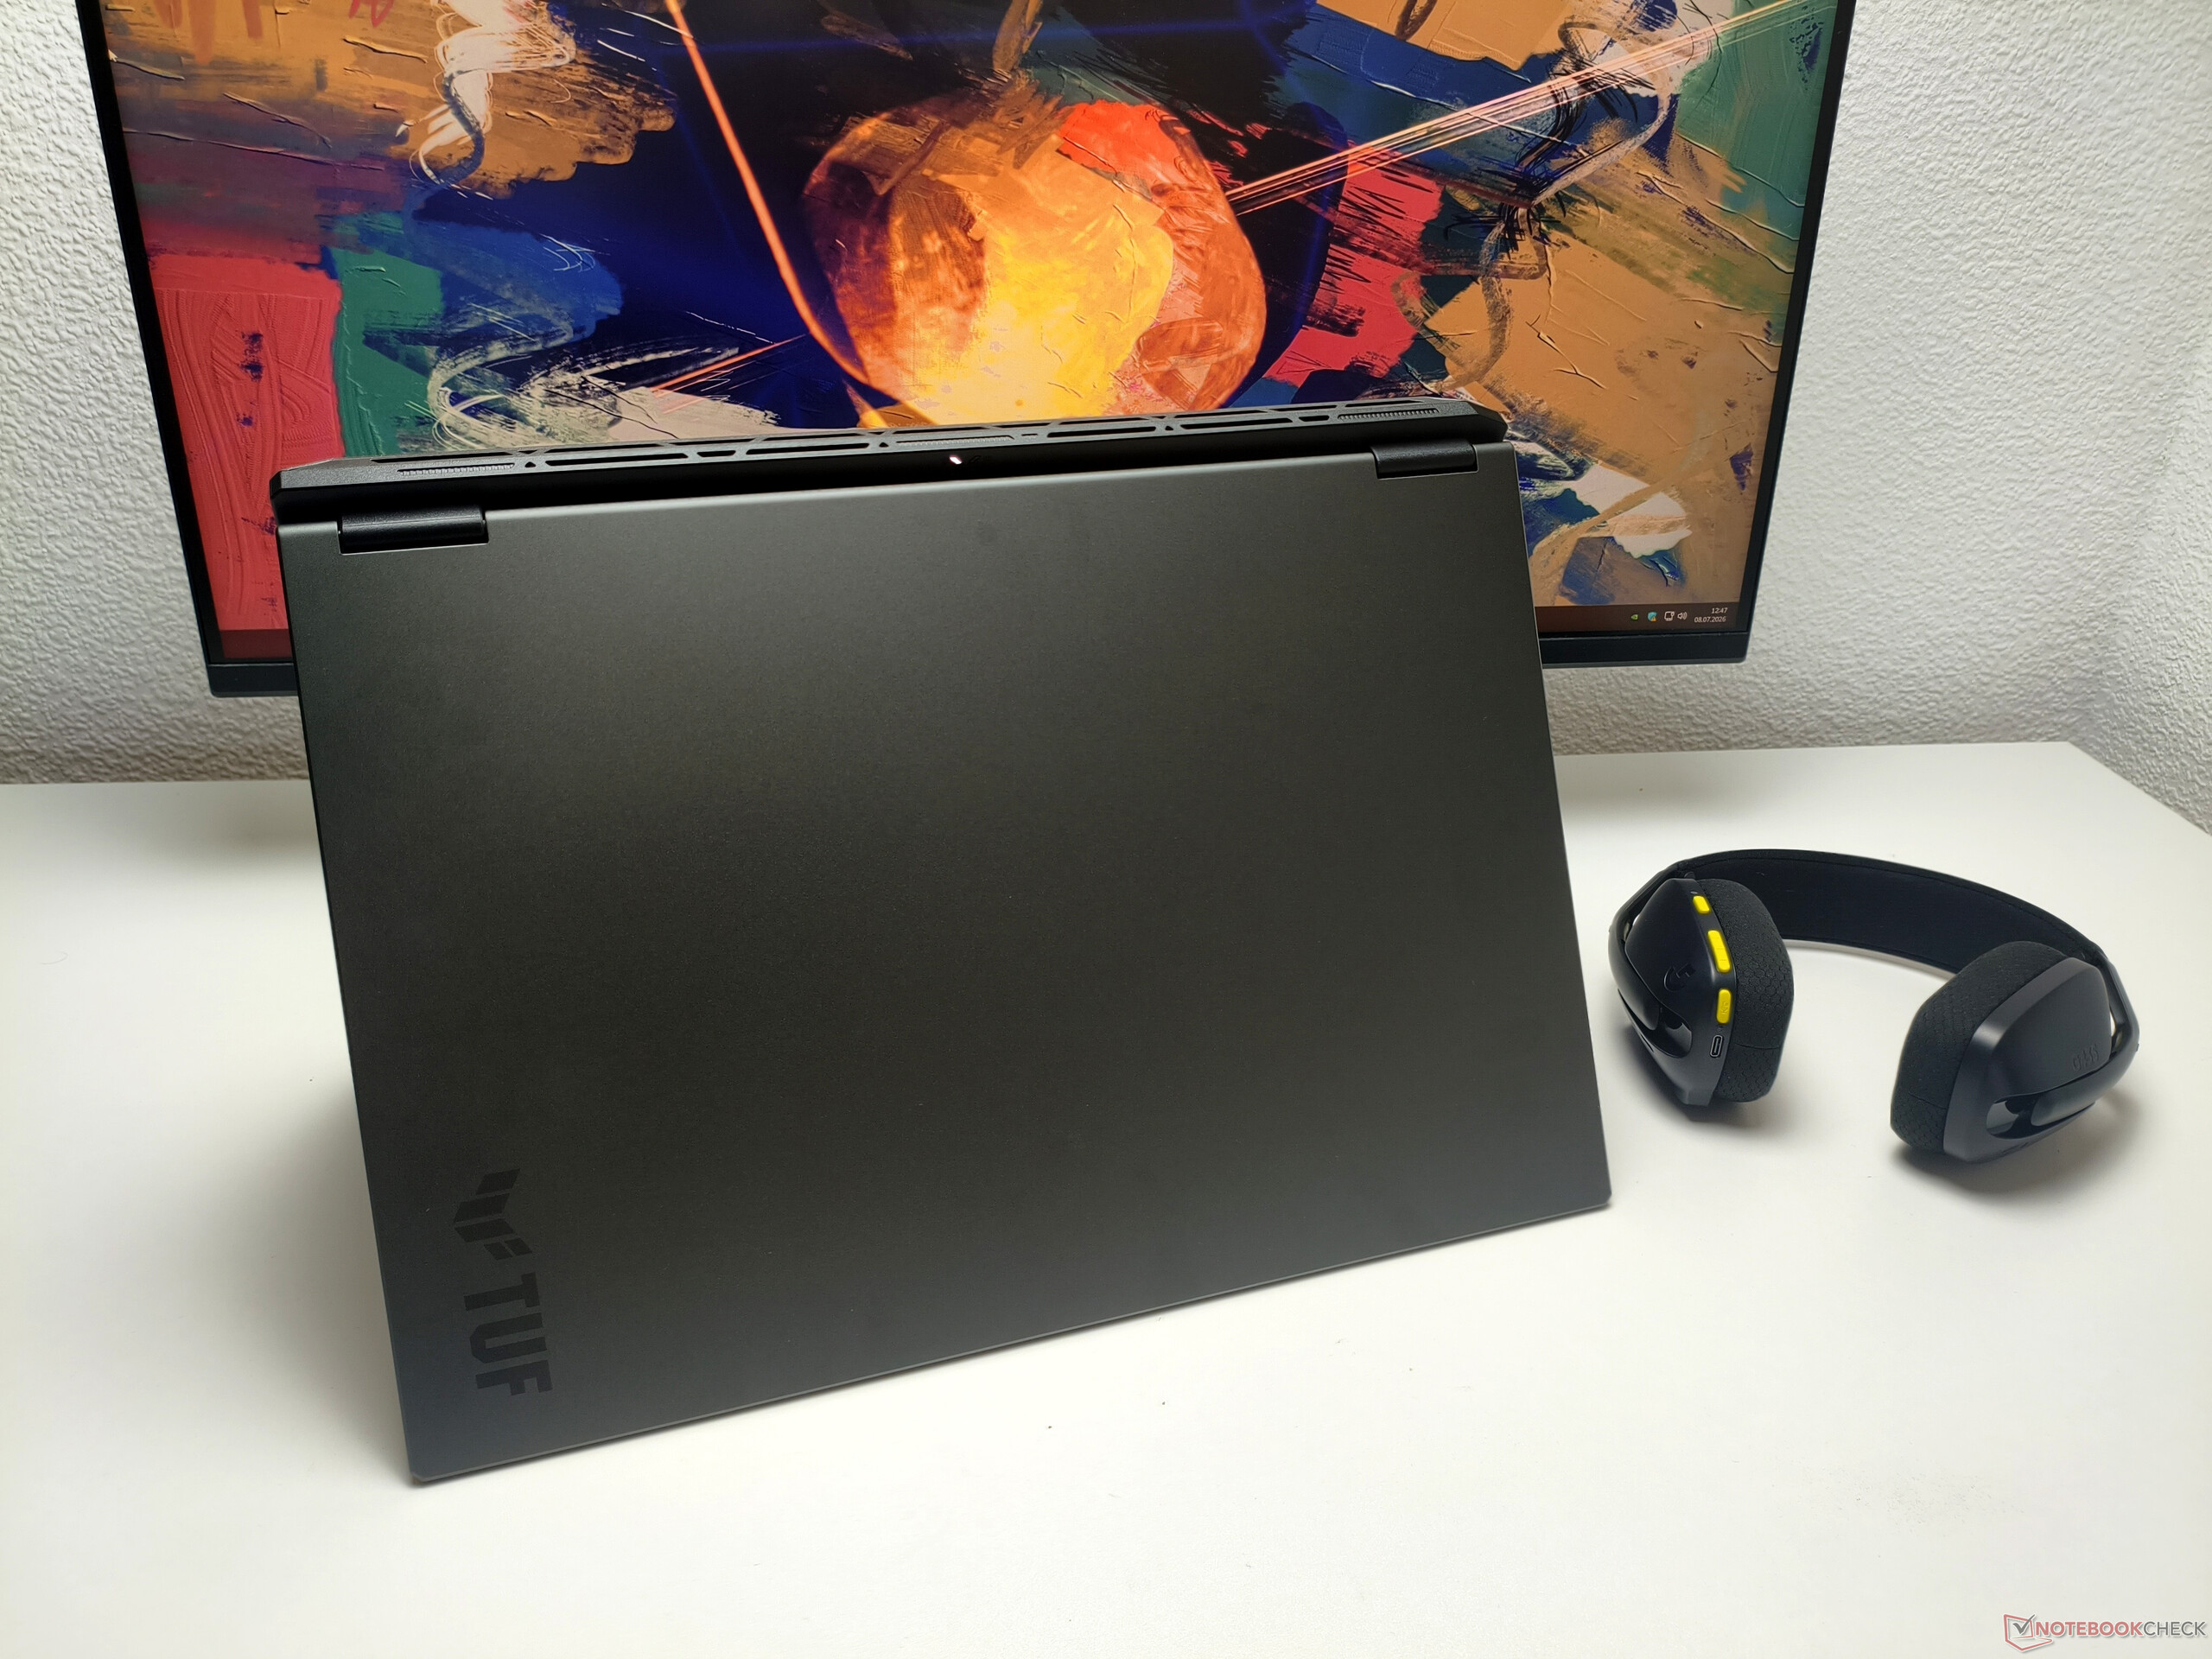
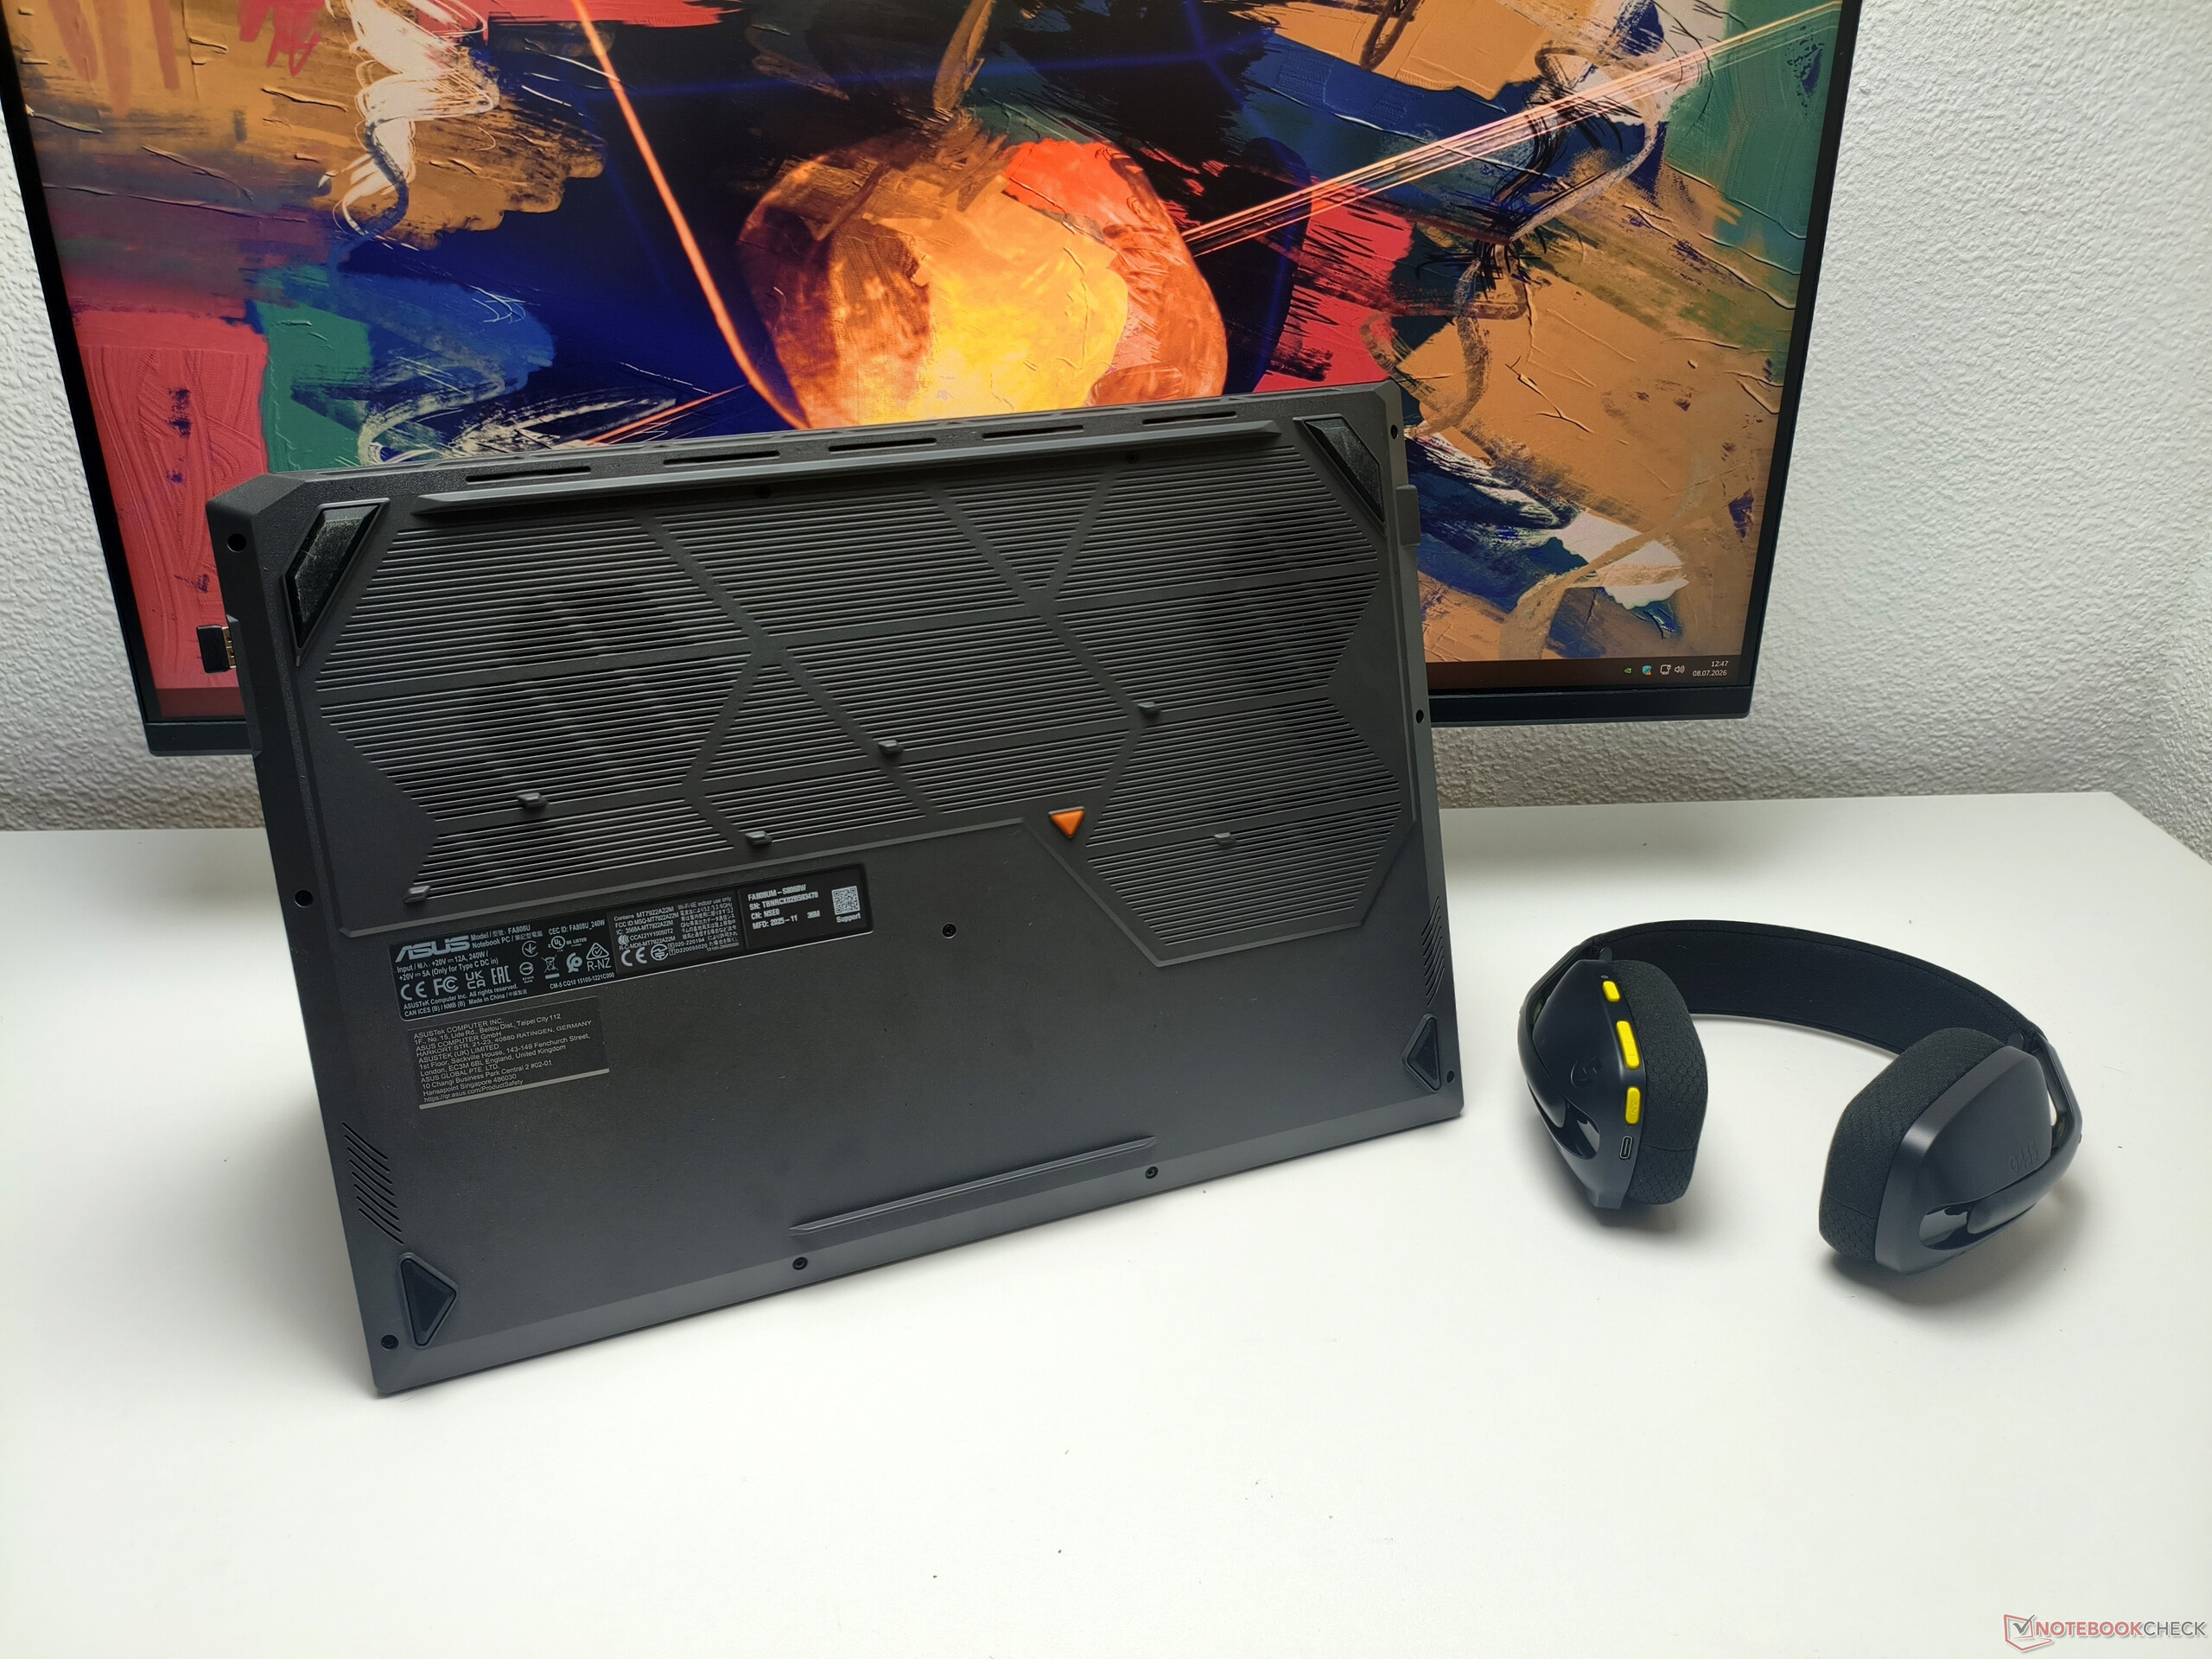
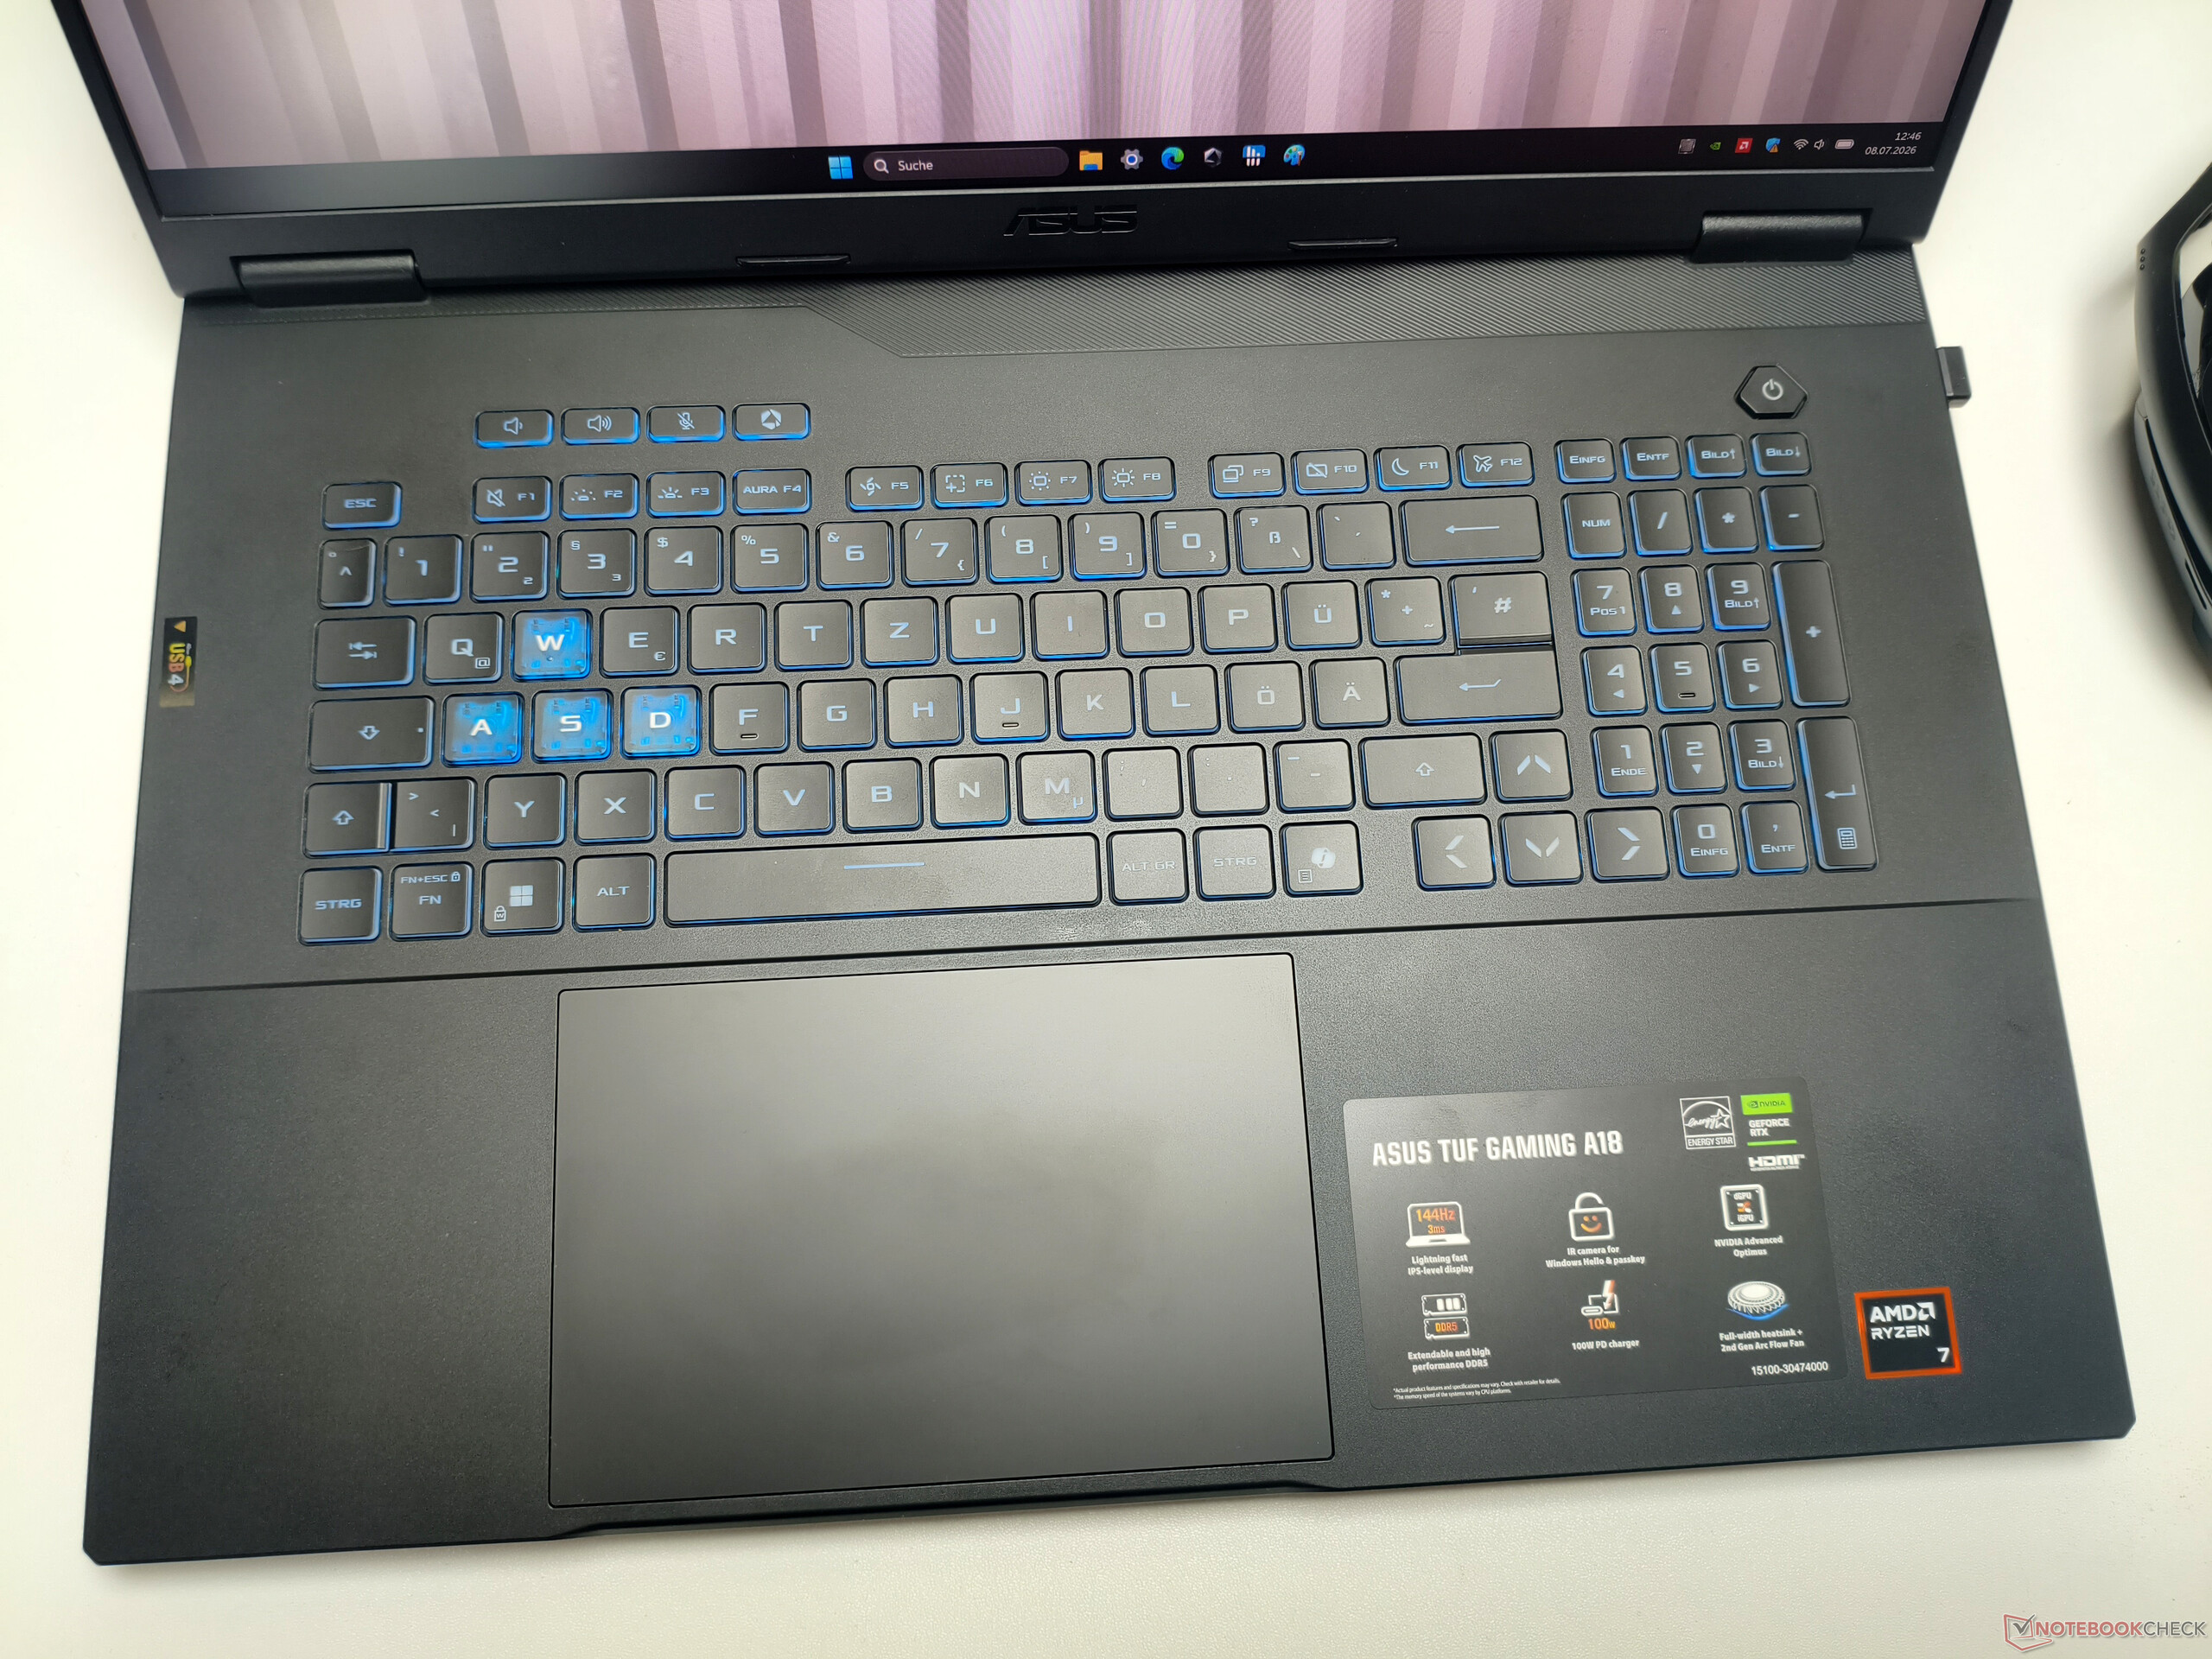
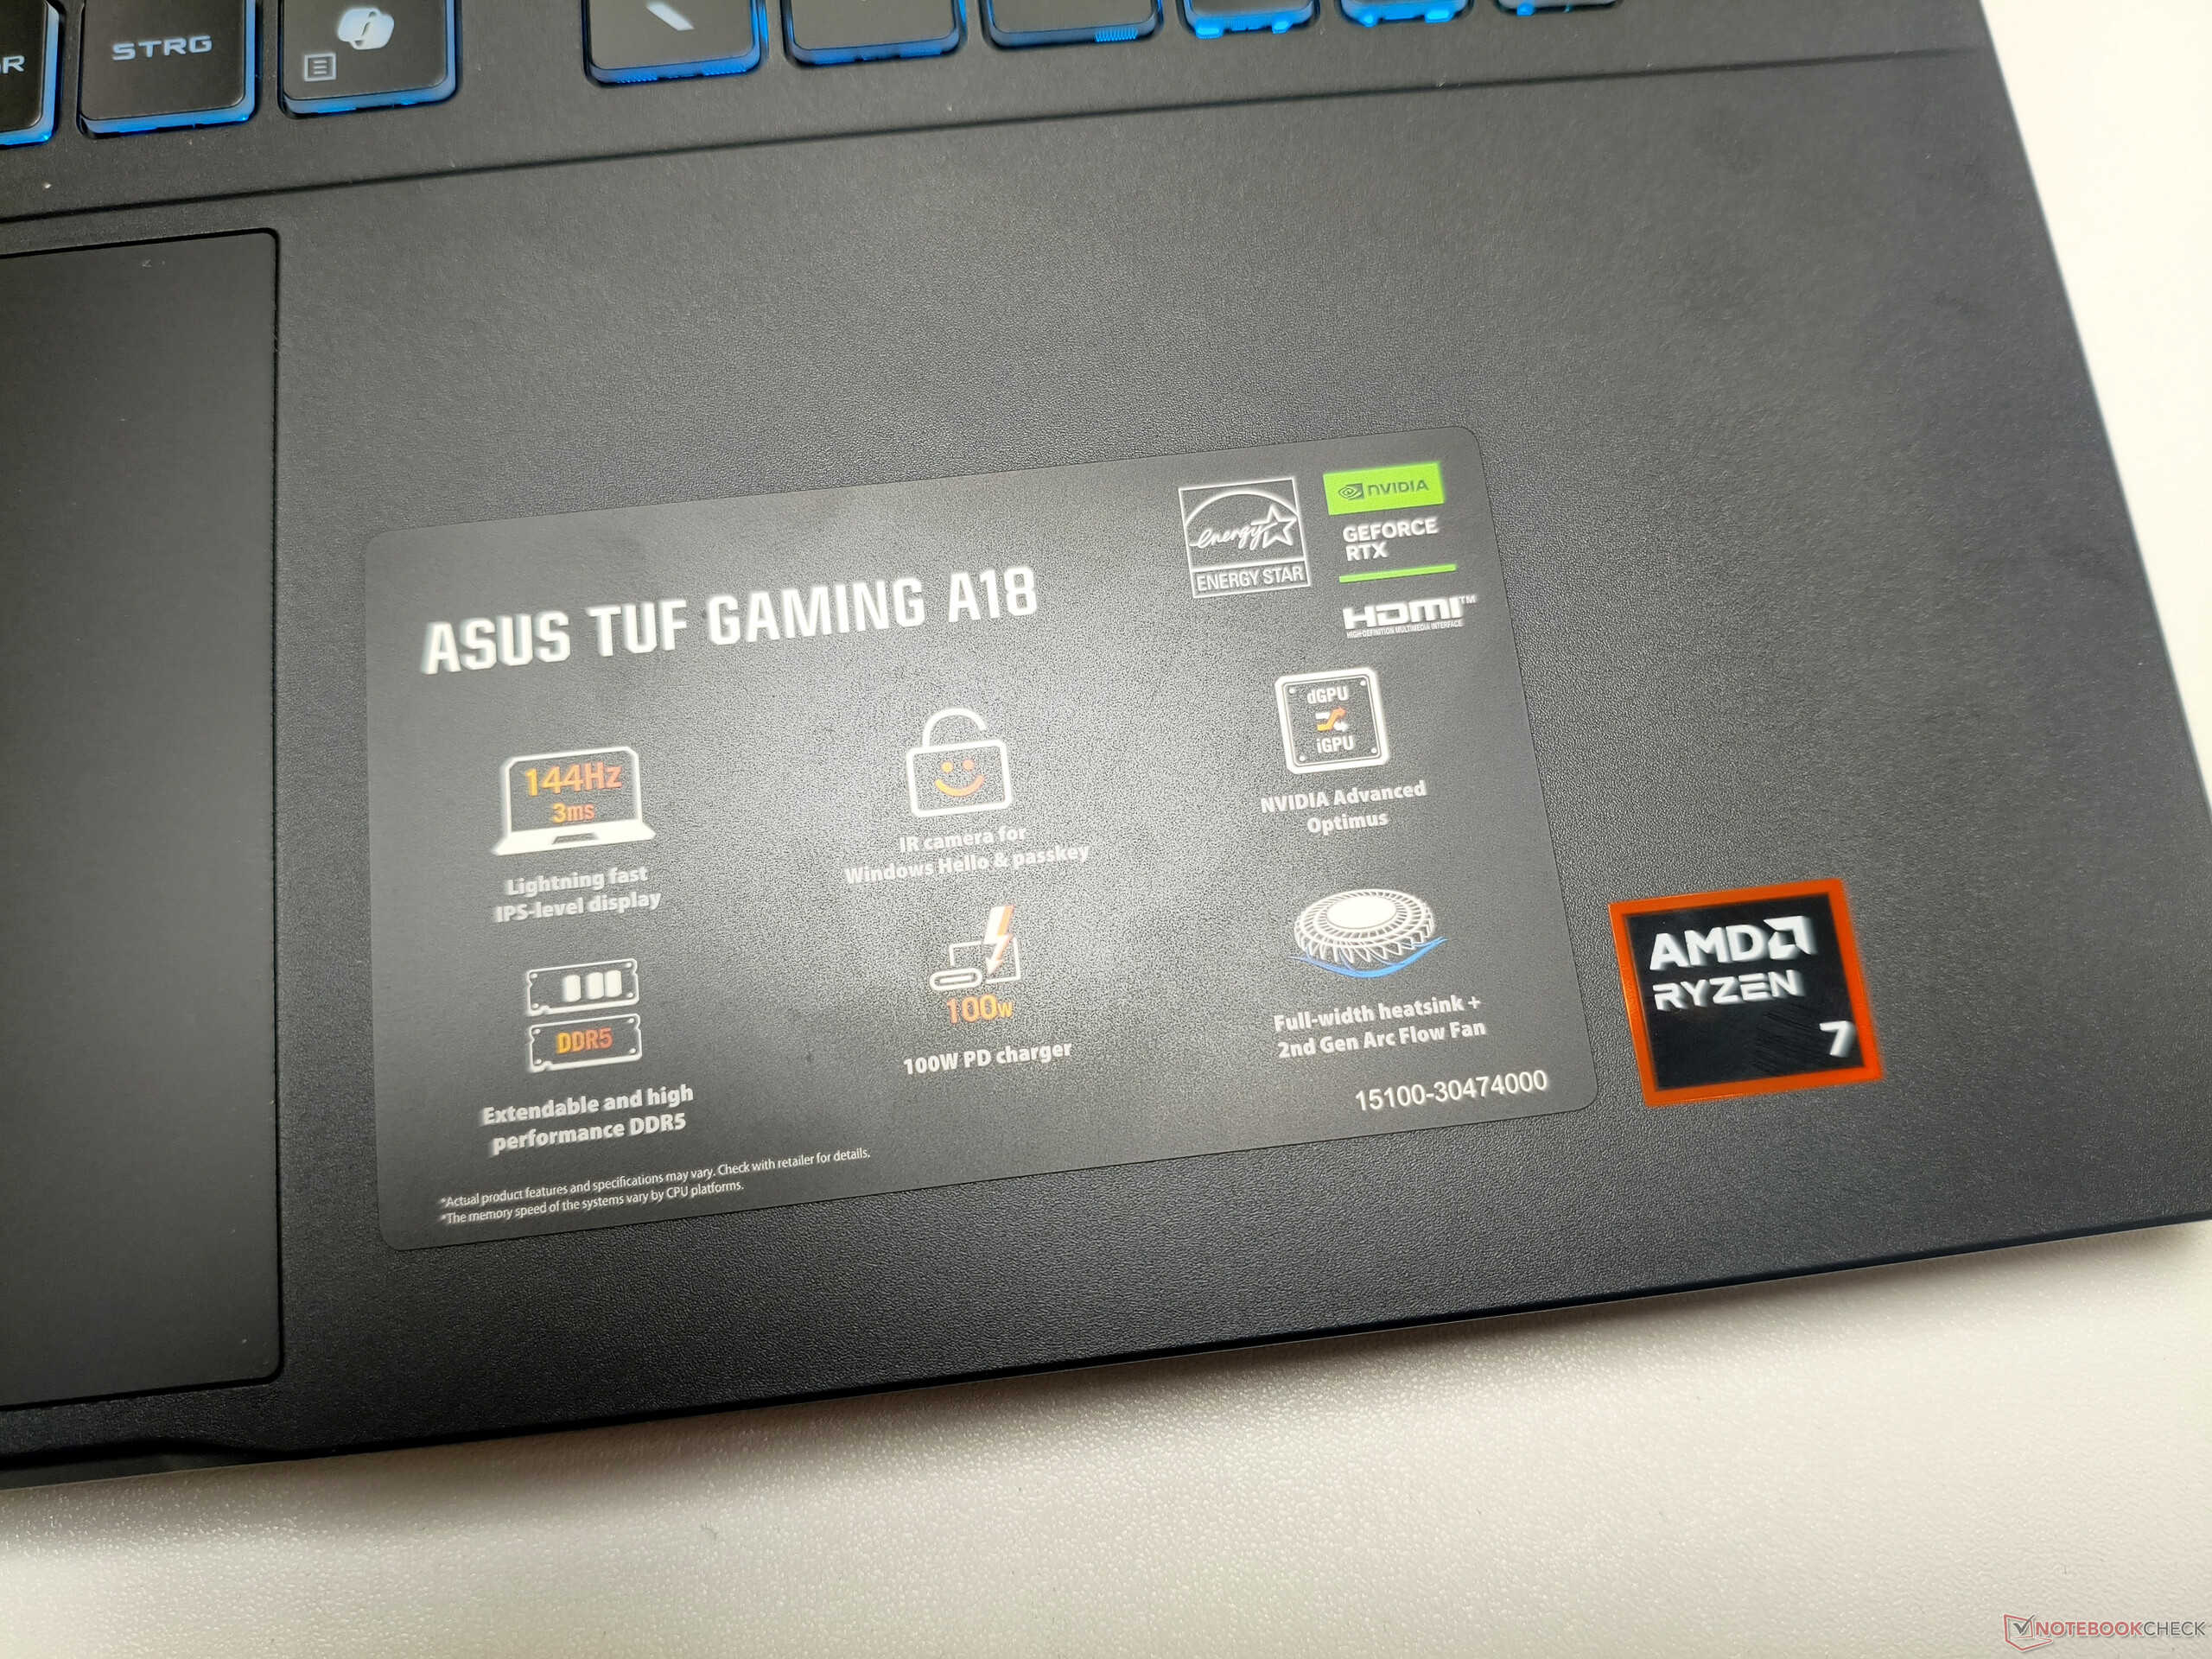
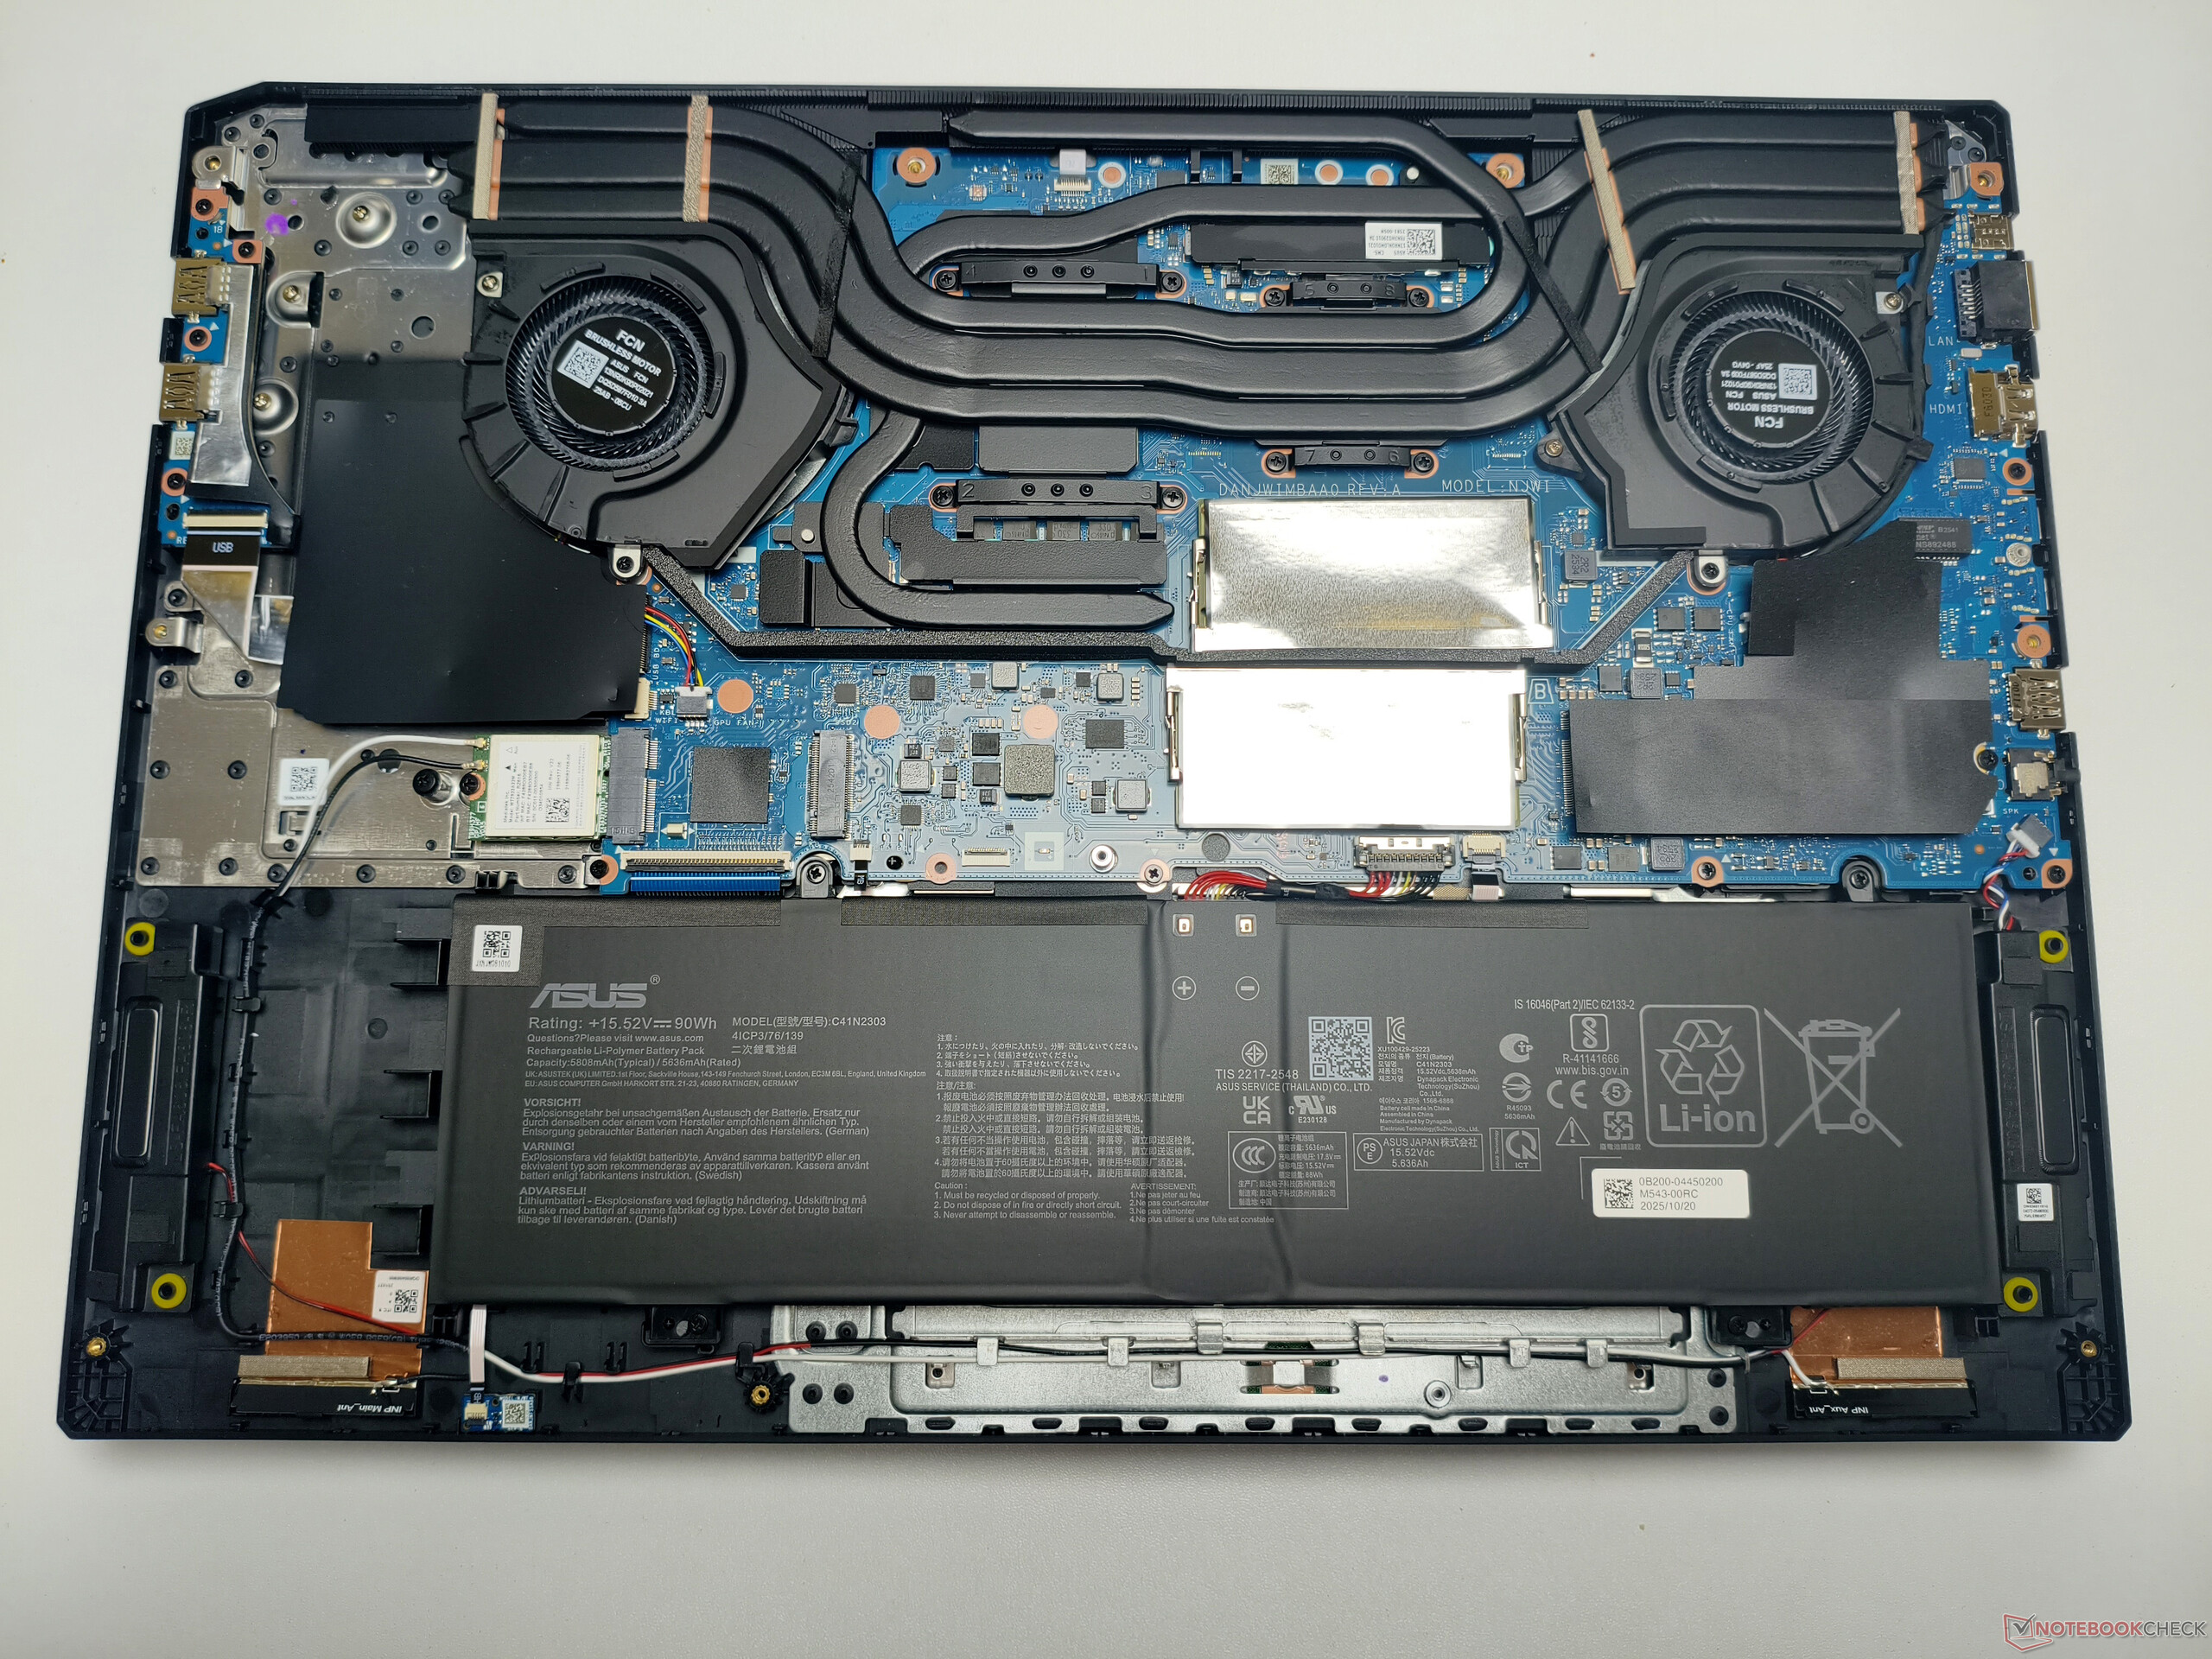
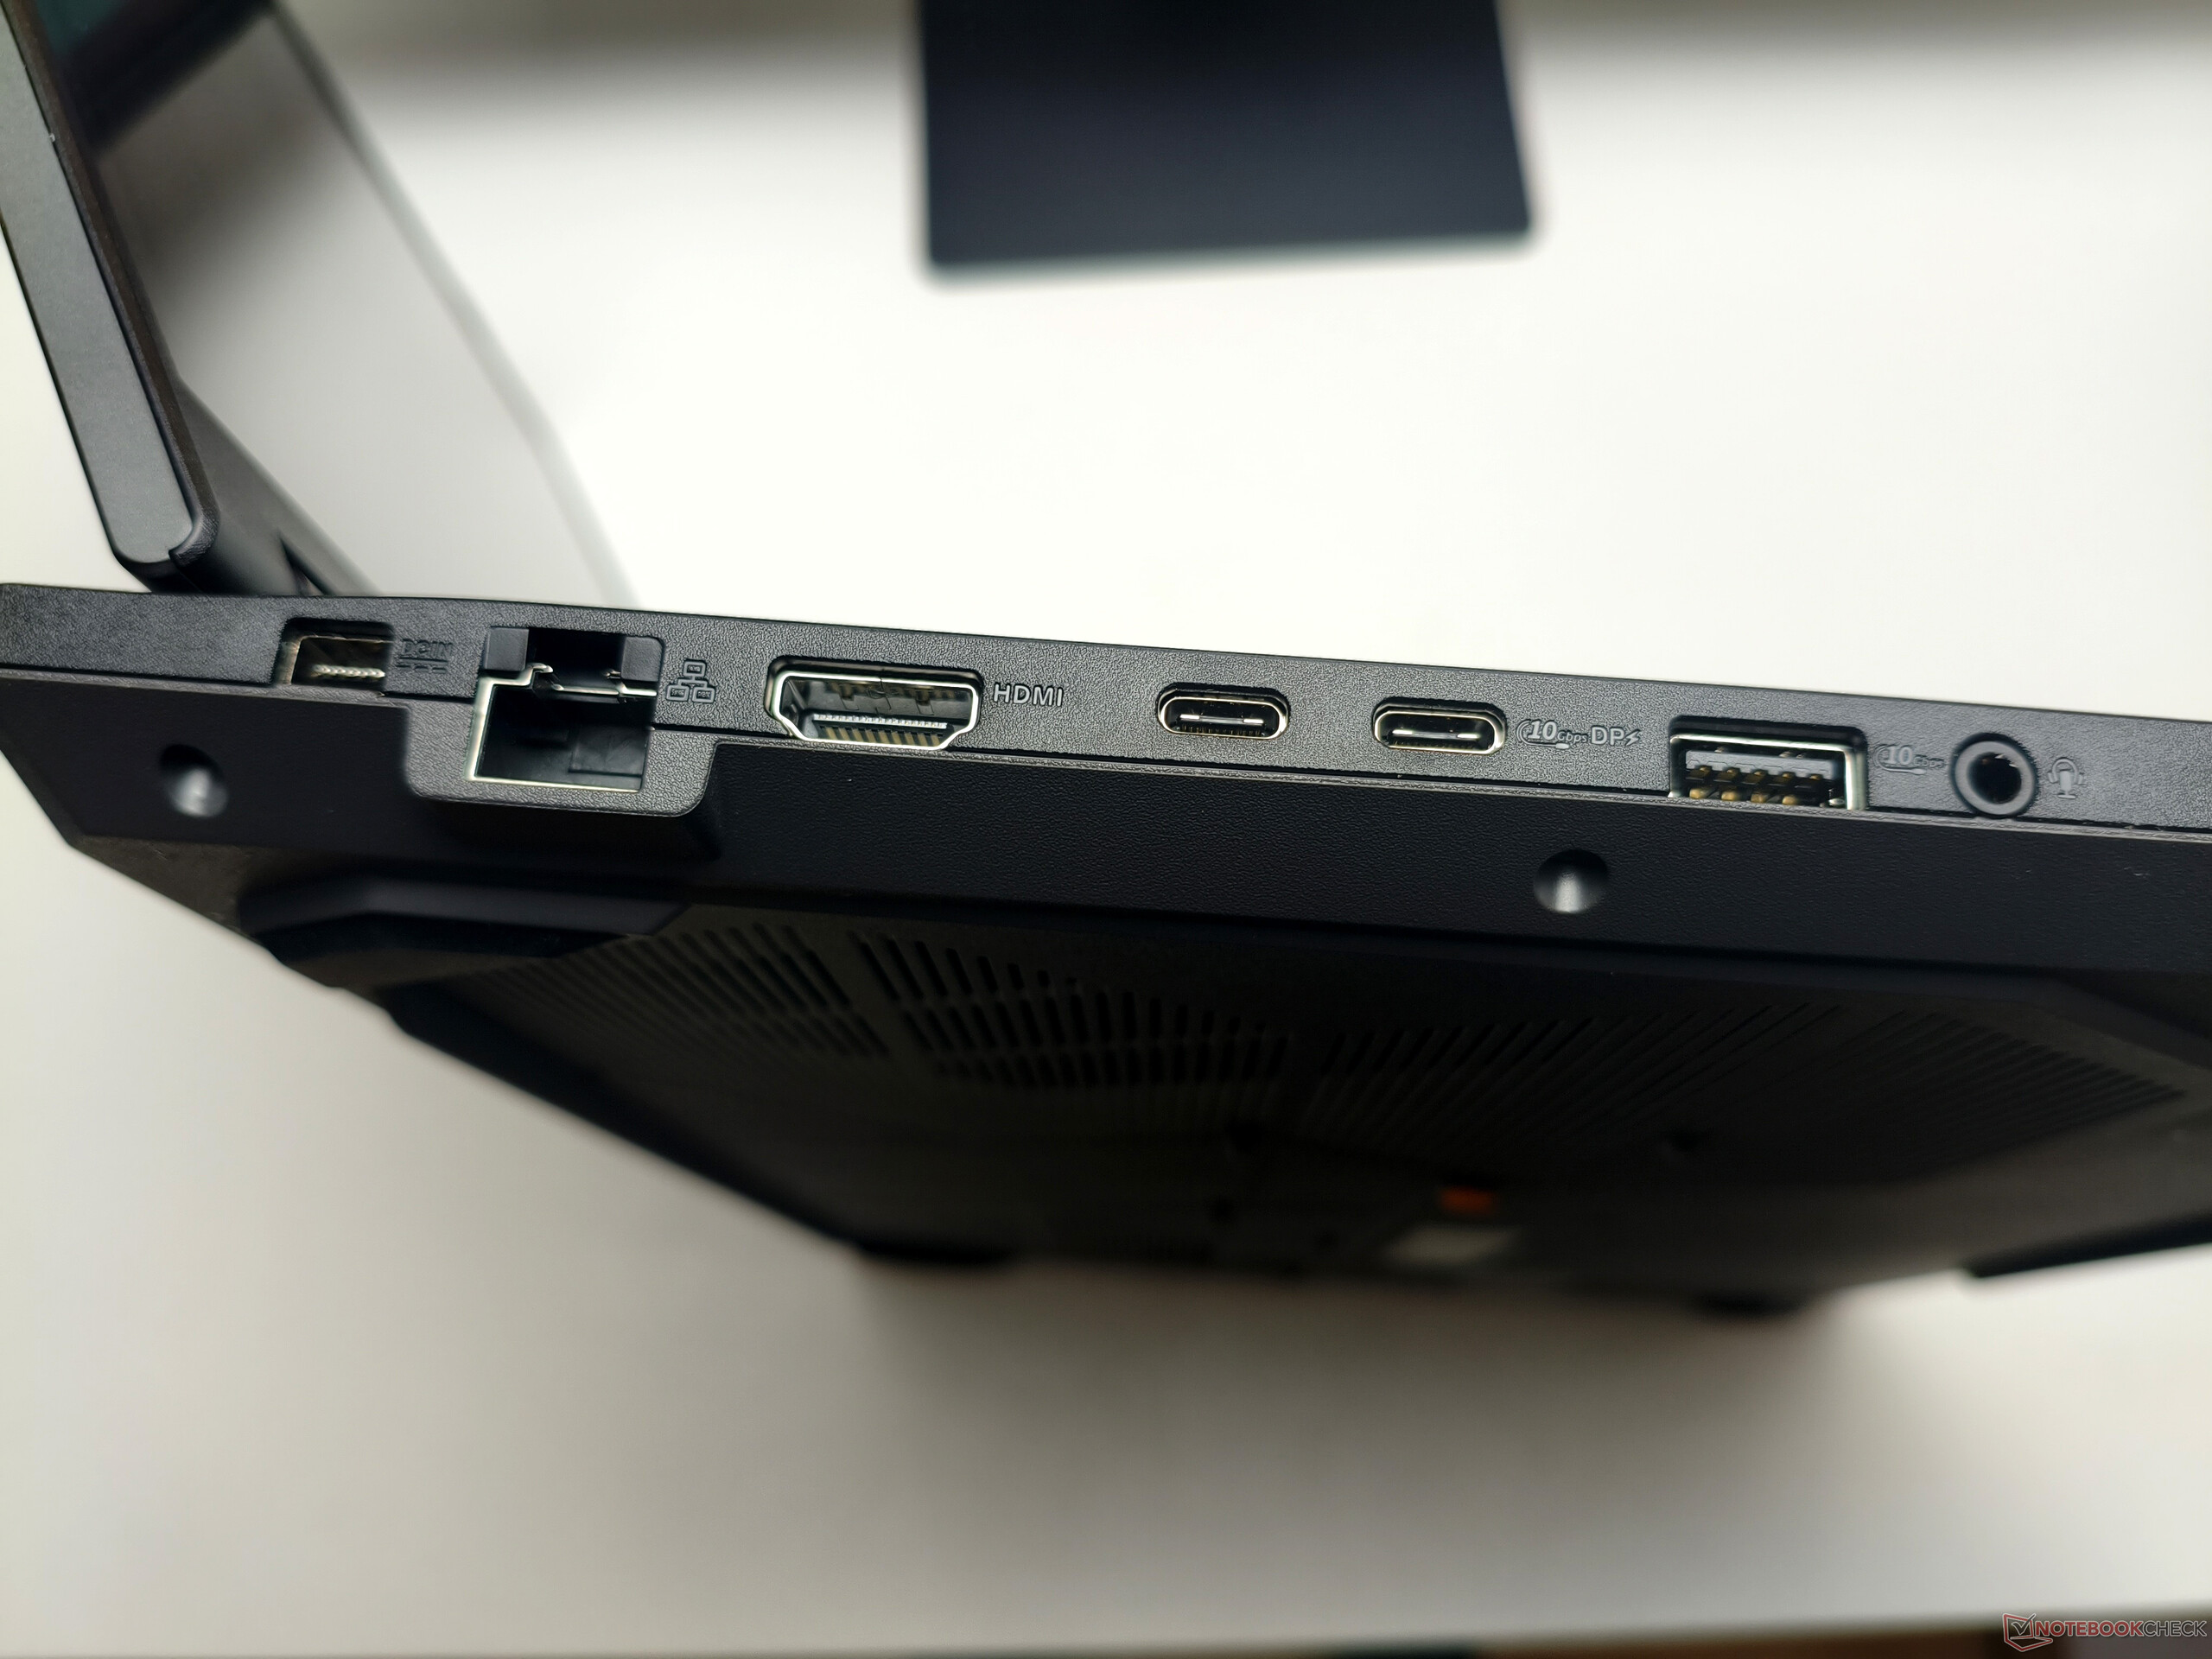
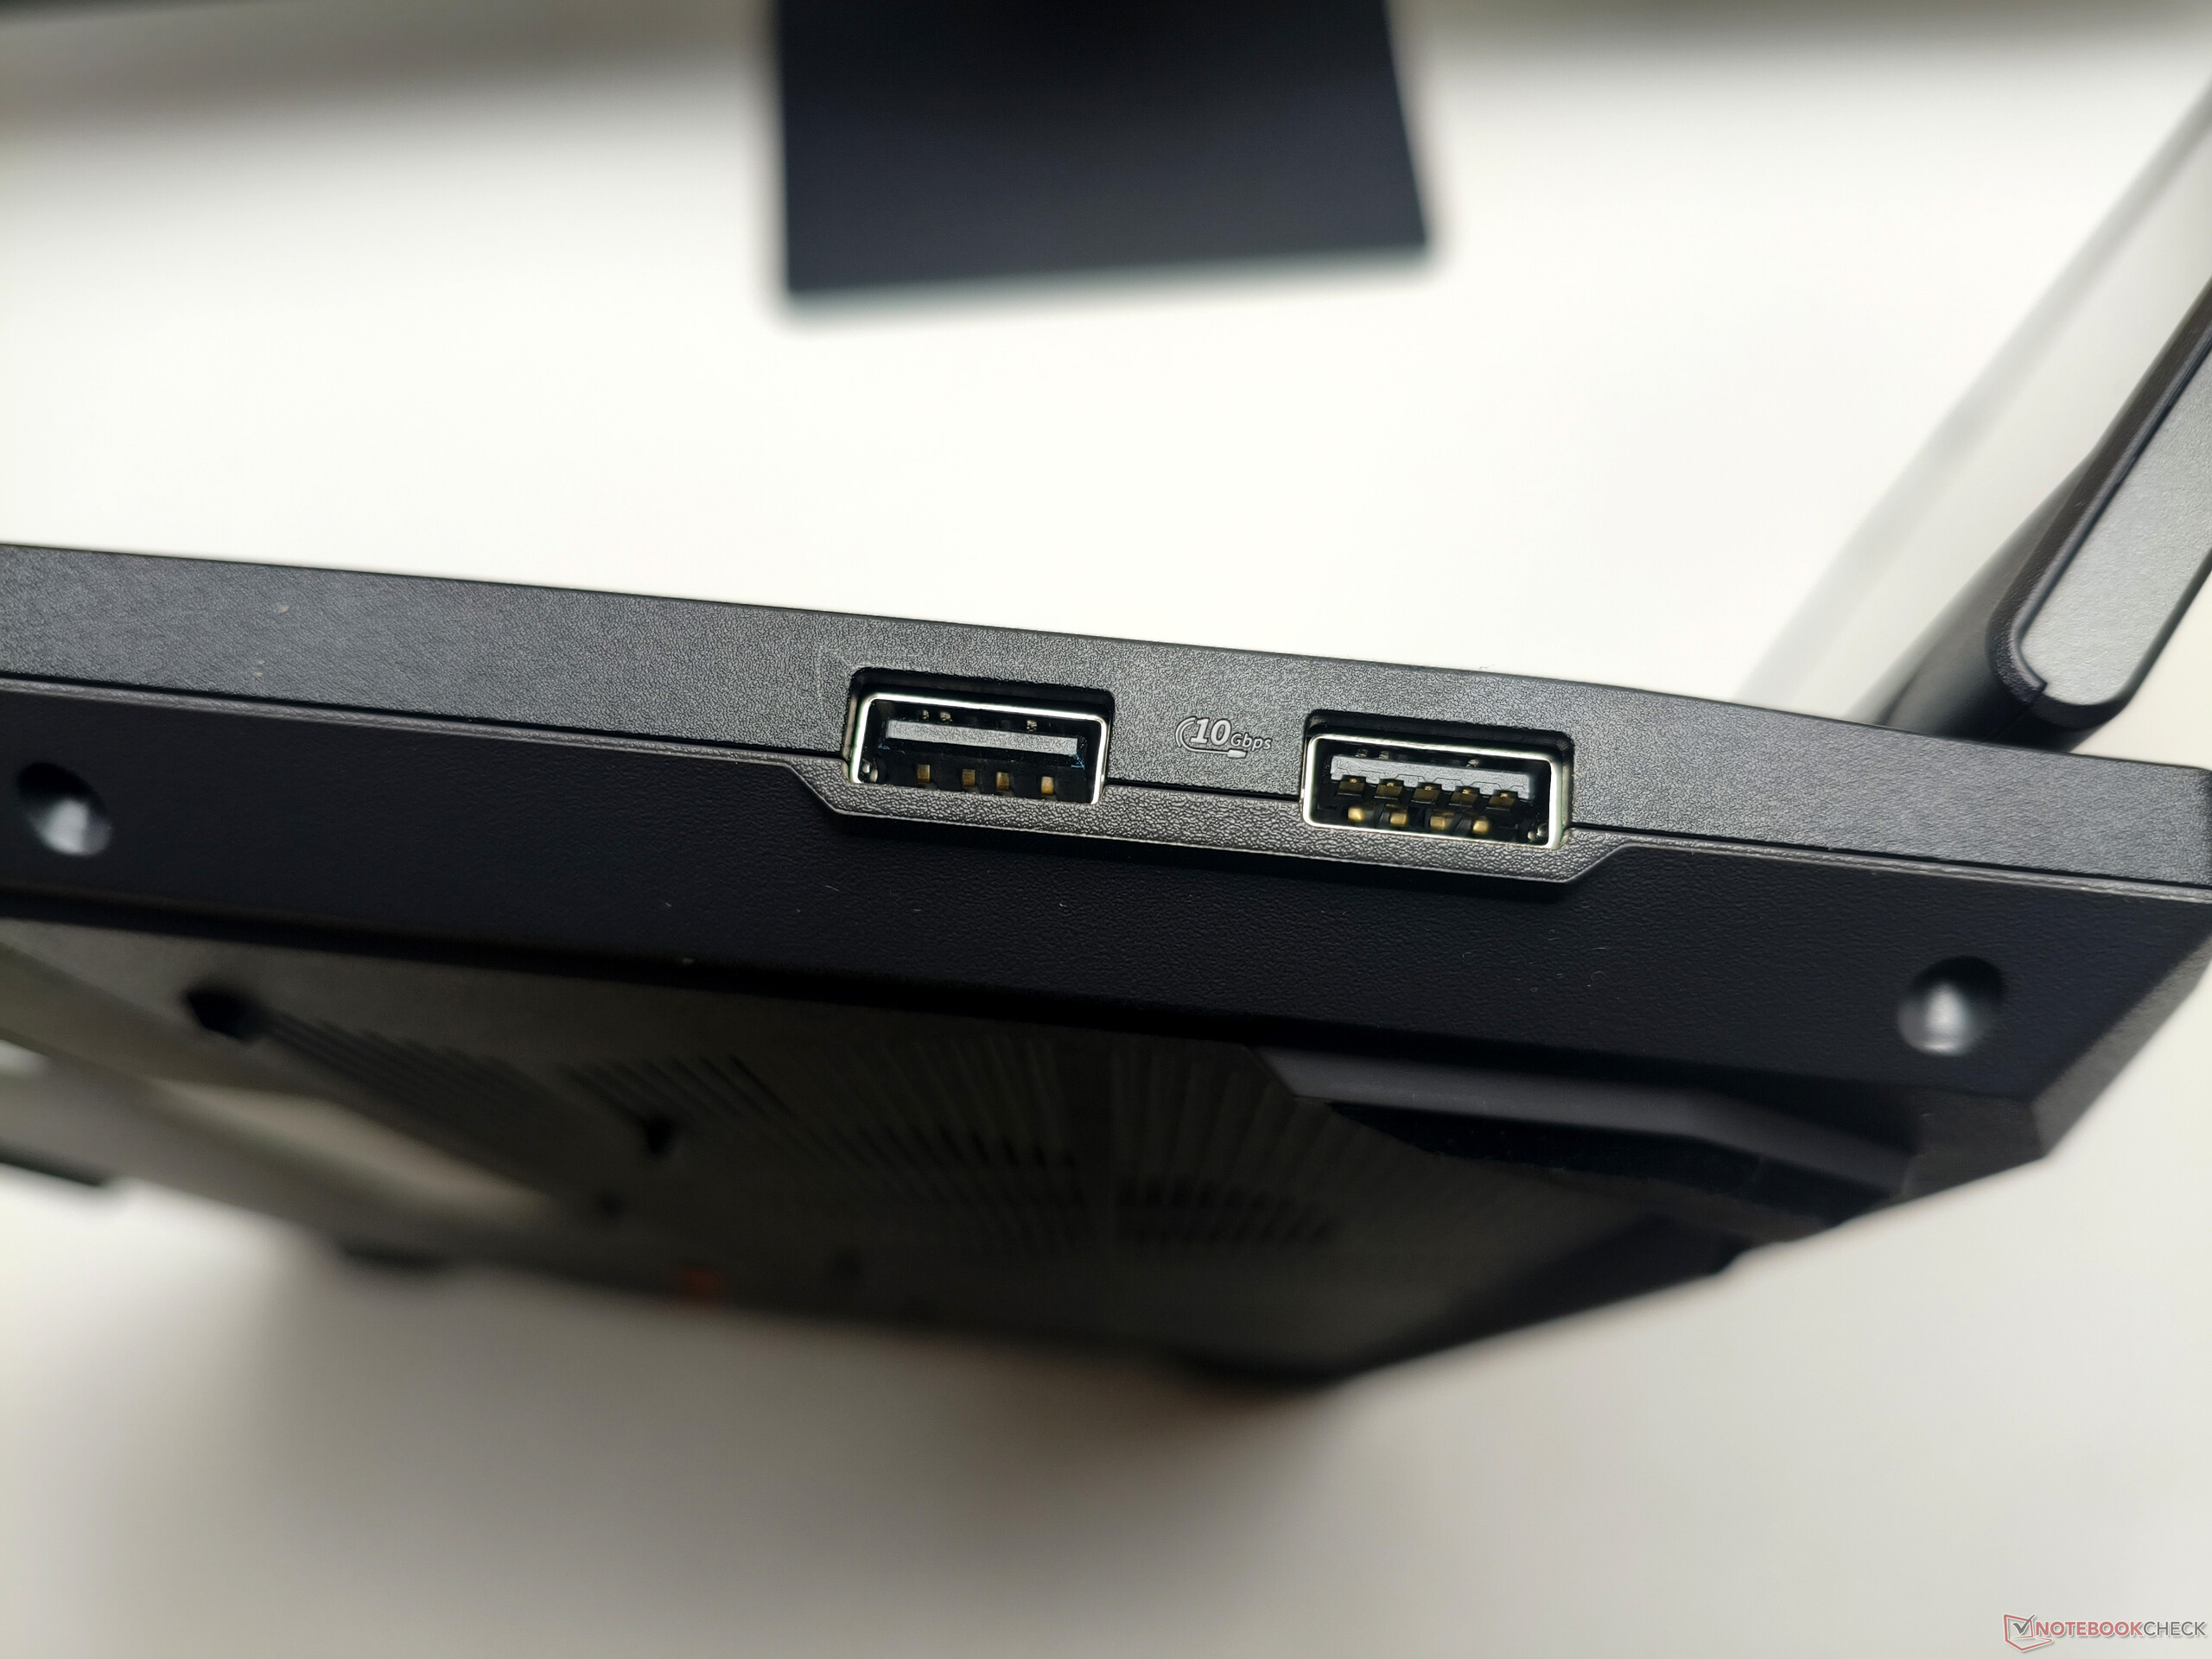
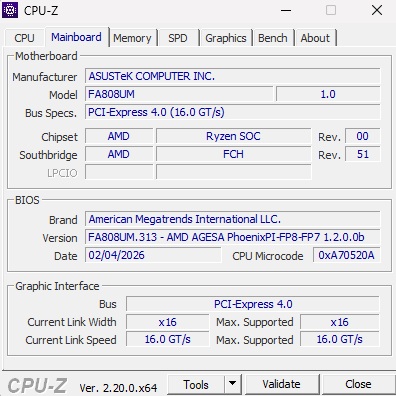
The well-built chassis is made predominantly of plastic and impresses with its solid rigidity and generously sized palm rest. The hinge can be opened to 180 degrees, which is still not standard among gaming laptops. At just under 2.7 kg, the Asus device is lighter than many of its competitors. The Acer Nitro 18 AI and MSI Crosshair 18 HX, for example, both weigh 3 kg or more. The chassis can be opened after removing eleven Phillips screws. The cooling system consists of two fans and several heat pipes. Both RAM slots are occupied, while one of the two M.2 slots remains free. Among the input devices, the enormous 15 × 10 cm touchpad is particularly impressive. The keyboard features RGB backlighting and practical dedicated volume keys. The port selection includes five USB ports, with one of the USB-C ports supporting USB4. There is no card reader. Despite being limited to Wi-Fi 6E rather than Wi-Fi 7, the wireless module achieves quite high transfer speeds, as our measurements show. The Full HD webcam produces reasonably decent images and video, although the results are not entirely convincing. A 240 W power adapter is included in the box.
| Networking | |
| iperf3 transmit Wi-Fi6/7 RT-BE96U | |
| Average of class Gaming (718 - 4473, n=11, last 2 years) | |
| Asus TUF Gaming A18 FA808UM | |
| Average MediaTek Wi-Fi 6E MT7922 160MHz Wireless LAN Card (973 - 1953, n=4) | |
| Lenovo LOQ 15AHP11 | |
| iperf3 receive Wi-Fi6/7 RT-BE96U | |
| Average of class Gaming (788 - 3208, n=11, last 2 years) | |
| Asus TUF Gaming A18 FA808UM | |
| Average MediaTek Wi-Fi 6E MT7922 160MHz Wireless LAN Card (1498 - 1910, n=4) | |
| Lenovo LOQ 15AHP11 | |


Display
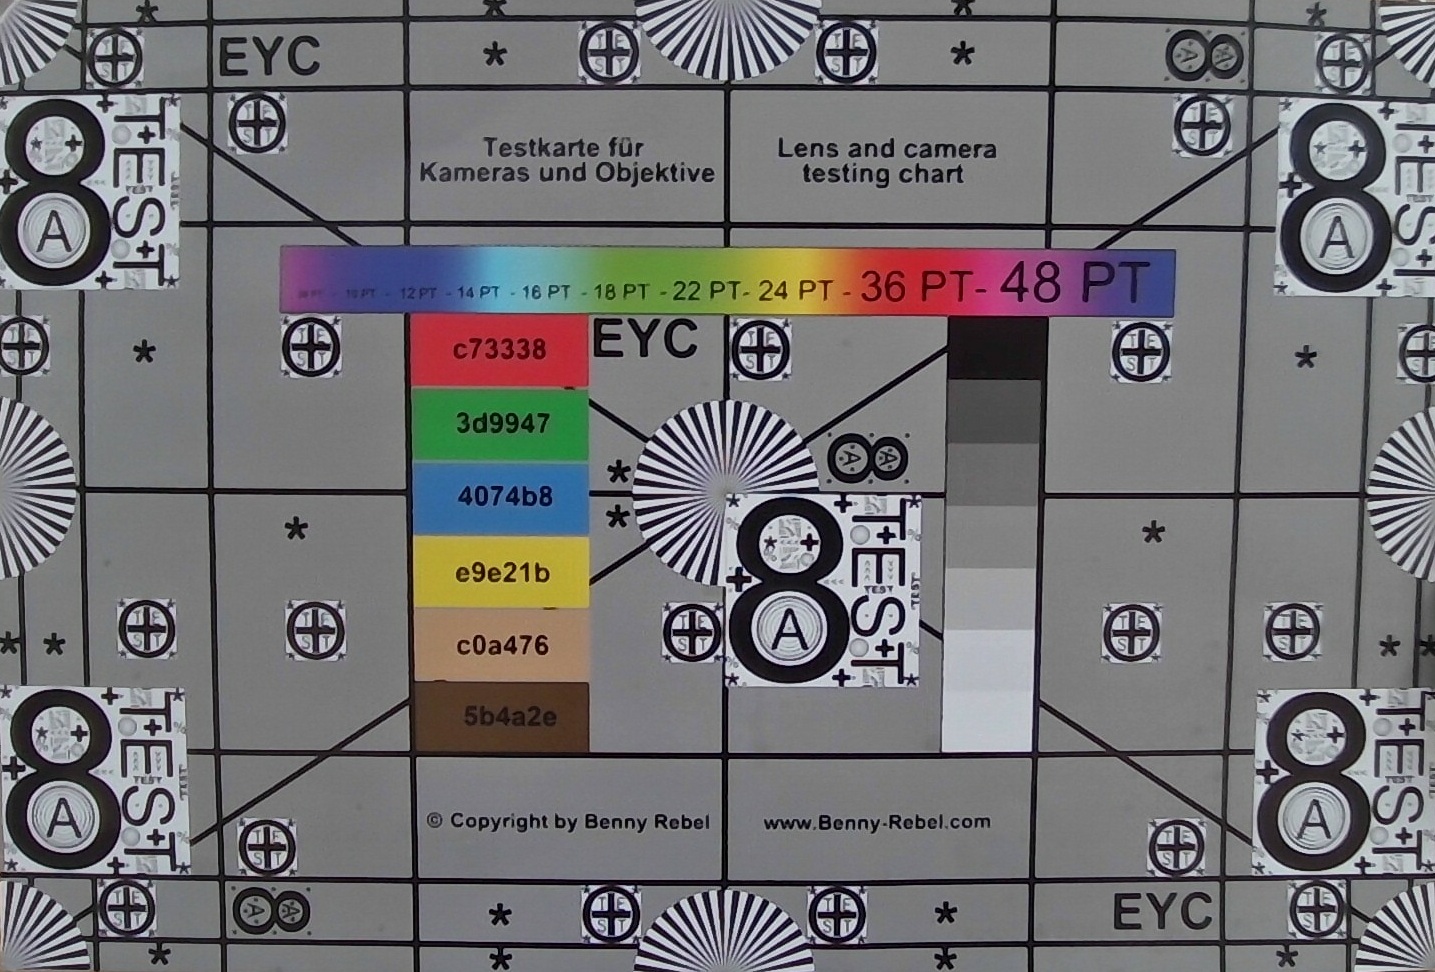
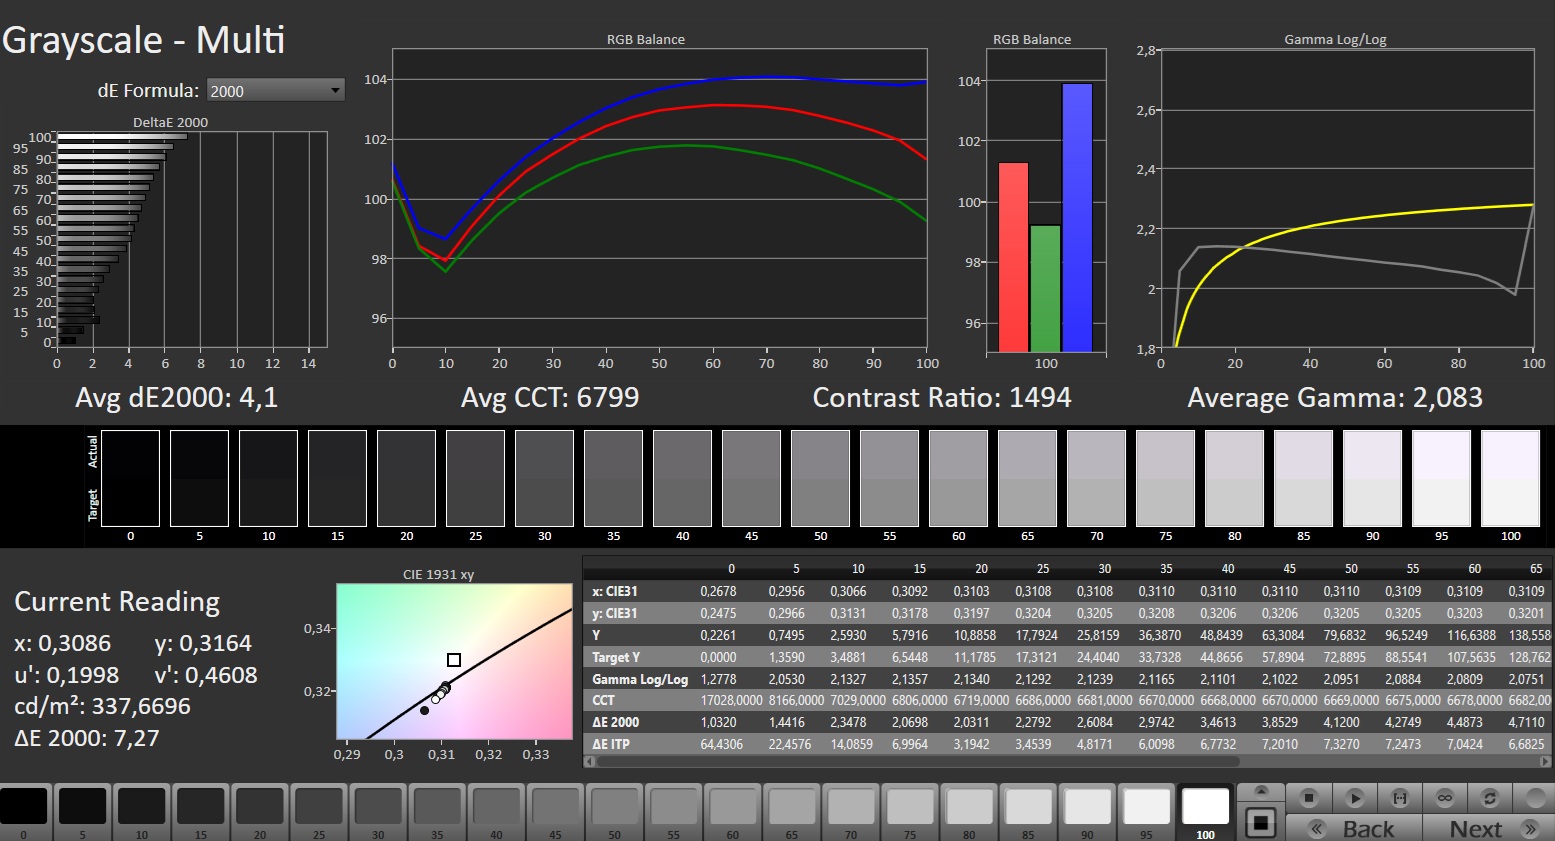
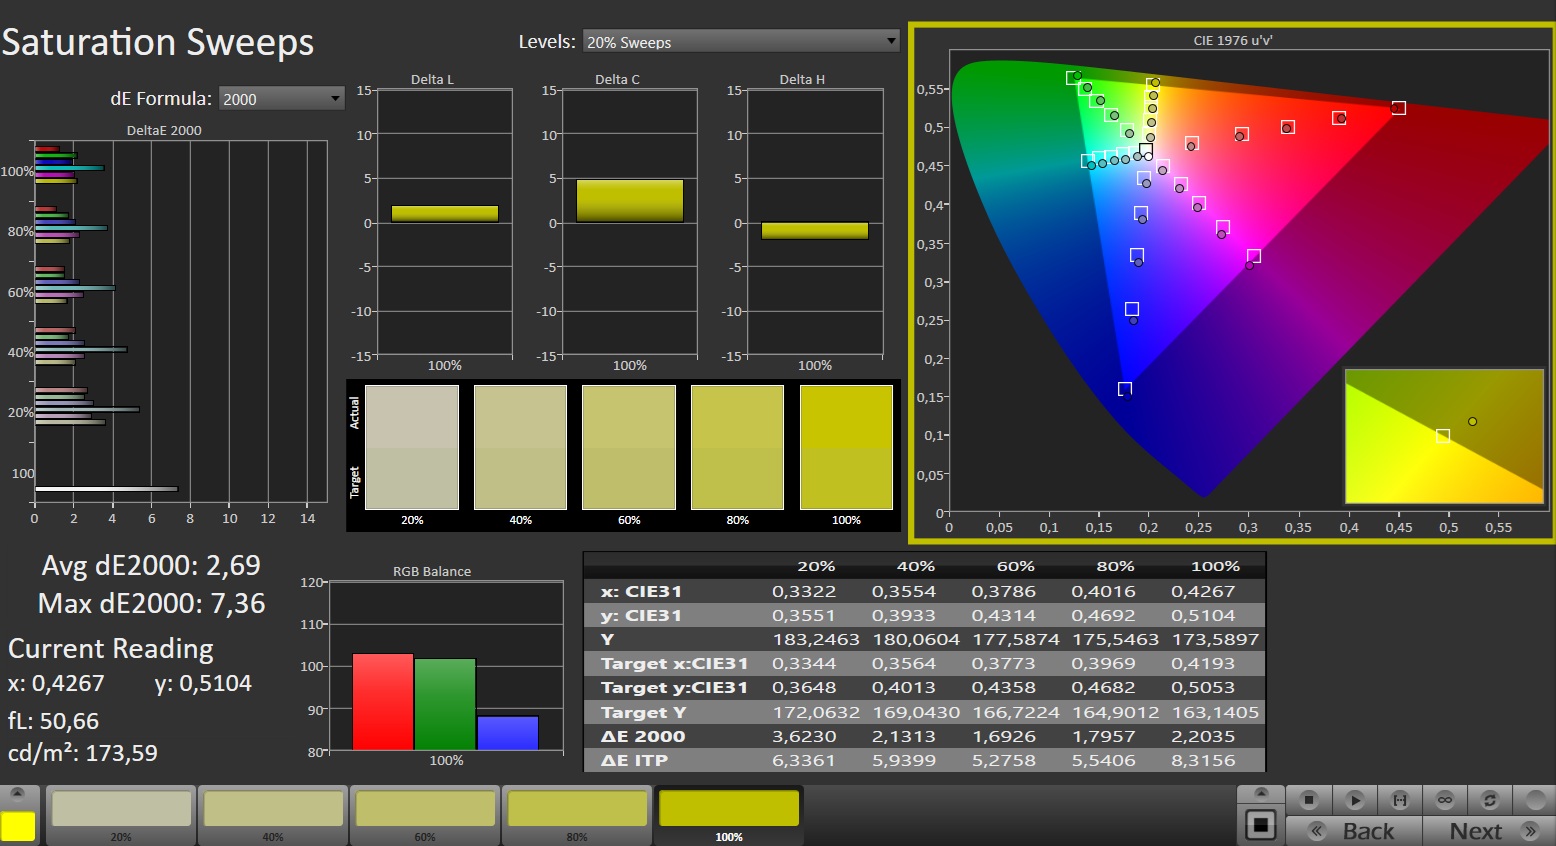
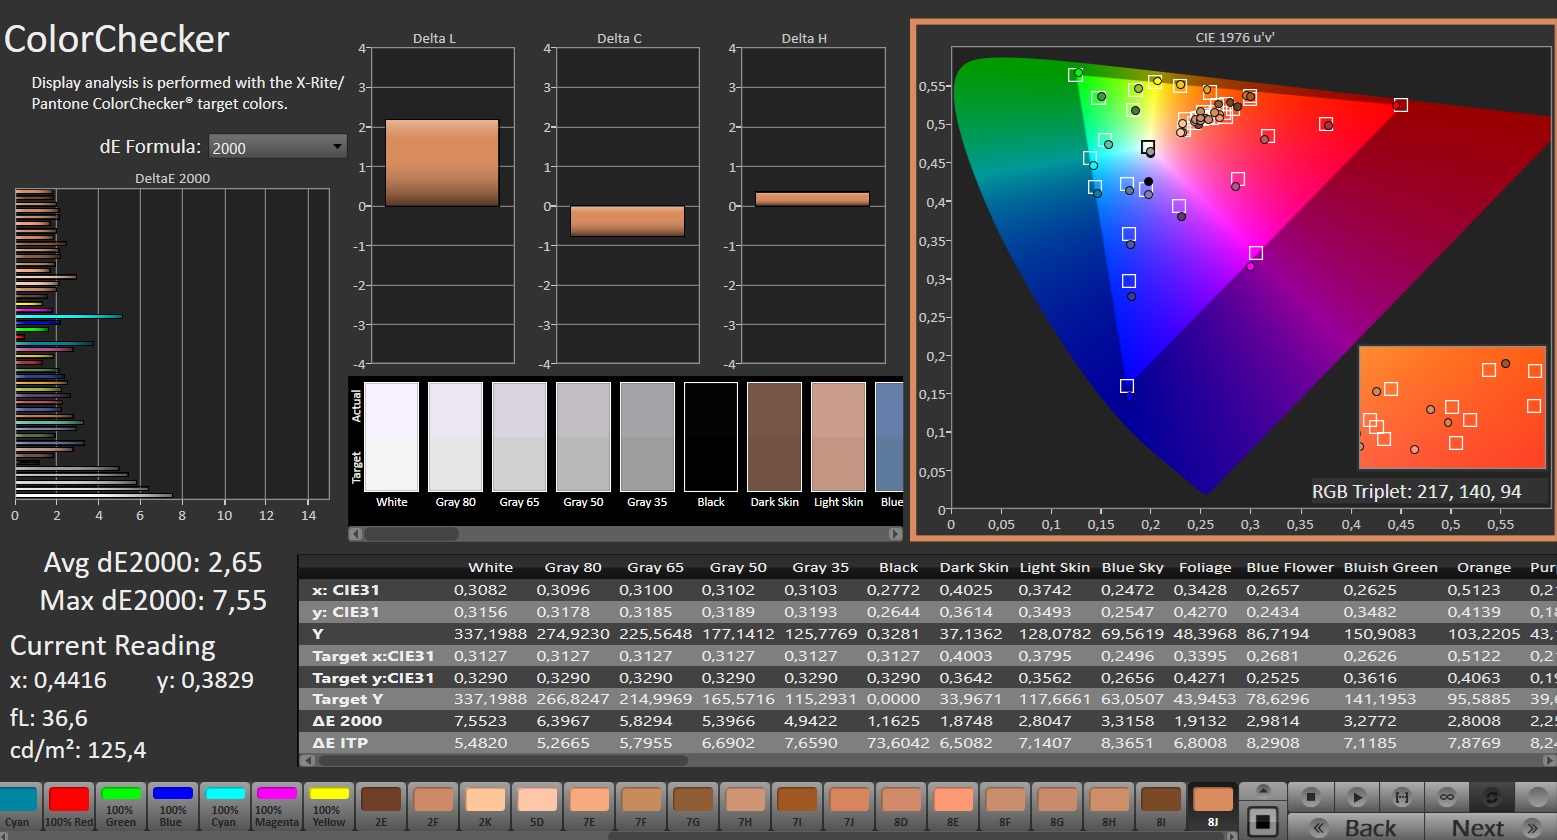
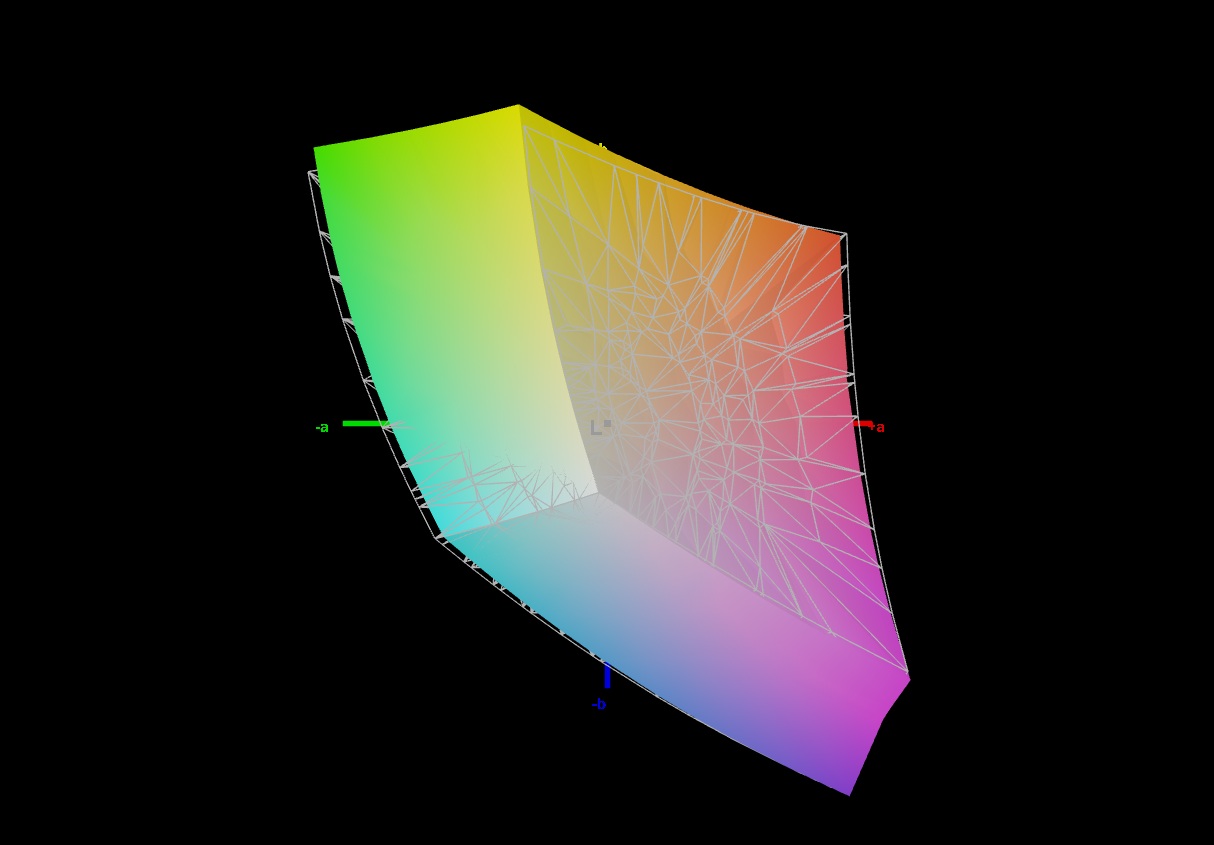
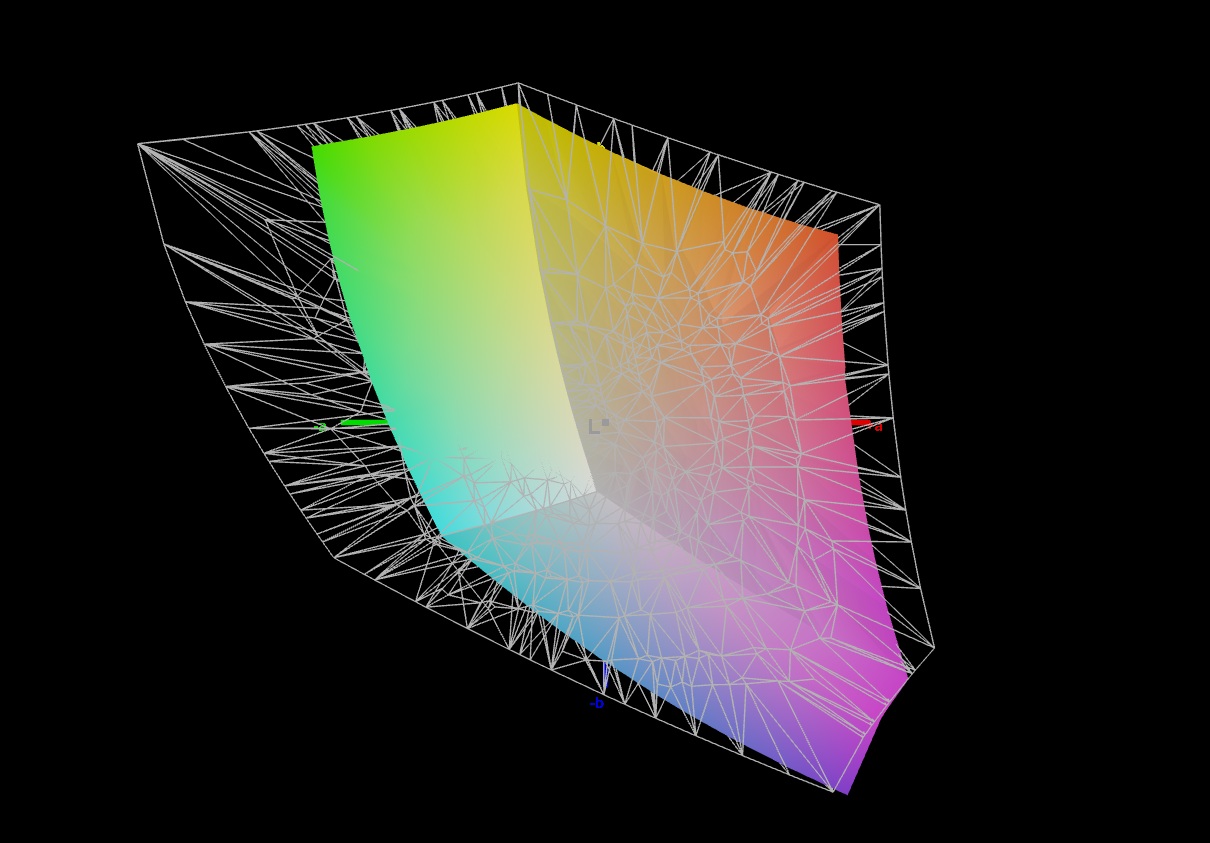
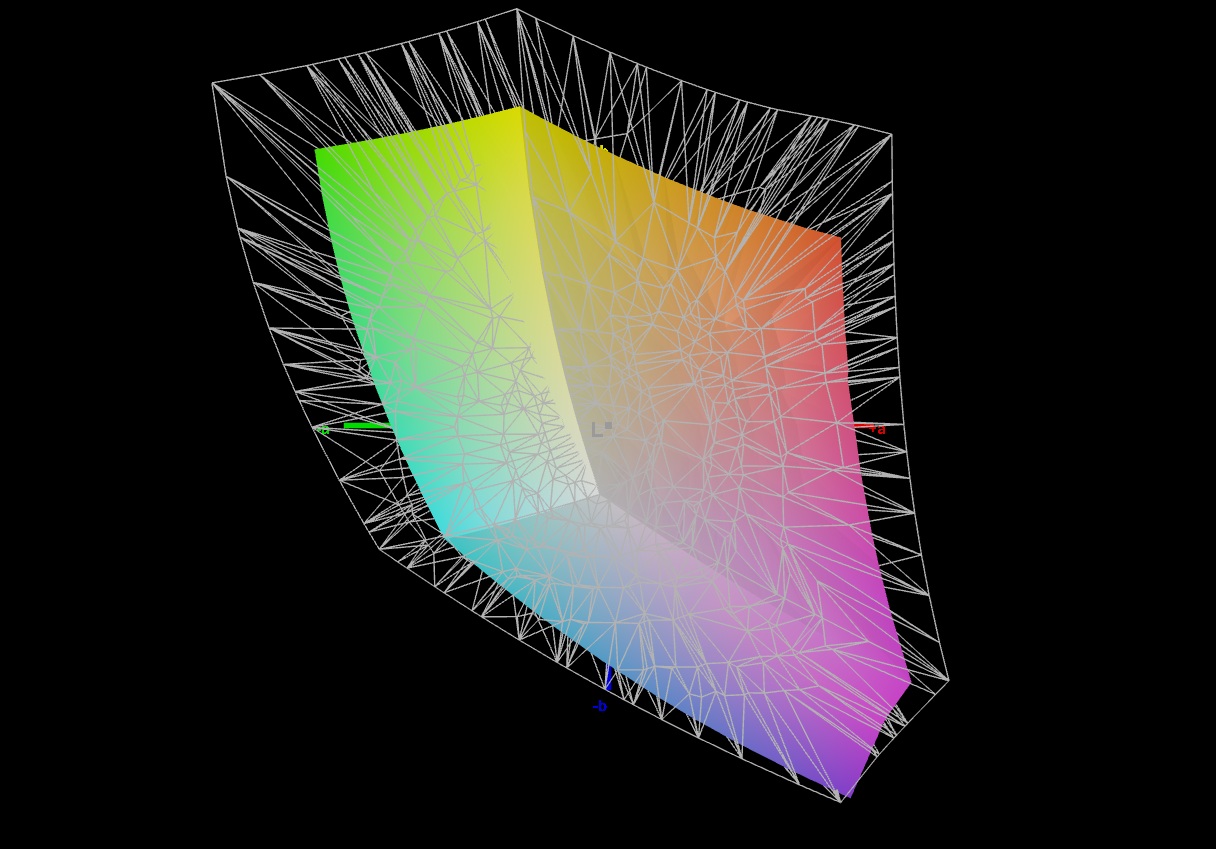
The 16:10 144 Hz display is fairly unremarkable and is identical to the panel used in the RTX 5070 version of the TUF Gaming A18. The IPS panel delivers adequate brightness, although its average of 323 cd/m² makes it suitable for outdoor use only to a limited extent. Contrast exceeds 1,400:1, while the sRGB colour space is covered almost in full. Viewing angles and response times are also in line with what is typically expected from an IPS panel. We detected no display flickering of the kind commonly associated with OLED panels.
| |||||||||||||||||||||||||
Brightness Distribution: 93 %
Center on Battery: 325 cd/m²
Contrast: 1413:1 (Black: 0.23 cd/m²)
ΔE ColorChecker Calman: 2.65 | ∀{0.5-29.43 Ø4.69}
ΔE Greyscale Calman: 4.1 | ∀{0.09-98 Ø4.94}
68.4% AdobeRGB 1998 (Argyll 3D)
96.6% sRGB (Argyll 3D)
66.7% Display P3 (Argyll 3D)
Gamma: 2.083
CCT: 6799 K
| Asus TUF Gaming A18 FA808UM NE180WUM-NY3, IPS, 1920x1200, 18", 144 Hz | MSI Cyborg 17 B13WFKG BOEhydis NV173FHM-NX4, IPS, 1920x1080, 17.3", 144 Hz | Acer Nitro 18 AI AN18-61-R10V BOEhydis NE180QDM-NY1, IPS, 2560x1600, 18", 165 Hz | Asus ROG Strix G18 2025 G814 NE180QDM-NZC, IPS, 2560x1600, 18", 240 Hz | MSI Crosshair 18 HX AI A2XW BOE NE180QDM-NZ4, IPS, 2560x1600, 18", 240 Hz | Asus TUF Gaming A18 FA808UP-S8022W NE180WUM-NY3 (BOE0CEF), IPS, 1920x1200, 18", 144 Hz | |
|---|---|---|---|---|---|---|
| Display | -49% | 24% | 27% | 26% | 2% | |
| Display P3 Coverage (%) | 66.7 | 33.7 -49% | 97.2 46% | 99.4 49% | 98 47% | 69.3 4% |
| sRGB Coverage (%) | 96.6 | 50.7 -48% | 99.9 3% | 100 4% | 100 4% | 98.1 2% |
| AdobeRGB 1998 Coverage (%) | 68.4 | 34.8 -49% | 84.8 24% | 87.7 28% | 86.1 26% | 67.9 -1% |
| Response Times | -172% | -12% | 35% | 0% | -27% | |
| Response Time Grey 50% / Grey 80% * (ms) | 6.2 ? | 21.9 ? -253% | 6.8 ? -10% | 3.8 ? 39% | 4.7 ? 24% | 8 ? -29% |
| Response Time Black / White * (ms) | 8.3 ? | 15.8 ? -90% | 9.4 ? -13% | 5.8 ? 30% | 10.3 ? -24% | 10.4 ? -25% |
| PWM Frequency (Hz) | ||||||
| Screen | -37% | -18% | 30% | -8% | -4% | |
| Brightness middle (cd/m²) | 325 | 274 -16% | 317 -2% | 582 79% | 581.4 79% | 351 8% |
| Brightness (cd/m²) | 323 | 252 -22% | 288 -11% | 557 72% | 534 65% | 332 3% |
| Brightness Distribution (%) | 93 | 85 -9% | 87 -6% | 93 0% | 84 -10% | 89 -4% |
| Black Level * (cd/m²) | 0.23 | 0.29 -26% | 0.28 -22% | 0.4 -74% | 0.46 -100% | 0.26 -13% |
| Contrast (:1) | 1413 | 945 -33% | 1132 -20% | 1455 3% | 1264 -11% | 1350 -4% |
| Colorchecker dE 2000 * | 2.65 | 5.19 -96% | 5.16 -95% | 1.4 47% | 3.89 -47% | 2.89 -9% |
| Colorchecker dE 2000 max. * | 7.55 | 19.99 -165% | 0.75 90% | 3.4 55% | 7.94 -5% | 7.91 -5% |
| Greyscale dE 2000 * | 4.1 | 1.2 71% | 7.4 -80% | 1.8 56% | 5.6 -37% | 4.46 -9% |
| Gamma | 2.083 106% | 2.121 104% | 2.093 105% | 2.24 98% | 2.1 105% | 2.46 89% |
| CCT | 6799 96% | 6597 99% | 6553 99% | 6633 98% | 6835 95% | 7132 91% |
| Colorchecker dE 2000 calibrated * | 5.02 | 2.42 | 0.7 | 0.97 | 0.93 | |
| Total Average (Program / Settings) | -86% /
-60% | -2% /
-7% | 31% /
30% | 6% /
1% | -10% /
-6% |
* ... smaller is better
Display Response Times
| ↔ Response Time Black to White | ||
|---|---|---|
| 8.3 ms ... rise ↗ and fall ↘ combined | ↗ 4.1 ms rise | 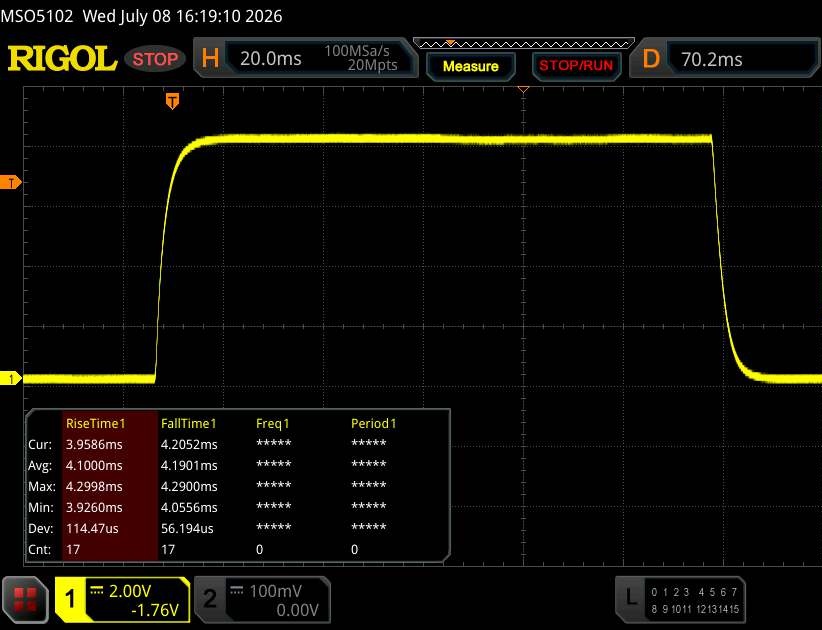 |
| ↘ 4.2 ms fall | ||
| The screen shows fast response rates in our tests and should be suited for gaming. In comparison, all tested devices range from 0.1 (minimum) to 240 (maximum) ms. » 24 % of all devices are better. This means that the measured response time is better than the average of all tested devices (19.6 ms). | ||
| ↔ Response Time 50% Grey to 80% Grey | ||
| 6.2 ms ... rise ↗ and fall ↘ combined | ↗ 2.7 ms rise | 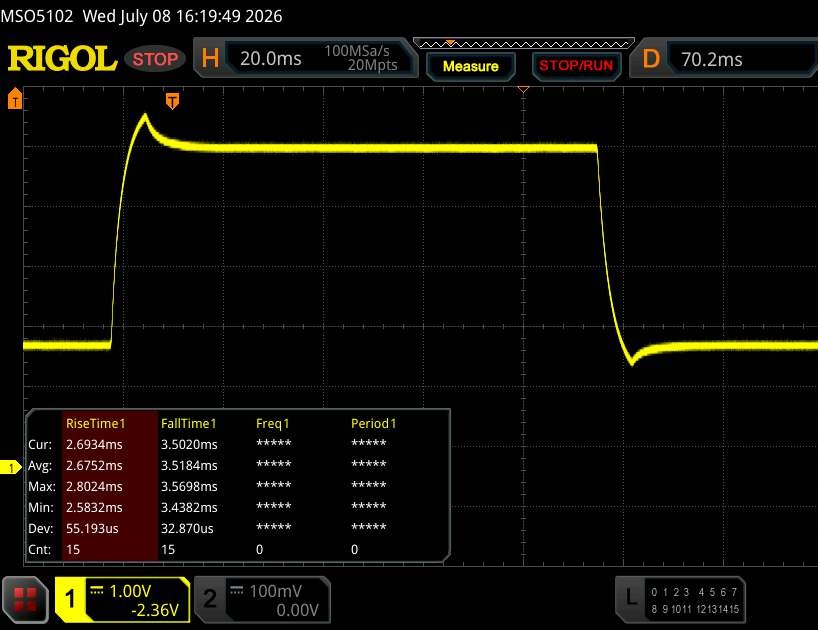 |
| ↘ 3.5 ms fall | ||
| The screen shows very fast response rates in our tests and should be very well suited for fast-paced gaming. In comparison, all tested devices range from 0.13 (minimum) to 636 (maximum) ms. » 20 % of all devices are better. This means that the measured response time is better than the average of all tested devices (30.7 ms). | ||
Screen Flickering / PWM (Pulse-Width Modulation)
| Screen flickering / PWM not detected | 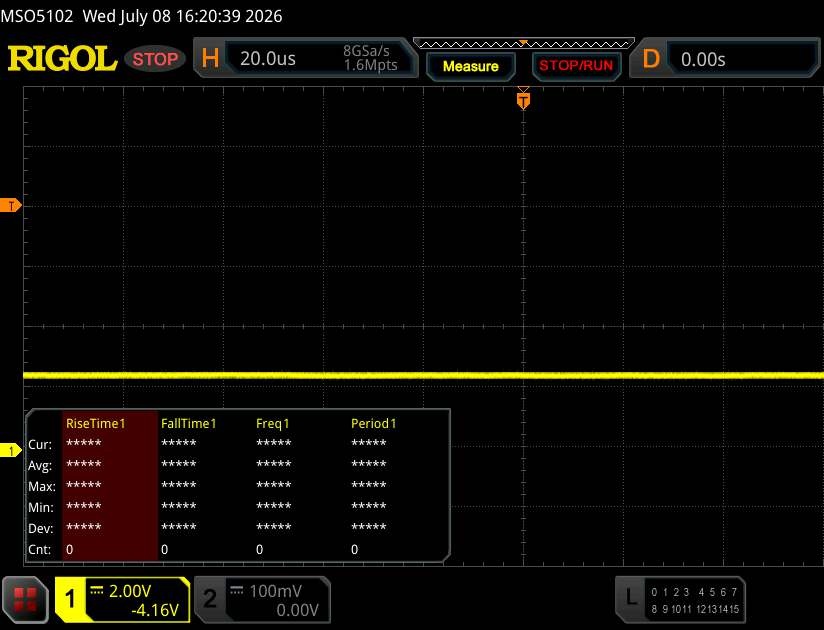 | ||
In comparison: 52 % of all tested devices do not use PWM to dim the display. If PWM was detected, an average of 7600 (minimum: 5 - maximum: 343500) Hz was measured. | |||
Performance
The RTX 5060 offers performance well suited to the mid-range segment. While the processor should continue to perform well for some time, the 8 GB of VRAM is already beginning to reach its limits in some cases.
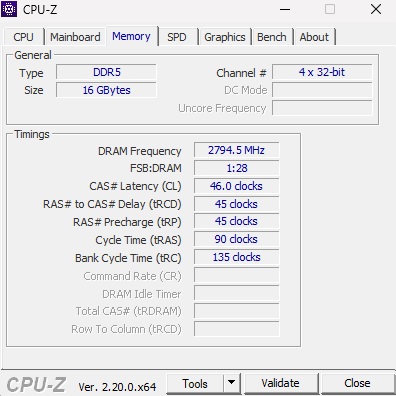
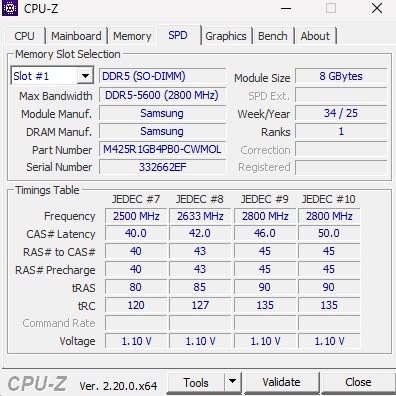
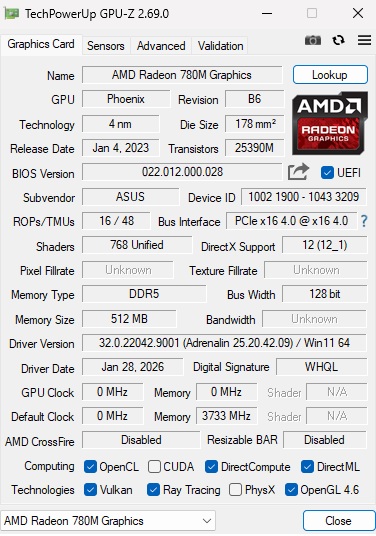
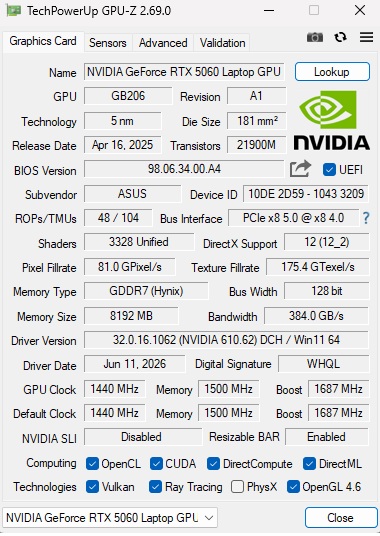
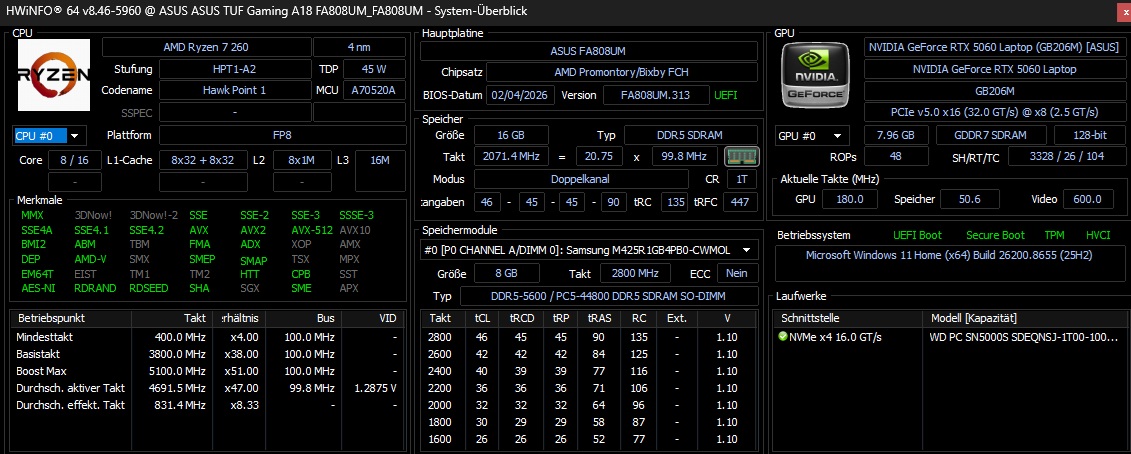
Test conditions
As usual, Asus Armoury Crate offers several performance profiles. As with the RTX 5070 configuration, all our measurements were carried out in Performance mode. The differences between the available modes are shown in the table below.
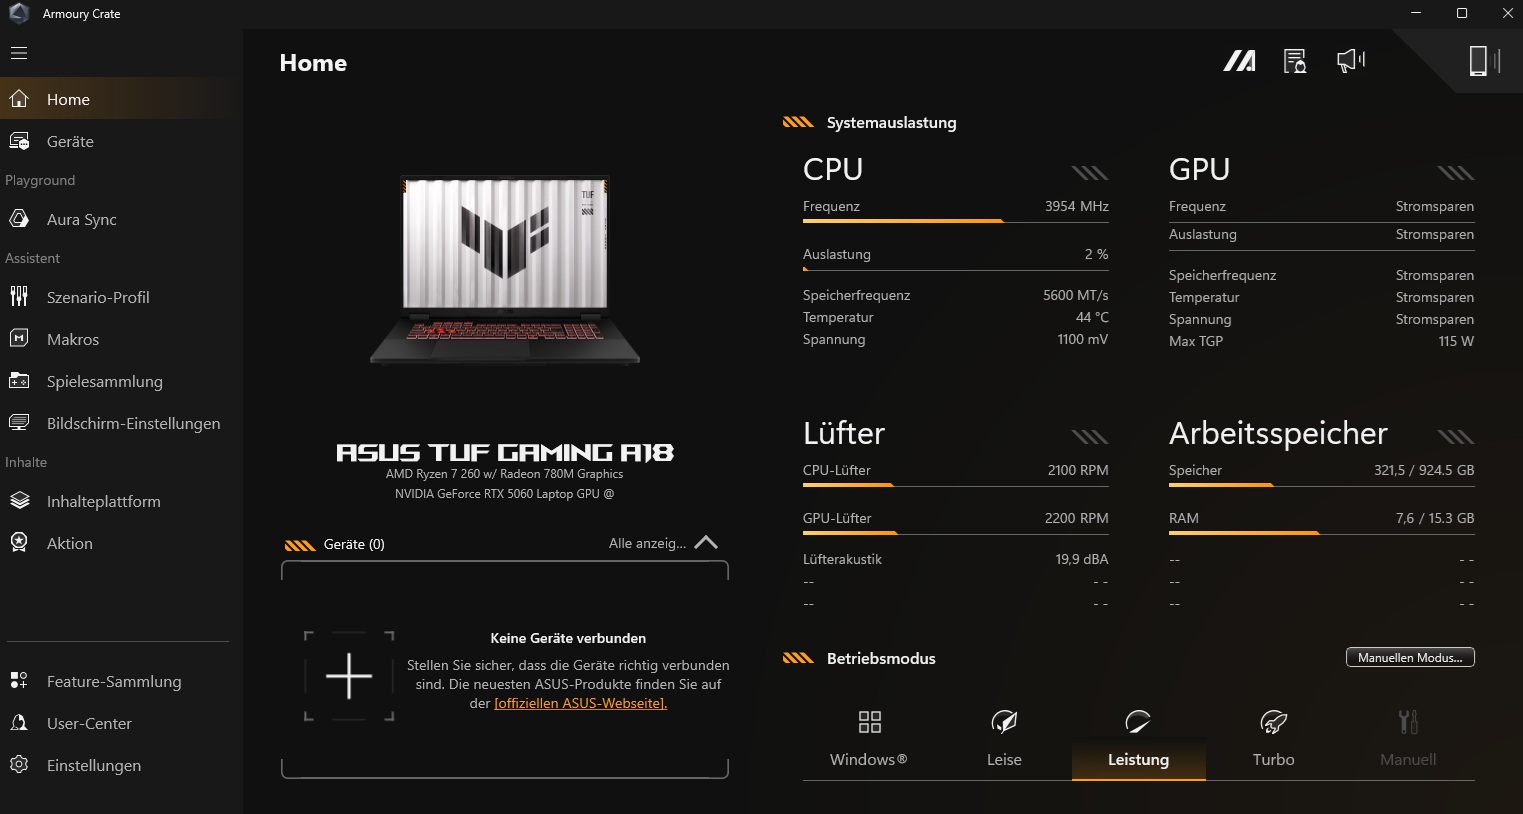
| Mode | Quiet | Performance | Turbo |
| Cyberpunk 2077 noise | 40 dB(A) | 43 dB(A) | 55 dB(A) |
| Cyberpunk 2077 frame rate (FHD/Ultra) | 73.2 fps | 85.8 fps | 95.6 fps |
| GPU power draw | 55 W | 80 W | 105 W |
| CPU PL1 | 54 W | 70 W | 80 W |
| CPU PL2 | 65 W | 80 W | 80 W |
| Cinebench R15 Multi score | 2565 points | 2742 points | 2744 points |
Processor performance
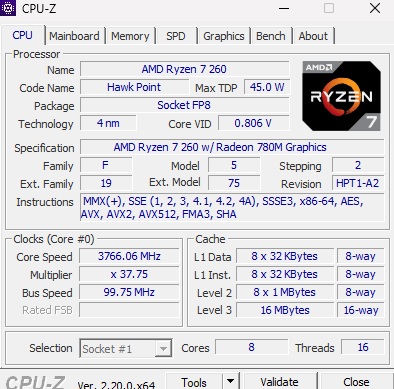
AMD's Ryzen 7 260 is a fairly powerful eight-core processor from the Zen 4 generation that can handle up to 16 threads simultaneously. In our CPU benchmark suite, the 4 nm chip delivered very consistent performance and reached roughly the same overall level as the newer Ryzen AI 7 350.
Cinebench R15 Multi endurance test
* ... smaller is better
AIDA64: FP32 Ray-Trace | FPU Julia | CPU SHA3 | FPU SinJulia | FPU Mandel | CPU AES | CPU ZLib | FP64 Ray-Trace | CPU PhotoWorxx
| Performance rating | |
| Asus ROG Strix G18 2025 G814 | |
| MSI Crosshair 18 HX AI A2XW | |
| Average of class Gaming | |
| Asus TUF Gaming A18 FA808UP-S8022W | |
| Asus TUF Gaming A18 FA808UM | |
| Average AMD Ryzen 7 260 | |
| Acer Nitro 18 AI AN18-61-R10V | |
| MSI Cyborg 17 B13WFKG | |
| AIDA64 / FP32 Ray-Trace | |
| Asus ROG Strix G18 2025 G814 (v6.92.6600) | |
| MSI Crosshair 18 HX AI A2XW (v6.92.6600) | |
| Average of class Gaming (10227 - 85542, n=102, last 2 years) | |
| Acer Nitro 18 AI AN18-61-R10V (v6.92.6600) | |
| Asus TUF Gaming A18 FA808UM (v8.20.8100) | |
| Average AMD Ryzen 7 260 (25995 - 29330, n=6) | |
| Asus TUF Gaming A18 FA808UP-S8022W (v6.92.6600) | |
| MSI Cyborg 17 B13WFKG (v6.92.6600) | |
| AIDA64 / FPU Julia | |
| Asus ROG Strix G18 2025 G814 (v6.92.6600) | |
| MSI Crosshair 18 HX AI A2XW (v6.92.6600) | |
| Average of class Gaming (51376 - 372155, n=102, last 2 years) | |
| Asus TUF Gaming A18 FA808UP-S8022W (v6.92.6600) | |
| Asus TUF Gaming A18 FA808UM (v8.20.8100) | |
| Average AMD Ryzen 7 260 (106250 - 121427, n=6) | |
| Acer Nitro 18 AI AN18-61-R10V (v6.92.6600) | |
| MSI Cyborg 17 B13WFKG (v6.92.6600) | |
| AIDA64 / CPU SHA3 | |
| Asus ROG Strix G18 2025 G814 (v6.92.6600) | |
| MSI Crosshair 18 HX AI A2XW (v6.92.6600) | |
| Average of class Gaming (2180 - 10115, n=102, last 2 years) | |
| Asus TUF Gaming A18 FA808UP-S8022W (v6.92.6600) | |
| Asus TUF Gaming A18 FA808UM (v8.20.8100) | |
| Average AMD Ryzen 7 260 (4636 - 5026, n=6) | |
| Acer Nitro 18 AI AN18-61-R10V (v6.92.6600) | |
| MSI Cyborg 17 B13WFKG (v6.92.6600) | |
| AIDA64 / FPU SinJulia | |
| Asus ROG Strix G18 2025 G814 (v6.92.6600) | |
| Asus TUF Gaming A18 FA808UP-S8022W (v6.92.6600) | |
| Asus TUF Gaming A18 FA808UM (v8.20.8100) | |
| Average AMD Ryzen 7 260 (14810 - 15497, n=6) | |
| Average of class Gaming (4424 - 33636, n=102, last 2 years) | |
| Acer Nitro 18 AI AN18-61-R10V (v6.92.6600) | |
| MSI Crosshair 18 HX AI A2XW (v6.92.6600) | |
| MSI Cyborg 17 B13WFKG (v6.92.6600) | |
| AIDA64 / FPU Mandel | |
| Asus ROG Strix G18 2025 G814 (v6.92.6600) | |
| MSI Crosshair 18 HX AI A2XW (v6.92.6600) | |
| Average of class Gaming (25115 - 196829, n=102, last 2 years) | |
| Asus TUF Gaming A18 FA808UM (v8.20.8100) | |
| Asus TUF Gaming A18 FA808UP-S8022W (v6.92.6600) | |
| Average AMD Ryzen 7 260 (56974 - 65308, n=6) | |
| Acer Nitro 18 AI AN18-61-R10V (v6.92.6600) | |
| MSI Cyborg 17 B13WFKG (v6.92.6600) | |
| AIDA64 / CPU AES | |
| Asus ROG Strix G18 2025 G814 (v6.92.6600) | |
| MSI Crosshair 18 HX AI A2XW (v6.92.6600) | |
| Average of class Gaming (39258 - 247074, n=102, last 2 years) | |
| Asus TUF Gaming A18 FA808UM (v8.20.8100) | |
| Asus TUF Gaming A18 FA808UP-S8022W (v6.92.6600) | |
| Acer Nitro 18 AI AN18-61-R10V (v6.92.6600) | |
| Average AMD Ryzen 7 260 (66825 - 91381, n=6) | |
| MSI Cyborg 17 B13WFKG (v6.92.6600) | |
| AIDA64 / CPU ZLib | |
| Asus ROG Strix G18 2025 G814 (v6.92.6600) | |
| MSI Crosshair 18 HX AI A2XW (v6.92.6600) | |
| Average of class Gaming (574 - 2531, n=102, last 2 years) | |
| Acer Nitro 18 AI AN18-61-R10V (v6.92.6600) | |
| Asus TUF Gaming A18 FA808UP-S8022W (v6.92.6600) | |
| Asus TUF Gaming A18 FA808UM (v8.20.8100) | |
| Average AMD Ryzen 7 260 (1039 - 1133, n=6) | |
| MSI Cyborg 17 B13WFKG (v6.92.6600) | |
| AIDA64 / FP64 Ray-Trace | |
| Asus ROG Strix G18 2025 G814 (v6.92.6600) | |
| MSI Crosshair 18 HX AI A2XW (v6.92.6600) | |
| Average of class Gaming (5509 - 45446, n=102, last 2 years) | |
| Asus TUF Gaming A18 FA808UP-S8022W (v6.92.6600) | |
| Acer Nitro 18 AI AN18-61-R10V (v6.92.6600) | |
| Average AMD Ryzen 7 260 (13944 - 15751, n=6) | |
| Asus TUF Gaming A18 FA808UM (v8.20.8100) | |
| MSI Cyborg 17 B13WFKG (v6.92.6600) | |
| AIDA64 / CPU PhotoWorxx | |
| MSI Crosshair 18 HX AI A2XW (v6.92.6600) | |
| Average of class Gaming (12271 - 89891, n=102, last 2 years) | |
| Asus ROG Strix G18 2025 G814 (v6.92.6600) | |
| Asus TUF Gaming A18 FA808UP-S8022W (v6.92.6600) | |
| Average AMD Ryzen 7 260 (23097 - 40796, n=6) | |
| Asus TUF Gaming A18 FA808UM (v8.20.8100) | |
| Acer Nitro 18 AI AN18-61-R10V (v6.92.6600) | |
| MSI Cyborg 17 B13WFKG (v6.92.6600) | |
System and storage performance
System performance also places the laptop in the lower mid-range. Unfortunately, the installed 1 TB SSD suffers from performance drops under heavier workloads, as was already the case with the RTX 5070 model.
PCMark 10: Score | Essentials | Productivity | Digital Content Creation
CrossMark: Overall | Productivity | Creativity | Responsiveness
WebXPRT 3: Overall
WebXPRT 4: Overall
Mozilla Kraken 1.1: Total
| Performance rating | |
| Asus ROG Strix G18 2025 G814 | |
| Acer Nitro 18 AI AN18-61-R10V -1! | |
| MSI Crosshair 18 HX AI A2XW | |
| Average of class Gaming | |
| Average AMD Ryzen 7 260, NVIDIA GeForce RTX 5060 Laptop | |
| Asus TUF Gaming A18 FA808UM | |
| Asus TUF Gaming A18 FA808UP-S8022W | |
| MSI Cyborg 17 B13WFKG | |
| PCMark 10 / Score | |
| Acer Nitro 18 AI AN18-61-R10V | |
| Asus ROG Strix G18 2025 G814 | |
| Average of class Gaming (5828 - 12414, n=93, last 2 years) | |
| Asus TUF Gaming A18 FA808UM | |
| Average AMD Ryzen 7 260, NVIDIA GeForce RTX 5060 Laptop (8241 - 8567, n=2) | |
| MSI Crosshair 18 HX AI A2XW | |
| MSI Cyborg 17 B13WFKG | |
| Asus TUF Gaming A18 FA808UP-S8022W | |
| PCMark 10 / Essentials | |
| Asus ROG Strix G18 2025 G814 | |
| MSI Crosshair 18 HX AI A2XW | |
| Average of class Gaming (8810 - 12187, n=97, last 2 years) | |
| Acer Nitro 18 AI AN18-61-R10V | |
| Average AMD Ryzen 7 260, NVIDIA GeForce RTX 5060 Laptop (9920 - 10806, n=2) | |
| Asus TUF Gaming A18 FA808UP-S8022W | |
| Asus TUF Gaming A18 FA808UM | |
| MSI Cyborg 17 B13WFKG | |
| PCMark 10 / Productivity | |
| Acer Nitro 18 AI AN18-61-R10V | |
| Asus TUF Gaming A18 FA808UM | |
| MSI Cyborg 17 B13WFKG | |
| Average AMD Ryzen 7 260, NVIDIA GeForce RTX 5060 Laptop (10163 - 14632, n=2) | |
| Average of class Gaming (6845 - 25323, n=95, last 2 years) | |
| Asus ROG Strix G18 2025 G814 | |
| MSI Crosshair 18 HX AI A2XW | |
| Asus TUF Gaming A18 FA808UP-S8022W | |
| PCMark 10 / Digital Content Creation | |
| Average of class Gaming (7602 - 19954, n=95, last 2 years) | |
| Asus ROG Strix G18 2025 G814 | |
| MSI Crosshair 18 HX AI A2XW | |
| Average AMD Ryzen 7 260, NVIDIA GeForce RTX 5060 Laptop (11756 - 13832, n=2) | |
| Asus TUF Gaming A18 FA808UP-S8022W | |
| Acer Nitro 18 AI AN18-61-R10V | |
| Asus TUF Gaming A18 FA808UM | |
| MSI Cyborg 17 B13WFKG | |
| CrossMark / Overall | |
| Asus ROG Strix G18 2025 G814 | |
| MSI Crosshair 18 HX AI A2XW | |
| Average of class Gaming (1366 - 2409, n=95, last 2 years) | |
| Asus TUF Gaming A18 FA808UP-S8022W | |
| Average AMD Ryzen 7 260, NVIDIA GeForce RTX 5060 Laptop (1658 - 1792, n=2) | |
| Acer Nitro 18 AI AN18-61-R10V | |
| Asus TUF Gaming A18 FA808UM | |
| MSI Cyborg 17 B13WFKG | |
| CrossMark / Productivity | |
| Asus ROG Strix G18 2025 G814 | |
| MSI Crosshair 18 HX AI A2XW | |
| Average of class Gaming (1386 - 2254, n=95, last 2 years) | |
| Asus TUF Gaming A18 FA808UP-S8022W | |
| Average AMD Ryzen 7 260, NVIDIA GeForce RTX 5060 Laptop (1610 - 1712, n=2) | |
| Acer Nitro 18 AI AN18-61-R10V | |
| Asus TUF Gaming A18 FA808UM | |
| MSI Cyborg 17 B13WFKG | |
| CrossMark / Creativity | |
| Asus ROG Strix G18 2025 G814 | |
| MSI Crosshair 18 HX AI A2XW | |
| Average of class Gaming (1343 - 2786, n=95, last 2 years) | |
| Asus TUF Gaming A18 FA808UP-S8022W | |
| Acer Nitro 18 AI AN18-61-R10V | |
| Average AMD Ryzen 7 260, NVIDIA GeForce RTX 5060 Laptop (1827 - 1957, n=2) | |
| Asus TUF Gaming A18 FA808UM | |
| MSI Cyborg 17 B13WFKG | |
| CrossMark / Responsiveness | |
| MSI Crosshair 18 HX AI A2XW | |
| Asus ROG Strix G18 2025 G814 | |
| Average of class Gaming (1241 - 2334, n=95, last 2 years) | |
| Average AMD Ryzen 7 260, NVIDIA GeForce RTX 5060 Laptop (1355 - 1580, n=2) | |
| Asus TUF Gaming A18 FA808UP-S8022W | |
| Acer Nitro 18 AI AN18-61-R10V | |
| Asus TUF Gaming A18 FA808UM | |
| MSI Cyborg 17 B13WFKG | |
| WebXPRT 3 / Overall | |
| Asus ROG Strix G18 2025 G814 | |
| MSI Crosshair 18 HX AI A2XW | |
| Average of class Gaming (220 - 532, n=100, last 2 years) | |
| Acer Nitro 18 AI AN18-61-R10V | |
| Average AMD Ryzen 7 260, NVIDIA GeForce RTX 5060 Laptop (286 - 308, n=2) | |
| Asus TUF Gaming A18 FA808UP-S8022W | |
| Asus TUF Gaming A18 FA808UM | |
| MSI Cyborg 17 B13WFKG | |
| WebXPRT 4 / Overall | |
| MSI Crosshair 18 HX AI A2XW | |
| Asus ROG Strix G18 2025 G814 | |
| Average of class Gaming (165 - 354, n=100, last 2 years) | |
| Acer Nitro 18 AI AN18-61-R10V | |
| Average AMD Ryzen 7 260, NVIDIA GeForce RTX 5060 Laptop (234 - 261, n=2) | |
| Asus TUF Gaming A18 FA808UP-S8022W | |
| Asus TUF Gaming A18 FA808UM | |
| MSI Cyborg 17 B13WFKG | |
| Mozilla Kraken 1.1 / Total | |
| Asus TUF Gaming A18 FA808UP-S8022W | |
| MSI Cyborg 17 B13WFKG | |
| Asus TUF Gaming A18 FA808UM | |
| Average AMD Ryzen 7 260, NVIDIA GeForce RTX 5060 Laptop (494 - 533, n=2) | |
| Average of class Gaming (391 - 590, n=102, last 2 years) | |
| MSI Crosshair 18 HX AI A2XW | |
| Asus ROG Strix G18 2025 G814 | |
* ... smaller is better
| PCMark 10 Score | 8567 points | |
Help | ||
| AIDA64 / Memory Copy | |
| MSI Crosshair 18 HX AI A2XW | |
| Average of class Gaming (21750 - 129946, n=102, last 2 years) | |
| Asus TUF Gaming A18 FA808UP-S8022W | |
| Asus TUF Gaming A18 FA808UM | |
| Asus ROG Strix G18 2025 G814 | |
| Average AMD Ryzen 7 260 (35762 - 69413, n=6) | |
| Acer Nitro 18 AI AN18-61-R10V | |
| MSI Cyborg 17 B13WFKG | |
| AIDA64 / Memory Read | |
| MSI Crosshair 18 HX AI A2XW | |
| Average of class Gaming (22956 - 118858, n=102, last 2 years) | |
| Asus ROG Strix G18 2025 G814 | |
| Asus TUF Gaming A18 FA808UM | |
| Asus TUF Gaming A18 FA808UP-S8022W | |
| Average AMD Ryzen 7 260 (30070 - 61363, n=6) | |
| Acer Nitro 18 AI AN18-61-R10V | |
| MSI Cyborg 17 B13WFKG | |
| AIDA64 / Memory Write | |
| Asus TUF Gaming A18 FA808UP-S8022W | |
| Asus TUF Gaming A18 FA808UM | |
| MSI Crosshair 18 HX AI A2XW | |
| Average of class Gaming (22297 - 135096, n=102, last 2 years) | |
| Average AMD Ryzen 7 260 (42757 - 87114, n=6) | |
| Asus ROG Strix G18 2025 G814 | |
| Acer Nitro 18 AI AN18-61-R10V | |
| MSI Cyborg 17 B13WFKG | |
| AIDA64 / Memory Latency | |
| MSI Crosshair 18 HX AI A2XW | |
| Average of class Gaming (75.3 - 151.7, n=102, last 2 years) | |
| Asus ROG Strix G18 2025 G814 | |
| MSI Cyborg 17 B13WFKG | |
| Average AMD Ryzen 7 260 (90.8 - 94.1, n=6) | |
| Asus TUF Gaming A18 FA808UP-S8022W | |
| Acer Nitro 18 AI AN18-61-R10V | |
| Asus TUF Gaming A18 FA808UM | |
* ... smaller is better

* ... smaller is better
Sustained read performance: DiskSpd read loop, queue depth 8
GPU and gaming performance
GPU performance is one of the laptop's strengths. By RTX 5060 standards, the TUF Gaming A18 performs above average in the graphics benchmarks and, in some cases, is not far behind more expensive RTX 5070-equipped competitors. All of the tested games were playable even at maximum settings, so DLSS or Frame Generation is generally unnecessary. As with CPU performance, the GPU frame rate also proved very stable, as shown in the Cyberpunk chart below.
| 3DMark 11 Performance | 32735 points | |
| 3DMark Cloud Gate Standard Score | 65437 points | |
| 3DMark Fire Strike Score | 28481 points | |
| 3DMark Time Spy Score | 11603 points | |
Help | ||
* ... smaller is better
| Performance rating - Percent | |
| Average of class Gaming | |
| Lenovo LOQ 15AHP11 | |
| Average NVIDIA GeForce RTX 5060 Laptop | |
| Asus TUF Gaming A18 FA808UM | |
| 007 First Light | |
| 1920x1080 High Settings AF:16x | |
| Average of class Gaming (60.2 - 111.8, n=6, last 2 years) | |
| Lenovo LOQ 15AHP11 | |
| Asus TUF Gaming A18 FA808UM | |
| Average NVIDIA GeForce RTX 5060 Laptop (57.7 - 62.8, n=3) | |
| 1920x1080 Ultra Settings AF:16x | |
| Average of class Gaming (57.3 - 108.2, n=6, last 2 years) | |
| Lenovo LOQ 15AHP11 | |
| Average NVIDIA GeForce RTX 5060 Laptop (55.2 - 60.4, n=3) | |
| Asus TUF Gaming A18 FA808UM | |
| Death Stranding 2 | |
| 1920x1080 High Preset | |
| Average of class Gaming (9.45 - 109.5, n=6, last 2 years) | |
| Lenovo LOQ 15AHP11 | |
| Average NVIDIA GeForce RTX 5060 Laptop (61.6 - 64.5, n=3) | |
| Asus TUF Gaming A18 FA808UM | |
| 1920x1080 Very High Preset | |
| Average of class Gaming (7.22 - 87.5, n=6, last 2 years) | |
| Lenovo LOQ 15AHP11 | |
| Average NVIDIA GeForce RTX 5060 Laptop (47.2 - 51.7, n=3) | |
| Asus TUF Gaming A18 FA808UM | |
| Resident Evil Requiem | |
| 1920x1080 High Settings (no upscaling) | |
| Average of class Gaming (90.4 - 168.3, n=6, last 2 years) | |
| Asus TUF Gaming A18 FA808UM | |
| Average NVIDIA GeForce RTX 5060 Laptop (90.4 - 94.1, n=3) | |
| Lenovo LOQ 15AHP11 | |
| 1920x1080 Max Settings + High Ray Tracing (no upscaling) | |
| Average of class Gaming (46.7 - 87.5, n=6, last 2 years) | |
| Lenovo LOQ 15AHP11 | |
| Asus TUF Gaming A18 FA808UM | |
| Average NVIDIA GeForce RTX 5060 Laptop (43.4 - 47.7, n=3) | |
| Pragmata - 1920x1080 Quality Preset | |
| Average of class Gaming (8.66 - 164.9, n=8, last 2 years) | |
| Lenovo LOQ 15AHP11 | |
| Average NVIDIA GeForce RTX 5060 Laptop (80.6 - 83.1, n=3) | |
| Asus TUF Gaming A18 FA808UM | |
| low | med. | high | ultra | |
|---|---|---|---|---|
| Dota 2 Reborn (2015) | 129.7 | 120.4 | ||
| X-Plane 11.11 (2018) | 79.6 | |||
| Cyberpunk 2077 (2023) | 95.7 | 85.8 | ||
| Resident Evil Requiem (2026) | 92.6 | 46.7 | ||
| Death Stranding 2 (2026) | 61.6 | 48.3 | ||
| Crimson Desert (2026) | 60 | 49.9 | ||
| Pragmata (2026) | 80.6 | |||
| 007 First Light (2026) | 60.2 | 57.3 |
Cyberpunk 2077 Ultra FPS chart
Emissions and energy
Noise emissions
Under 3D load, the Asus laptop remains relatively restrained compared with the competition, provided Performance mode is used. Noise levels of 36 to 46 dB(A) are clearly audible but not distractingly loud. Aside from occasional brief increases in fan speed, there is also little to criticise during idle operation.
Noise level
| Idle |
| 25 / 26 / 33 dB(A) |
| Load |
| 36 / 46 dB(A) |
 | ||
30 dB silent 40 dB(A) audible 50 dB(A) loud |
||
min:  , med: , med:  , max: , max:  Earthworks M23R, Arta (15 cm distance) environment noise: 25 dB(A) Earthworks M23R, Arta (15 cm distance) environment noise: 25 dB(A) | ||
| Asus TUF Gaming A18 FA808UM R7 260, GeForce RTX 5060 Laptop | MSI Cyborg 17 B13WFKG i7-13620H, GeForce RTX 5060 Laptop | Acer Nitro 18 AI AN18-61-R10V Ryzen AI 7 350, GeForce RTX 5070 Laptop | Asus ROG Strix G18 2025 G814 R9 9955HX, GeForce RTX 5070 Laptop | MSI Crosshair 18 HX AI A2XW Ultra 9 275HX, GeForce RTX 5070 Laptop | |
|---|---|---|---|---|---|
| Noise | -7% | -14% | -3% | -4% | |
| off / environment * (dB) | 25 | 25 -0% | 24 4% | 24.6 2% | 23.1 8% |
| Idle Minimum * (dB) | 25 | 25 -0% | 28 -12% | 24.6 2% | 27.3 -9% |
| Idle Average * (dB) | 26 | 27 -4% | 29 -12% | 30 -15% | 27.3 -5% |
| Idle Maximum * (dB) | 33 | 34 -3% | 31 6% | 30 9% | 27.6 16% |
| Load Average * (dB) | 36 | 44 -22% | 49 -36% | 34.4 4% | 30.1 16% |
| Cyberpunk 2077 ultra * (dB) | 43 | 48 -12% | 54 -26% | 49.7 -16% | 54.4 -27% |
| Load Maximum * (dB) | 46 | 50 -9% | 56 -22% | 49.7 -8% | 58.6 -27% |
* ... smaller is better
Temperature
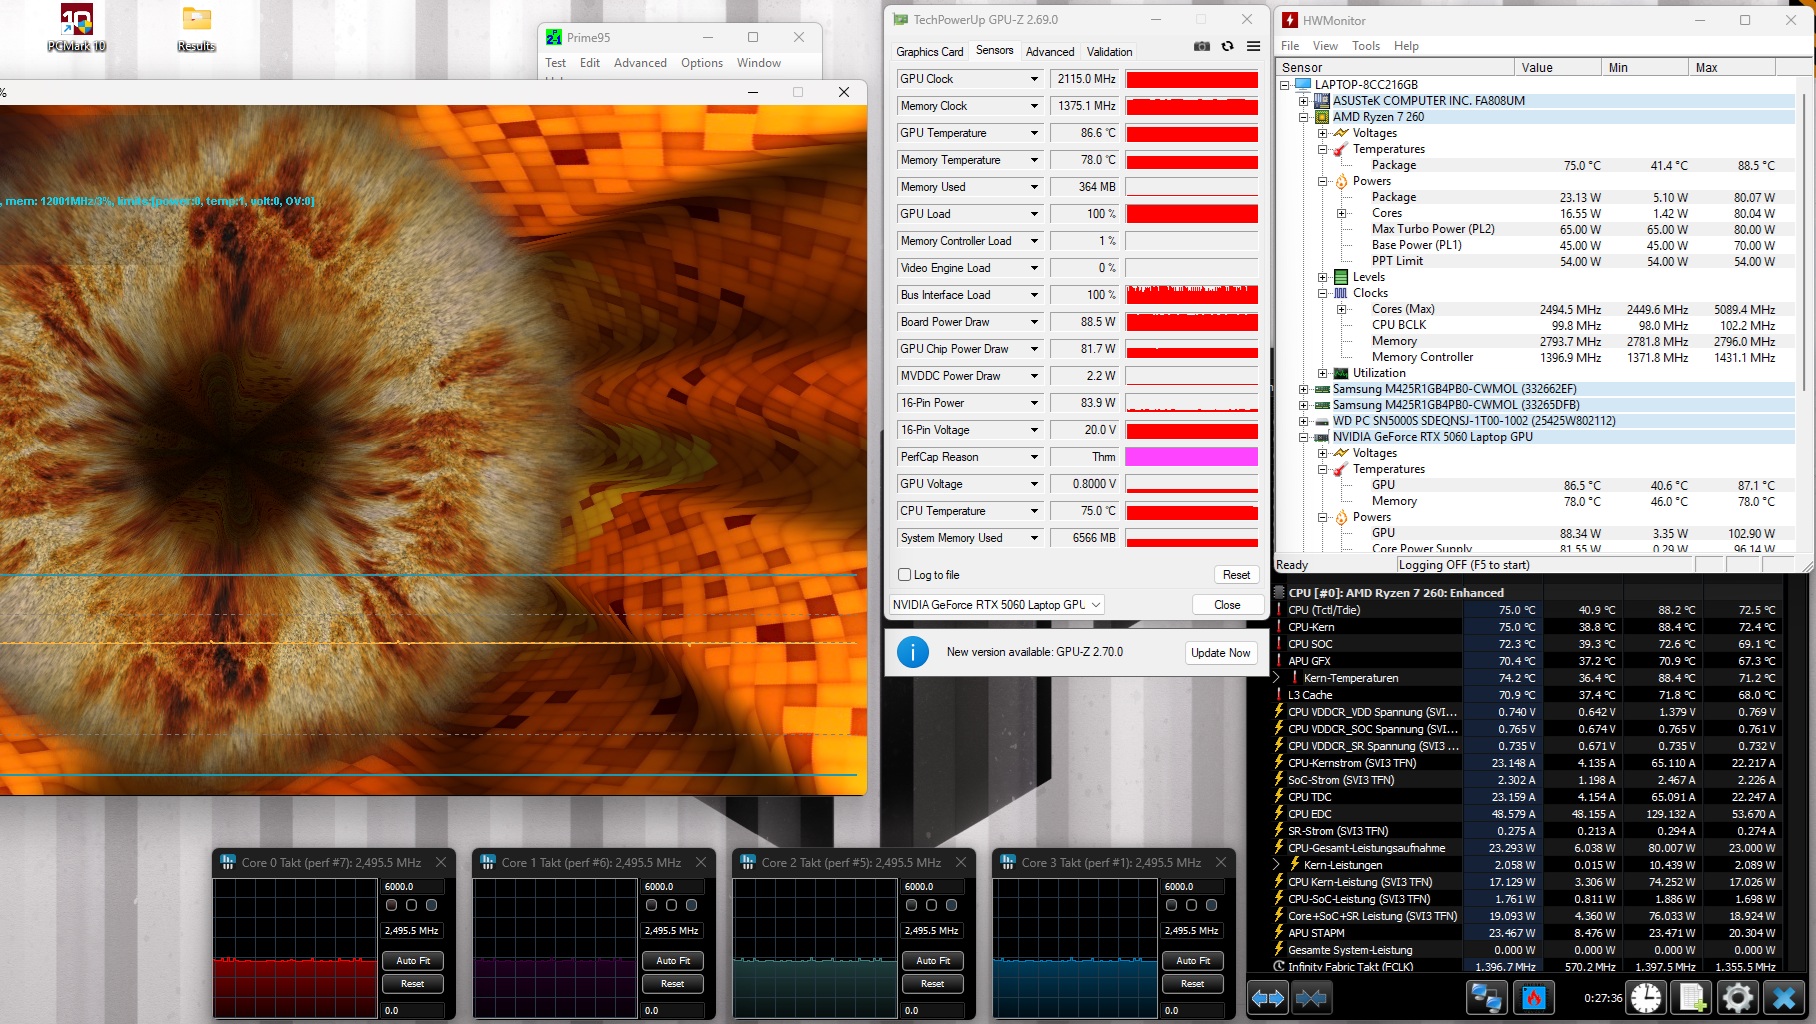
While the underside of the chassis exceeded 50 °C during the stress test with FurMark and Prime95, the upper side remained a few degrees cooler overall. The CPU averaged 75 °C, while the GPU reached just under 87 °C after some time.
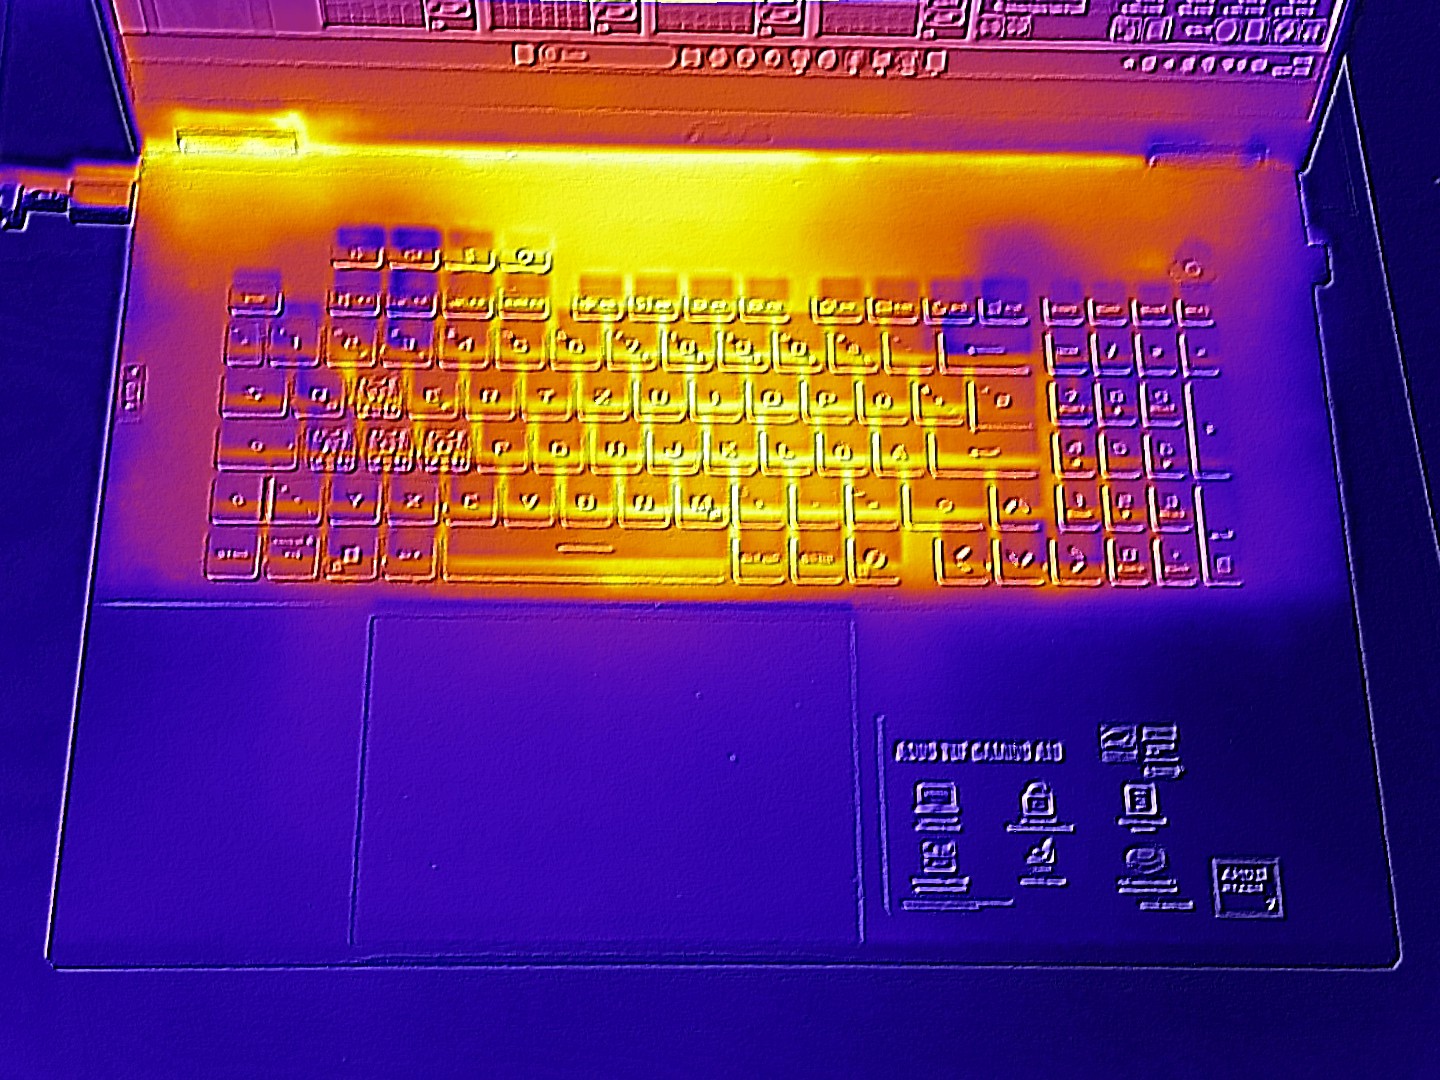
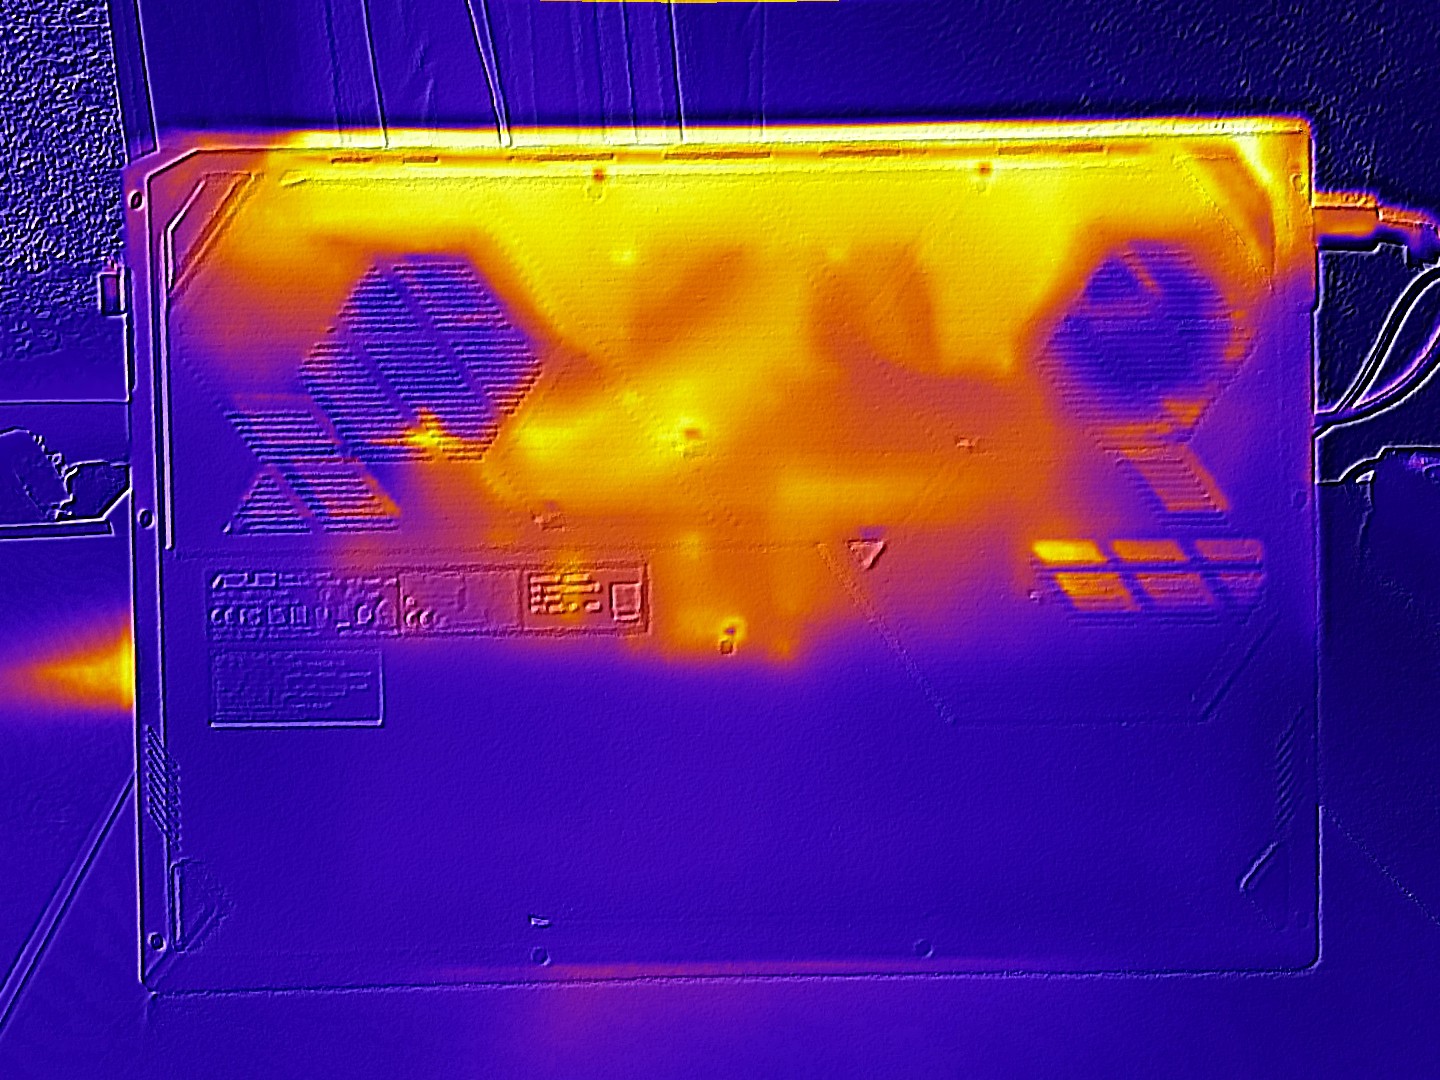
(-) The maximum temperature on the upper side is 46 °C / 115 F, compared to the average of 40.4 °C / 105 F, ranging from 21.2 to 68.8 °C for the class Gaming.
(-) The bottom heats up to a maximum of 51 °C / 124 F, compared to the average of 43.2 °C / 110 F
(+) The palmrests and touchpad are cooler than skin temperature with a maximum of 30 °C / 86 F and are therefore cool to the touch.
(±) The average temperature of the palmrest area of similar devices was 28.8 °C / 83.8 F (-1.2 °C / -2.2 F).
| Asus TUF Gaming A18 FA808UM R7 260, GeForce RTX 5060 Laptop | MSI Cyborg 17 B13WFKG i7-13620H, GeForce RTX 5060 Laptop | Acer Nitro 18 AI AN18-61-R10V Ryzen AI 7 350, GeForce RTX 5070 Laptop | Asus ROG Strix G18 2025 G814 R9 9955HX, GeForce RTX 5070 Laptop | MSI Crosshair 18 HX AI A2XW Ultra 9 275HX, GeForce RTX 5070 Laptop | |
|---|---|---|---|---|---|
| Heat | -2% | -4% | 11% | 14% | |
| Maximum Upper Side * (°C) | 46 | 49 -7% | 44 4% | 42.8 7% | 40.2 13% |
| Maximum Bottom * (°C) | 51 | 49 4% | 57 -12% | 43.1 15% | 44 14% |
| Idle Upper Side * (°C) | 37 | 25 | 26.8 | 25.6 | |
| Idle Bottom * (°C) | 39 | 28 | 26.6 | 26.8 |
* ... smaller is better
Speakers
Apart from the somewhat weak bass, the sound quality is quite respectable. Of the comparison devices, only Asus's own ROG Strix G18 sounded better.
Asus TUF Gaming A18 FA808UM audio analysis
(±) | speaker loudness is average but good (77 dB)
Bass 100 - 315 Hz
(±) | reduced bass - on average 9.5% lower than median
(±) | linearity of bass is average (11.3% delta to prev. frequency)
Mids 400 - 2000 Hz
(+) | balanced mids - only 4.8% away from median
(+) | mids are linear (4.6% delta to prev. frequency)
Highs 2 - 16 kHz
(+) | balanced highs - only 3.3% away from median
(±) | linearity of highs is average (7.1% delta to prev. frequency)
Overall 100 - 16.000 Hz
(+) | overall sound is linear (14% difference to median)
Compared to same class
» 23% of all tested devices in this class were better, 8% similar, 69% worse
» The best had a delta of 6%, average was 18%, worst was 132%
Compared to all devices tested
» 17% of all tested devices were better, 4% similar, 79% worse
» The best had a delta of 4%, average was 23%, worst was 136%
MSI Cyborg 17 B13WFKG audio analysis
(+) | speakers can play relatively loud (86 dB)
Bass 100 - 315 Hz
(-) | nearly no bass - on average 23% lower than median
(±) | linearity of bass is average (14% delta to prev. frequency)
Mids 400 - 2000 Hz
(+) | balanced mids - only 2.5% away from median
(+) | mids are linear (4.3% delta to prev. frequency)
Highs 2 - 16 kHz
(±) | higher highs - on average 5.1% higher than median
(+) | highs are linear (4% delta to prev. frequency)
Overall 100 - 16.000 Hz
(±) | linearity of overall sound is average (15.2% difference to median)
Compared to same class
» 34% of all tested devices in this class were better, 6% similar, 60% worse
» The best had a delta of 6%, average was 18%, worst was 132%
Compared to all devices tested
» 22% of all tested devices were better, 4% similar, 74% worse
» The best had a delta of 4%, average was 23%, worst was 136%
Acer Nitro 18 AI AN18-61-R10V audio analysis
(±) | speaker loudness is average but good (80 dB)
Bass 100 - 315 Hz
(-) | nearly no bass - on average 25% lower than median
(±) | linearity of bass is average (14.4% delta to prev. frequency)
Mids 400 - 2000 Hz
(+) | balanced mids - only 2% away from median
(+) | mids are linear (3.9% delta to prev. frequency)
Highs 2 - 16 kHz
(+) | balanced highs - only 3.1% away from median
(+) | highs are linear (6.6% delta to prev. frequency)
Overall 100 - 16.000 Hz
(±) | linearity of overall sound is average (16.9% difference to median)
Compared to same class
» 45% of all tested devices in this class were better, 11% similar, 44% worse
» The best had a delta of 6%, average was 18%, worst was 132%
Compared to all devices tested
» 31% of all tested devices were better, 8% similar, 62% worse
» The best had a delta of 4%, average was 23%, worst was 136%
Asus ROG Strix G18 2025 G814 audio analysis
(+) | speakers can play relatively loud (83.3 dB)
Bass 100 - 315 Hz
(±) | reduced bass - on average 11% lower than median
(±) | linearity of bass is average (8.4% delta to prev. frequency)
Mids 400 - 2000 Hz
(+) | balanced mids - only 4.4% away from median
(+) | mids are linear (3.1% delta to prev. frequency)
Highs 2 - 16 kHz
(+) | balanced highs - only 2.7% away from median
(+) | highs are linear (4.8% delta to prev. frequency)
Overall 100 - 16.000 Hz
(+) | overall sound is linear (12.1% difference to median)
Compared to same class
» 13% of all tested devices in this class were better, 4% similar, 84% worse
» The best had a delta of 6%, average was 18%, worst was 132%
Compared to all devices tested
» 10% of all tested devices were better, 2% similar, 88% worse
» The best had a delta of 4%, average was 23%, worst was 136%
MSI Crosshair 18 HX AI A2XW audio analysis
(+) | speakers can play relatively loud (84.5 dB)
Bass 100 - 315 Hz
(±) | reduced bass - on average 14.8% lower than median
(±) | linearity of bass is average (14.7% delta to prev. frequency)
Mids 400 - 2000 Hz
(±) | higher mids - on average 11.9% higher than median
(±) | linearity of mids is average (10% delta to prev. frequency)
Highs 2 - 16 kHz
(+) | balanced highs - only 3% away from median
(+) | highs are linear (4.9% delta to prev. frequency)
Overall 100 - 16.000 Hz
(±) | linearity of overall sound is average (22.3% difference to median)
Compared to same class
» 80% of all tested devices in this class were better, 6% similar, 14% worse
» The best had a delta of 6%, average was 18%, worst was 132%
Compared to all devices tested
» 65% of all tested devices were better, 6% similar, 29% worse
» The best had a delta of 4%, average was 23%, worst was 136%
Asus TUF Gaming A18 FA808UP-S8022W audio analysis
(±) | speaker loudness is average but good (74.53 dB)
Bass 100 - 315 Hz
(±) | reduced bass - on average 12.9% lower than median
(±) | linearity of bass is average (7.5% delta to prev. frequency)
Mids 400 - 2000 Hz
(±) | higher mids - on average 5.1% higher than median
(+) | mids are linear (5.9% delta to prev. frequency)
Highs 2 - 16 kHz
(+) | balanced highs - only 4.1% away from median
(+) | highs are linear (6.9% delta to prev. frequency)
Overall 100 - 16.000 Hz
(±) | linearity of overall sound is average (16.9% difference to median)
Compared to same class
» 45% of all tested devices in this class were better, 11% similar, 44% worse
» The best had a delta of 6%, average was 18%, worst was 132%
Compared to all devices tested
» 31% of all tested devices were better, 8% similar, 62% worse
» The best had a delta of 4%, average was 23%, worst was 136%
Power consumption and battery life
The 18-inch laptop is surprisingly frugal at idle, averaging around 9 W. Thanks in part to the generous 90 Wh battery, the Asus laptop delivers impressively long runtimes away from a power outlet. In our Wi-Fi test, with the display brightness reduced to 150 cd/m², it achieved an excellent battery life of 13 hours.
| Off / Standby | 0.1 / 0.8 Watt |
| Idle | 6 / 8.8 / 11 Watt |
| Load |
75 / 195 Watt |
   
| |
Key:
min: ,
med: ,
max: Metrahit Energy | |
| Asus TUF Gaming A18 FA808UM R7 260, GeForce RTX 5060 Laptop | MSI Cyborg 17 B13WFKG i7-13620H, GeForce RTX 5060 Laptop | Acer Nitro 18 AI AN18-61-R10V Ryzen AI 7 350, GeForce RTX 5070 Laptop | Asus ROG Strix G18 2025 G814 R9 9955HX, GeForce RTX 5070 Laptop | MSI Crosshair 18 HX AI A2XW Ultra 9 275HX, GeForce RTX 5070 Laptop | Asus TUF Gaming A18 FA808UP-S8022W R7 260, GeForce RTX 5070 Laptop | Average of class Gaming | |
|---|---|---|---|---|---|---|---|
| Power Consumption | -16% | -17% | -82% | -84% | -19% | -87% | |
| Idle Minimum * (Watt) | 6 | 7.9 -32% | 5.9 2% | 13.1 -118% | 8.8 -47% | 6.7 -12% | 12.8 ? -113% |
| Idle Average * (Watt) | 8.8 | 12.7 -44% | 9.6 -9% | 20.6 -134% | 14.1 -60% | 11.6 -32% | 18.5 ? -110% |
| Idle Maximum * (Watt) | 11 | 18.1 -65% | 17 -55% | 21.1 -92% | 35.4 -222% | 17.7 -61% | 24.7 ? -125% |
| Load Average * (Watt) | 75 | 90 -20% | 89 -19% | 123.4 -65% | 106.2 -42% | 85 -13% | 113 ? -51% |
| Cyberpunk 2077 ultra * (Watt) | 141 | 109.7 22% | 160.4 -14% | 215 -52% | 233 -65% | 144 -2% | |
| Load Maximum * (Watt) | 195 | 115 41% | 210 -8% | 249.7 -28% | 322.3 -65% | 187 4% | 262 ? -34% |
| Cyberpunk 2077 ultra external monitor * (Watt) | 108.4 | 154.6 | 179.2 | 225 | 139 |
* ... smaller is better
| Asus TUF Gaming A18 FA808UM R7 260, GeForce RTX 5060 Laptop, 90 Wh | MSI Cyborg 17 B13WFKG i7-13620H, GeForce RTX 5060 Laptop, 55.2 Wh | Acer Nitro 18 AI AN18-61-R10V Ryzen AI 7 350, GeForce RTX 5070 Laptop, 90 Wh | Asus ROG Strix G18 2025 G814 R9 9955HX, GeForce RTX 5070 Laptop, 90 Wh | MSI Crosshair 18 HX AI A2XW Ultra 9 275HX, GeForce RTX 5070 Laptop, 90 Wh | Asus TUF Gaming A18 FA808UP-S8022W R7 260, GeForce RTX 5070 Laptop, 90 Wh | Average of class Gaming | |
|---|---|---|---|---|---|---|---|
| Battery runtime | |||||||
| WiFi v1.3 (h) | 13.2 | 3.8 -71% | 11.1 -16% | 7.1 -46% | 10.9 -17% | 11.9 -10% | 7.22 ? -45% |
Notebookcheck overall rating
Anyone seeking a powerful but reasonably priced XXL laptop should find plenty to like about the TUF Gaming A18. Asus makes very few mistakes and earns a good overall rating.
Asus TUF Gaming A18 FA808UM
- 07/10/2026 v8
Florian Glaser
 Total Sustainability Score:
 Alternatives at a glance
Image | Model / Review | Price | Weight | Height | Display |
|---|---|---|---|---|---|
1. 82.4%  | Asus TUF Gaming A18 FA808UM AMD Ryzen 7 260 ⎘ NVIDIA GeForce RTX 5060 Laptop ⎘ 16 GB Memory, 1024 GB SSD | List Price: 1300 EUR | 2.7 kg | 26.7 mm | 18.00" 1920x1200 126 PPI IPS |
2. 76.3%  | MSI Cyborg 17 B13WFKG Intel Core i7-13620H ⎘ NVIDIA GeForce RTX 5060 Laptop ⎘ 16 GB Memory, 512 GB SSD | List Price: 1200 EUR | 2.6 kg | 22.2 mm | 17.30" 1920x1080 127 PPI IPS |
3. 81.2%  | Acer Nitro 18 AI AN18-61-R10V AMD Ryzen AI 7 350 ⎘ NVIDIA GeForce RTX 5070 Laptop ⎘ 16 GB Memory, 1000 GB SSD | List Price: 1900 EUR | 3 kg | 25 mm | 18.00" 2560x1600 168 PPI IPS |
4. 86.4%  | Asus ROG Strix G18 2025 G814 AMD Ryzen 9 9955HX ⎘ NVIDIA GeForce RTX 5070 Laptop ⎘ 32 GB Memory, 1024 GB SSD | List Price: 2299€ | 2.9 kg | 30.8 mm | 18.00" 2560x1600 168 PPI IPS |
5. 81.7%  | MSI Crosshair 18 HX AI A2XW Intel Core Ultra 9 275HX ⎘ NVIDIA GeForce RTX 5070 Laptop ⎘ 32 GB Memory, 1024 GB SSD | Amazon: 1. $2,799.00 msi Crosshair 18 HX AI Gamin... 2. $1,799.00 msi Crosshair 18 HX AI 18" 2... 3. $1,699.00 msi Crosshair 18 HX AI 18" 2... List Price: 1700 USD | 3.1 kg | 29.9 mm | 18.00" 2560x1600 168 PPI IPS |
6. 83.8%  | Asus TUF Gaming A18 FA808UP-S8022W AMD Ryzen 7 260 ⎘ NVIDIA GeForce RTX 5070 Laptop ⎘ 32 GB Memory, 1024 GB SSD | List Price: 2199 Euro | 2.6 kg | 26.7 mm | 18.00" 1920x1200 126 PPI IPS |
Transparency
The selection of devices to be reviewed is made by our editorial team. The test sample was provided to the author as a loan by the manufacturer or retailer for the purpose of this review. The lender had no influence on this review, nor did the manufacturer receive a copy of this review before publication. There was no obligation to publish this review. As an independent media company, Notebookcheck is not subjected to the authority of manufacturers, retailers or publishers.
This is how Notebookcheck is testing
Every year, Notebookcheck independently reviews hundreds of laptops and smartphones using standardized procedures to ensure that all results are comparable. We have continuously developed our test methods for around 20 years and set industry standards in the process. In our test labs, high-quality measuring equipment is utilized by experienced technicians and editors. These tests involve a multi-stage validation process. Our complex rating system is based on hundreds of well-founded measurements and benchmarks, which maintains objectivity. Further information on our test methods can be found here.
 Add as a preferred source on Google


