Qualcomm Adreno 510 vs NVIDIA GeForce GTX 1070 Ti (Desktop) vs NVIDIA GeForce GTX 1050 Ti Max-Q
Qualcomm Adreno 510 ► remove from comparison
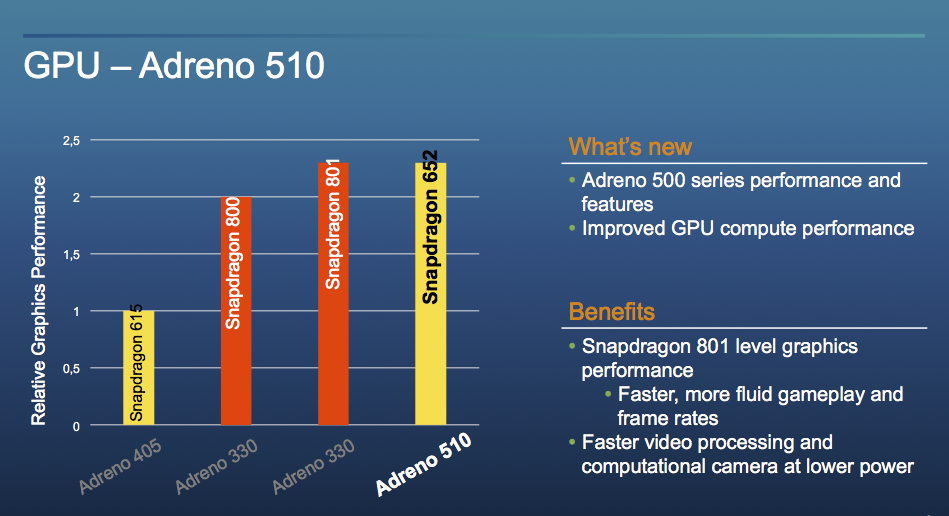
The Qualcomm Adreno 510 is a mobile graphics card for mid-range smartphones and tablets (mostly Android based). It is included in the Qualcomm Snapdragon 650 and 652 SoCs and based on the Adreno 500 architecture (like the Adreno 520 in the S820, which should be fully compatible in software).
The GPU supports modern standards like Vulkan 1.0 (according to Wikipedia), OpenGL ES 3.1 + AE (3.2 in other sources), OpenCL 2.0 and DirectX 12 (FL 12.1 according to Wikipedia, 11.1 according to Qualcomm). Furthermore, the GPU supports Universal Bandwidth Compression (UBWC) to save memory bandwidth.
Compared the the faster Adreno 530, the 510 is currently produced in the older 28nm process (650 and 652) and should offer less ALUs. The clock speed is not disclosed.
Early benchmarks and performance ratings from Qualcomm position the GPU on a level with the old Adreno 330 (former high end GPU) in the Snapdragon 810. Therefore, it should be able to handle most Android games up to Full HD fluently.
NVIDIA GeForce GTX 1070 Ti (Desktop) ► remove from comparison
The Nvidia GeForce GTX 1070 Ti is the second fastest Pascal based graphics card in November 2017. It is a high-end desktop graphics card based on a cut down GP104 chip as the GTX 1080 and manufactured in 16 nm FinFET at TSMC. Compared to the GTX 1080, it uses the more available GDDR5 graphics memory, and compared to the GTX 1070 it offers more shaders (2432 versus 1920). More details on the Pascal architecture including all features and comparisons to Maxwell, can be found here .
The performance of the GTX 1070 Ti was in our tests right between the GTX 1070 and GTX 1080. However, the powerefficiency was worse than the GTX 1070 and near the GTX 1080. Nvidia also specifies the 1070 Ti and 1080 at 180W.
NVIDIA GeForce GTX 1050 Ti Max-Q ► remove from comparison
The Nvidia GTX 1050 Ti with Max-Q design is a power efficient mainstream GPU for laptops based on the Pascal architecture and was announced in January 2017. Contrary to the faster models, the GTX 1050 uses the GP107 chip, which is manufactured in a 14 nm process at Samsung.
The clock is not the only difference compared to the regular GTX 1050 Ti though. The drivers for the Max-Q version were optimized for efficiency (and not performance; only for Max-Q models), there are optimized voltage converters for 1V operation, high-end cooling methods, and a 40 dB limit for the fan noise (with clock adjustments to ensure this at all times).
Features
The GP107 chip is manufactured in a 14 nm FinFET process at Samsung and offers a number of new features, including support for DisplayPort 1.4 (ready), HDMI 2.0b, HDR, Simultaneous Multi-Projection (SMP) as well as improved H.265 video de- and encoding (PlayReady 3.0). A full list of improvements and the new Pascal desktop GPUs is available in our dedicated Pascal architecture article .
Performance
The performance of the GeForce GTX 1050 Ti can vary quite a lot depending on the cooling performance of the laptop. Nvidia states that the Max-Q variant should be about 10 to 15% slower than a regular GTX 1050 Ti for laptops. Therefore, the GPU is most suited for Full HD and high quality settings for games of 2016.
Power Consumption
The power consumption of the GeForce GTX 1050 Ti with Max-Q design is rated at 40 to 46 Watt and therefore a lot lower than a regular GTX 1050 Ti for laptops (53 Watt). This means that the Max-Q GTX 1050 Ti is also suited for thin and light laptops.
Qualcomm Adreno 510 NVIDIA GeForce GTX 1070 Ti (Desktop) NVIDIA GeForce GTX 1050 Ti Max-Q GeForce GTX 1000 Series Architecture Adreno 500 Pascal Pascal Shared Memory yes no no API DirectX 12.1, OpenGL ES 3.2, Vulkan DirectX 12_1, OpenGL 4.5 DirectX 12_1, OpenGL 4.5 technology 14 nm 16 nm 16 nm Features OpenGL ES 3.2, OpenCL 2.0, Direct3D 12 (FL 12_1) Multi-Projection, VR Ready, G-SYNC, Vulkan, Multi Monitor Multi-Projection, VR Ready, G-SYNC, Vulkan, Multi Monitor Date of Announcement 15.12.2015 02.11.2017 03.01.2018 Codename Pascal GP104 N17P-G1 Max-Q Pipelines 2432 - unified 768 - unified Core Speed 1607 - 1683 (Boost) MHz 1151 – 1290 - 1290 – 1417 (Boost) MHz Memory Speed 8000 MHz 7000 MHz Memory Bus Width 256 Bit 128 Bit Memory Type GDDR5 GDDR5 Max. Amount of Memory 8 GB 4 GB Power Consumption 180 Watt 40 - 46 Watt Transistors 7.2 Billion Link to Manufacturer Page www.nvidia.at www.nvidia.com Notebook Size medium sized
Benchmarks Performance Rating - 3DMark 11 + Fire Strike + Time Spy - GeForce GTX 1050 Ti Max-Q
3.3 pt (10%)
NVIDIA GeForce GTX 1050 Ti Max-Q
...
max:
3DMark - 3DMark Time Spy Score
6177 Points (18%)
min: 2361 avg: 2453 median: 2485 (7%) max: 2513 Points
3DMark - 3DMark Time Spy Graphics
6531 Points (17%)
min: 2196 avg: 2245 median: 2261 (6%) max: 2278 Points
3DMark - 3DMark Ice Storm Unlimited Graphics
min: 21087 avg: 21766 median: 21533 (2%) max: 23175 Points
442105 Points (50%)
324705 Points (37%)
3DMark - 3DMark Ice Storm Extreme Graphics
39641 Points (5%)
3DMark - 3DMark Cloud Gate Score
29364 Points (31%)
min: 20755 avg: 24100 median: 24021 (26%) max: 28253 Points
3DMark - 3DMark Cloud Gate Graphics
88161 Points (23%)
min: 41871 avg: 46017 median: 46952 (12%) max: 50801 Points
3DMark - 3DMark Fire Strike Standard Score
15061 Points (27%)
min: 6175 avg: 6548 median: 6688 (12%) max: 6753 Points
3DMark - 3DMark Fire Strike Standard Graphics
18405 Points (21%)
min: 6957 avg: 7281 median: 7324 (8%) max: 7428 Points
3DMark - 3DMark Ice Storm Graphics
min: 41029 avg: 73224 median: 60442 (7%) max: 118202 Points
3DMark - 3DMark Sling Shot (ES 3.0) Unlimited
min: 1381 avg: 1454 median: 1441.5 (6%) max: 1579 Points
3DMark - 3DMark Sling Shot (ES 3.0) Unlimited Graphics
min: 1354 avg: 1395 median: 1389.5 (3%) max: 1459 Points
3DMark - 3DMark Sling Shot Extreme (ES 3.1) Unlimited
971 Points (5%)
3DMark - 3DMark Sling Shot Extreme (ES 3.1) Unlimited Graphics
867 Points (3%)
3DMark 11 - 3DM11 Performance Score
20106 Points (28%)
min: 8250 avg: 8936 median: 9106 (13%) max: 9414 Points
3DMark 11 - 3DM11 Performance GPU
27503 Points (24%)
min: 8317 avg: 8781 median: 8752 (8%) max: 9079 Points
3DMark Vantage + NVIDIA GeForce GTX 1050 Ti Max-Q 3DMark Vantage - 3DM Vant. Perf. total
min: 24827 avg: 29504 median: 29503.5 (9%) max: 34180 Points
3DM Vant. Perf. GPU no PhysX + NVIDIA GeForce GTX 1050 Ti Max-Q 3DMark Vantage - 3DM Vant. Perf. GPU no PhysX
min: 25707 avg: 29448 median: 29448 (17%) max: 33189 Points
3DMark 06 3DMark 06 - Standard 1280x1024 + NVIDIA GeForce GTX 1070 Ti (Desktop)
36475 Points (48%)
3DMark 06 - Standard 1280x1024 + NVIDIA GeForce GTX 1050 Ti Max-Q
min: 26796 avg: 28797 median: 28797 (38%) max: 30798 Points
3DMark 06 - Standard 1024x768 + NVIDIA GeForce GTX 1050 Ti Max-Q
34786 Points (45%)
Unigine Valley 1.0 - Unigine Valley 1.0 DX
40.1 fps (13%)
Unigine Heaven 2.1 - Heaven 2.1 high
86 fps (16%)
Cinebench R10 Cinebench R10 Shading (32bit) + NVIDIA GeForce GTX 1050 Ti Max-Q Cinebench R10 - Cinebench R10 Shading (32bit)
min: 4597 avg: 5340 median: 4972 (4%) max: 6451 Points
Cinebench R11.5 Cinebench R11.5 OpenGL 64 Bit + NVIDIA GeForce GTX 1050 Ti Max-Q Cinebench R11.5 - Cinebench R11.5 OpenGL 64 Bit
min: 66.9 avg: 71.7 median: 71.7 (25%) max: 76.5 fps
Cinebench R15 + NVIDIA GeForce GTX 1050 Ti Max-Q Cinebench R15 - Cinebench R15 OpenGL 64 Bit
min: 92.1 avg: 105.4 median: 102 (6%) max: 120.7 fps
Cinebench R15 OpenGL Ref. Match 64 Bit + NVIDIA GeForce GTX 1050 Ti Max-Q Cinebench R15 - Cinebench R15 OpenGL Ref. Match 64 Bit
99.6 % (100%)
GFXBench - GFXBench 5.0 Aztec Ruins High Tier Offscreen
49.5 fps (9%)
GFXBench - GFXBench 5.0 Aztec Ruins Normal Tier Offscreen
119.1 fps (9%)
GFXBench - GFXBench Car Chase Offscreen
min: 3.2 avg: 5.2 median: 5.4 (1%) max: 6 fps
min: 108.8 avg: 124.2 median: 124.2 (14%) max: 139.5 fps
GFXBench 3.1 - GFXBench Manhattan ES 3.1 Offscreen
min: 4.6 avg: 8.9 median: 9.5 (0%) max: 10 fps
min: 168 avg: 184.9 median: 184.9 (4%) max: 201.7 fps
GFXBench 3.0 - GFXBench 3.0 Manhattan Offscreen
min: 9.2 avg: 14.2 median: 14.5 (1%) max: 17 fps
min: 229.8 avg: 253.2 median: 253.2 (15%) max: 276.5 fps
GFXBench (DX / GLBenchmark) 2.7 + Qualcomm Adreno 510 GFXBench (DX / GLBenchmark) 2.7 - GFXBench T-Rex HD Offscreen C24Z16
min: 22 avg: 30.8 median: 31 (0%) max: 36 fps
GFXBench T-Rex HD Offscreen C24Z16 + NVIDIA GeForce GTX 1050 Ti Max-Q
min: 501 avg: 531 median: 531 (4%) max: 561 fps
Basemark ES 2.0 - Basemark ES 2.0
44.8 fps (74%)
Basemark X 1.1 - Basemark X 1.1 High Quality
15120 Points (34%)
Basemark X 1.1 - Basemark X 1.1 Medium Quality
26078 Points (58%)
LuxMark v2.0 64Bit - LuxMark v2.0 Room GPU
2542 Samples/s (11%)
min: 1167 avg: 1201 median: 1200.5 (5%) max: 1234 Samples/s
LuxMark v2.0 64Bit - LuxMark v2.0 Sala GPU
5159 Samples/s (9%)
min: 2100 avg: 2222 median: 2221.5 (4%) max: 2343 Samples/s
ComputeMark v2.1 - ComputeMark v2.1 Result
15488 Points (17%)
min: 4515 avg: 4879 median: 4879 (5%) max: 5243 Points
PassMark PerformanceTest Mobile V1 - PerformanceTest Mobile V1 2D Graphics Tests
6078 Points (6%)
PassMark PerformanceTest Mobile V1 - PerformanceTest Mobile V1 3D Graphics Tests
2559 Points (4%)
Smartbench 2012 - Smartbench 2012 Gaming Index
4270 Points (93%)
Power Consumption - Furmark Stress Test Power Consumption - external Monitor *
291 Watt (41%)
73.1 Watt (10%)
Power Consumption - The Witcher 3 Power Consumption - external Monitor *
290 Watt (41%)
75.8 Watt (11%)
Power Consumption - Witcher 3 Power Consumption *
min: 82 avg: 90 median: 85 (19%) max: 103 Watt
Power Consumption - Witcher 3 ultra Power Efficiency
min: 0.2379 avg: 0.3 median: 0.3 (29%) max: 0.3073 fps per Watt
Power Consumption - Witcher 3 ultra Power Efficiency - external Monitor
0.2 fps per Watt (21%)
0.3 fps per Watt (27%)
Emissions Witcher 3 Fan Noise + NVIDIA GeForce GTX 1050 Ti Max-Q Emissions - Witcher 3 Fan Noise
min: 36.4 avg: 40.2 median: 38.4 (61%) max: 47.6 dB(A)
Clock Speed - GPU Clock Witcher 3 ultra
1810 MHz (71%)
1392 MHz (55%)
Clock Speed - GPU Clock Speed Furmark
1677 MHz (66%)
Average Benchmarks Qualcomm Adreno 510 → 100% n=1 Average Benchmarks NVIDIA GeForce GTX 1070 Ti (Desktop) → 2053% n=1 Average Benchmarks NVIDIA GeForce GTX 1050 Ti Max-Q → 1508% n=1
- Range of benchmark values for this graphics card
- Average benchmark values for this graphics card
* Smaller numbers mean a higher performance
1 This benchmark is not used for the average calculation
Game Benchmarks The following benchmarks stem from our benchmarks of review laptops. The performance depends on the used graphics memory, clock rate, processor, system settings, drivers, and operating systems. So the results don't have to be representative for all laptops with this GPU. For detailed information on the benchmark results, click on the fps number.
GeForce GTX 1070 Ti (Desktop):
200 [X] i7-7740X Asus X299 Prime Intel Core i7-7740X 4.3GHz
GeForce GTX 1070 Ti (Desktop)
min:
173 fps, max:
219 fps
fps
GeForce GTX 1070 Ti (Desktop):
78 [X] i7-7740X Asus X299 Prime Intel Core i7-7740X 4.3GHz
GeForce GTX 1070 Ti (Desktop)
min:
68 fps, max:
88 fps
fps
GeForce GTX 1070 Ti (Desktop):
58.5 [X] i7-7740X Asus X299 Prime Intel Core i7-7740X 4.3GHz
GeForce GTX 1070 Ti (Desktop)
min:
50 fps, max:
67 fps
fps
GeForce GTX 1070 Ti (Desktop):
37.1 [X] i7-7740X Asus X299 Prime Intel Core i7-7740X 4.3GHz
GeForce GTX 1070 Ti (Desktop)
min:
31 fps, max:
43 fps
fps
GeForce GTX 1070 Ti (Desktop):
17.9 [X] i7-7740X Asus X299 Prime Intel Core i7-7740X 4.3GHz
GeForce GTX 1070 Ti (Desktop)
min:
15 fps, max:
21 fps
fps
GeForce GTX 1070 Ti (Desktop):
244 [X] i7-7740X Asus X299 Prime Intel Core i7-7740X 4.3GHz
GeForce GTX 1070 Ti (Desktop)
min:
195 fps, max:
269 fps
fps
GeForce GTX 1070 Ti (Desktop):
183 [X] i7-7740X Asus X299 Prime Intel Core i7-7740X 4.3GHz
GeForce GTX 1070 Ti (Desktop)
min:
155 fps, max:
196 fps
fps
GeForce GTX 1070 Ti (Desktop):
164 [X] i7-7740X Asus X299 Prime Intel Core i7-7740X 4.3GHz
GeForce GTX 1070 Ti (Desktop)
min:
145 fps, max:
176 fps
fps
GeForce GTX 1070 Ti (Desktop):
120 [X] i7-7740X Asus X299 Prime Intel Core i7-7740X 4.3GHz
GeForce GTX 1070 Ti (Desktop)
min:
112 fps, max:
129 fps
fps
GeForce GTX 1070 Ti (Desktop):
94 [X] i7-7740X Asus X299 Prime Intel Core i7-7740X 4.3GHz
GeForce GTX 1070 Ti (Desktop)
min:
86 fps, max:
98 fps
fps
GeForce GTX 1070 Ti (Desktop):
57 [X] i7-7740X Asus X299 Prime Intel Core i7-7740X 4.3GHz
GeForce GTX 1070 Ti (Desktop)
min:
52 fps, max:
60 fps
fps
GeForce GTX 1070 Ti (Desktop):
271 [X] i7-7740X Asus X299 Prime Intel Core i7-7740X 4.3GHz
GeForce GTX 1070 Ti (Desktop)
min:
209 fps, max:
313 fps
fps
GeForce GTX 1070 Ti (Desktop):
249 [X] i7-7740X Asus X299 Prime Intel Core i7-7740X 4.3GHz
GeForce GTX 1070 Ti (Desktop)
min:
201 fps, max:
284 fps
fps
GeForce GTX 1070 Ti (Desktop):
241 [X] i7-7740X Asus X299 Prime Intel Core i7-7740X 4.3GHz
GeForce GTX 1070 Ti (Desktop)
min:
189 fps, max:
269 fps
fps
GeForce GTX 1070 Ti (Desktop):
219 [X] i7-7740X Asus X299 Prime Intel Core i7-7740X 4.3GHz
GeForce GTX 1070 Ti (Desktop)
min:
159 fps, max:
243 fps
fps
GeForce GTX 1070 Ti (Desktop):
222 [X] i7-7740X Asus X299 Prime Intel Core i7-7740X 4.3GHz
GeForce GTX 1070 Ti (Desktop)
min:
176 fps, max:
250 fps
fps
GeForce GTX 1070 Ti (Desktop):
221 [X] i7-7740X Asus X299 Prime Intel Core i7-7740X 4.3GHz
GeForce GTX 1070 Ti (Desktop)
min:
161 fps, max:
247 fps
fps
GeForce GTX 1070 Ti (Desktop):
86.6 [X] i7-7740X Asus X299 Prime Intel Core i7-7740X 4.3GHz
GeForce GTX 1070 Ti (Desktop)
min:
71 fps, max:
102 fps
fps
GeForce GTX 1070 Ti (Desktop):
63.4 [X] i7-7740X Asus X299 Prime Intel Core i7-7740X 4.3GHz
GeForce GTX 1070 Ti (Desktop)
min:
56 fps, max:
76 fps
fps
GeForce GTX 1070 Ti (Desktop):
41.2 [X] i7-7740X Asus X299 Prime Intel Core i7-7740X 4.3GHz
GeForce GTX 1070 Ti (Desktop)
min:
36 fps, max:
47 fps
fps
GeForce GTX 1070 Ti (Desktop):
20.3 [X] i7-7740X Asus X299 Prime Intel Core i7-7740X 4.3GHz
GeForce GTX 1070 Ti (Desktop)
min:
17 fps, max:
22 fps
fps
GeForce GTX 1070 Ti (Desktop):
46 [X] i7-7740X Asus X299 Prime Intel Core i7-7740X 4.3GHz
GeForce GTX 1070 Ti (Desktop)
min:
39 fps, max:
54 fps
fps
GeForce GTX 1070 Ti (Desktop):
40.4 [X] i7-7740X Asus X299 Prime Intel Core i7-7740X 4.3GHz
GeForce GTX 1070 Ti (Desktop)
min:
34 fps, max:
44 fps
fps
GeForce GTX 1070 Ti (Desktop):
24.1 [X] i7-7740X Asus X299 Prime Intel Core i7-7740X 4.3GHz
GeForce GTX 1070 Ti (Desktop)
min:
22 fps, max:
26 fps
fps
GeForce GTX 1050 Ti Max-Q:
133.2 fps
GeForce GTX 1050 Ti Max-Q:
56.7 fps
GeForce GTX 1050 Ti Max-Q:
44.3 fps
GeForce GTX 1050 Ti Max-Q:
27.2 fps
GeForce GTX 1050 Ti Max-Q:
11.3 fps
GeForce GTX 1050 Ti Max-Q:
67.1 fps
GeForce GTX 1050 Ti Max-Q:
40.5 fps
GeForce GTX 1050 Ti Max-Q:
34 fps
GeForce GTX 1050 Ti Max-Q:
30.4 fps
GeForce GTX 1050 Ti Max-Q:
9 fps
GeForce GTX 1070 Ti (Desktop):
121 [X] i7-7740X Asus X299 Prime Intel Core i7-7740X 4.3GHz
GeForce GTX 1070 Ti (Desktop)
min:
93 fps, max:
174 fps
fps
GeForce GTX 1050 Ti Max-Q:
83 89 [X] MSI GF75 8RD-001 Intel Core i7-8750H 2.2GHz
GeForce GTX 1050 Ti Max-Q
min:
61 fps, max:
89 fps
~ 86 fps
GeForce GTX 1070 Ti (Desktop):
107 [X] i7-7740X Asus X299 Prime Intel Core i7-7740X 4.3GHz
GeForce GTX 1070 Ti (Desktop)
min:
83 fps, max:
140 fps
fps
GeForce GTX 1050 Ti Max-Q:
47 50 [X] MSI GF75 8RD-001 Intel Core i7-8750H 2.2GHz
GeForce GTX 1050 Ti Max-Q
min:
40 fps, max:
60 fps
~ 49 fps
GeForce GTX 1070 Ti (Desktop):
103 [X] i7-7740X Asus X299 Prime Intel Core i7-7740X 4.3GHz
GeForce GTX 1070 Ti (Desktop)
min:
84 fps, max:
132 fps
fps
GeForce GTX 1050 Ti Max-Q:
43 46 [X] MSI GF75 8RD-001 Intel Core i7-8750H 2.2GHz
GeForce GTX 1050 Ti Max-Q
min:
38 fps, max:
56 fps
~ 45 fps
GeForce GTX 1070 Ti (Desktop):
93 [X] i7-7740X Asus X299 Prime Intel Core i7-7740X 4.3GHz
GeForce GTX 1070 Ti (Desktop)
min:
72 fps, max:
127 fps
fps
GeForce GTX 1050 Ti Max-Q:
40 43 [X] MSI GF75 8RD-001 Intel Core i7-8750H 2.2GHz
GeForce GTX 1050 Ti Max-Q
min:
33 fps, max:
53 fps
~ 42 fps
GeForce GTX 1070 Ti (Desktop):
76 [X] i7-7740X Asus X299 Prime Intel Core i7-7740X 4.3GHz
GeForce GTX 1070 Ti (Desktop)
min:
60 fps, max:
95 fps
fps
GeForce GTX 1050 Ti Max-Q:
29 [X] MSI GF75 8RD-001 Intel Core i7-8750H 2.2GHz
GeForce GTX 1050 Ti Max-Q
min:
24 fps, max:
37 fps
fps
GeForce GTX 1070 Ti (Desktop):
42 [X] i7-7740X Asus X299 Prime Intel Core i7-7740X 4.3GHz
GeForce GTX 1070 Ti (Desktop)
min:
34 fps, max:
51 fps
fps
GeForce GTX 1050 Ti Max-Q:
14 15 [X] MSI GF75 8RD-001 Intel Core i7-8750H 2.2GHz
GeForce GTX 1050 Ti Max-Q
min:
11 fps, max:
19 fps
~ 15 fps
GeForce GTX 1070 Ti (Desktop):
147 [X] i7-7740X Asus X299 Prime Intel Core i7-7740X 4.3GHz
GeForce GTX 1070 Ti (Desktop)
min:
77.86 fps, max:
237.53 fps
fps
GeForce GTX 1050 Ti Max-Q:
55.5 60.4 [X] MSI GF75 8RD-001 Intel Core i7-8750H 2.2GHz
GeForce GTX 1050 Ti Max-Q
min:
31.8 fps, max:
115.6 fps
~ 58 fps
GeForce GTX 1070 Ti (Desktop):
83 [X] i7-7740X Asus X299 Prime Intel Core i7-7740X 4.3GHz
GeForce GTX 1070 Ti (Desktop)
min:
40.8 fps, max:
146.74 fps
fps
GeForce GTX 1050 Ti Max-Q:
31.4 [X] MSI GF75 8RD-001 Intel Core i7-8750H 2.2GHz
GeForce GTX 1050 Ti Max-Q
min:
15.8 fps, max:
53.7 fps
49.8 ~ 41 fps
GeForce GTX 1070 Ti (Desktop):
63 [X] i7-7740X Asus X299 Prime Intel Core i7-7740X 4.3GHz
GeForce GTX 1070 Ti (Desktop)
min:
32.59 fps, max:
112.4 fps
fps
GeForce GTX 1050 Ti Max-Q:
23.5 [X] MSI GF75 8RD-001 Intel Core i7-8750H 2.2GHz
GeForce GTX 1050 Ti Max-Q
min:
12.1 fps, max:
39.8 fps
36.5 ~ 30 fps
GeForce GTX 1070 Ti (Desktop):
52.3 [X] i7-7740X Asus X299 Prime Intel Core i7-7740X 4.3GHz
GeForce GTX 1070 Ti (Desktop)
min:
28.83 fps, max:
88.2 fps
fps
GeForce GTX 1050 Ti Max-Q:
19.3 [X] MSI GF75 8RD-001 Intel Core i7-8750H 2.2GHz
GeForce GTX 1050 Ti Max-Q
min:
10.4 fps, max:
19.3 fps
28.3 ~ 24 fps
GeForce GTX 1070 Ti (Desktop):
40.2 [X] i7-7740X Asus X299 Prime Intel Core i7-7740X 4.3GHz
GeForce GTX 1070 Ti (Desktop)
min:
24.15 fps, max:
62.69 fps
fps
GeForce GTX 1070 Ti (Desktop):
24.6 [X] i7-7740X Asus X299 Prime Intel Core i7-7740X 4.3GHz
GeForce GTX 1070 Ti (Desktop)
min:
16.12 fps, max:
36.5 fps
fps
GeForce GTX 1050 Ti Max-Q:
4.7 fps
GeForce GTX 1070 Ti (Desktop):
144 [X] i7-7740X Asus X299 Prime Intel Core i7-7740X 4.3GHz
GeForce GTX 1070 Ti (Desktop)
min:
143 fps, max:
145 fps
fps
GeForce GTX 1070 Ti (Desktop):
138 [X] i7-7740X Asus X299 Prime Intel Core i7-7740X 4.3GHz
GeForce GTX 1070 Ti (Desktop)
min:
128 fps, max:
145 fps
fps
GeForce GTX 1070 Ti (Desktop):
123 [X] i7-7740X Asus X299 Prime Intel Core i7-7740X 4.3GHz
GeForce GTX 1070 Ti (Desktop)
min:
110 fps, max:
145 fps
fps
GeForce GTX 1070 Ti (Desktop):
121 [X] i7-7740X Asus X299 Prime Intel Core i7-7740X 4.3GHz
GeForce GTX 1070 Ti (Desktop)
min:
109 fps, max:
145 fps
fps
GeForce GTX 1070 Ti (Desktop):
81 [X] i7-7740X Asus X299 Prime Intel Core i7-7740X 4.3GHz
GeForce GTX 1070 Ti (Desktop)
min:
63 fps, max:
100 fps
fps
GeForce GTX 1070 Ti (Desktop):
42.4 [X] i7-7740X Asus X299 Prime Intel Core i7-7740X 4.3GHz
GeForce GTX 1070 Ti (Desktop)
min:
37 fps, max:
52 fps
fps
GeForce GTX 1050 Ti Max-Q:
73.2 fps
GeForce GTX 1050 Ti Max-Q:
47.9 fps
GeForce GTX 1050 Ti Max-Q:
36.1 fps
GeForce GTX 1070 Ti (Desktop):
88 [X] i7-7740X Asus X299 Prime Intel Core i7-7740X 4.3GHz
GeForce GTX 1070 Ti (Desktop)
min:
82 fps, max:
94 fps
fps
GeForce GTX 1050 Ti Max-Q:
35.3 fps
GeForce GTX 1070 Ti (Desktop):
64 [X] i7-7740X Asus X299 Prime Intel Core i7-7740X 4.3GHz
GeForce GTX 1070 Ti (Desktop)
min:
58 fps, max:
68 fps
fps
GeForce GTX 1070 Ti (Desktop):
35.3 [X] i7-7740X Asus X299 Prime Intel Core i7-7740X 4.3GHz
GeForce GTX 1070 Ti (Desktop)
min:
32 fps, max:
38 fps
fps
GeForce GTX 1050 Ti Max-Q:
12.9 fps
GeForce GTX 1050 Ti Max-Q:
134.5 fps
GeForce GTX 1050 Ti Max-Q:
87.4 fps
GeForce GTX 1050 Ti Max-Q:
73.7 fps
GeForce GTX 1070 Ti (Desktop):
110 [X] i7-7740X Asus X299 Prime Intel Core i7-7740X 4.3GHz
GeForce GTX 1070 Ti (Desktop)
min:
84 fps, max:
125 fps
fps
GeForce GTX 1050 Ti Max-Q:
65 fps
GeForce GTX 1070 Ti (Desktop):
74 [X] i7-7740X Asus X299 Prime Intel Core i7-7740X 4.3GHz
GeForce GTX 1070 Ti (Desktop)
min:
62 fps, max:
84 fps
fps
GeForce GTX 1070 Ti (Desktop):
35.4 [X] i7-7740X Asus X299 Prime Intel Core i7-7740X 4.3GHz
GeForce GTX 1070 Ti (Desktop)
min:
27 fps, max:
41 fps
fps
GeForce GTX 1050 Ti Max-Q:
13.2 fps
GeForce GTX 1050 Ti Max-Q:
100.1 fps
GeForce GTX 1050 Ti Max-Q:
57.3 fps
GeForce GTX 1050 Ti Max-Q:
47.9 fps
GeForce GTX 1070 Ti (Desktop):
111 [X] i7-7740X Asus X299 Prime Intel Core i7-7740X 4.3GHz
GeForce GTX 1070 Ti (Desktop)
min:
90 fps, max:
162 fps
fps
GeForce GTX 1050 Ti Max-Q:
44.8 fps
GeForce GTX 1070 Ti (Desktop):
83 [X] i7-7740X Asus X299 Prime Intel Core i7-7740X 4.3GHz
GeForce GTX 1070 Ti (Desktop)
min:
67 fps, max:
124 fps
fps
GeForce GTX 1070 Ti (Desktop):
47.1 [X] i7-7740X Asus X299 Prime Intel Core i7-7740X 4.3GHz
GeForce GTX 1070 Ti (Desktop)
min:
37 fps, max:
72 fps
fps
GeForce GTX 1050 Ti Max-Q:
17.3 fps
GeForce GTX 1050 Ti Max-Q:
193.6 fps
GeForce GTX 1050 Ti Max-Q:
128.7 fps
GeForce GTX 1050 Ti Max-Q:
80.5 fps
GeForce GTX 1050 Ti Max-Q:
61 fps
GeForce GTX 1050 Ti Max-Q:
22 fps
GeForce GTX 1050 Ti Max-Q:
64.8 fps
GeForce GTX 1050 Ti Max-Q:
41 fps
GeForce GTX 1050 Ti Max-Q:
37.5 fps
GeForce GTX 1050 Ti Max-Q:
35.9 fps
GeForce GTX 1050 Ti Max-Q:
11.3 fps
GeForce GTX 1050 Ti Max-Q:
118.7 fps
GeForce GTX 1050 Ti Max-Q:
46.3 fps
GeForce GTX 1050 Ti Max-Q:
45 fps
GeForce GTX 1070 Ti (Desktop):
120 [X] i7-7740X Asus X299 Prime Intel Core i7-7740X 4.3GHz
GeForce GTX 1070 Ti (Desktop)
min:
94 fps, max:
156 fps
fps
GeForce GTX 1050 Ti Max-Q:
37.5 fps
GeForce GTX 1070 Ti (Desktop):
80 [X] i7-7740X Asus X299 Prime Intel Core i7-7740X 4.3GHz
GeForce GTX 1070 Ti (Desktop)
min:
61 fps, max:
105 fps
fps
GeForce GTX 1070 Ti (Desktop):
40.1 [X] i7-7740X Asus X299 Prime Intel Core i7-7740X 4.3GHz
GeForce GTX 1070 Ti (Desktop)
min:
28 fps, max:
53 fps
fps
GeForce GTX 1050 Ti Max-Q:
10.1 fps
GeForce GTX 1050 Ti Max-Q:
67 fps
GeForce GTX 1050 Ti Max-Q:
43 fps
GeForce GTX 1050 Ti Max-Q:
34 fps
GeForce GTX 1070 Ti (Desktop):
63 [X] i7-7740X Asus X299 Prime Intel Core i7-7740X 4.3GHz
GeForce GTX 1070 Ti (Desktop)
min:
35 fps, max:
124 fps
fps
GeForce GTX 1050 Ti Max-Q:
18 fps
GeForce GTX 1070 Ti (Desktop):
48 [X] i7-7740X Asus X299 Prime Intel Core i7-7740X 4.3GHz
GeForce GTX 1070 Ti (Desktop)
min:
24 fps, max:
81 fps
fps
GeForce GTX 1070 Ti (Desktop):
27 [X] i7-7740X Asus X299 Prime Intel Core i7-7740X 4.3GHz
GeForce GTX 1070 Ti (Desktop)
min:
13 fps, max:
63 fps
fps
GeForce GTX 1050 Ti Max-Q:
7 fps
GeForce GTX 1050 Ti Max-Q:
122 fps
GeForce GTX 1050 Ti Max-Q:
67 fps
GeForce GTX 1050 Ti Max-Q:
61 fps
GeForce GTX 1070 Ti (Desktop):
100 [X] i7-7740X Asus X299 Prime Intel Core i7-7740X 4.3GHz
GeForce GTX 1070 Ti (Desktop)
min:
87 fps, max:
129 fps
fps
GeForce GTX 1050 Ti Max-Q:
47 fps
GeForce GTX 1070 Ti (Desktop):
81 [X] i7-7740X Asus X299 Prime Intel Core i7-7740X 4.3GHz
GeForce GTX 1070 Ti (Desktop)
min:
73 fps, max:
103 fps
fps
GeForce GTX 1070 Ti (Desktop):
55 [X] i7-7740X Asus X299 Prime Intel Core i7-7740X 4.3GHz
GeForce GTX 1070 Ti (Desktop)
min:
49 fps, max:
68 fps
fps
GeForce GTX 1050 Ti Max-Q:
20 fps
GeForce GTX 1070 Ti (Desktop):
267 [X] i7-7740X Asus X299 Prime Intel Core i7-7740X 4.3GHz
GeForce GTX 1070 Ti (Desktop)
min:
248 fps, max:
287 fps
fps
GeForce GTX 1070 Ti (Desktop):
141 [X] i7-7740X Asus X299 Prime Intel Core i7-7740X 4.3GHz
GeForce GTX 1070 Ti (Desktop)
min:
114 fps, max:
165 fps
fps
GeForce GTX 1050 Ti Max-Q:
97 fps
GeForce GTX 1050 Ti Max-Q:
39 fps
GeForce GTX 1050 Ti Max-Q:
35 fps
GeForce GTX 1070 Ti (Desktop):
84 [X] i7-7740X Asus X299 Prime Intel Core i7-7740X 4.3GHz
GeForce GTX 1070 Ti (Desktop)
min:
67 fps, max:
142 fps
fps
GeForce GTX 1050 Ti Max-Q:
29 fps
GeForce GTX 1070 Ti (Desktop):
51 [X] i7-7740X Asus X299 Prime Intel Core i7-7740X 4.3GHz
GeForce GTX 1070 Ti (Desktop)
min:
46 fps, max:
87 fps
fps
GeForce GTX 1070 Ti (Desktop):
28 [X] i7-7740X Asus X299 Prime Intel Core i7-7740X 4.3GHz
GeForce GTX 1070 Ti (Desktop)
min:
24 fps, max:
43 fps
fps
GeForce GTX 1050 Ti Max-Q:
11 fps
GeForce GTX 1050 Ti Max-Q:
134 fps
GeForce GTX 1050 Ti Max-Q:
80 fps
GeForce GTX 1050 Ti Max-Q:
62 fps
GeForce GTX 1070 Ti (Desktop):
97 [X] i7-7740X Asus X299 Prime Intel Core i7-7740X 4.3GHz
GeForce GTX 1070 Ti (Desktop)
min:
85 fps, max:
102 fps
fps
GeForce GTX 1050 Ti Max-Q:
38 fps
GeForce GTX 1070 Ti (Desktop):
78 [X] i7-7740X Asus X299 Prime Intel Core i7-7740X 4.3GHz
GeForce GTX 1070 Ti (Desktop)
min:
70 fps, max:
82 fps
fps
GeForce GTX 1070 Ti (Desktop):
49 [X] i7-7740X Asus X299 Prime Intel Core i7-7740X 4.3GHz
GeForce GTX 1070 Ti (Desktop)
min:
44 fps, max:
51 fps
fps
GeForce GTX 1050 Ti Max-Q:
17 fps
GeForce GTX 1050 Ti Max-Q:
100.3 fps
GeForce GTX 1050 Ti Max-Q:
39.2 fps
GeForce GTX 1050 Ti Max-Q:
34.9 fps
GeForce GTX 1070 Ti (Desktop):
78 [X] i7-7740X Asus X299 Prime Intel Core i7-7740X 4.3GHz
GeForce GTX 1070 Ti (Desktop)
min:
64 fps, max:
99 fps
fps
GeForce GTX 1050 Ti Max-Q:
26.8 fps
GeForce GTX 1070 Ti (Desktop):
48.5 [X] i7-7740X Asus X299 Prime Intel Core i7-7740X 4.3GHz
GeForce GTX 1070 Ti (Desktop)
min:
41 fps, max:
59 fps
fps
GeForce GTX 1070 Ti (Desktop):
23.8 [X] i7-7740X Asus X299 Prime Intel Core i7-7740X 4.3GHz
GeForce GTX 1070 Ti (Desktop)
min:
21 fps, max:
28 fps
fps
GeForce GTX 1050 Ti Max-Q:
8.3 fps
GeForce GTX 1050 Ti Max-Q:
60 fps
GeForce GTX 1050 Ti Max-Q:
49.1 fps
GeForce GTX 1050 Ti Max-Q:
45.3 fps
GeForce GTX 1050 Ti Max-Q:
42 fps
GeForce GTX 1050 Ti Max-Q:
14 fps
GeForce GTX 1070 Ti (Desktop):
135 [X] i7-7740X Asus X299 Prime Intel Core i7-7740X 4.3GHz
GeForce GTX 1070 Ti (Desktop)
min:
111 fps, max:
171 fps
fps
GeForce GTX 1050 Ti Max-Q:
76 91 91 ~ 86 fps
GeForce GTX 1070 Ti (Desktop):
114 [X] i7-7740X Asus X299 Prime Intel Core i7-7740X 4.3GHz
GeForce GTX 1070 Ti (Desktop)
min:
95 fps, max:
132 fps
fps
GeForce GTX 1050 Ti Max-Q:
45 48 48 ~ 47 fps
GeForce GTX 1070 Ti (Desktop):
108 [X] i7-7740X Asus X299 Prime Intel Core i7-7740X 4.3GHz
GeForce GTX 1070 Ti (Desktop)
min:
95 fps, max:
122 fps
fps
GeForce GTX 1050 Ti Max-Q:
41 44 44 ~ 43 fps
GeForce GTX 1070 Ti (Desktop):
102 [X] i7-7740X Asus X299 Prime Intel Core i7-7740X 4.3GHz
GeForce GTX 1070 Ti (Desktop)
min:
79 fps, max:
116 fps
fps
GeForce GTX 1050 Ti Max-Q:
38 38 41 ~ 39 fps
GeForce GTX 1070 Ti (Desktop):
75 [X] i7-7740X Asus X299 Prime Intel Core i7-7740X 4.3GHz
GeForce GTX 1070 Ti (Desktop)
min:
67 fps, max:
85 fps
fps
GeForce GTX 1070 Ti (Desktop):
39 [X] i7-7740X Asus X299 Prime Intel Core i7-7740X 4.3GHz
GeForce GTX 1070 Ti (Desktop)
min:
34 fps, max:
45 fps
fps
GeForce GTX 1050 Ti Max-Q:
13 13 14 ~ 13 fps
GeForce GTX 1070 Ti (Desktop):
101 [X] Intel Core i7-4790K 4GHz
GeForce GTX 1070 Ti (Desktop)
fps
GeForce GTX 1050 Ti Max-Q:
92.7 fps
GeForce GTX 1070 Ti (Desktop):
89 [X] Intel Core i7-4790K 4GHz
GeForce GTX 1070 Ti (Desktop)
fps
GeForce GTX 1050 Ti Max-Q:
80.3 fps
GeForce GTX 1070 Ti (Desktop):
74.5 [X] Intel Core i7-4790K 4GHz
GeForce GTX 1070 Ti (Desktop)
fps
GeForce GTX 1050 Ti Max-Q:
69.4 fps
GeForce GTX 1070 Ti (Desktop):
66.7 [X] Intel Core i7-4790K 4GHz
GeForce GTX 1070 Ti (Desktop)
fps
GeForce GTX 1050 Ti Max-Q:
39.5 fps
GeForce GTX 1070 Ti (Desktop):
154 [X] Intel Core i7-4790K 4GHz
GeForce GTX 1070 Ti (Desktop)
min:
101 fps, max:
189 fps
fps
GeForce GTX 1070 Ti (Desktop):
100 [X] Intel Core i7-4790K 4GHz
GeForce GTX 1070 Ti (Desktop)
min:
77 fps, max:
115 fps
fps
GeForce GTX 1070 Ti (Desktop):
82 [X] Intel Core i7-4790K 4GHz
GeForce GTX 1070 Ti (Desktop)
min:
58 fps, max:
97 fps
fps
GeForce GTX 1070 Ti (Desktop):
59.1 [X] Intel Core i7-4790K 4GHz
GeForce GTX 1070 Ti (Desktop)
min:
44 fps, max:
74 fps
fps
GeForce GTX 1070 Ti (Desktop):
42.4 [X] Intel Core i7-4790K 4GHz
GeForce GTX 1070 Ti (Desktop)
min:
33 fps, max:
50 fps
fps
GeForce GTX 1070 Ti (Desktop):
22.7 [X] Intel Core i7-4790K 4GHz
GeForce GTX 1070 Ti (Desktop)
min:
18 fps, max:
27 fps
fps
GeForce GTX 1070 Ti (Desktop):
146 [X] Intel Core i7-4790K 4GHz
GeForce GTX 1070 Ti (Desktop)
min:
93 fps, max:
194 fps
fps
GeForce GTX 1050 Ti Max-Q:
61.5 75.1 ~ 68 fps
GeForce GTX 1070 Ti (Desktop):
87 [X] Intel Core i7-4790K 4GHz
GeForce GTX 1070 Ti (Desktop)
min:
69 fps, max:
110 fps
fps
GeForce GTX 1050 Ti Max-Q:
36.6 37.7 ~ 37 fps
GeForce GTX 1070 Ti (Desktop):
63 [X] Intel Core i7-4790K 4GHz
GeForce GTX 1070 Ti (Desktop)
max:
92 fps
fps
GeForce GTX 1050 Ti Max-Q:
23.3 25 ~ 24 fps
GeForce GTX 1070 Ti (Desktop):
27.7 [X] Intel Core i7-4790K 4GHz
GeForce GTX 1070 Ti (Desktop)
max:
42 fps
fps
GeForce GTX 1050 Ti Max-Q:
9.2 fps
GeForce GTX 1070 Ti (Desktop):
109 [X] Intel Core i7-4790K 4GHz
GeForce GTX 1070 Ti (Desktop)
min:
78 fps, max:
132 fps
fps
GeForce GTX 1070 Ti (Desktop):
72 [X] Intel Core i7-4790K 4GHz
GeForce GTX 1070 Ti (Desktop)
min:
61 fps, max:
89 fps
fps
GeForce GTX 1070 Ti (Desktop):
36 [X] Intel Core i7-4790K 4GHz
GeForce GTX 1070 Ti (Desktop)
min:
32 fps, max:
39 fps
fps
GeForce GTX 1050 Ti Max-Q:
92.3 fps
GeForce GTX 1050 Ti Max-Q:
42 fps
GeForce GTX 1050 Ti Max-Q:
34.3 fps
GeForce GTX 1070 Ti (Desktop):
117 [X] Intel Core i7-4790K 4GHz
GeForce GTX 1070 Ti (Desktop)
min:
106 fps, max:
130 fps
fps
GeForce GTX 1050 Ti Max-Q:
30.4 fps
GeForce GTX 1070 Ti (Desktop):
77 [X] Intel Core i7-4790K 4GHz
GeForce GTX 1070 Ti (Desktop)
min:
70 fps, max:
85 fps
fps
GeForce GTX 1070 Ti (Desktop):
38 [X] Intel Core i7-4790K 4GHz
GeForce GTX 1070 Ti (Desktop)
min:
34 fps, max:
44 fps
fps
GeForce GTX 1070 Ti (Desktop):
122 [X] Intel Core i7-4790K 4GHz
GeForce GTX 1070 Ti (Desktop)
min:
86 fps, max:
155 fps
fps
GeForce GTX 1070 Ti (Desktop):
85 [X] Intel Core i7-4790K 4GHz
GeForce GTX 1070 Ti (Desktop)
min:
57 fps, max:
102 fps
fps
GeForce GTX 1070 Ti (Desktop):
45 [X] Intel Core i7-4790K 4GHz
GeForce GTX 1070 Ti (Desktop)
min:
30 fps, max:
52 fps
fps
GeForce GTX 1070 Ti (Desktop):
103 [X] Intel Core i7-4790K 4GHz
GeForce GTX 1070 Ti (Desktop)
min:
60 fps, max:
143 fps
fps
GeForce GTX 1050 Ti Max-Q:
58 fps
GeForce GTX 1070 Ti (Desktop):
92 [X] Intel Core i7-4790K 4GHz
GeForce GTX 1070 Ti (Desktop)
min:
55 fps, max:
133 fps
fps
GeForce GTX 1050 Ti Max-Q:
41 fps
GeForce GTX 1070 Ti (Desktop):
88 [X] Intel Core i7-4790K 4GHz
GeForce GTX 1070 Ti (Desktop)
min:
53 fps, max:
126 fps
fps
GeForce GTX 1050 Ti Max-Q:
33 fps
GeForce GTX 1070 Ti (Desktop):
75 [X] Intel Core i7-4790K 4GHz
GeForce GTX 1070 Ti (Desktop)
min:
30 fps, max:
117 fps
fps
GeForce GTX 1050 Ti Max-Q:
27 fps
GeForce GTX 1070 Ti (Desktop):
58 [X] Intel Core i7-4790K 4GHz
GeForce GTX 1070 Ti (Desktop)
min:
33 fps, max:
104 fps
fps
GeForce GTX 1070 Ti (Desktop):
34 [X] Intel Core i7-4790K 4GHz
GeForce GTX 1070 Ti (Desktop)
min:
24 fps, max:
51 fps
fps
GeForce GTX 1050 Ti Max-Q:
13 fps
GeForce GTX 1050 Ti Max-Q:
119.5 fps
GeForce GTX 1050 Ti Max-Q:
69.4 fps
GeForce GTX 1050 Ti Max-Q:
64.3 fps
GeForce GTX 1050 Ti Max-Q:
57.9 fps
GeForce GTX 1050 Ti Max-Q:
18.9 fps
GeForce GTX 1070 Ti (Desktop):
165 [X] Intel Core i7-4790K 4GHz
GeForce GTX 1070 Ti (Desktop)
min:
76 fps, max:
225 fps
fps
GeForce GTX 1050 Ti Max-Q:
105 fps
GeForce GTX 1070 Ti (Desktop):
136 [X] Intel Core i7-4790K 4GHz
GeForce GTX 1070 Ti (Desktop)
min:
66 fps, max:
190 fps
fps
GeForce GTX 1050 Ti Max-Q:
55 fps
GeForce GTX 1070 Ti (Desktop):
109 [X] Intel Core i7-4790K 4GHz
GeForce GTX 1070 Ti (Desktop)
min:
49 fps, max:
169 fps
fps
GeForce GTX 1050 Ti Max-Q:
41 fps
GeForce GTX 1070 Ti (Desktop):
85 [X] Intel Core i7-4790K 4GHz
GeForce GTX 1070 Ti (Desktop)
min:
43 fps, max:
169 fps
fps
GeForce GTX 1050 Ti Max-Q:
31 fps
GeForce GTX 1070 Ti (Desktop):
34 [X] Intel Core i7-4790K 4GHz
GeForce GTX 1070 Ti (Desktop)
min:
21 fps, max:
50 fps
fps
GeForce GTX 1050 Ti Max-Q:
13 fps
GeForce GTX 1070 Ti (Desktop):
47.1 [X] Intel Core i7-4790K 4GHz
GeForce GTX 1070 Ti (Desktop)
min:
44 fps, max:
51 fps
fps
GeForce GTX 1070 Ti (Desktop):
17.3 [X] Intel Core i7-4790K 4GHz
GeForce GTX 1070 Ti (Desktop)
min:
16 fps, max:
18 fps
fps
GeForce GTX 1070 Ti (Desktop):
106 [X] Intel Core i7-4790K 4GHz
GeForce GTX 1070 Ti (Desktop)
min:
95 fps, max:
113 fps
fps
GeForce GTX 1070 Ti (Desktop):
52 [X] Intel Core i7-4790K 4GHz
GeForce GTX 1070 Ti (Desktop)
min:
47 fps, max:
55 fps
fps
GeForce GTX 1050 Ti Max-Q:
129.8 fps
GeForce GTX 1050 Ti Max-Q:
123.6 fps
GeForce GTX 1050 Ti Max-Q:
115.7 fps
GeForce GTX 1050 Ti Max-Q:
112.6 fps
GeForce GTX 1070 Ti (Desktop):
152 [X] Intel Core i7-4790K 4GHz
GeForce GTX 1070 Ti (Desktop)
min:
130 fps
fps
GeForce GTX 1050 Ti Max-Q:
65.2 fps
GeForce GTX 1070 Ti (Desktop):
57.9 [X] Intel Core i7-4790K 4GHz
GeForce GTX 1070 Ti (Desktop)
min:
51 fps, max:
69 fps
fps
GeForce GTX 1050 Ti Max-Q:
249.1 fps
GeForce GTX 1050 Ti Max-Q:
169.1 fps
GeForce GTX 1070 Ti (Desktop):
223 [X] Intel Core i7-4790K 4GHz
GeForce GTX 1070 Ti (Desktop)
min:
176 fps, max:
252 fps
fps
GeForce GTX 1050 Ti Max-Q:
112.5 fps
GeForce GTX 1070 Ti (Desktop):
92 [X] Intel Core i7-4790K 4GHz
GeForce GTX 1070 Ti (Desktop)
min:
76 fps, max:
133 fps
fps
GeForce GTX 1050 Ti Max-Q:
42.3 fps
GeForce GTX 1050 Ti Max-Q:
142.4 fps
GeForce GTX 1050 Ti Max-Q:
85.6 fps
GeForce GTX 1050 Ti Max-Q:
68.3 fps
GeForce GTX 1050 Ti Max-Q:
58.9 fps
GeForce GTX 1050 Ti Max-Q:
21.7 fps
GeForce GTX 1050 Ti Max-Q:
68.6 96.7 ~ 83 fps
GeForce GTX 1070 Ti (Desktop):
54.2 [X] Intel Core i7-4790K 4GHz
GeForce GTX 1070 Ti (Desktop)
min:
47 fps, max:
62 fps
fps
GeForce GTX 1070 Ti (Desktop):
35.8 [X] Intel Core i7-4790K 4GHz
GeForce GTX 1070 Ti (Desktop)
min:
27 fps, max:
40 fps
fps
GeForce GTX 1050 Ti Max-Q:
13.9 14.5 ~ 14 fps
GeForce GTX 1050 Ti Max-Q:
63.8 68.2 ~ 66 fps
GeForce GTX 1070 Ti (Desktop):
156 [X] Intel Core i7-4790K 4GHz
GeForce GTX 1070 Ti (Desktop)
min:
92 fps, max:
189 fps
fps
GeForce GTX 1050 Ti Max-Q:
64.9 65.5 ~ 65 fps
GeForce GTX 1070 Ti (Desktop):
122 [X] Intel Core i7-4790K 4GHz
GeForce GTX 1070 Ti (Desktop)
min:
75 fps, max:
163 fps
fps
GeForce GTX 1050 Ti Max-Q:
49.5 50.4 ~ 50 fps
GeForce GTX 1070 Ti (Desktop):
47.9 [X] Intel Core i7-4790K 4GHz
GeForce GTX 1070 Ti (Desktop)
min:
39 fps, max:
60 fps
fps
GeForce GTX 1050 Ti Max-Q:
19.2 19.2 ~ 19 fps
GeForce GTX 1070 Ti (Desktop):
67.8 [X] Intel Core i7-4790K 4GHz
GeForce GTX 1070 Ti (Desktop)
min:
51 fps, max:
97 fps
fps
GeForce GTX 1050 Ti Max-Q:
137.3 fps
GeForce GTX 1050 Ti Max-Q:
104.6 fps
GeForce GTX 1070 Ti (Desktop):
80 [X] Intel Core i7-4790K 4GHz
GeForce GTX 1070 Ti (Desktop)
min:
79 fps, max:
81 fps
fps
GeForce GTX 1050 Ti Max-Q:
89.5 154.8 ~ 122 fps
GeForce GTX 1050 Ti Max-Q:
85.2 120 ~ 103 fps
GeForce GTX 1050 Ti Max-Q:
51.7 58.1 ~ 55 fps
GeForce GTX 1050 Ti Max-Q:
49.8 53.1 ~ 51 fps
GeForce GTX 1050 Ti Max-Q:
20.7 21.1 ~ 21 fps
GeForce GTX 1050 Ti Max-Q:
112.5 fps
GeForce GTX 1050 Ti Max-Q:
85.8 fps
GeForce GTX 1050 Ti Max-Q:
51 fps
GeForce GTX 1070 Ti (Desktop):
108 [X] Intel Core i7-4790K 4GHz
GeForce GTX 1070 Ti (Desktop)
min:
86 fps, max:
184 fps
fps
GeForce GTX 1050 Ti Max-Q:
43 fps
GeForce GTX 1070 Ti (Desktop):
91 [X] Intel Core i7-4790K 4GHz
GeForce GTX 1070 Ti (Desktop)
min:
70 fps, max:
133 fps
fps
GeForce GTX 1070 Ti (Desktop):
67.9 [X] DX11
Intel Core i7-4790K 4GHz
GeForce GTX 1070 Ti (Desktop)
min:
53 fps, max:
87 fps
fps
GeForce GTX 1070 Ti (Desktop):
31.9 [X] DX11
Intel Core i7-4790K 4GHz
GeForce GTX 1070 Ti (Desktop)
min:
27 fps, max:
38 fps
fps
GeForce GTX 1050 Ti Max-Q:
285.4 fps
GeForce GTX 1050 Ti Max-Q:
233.9 fps
GeForce GTX 1050 Ti Max-Q:
117.7 fps
GeForce GTX 1070 Ti (Desktop):
182 [X] Intel Core i7-4790K 4GHz
GeForce GTX 1070 Ti (Desktop)
min:
149 fps, max:
213 fps
fps
GeForce GTX 1050 Ti Max-Q:
70.5 fps
GeForce GTX 1070 Ti (Desktop):
88.7 [X] Intel Core i7-4790K 4GHz
GeForce GTX 1070 Ti (Desktop)
min:
77 fps, max:
103 fps
fps
GeForce GTX 1050 Ti Max-Q:
37 fps
GeForce GTX 1050 Ti Max-Q:
63 fps
GeForce GTX 1050 Ti Max-Q:
41.3 fps
GeForce GTX 1050 Ti Max-Q:
35.8 fps
GeForce GTX 1050 Ti Max-Q:
15.7 fps
GeForce GTX 1050 Ti Max-Q:
83.4 89.5 ~ 86 fps
GeForce GTX 1050 Ti Max-Q:
41.9 42.5 ~ 42 fps
GeForce GTX 1070 Ti (Desktop):
94.6 [X] Intel Core i7-4790K 4GHz
GeForce GTX 1070 Ti (Desktop)
min:
53 fps, max:
133 fps
fps
GeForce GTX 1050 Ti Max-Q:
32.2 34.8 ~ 34 fps
GeForce GTX 1070 Ti (Desktop):
45.6 [X] Intel Core i7-4790K 4GHz
GeForce GTX 1070 Ti (Desktop)
min:
21 fps, max:
59 fps
fps
GeForce GTX 1050 Ti Max-Q:
14.6 15.7 ~ 15 fps
GeForce GTX 1070 Ti (Desktop):
98 [X] Intel Core i7-4790K 4GHz
GeForce GTX 1070 Ti (Desktop)
min:
80 fps, max:
113 fps
fps
GeForce GTX 1070 Ti (Desktop):
41 [X] Intel Core i7-4790K 4GHz
GeForce GTX 1070 Ti (Desktop)
min:
39 fps, max:
45 fps
fps
GeForce GTX 1070 Ti (Desktop):
111 [X] DX11
Intel Core i7-4790K 4GHz
GeForce GTX 1070 Ti (Desktop)
min:
101 fps, max:
119 fps
fps
GeForce GTX 1070 Ti (Desktop):
46.5 [X] DX11
Intel Core i7-4790K 4GHz
GeForce GTX 1070 Ti (Desktop)
min:
41 fps, max:
52 fps
fps
GeForce GTX 1050 Ti Max-Q:
16.8 17.1 ~ 17 fps
GeForce GTX 1050 Ti Max-Q:
90.2 92.7 ~ 91 fps
GeForce GTX 1070 Ti (Desktop):
177 [X] Intel Core i7-4790K 4GHz
GeForce GTX 1070 Ti (Desktop)
min:
106 fps, max:
305 fps
fps
GeForce GTX 1050 Ti Max-Q:
62.5 67.5 ~ 65 fps
GeForce GTX 1070 Ti (Desktop):
77 [X] Intel Core i7-4790K 4GHz
GeForce GTX 1070 Ti (Desktop)
min:
54 fps, max:
113 fps
fps
GeForce GTX 1050 Ti Max-Q:
27.7 29.3 ~ 29 fps
GeForce GTX 1050 Ti Max-Q:
168.6 fps
GeForce GTX 1050 Ti Max-Q:
143.9 fps
GeForce GTX 1050 Ti Max-Q:
112.7 fps
GeForce GTX 1050 Ti Max-Q:
101 fps
GeForce GTX 1050 Ti Max-Q:
34.4 fps
GeForce GTX 1070 Ti (Desktop):
142.7 [X] Intel Core i7-4790K 4GHz
GeForce GTX 1070 Ti (Desktop)
min:
125.8 fps
fps
GeForce GTX 1050 Ti Max-Q:
111.9 fps
GeForce GTX 1070 Ti (Desktop):
134.2 [X] Intel Core i7-4790K 4GHz
GeForce GTX 1070 Ti (Desktop)
min:
115.5 fps
fps
GeForce GTX 1050 Ti Max-Q:
104.2 fps
GeForce GTX 1070 Ti (Desktop):
126.6 [X] Intel Core i7-4790K 4GHz
GeForce GTX 1070 Ti (Desktop)
min:
111.1 fps
fps
GeForce GTX 1050 Ti Max-Q:
98.1 fps
GeForce GTX 1070 Ti (Desktop):
121.2 [X] Intel Core i7-4790K 4GHz
GeForce GTX 1070 Ti (Desktop)
min:
105.8 fps
fps
GeForce GTX 1050 Ti Max-Q:
93.5 fps
GeForce GTX 1070 Ti (Desktop):
105 [X] Intel Core i7-4790K 4GHz
GeForce GTX 1070 Ti (Desktop)
min:
95 fps
fps
GeForce GTX 1050 Ti Max-Q:
46 fps
GeForce GTX 1070 Ti (Desktop):
293 [X] Intel Core i7-4790K 4GHz
GeForce GTX 1070 Ti (Desktop)
min:
269 fps, max:
321 fps
fps
GeForce GTX 1070 Ti (Desktop):
71.8 [X] Intel Core i7-4790K 4GHz
GeForce GTX 1070 Ti (Desktop)
min:
61 fps, max:
80 fps
fps
GeForce GTX 1070 Ti (Desktop):
47.1 [X] Intel Core i7-4790K 4GHz
GeForce GTX 1070 Ti (Desktop)
min:
42 fps, max:
51 fps
fps
GeForce GTX 1050 Ti Max-Q:
150.4 fps
GeForce GTX 1050 Ti Max-Q:
143.3 fps
GeForce GTX 1050 Ti Max-Q:
78.9 fps
GeForce GTX 1050 Ti Max-Q:
34.5 fps
GeForce GTX 1070 Ti (Desktop):
67 [X] i7-7740X Asus X299 Prime Intel Core i7-7740X 4.3GHz
GeForce GTX 1070 Ti (Desktop)
min:
11.7 fps, P1:
27 fps, max:
202 fps
fps
GeForce GTX 1050 Ti Max-Q:
35.5 fps
100%
Adreno 510:
29 30 30 ~ 30 fps
GeForce GTX 1070 Ti (Desktop):
132 [X] Intel Core i7-4790K 4GHz
GeForce GTX 1070 Ti (Desktop)
min:
58 fps, max:
235 fps
fps
GeForce GTX 1050 Ti Max-Q:
228.2 fps
GeForce GTX 1050 Ti Max-Q:
202.6 fps
GeForce GTX 1050 Ti Max-Q:
202.1 fps
GeForce GTX 1050 Ti Max-Q:
170.1 fps
GeForce GTX 1050 Ti Max-Q:
433.4 fps
GeForce GTX 1050 Ti Max-Q:
200.4 fps
GeForce GTX 1050 Ti Max-Q:
186.7 fps
GeForce GTX 1050 Ti Max-Q:
126.7 fps
Average Gaming Qualcomm Adreno 510 → 100% Average Gaming 30-70 fps → 100%
 Deutsch
 English
 Español
 Français
 Italiano
 Nederlands
 Polski
 Português
 Русский
 Türkçe
 Svenska
 Chinese
 Magyar