MSI GS66 Stealth 10UG Laptop Review: How Fast is a 95 W GeForce RTX 3070?
MSI has been quick to jump in on the mobile GeForce RTX 30 bandwagon with plenty of updated models to choose from. The GS66, GE76, and GE66 are now all available with the latest Nvidia Ampere GPUs to replace last year's Turing options. Our GS66 10UG configuration comes with a GeForce RTX 3070 which MSI has confirmed with us to be targeting a 95 W TGP. There is also a new Core i7-10870H CPU to supplement the existing Core i7-10875H.
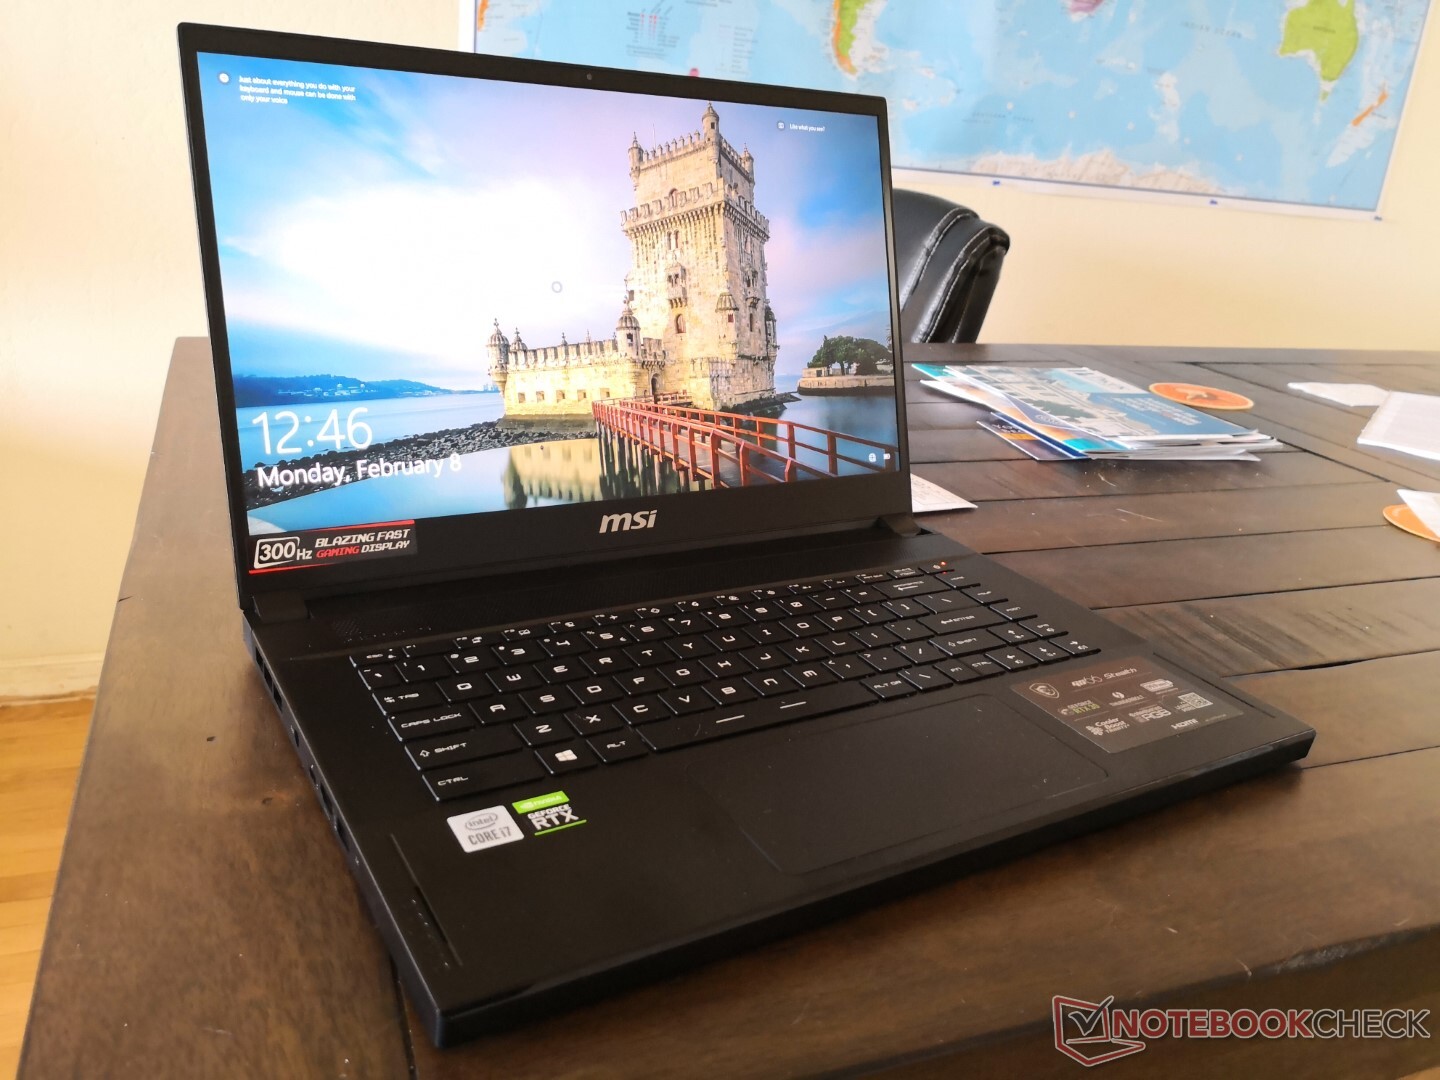
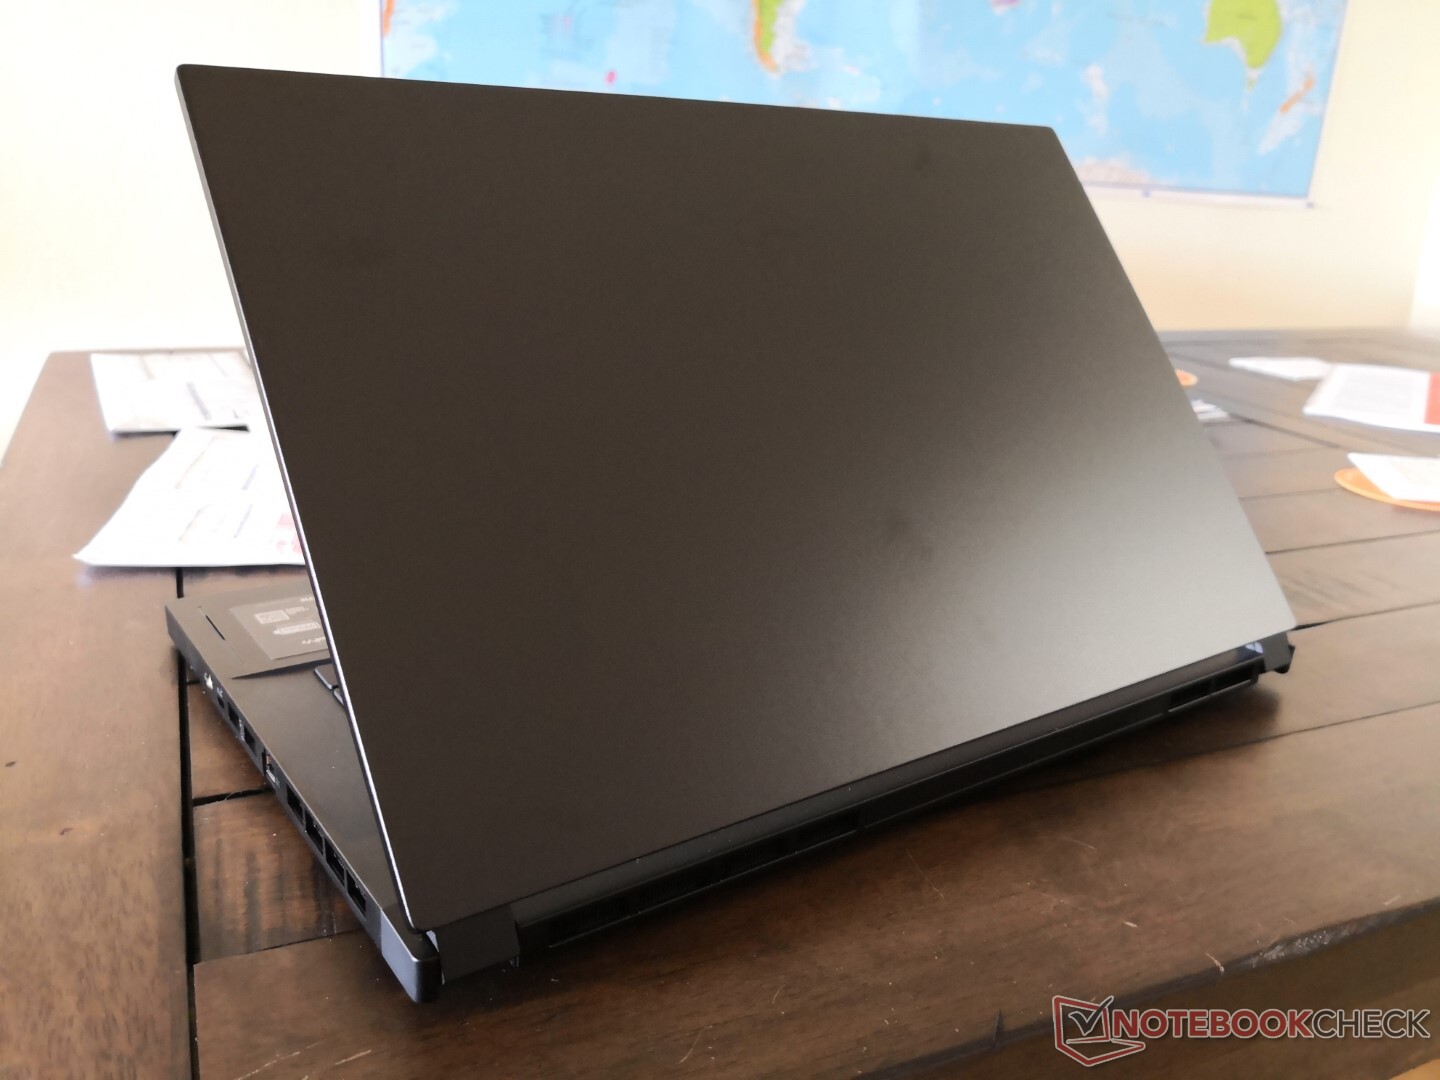
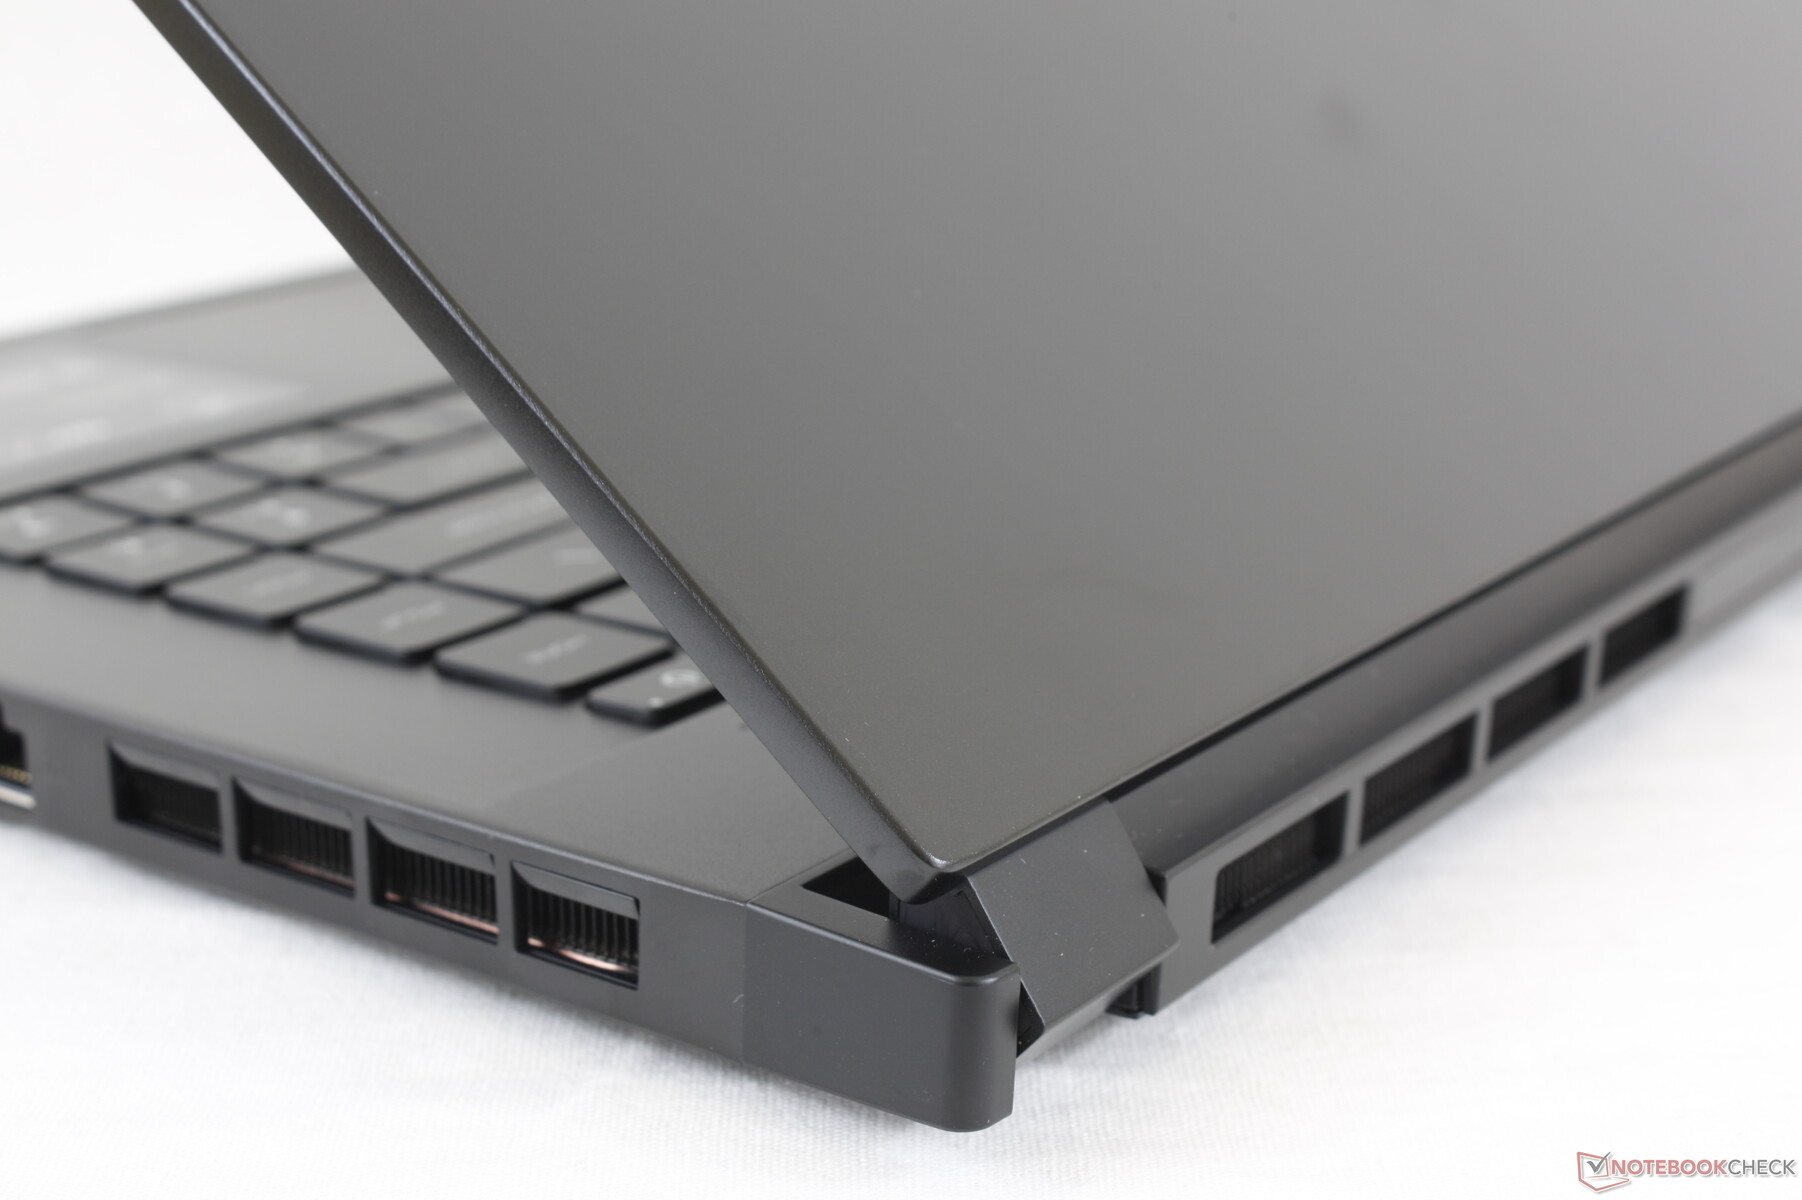
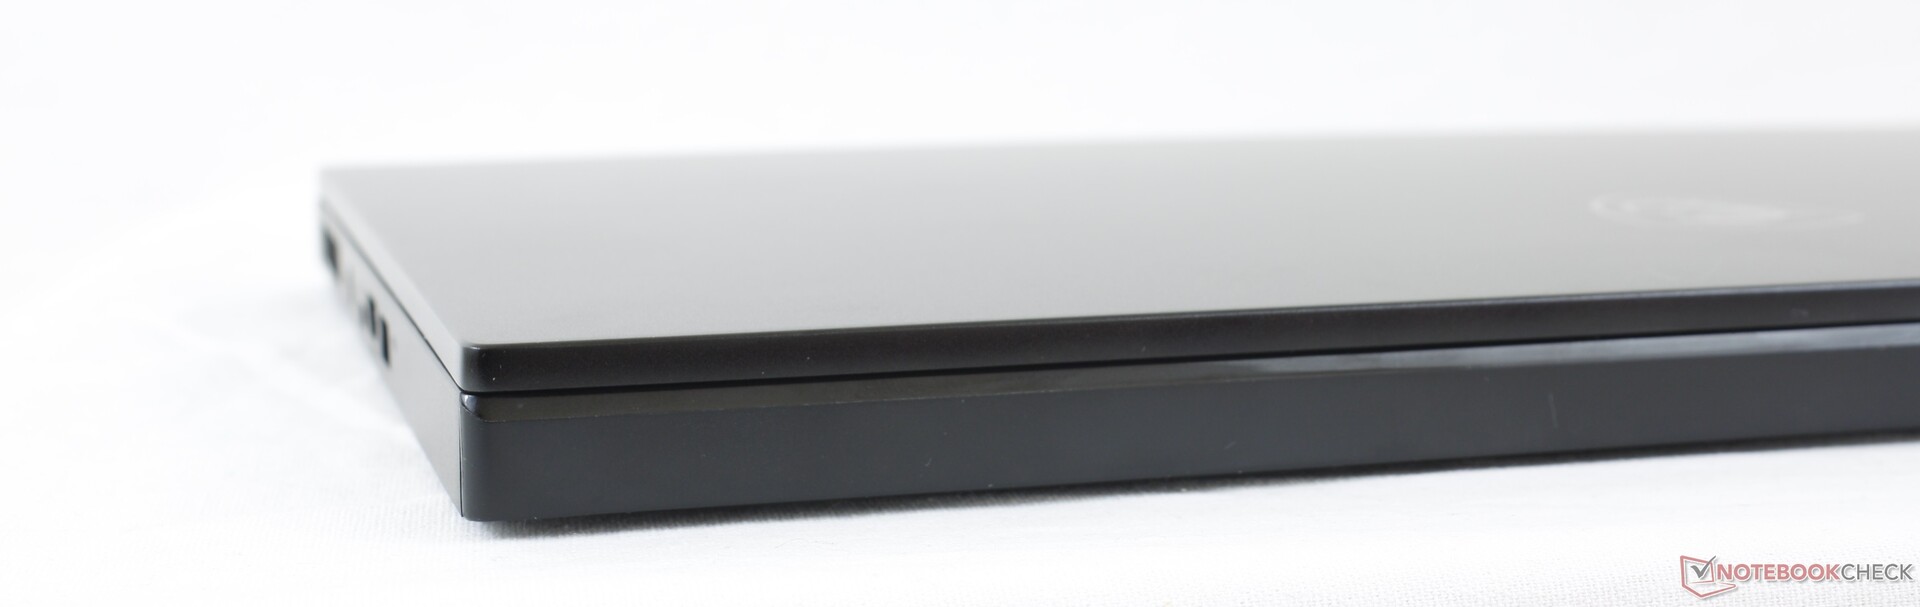
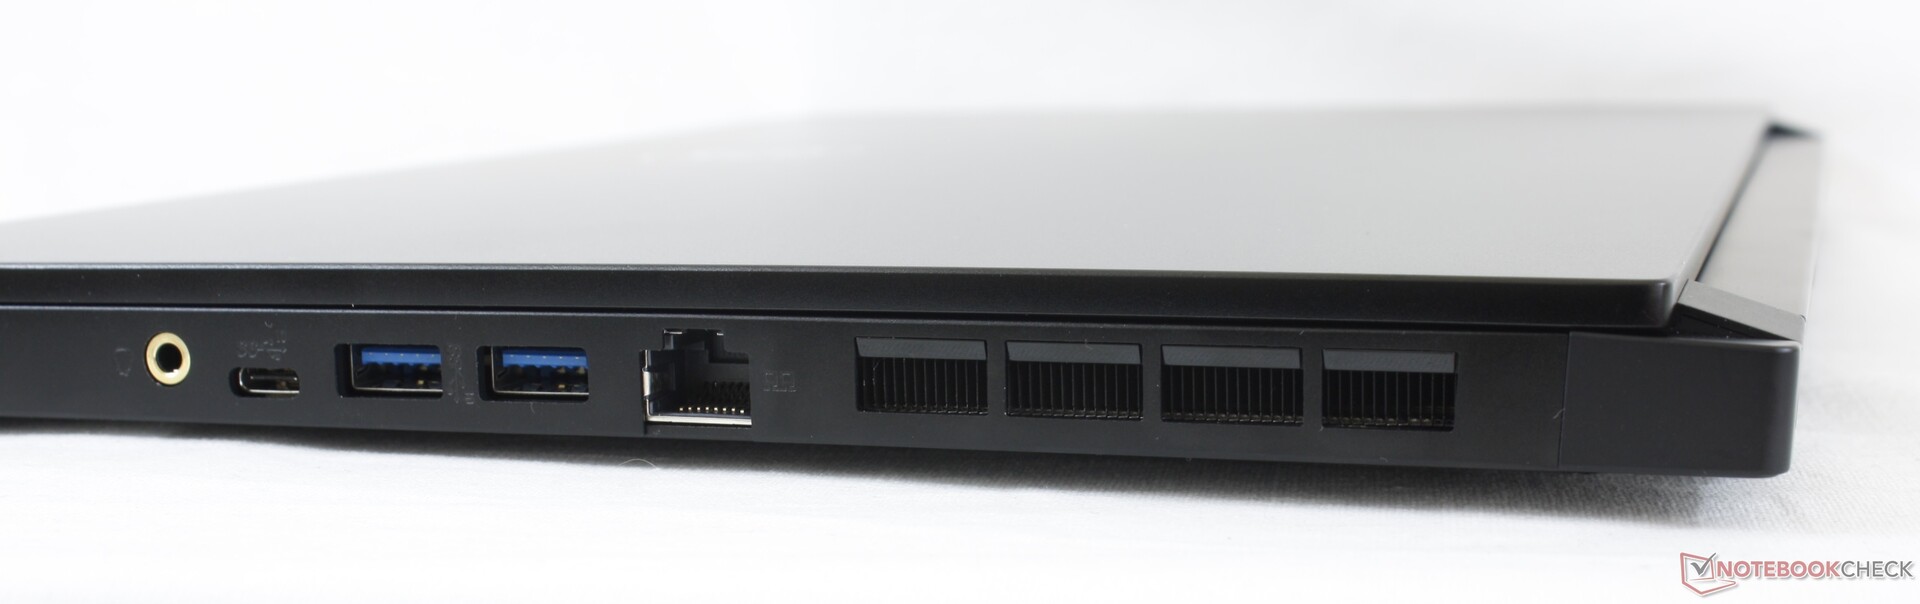
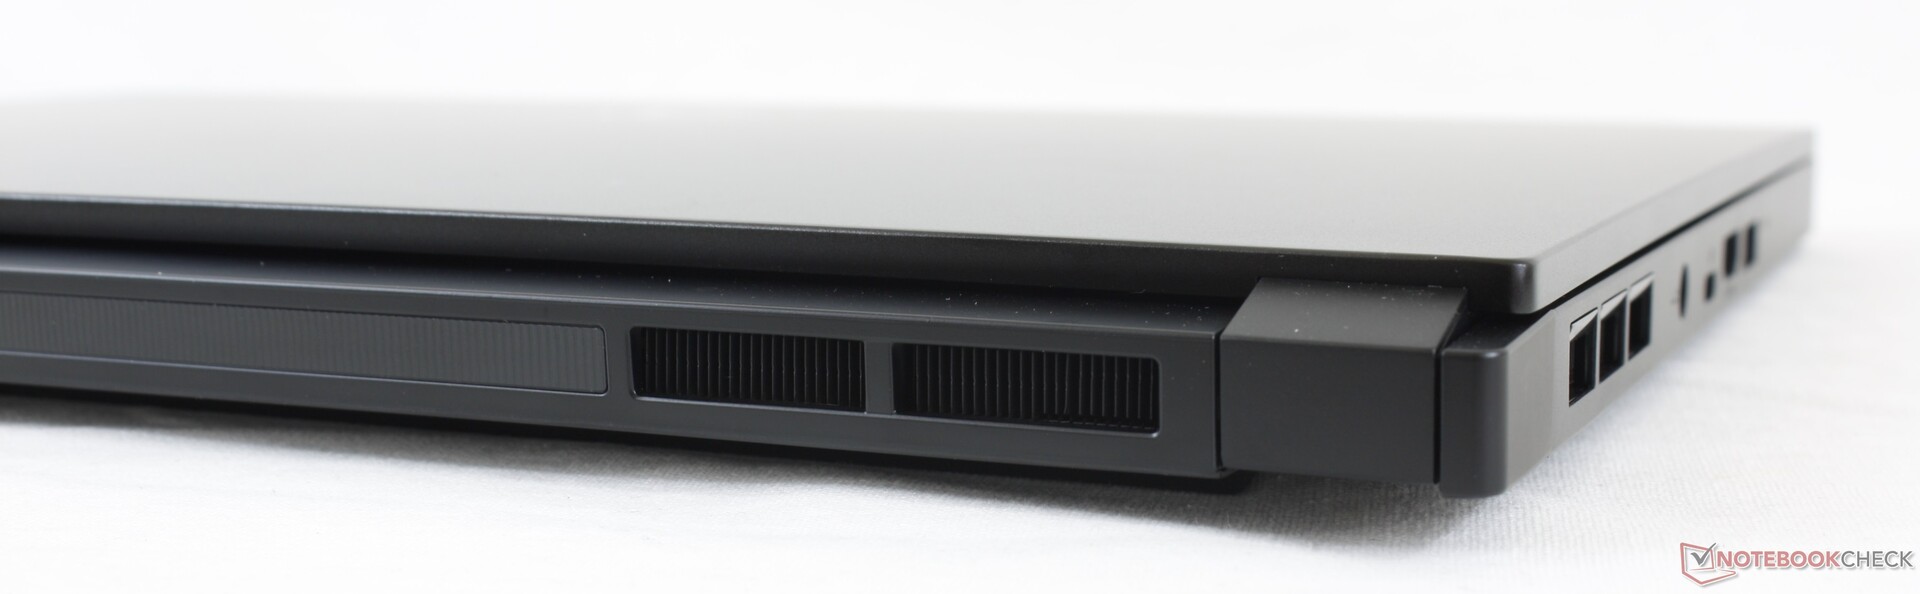
Other than the new CPU and GPU, the chassis remains visually identical to previous GS66 models. We recommend checking out our existing reviews on the GS66 to learn more about the physical features of the laptop as they all apply here as well. The GS66 competes directly with other ultra-thin high-performance 15.6-inch laptops like the Razer Blade 15, Lenovo Legion 7, Gigabyte Aero 15, and the Asus Zephyrus series.
More MSI reviews:
potential competitors in comparison
Rating | Date | Model | Weight | Height | Size | Resolution | Price |
|---|---|---|---|---|---|---|---|
| 84 % v7 (old) | 02 / 2021 | MSI GS66 Stealth 10UG i7-10870H, GeForce RTX 3070 Laptop GPU | 2.1 kg | 19.8 mm | 15.60" | 1920x1080 | |
| 84 % v7 (old) | 05 / 2020 | MSI GS66 10SGS i7-10750H, GeForce RTX 2080 Super Max-Q | 2.2 kg | 20 mm | 15.60" | 1920x1080 | |
| 82.4 % v7 (old) | 02 / 2021 | Asus TUF Dash F15 FX516PR i7-11370H, GeForce RTX 3070 Laptop GPU | 2 kg | 20 mm | 15.60" | 1920x1080 | |
| 86.9 % v7 (old) | 08 / 2020 | Razer Blade 15 RTX 2070 Super Max-Q i7-10875H, GeForce RTX 2070 Super Max-Q | 2.1 kg | 17.8 mm | 15.60" | 1920x1080 | |
| 84.5 % v7 (old) | 01 / 2021 | Aorus 15P WB i7-10750H, GeForce RTX 2070 Max-Q | 2.1 kg | 23 mm | 15.60" | 1920x1080 | |
| 84.8 % v7 (old) | 07 / 2020 | Alienware m15 R3 P87F i7-10750H, GeForce RTX 2070 Mobile | 2.3 kg | 19.9 mm | 15.60" | 1920x1080 |
Case
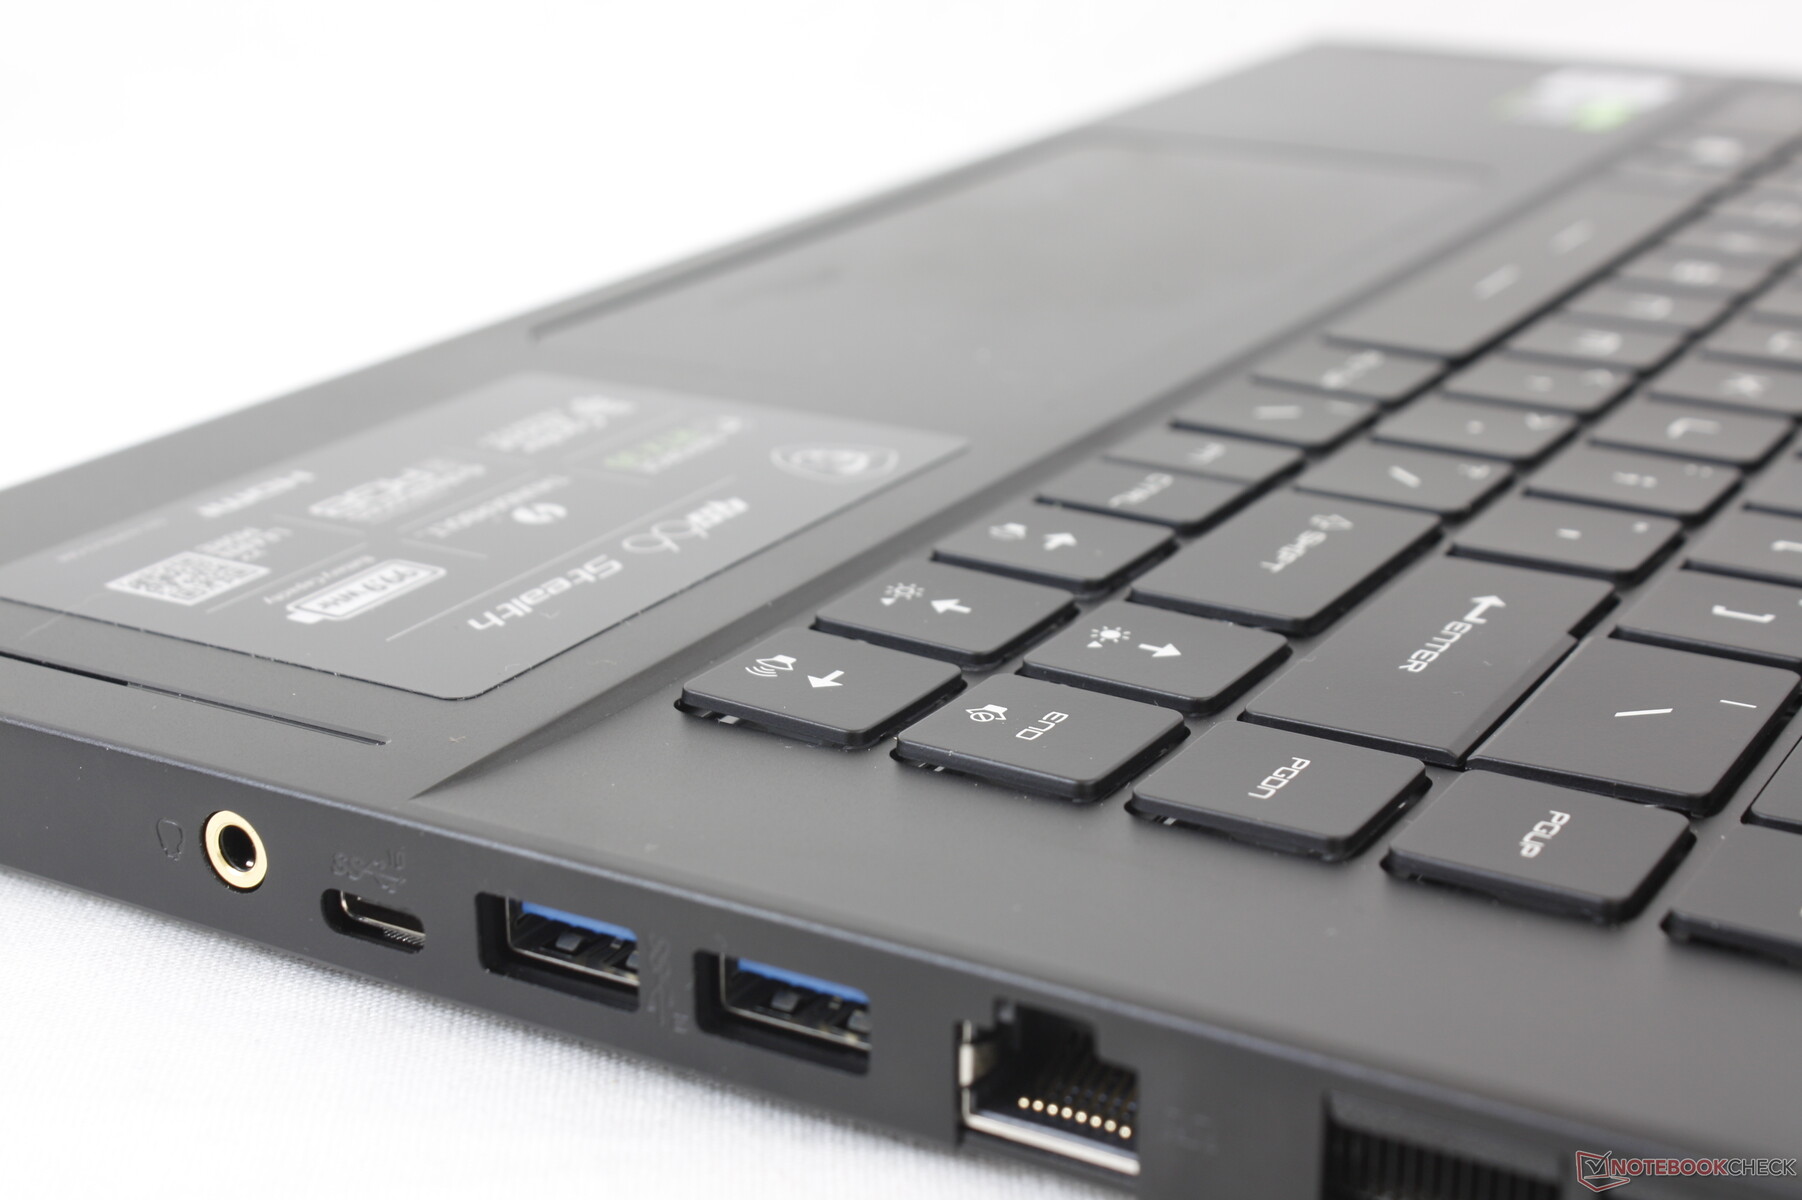
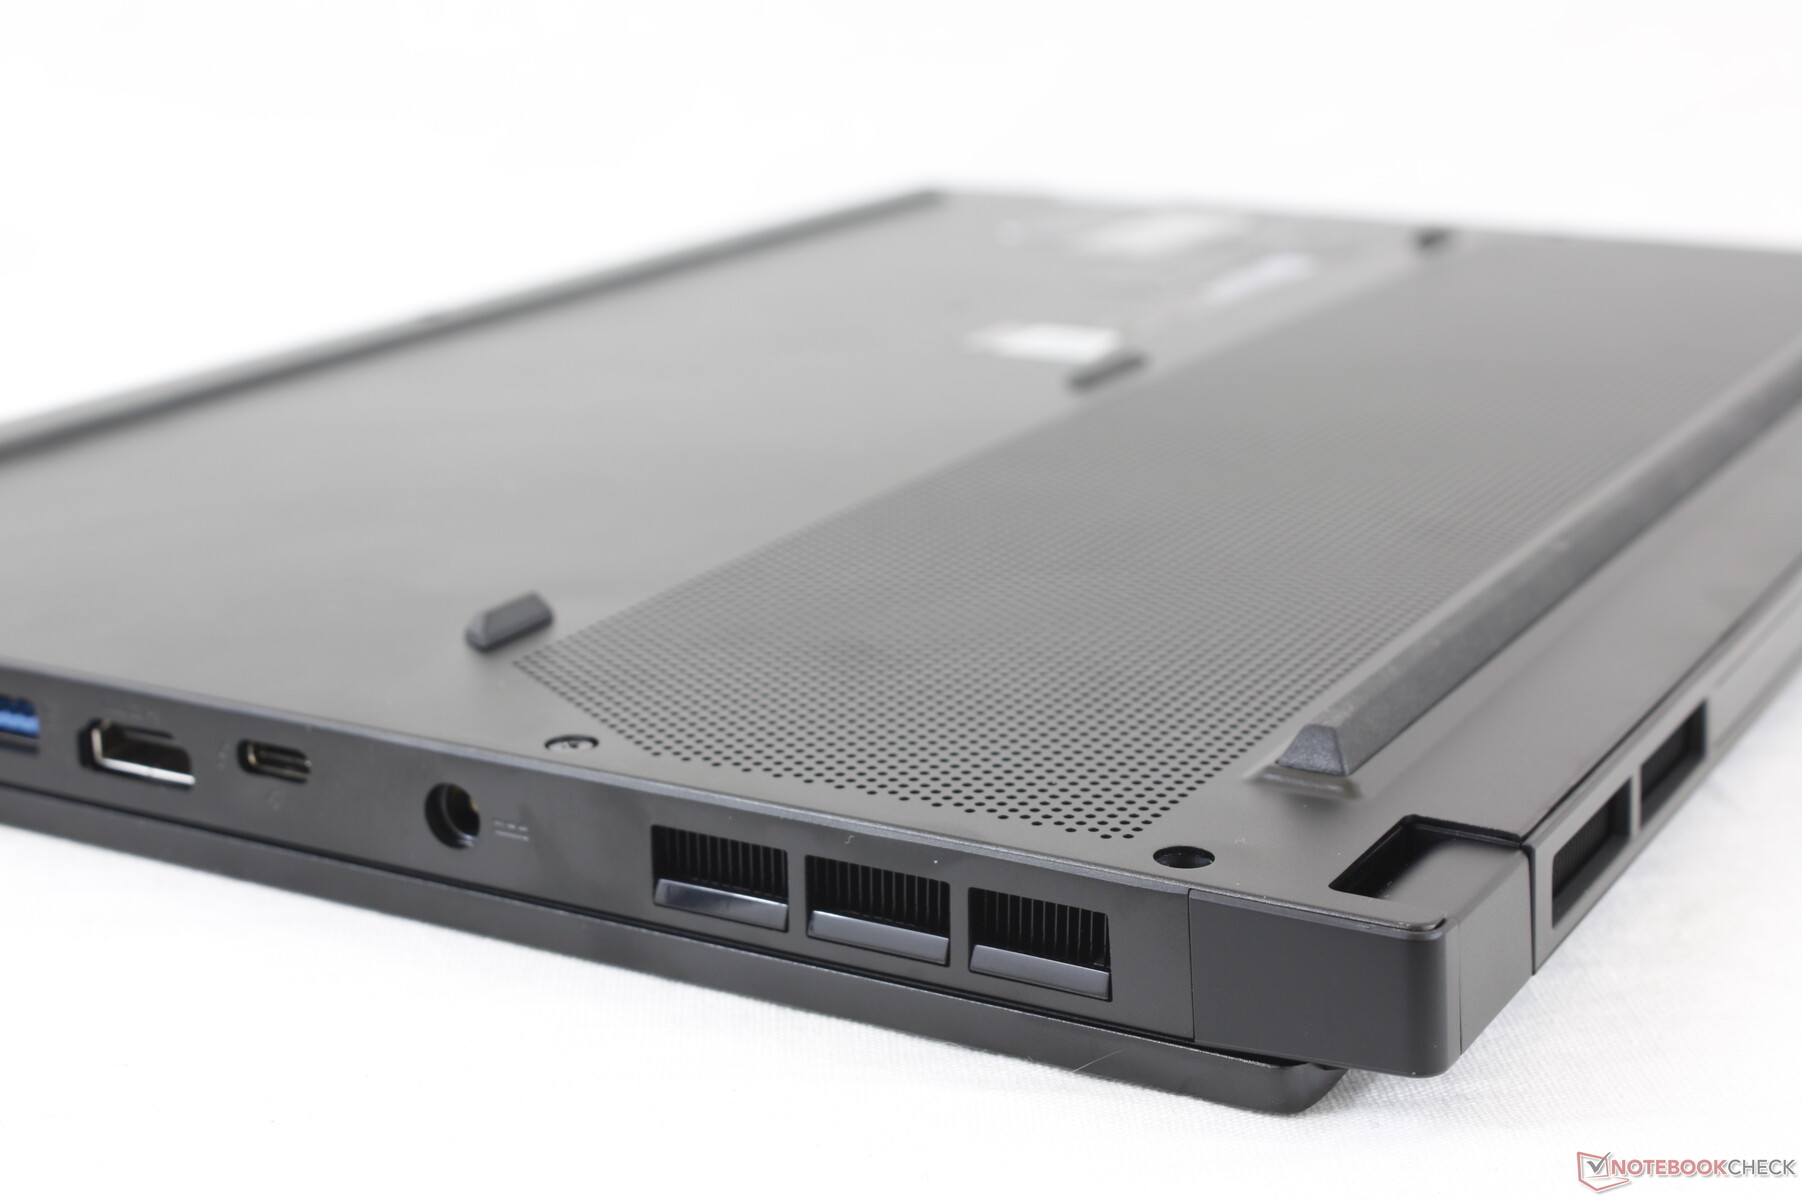
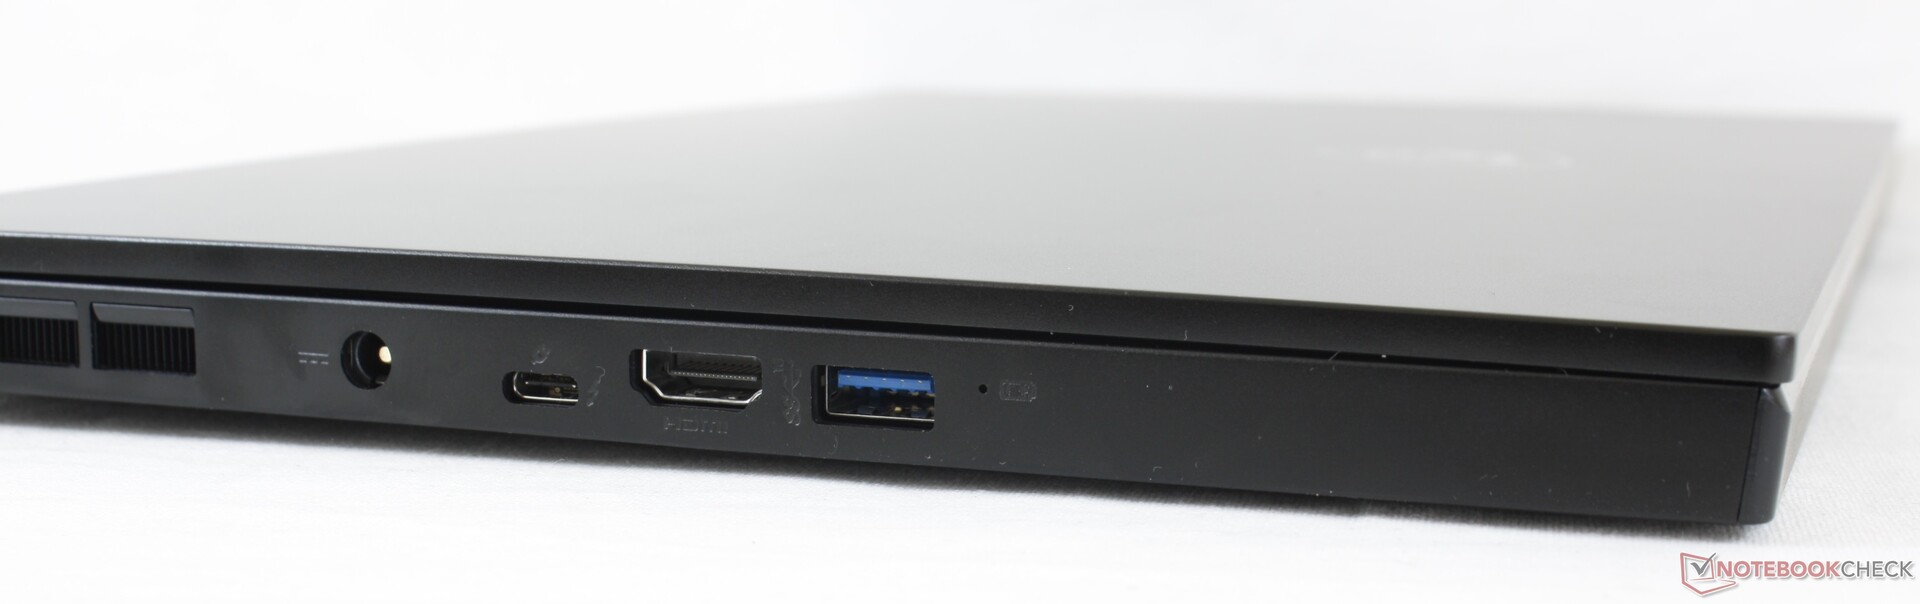
Connectivity
Communication
Webcam


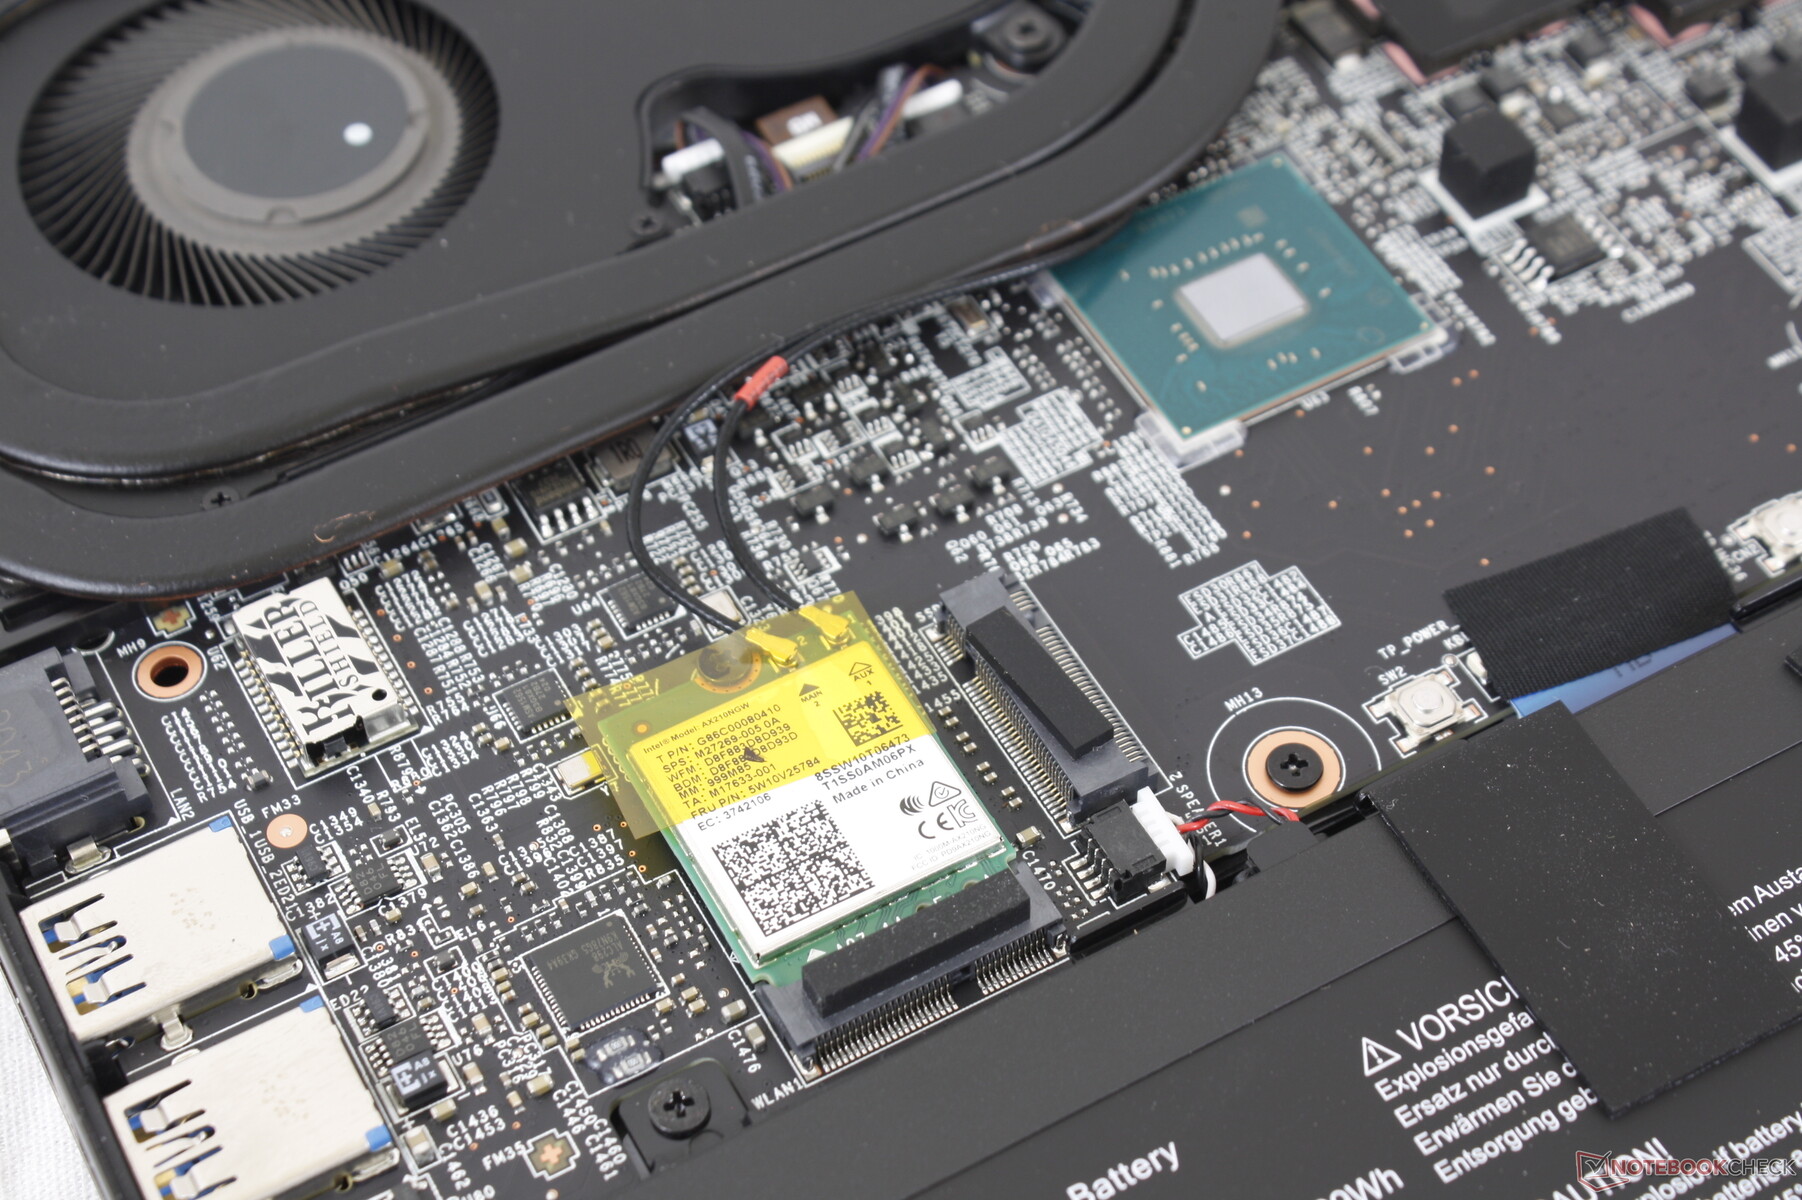
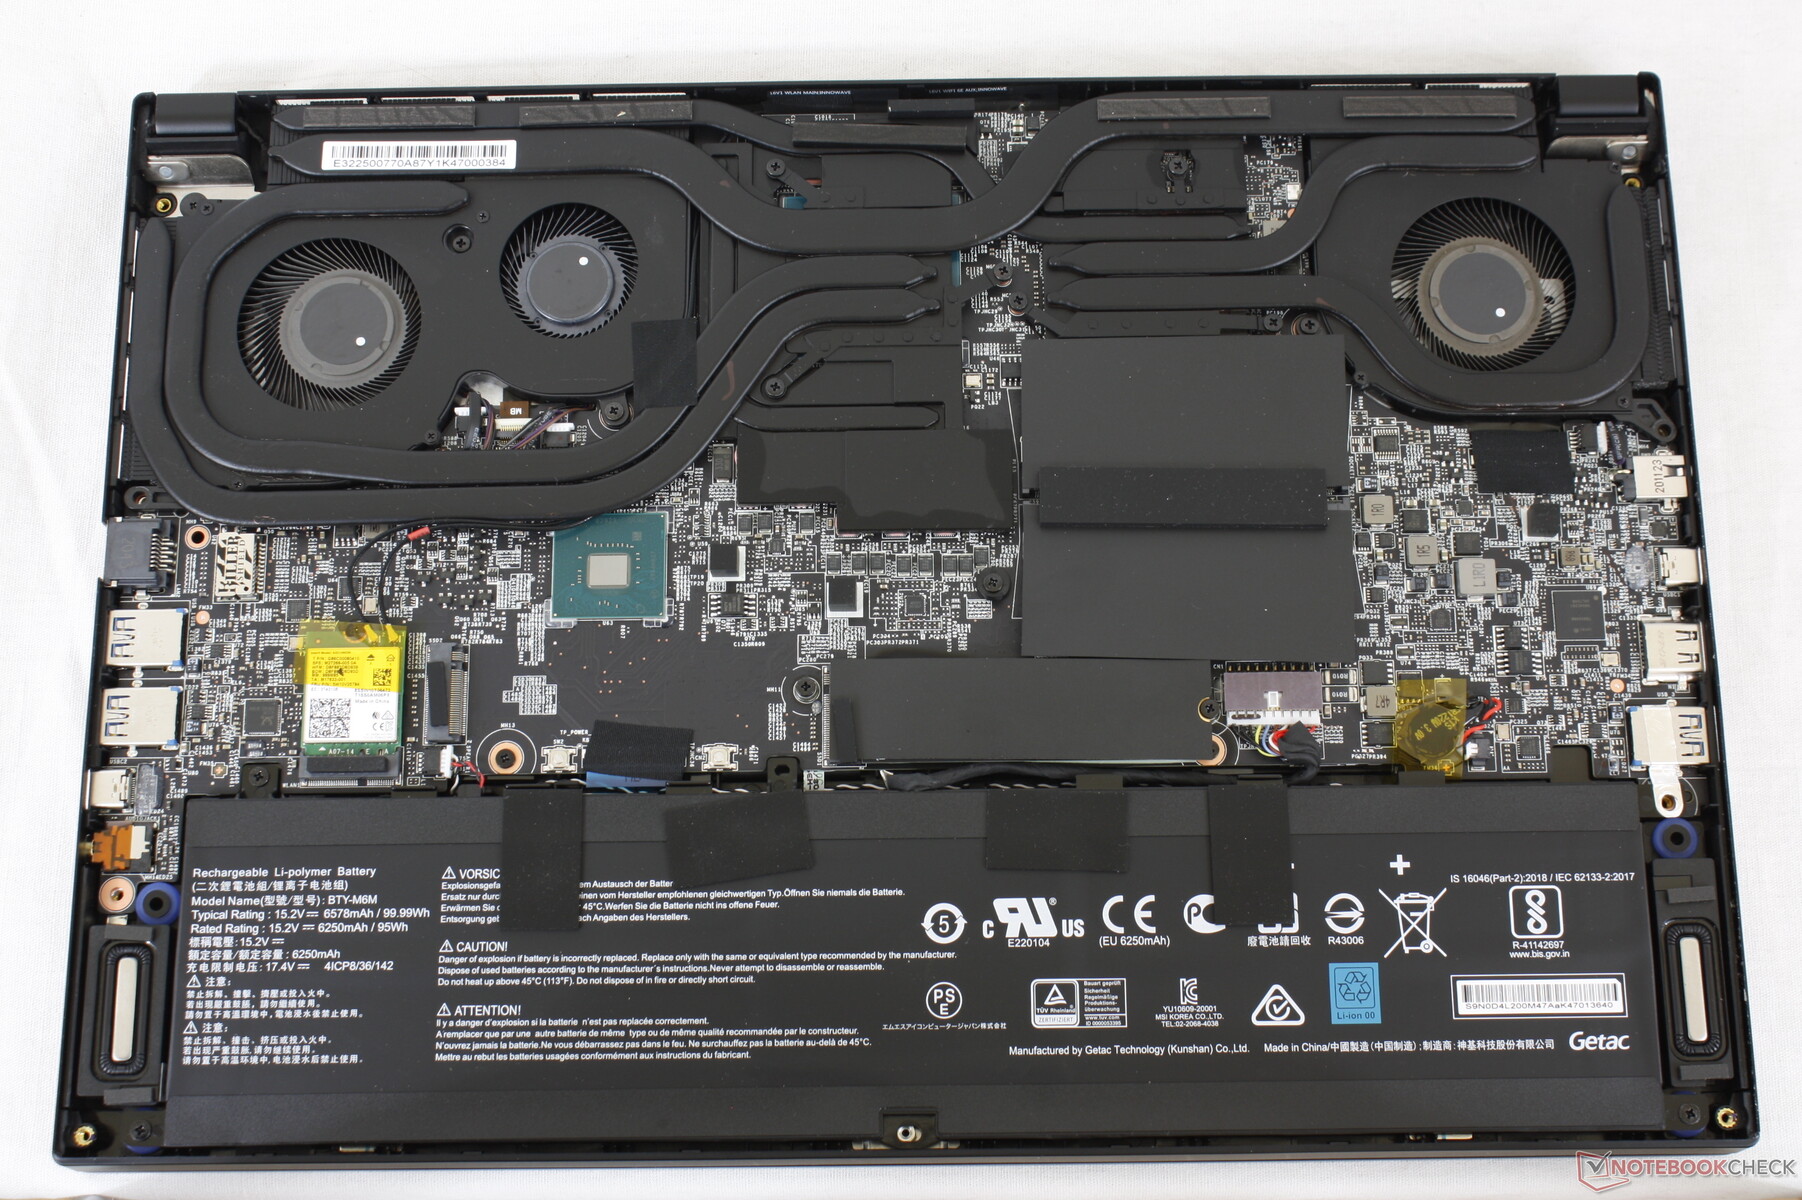
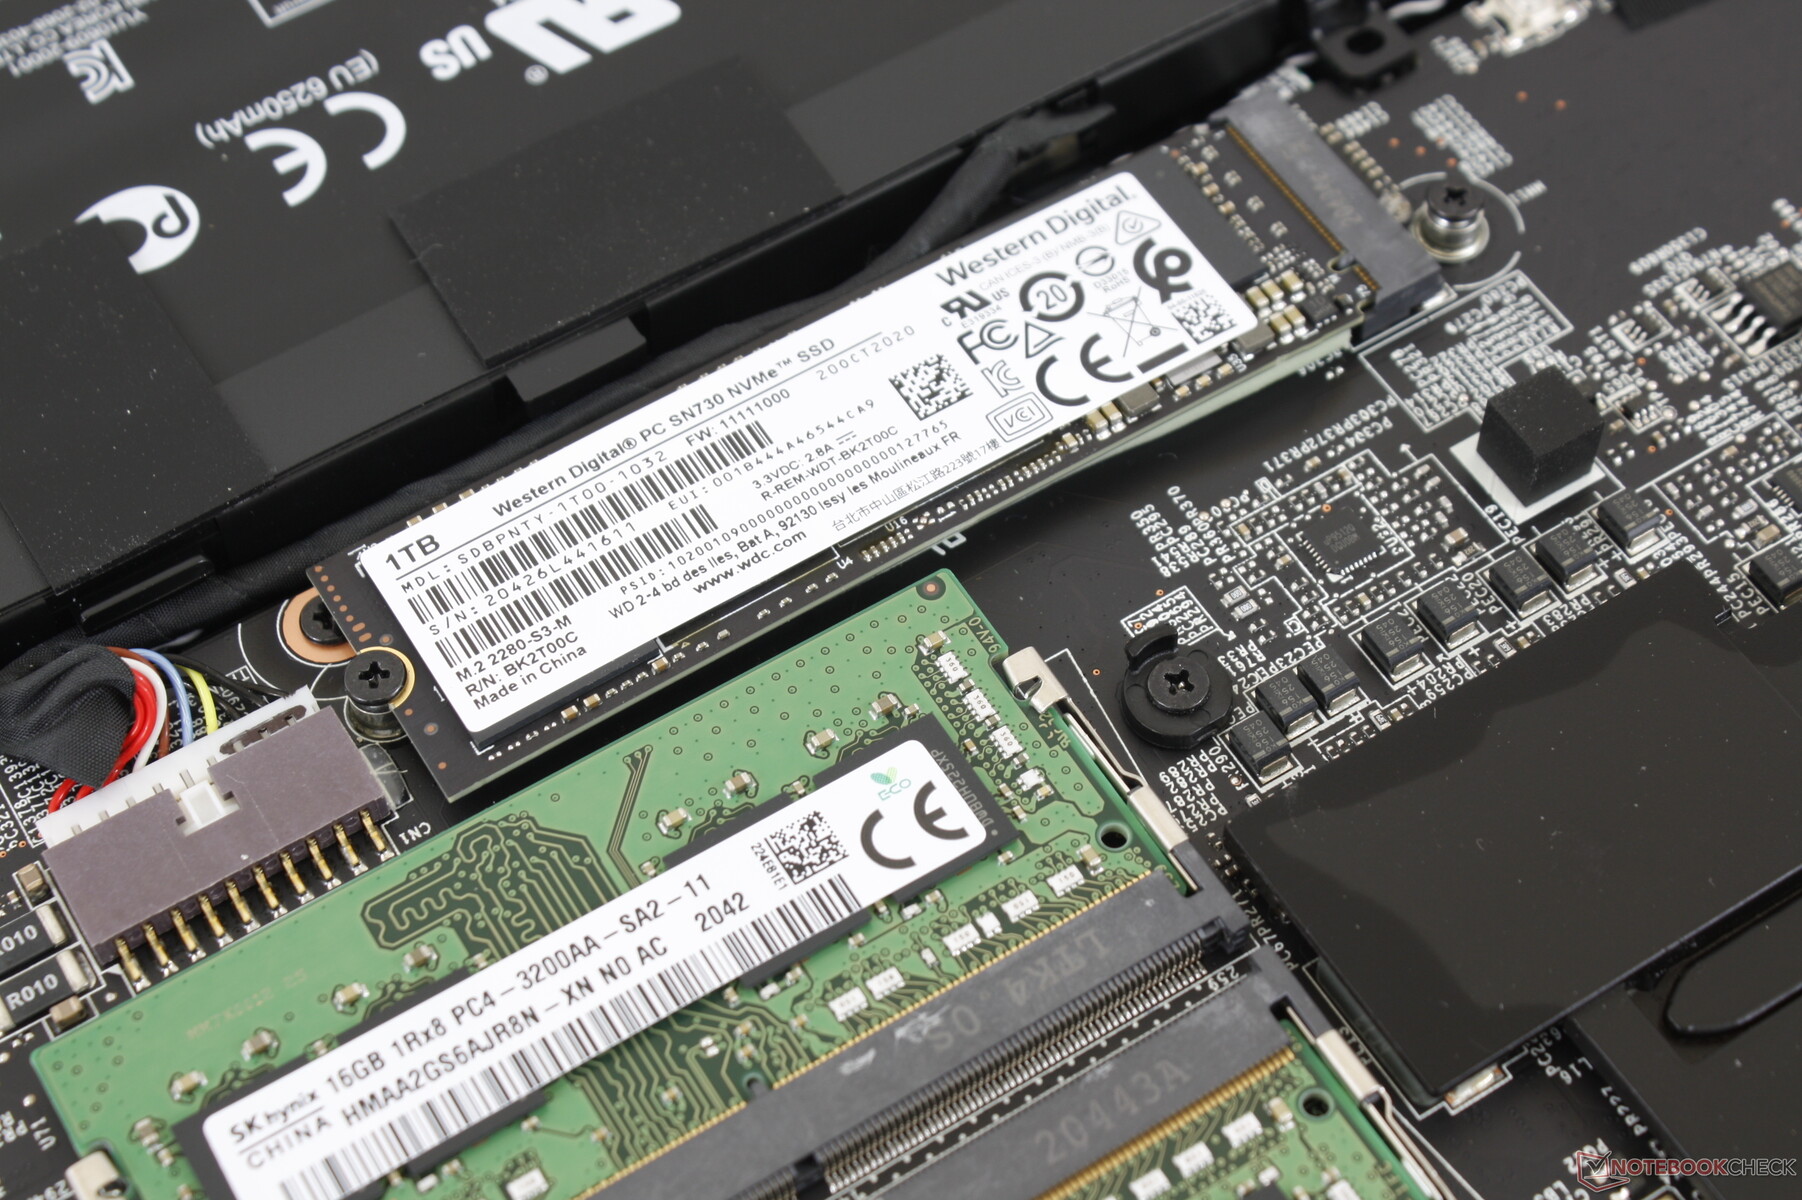
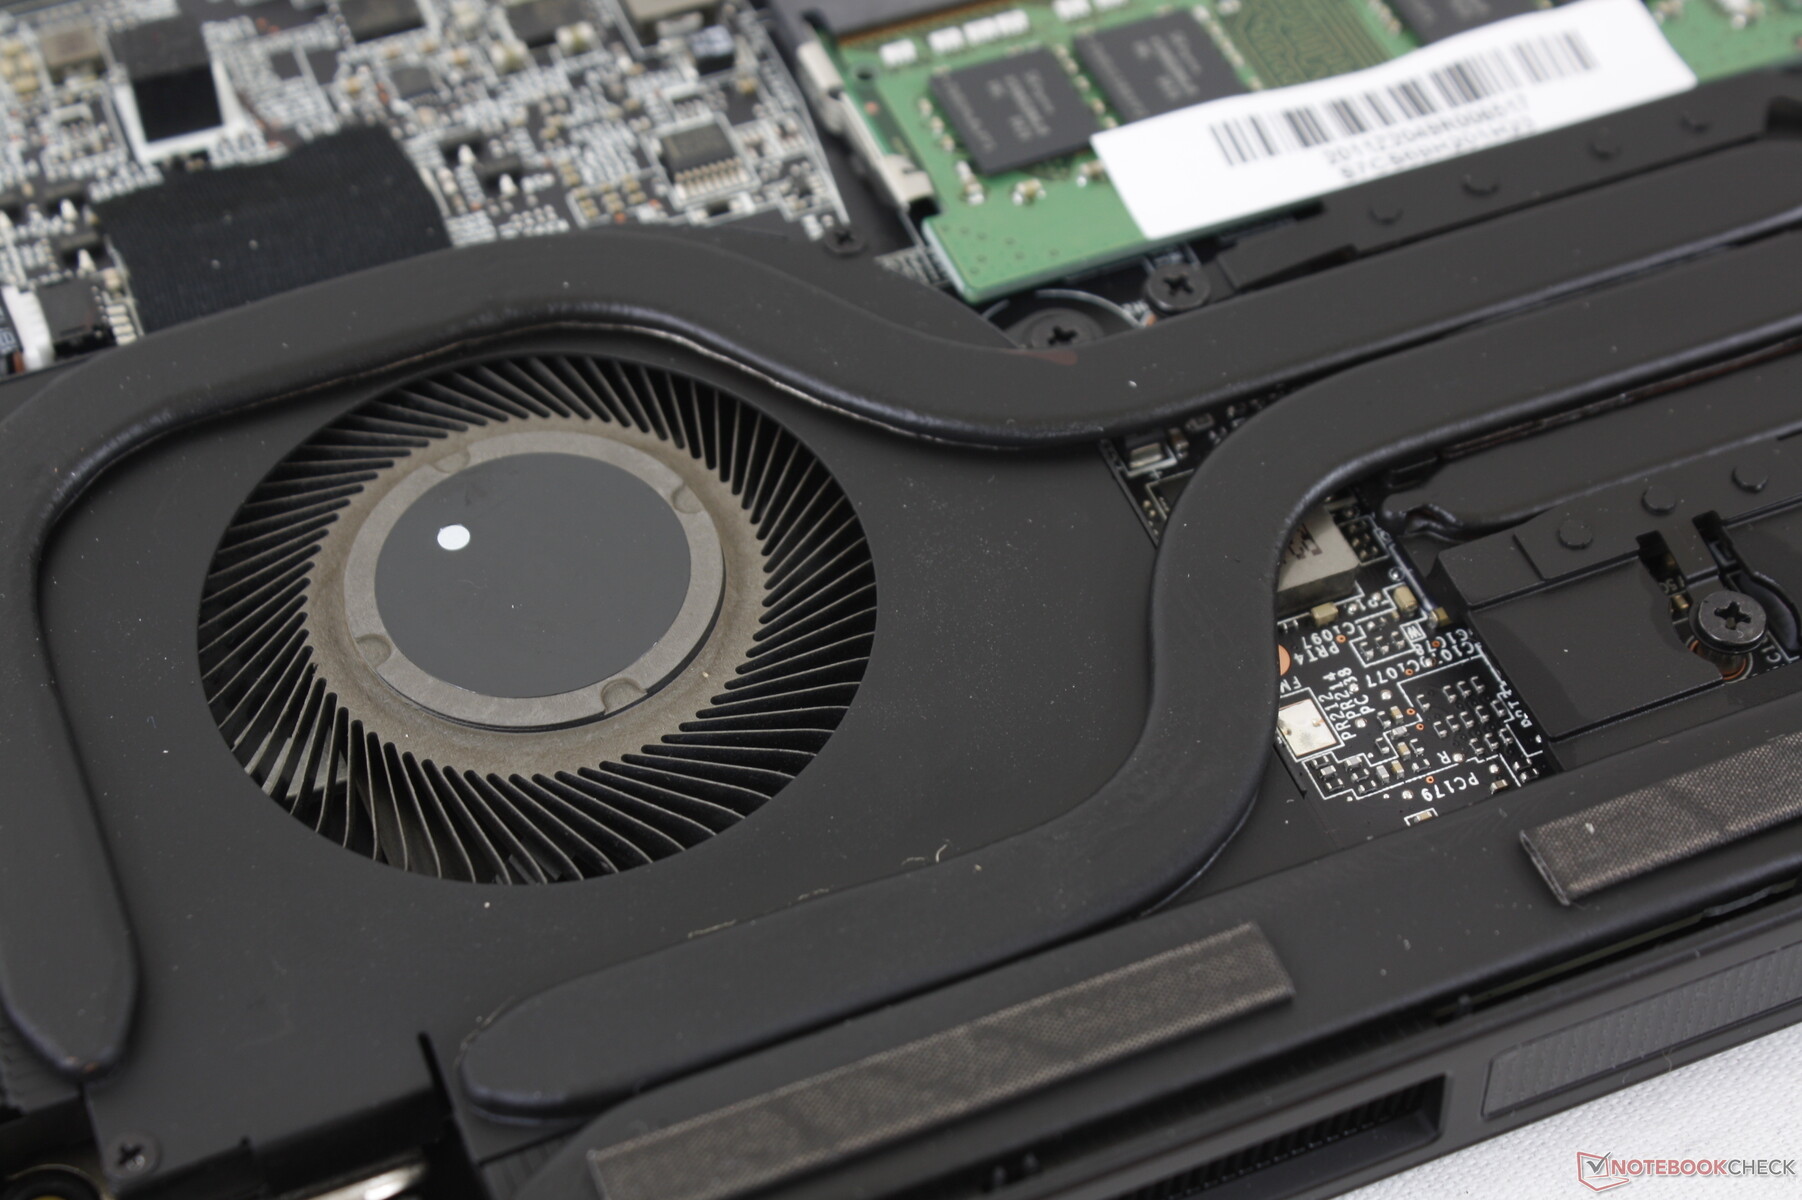
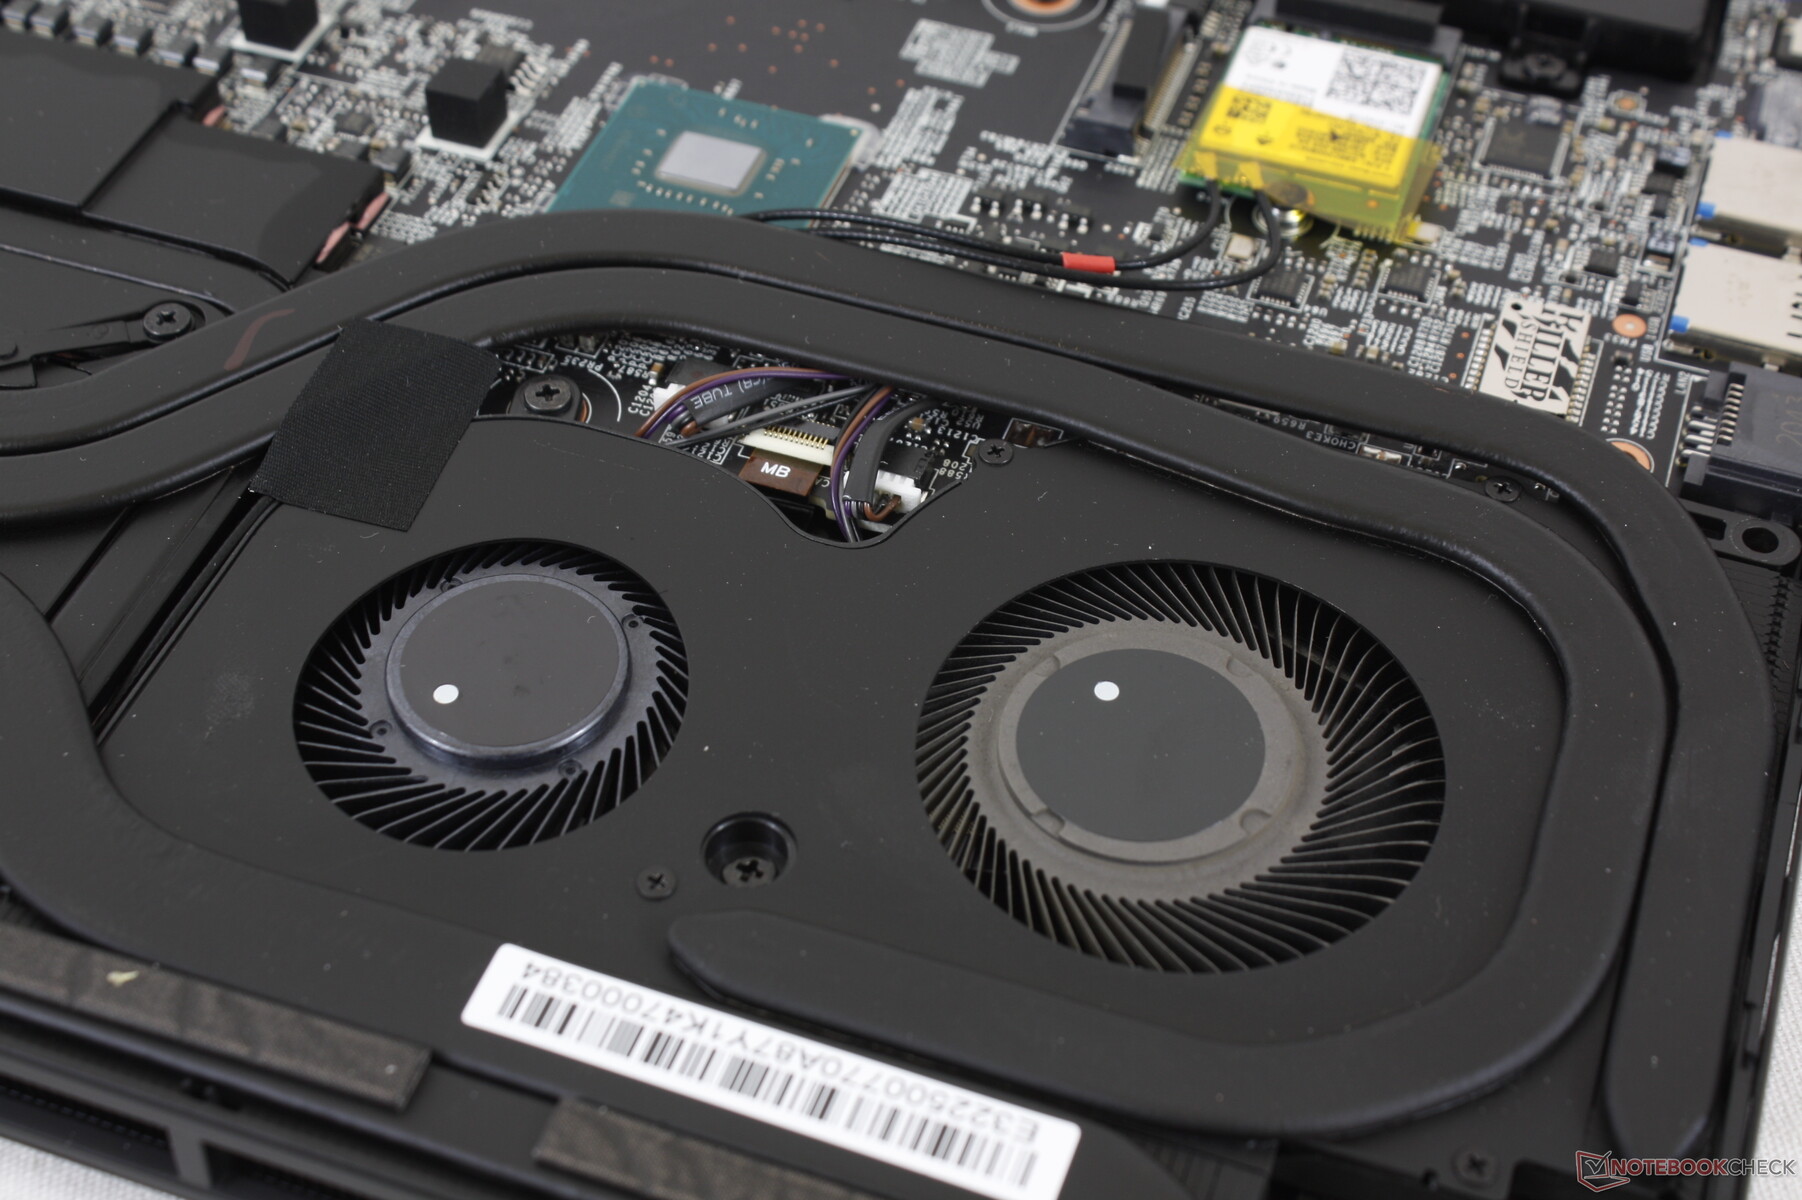
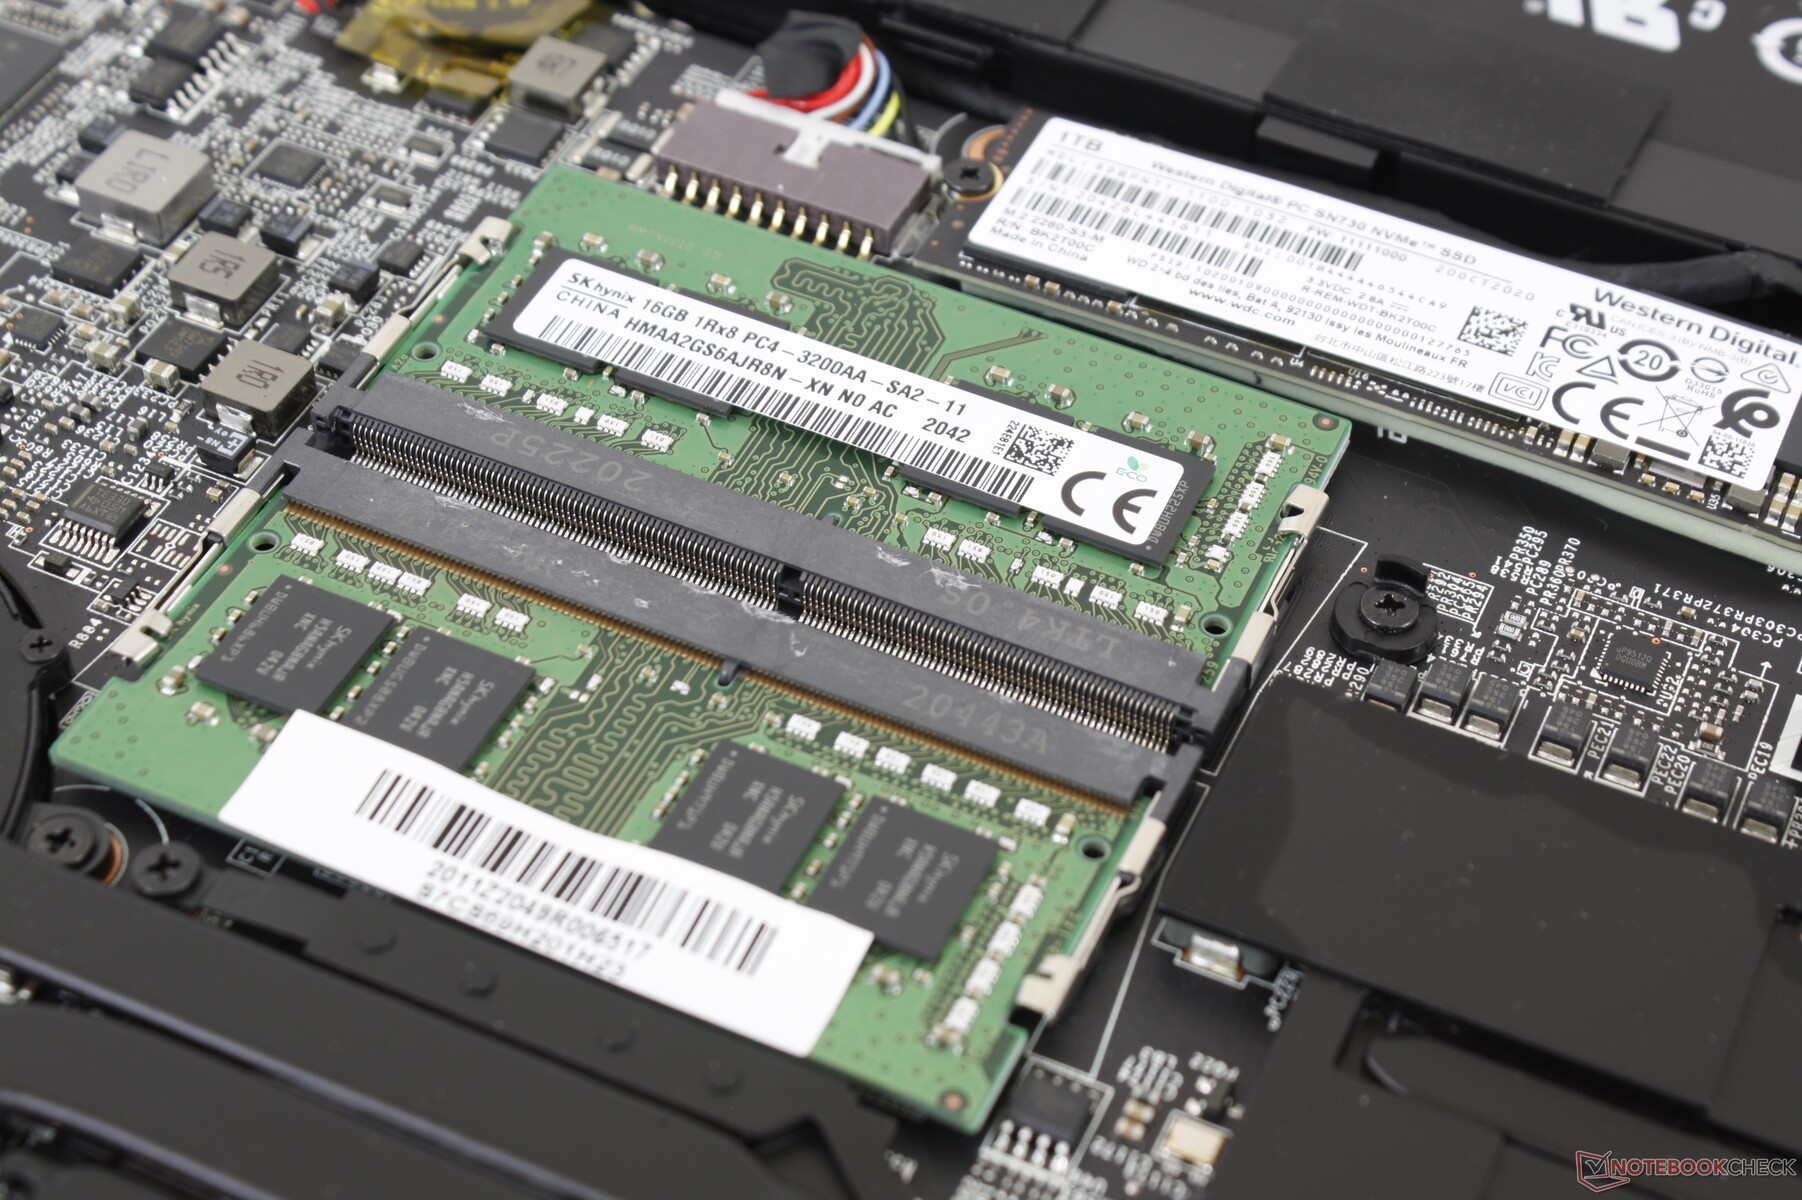
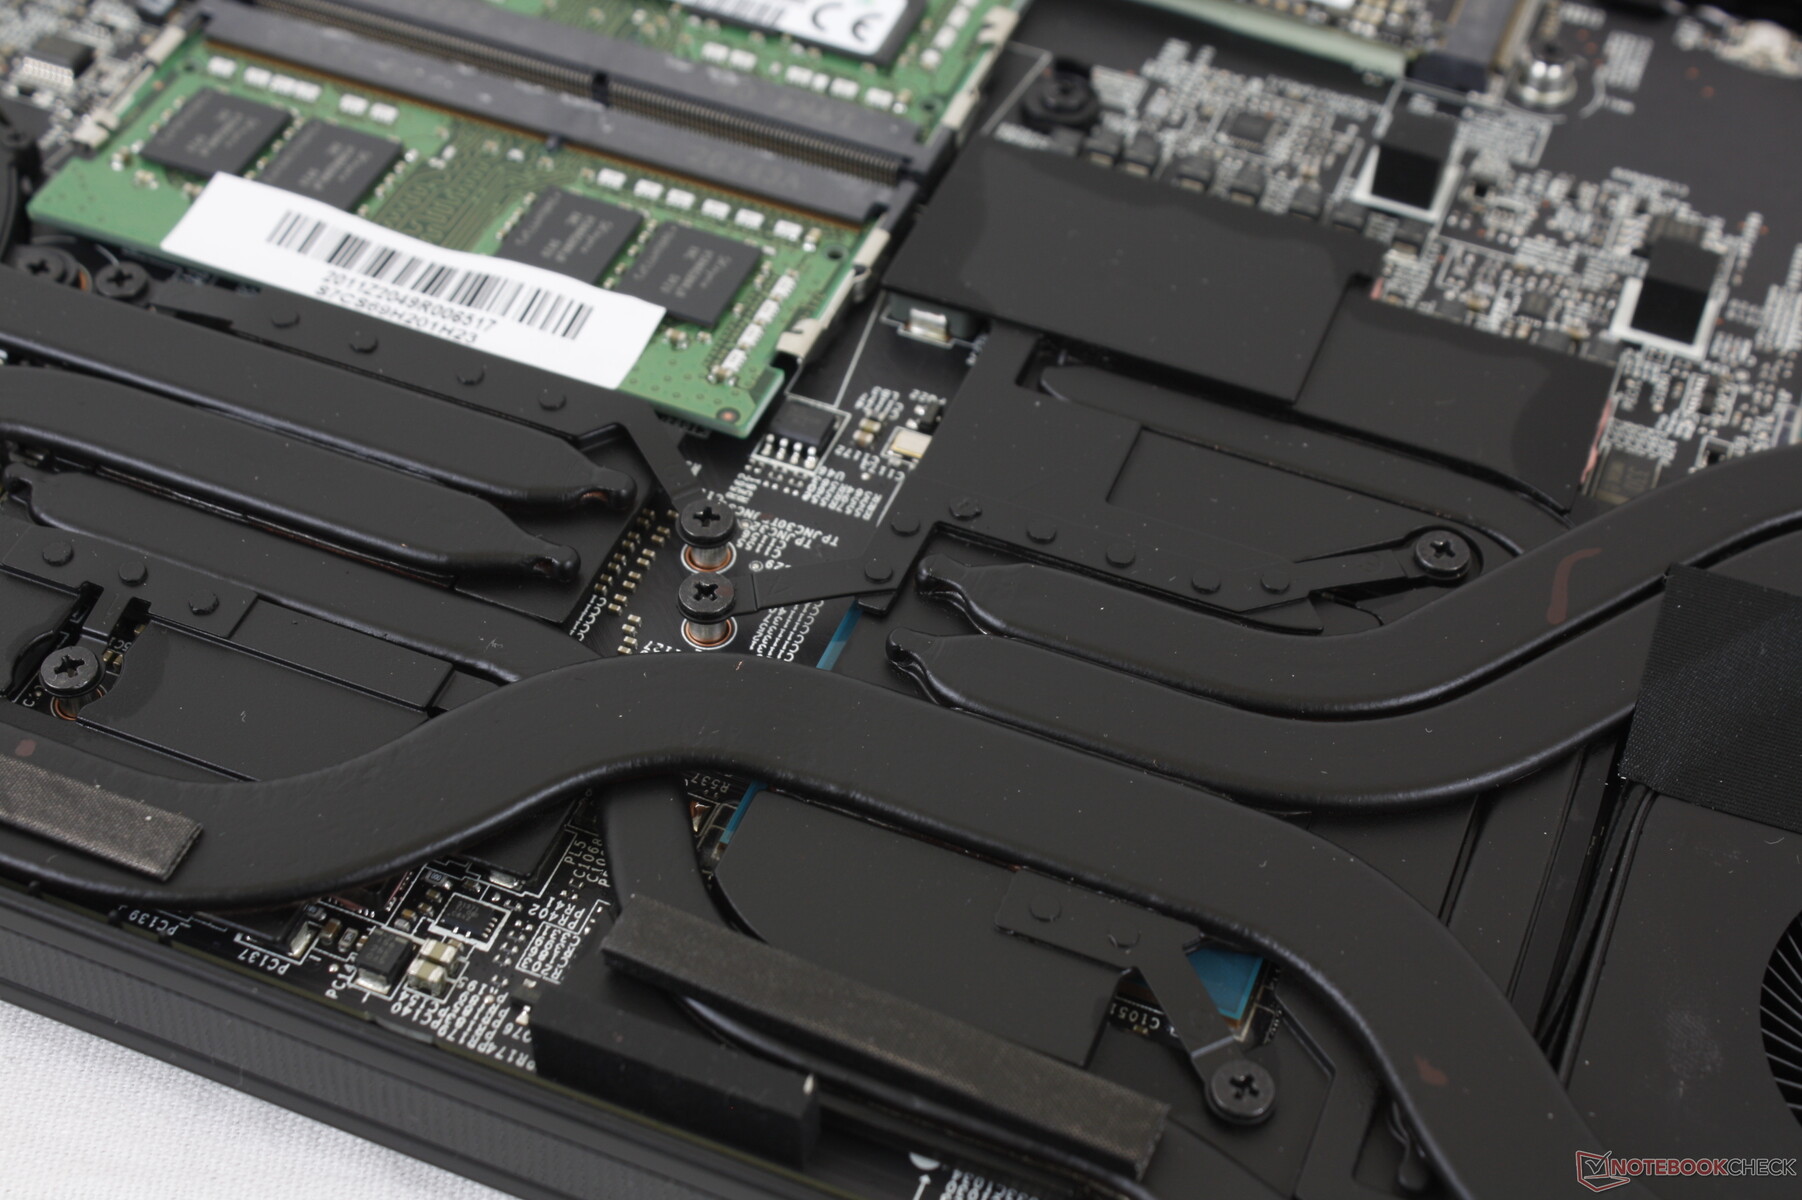
Maintenance
MSI has made no major internal changes outside of the CPU and GPU swap. The cooling solution and components appear identical to what we observed on last year's Turing-powered GS66.
Accessories and Warranty
The retail box include a large velvet cloth in addition to the usual AC adapter and manuals. The standard one-year limited warranty applies with additional options if purchased from Xotic PC.
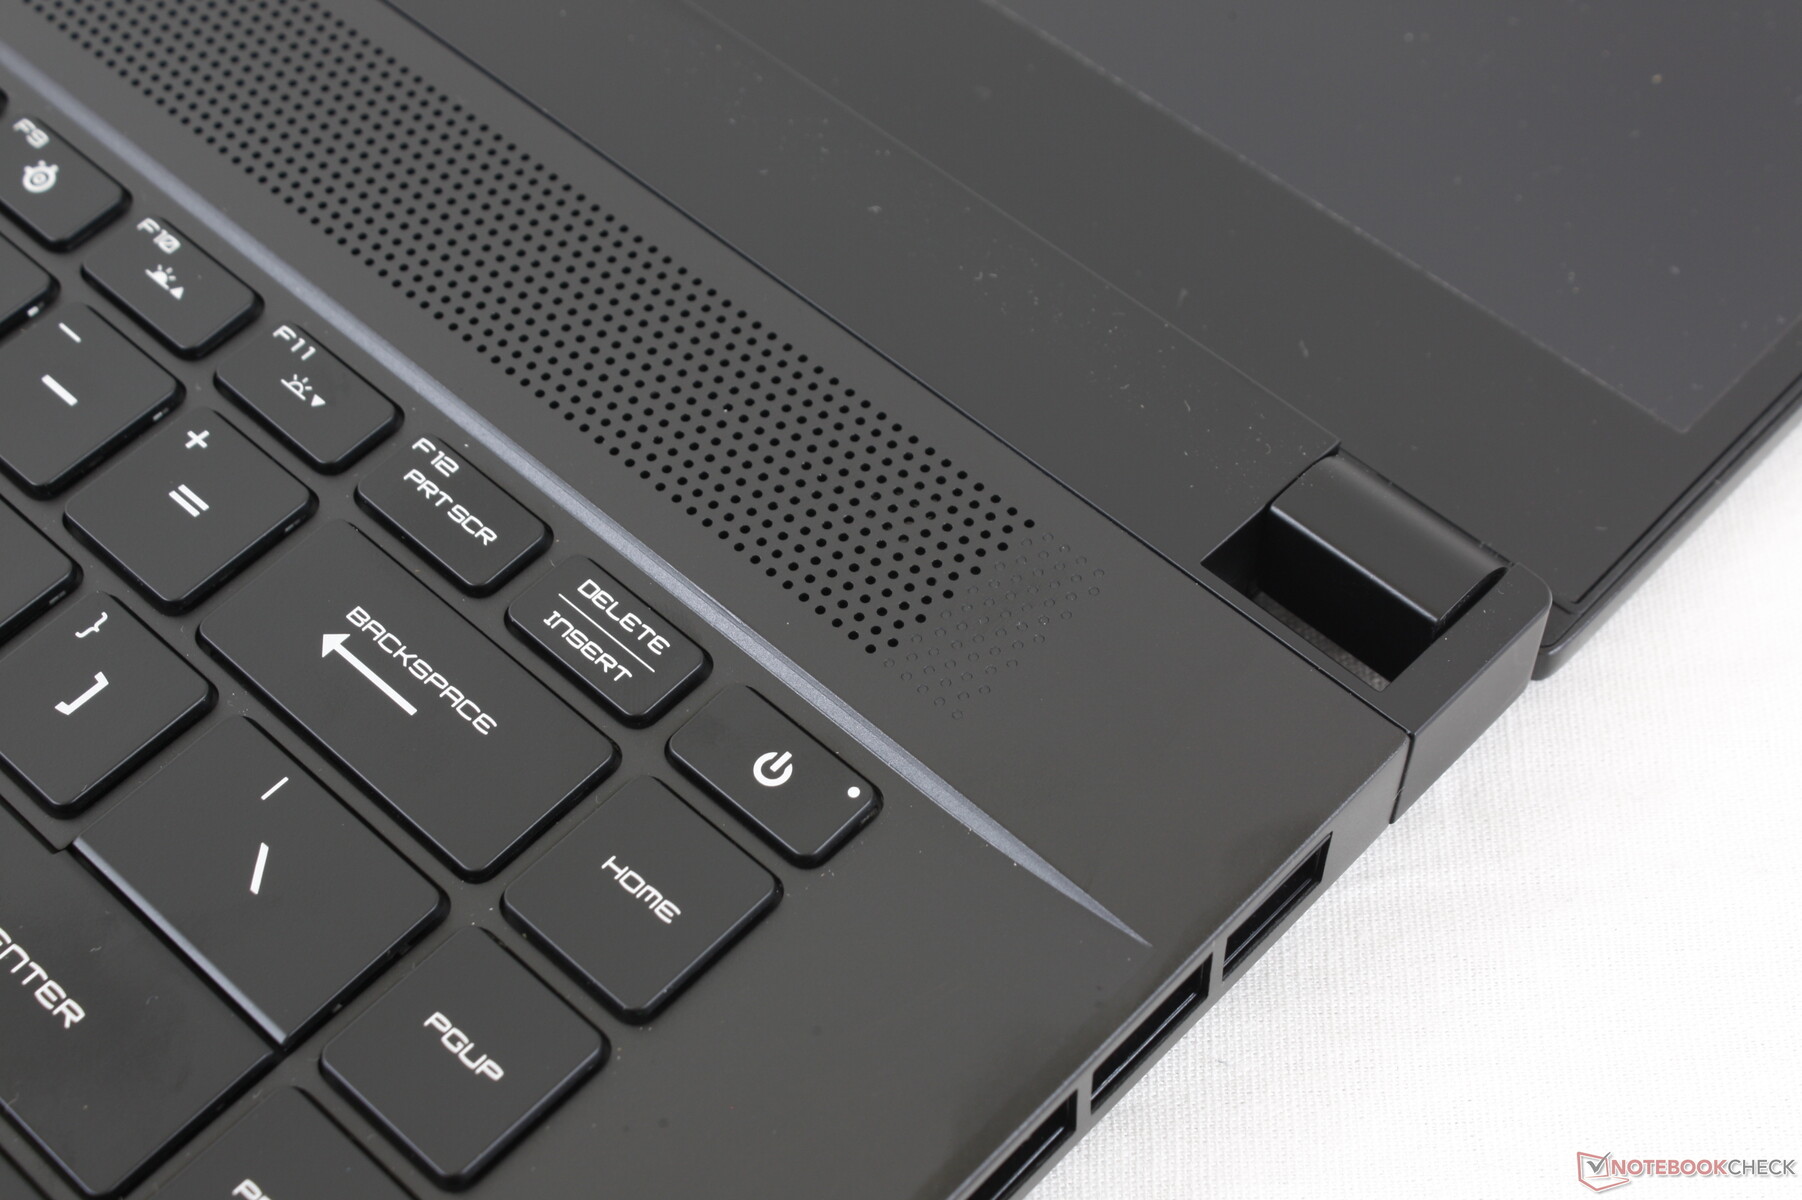
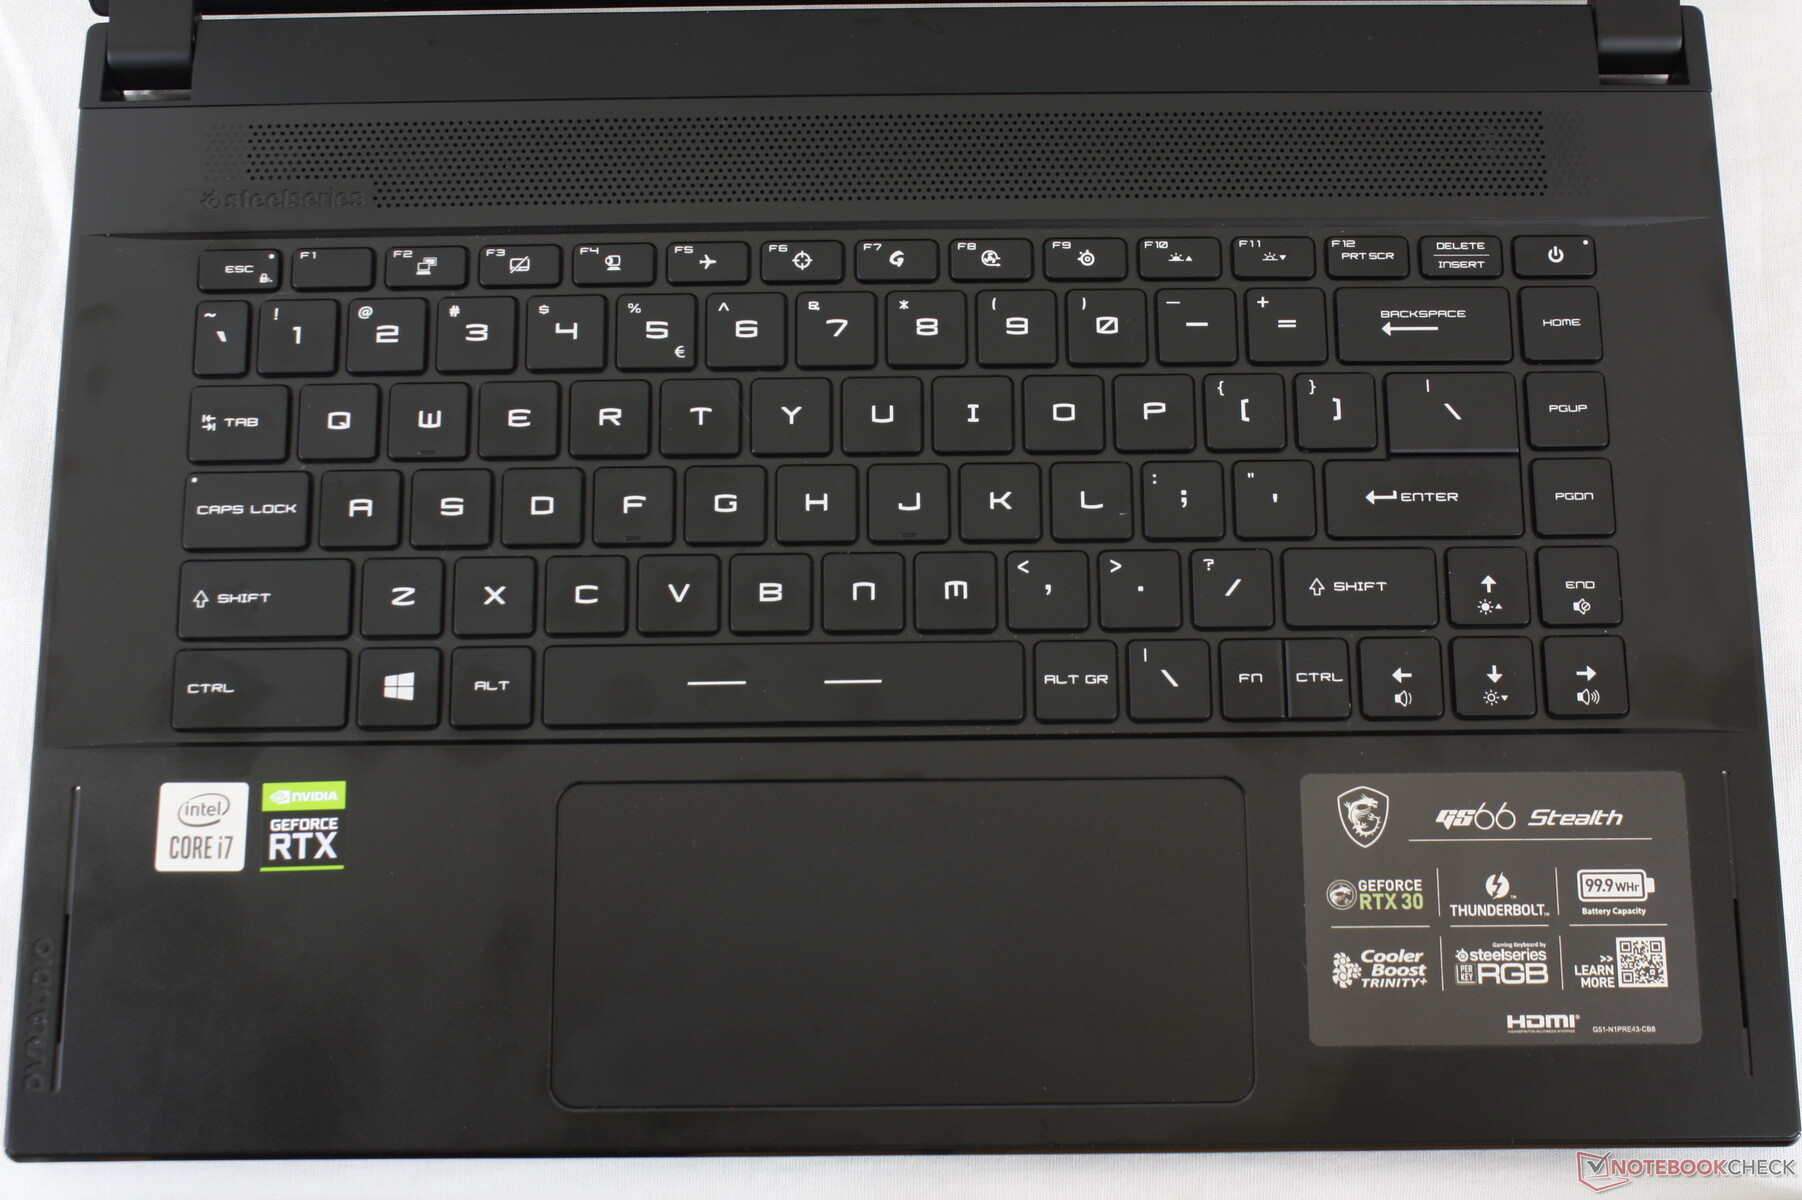
Input Devices


Display
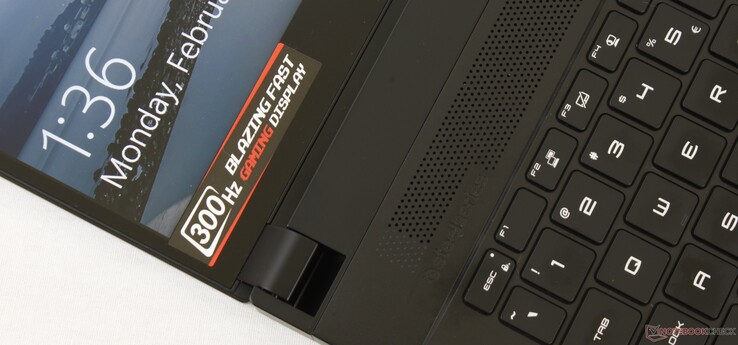
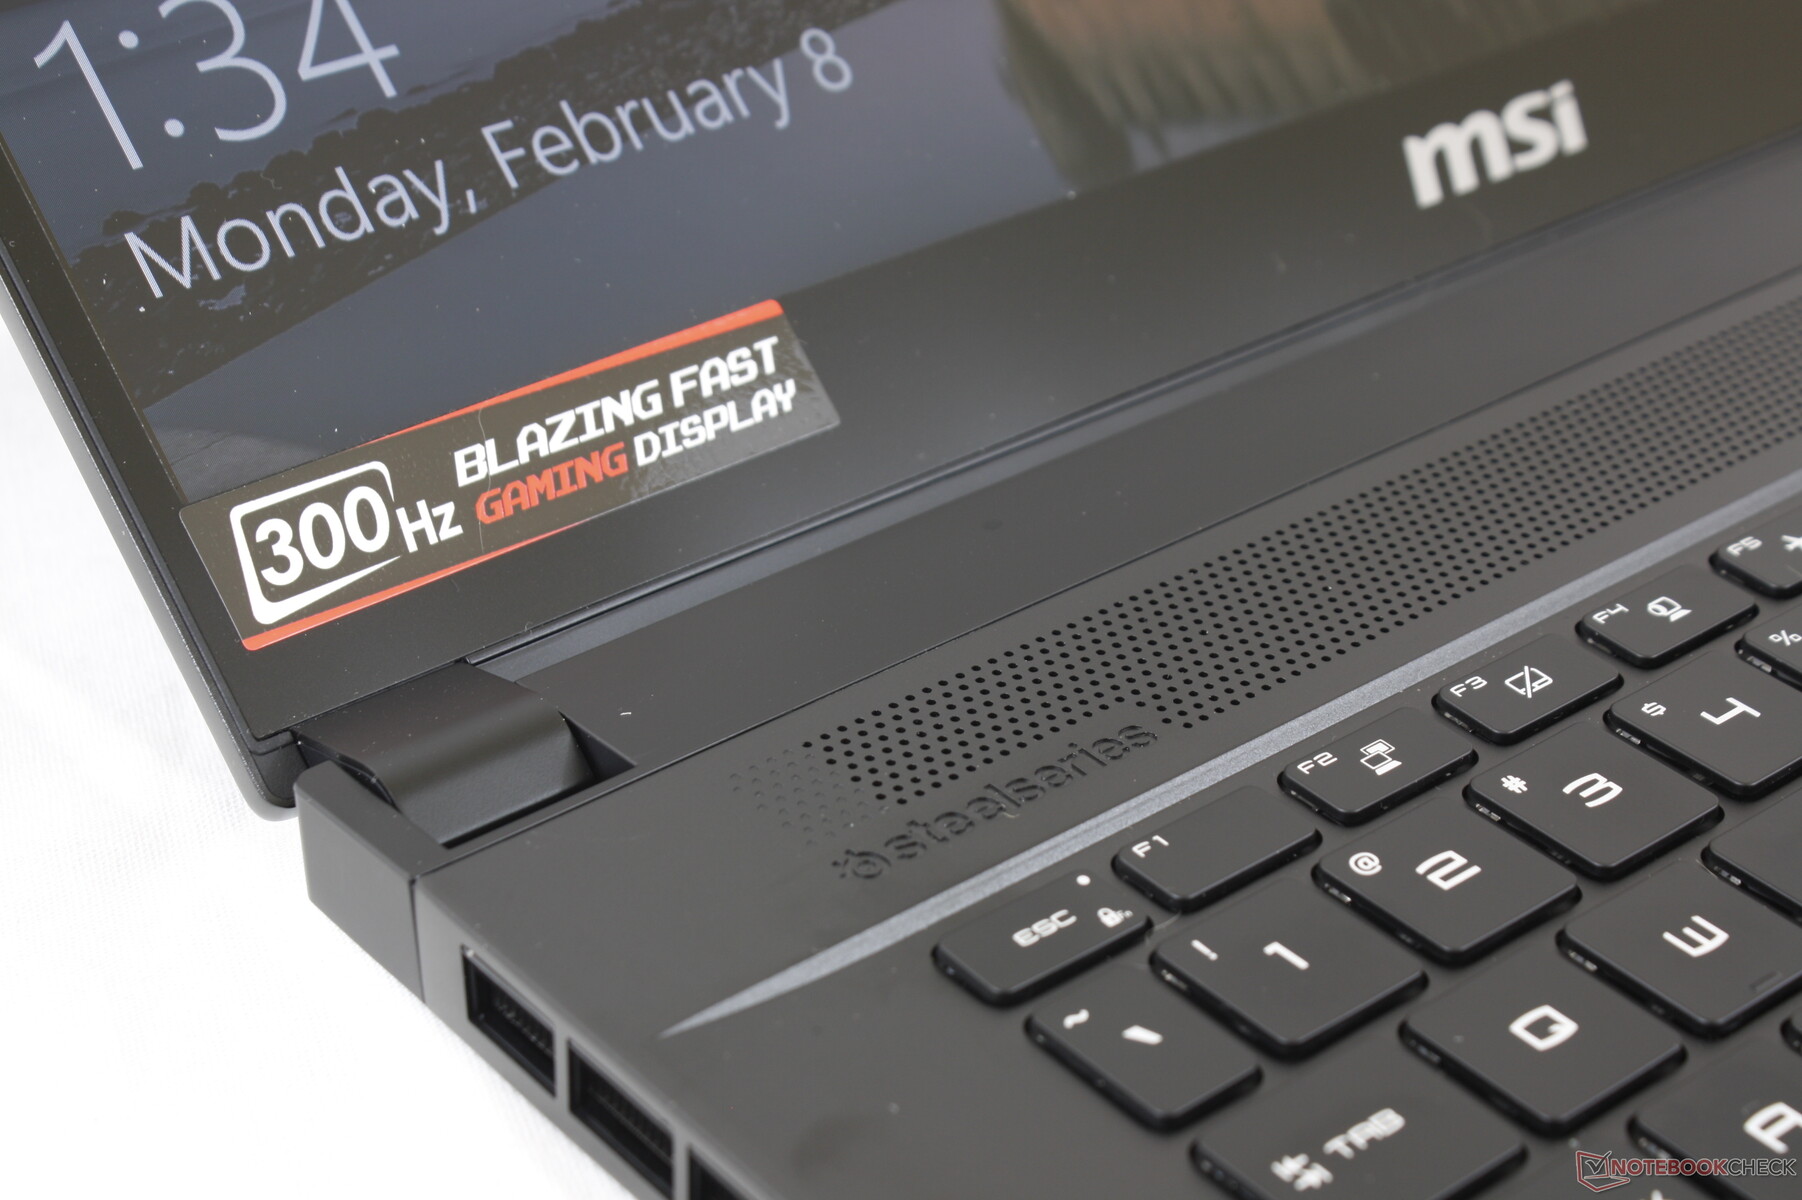
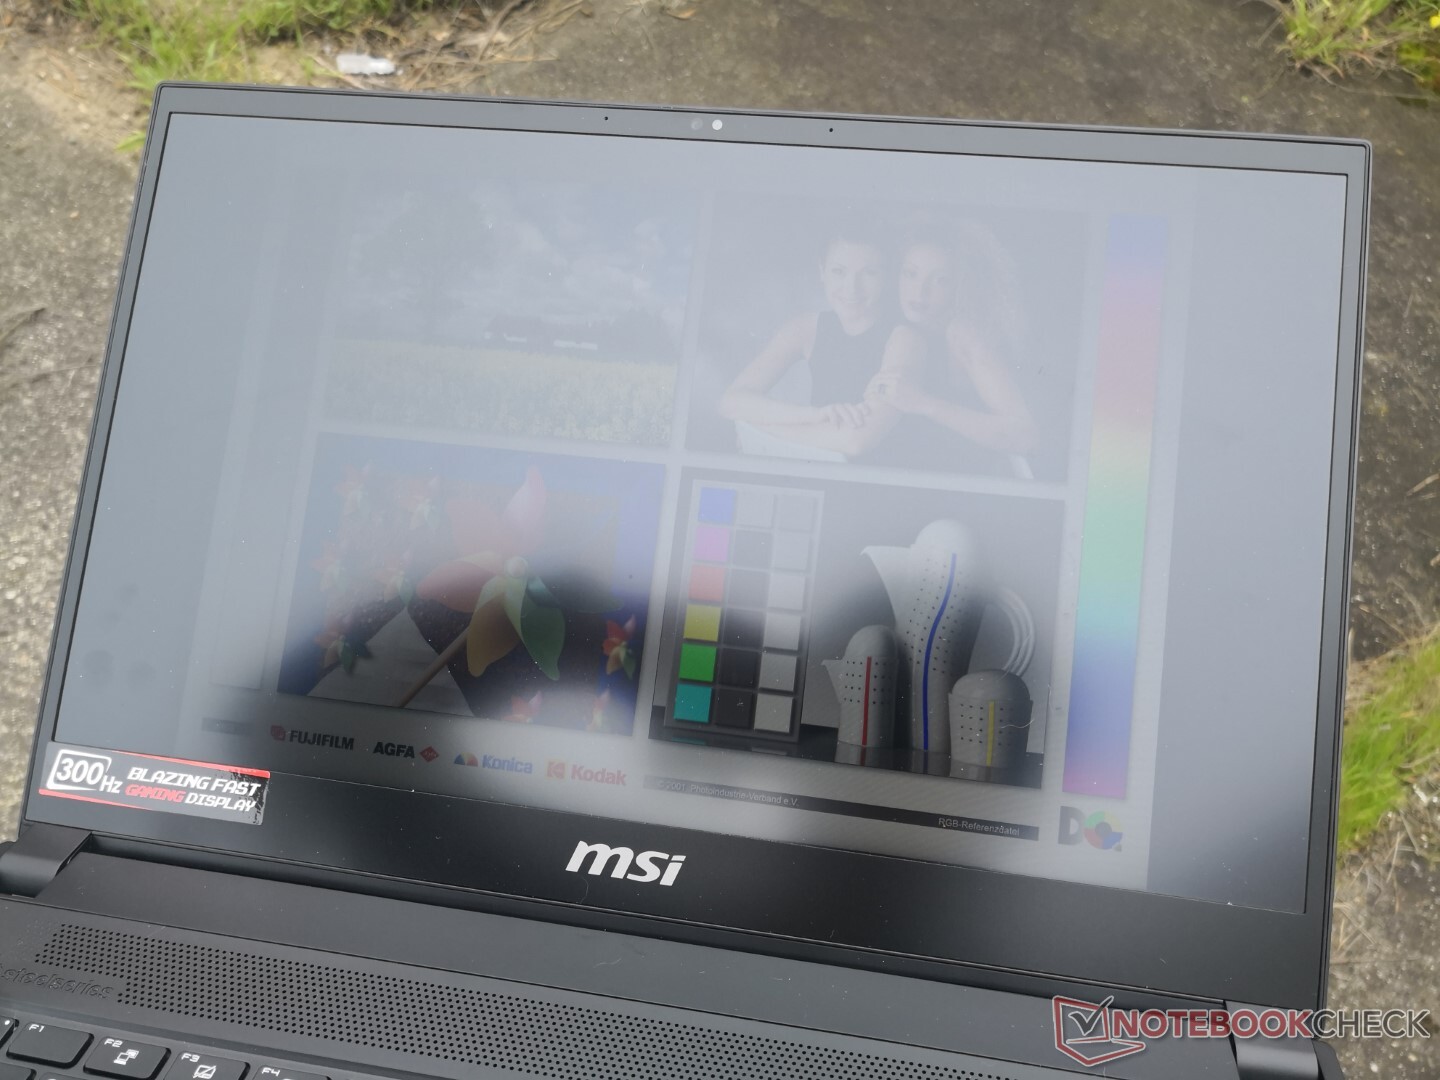
The 300 Hz AU Optronics B156HAN12.0 IPS panel on our GS66 10UG is the same one as on last year's GS66 10SGS. Strangely, however, maximum brightness is noticeably dimmer this time at just 264 nits compared to 331 nits on the older model even after double-checking. We're not sure why this is happening as we can identify no automatic brightness controls or limiters, either.
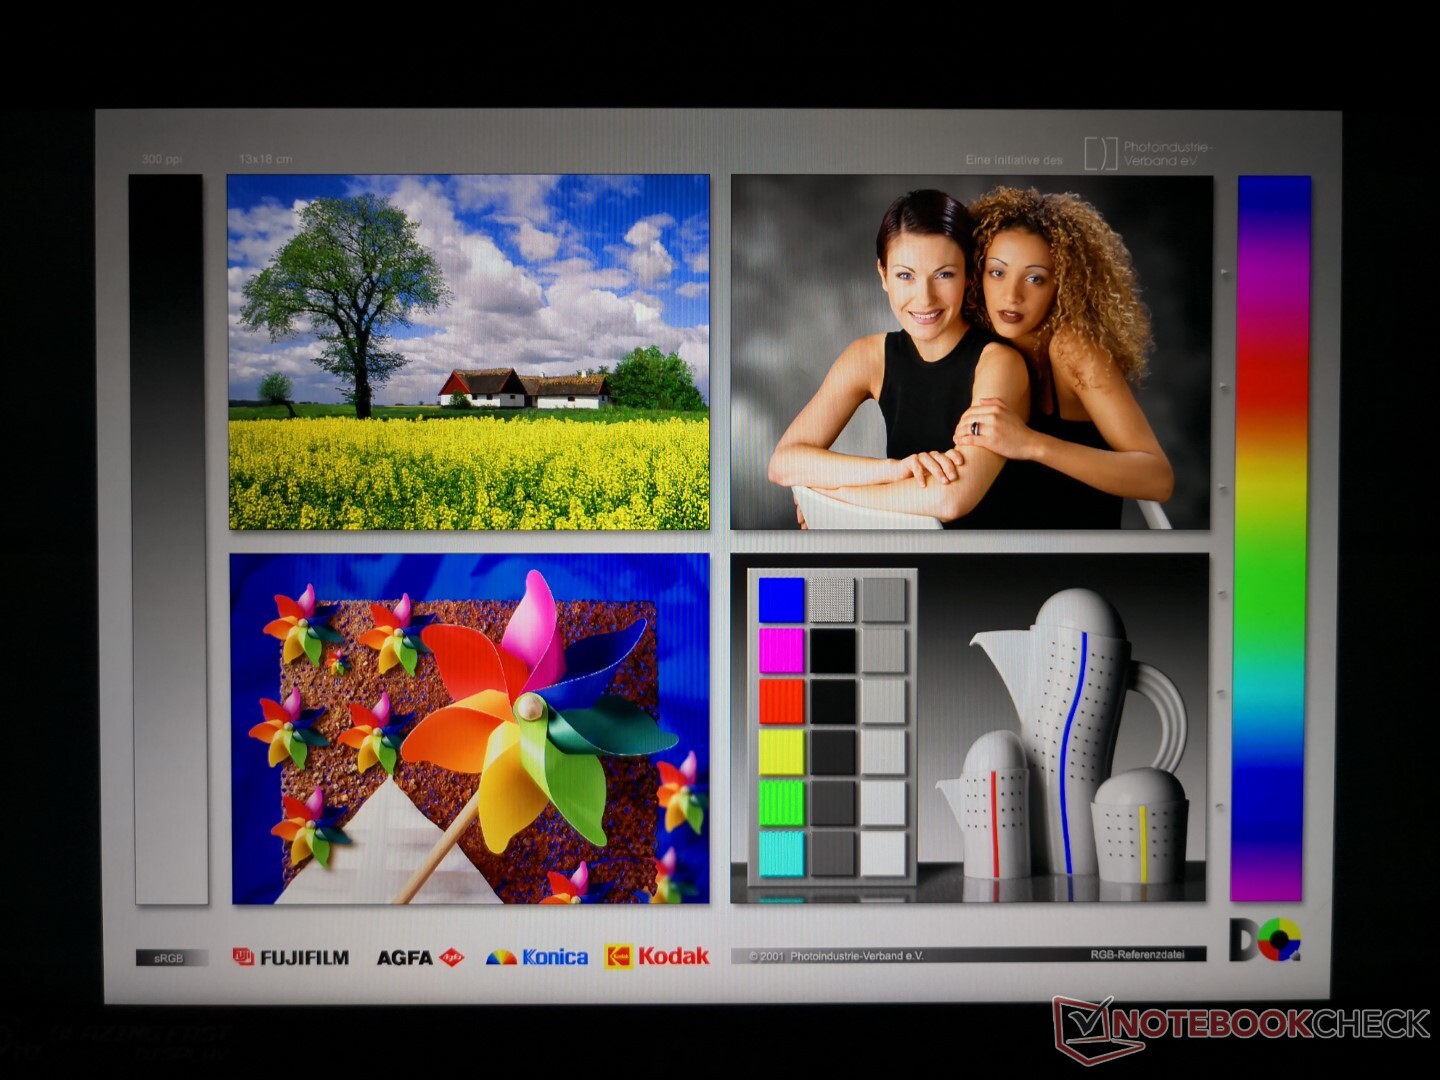
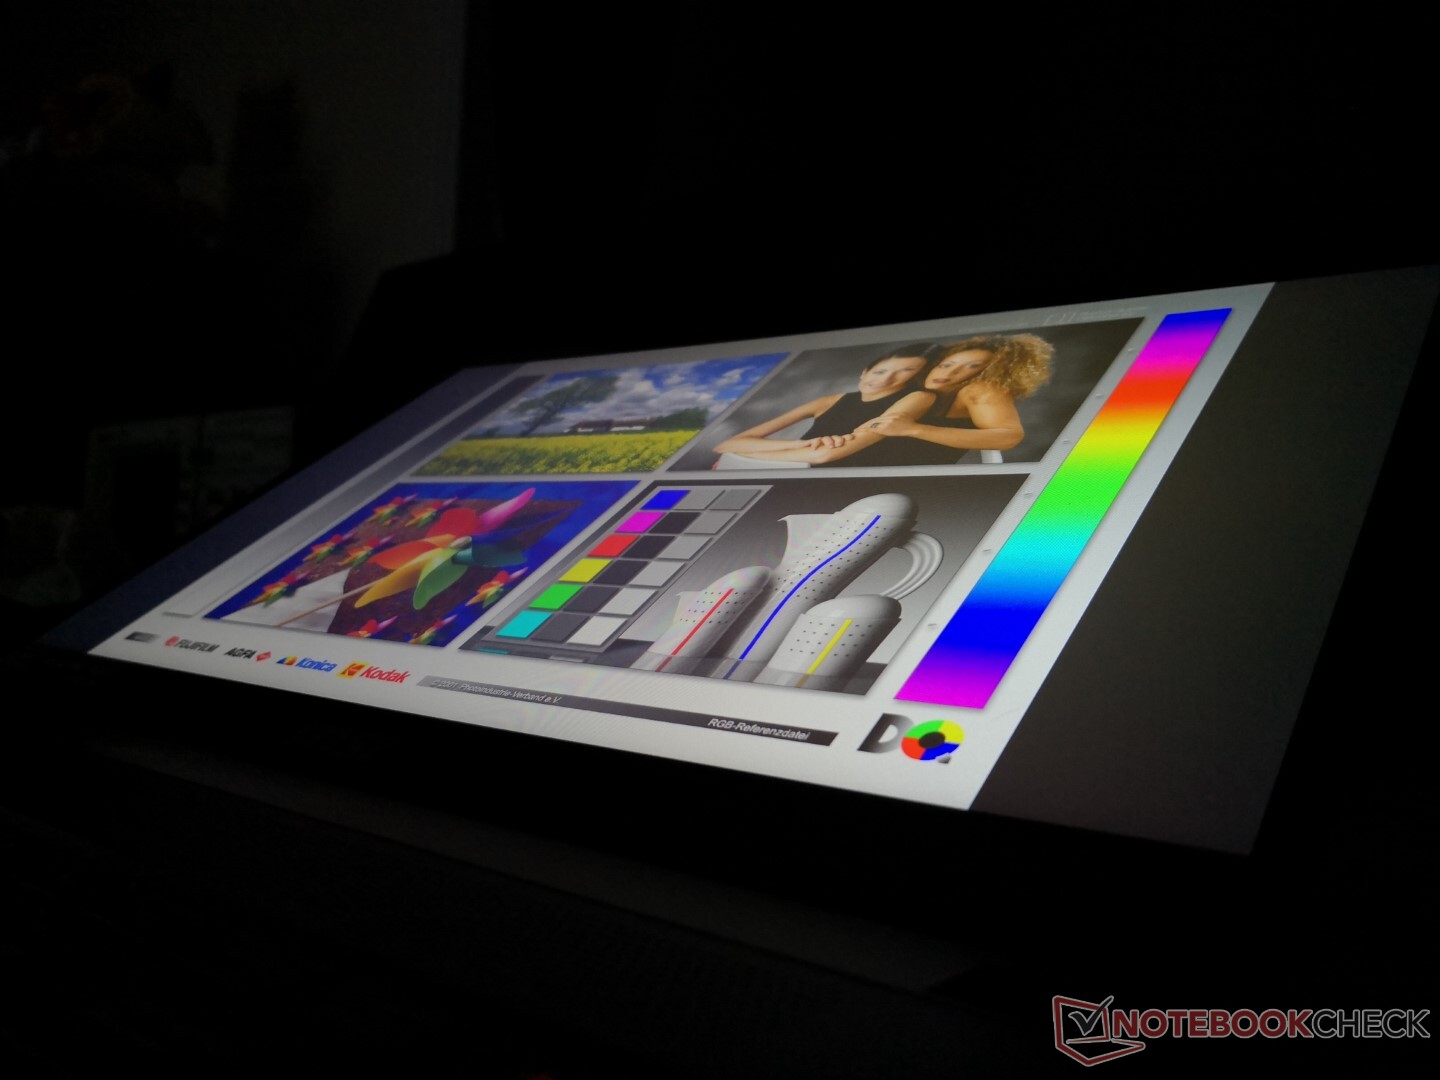
Aside from the brightness discrepancy, other characteristics of the panel remain intact including the very fast response times, >1000:1 contrast ratio, and wide color space. Users should keep in mind that the 300 Hz refresh rate is useful even if you're unlikely to ever reach such high frame rates when gaming.


| |||||||||||||||||||||||||
Brightness Distribution: 90 %
Center on Battery: 259.5 cd/m²
Contrast: 1038:1 (Black: 0.25 cd/m²)
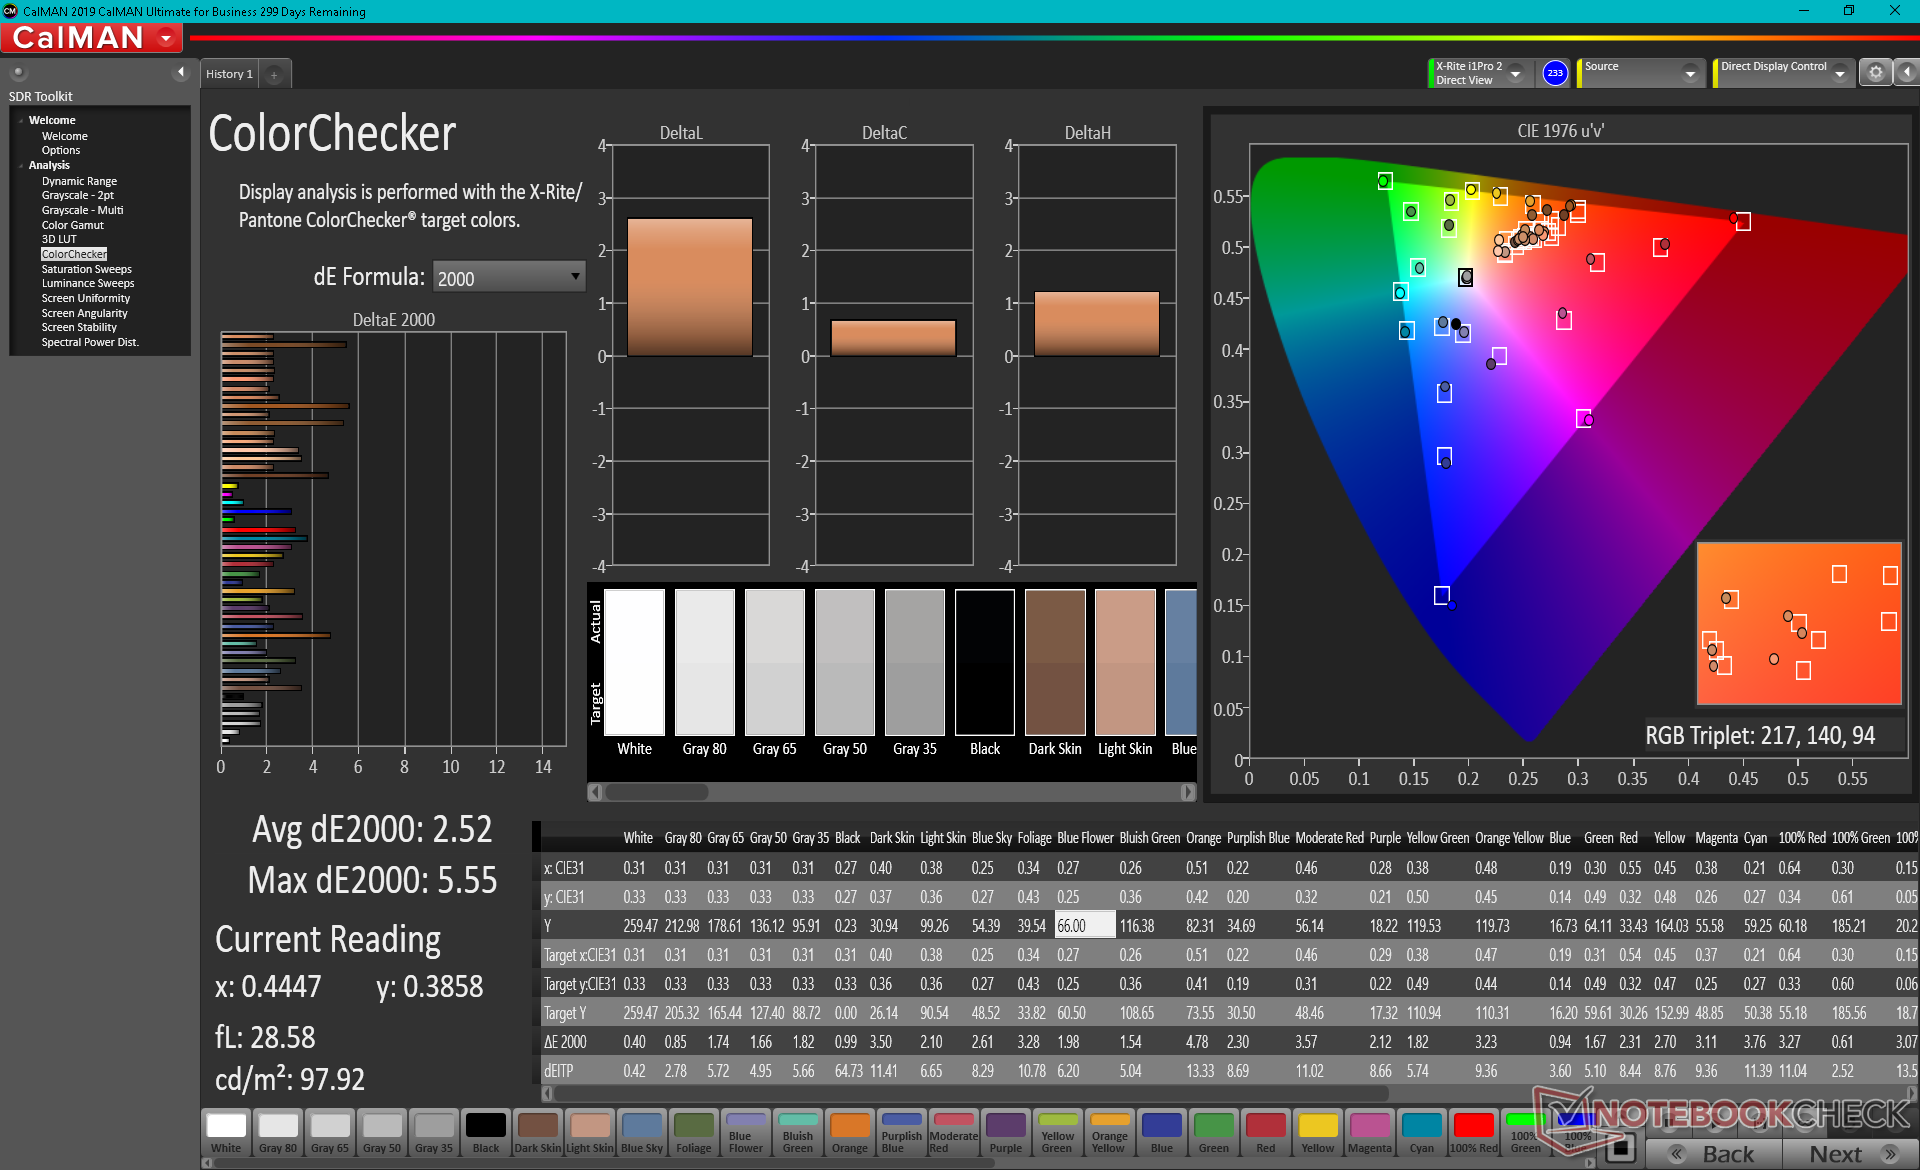
ΔE ColorChecker Calman: 2.52 | ∀{0.5-29.43 Ø4.75}
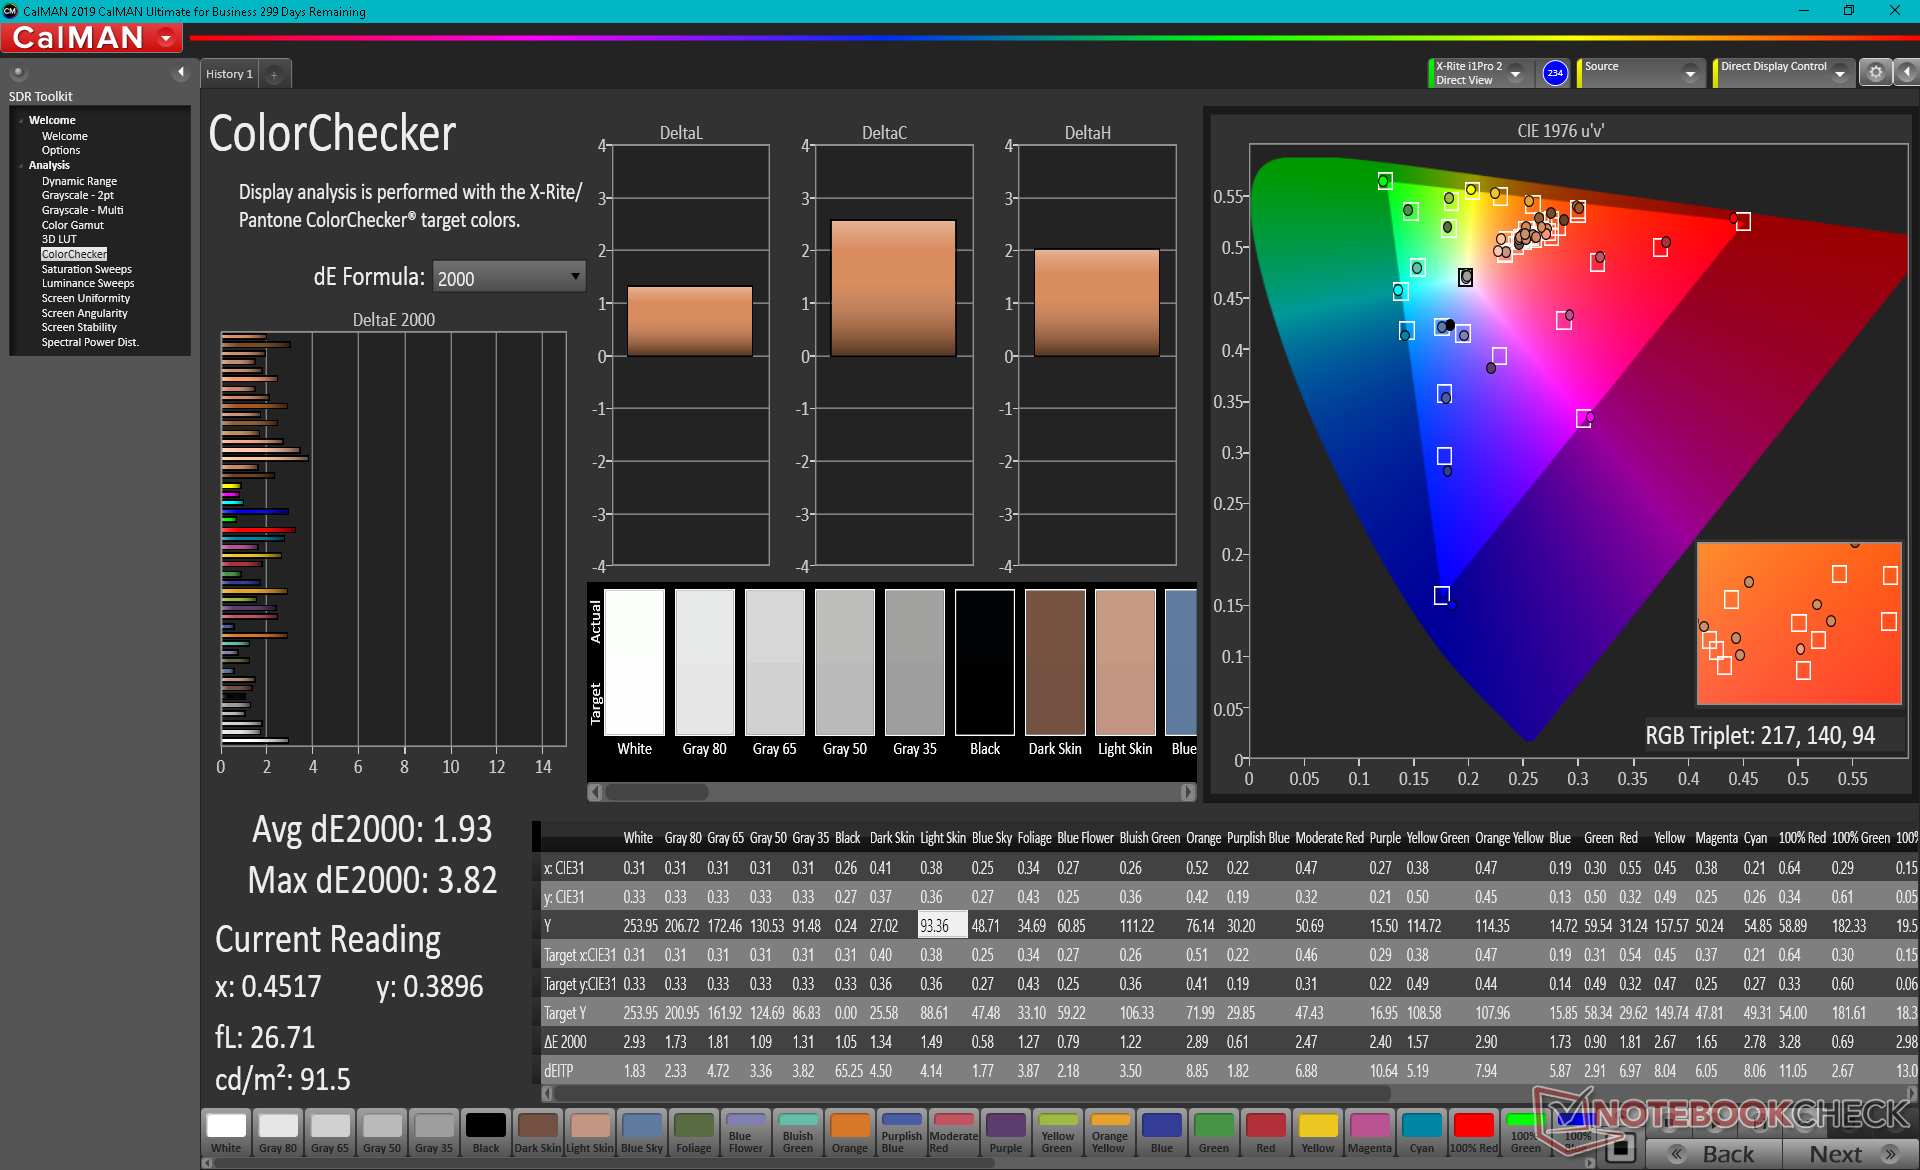
calibrated: 1.93
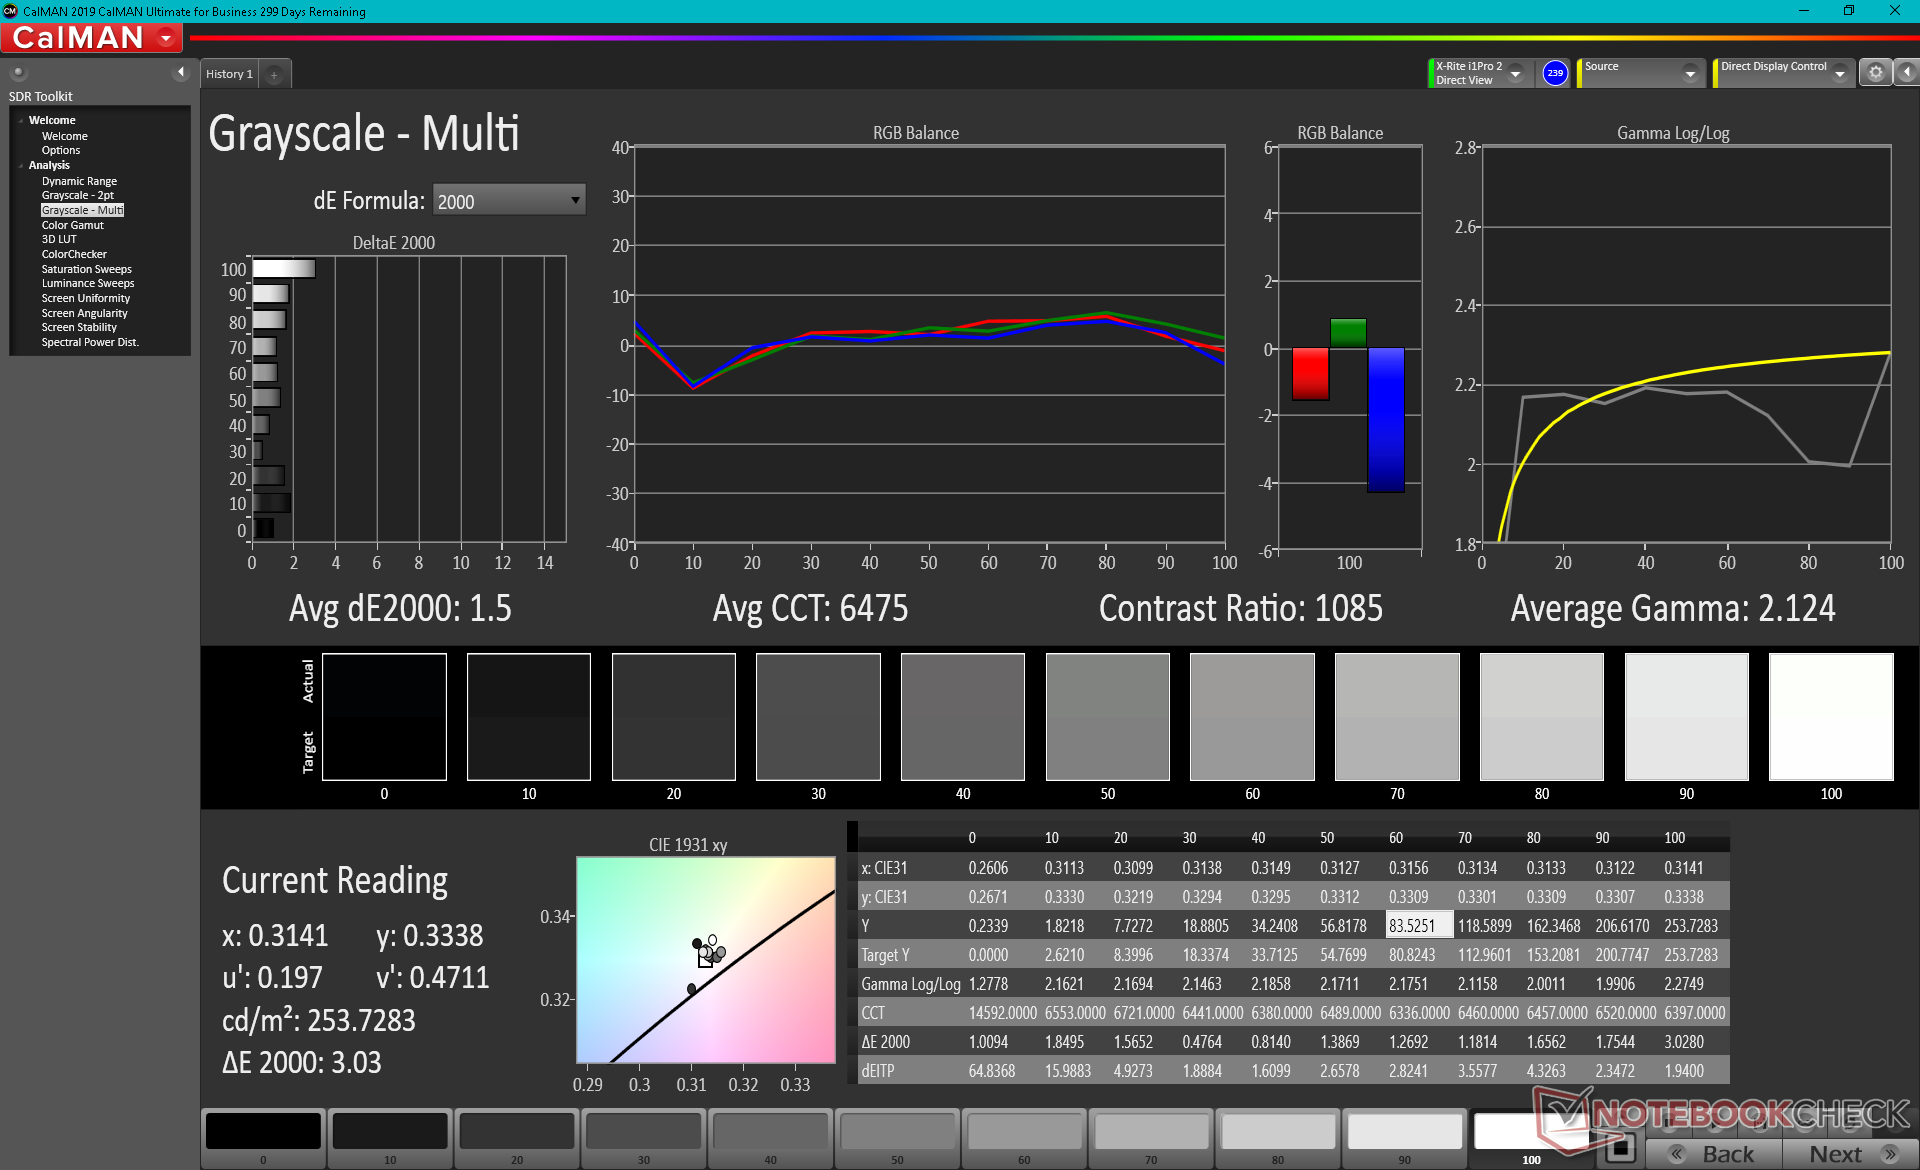
ΔE Greyscale Calman: 1.7 | ∀{0.09-98 Ø5}
98.8% sRGB (Argyll 1.6.3 3D)
63.3% AdobeRGB 1998 (Argyll 1.6.3 3D)
69.1% AdobeRGB 1998 (Argyll 3D)
98.4% sRGB (Argyll 3D)
67.7% Display P3 (Argyll 3D)
Gamma: 2.04
CCT: 6414 K
| MSI GS66 Stealth 10UG AU Optronics B156HAN12.0, IPS, 15.6", 1920x1080 | MSI GS66 10SGS AU Optronics B156HAN12.0, IPS, 15.6", 1920x1080 | Asus TUF Dash F15 FX516PR LQ156M1JW26 (SHP1532), IPS, 15.6", 1920x1080 | Razer Blade 15 RTX 2070 Super Max-Q AU Optronics B156HAN12.0, IPS, 15.6", 1920x1080 | Aorus 15P WB BOE HF NV156FHM-N4G, IPS, 15.6", 1920x1080 | Alienware m15 R3 P87F AU Optronics B156HAN, IPS, 15.6", 1920x1080 | |
|---|---|---|---|---|---|---|
| Display | 2% | -1% | 2% | -7% | 1% | |
| Display P3 Coverage (%) | 67.7 | 69.9 3% | 66.9 -1% | 69.4 3% | 63 -7% | 68.6 1% |
| sRGB Coverage (%) | 98.4 | 99.1 1% | 98.1 0% | 98.8 0% | 91.3 -7% | 98.9 1% |
| AdobeRGB 1998 Coverage (%) | 69.1 | 71.1 3% | 67.9 -2% | 70.5 2% | 64.6 -7% | 69.8 1% |
| Response Times | 18% | 16% | 55% | 30% | 40% | |
| Response Time Grey 50% / Grey 80% * (ms) | 14.4 ? | 11.2 ? 22% | 12 ? 17% | 3.2 ? 78% | 8.8 ? 39% | 4 ? 72% |
| Response Time Black / White * (ms) | 11.6 ? | 10 ? 14% | 10 ? 14% | 8 ? 31% | 9.2 ? 21% | 10.8 ? 7% |
| PWM Frequency (Hz) | 23580 ? | |||||
| Screen | 14% | -3% | -12% | -7% | -6% | |
| Brightness middle (cd/m²) | 259.5 | 339.4 31% | 286 10% | 345.4 33% | 275 6% | 326.7 26% |
| Brightness (cd/m²) | 264 | 331 25% | 275 4% | 342 30% | 268 2% | 316 20% |
| Brightness Distribution (%) | 90 | 92 2% | 91 1% | 90 0% | 91 1% | 87 -3% |
| Black Level * (cd/m²) | 0.25 | 0.24 4% | 0.25 -0% | 0.34 -36% | 0.33 -32% | 0.33 -32% |
| Contrast (:1) | 1038 | 1414 36% | 1144 10% | 1016 -2% | 833 -20% | 990 -5% |
| Colorchecker dE 2000 * | 2.52 | 1.58 37% | 2.43 4% | 3.18 -26% | 2.72 -8% | 2.4 5% |
| Colorchecker dE 2000 max. * | 5.55 | 3.8 32% | 6.33 -14% | 6.57 -18% | 4.45 20% | 6.06 -9% |
| Colorchecker dE 2000 calibrated * | 1.93 | 1.47 24% | 0.83 57% | 1.77 8% | 2.09 -8% | 1.51 22% |
| Greyscale dE 2000 * | 1.7 | 2.3 -35% | 3.5 -106% | 3.8 -124% | 2.3 -35% | 3.2 -88% |
| Gamma | 2.04 108% | 2.24 98% | 2.32 95% | 2.15 102% | 2.266 97% | 2.13 103% |
| CCT | 6414 101% | 6952 93% | 7145 91% | 7109 91% | 6933 94% | 7129 91% |
| Color Space (Percent of AdobeRGB 1998) (%) | 63.3 | 64.8 2% | 68 7% | 64.3 2% | 65 3% | 63.7 1% |
| Color Space (Percent of sRGB) (%) | 98.8 | 99.4 1% | 91 -8% | 99 0% | 90 -9% | 99.2 0% |
| Total Average (Program / Settings) | 11% /
13% | 4% /
-0% | 15% /
-1% | 5% /
-3% | 12% /
1% |
* ... smaller is better
Color space is identical to last year's high refresh rate 1080p panels at approximately 63 percent AdobeRGB and 99 percent sRGB. MSI is offering no 4K options at the moment for its GeForce RTX 30 GS66 refresh.
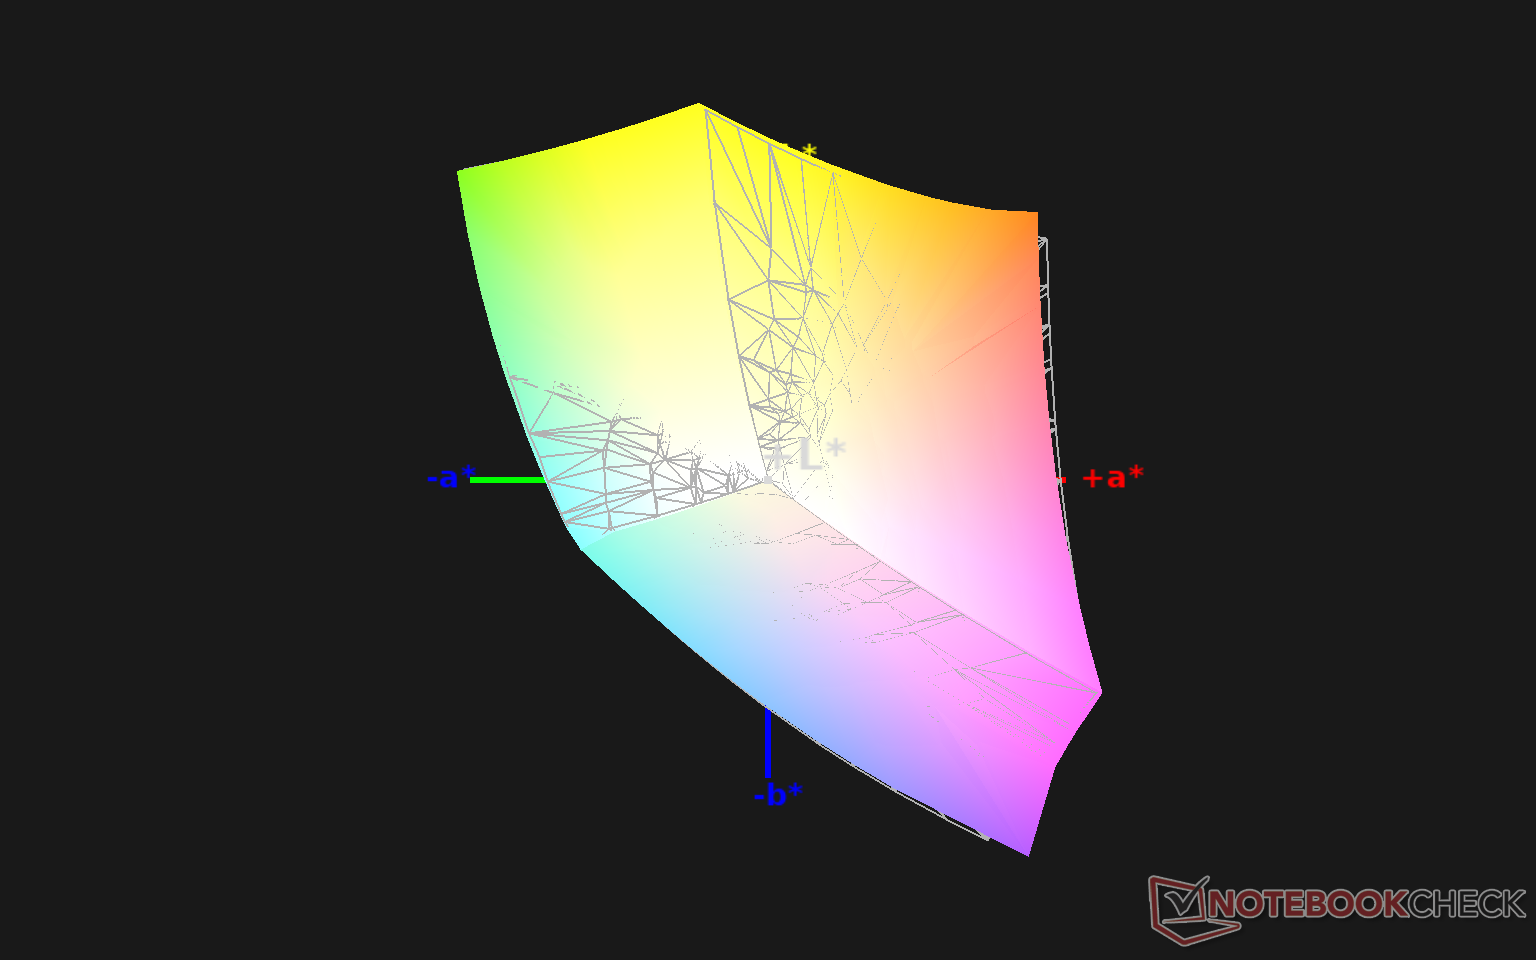
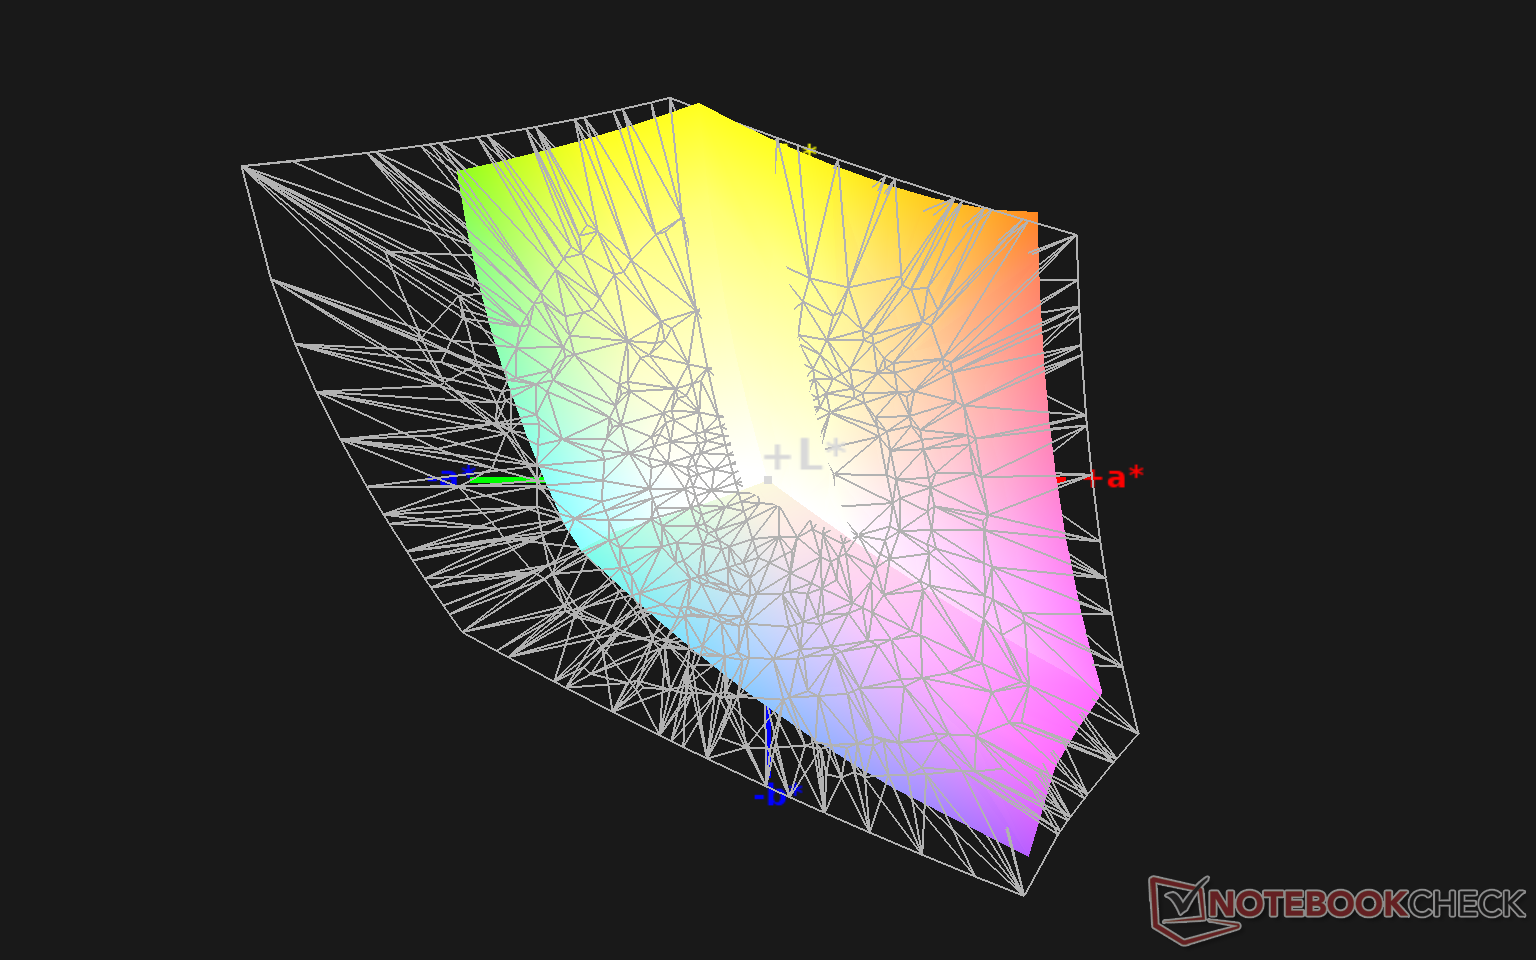
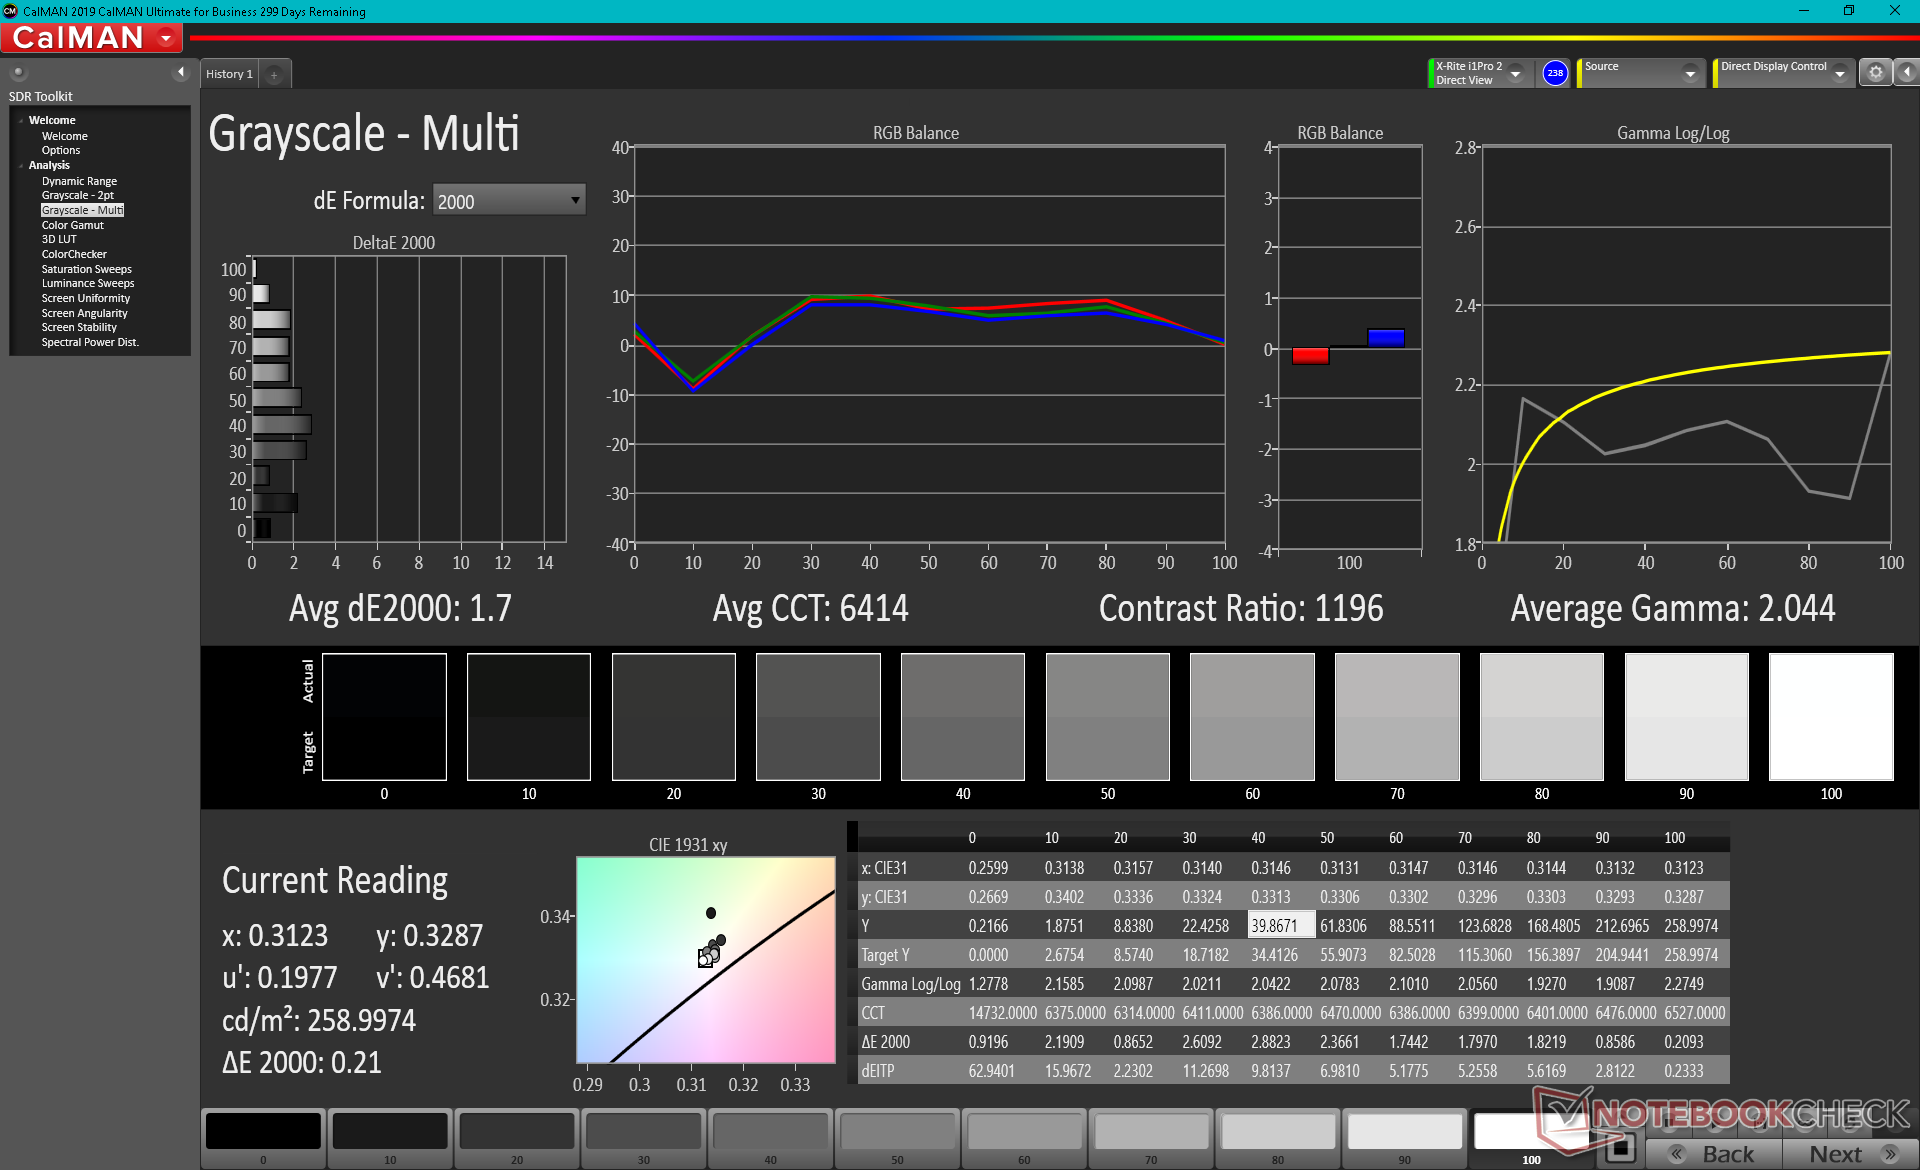
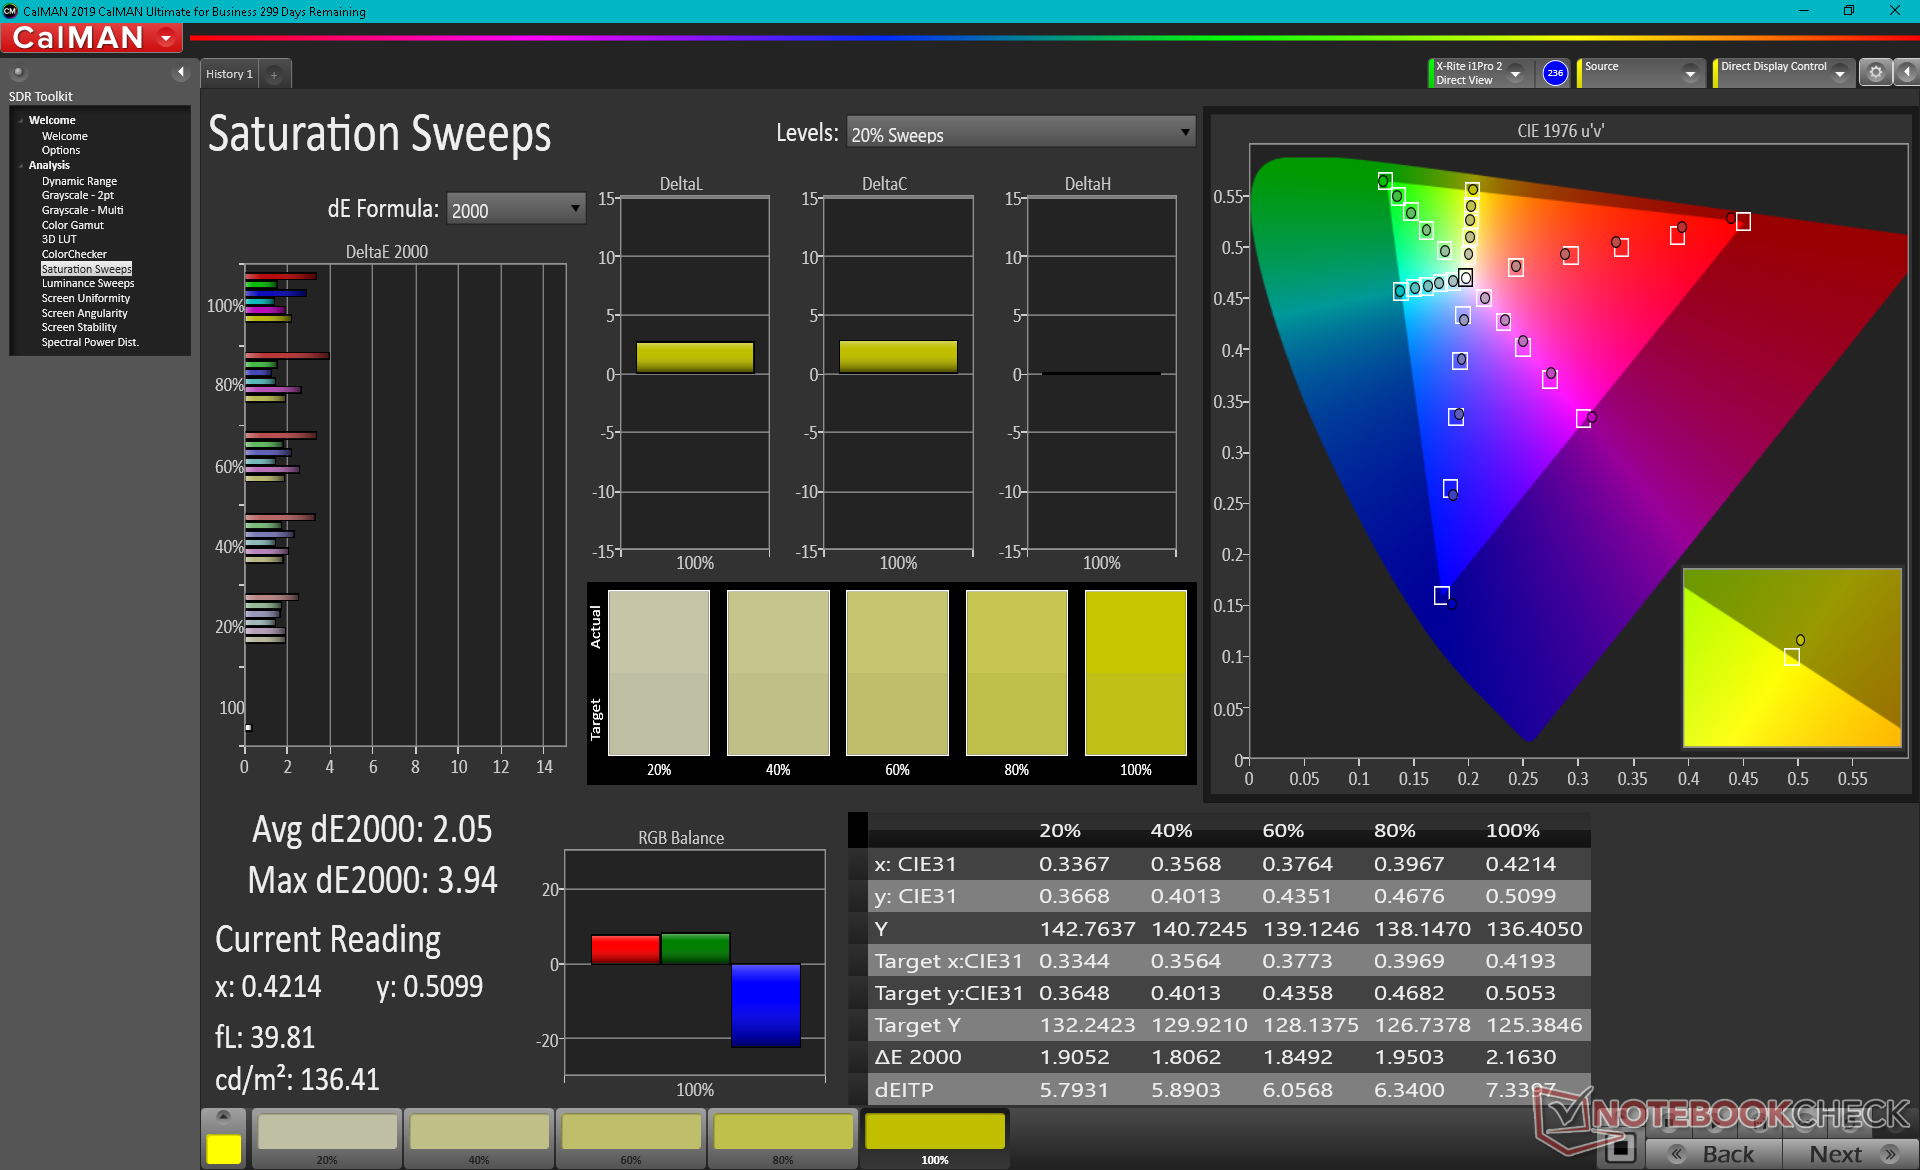
The display is well-calibrated against the sRGB standard out of the box with average grayscale and ColorChcker deltaE values of just 1.7 and 2.52, respectively. These values would improve just marginally after calibrating the panel even further ourselves.

Display Response Times
| ↔ Response Time Black to White | ||
|---|---|---|
| 11.6 ms ... rise ↗ and fall ↘ combined | ↗ 7.6 ms rise | 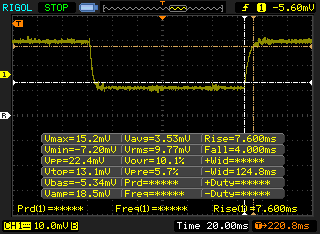 |
| ↘ 4 ms fall | ||
| The screen shows good response rates in our tests, but may be too slow for competitive gamers. In comparison, all tested devices range from 0.1 (minimum) to 240 (maximum) ms. » 30 % of all devices are better. This means that the measured response time is better than the average of all tested devices (20.1 ms). | ||
| ↔ Response Time 50% Grey to 80% Grey | ||
| 14.4 ms ... rise ↗ and fall ↘ combined | ↗ 6.8 ms rise | 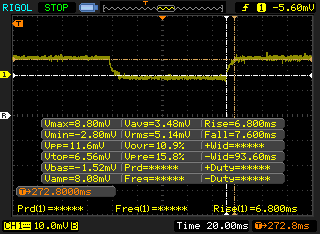 |
| ↘ 7.6 ms fall | ||
| The screen shows good response rates in our tests, but may be too slow for competitive gamers. In comparison, all tested devices range from 0.165 (minimum) to 636 (maximum) ms. » 28 % of all devices are better. This means that the measured response time is better than the average of all tested devices (31.4 ms). | ||
Screen Flickering / PWM (Pulse-Width Modulation)
| Screen flickering / PWM not detected | 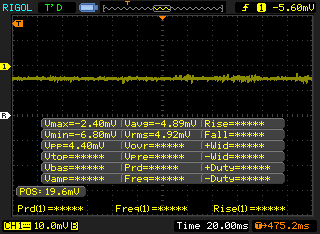 | ||
In comparison: 53 % of all tested devices do not use PWM to dim the display. If PWM was detected, an average of 7986 (minimum: 5 - maximum: 343500) Hz was measured. | |||
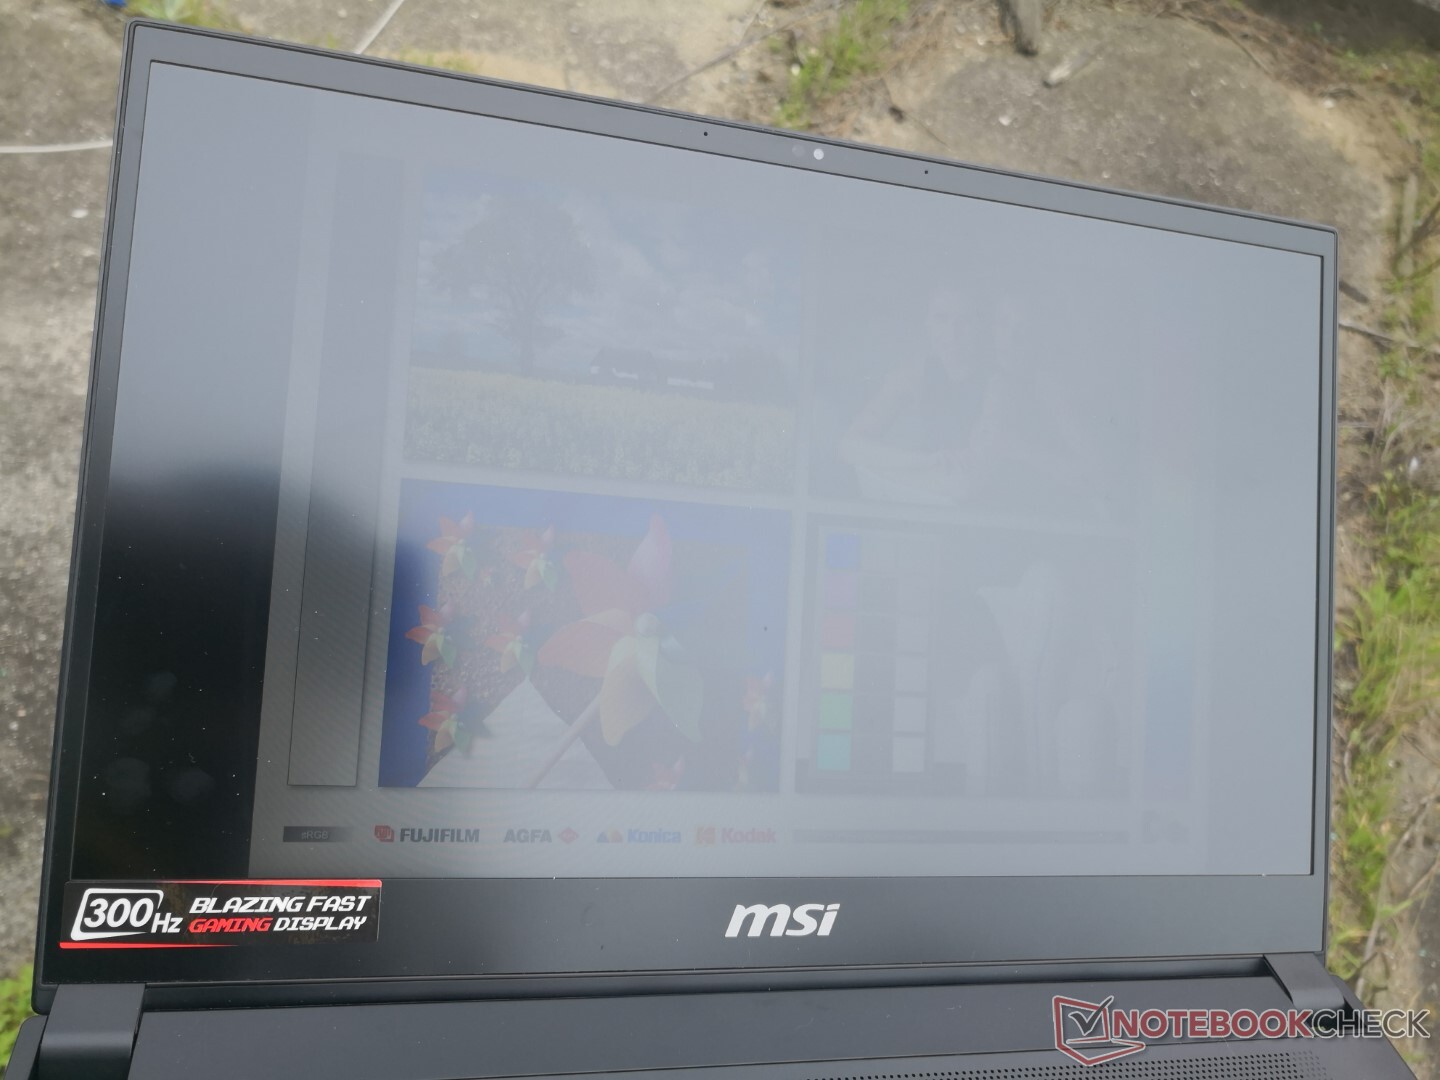
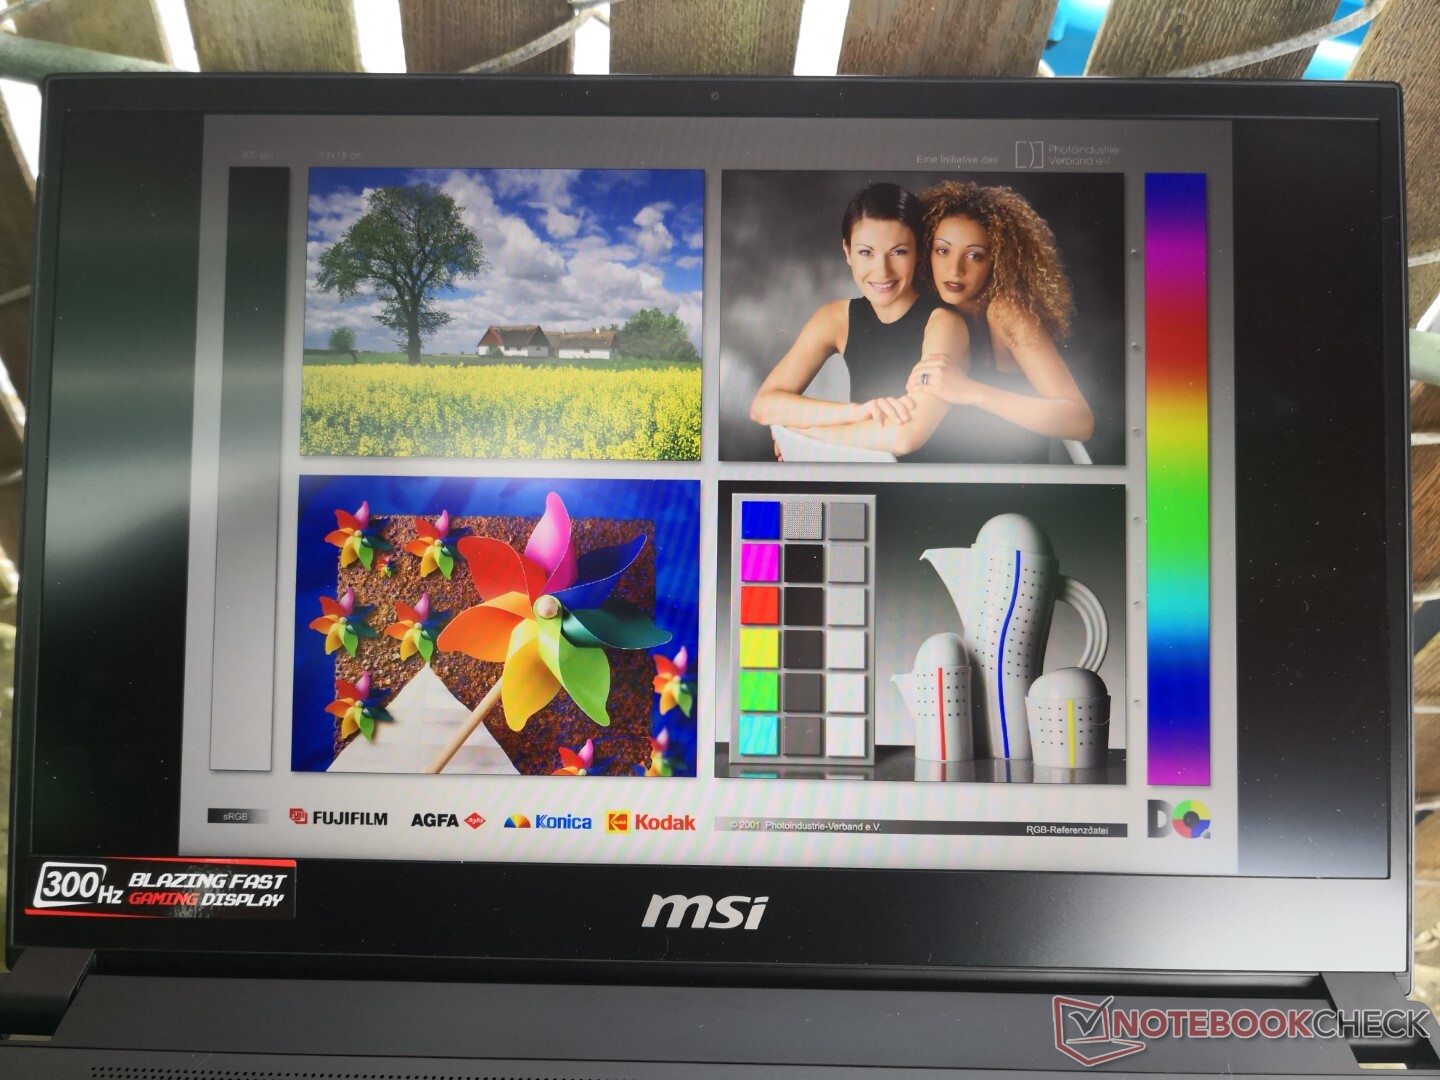
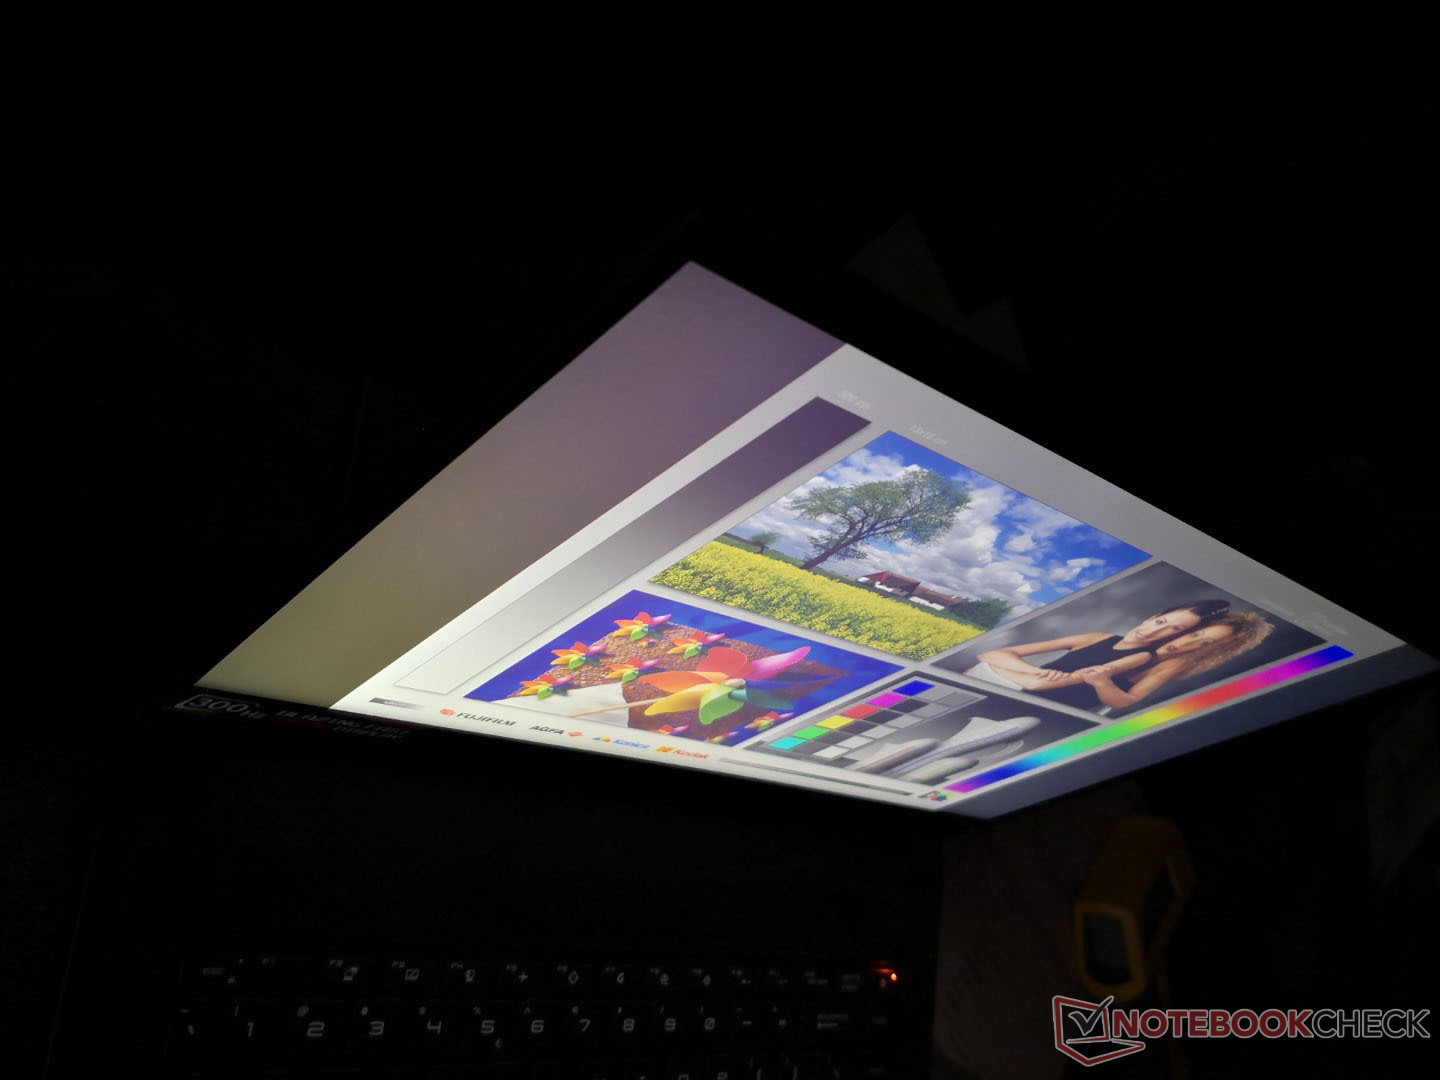
Outdoor visibility is worse than most Ultrabooks as the display is simply not as bright. The latest Dell XPS 15, for example, is over two times brighter than our MSI. For such a thin and light gaming laptop, we were hoping for a more vibrant display when traveling and working out of office.
Performance
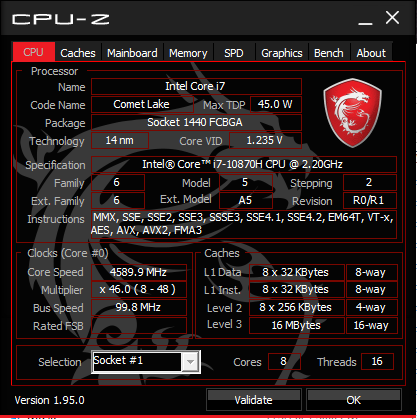
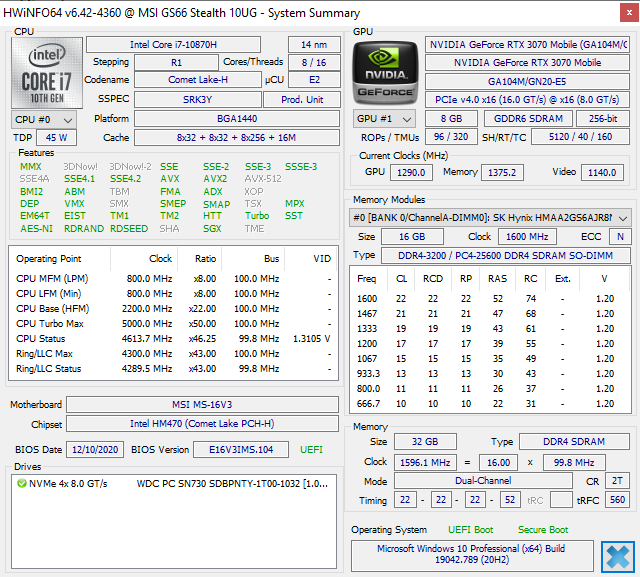
The Core i7-10870H is exactly the same as the Core i7-10875H with just a couple of minor differences. Firstly, base and maximum clock rates are each 100 MHz slower than the Core i7-10875H at 2.2 GHz vs. 2.3 GHz and 5 GHz vs. 5.1 GHz, respectively. Secondly, the CPU is not compatible with certain Intel security features including vPro and Trusted Execution that dedicated gaming laptops would likely never utilize, anyway. It was rumored that Intel introduced the Core i7-10870H to alleviate the supply issues some laptop makers were experiencing with the Core i7-10875H late last year.
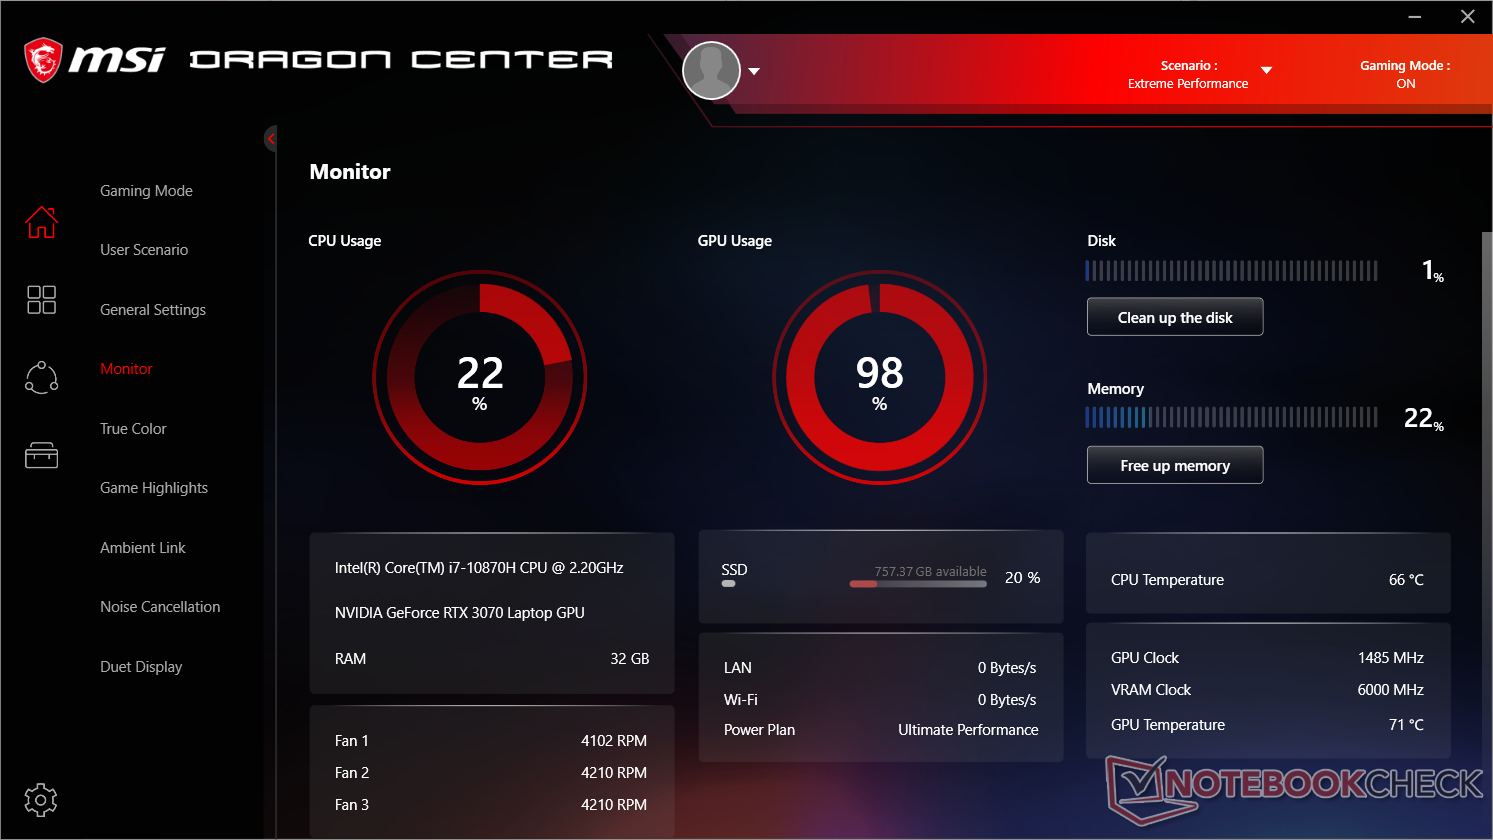
Unless otherwise noted, our benchmarks below were performed on Extreme Performance mode. We recommend users become familiar with the MSI Dragon Center software as important performance and fan controls can be found here. Note that the Dragon Center real-time monitoring tool is prone to freezing whenever the CPU is at 100 percent utilization and so it is not always reliable.
Processor
Raw CPU performance is where we expect it to be according to CineBench benchmarks with scores that are just a few percentage points behind the Core i7-10875H. However, maximum Turbo Boost is not sustainable for long periods as exemplified by our CineBench R15 xT loop test. Performance would start out strong at almost 1650 points before falling to 1480 points and lower over time. Results would not change even after a retest. Note that we had set our system to Cooler Boost Turbo mode prior to starting the loop test and so the GS66 ought to be performing at its best under these conditions.
Despite the dip in clock rates, the Core i7-10870H can still offer 30 to 35 percent faster multi-thread performance than the Core i7-10750H on last year's GS66 to be roughly in between the competing AMD Ryzen 5 4600H and Ryzen 7 4800H.
Cinebench R15: CPU Multi 64Bit | CPU Single 64Bit
Blender: v2.79 BMW27 CPU
7-Zip 18.03: 7z b 4 -mmt1 | 7z b 4
Geekbench 5.5: Single-Core | Multi-Core
HWBOT x265 Benchmark v2.2: 4k Preset
LibreOffice : 20 Documents To PDF
R Benchmark 2.5: Overall mean
Cinebench R15: CPU Multi 64Bit | CPU Single 64Bit
Blender: v2.79 BMW27 CPU
7-Zip 18.03: 7z b 4 -mmt1 | 7z b 4
Geekbench 5.5: Single-Core | Multi-Core
HWBOT x265 Benchmark v2.2: 4k Preset
LibreOffice : 20 Documents To PDF
R Benchmark 2.5: Overall mean
* ... smaller is better
System Performance
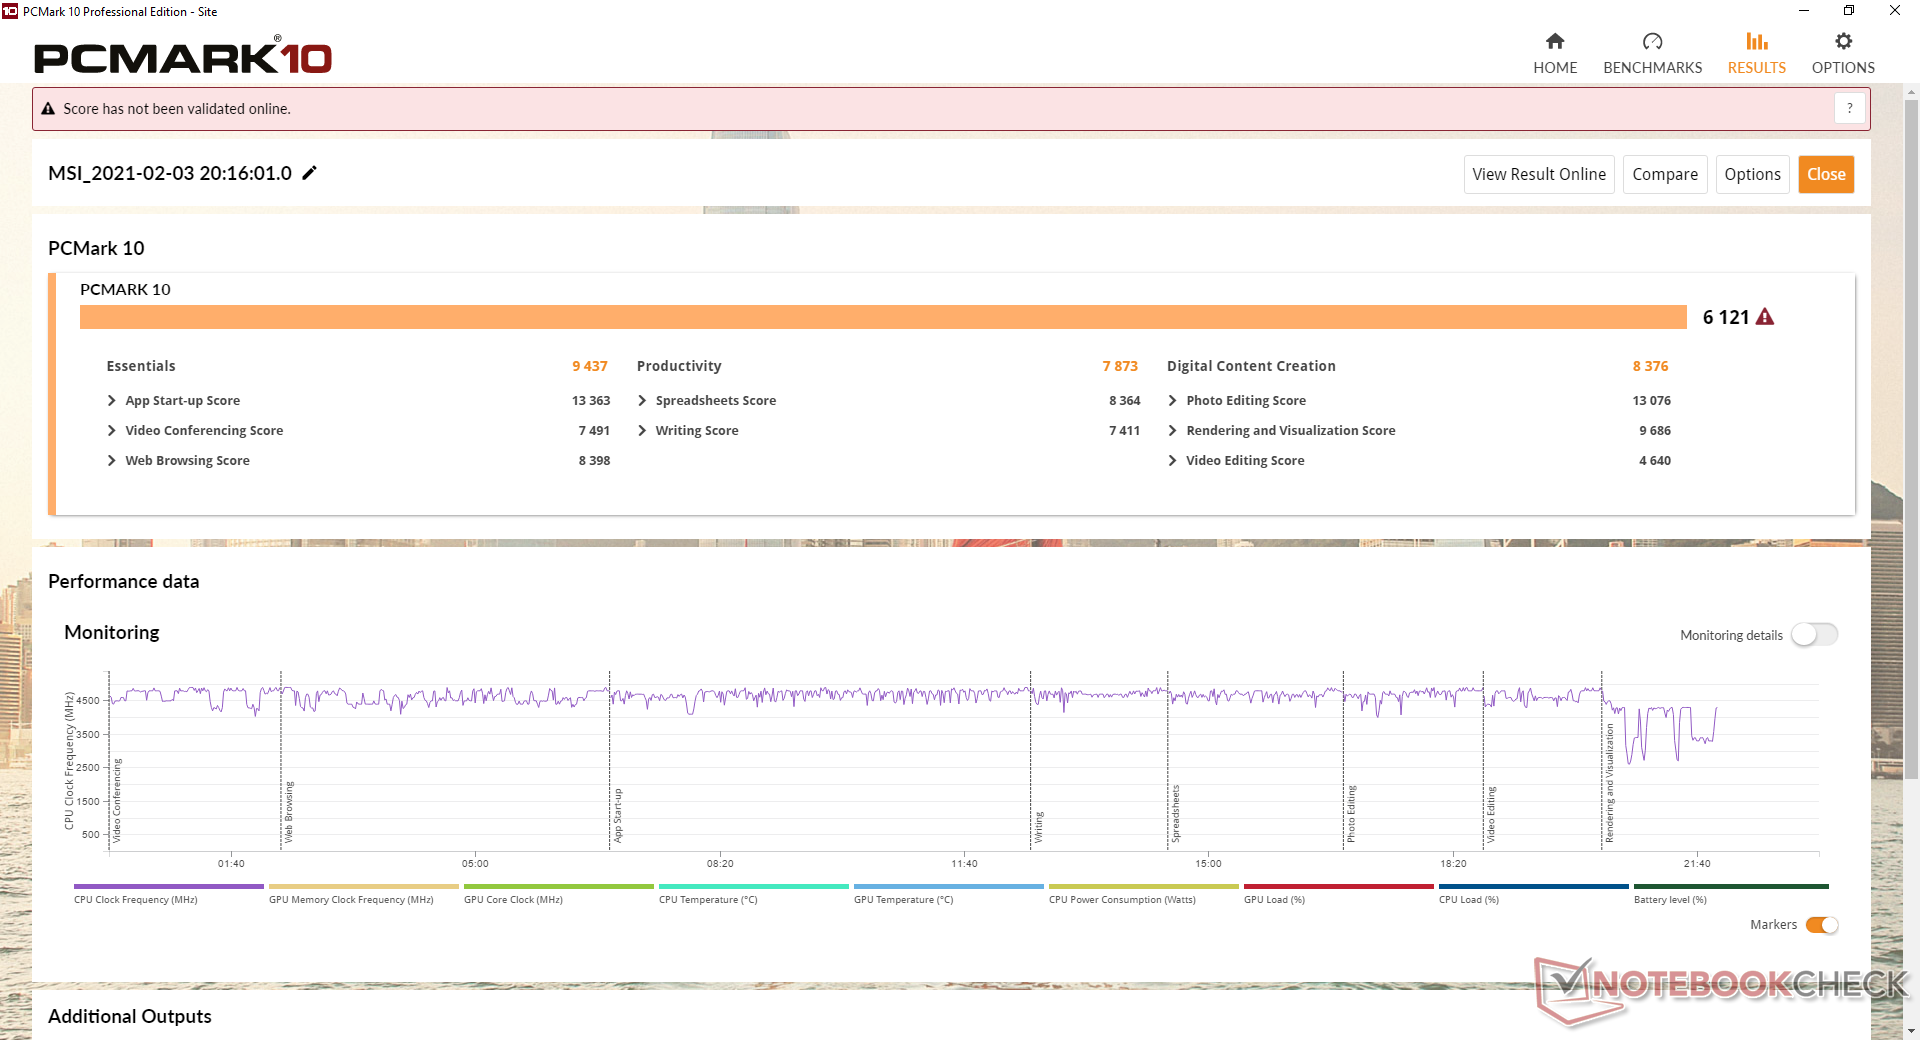
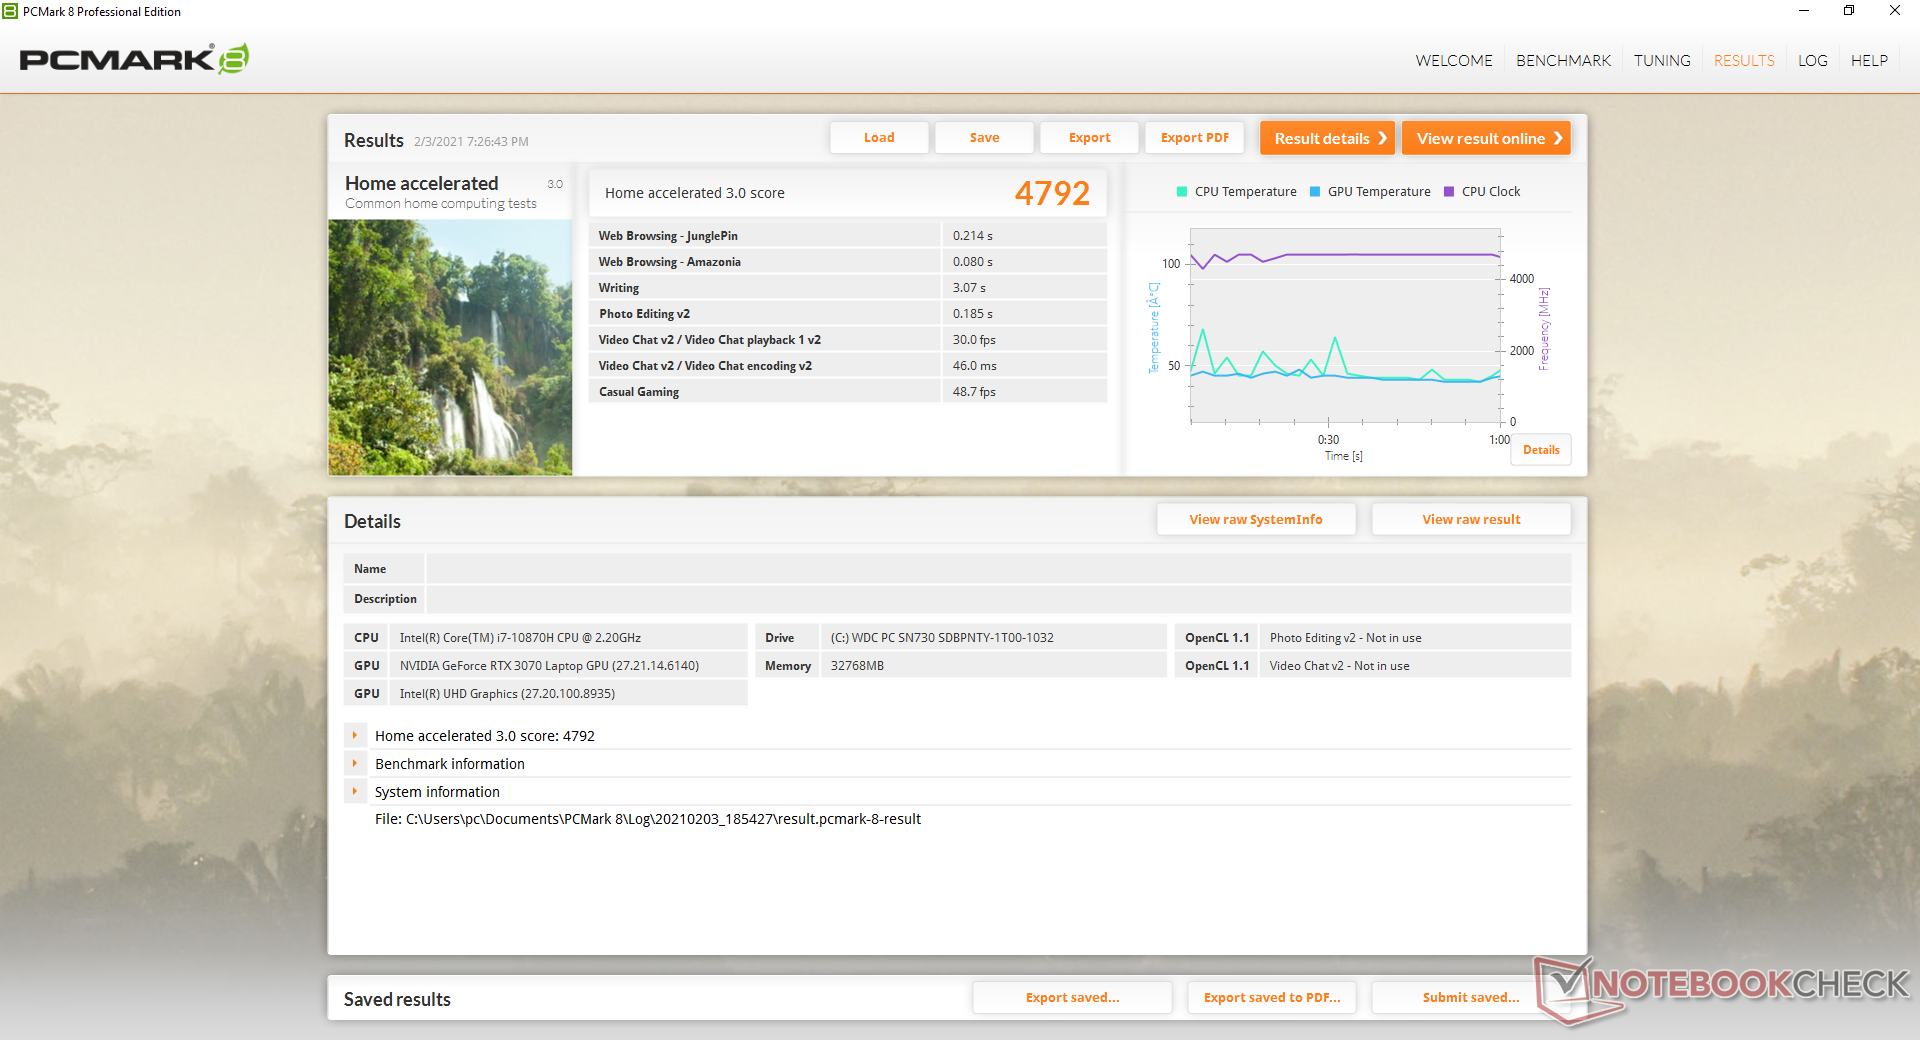
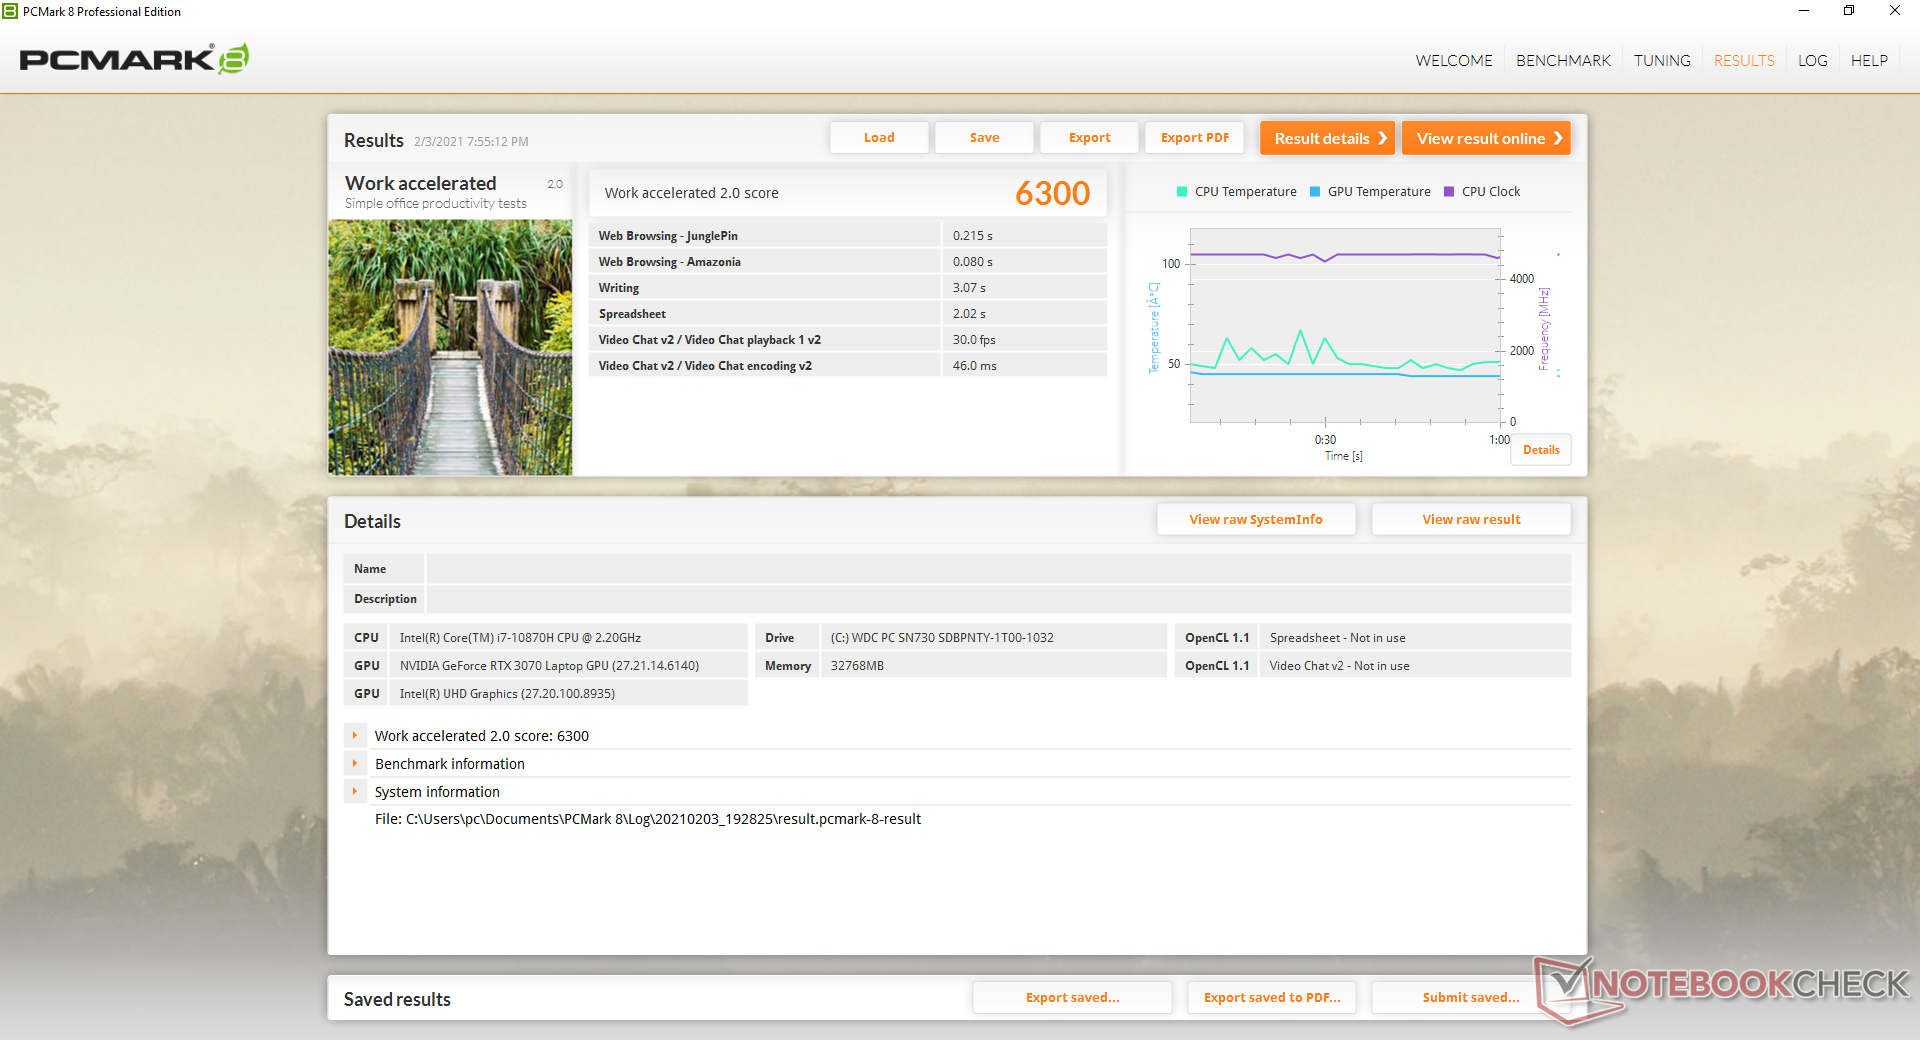
PCMark results are within single-digit percentage points of other GeForce RTX-powered laptops including those from the older Turing series. In other words, it doesn't appear that the gen-to-gen GPU performance advantage of mobile Ampere is wide enough to really impact PCMark scores.
| PCMark 8 | |
| Home Score Accelerated v2 | |
| Razer Blade 15 RTX 2070 Super Max-Q | |
| Alienware m15 R3 P87F | |
| MSI GS66 Stealth 10UG | |
| MSI GS66 10SGS | |
| Aorus 15P WB | |
| Work Score Accelerated v2 | |
| Razer Blade 15 RTX 2070 Super Max-Q | |
| MSI GS66 Stealth 10UG | |
| Alienware m15 R3 P87F | |
| MSI GS66 10SGS | |
| Aorus 15P WB | |
| PCMark 8 Home Score Accelerated v2 | 4792 points | |
| PCMark 8 Work Score Accelerated v2 | 6300 points | |
| PCMark 10 Score | 6121 points | |
Help | ||
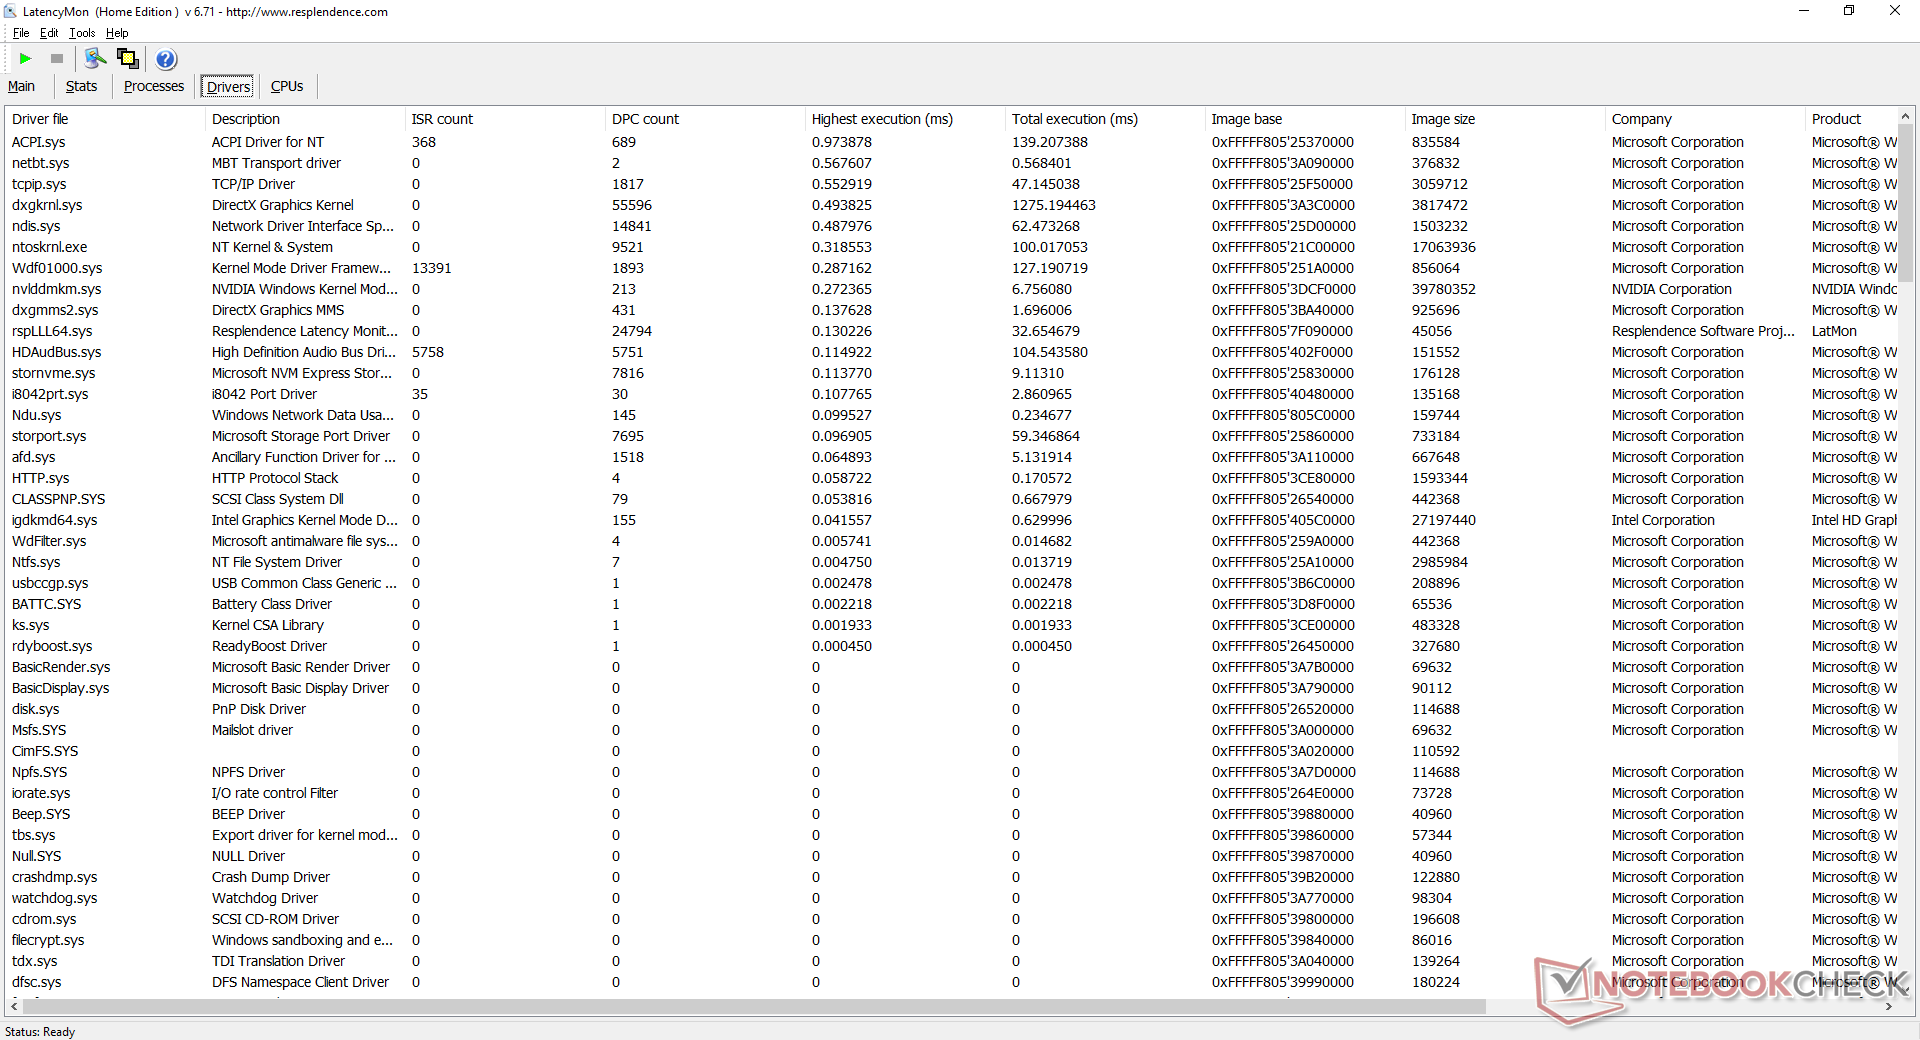
DPC Latency
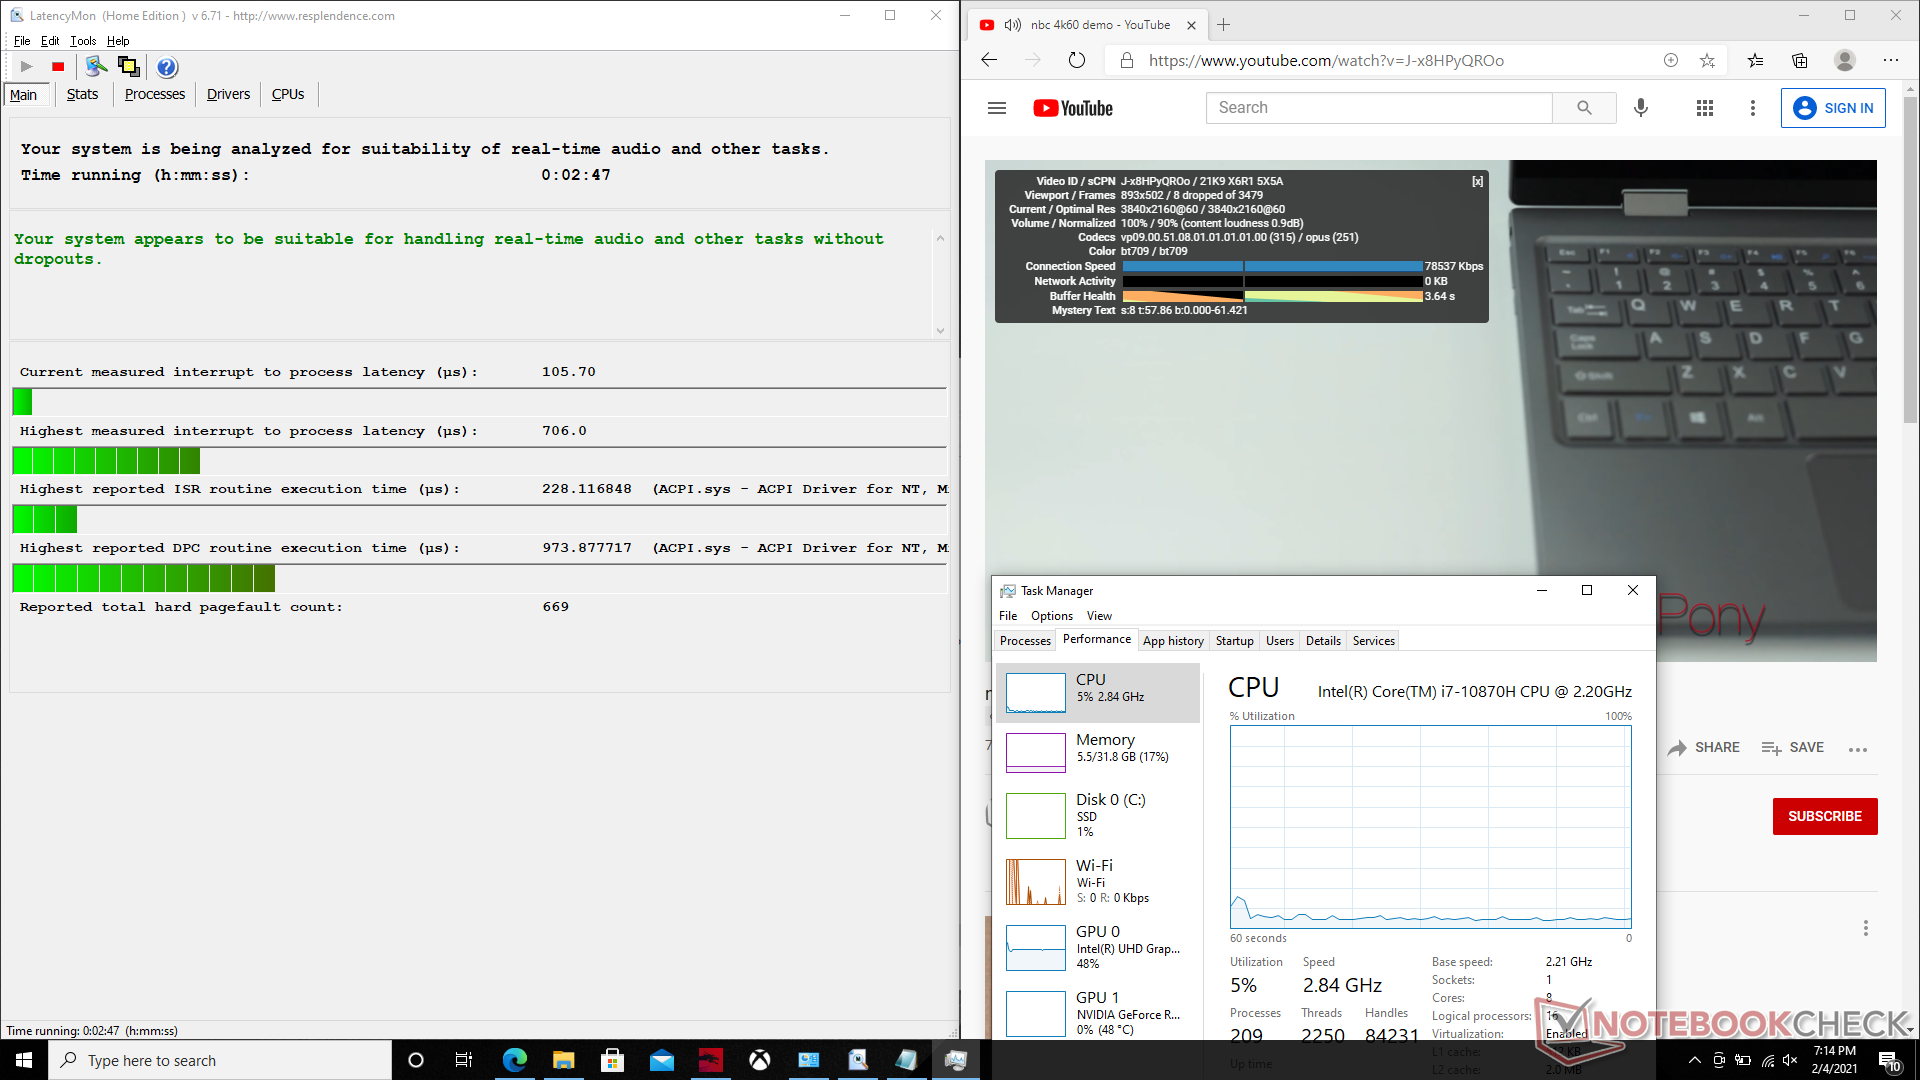
LatencyMon shows no major latency issues when opening multiple browser tabs of our homepage. 4K video playback at 60 FPS is smooth but not perfect with 8 dropped frames during our minute-long video test.
| DPC Latencies / LatencyMon - interrupt to process latency (max), Web, Youtube, Prime95 | |
| Razer Blade 15 RTX 2070 Super Max-Q | |
| MSI GS66 10SGS | |
| Alienware m15 R3 P87F | |
| Asus TUF Dash F15 FX516PR | |
| Aorus 15P WB | |
| MSI GS66 Stealth 10UG | |
* ... smaller is better
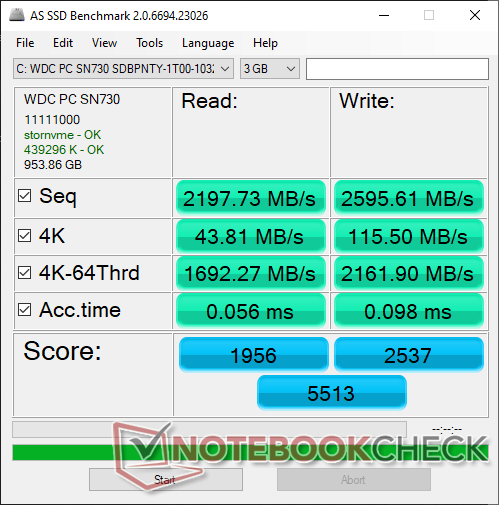
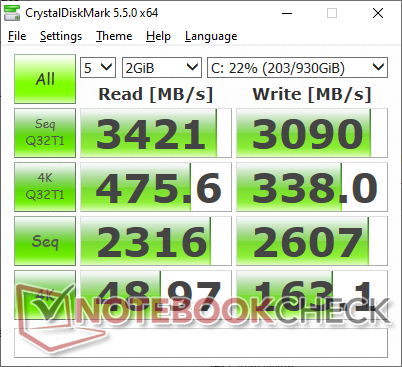
Storage Devices
| MSI GS66 Stealth 10UG WDC PC SN730 SDBPNTY-1T00 | MSI GS66 10SGS Samsung SSD PM981 MZVLB512HAJQ | Asus TUF Dash F15 FX516PR SK Hynix HFM001TD3JX013N | Razer Blade 15 RTX 2070 Super Max-Q Samsung SSD PM981a MZVLB512HBJQ | Aorus 15P WB ADATA XPG SX8200 Pro (ASX8200PNP-512GT) | Alienware m15 R3 P87F 2x Micron 2200S 512 GB (RAID 0) | |
|---|---|---|---|---|---|---|
| AS SSD | -11% | -20% | -9% | -18% | -40% | |
| Seq Read (MB/s) | 2198 | 1086 -51% | 2671 22% | 1957 -11% | 2241 2% | 2058 -6% |
| Seq Write (MB/s) | 2596 | 1901 -27% | 1501 -42% | 2092 -19% | 2121 -18% | 2316 -11% |
| 4K Read (MB/s) | 43.81 | 51 16% | 39.65 -9% | 50.2 15% | 52.3 19% | 39.72 -9% |
| 4K Write (MB/s) | 115.5 | 117.3 2% | 69 -40% | 96.5 -16% | 116.2 1% | 62.9 -46% |
| 4K-64 Read (MB/s) | 1692 | 1503 -11% | 1209 -29% | 1594 -6% | 713 -58% | 1334 -21% |
| 4K-64 Write (MB/s) | 2162 | 1721 -20% | 1650 -24% | 2005 -7% | 827 -62% | 1271 -41% |
| Access Time Read * (ms) | 0.056 | 0.059 -5% | 0.093 -66% | 0.057 -2% | 0.054 4% | 0.062 -11% |
| Access Time Write * (ms) | 0.098 | 0.1 -2% | 0.055 44% | 0.112 -14% | 0.031 68% | 0.388 -296% |
| Score Read (Points) | 1956 | 1662 -15% | 1516 -22% | 1840 -6% | 989 -49% | 1580 -19% |
| Score Write (Points) | 2537 | 2029 -20% | 1869 -26% | 2310 -9% | 1155 -54% | 1565 -38% |
| Score Total (Points) | 5513 | 4588 -17% | 4105 -26% | 5103 -7% | 2659 -52% | 3968 -28% |
| Copy ISO MB/s (MB/s) | 2236 | 2155 -4% | 1793 -20% | 2192 -2% | 1685 -25% | |
| Copy Program MB/s (MB/s) | 690 | 715 4% | 573 -17% | 576 -17% | 669 -3% | |
| Copy Game MB/s (MB/s) | 1546 | 1506 -3% | 1418 -8% | 1062 -31% | 1493 -3% | |
| CrystalDiskMark 5.2 / 6 | -10% | -13% | 3% | 3% | -7% | |
| Write 4K (MB/s) | 163.1 | 132.5 -19% | 129.6 -21% | 139.8 -14% | 131.7 -19% | 67.3 -59% |
| Read 4K (MB/s) | 48.97 | 45.03 -8% | 44.71 -9% | 48.62 -1% | 55.7 14% | 41.47 -15% |
| Write Seq (MB/s) | 2607 | 1987 -24% | 1929 -26% | 2260 -13% | 2273 -13% | 2239 -14% |
| Read Seq (MB/s) | 2316 | 1434 -38% | 2035 -12% | 2135 -8% | 2533 9% | 2112 -9% |
| Write 4K Q32T1 (MB/s) | 338 | 467.5 38% | 425.9 26% | 499.3 48% | 475.1 41% | 488.9 45% |
| Read 4K Q32T1 (MB/s) | 475.6 | 536 13% | 433.4 -9% | 552 16% | 590 24% | 557 17% |
| Write Seq Q32T1 (MB/s) | 3090 | 2003 -35% | 1390 -55% | 2960 -4% | 2373 -23% | 2654 -14% |
| Read Seq Q32T1 (MB/s) | 3421 | 3306 -3% | 3505 2% | 3269 -4% | 3068 -10% | 3137 -8% |
| Total Average (Program / Settings) | -11% /
-10% | -17% /
-17% | -3% /
-5% | -8% /
-10% | -24% /
-28% |
* ... smaller is better

Disk Throttling: DiskSpd Read Loop, Queue Depth 8
GPU Performance
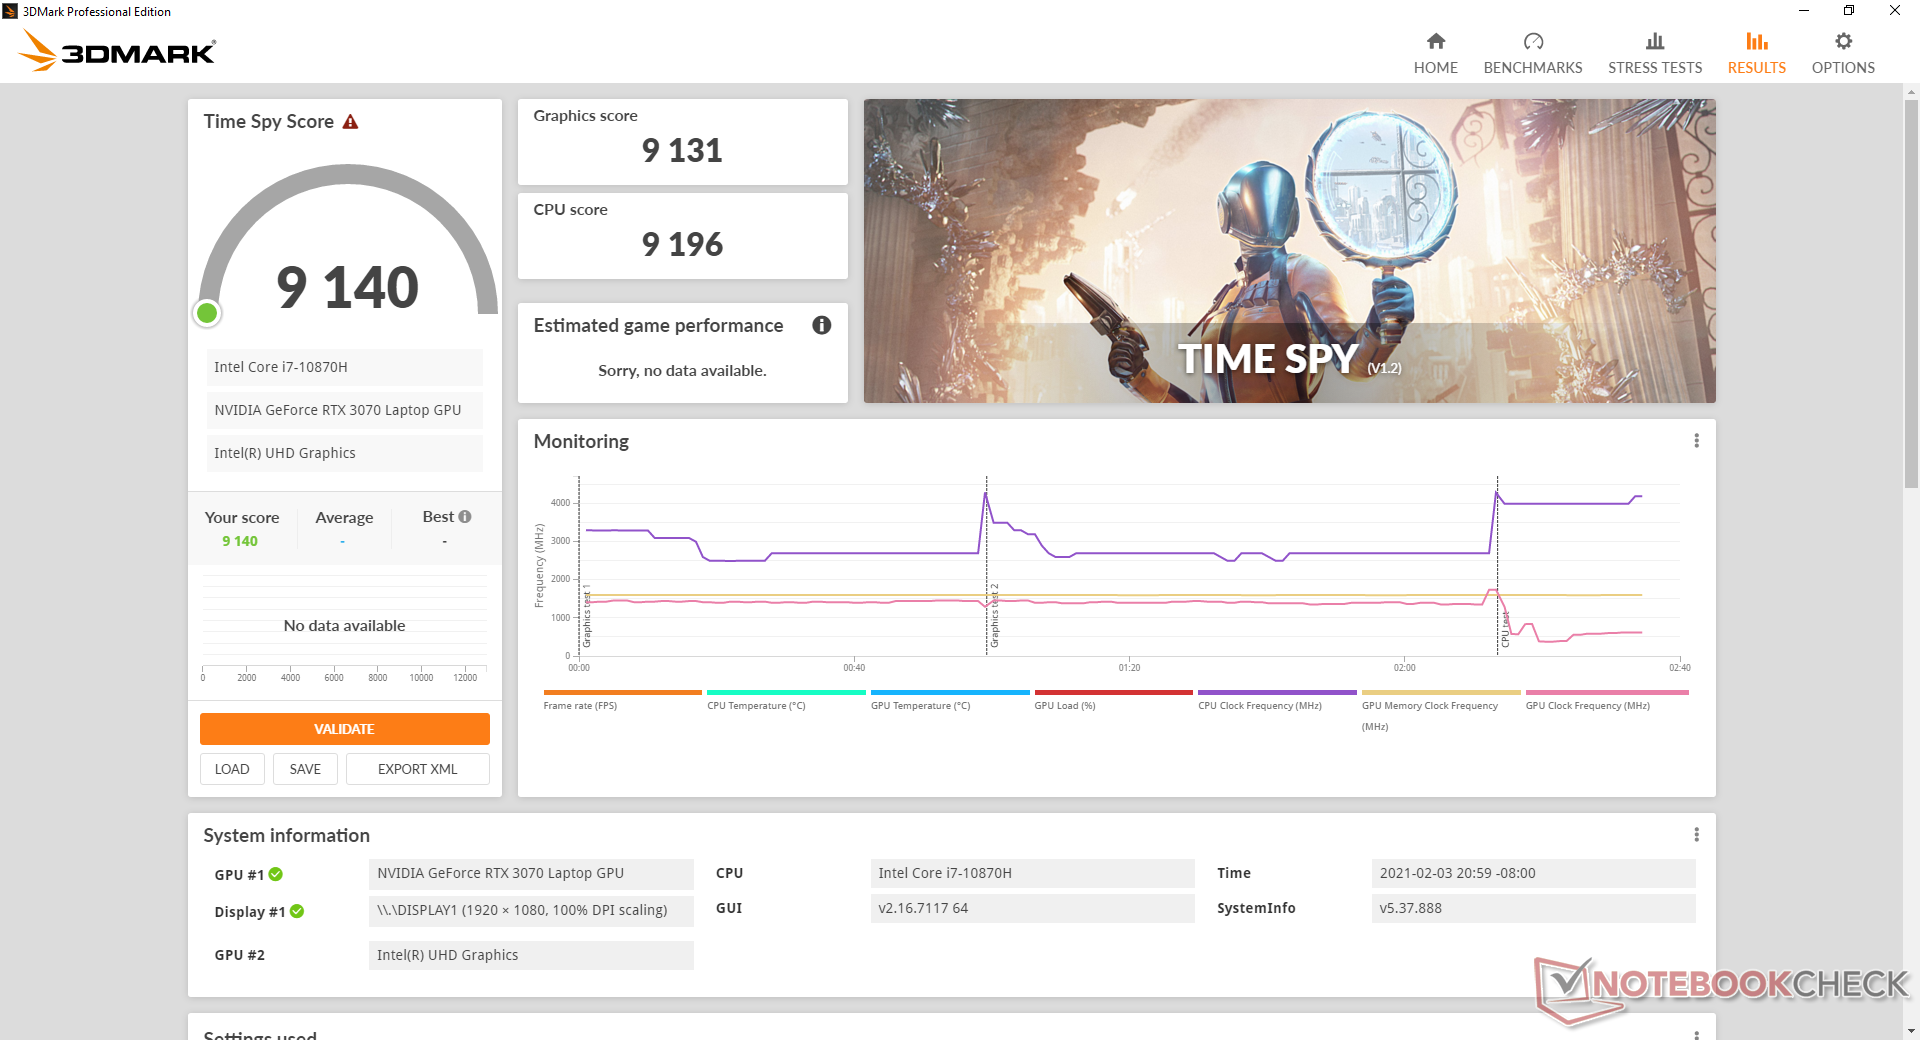
The mobile GeForce RTX 3070 here is about 20 percent faster than the GeForce RTX 2080 Max-Q in last year's GS66 10SGS or 30 percent faster than the 2070 Super Max-Q in the GS66 10SFS. The gen-to-gen gains are nowhere near the desktop RTX 3070 as the desktop version offers about 50 percent faster graphics power than our mobile version. Overall gaming performance is neck-to-neck with the desktop RTX 2070.
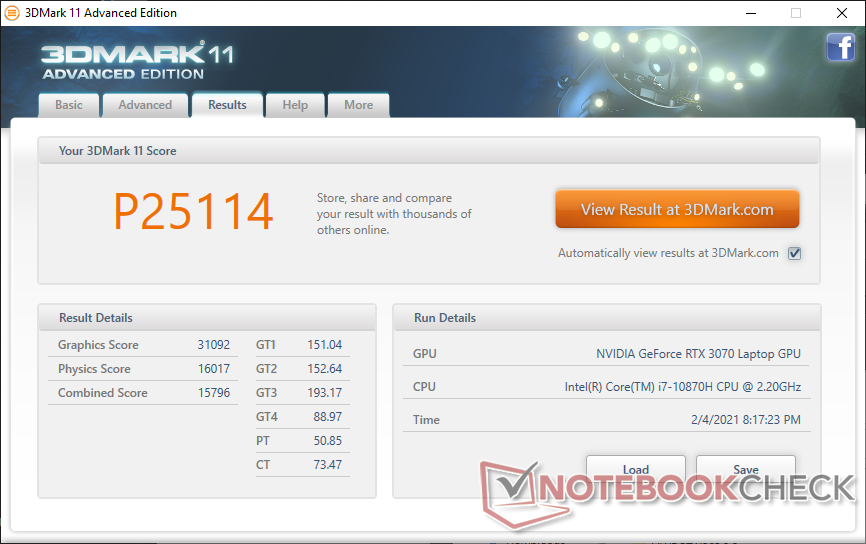
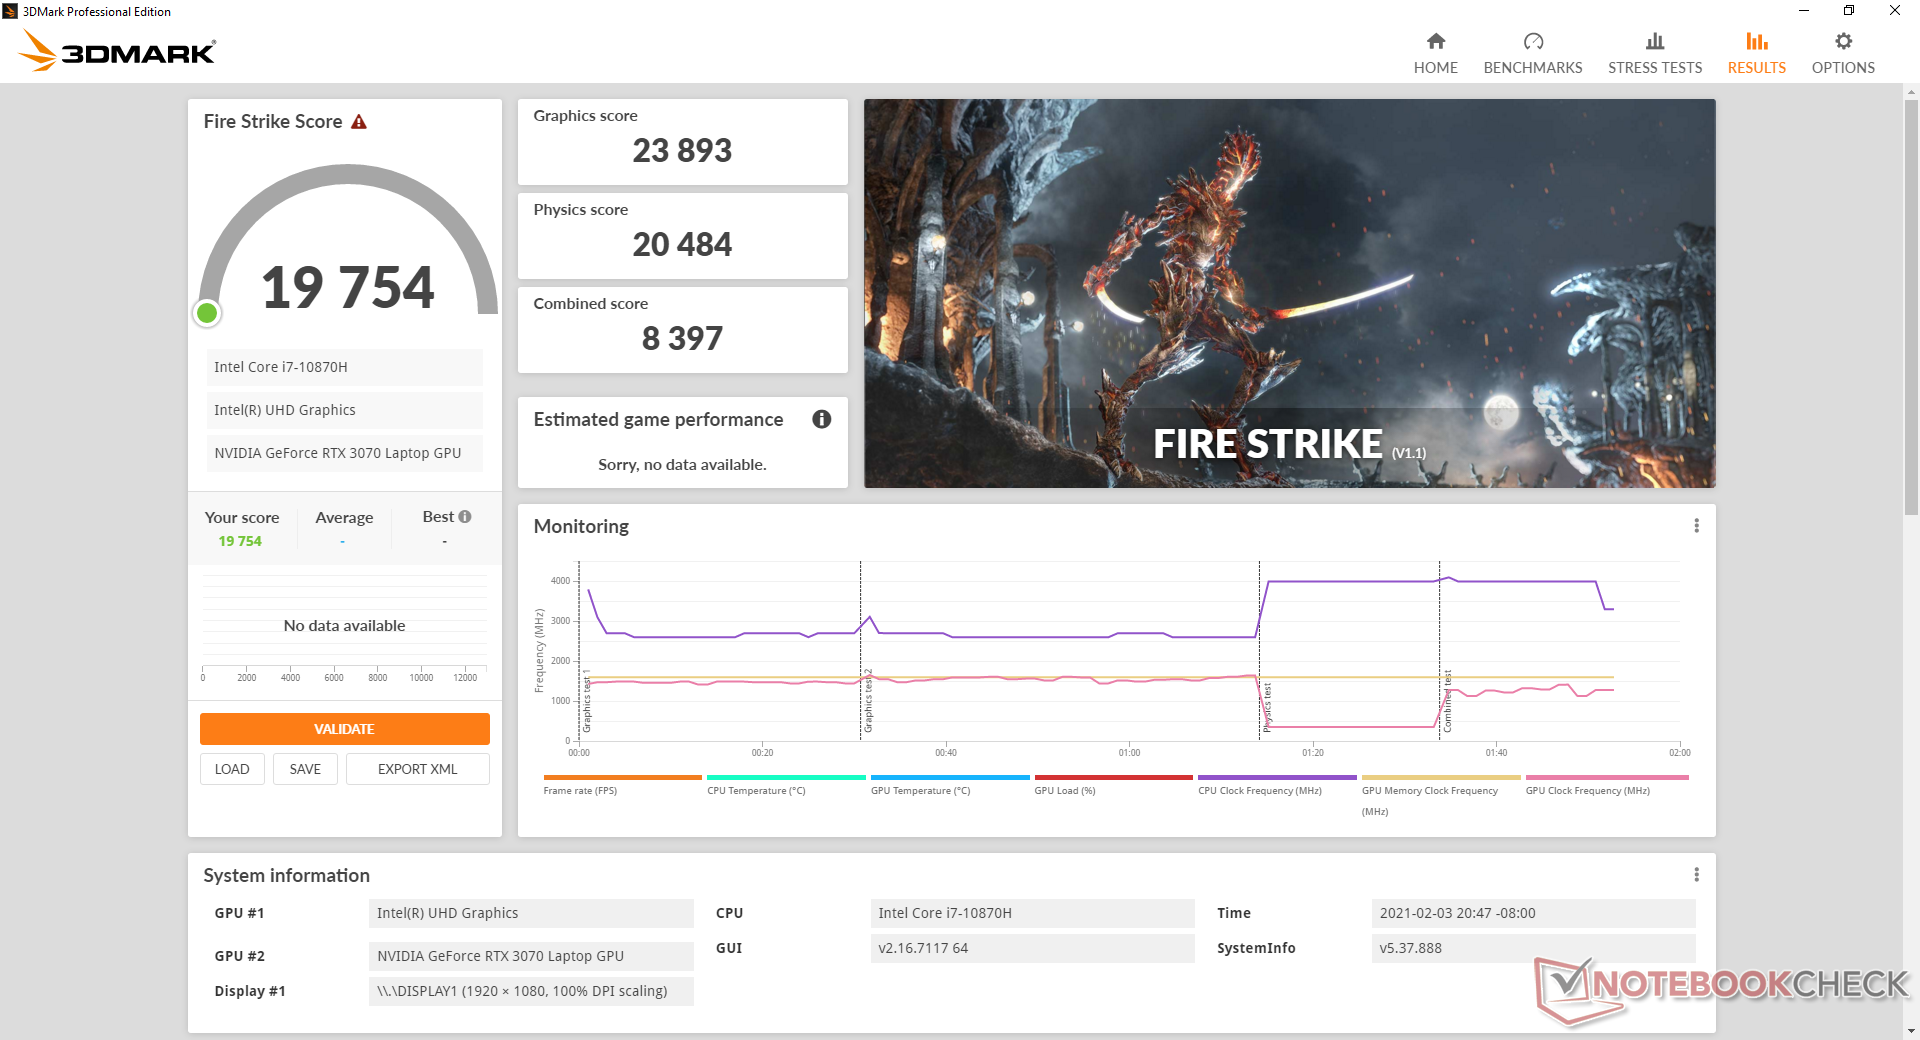
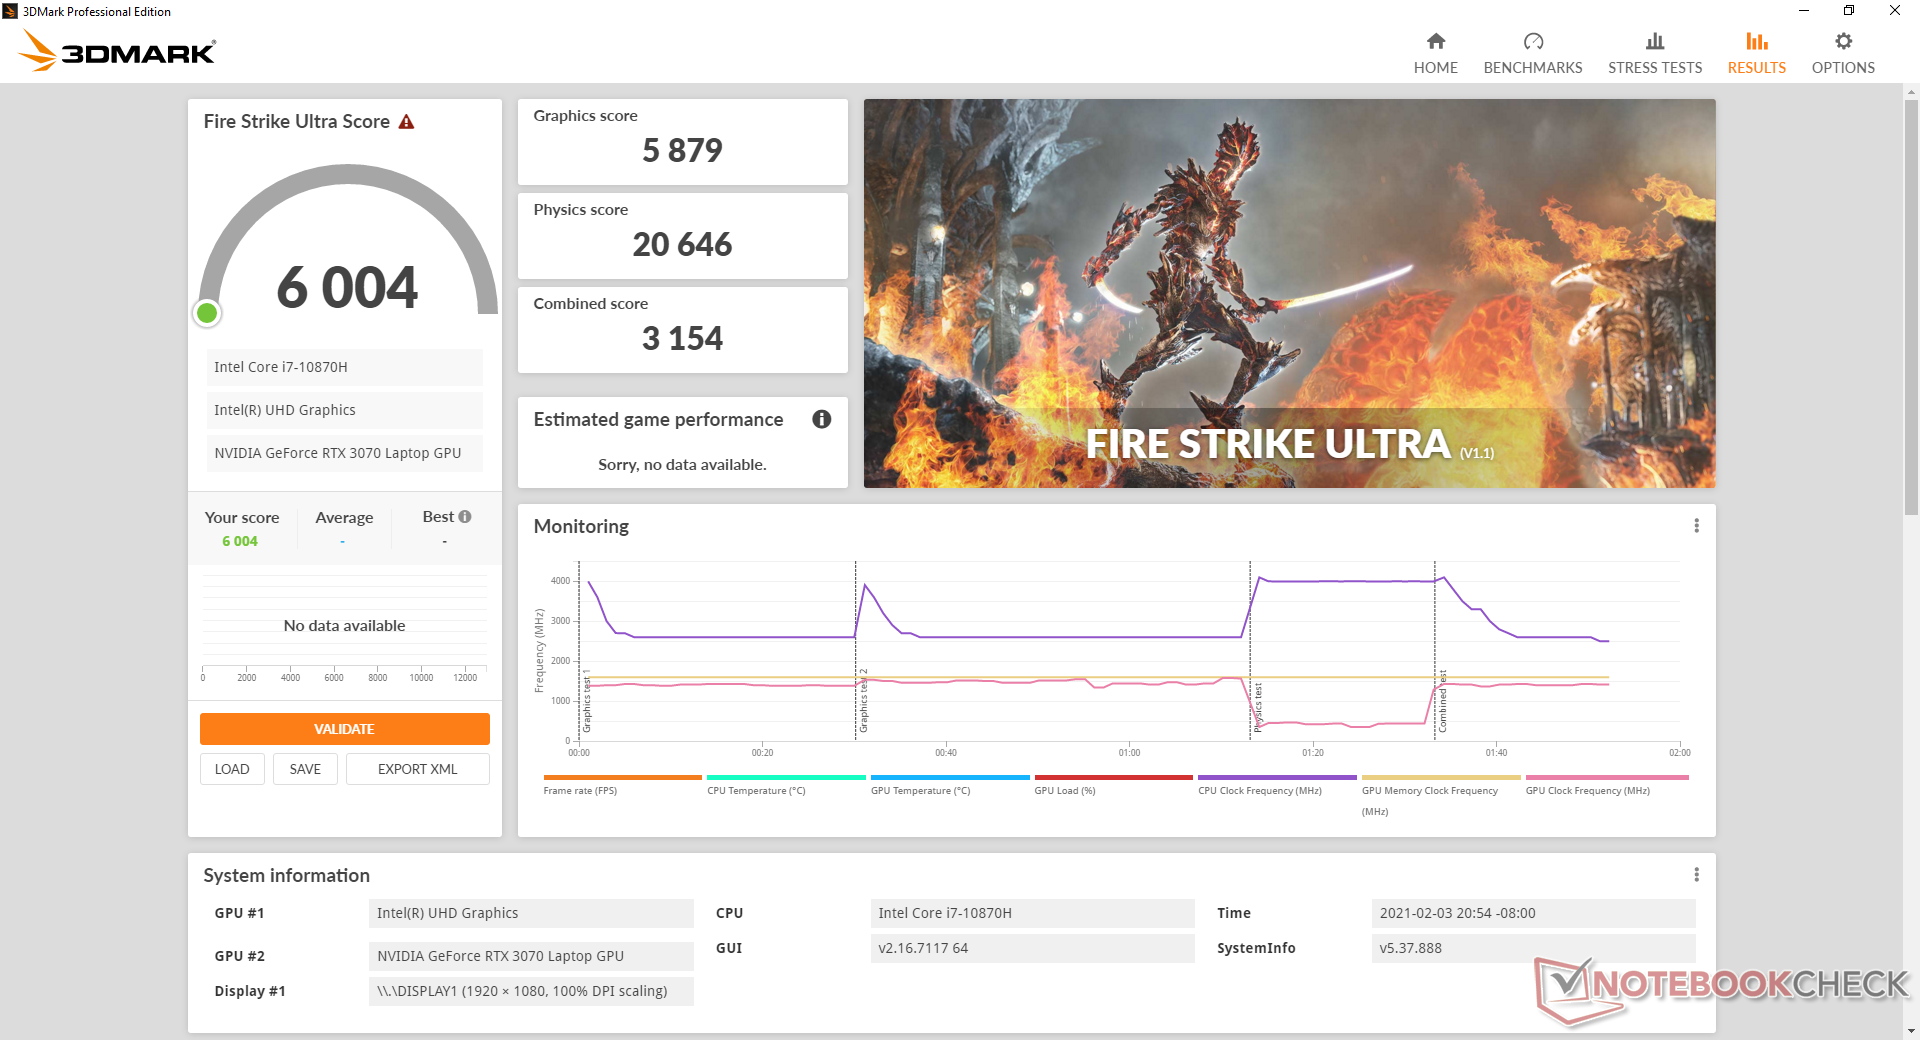
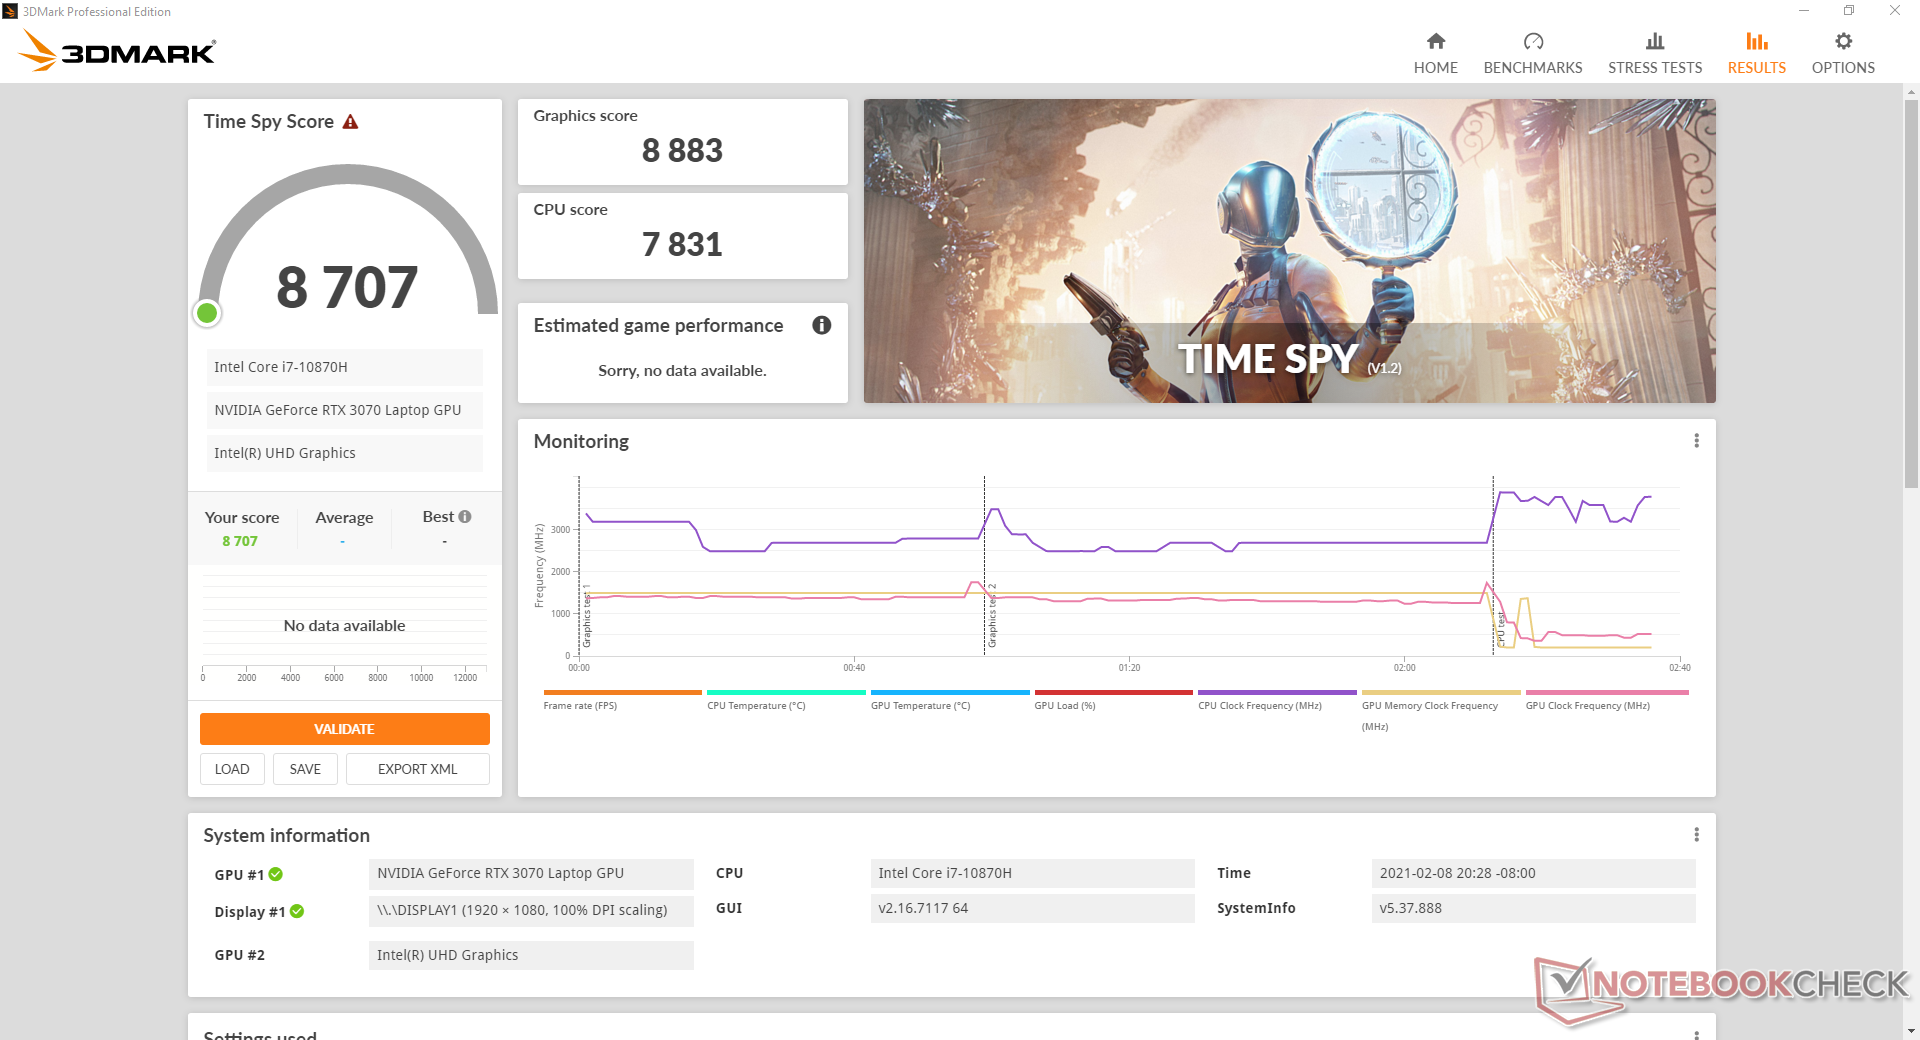
| 3DMark 11 Performance | 25114 points | |
| 3DMark Cloud Gate Standard Score | 49338 points | |
| 3DMark Fire Strike Score | 19754 points | |
| 3DMark Time Spy Score | 9140 points | |
Help | ||
| low | med. | high | ultra | |
|---|---|---|---|---|
| GTA V (2015) | 178 | 169 | 152 | 90.4 |
| The Witcher 3 (2015) | 335.9 | 246.7 | 152.6 | 89.7 |
| Dota 2 Reborn (2015) | 137 | 120 | 120 | 107 |
| Final Fantasy XV Benchmark (2018) | 151 | 111 | 87.5 | |
| X-Plane 11.11 (2018) | 107 | 90.5 | 76.4 | |
| Strange Brigade (2018) | 347 | 213 | 175 | 155 |
Emissions
System Noise
Fan noise is almost the same as last year's model despite the GPU update which isn't surprising because the cooling solution and TGP targets haven't changed. Though this means that owners are getting more performance at the same fan noise level, it also means that MSI hasn't improved fan noise behavior without resorting to Nvidia Whisper Mode 2.0 which limits frame rates. We complained about the constant fan noise on last year's GS66 even when simply idling on "Silent" mode and this remains true for the 2021 model. The fans would also tend to pulse between 40.8 dB(A) to 46.3 dB(A) during our Witcher 3 run.
Enabling Cooler Boost mode, which is MSI's version of "Turbo" mode, bumps fan noise to 58 dB(A) no matter the onscreen load. Note that this increase is very significant relative to the small performance benefits gained as shown in our Stress Test section. Gamers may want to think twice about using this feature as its benefits may not be worth it.
| MSI GS66 Stealth 10UG GeForce RTX 3070 Laptop GPU, i7-10870H, WDC PC SN730 SDBPNTY-1T00 | MSI GS66 10SGS GeForce RTX 2080 Super Max-Q, i7-10750H, Samsung SSD PM981 MZVLB512HAJQ | Asus TUF Dash F15 FX516PR GeForce RTX 3070 Laptop GPU, i7-11370H, SK Hynix HFM001TD3JX013N | Razer Blade 15 RTX 2070 Super Max-Q GeForce RTX 2070 Super Max-Q, i7-10875H, Samsung SSD PM981a MZVLB512HBJQ | Alienware m15 R3 P87F GeForce RTX 2070 Mobile, i7-10750H, 2x Micron 2200S 512 GB (RAID 0) | |
|---|---|---|---|---|---|
| Noise | 5% | 5% | 9% | 8% | |
| off / environment * (dB) | 26.2 | 28.5 -9% | 24 8% | 27 -3% | 26.3 -0% |
| Idle Minimum * (dB) | 34 | 30 12% | 25 26% | 27 21% | 26.7 21% |
| Idle Average * (dB) | 34 | 30 12% | 30 12% | 27 21% | 26.7 21% |
| Idle Maximum * (dB) | 34 | 30.9 9% | 35 -3% | 27 21% | 30.7 10% |
| Load Average * (dB) | 47.2 | 39.5 16% | 53 -12% | 44.7 5% | 40.2 15% |
| Witcher 3 ultra * (dB) | 46.3 | 48 -4% | 48 -4% | 51.2 -11% | 51 -10% |
| Load Maximum * (dB) | 58.2 | 59.4 -2% | 54 7% | 54 7% | 59.7 -3% |
* ... smaller is better
Noise level
| Idle |
| 34 / 34 / 34 dB(A) |
| Load |
| 47.2 / 58.2 dB(A) |
 | ||
30 dB silent 40 dB(A) audible 50 dB(A) loud |
||
min: | ||
Temperature
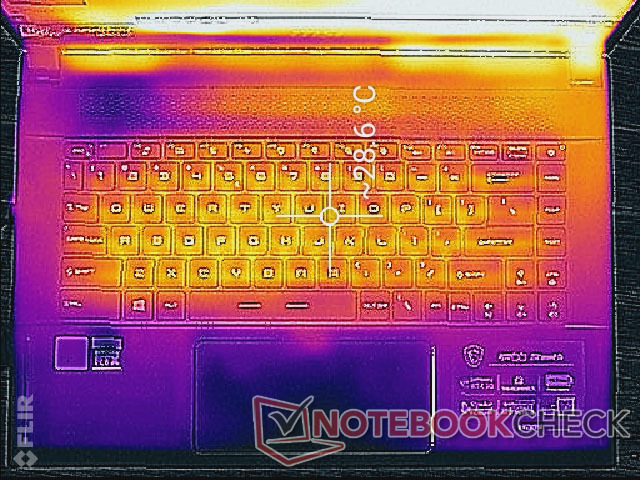
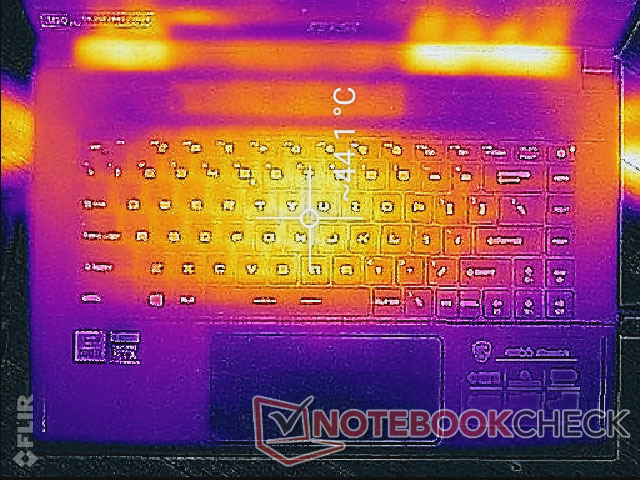
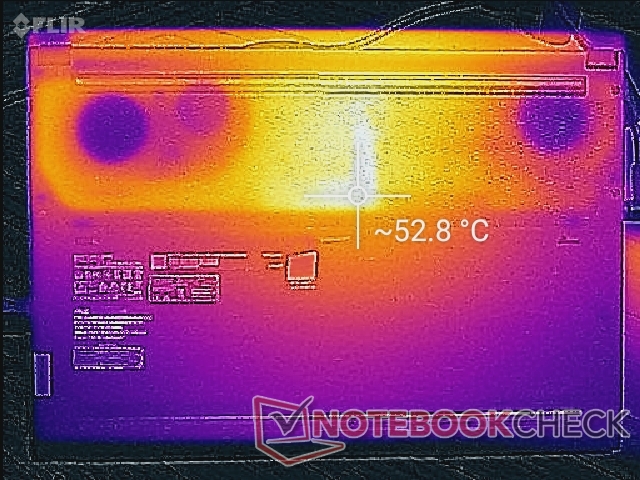
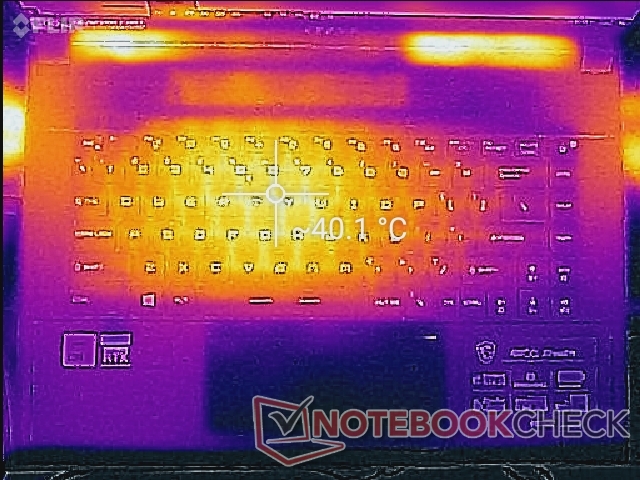
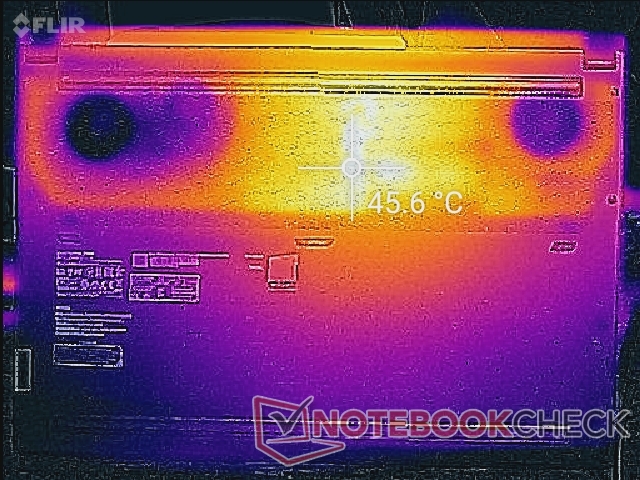
Surface temperatures are not too different from the Turing-powered GS66 SKUs since MSI is aiming for similar thermals gen-to-gen. The keyboard center can be as warm as 44 C when gaming while the palm rests, WASD keys, and arrow keys remain much cooler for more comfortable gaming. The competing Razer Blade 15 runs warmer especially on the palm rests due to its tougher unibody design and lower number of ventilation grilles.
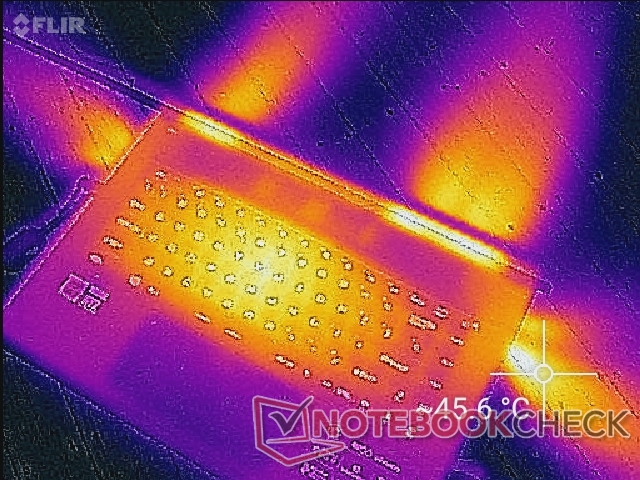
(±) The maximum temperature on the upper side is 40.2 °C / 104 F, compared to the average of 40.4 °C / 105 F, ranging from 21.2 to 68.8 °C for the class Gaming.
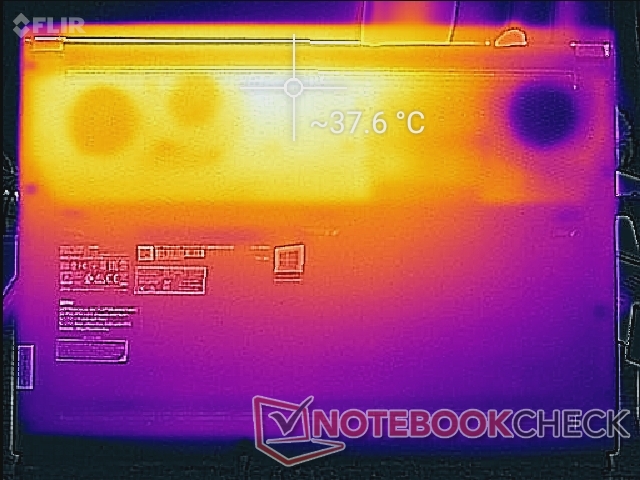
(-) The bottom heats up to a maximum of 45.6 °C / 114 F, compared to the average of 43.3 °C / 110 F
(+) In idle usage, the average temperature for the upper side is 27 °C / 81 F, compared to the device average of 33.9 °C / 93 F.
(+) Playing The Witcher 3, the average temperature for the upper side is 31.3 °C / 88 F, compared to the device average of 33.9 °C / 93 F.
(+) The palmrests and touchpad are cooler than skin temperature with a maximum of 26.2 °C / 79.2 F and are therefore cool to the touch.
(+) The average temperature of the palmrest area of similar devices was 28.8 °C / 83.8 F (+2.6 °C / 4.6 F).
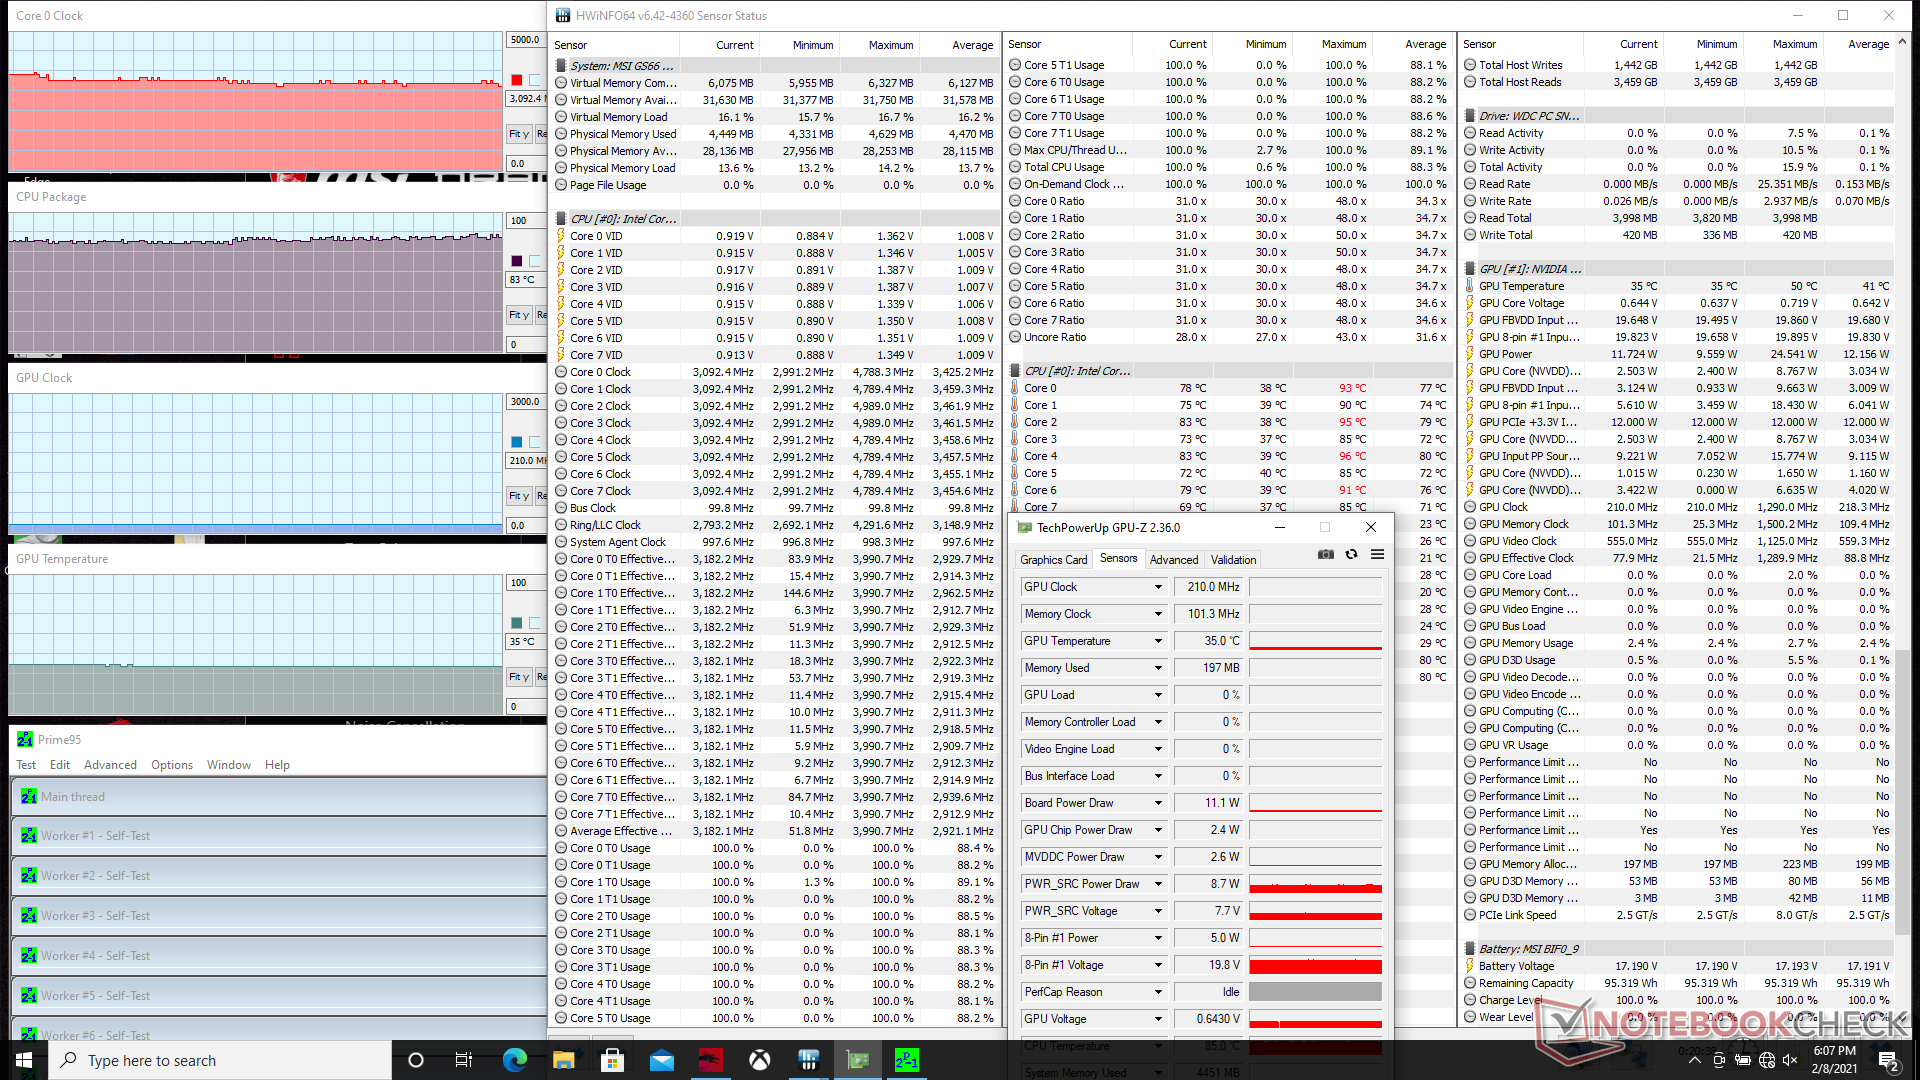
Stress Test
We stress the laptop with synthetic loads to identify for any potential throttling or stability issues in both Cooler Boost mode and non Cooler Boost mode. When running Prime95 with Cooler Boost off, the CPU would boost to 4 GHz and 95 C for the first few seconds before eventually falling and stabilizing at 3.0 GHz and 90 C. If Cooler Boost is enabled, core temperature would drop to 83 C while clock rates remain the same.
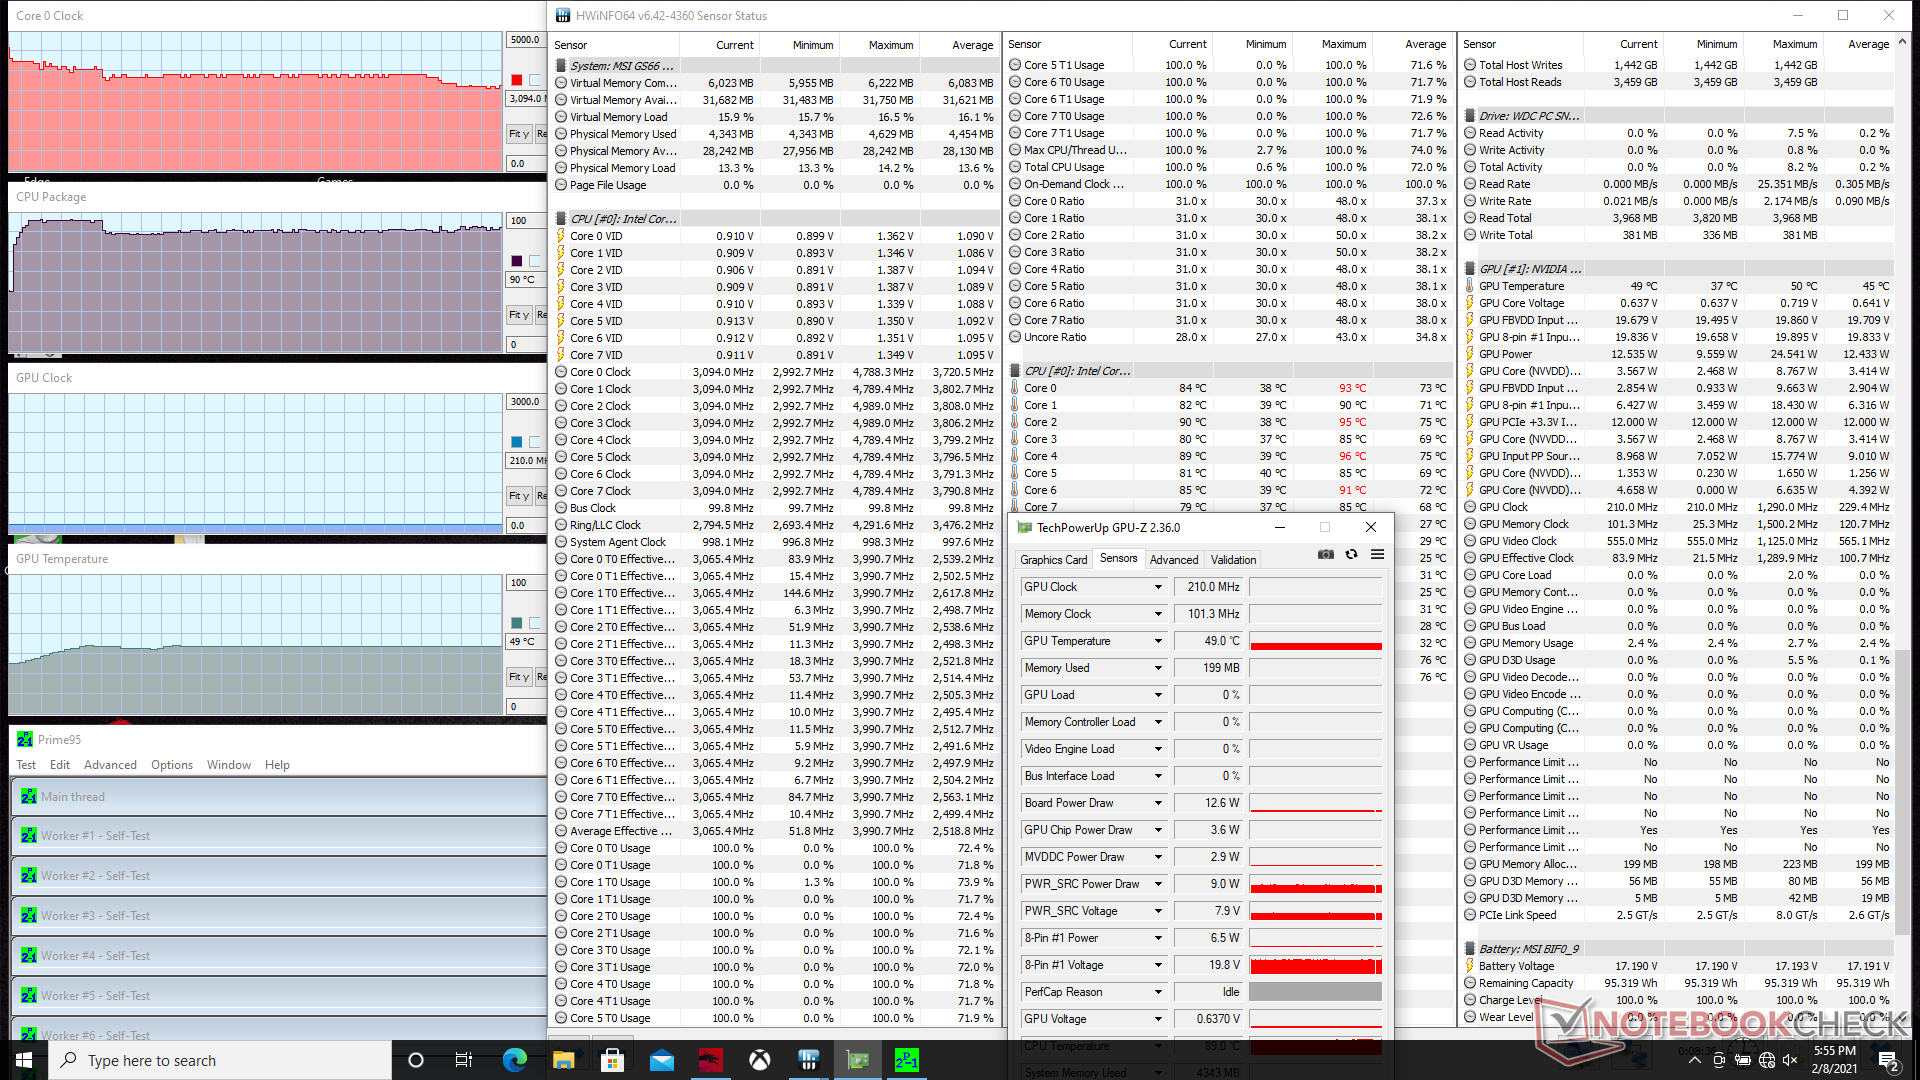
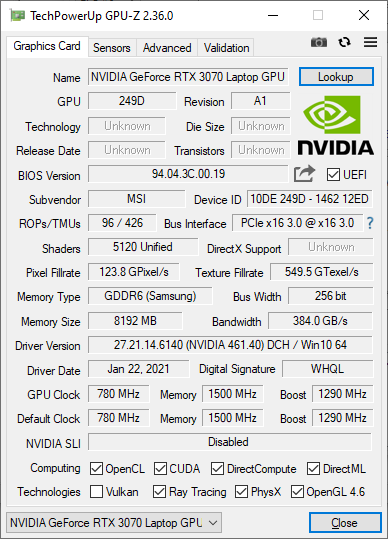
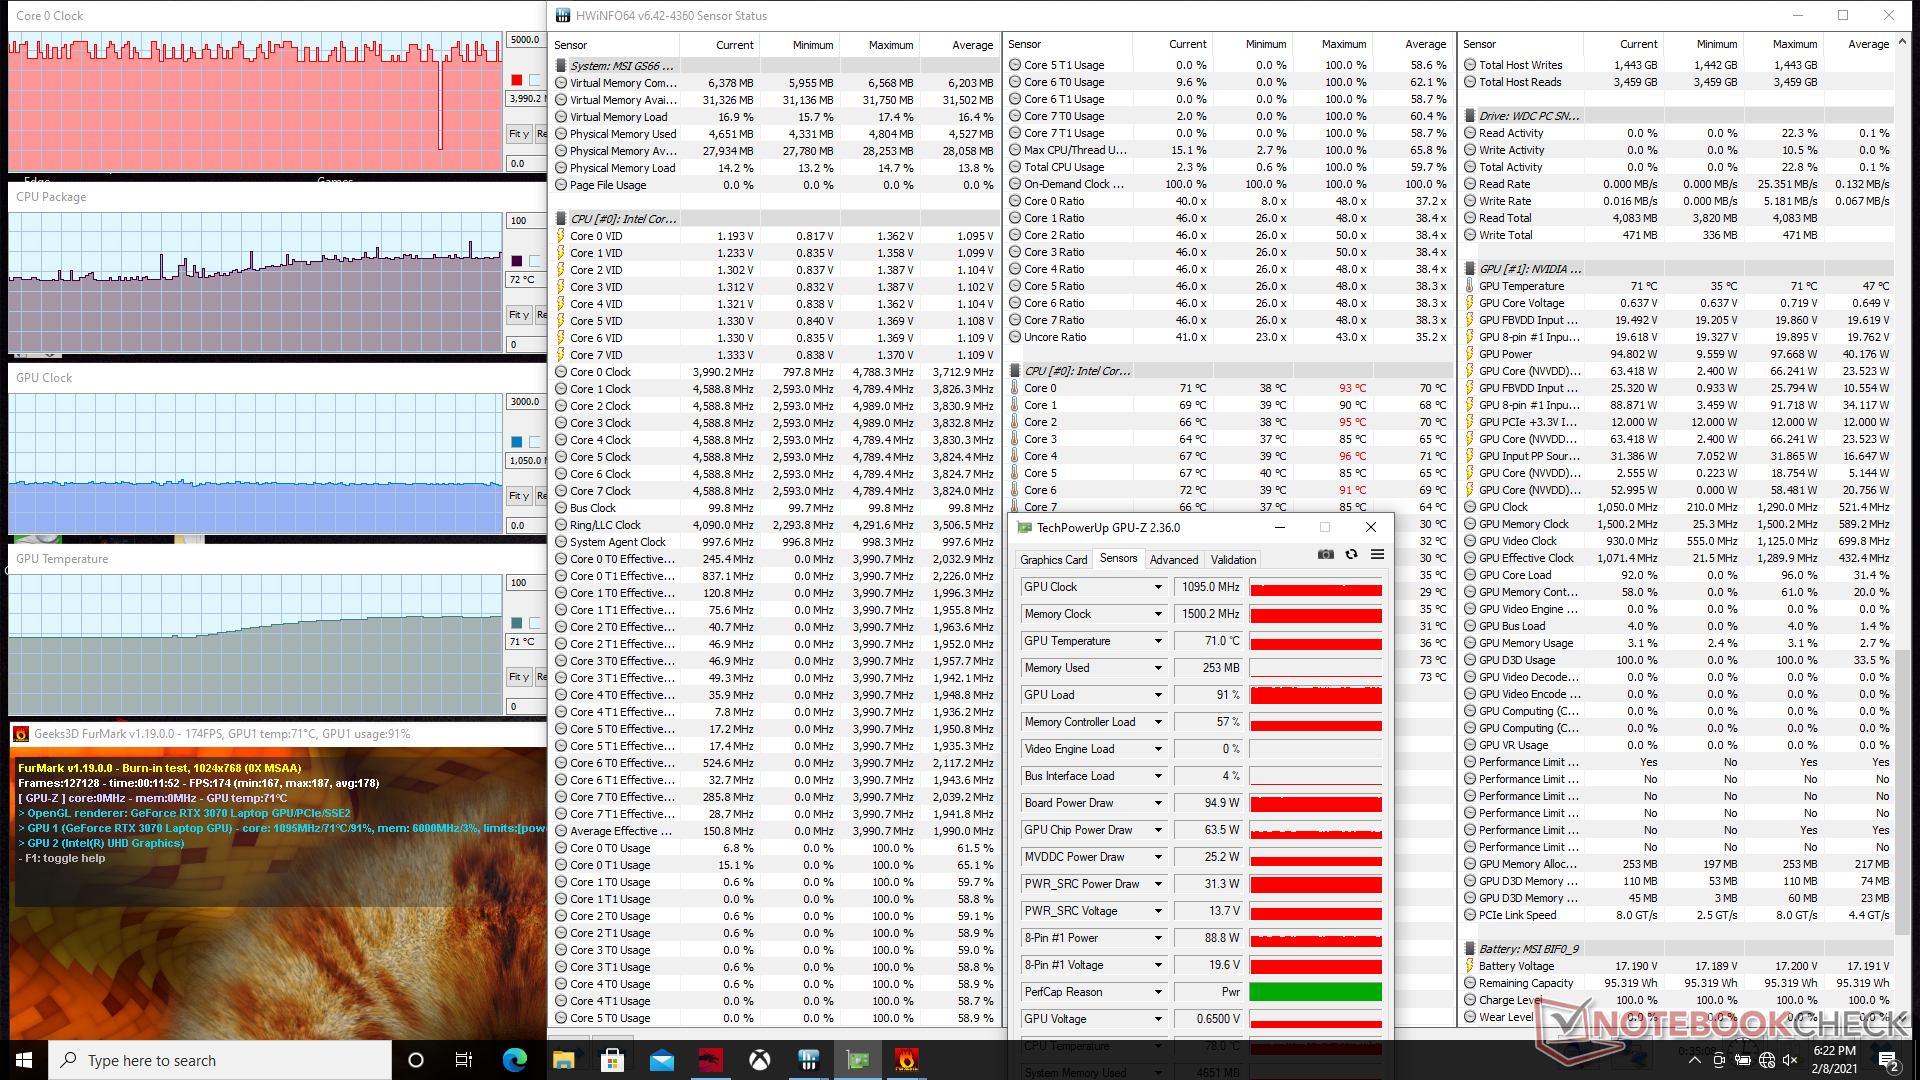
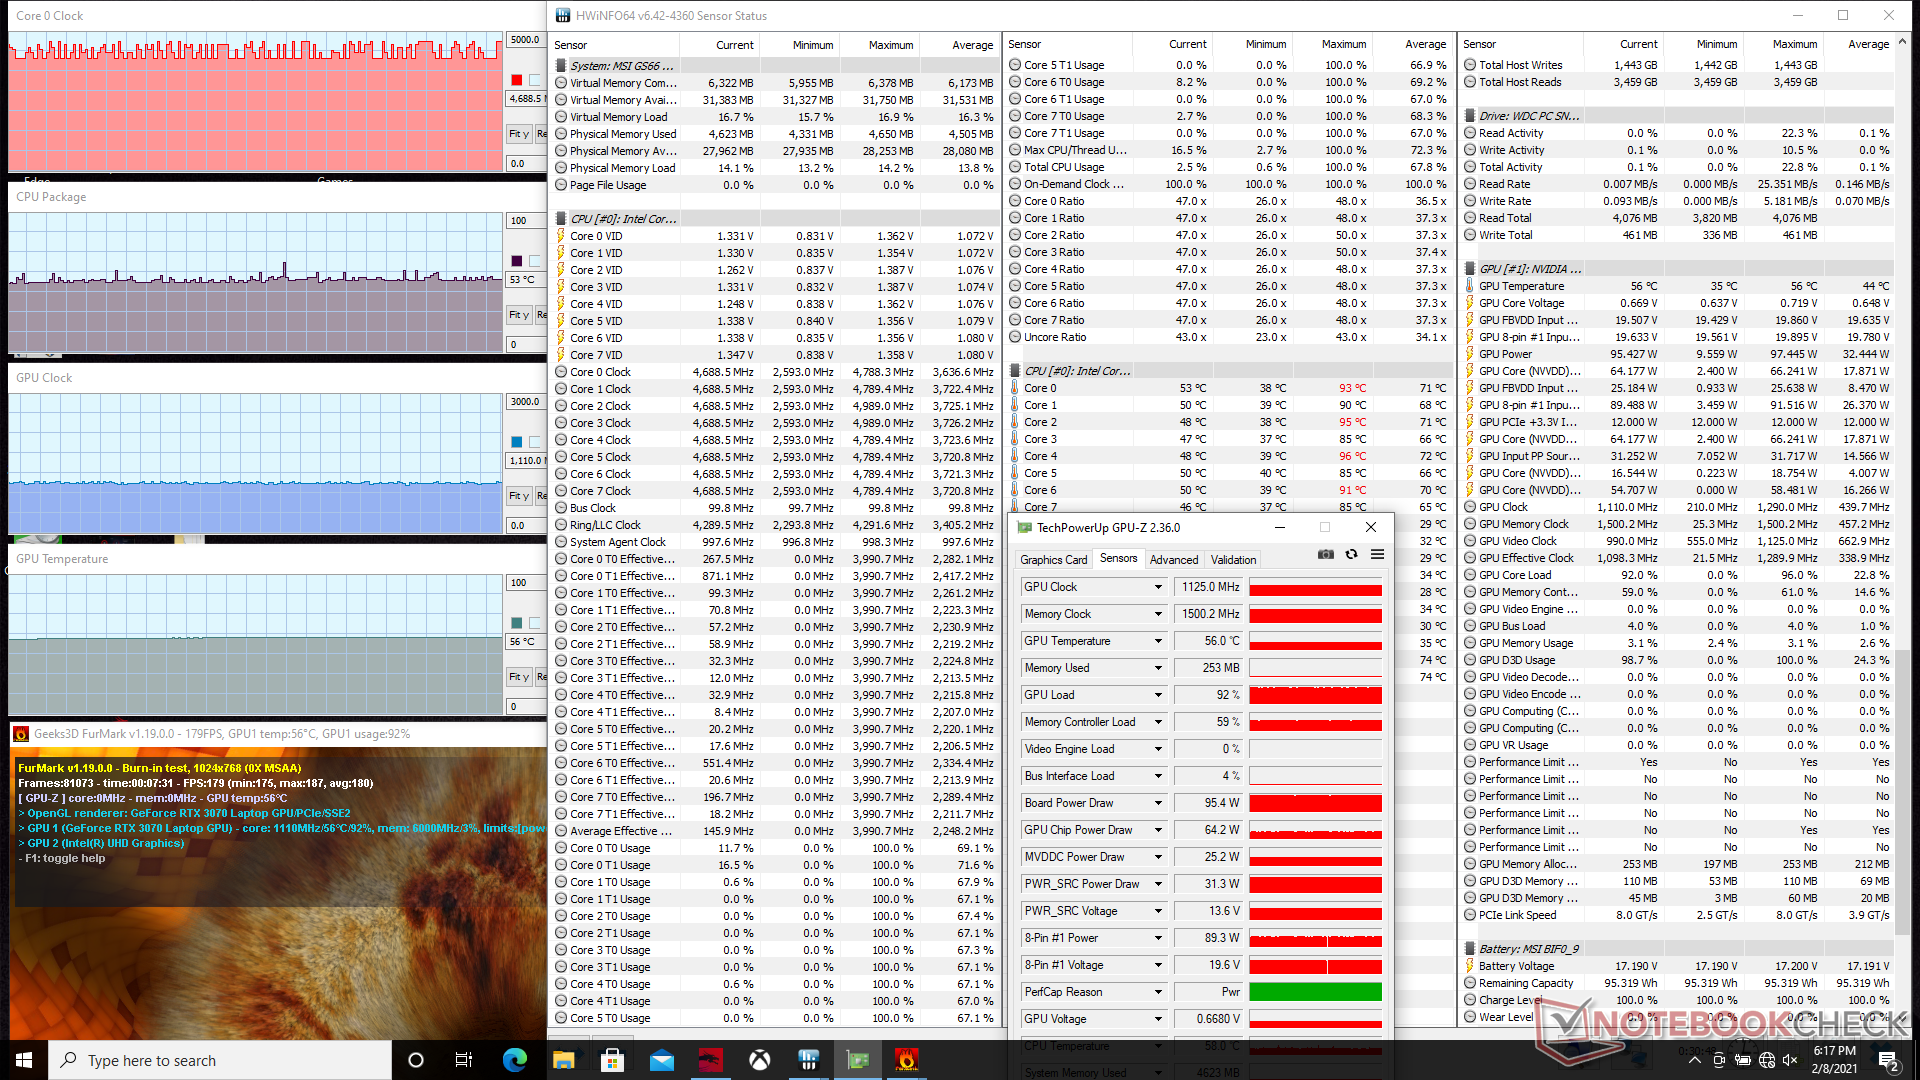
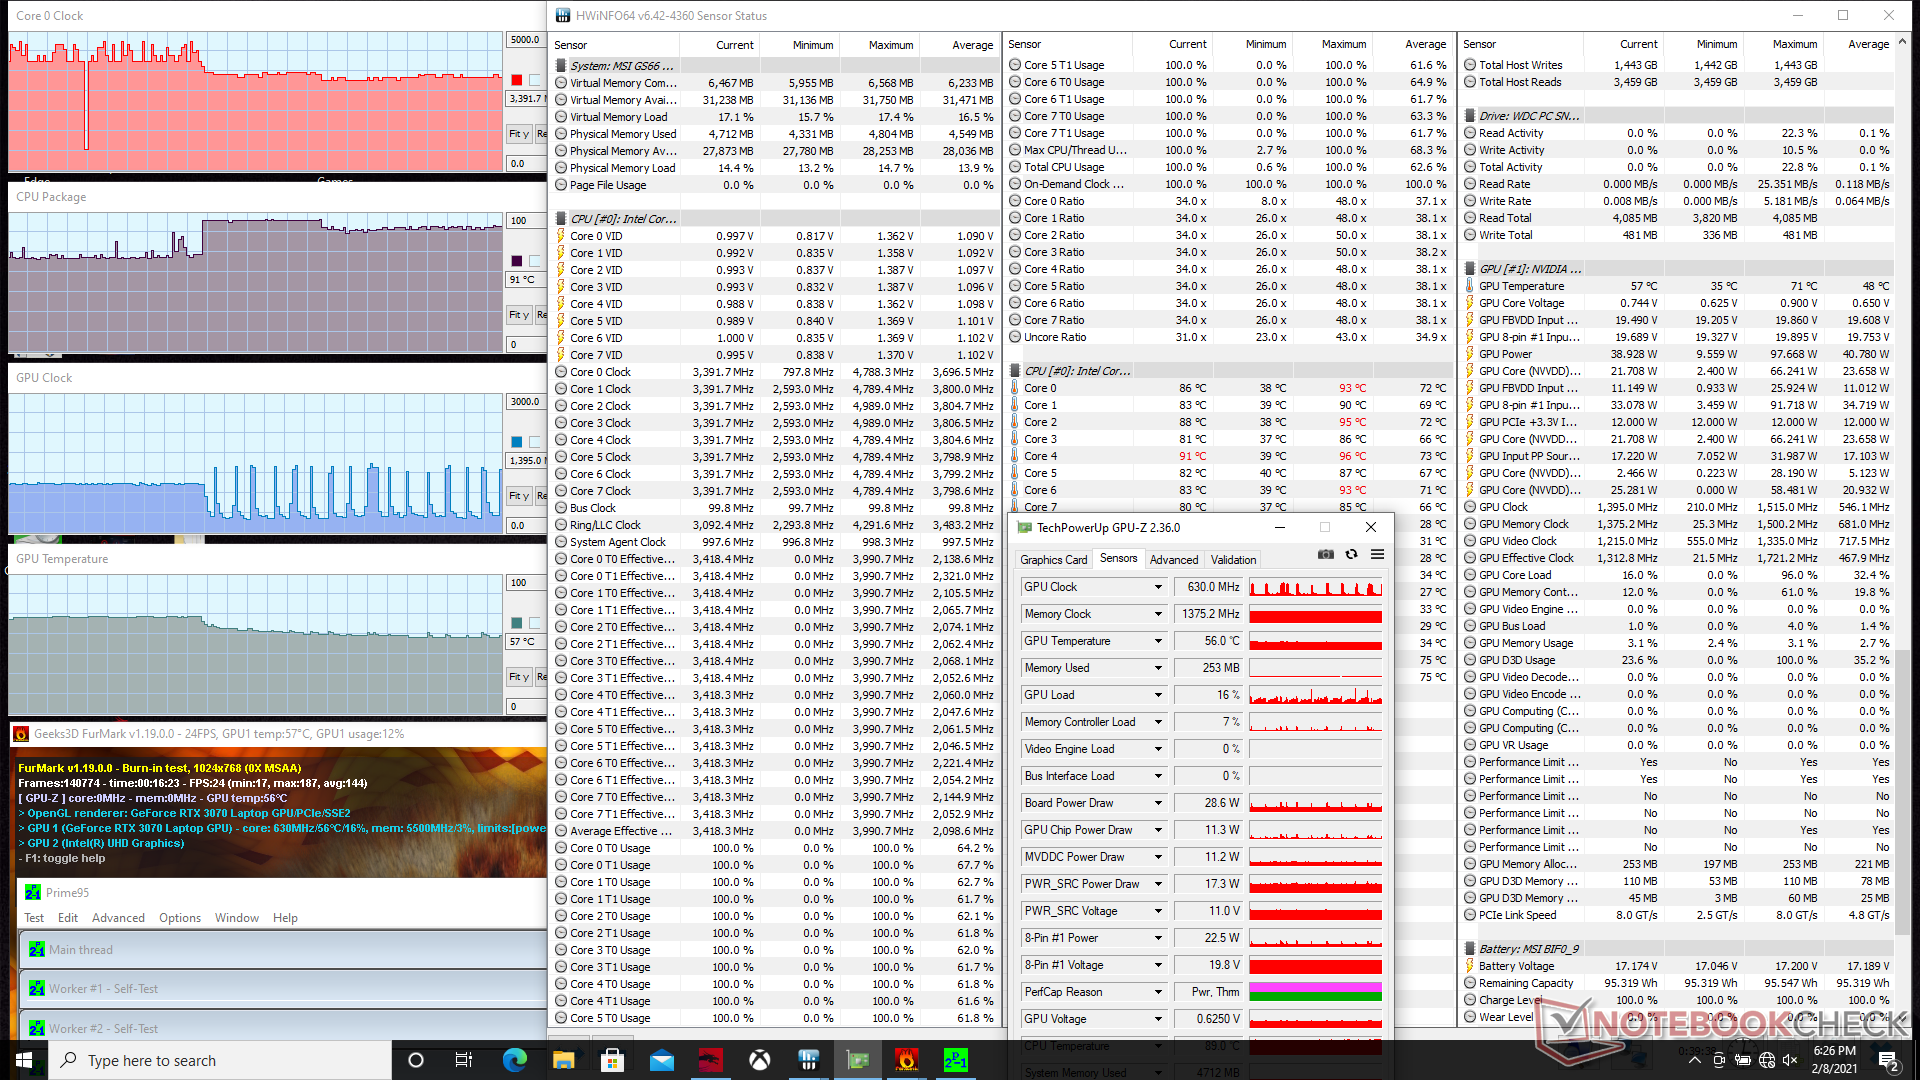
Running FurMark with Cooler Boost on would result in a significantly cooler GPU temperature of 56 C compared to 71 C if the feature was disabled. GPU clock rate would also run slightly higher by about 50 to 60 MHz. GPU-Z shows a sustained board power draw of 95.4 W to match MSI's claim of a 95 W TGP.


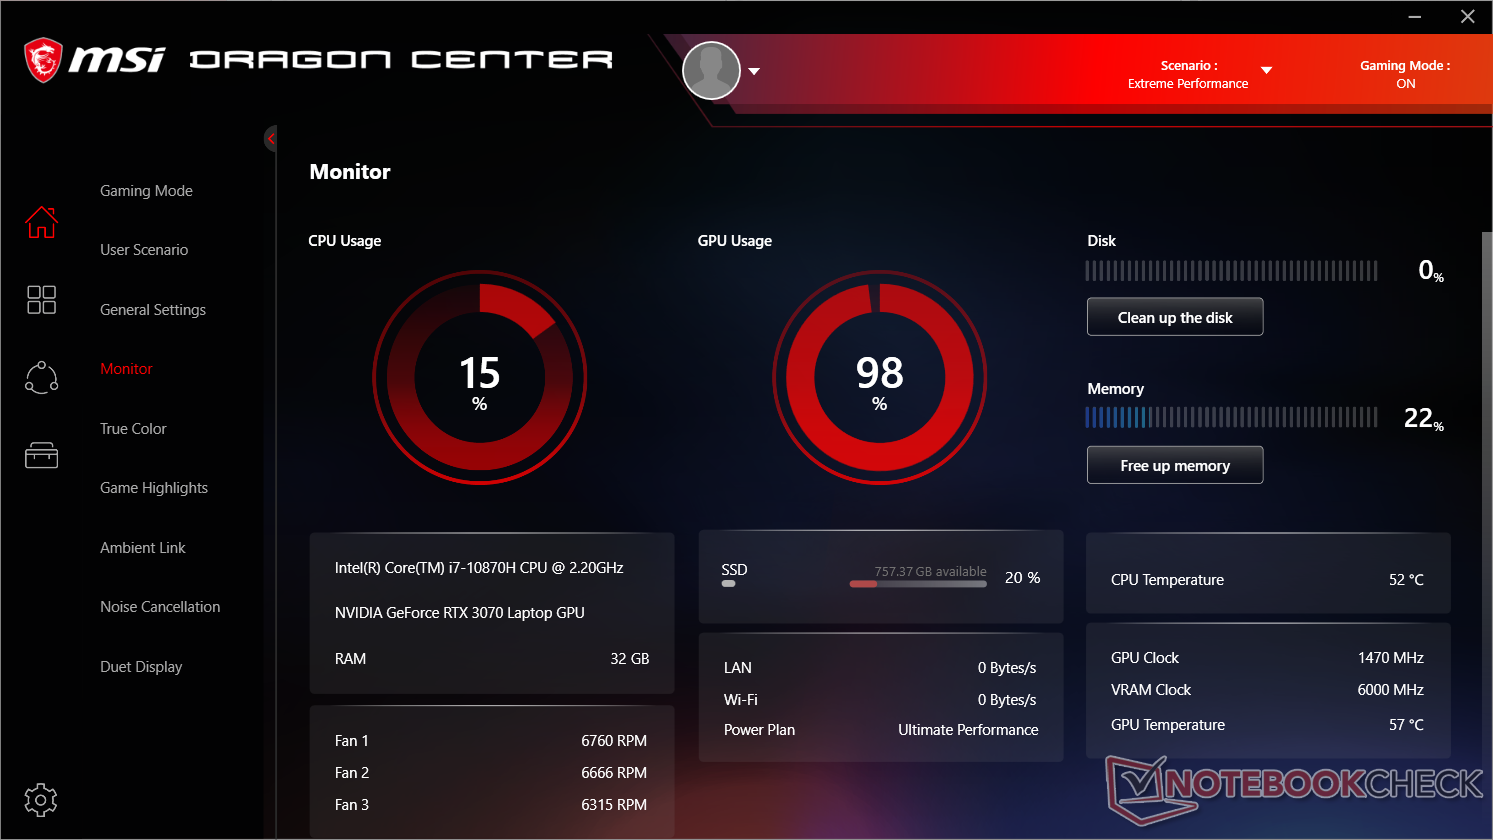
Running Witcher 3 is more representative of real-world gaming loads than either Prime95 or FurMark. The CPU and GPU would stabilize at relatively cool temperatures of 66 C and 71 C, respectively, even without enabling Cooler Boost. Enabling the feature would cause CPU and GPU temperatures to drop to just 50 C and 57 C, respectively. Clock Rates aren't even that much higher with Cooler Boost despite the extreme fan noise increase. Thus, Cooler Boost mode has more to do with improving temperatures than maximizing frame rates when gaming.
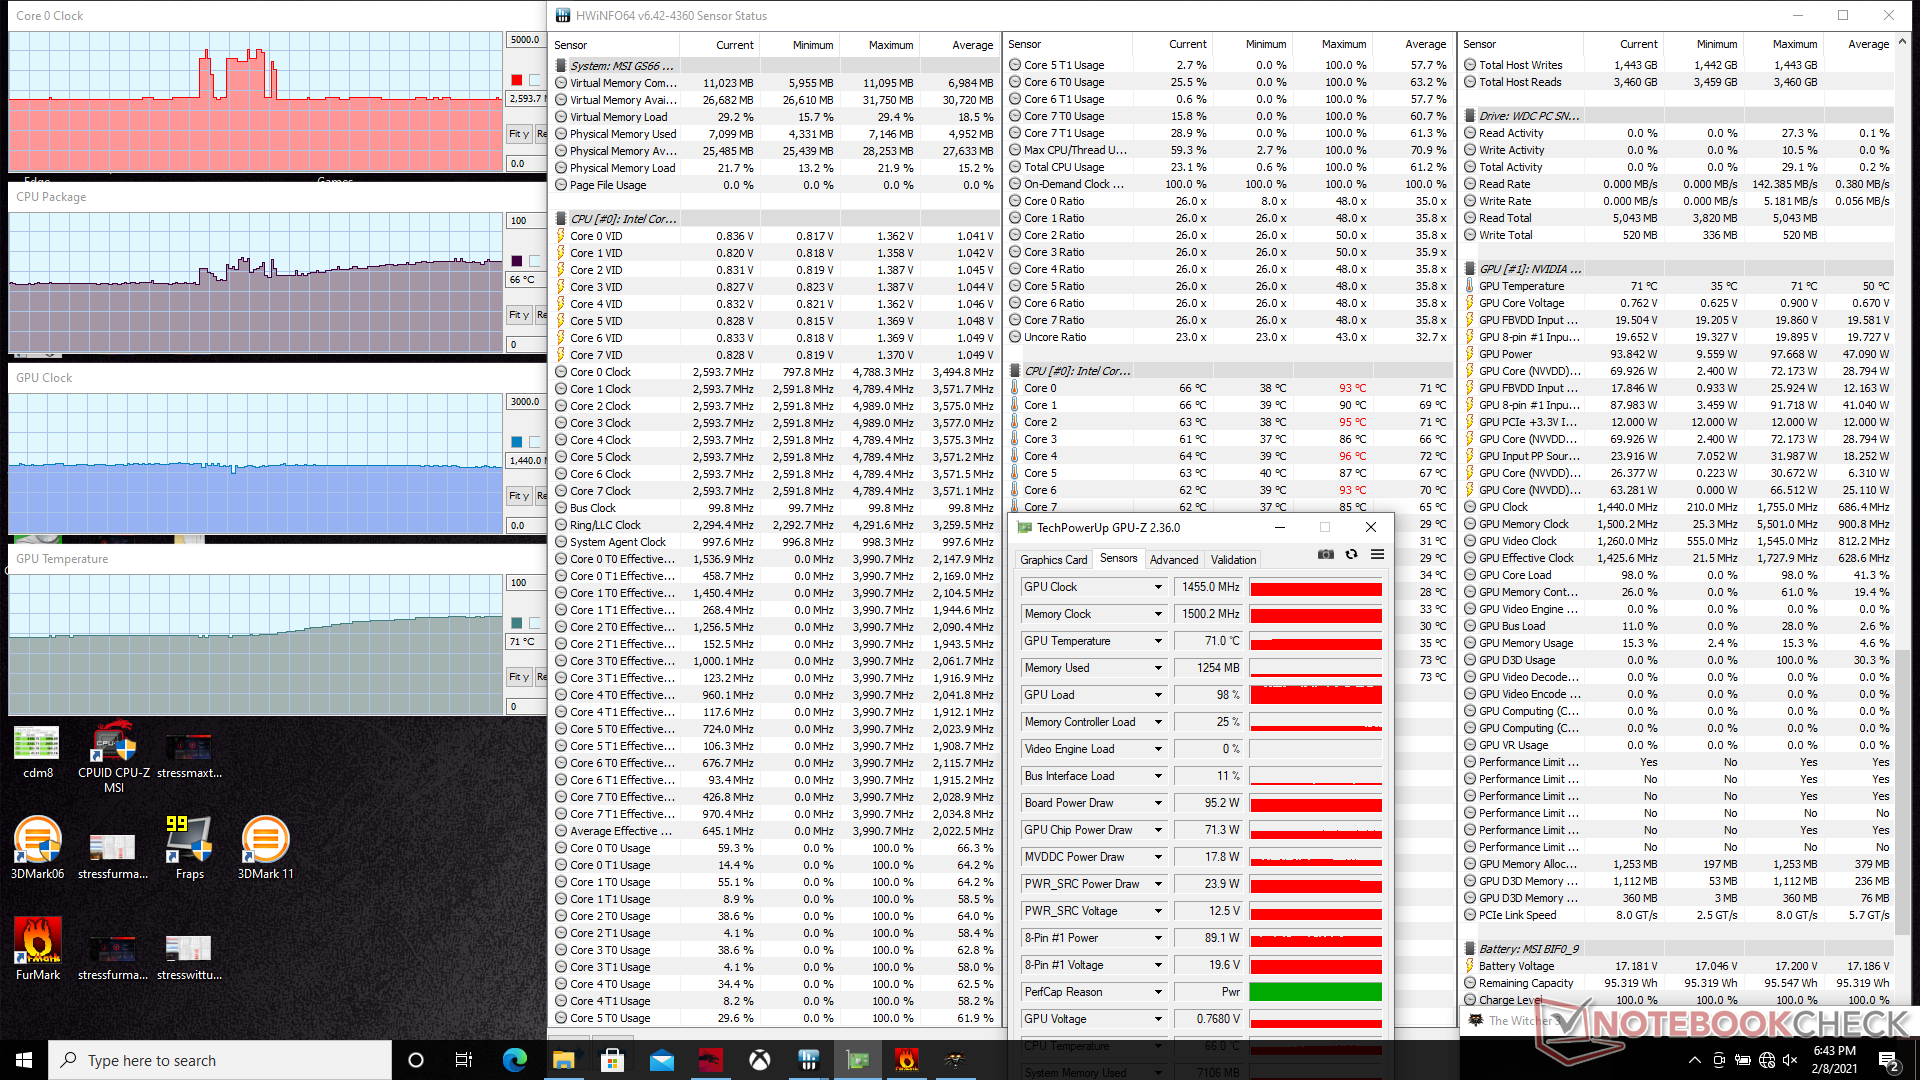

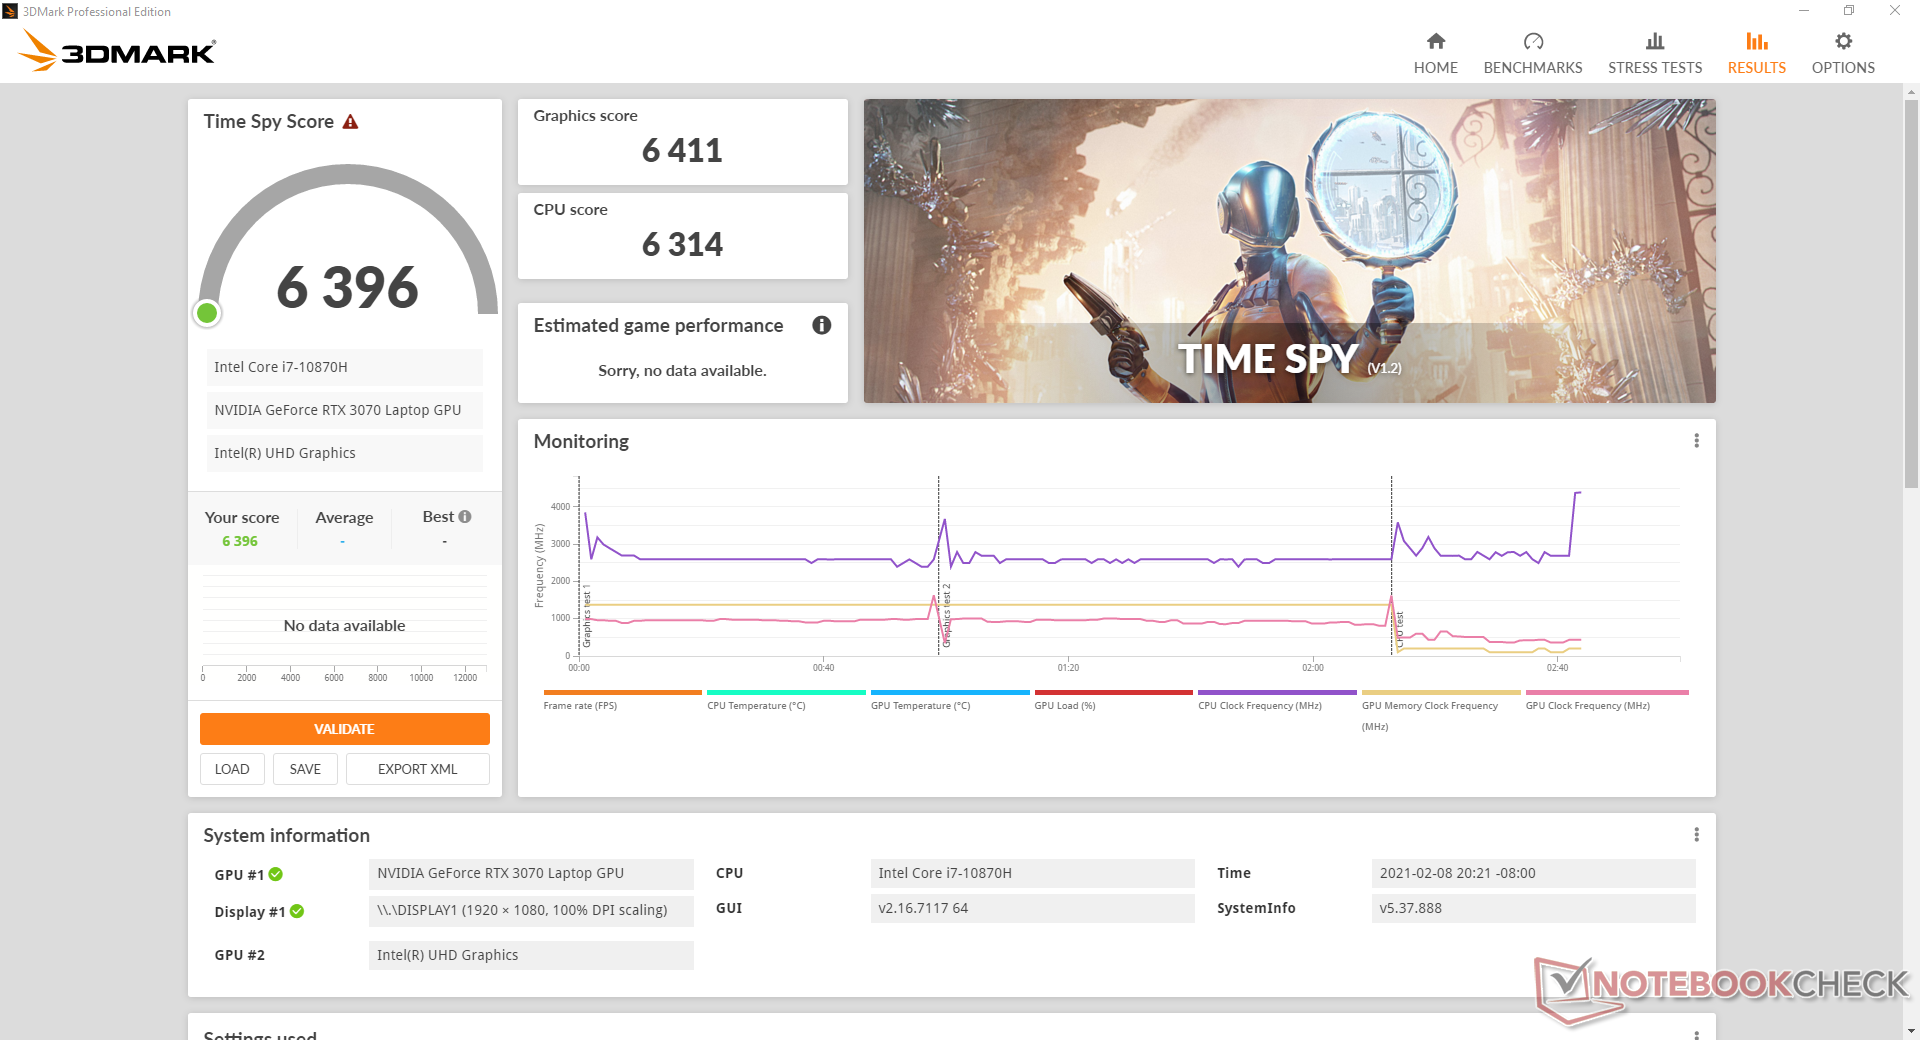
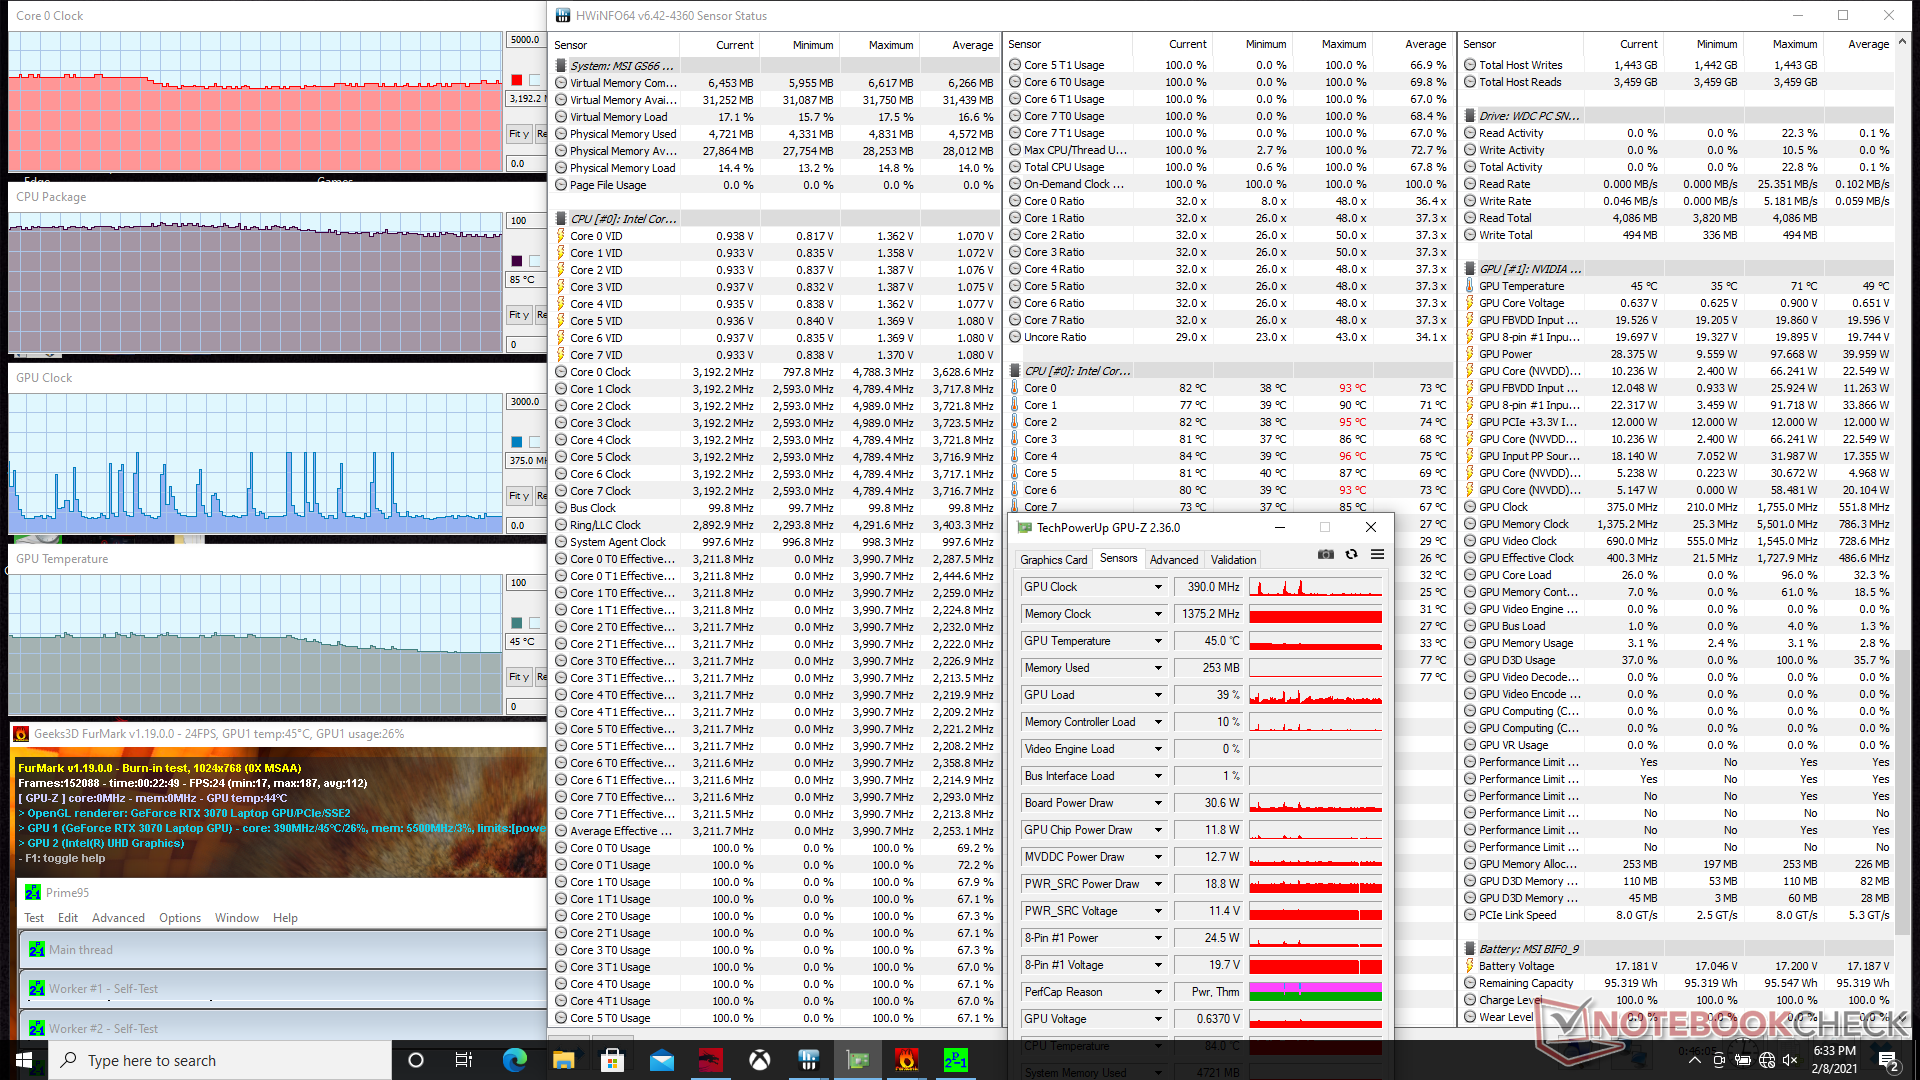
Running both Prime95 and FurMark simultaneously throttles the GPU quite heavily down to around 375 MHz and 31 W power draw regardless of the Cooler Boost setting. The CPU, however, remains almost unaffected as it will still run at over 3 GHz.
| CPU Clock (GHz) | GPU Clock (MHz) | Average CPU Temperature (°C) | Average GPU Temperature (°C) | |
| System Idle (Cooler Boost off) | -- | -- | 41 | 37 |
| Prime95 Stress (Cooler Boost off) | 3.0 - 3.1 | -- | 90 | 49 |
| Prime95 Stress (Cooler Boost on) | 3.0 - 3.1 | -- | 83 | 35 |
| FurMark Stress (Cooler Boost off) | -- | 1050 | 72 | 71 |
| FurMark Stress (Cooler Boost on) | -- | 1110 | 53 | 56 |
| Witcher 3 Stress (Cooler Boost off) | 2.7 | 1440 | 66 | 71 |
| Witcher 3 Stress (Cooler Boost on) | 2.7 | 1515 | 50 | 57 |
| Prime95 + FurMark Stress (Cooler Boost off) | 3.3 - 3.4 | 375 - 1440 | 91 | 57 |
| Prime95 + FurMark Stress (Cooler Boost on) | 3.1 - 3.2 | 375 | 85 | 45 |
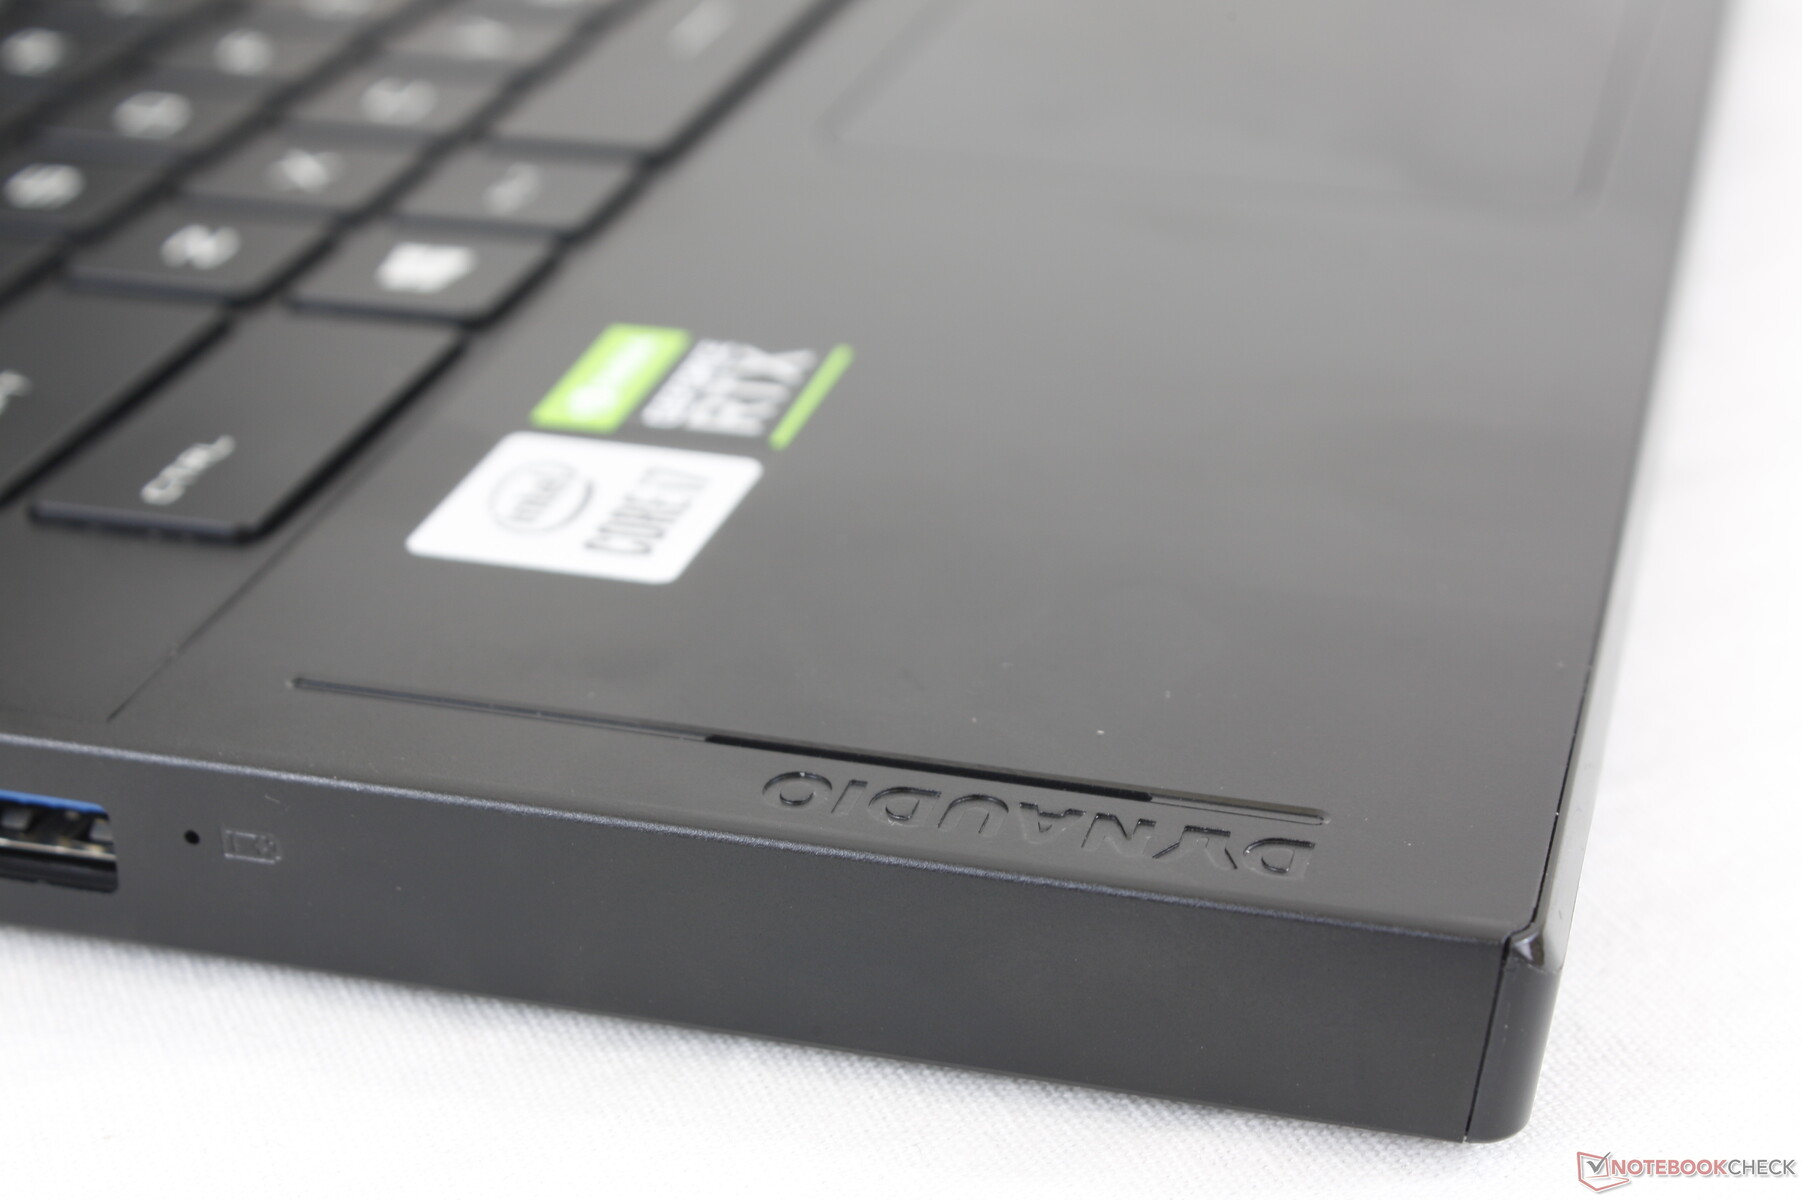
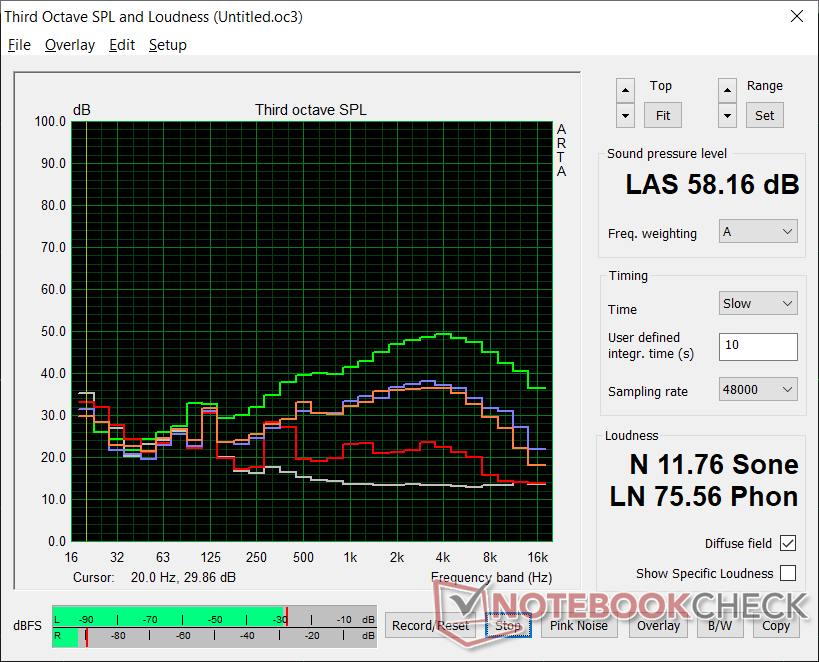
Speakers


MSI GS66 Stealth 10UG audio analysis
(±) | speaker loudness is average but good (81 dB)
Bass 100 - 315 Hz
(-) | nearly no bass - on average 18.9% lower than median
(±) | linearity of bass is average (13.6% delta to prev. frequency)
Mids 400 - 2000 Hz
(±) | higher mids - on average 6.1% higher than median
(+) | mids are linear (5.7% delta to prev. frequency)
Highs 2 - 16 kHz
(+) | balanced highs - only 2.4% away from median
(±) | linearity of highs is average (8% delta to prev. frequency)
Overall 100 - 16.000 Hz
(±) | linearity of overall sound is average (20.3% difference to median)
Compared to same class
» 71% of all tested devices in this class were better, 6% similar, 23% worse
» The best had a delta of 6%, average was 18%, worst was 132%
Compared to all devices tested
» 52% of all tested devices were better, 8% similar, 39% worse
» The best had a delta of 4%, average was 24%, worst was 134%
Apple MacBook 12 (Early 2016) 1.1 GHz audio analysis
(+) | speakers can play relatively loud (83.6 dB)
Bass 100 - 315 Hz
(±) | reduced bass - on average 11.3% lower than median
(±) | linearity of bass is average (14.2% delta to prev. frequency)
Mids 400 - 2000 Hz
(+) | balanced mids - only 2.4% away from median
(+) | mids are linear (5.5% delta to prev. frequency)
Highs 2 - 16 kHz
(+) | balanced highs - only 2% away from median
(+) | highs are linear (4.5% delta to prev. frequency)
Overall 100 - 16.000 Hz
(+) | overall sound is linear (10.2% difference to median)
Compared to same class
» 7% of all tested devices in this class were better, 2% similar, 91% worse
» The best had a delta of 5%, average was 18%, worst was 53%
Compared to all devices tested
» 5% of all tested devices were better, 1% similar, 94% worse
» The best had a delta of 4%, average was 24%, worst was 134%
Energy Management
Power Consumption
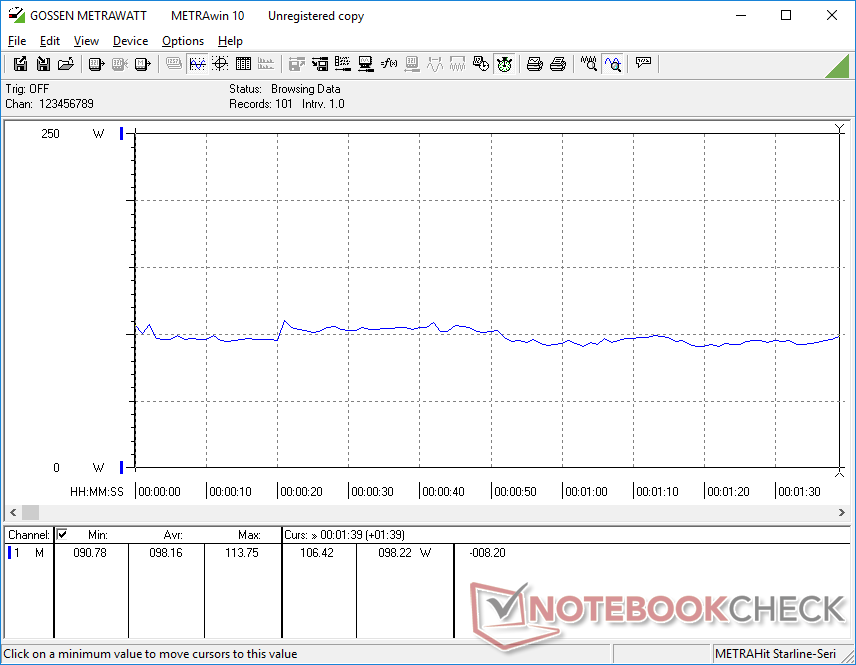
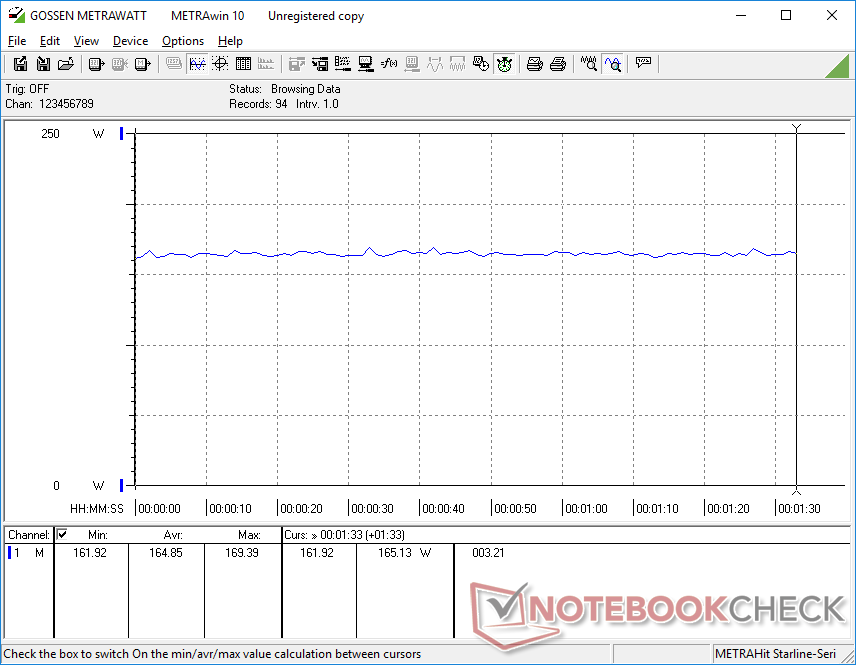
Overall power consumption is similar to what we recorded on the GS66 10SFS with the older GeForce RTX 2070 Super Max-Q. Most notably, power consumption on our GS66 10UG is only about 6 percent higher when gaming even though the system offers roughly 30 percent faster graphics performance to show superior performance-per-watt over last year's Turing GPU.
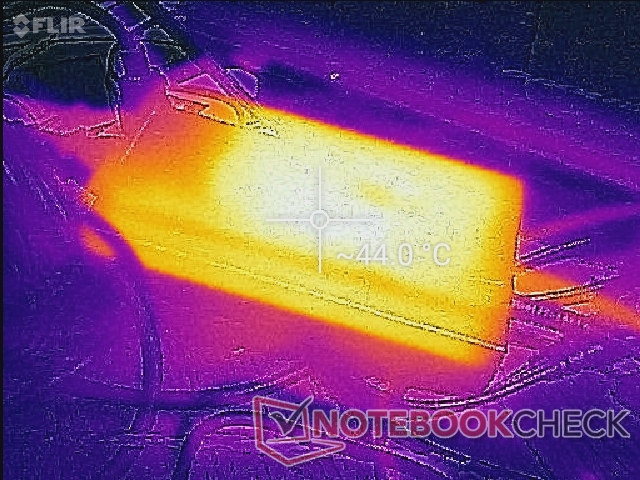
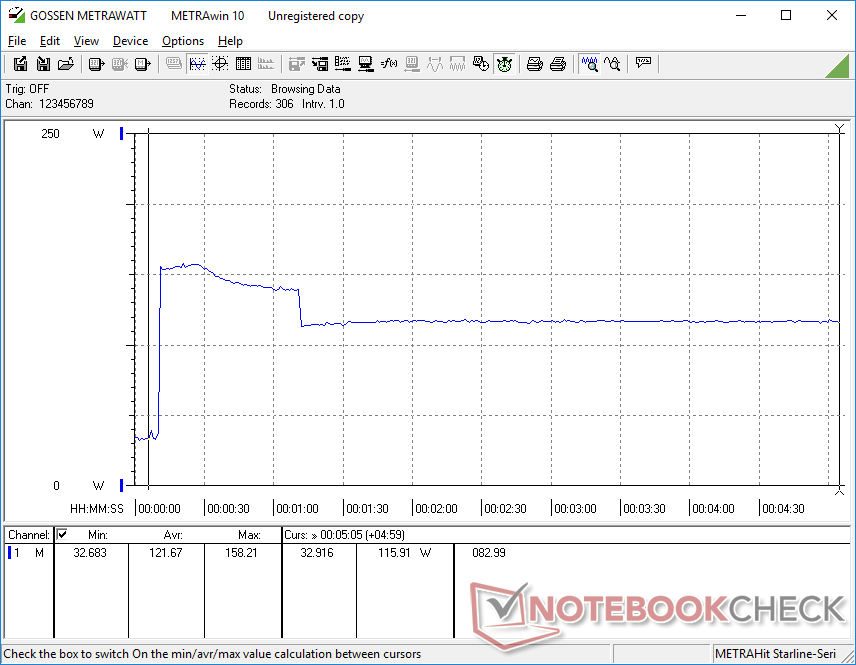
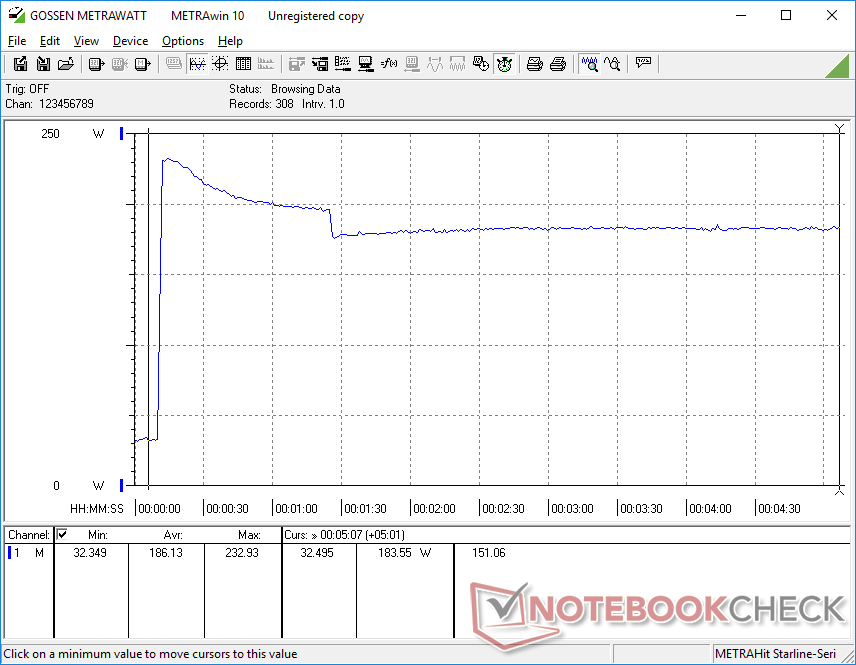
We're able to record a temporary maximum draw of 233 W from the medium-large (~15.3 x 7.3 x 3 cm) 230 W AC adapter when running Prime95 and FurMark simultaneously. The sustained rate is closer to 184 W due to thermal limitations.
| Off / Standby | |
| Idle | |
| Load |
|
Key:
min: | |
| MSI GS66 Stealth 10UG i7-10870H, GeForce RTX 3070 Laptop GPU, WDC PC SN730 SDBPNTY-1T00, IPS, 1920x1080, 15.6" | MSI GS66 10SGS i7-10750H, GeForce RTX 2080 Super Max-Q, Samsung SSD PM981 MZVLB512HAJQ, IPS, 1920x1080, 15.6" | Asus TUF Dash F15 FX516PR i7-11370H, GeForce RTX 3070 Laptop GPU, SK Hynix HFM001TD3JX013N, IPS, 1920x1080, 15.6" | Alienware m15 R3 P87F i7-10750H, GeForce RTX 2070 Mobile, 2x Micron 2200S 512 GB (RAID 0), IPS, 1920x1080, 15.6" | MSI GS66 Stealth 10SFS i9-10980HK, GeForce RTX 2070 Super Max-Q, Samsung SSD PM981 MZVLB1T0HALR, IPS, 1920x1080, 15.6" | |
|---|---|---|---|---|---|
| Power Consumption | -3% | 25% | -95% | -2% | |
| Idle Minimum * (Watt) | 12.9 | 14.9 -16% | 9 30% | 34 -164% | 13 -1% |
| Idle Average * (Watt) | 15.4 | 17.5 -14% | 11 29% | 48.6 -216% | 16 -4% |
| Idle Maximum * (Watt) | 27.1 | 29.5 -9% | 16 41% | 58.2 -115% | 27 -0% |
| Load Average * (Watt) | 98.2 | 94.8 3% | 107 -9% | 129.4 -32% | 109 -11% |
| Witcher 3 ultra * (Watt) | 164.9 | 146.1 11% | 121 27% | 214.5 -30% | 155 6% |
| Load Maximum * (Watt) | 232.9 | 210.9 9% | 162 30% | 257.3 -10% | 236 -1% |
* ... smaller is better
Battery Life
Runtimes are almost identical to what we recorded on the older Turing-powered GS66 10SGS at about 7 hours of real-world WLAN use when on the Balanced power profile. The system can also recharge via USB-C albeit at a slower rate.
We experienced strange charging behavior with the included AC adapter on our test unit. When charging from empty, the charge rate would be extremely slow to the point where a full hour would charge just 10 percent. Then, the charge rate would inexplicably pick up to its "normal" rate to fully recharge the laptop 1.5 to 2 hours later. This same phenomenon would occur even after retests. We recommend new owners double-check their charge rates to make sure it's not taking longer than usual to recharge the battery.
| MSI GS66 Stealth 10UG i7-10870H, GeForce RTX 3070 Laptop GPU, 99.9 Wh | MSI GS66 10SGS i7-10750H, GeForce RTX 2080 Super Max-Q, 99.99 Wh | Asus TUF Dash F15 FX516PR i7-11370H, GeForce RTX 3070 Laptop GPU, 76 Wh | Razer Blade 15 RTX 2070 Super Max-Q i7-10875H, GeForce RTX 2070 Super Max-Q, 80 Wh | Aorus 15P WB i7-10750H, GeForce RTX 2070 Max-Q, 94.24 Wh | Alienware m15 R3 P87F i7-10750H, GeForce RTX 2070 Mobile, 86 Wh | |
|---|---|---|---|---|---|---|
| Battery runtime | -12% | 38% | -11% | 3% | -61% | |
| Reader / Idle (h) | 10.8 | 10.2 -6% | 16 48% | 11.3 5% | 5 -54% | |
| WiFi v1.3 (h) | 7.1 | 6.9 -3% | 9.1 28% | 6.3 -11% | 7.1 0% | 2.8 -61% |
| Load (h) | 2.2 | 1.6 -27% | 2.3 5% | 0.7 -68% |
Pros
Cons
Verdict

Upgrading from the desktop GeForce RTX 2070 to the desktop RTX 3070 will net owners a 40 to 45 percent gain in raw graphics performance. Meanwhile, upgrading from the mobile GeForce RTX 2070 to the mobile RTX 3070 will net owners a 25 to 30 percent gain. The 2021 GS66 may come equipped with a fancy new GPU, but power limitations remain similar for smaller gen-to-gen gains overall. It's faster for sure — just not by all that much. Gamers in the market for a new GS66 can still consider the slightly older and hopefully cheaper RTX 20 SKUs without feeling like they're missing out on anything huge.
The GS66 with GeForce RTX 30 graphics offers faster graphics performance than last year's options without needing to run warmer, louder, or shorter. However, the gains are slight to moderate at best.
It's recommended to avoid the Core i9-10980HK option as it offers no significant benefits over the Core i7-10875H or i7-10870H. Spending those extra dollars on more RAM, storage, or a faster GPU option would be a more balanced approach.
Price and availability
MSI GS66 Stealth 10UG
- 02/11/2021 v7 (old)
Allen Ngo
Price comparison
