MSI Alpha 17 gaming laptop in review: With a Ryzen 7 and Radeon RX 5600M

MSI is well positioned in the gaming sector and also has a wide product range of very large laptops. For example, we reviewed the quite inexpensive 17-inch MSI GF75 Thin 10SDR and the much more expensive 17-inch MSI GT76 Titan DT 10SG. The MSI Alpha 17 is now also available with the same display diagonal size, but it uses neither a graphics card from Nvidia nor a CPU from Intel.
Instead, an AMD Ryzen 7 4800H and an AMD Radeon RX 5600M are responsible for the processing and graphics performance. In addition, there's 16 GB of RAM and a 512 GB SSD. With this configuration, we compare the MSI Alpha 17 with the rivals listed below. However, other laptops from our database can also be added for comparison under each section.
Possible contenders in comparison
Rating | Date | Model | Weight | Height | Size | Resolution | Price |
|---|---|---|---|---|---|---|---|
| 83.3 % v7 (old) | 02 / 2021 | MSI Alpha 17 A4DEK R7 4800H, Radeon RX 5600M | 2.6 kg | 28 mm | 17.30" | 1920x1080 | |
| 81.4 % v7 (old) | 12 / 2020 | Schenker XMG Core 17 Comet Lake i7-10750H, GeForce GTX 1650 Ti Mobile | 2.5 kg | 30 mm | 17.30" | 1920x1080 | |
| 84.3 % v7 (old) | 08 / 2020 | Eluktronics RP-17 R7 4800H, GeForce RTX 2060 Mobile | 2.6 kg | 30 mm | 17.30" | 1920x1080 | |
| 83.7 % v7 (old) | 06 / 2020 | Dell G5 15 SE 5505 P89F R7 4800H, Radeon RX 5600M | 2.4 kg | 21.6 mm | 15.60" | 1920x1080 |
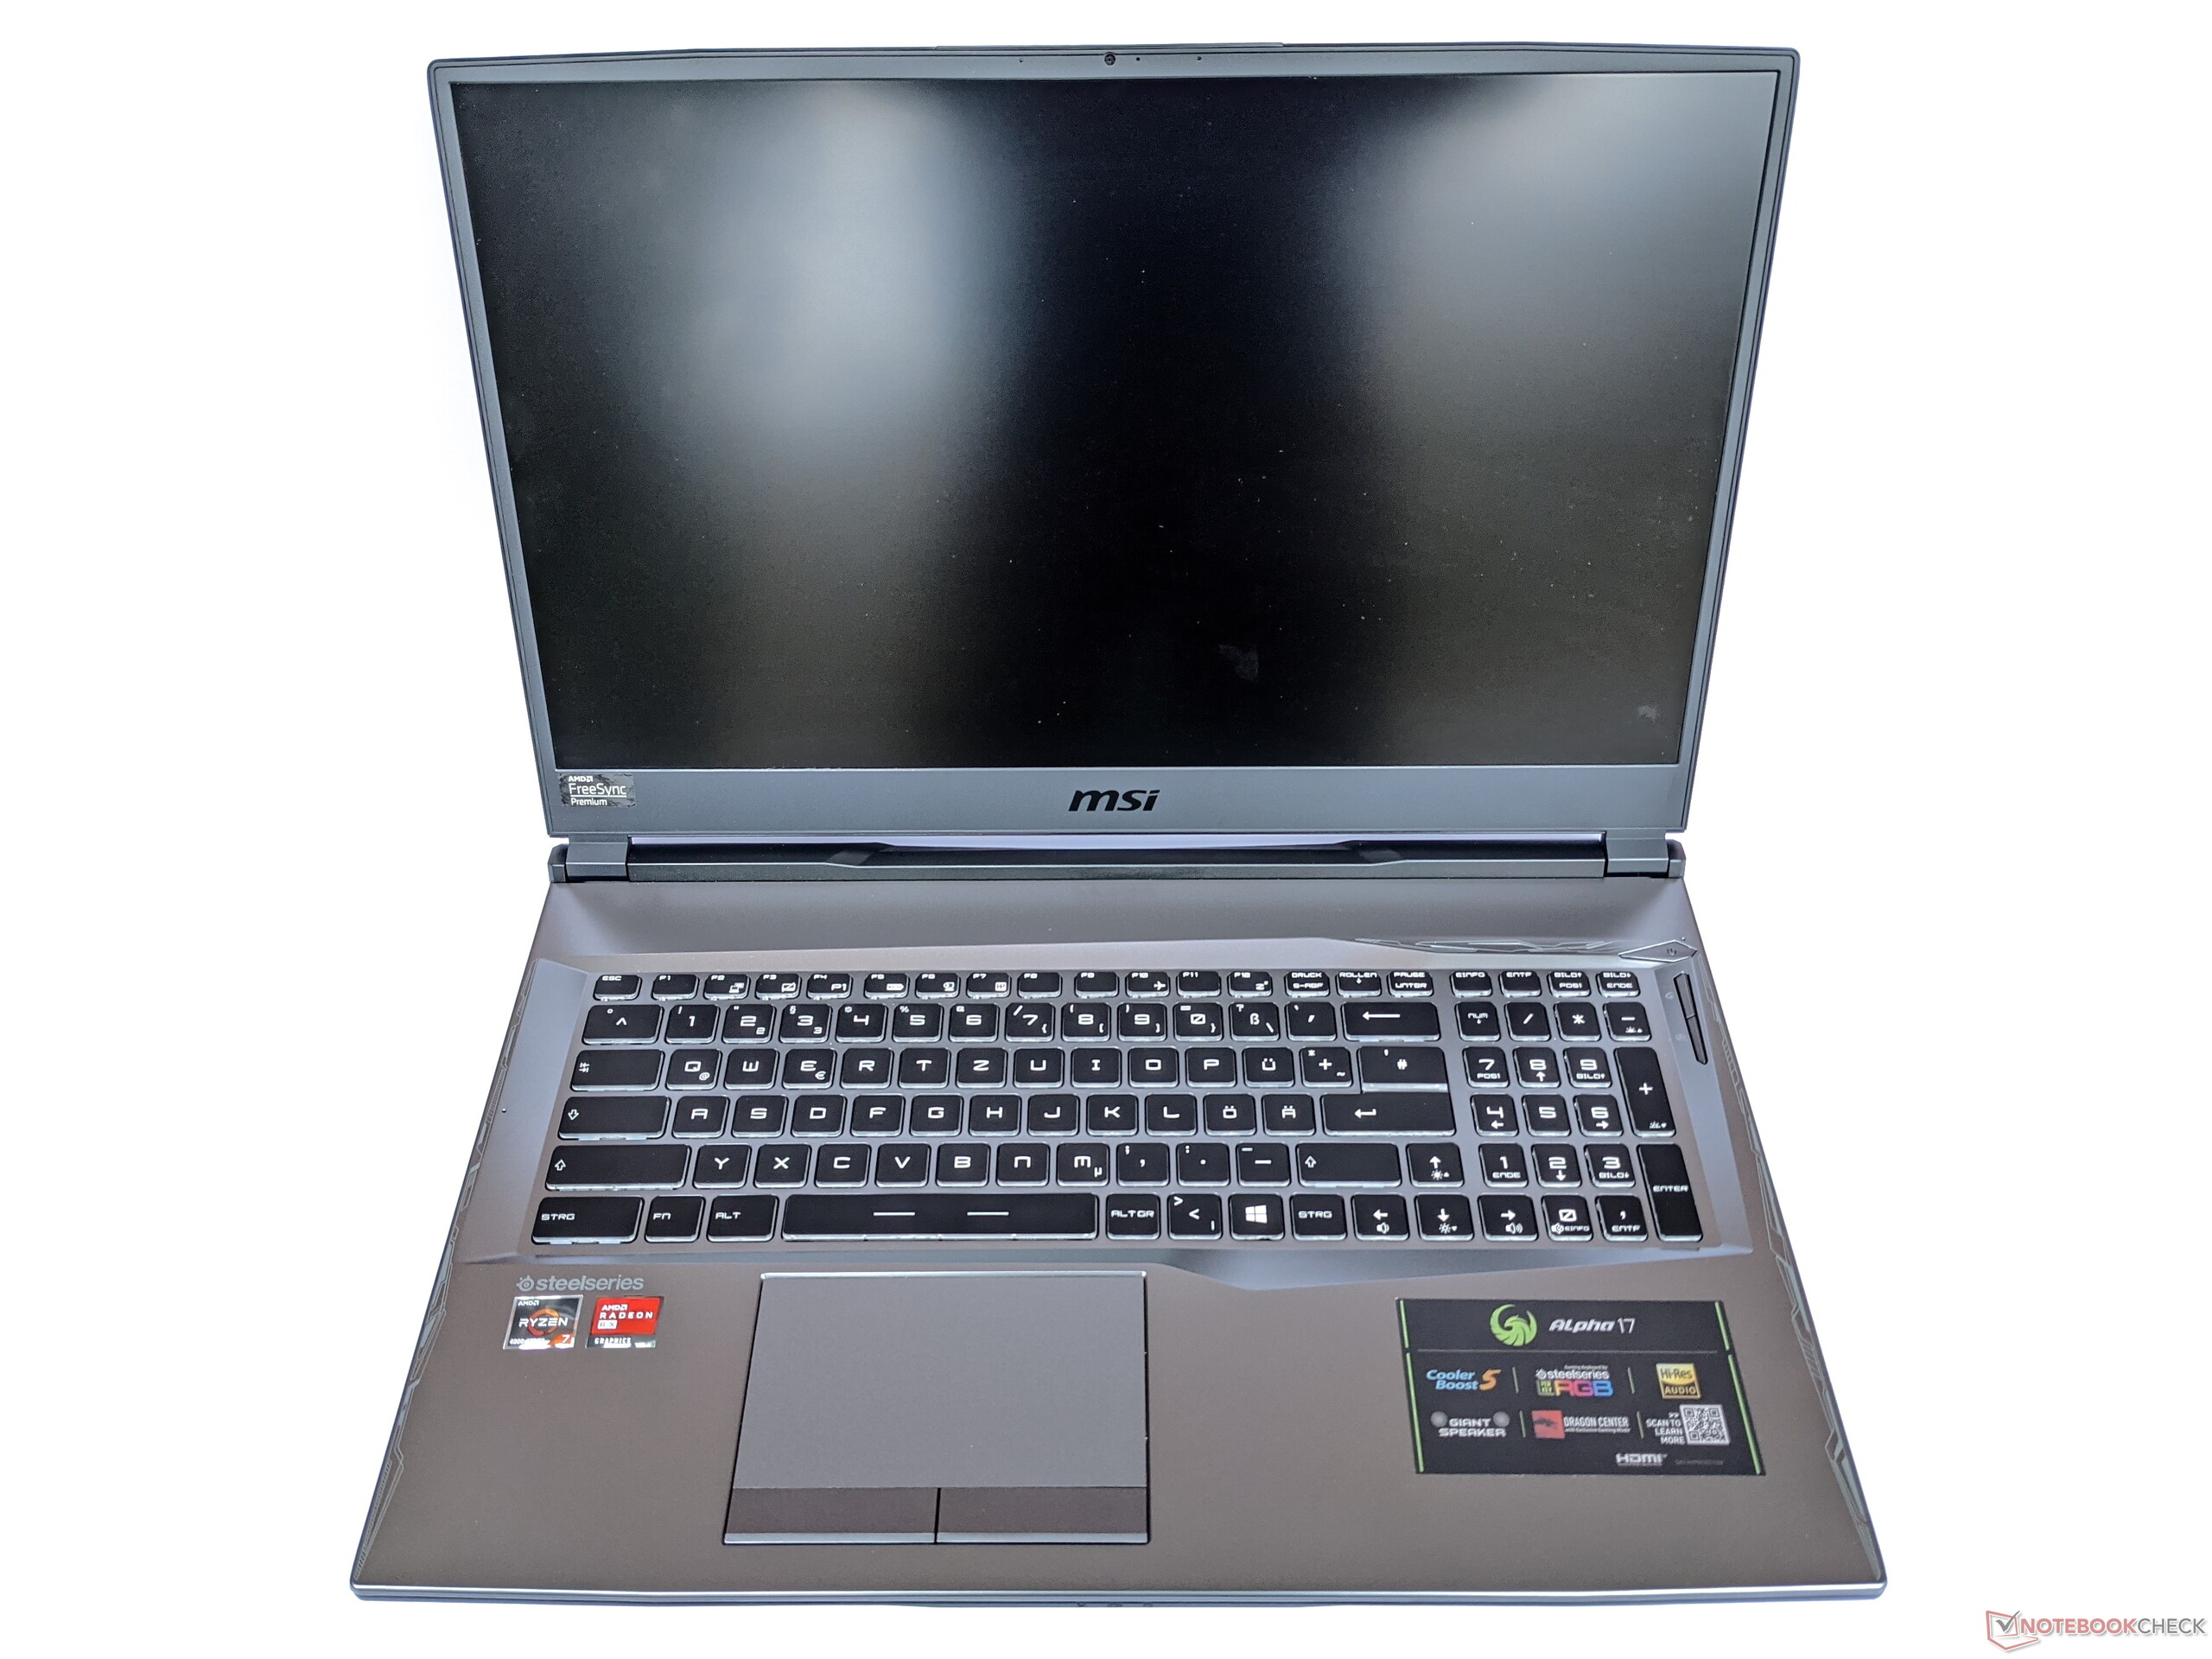
Case - Robust 17-inch laptop with stable display
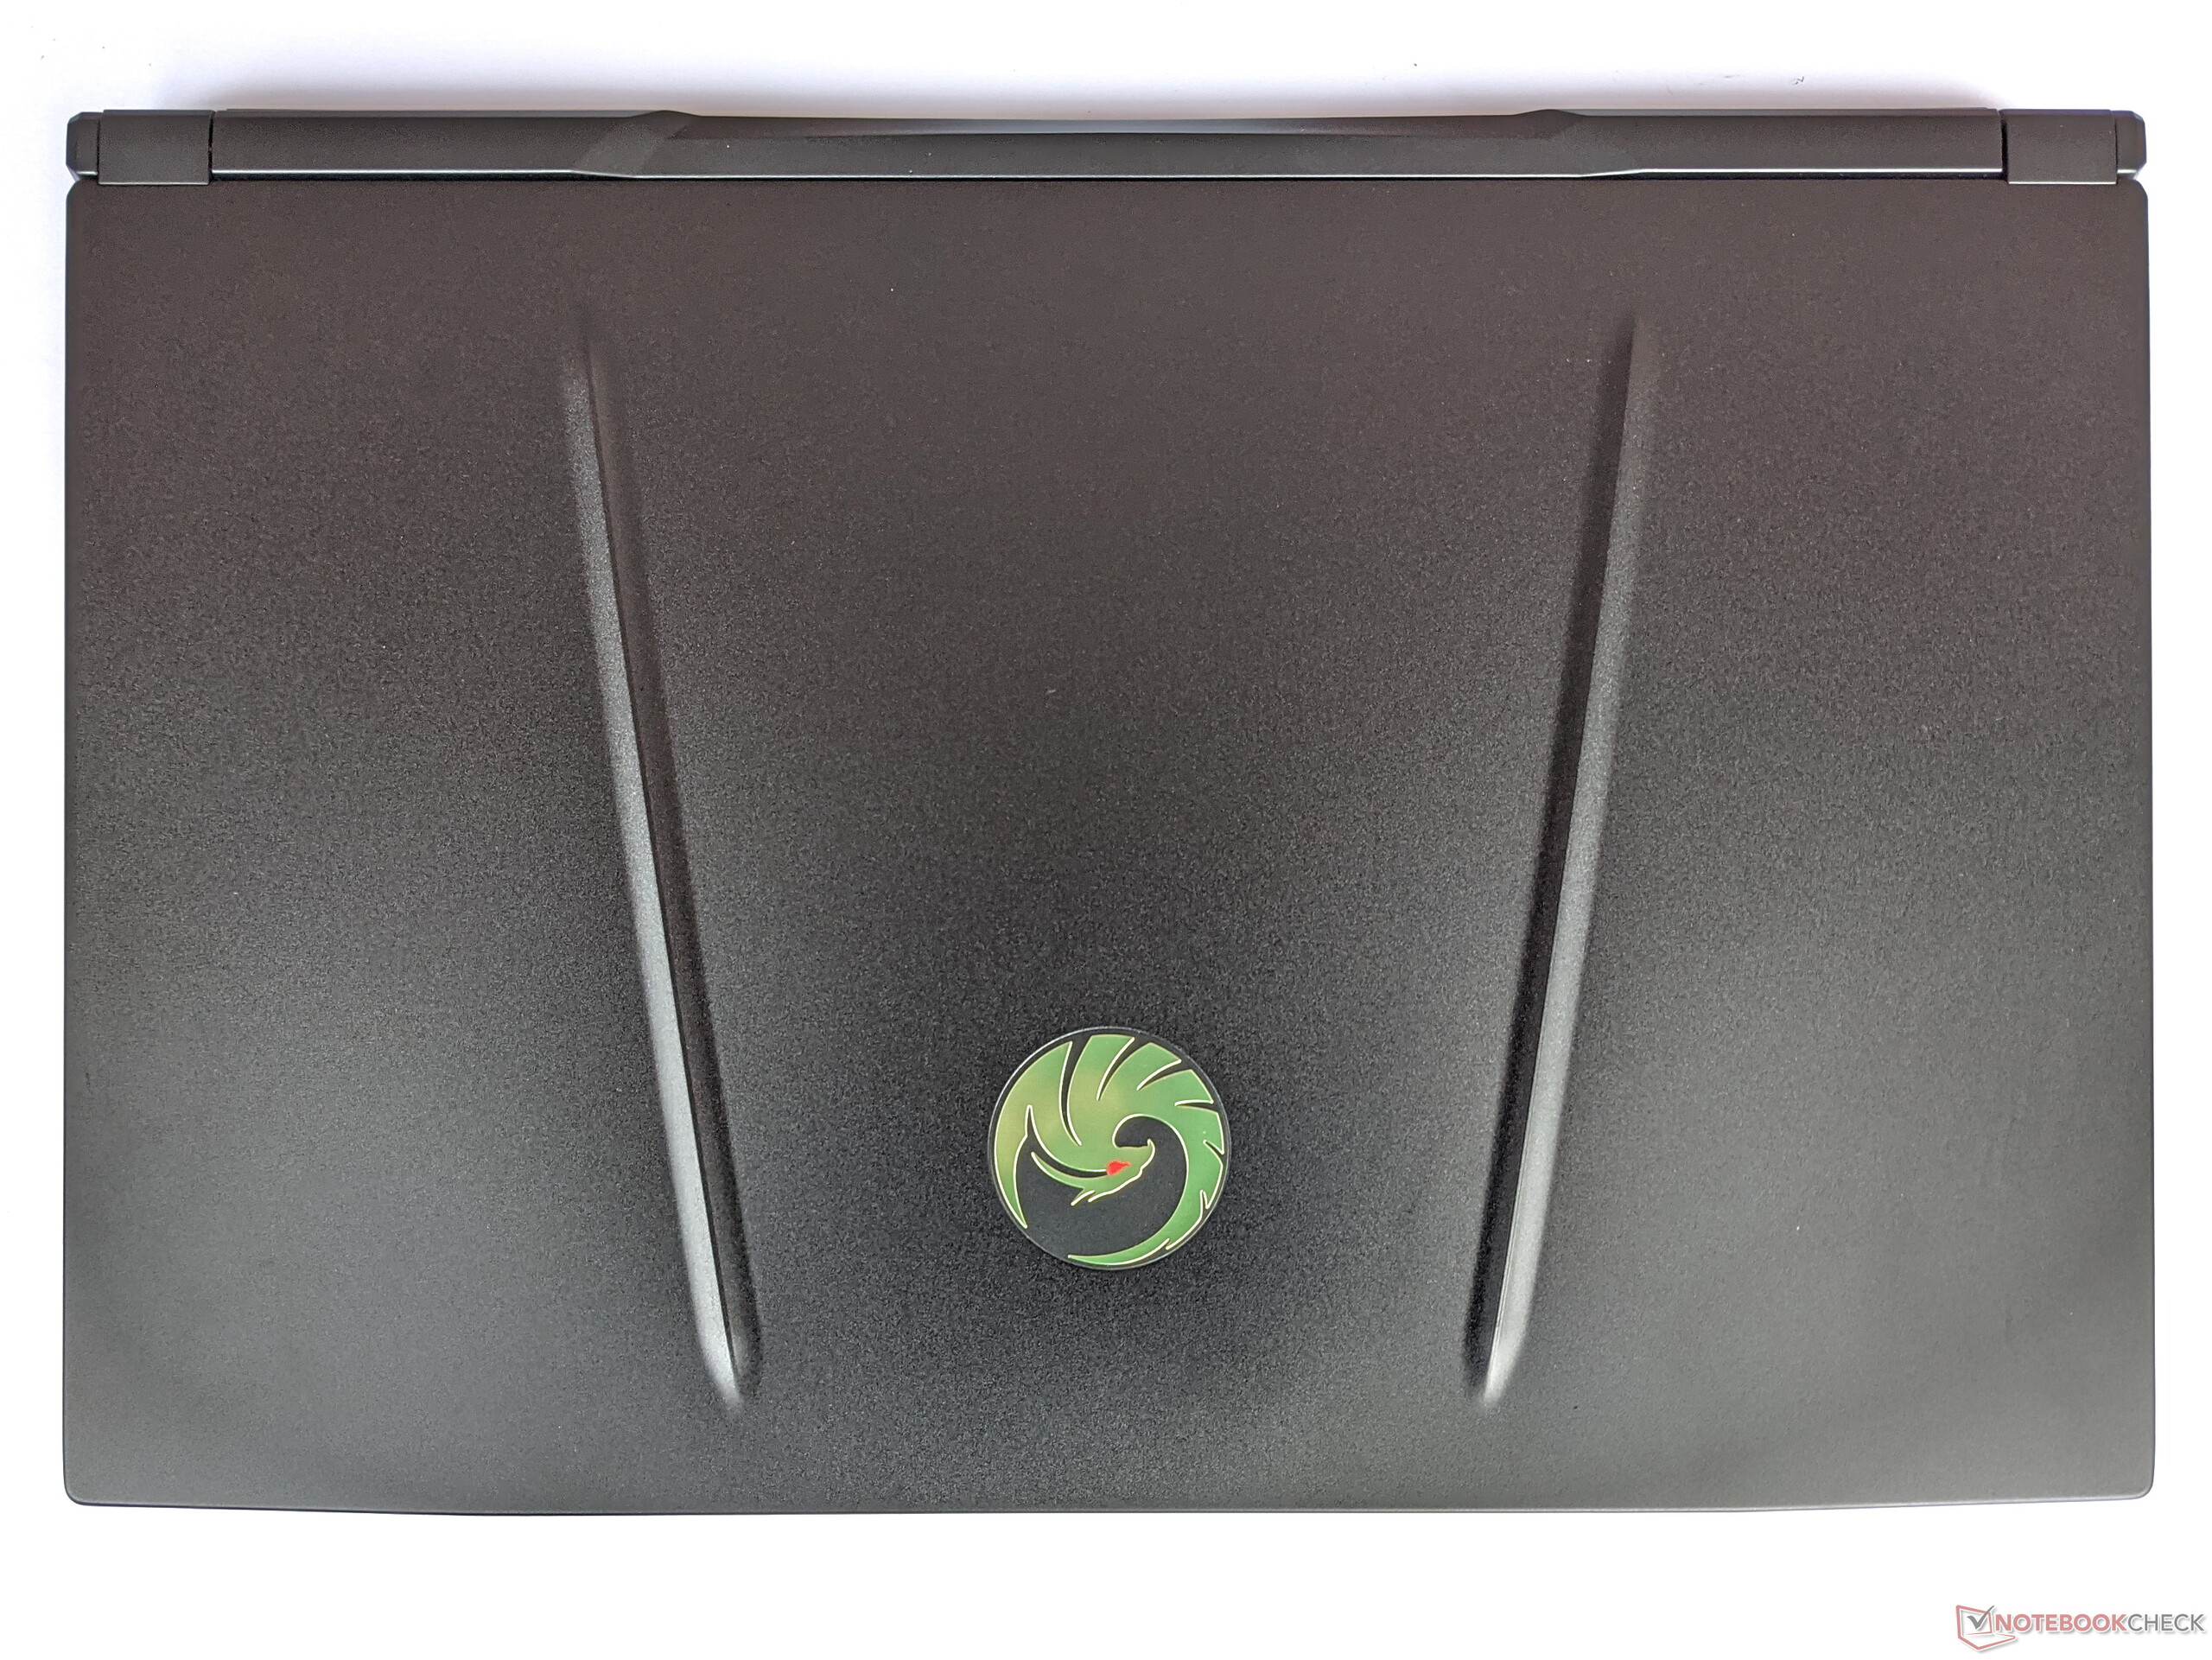
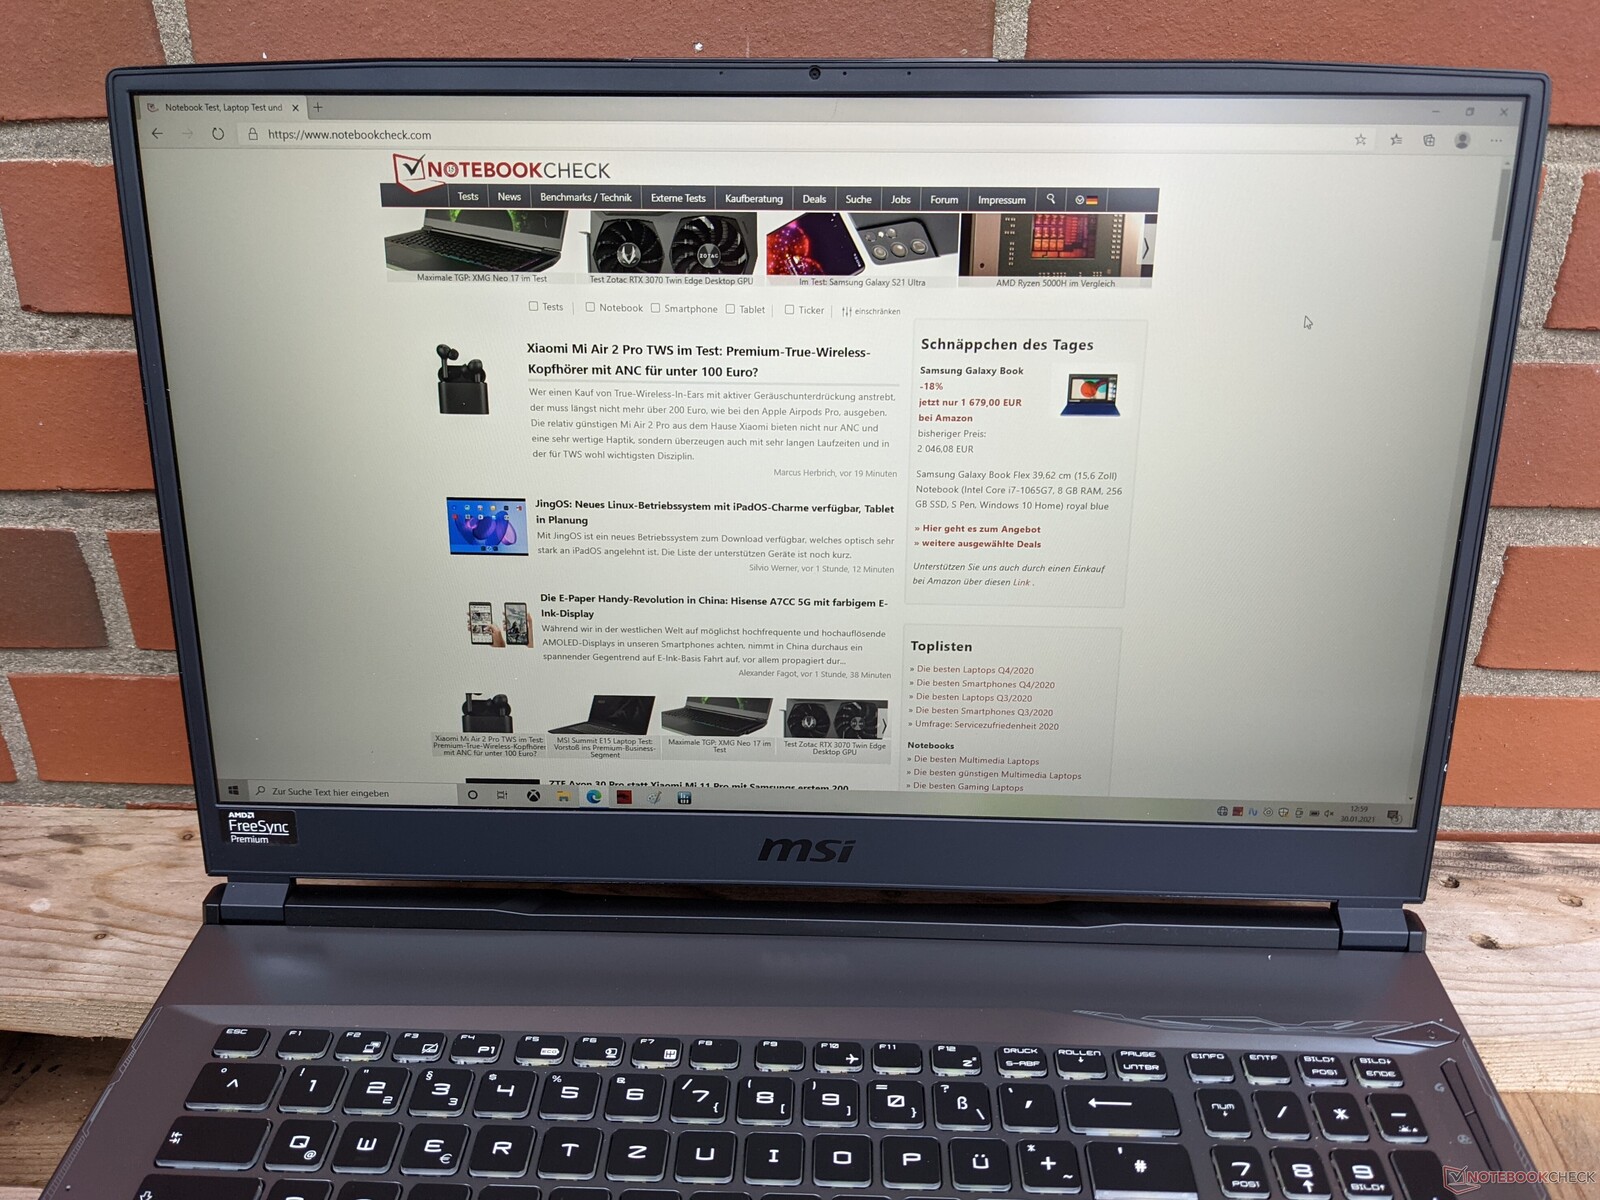
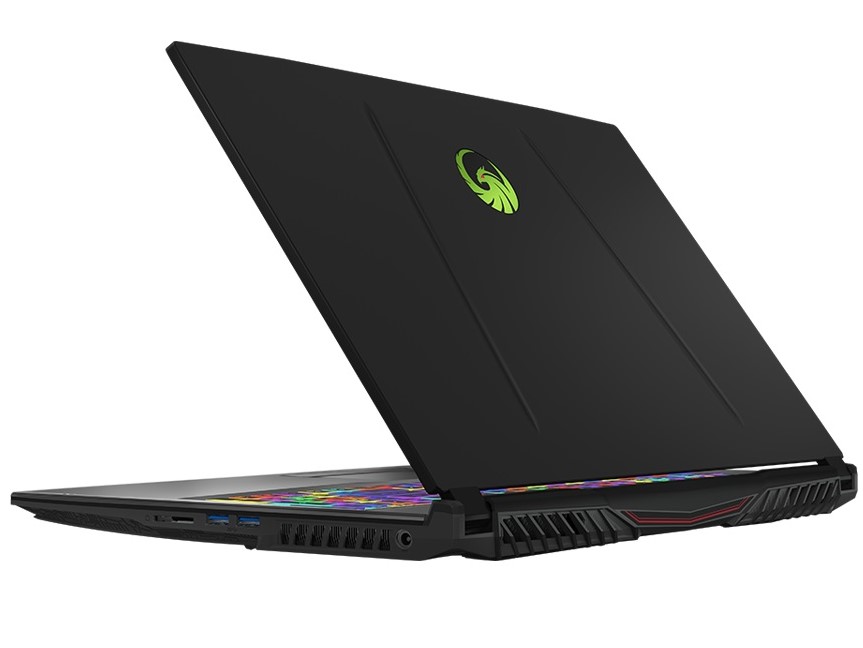
MSI has made the base unit of the Alpha 17 out of plastic and the back of the display out of aluminum. This makes the gaming laptop look sturdy and stable all around. Furthermore, the screen only bends minimally when opened, even if it's only lifted from one corner. The maximum aperture angle is about 160 degrees. Overall, the build quality is very high and leaves no room for criticism in any area.
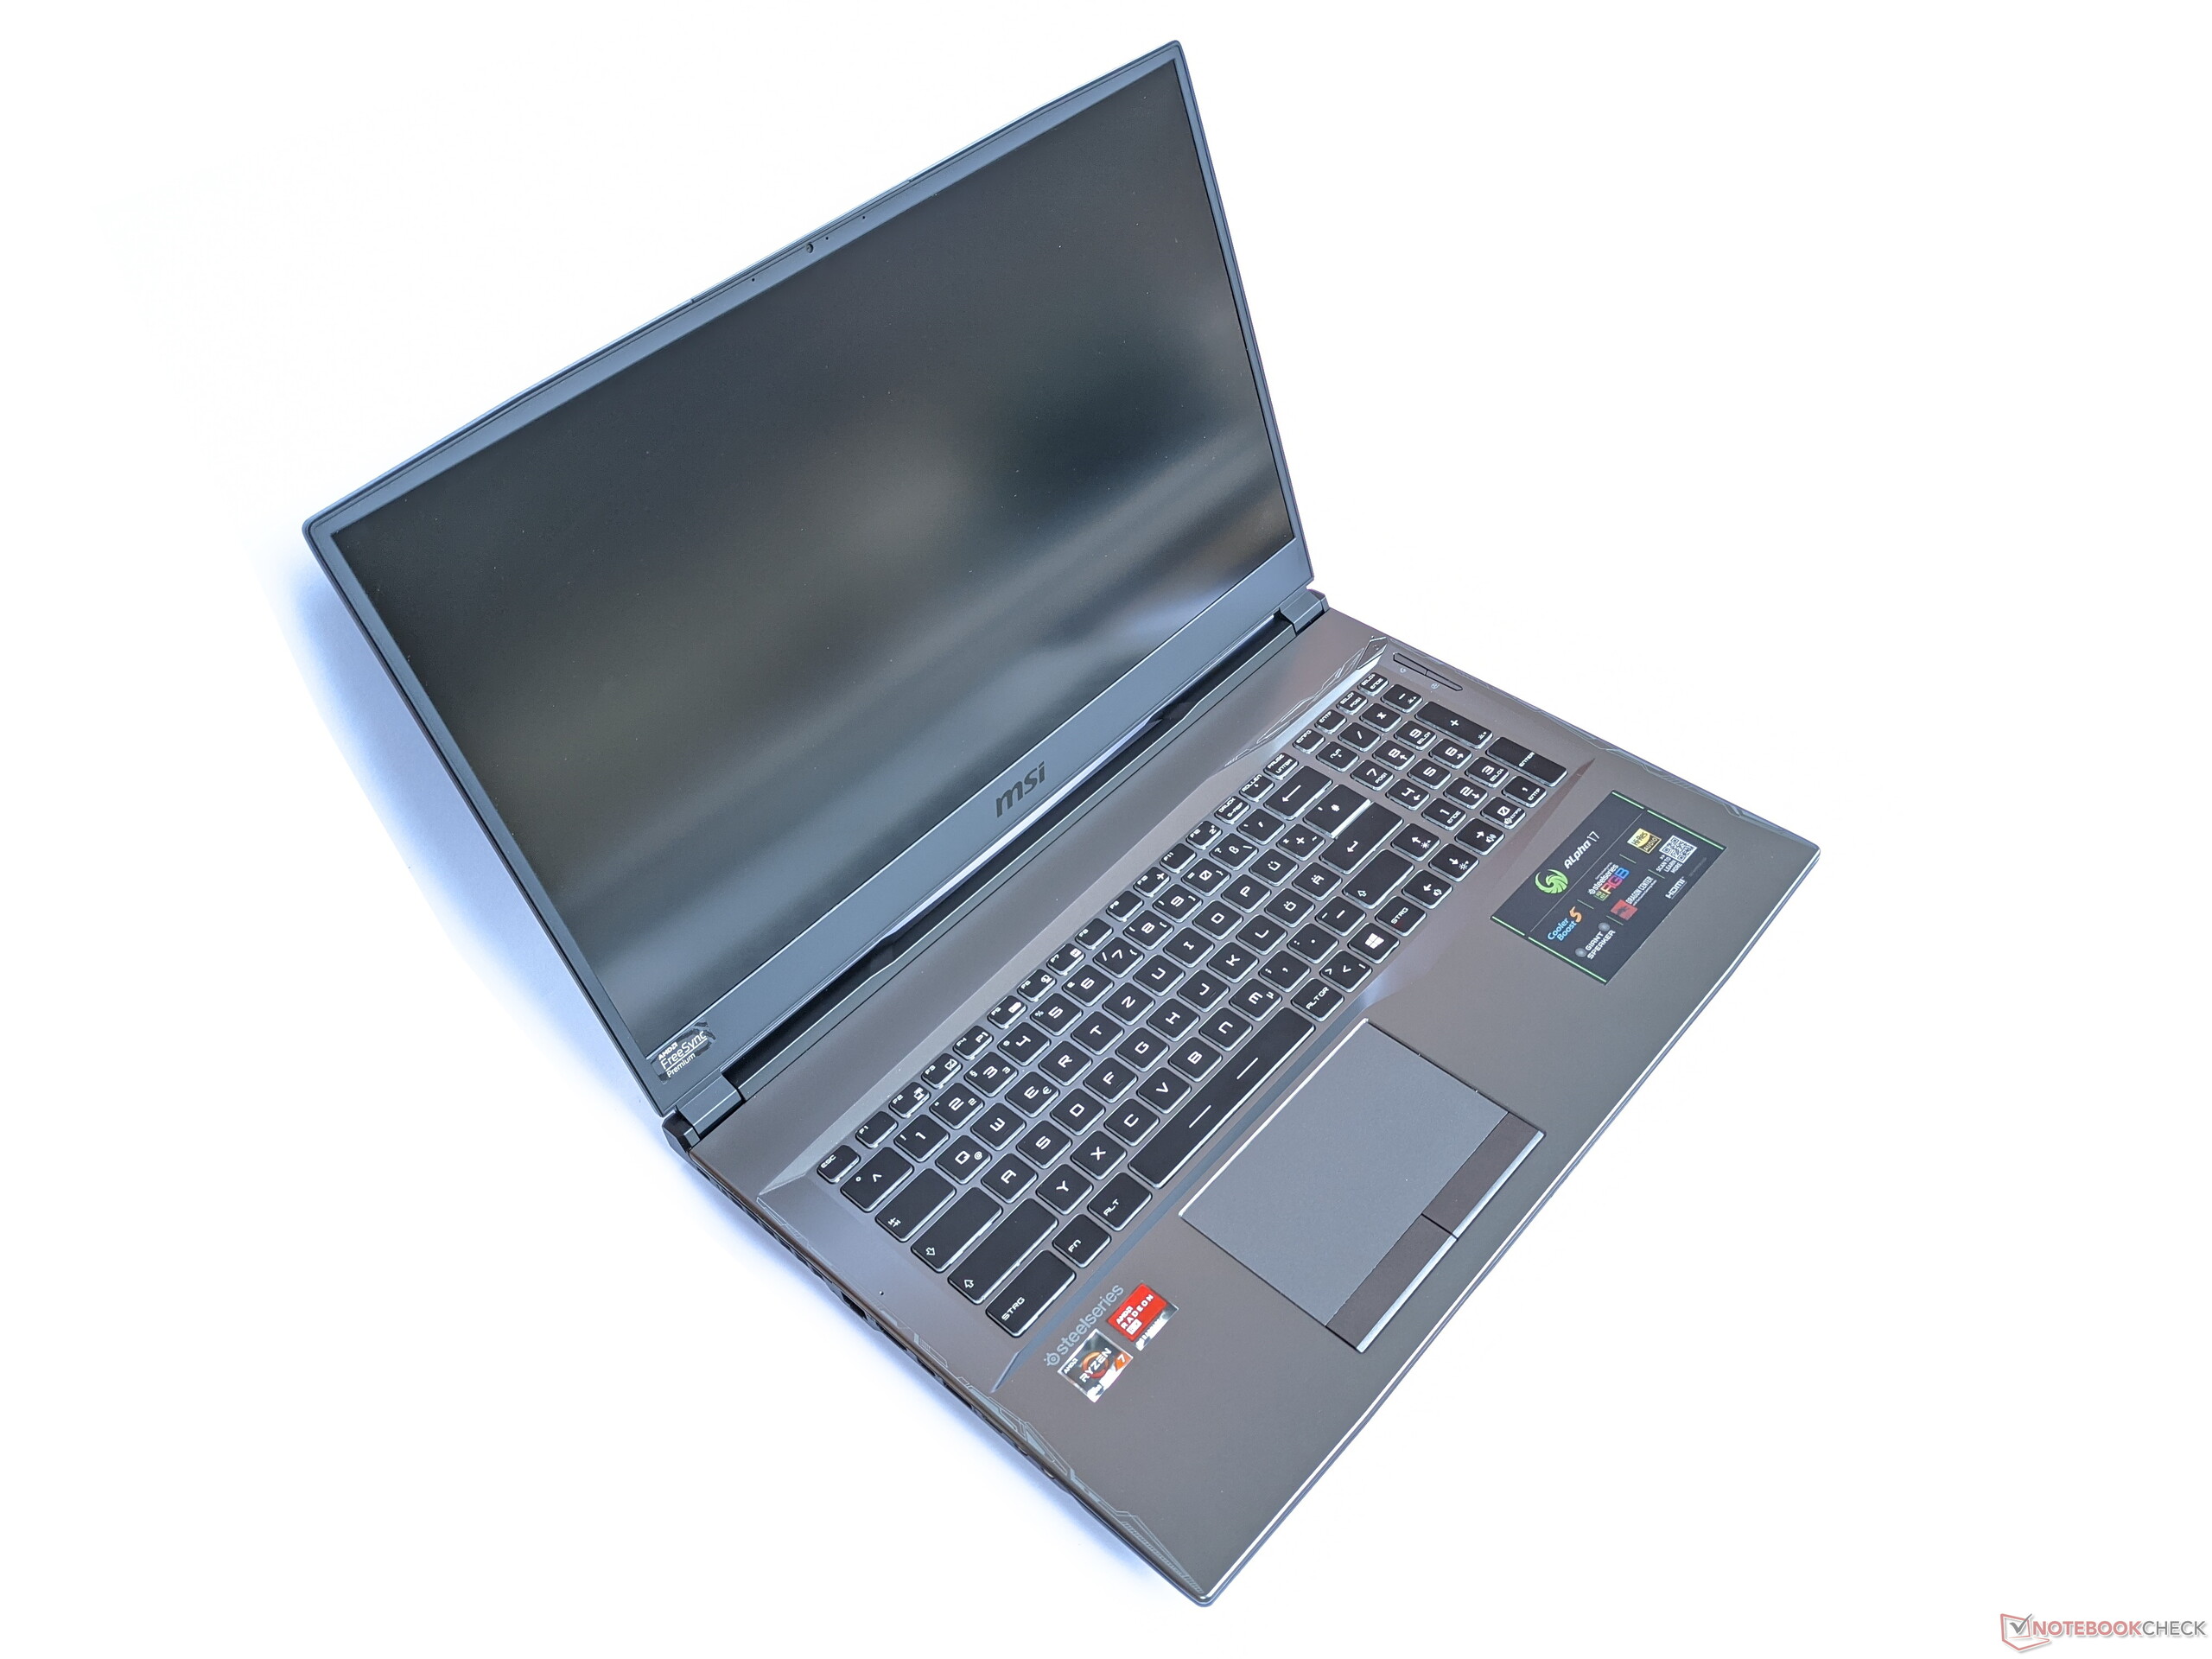
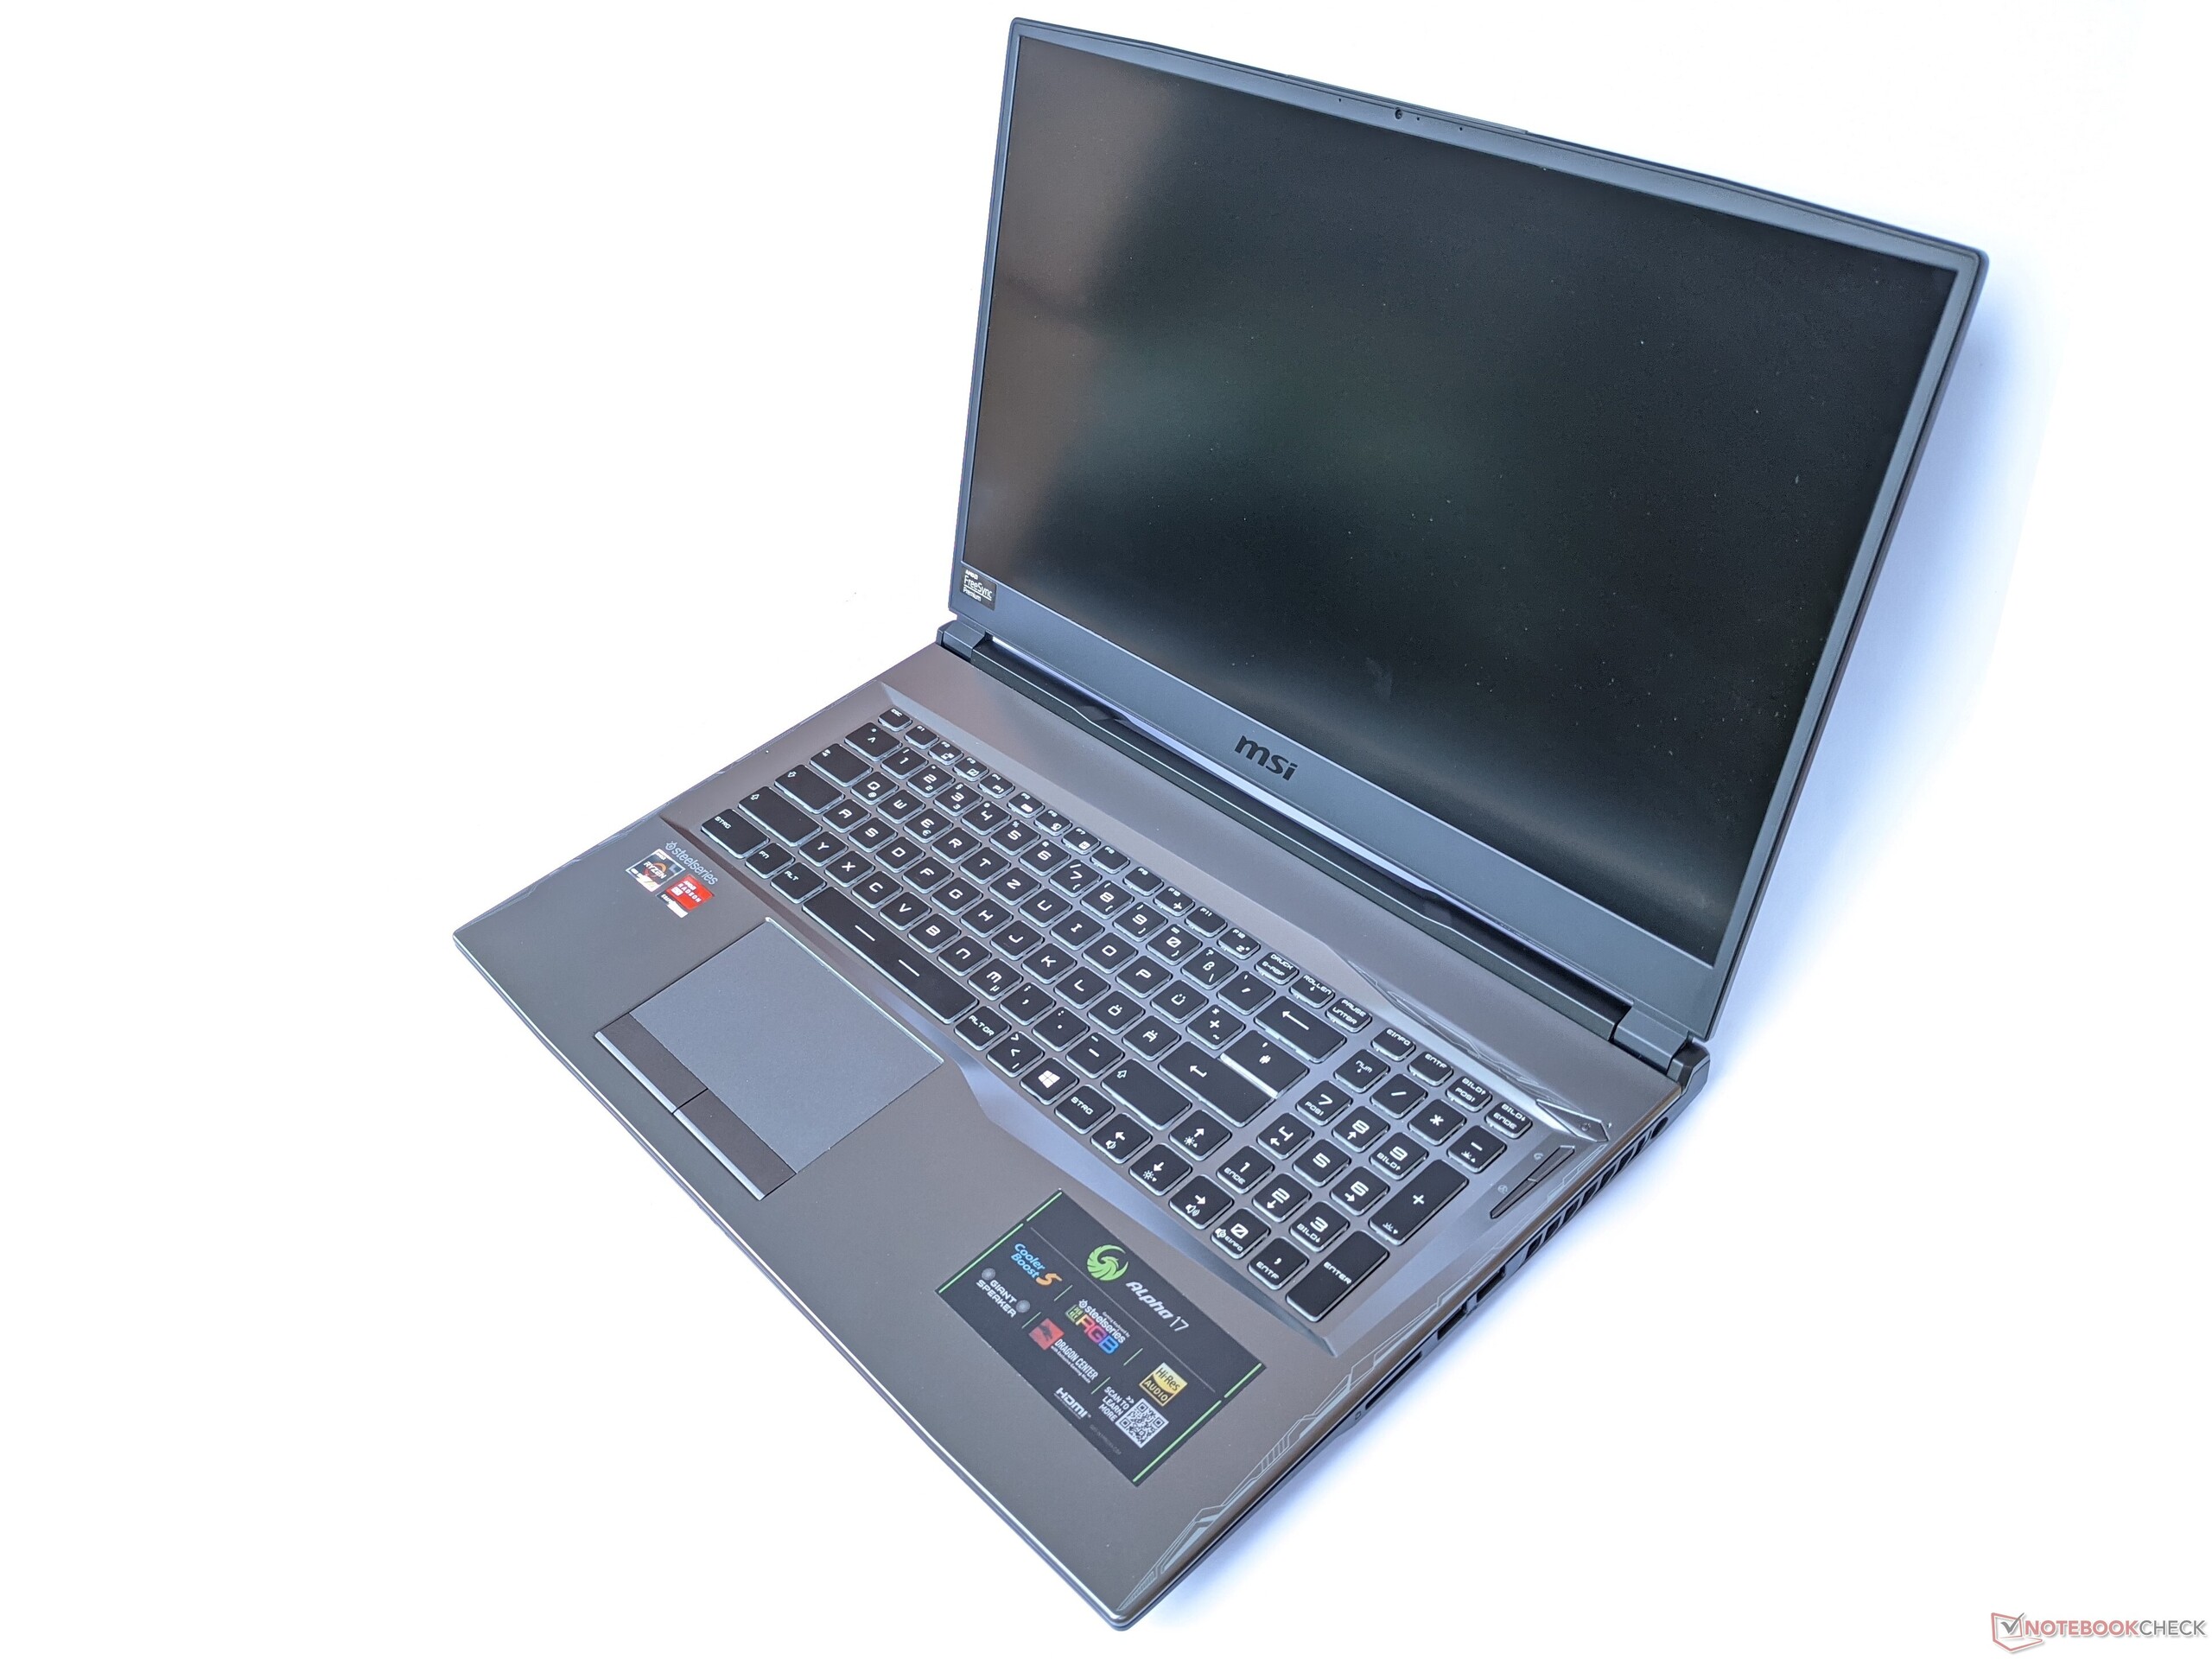
Compared with 17-inch gaming laptops from other manufacturers, the Alpha 17 shows slightly wider and also somewhat deeper dimensions. The weight of 2.6 kilograms, on the other hand, is on par with comparable devices.
Connectivity - MSI gaming laptop with fast WLAN and memory card reader
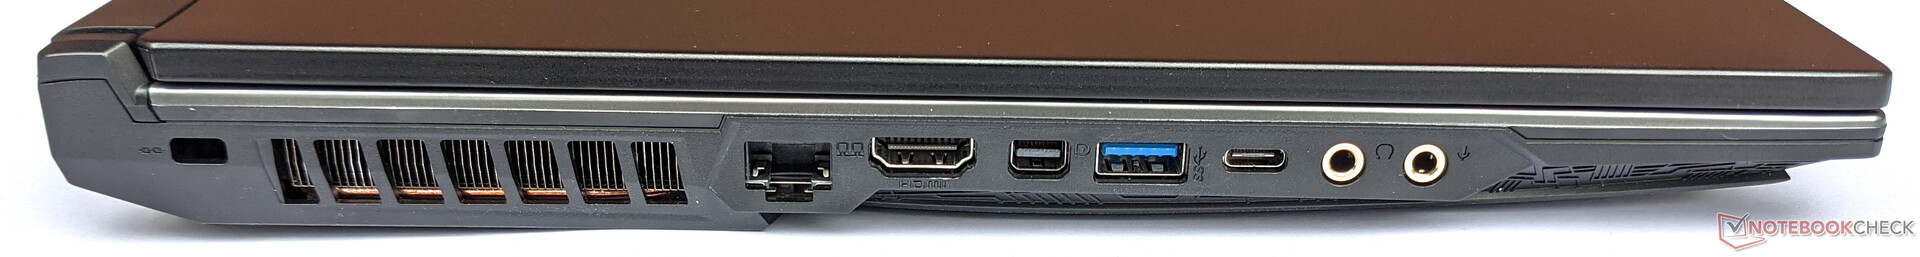
The MSI Alpha 17 offers numerous ports that cover the essential needs. In addition Gigabit LAN and Mini DisplayPort connections, a USB Type-C port is also offered, but it failed to transmit image output to our test monitor using a suitable adapter.
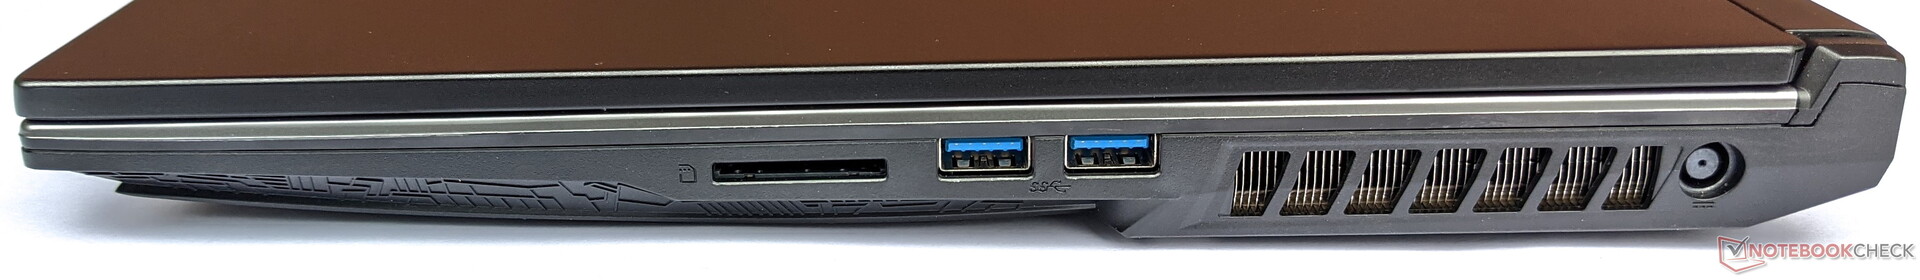
SD card reader
The memory card reader of the Alpha 17 achieves speeds of up to 77 MB/s for copying data and up to 86 MB/s for reading data with our reference memory card, the 64 GB Toshiba Exceria Pro UHS-II SDXC. This allows MSI's gaming laptop to lead our test field. Moreover, inserted memory cards protrude about four millimeters beyond the case's edge.
| SD Card Reader | |
| average JPG Copy Test (av. of 3 runs) | |
| Average of class Gaming (20.9 - 210, n=55, last 2 years) | |
| MSI Alpha 17 A4DEK (Toshiba Exceria Pro SDXC 64 GB UHS-II) | |
| Dell G5 15 SE 5505 P89F (Toshiba Exceria Pro SDXC 64 GB UHS-II) | |
| Eluktronics RP-17 (Toshiba Exceria Pro SDXC 64 GB UHS-II) | |
| Schenker XMG Core 17 Comet Lake (Toshiba Exceria Pro SDXC 64 GB UHS-II) | |
| maximum AS SSD Seq Read Test (1GB) | |
| Average of class Gaming (25.5 - 261, n=52, last 2 years) | |
| MSI Alpha 17 A4DEK (Toshiba Exceria Pro SDXC 64 GB UHS-II) | |
| Dell G5 15 SE 5505 P89F (Toshiba Exceria Pro SDXC 64 GB UHS-II) | |
| Eluktronics RP-17 (Toshiba Exceria Pro SDXC 64 GB UHS-II) | |
| Schenker XMG Core 17 Comet Lake (Toshiba Exceria Pro SDXC 64 GB UHS-II) | |
Communication
With our Netgear Nighthawk AX12 reference router, the MSI Alpha 17 reaches WLAN speeds of up to 1,100 Mb/s for receiving and up to 1,010 Mb/s for sending data. Although these rates are very good, they are still surpassed by our chosen competitor devices.
Webcam
The Alpha 17 is also equipped with one of the widespread but very low-resolution HD webcams with 0.9 MP. Accordingly, the quality of our test images is low. They are too pale and blurry even in good lighting conditions.


Accessories
Besides the laptop, the MSI Alpha 17 only comes with a power adapter. However, the manufacturer offers numerous accessories on its website such as headsets, keyboards, mice, monitors, and more.
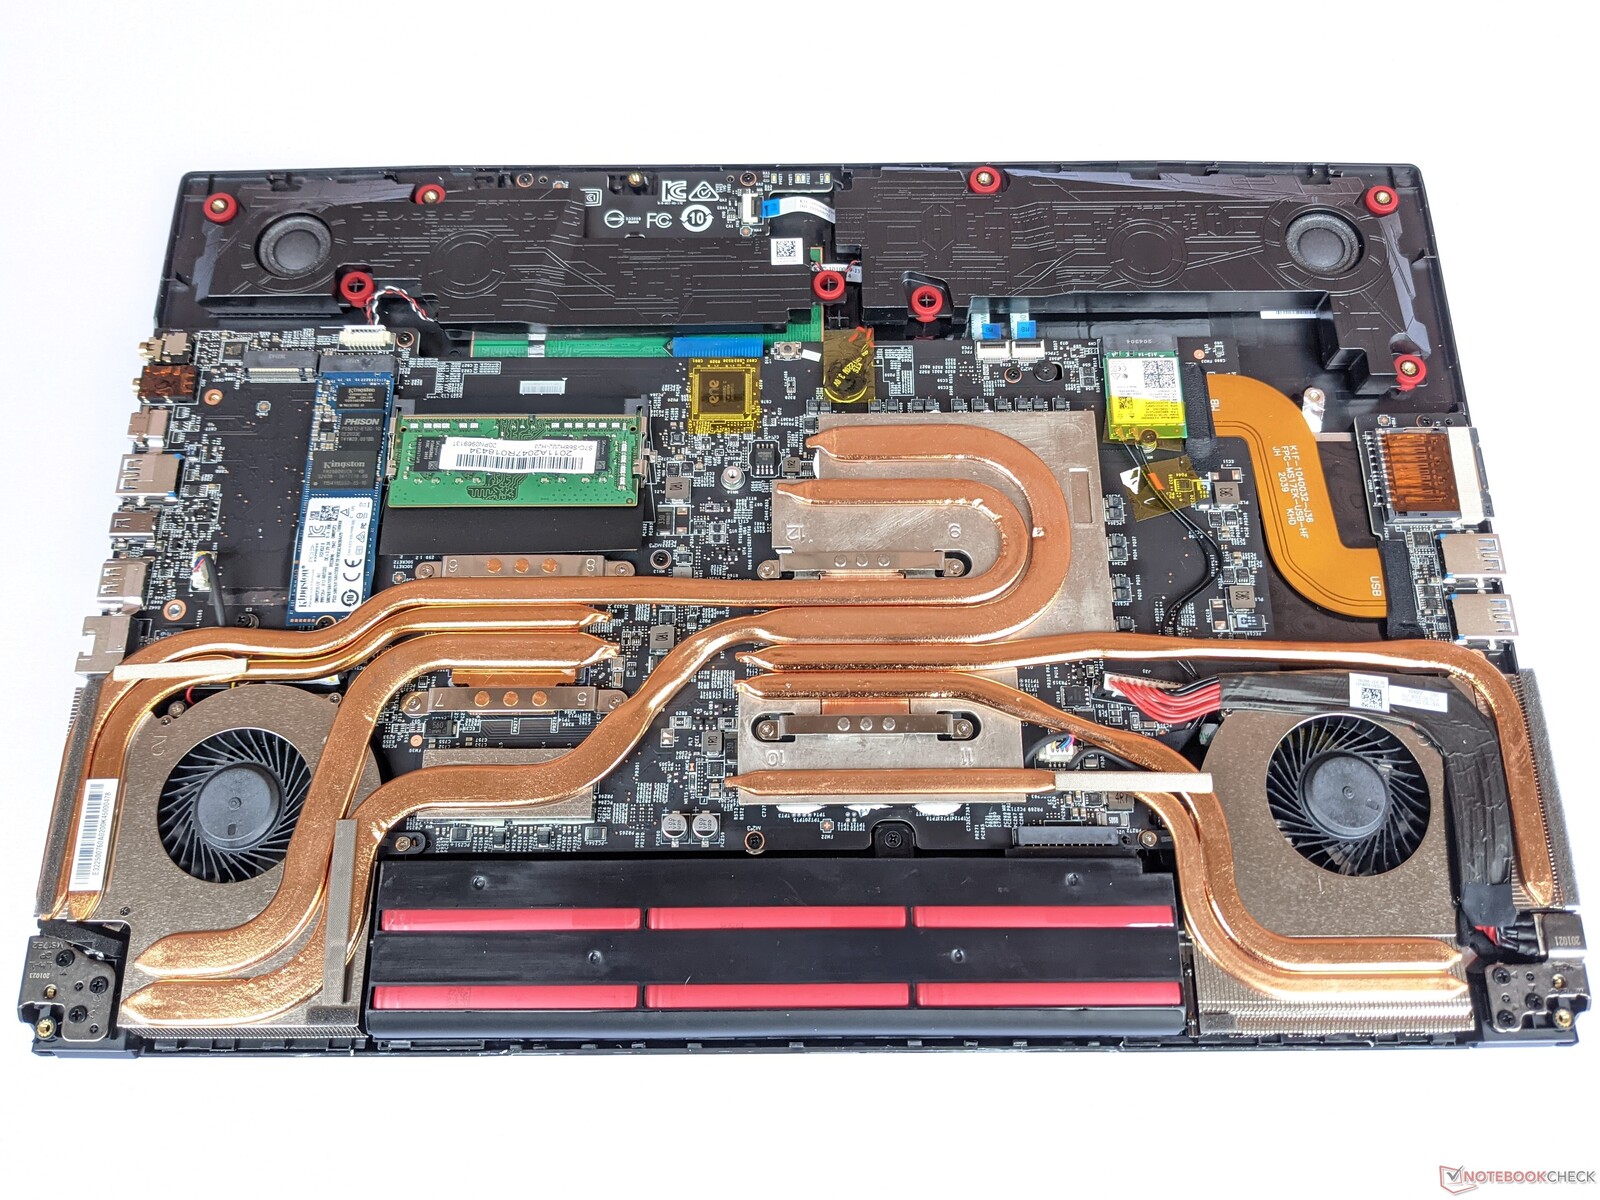
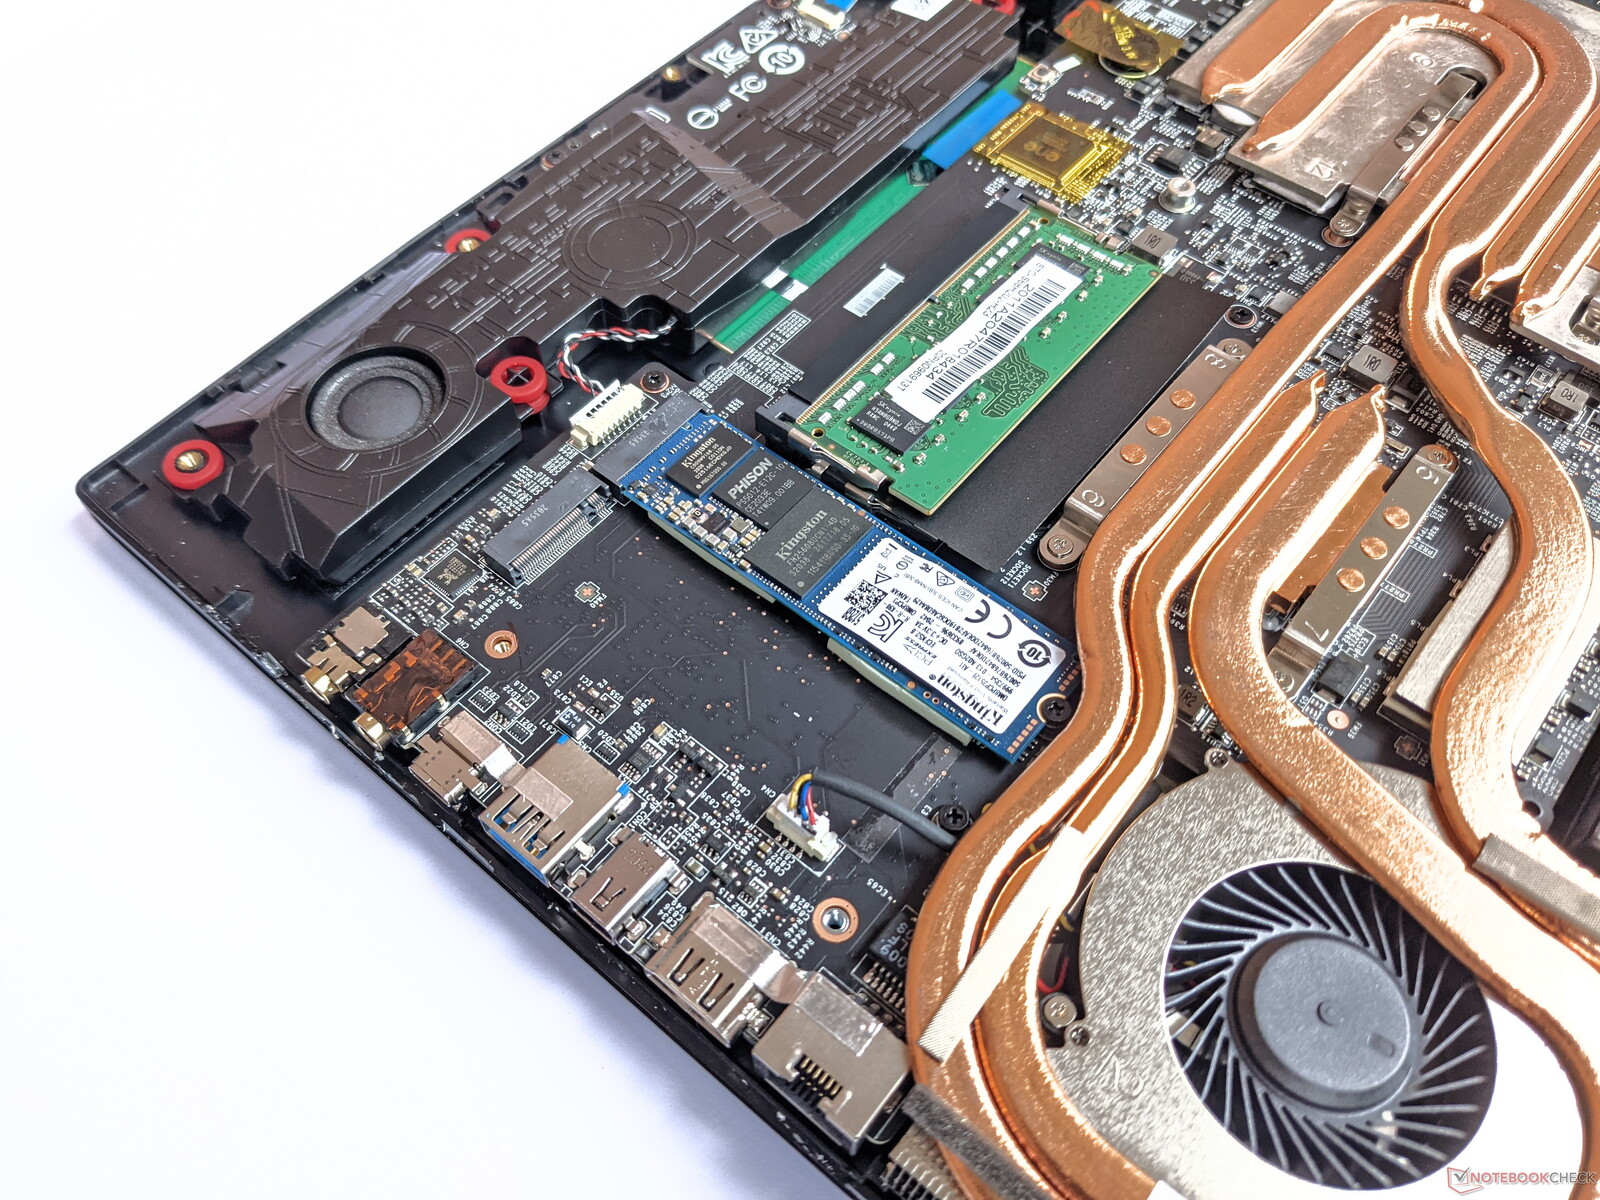
Maintenance
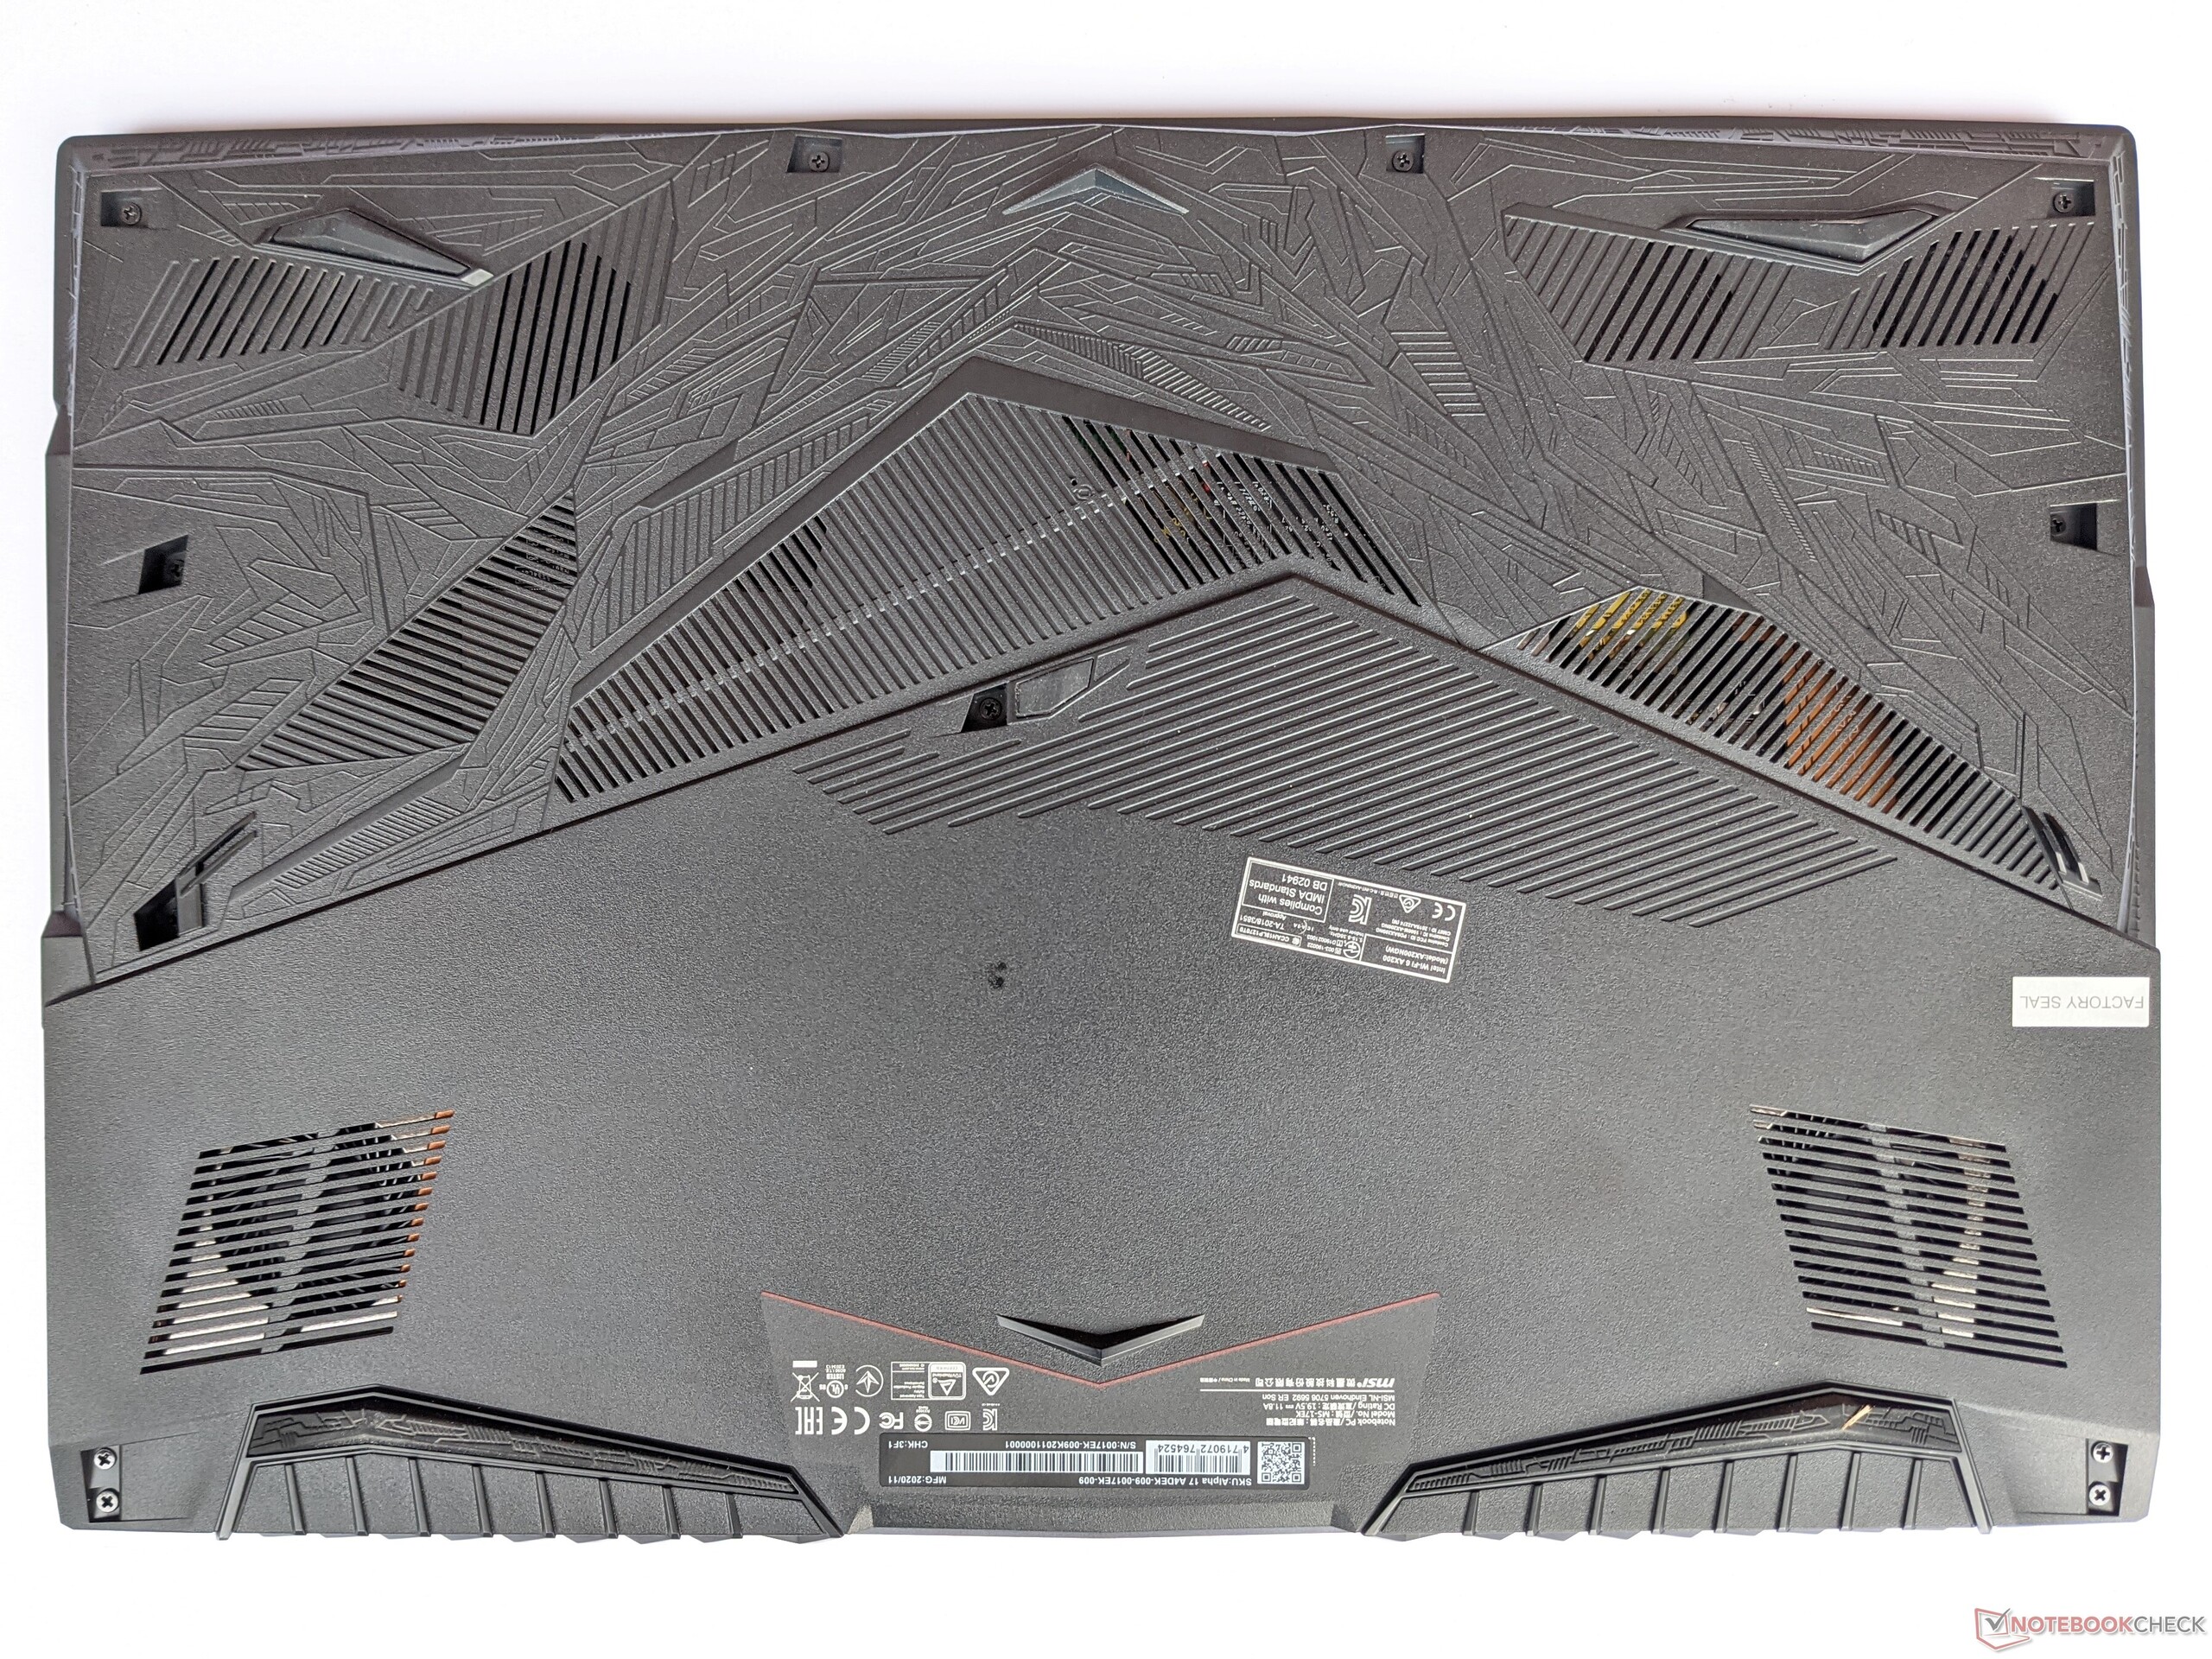
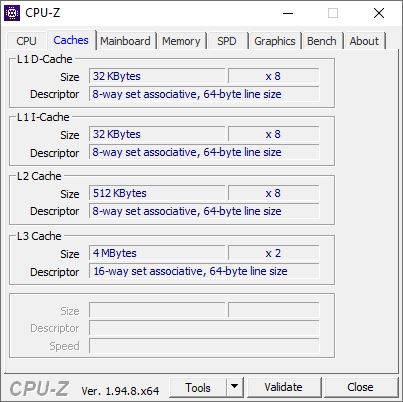
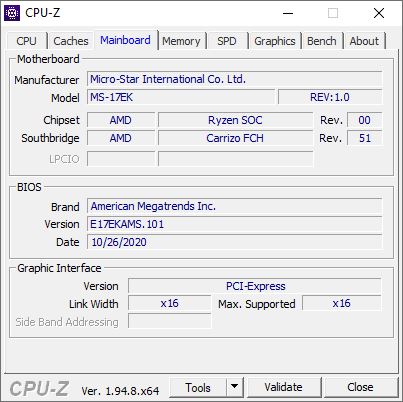
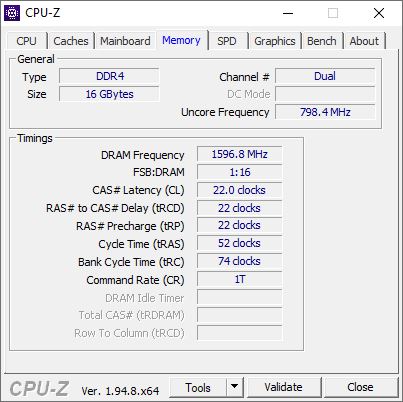
The MSI Alpha 17 can be opened after removing all screws on the bottom. Removing the bottom cover in the area of the hinges is a bit difficult, so patience is required. Inside, the storage drive and RAM can be accessed, and the WLAN module can also be replaced. While nothing stands in the way of using an additional SSD thanks to the second M.2 slot, only one RAM slot is available. In our test configuration, RAM is, therefore, divided into 8 GB that is permanently installed (soldered) and another 8 GB that is installed as a module.

Warranty
MSI grants buyers of the Alpha 17 a warranty period of 24 months.
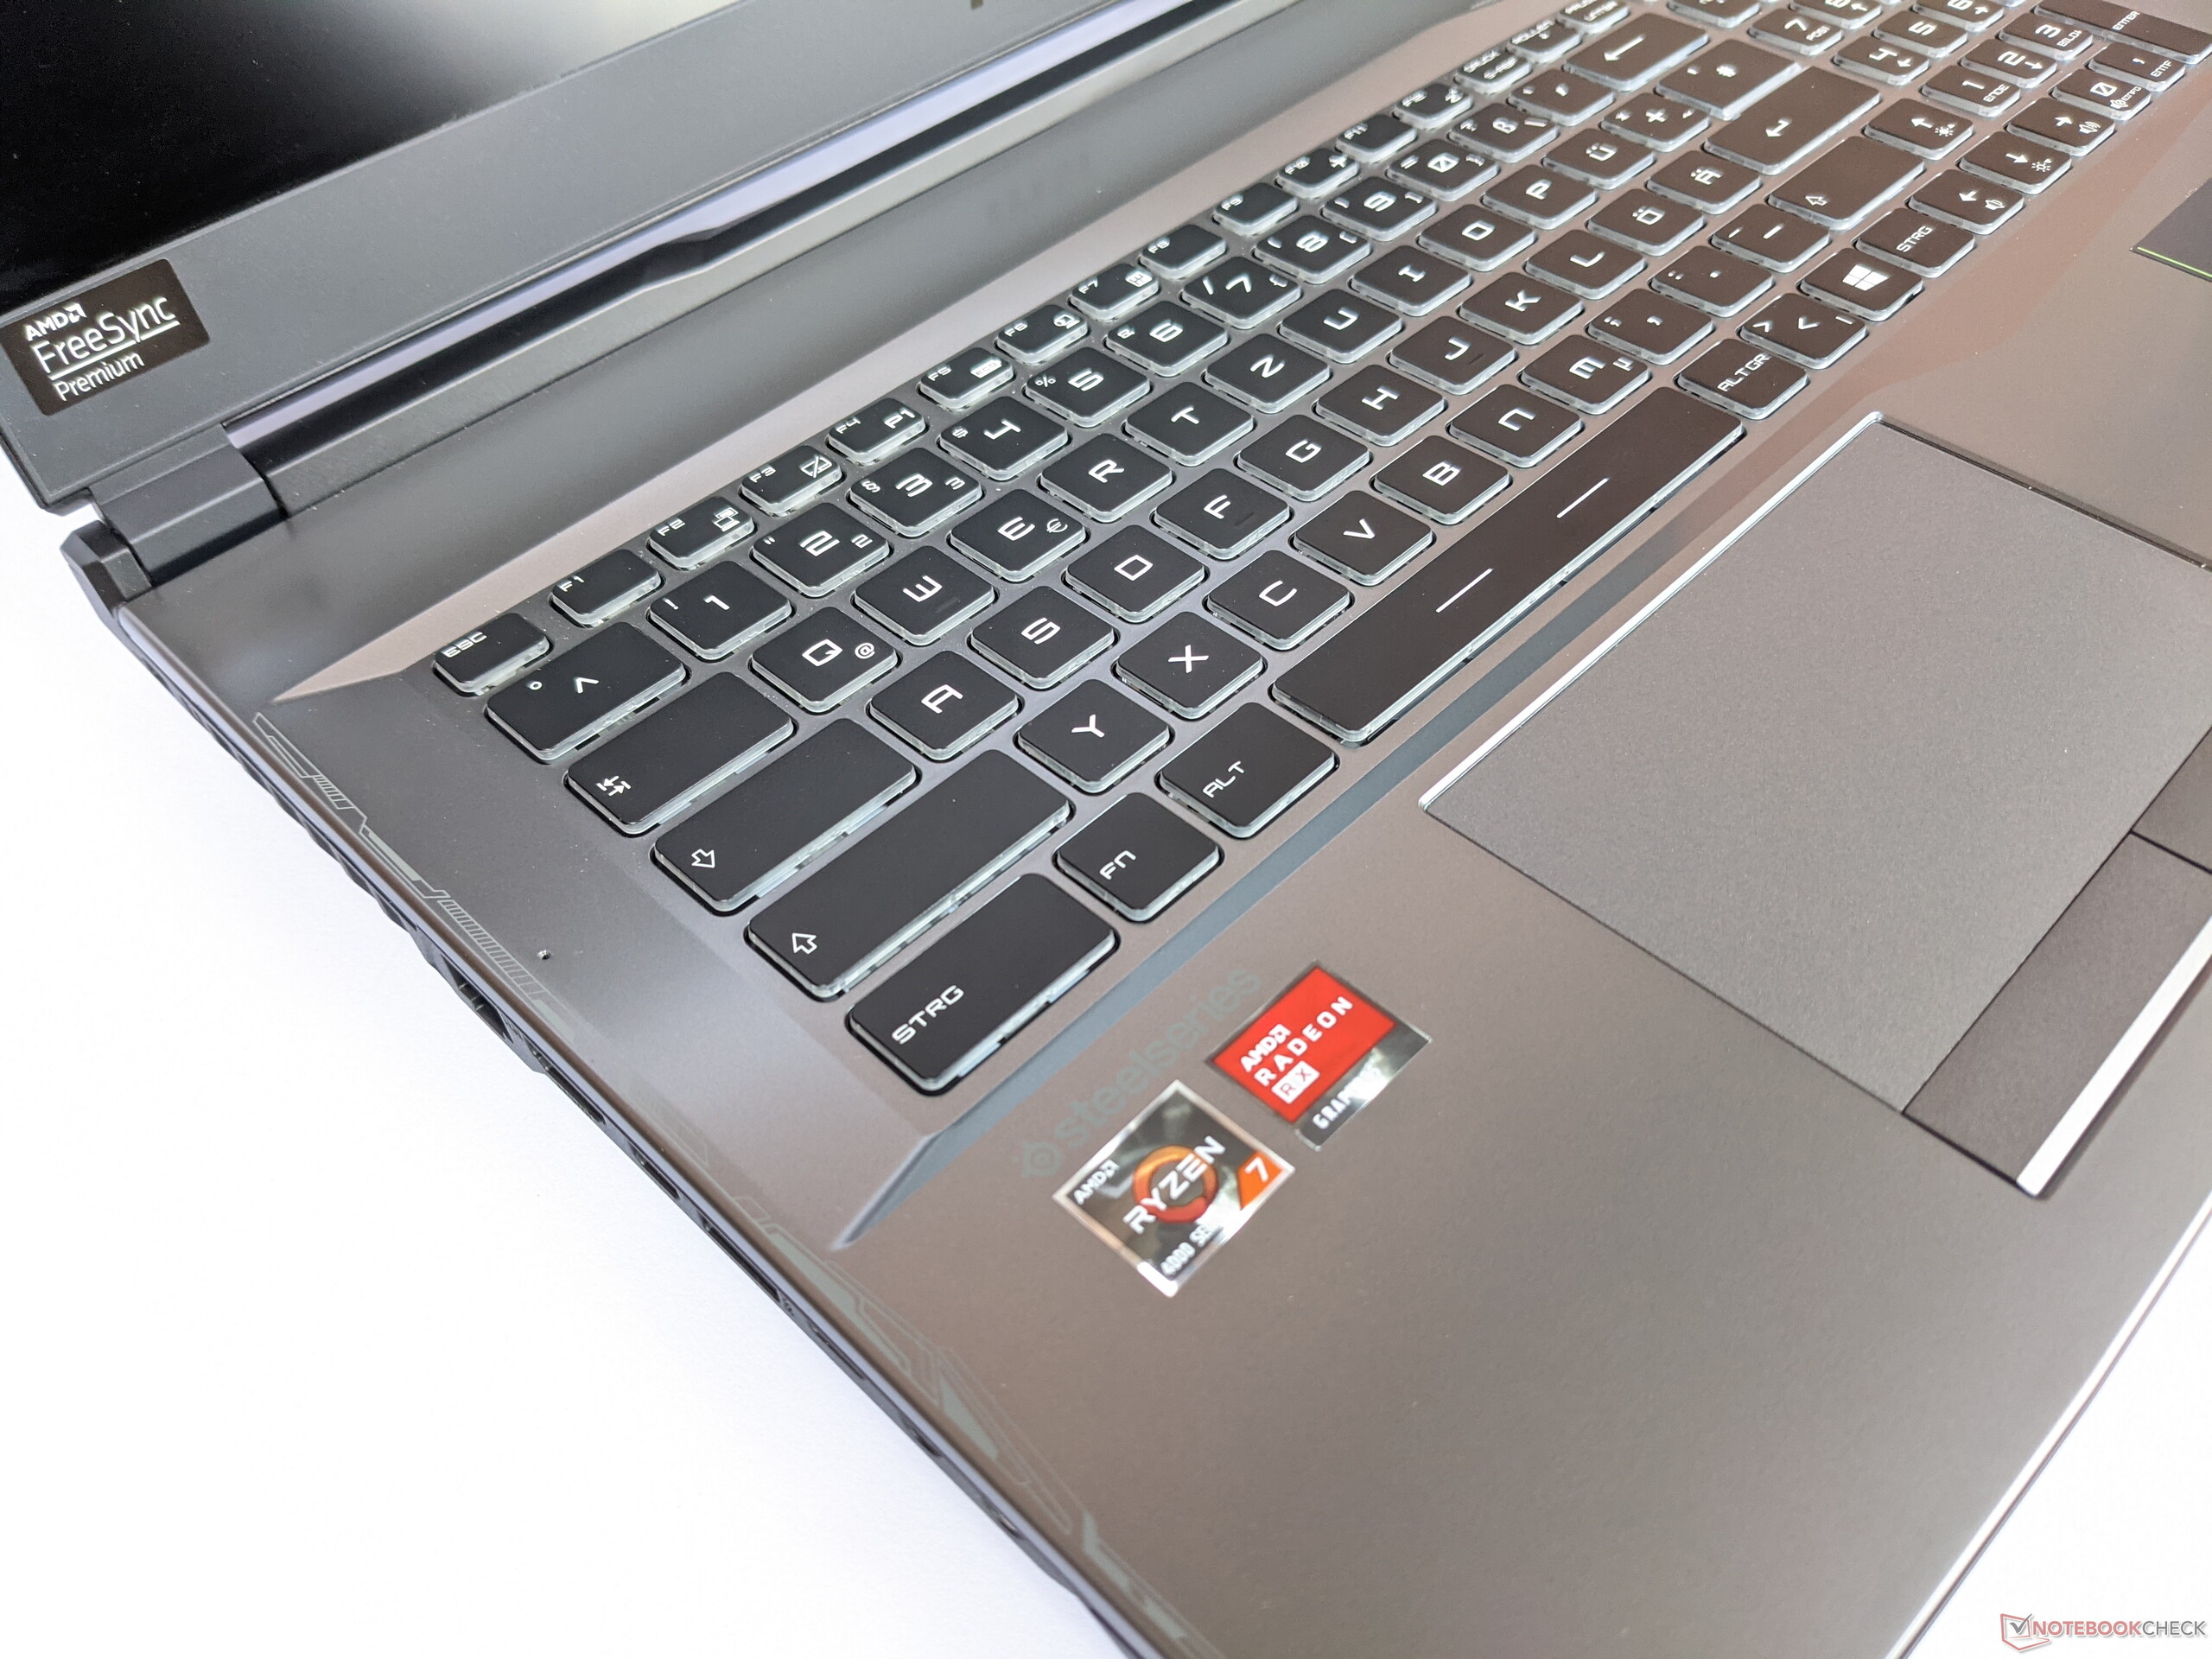
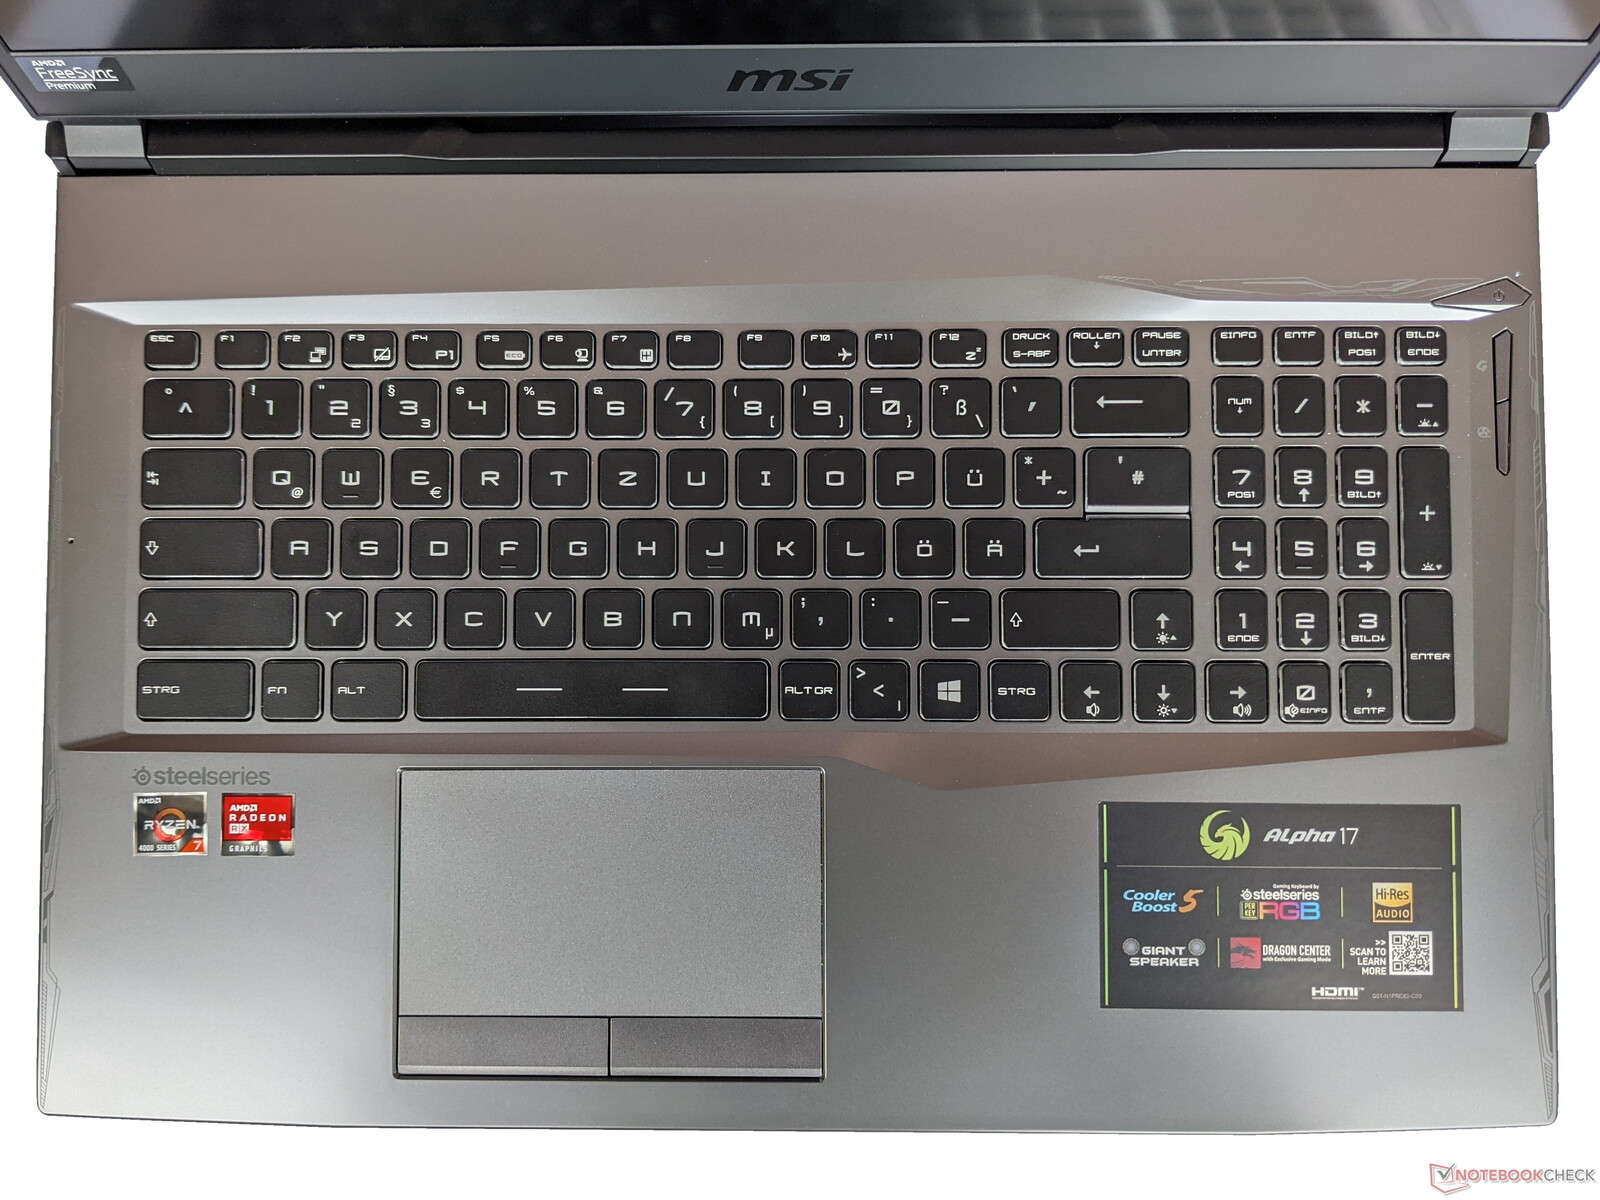
Input devices - Good backlighting and precise touchpad
Keyboard
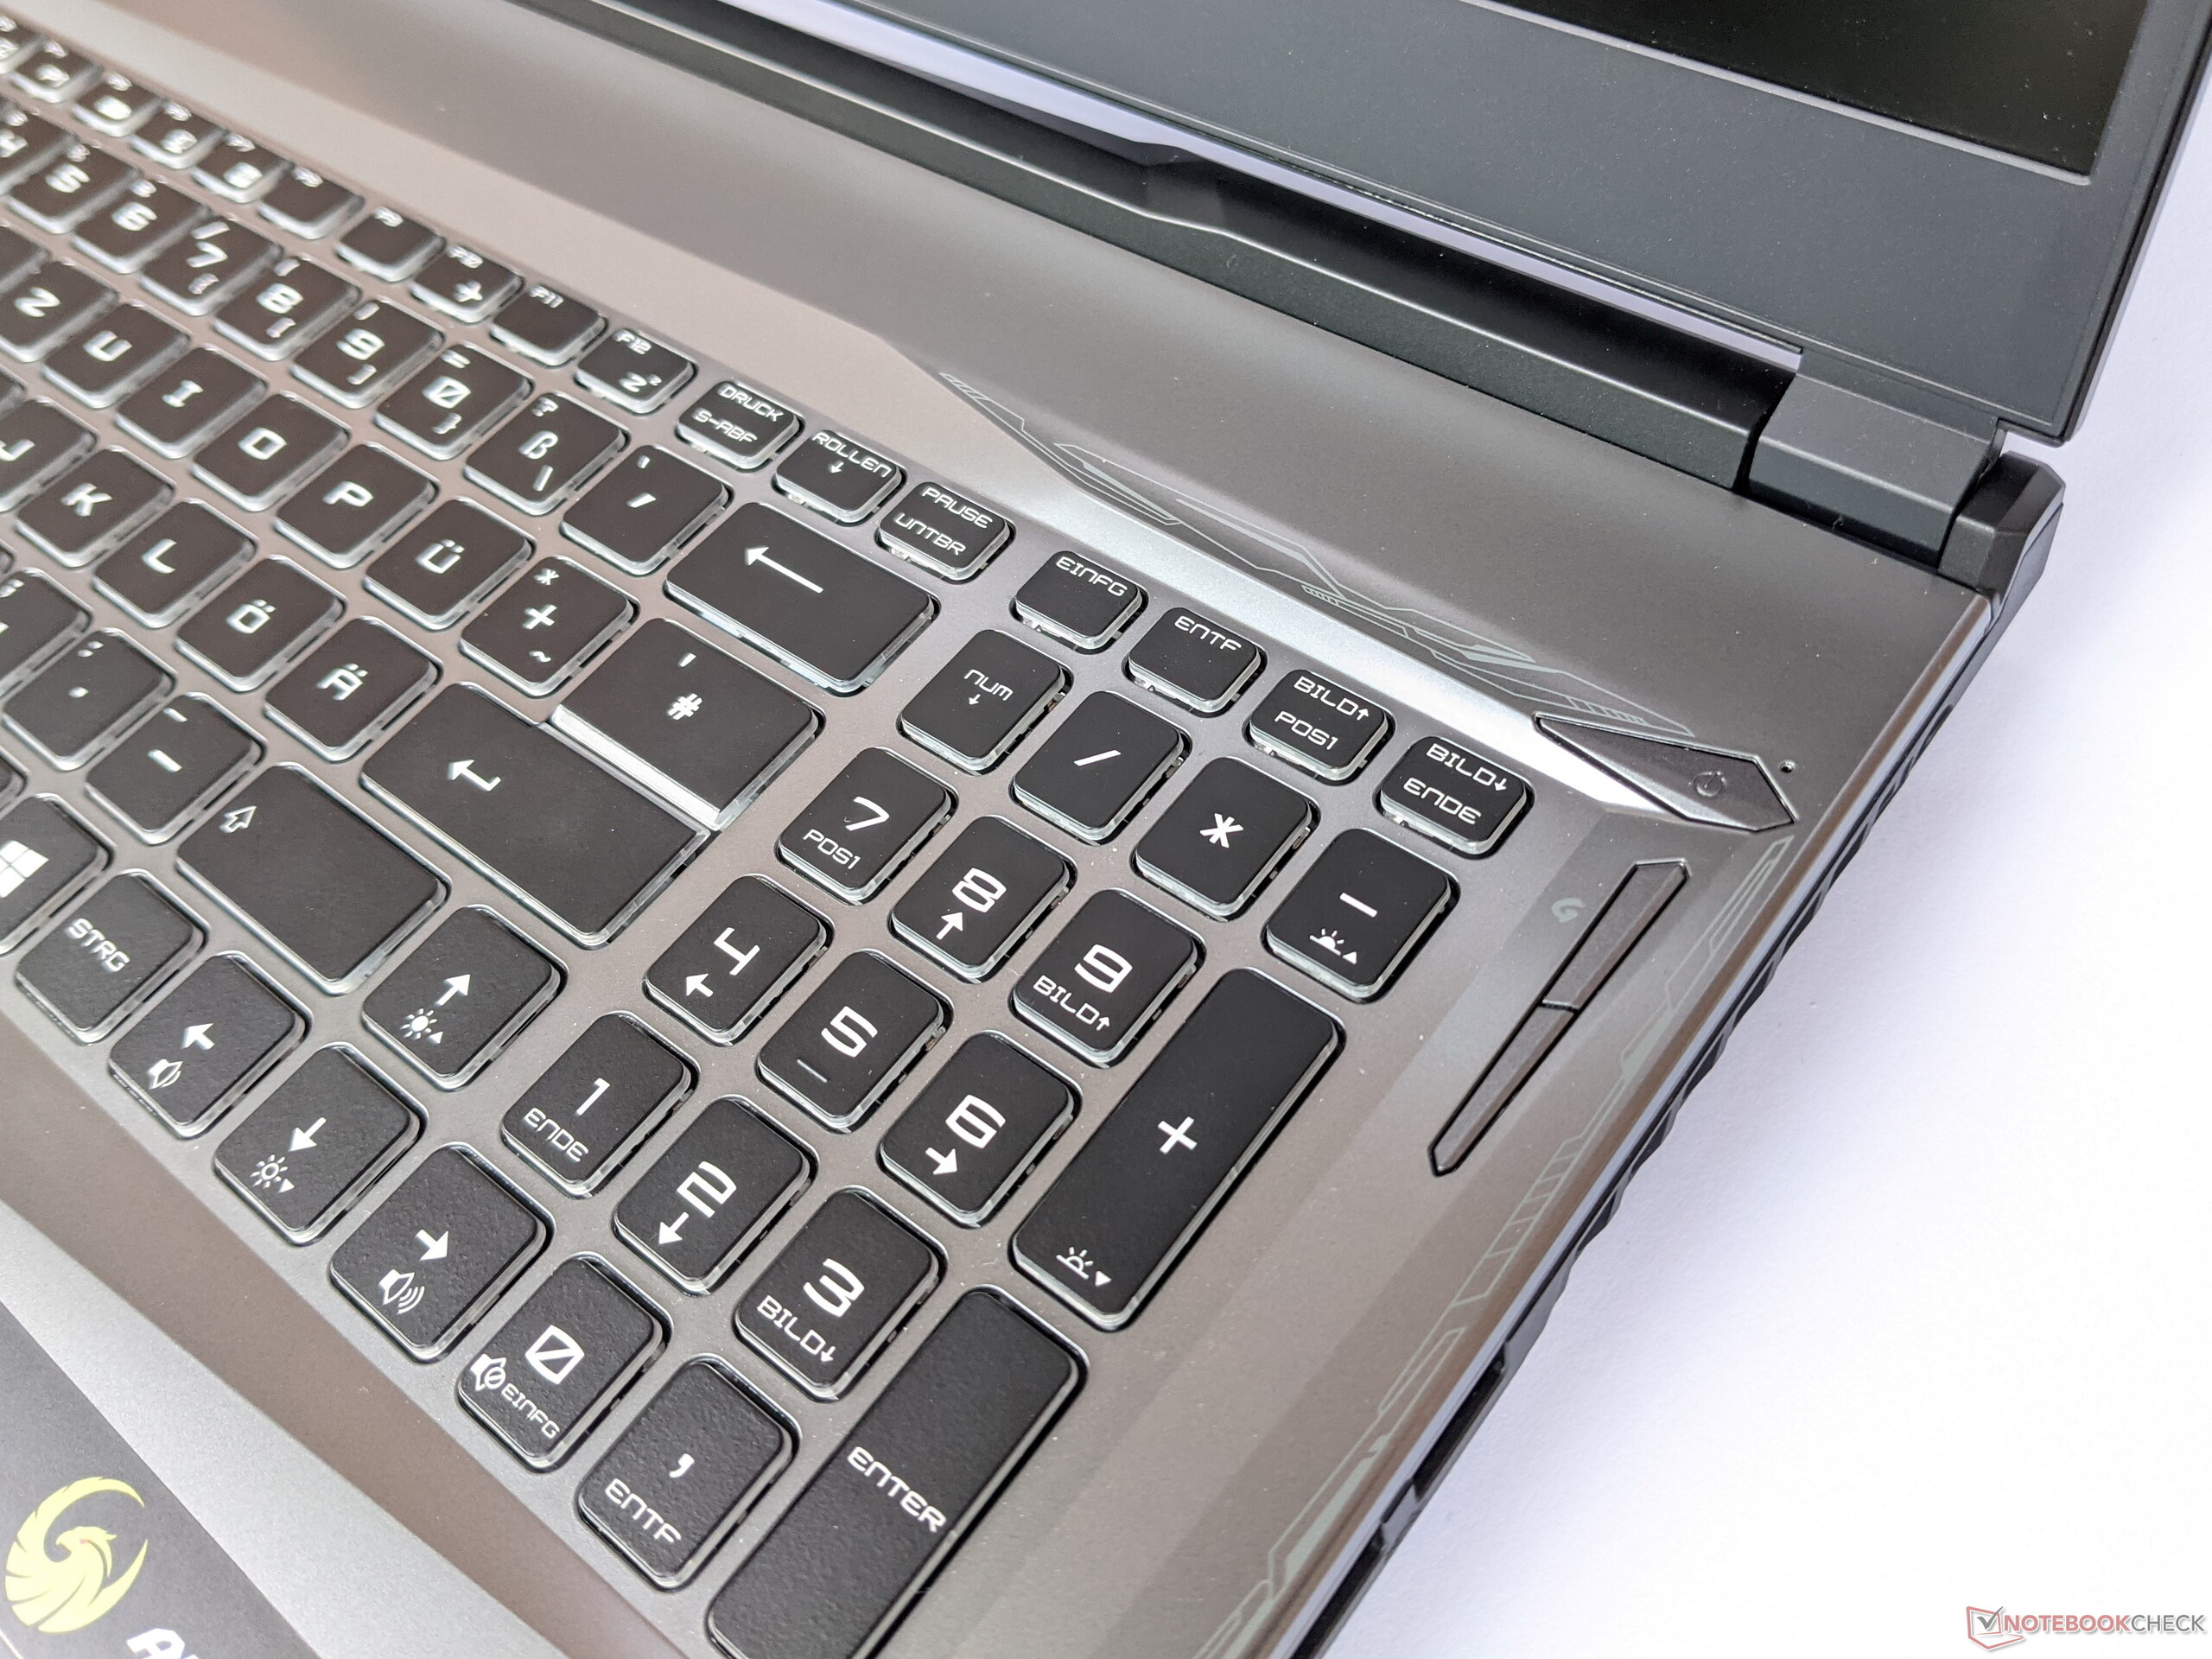
The MSI Alpha 17's keys offer a clear pressure point and a good grip for the fingertips. This makes them well suited not only for gaming but also for typing. The manufacturer also refrains from reducing the size of the arrow keys and provides special keys such as Del, Ins, and the scroll keys as separate keys. Only the Home and End keys are exclusively accessible as secondary keys.
MSI has also installed an RGB backlight for the keyboard. This can be adjusted in four brightness levels and illuminates the keys uniformly. It's possible to adjust the colors and effects extensively in the corresponding software.
Touchpad
Users can use a classic touchpad with separate buttons as mouse replacement. The mouse pointer can be navigated very well with it, and clicks are triggered reliably on the left as well as on the right.

Display - 144 Hz display in the MSI laptop
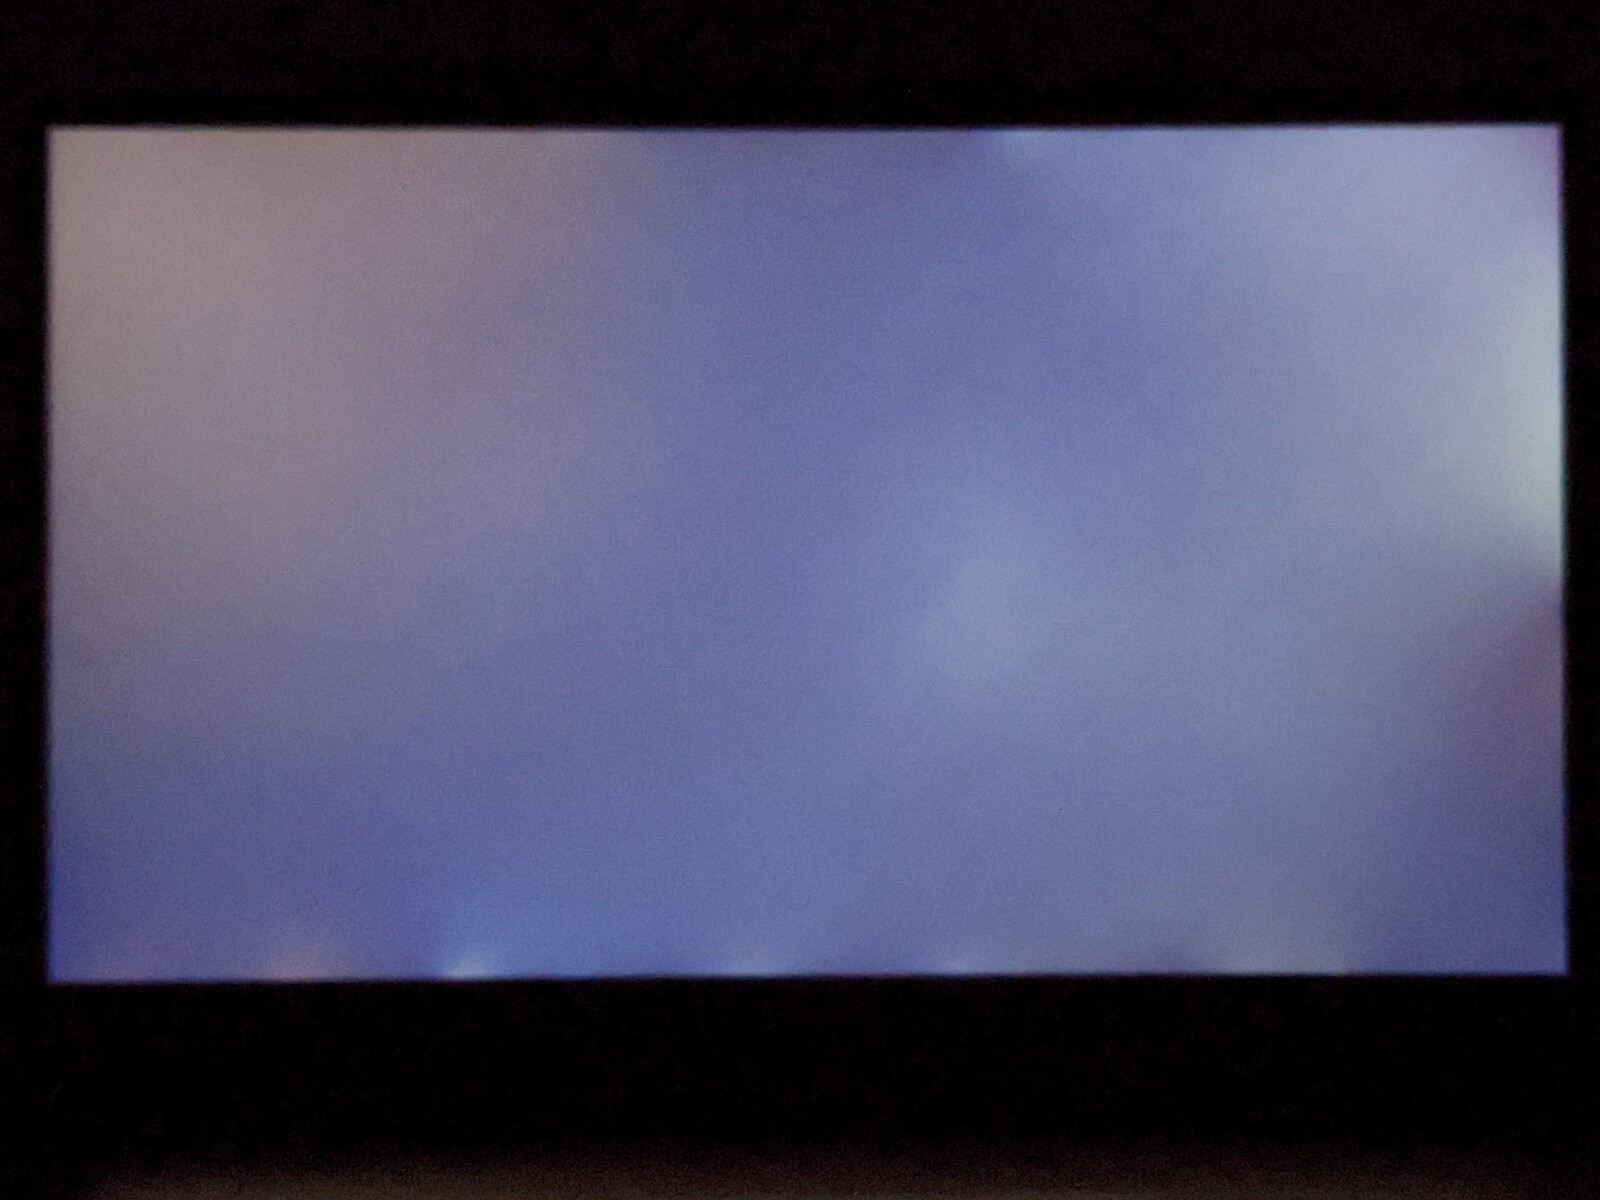
The screen of the MSI Alpha 17 consists of a 17-inch IPS panel with a resolution of 1920x1080 pixels and offers a refresh rate of 144 Hz. The average brightness of 254 cd/m² is usually high enough for indoor environments, and the brightness distribution of 93% is the highest in our test field.
No PWM is used for brightness control, which means that users with sensitive eyes shouldn't expect any problems.
| |||||||||||||||||||||||||
Brightness Distribution: 93 %
Center on Battery: 254 cd/m²
Contrast: 1104:1 (Black: 0.23 cd/m²)
ΔE ColorChecker Calman: 4.12 | ∀{0.5-29.43 Ø4.73}
calibrated: 3.78
ΔE Greyscale Calman: 3.2 | ∀{0.09-98 Ø4.98}
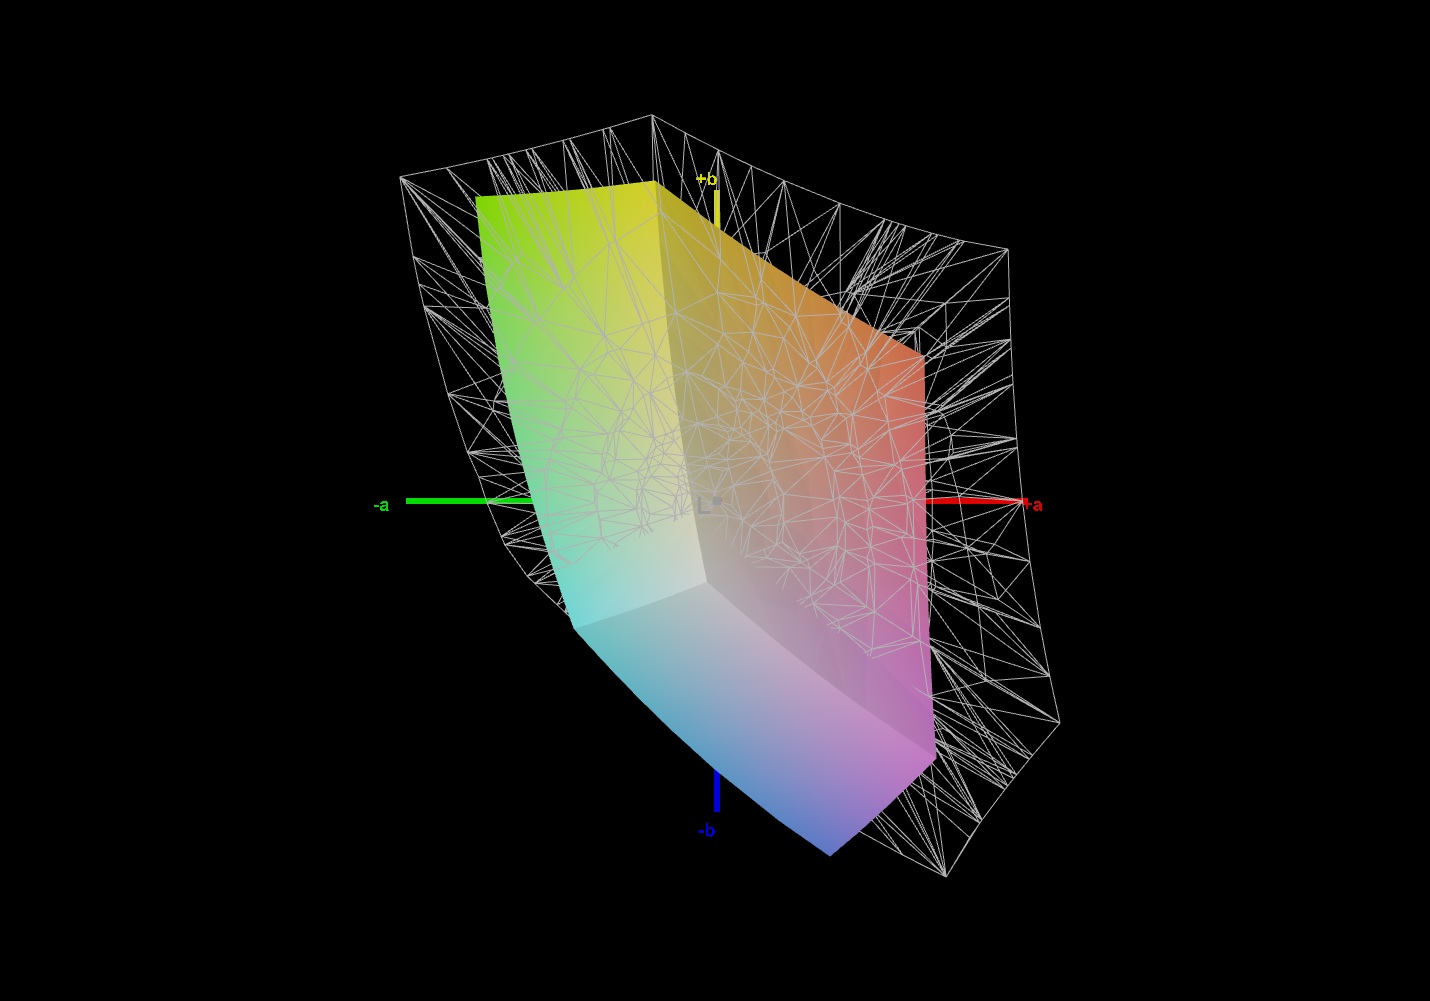
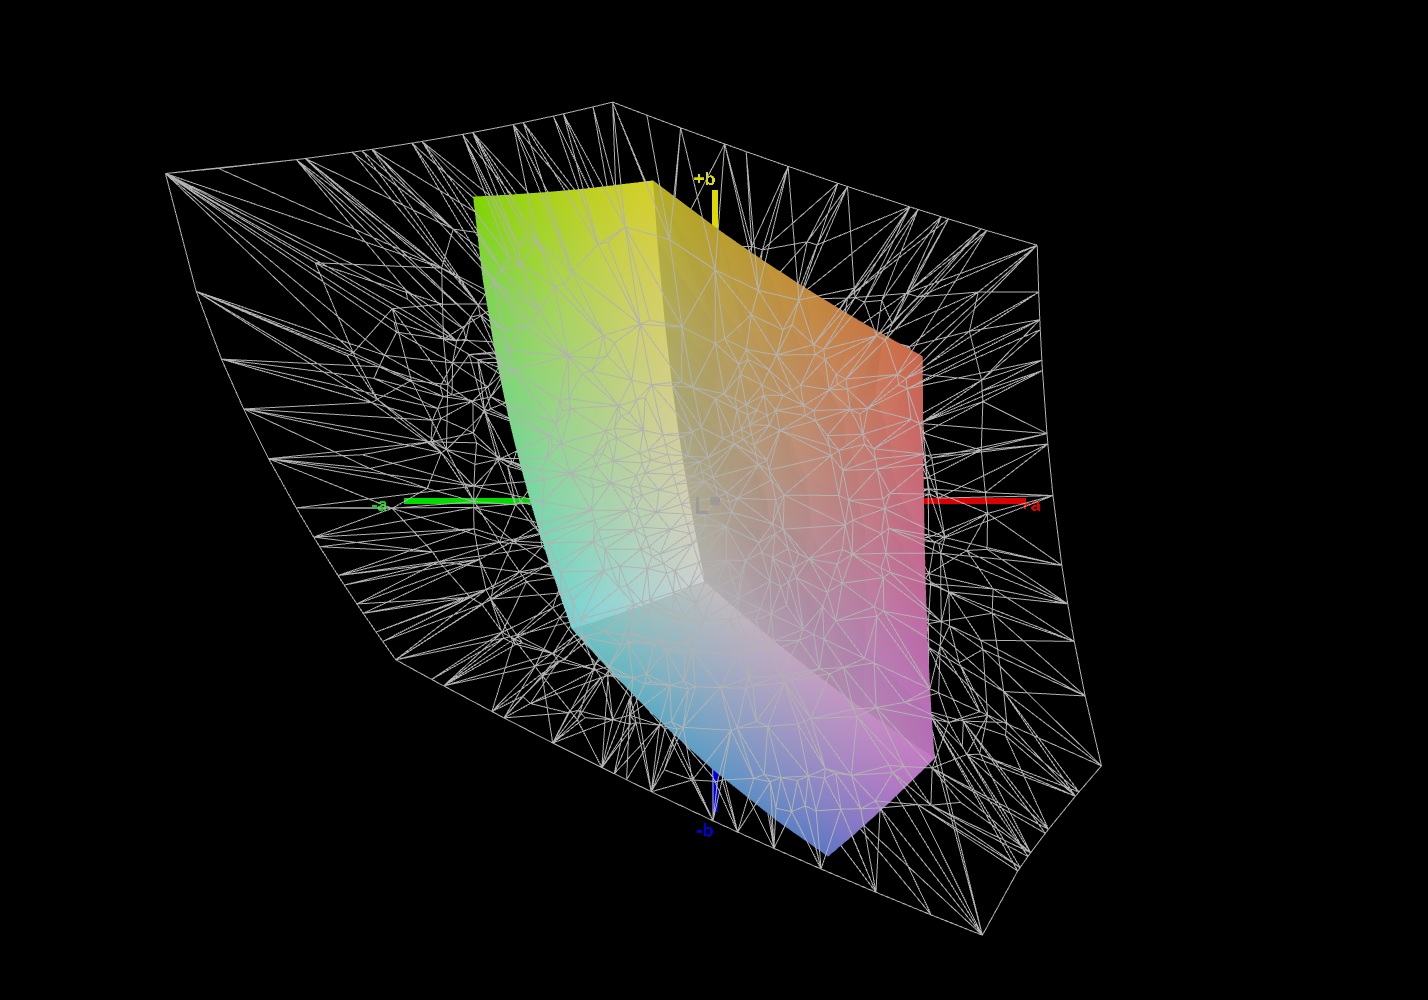
59% sRGB (Argyll 1.6.3 3D)
41% AdobeRGB 1998 (Argyll 1.6.3 3D)
40.86% AdobeRGB 1998 (Argyll 3D)
59.2% sRGB (Argyll 3D)
39.55% Display P3 (Argyll 3D)
Gamma: 2.179
CCT: 6754 K
| MSI Alpha 17 A4DEK AU Optronics AUO978F, IPS, 1920x1080, 17.3" | Schenker XMG Core 17 Comet Lake BOE HF NV173FHM-N44, IPS, 1920x1080, 17.3" | Eluktronics RP-17 BOE NV173FHM-N44, IPS, 1920x1080, 17.3" | Dell G5 15 SE 5505 P89F BOE NV156FH, WVA, 1920x1080, 15.6" | |
|---|---|---|---|---|
| Display | 61% | 60% | 56% | |
| Display P3 Coverage (%) | 39.55 | 65.3 65% | 64.7 64% | 63 59% |
| sRGB Coverage (%) | 59.2 | 92.6 56% | 92 55% | 90.1 52% |
| AdobeRGB 1998 Coverage (%) | 40.86 | 66.5 63% | 65.8 61% | 64.1 57% |
| Response Times | 61% | 52% | 56% | |
| Response Time Grey 50% / Grey 80% * (ms) | 40 ? | 17.6 ? 56% | 22.4 ? 44% | 20.4 ? 49% |
| Response Time Black / White * (ms) | 29.2 ? | 10 ? 66% | 12 ? 59% | 10.8 ? 63% |
| PWM Frequency (Hz) | 1000 ? | 943 | 198.4 ? | |
| Screen | 17% | 16% | 16% | |
| Brightness middle (cd/m²) | 254 | 315 24% | 311.5 23% | 292 15% |
| Brightness (cd/m²) | 254 | 298 17% | 301 19% | 290 14% |
| Brightness Distribution (%) | 93 | 88 -5% | 91 -2% | 77 -17% |
| Black Level * (cd/m²) | 0.23 | 0.29 -26% | 0.31 -35% | 0.27 -17% |
| Contrast (:1) | 1104 | 1086 -2% | 1005 -9% | 1081 -2% |
| Colorchecker dE 2000 * | 4.12 | 4.3 -4% | 4.13 -0% | 3.99 3% |
| Colorchecker dE 2000 max. * | 19.66 | 7.3 63% | 7.32 63% | 6.11 69% |
| Colorchecker dE 2000 calibrated * | 3.78 | 2.29 39% | 2.93 22% | 3.02 20% |
| Greyscale dE 2000 * | 3.2 | 4.3 -34% | 3.3 -3% | 3.3 -3% |
| Gamma | 2.179 101% | 2.084 106% | 2.17 101% | 2.25 98% |
| CCT | 6754 96% | 7434 87% | 7157 91% | 7047 92% |
| Color Space (Percent of AdobeRGB 1998) (%) | 41 | 66 61% | 59.5 45% | 58.1 42% |
| Color Space (Percent of sRGB) (%) | 59 | 92 56% | 91.6 55% | 89.7 52% |
| Total Average (Program / Settings) | 46% /
31% | 43% /
29% | 43% /
29% |
* ... smaller is better
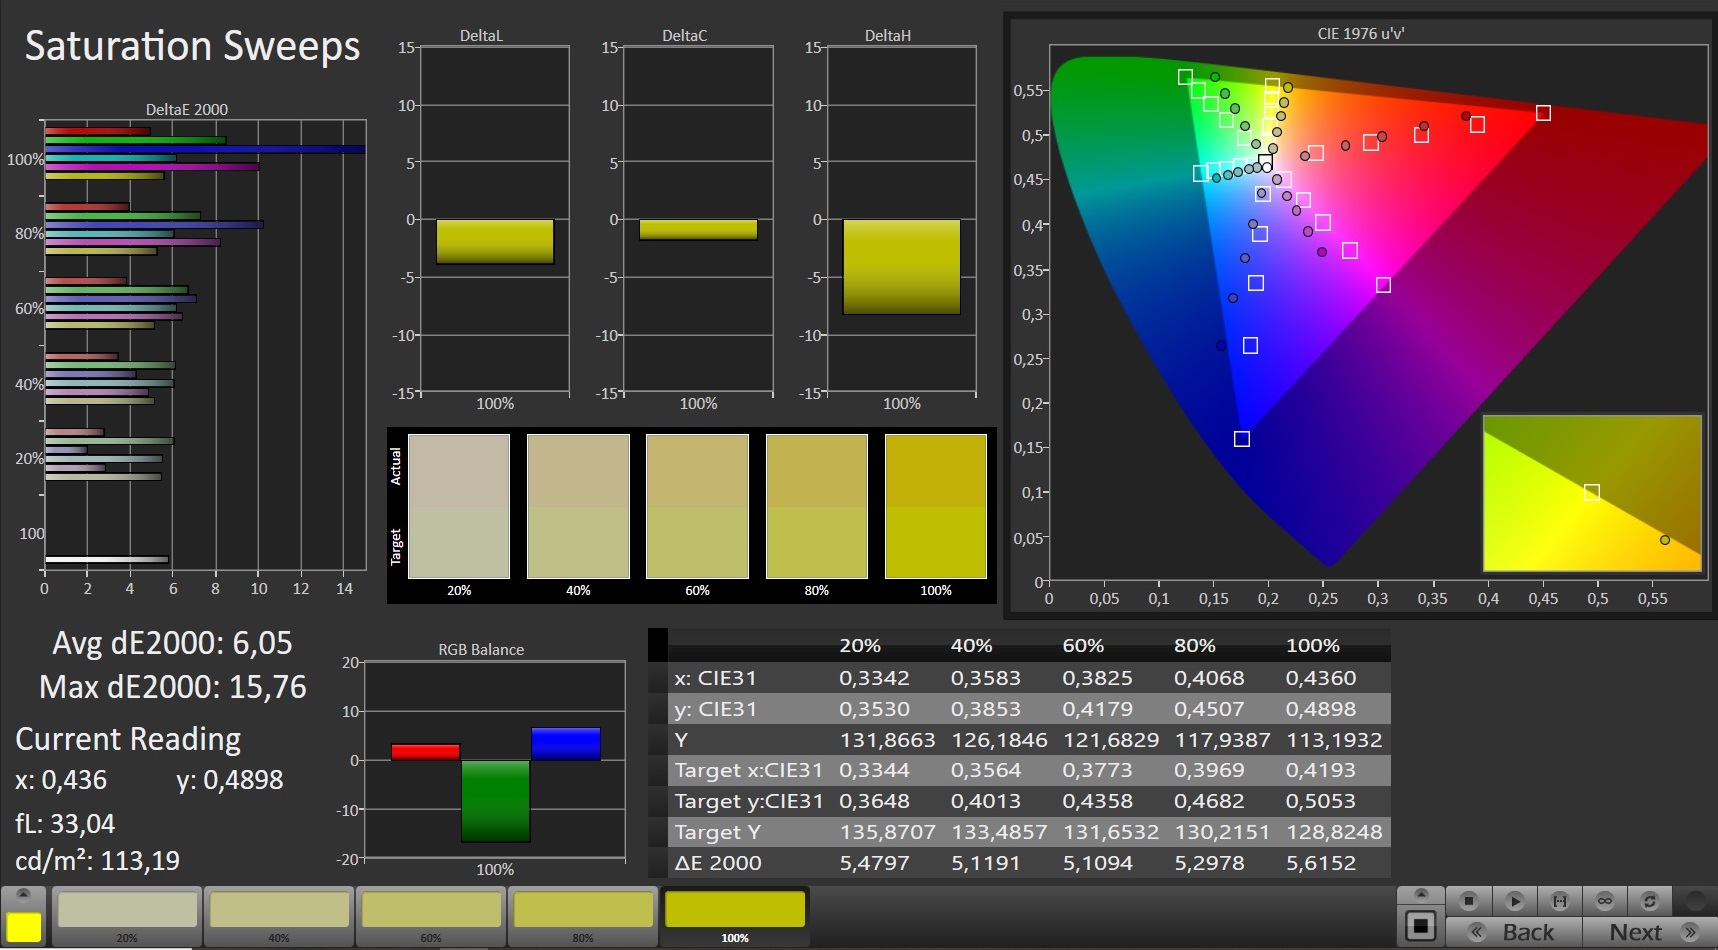
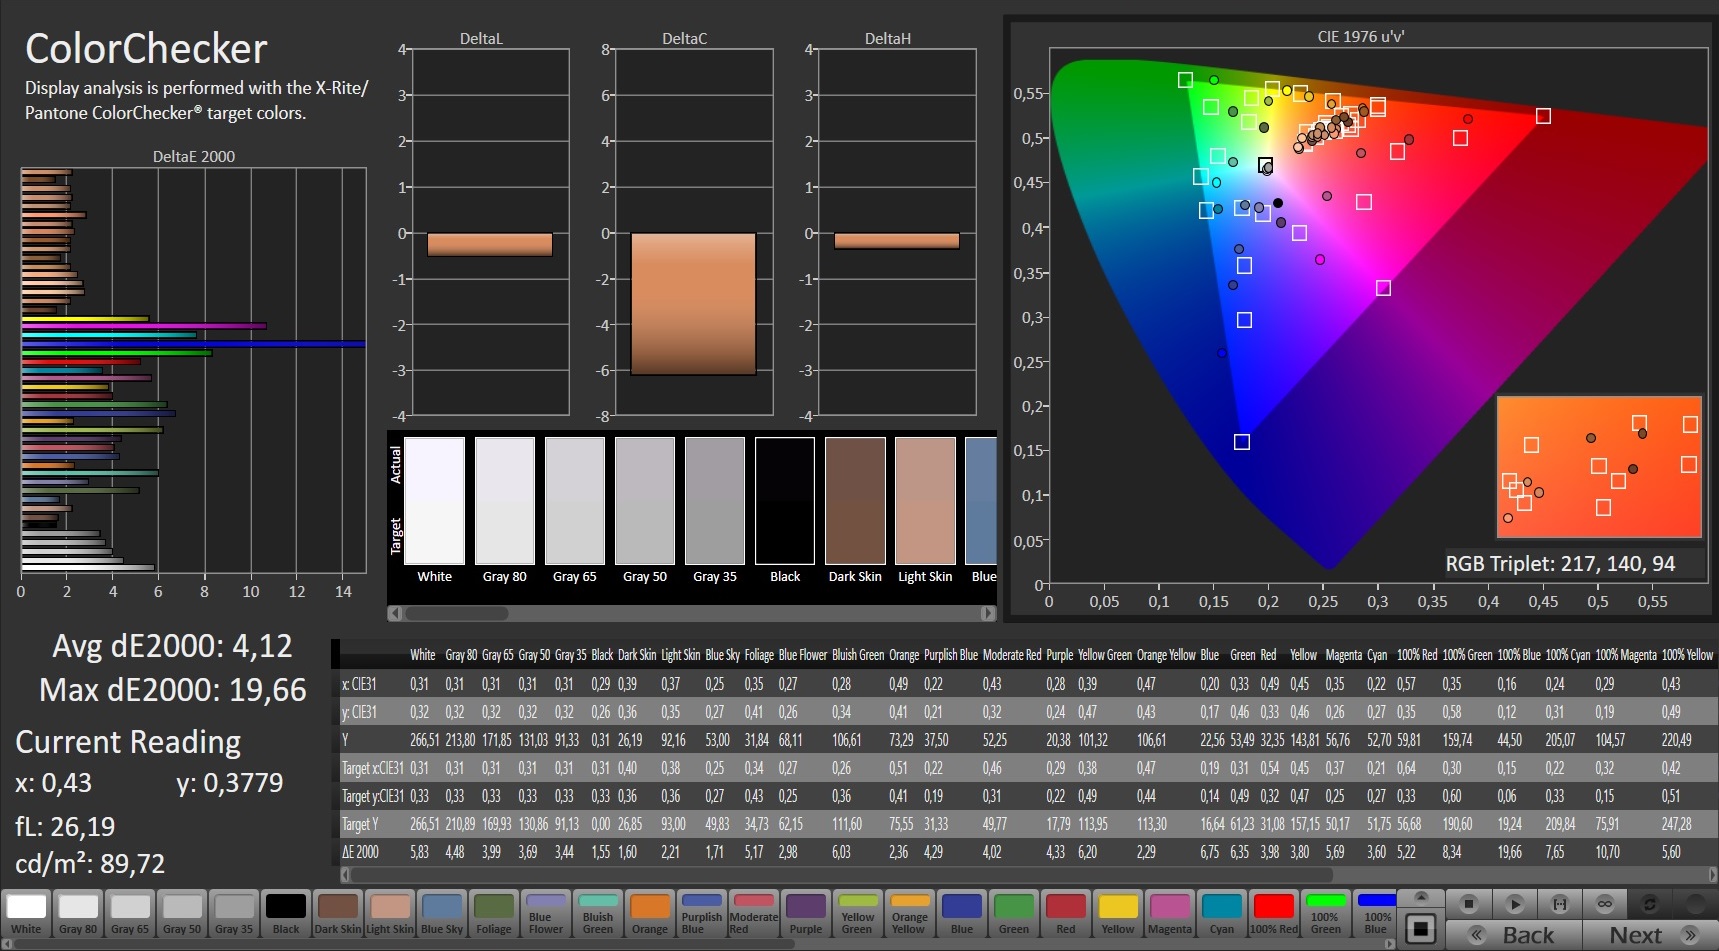
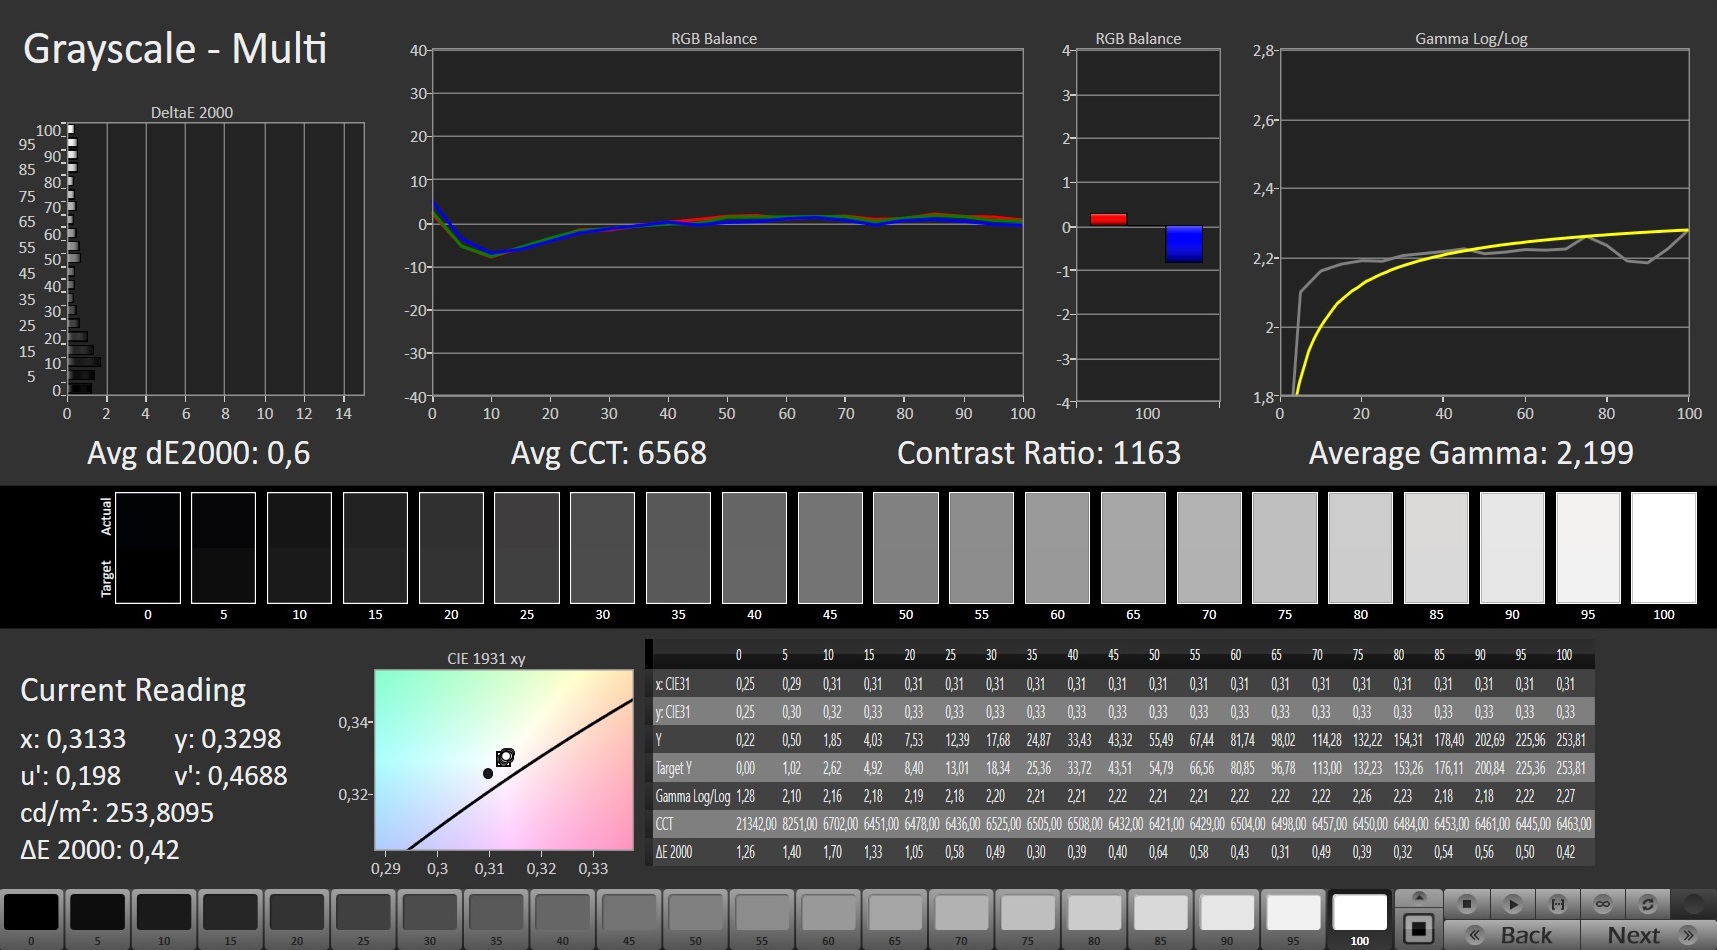
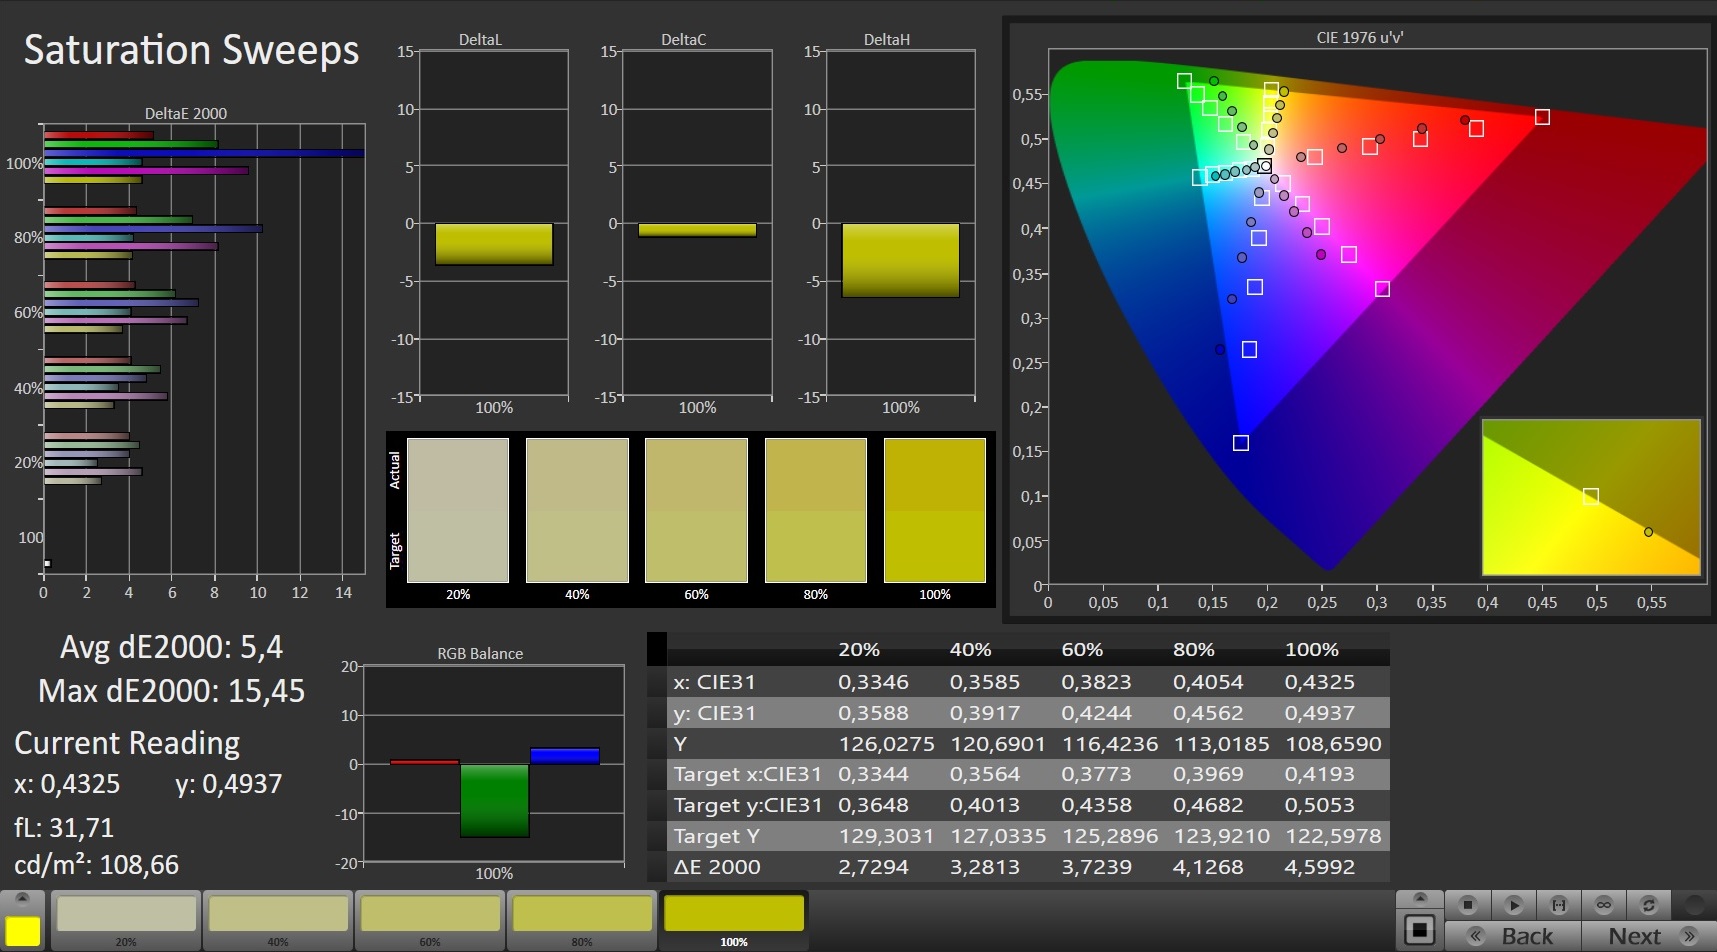
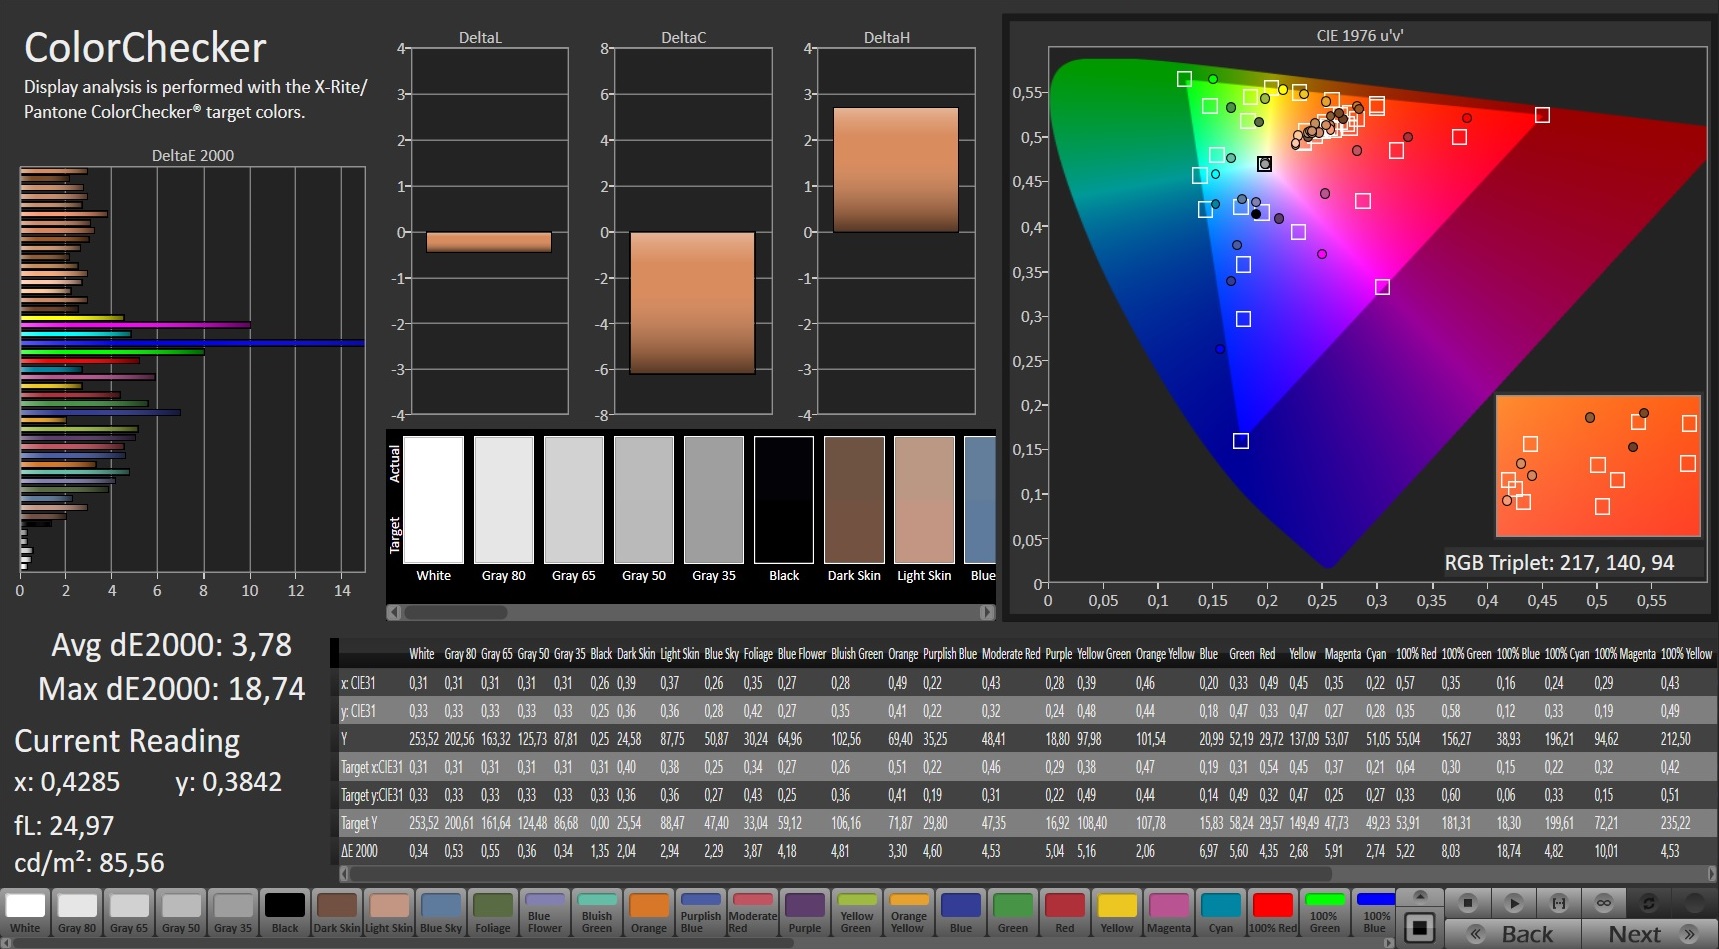
Our measurements show that the MSI Alpha 17's display has a good contrast ratio of 1,104:1 and a relatively low black level of 0.23 cd/m². As a result, colors are well separated from each other, and black image content is only covered by a slight gray haze. However, color-space coverage is poor at 59% (sRGB) and 41% (AdobeRGB), respectively.
The CalMAN analysis shows that the display already has a fairly small deviation in color reproduction out of the box. However, this can still be improved with calibration. The corresponding ICC file can be downloaded in the upper right window, next to the display's brightness distribution graph.

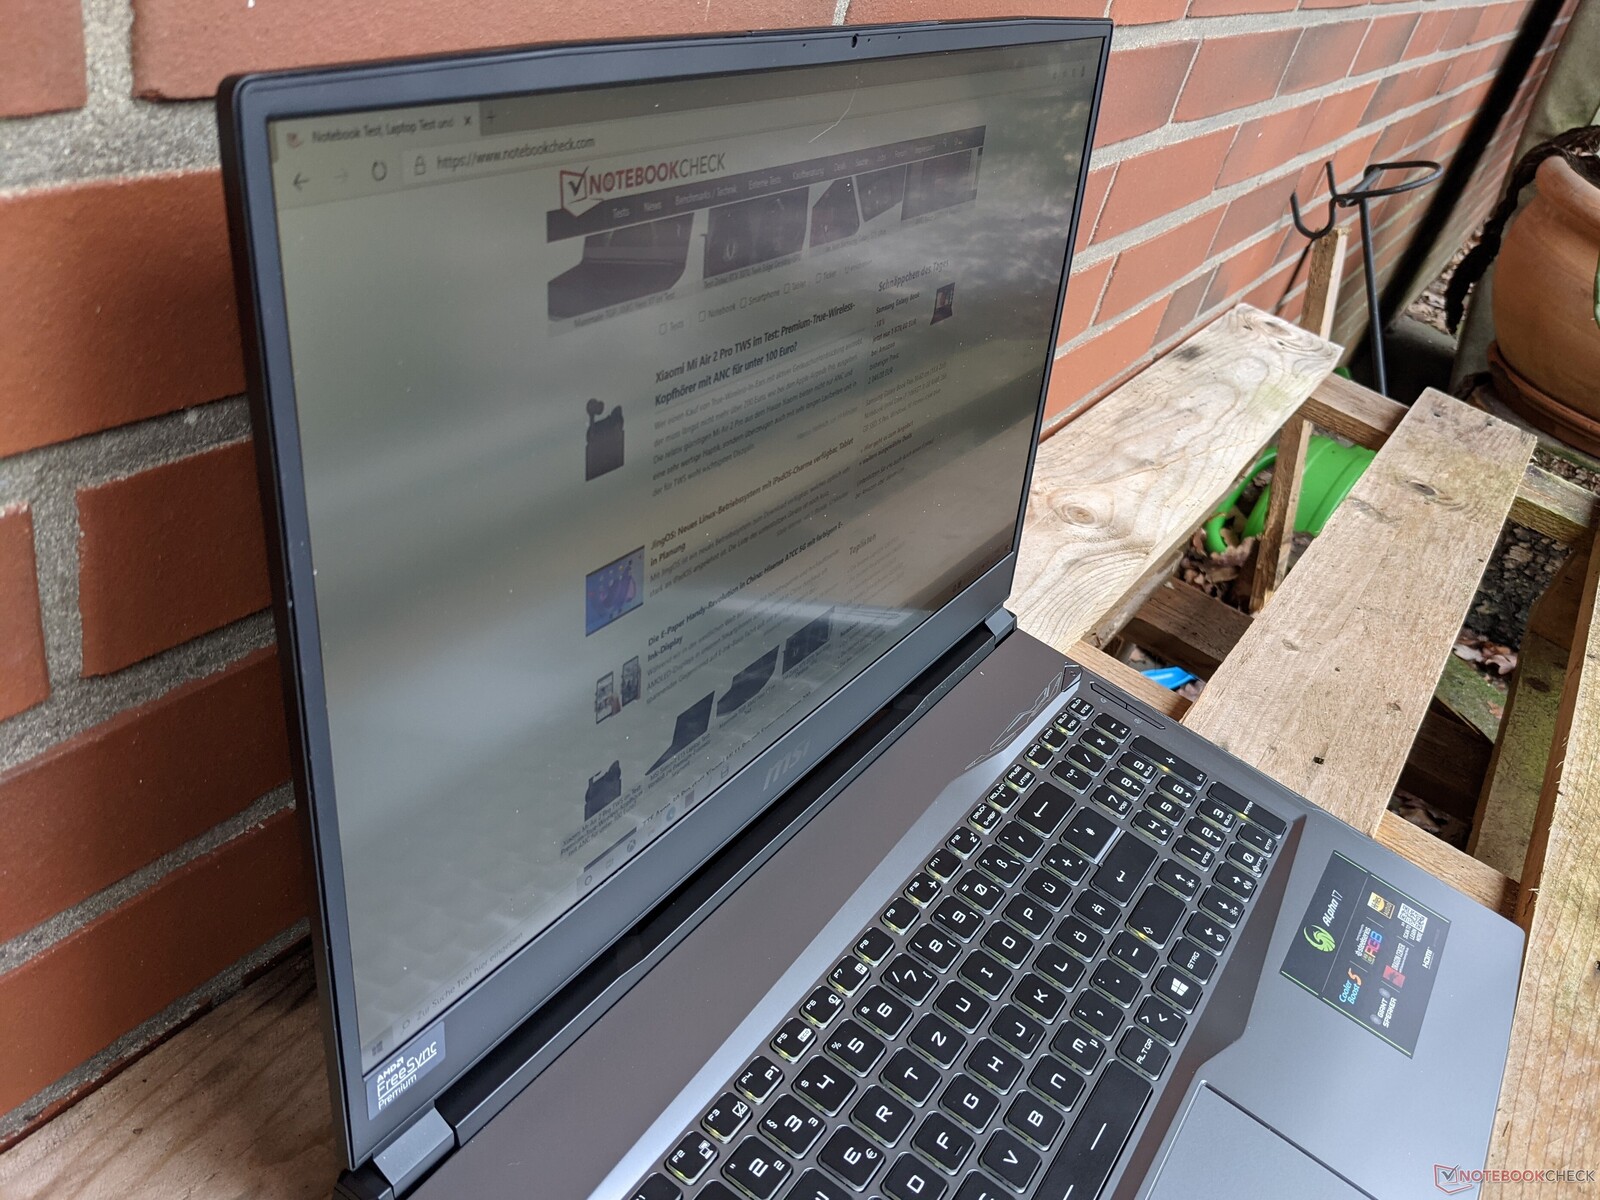
Outdoors, the MSI Alpha 17 can be used well in places in the shade. The screen surface is matte, but there are still very slight reflections from objects in the environment.
Display Response Times
| ↔ Response Time Black to White | ||
|---|---|---|
| 29.2 ms ... rise ↗ and fall ↘ combined | ↗ 15.6 ms rise | 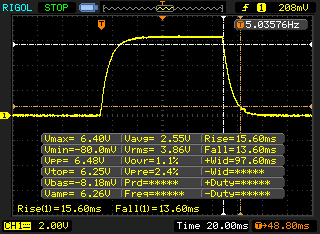 |
| ↘ 13.6 ms fall | ||
| The screen shows relatively slow response rates in our tests and may be too slow for gamers. In comparison, all tested devices range from 0.1 (minimum) to 240 (maximum) ms. » 78 % of all devices are better. This means that the measured response time is worse than the average of all tested devices (19.9 ms). | ||
| ↔ Response Time 50% Grey to 80% Grey | ||
| 40 ms ... rise ↗ and fall ↘ combined | ↗ 19.6 ms rise | 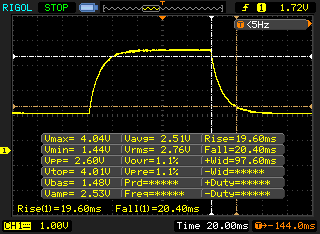 |
| ↘ 20.4 ms fall | ||
| The screen shows slow response rates in our tests and will be unsatisfactory for gamers. In comparison, all tested devices range from 0.165 (minimum) to 636 (maximum) ms. » 61 % of all devices are better. This means that the measured response time is worse than the average of all tested devices (31.1 ms). | ||
Screen Flickering / PWM (Pulse-Width Modulation)
| Screen flickering / PWM not detected | 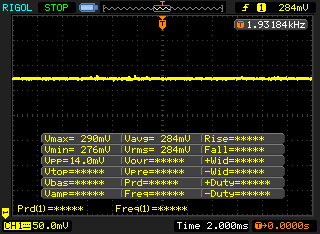 | ||
In comparison: 52 % of all tested devices do not use PWM to dim the display. If PWM was detected, an average of 7822 (minimum: 1.31 - maximum: 343500) Hz was measured. | |||
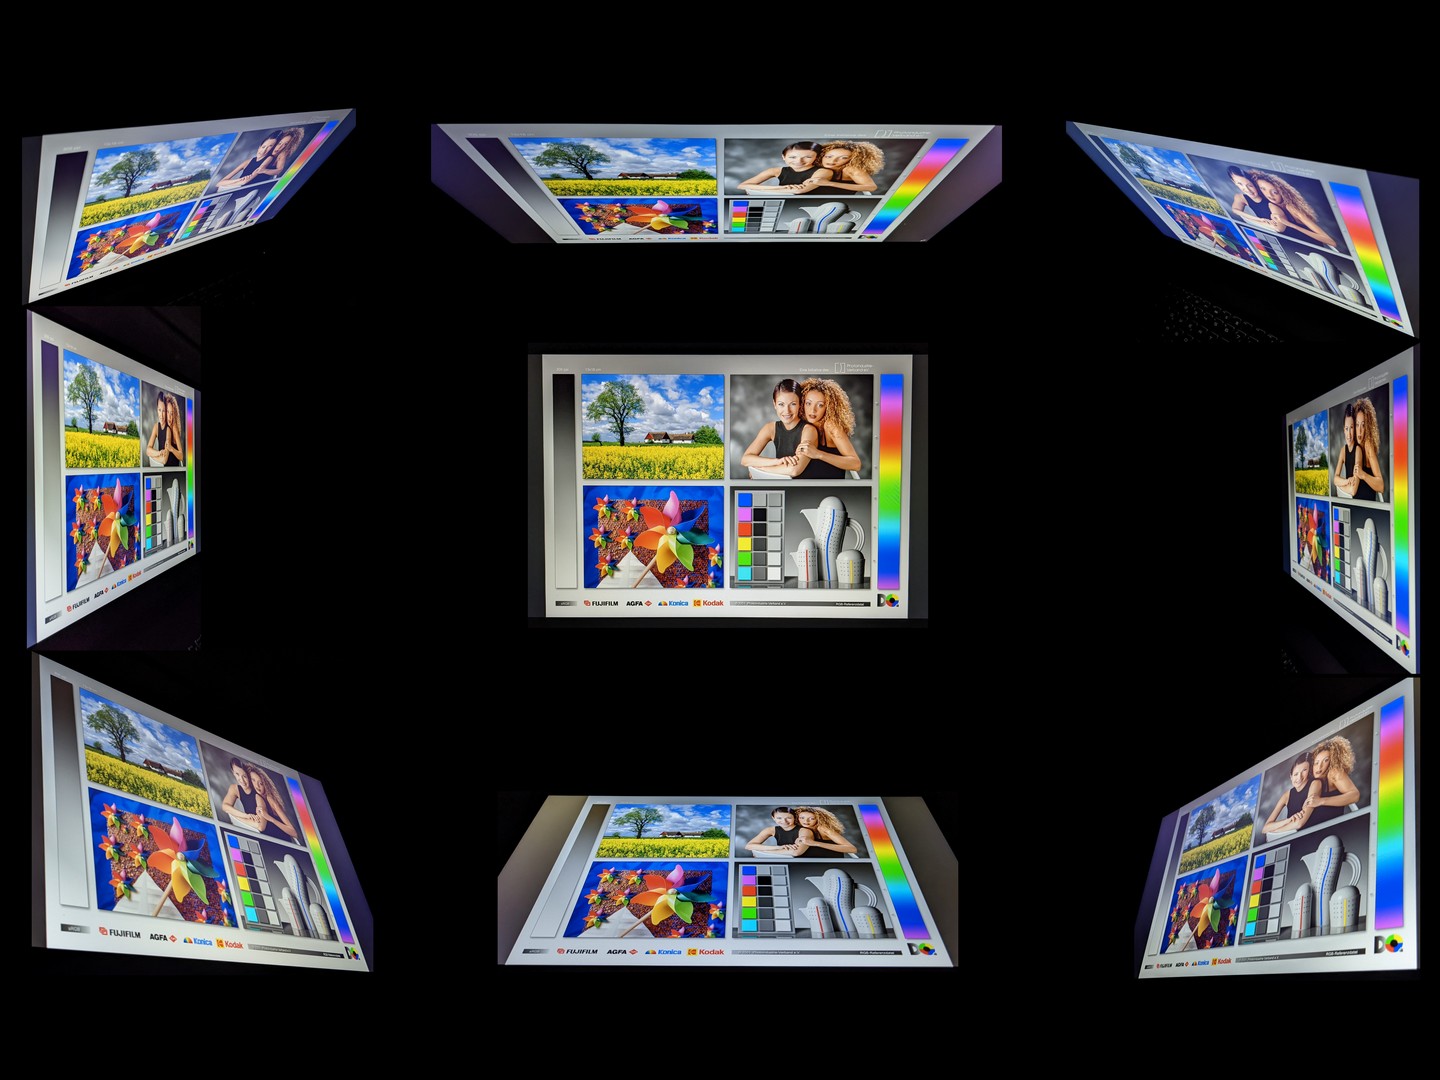
The IPS panel of the Alpha 17 is very viewing-angle stable. Image content can be read from almost any angle without it becoming distorted or displayed with the wrong colors.
Performance - Gaming laptop with Ryzen 7 and RX 5600M
MSI's Alpha 17 is aimed at price-conscious gamers who are looking for a gaming laptop with the largest possible screen. The installed hardware can display modern games smoothly at high frame rates, but it might be necessary to reduce the resolution in very demanding titles.
Processor
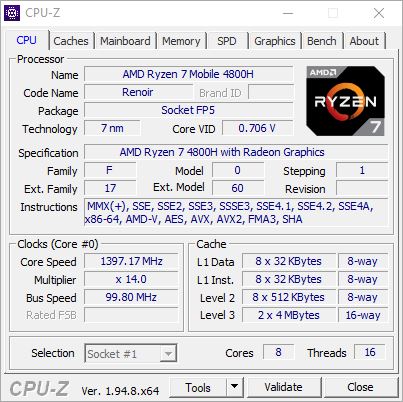
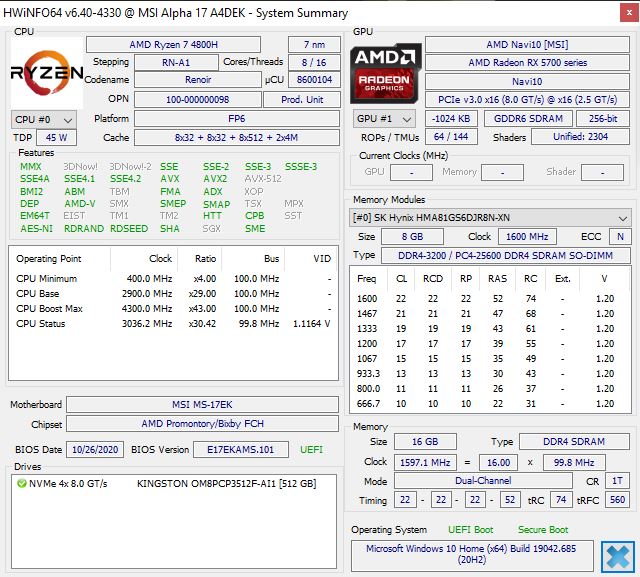
The MSI Alpha 17 is powered by an AMD Ryzen 7 4800H. This processor has eight cores and can process up to 16 threads simultaneously at clock rates between 2.9 and 4.2 GHz. Performance depends on the cooling solution and the TDP setting. MSI fully exploits the latter with a PL1 of 54 watts, but up to 65 watts is possible for a short time.
Our Cinebench R15 endurance test also shows that the initially very high multi-core score outperforms our chosen competition. Afterwards, the result drops moderately down to the value of the Eluktronics RP-17, which is also equipped with a Ryzen 7 4800H, and experiences another significant drop shortly before the end of the test. Compared with the Dell G5 15 SE, however, the MSI Alpha 17 can maintain its performance better.
In the individual tests, the Intel competitor that we chose, the Core i7-10750H in the Schenker XMG Core 17, shows a significantly stronger single-core performance. In return, the Ryzen 7 4800H used here can prevail in the multi-core disciplines.
* ... smaller is better
System performance
In the PCMark 10 test for system performance, the MSI Alpha 17 shows a slightly below-average result. While the result of the individual discipline "Digital Content Creation" ensures the first place in our test field, the scores of the remaining individual tests are only enough for the penultimate place. The system always runs smoothly in everyday use and doesn't experience any micro stuttering or the like.
The performance of other laptops in comparison can be seen in our CPU Benchmarks article.
| PCMark 10 Score | 5911 points | |
Help | ||
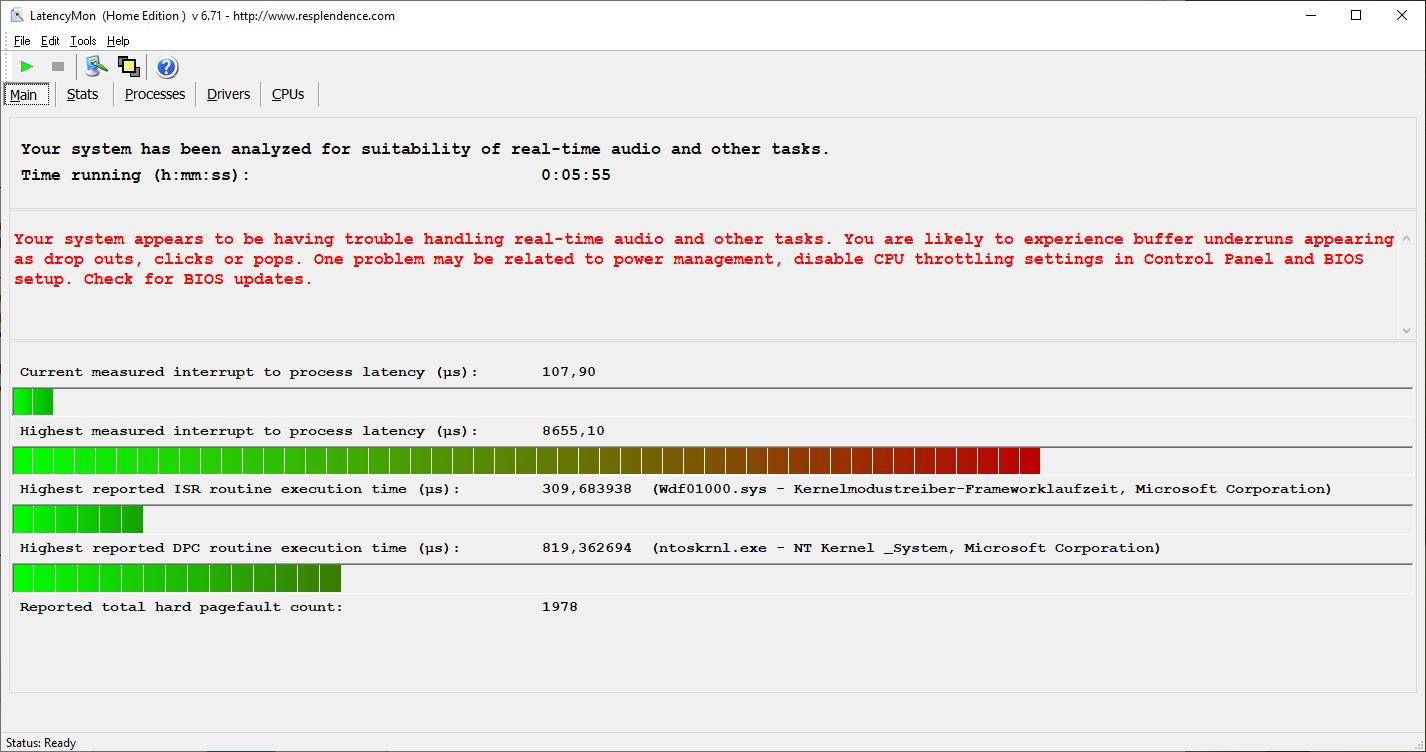
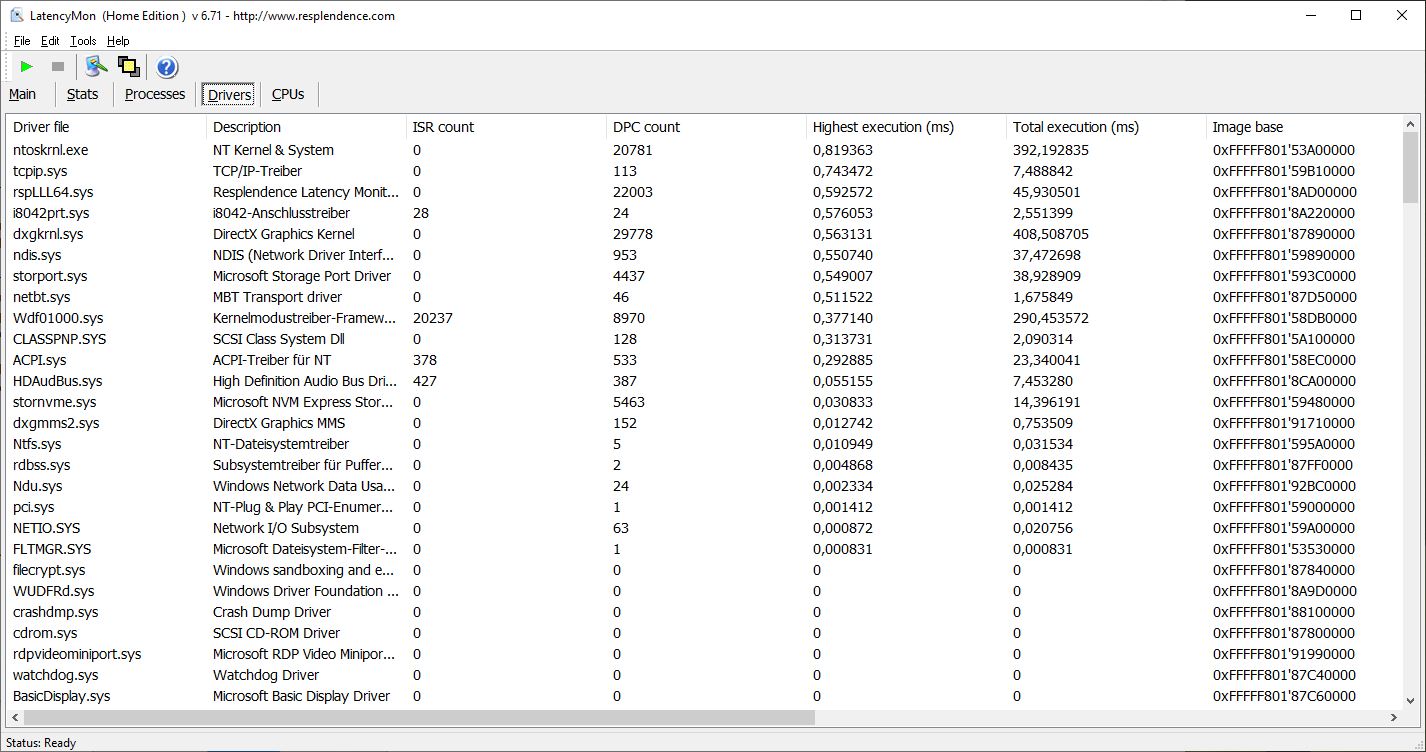
DPC latencies
In our test with LatencyMon, the MSI Alpha 17 reveals rather high interruption times. Therefore, it's not suitable for real-time applications.
| DPC Latencies / LatencyMon - interrupt to process latency (max), Web, Youtube, Prime95 | |
| MSI Alpha 17 A4DEK | |
| Dell G5 15 SE 5505 P89F | |
| Eluktronics RP-17 | |
| Schenker XMG Core 17 Comet Lake | |
* ... smaller is better
Storage
The SSD installed in the MSI Alpha 17 achieves solid write and read rates, but these are surpassed by the other devices in our test field. The results achieved by other mass storage devices can be found in our HDD/SSD Benchmarks article.
| MSI Alpha 17 A4DEK Kingston OM8PCP3512F-AB | Schenker XMG Core 17 Comet Lake Samsung SSD 970 EVO Plus 1TB | Eluktronics RP-17 Phison PS5013 PRO-X-1TB-G2R NVMe SSD | Dell G5 15 SE 5505 P89F Samsung PM991 MZ9LQ512HALU | Average Kingston OM8PCP3512F-AB | |
|---|---|---|---|---|---|
| CrystalDiskMark 5.2 / 6 | 96% | 44% | 14% | -2% | |
| Write 4K (MB/s) | 204.7 | 169.5 -17% | 226.1 10% | 142.1 -31% | 194.5 ? -5% |
| Read 4K (MB/s) | 50.4 | 51.5 2% | 54.7 9% | 46.43 -8% | 47.3 ? -6% |
| Write Seq (MB/s) | 985 | 3009 205% | 1868 90% | 1108 12% | 978 ? -1% |
| Read Seq (MB/s) | 1193 | 2959 148% | 1648 38% | 1622 36% | 1299 ? 9% |
| Write 4K Q32T1 (MB/s) | 537 | 536 0% | 429.9 -20% | 467 -13% | 505 ? -6% |
| Read 4K Q32T1 (MB/s) | 300 | 621 107% | 521 74% | 525 75% | 301 ? 0% |
| Write Seq Q32T1 (MB/s) | 982 | 3339 240% | 2248 129% | 1203 23% | 978 ? 0% |
| Read Seq Q32T1 (MB/s) | 1985 | 3561 79% | 2484 25% | 2288 15% | 1930 ? -3% |
| AS SSD | 216% | 89% | 28% | 36% | |
| Seq Read (MB/s) | 251.9 | 2937 1066% | 1689 571% | 1386 450% | 1570 ? 523% |
| Seq Write (MB/s) | 925 | 2858 209% | 1695 83% | 1234 33% | 904 ? -2% |
| 4K Read (MB/s) | 58.2 | 50.3 -14% | 50 -14% | 41.32 -29% | 48.2 ? -17% |
| 4K Write (MB/s) | 98 | 130.6 33% | 182.9 87% | 128 31% | 118.9 ? 21% |
| 4K-64 Read (MB/s) | 461.4 | 1710 271% | 1043 126% | 854 85% | 415 ? -10% |
| 4K-64 Write (MB/s) | 924 | 2355 155% | 1841 99% | 721 -22% | 829 ? -10% |
| Access Time Read * (ms) | 0.09 | 0.037 59% | 0.04 56% | 0.098 -9% | 0.1294 ? -44% |
| Access Time Write * (ms) | 0.022 | 0.028 -27% | 0.102 -364% | 0.095 -332% | 0.0371 ? -69% |
| Score Read (Points) | 545 | 2054 277% | 1262 132% | 1034 90% | 619 ? 14% |
| Score Write (Points) | 1114 | 2771 149% | 2194 97% | 973 -13% | 1036 ? -7% |
| Score Total (Points) | 1994 | 5873 195% | 4112 106% | 2536 27% | 1955 ? -2% |
| Total Average (Program / Settings) | 156% /
165% | 67% /
70% | 21% /
22% | 17% /
20% |
* ... smaller is better

Continuous load read: DiskSpd Read Loop, Queue Depth 8
Graphics card
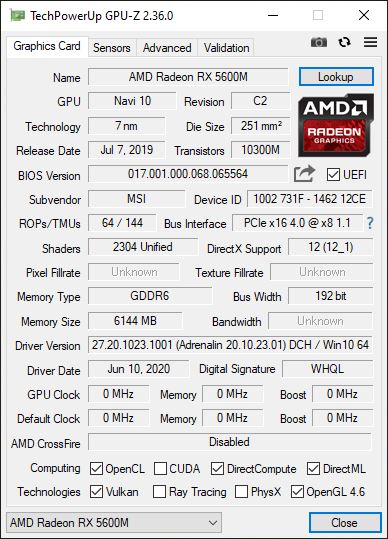
The graphics card used here is an AMD Radeon RX 5600M with 6 GB of video memory. It belongs to the mid-range and is suitable for demanding graphics applications. However, the results in the 3DMark tests are slightly below average. For example, the Dell G5 15 can rank much higher in our test field with this GPU. In 3DMark, the Eluktronics RP-17 with the Nvidia GeForce RTX 2060 Mobile is just above the MSI Alpha 17.
Our GPU Benchmarks article shows the performance that other graphics cards were able to achieve in our tests.
| 3DMark 11 Performance | 19927 points | |
| 3DMark Fire Strike Score | 14806 points | |
| 3DMark Time Spy Score | 5931 points | |
Help | ||
Gaming performance
The AMD Radeon RX 5600M can run most modern games smoothly in Full HD and with high detail levels. In the games that we tested, the detail levels only had to be reduced a bit in very demanding games. However, frame rates around 30 fps were always possible. Nevertheless, users who want to play on an external 4K screen will have to be prepared for higher reductions depending on the game.
The performance that can be expected from the AMD Radeon RX 5600M in other games can be found in our GPU Games article.
| The Witcher 3 - 1920x1080 Ultra Graphics & Postprocessing (HBAO+) | |
| Average of class Gaming (83.7 - 240, n=11, last 2 years) | |
| Dell G5 15 SE 5505 P89F | |
| Average AMD Radeon RX 5600M (61 - 66.1, n=2) | |
| Eluktronics RP-17 | |
| MSI Alpha 17 A4DEK | |
| Schenker XMG Core 17 Comet Lake | |
| Dota 2 Reborn - 1920x1080 ultra (3/3) best looking | |
| Average of class Gaming (84.8 - 248, n=114, last 2 years) | |
| Schenker XMG Core 17 Comet Lake | |
| MSI Alpha 17 A4DEK | |
| Average AMD Radeon RX 5600M (102 - 105, n=2) | |
| Dell G5 15 SE 5505 P89F | |
| Eluktronics RP-17 | |
| Final Fantasy XV Benchmark - 1920x1080 High Quality | |
| Average of class Gaming (41 - 215, n=105, last 2 years) | |
| Eluktronics RP-17 | |
| MSI Alpha 17 A4DEK | |
| Average AMD Radeon RX 5600M (n=1) | |
| X-Plane 11.11 - 1920x1080 high (fps_test=3) | |
| Average of class Gaming (52.1 - 144.5, n=117, last 2 years) | |
| Schenker XMG Core 17 Comet Lake | |
| Eluktronics RP-17 | |
| Dell G5 15 SE 5505 P89F | |
| Average AMD Radeon RX 5600M (33.3 - 33.7, n=2) | |
| MSI Alpha 17 A4DEK | |
Our The Witcher 3 endurance test shows that although the fps drop slowly over time, they still decline a bit. Therefore, users have to expect a slight drop in frame rates during very long gaming sessions.
| low | med. | high | ultra | |
|---|---|---|---|---|
| The Witcher 3 (2015) | 61 | |||
| Dota 2 Reborn (2015) | 123 | 119 | 108 | 105 |
| Final Fantasy XV Benchmark (2018) | 129 | 78 | 51.1 | |
| X-Plane 11.11 (2018) | 49.8 | 37.1 | 33.3 |
Emissions - MSI Alpha 17 with strong speakers
Noise emissions
According to our measurements, the MSI Alpha 17 can get very loud at up to 54 dB(A). However, it's very quiet or even inaudible in daily use, especially during office and Internet tasks. In gaming mode, the volume depends on the selected fan profile. Depending on the game and the desired frame rate, moderate noise level is also possible here.
Apart from the fan noise, a constant coil whine could be heard from the included power adapter in our test device, but it's only audible in very quiet environments.
Noise level
| Idle |
| 31 / 32 / 33 dB(A) |
| Load |
| 38 / 54 dB(A) |
 | ||
30 dB silent 40 dB(A) audible 50 dB(A) loud |
||
min: | ||
Temperature
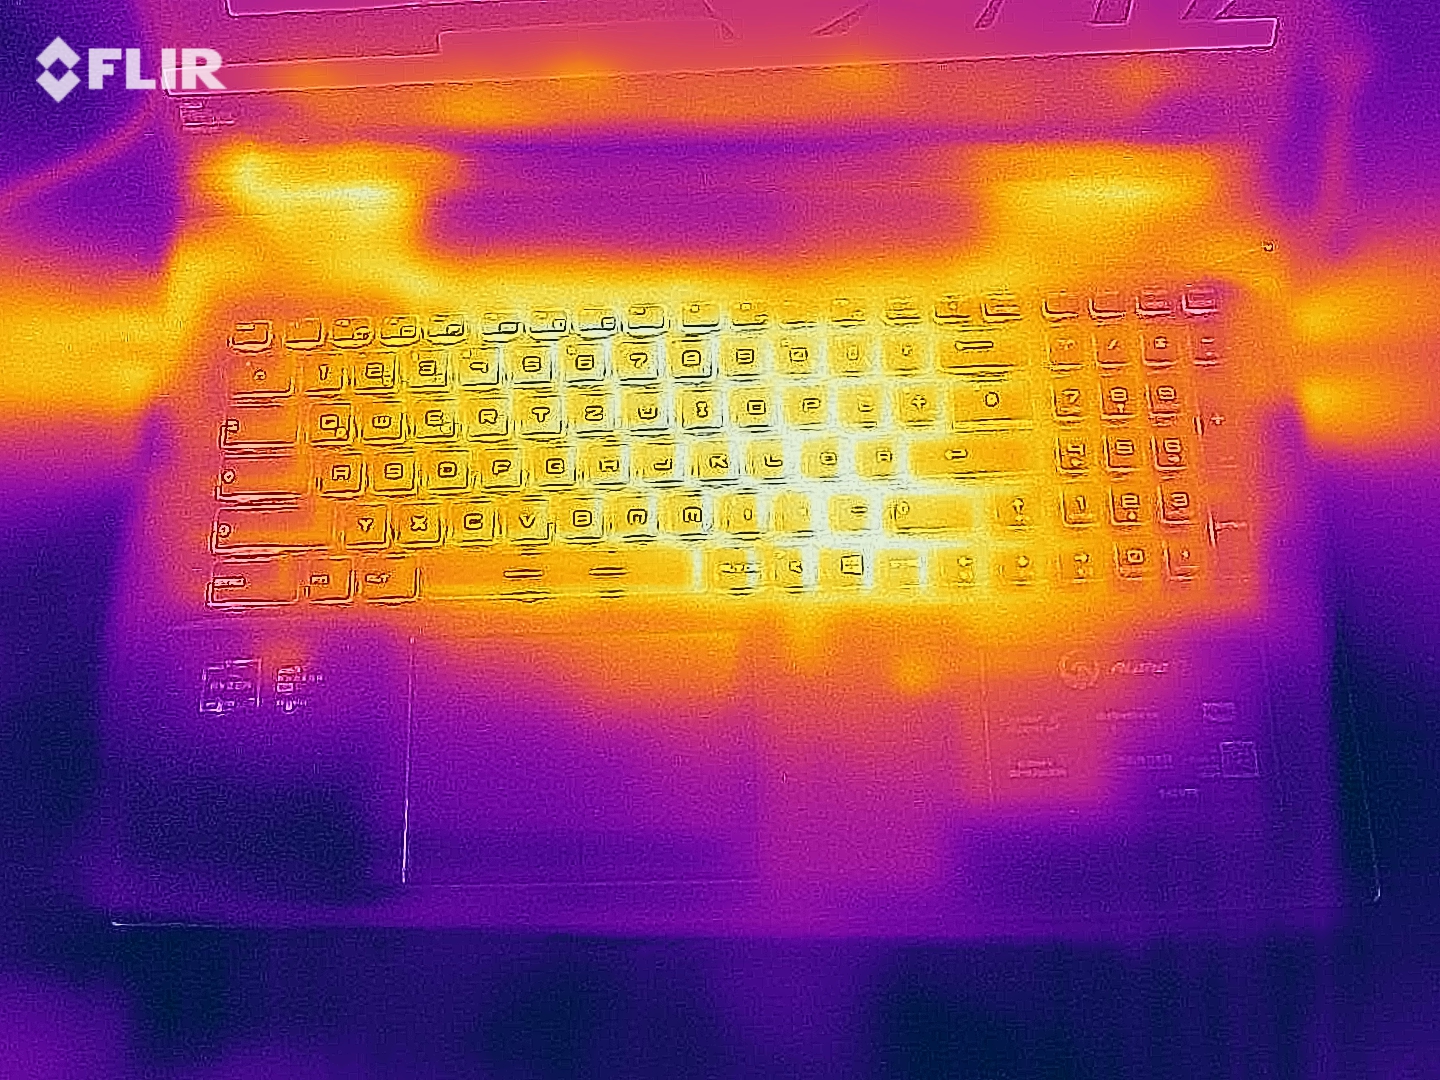
The surfaces of the MSI Alpha 17 heat up to 46 °C (~115 °F) in gaming mode. The warmest point is at the rear left corner of the bottom, and the gaming laptop should no longer be placed on the lap by then, for example. The palm rests only heat up moderately, but they still feel warm to the touch at a maximum of 36 °C (~97 °F).
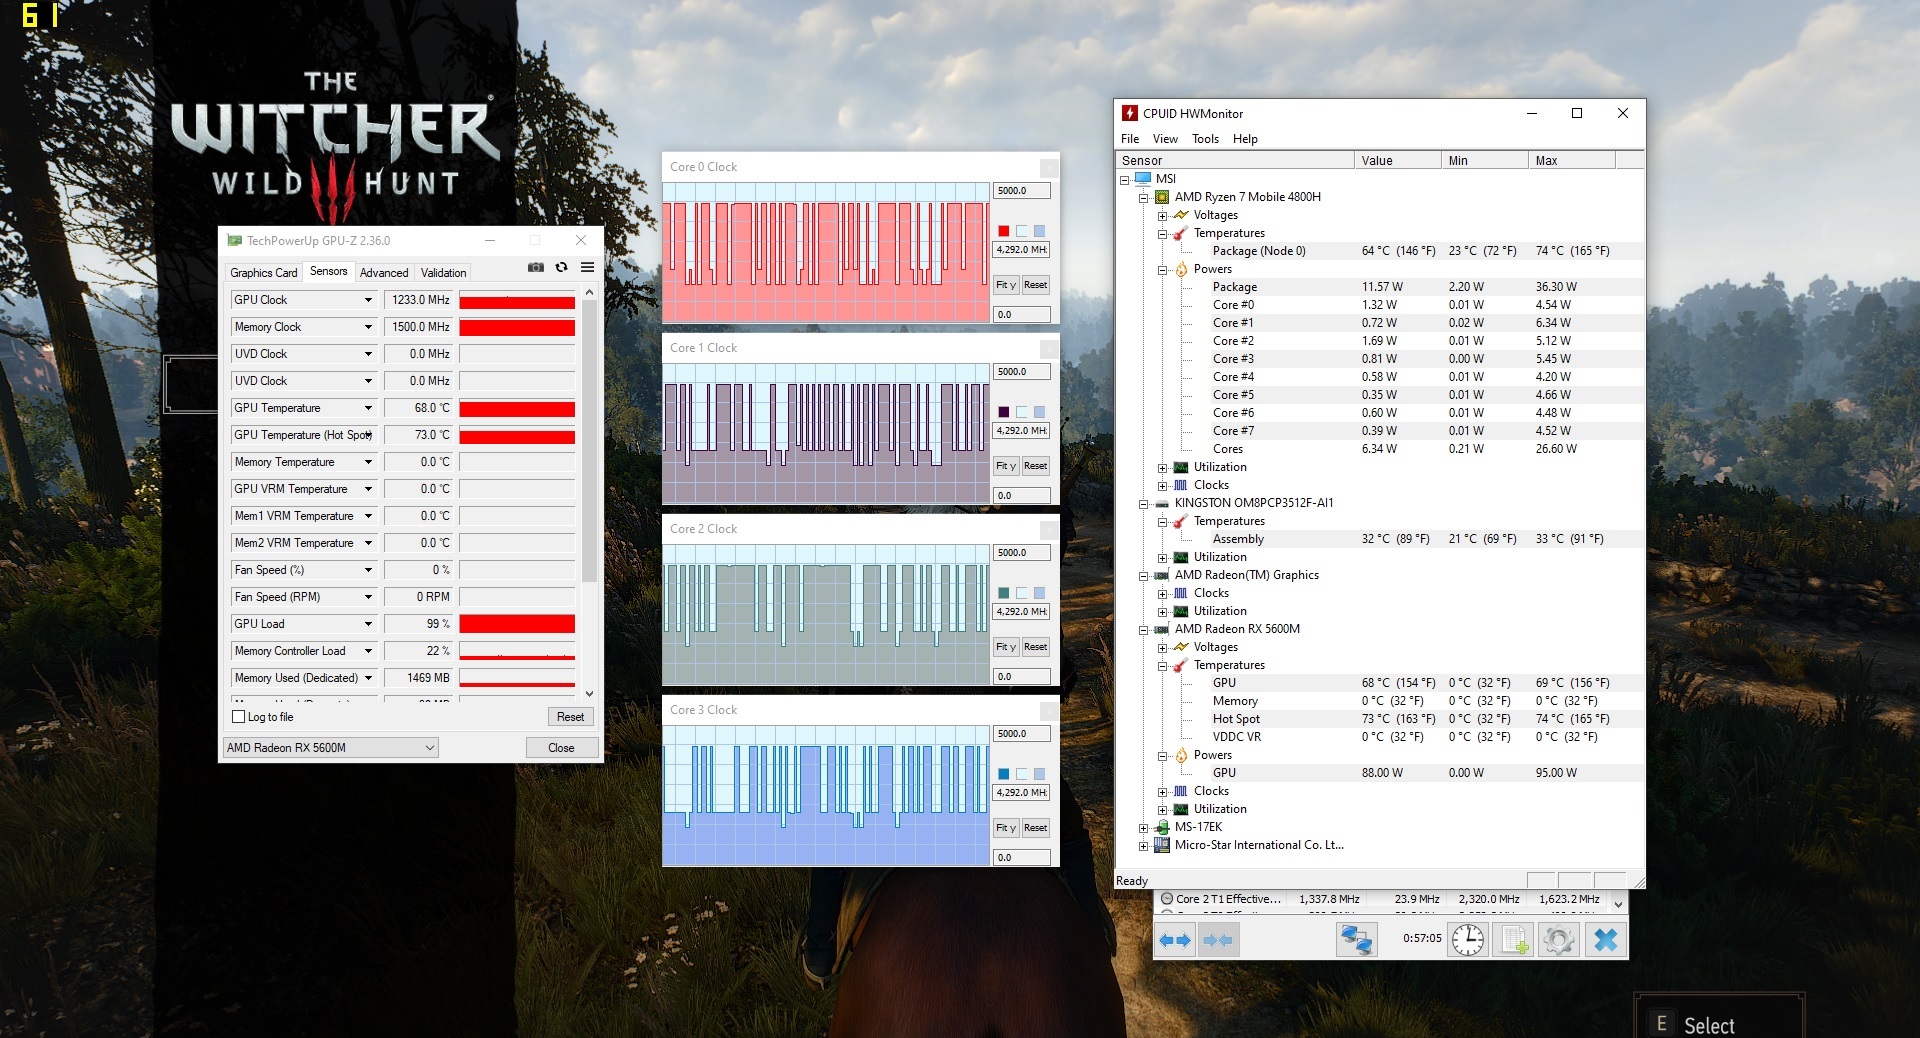
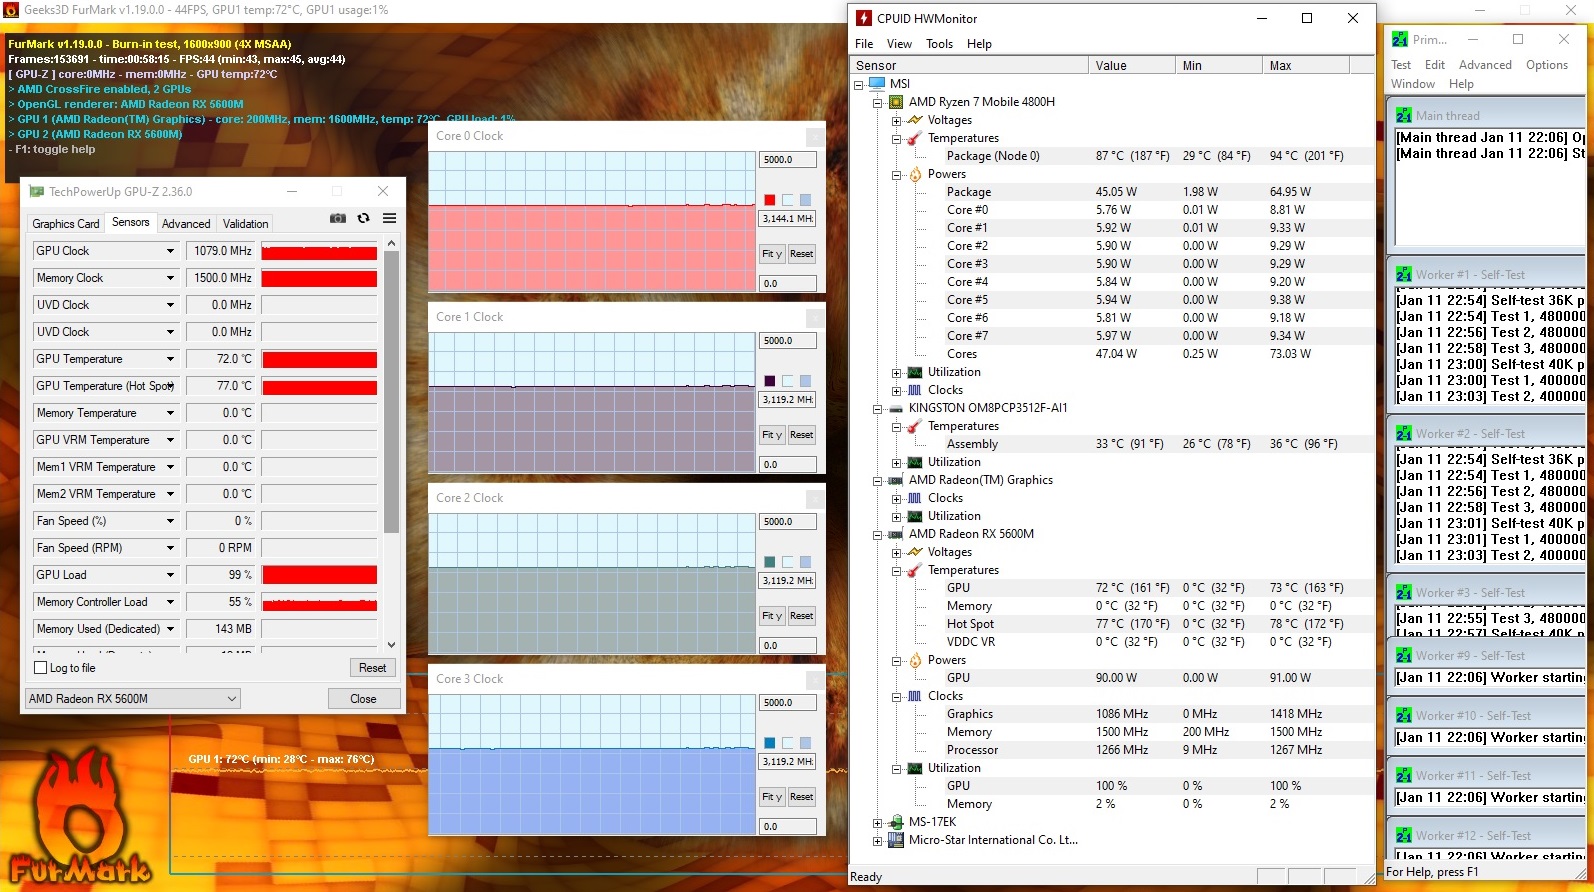

During our approximately one-hour endurance stress test, the temperatures inside the MSI Alpha 17 rise up to 94 °C (~201 °F). The PL2 of 65 watts is also reached in the process, whereby the average power consumption corresponds to the PL1 of 45 watts. In addition, the cooling system can keep the temperatures at 87 °C (~189 °F) on average and the clock rates at around 3.1 GHz. Consequently, users don't have to expect a drop in system performance due to excessive temperatures even during heavy use.
(±) The maximum temperature on the upper side is 44 °C / 111 F, compared to the average of 40.4 °C / 105 F, ranging from 21.2 to 68.8 °C for the class Gaming.
(±) The bottom heats up to a maximum of 43 °C / 109 F, compared to the average of 43.2 °C / 110 F
(+) In idle usage, the average temperature for the upper side is 23.8 °C / 75 F, compared to the device average of 33.9 °C / 93 F.
(-) Playing The Witcher 3, the average temperature for the upper side is 39.4 °C / 103 F, compared to the device average of 33.9 °C / 93 F.
(±) The palmrests and touchpad can get very hot to the touch with a maximum of 38 °C / 100.4 F.
(-) The average temperature of the palmrest area of similar devices was 28.8 °C / 83.8 F (-9.2 °C / -16.6 F).
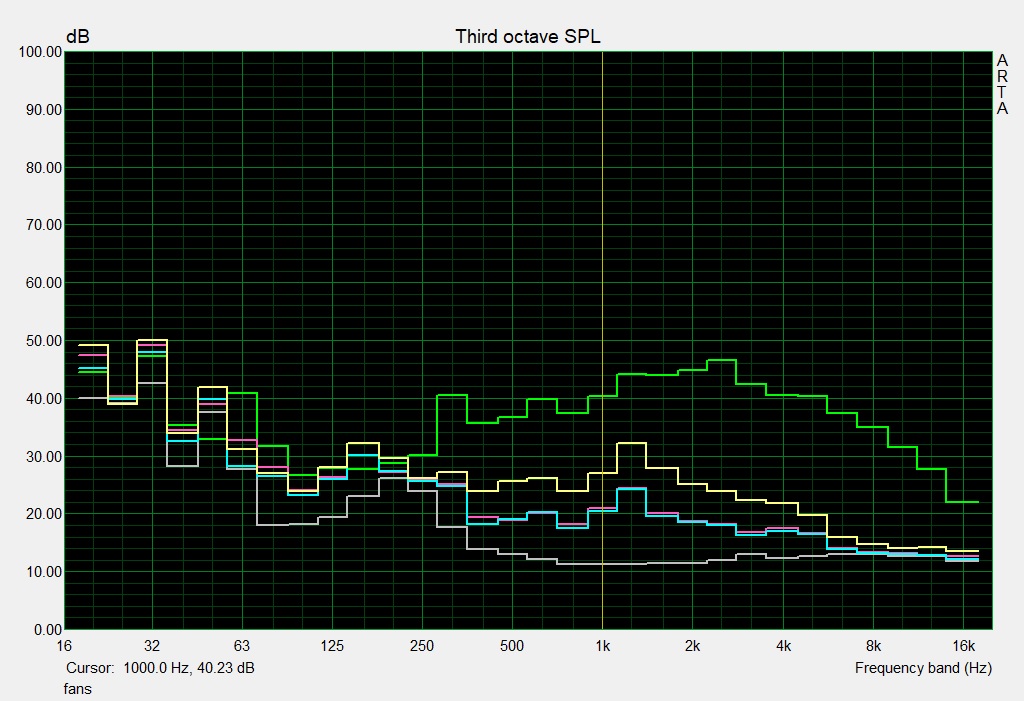
Speakers
The speakers of the MSI Alpha 17 offer a relatively high volume and a wide sound spectrum. This makes them well suited for playing media content. However, headphones are still recommended depending on the selected fan profile.
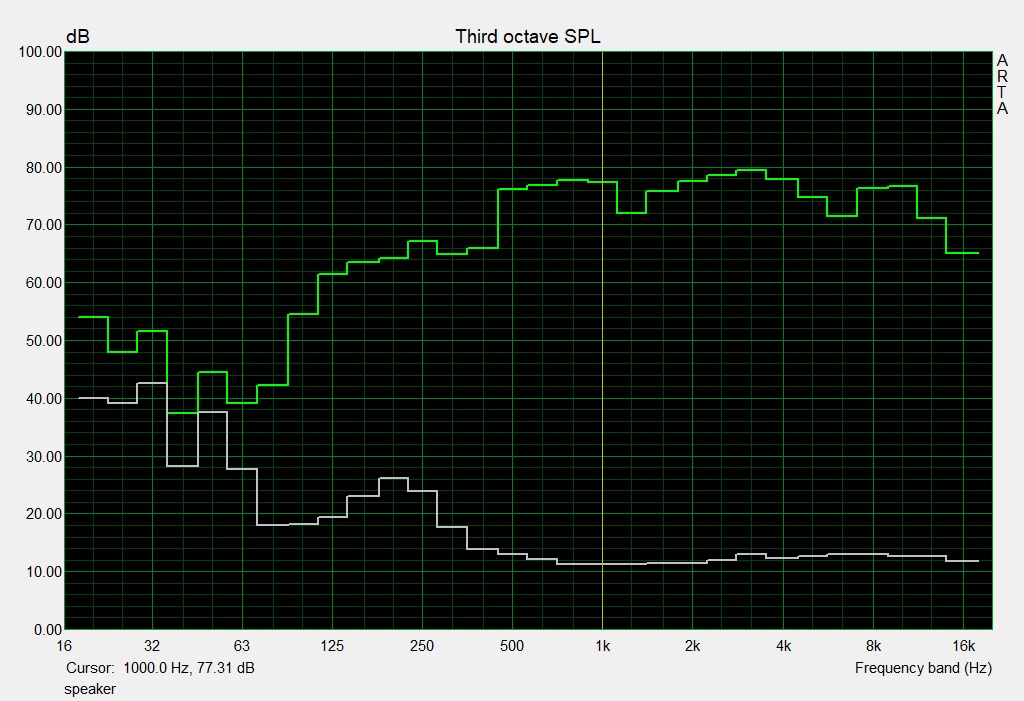
MSI Alpha 17 A4DEK audio analysis
(+) | speakers can play relatively loud (89 dB)
Bass 100 - 315 Hz
(±) | reduced bass - on average 13.2% lower than median
(±) | linearity of bass is average (7.2% delta to prev. frequency)
Mids 400 - 2000 Hz
(+) | balanced mids - only 2.5% away from median
(+) | mids are linear (4.8% delta to prev. frequency)
Highs 2 - 16 kHz
(+) | balanced highs - only 2.2% away from median
(+) | highs are linear (3.4% delta to prev. frequency)
Overall 100 - 16.000 Hz
(+) | overall sound is linear (9.4% difference to median)
Compared to same class
» 3% of all tested devices in this class were better, 2% similar, 95% worse
» The best had a delta of 6%, average was 18%, worst was 132%
Compared to all devices tested
» 3% of all tested devices were better, 1% similar, 96% worse
» The best had a delta of 4%, average was 24%, worst was 134%
Apple MacBook 12 (Early 2016) 1.1 GHz audio analysis
(+) | speakers can play relatively loud (83.6 dB)
Bass 100 - 315 Hz
(±) | reduced bass - on average 11.3% lower than median
(±) | linearity of bass is average (14.2% delta to prev. frequency)
Mids 400 - 2000 Hz
(+) | balanced mids - only 2.4% away from median
(+) | mids are linear (5.5% delta to prev. frequency)
Highs 2 - 16 kHz
(+) | balanced highs - only 2% away from median
(+) | highs are linear (4.5% delta to prev. frequency)
Overall 100 - 16.000 Hz
(+) | overall sound is linear (10.2% difference to median)
Compared to same class
» 7% of all tested devices in this class were better, 2% similar, 91% worse
» The best had a delta of 5%, average was 18%, worst was 53%
Compared to all devices tested
» 5% of all tested devices were better, 1% similar, 94% worse
» The best had a delta of 4%, average was 24%, worst was 134%
Energy management - Good battery life in office use
Energy consumption
According to our measurements, the MSI Alpha 17 shows a maximum power consumption of up to 222 watts. While this is the highest value in our test field, the average power consumption is at a comparatively low level both in idle usage as well as under load.
The included power adapter offers an output of 230 watts and has, therefore, a high enough capacity to ensure a reliable power supply.
| Off / Standby | |
| Idle | |
| Load |
|
Key:
min: | |
| MSI Alpha 17 A4DEK R7 4800H, Radeon RX 5600M | Schenker XMG Core 17 Comet Lake i7-10750H, GeForce GTX 1650 Ti Mobile | Eluktronics RP-17 R7 4800H, GeForce RTX 2060 Mobile | Dell G5 15 SE 5505 P89F R7 4800H, Radeon RX 5600M | Average AMD Radeon RX 5600M | Average of class Gaming | |
|---|---|---|---|---|---|---|
| Power Consumption | -12% | -59% | 13% | 9% | -40% | |
| Idle Minimum * (Watt) | 9 | 12 -33% | 20.2 -124% | 6.5 28% | 7.75 ? 14% | 13.4 ? -49% |
| Idle Average * (Watt) | 12 | 15 -25% | 24.5 -104% | 10.6 12% | 11.3 ? 6% | 19.1 ? -59% |
| Idle Maximum * (Watt) | 18 | 24 -33% | 28.7 -59% | 11 39% | 14.5 ? 19% | 24.6 ? -37% |
| Load Average * (Watt) | 76 | 105 -38% | 110.4 -45% | 84.1 -11% | 80.1 ? -5% | 108.3 ? -43% |
| Witcher 3 ultra * (Watt) | 136 | 93 32% | 166.3 -22% | 152.9 -12% | ||
| Load Maximum * (Watt) | 222 | 168 24% | 217.4 2% | 180.4 19% | 201 ? 9% | 253 ? -14% |
* ... smaller is better
Battery life
In our practical WLAN test, MSI's gaming laptop achieves a runtime of 7:18 hours. The "Balanced" performance profile was used for this, leading to a good utilization of the 65 Wh battery.
| MSI Alpha 17 A4DEK R7 4800H, Radeon RX 5600M, 65 Wh | Schenker XMG Core 17 Comet Lake i7-10750H, GeForce GTX 1650 Ti Mobile, 62.3 Wh | Eluktronics RP-17 R7 4800H, GeForce RTX 2060 Mobile, 62 Wh | Dell G5 15 SE 5505 P89F R7 4800H, Radeon RX 5600M, 51 Wh | Average of class Gaming | |
|---|---|---|---|---|---|
| Battery runtime | -30% | -34% | -3% | -7% | |
| Reader / Idle (h) | 10.5 | 11.2 7% | 8.81 ? -16% | ||
| WiFi v1.3 (h) | 7.3 | 5.1 -30% | 4.4 -40% | 6.2 -15% | 6.94 ? -5% |
| Load (h) | 1.5 | 1.1 -27% | 1.5 0% | 1.488 ? -1% |
Pros
Cons
Verdict - The price is adequate for what you get
The MSI Alpha 17 is predominantly big. However, the good battery life in office or WLAN mode makes it suitable for work on the road as long as the dimensions don't get in the way of its transportation and you don't use the device outdoors (poor display brightness). Naturally, the power adapter has to be connected when gaming in order to fully utilize the power of the CPU and GPU. The Alpha 17 shows good performance here, but it's not quite sufficient for very demanding games. These can be run smoothly, but depending on the title, reducing the detail levels is necessary.
For a good price, buyers of the MSI Alpha 17 get a large 144 Hz screen and enough performance for extensive mid-range gaming.
All the other components in this gaming laptop reliably fulfill their purpose. The input devices are well suited for gaming, and the screen is also impressive with its 144 Hz refresh rate. We would've only wished for better color-space coverage here so as to achieve more vivid colors. But the contrast and response times are fine for a laptop.
Price and availability
MSI Alpha 17 A4DEK
- 02/03/2021 v7 (old)
Mike Wobker
Price comparison

