

MSI GT76 Titan DT 10SGS Laptop Review: Late Game Exotic Gear

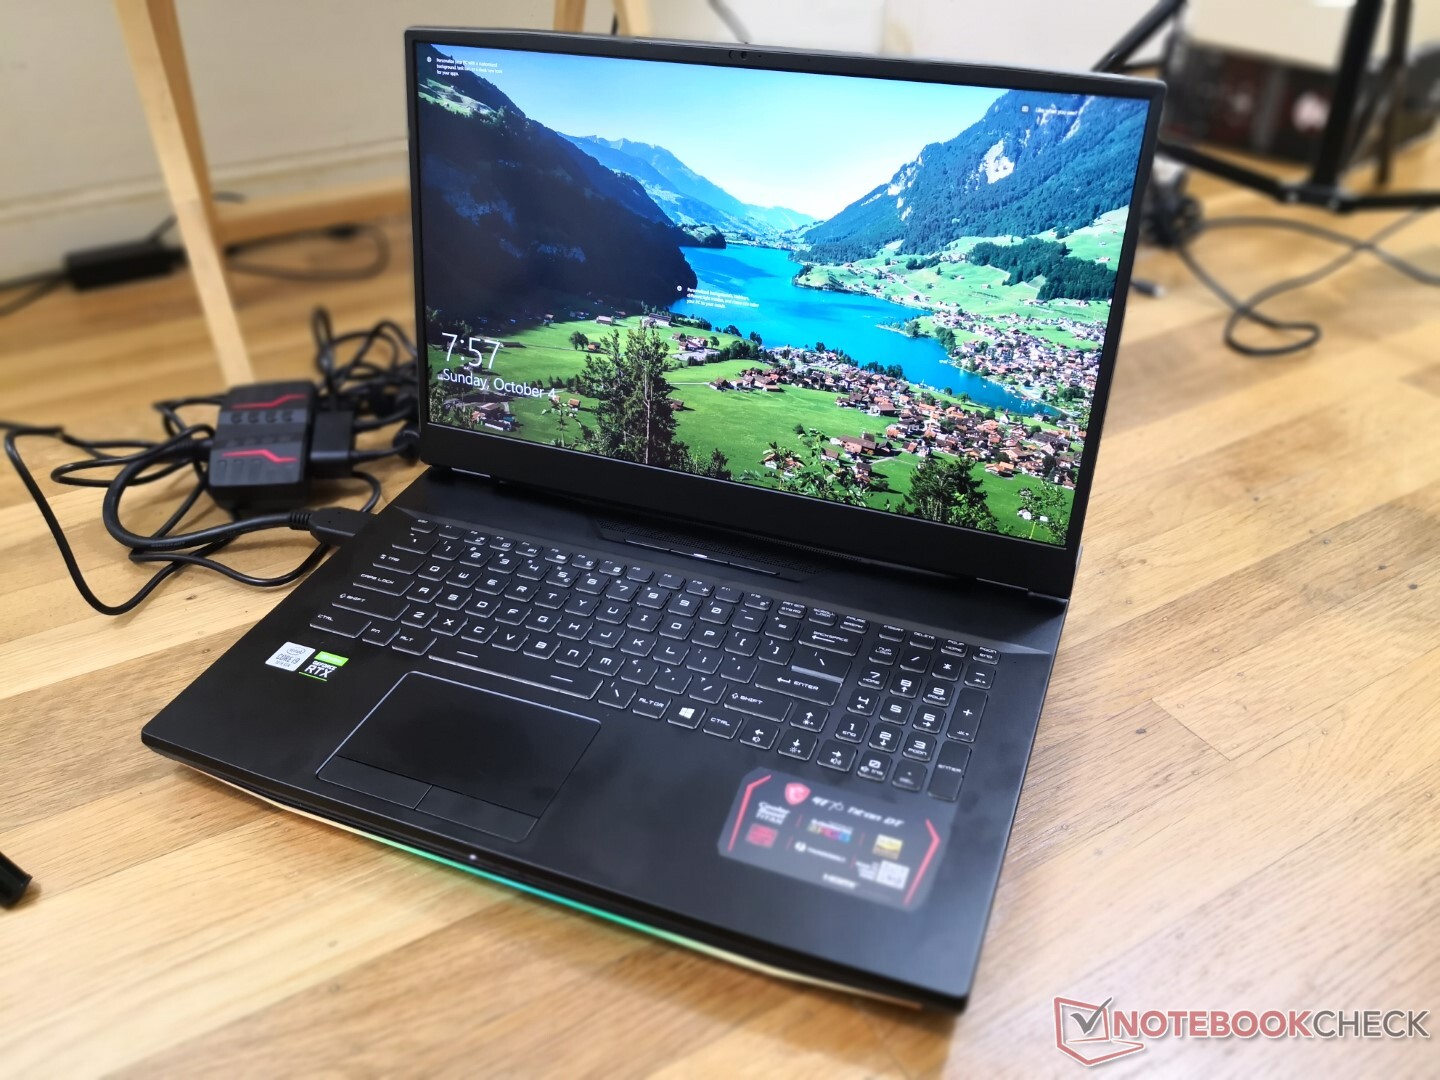
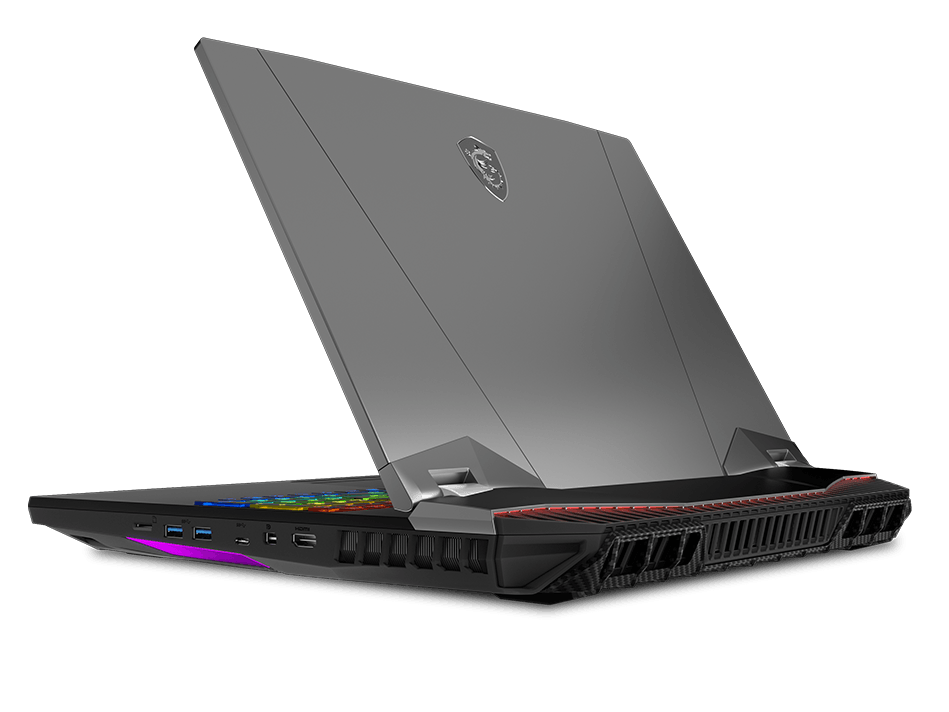
If the MSI GS75 was your stealthy swift-moving hunter class, then the MSI GT76 would be your bulky gear-dependent tank class. The GT76 Titan crams the fastest CPU and GPU you can find in a laptop chassis that's designed to replace a traditional PC.
We first checked out the GT76 when it launched last year with the 9th gen Core i9-9900K, GeForce RTX 2080, and FHD display. This 2020 update ships with the the 10th gen Core i9-10900K, GeForce RTX 2080 Super, and 120 Hz 4K UHD display instead. Physical features remain identical and so most of our existing comments on the chassis, keyboard, speakers, and internals apply here as well.
Direct competitors to the GT76 include other 17.3-inch DTRs like the Dell Alienware Area-51m, Asus ROG G703 Chimera, Eurocom Sky X7C, or the Schenker XMG Ultra 17.
More MSI reviews:
Rating | Date | Model | Weight | Height | Size | Resolution | Price |
|---|---|---|---|---|---|---|---|
| 87.4 % v7 (old) | 10 / 2020 | MSI GT76 Titan DT 10SGS i9-10900K, GeForce RTX 2080 Super Mobile | 4.2 kg | 42 mm | 17.30" | 3840x2160 | |
| 85.8 % v7 (old) | 10 / 2019 | Asus ROG G703GXR i7-9750H, GeForce RTX 2080 Mobile | 4.7 kg | 48 mm | 17.30" | 1920x1080 | |
| 85.8 % v7 (old) | 03 / 2019 | Alienware Area-51m i9-9900K RTX 2080 i9-9900K, GeForce RTX 2080 Mobile | 3.9 kg | 42 mm | 17.30" | 1920x1080 | |
| 82.7 % v7 (old) | 07 / 2020 | Asus Strix Scar 17 G732LXS i9-10980HK, GeForce RTX 2080 Super Mobile | 2.9 kg | 26.5 mm | 17.30" | 1920x1080 | |
| 83.2 % v7 (old) | 02 / 2020 | SCHENKER XMG Pro 17 PB71RD-G i7-9750H, GeForce RTX 2060 Mobile | 2.8 kg | 30 mm | 17.30" | 1920x1080 |
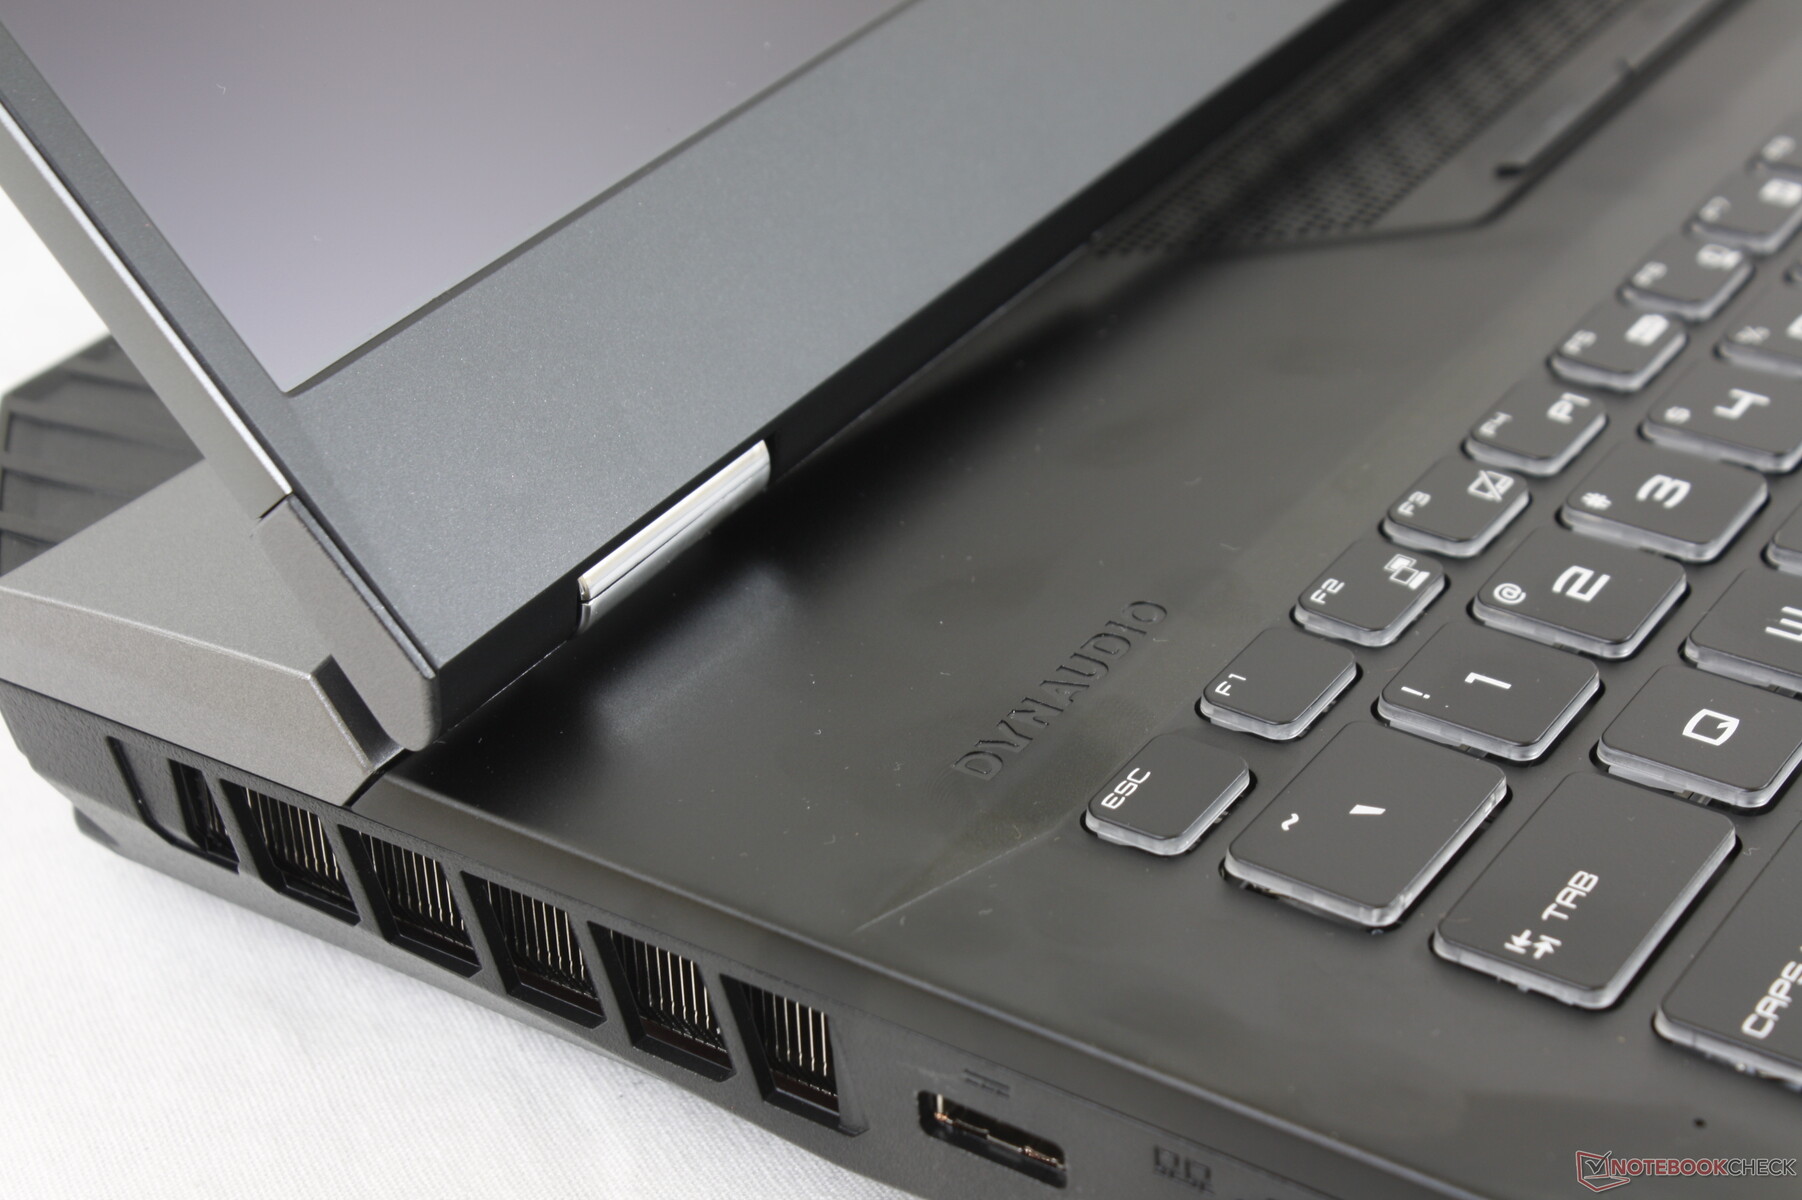
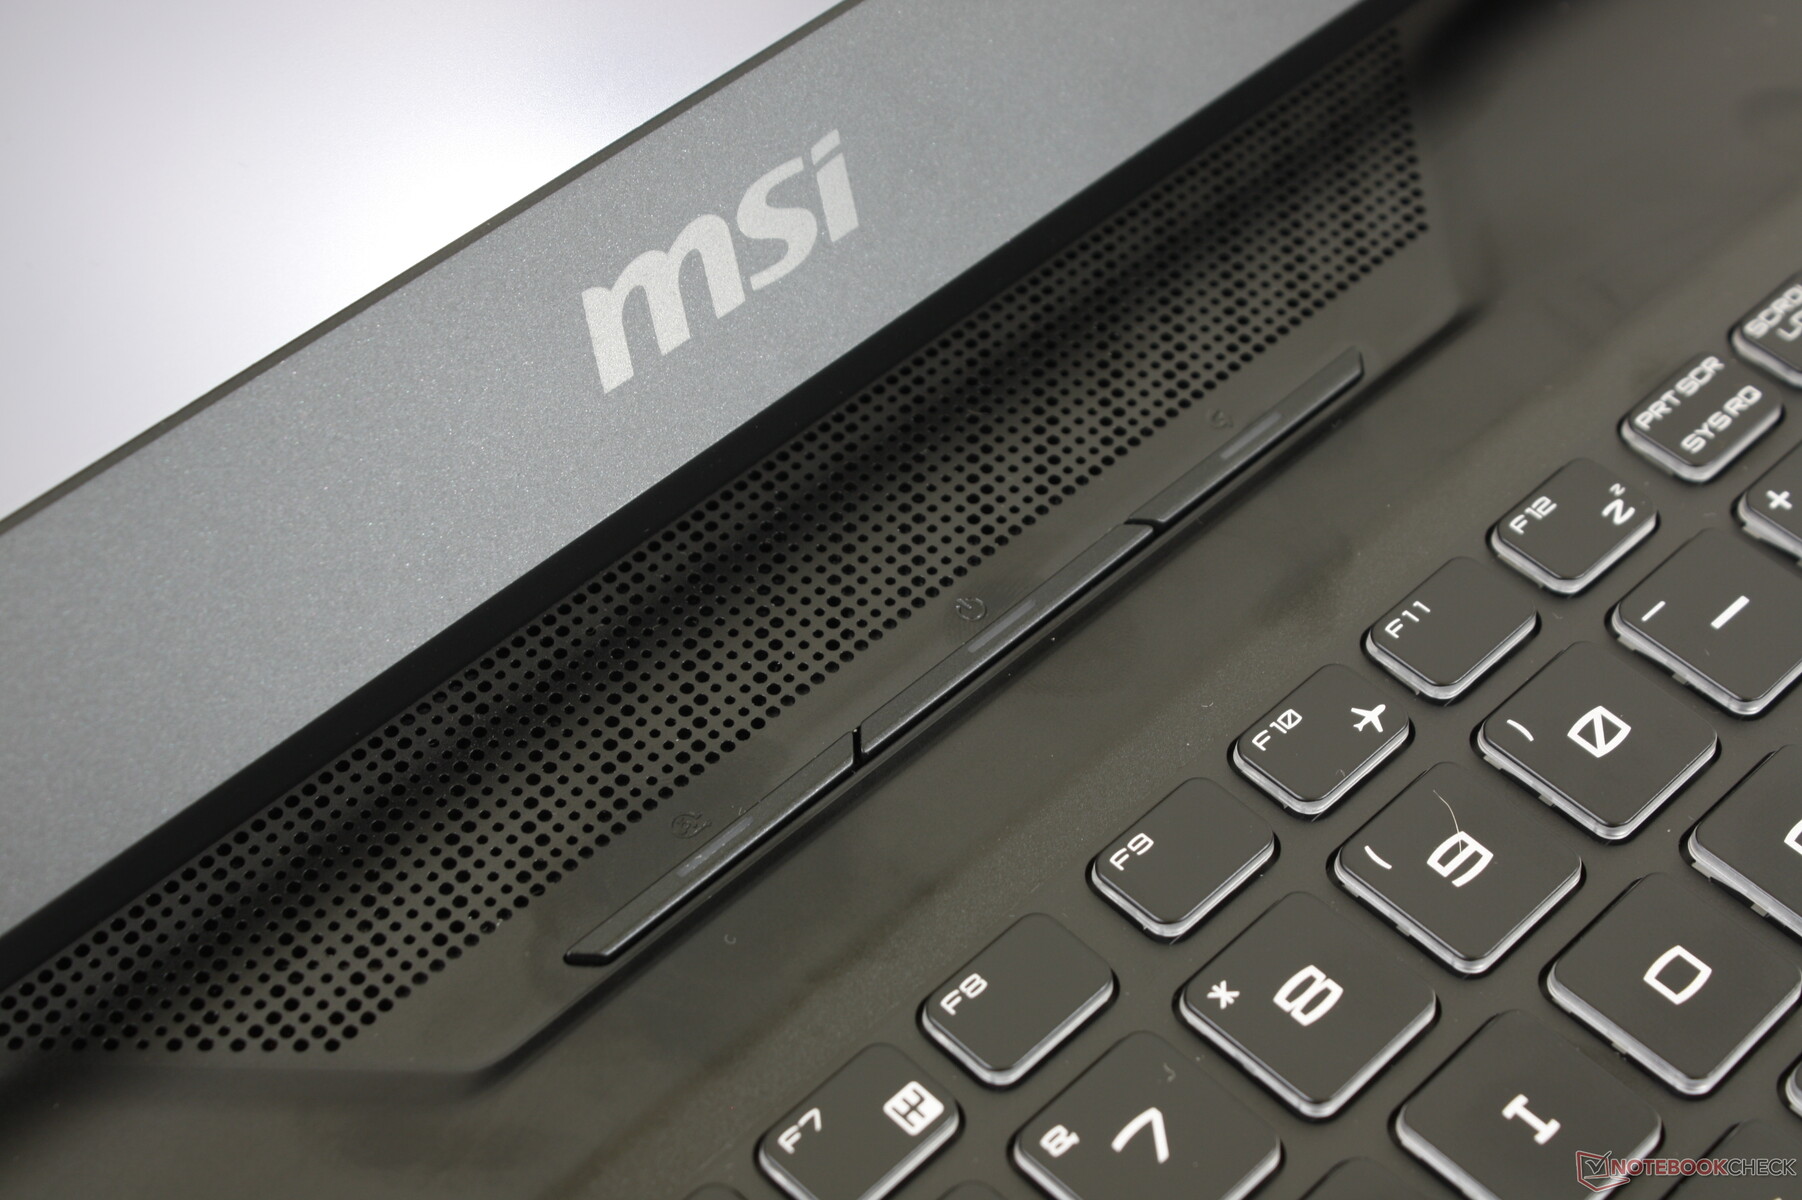
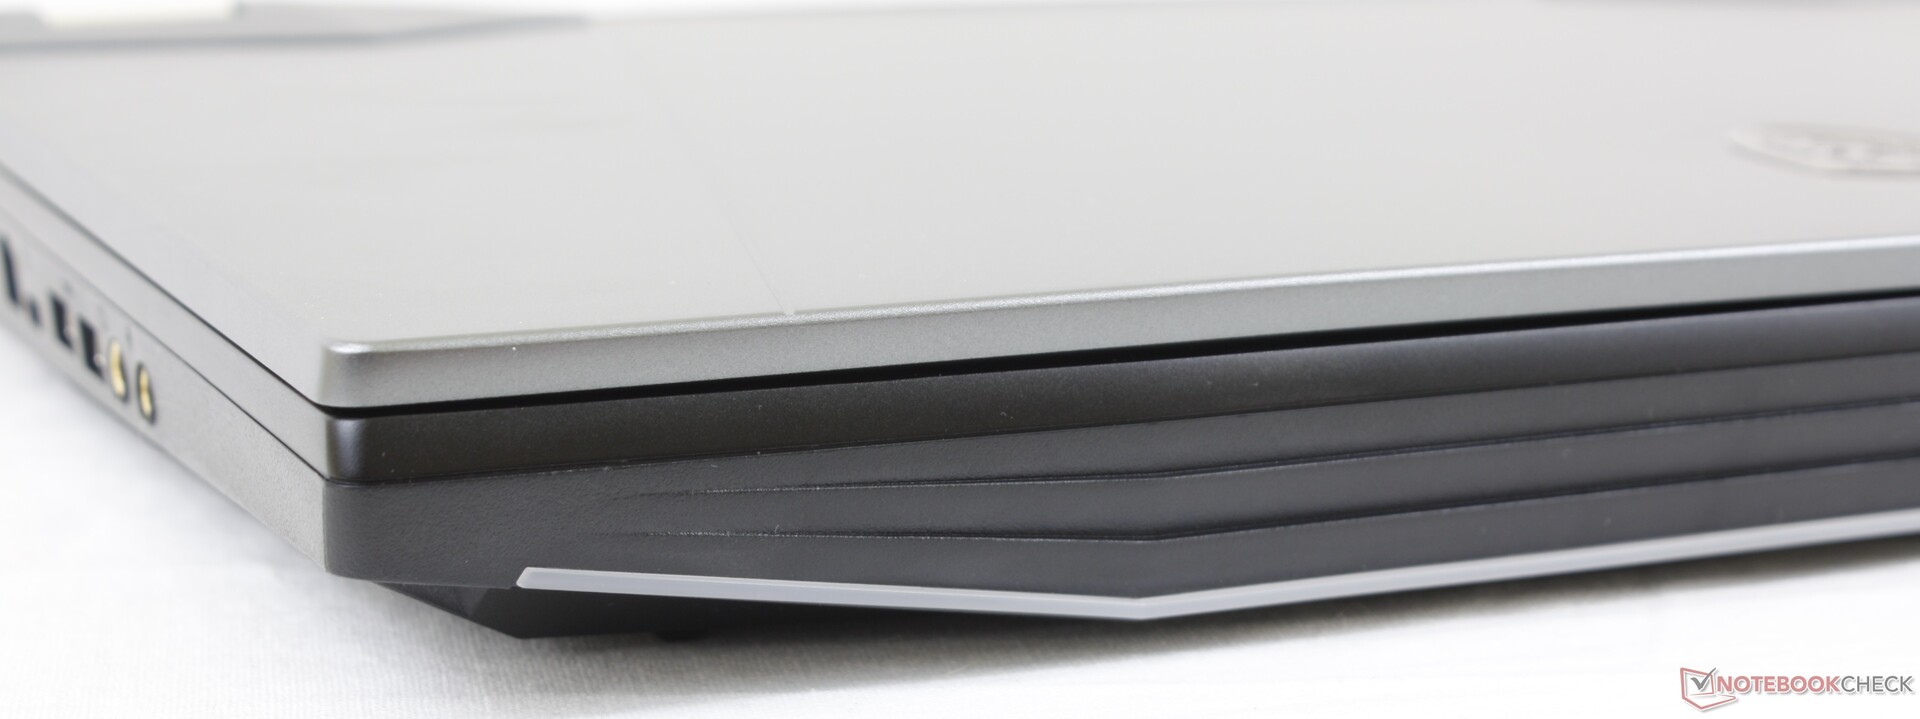
Case
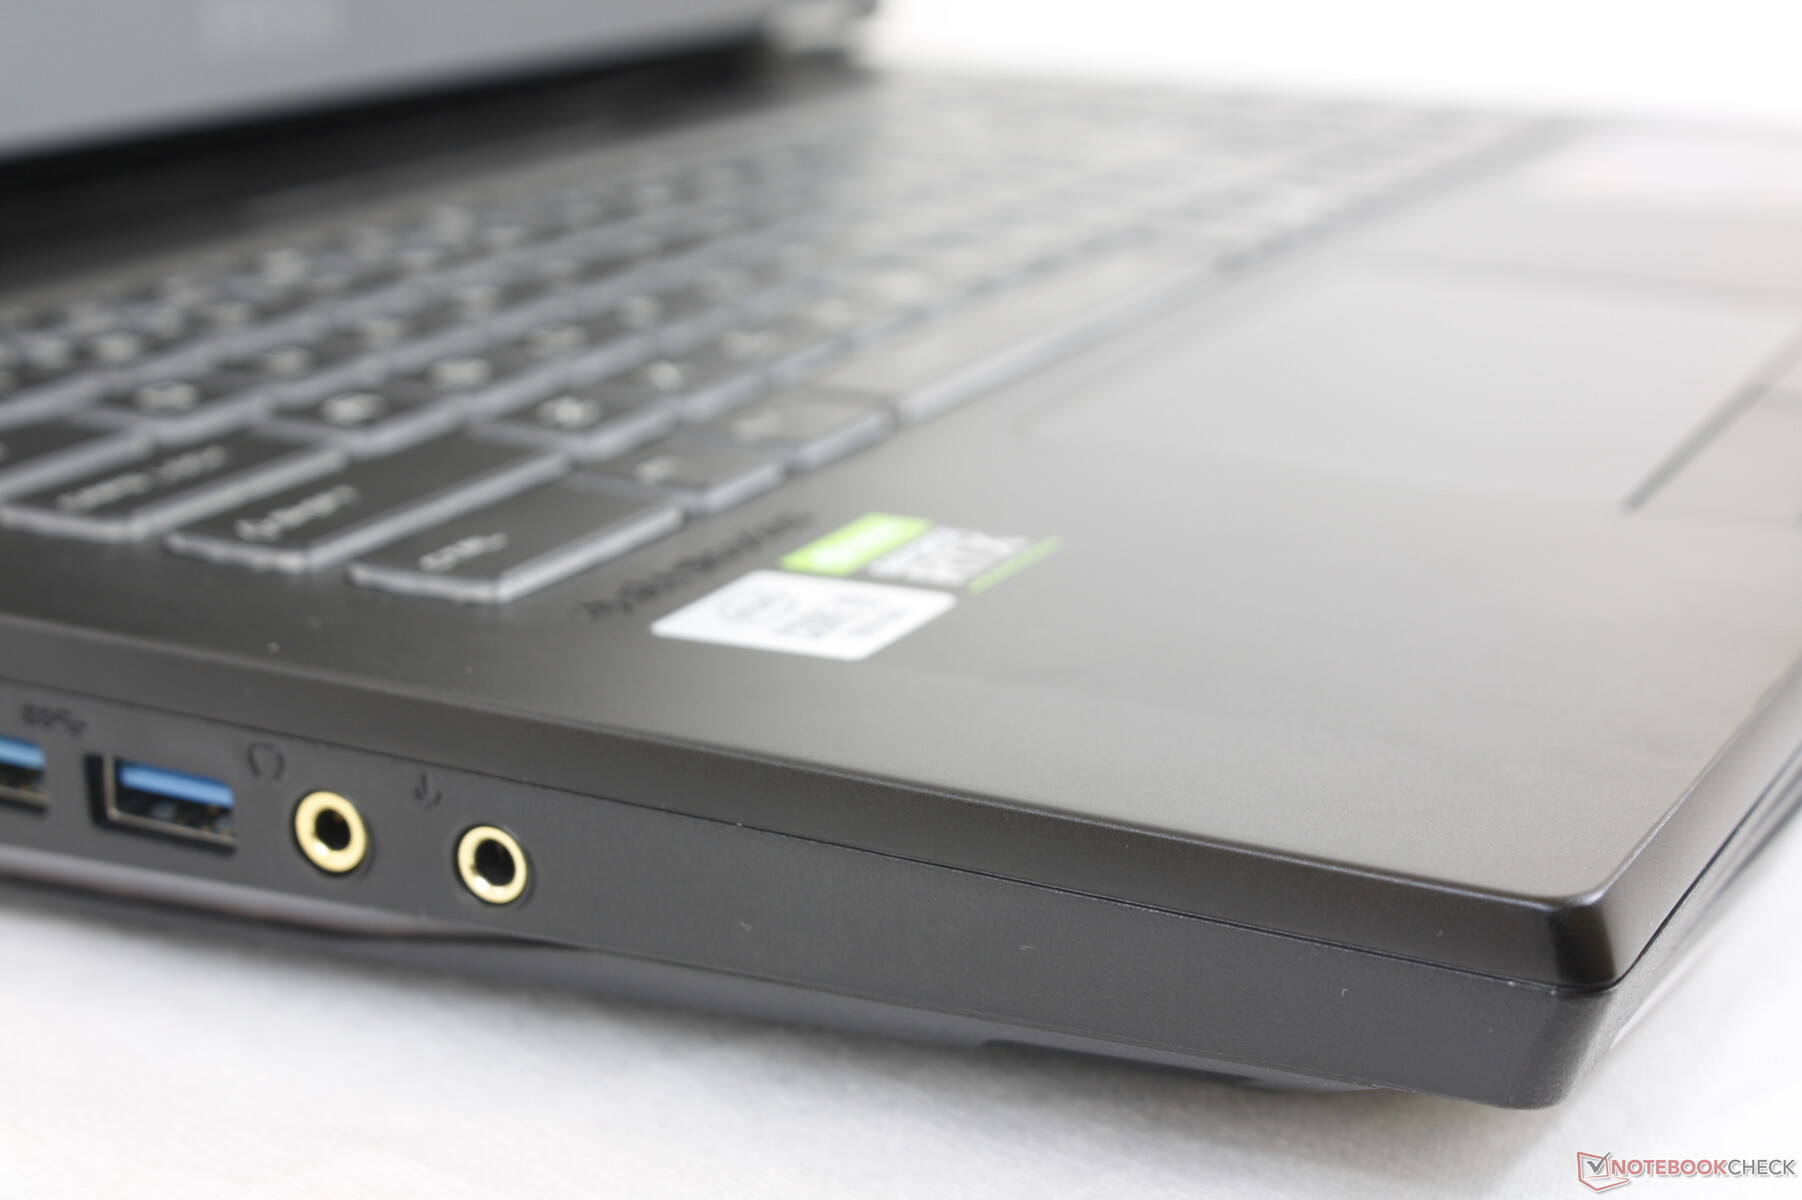
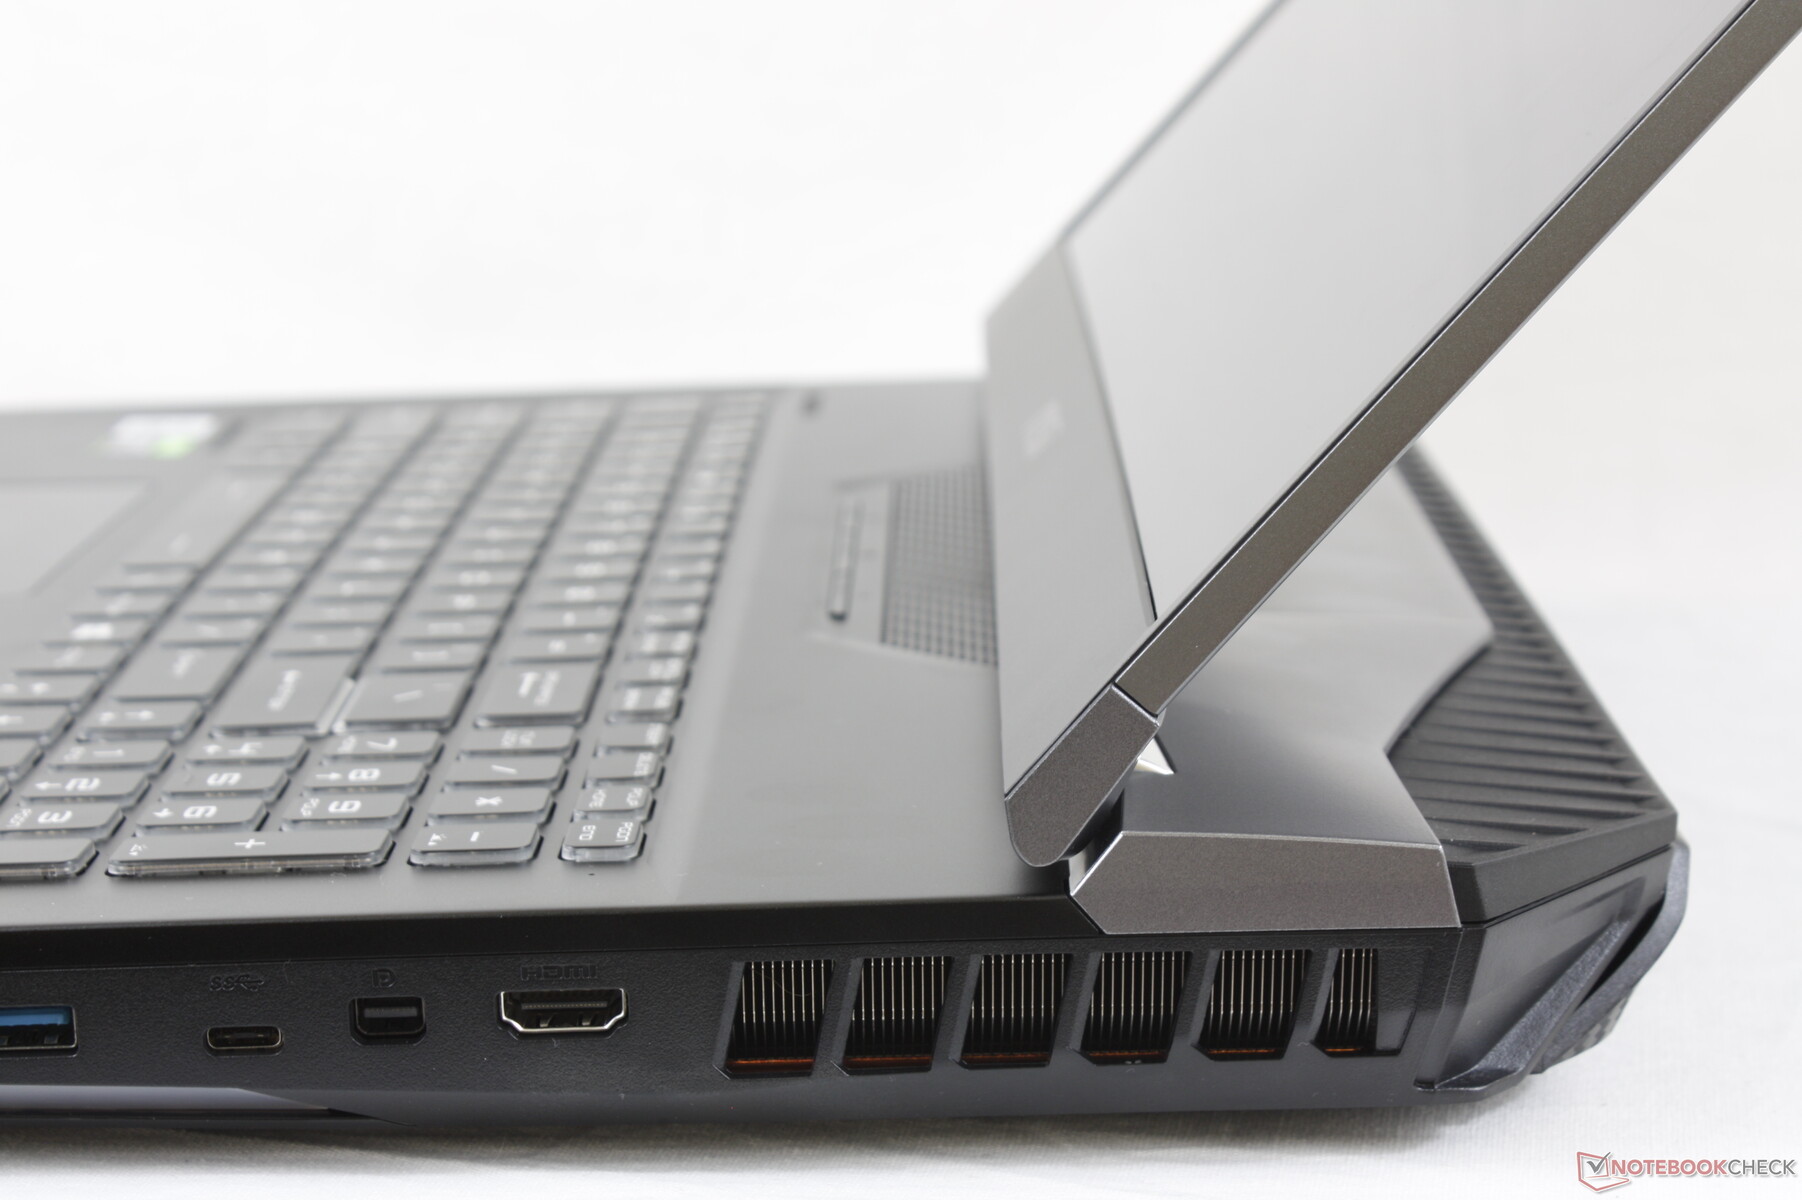
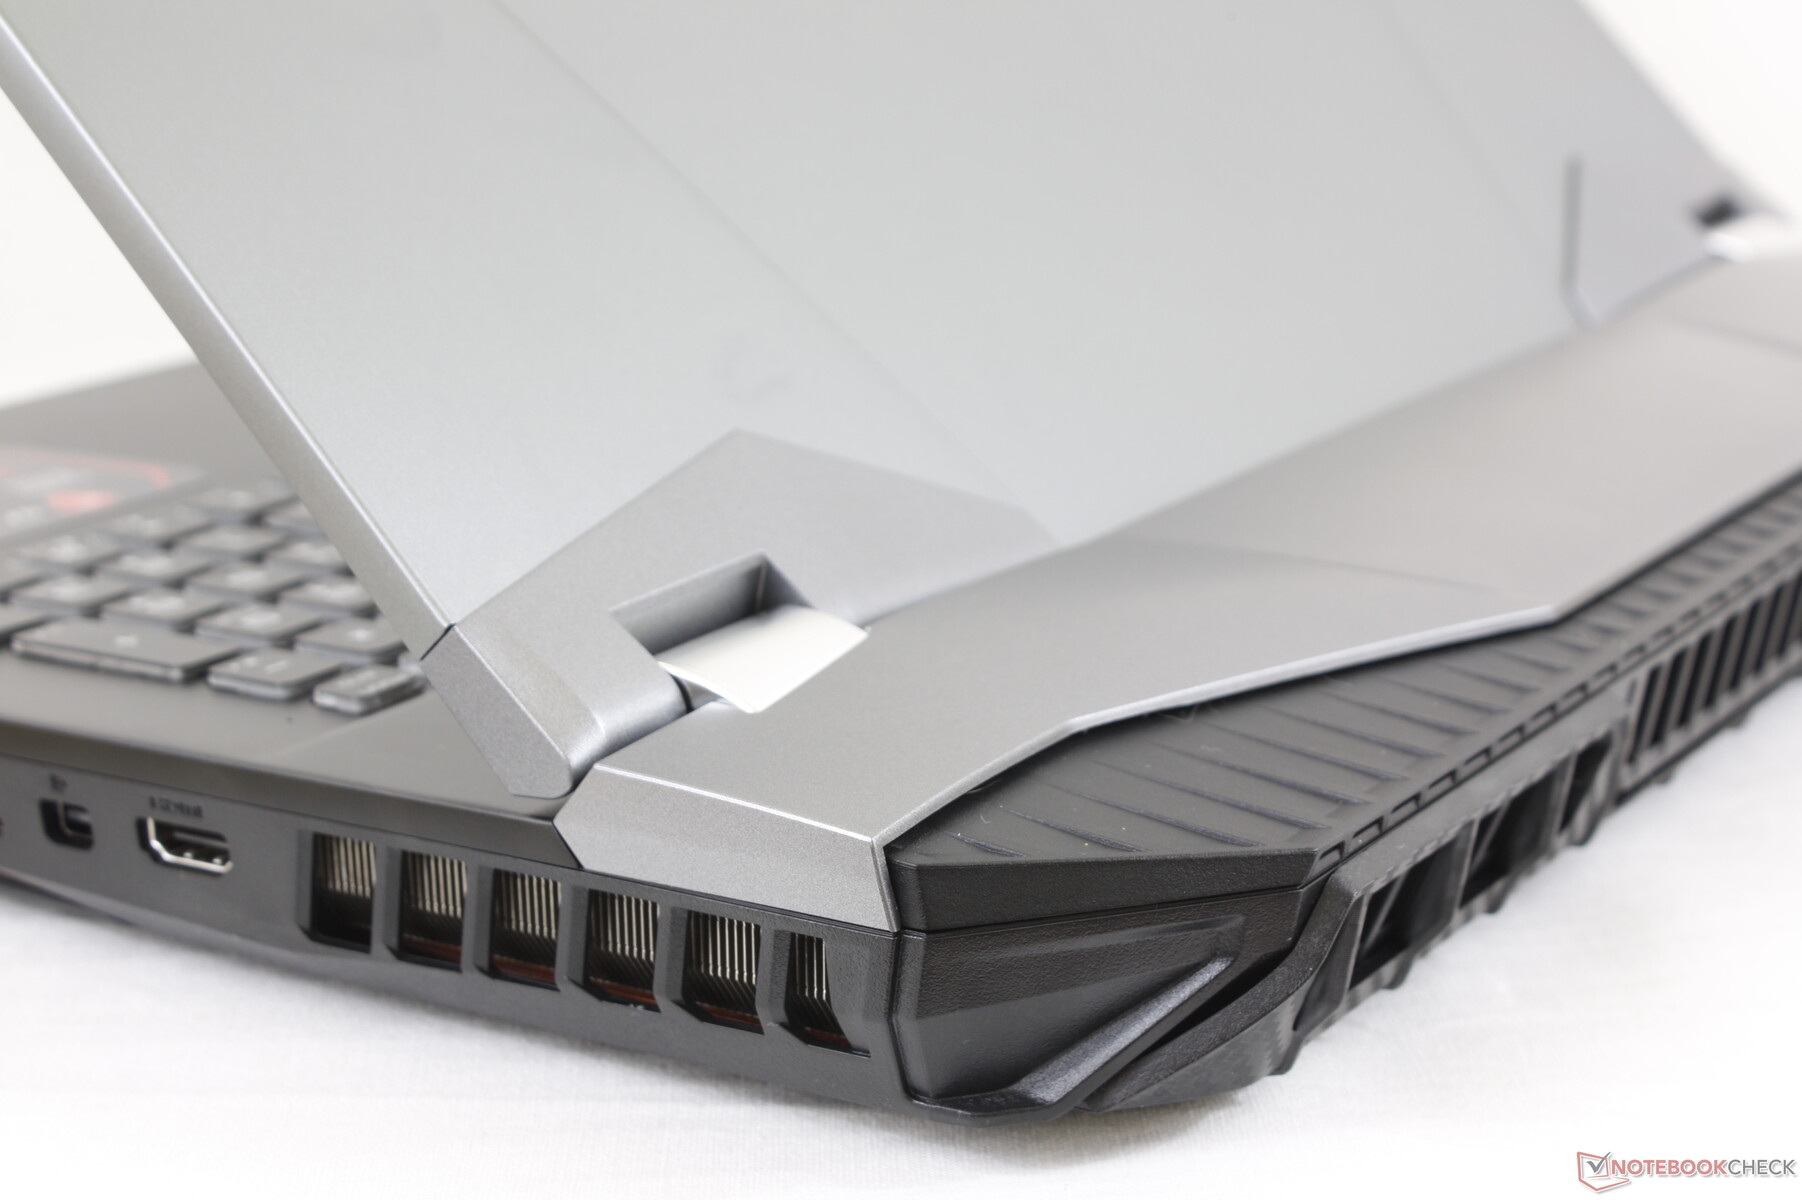
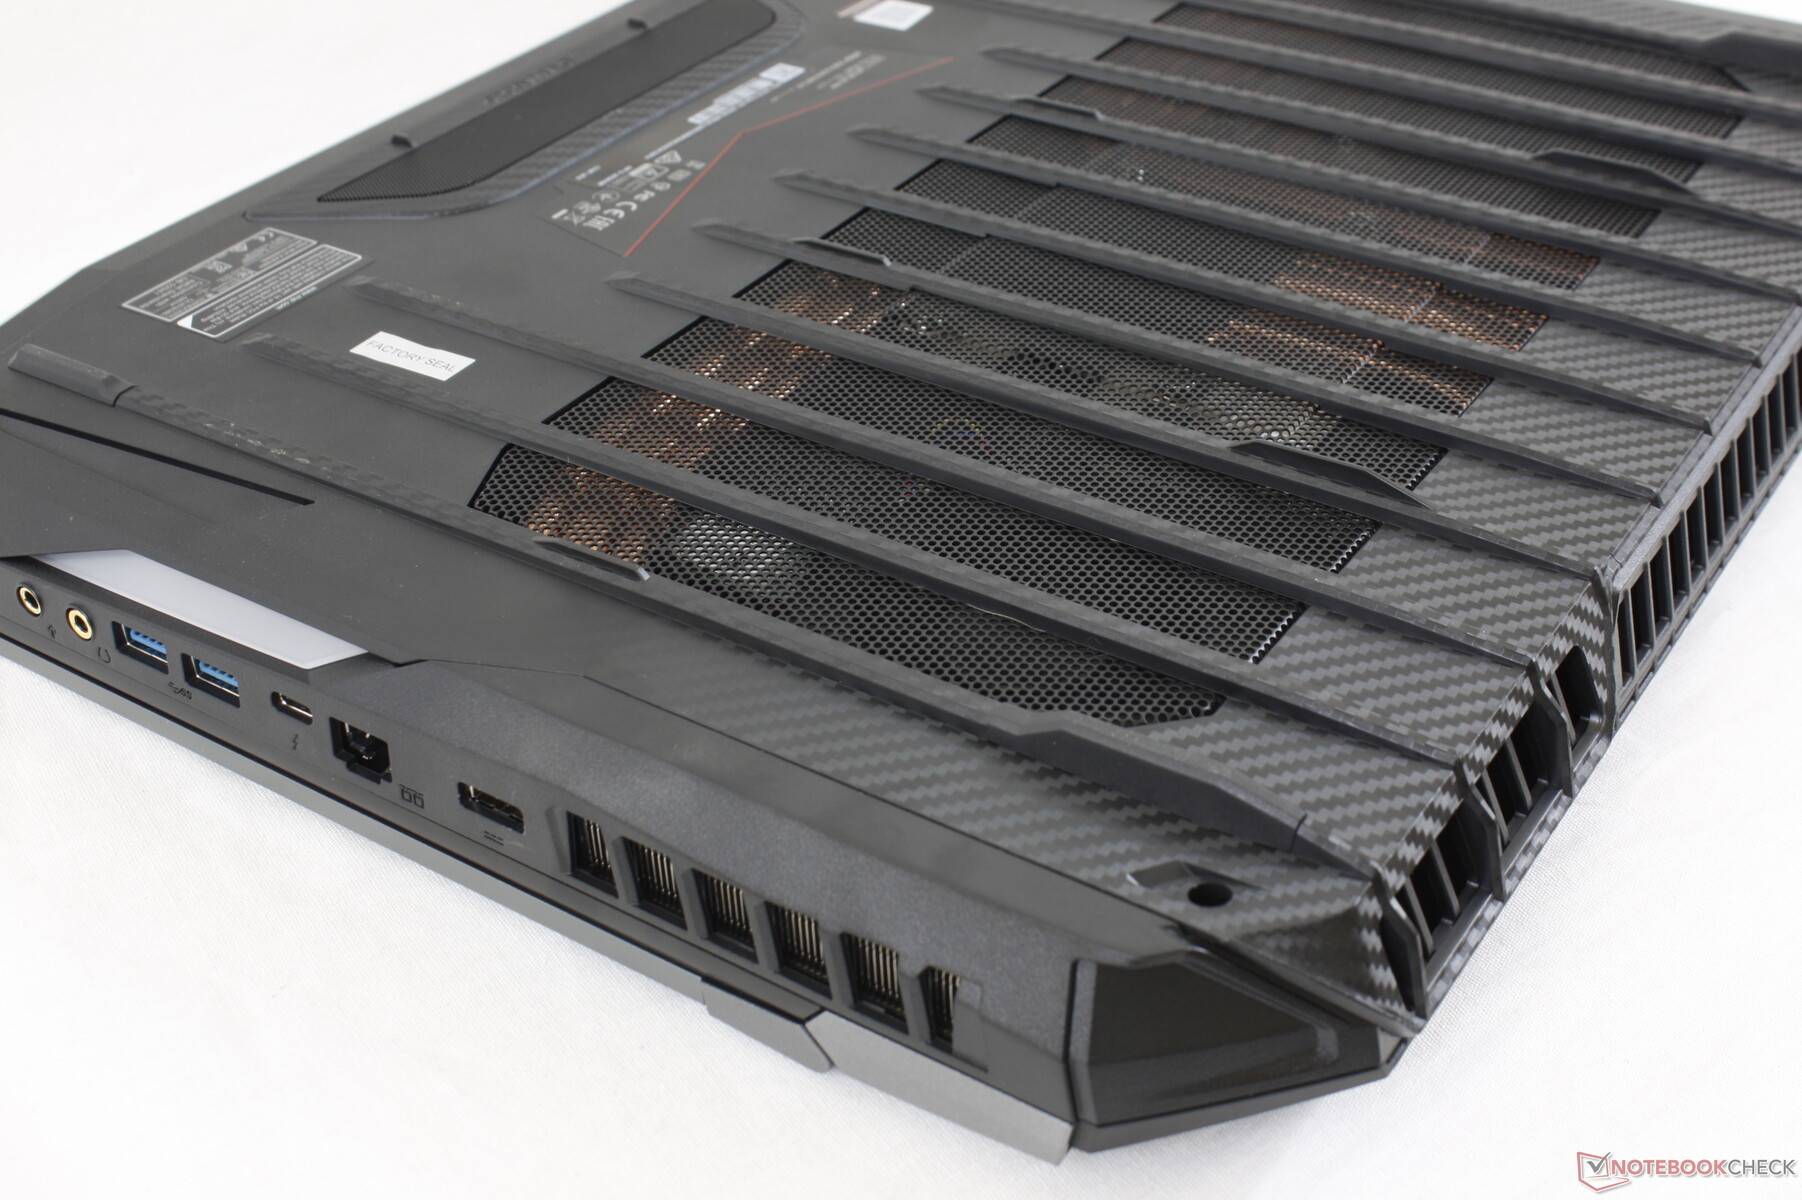
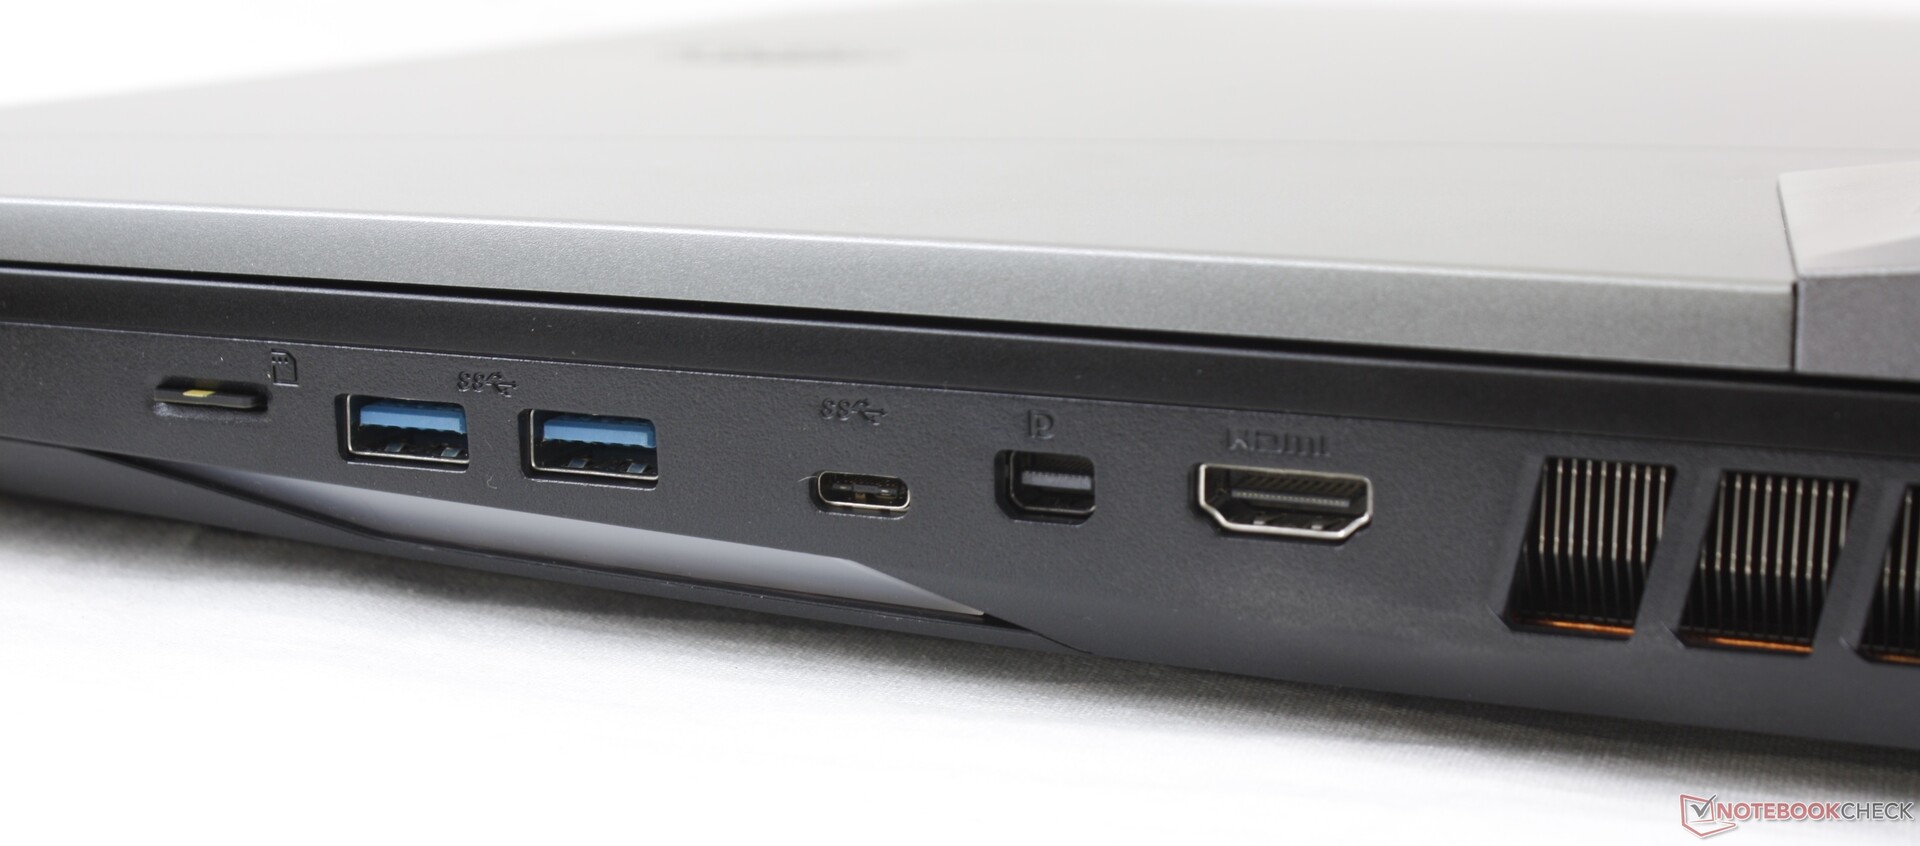
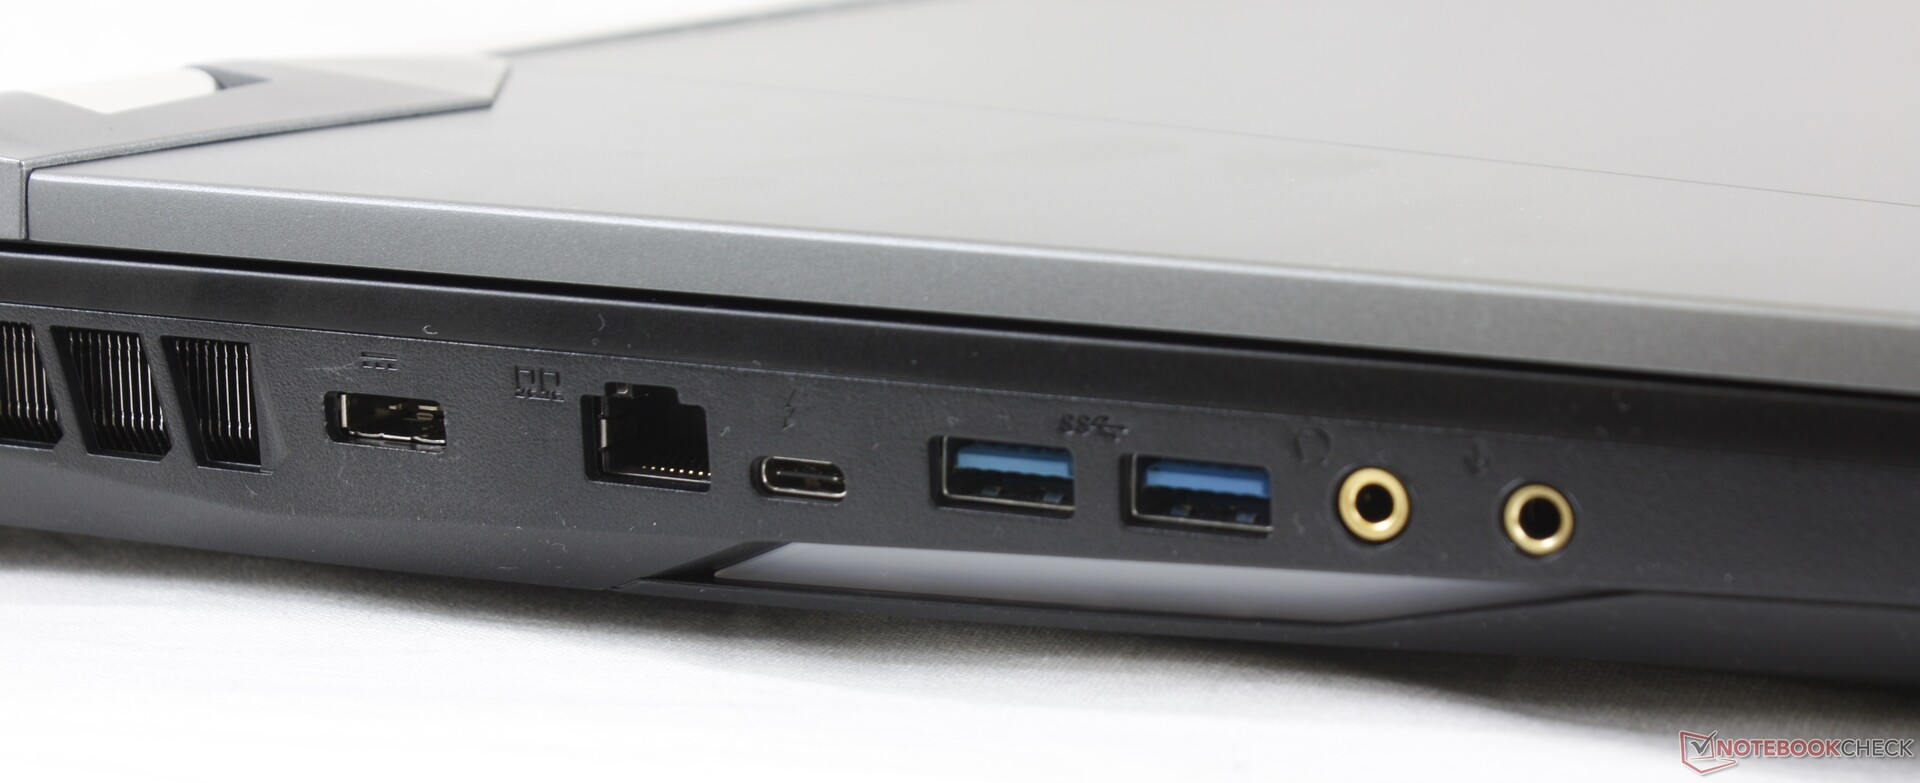
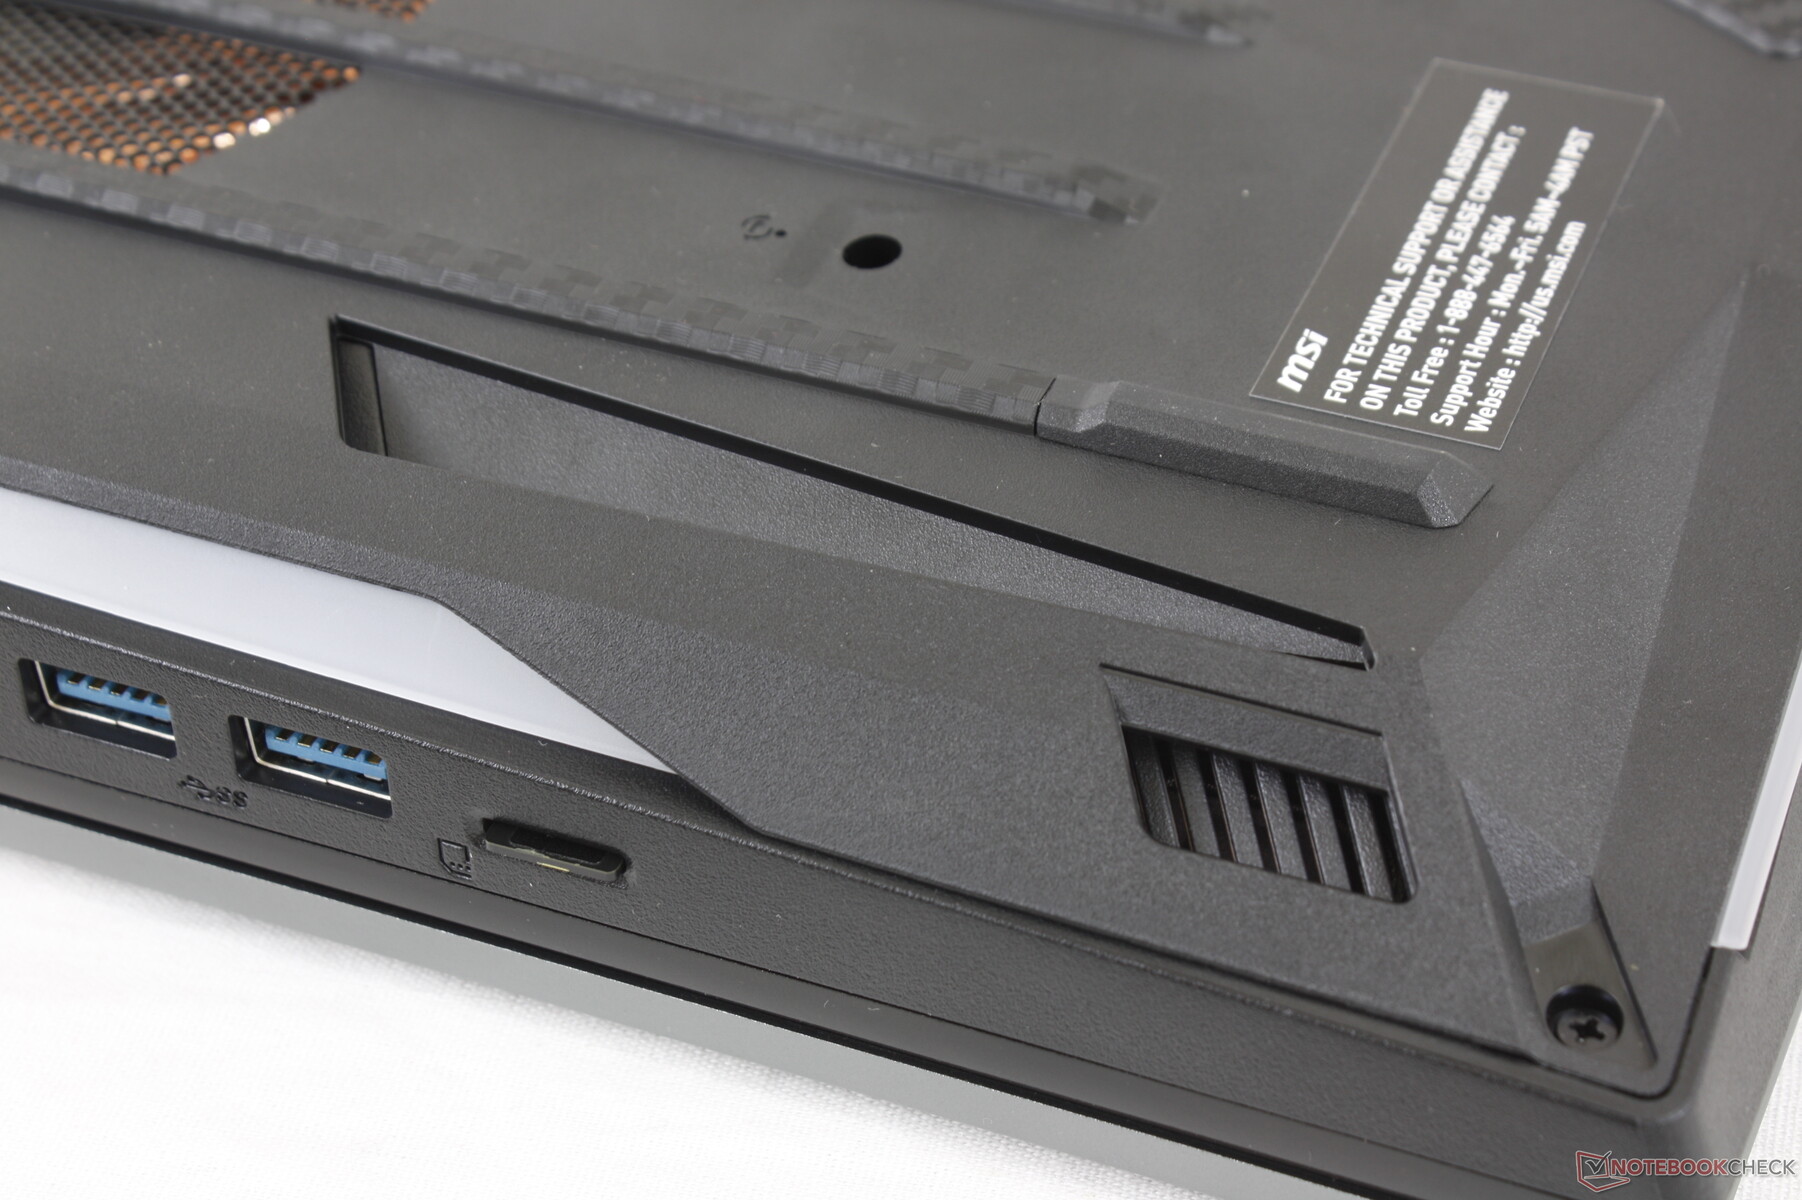
Connectivity
SD Card Reader
| SD Card Reader | |
| average JPG Copy Test (av. of 3 runs) | |
| SCHENKER XMG Pro 17 PB71RD-G (Toshiba Exceria Pro SDXC 64 GB UHS-II) | |
| Asus ROG G703GXR (Toshiba Exceria Pro SDXC 64 GB UHS-II) | |
| MSI GT76 Titan DT 10SGS (Toshiba Exceria Pro M501 UHS-II) | |
| MSI GE75 9SG (Toshiba Exceria Pro SDXC 64 GB UHS-II) | |
| maximum AS SSD Seq Read Test (1GB) | |
| Asus ROG G703GXR (Toshiba Exceria Pro SDXC 64 GB UHS-II) | |
| SCHENKER XMG Pro 17 PB71RD-G (Toshiba Exceria Pro SDXC 64 GB UHS-II) | |
| MSI GT76 Titan DT 10SGS (Toshiba Exceria Pro M501 UHS-II) | |
| MSI GE75 9SG (Toshiba Exceria Pro SDXC 64 GB UHS-II) | |
Communication
Webcam

")
")
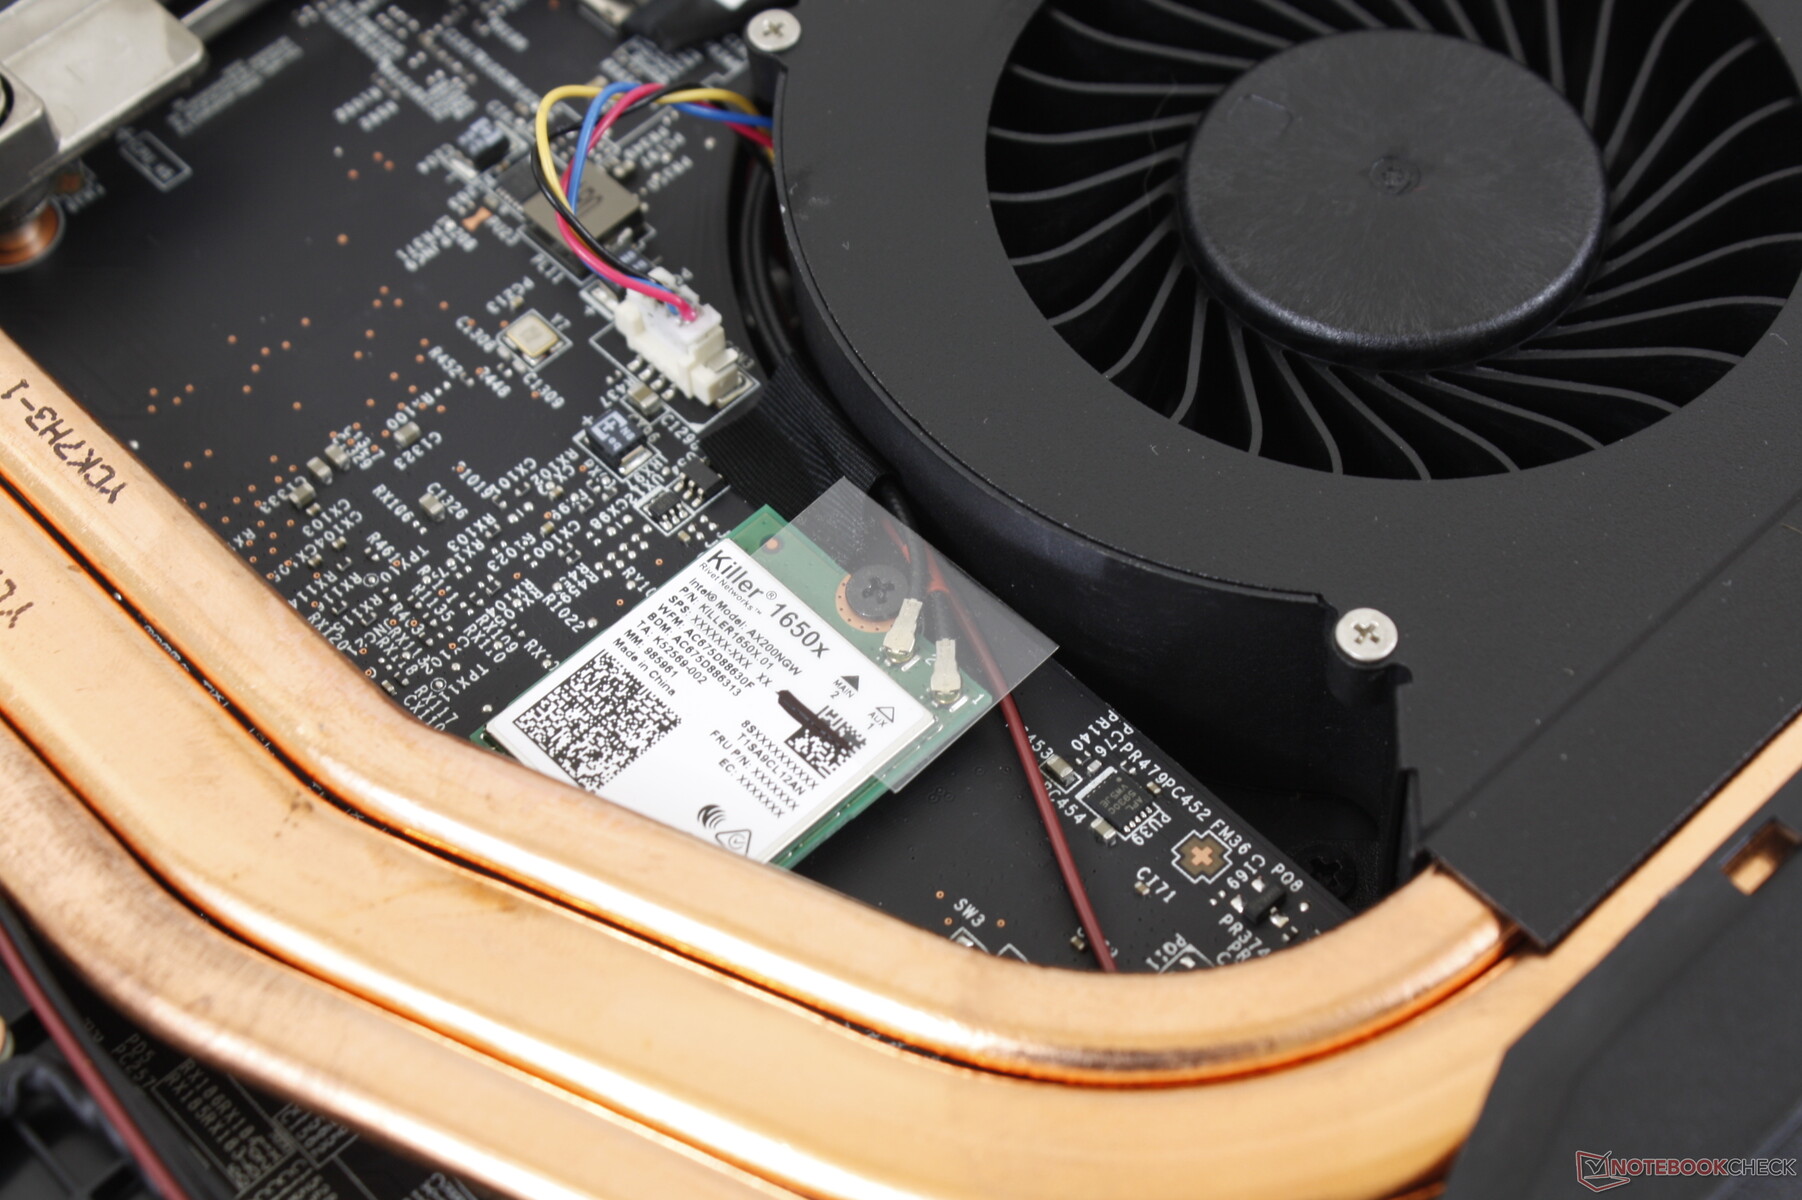
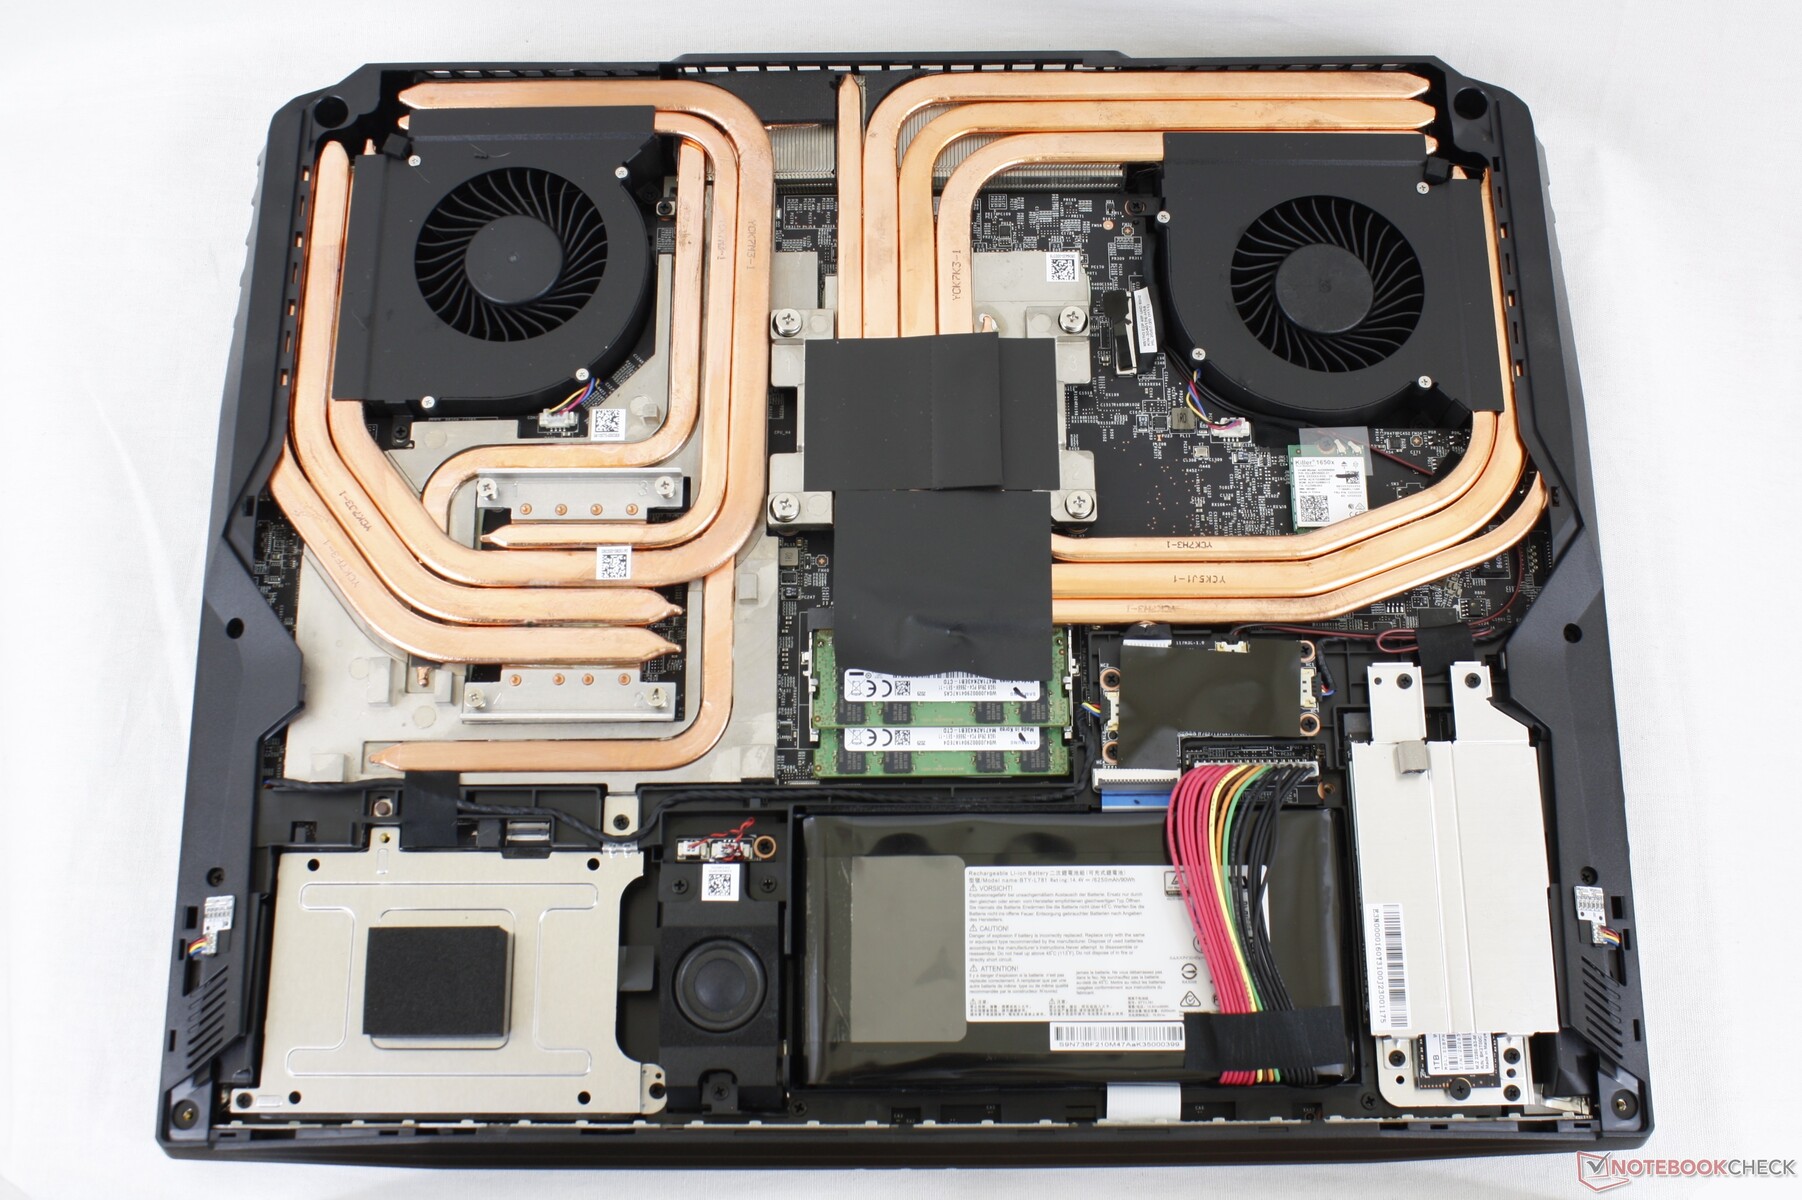
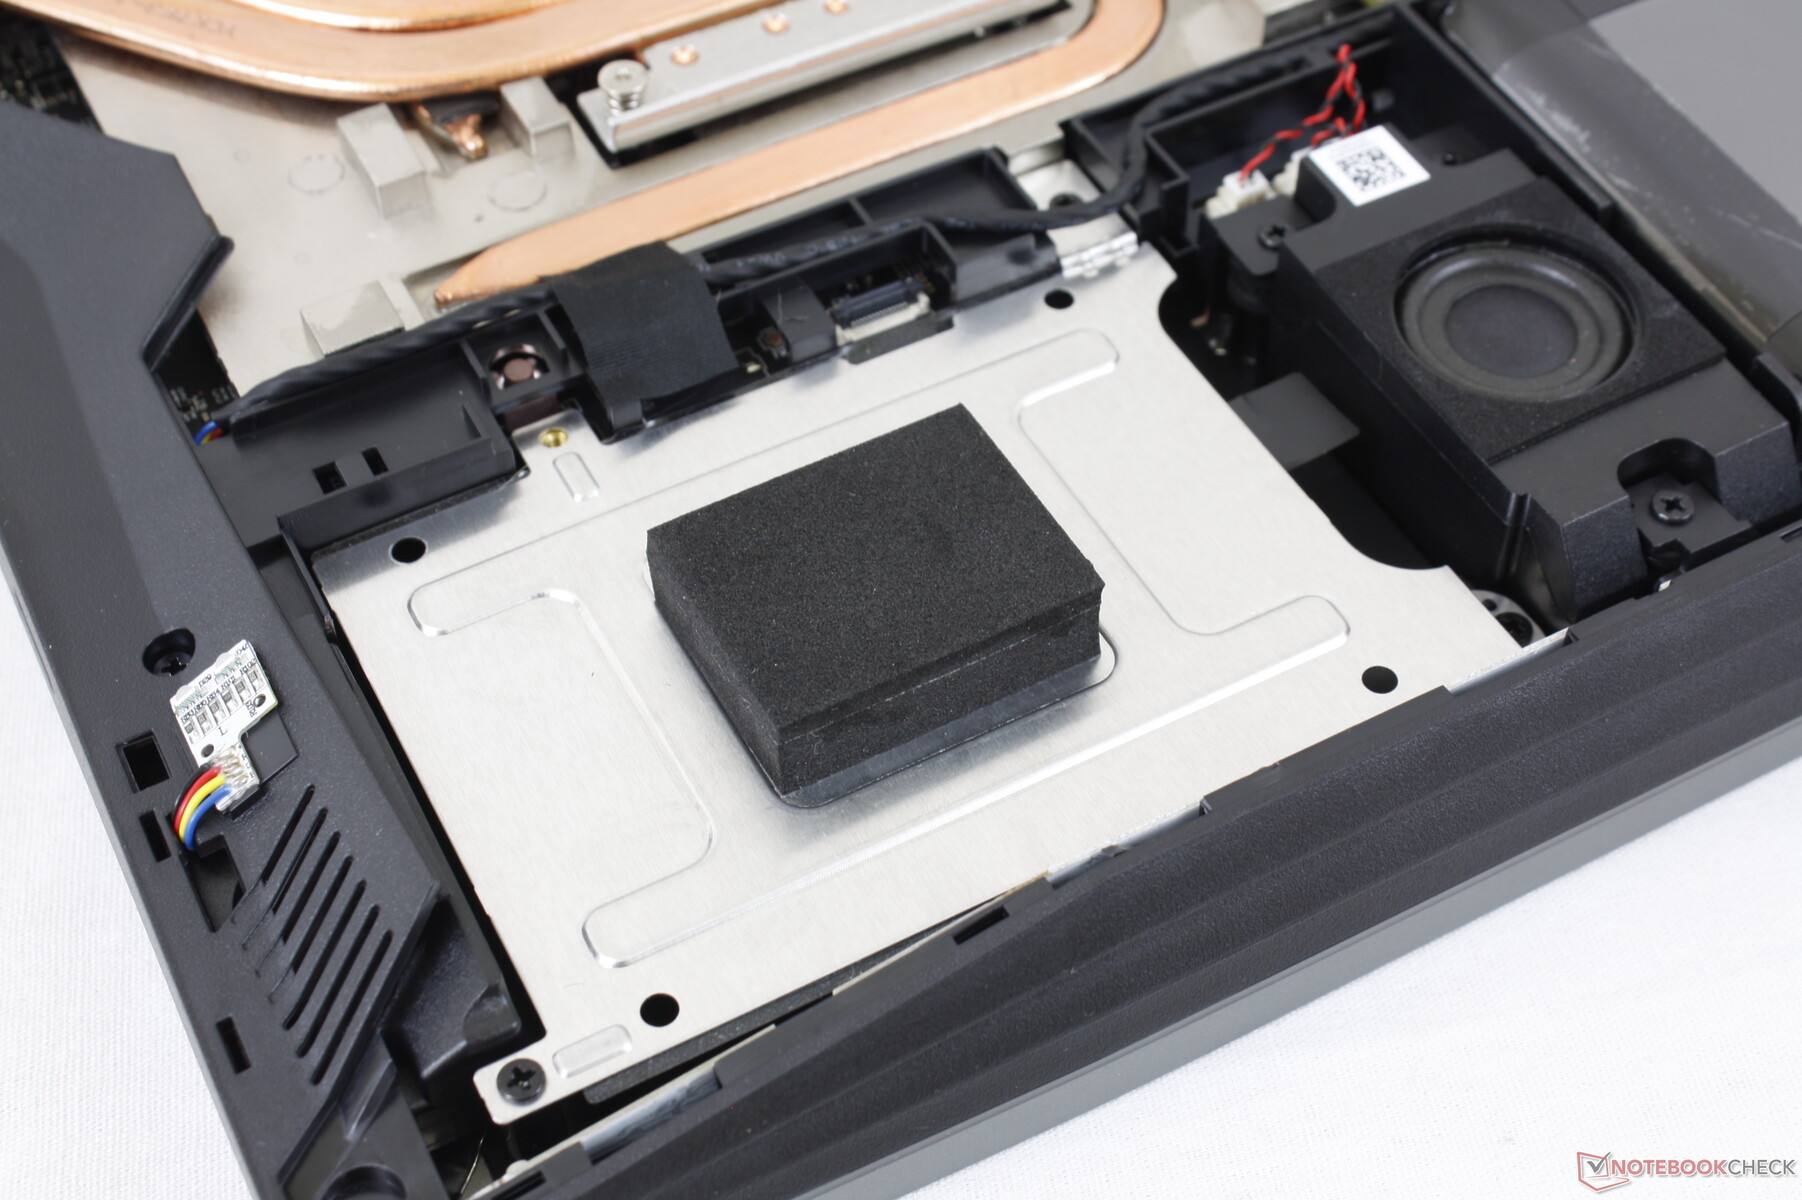
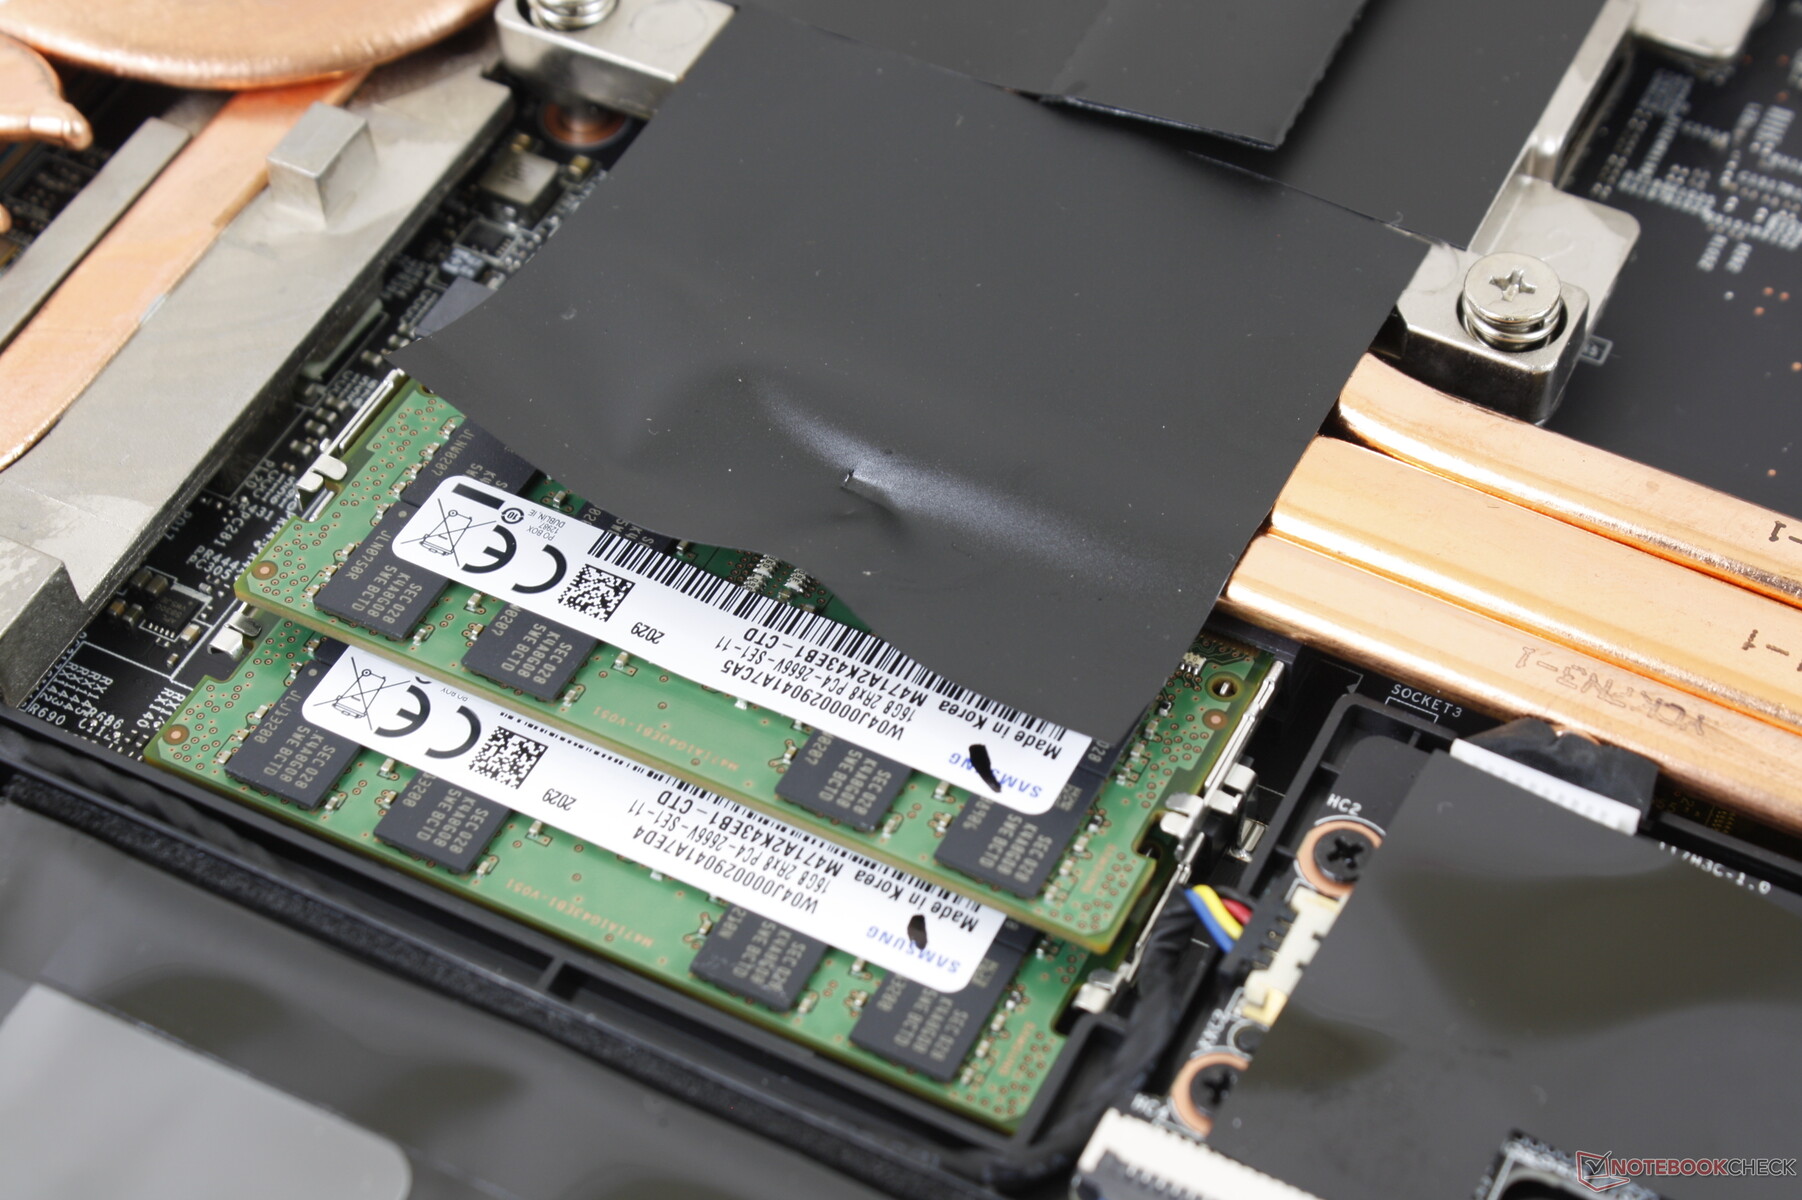
Maintenance
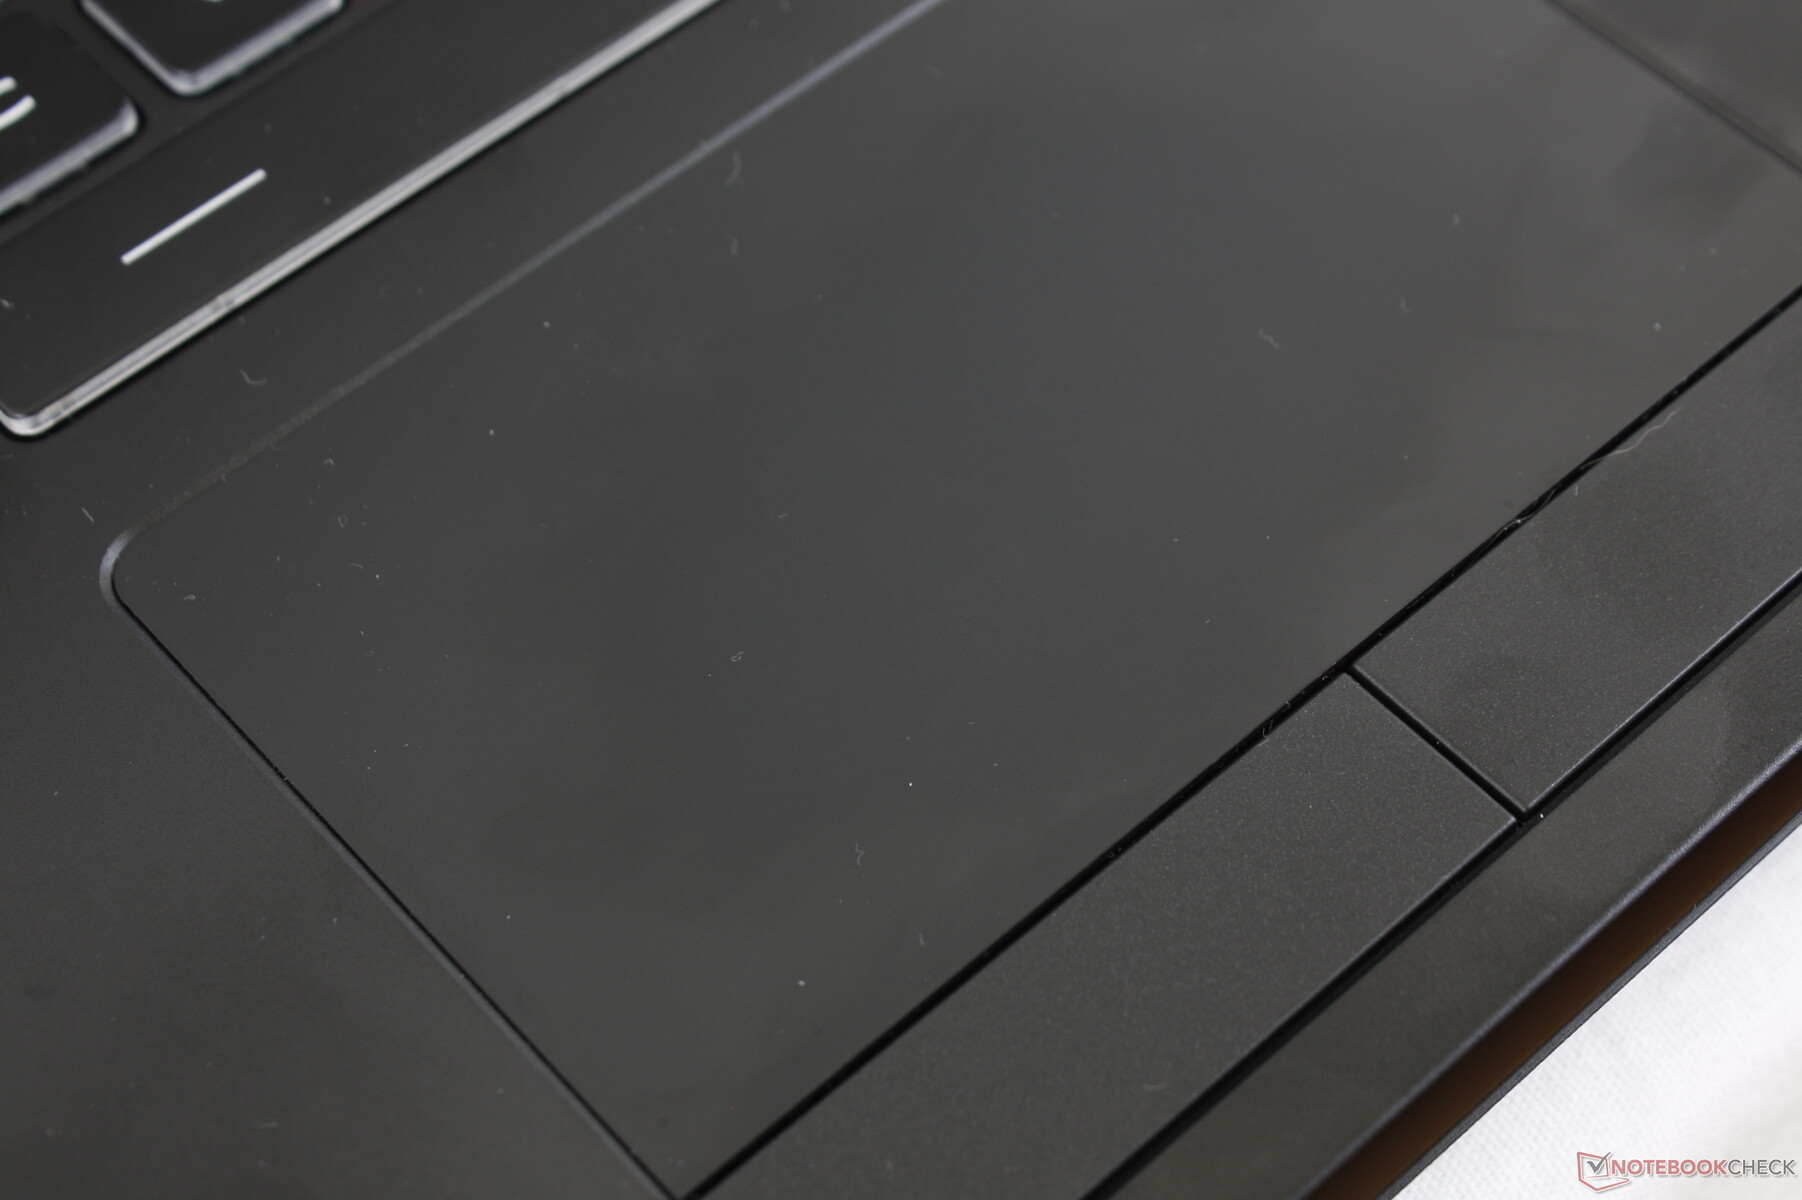
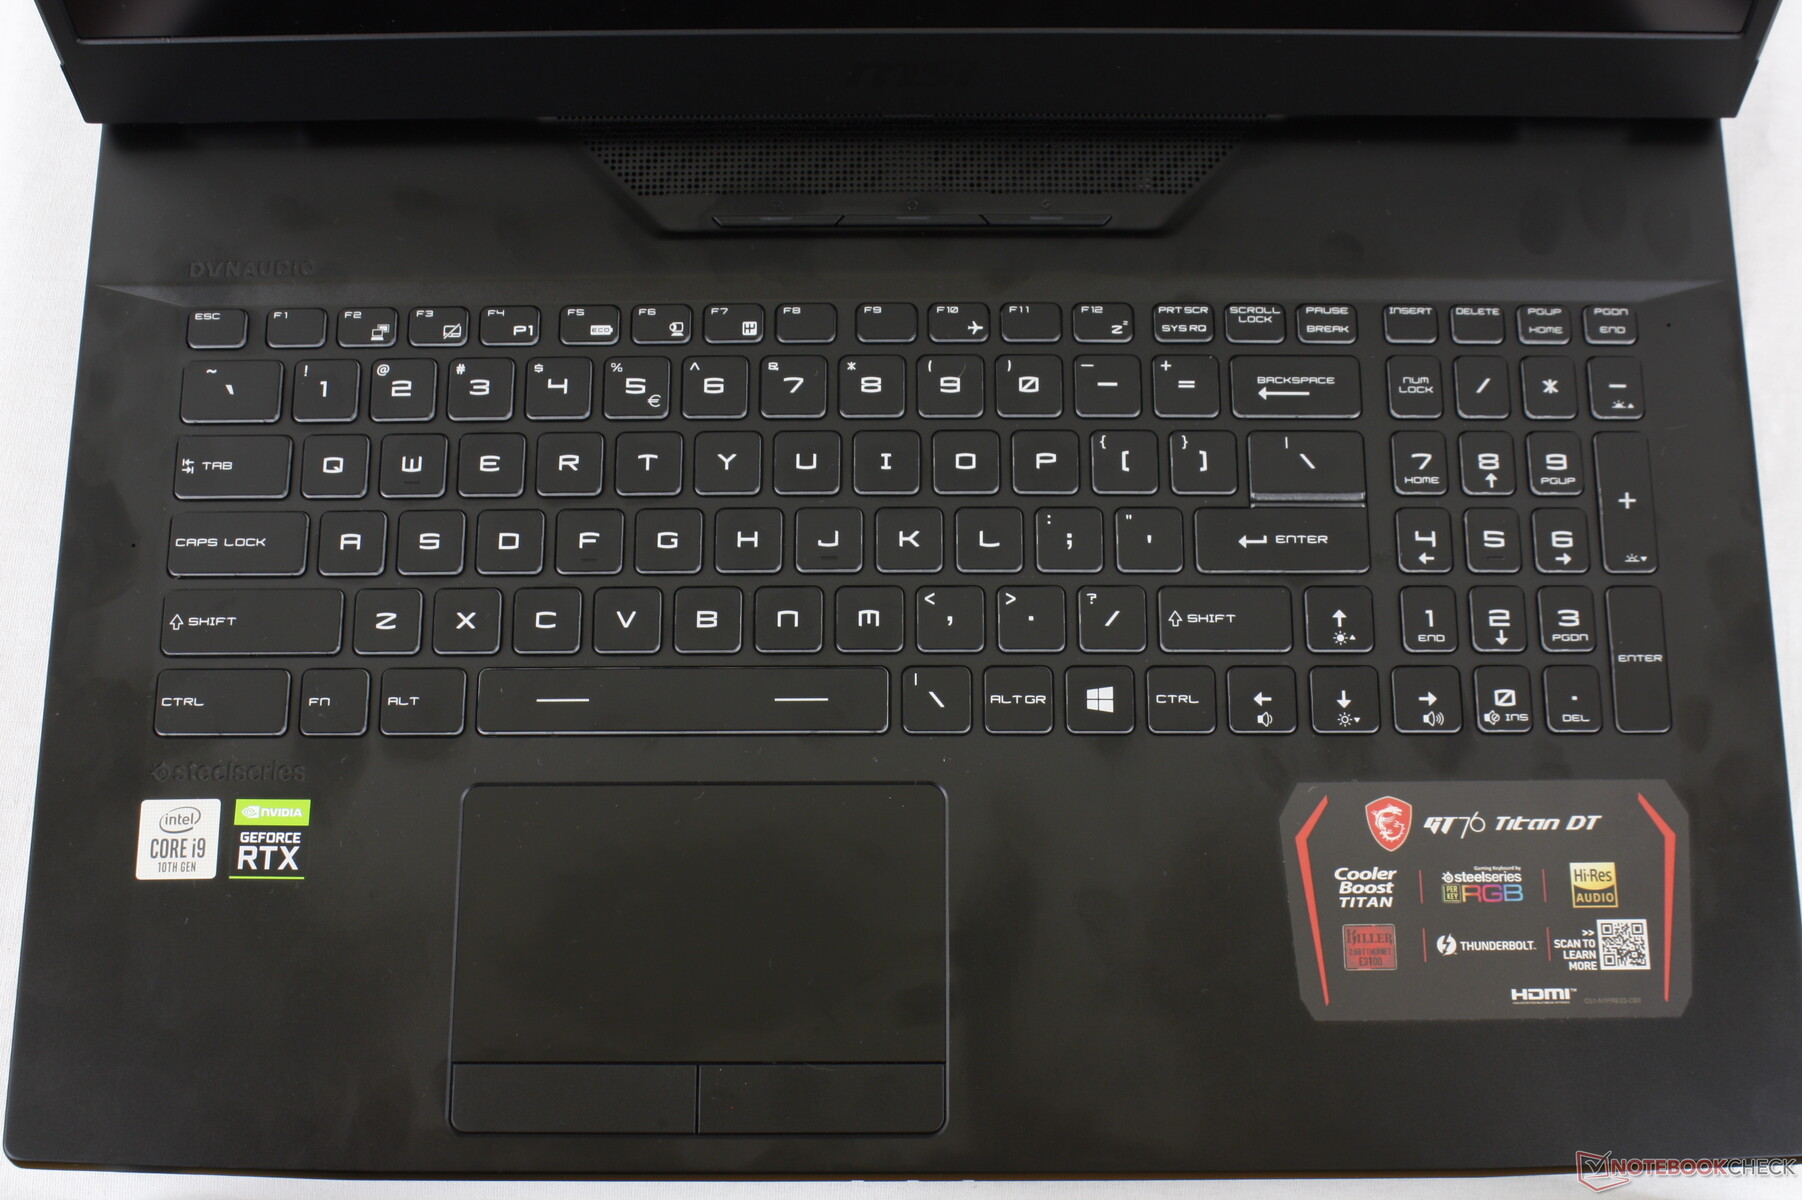
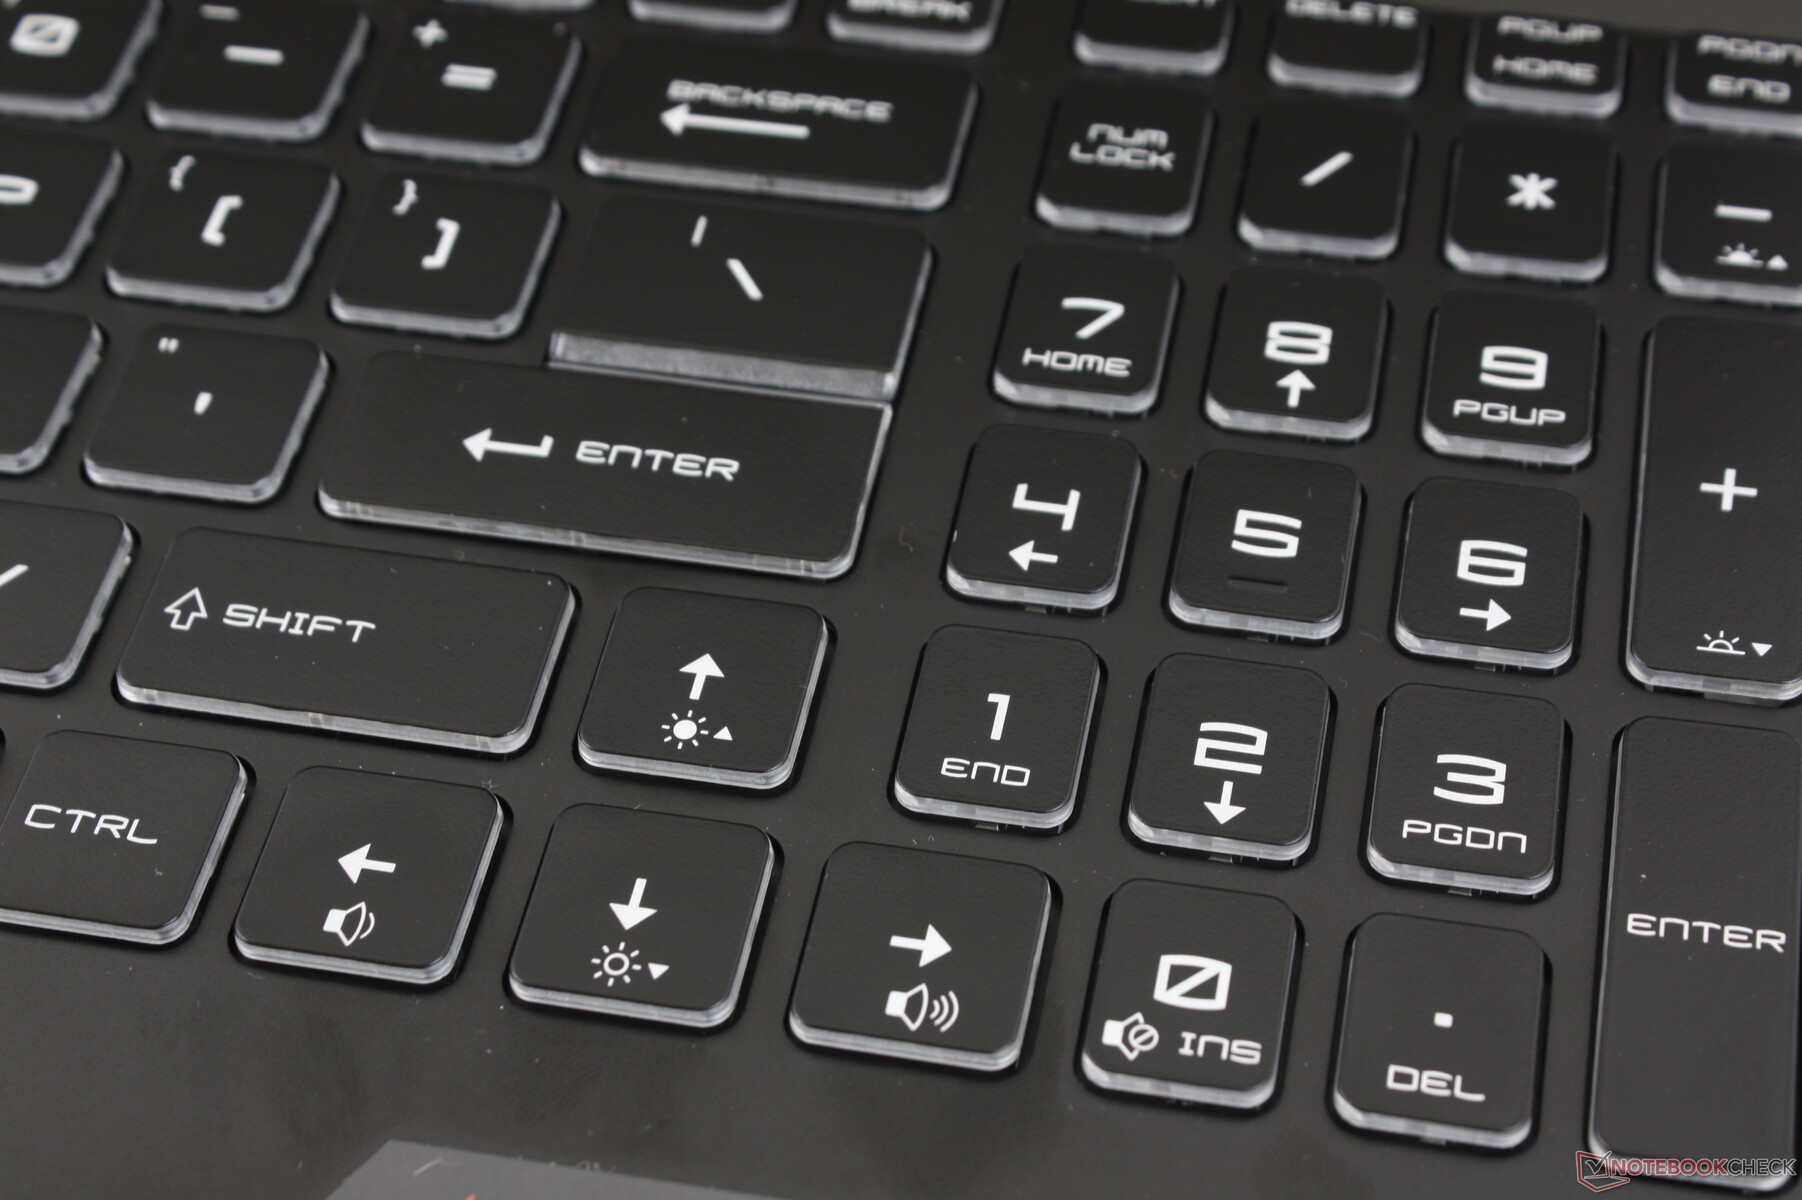
Input Devices

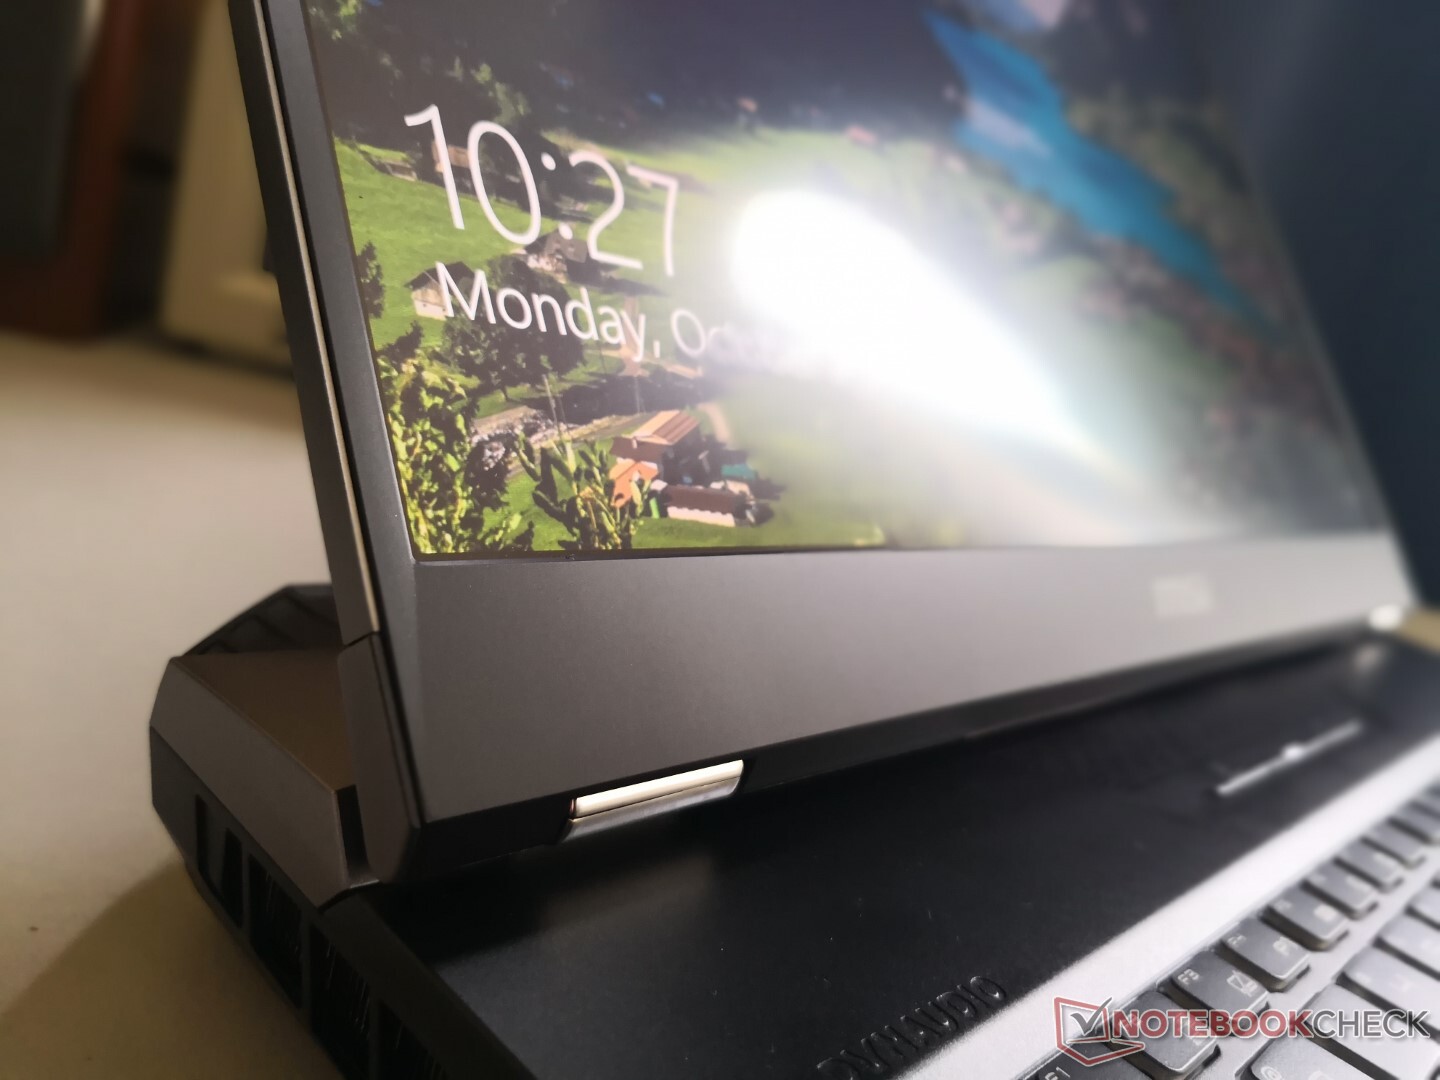
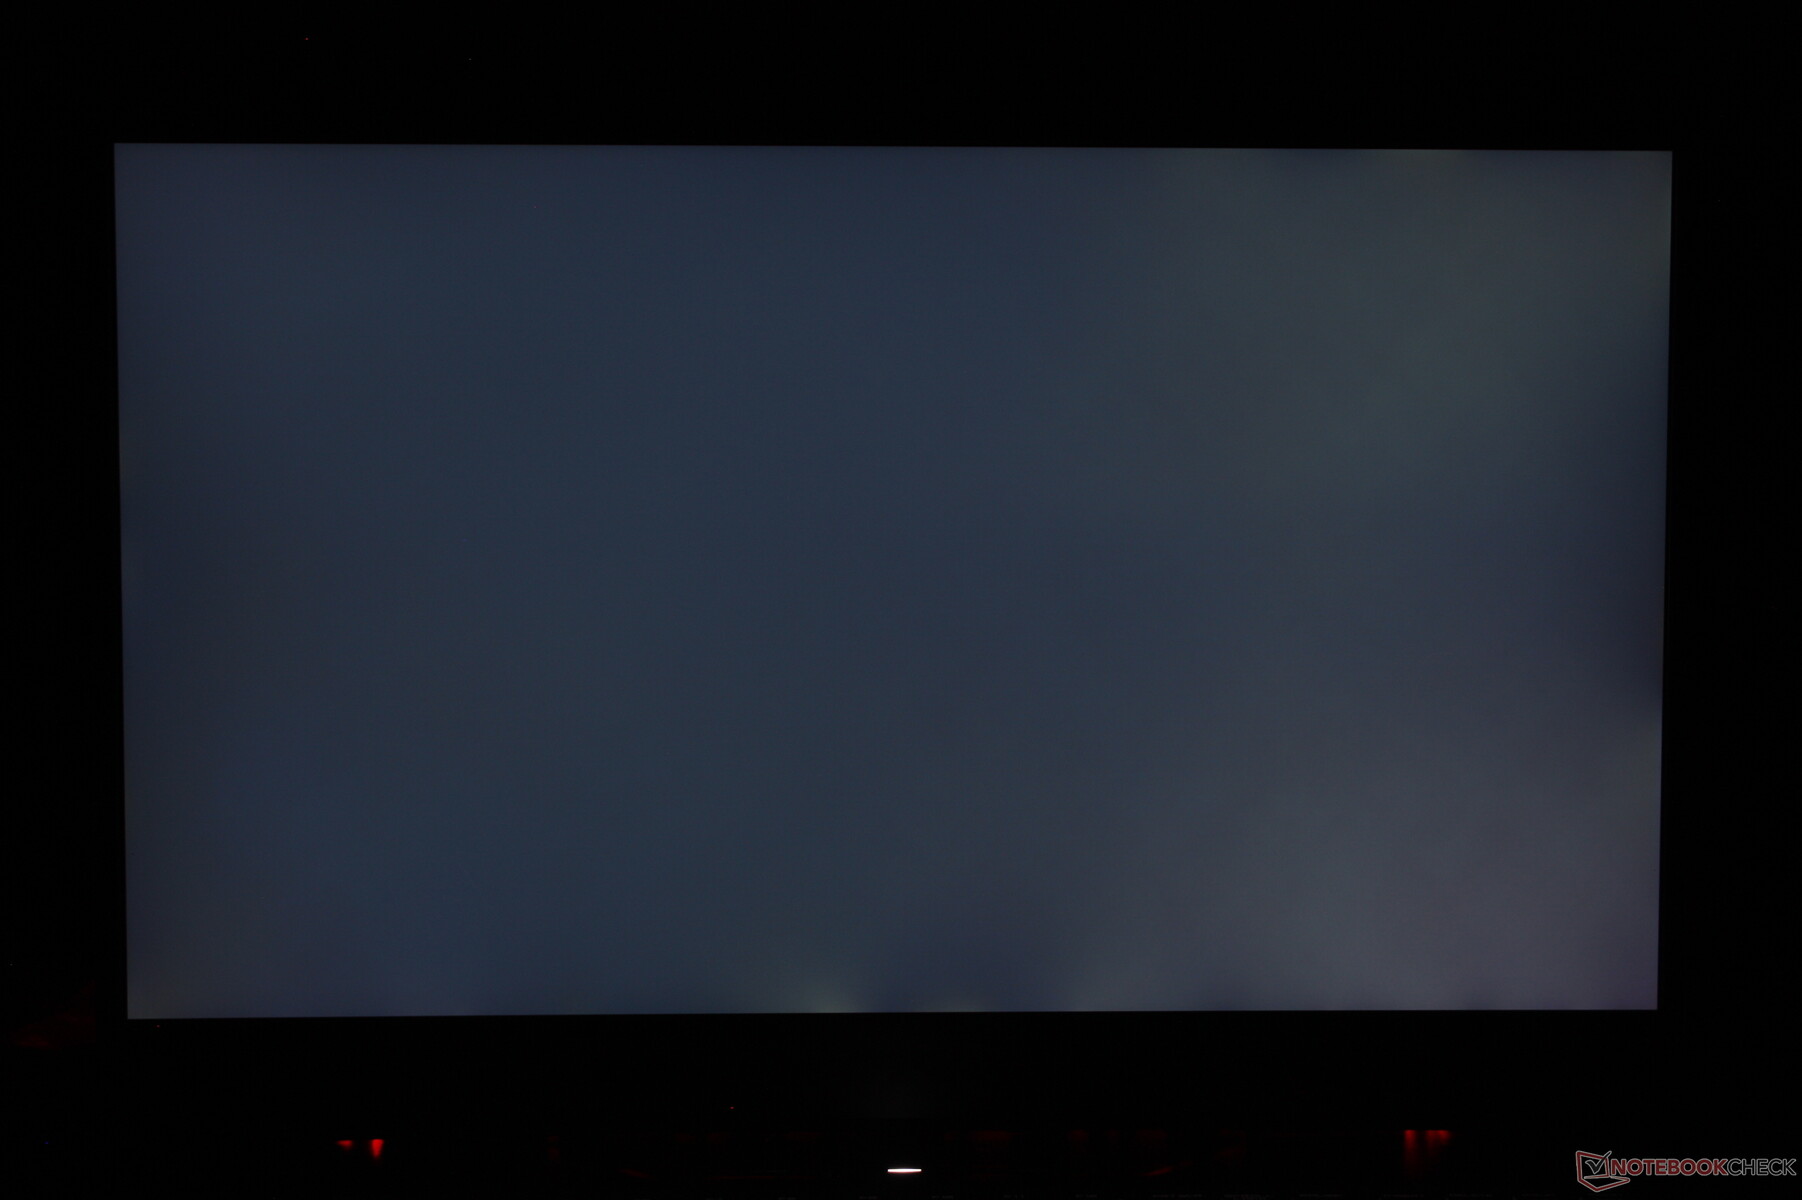
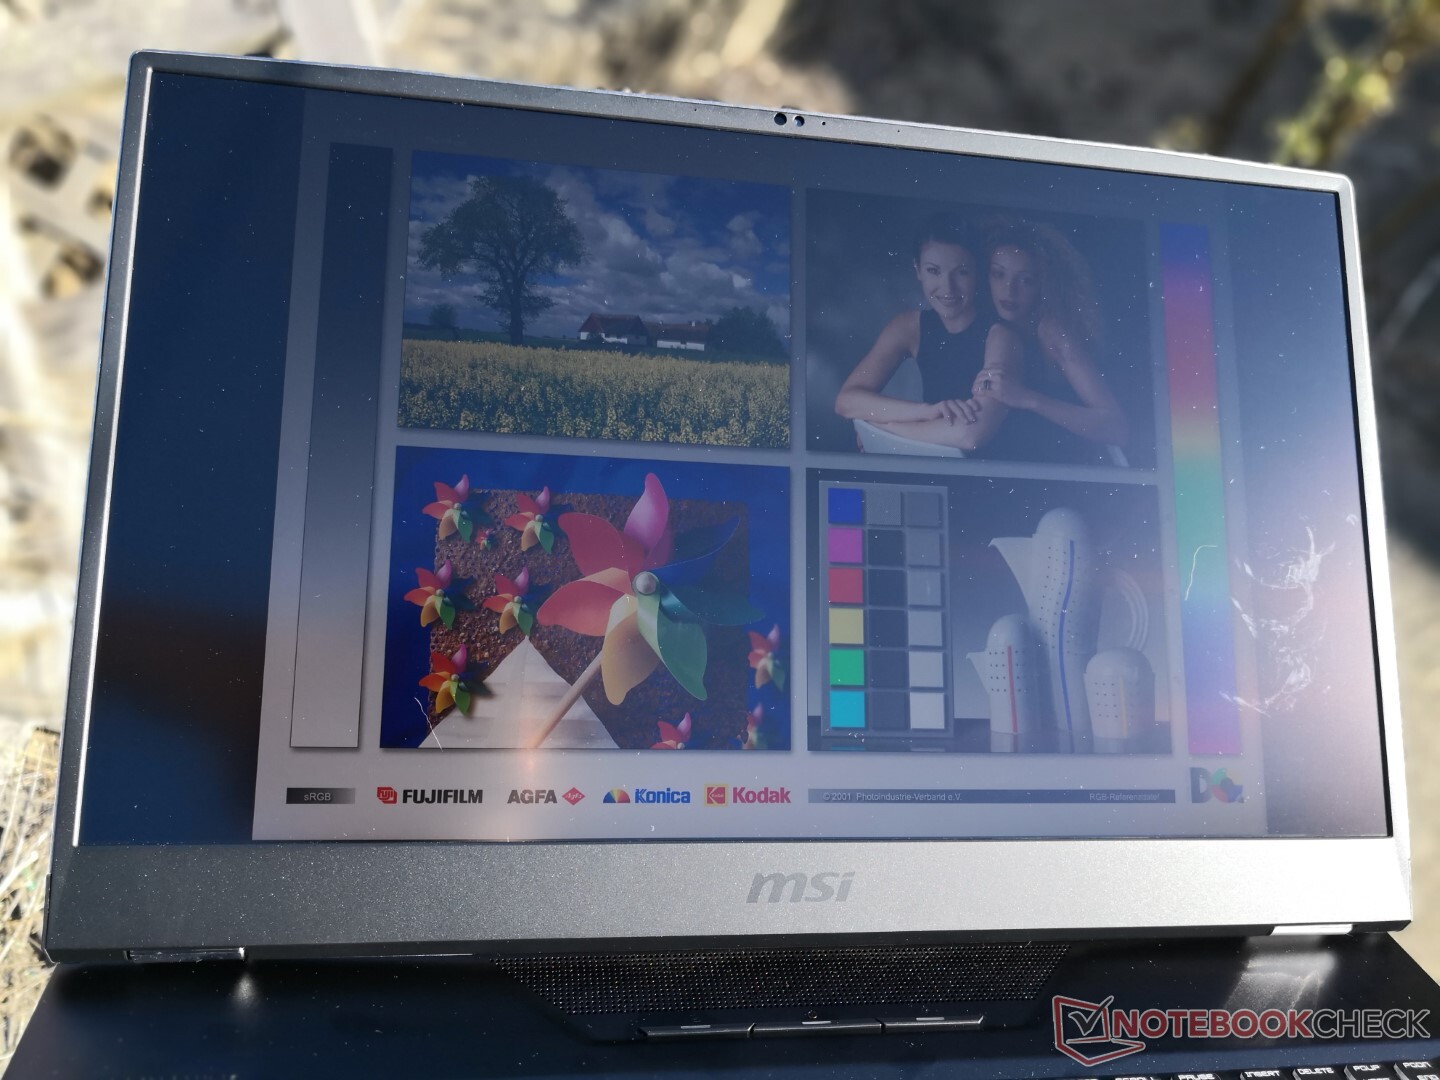
Display
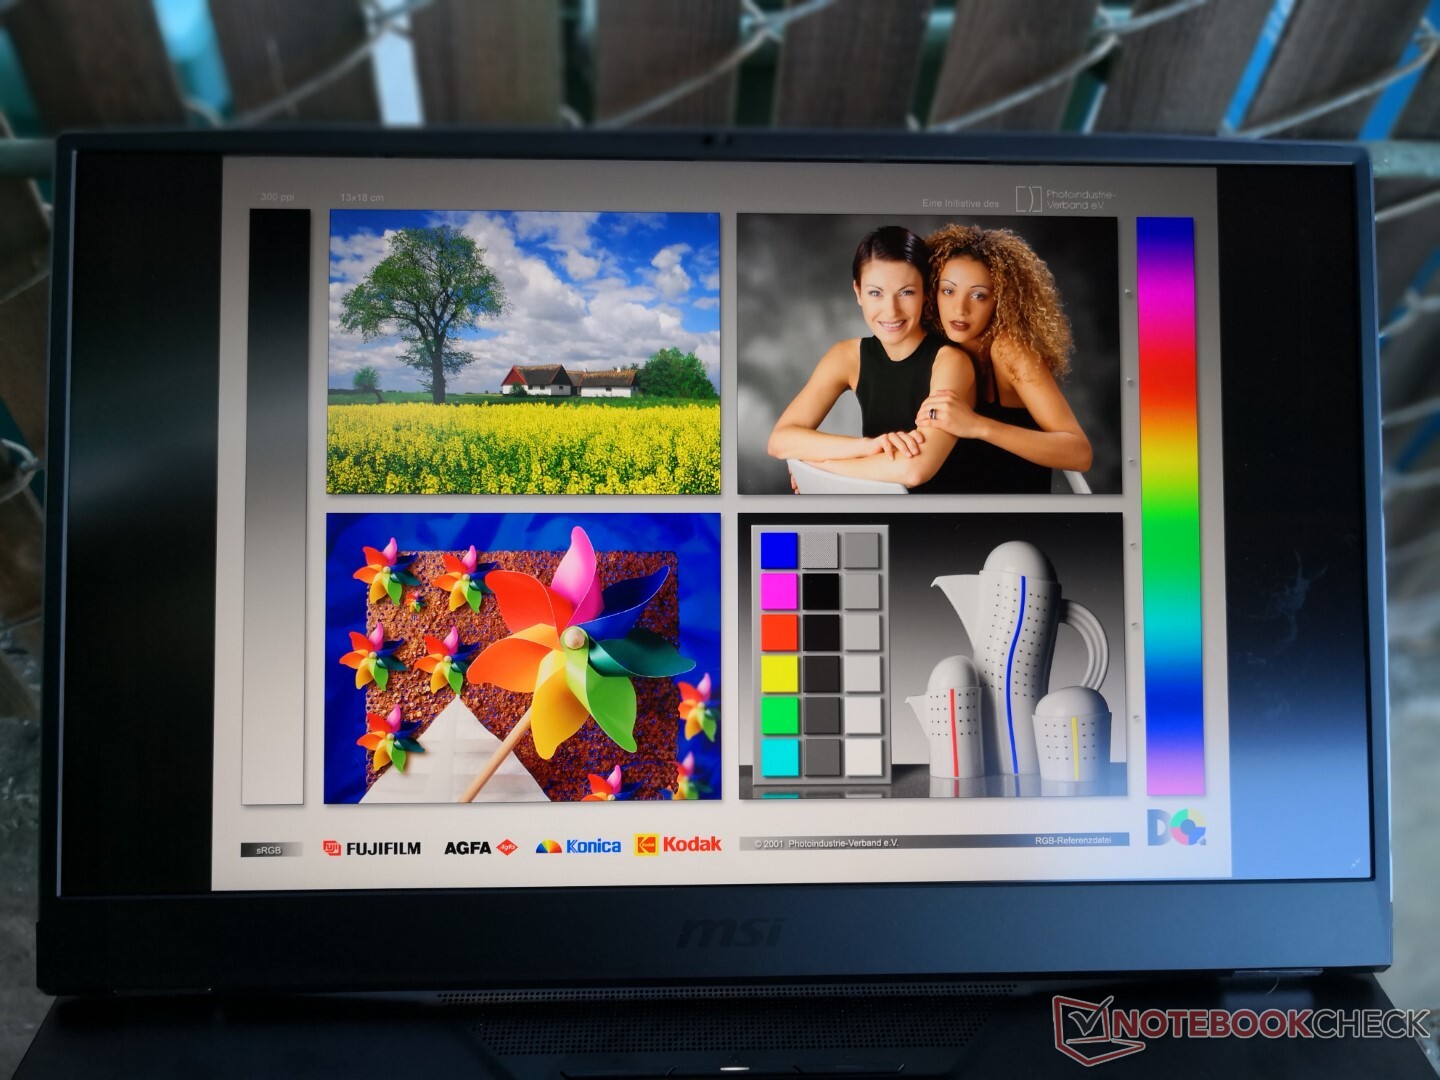
Our AU Optronics B173ZAN03.3 4K UHD panel here can also be found on the latest Razer Blade Pro 17. This particular panel is notable for its native 120 Hz refresh rate and fast response times relative to most other 4K UHD panels that are limited to 60 Hz only. 1080p panels still have the advantage in terms of refresh rates and response times and it's for these reasons that the GT76 can also be configured with 300 Hz 1080p panels if desired.

| |||||||||||||||||||||||||
Brightness Distribution: 93 %
Center on Battery: 419.5 cd/m²
Contrast: 1049:1 (Black: 0.4 cd/m²)
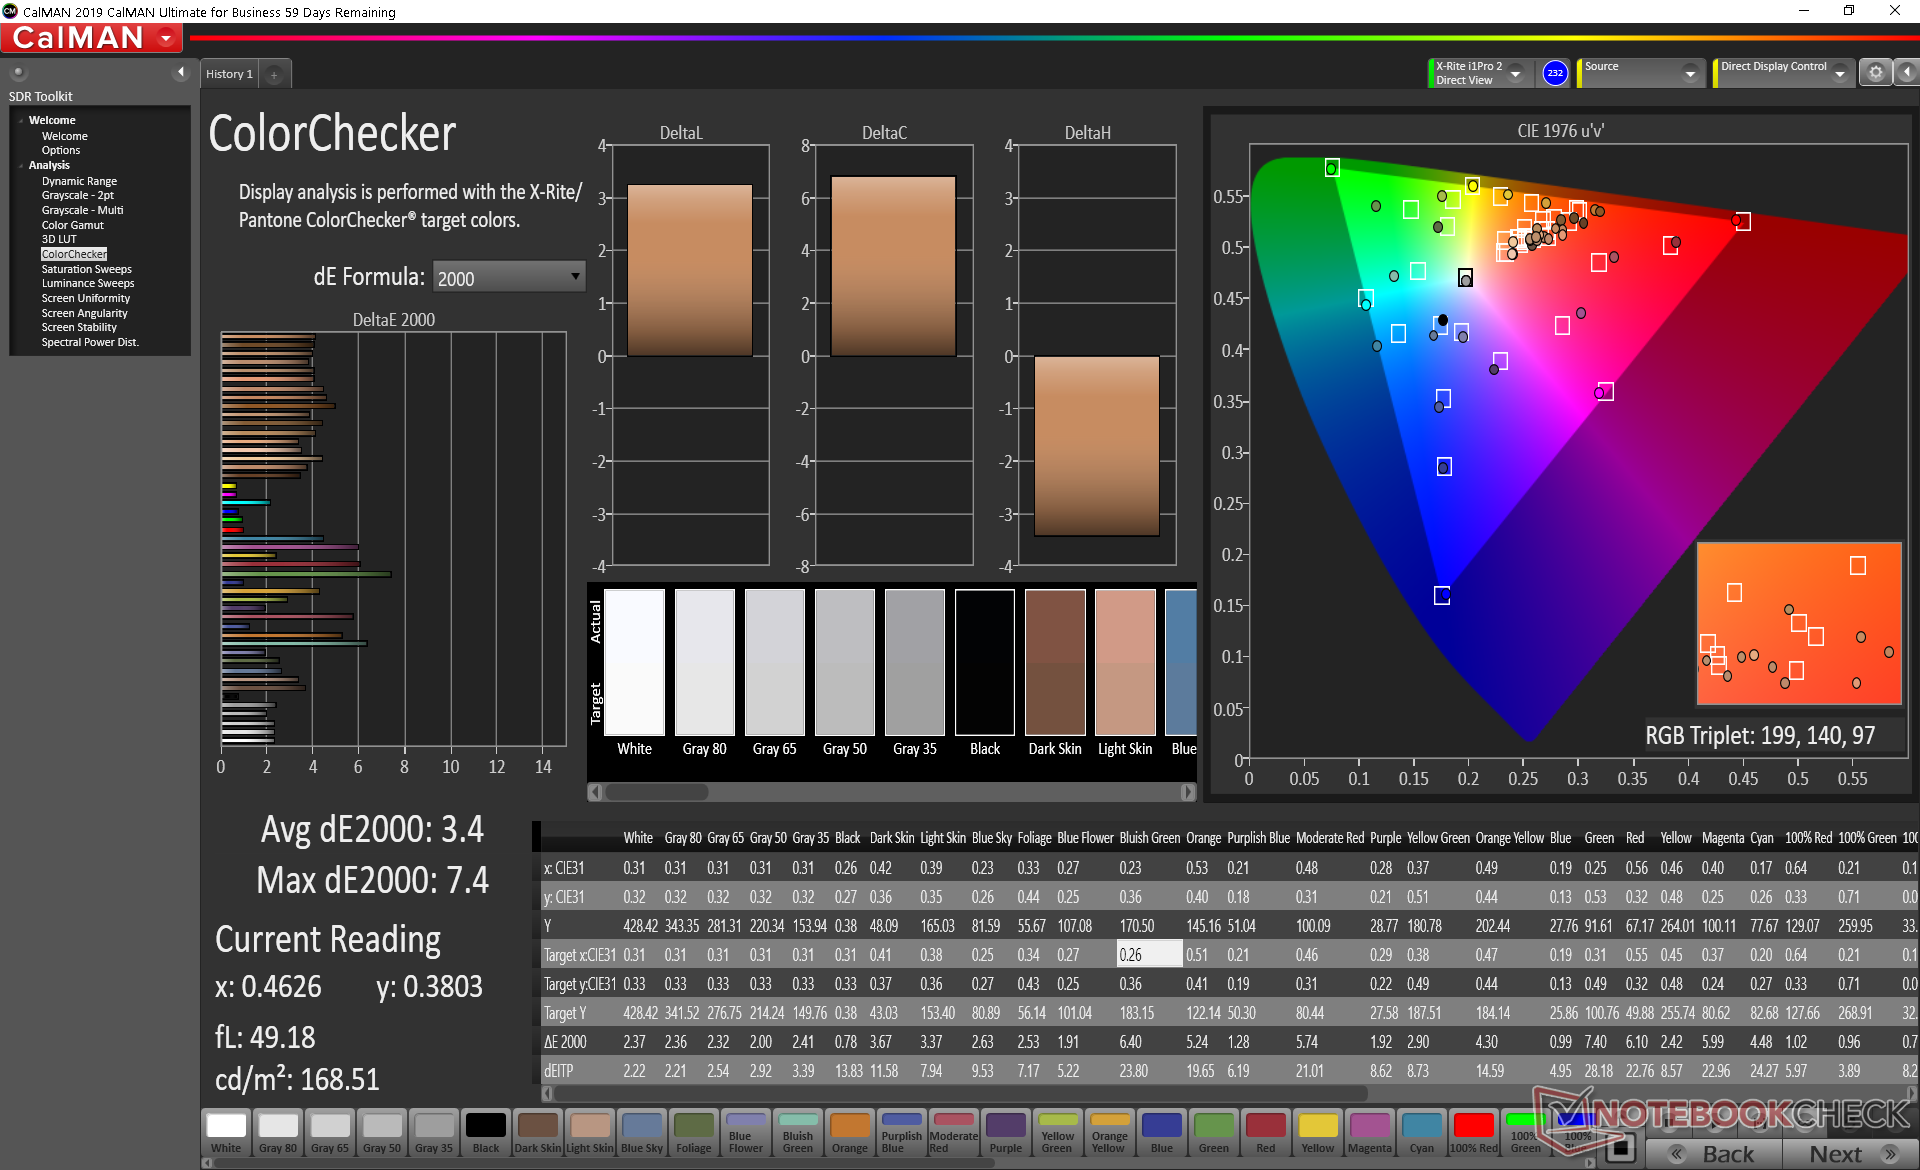
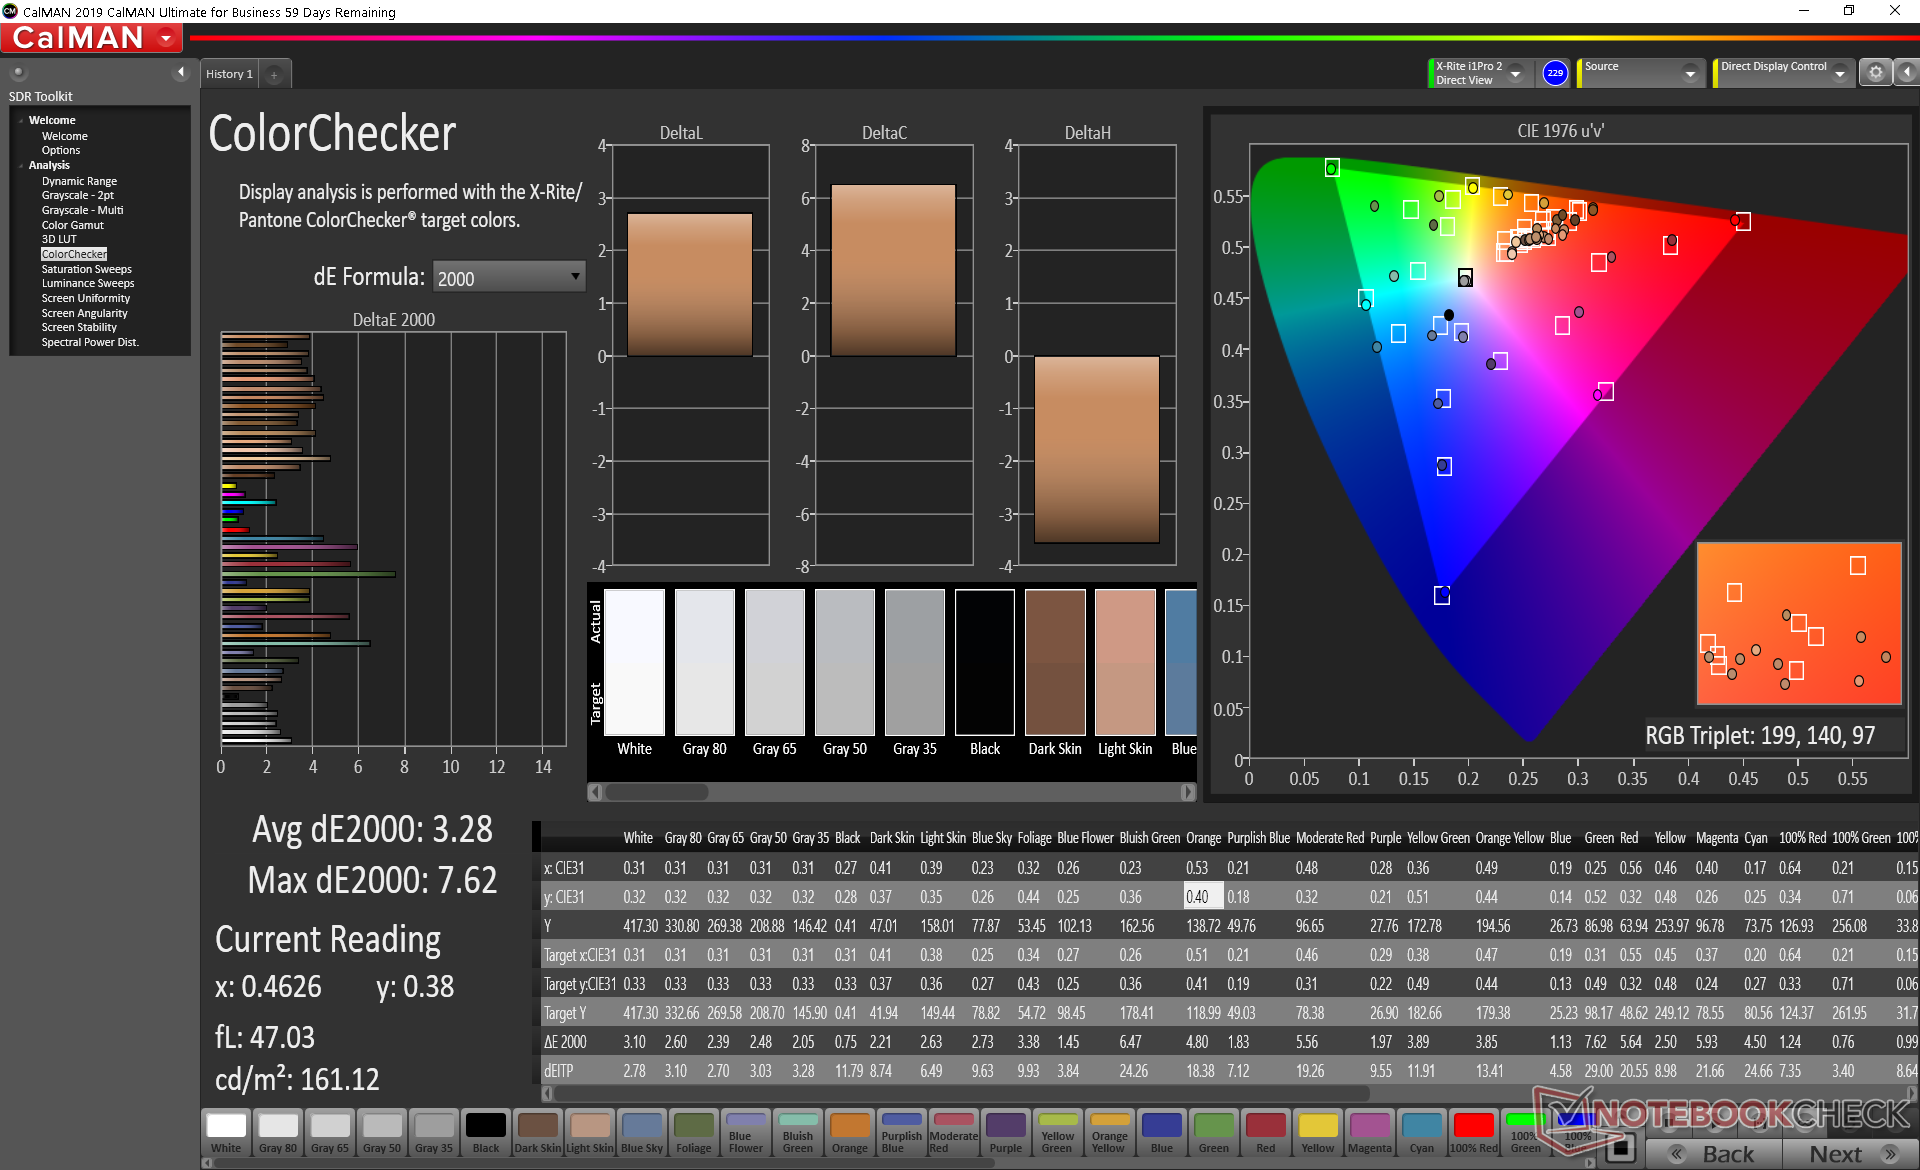
ΔE ColorChecker Calman: 3.4 | ∀{0.5-29.43 Ø4.82}
calibrated: 3.28
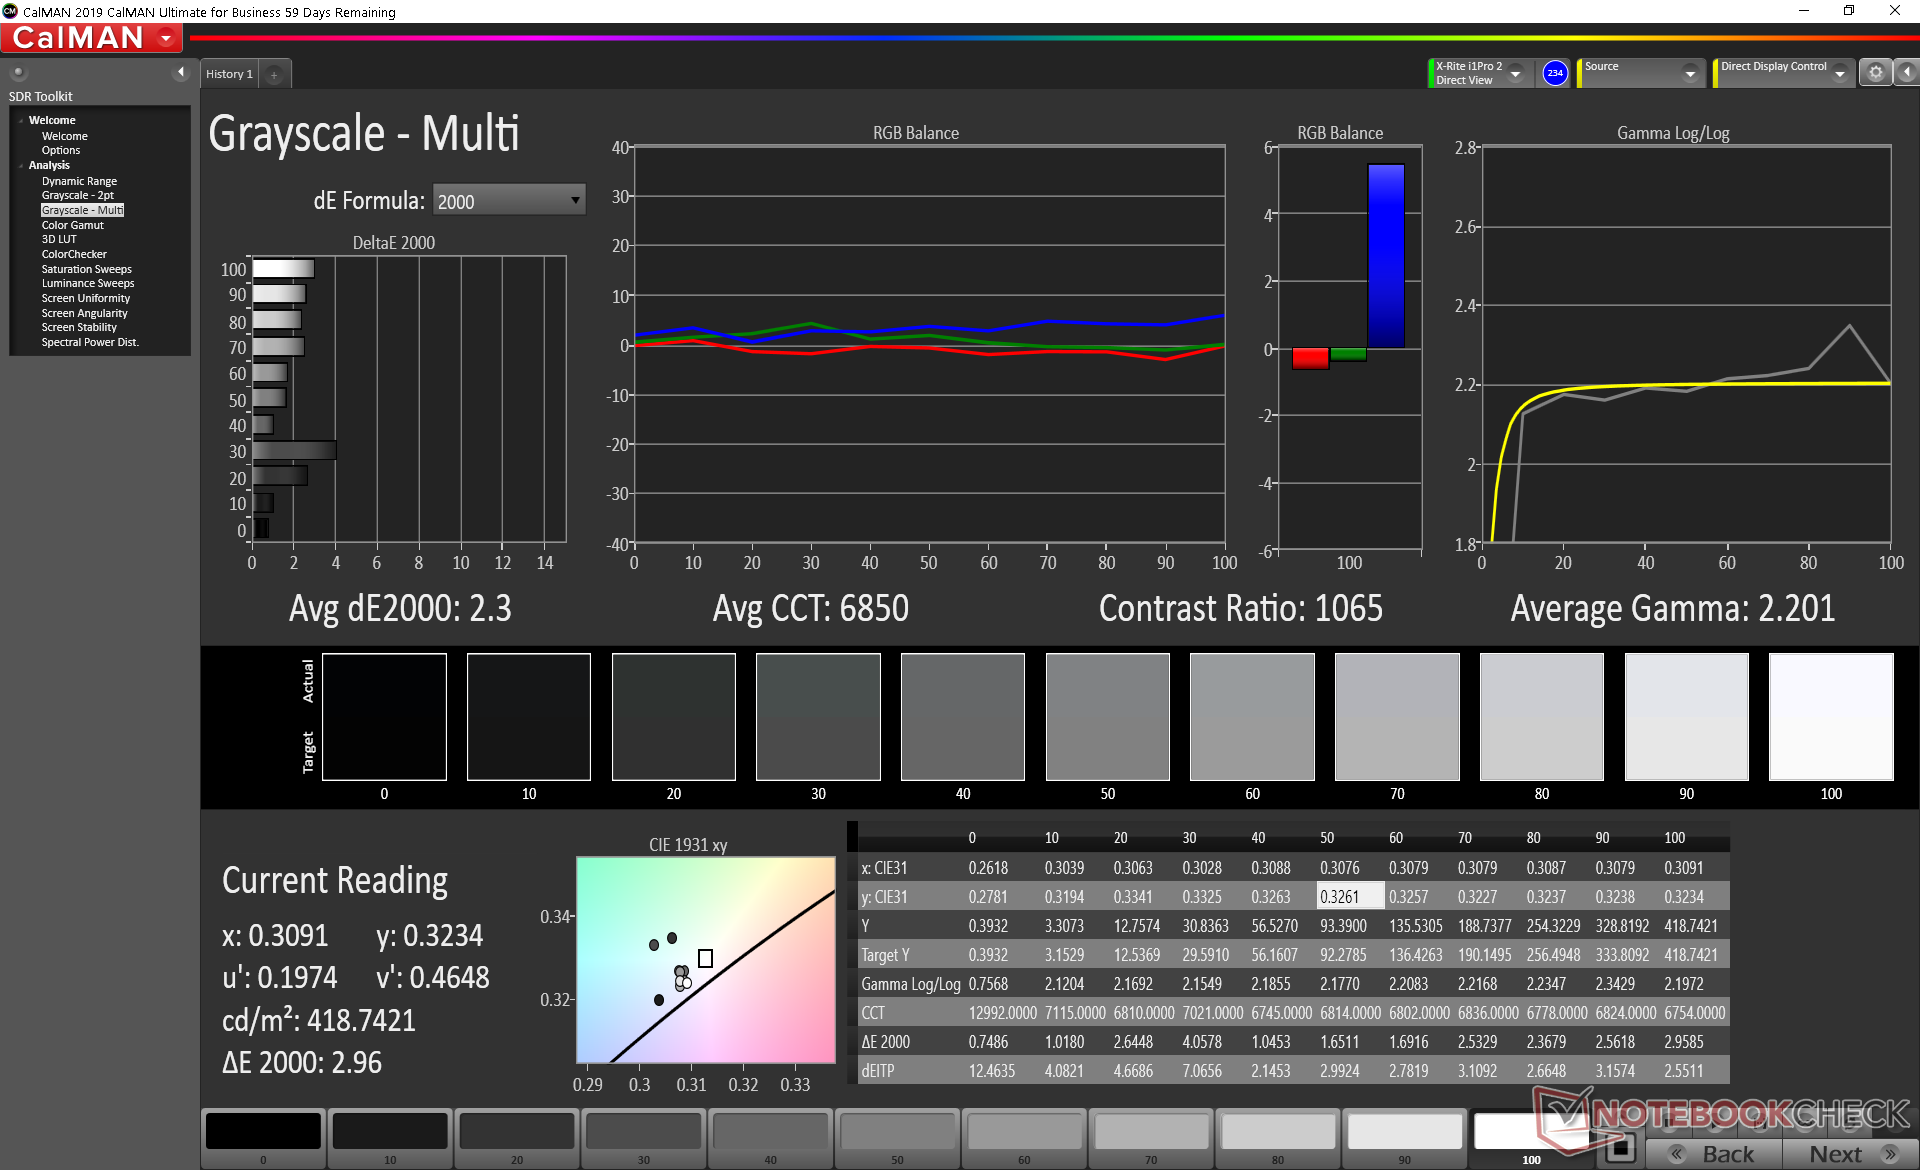
ΔE Greyscale Calman: 2 | ∀{0.09-98 Ø5.1}
97.9% sRGB (Argyll 1.6.3 3D)
84.6% AdobeRGB 1998 (Argyll 1.6.3 3D)
96.6% AdobeRGB 1998 (Argyll 3D)
98% sRGB (Argyll 3D)
82.5% Display P3 (Argyll 3D)
Gamma: 2.14
CCT: 6858 K
| MSI GT76 Titan DT 10SGS AU Optronics B173ZAN03.3, IPS, 17.3", 3840x2160 | Asus ROG G703GXR AU Optronics B173HAN04.0 (AUO409D), IPS, 17.3", 1920x1080 | Alienware Area-51m i9-9900K RTX 2080 LG Philips 173WFG, IPS, 17.3", 1920x1080 | Asus Strix Scar 17 G732LXS LQ173M1JW03 (SHP14DC), IPS, 17.3", 1920x1080 | SCHENKER XMG Pro 17 PB71RD-G AU Optronics B173HAN04.0 (AUO409D), IPS, 17.3", 1920x1080 | MSI GE75 9SG Chi Mei N173HCE-G33, AHVA, 17.3", 1920x1080 | MSI GT76 Titan DT 9SG Chi Mei N173HCE-G33 (CMN175C), IPS, 17.3", 1920x1080 | |
|---|---|---|---|---|---|---|---|
| Display | -21% | -17% | -13% | -22% | -22% | -21% | |
| Display P3 Coverage | 82.5 | 63.2 -23% | 66.3 -20% | 71 -14% | 62.8 -24% | 61.5 -25% | 62.3 -24% |
| sRGB Coverage | 98 | 92 -6% | 96.9 -1% | 99 1% | 89.8 -8% | 92 -6% | 93.4 -5% |
| AdobeRGB 1998 Coverage | 96.6 | 64.7 -33% | 66.5 -31% | 71.6 -26% | 64.2 -34% | 63.5 -34% | 64.3 -33% |
| Response Times | 31% | 25% | 52% | 13% | 56% | 40% | |
| Response Time Grey 50% / Grey 80% * | 23.2 ? | 6.4 ? 72% | 13.2 ? 43% | 5.8 ? 75% | 16.8 ? 28% | 7.2 ? 69% | 8 ? 66% |
| Response Time Black / White * | 11.6 ? | 12.8 ? -10% | 10.8 ? 7% | 8.4 ? 28% | 12 ? -3% | 6.6 ? 43% | 10 ? 14% |
| PWM Frequency | 26040 ? | 26040 ? | |||||
| Screen | -19% | -14% | -14% | -21% | 16% | 9% | |
| Brightness middle | 419.5 | 290 -31% | 335.2 -20% | 310 -26% | 274 -35% | 400.7 -4% | 396 -6% |
| Brightness | 413 | 281 -32% | 297 -28% | 311 -25% | 273 -34% | 372 -10% | 373 -10% |
| Brightness Distribution | 93 | 91 -2% | 82 -12% | 82 -12% | 95 2% | 89 -4% | 89 -4% |
| Black Level * | 0.4 | 0.2 50% | 0.66 -65% | 0.41 -3% | 0.26 35% | 0.34 15% | 0.33 17% |
| Contrast | 1049 | 1450 38% | 508 -52% | 756 -28% | 1054 0% | 1179 12% | 1200 14% |
| Colorchecker dE 2000 * | 3.4 | 4.77 -40% | 2.02 41% | 2.41 29% | 4.62 -36% | 1.33 61% | 2.04 40% |
| Colorchecker dE 2000 max. * | 7.4 | 9.08 -23% | 7.23 2% | 8.59 -16% | 7.66 -4% | 3.51 53% | 3.85 48% |
| Colorchecker dE 2000 calibrated * | 3.28 | 1.46 55% | 1.17 64% | 1.13 66% | 1.93 41% | 1.39 58% | 0.82 75% |
| Greyscale dE 2000 * | 2 | 5.83 -192% | 3.2 -60% | 4.3 -115% | 5.3 -165% | 1.3 35% | 2.83 -42% |
| Gamma | 2.14 103% | 2.47 89% | 2.16 102% | 2.149 102% | 2.34 94% | 2.24 98% | 2.49 88% |
| CCT | 6858 95% | 8076 80% | 6746 96% | 7059 92% | 7619 85% | 6735 97% | 7113 91% |
| Color Space (Percent of AdobeRGB 1998) | 84.6 | 59 -30% | 61.3 -28% | 72 -15% | 58 -31% | 58.2 -31% | 59 -30% |
| Color Space (Percent of sRGB) | 97.9 | 92 -6% | 96.9 -1% | 94 -4% | 90 -8% | 92.1 -6% | 94 -4% |
| Total Average (Program / Settings) | -3% /
-13% | -2% /
-10% | 8% /
-5% | -10% /
-17% | 17% /
14% | 9% /
7% |
* ... smaller is better
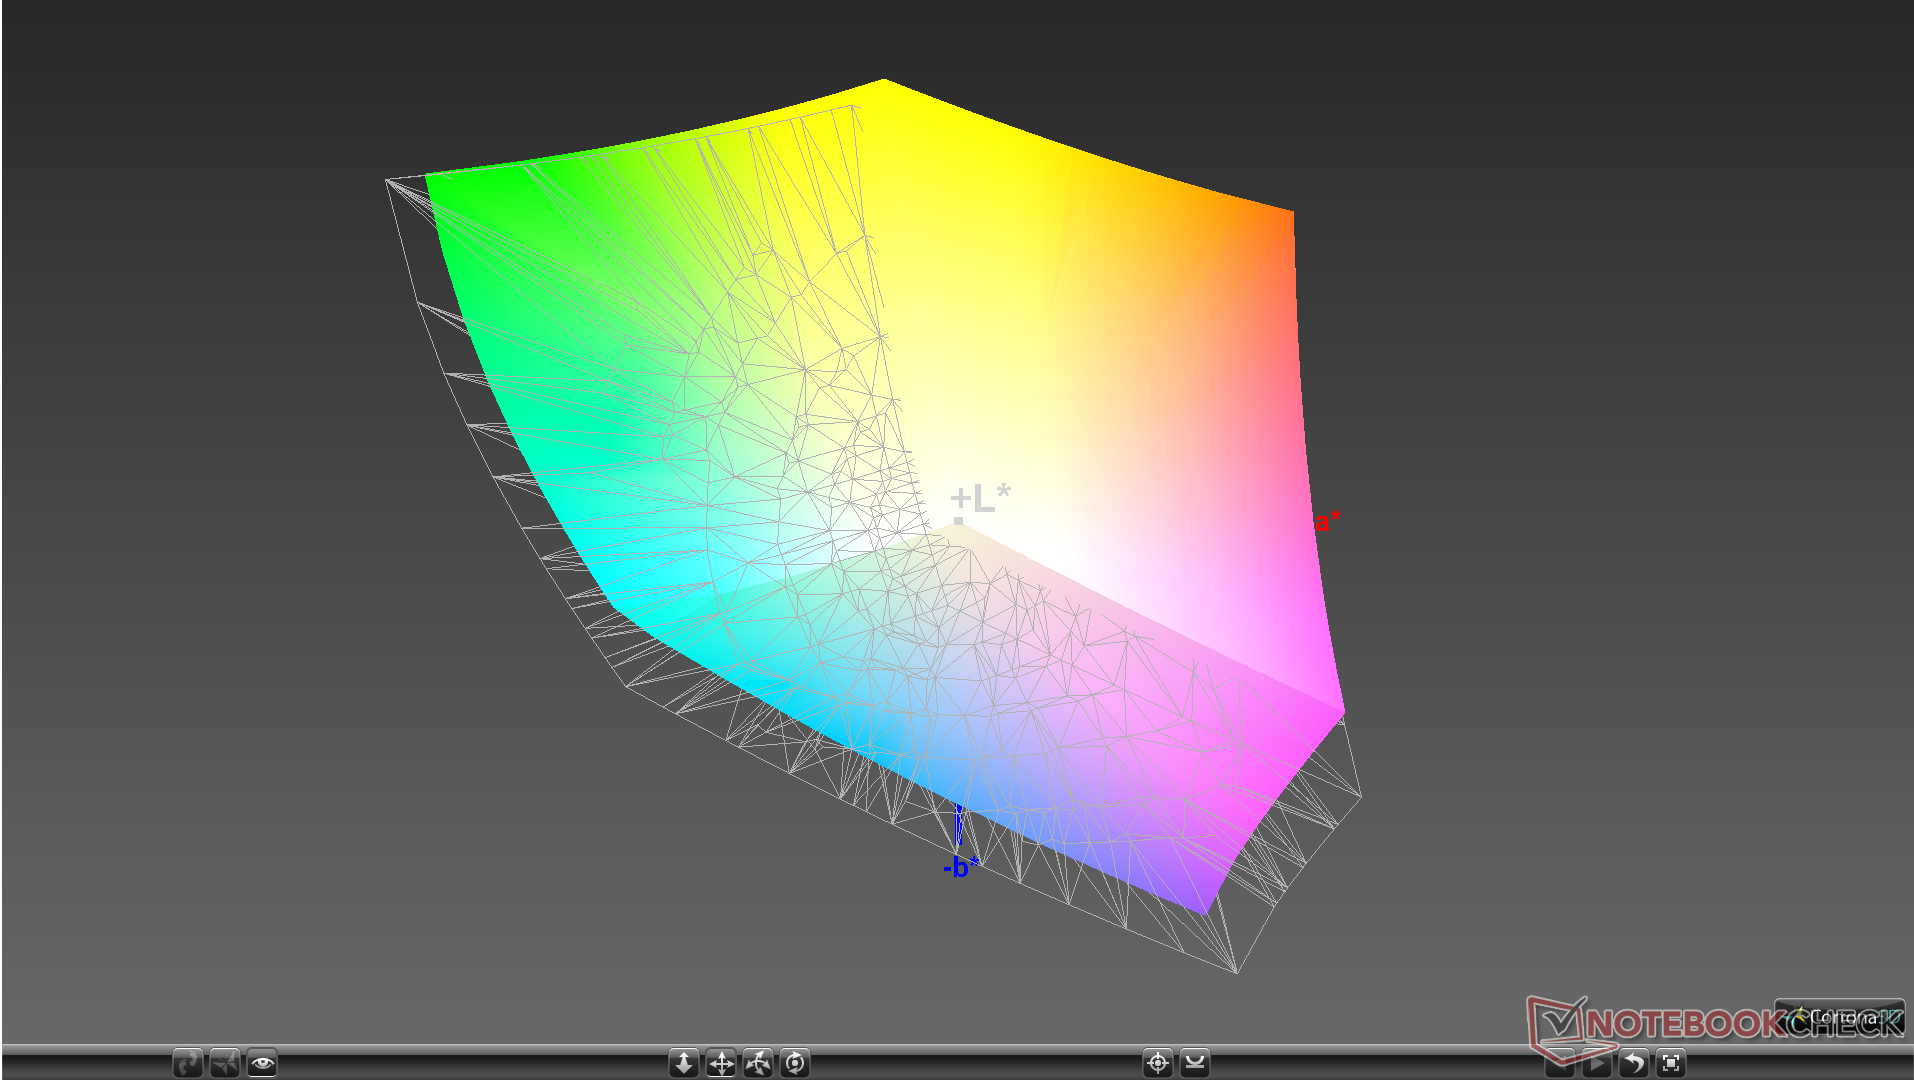
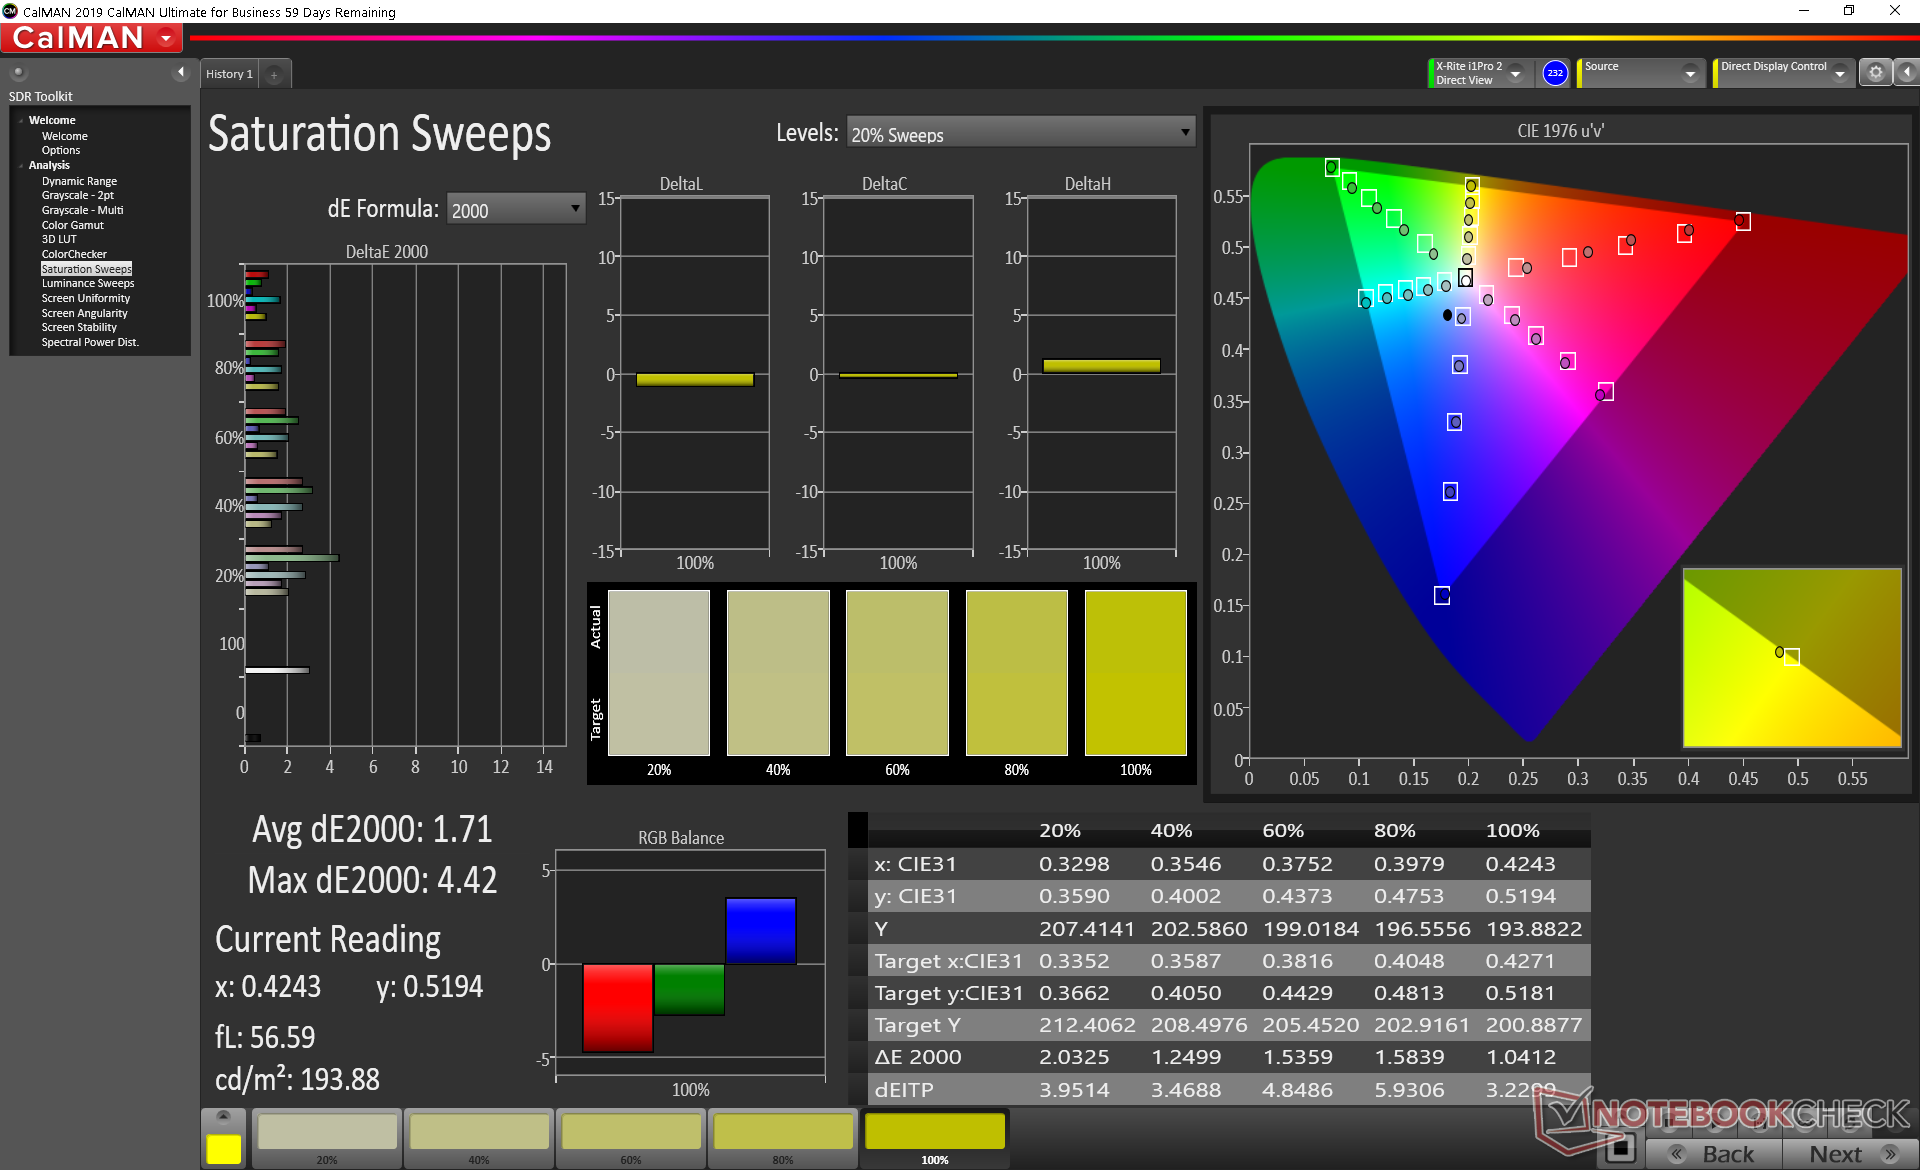
Color space is wide at approximately 85 percent of the 3D AdobeRGB standard compared to 59 percent on last year's 1080p option. MSI True Color allows for quick and easy color adjustments and profiles.
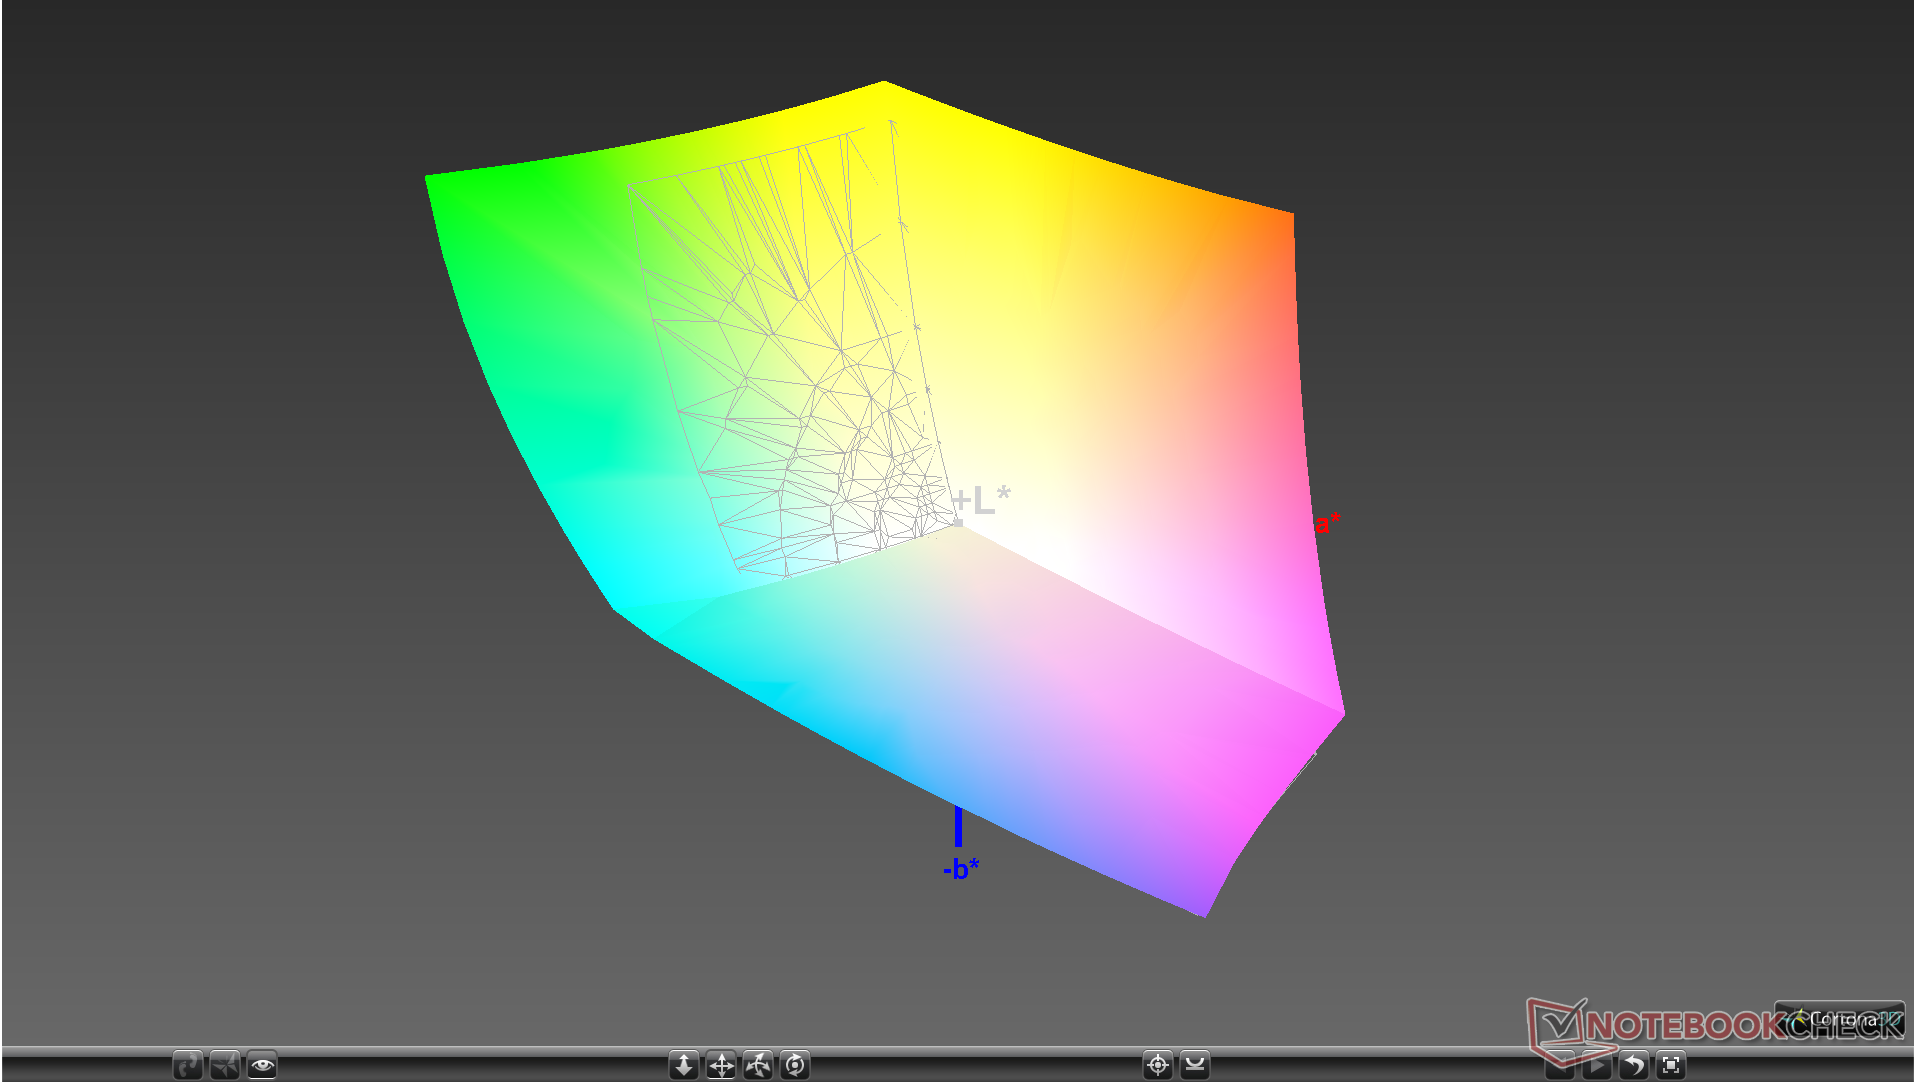
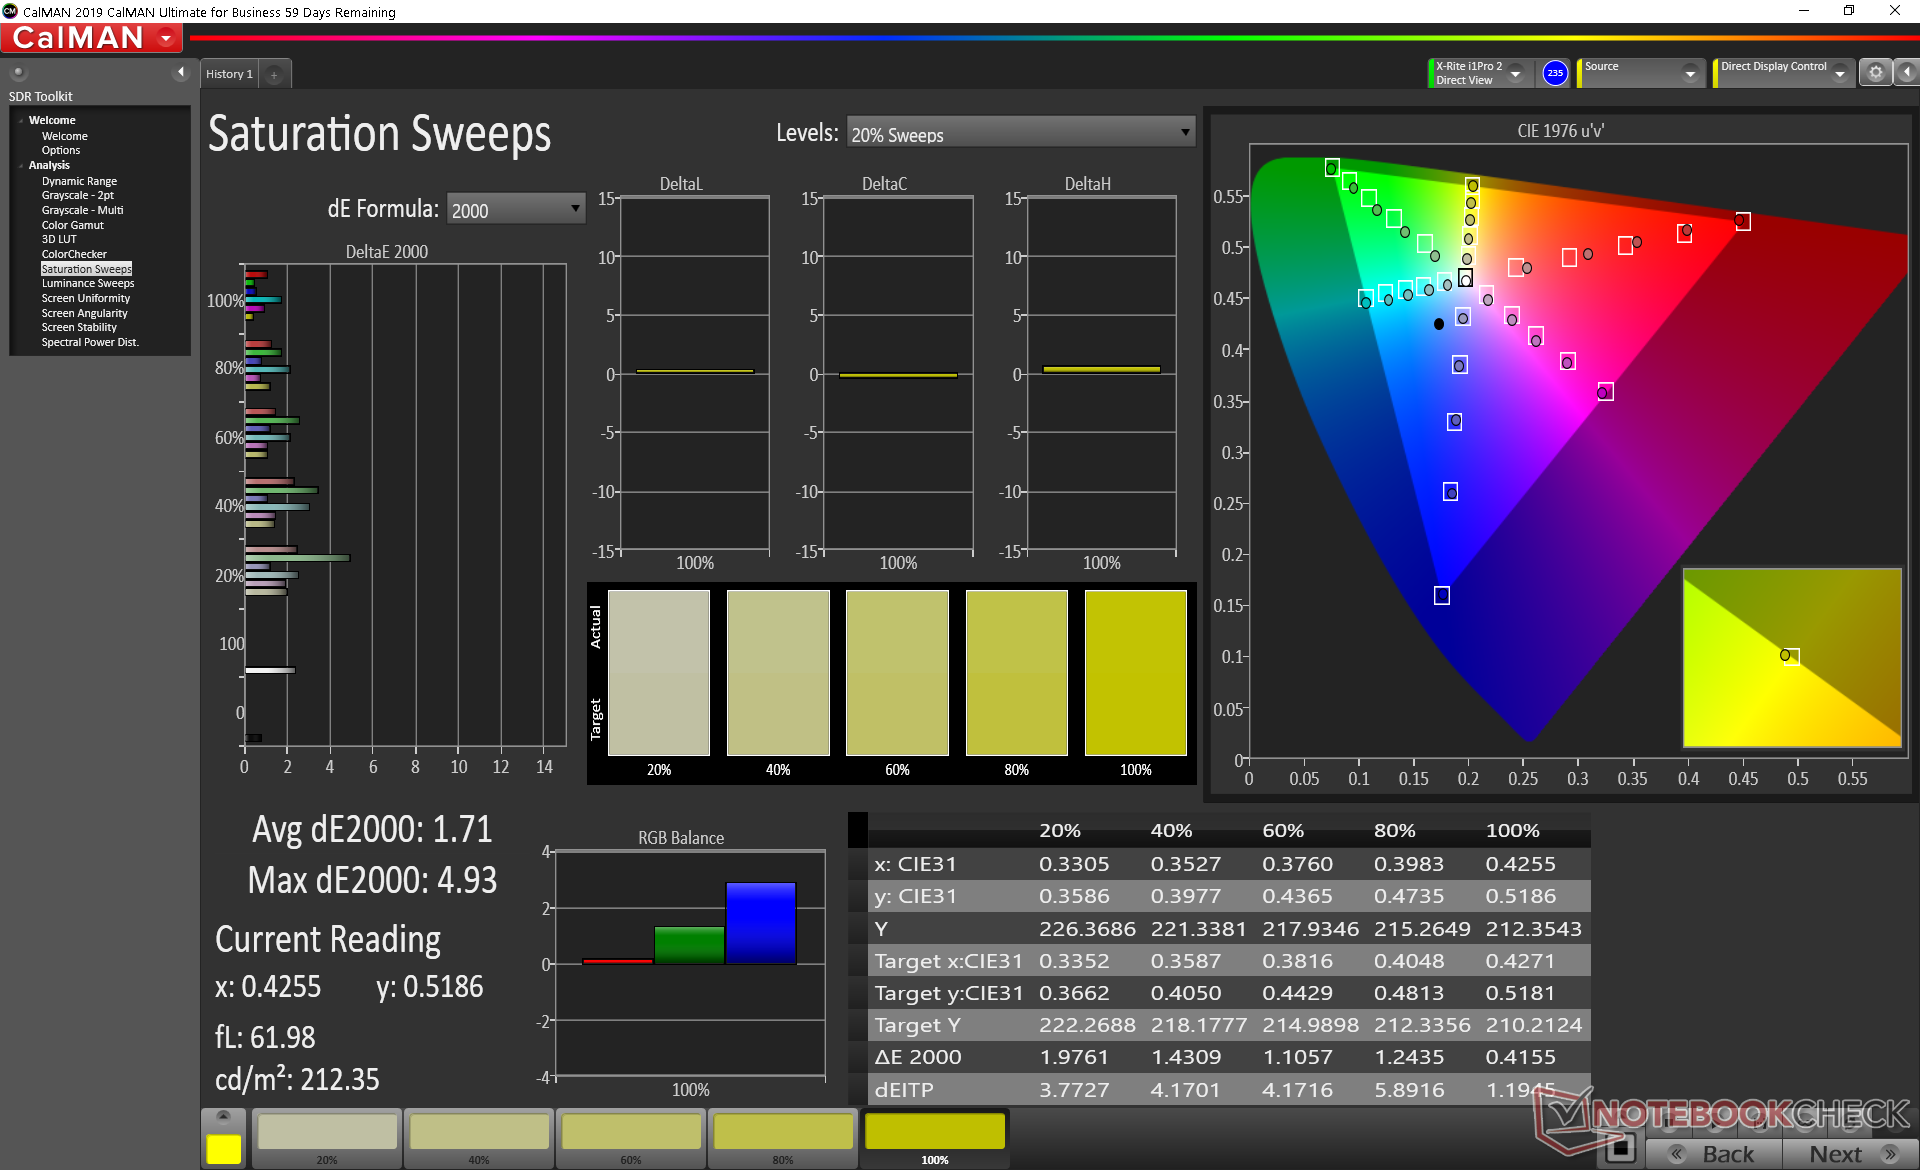
X-Rite colorimeter measurements reveal a well-calibrated display out of the box with average grayscale and color deltaE values of just 2 and 3.2, respectively. Calibrating the panel even further ourselves would not result in any notable improvements.

Display Response Times
| ↔ Response Time Black to White | ||
|---|---|---|
| 11.6 ms ... rise ↗ and fall ↘ combined | ↗ 6.4 ms rise | 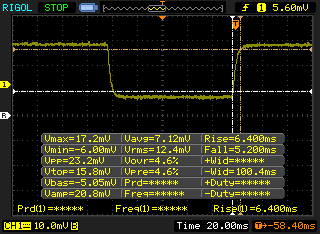 |
| ↘ 5.2 ms fall | ||
| The screen shows good response rates in our tests, but may be too slow for competitive gamers. In comparison, all tested devices range from 0.1 (minimum) to 240 (maximum) ms. » 29 % of all devices are better. This means that the measured response time is better than the average of all tested devices (20.4 ms). | ||
| ↔ Response Time 50% Grey to 80% Grey | ||
| 23.2 ms ... rise ↗ and fall ↘ combined | ↗ 12.4 ms rise | 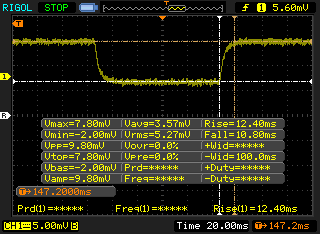 |
| ↘ 10.8 ms fall | ||
| The screen shows good response rates in our tests, but may be too slow for competitive gamers. In comparison, all tested devices range from 0.165 (minimum) to 636 (maximum) ms. » 32 % of all devices are better. This means that the measured response time is better than the average of all tested devices (32 ms). | ||
Screen Flickering / PWM (Pulse-Width Modulation)
| Screen flickering / PWM not detected | 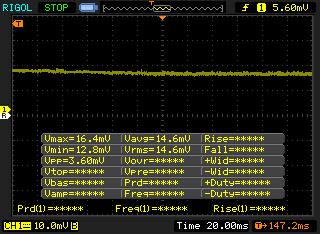 | ||
In comparison: 53 % of all tested devices do not use PWM to dim the display. If PWM was detected, an average of 8291 (minimum: 5 - maximum: 343500) Hz was measured. | |||

Performance
Processor
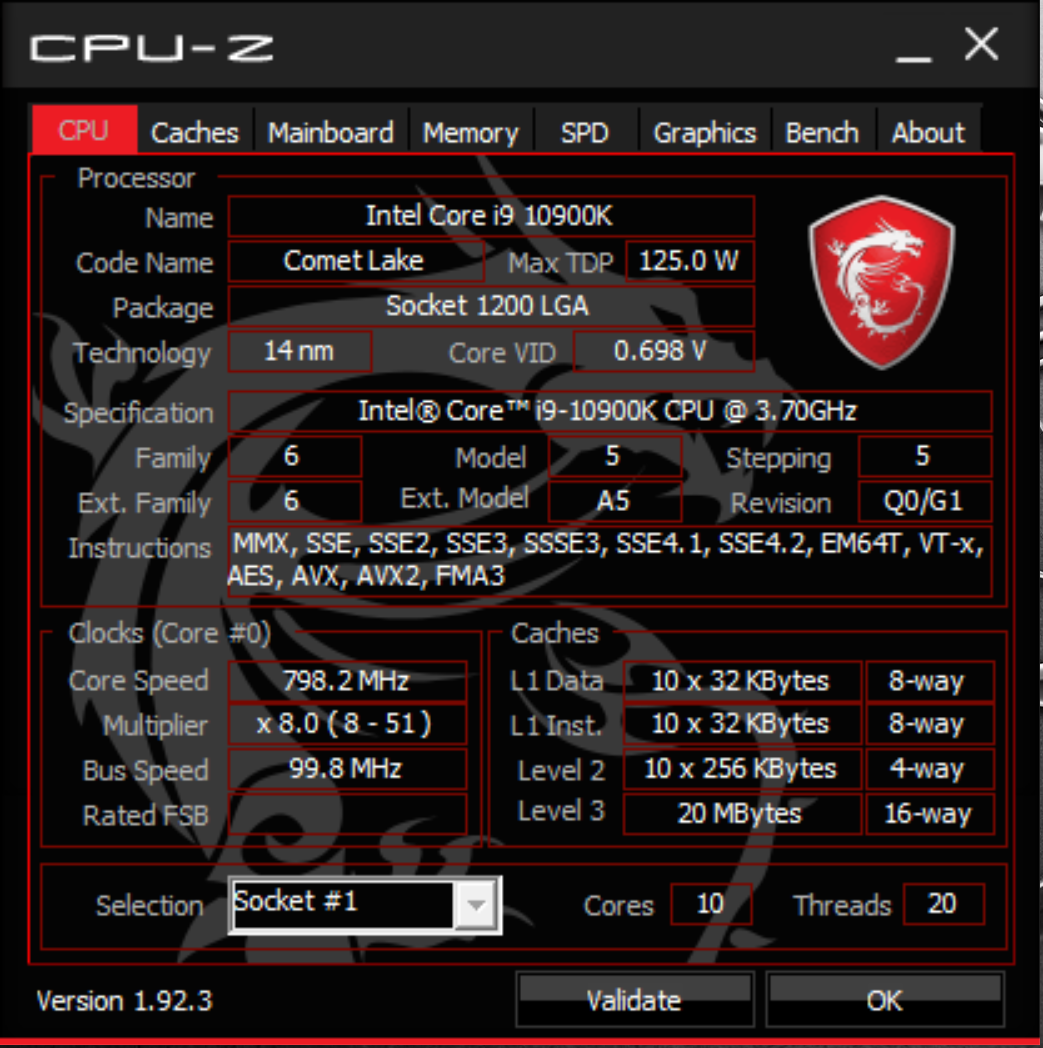
When compared to our desktop Core i9-10900K reference, CPU performance in the GT76 is only about 5 to 6 percent slower. The additional physical cores (10 vs. 8) grant roughly 25 percent faster multi-thread performance than the Core i9-9900K on last year's GT76 while single-core performance remains about the same. Performance sustainability is excellent with no major performance dips over time.
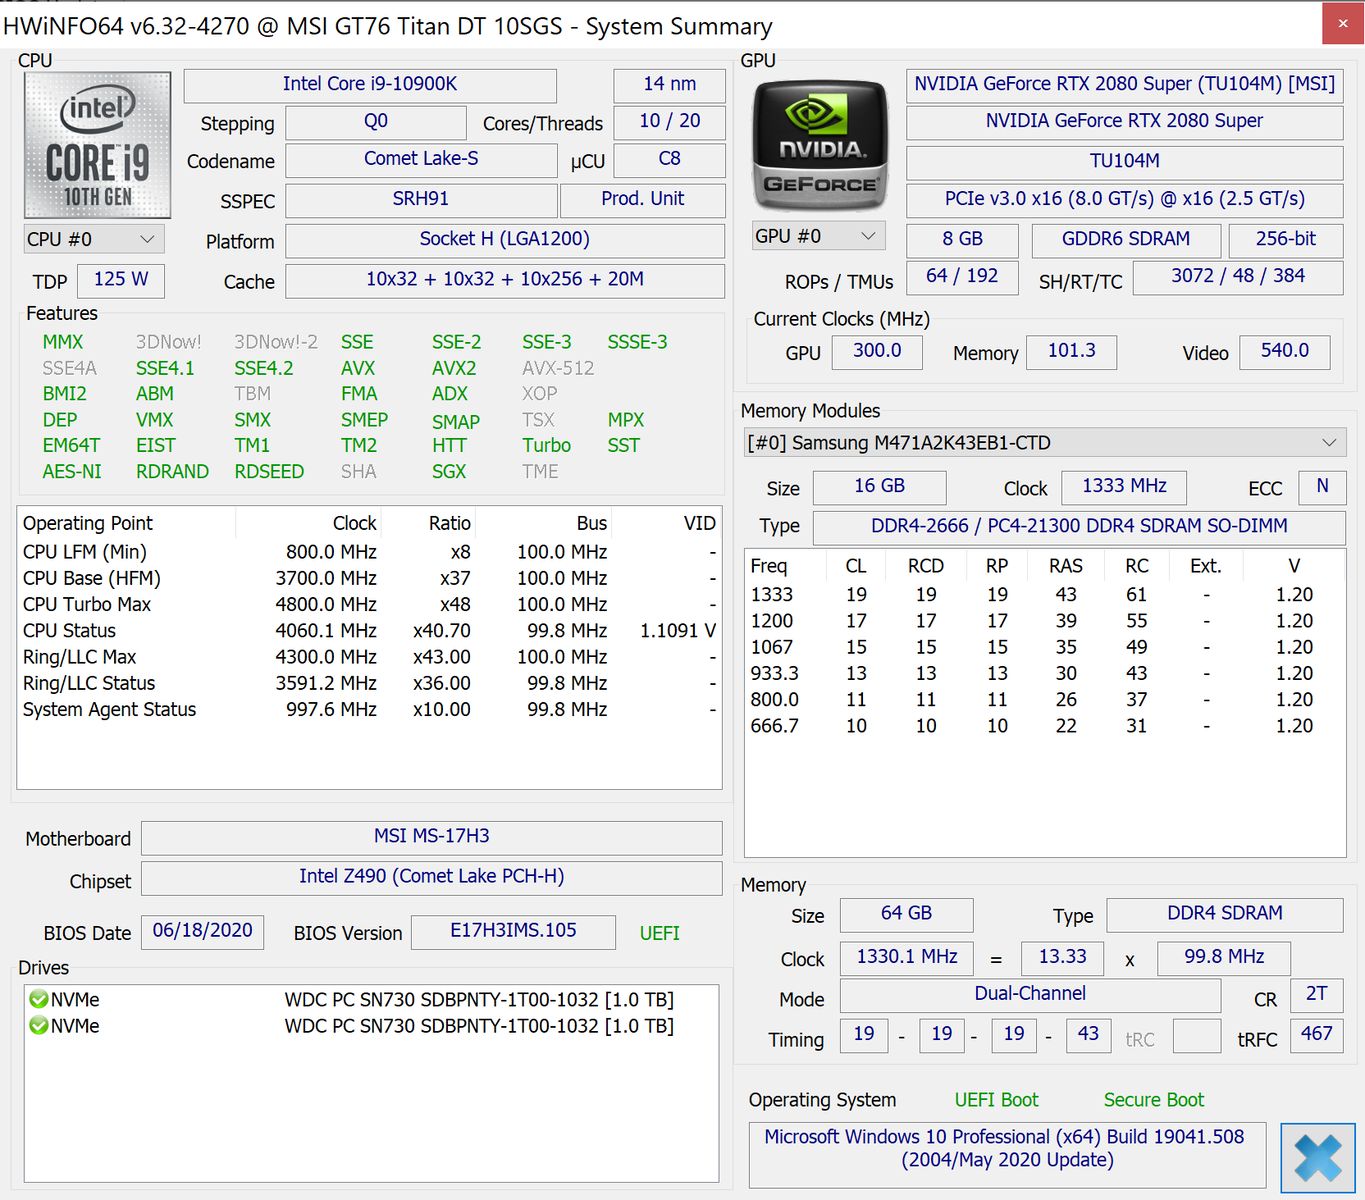
See our dedicated page on the Core i9-10900K for more technical information and benchmarks. Users can replace the CPU in the GT76 since it uses a standard FCLGA1200 socket, but the entire cooling solution must be removed first.
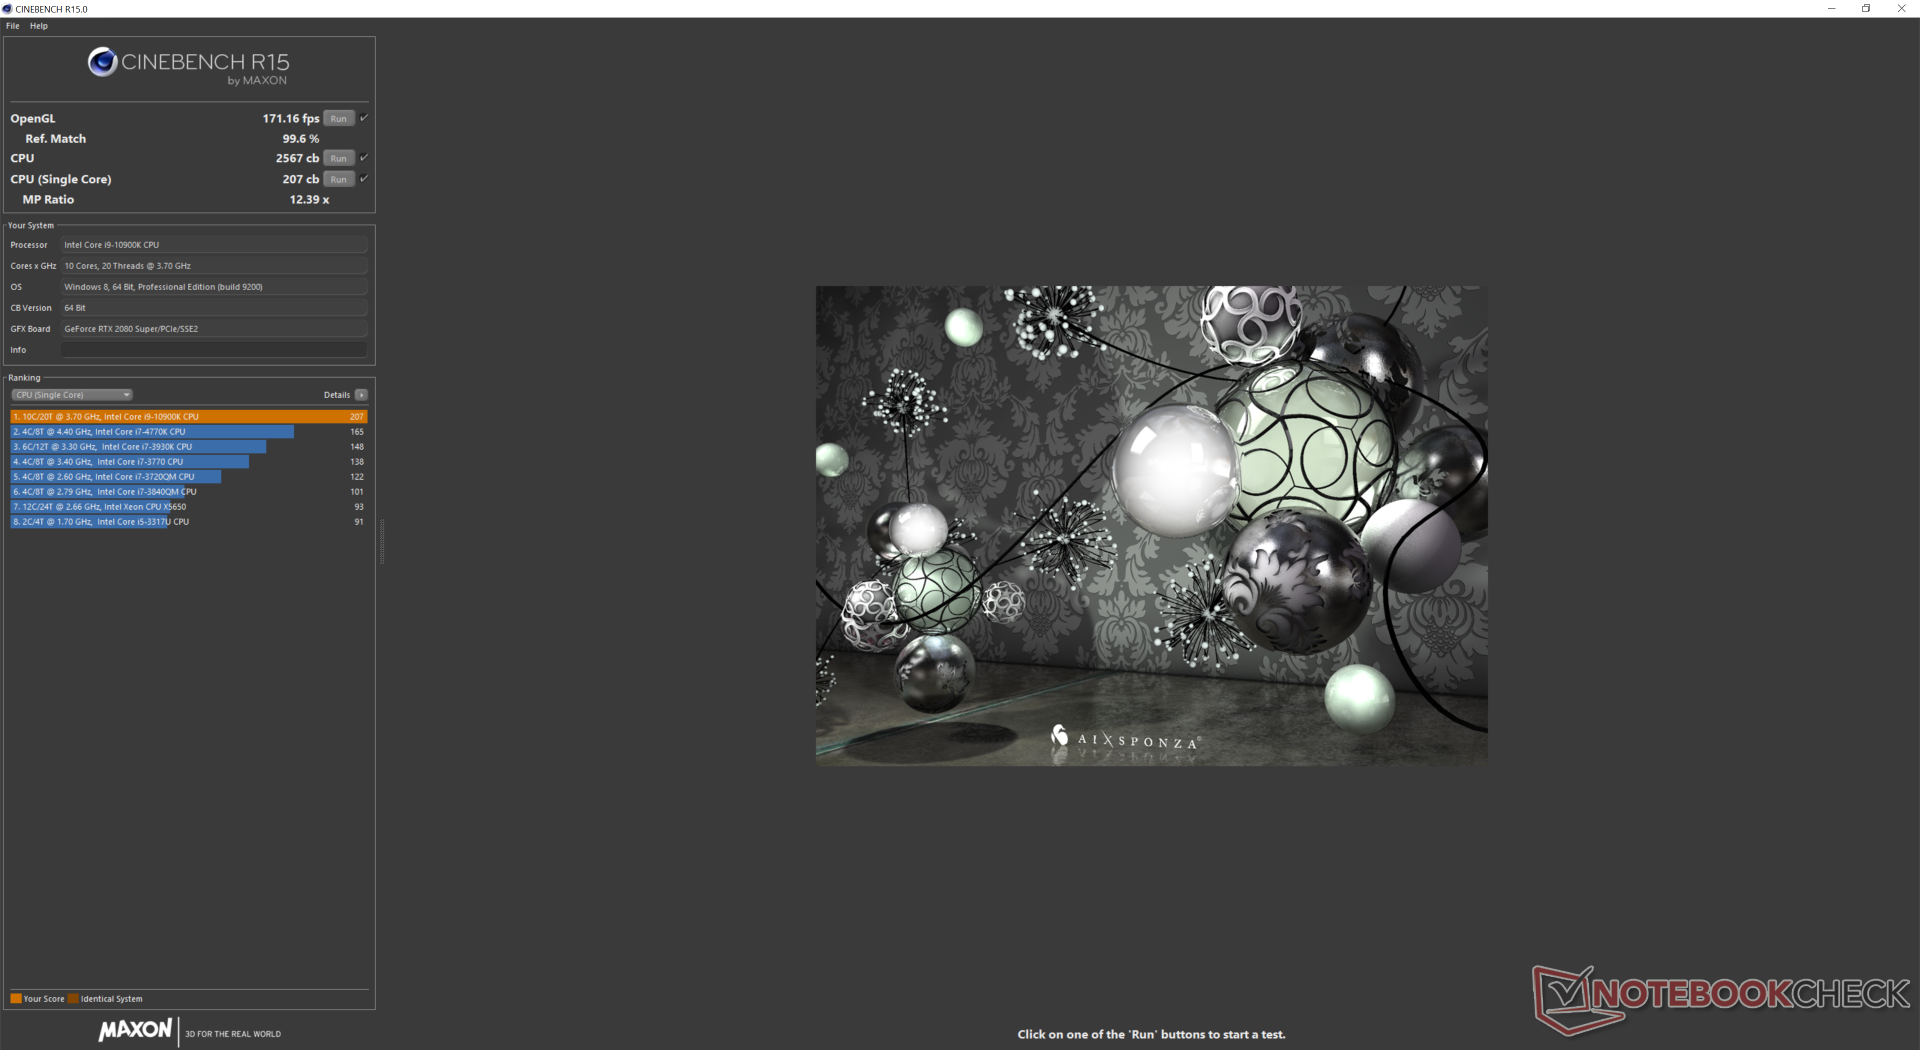
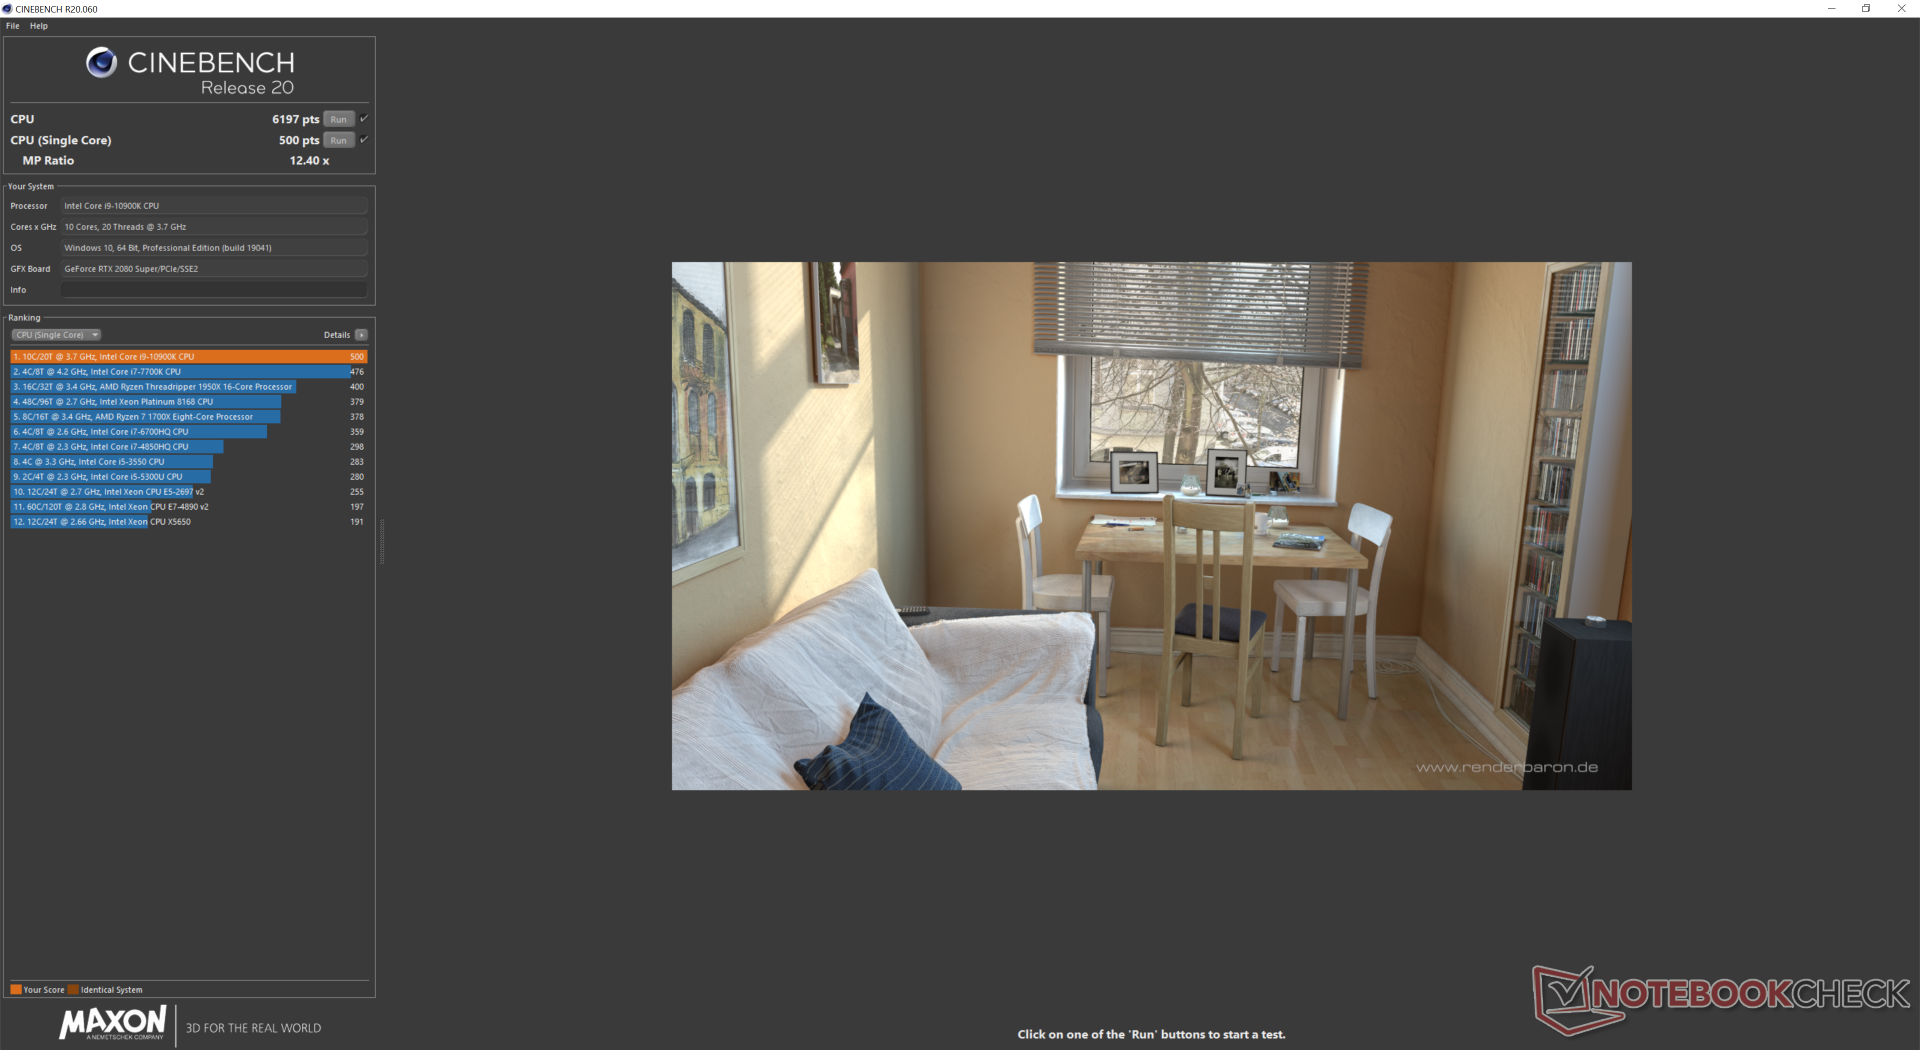
Cinebench R15: CPU Multi 64Bit | CPU Single 64Bit
Blender: v2.79 BMW27 CPU
7-Zip 18.03: 7z b 4 -mmt1 | 7z b 4
Geekbench 5.5: Single-Core | Multi-Core
HWBOT x265 Benchmark v2.2: 4k Preset
LibreOffice : 20 Documents To PDF
R Benchmark 2.5: Overall mean
| Cinebench R20 / CPU (Multi Core) | |
| KFA2 GeForce GTX 1650 EX One Click Plus | |
| MSI GT76 Titan DT 10SGS | |
| Average Intel Core i9-10900K (5825 - 6381, n=3) | |
| MSI GT76 Titan DT 9SG | |
| Eluktronics RP-17 | |
| Alienware m17 R3 P45E | |
| Eurocom Sky X4C i9-9900KS | |
| Asus Zephyrus G14 GA401IV | |
| Alienware m17 R2 P41E | |
| MSI GE65 Raider 9SF-049US | |
| Gigabyte Aero 15-Y9 | |
| Cinebench R20 / CPU (Single Core) | |
| Average Intel Core i9-10900K (493 - 532, n=3) | |
| MSI GT76 Titan DT 9SG | |
| Eurocom Sky X4C i9-9900KS | |
| KFA2 GeForce GTX 1650 EX One Click Plus | |
| Asus Zephyrus G14 GA401IV | |
| MSI GT76 Titan DT 10SGS | |
| Eluktronics RP-17 | |
| Alienware m17 R2 P41E | |
| MSI GE65 Raider 9SF-049US | |
| Alienware m17 R3 P45E | |
| Gigabyte Aero 15-Y9 | |
| Cinebench R15 / CPU Multi 64Bit | |
| KFA2 GeForce GTX 1650 EX One Click Plus | |
| Average Intel Core i9-10900K (2513 - 2620, n=3) | |
| MSI GT76 Titan DT 10SGS | |
| MSI GT76 Titan DT 9SG | |
| Eurocom Sky X4C i9-9900KS | |
| Eluktronics RP-17 | |
| Asus Zephyrus G14 GA401IV | |
| Alienware m17 R3 P45E | |
| Alienware m17 R2 P41E | |
| MSI GE65 Raider 9SF-049US | |
| Gigabyte Aero 15-Y9 | |
| Cinebench R15 / CPU Single 64Bit | |
| Average Intel Core i9-10900K (206 - 224, n=3) | |
| Eurocom Sky X4C i9-9900KS | |
| MSI GT76 Titan DT 9SG | |
| Alienware m17 R3 P45E | |
| MSI GT76 Titan DT 10SGS | |
| KFA2 GeForce GTX 1650 EX One Click Plus | |
| MSI GE65 Raider 9SF-049US | |
| Alienware m17 R2 P41E | |
| Gigabyte Aero 15-Y9 | |
| Asus Zephyrus G14 GA401IV | |
| Eluktronics RP-17 | |
| Blender / v2.79 BMW27 CPU | |
| Asus Zephyrus G14 GA401IV | |
| Eluktronics RP-17 | |
| Eurocom Sky X4C i9-9900KS | |
| Alienware m17 R3 P45E | |
| MSI GT76 Titan DT 10SGS | |
| Average Intel Core i9-10900K (167.3 - 190, n=3) | |
| KFA2 GeForce GTX 1650 EX One Click Plus | |
| 7-Zip 18.03 / 7z b 4 -mmt1 | |
| Average Intel Core i9-10900K (5349 - 5954, n=3) | |
| Eurocom Sky X4C i9-9900KS | |
| Alienware m17 R3 P45E | |
| MSI GT76 Titan DT 10SGS | |
| KFA2 GeForce GTX 1650 EX One Click Plus | |
| Asus Zephyrus G14 GA401IV | |
| Eluktronics RP-17 | |
| 7-Zip 18.03 / 7z b 4 | |
| KFA2 GeForce GTX 1650 EX One Click Plus | |
| Average Intel Core i9-10900K (67252 - 70968, n=3) | |
| MSI GT76 Titan DT 10SGS | |
| Eurocom Sky X4C i9-9900KS | |
| Eluktronics RP-17 | |
| Asus Zephyrus G14 GA401IV | |
| Alienware m17 R3 P45E | |
| Geekbench 5.5 / Single-Core | |
| Average Intel Core i9-10900K (1336 - 1449, n=3) | |
| Eurocom Sky X4C i9-9900KS | |
| Alienware m17 R3 P45E | |
| MSI GT76 Titan DT 10SGS | |
| MSI GT76 Titan DT 9SG | |
| KFA2 GeForce GTX 1650 EX One Click Plus | |
| KFA2 GeForce GTX 1650 EX One Click Plus | |
| Asus Zephyrus G14 GA401IV | |
| Eluktronics RP-17 | |
| Geekbench 5.5 / Multi-Core | |
| Average Intel Core i9-10900K (10725 - 11414, n=3) | |
| KFA2 GeForce GTX 1650 EX One Click Plus | |
| KFA2 GeForce GTX 1650 EX One Click Plus | |
| MSI GT76 Titan DT 10SGS | |
| Eurocom Sky X4C i9-9900KS | |
| MSI GT76 Titan DT 9SG | |
| Alienware m17 R3 P45E | |
| Eluktronics RP-17 | |
| Asus Zephyrus G14 GA401IV | |
| HWBOT x265 Benchmark v2.2 / 4k Preset | |
| KFA2 GeForce GTX 1650 EX One Click Plus | |
| MSI GT76 Titan DT 10SGS | |
| Average Intel Core i9-10900K (18.2 - 21, n=3) | |
| Eurocom Sky X4C i9-9900KS | |
| Alienware m17 R3 P45E | |
| Eluktronics RP-17 | |
| Asus Zephyrus G14 GA401IV | |
| LibreOffice / 20 Documents To PDF | |
| Eluktronics RP-17 | |
| KFA2 GeForce GTX 1650 EX One Click Plus | |
| Average Intel Core i9-10900K (46.2 - 76, n=3) | |
| Alienware m17 R3 P45E | |
| MSI GT76 Titan DT 10SGS | |
| R Benchmark 2.5 / Overall mean | |
| Eluktronics RP-17 | |
| MSI GT76 Titan DT 10SGS | |
| Alienware m17 R3 P45E | |
| Average Intel Core i9-10900K (0.528 - 0.567, n=3) | |
| KFA2 GeForce GTX 1650 EX One Click Plus | |
* ... smaller is better
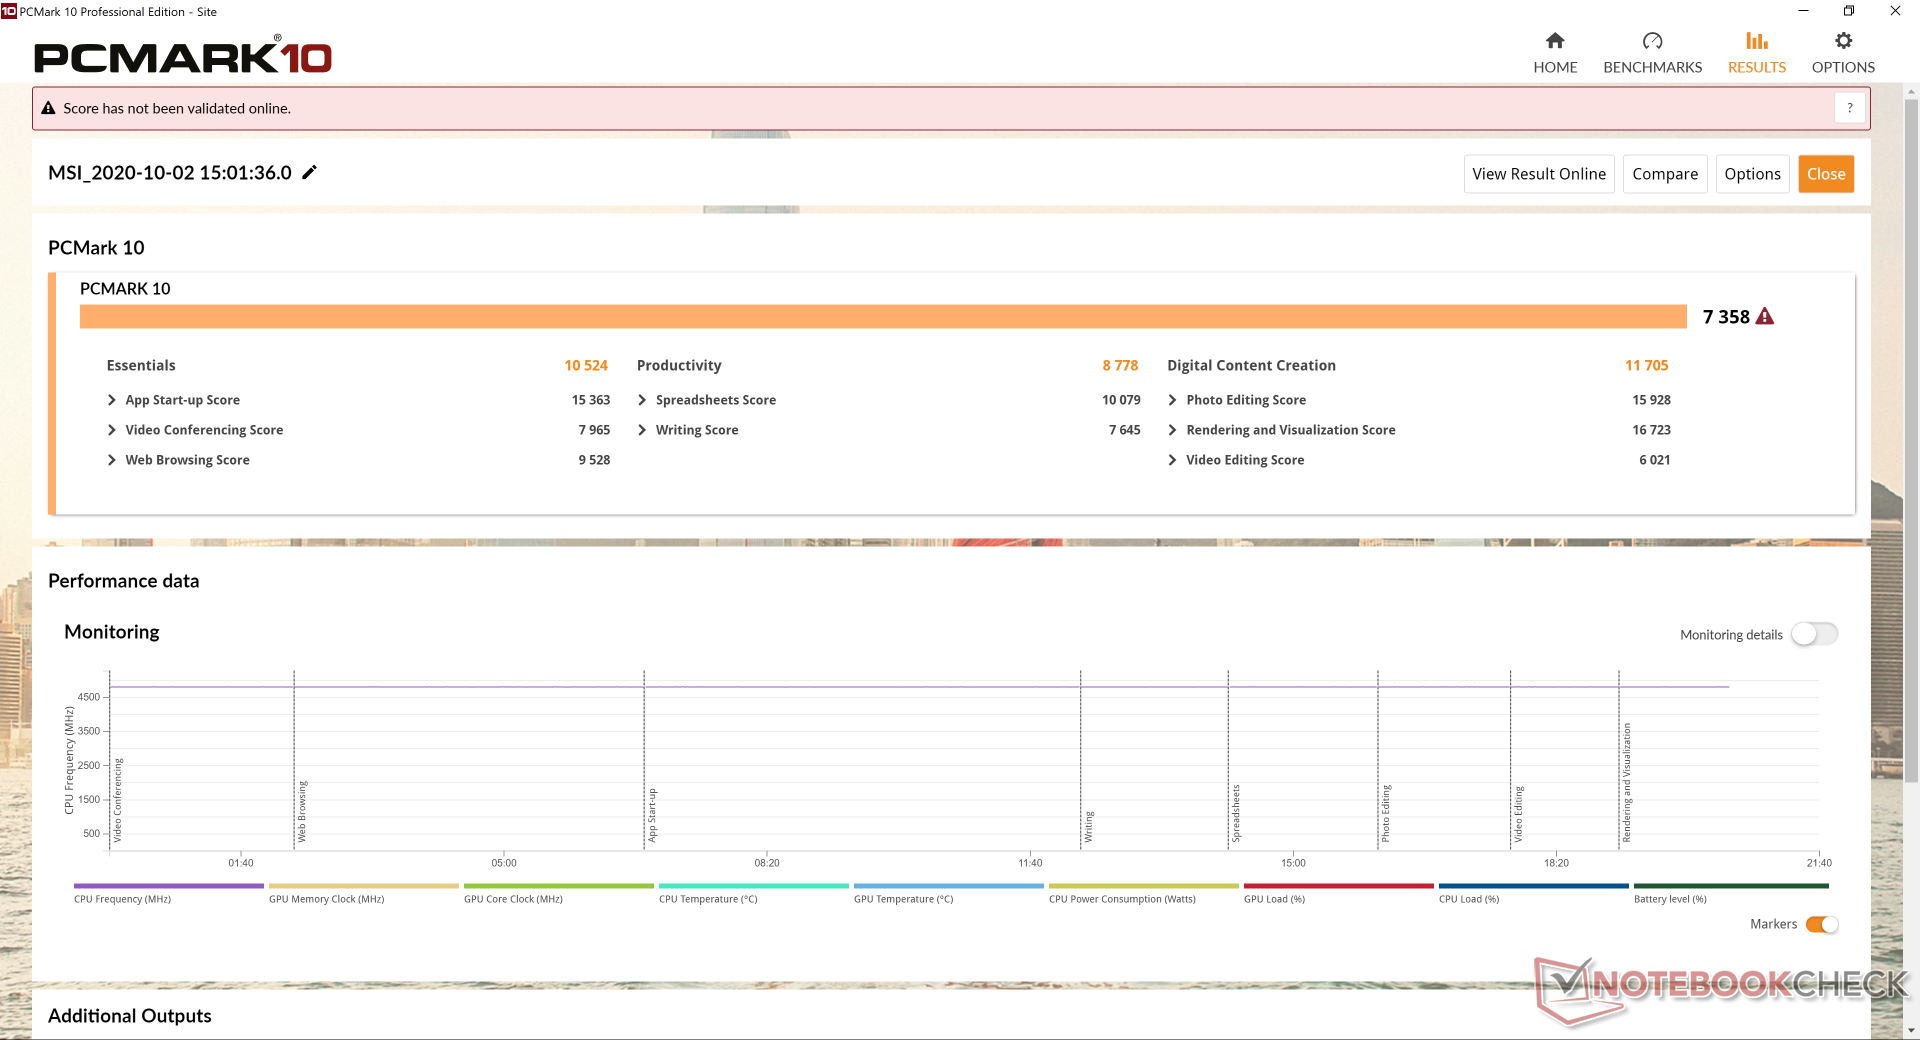
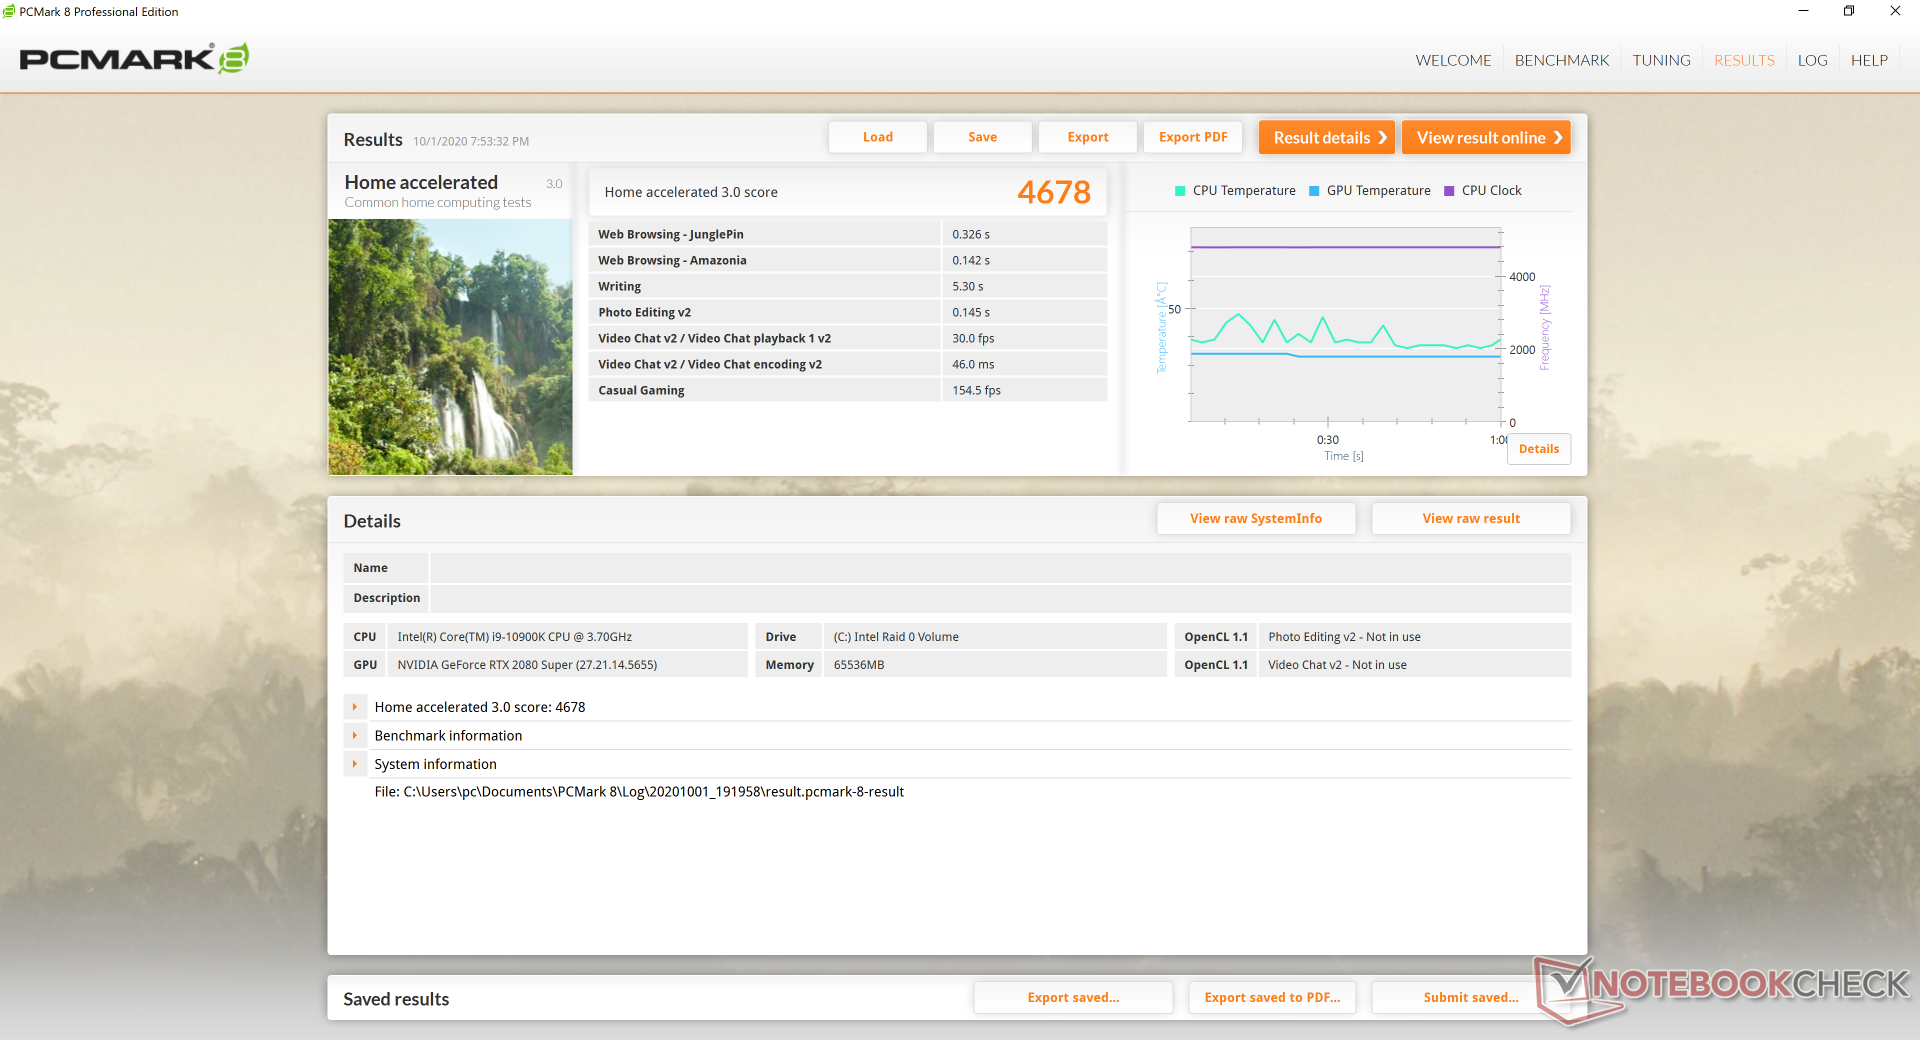
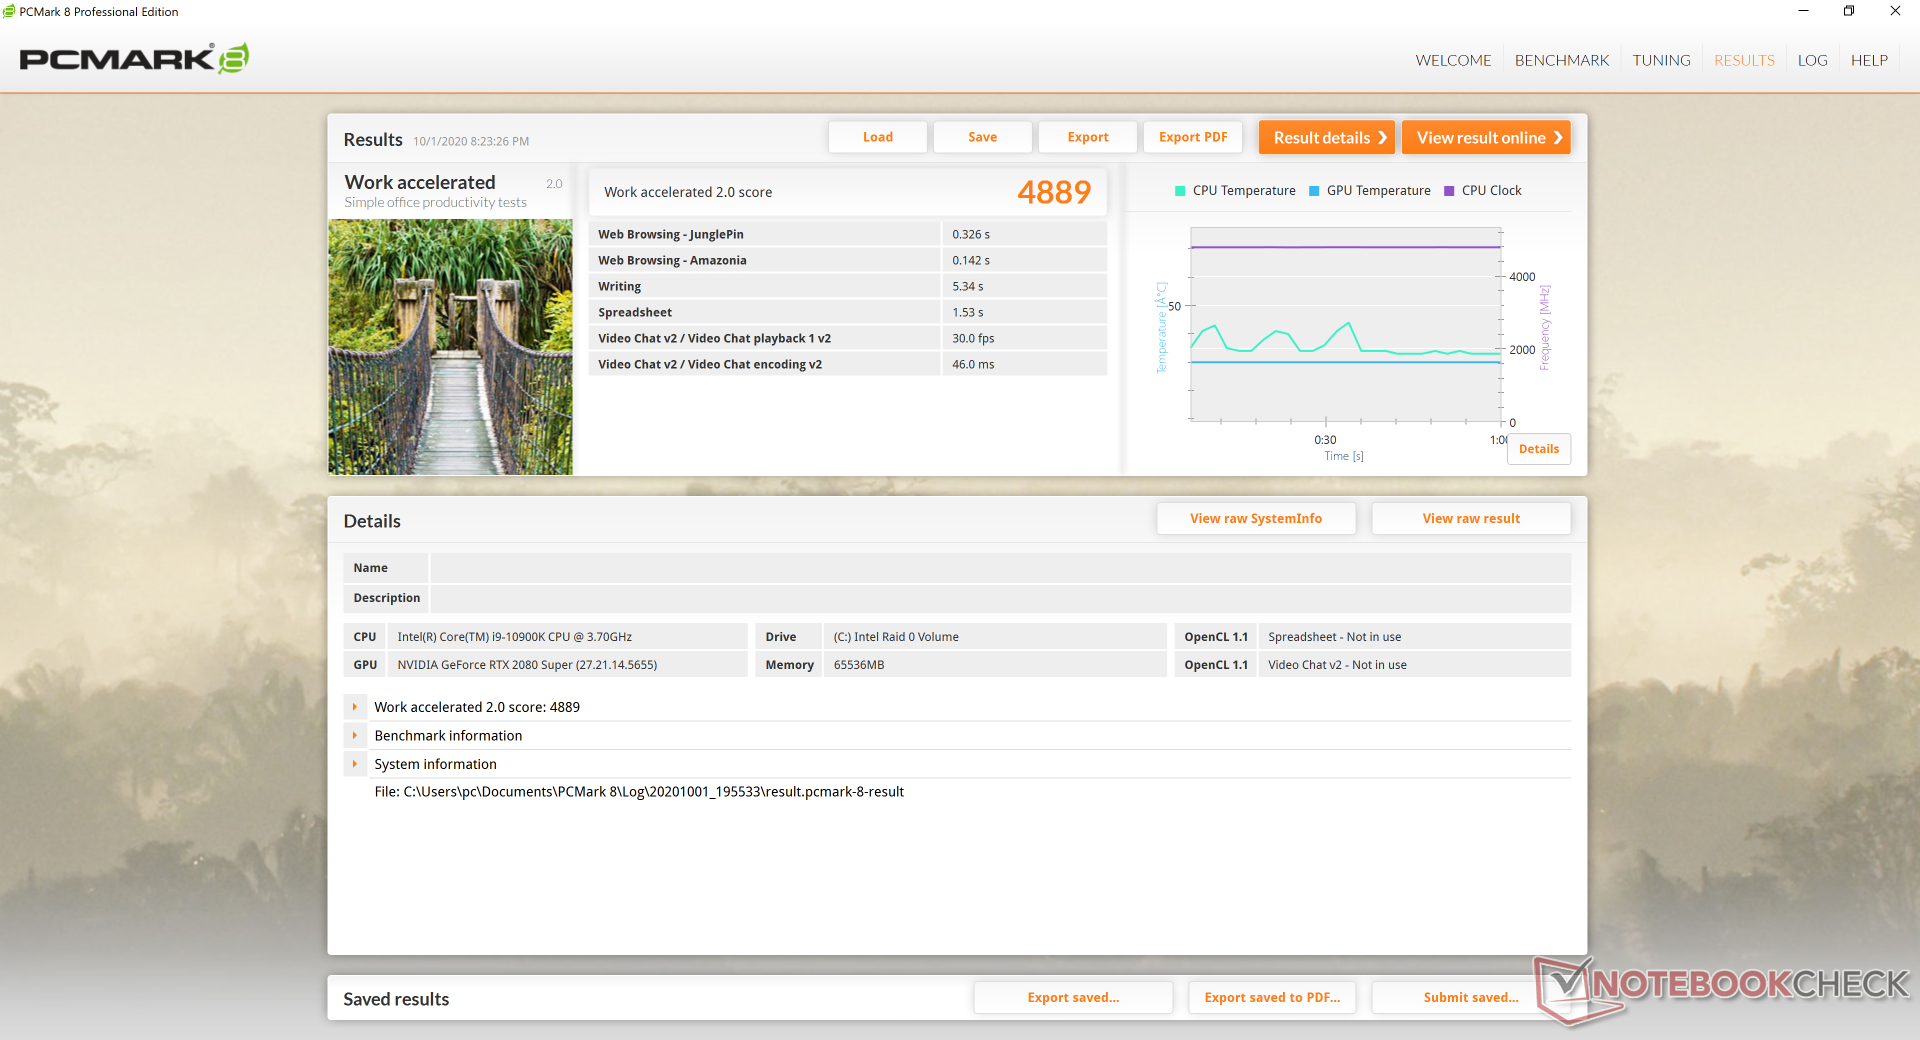
System Performance
PCMark results are some of the highest we've recorded on any gaming laptop with scores that are consistently above both the GT76 9SG and Alienware Area-51m. Nonetheless, the differences are mostly marginal.
| PCMark 8 | |
| Home Score Accelerated v2 | |
| Average of class Gaming (5564 - 5883, n=4, last 2 years) | |
| Alienware Area-51m i9-9900K RTX 2080 | |
| MSI GT76 Titan DT 10SGS | |
| MSI GE75 9SG | |
| Work Score Accelerated v2 | |
| Alienware Area-51m i9-9900K RTX 2080 | |
| MSI GE75 9SG | |
| Average of class Gaming (3012 - 6177, n=3, last 2 years) | |
| MSI GT76 Titan DT 10SGS | |
| PCMark 8 Home Score Accelerated v2 | 4678 points | |
| PCMark 8 Work Score Accelerated v2 | 4889 points | |
| PCMark 10 Score | 7358 points | |
Help | ||
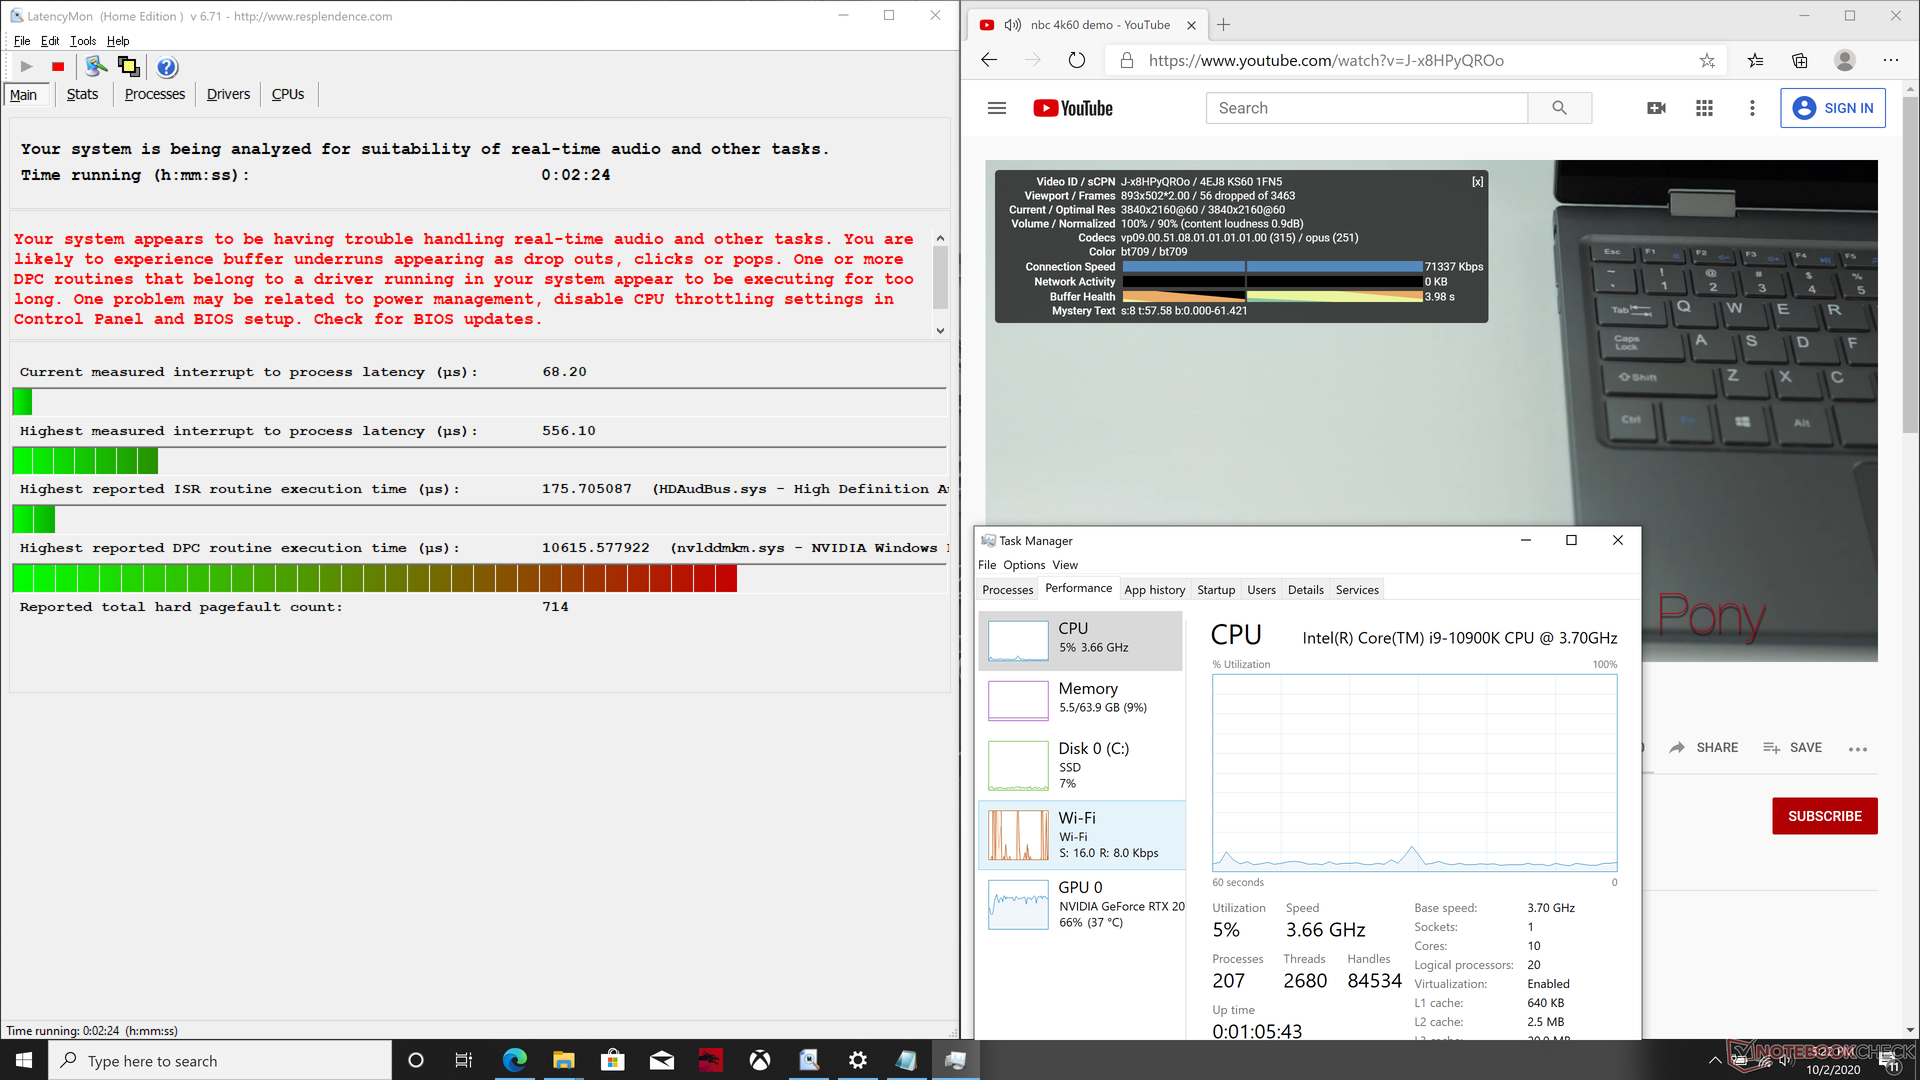
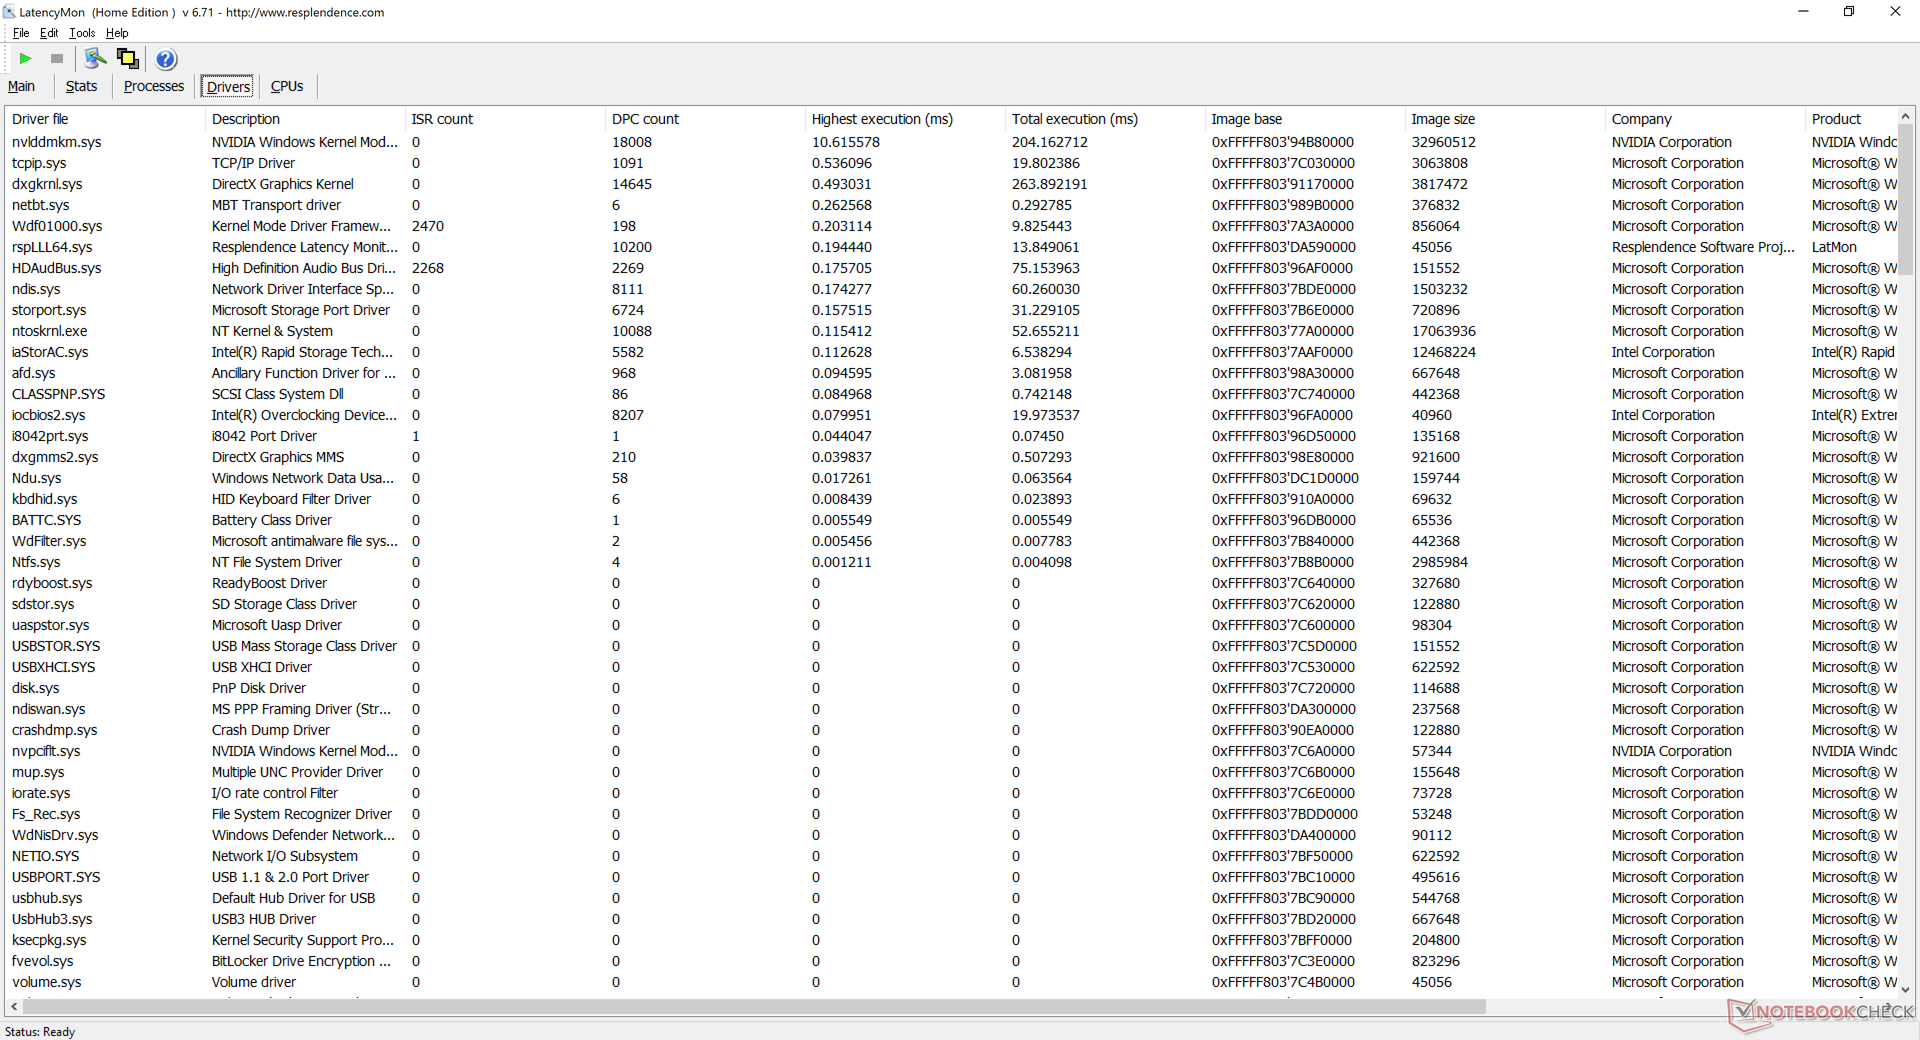
DPC Latency
LatencyMon shows DPC latency issues related to nvlddmkm.sys when opening multiple tabs on our homepage. 4K UHD video playback at 60 FPS isn't perfect either with 56 dropped frames during our minute-long YouTube test. These results are disappointing considering the hardware involved.
| DPC Latencies / LatencyMon - interrupt to process latency (max), Web, Youtube, Prime95 | |
| MSI GT76 Titan DT 10SGS | |
| Asus Strix Scar 17 G732LXS | |
| Asus Zephyrus G14 GA401IV | |
| Eluktronics RP-17 | |
| Alienware m17 R3 P45E | |
* ... smaller is better
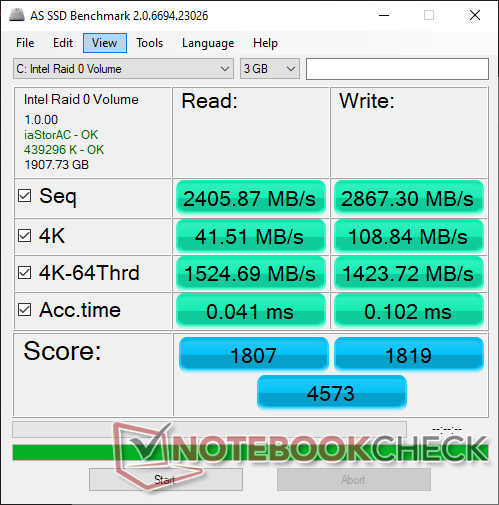
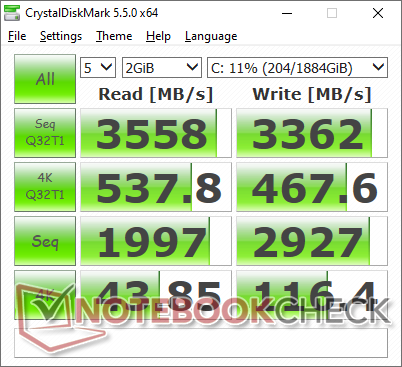
Storage Devices
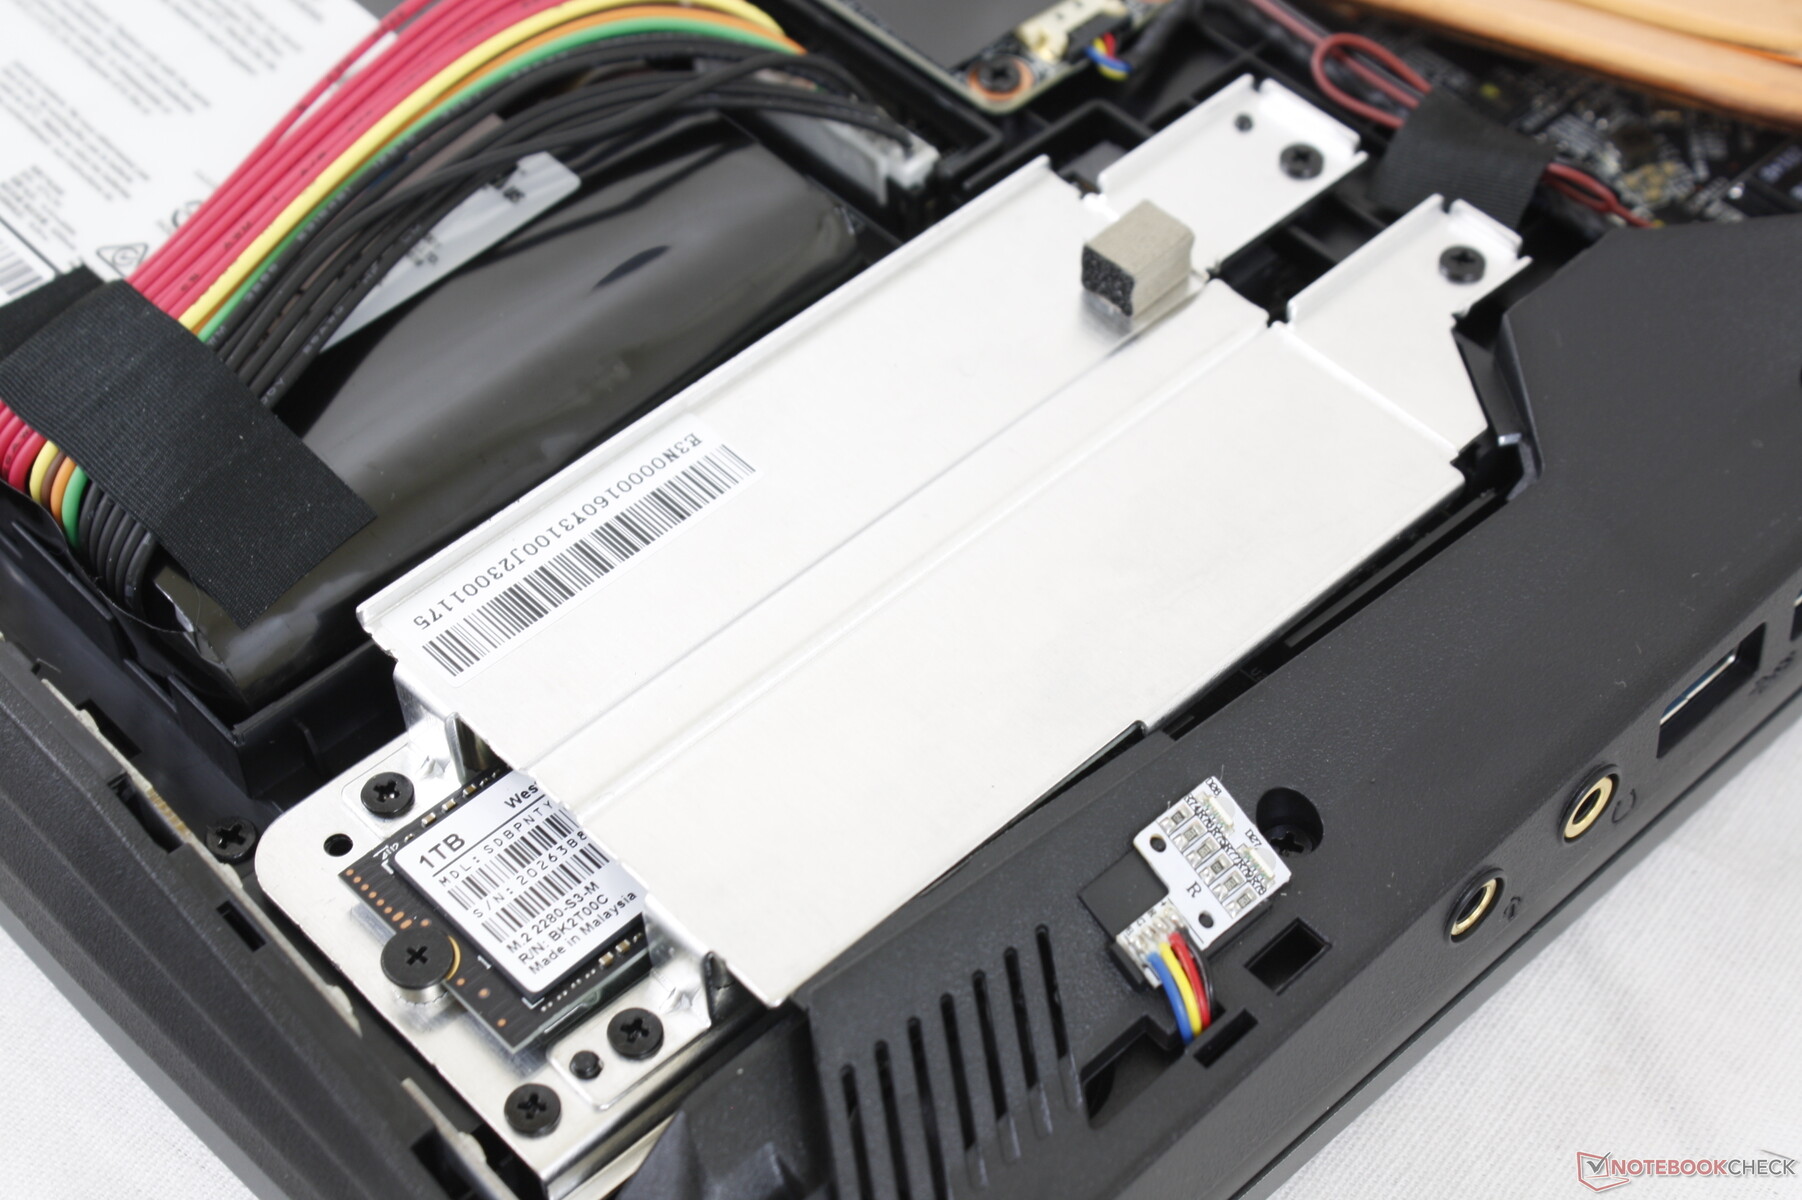
| MSI GT76 Titan DT 10SGS 2x WDC PC SN730 SDBPNTY-1T00 (RAID 0) | Alienware Area-51m i9-9900K RTX 2080 2x SK Hynix PC400 512GB (RAID 0) | Asus Strix Scar 17 G732LXS 2x Intel SSD 660p 1TB SSDPEKNW010T8 (RAID 0) | MSI GE75 9SG Samsung SSD PM981 MZVLB1T0HALR | MSI GT76 Titan DT 9SG 2x Samsung PM961 MZVLW256HEHP (RAID 0) | |
|---|---|---|---|---|---|
| AS SSD | -20% | -29% | -11% | -16% | |
| Seq Read | 2406 | 2082 -13% | 2450 2% | 1358 -44% | 2646 10% |
| Seq Write | 2867 | 2335 -19% | 1436 -50% | 2381 -17% | 2214 -23% |
| 4K Read | 41.51 | 24.14 -42% | 49.48 19% | 27.02 -35% | 30.42 -27% |
| 4K Write | 108.8 | 91.8 -16% | 119.4 10% | 89.2 -18% | 95.9 -12% |
| 4K-64 Read | 1525 | 1561 2% | 1032 -32% | 1642 8% | 1609 6% |
| 4K-64 Write | 1424 | 1350 -5% | 1229 -14% | 1799 26% | 1573 10% |
| Access Time Read * | 0.041 | 0.121 -195% | 0.145 -254% | 0.067 -63% | 0.128 -212% |
| Access Time Write * | 0.102 | 0.039 62% | 0.036 65% | 0.05 51% | 0.039 62% |
| Score Read | 1807 | 1793 -1% | 1327 -27% | 1805 0% | 1904 5% |
| Score Write | 1819 | 1675 -8% | 1492 -18% | 2127 17% | 1890 4% |
| Score Total | 4573 | 4390 -4% | 3456 -24% | 4899 7% | 4740 4% |
| Copy ISO MB/s | 2605 | 2175 -17% | 3193 23% | ||
| Copy Program MB/s | 651 | 582 -11% | 198.2 -70% | ||
| Copy Game MB/s | 1709 | 1479 -13% | 1054 -38% | ||
| CrystalDiskMark 5.2 / 6 | 3% | -7% | -16% | -12% | |
| Write 4K | 116.4 | 111.1 -5% | 125.8 8% | 116.1 0% | 101.4 -13% |
| Read 4K | 43.85 | 45.47 4% | 52.9 21% | 44.98 3% | 40.57 -7% |
| Write Seq | 2927 | 2454 -16% | 1795 -39% | 2370 -19% | 2229 -24% |
| Read Seq | 1997 | 2212 11% | 2315 16% | 1465 -27% | 2528 27% |
| Write 4K Q32T1 | 467.6 | 622 33% | 407.1 -13% | 337.5 -28% | 379.6 -19% |
| Read 4K Q32T1 | 538 | 695 29% | 411.9 -23% | 453.6 -16% | 421.9 -22% |
| Write Seq Q32T1 | 3362 | 2675 -20% | 2844 -15% | 2399 -29% | 2439 -27% |
| Read Seq Q32T1 | 3558 | 3184 -11% | 3130 -12% | 3087 -13% | 3199 -10% |
| Total Average (Program / Settings) | -9% /
-12% | -18% /
-20% | -14% /
-13% | -14% /
-14% |
* ... smaller is better

Disk Throttling: DiskSpd Read Loop, Queue Depth 8
GPU Performance
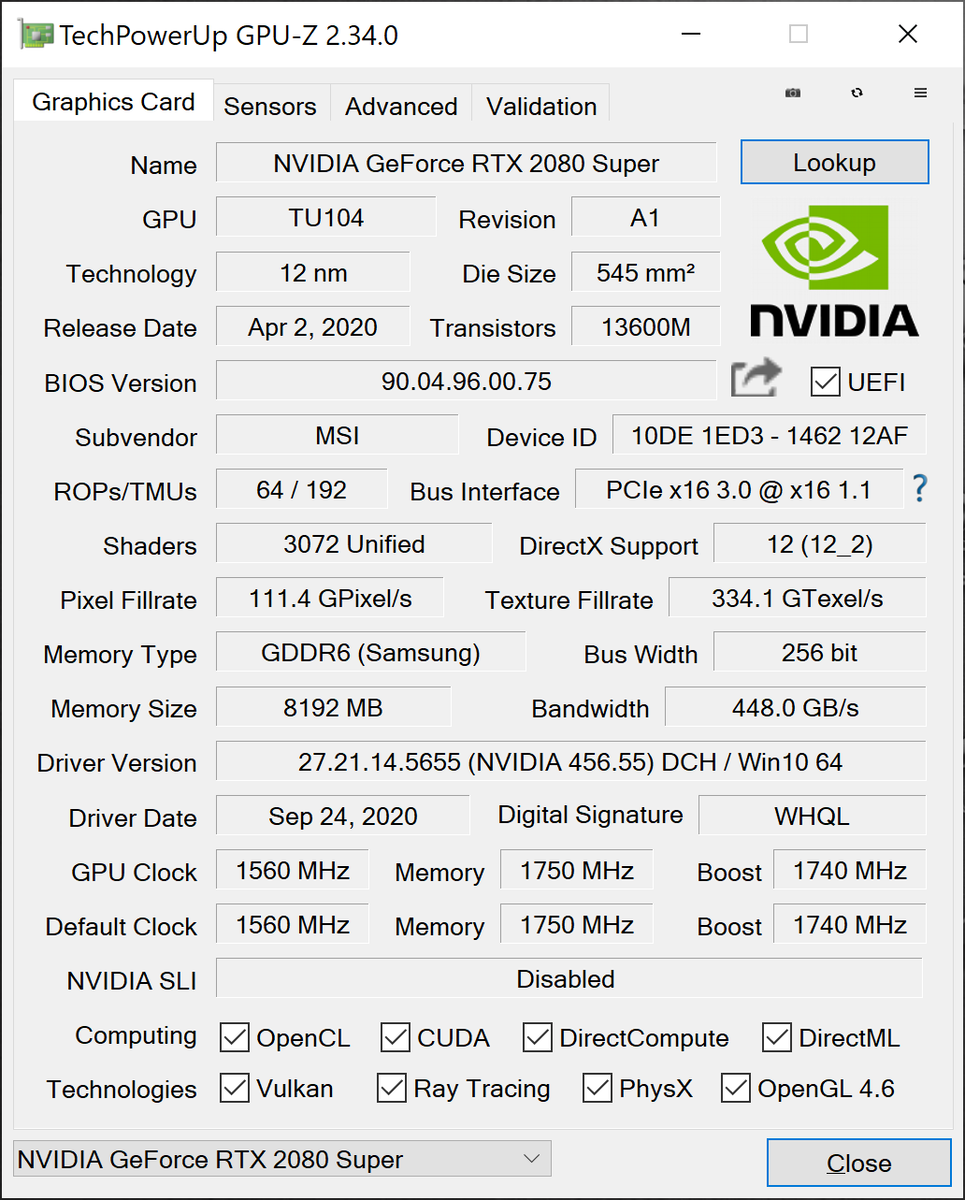
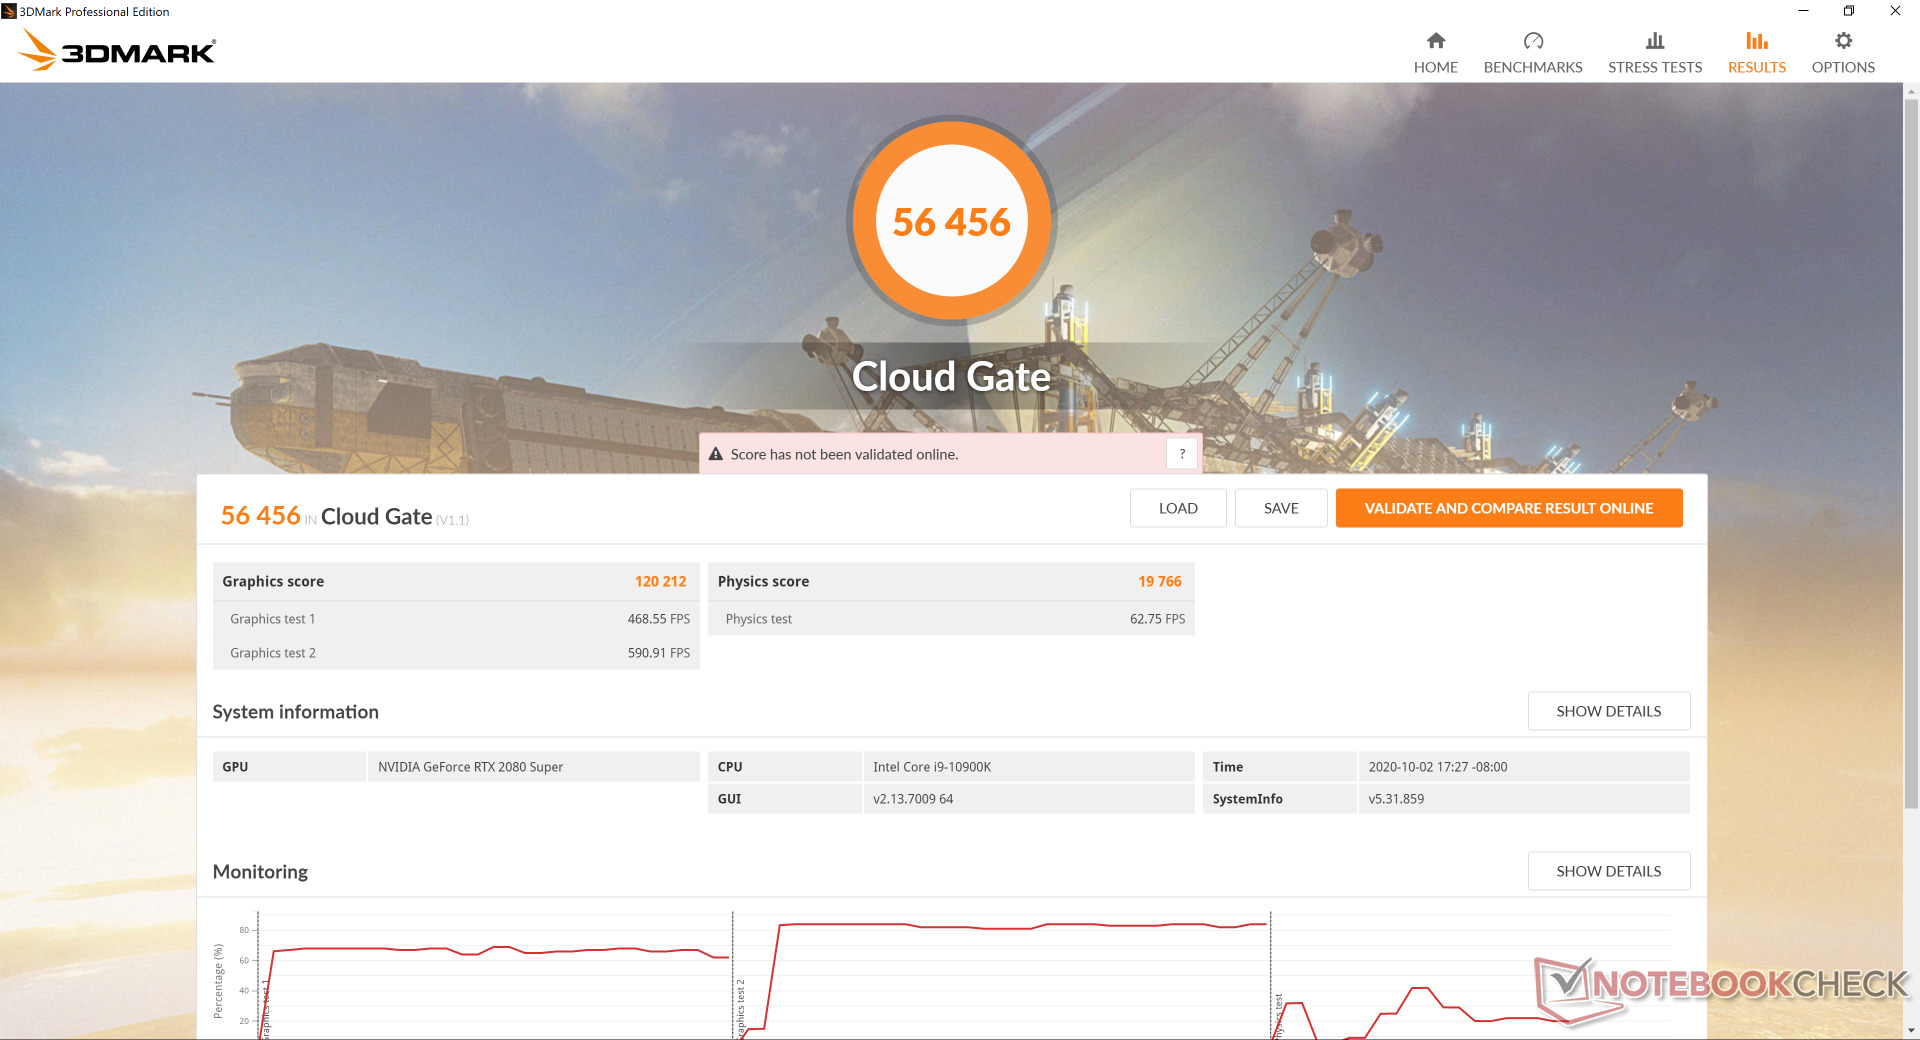
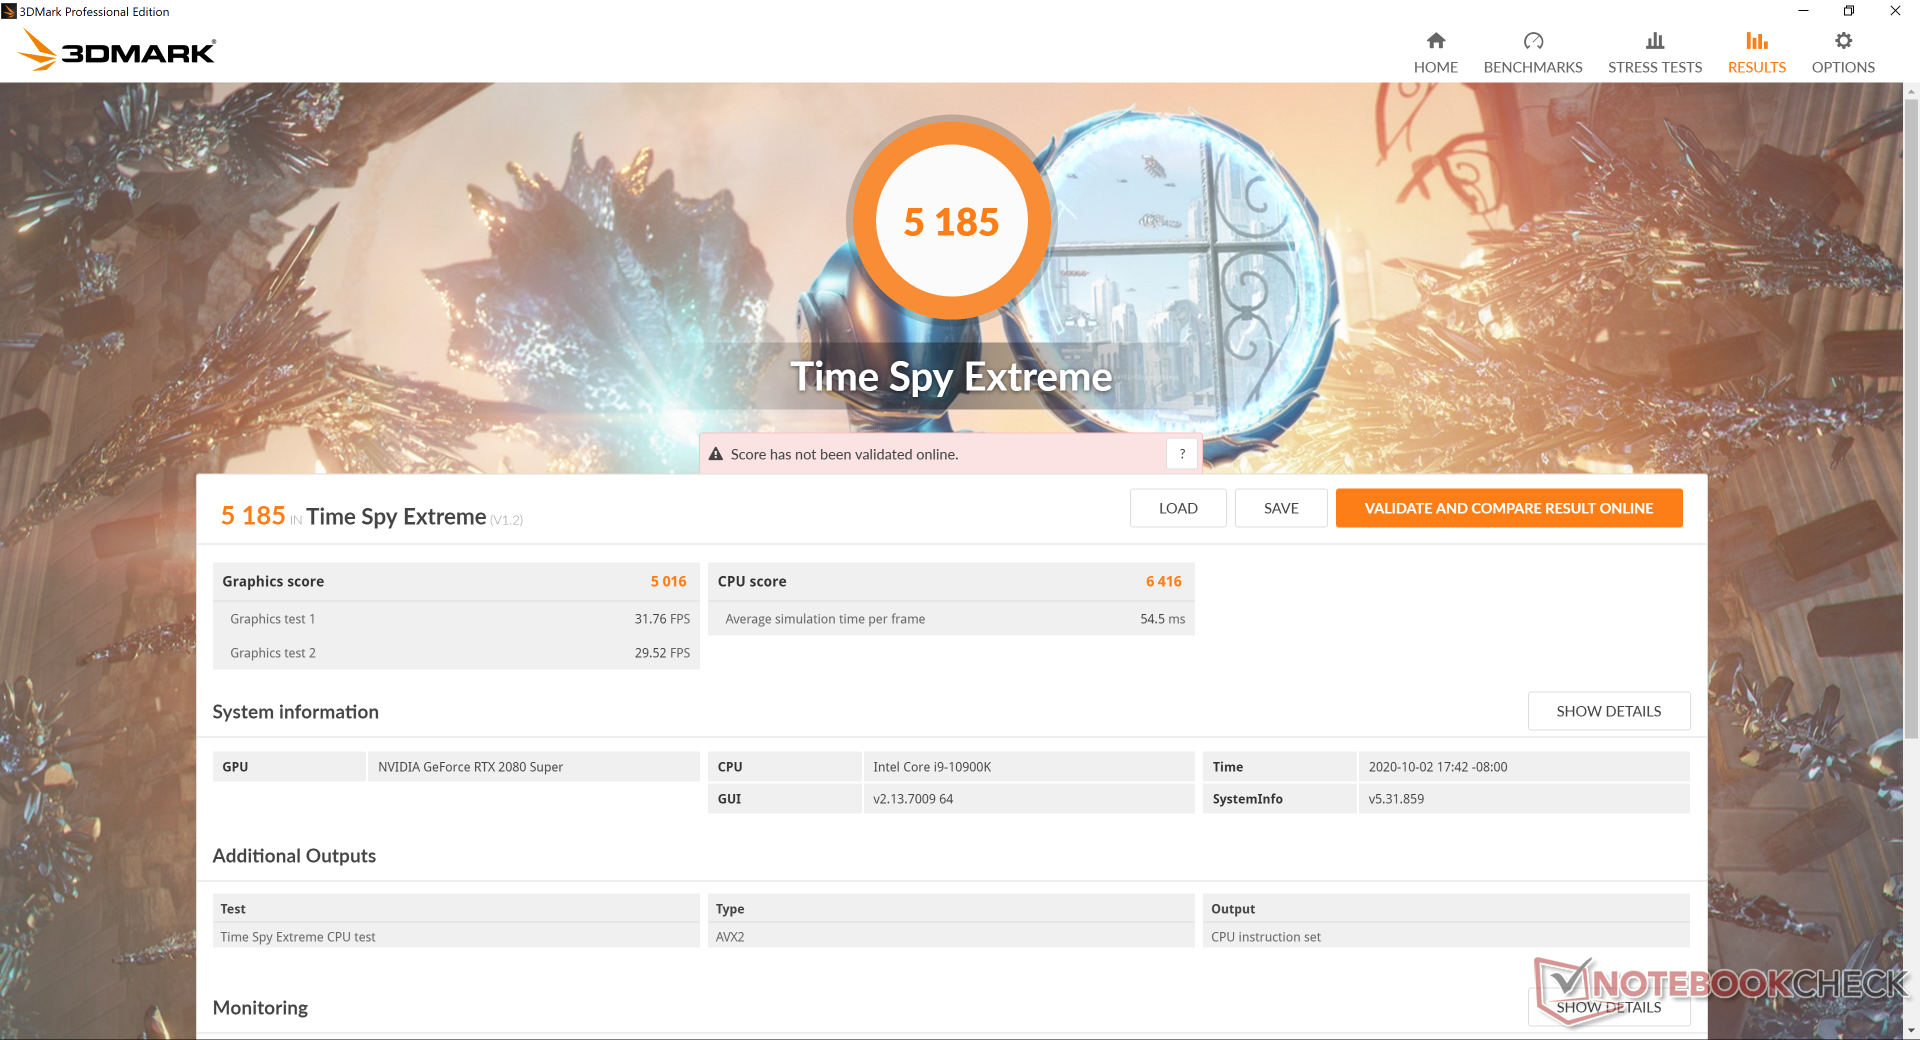
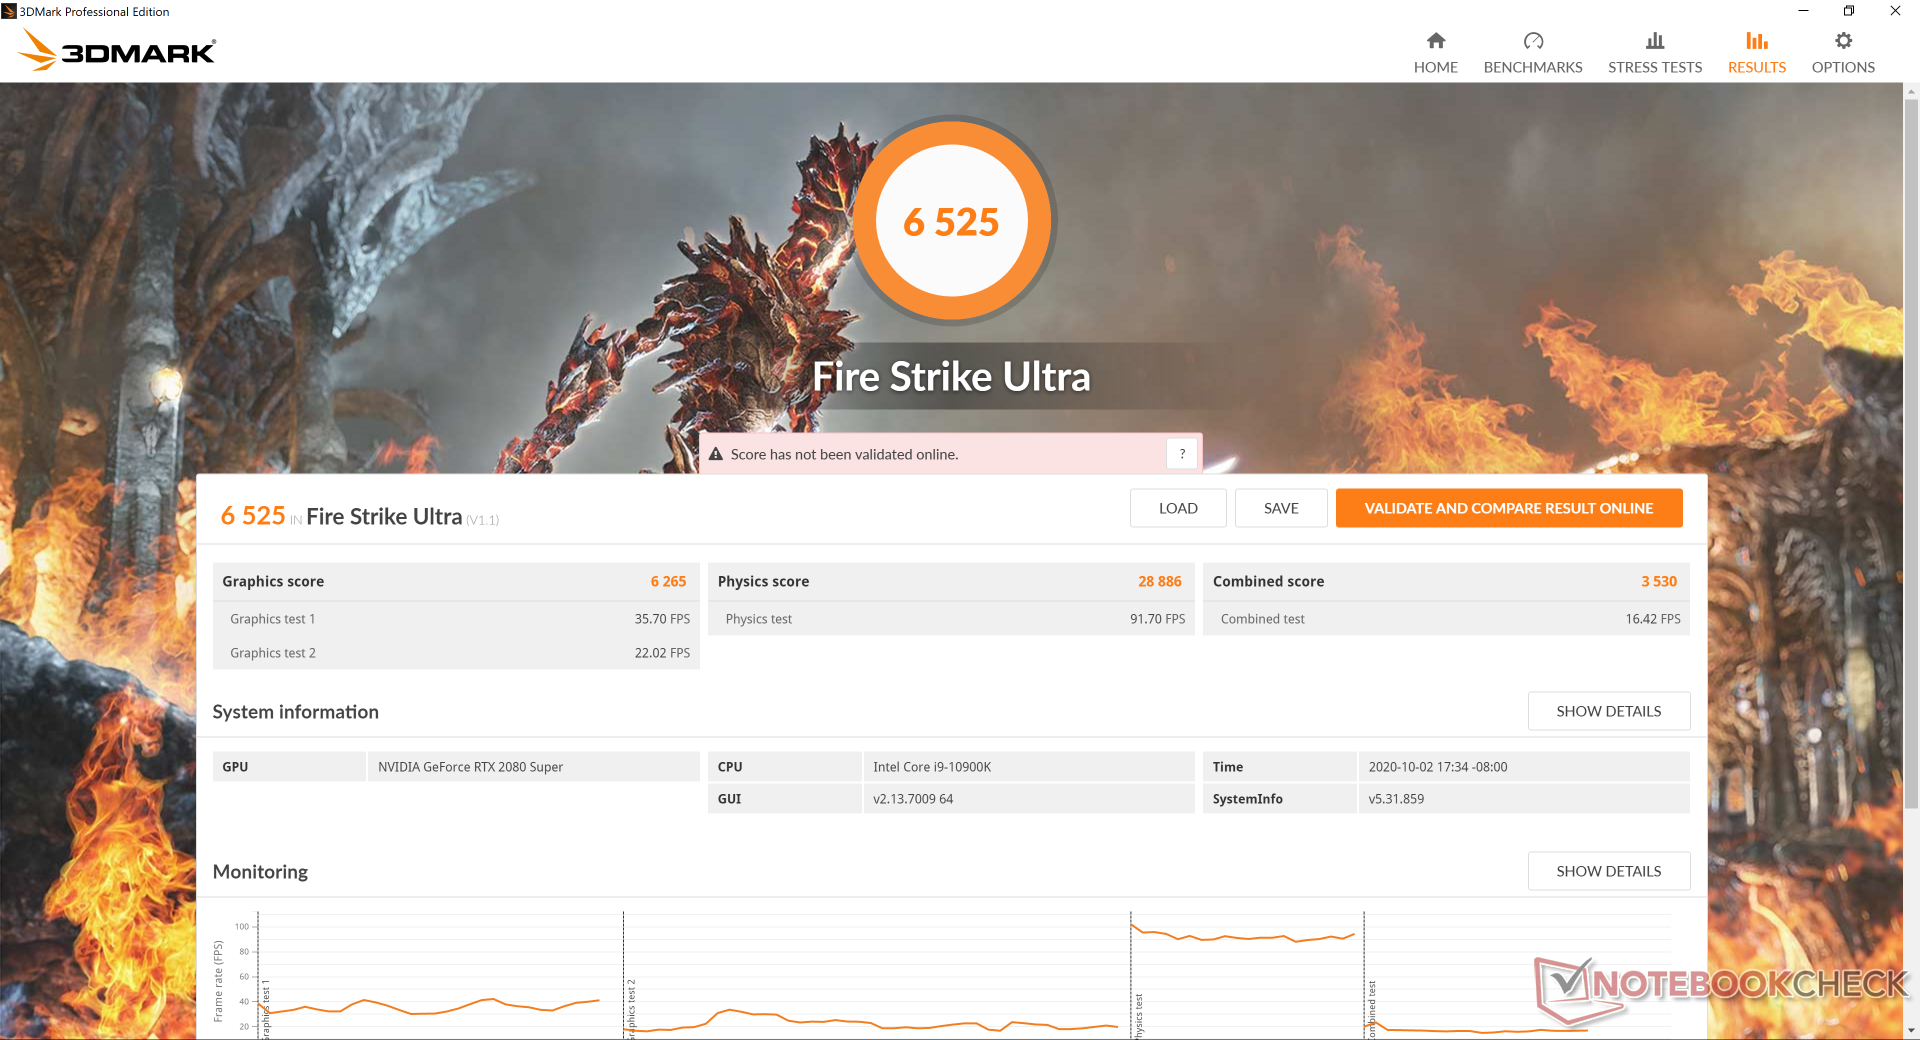
3DMark results are indeed faster than last year's GT76 9SG albeit just marginally by only a few percentage points. Raw graphics performance is just shy of our desktop RTX 2080 Super reference. See our page on the mobile GeForce RTX 2080 Super for more technical information and benchmark comparisons.
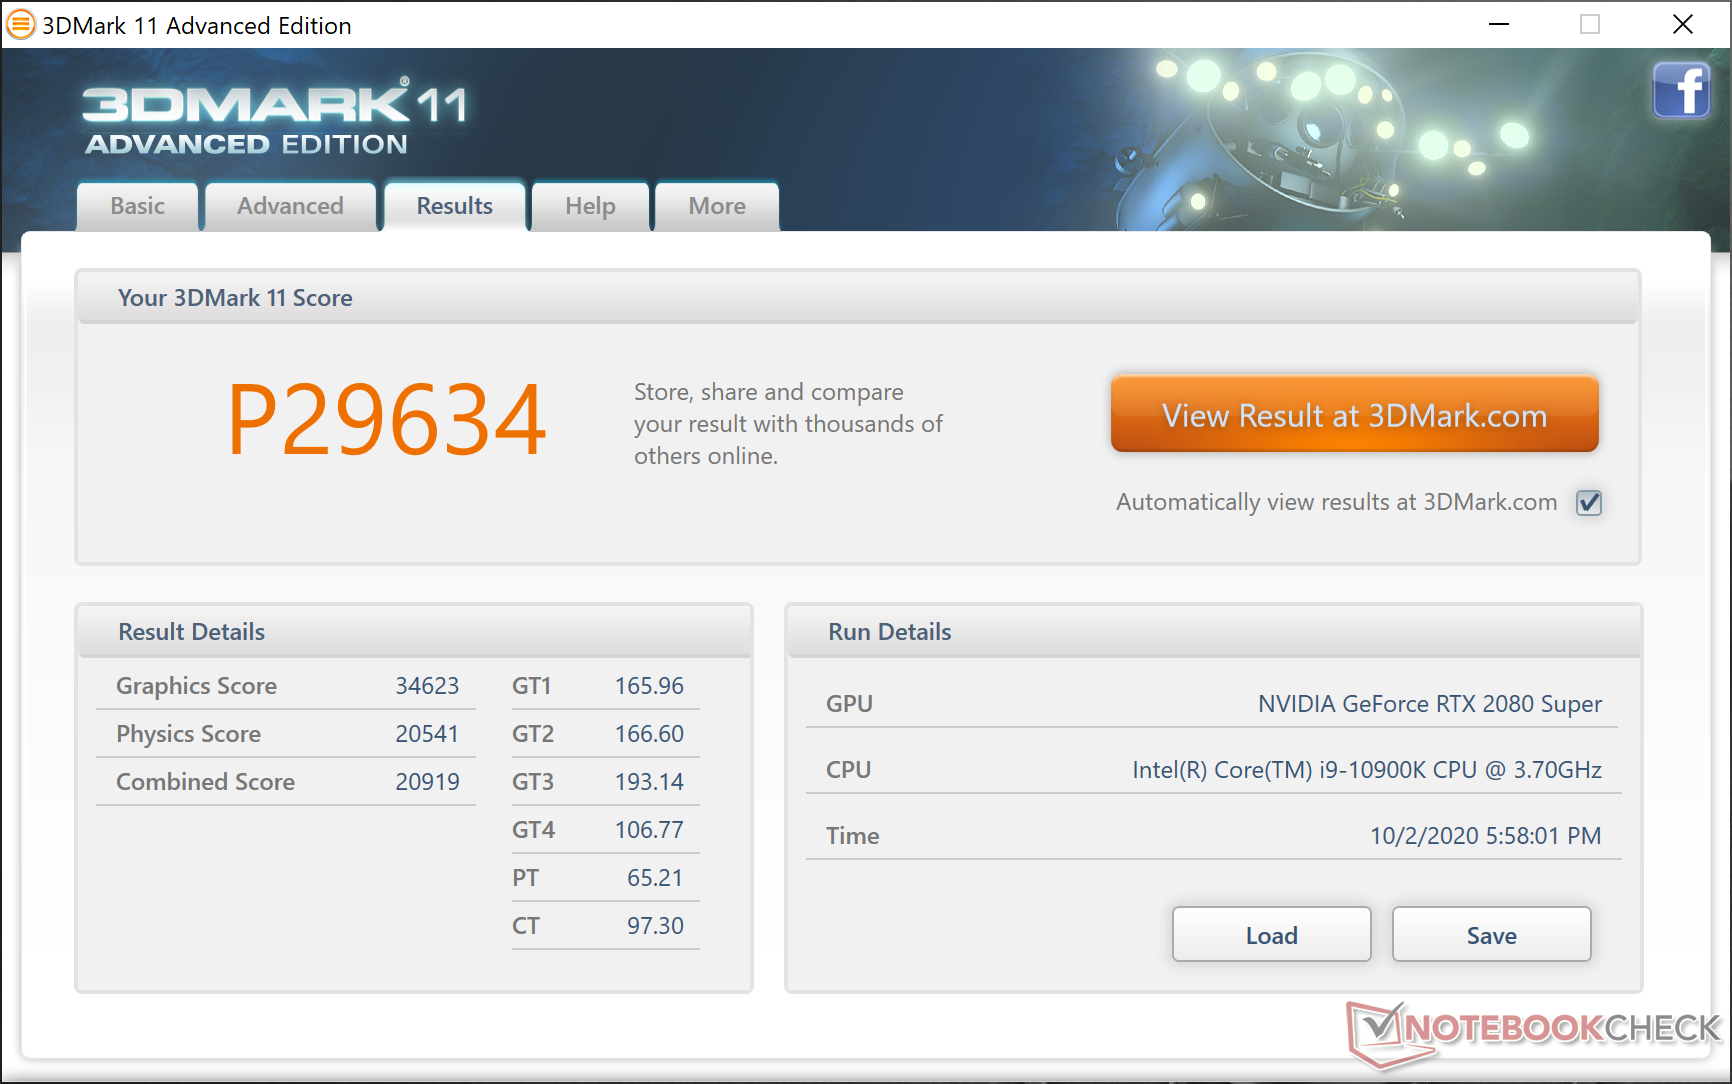
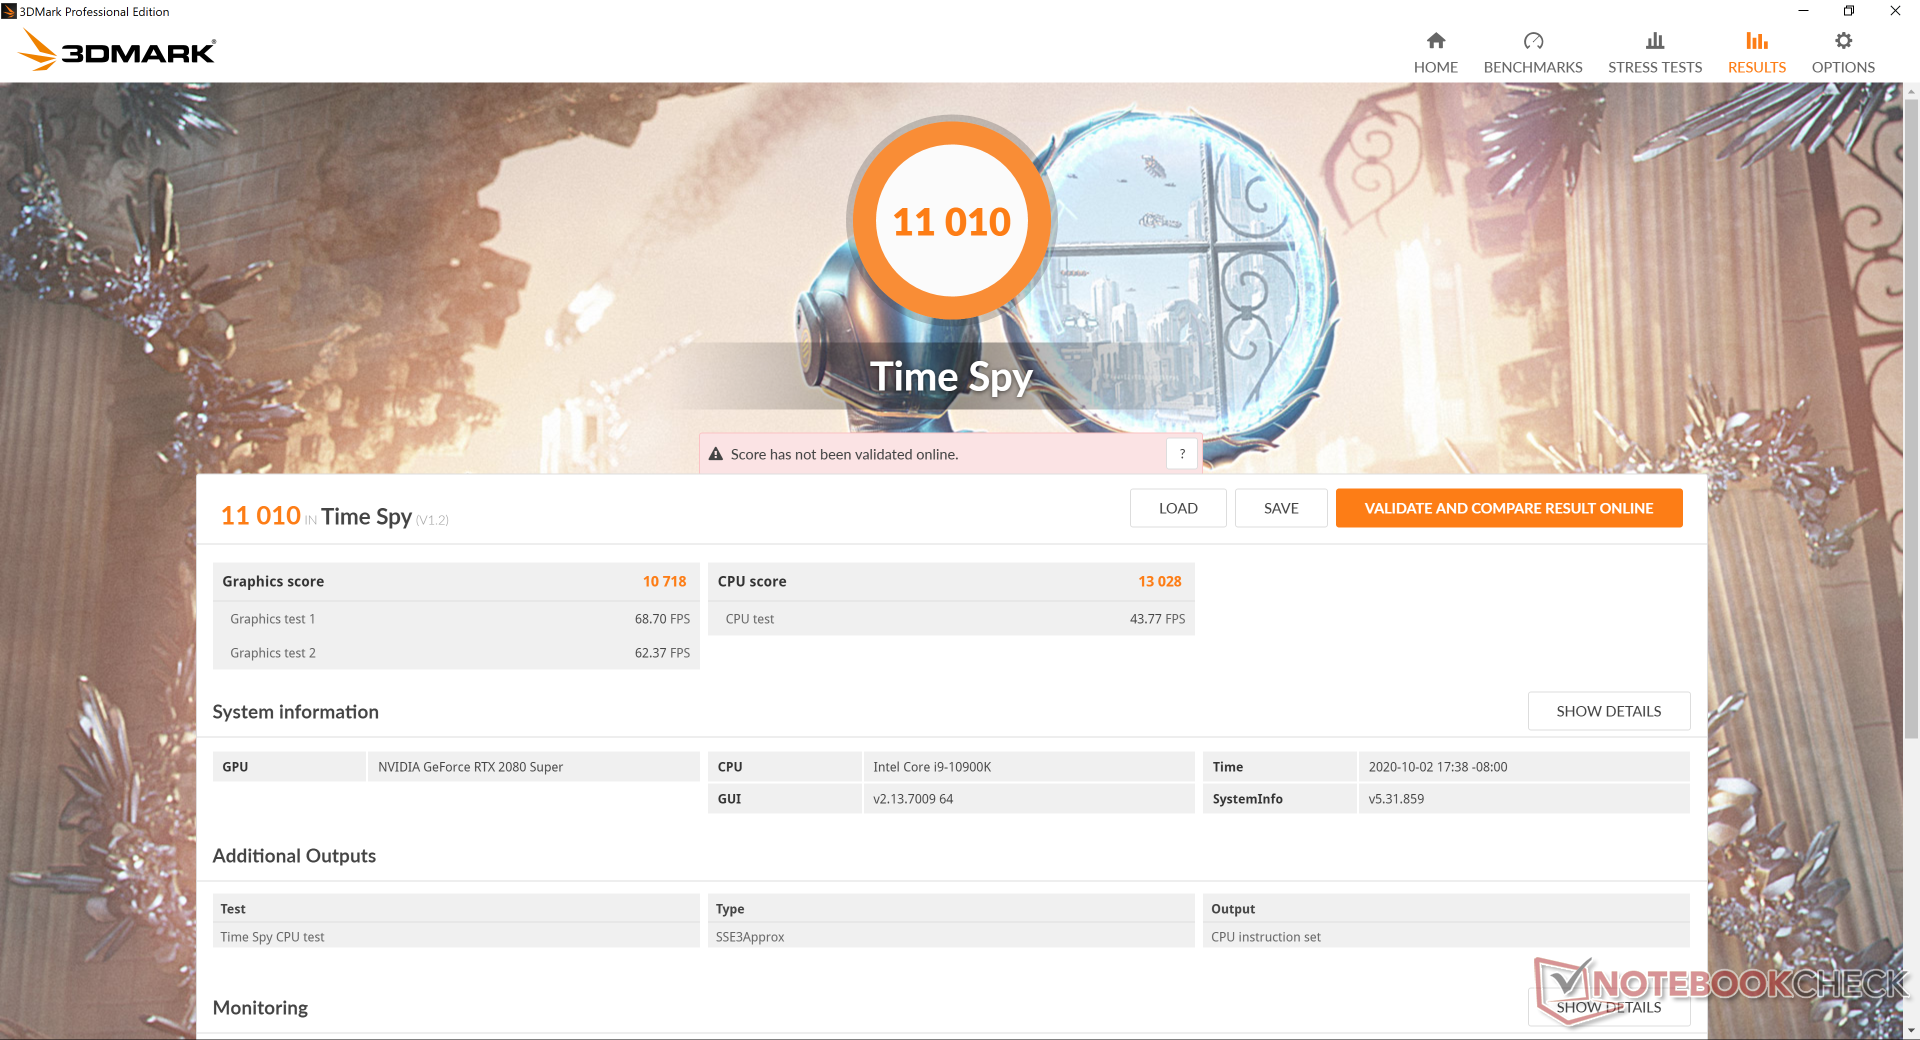
| 3DMark 11 Performance | 29634 points | |
| 3DMark Cloud Gate Standard Score | 56456 points | |
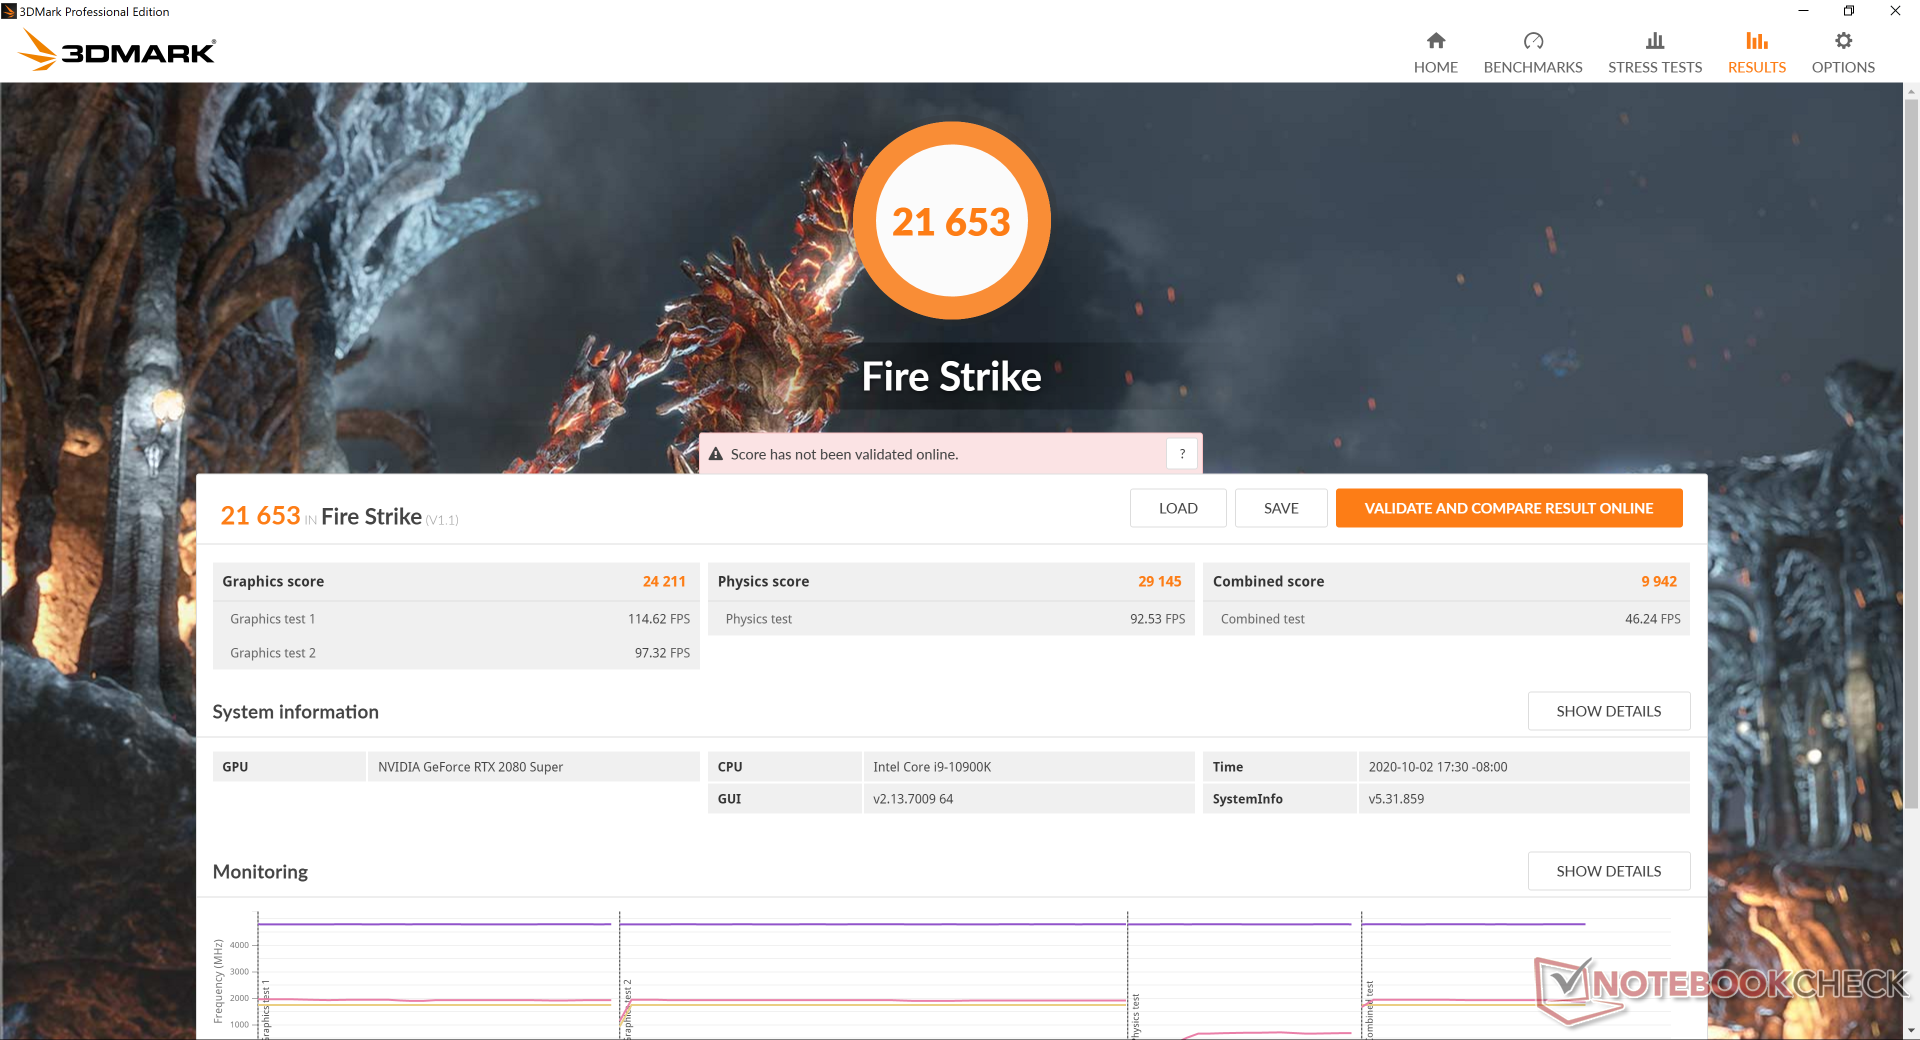
| 3DMark Fire Strike Score | 21653 points | |
| 3DMark Time Spy Score | 11010 points | |
Help | ||
| GTA V | |
| 1920x1080 Lowest Settings possible | |
| MSI GT76 Titan DT 10SGS | |
| Average NVIDIA GeForce RTX 2080 Super Mobile (182 - 185, n=2) | |
| Asus Strix Scar 17 G732LXS | |
| Aorus 17G XB | |
| 3840x2160 Highest Settings possible AA:4xMSAA + FX AF:16x | |
| Average NVIDIA GeForce RTX 2080 Super Mobile (47.9 - 49.3, n=3) | |
| MSI GT76 Titan DT 10SGS | |
| 3840x2160 High/On (Advanced Graphics Off) AA:FX AF:8x | |
| KFA2 GeForce RTX 2080 Ti EX | |
| Asus ROG Strix RTX 2080 OC | |
| Nvidia GeForce RTX 2080 Super | |
| Asus ROG Strix RTX 2070 OC | |
| Nvidia GeForce RTX 2070 Super | |
| Average NVIDIA GeForce RTX 2080 Super Mobile (96 - 98.9, n=2) | |
| MSI GT76 Titan DT 10SGS | |
| Gigabyte Aero 15-Y9 | |
| Strange Brigade | |
| 1280x720 lowest AF:1 | |
| MSI GT76 Titan DT 10SGS | |
| Average NVIDIA GeForce RTX 2080 Super Mobile (n=1) | |
| KFA2 GeForce GTX 1650 EX One Click Plus | |
| 1920x1080 high AA:high AF:8 | |
| MSI GT76 Titan DT 10SGS | |
| Average NVIDIA GeForce RTX 2080 Super Mobile (n=1) | |
| KFA2 GeForce GTX 1650 EX One Click Plus | |
| 1920x1080 ultra AA:ultra AF:16 | |
| MSI GT76 Titan DT 10SGS | |
| Average NVIDIA GeForce RTX 2080 Super Mobile (n=1) | |
| KFA2 GeForce GTX 1650 EX One Click Plus | |
| low | med. | high | ultra | QHD | 4K | |
|---|---|---|---|---|---|---|
| GTA V (2015) | 185 | 183 | 176 | 101 | 90.2 | 96 |
| The Witcher 3 (2015) | 471.7 | 332 | 223.2 | 113.2 | 80.5 | |
| Dota 2 Reborn (2015) | 179 | 163 | 158 | 148 | 136 | |
| Final Fantasy XV Benchmark (2018) | 196 | 140 | 107 | 80.2 | 47 | |
| X-Plane 11.11 (2018) | 138 | 122 | 98 | 84.2 | ||
| Strange Brigade (2018) | 515 | 265 | 217 | 183 | 137 | 78.4 |
Emissions
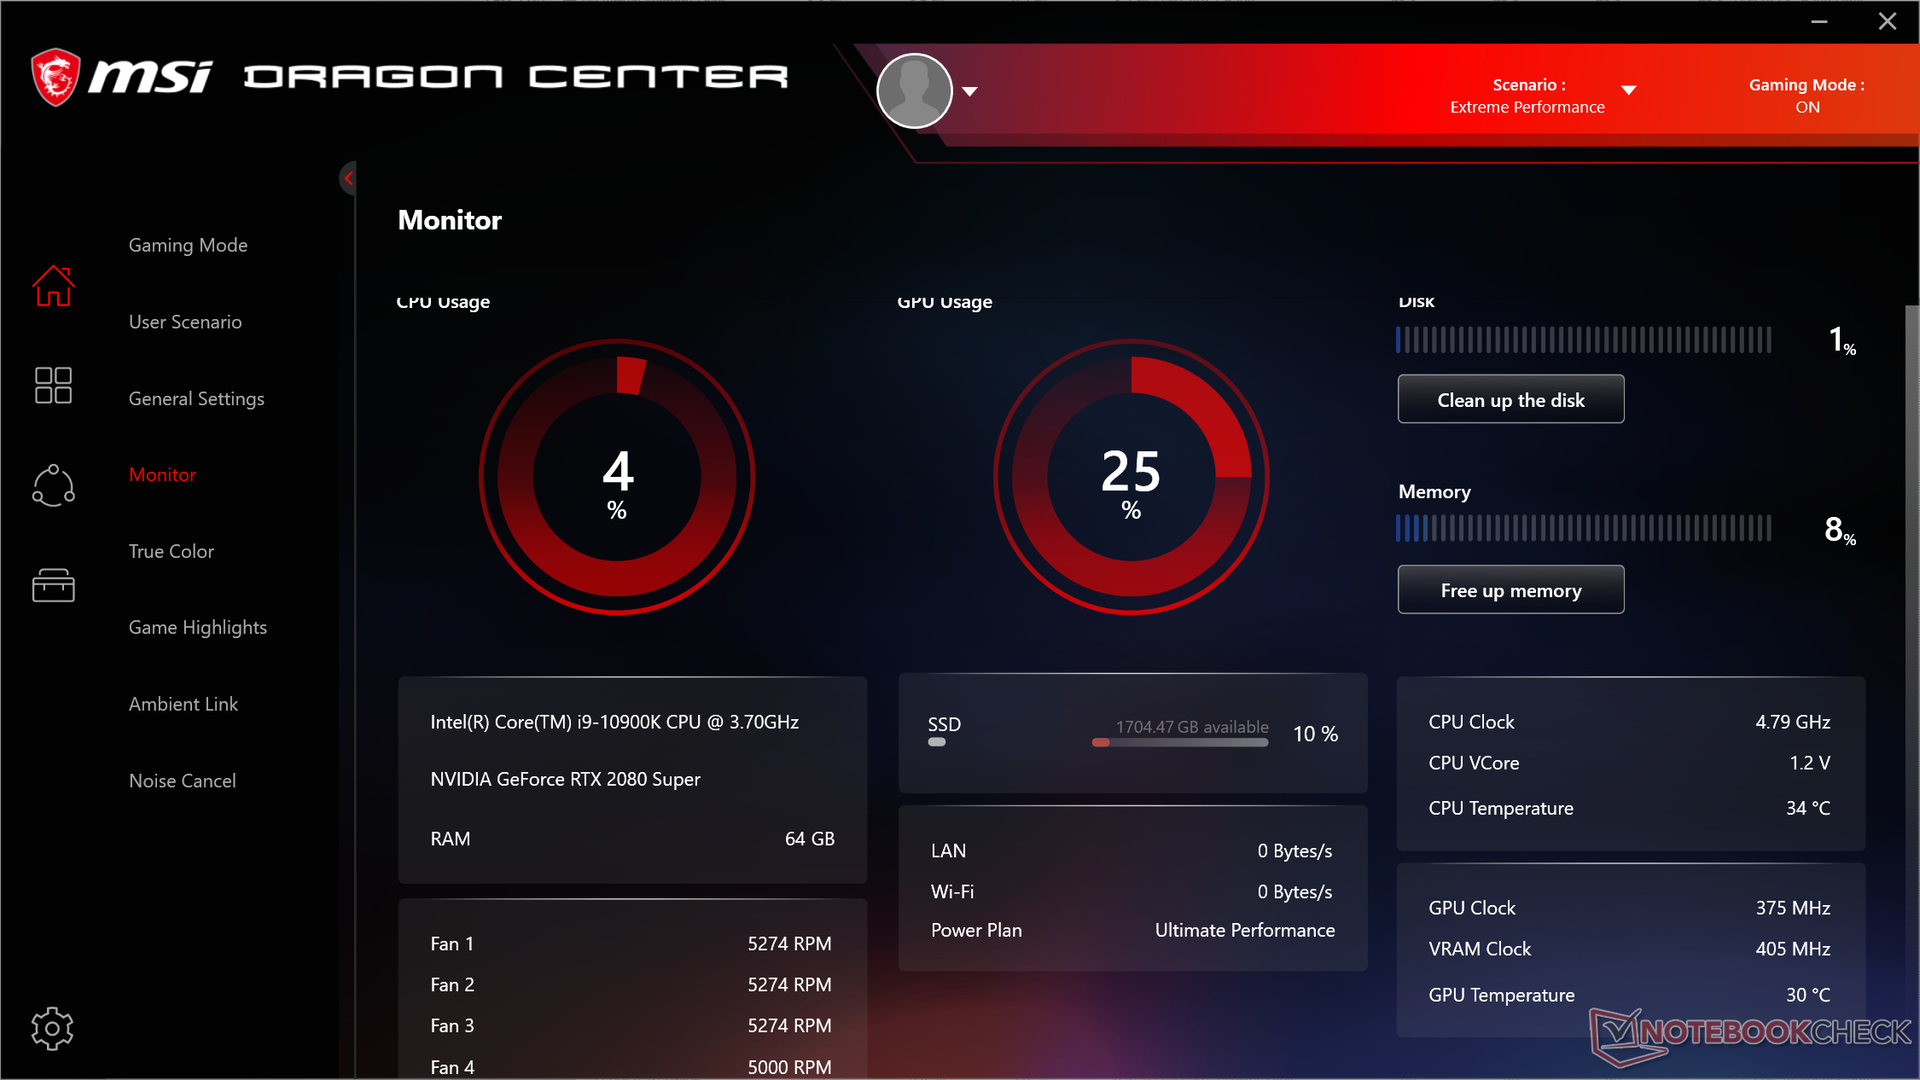
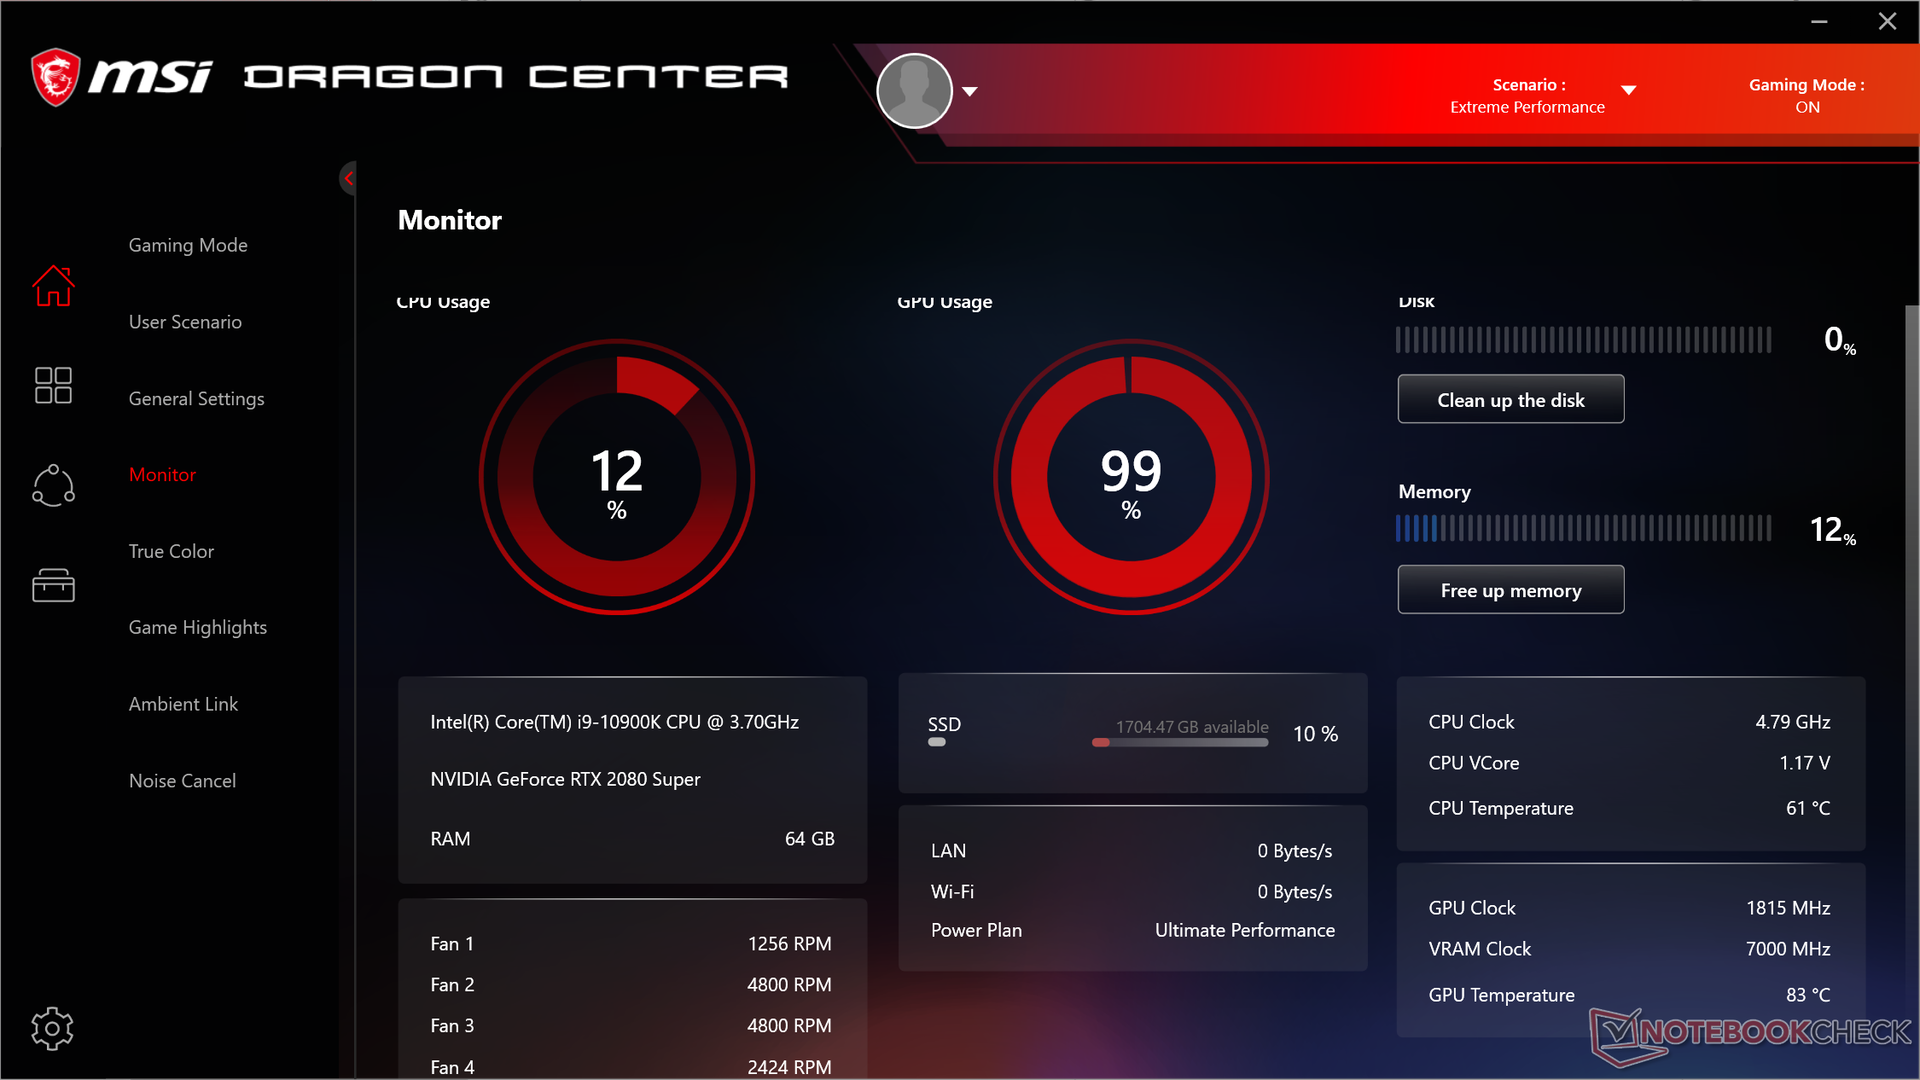
System Noise
Fan noise is tied directly to the MSI Dragon Center software. When set to Silent mode, the fans will range between 27.5 to 29.8 dB(A) against a background of 26.5 dB(A). While not truly "silent", it's still quiet especially for the hardware involved. We recommend running on Silent mode if simply web browsing or video streaming where the extra horsepower isn't needed.
Gaming on Extreme Performance mode will induce a fan noise of about 60.7 dB(A) to be significantly louder than most other gaming laptops — and that's before toggling the Turbo Fan/Cooler Boost feature. Once enabled, fan noise would jump to 66.6 dB(A) to be one of the loudest we've ever recorded on any laptop.
| MSI GT76 Titan DT 10SGS GeForce RTX 2080 Super Mobile, i9-10900K, 2x WDC PC SN730 SDBPNTY-1T00 (RAID 0) | Asus ROG G703GXR GeForce RTX 2080 Mobile, i7-9750H, Samsung SSD PM981 MZVLB512HAJQ | Alienware Area-51m i9-9900K RTX 2080 GeForce RTX 2080 Mobile, i9-9900K, 2x SK Hynix PC400 512GB (RAID 0) | Asus Strix Scar 17 G732LXS GeForce RTX 2080 Super Mobile, i9-10980HK, 2x Intel SSD 660p 1TB SSDPEKNW010T8 (RAID 0) | SCHENKER XMG Pro 17 PB71RD-G GeForce RTX 2060 Mobile, i7-9750H, Samsung SSD 970 EVO Plus 500GB | MSI GE75 9SG GeForce RTX 2080 Mobile, i9-9880H, Samsung SSD PM981 MZVLB1T0HALR | MSI GT76 Titan DT 9SG GeForce RTX 2080 Mobile, i9-9900K, 2x Samsung PM961 MZVLW256HEHP (RAID 0) | |
|---|---|---|---|---|---|---|---|
| Noise | -9% | -16% | -21% | -15% | -5% | -19% | |
| off / environment * | 26.4 | 30 -14% | 28.1 -6% | 25 5% | 30 -14% | 28.2 -7% | 30 -14% |
| Idle Minimum * | 27.5 | 33 -20% | 28.1 -2% | 33 -20% | 30 -9% | 30.4 -11% | 33 -20% |
| Idle Average * | 27.5 | 34 -24% | 28.6 -4% | 38 -38% | 32 -16% | 30.4 -11% | 34 -24% |
| Idle Maximum * | 29.8 | 35 -17% | 51 -71% | 45 -51% | 39 -31% | 33.4 -12% | 44 -48% |
| Load Average * | 30.9 | 38 -23% | 51 -65% | 54 -75% | 51 -65% | 37.1 -20% | 47 -52% |
| Witcher 3 ultra * | 60.7 | 50 18% | 51 16% | 50 18% | 54 11% | 54.2 11% | 53 13% |
| Load Maximum * | 66.6 | 54 19% | 51 23% | 55 17% | 54 19% | 56.4 15% | 59 11% |
* ... smaller is better
Noise Level
| Idle |
| 27.5 / 27.5 / 29.8 dB(A) |
| Load |
| 30.9 / 66.6 dB(A) |
 | ||
30 dB silent 40 dB(A) audible 50 dB(A) loud |
||
min: | ||
Temperature
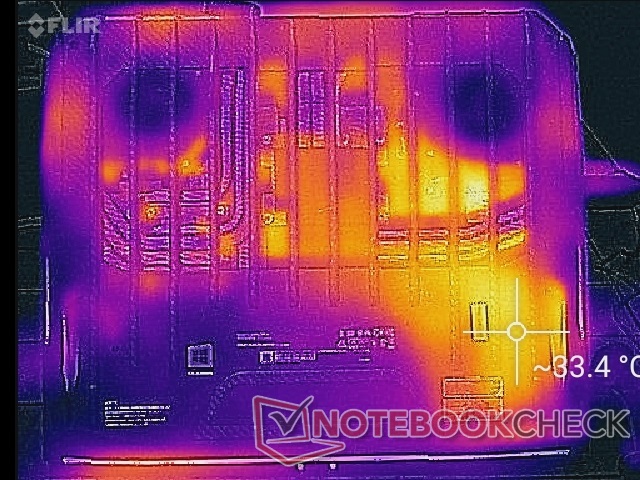
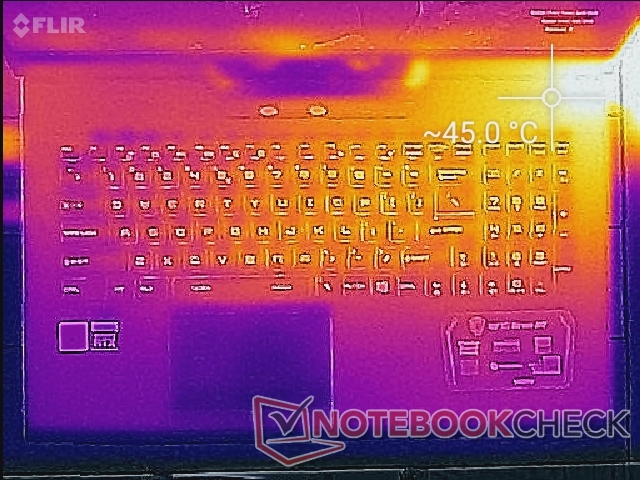
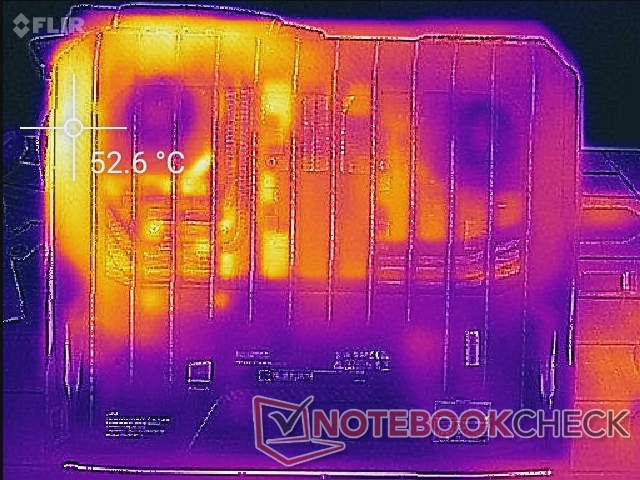
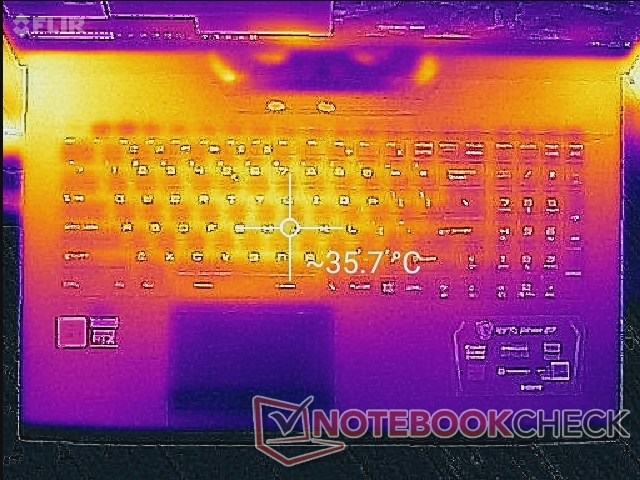
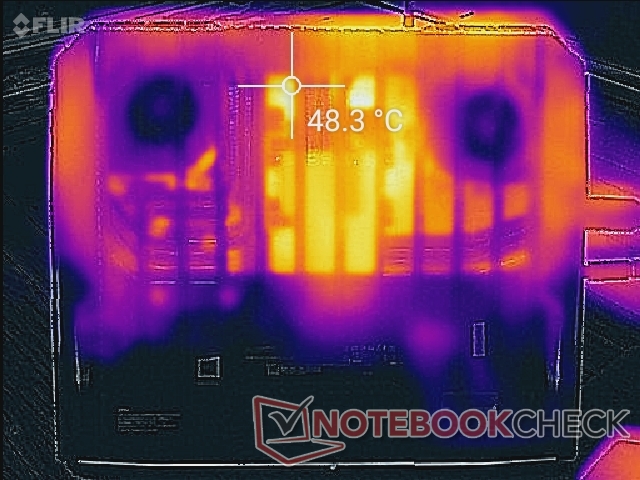
Surface temperatures are never uncomfortably warm even though we have some of the fastest components inside due to the abundance of ventilation grilles and a heavy cooling solution. When gamng, for example, the keyboard center is just 36 C compared to 42 C to 47 C on the ultra-thin MSI GS75. Hot spots are nearest the rear corners where users' hands are unlikely to touch.
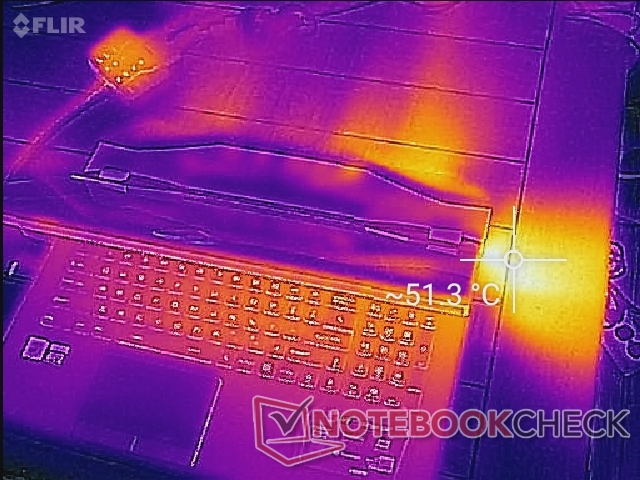
(+) The maximum temperature on the upper side is 36.4 °C / 98 F, compared to the average of 40.5 °C / 105 F, ranging from 21.2 to 68.8 °C for the class Gaming.
(±) The bottom heats up to a maximum of 43 °C / 109 F, compared to the average of 43.3 °C / 110 F
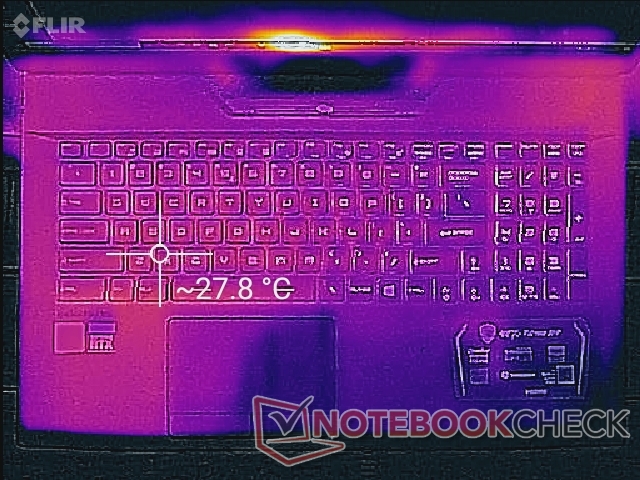
(+) In idle usage, the average temperature for the upper side is 27.3 °C / 81 F, compared to the device average of 33.9 °C / 93 F.
(±) Playing The Witcher 3, the average temperature for the upper side is 34.8 °C / 95 F, compared to the device average of 33.9 °C / 93 F.
(+) The palmrests and touchpad are cooler than skin temperature with a maximum of 31.6 °C / 88.9 F and are therefore cool to the touch.
(-) The average temperature of the palmrest area of similar devices was 28.9 °C / 84 F (-2.7 °C / -4.9 F).
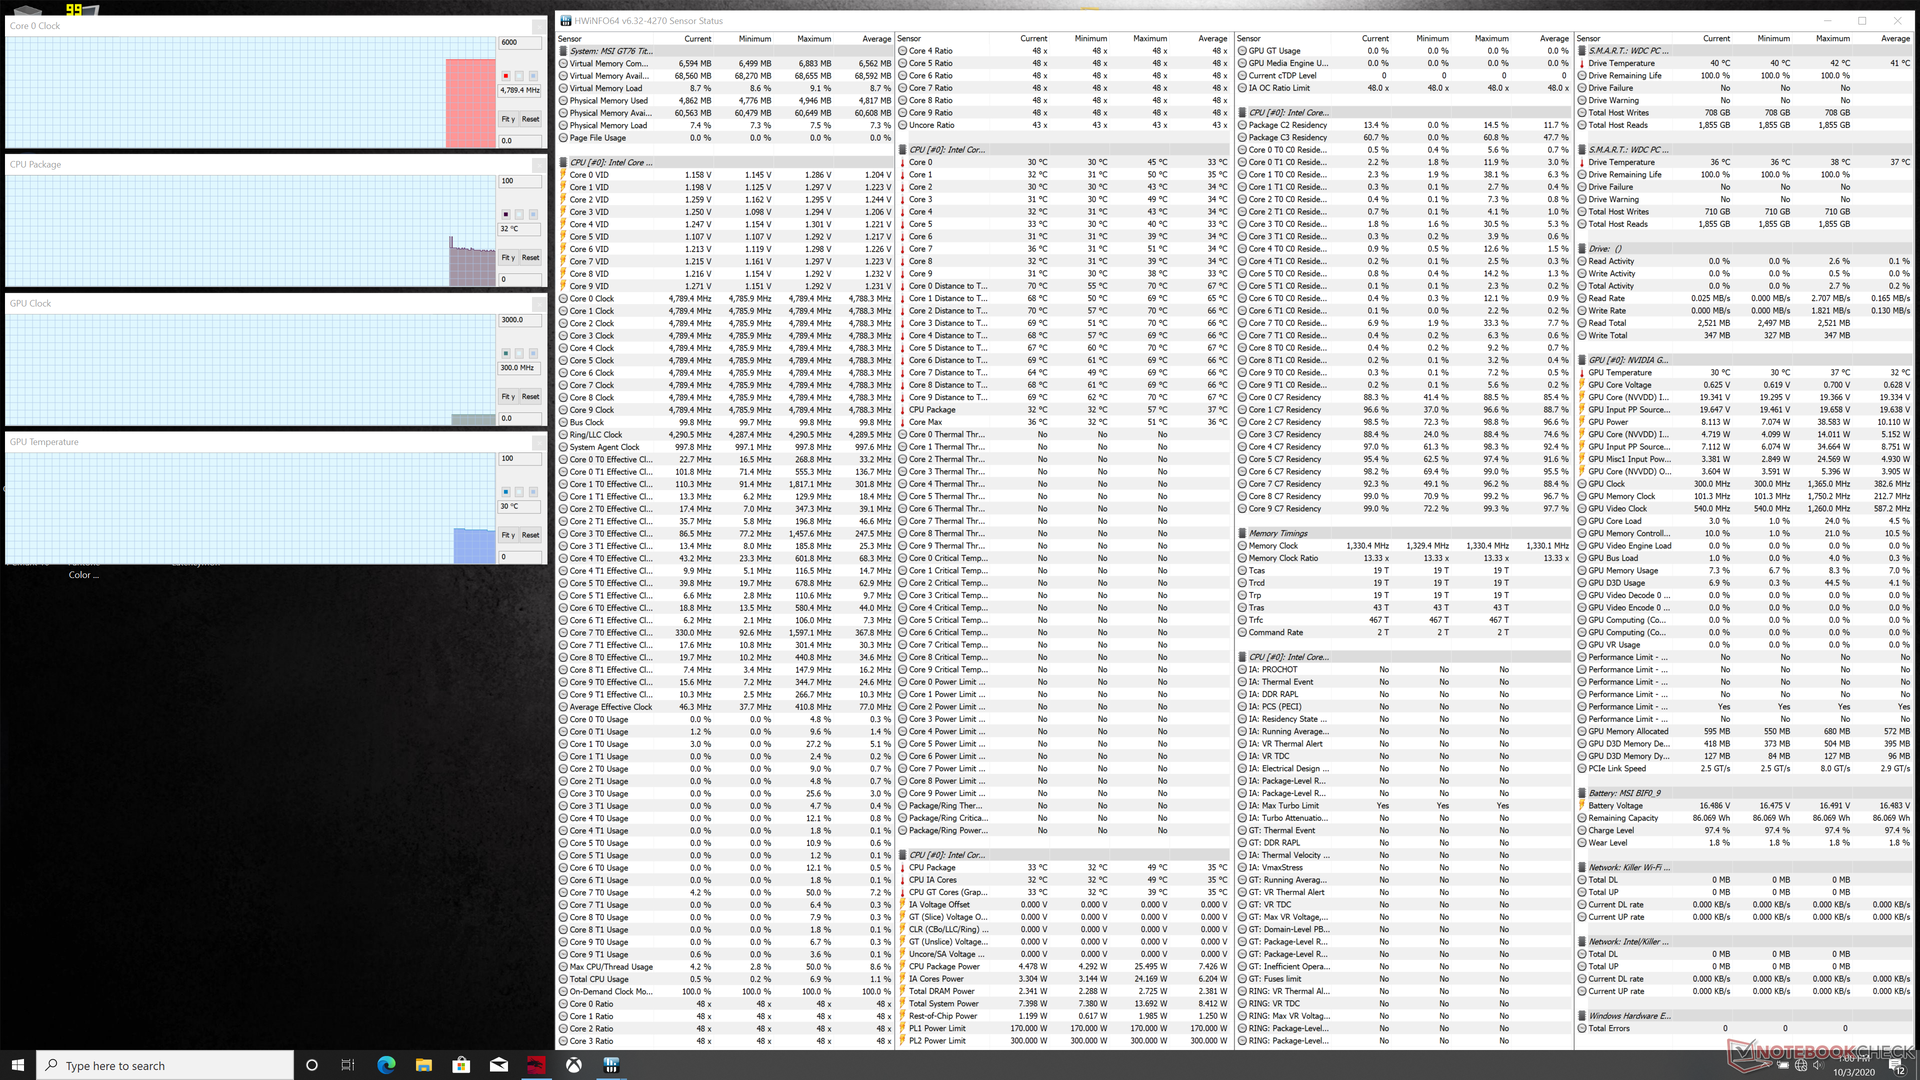
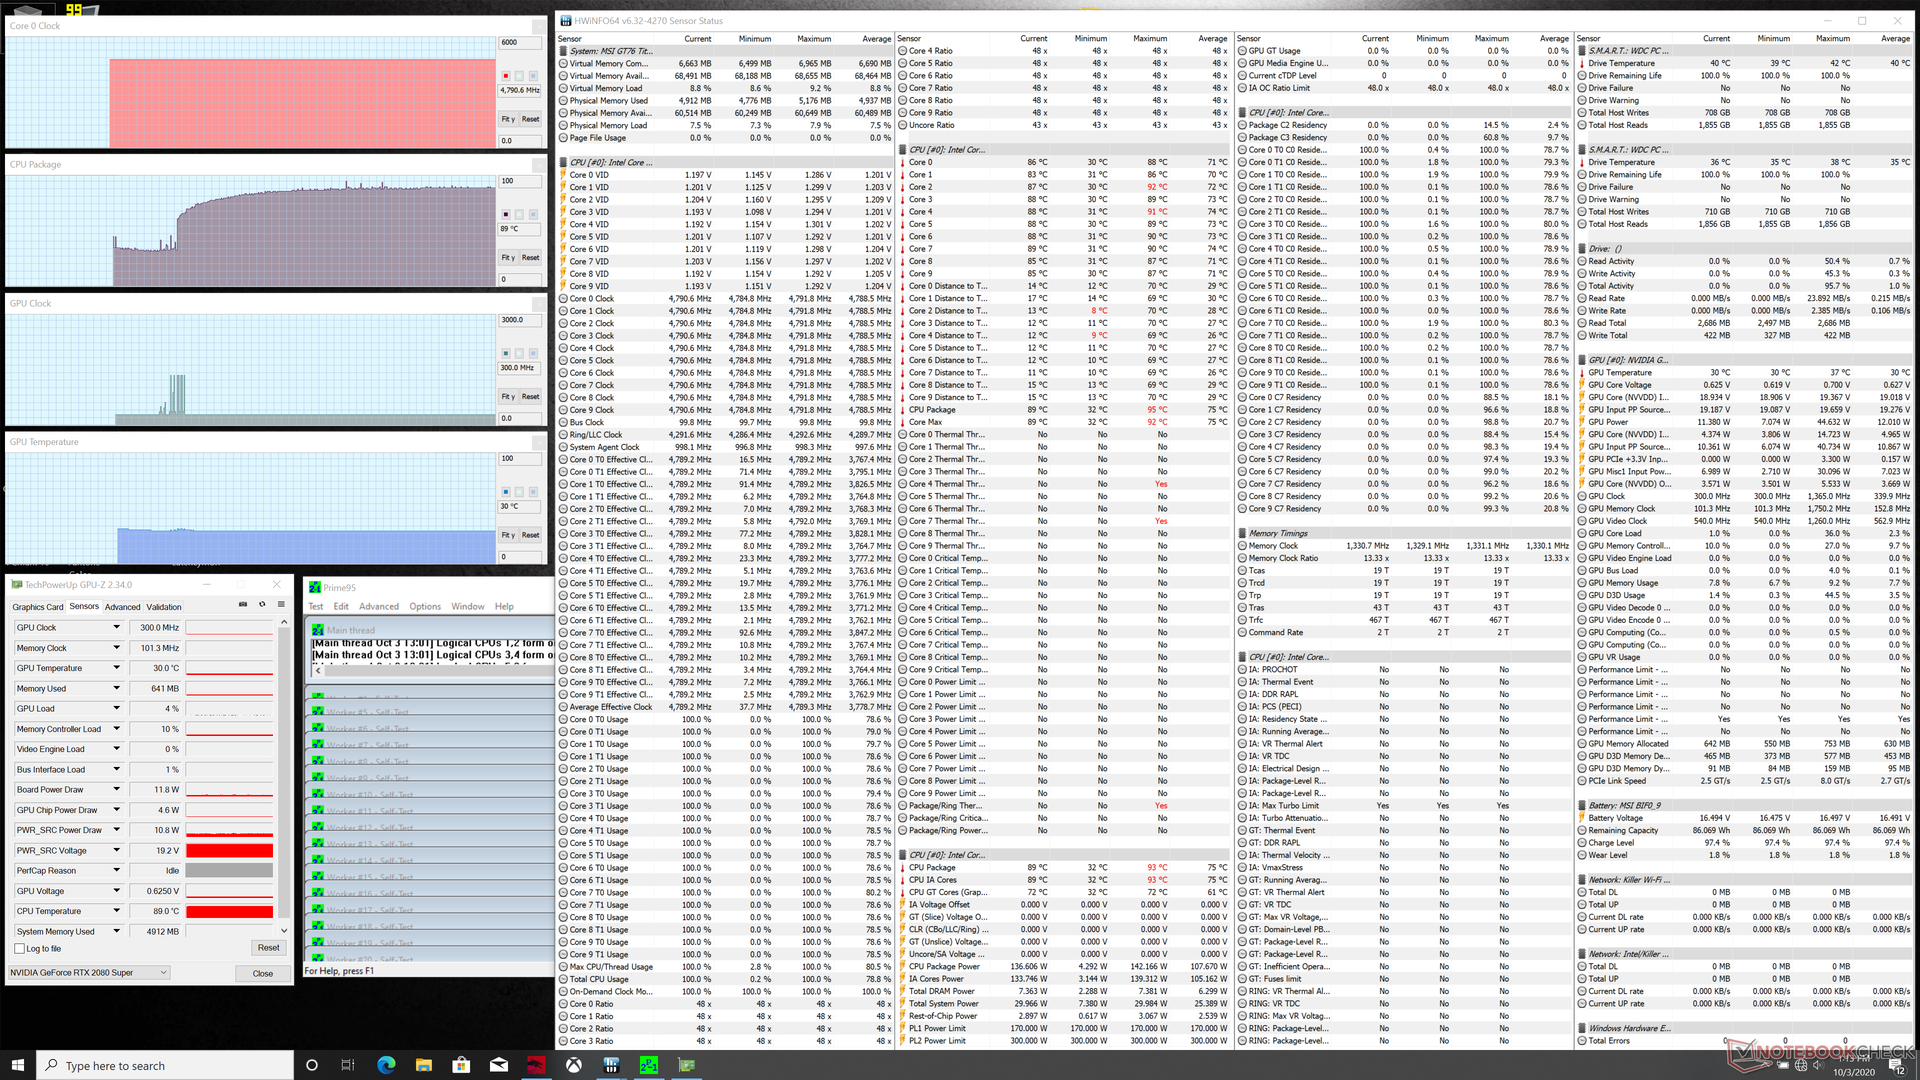
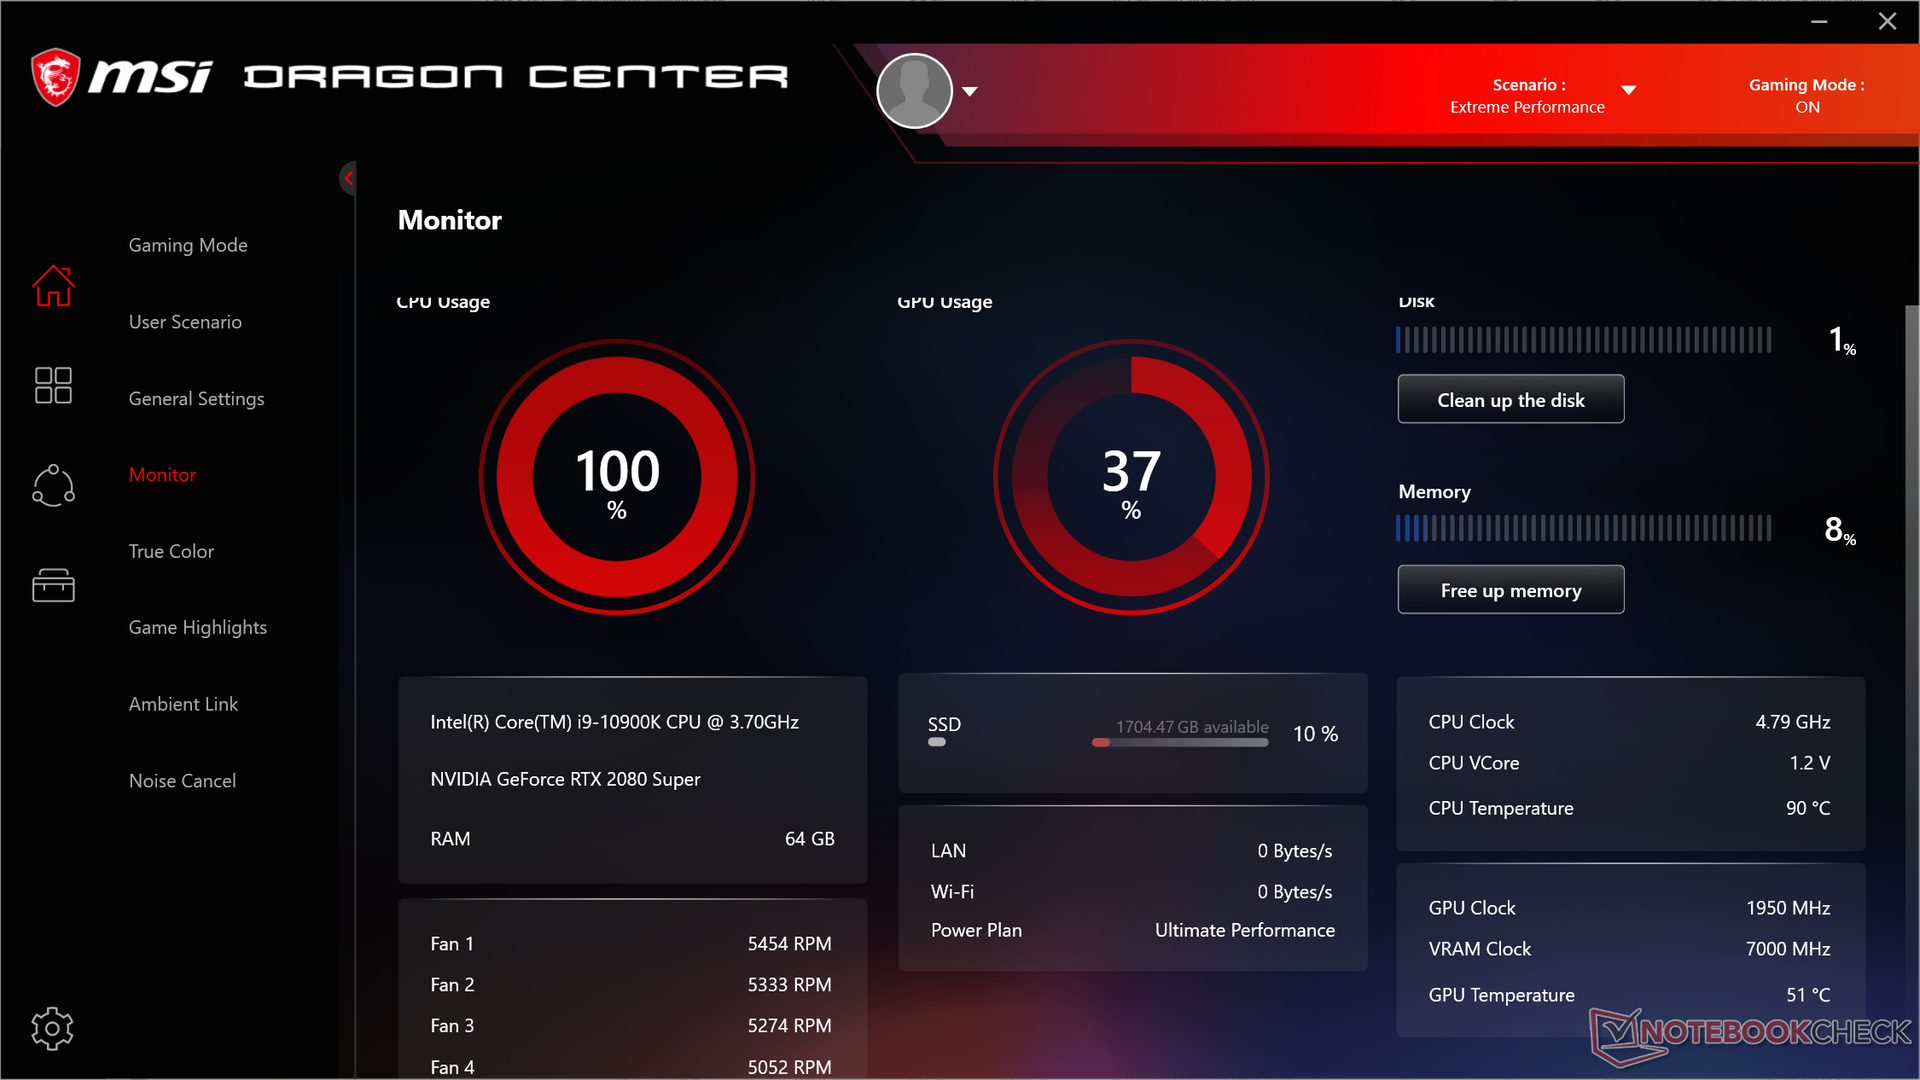
Stress Test
When running Prime95 to stress the CPU on Turbo Fan/Cooler Boost mode, clock rates would boost to and stabilize at 4.8 GHz. Intel rates its Core i9-10900K for a maximum Turbo Boost of 4.8 GHz meaning that the GT76 is able to maintain this clock rate ceiling — an impressive feat for a laptop running on a CPU designed for desktops. Core temperature would stabilize at a blistering 89 C, however, and so there is almost no headroom for any end-user overclocking. Temperatures are still better than what we observed on the Alienware Area-51m nonetheless.
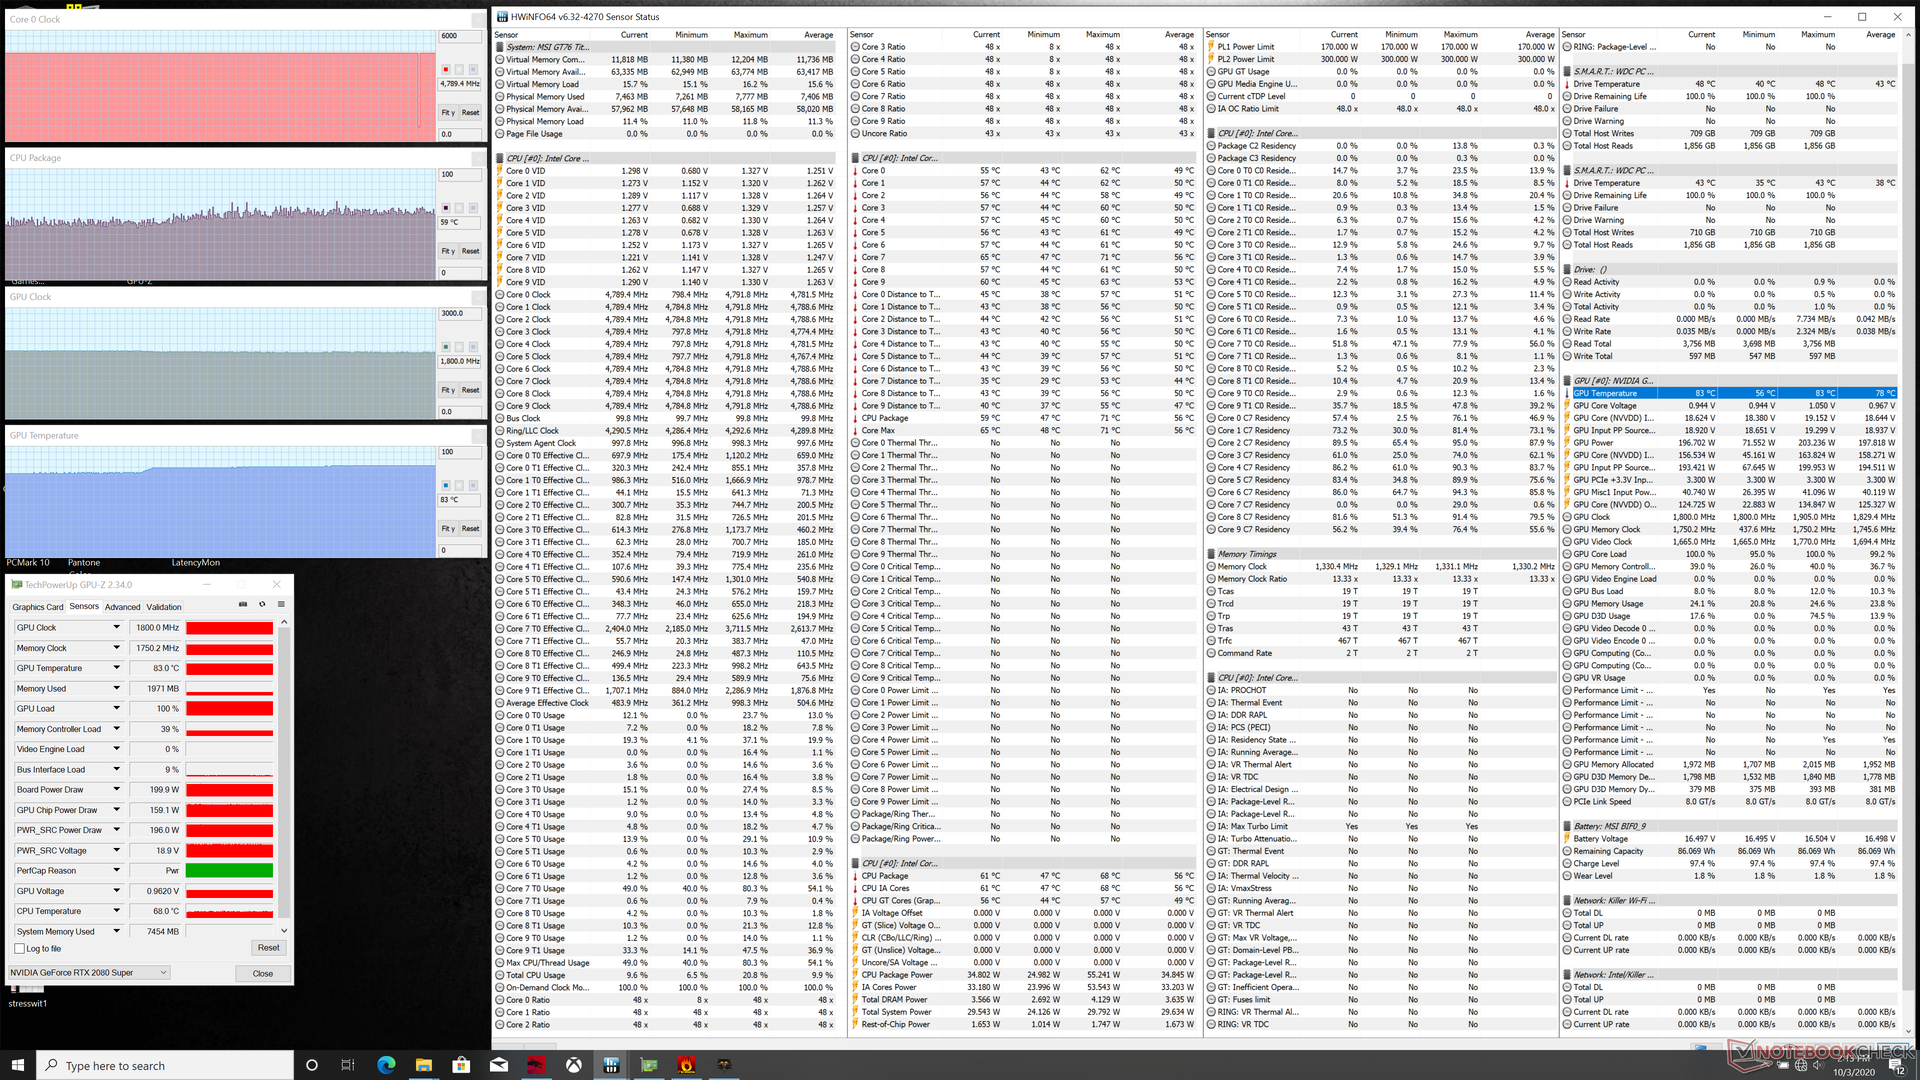
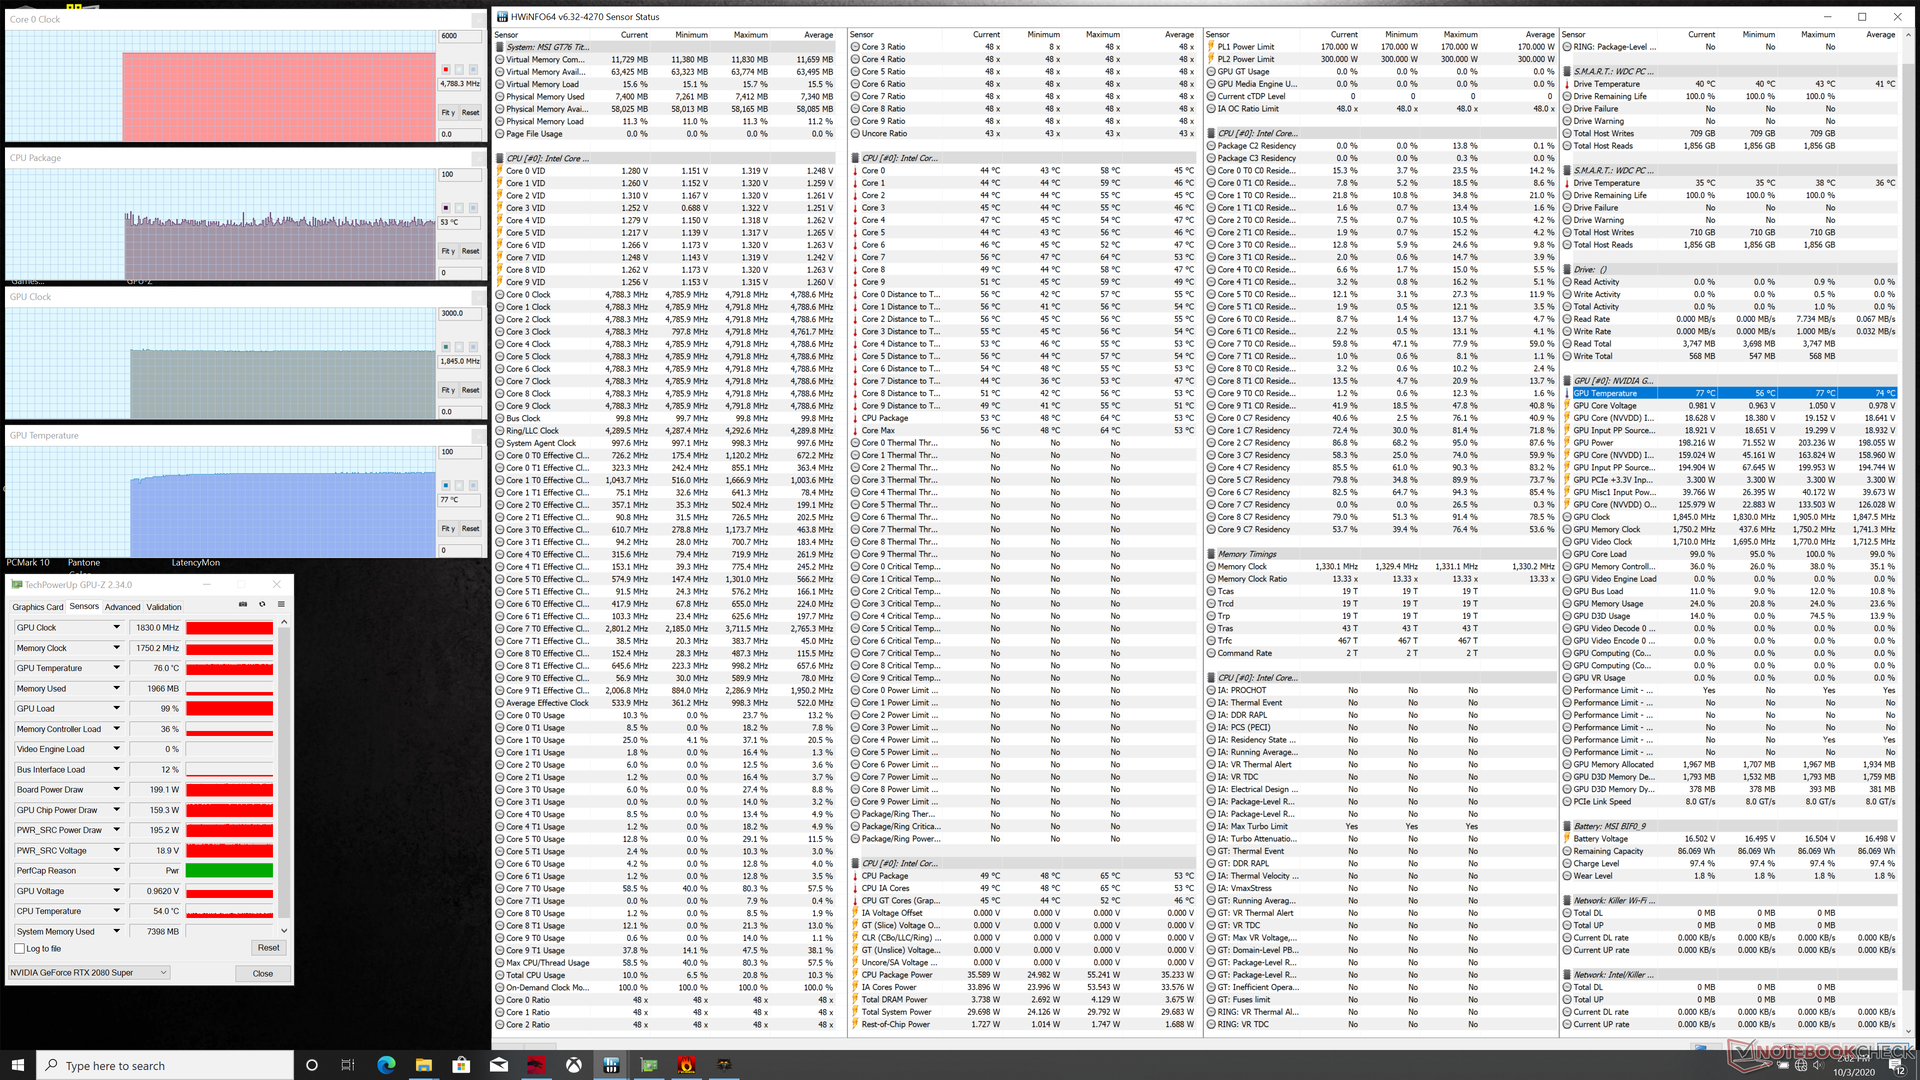
Running Witcher 3 on Turbo Fan mode would result in stable CPU and GPU temperatures of 53 C and 77 C. If Turbo Fan is off, then temperatures would stabilize at 59 C and 83 C while clock rates remain the same. Thus, it's not necessary to play games on Turbo Fan mode as performance will not be impacted. Instead, the feature becomes more useful if running extreme loads at 100 percent CPU or GPU utilization.
Running on battery power will limit performance. A Fire Strike run on batteries would return Physics and Graphics scores of 17234 and 11304 points, respectively, compared to 29145 and 24211 points on mains.
| CPU Clock (GHz) | GPU Clock (MHz) | Average CPU Temperature (°C) | Average GPU Temperature (°C) | |
| System Idle (Turbo Fan on) | -- | -- | 32 | 30 |
| Prime95 Stress (Turbo Fan on) | 4.8 | -- | 89 | 30 |
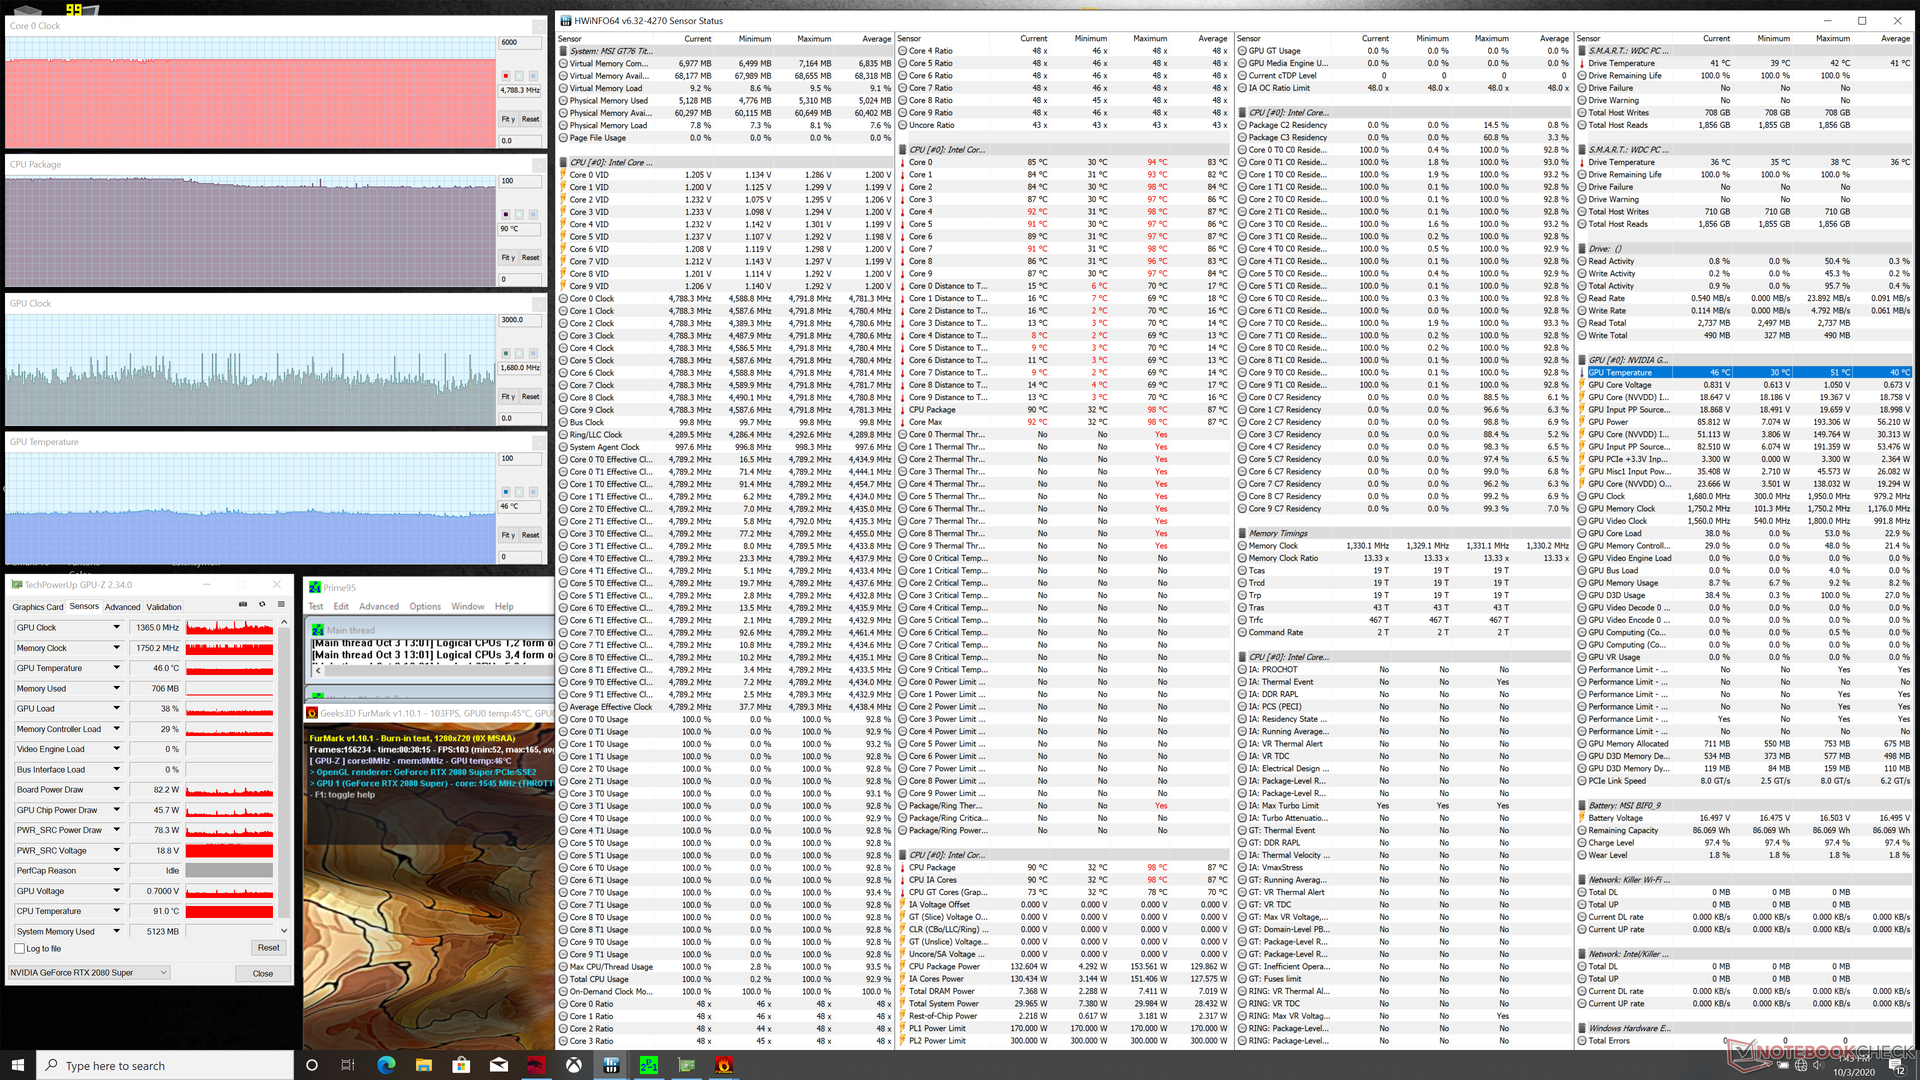
| Prime95 + FurMark Stress (Turbo Fan on) | 4.8 | ~1365 | 90 - 98 | 46 |
| Witcher 3 Stress (Turbo Fan on) | 4.8 | 1830 | ~53 | 77 |
| Witcher 3 Stress (Turbo Fan off) | 4.8 | 1800 | ~59 | 83 |
Speakers


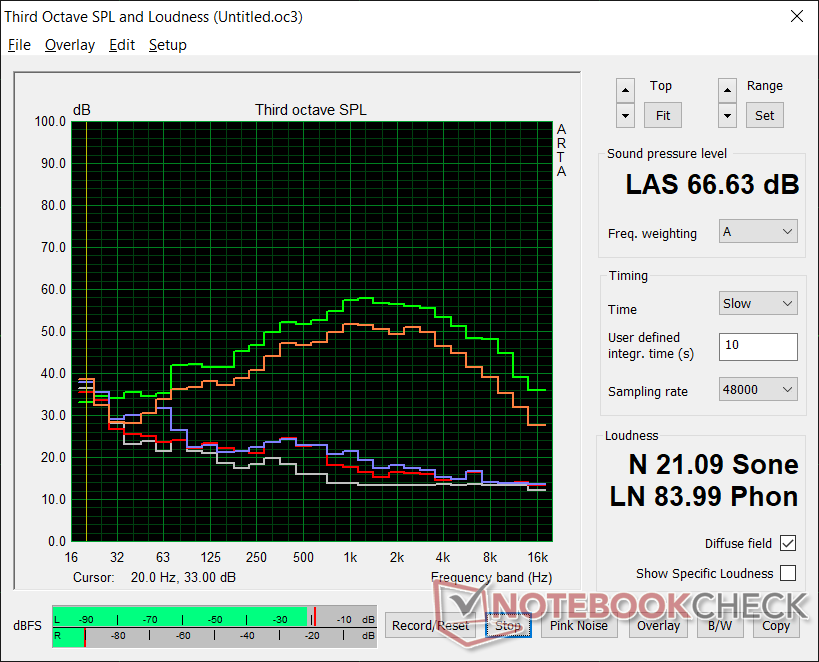
MSI GT76 Titan DT 10SGS audio analysis
(+) | speakers can play relatively loud (83.2 dB)
Bass 100 - 315 Hz
(±) | reduced bass - on average 8.6% lower than median
(±) | linearity of bass is average (11% delta to prev. frequency)
Mids 400 - 2000 Hz
(+) | balanced mids - only 3.1% away from median
(+) | mids are linear (6.9% delta to prev. frequency)
Highs 2 - 16 kHz
(+) | balanced highs - only 3% away from median
(+) | highs are linear (5.5% delta to prev. frequency)
Overall 100 - 16.000 Hz
(+) | overall sound is linear (9.9% difference to median)
Compared to same class
» 5% of all tested devices in this class were better, 2% similar, 94% worse
» The best had a delta of 6%, average was 18%, worst was 132%
Compared to all devices tested
» 4% of all tested devices were better, 1% similar, 95% worse
» The best had a delta of 4%, average was 24%, worst was 134%
Apple MacBook 12 (Early 2016) 1.1 GHz audio analysis
(+) | speakers can play relatively loud (83.6 dB)
Bass 100 - 315 Hz
(±) | reduced bass - on average 11.3% lower than median
(±) | linearity of bass is average (14.2% delta to prev. frequency)
Mids 400 - 2000 Hz
(+) | balanced mids - only 2.4% away from median
(+) | mids are linear (5.5% delta to prev. frequency)
Highs 2 - 16 kHz
(+) | balanced highs - only 2% away from median
(+) | highs are linear (4.5% delta to prev. frequency)
Overall 100 - 16.000 Hz
(+) | overall sound is linear (10.2% difference to median)
Compared to same class
» 7% of all tested devices in this class were better, 2% similar, 91% worse
» The best had a delta of 5%, average was 19%, worst was 53%
Compared to all devices tested
» 4% of all tested devices were better, 1% similar, 95% worse
» The best had a delta of 4%, average was 24%, worst was 134%
Energy Management
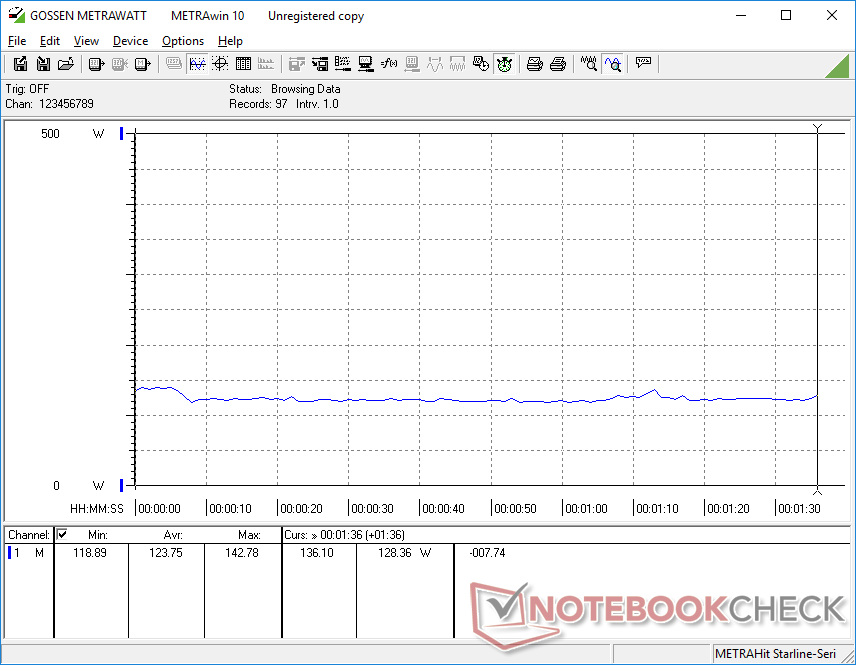
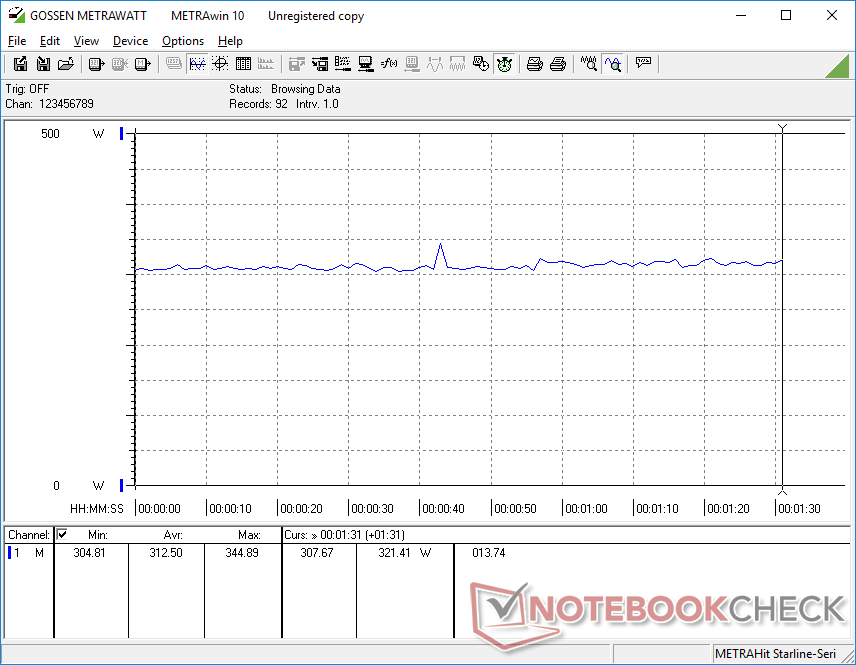
Power Consumption
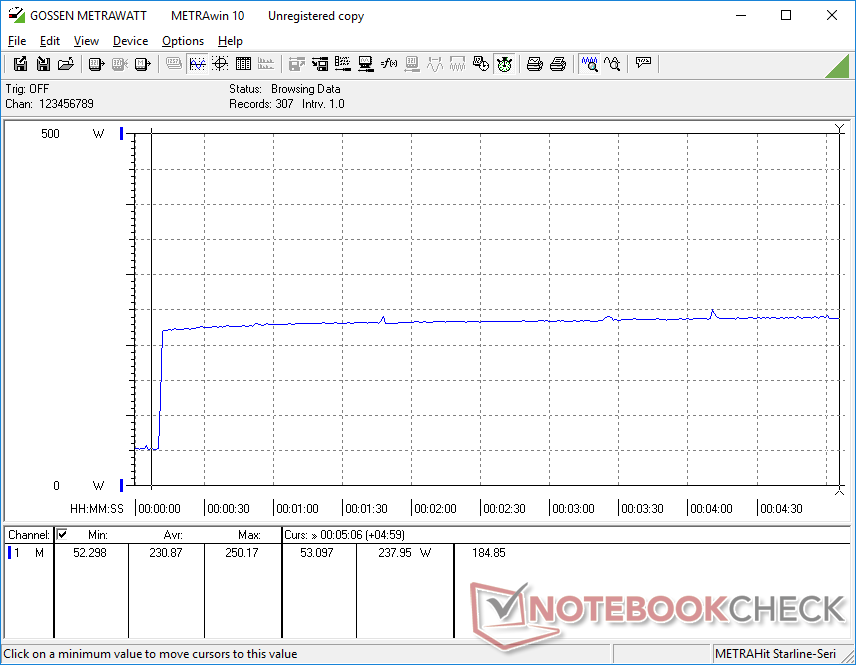
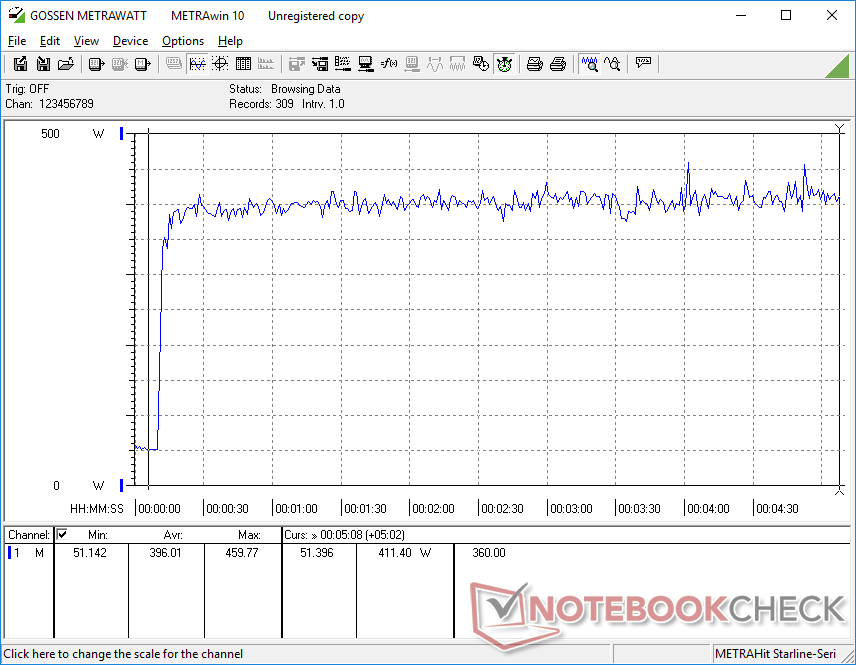
Power consumption is very high rivaling that of the Alienware Area-51m. Idling on desktop draws 26 W to as high as 54 W when on Ultimate Performance mode with Turbo Fan active. Running Witcher 3 demands 313 W or 11 percent more than last year's GT76 Titan with the regular GeForce RTX 2080. This increase is acceptable relative to the 6 percent GPU advantage between the RTX 2080 and RTX 2080 Super and 25 percent multi-thread advantage between the i9-9900K and i9-10900K.
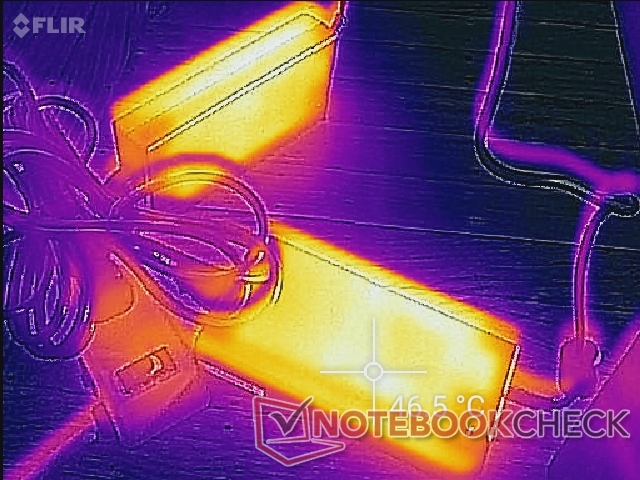
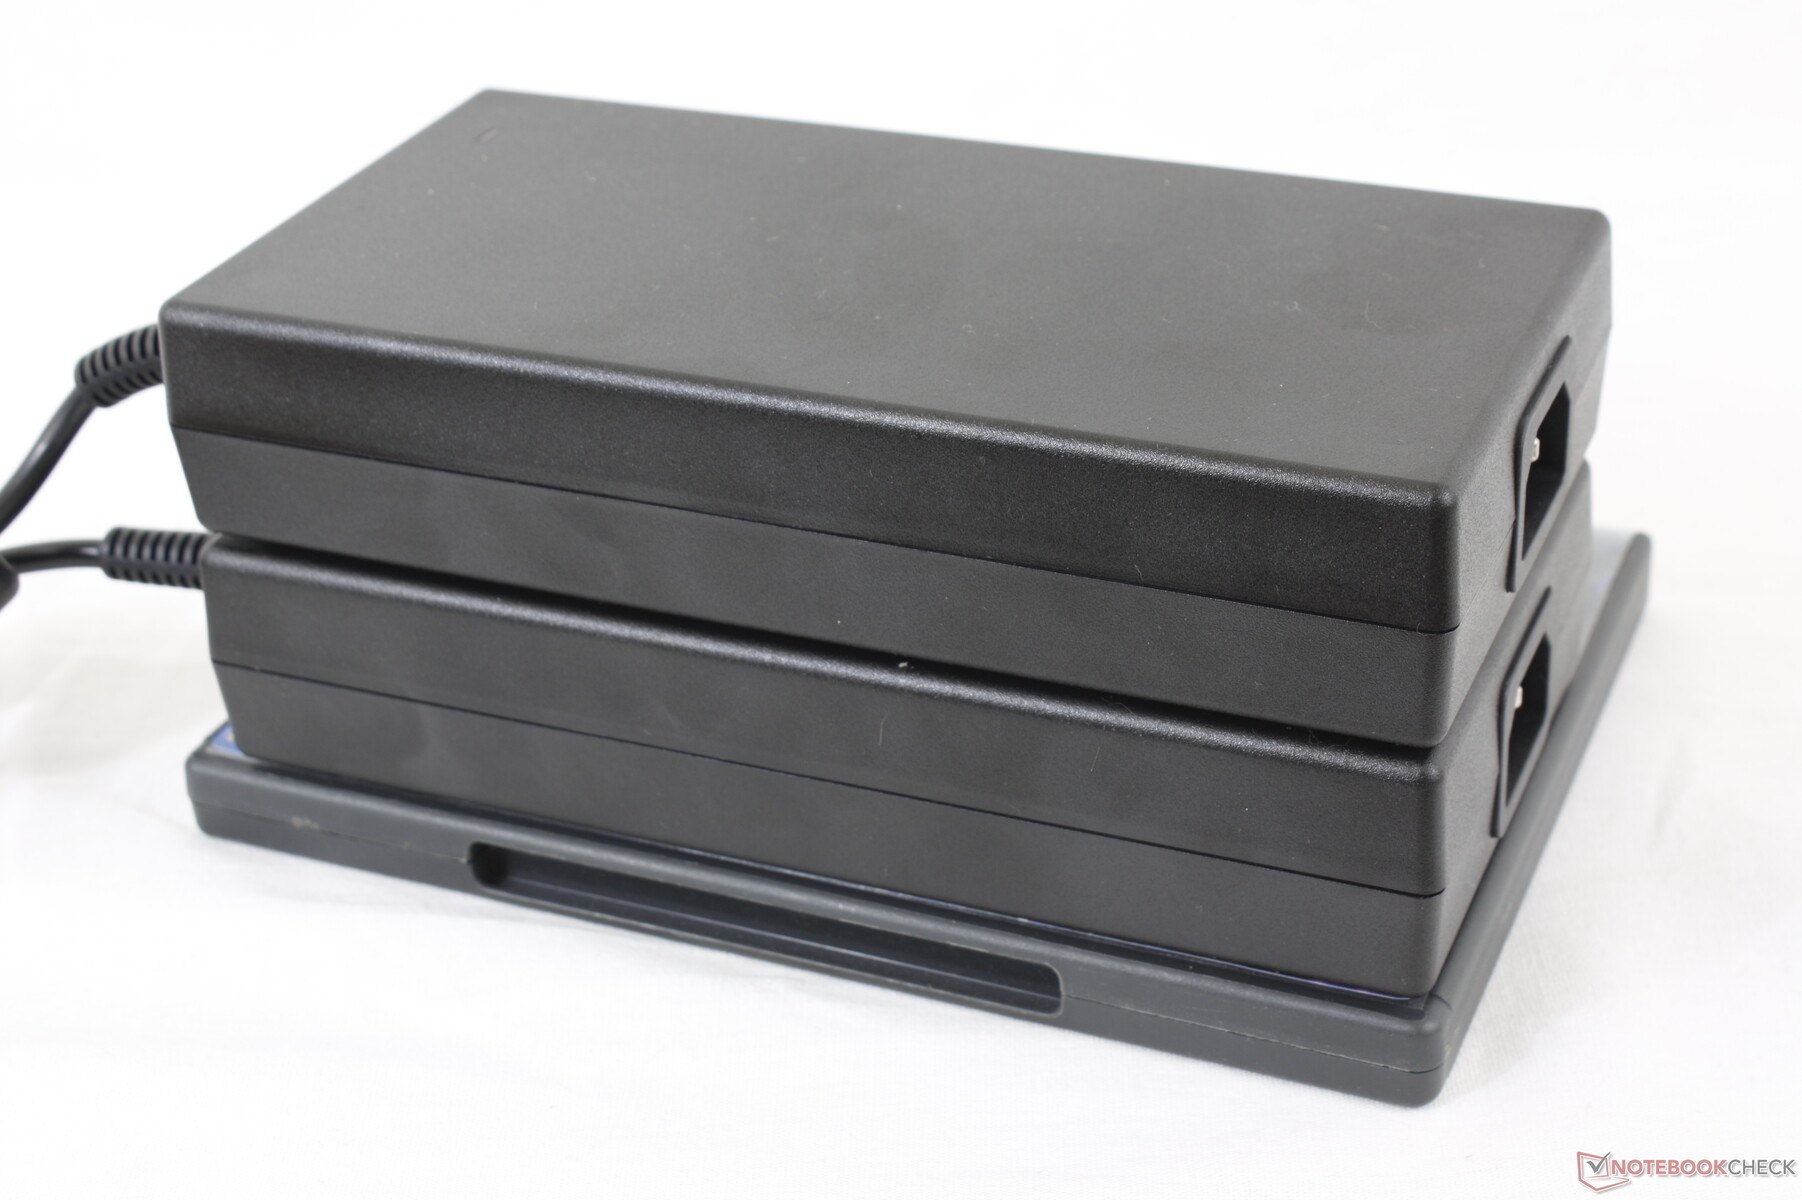
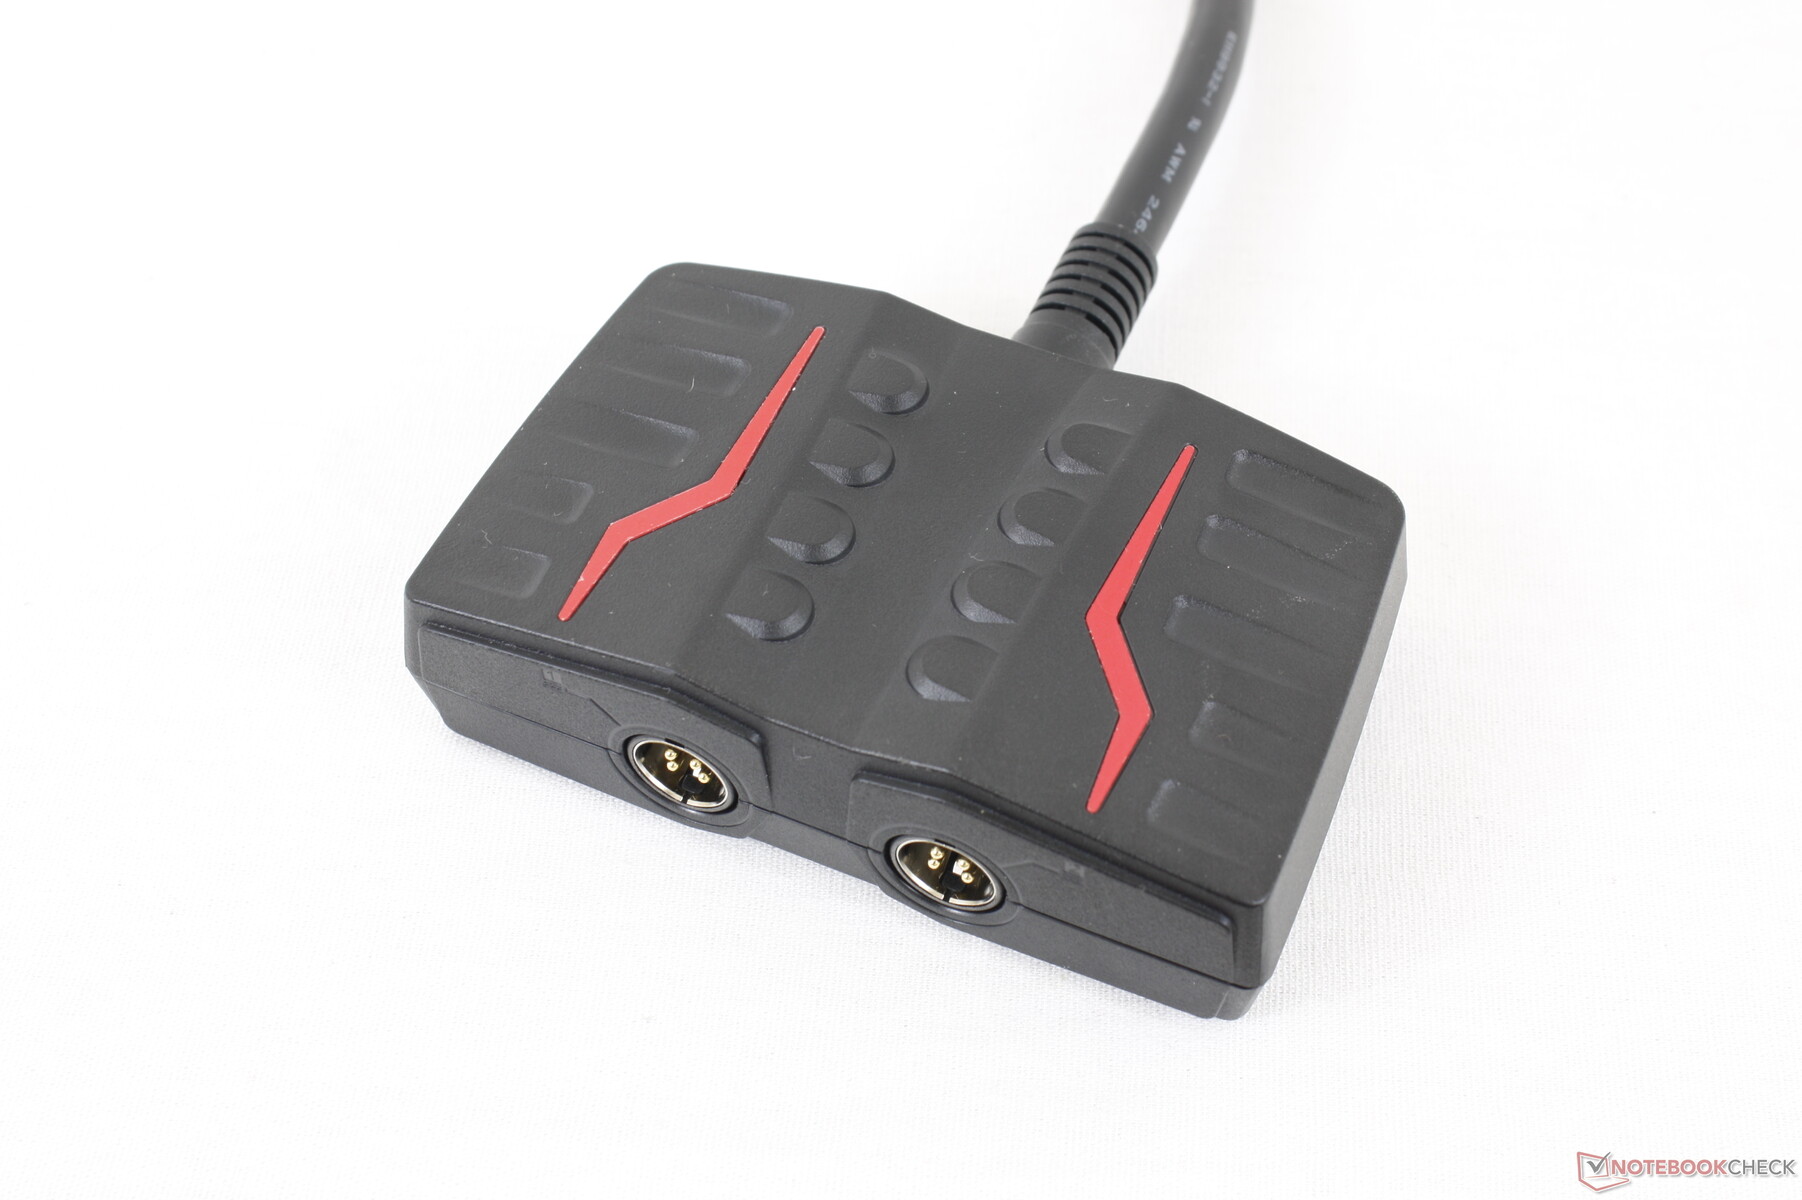
We're able to record a combined maximum consumption of 459.8 W from the two large (2x ~17.8 x 9 x 3.6 cm) 230 W AC adapters. These Chicony AC adapters are used on a number of other high-performance MSI laptops like the GS75. Each adapter has its own three-prong power cable which all connect to a proprietary MSI adapter before reaching the laptop. Together, these necessary cables and adapters weigh just over 2.4 kg.
| Off / Standby | |
| Idle | |
| Load |
|
Key:
min: | |
| MSI GT76 Titan DT 10SGS i9-10900K, GeForce RTX 2080 Super Mobile, 2x WDC PC SN730 SDBPNTY-1T00 (RAID 0), IPS, 3840x2160, 17.3" | Asus ROG G703GXR i7-9750H, GeForce RTX 2080 Mobile, Samsung SSD PM981 MZVLB512HAJQ, IPS, 1920x1080, 17.3" | Alienware Area-51m i9-9900K RTX 2080 i9-9900K, GeForce RTX 2080 Mobile, 2x SK Hynix PC400 512GB (RAID 0), IPS, 1920x1080, 17.3" | Asus Strix Scar 17 G732LXS i9-10980HK, GeForce RTX 2080 Super Mobile, 2x Intel SSD 660p 1TB SSDPEKNW010T8 (RAID 0), IPS, 1920x1080, 17.3" | SCHENKER XMG Pro 17 PB71RD-G i7-9750H, GeForce RTX 2060 Mobile, Samsung SSD 970 EVO Plus 500GB, IPS, 1920x1080, 17.3" | MSI GE75 9SG i9-9880H, GeForce RTX 2080 Mobile, Samsung SSD PM981 MZVLB1T0HALR, AHVA, 1920x1080, 17.3" | MSI GT76 Titan DT 9SG i9-9900K, GeForce RTX 2080 Mobile, 2x Samsung PM961 MZVLW256HEHP (RAID 0), IPS, 1920x1080, 17.3" | |
|---|---|---|---|---|---|---|---|
| Power Consumption | 13% | 7% | 22% | 48% | 38% | 30% | |
| Idle Minimum * | 25.9 | 27 -4% | 23.3 10% | 16 38% | 11 58% | 13.9 46% | 14 46% |
| Idle Average * | 38 | 32 16% | 33.5 12% | 25 34% | 18 53% | 18.8 51% | 18 53% |
| Idle Maximum * | 53.2 | 39 27% | 38.4 28% | 35 34% | 28 47% | 23.1 57% | 23 57% |
| Load Average * | 123.8 | 124 -0% | 114.1 8% | 177 -43% | 99 20% | 112.3 9% | 114 8% |
| Witcher 3 ultra * | 312.5 | 274 12% | 339.5 -9% | 227 27% | 146 53% | 231 26% | 283 9% |
| Load Maximum * | 459.8 | 338 26% | 485.1 -6% | 280 39% | 210 54% | 291.5 37% | 443 4% |
* ... smaller is better
Battery Life
Runtimes are short at just under 2.5 hours of real-world WLAN use when on the Balanced profile despite the large 90 Wh battery. Recharging from empty to full capacity takes two full hours. Keep in mind that both AC adapters must be connected or else the laptop will not recharge at all unlike on the Alienware Area-51m.
The system cannot be recharged via USB-C.
| MSI GT76 Titan DT 10SGS i9-10900K, GeForce RTX 2080 Super Mobile, 90 Wh | Asus ROG G703GXR i7-9750H, GeForce RTX 2080 Mobile, 96 Wh | Alienware Area-51m i9-9900K RTX 2080 i9-9900K, GeForce RTX 2080 Mobile, 90 Wh | Asus Strix Scar 17 G732LXS i9-10980HK, GeForce RTX 2080 Super Mobile, 66 Wh | SCHENKER XMG Pro 17 PB71RD-G i7-9750H, GeForce RTX 2060 Mobile, 62 Wh | MSI GE75 9SG i9-9880H, GeForce RTX 2080 Mobile, 65 Wh | MSI GT76 Titan DT 9SG i9-9900K, GeForce RTX 2080 Mobile, 90 Wh | |
|---|---|---|---|---|---|---|---|
| Battery Runtime | 151% | -13% | 144% | 67% | 101% | 107% | |
| WiFi v1.3 | 146 | 367 151% | 127 -13% | 356 144% | 244 67% | 294 101% | 302 107% |
| Reader / Idle | 484 | 155 | 602 | 313 | 409 | ||
| Load | 61 | 66 | 89 | 79 | 52 |
Pros
Cons
Verdict
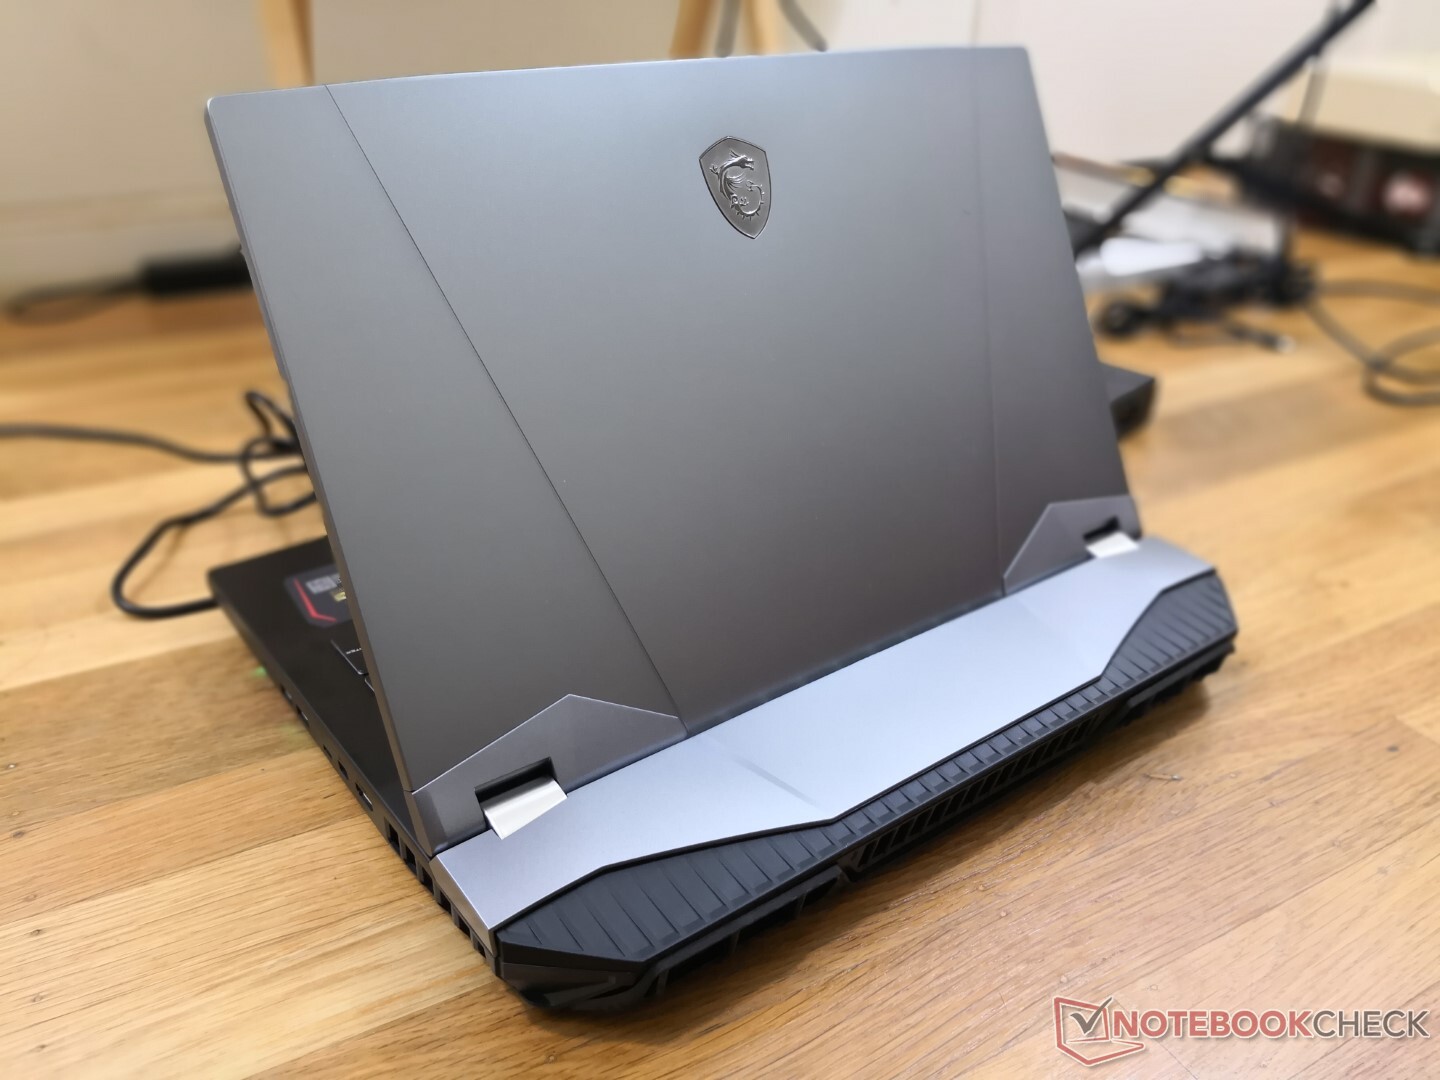
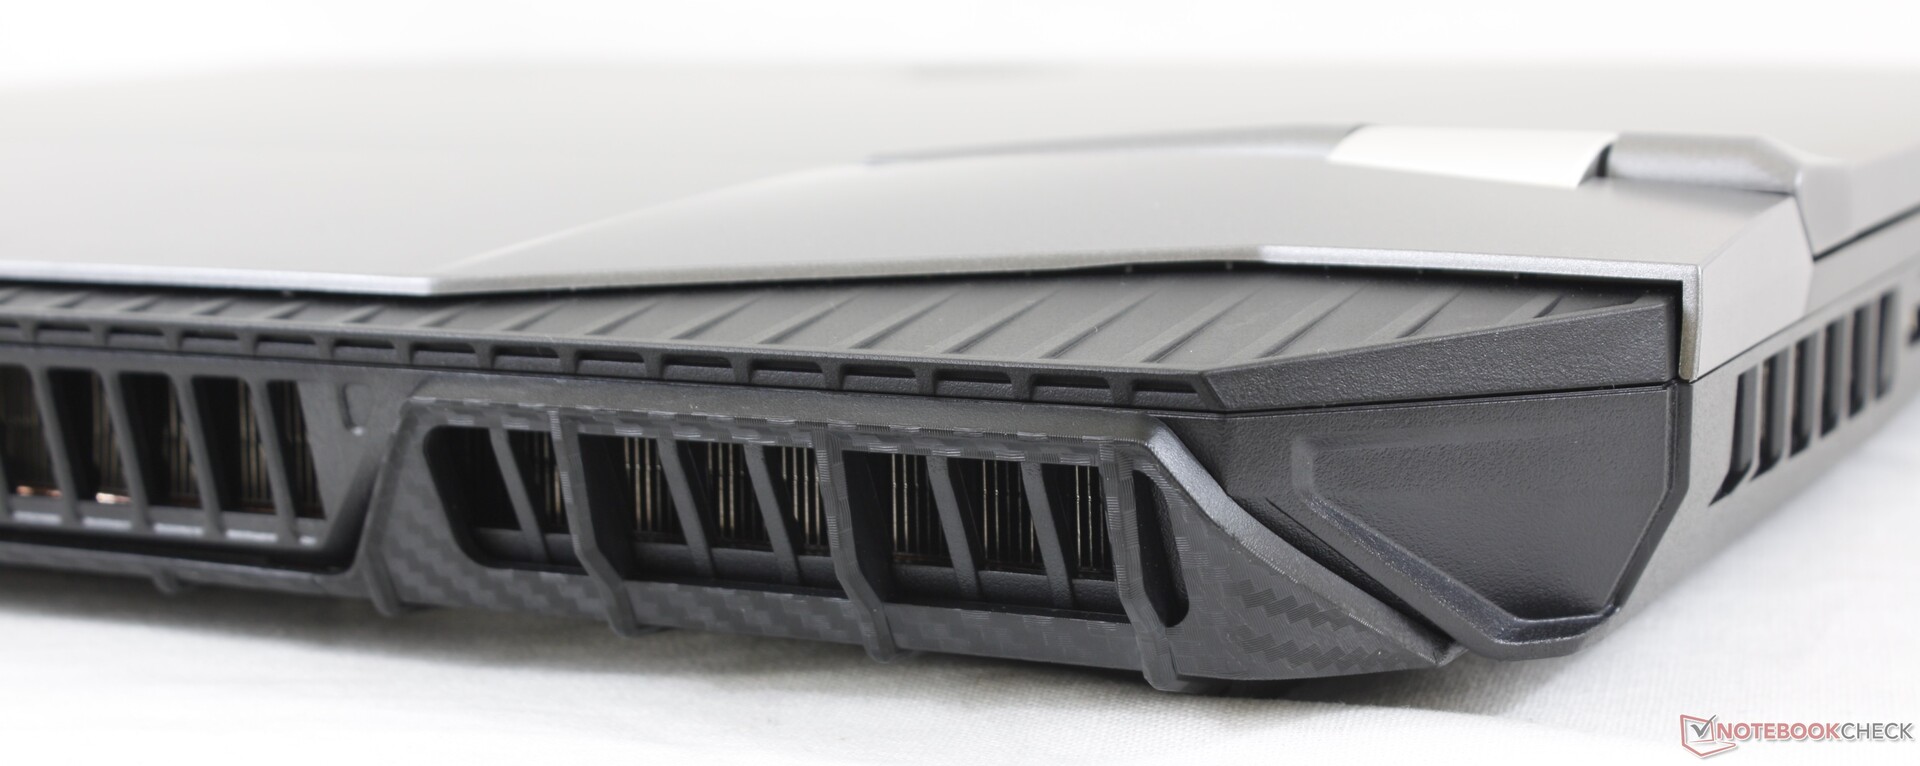
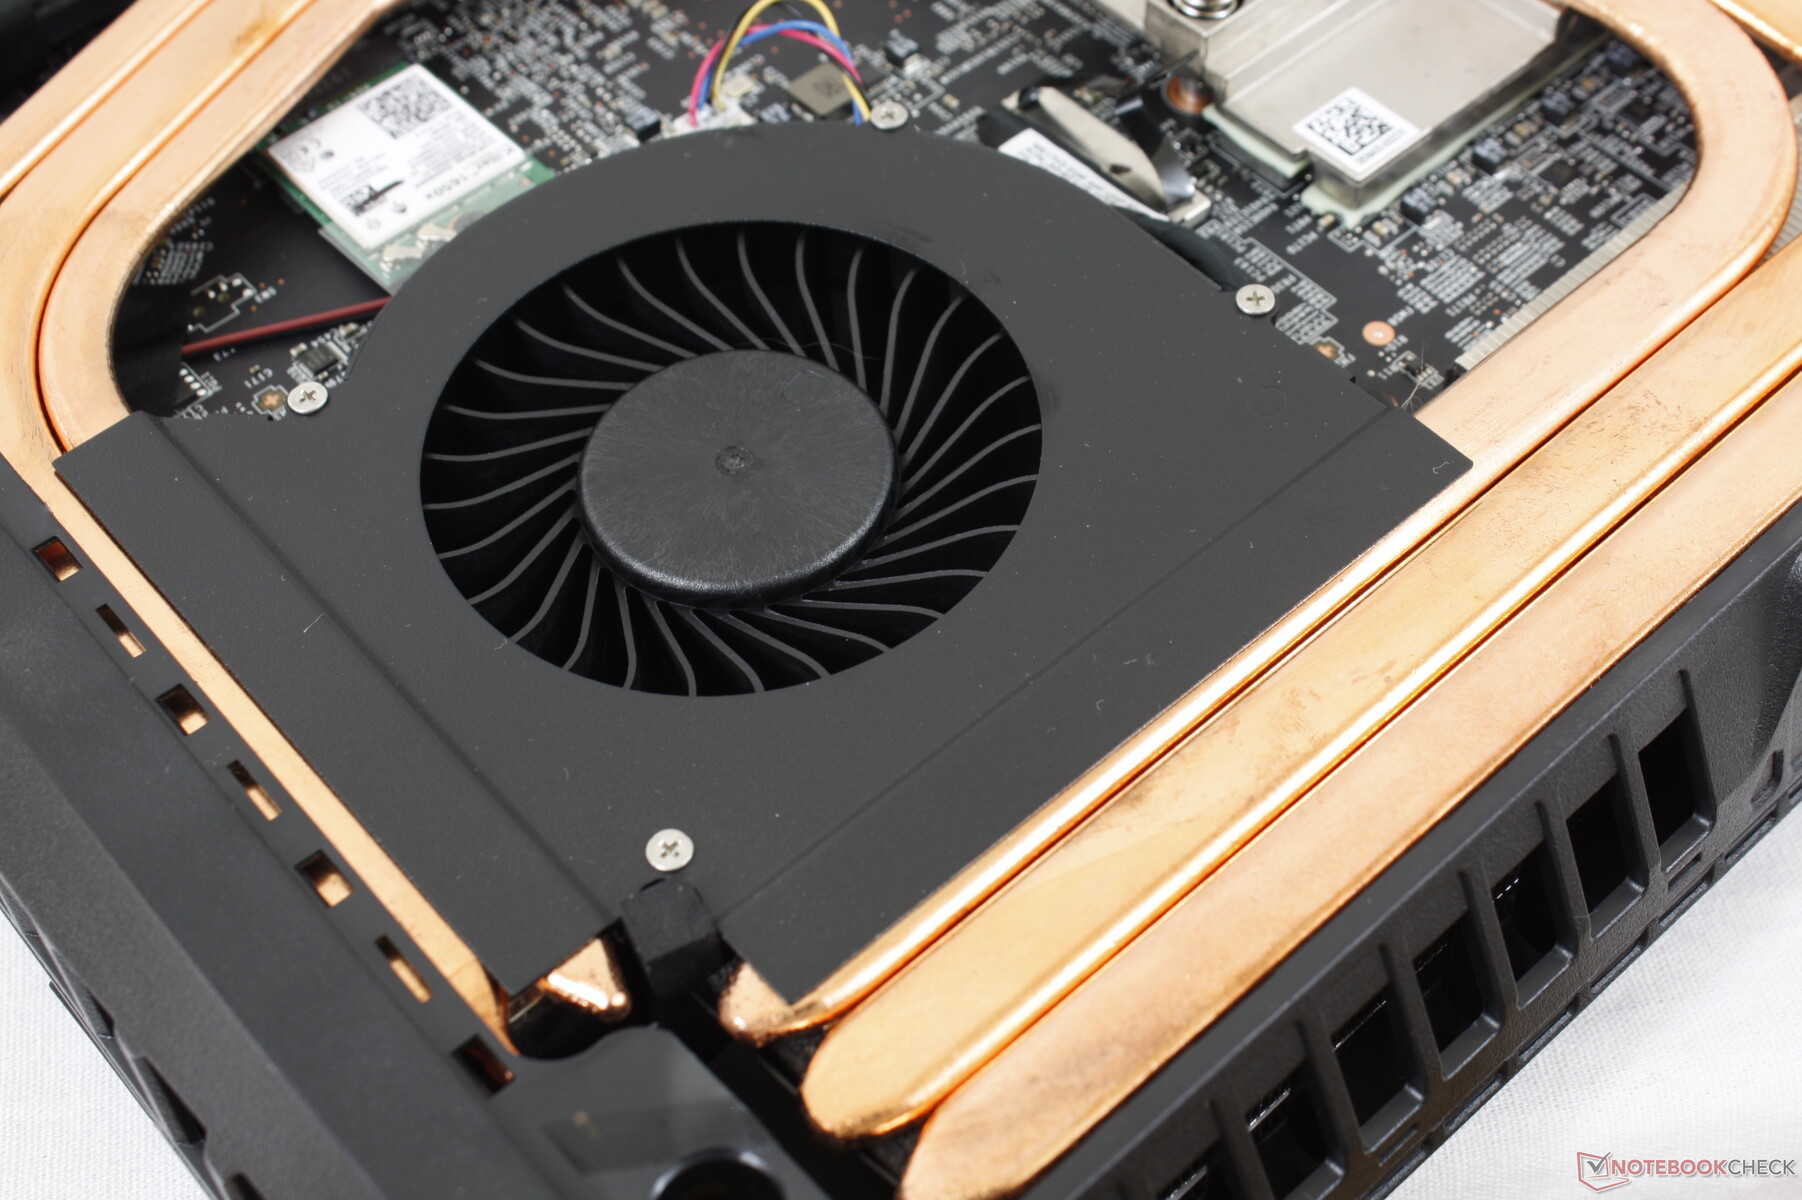
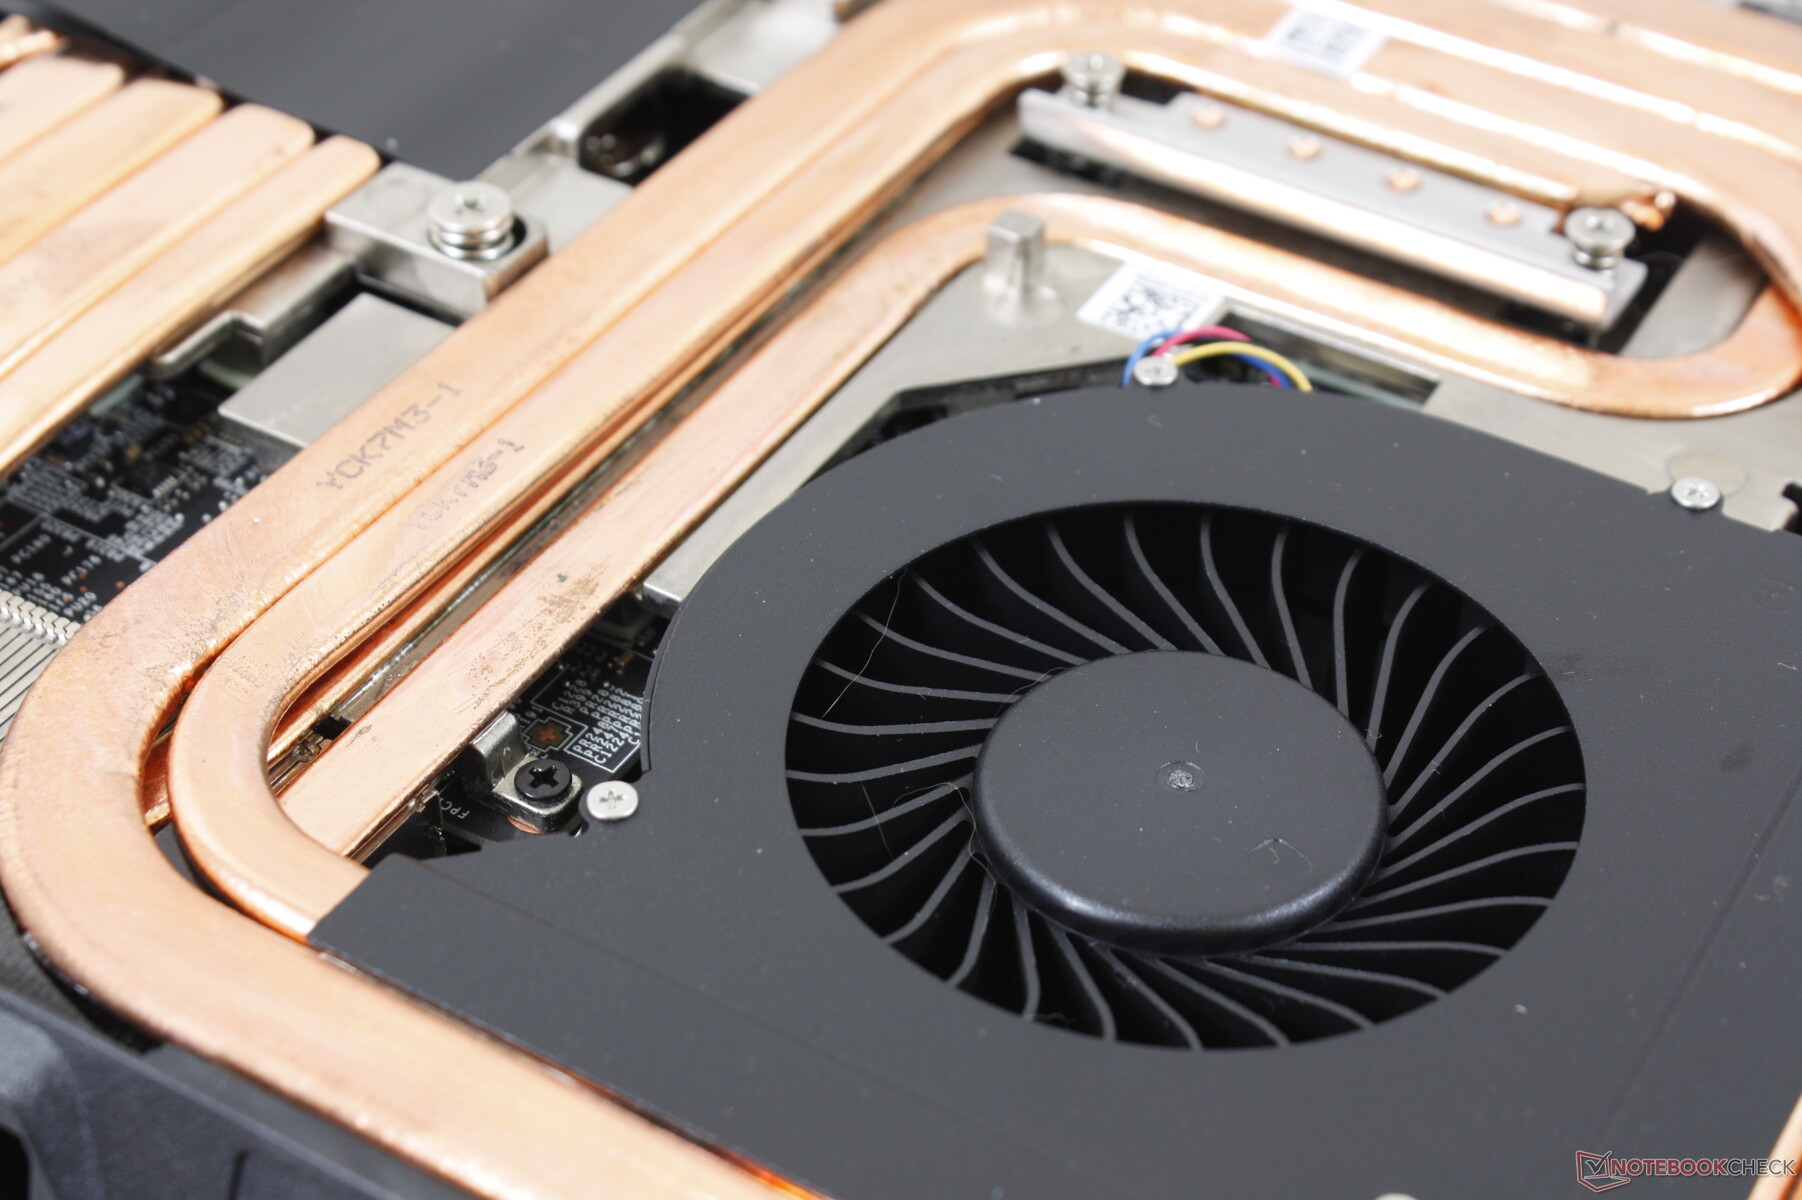
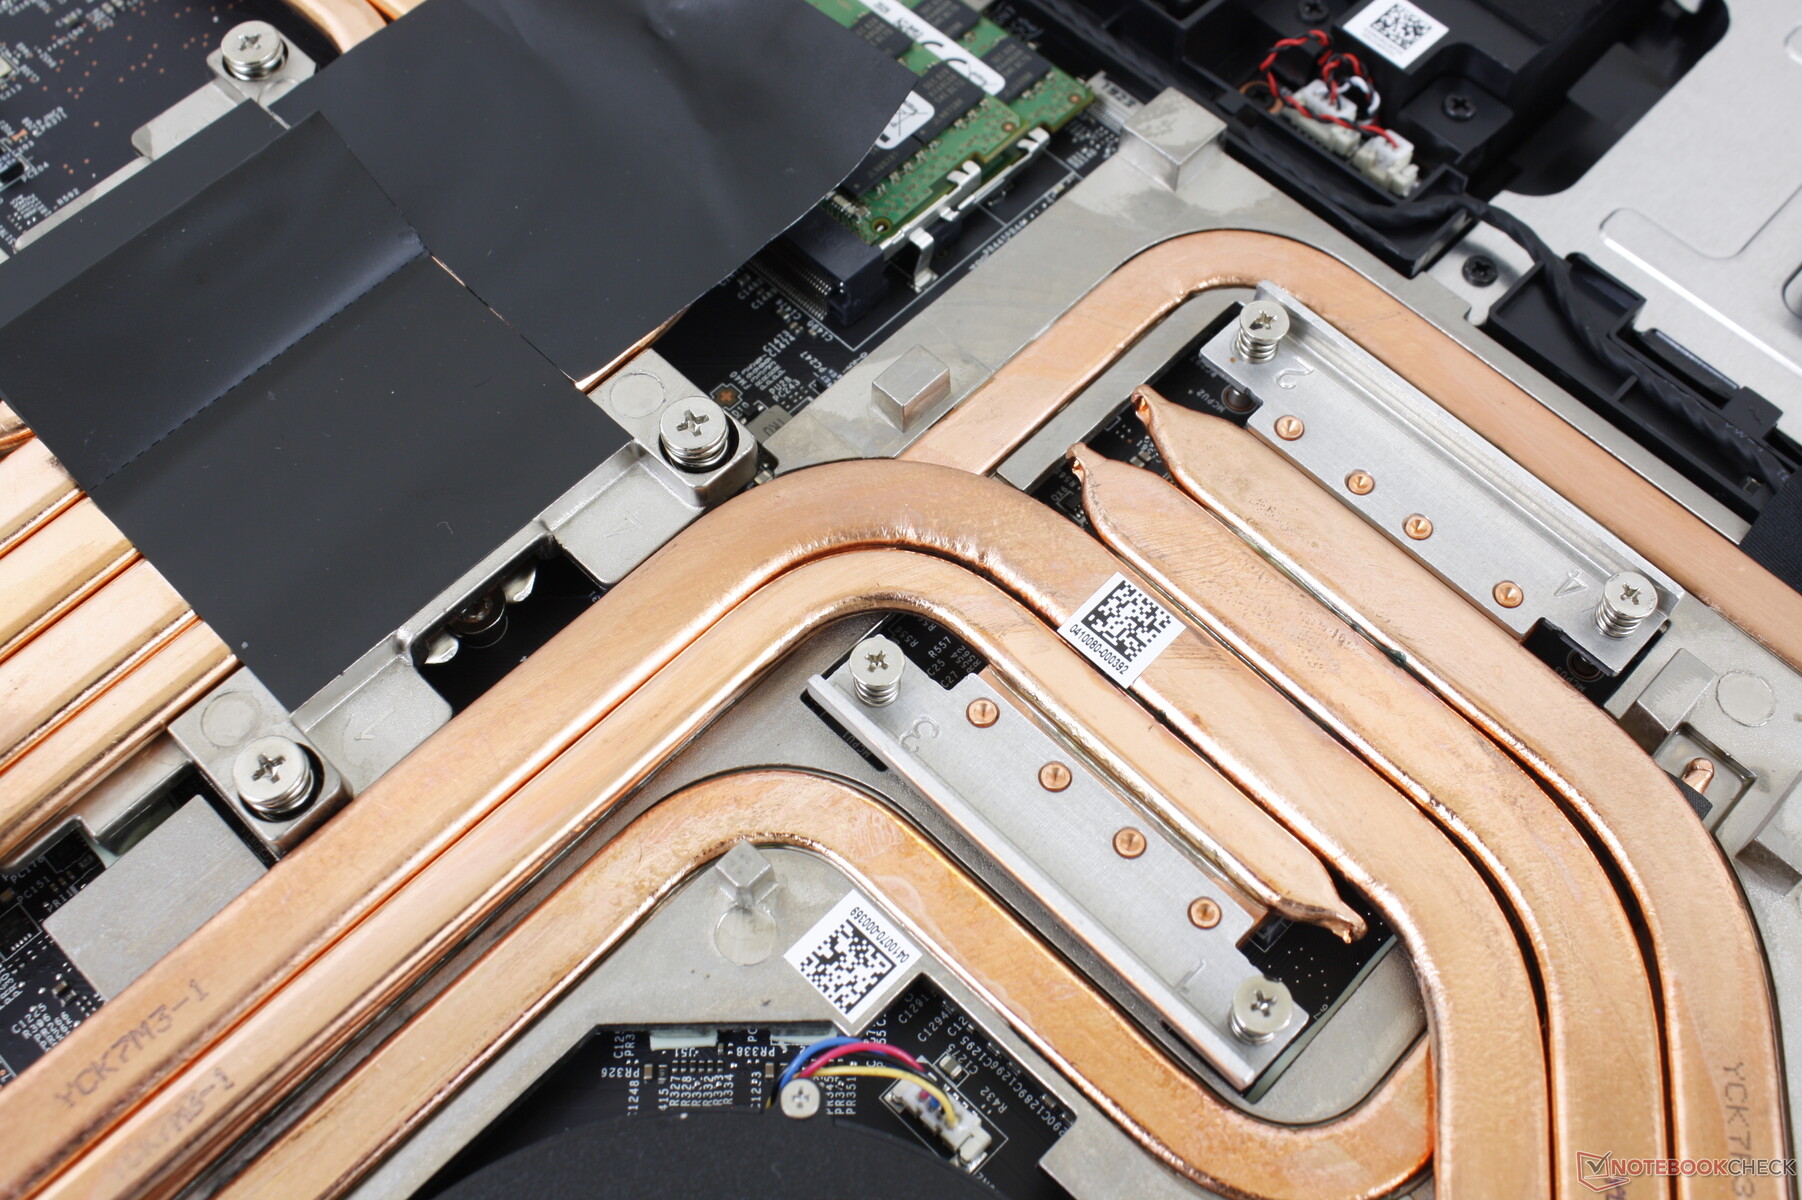
The GT76 Titan has a key advantage over both the Dell Alienware Area-51m and Asus ROG G703: core temperatures. The MSI system is able to run its processors cooler when under demanding loads which isn't surprising given that its network of 11 internal heat pipes is the largest we've ever seen on a 17.3-inch laptop. The CPU and GPU are independently cooled with no overlapping heat pipes to better support overclocking efforts.
Other notable advantages include the strong chassis design, easier servicing and the 120 Hz 4K UHD display option which is not yet a common feature.
There are a number of disadvantages. Fan noise is still very loud when gaming and the two AC adapters and cables feel even more bulky to carry around than the laptop itself. In comparison, Eurocom has a single AC adapter solution for its DTRs. Chassis size is also very large even for the category due to the protruding rear and enlarged cooling solution. The bottom panel can be tricky to snap back in place and the lack of both USB-C charging and G-Sync is a missed opportunity.
Core temperatures are cooler than many competitors in this category with the same desktop Core i9 and RTX Super options. You'll have to overlook the loud fans and bulky AC adapters to get the most out of this desktop replacement.
MSI GT76 Titan DT 10SGS
- 10/05/2020 v7 (old)
Allen Ngo


Price comparison
