 Deutsch
 English
 Español
 Français
 Italiano
 Nederlands
 Polski
 Português
 Русский
 Türkçe
 Svenska
 Chinese
 Magyar
Going all in on AMD: Dell G5 15 Special Edition Radeon RX 5600M Laptop Review
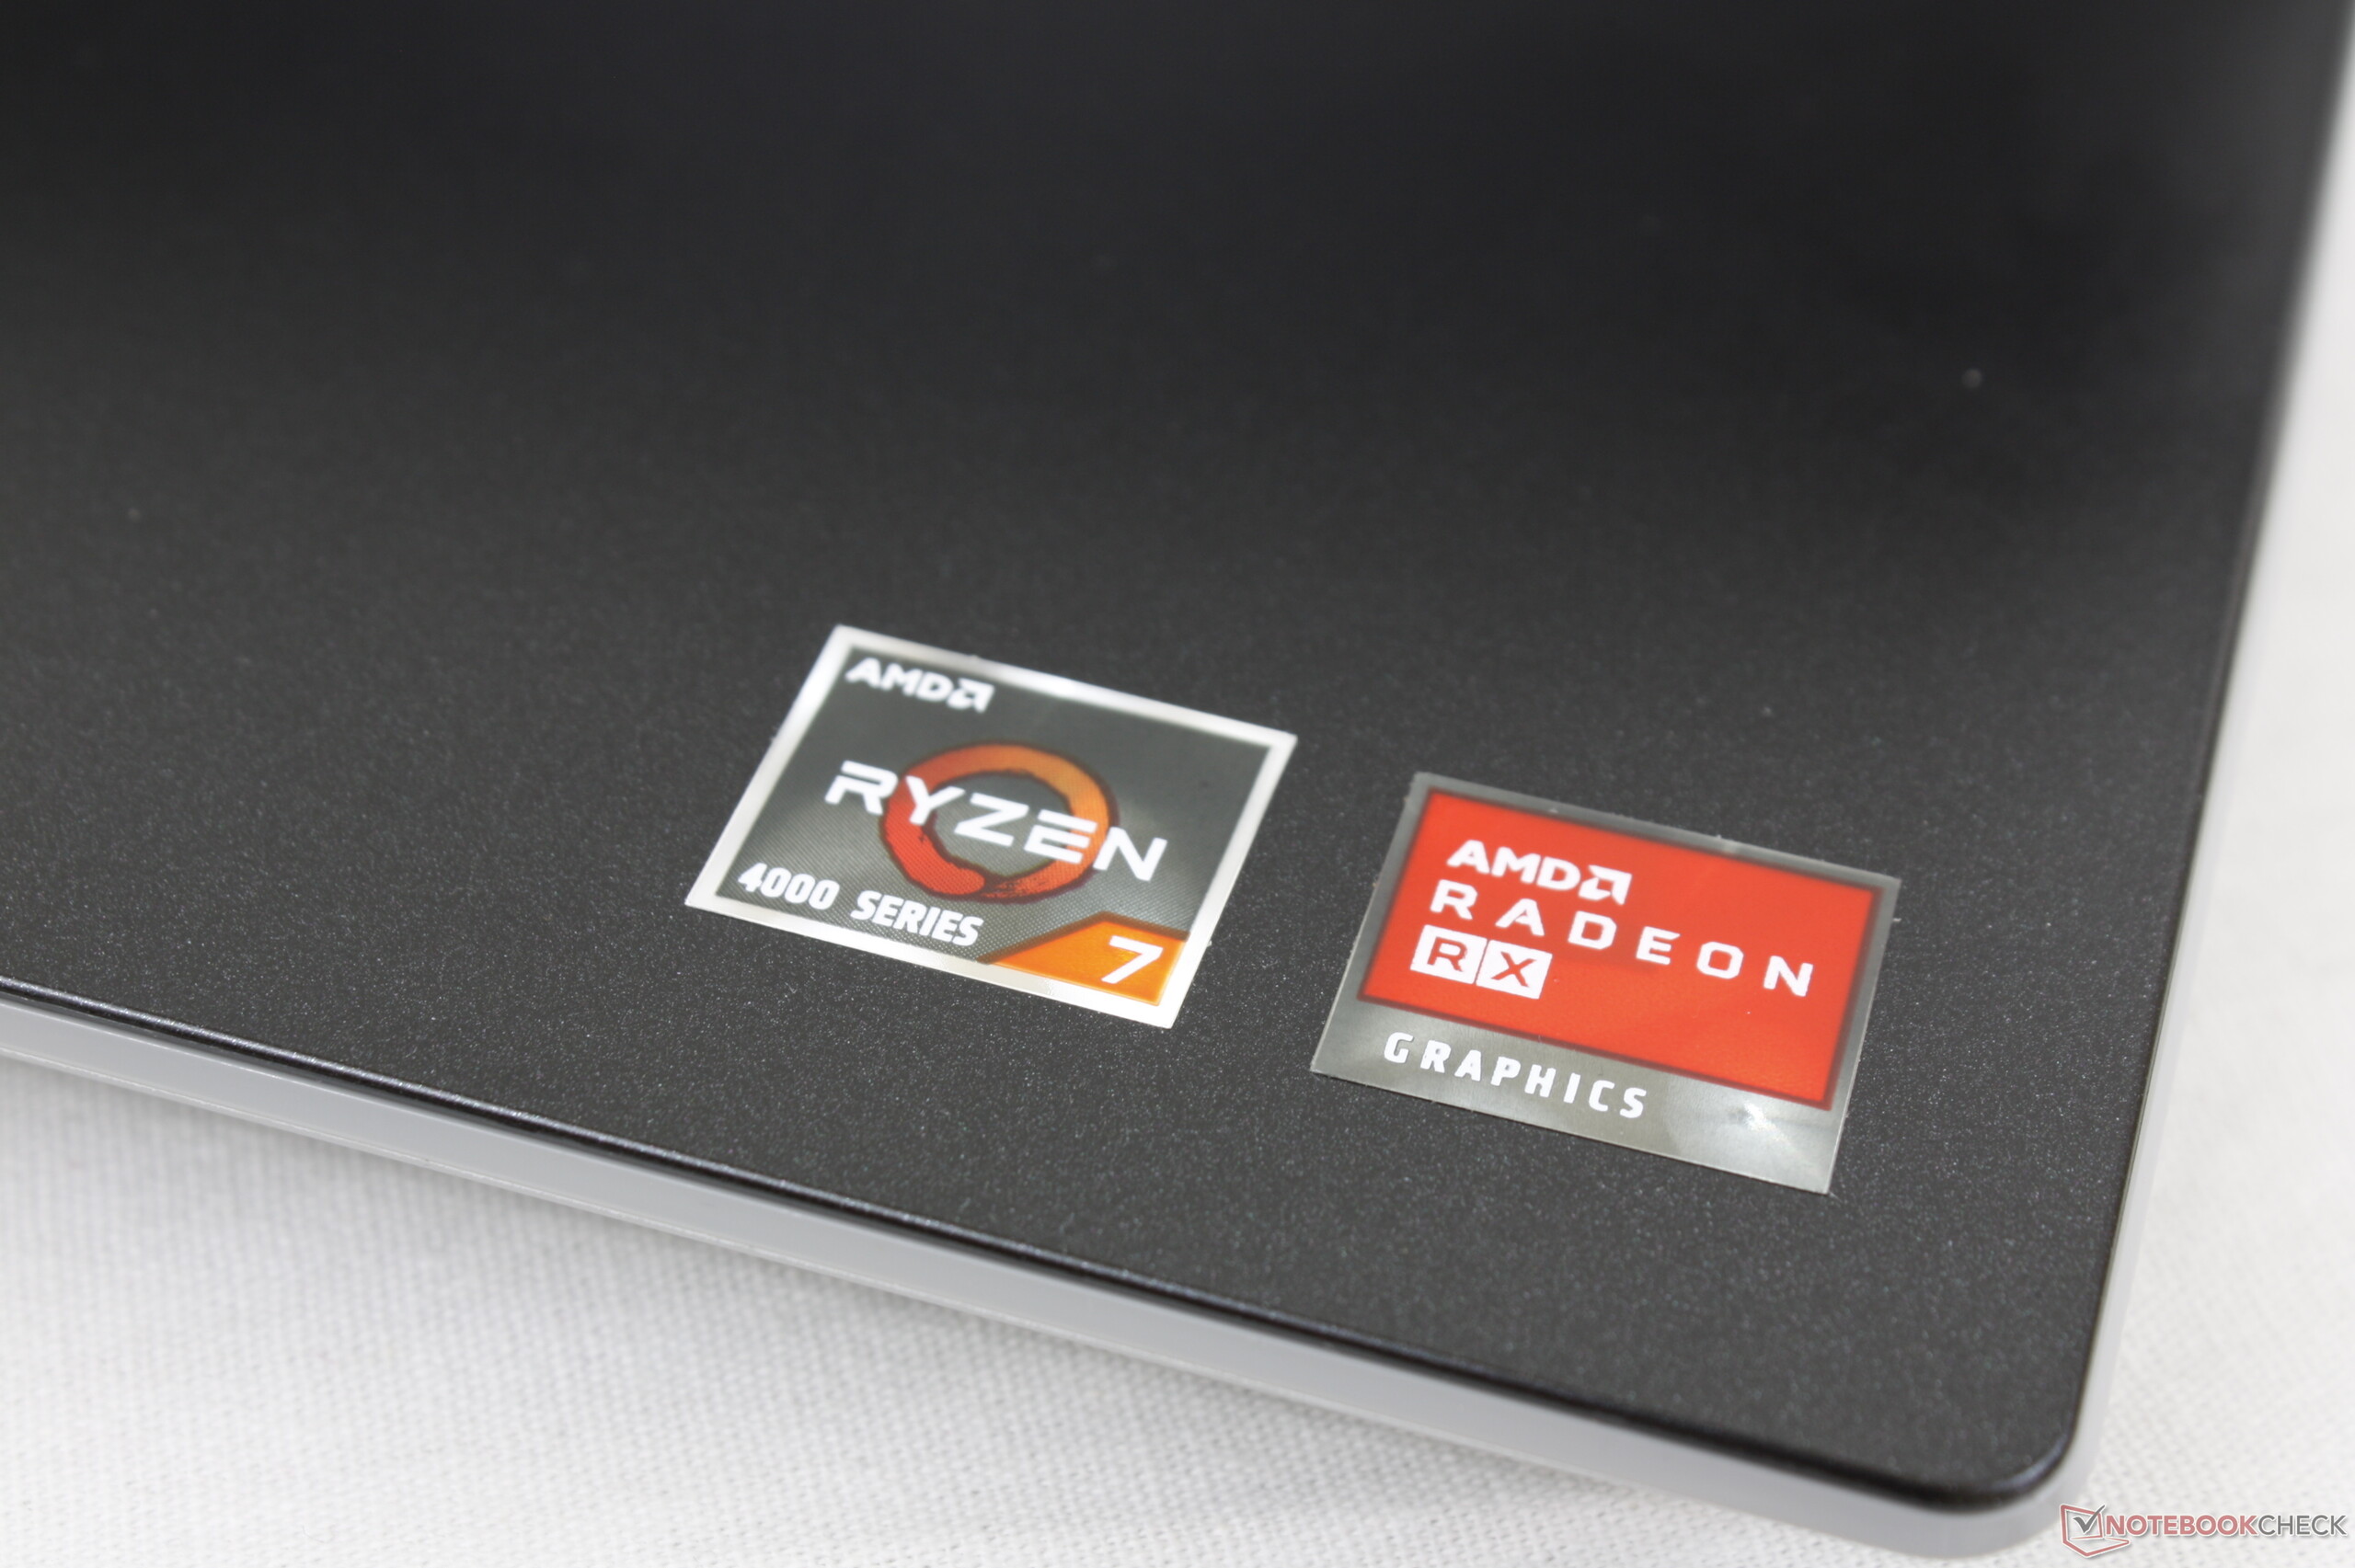
Had the Dell G5 15 Special Edition shipped with any ol' Intel CPU and Nvidia GPU, it would have likely slipped past most readers' radar. Instead, the system has carved a unique niche for itself by being the only laptop thus far to pair a 7 nm Ryzen 7 4800H CPU with a Radeon RX 5600M GPU. Furthermore, it is expected to be the only laptop in 2020 to integrate AMD SmartShift — the same performance-enhancing technology that's set to appear on the Sony Playstation 5 but not the XBox Series X. Combine these interesting set of features with the reasonable $850 to $1200 USD price point and we can see why there's so much hype regarding the performance of Dell's latest affordable gaming laptop.
The SKU we have in review is a higher-end configuration equipped with the Ryzen 7 4800H CPU, 1080p144 display, 16 GB of RAM, and 512 GB NVMe SSD for approximately $1250. Lesser SKUs are available with the Ryzen 5 4600H, 1080p60 display, and half the RAM and storage. The Radeon RX 5600M comes fixed on all options.
Direct competitors include other budget to mid-range 15.6-inch gaming laptops like the Asus TUF A15, HP Omen 15, Lenovo Legion Y740, or the MSI Bravo 15.
More Dell reviews:
Rating | Date | Model | Weight | Height | Size | Resolution | Best Price |
|---|---|---|---|---|---|---|---|
| 83.7 % | 06/2020 | Dell G5 15 SE 5505 P89F R7 4800H, Radeon RX 5600M | 2.4 kg | 21.6 mm | 15.60" | 1920x1080 | |
| 82.7 % | 06/2020 | Asus TUF Gaming A15 FA506IV-HN172 R7 4800H, GeForce RTX 2060 Mobile | 2.2 kg | 24.9 mm | 15.60" | 1920x1080 | |
| 82.6 % | 10/2019 | Dell G5 15 5590-P8RVW i7-9750H, GeForce RTX 2070 Max-Q | 2.8 kg | 23.7 mm | 15.60" | 1920x1080 | |
| 84.8 % | 10/2019 | Lenovo Legion Y740-15ICHg i7-9750H, GeForce RTX 2070 Max-Q | 2.3 kg | 25 mm | 15.60" | 1920x1080 | |
| 83.2 % | 05/2020 | MSI GP65 10SFK-047US i7-10750H, GeForce RTX 2070 Mobile | 2.3 kg | 27.5 mm | 15.60" | 1920x1080 | |
| 81.5 % | 07/2019 | HP Omen 15-dc1020ng i5-9300H, GeForce GTX 1650 Mobile | 2.3 kg | 25 mm | 15.60" | 1920x1080 |
Case
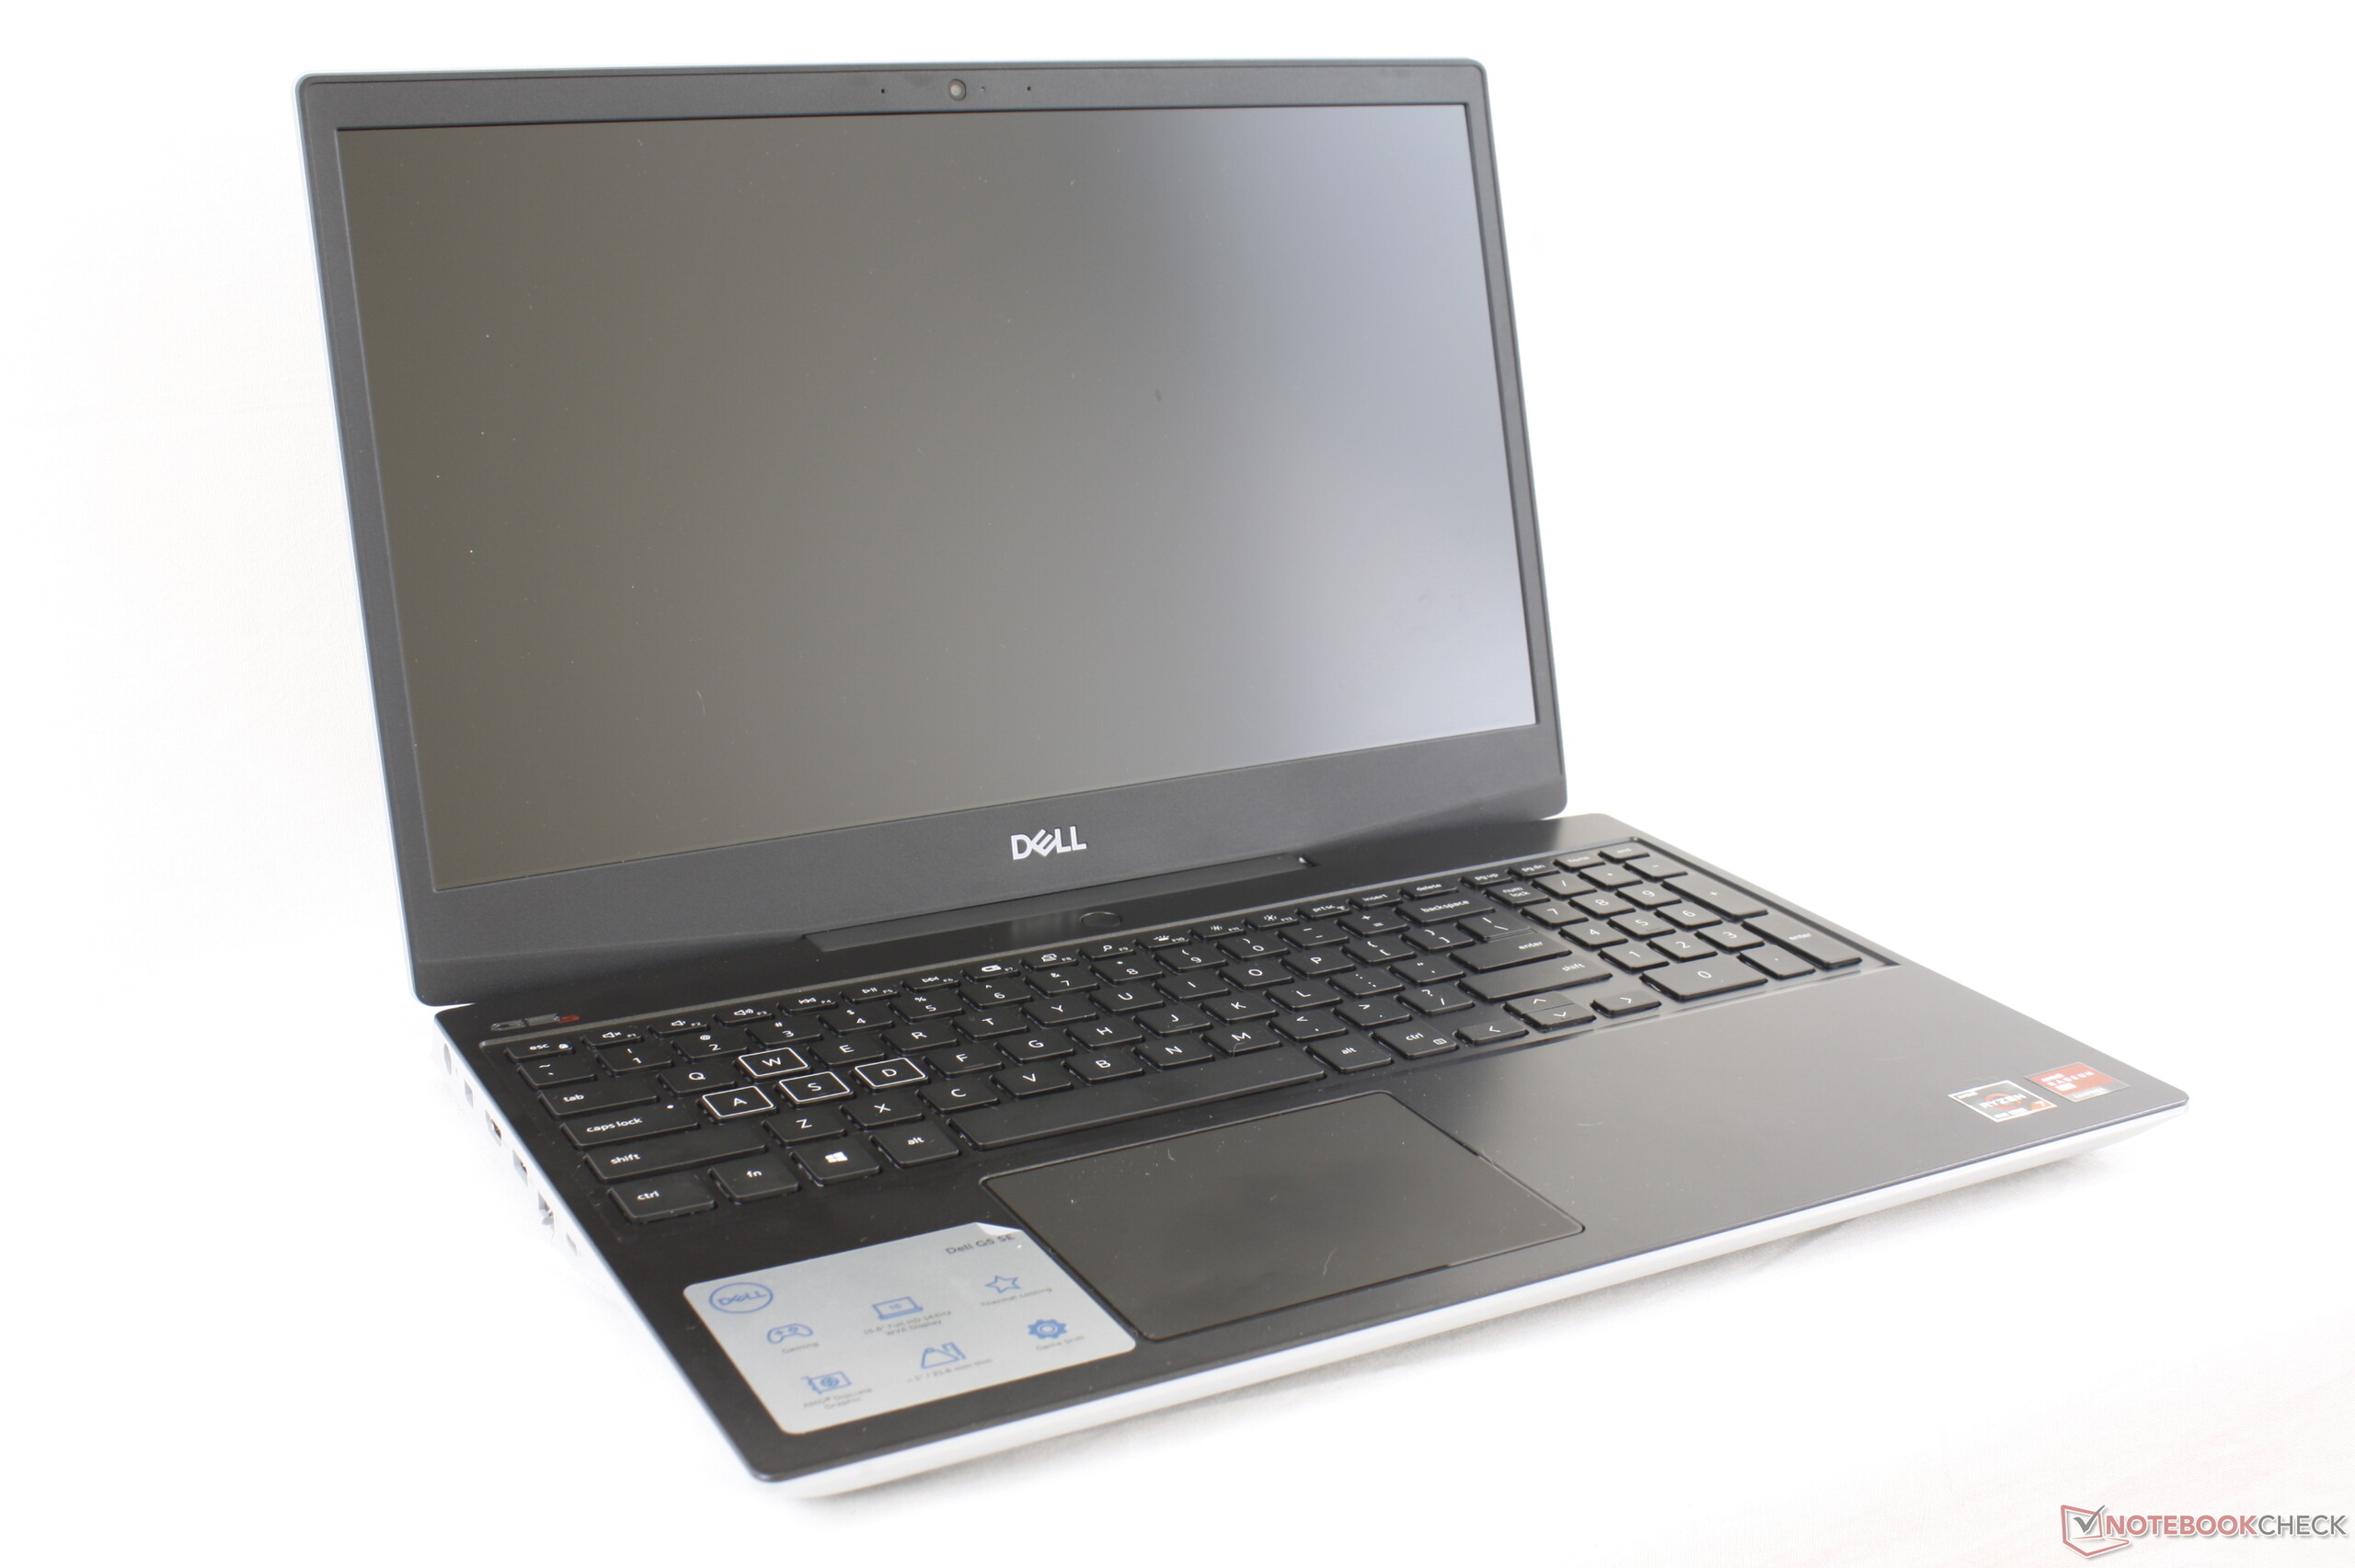
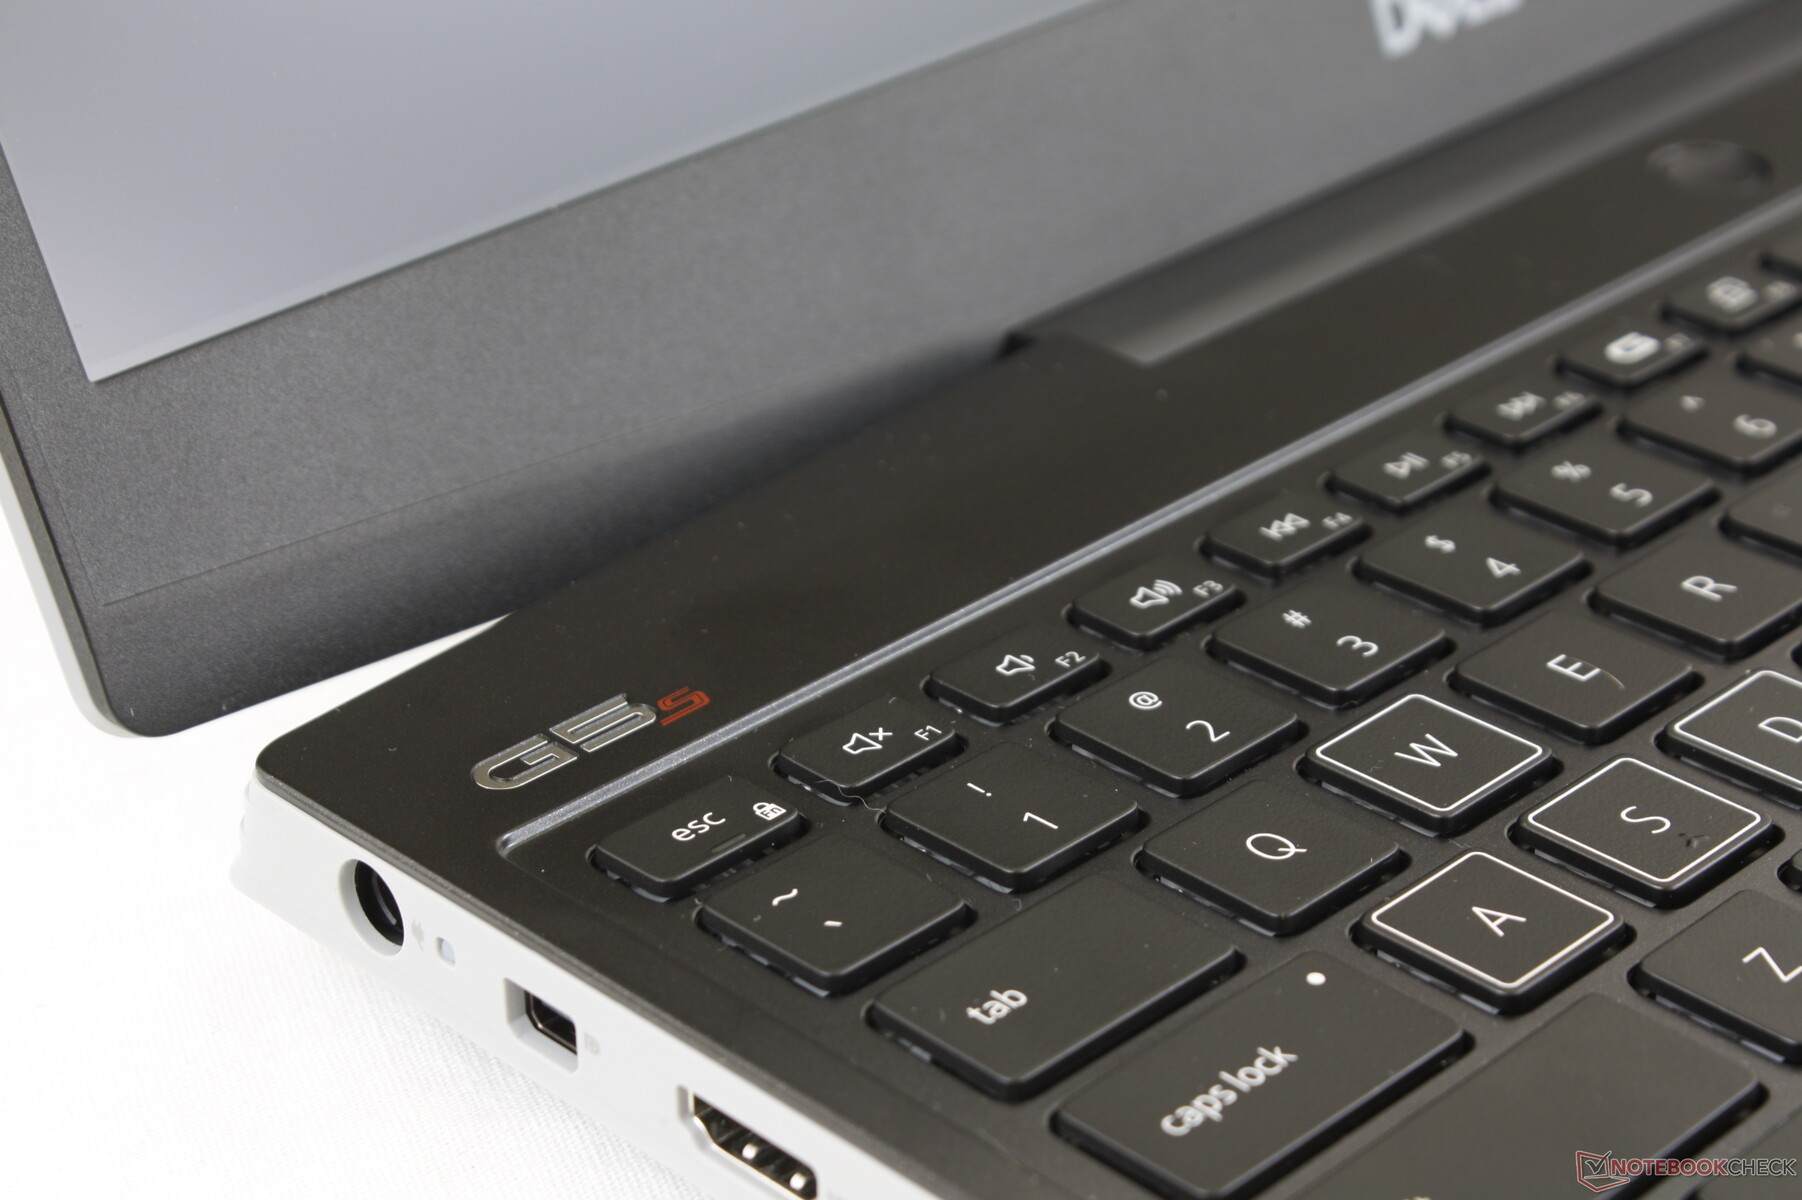
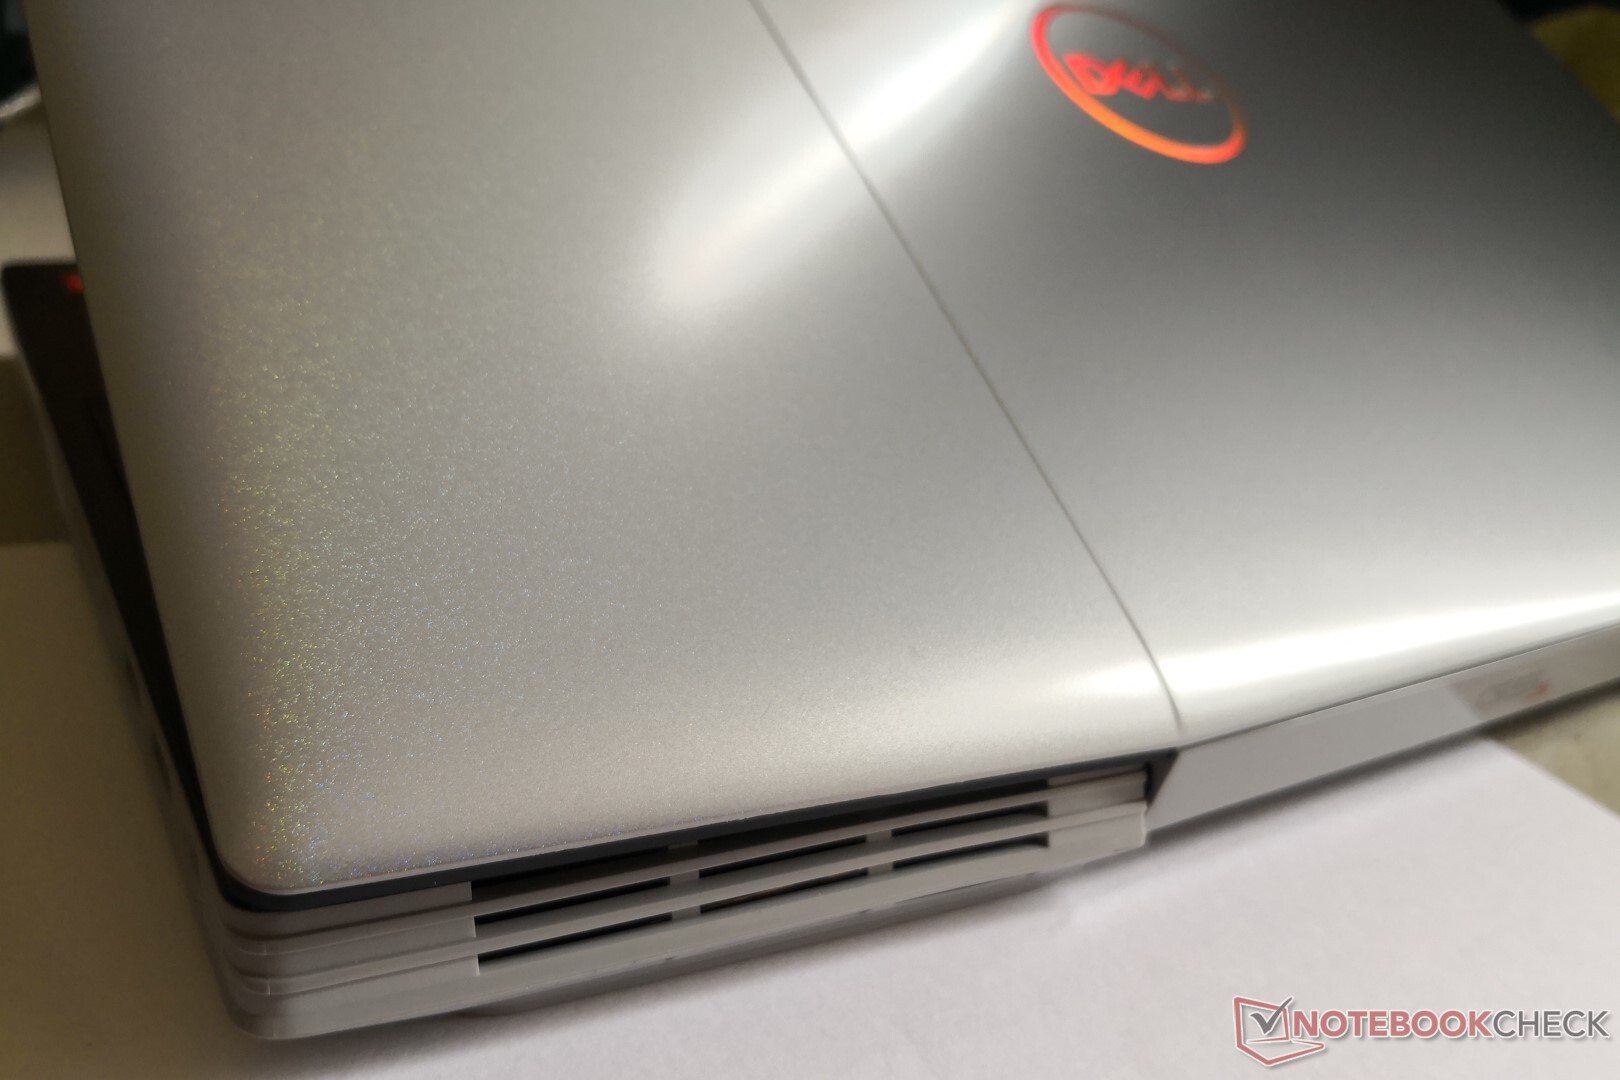
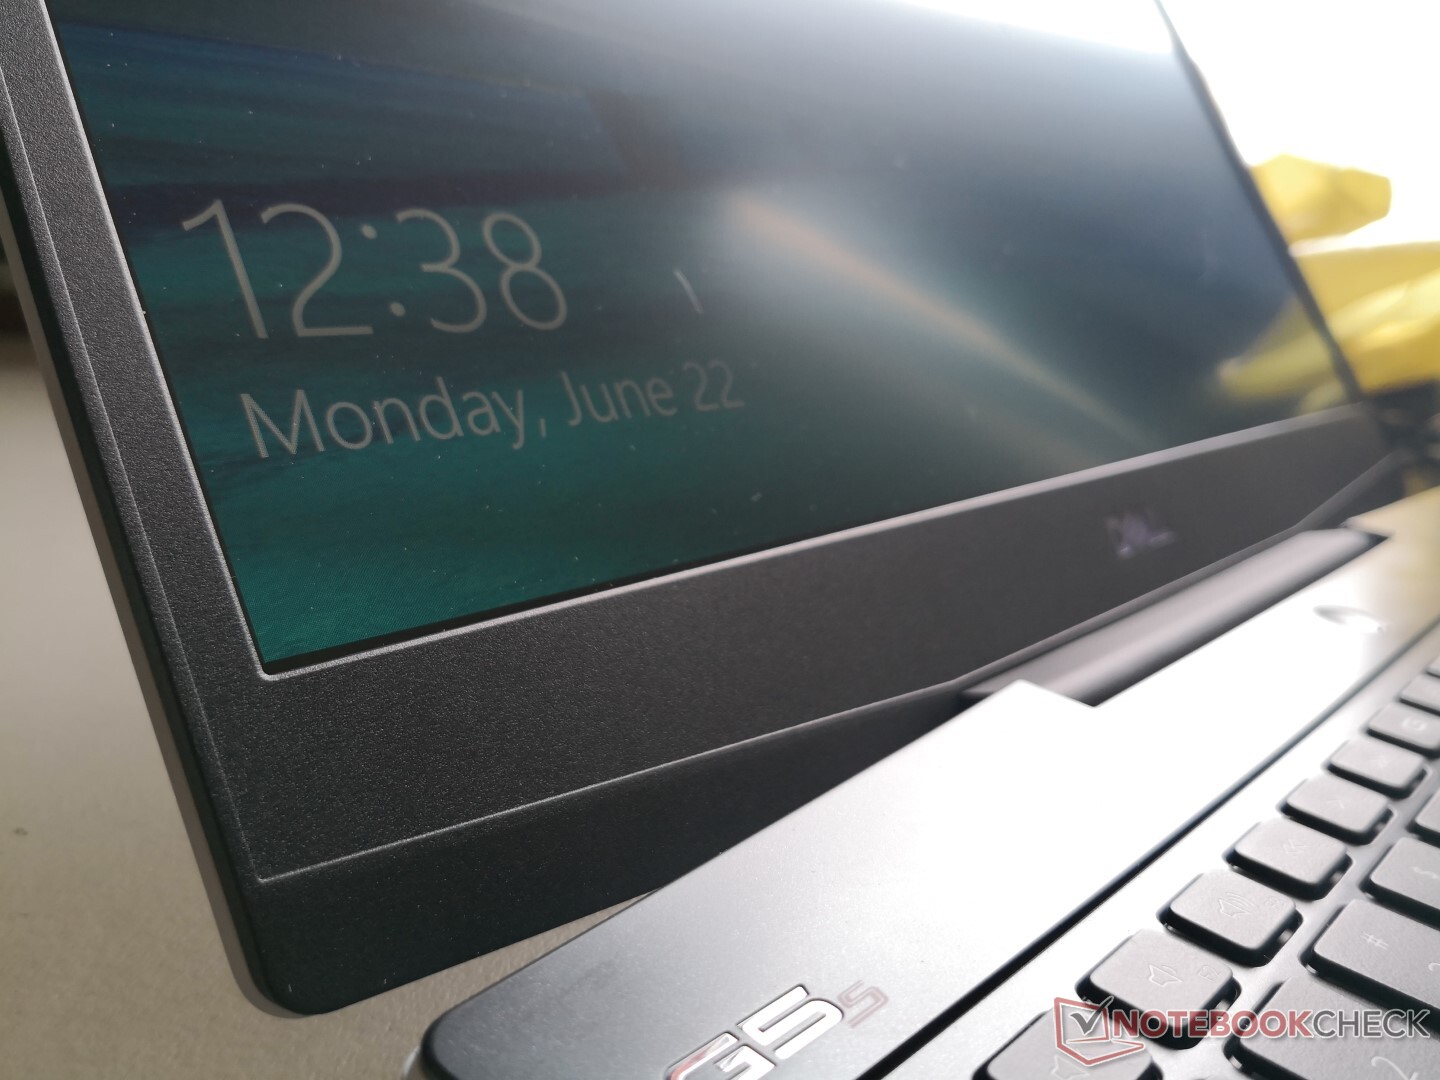
Stylistically, the chassis will be hit or miss with most users. Potential owners have to remember that this isn't an Alienware or $2000 minimalist unibody gaming laptop like the MSI GS65 or Razer Blade 15. Instead, what's here is mostly plastic with the general aesthetic of an Inspiron 15. The outer lid has a slight iridescent rainbow effect for a subtle visual flair, but this can be a mixed bag to gamers who would have preferred a more "ordinary" jet black color like on the older G5 15 designs. It's too bad that Dell isn't offering any other color options at the moment aside from "Supernova Silver".
From a build quality perspective, the base is firm with minimal depressions or warping when applying pressure down the keyboard center or twisting the corners side-to-side. It doesn't feel as sound as an Alienware m15 R2, but it is at least comparable to the Asus TUF A15.
The lid could be more rigid and the chassis tends to creak when opening the display. This is where the system feels cheapest and most representative of the budget price point.
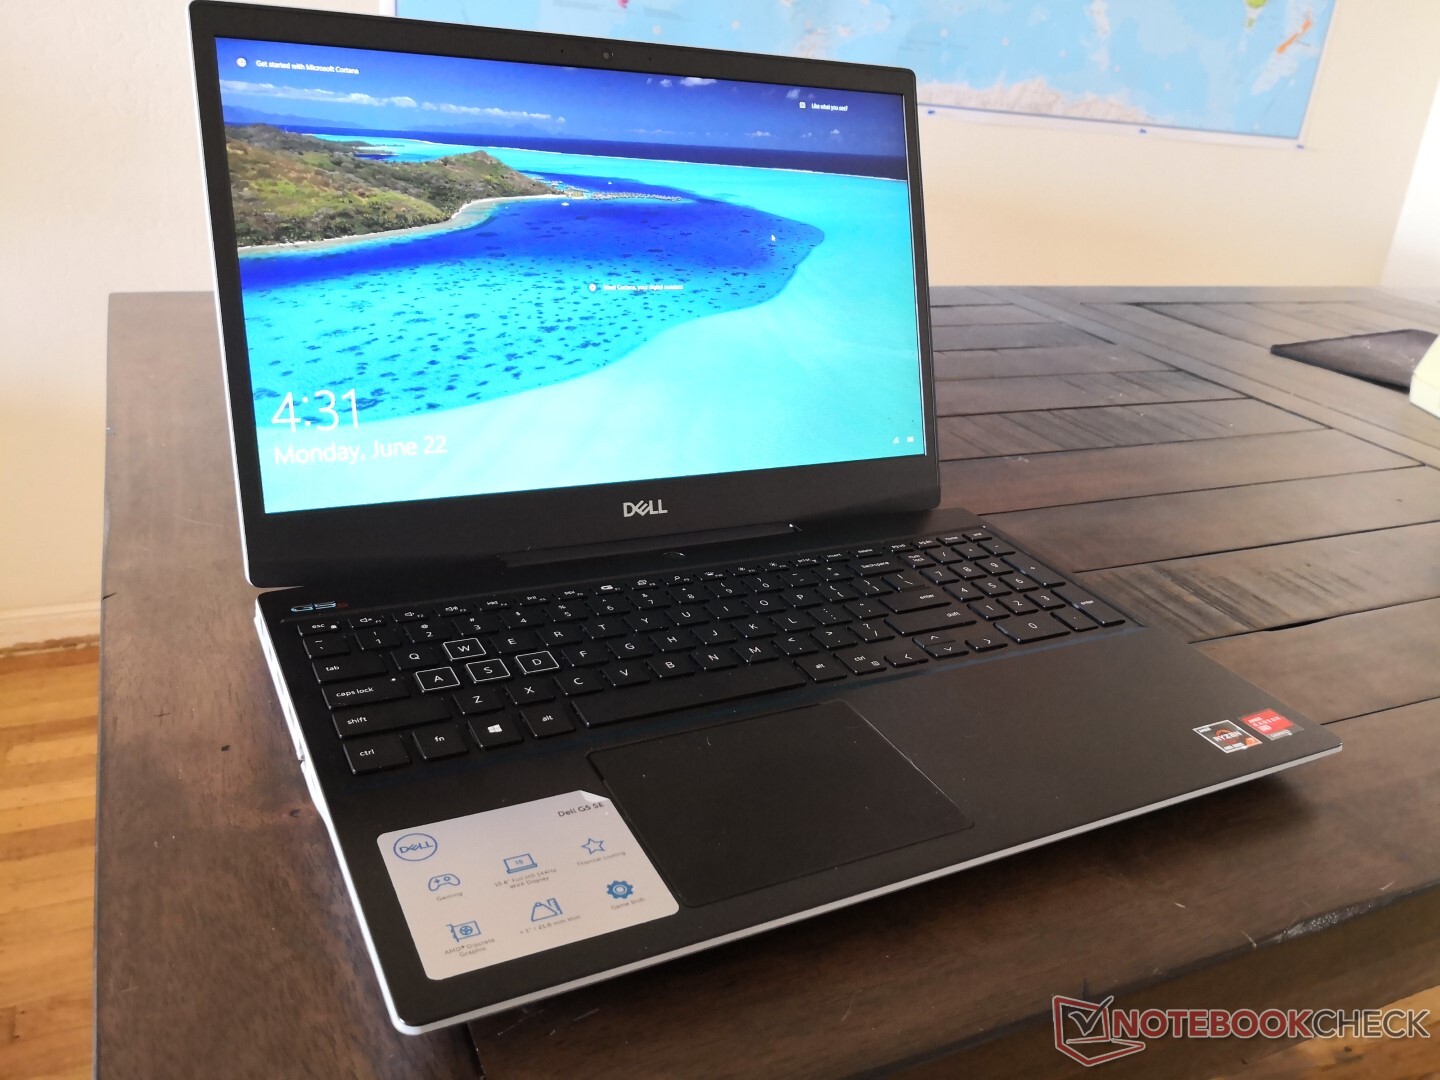
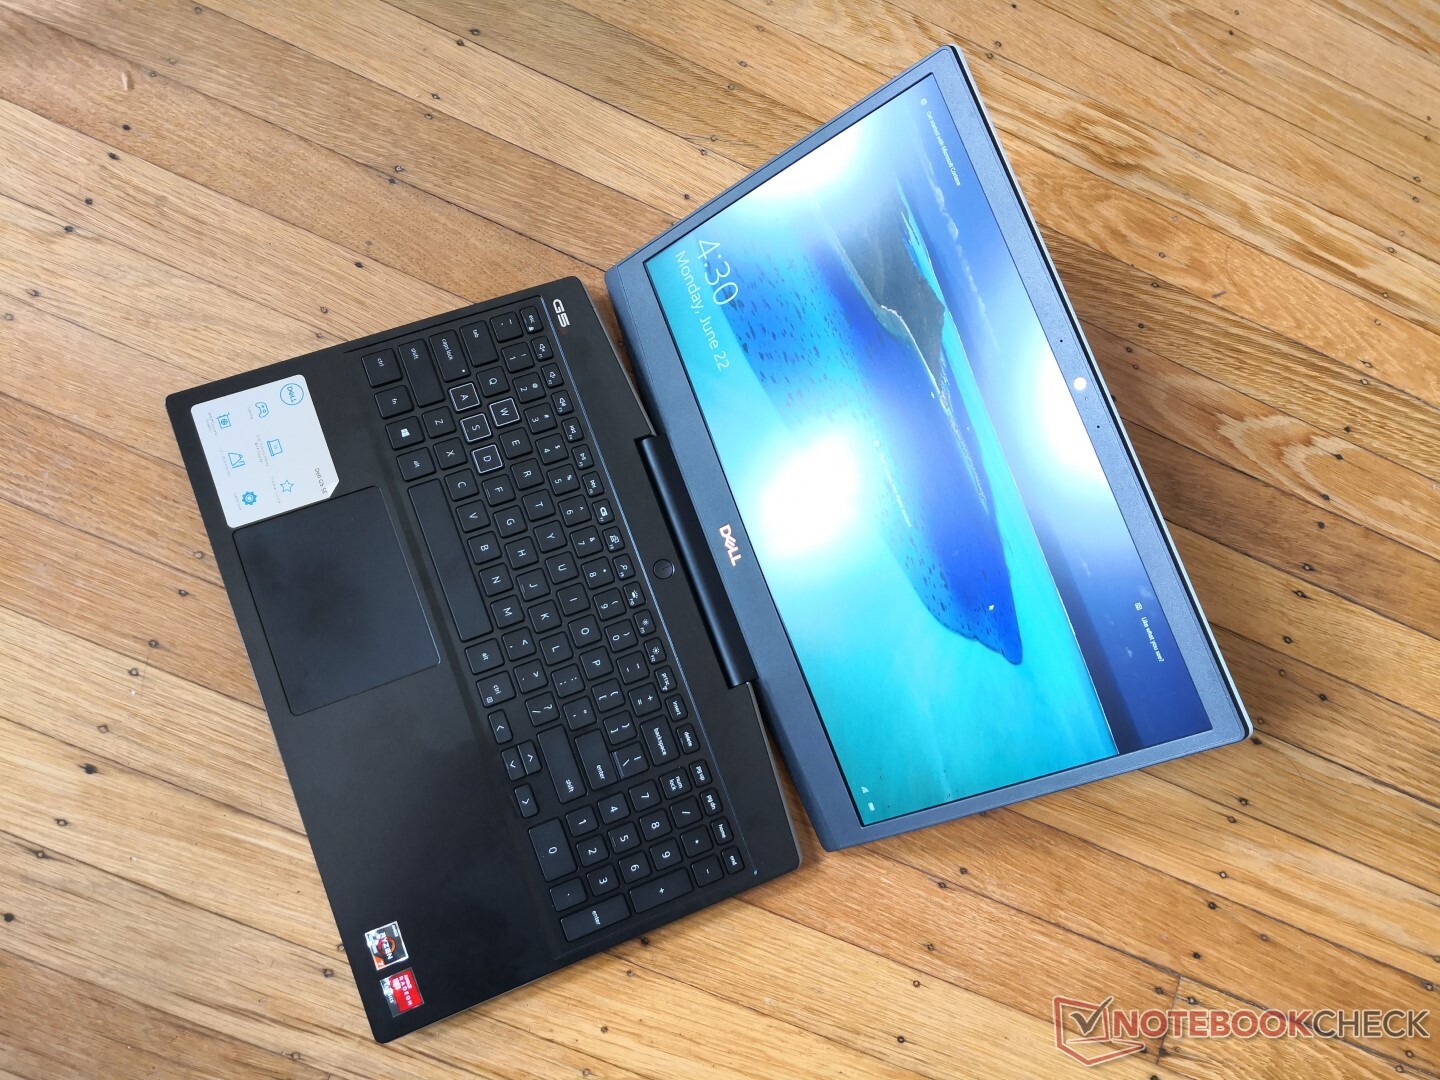
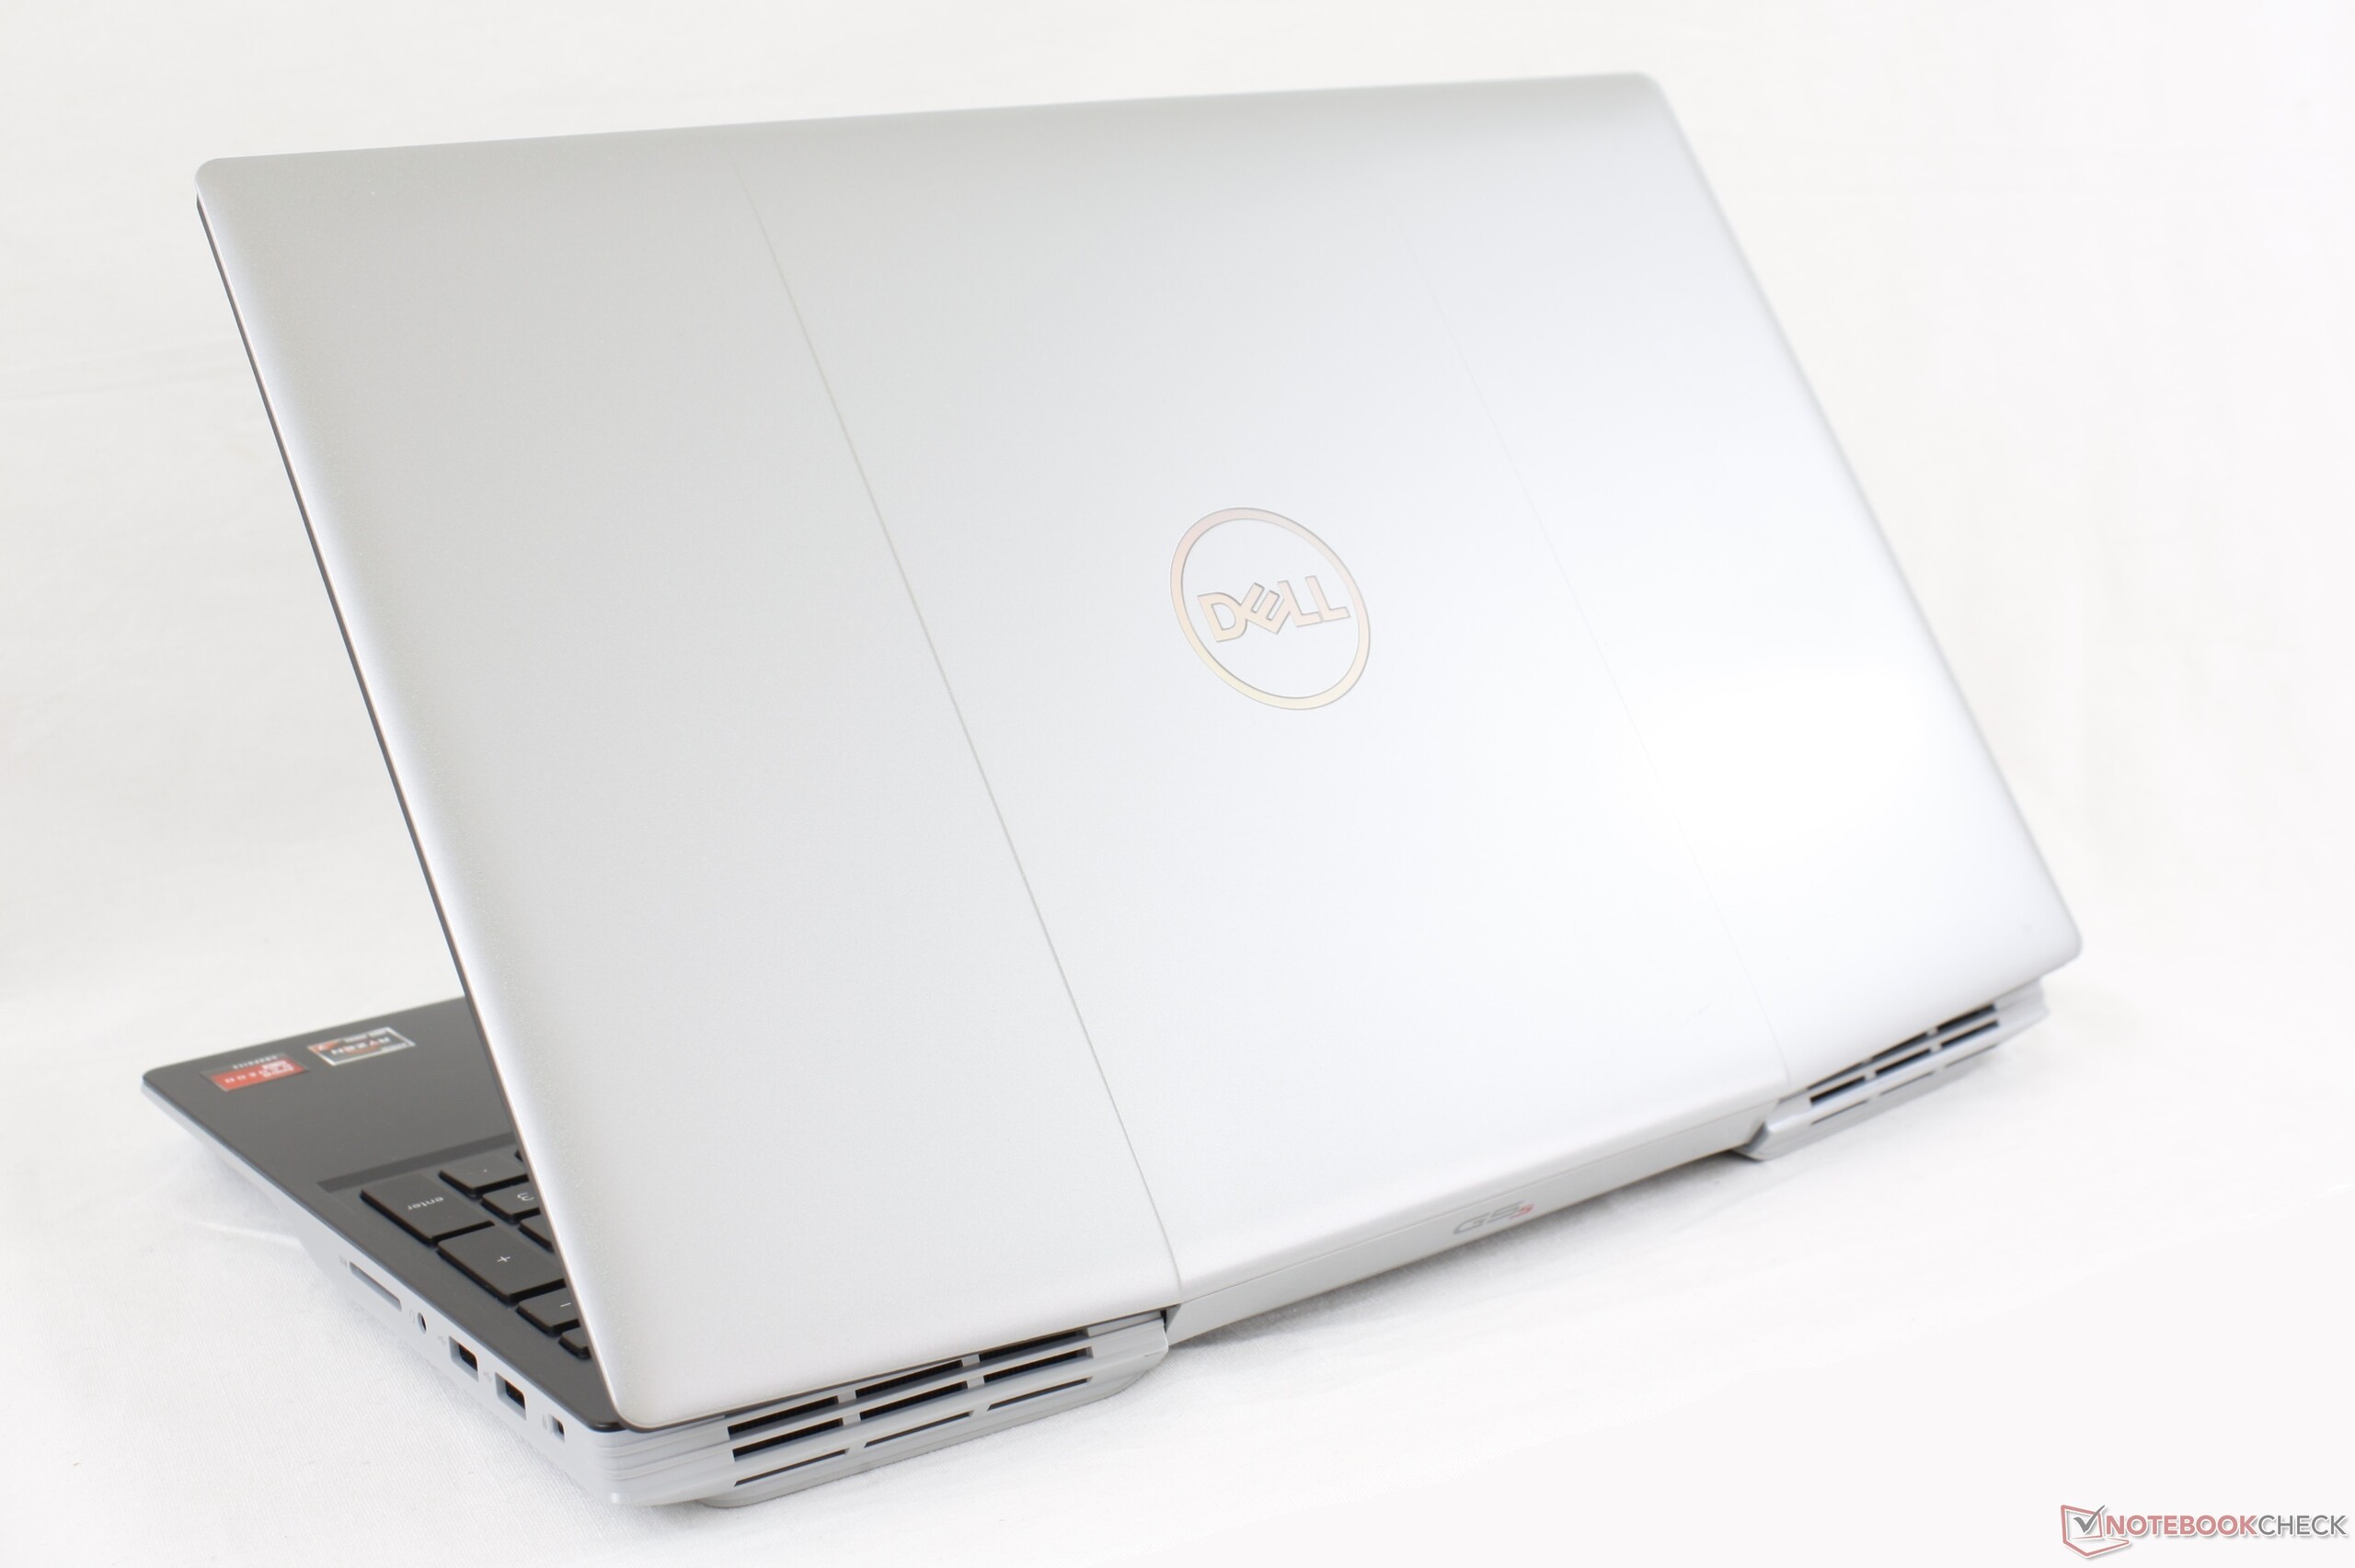
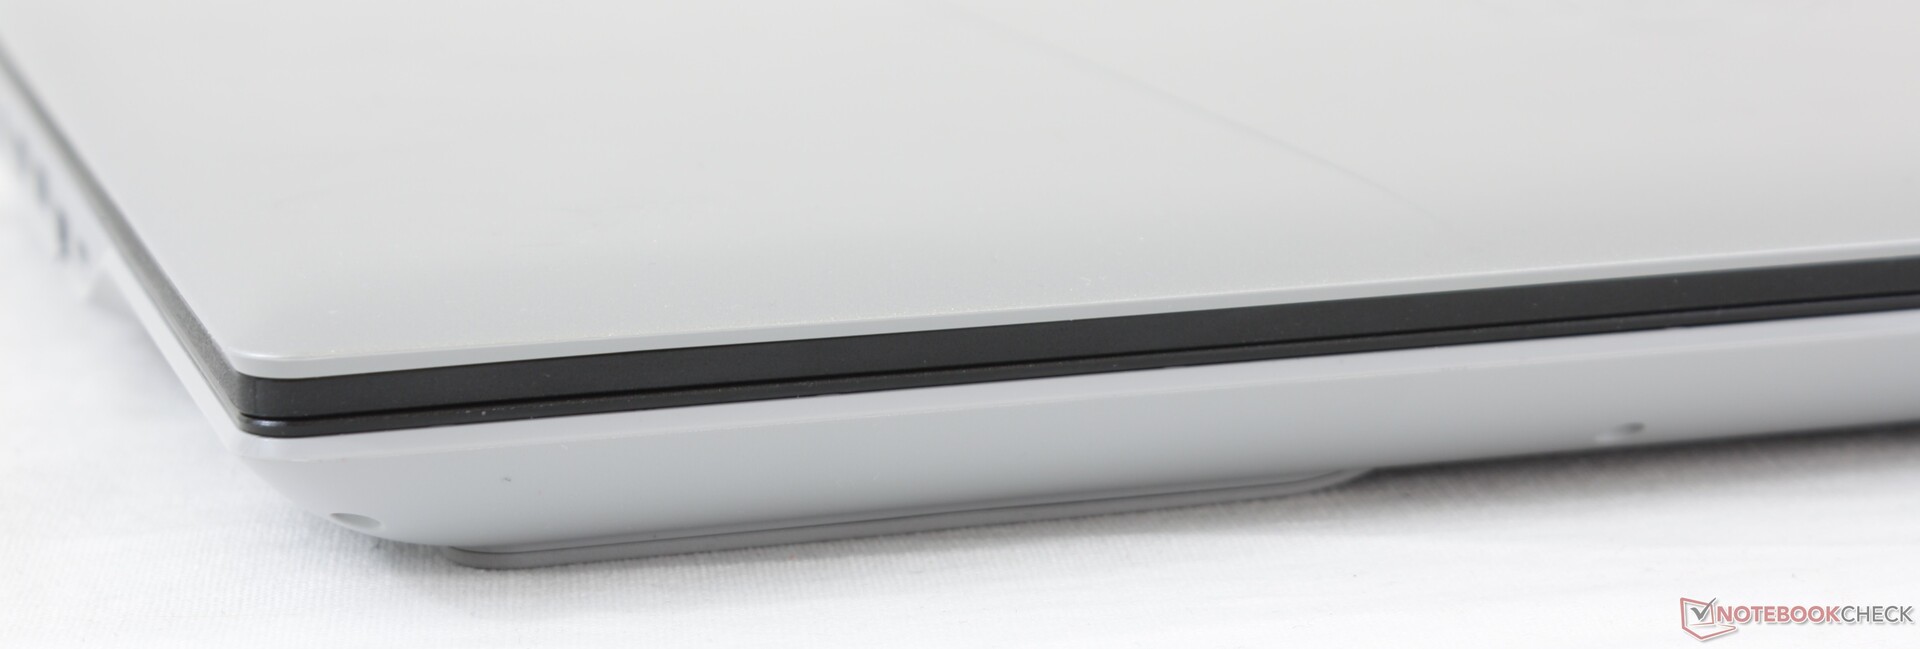
The new chassis addresses some of our biggest complaints about older G5 15 laptops: size and weight. The G5 15 SE is noticeably smaller and lighter than its predecessors to be more in line with other laptops in its price range. The "ultimate" thin and light gaming laptop within this same price bracket continues to be the older Asus Zephyrus GA502 series.
Connectivity
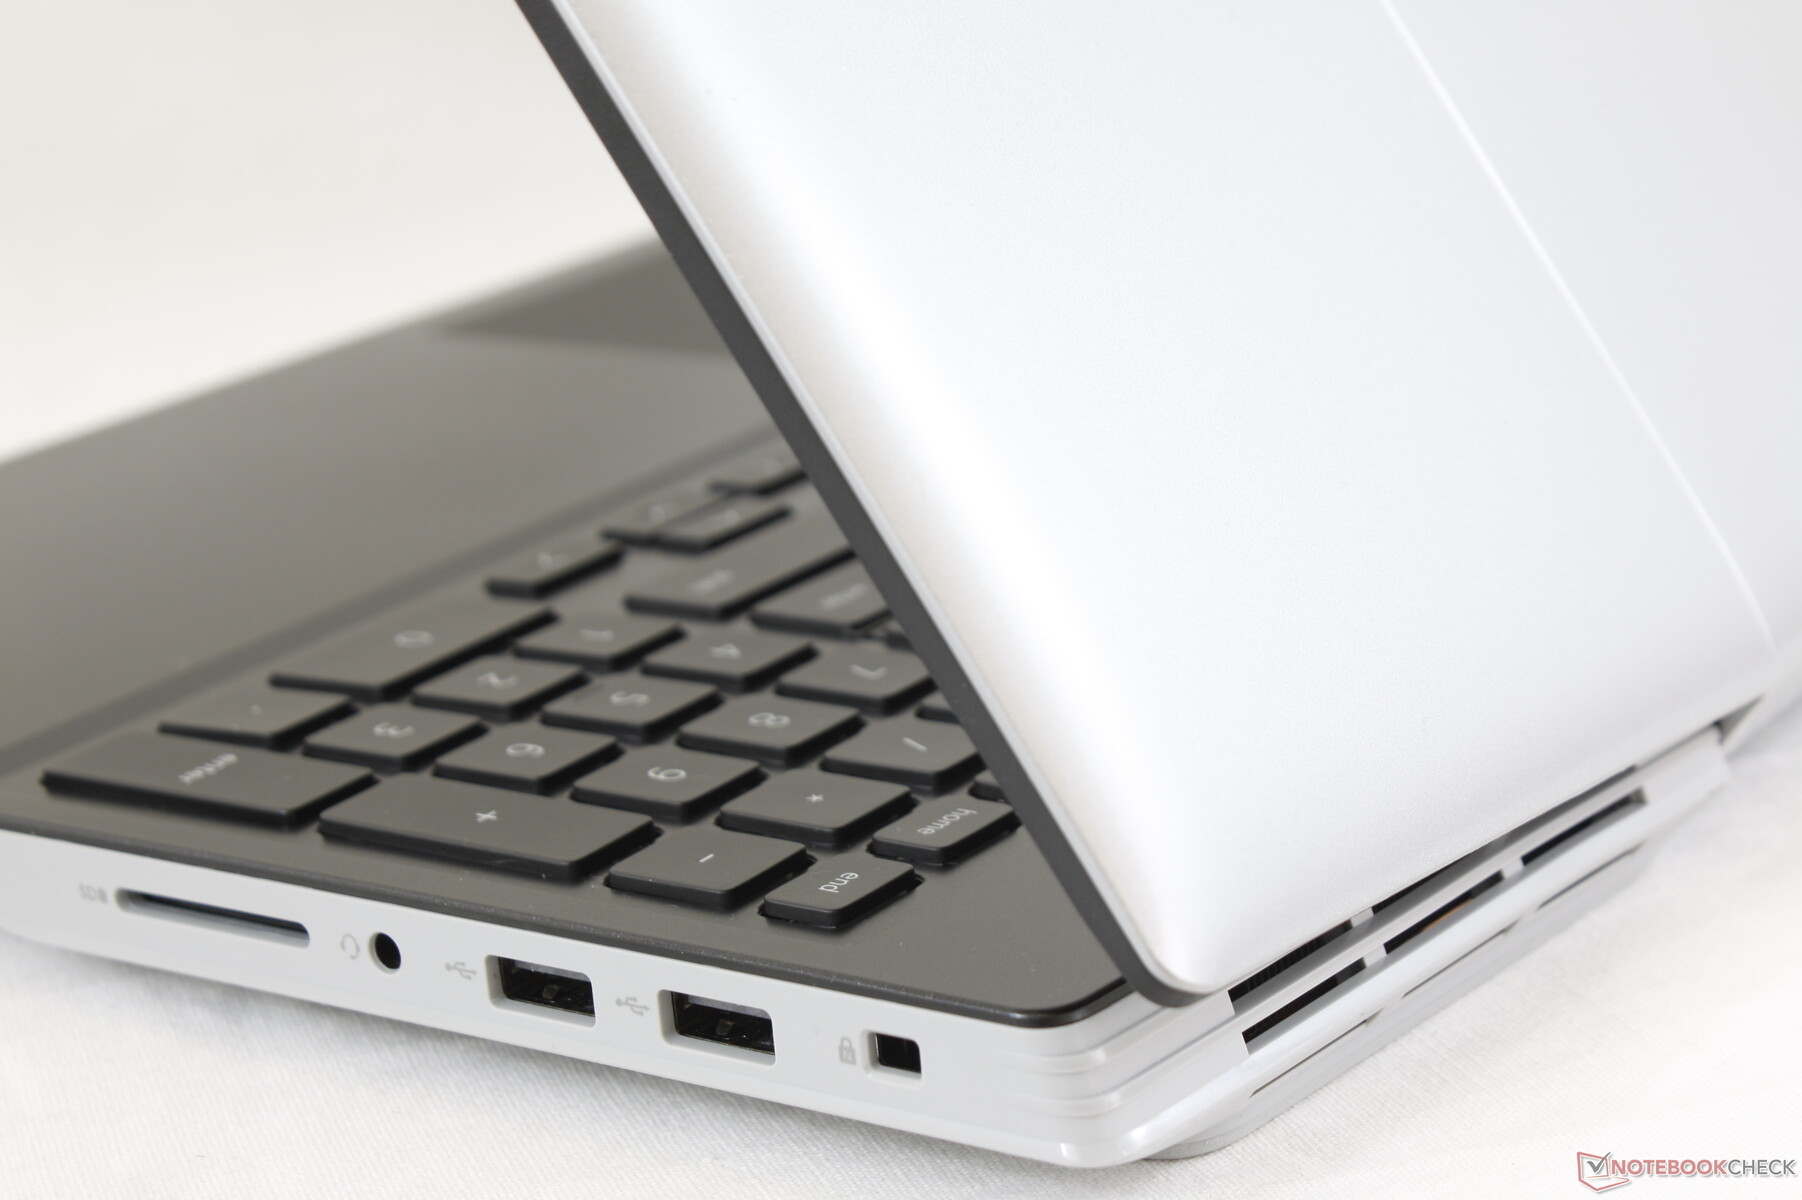
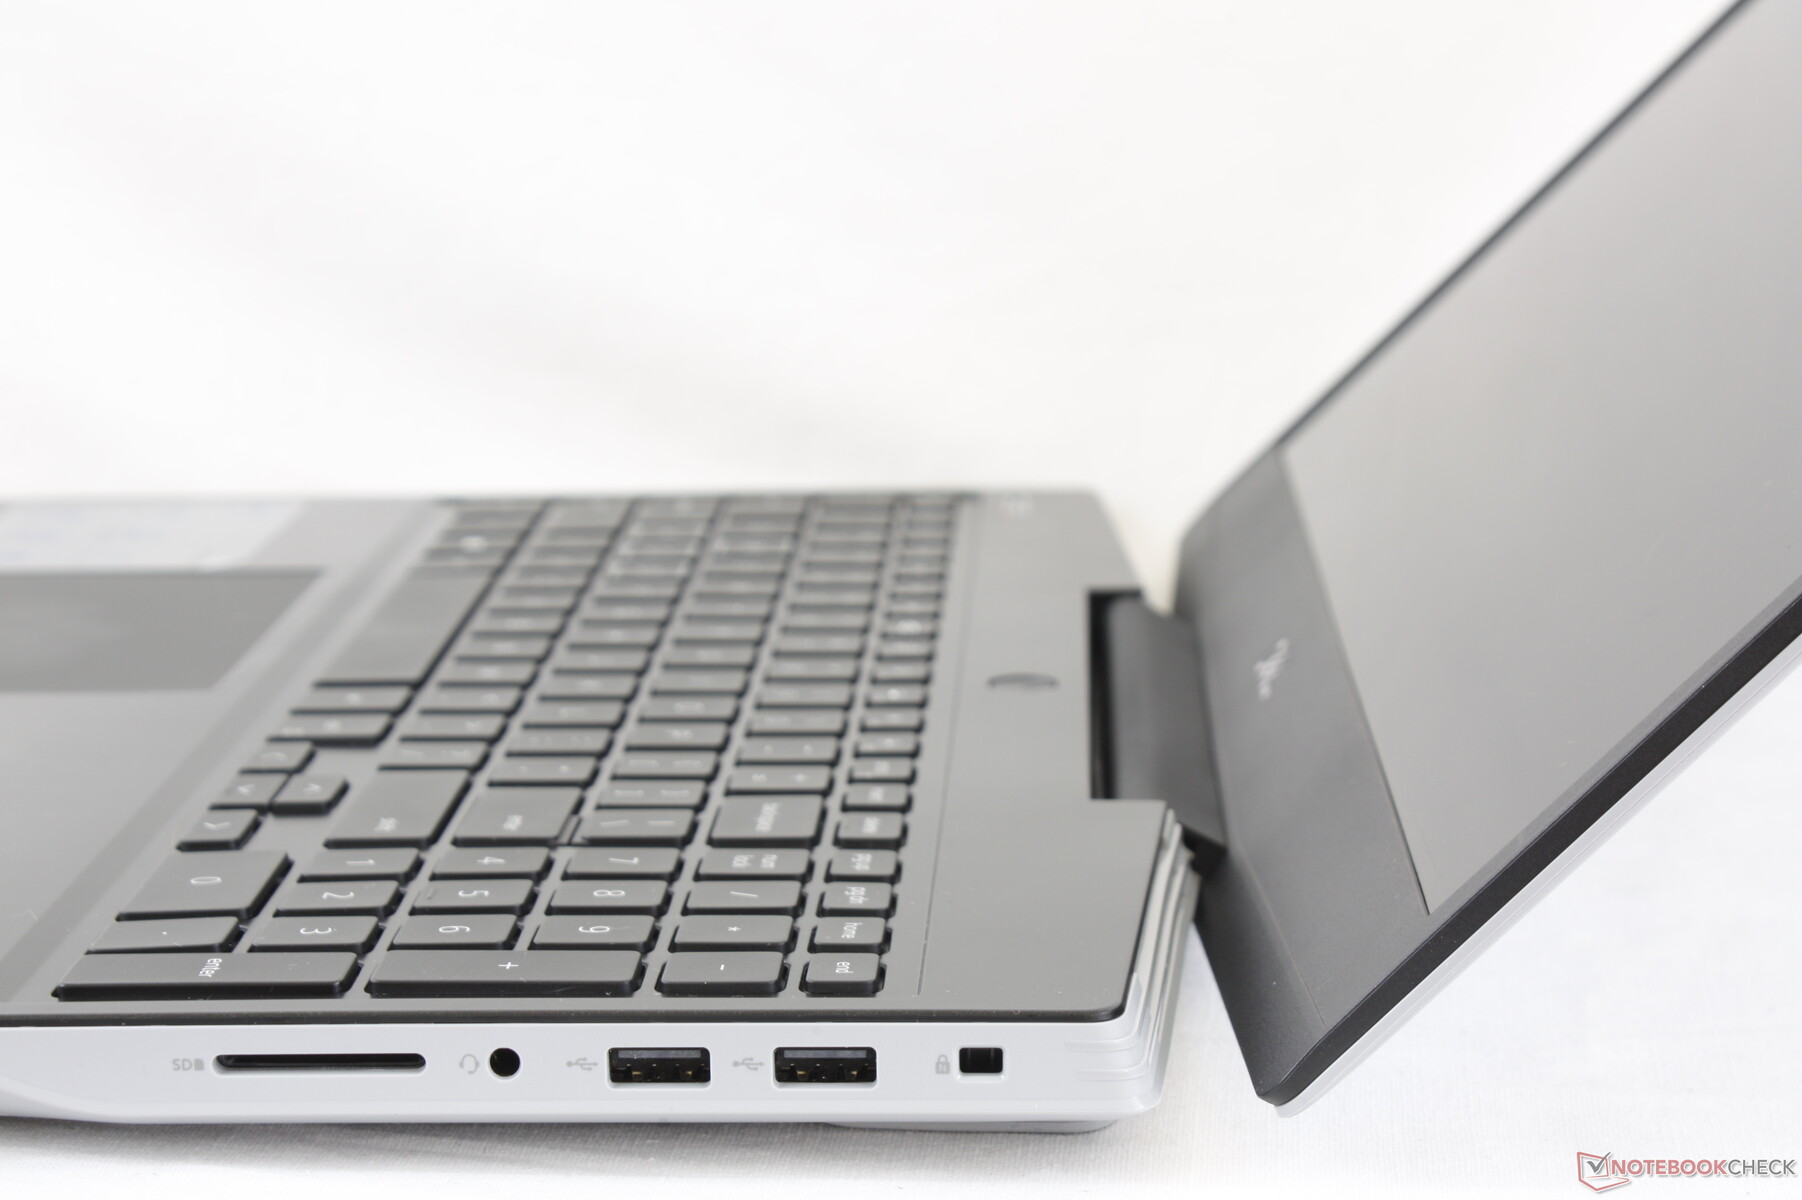
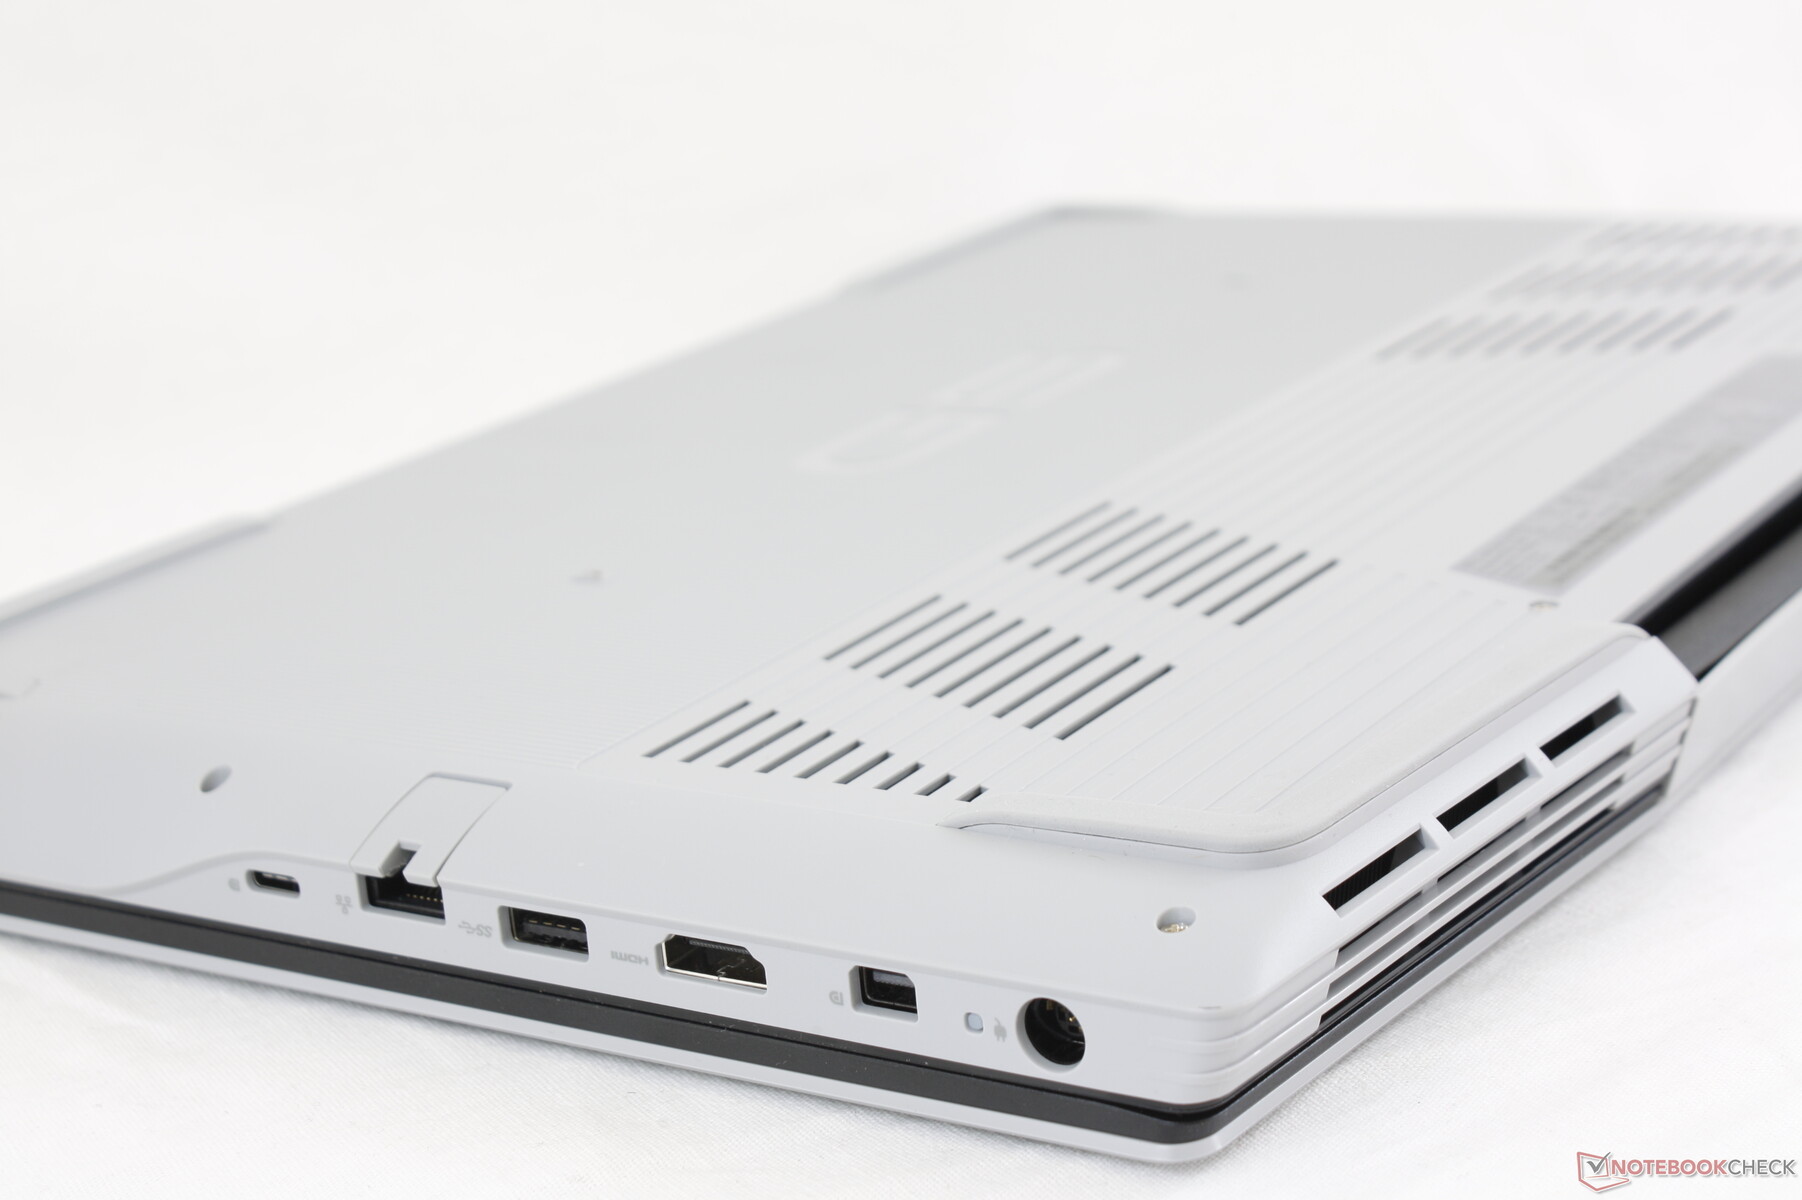
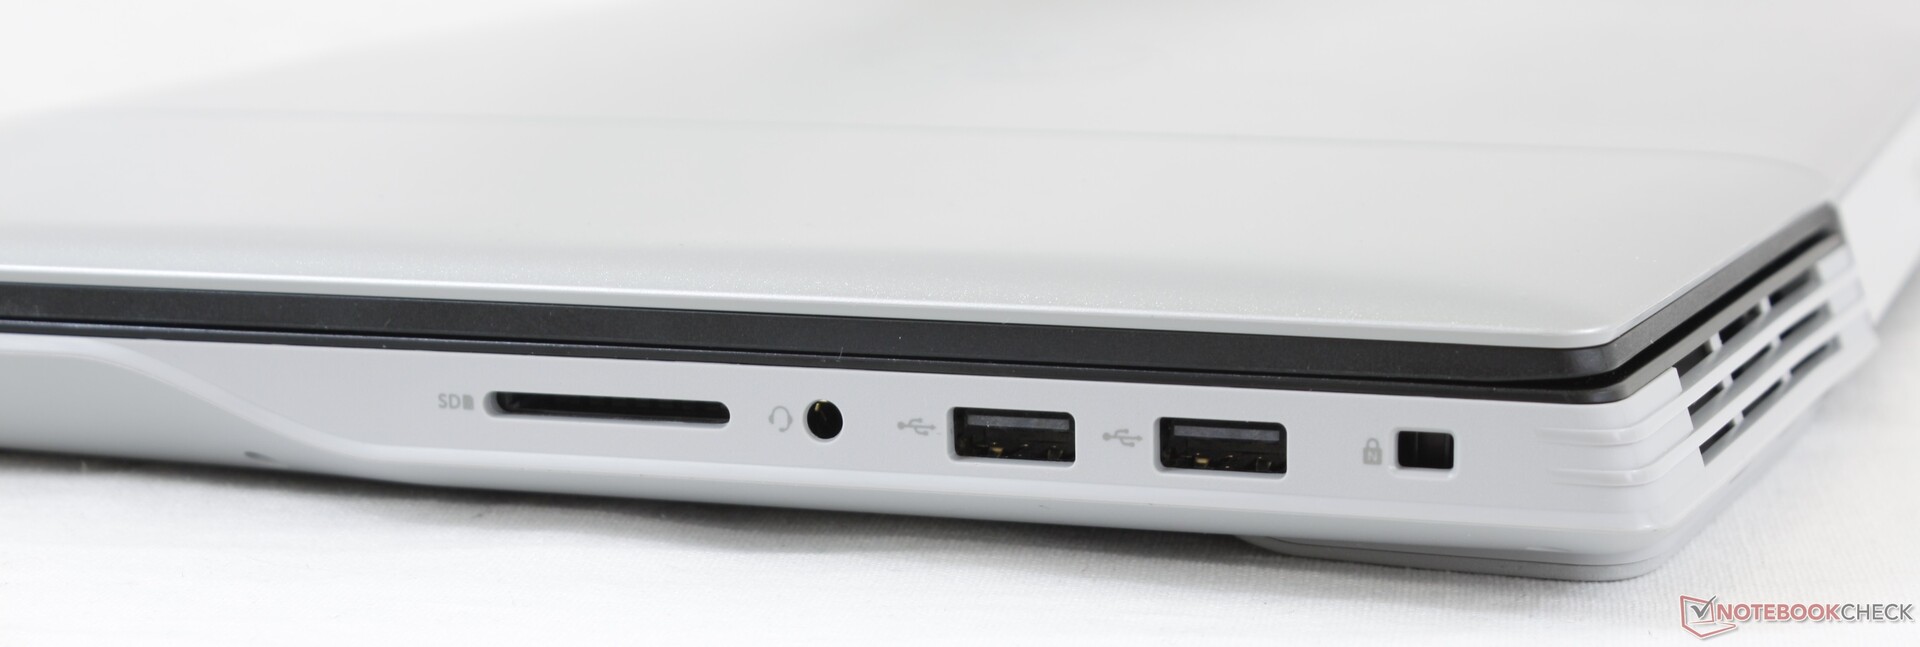
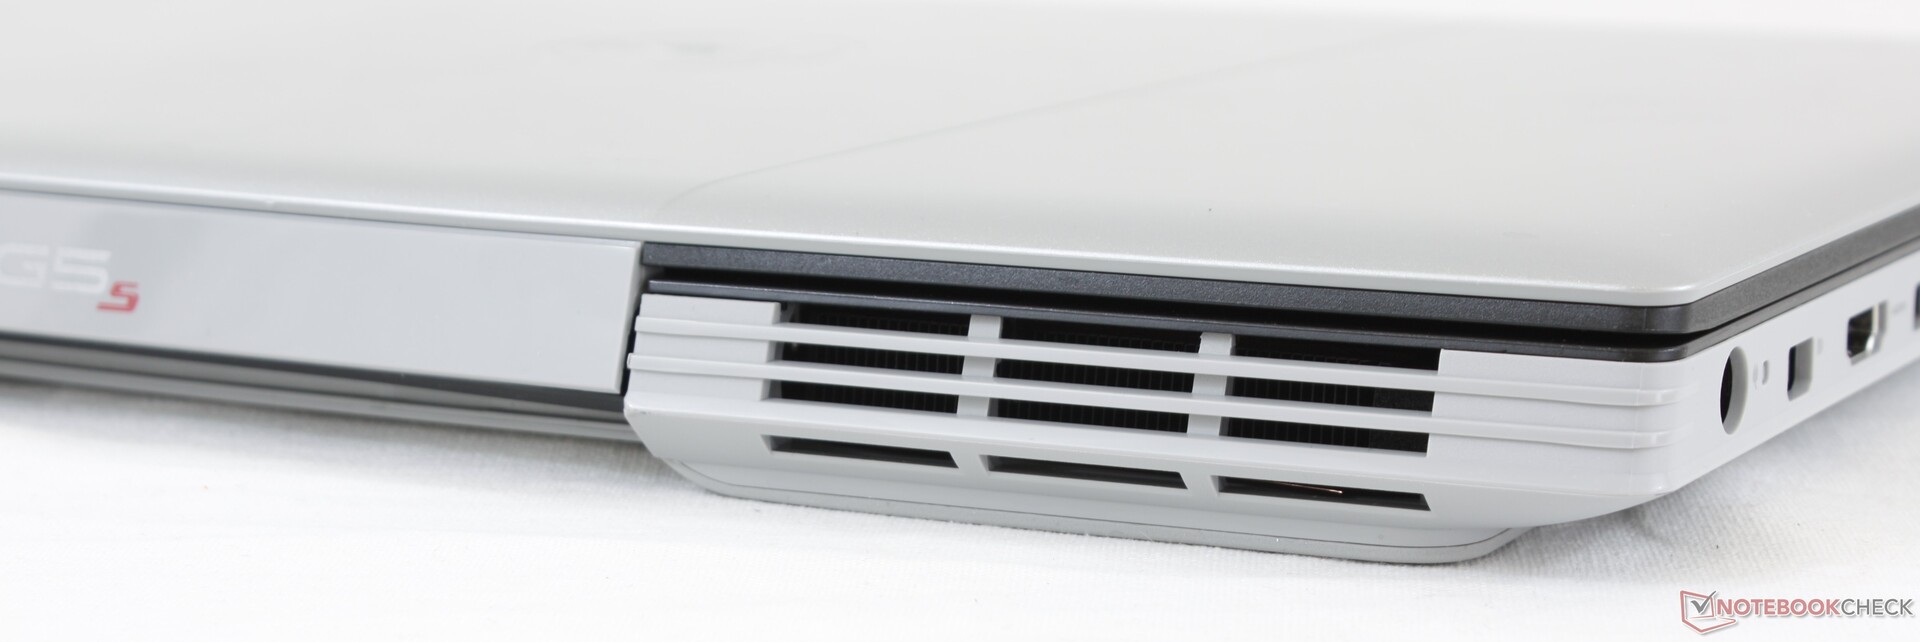
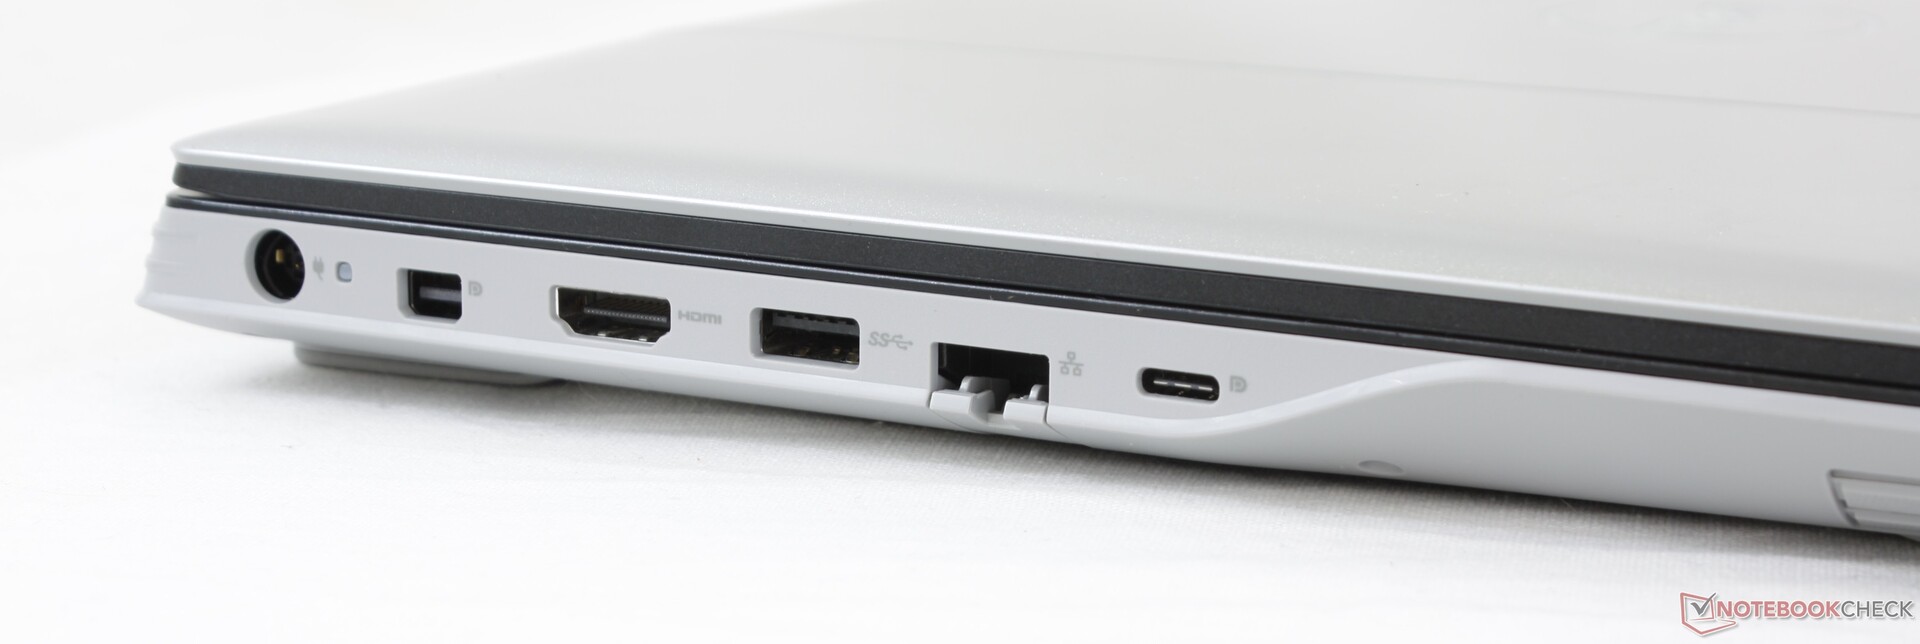
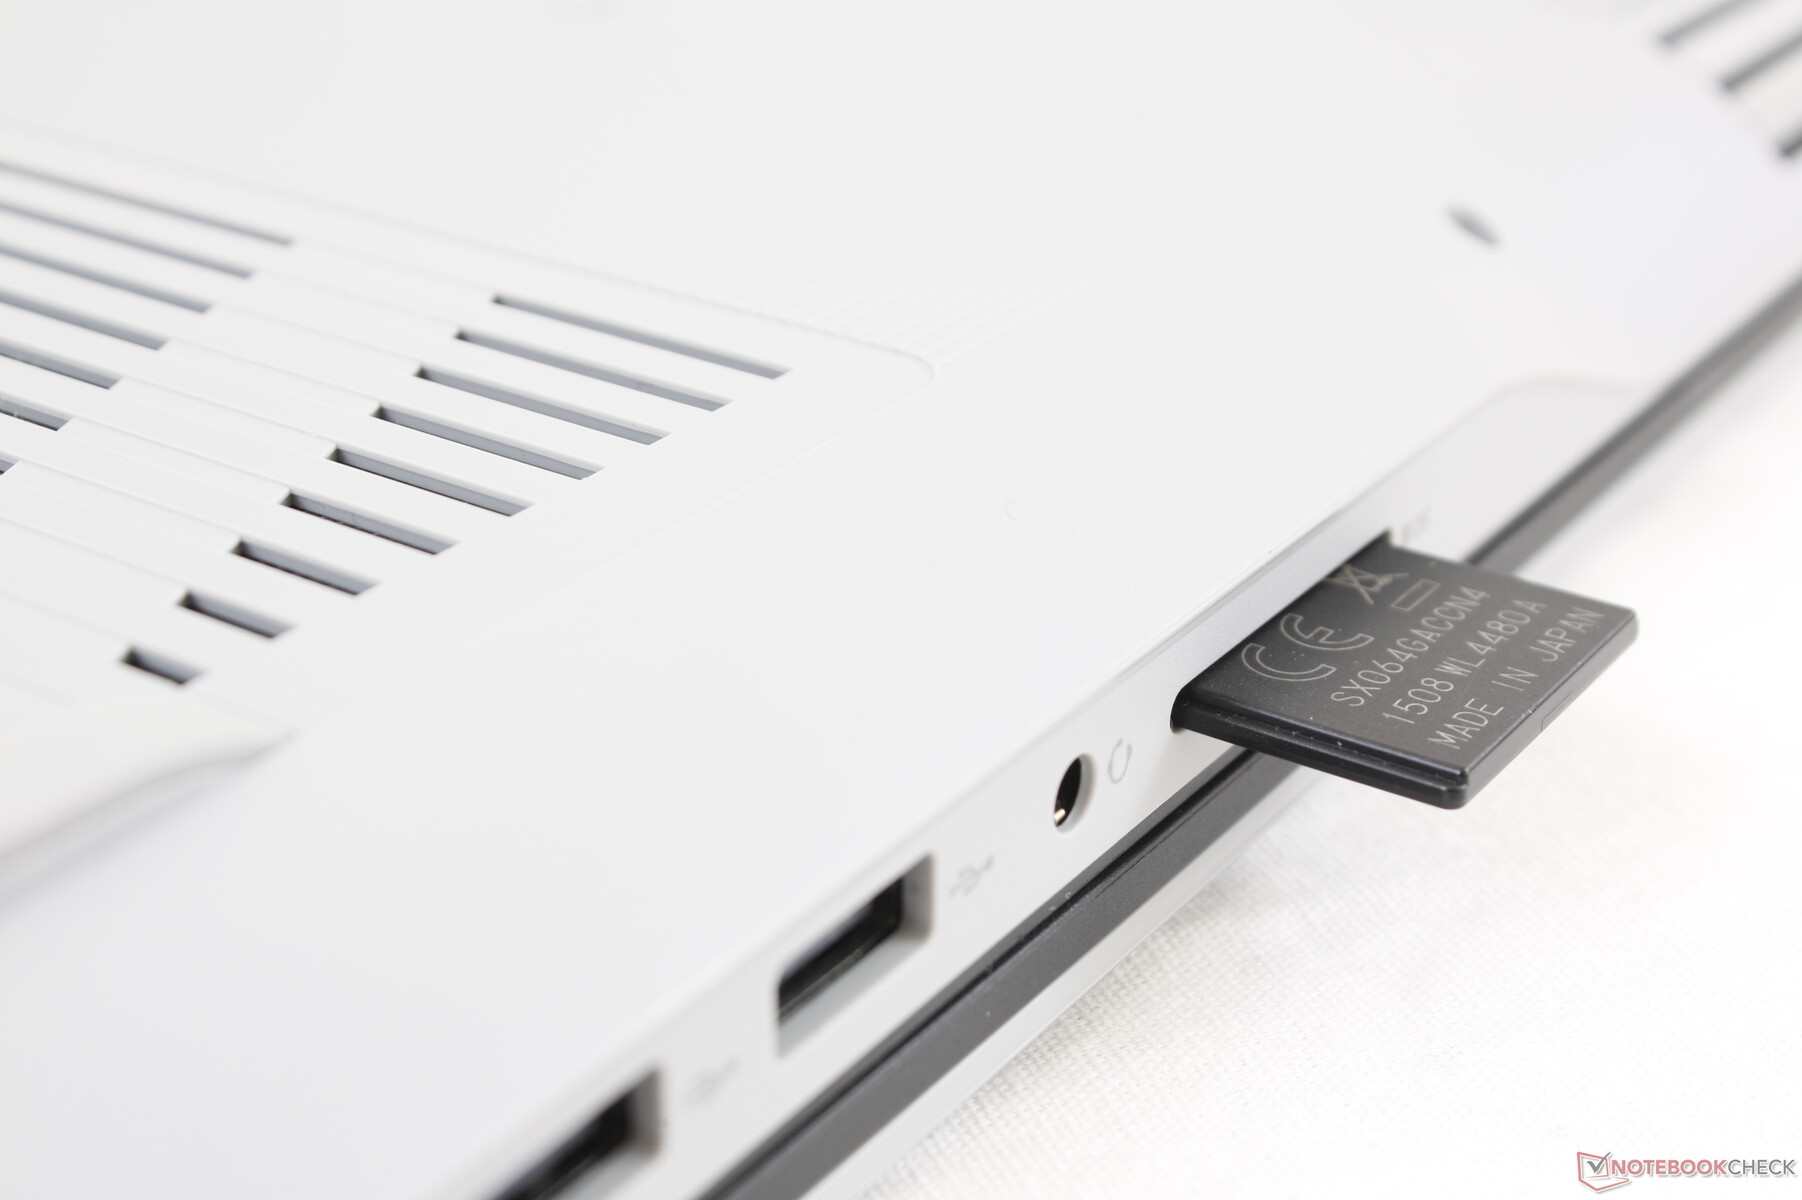
Port options are essentially identical to the G5 15 5590 but with two major differences. Firstly, the USB Type-C port no longer supports Thunderbolt 3 and secondly, port placement has now changed for easier accessibility. It's interesting to see that Dell is keeping the dedicated mini-DisplayPort as this option is becomingly increasingly uncommon.
SD Card Reader
The integrated SD card reader continues to be slow. Trnsferring 1 GB of pictures from our UHS-II test card to desktop takes about 28 seconds compared to under 8 seconds on the XPS 15.
| SD Card Reader | |
| average JPG Copy Test (av. of 3 runs) | |
| HP Omen 15-dc1020ng (Toshiba Exceria Pro SDXC 64 GB UHS-II) | |
| Dell G5 15 SE 5505 P89F (Toshiba Exceria Pro SDXC 64 GB UHS-II) | |
| MSI GP65 10SFK-047US (Toshiba Exceria Pro SDXC 64 GB UHS-II) | |
| Dell G5 15 5590-P8RVW (Toshiba Exceria Pro SDXC 64 GB UHS-II) | |
| maximum AS SSD Seq Read Test (1GB) | |
| HP Omen 15-dc1020ng (Toshiba Exceria Pro SDXC 64 GB UHS-II) | |
| Dell G5 15 SE 5505 P89F (Toshiba Exceria Pro SDXC 64 GB UHS-II) | |
| MSI GP65 10SFK-047US (Toshiba Exceria Pro SDXC 64 GB UHS-II) | |
| Dell G5 15 5590-P8RVW (Toshiba Exceria Pro SDXC 64 GB UHS-II) | |
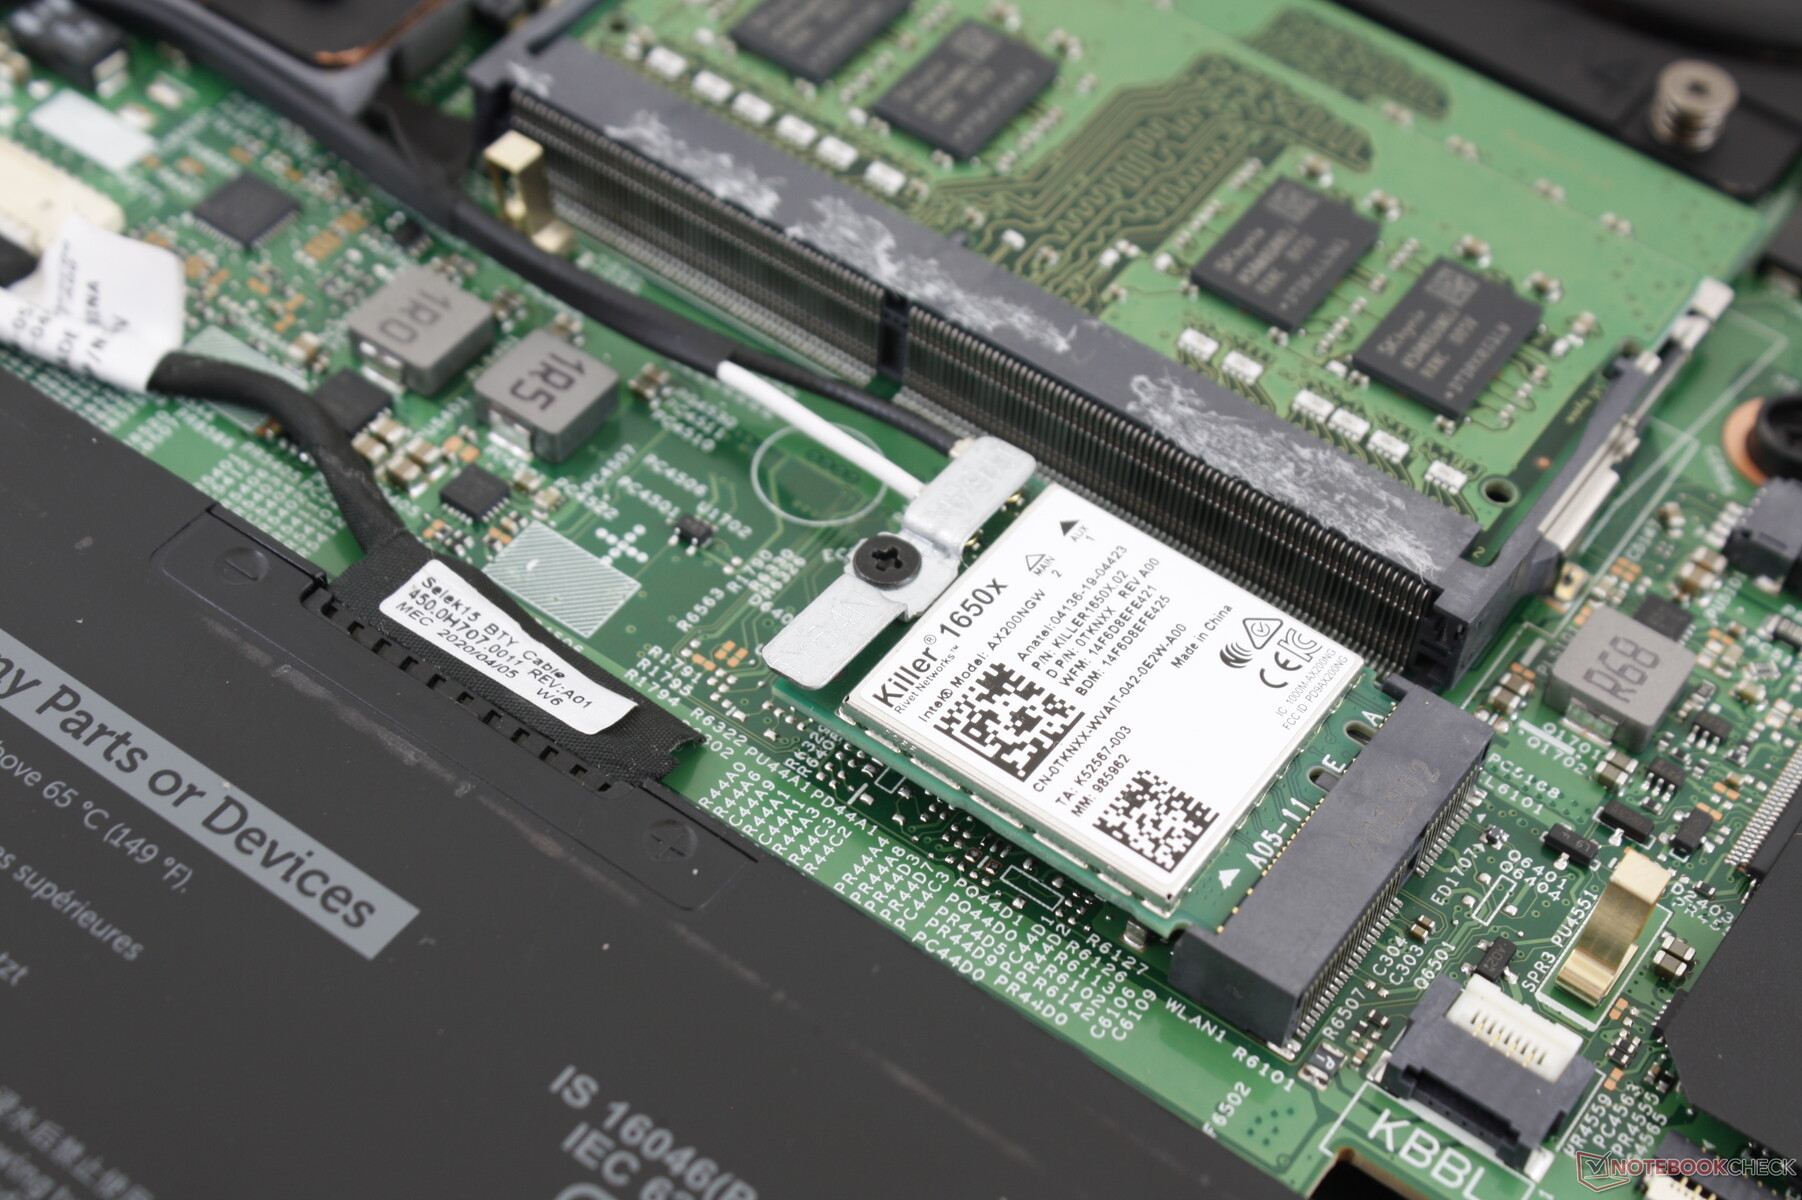
Communication
The Killer AX1650s comes standard across all SKUs for Wi-Fi 6 and Bluetooth 5.1 connectivity. We experienced no issues when connected to our Netgear RAX200 router.
Webcam


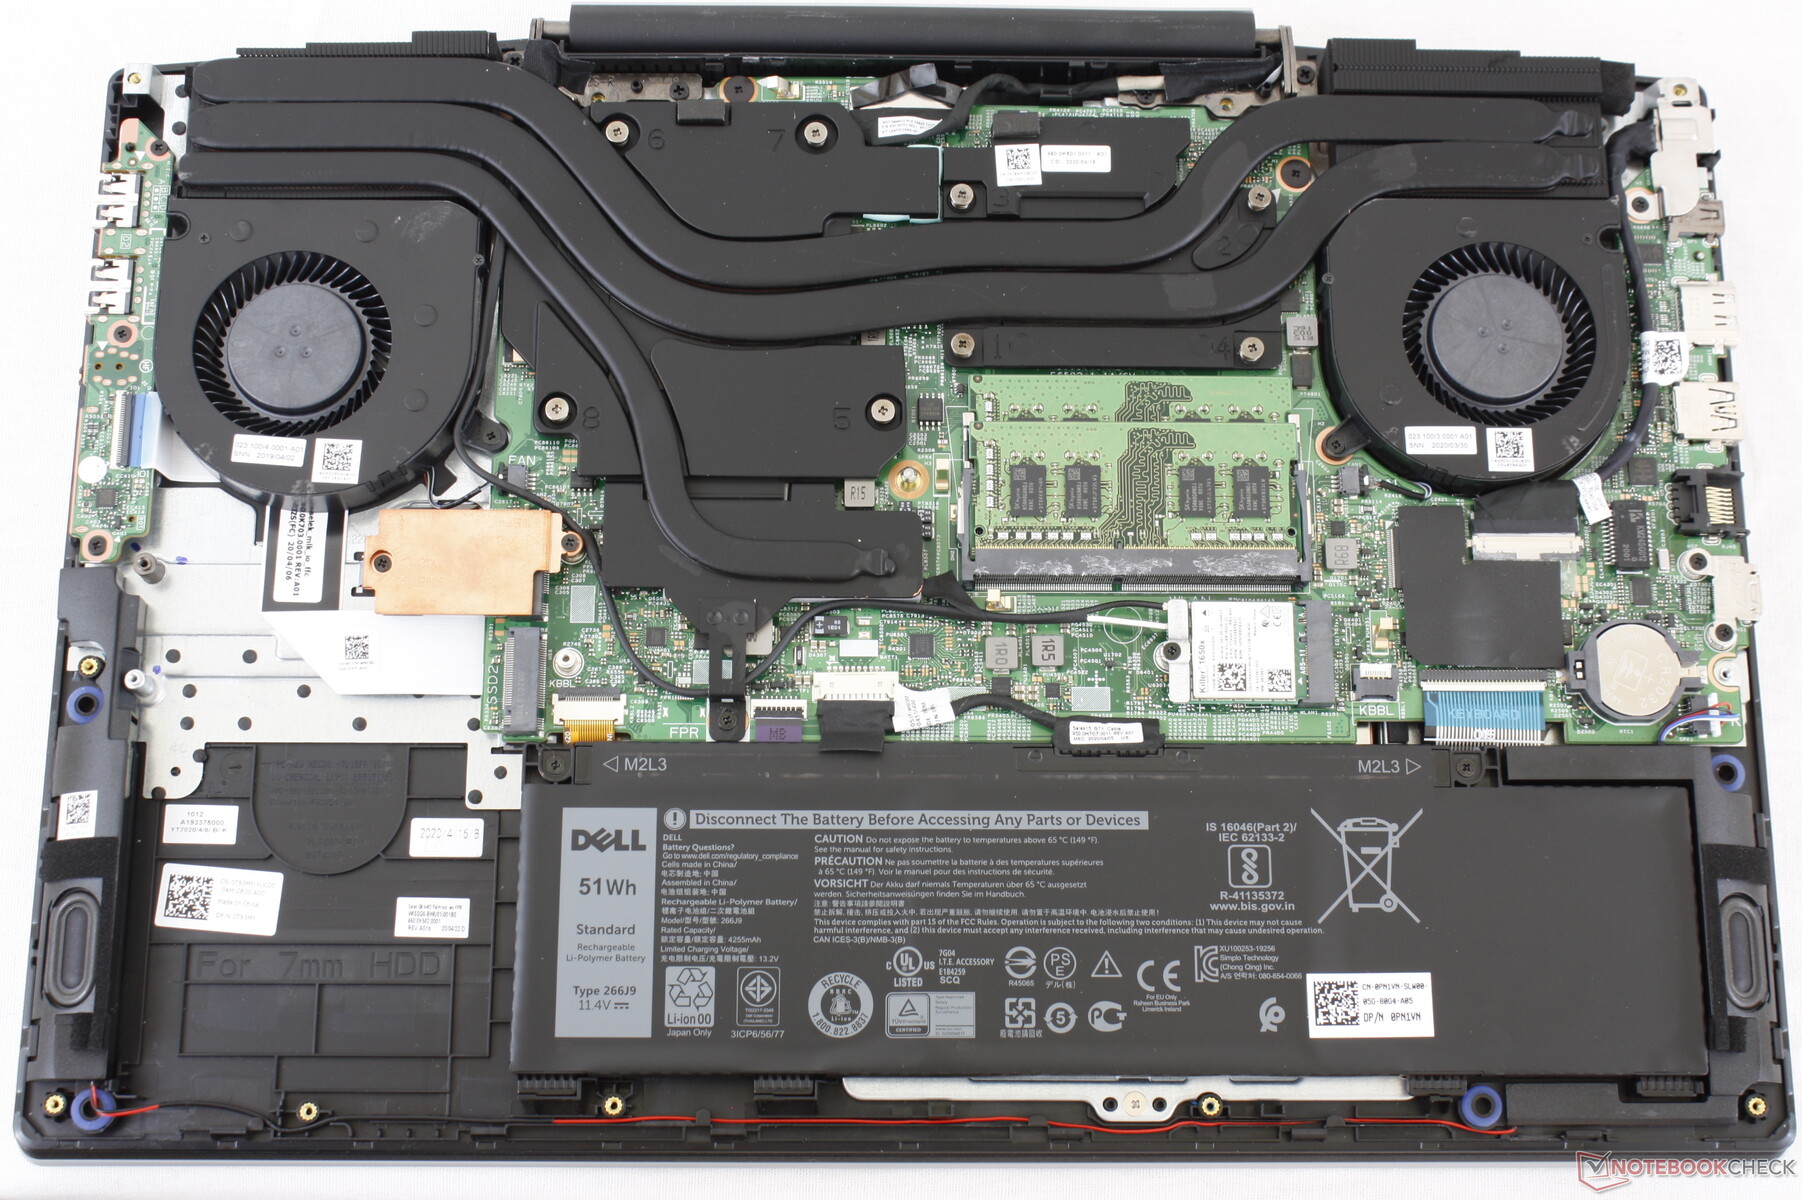
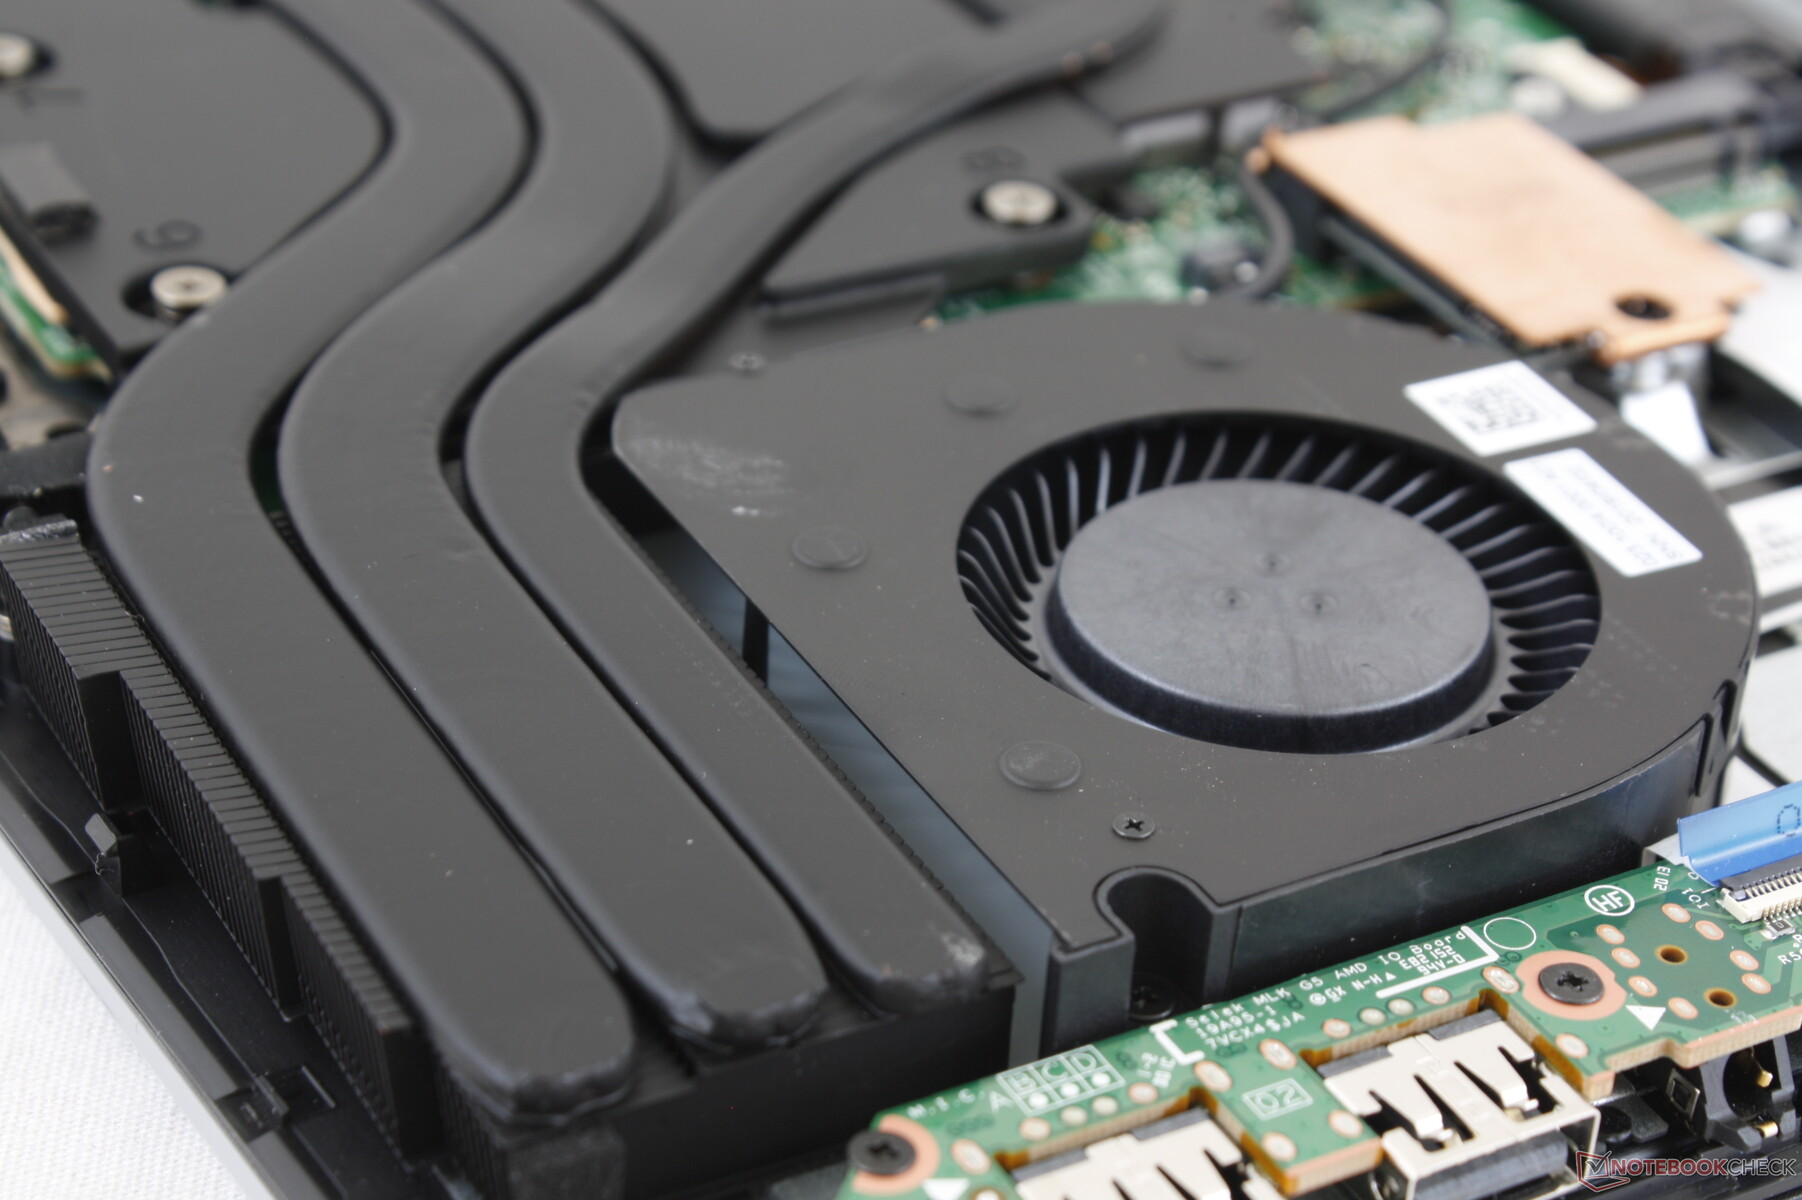
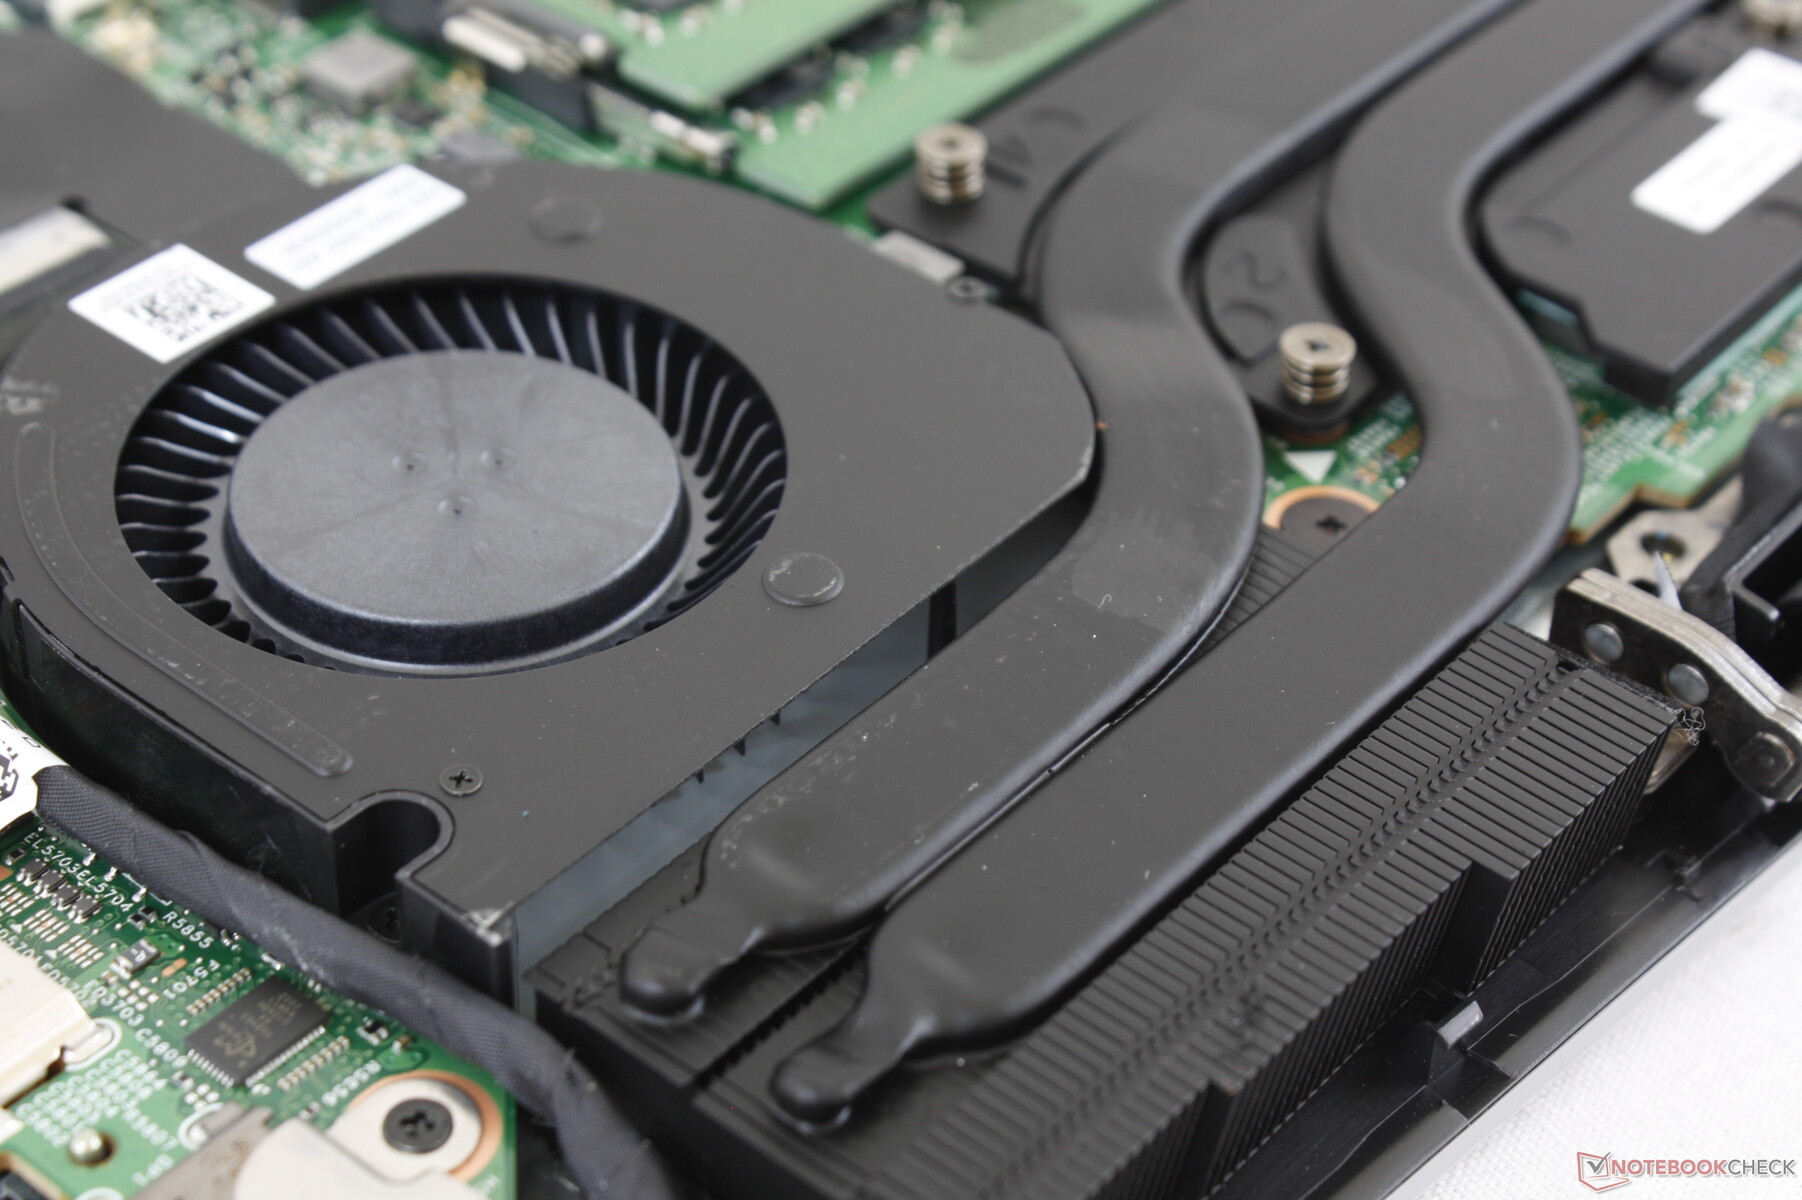
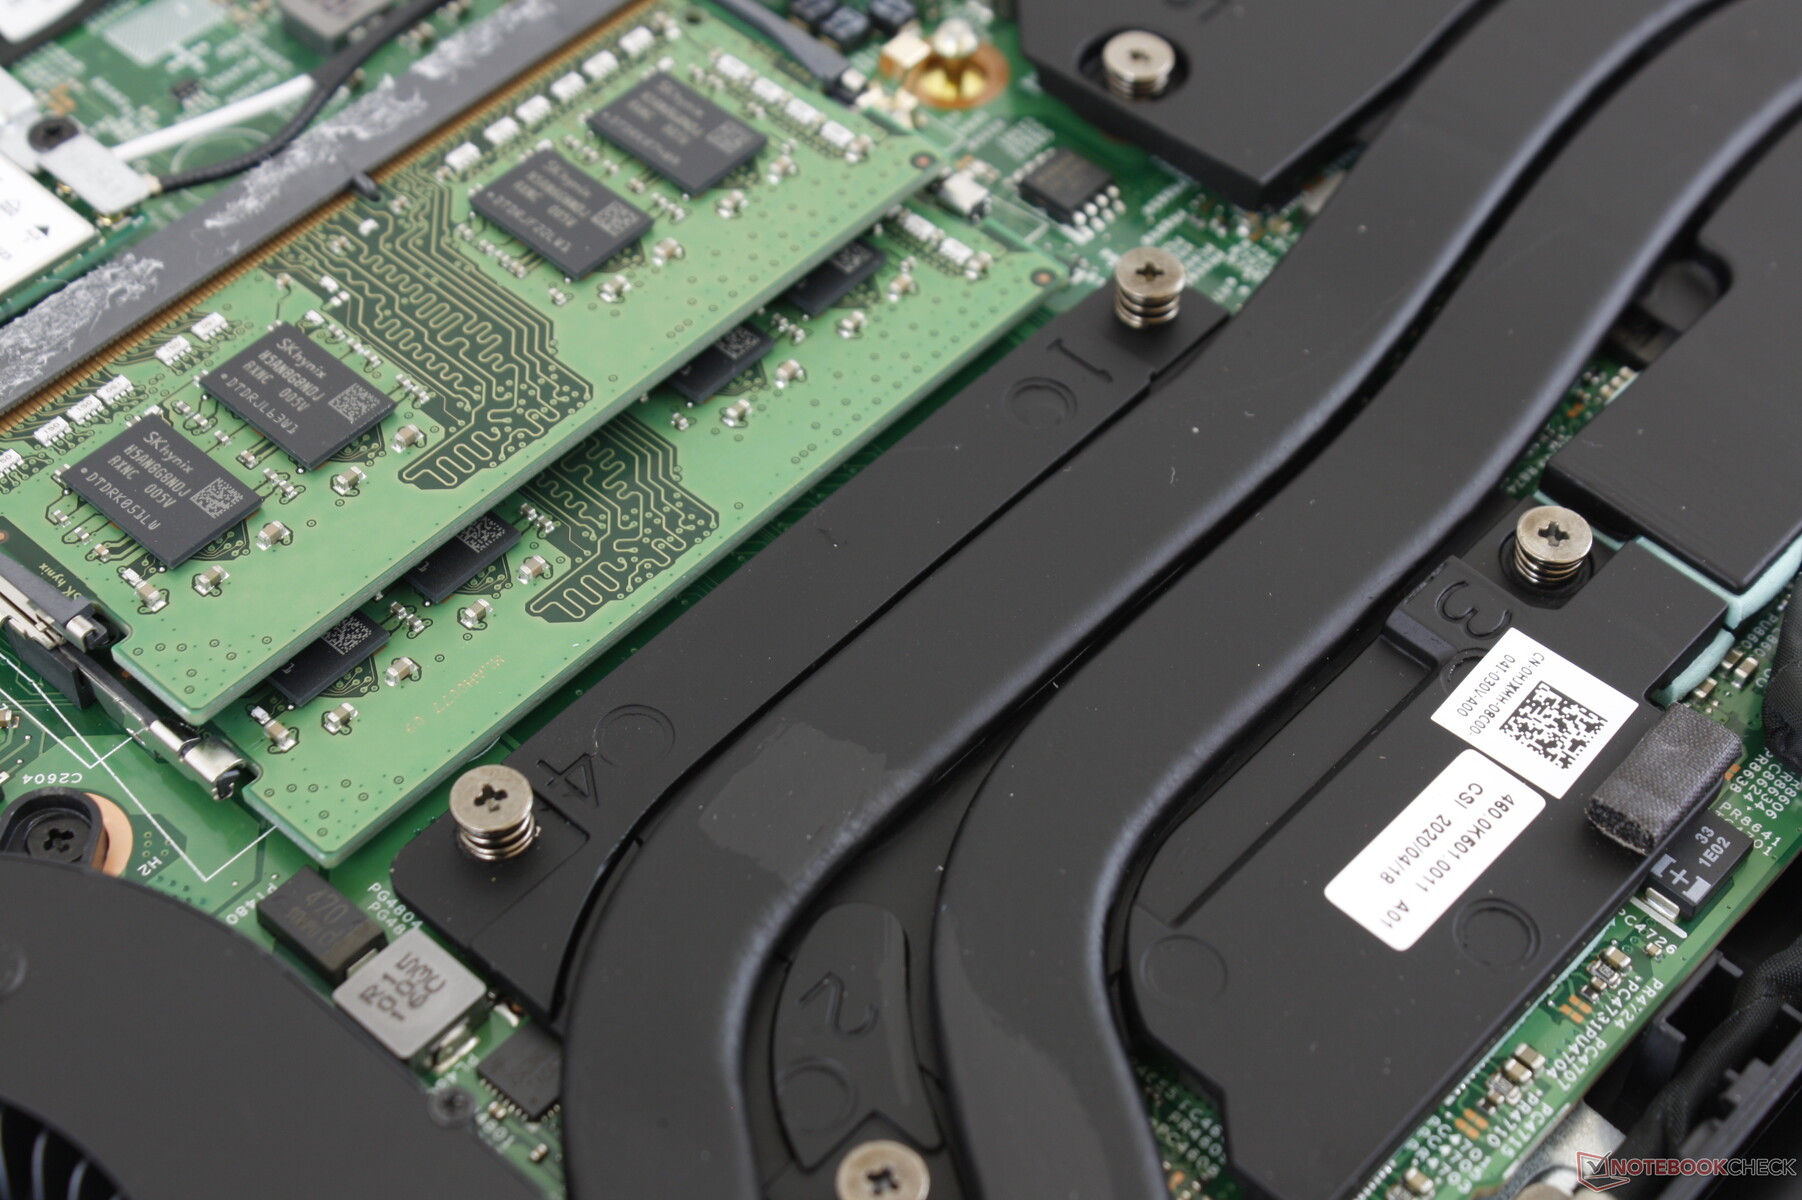
Maintenance
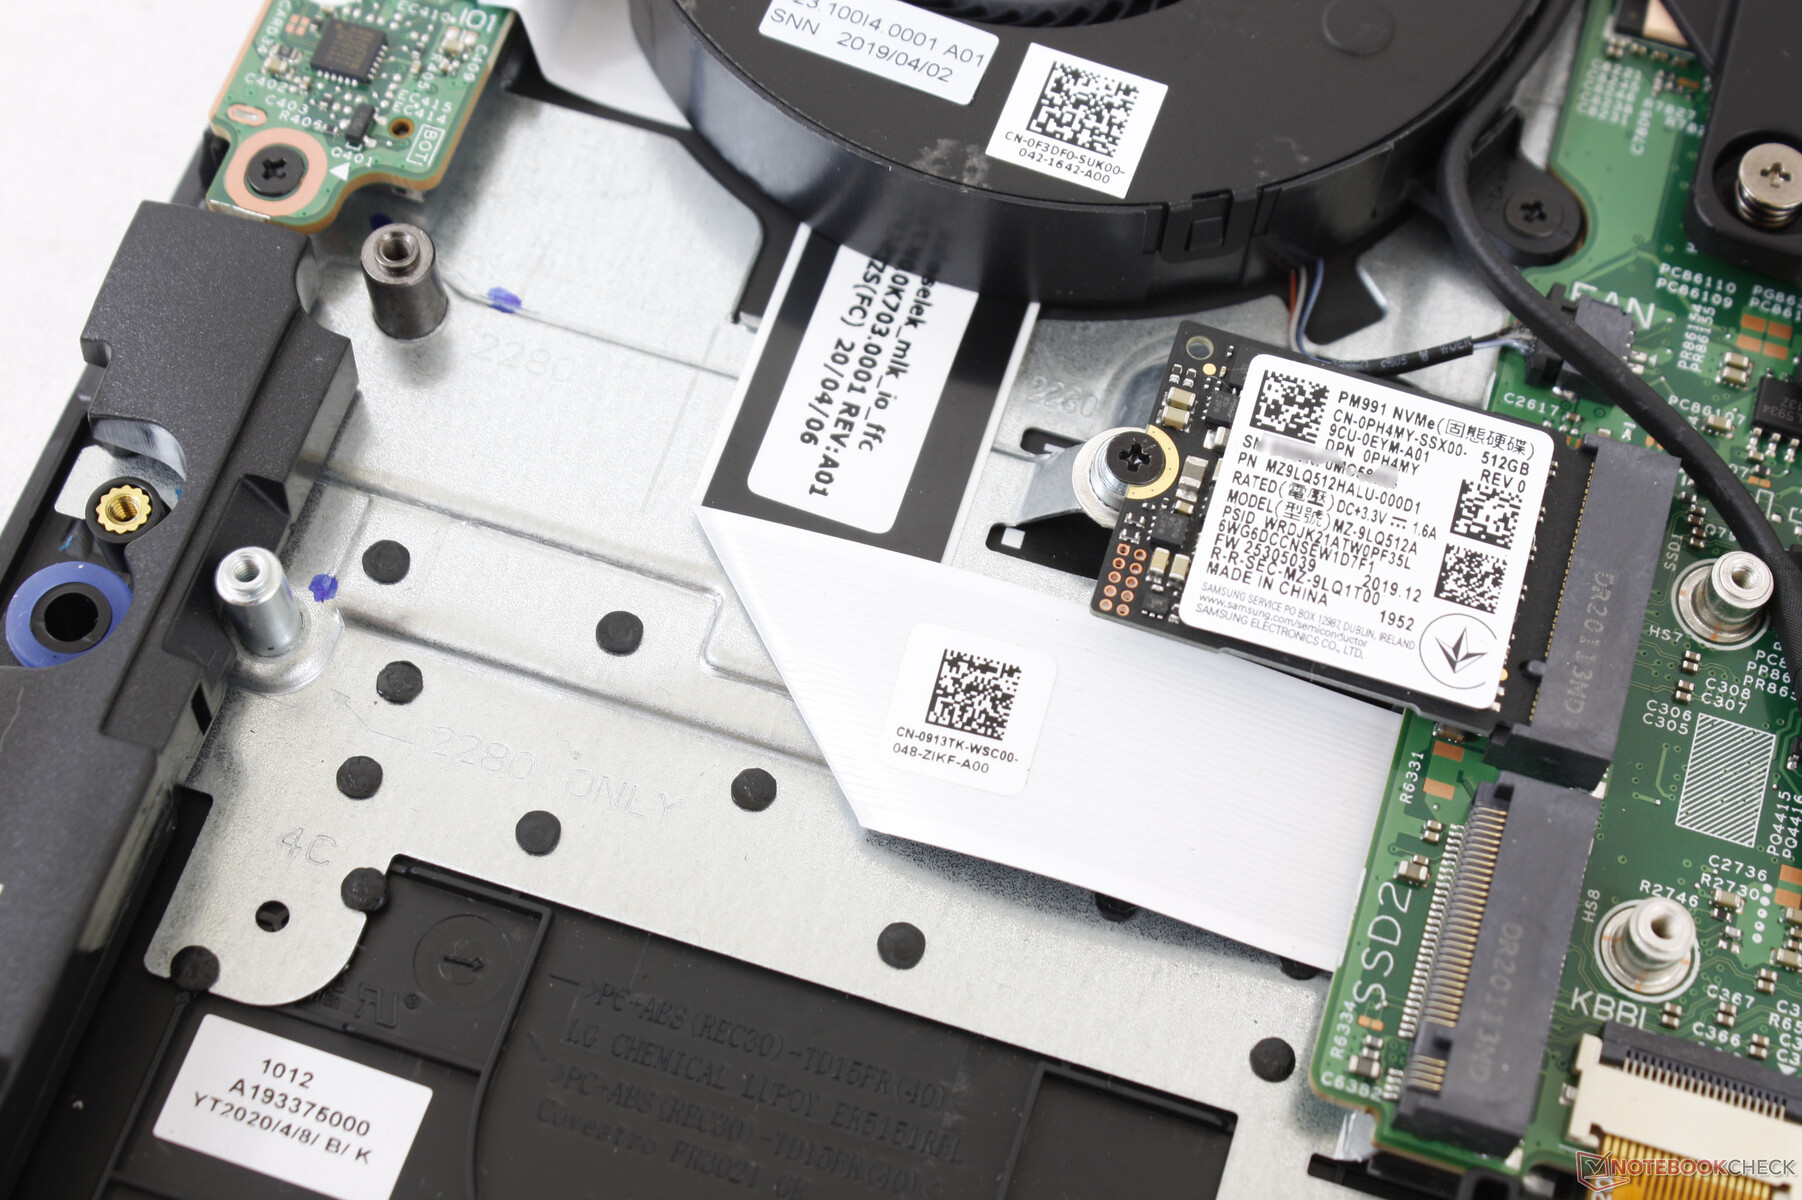
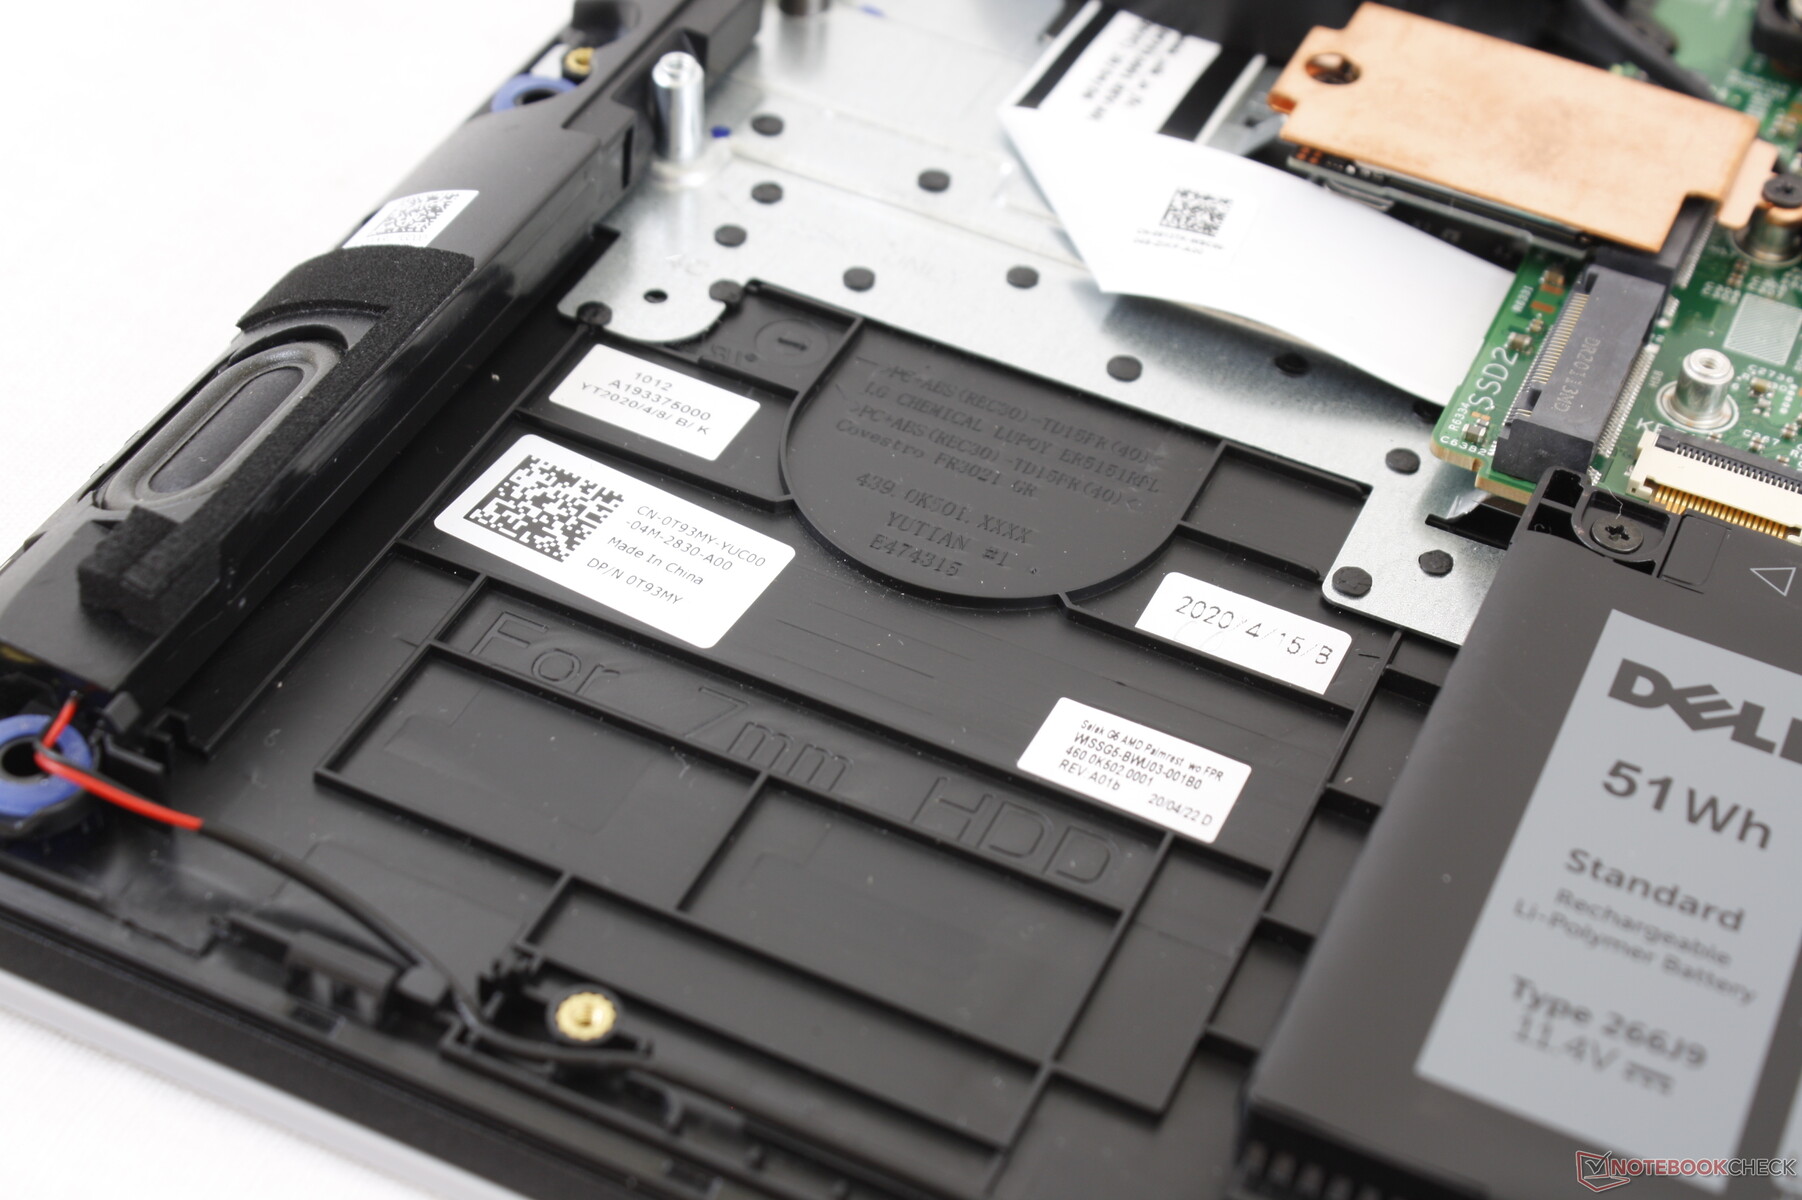
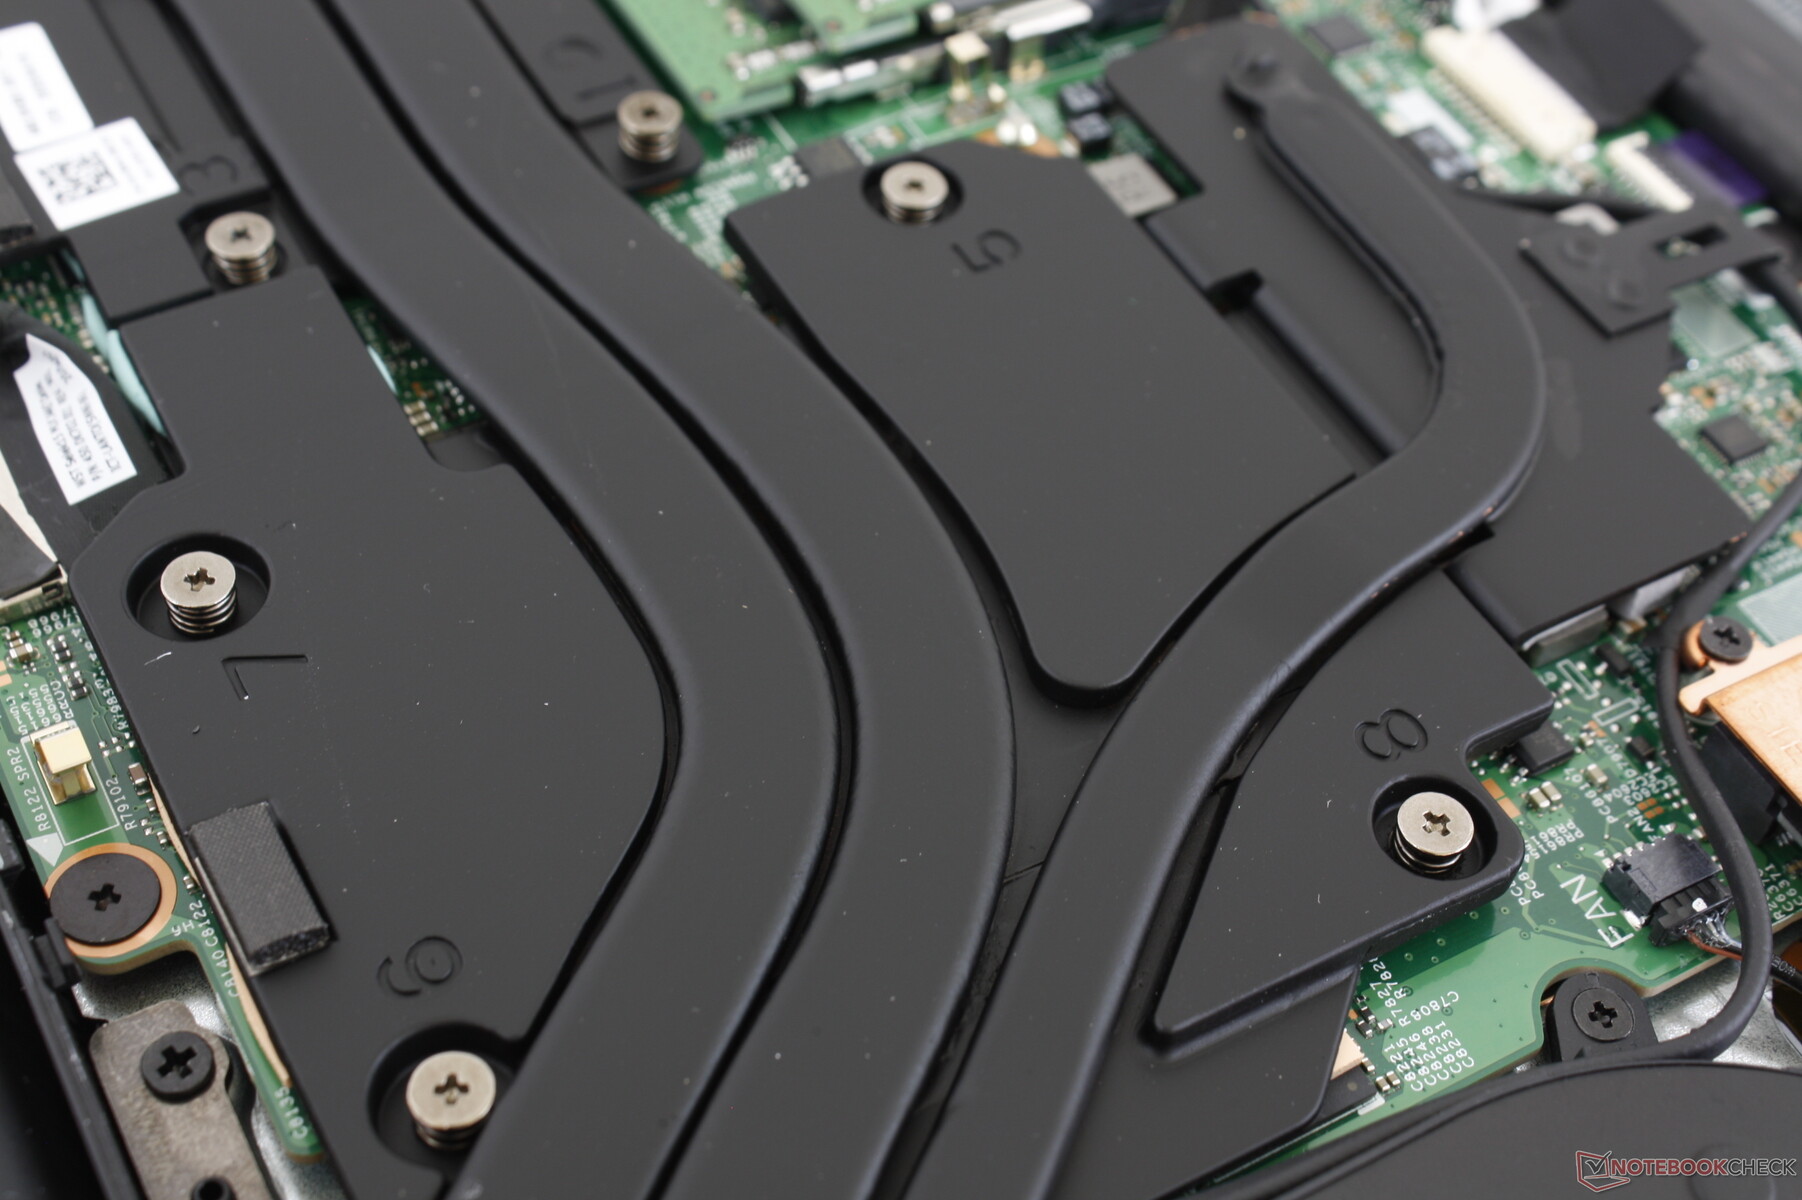
The bottom panel is relatively easy to remove with a Philips screwdriver and sharp edge for the rear. Internals have been completely redesigned when compared to the last generation G5 15 5590.
Accessories and Warranty
There are no extras in the box other than the AC adapter and usual paperwork. The standard one-year limited warranty applies with plenty of extensions options if purchased directly from Dell.
Input Devices
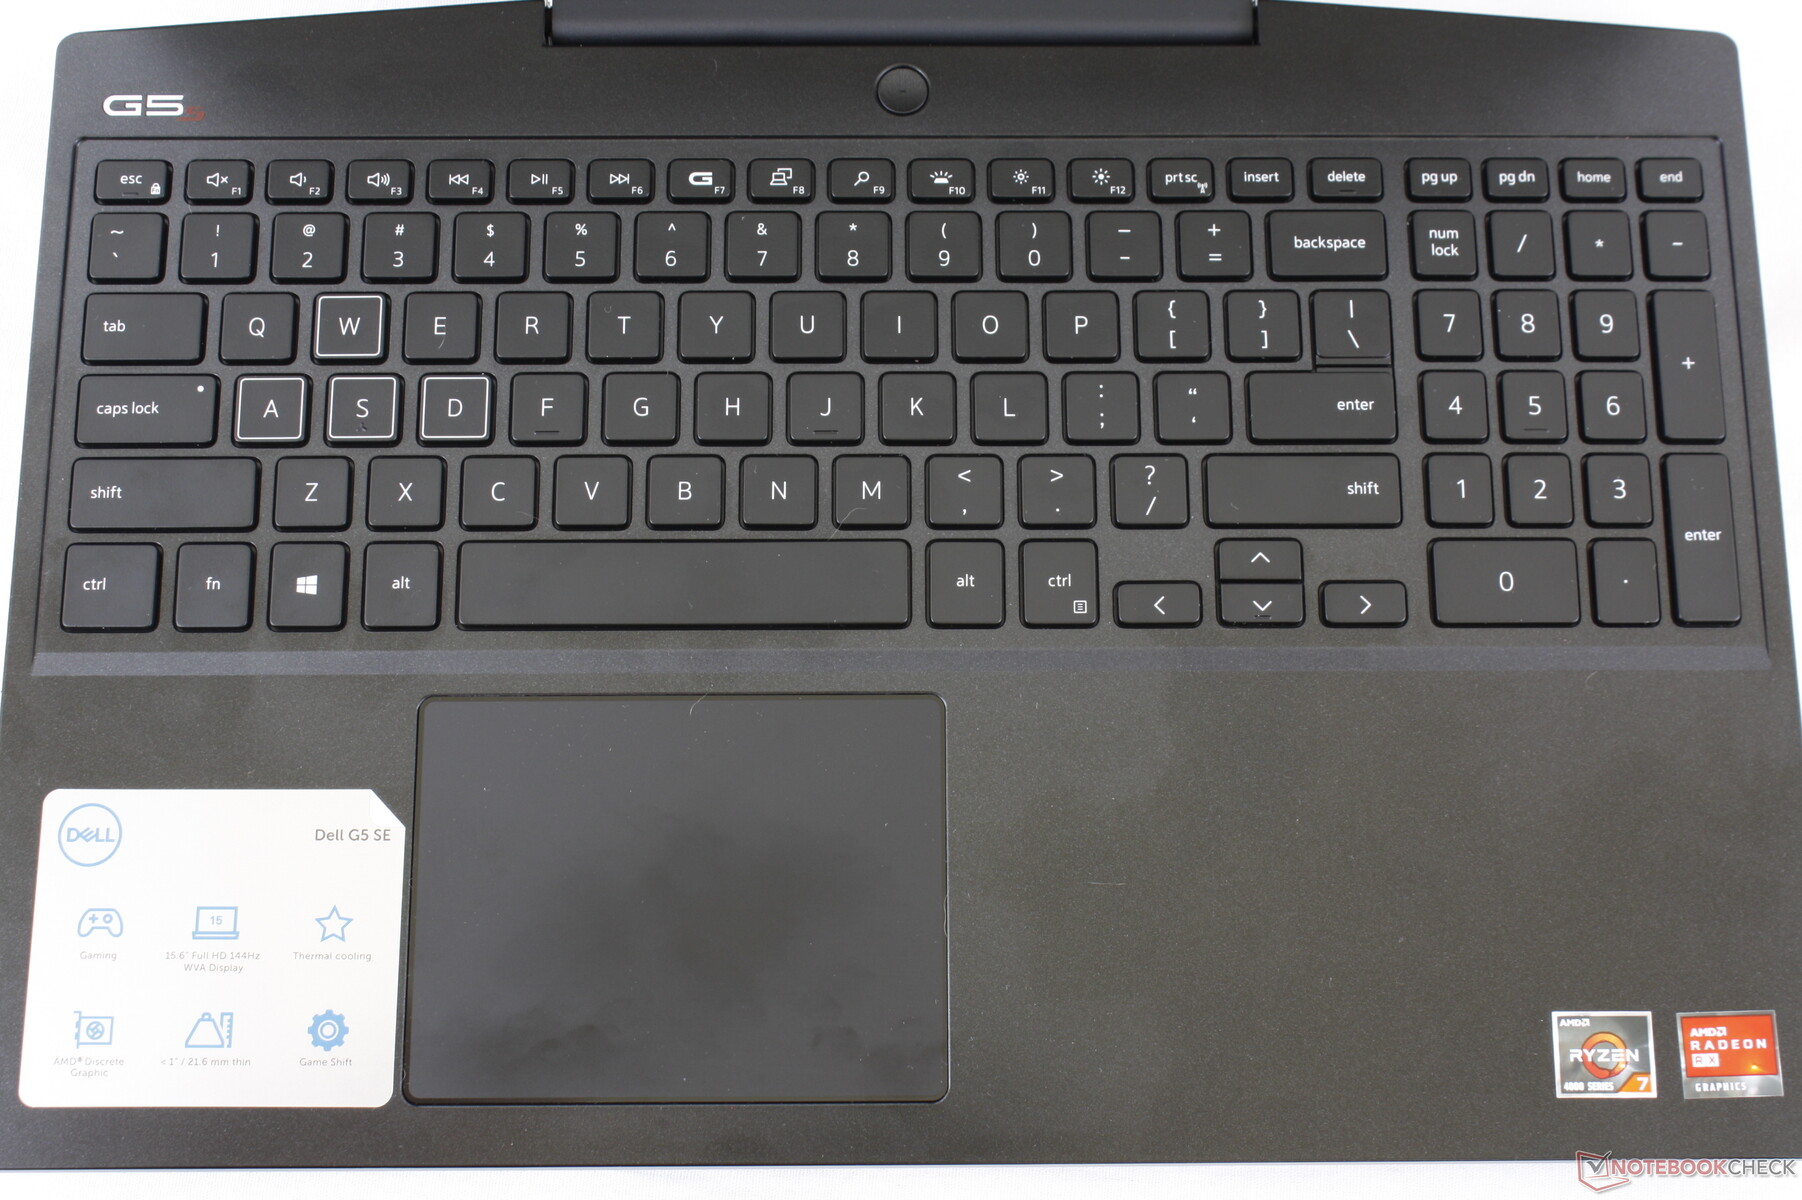
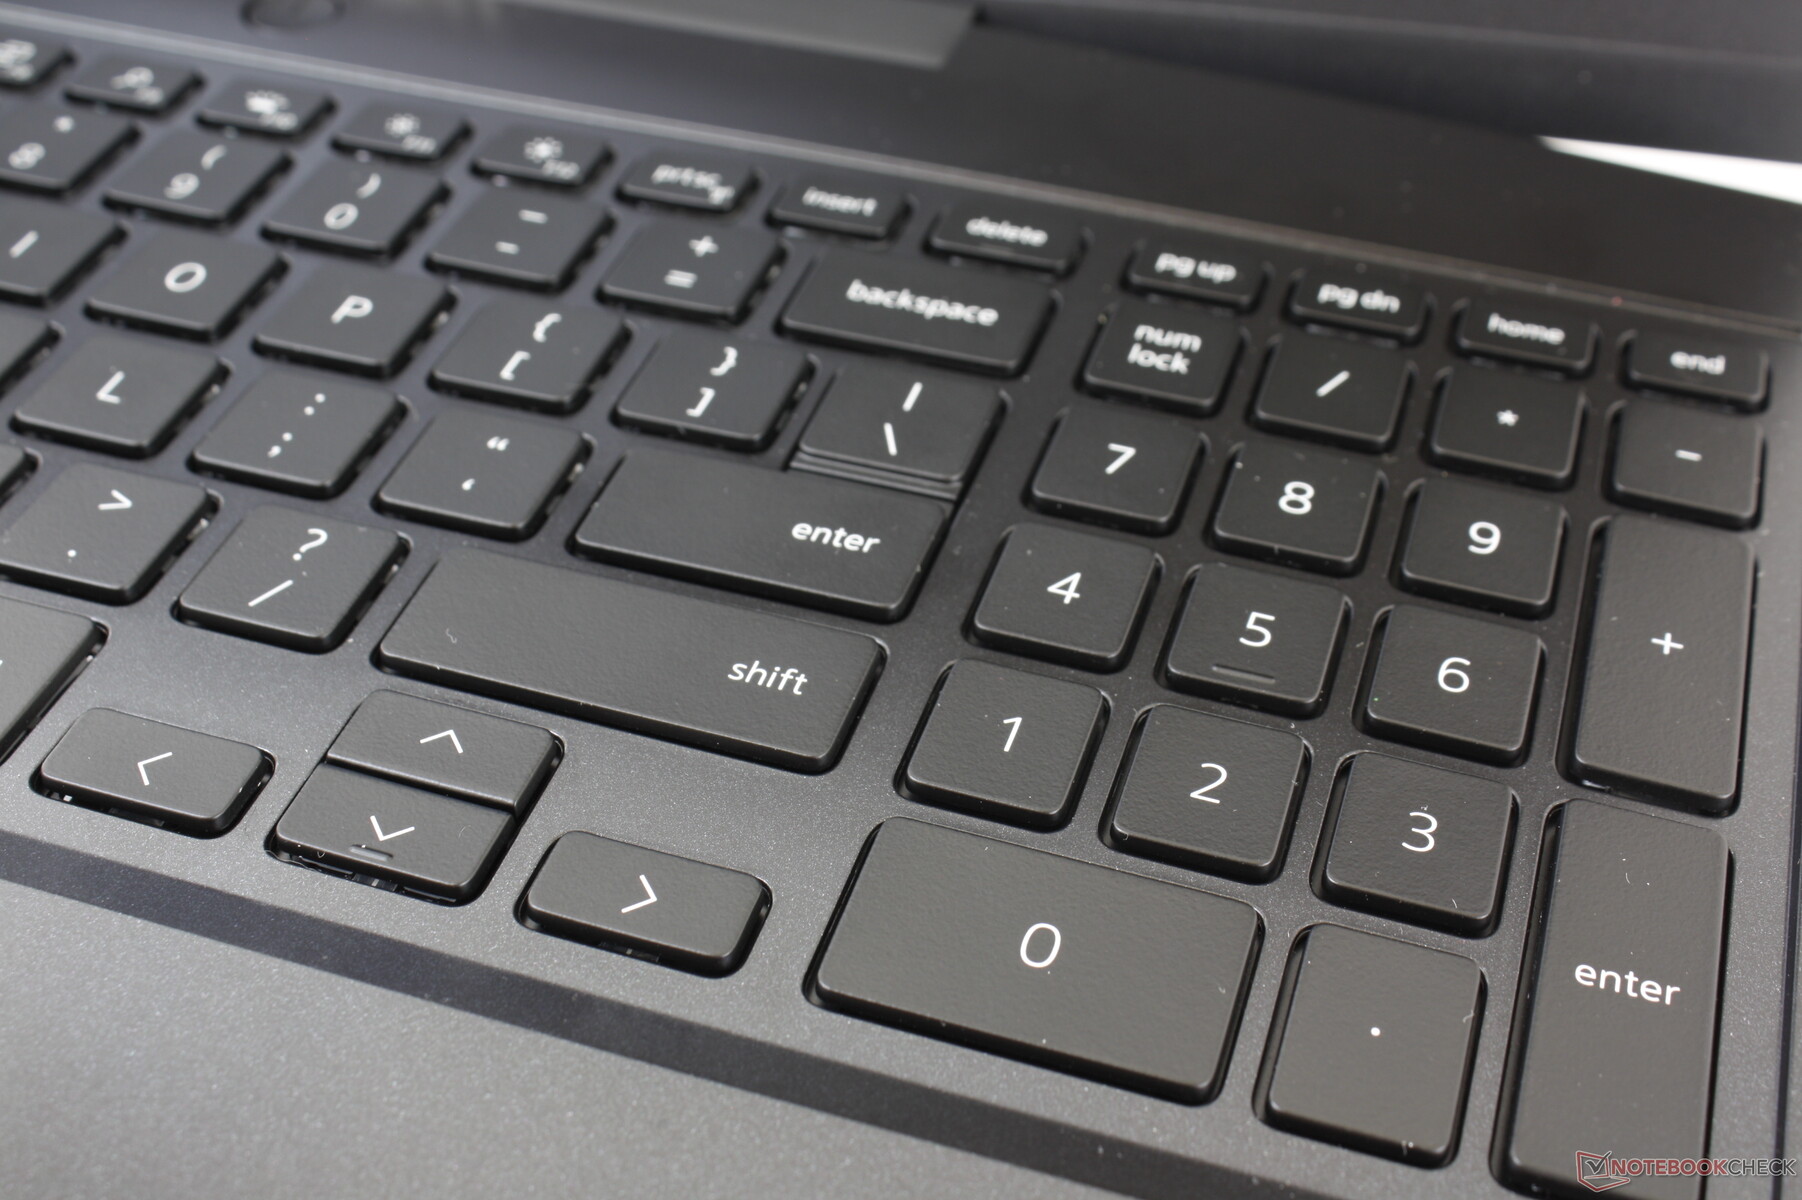
Keyboard
Keyboard layout and feedback remain identical to the G5 15 5590. Dell added a new "G" fn hotkey on the F7 key for toggling Alienware Command Center High Performance mode. This mode is necessary to get the most performance out of the system, but fan noise will jump immediately to its maximum.
Four-zone RGB backlight is included and all keys and symbols are lit. Allienware Command Center must be running or else the backlight cannot be activated.
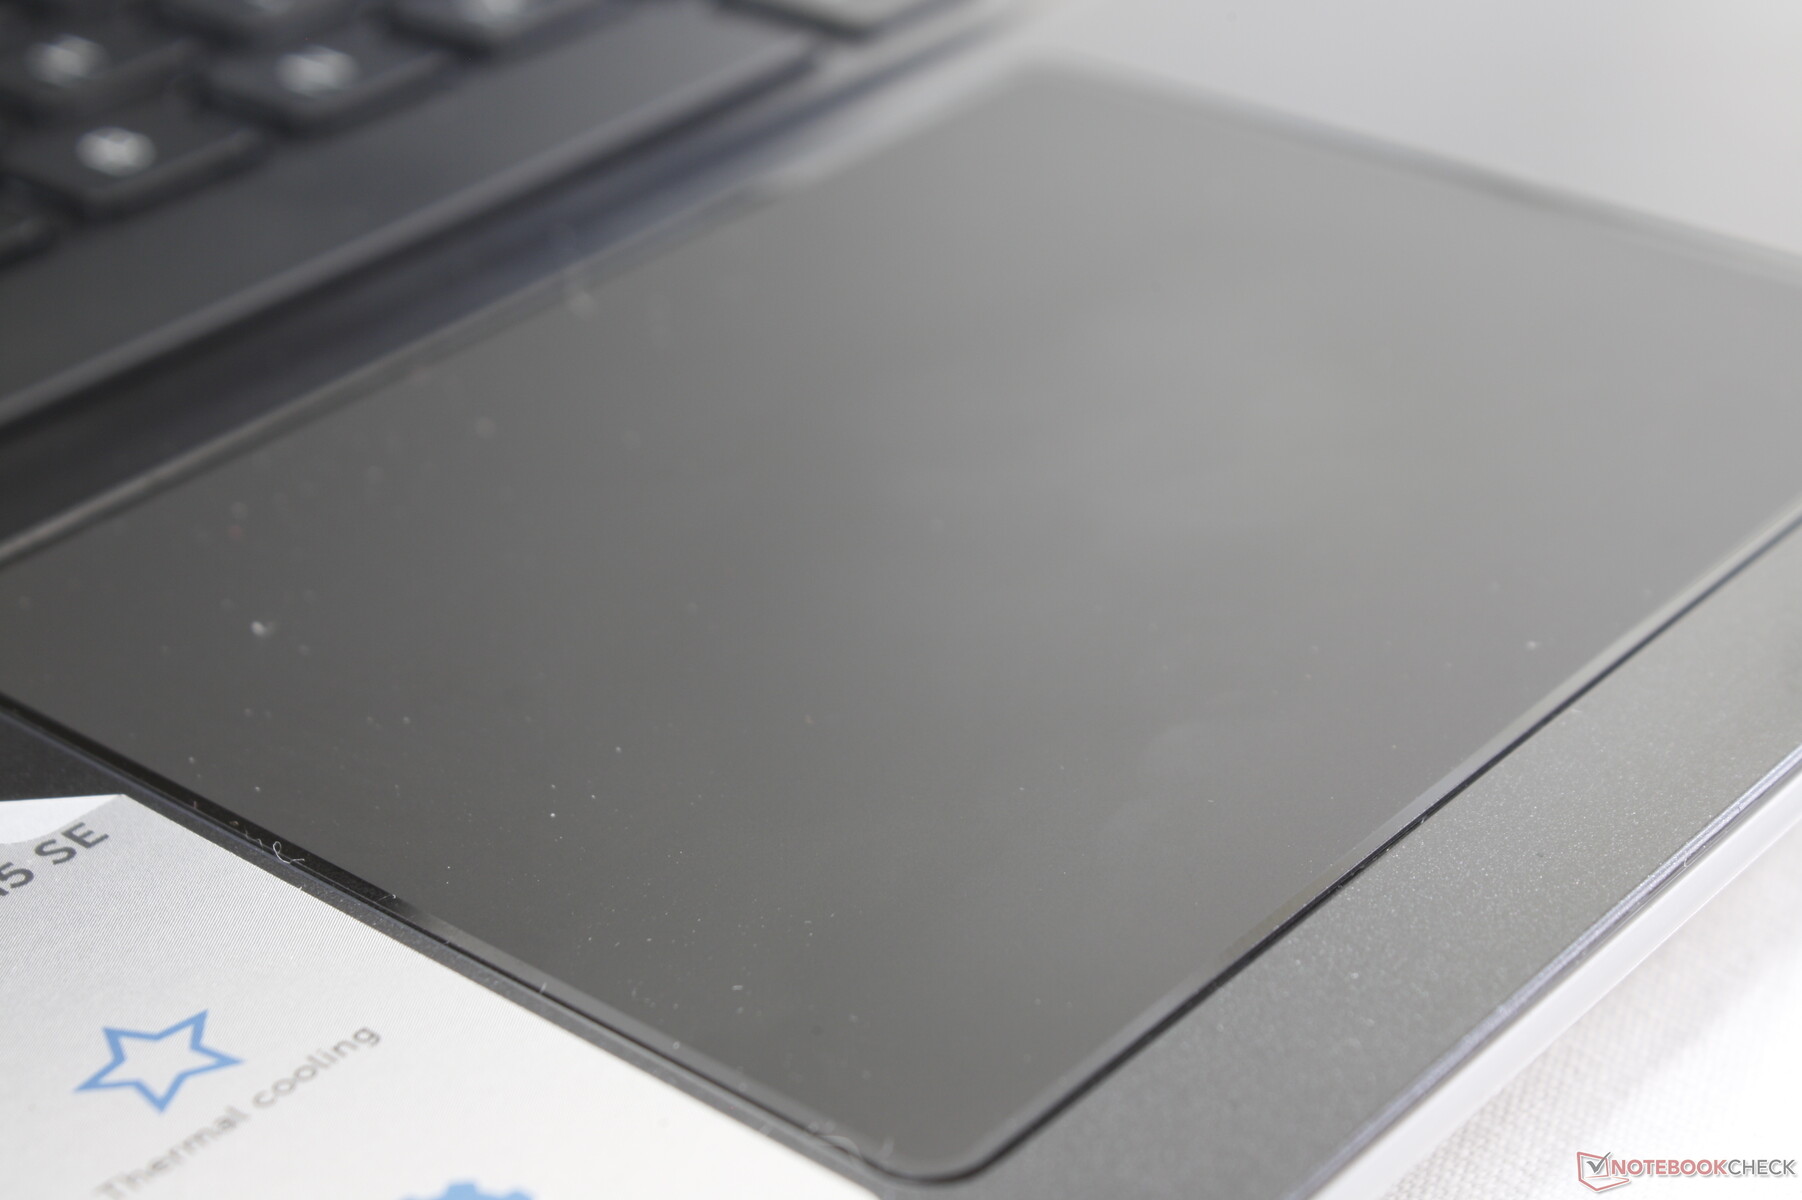
Touchpad
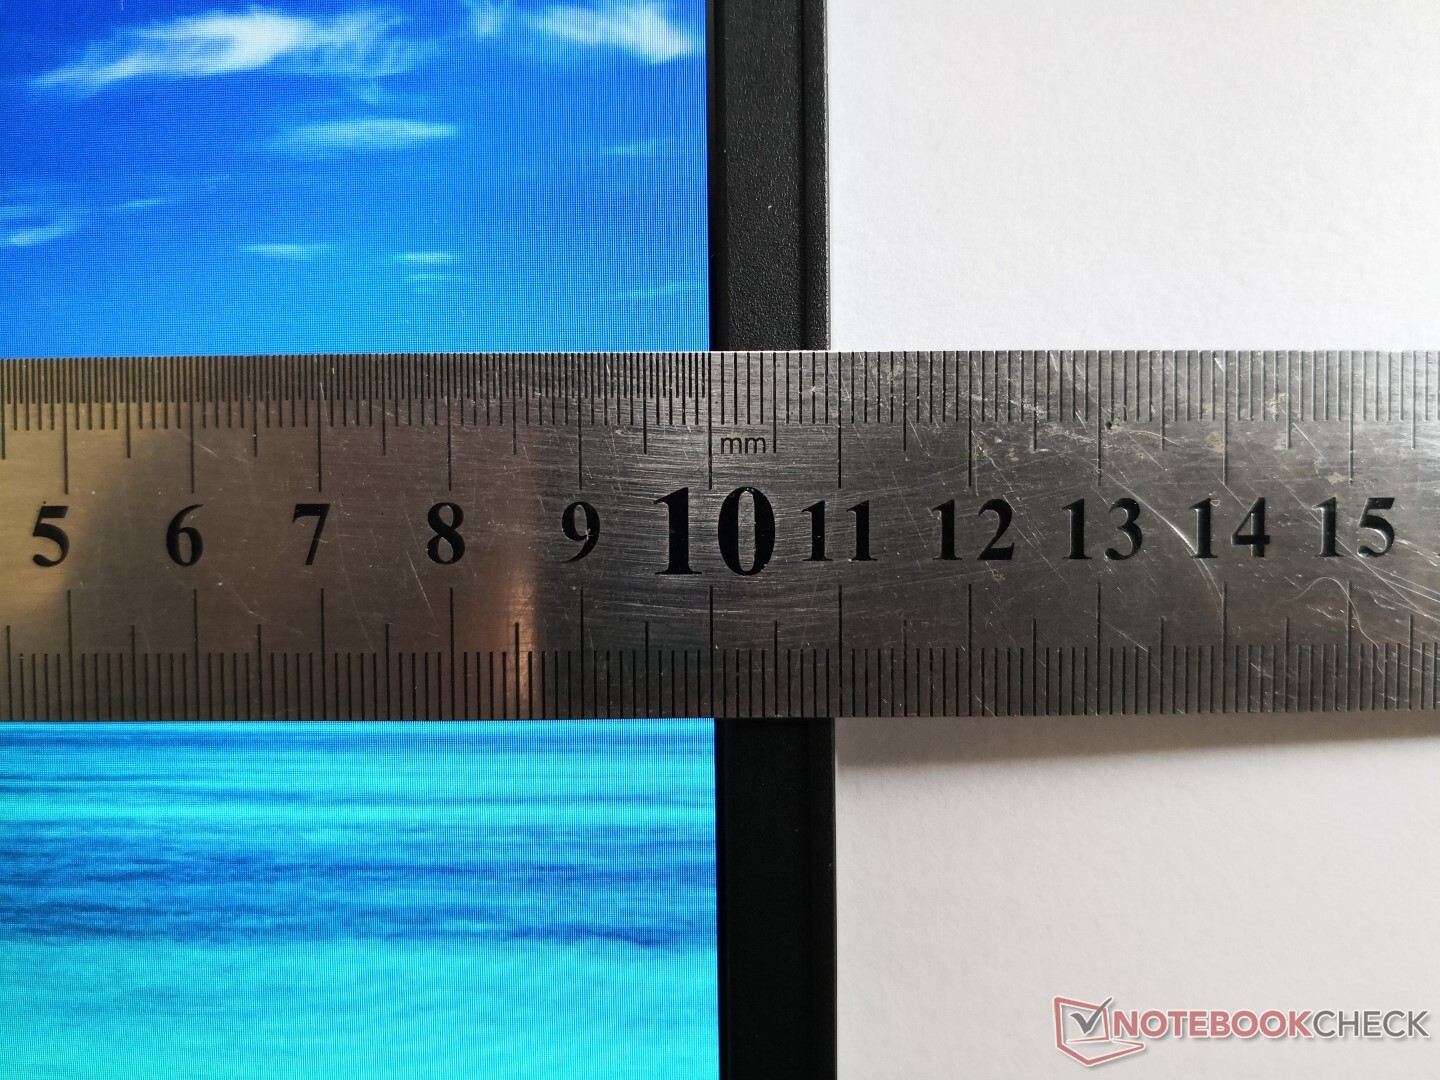
The clickpad (10.5 x 8 cm) works well for cursor control at both slow and fast speeds and it feels very responsive as well due to the 144 Hz display refresh rate. Clicking, however, is too shallow and spongy.

Display
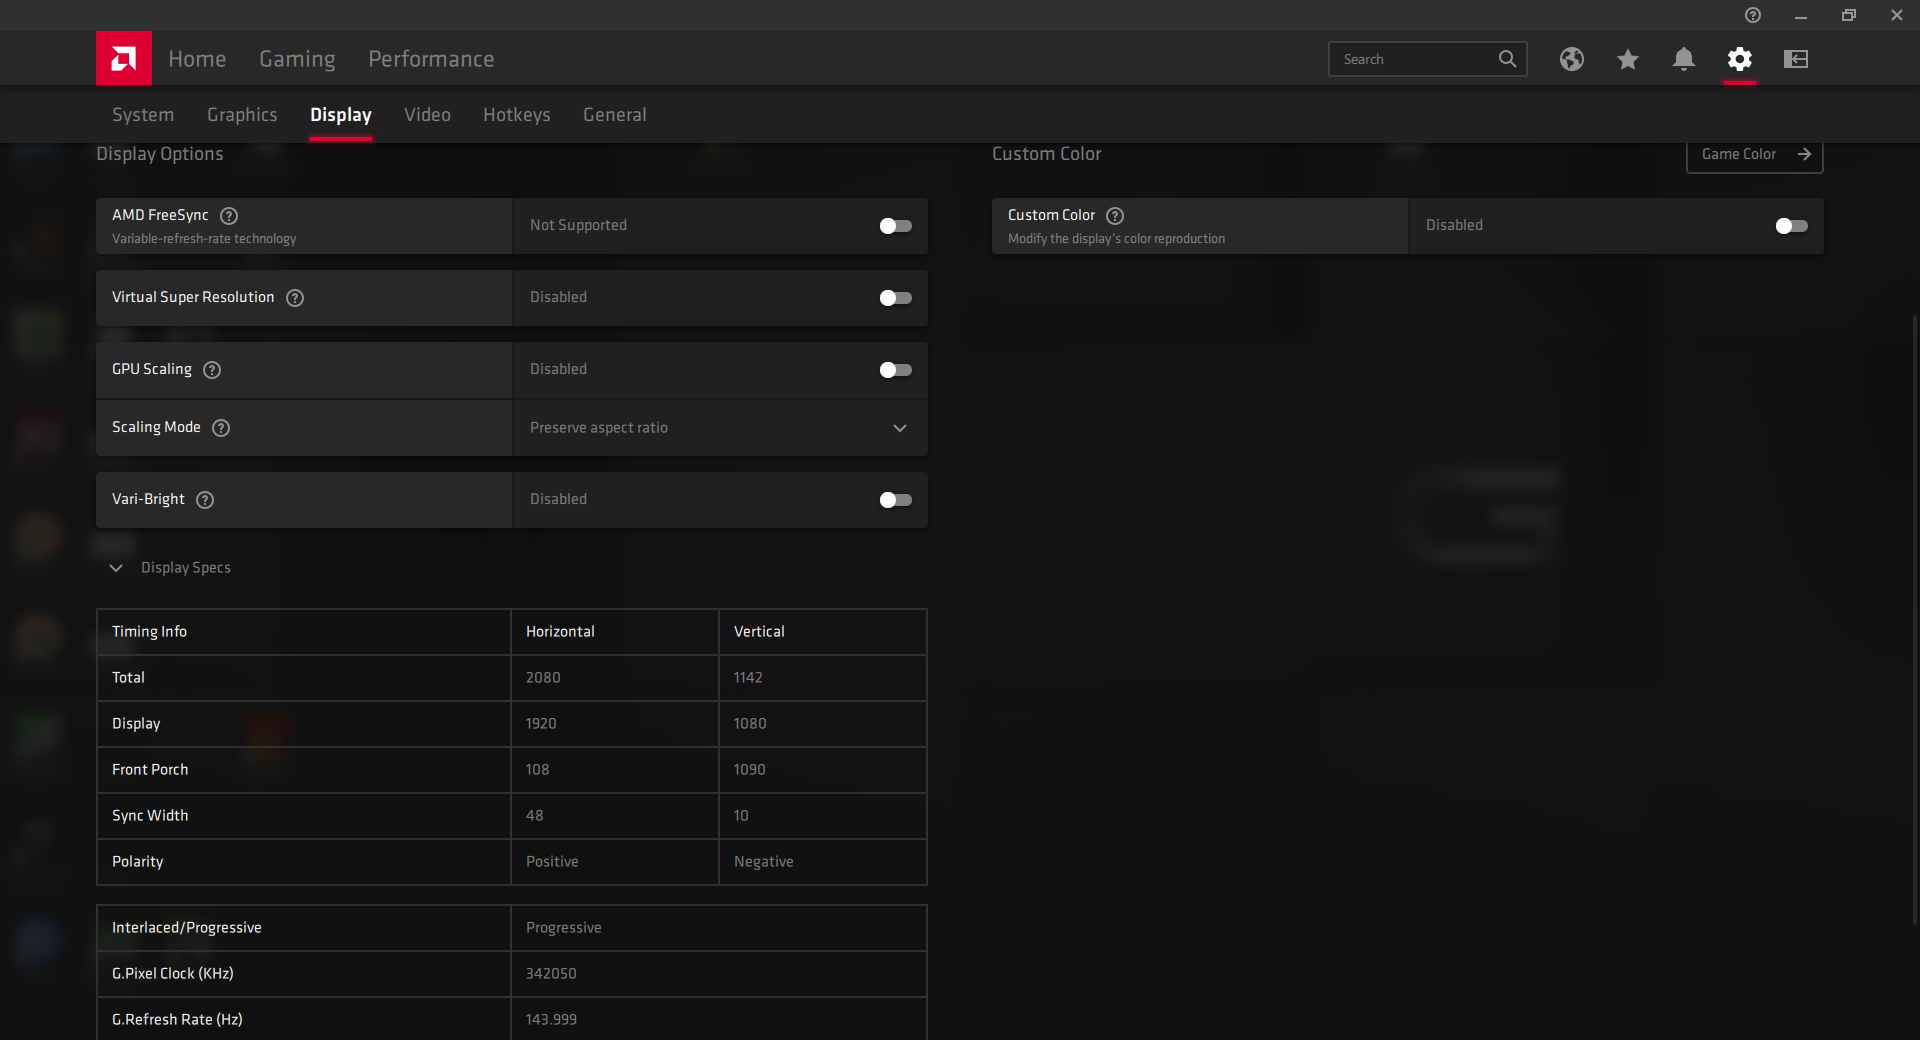
(June 29, 2020 update: We previously mentioned that adaptive sync was not available. According to Dell, the feature will become available on the 144 Hz panel after updating to the latest drivers.)
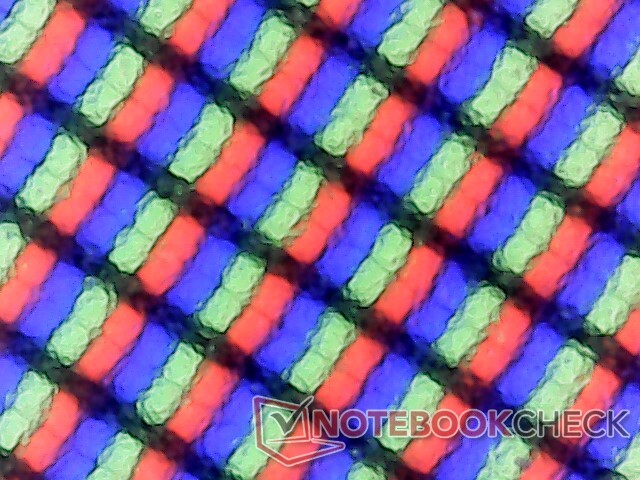
Dell offers just one 1080p WVA panel across all SKUs with options for either 60 Hz or 144 Hz. Unfortunately, adaptive sync is not available.
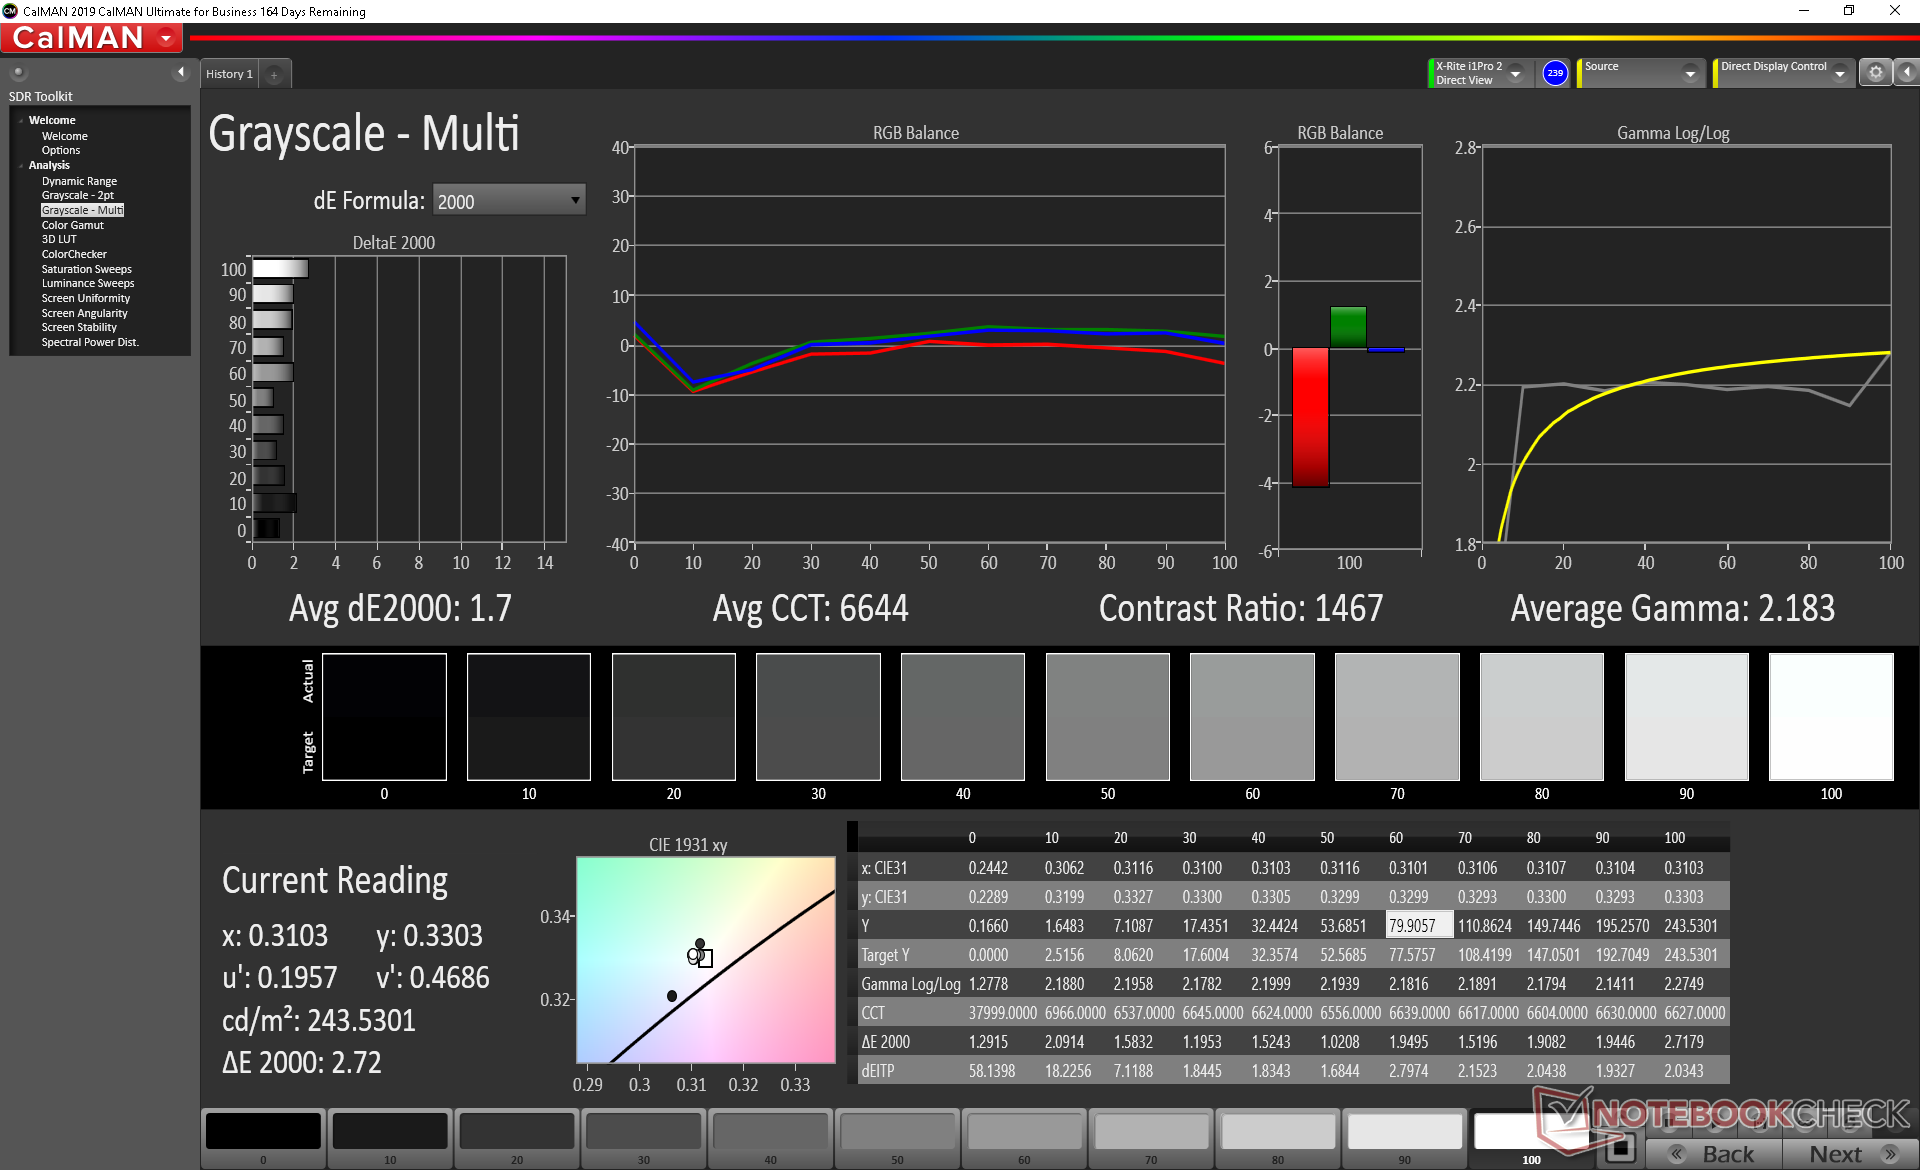
Display quality is great and representative of a mid-range gaming laptop. The fast response times, good contrast ratio, and good colors are where we expect them to be relative to other ~$1000 alternatives if not slightly better. The Asus TUF A15 FA506IV, for example, has poorer colors and slower response times.
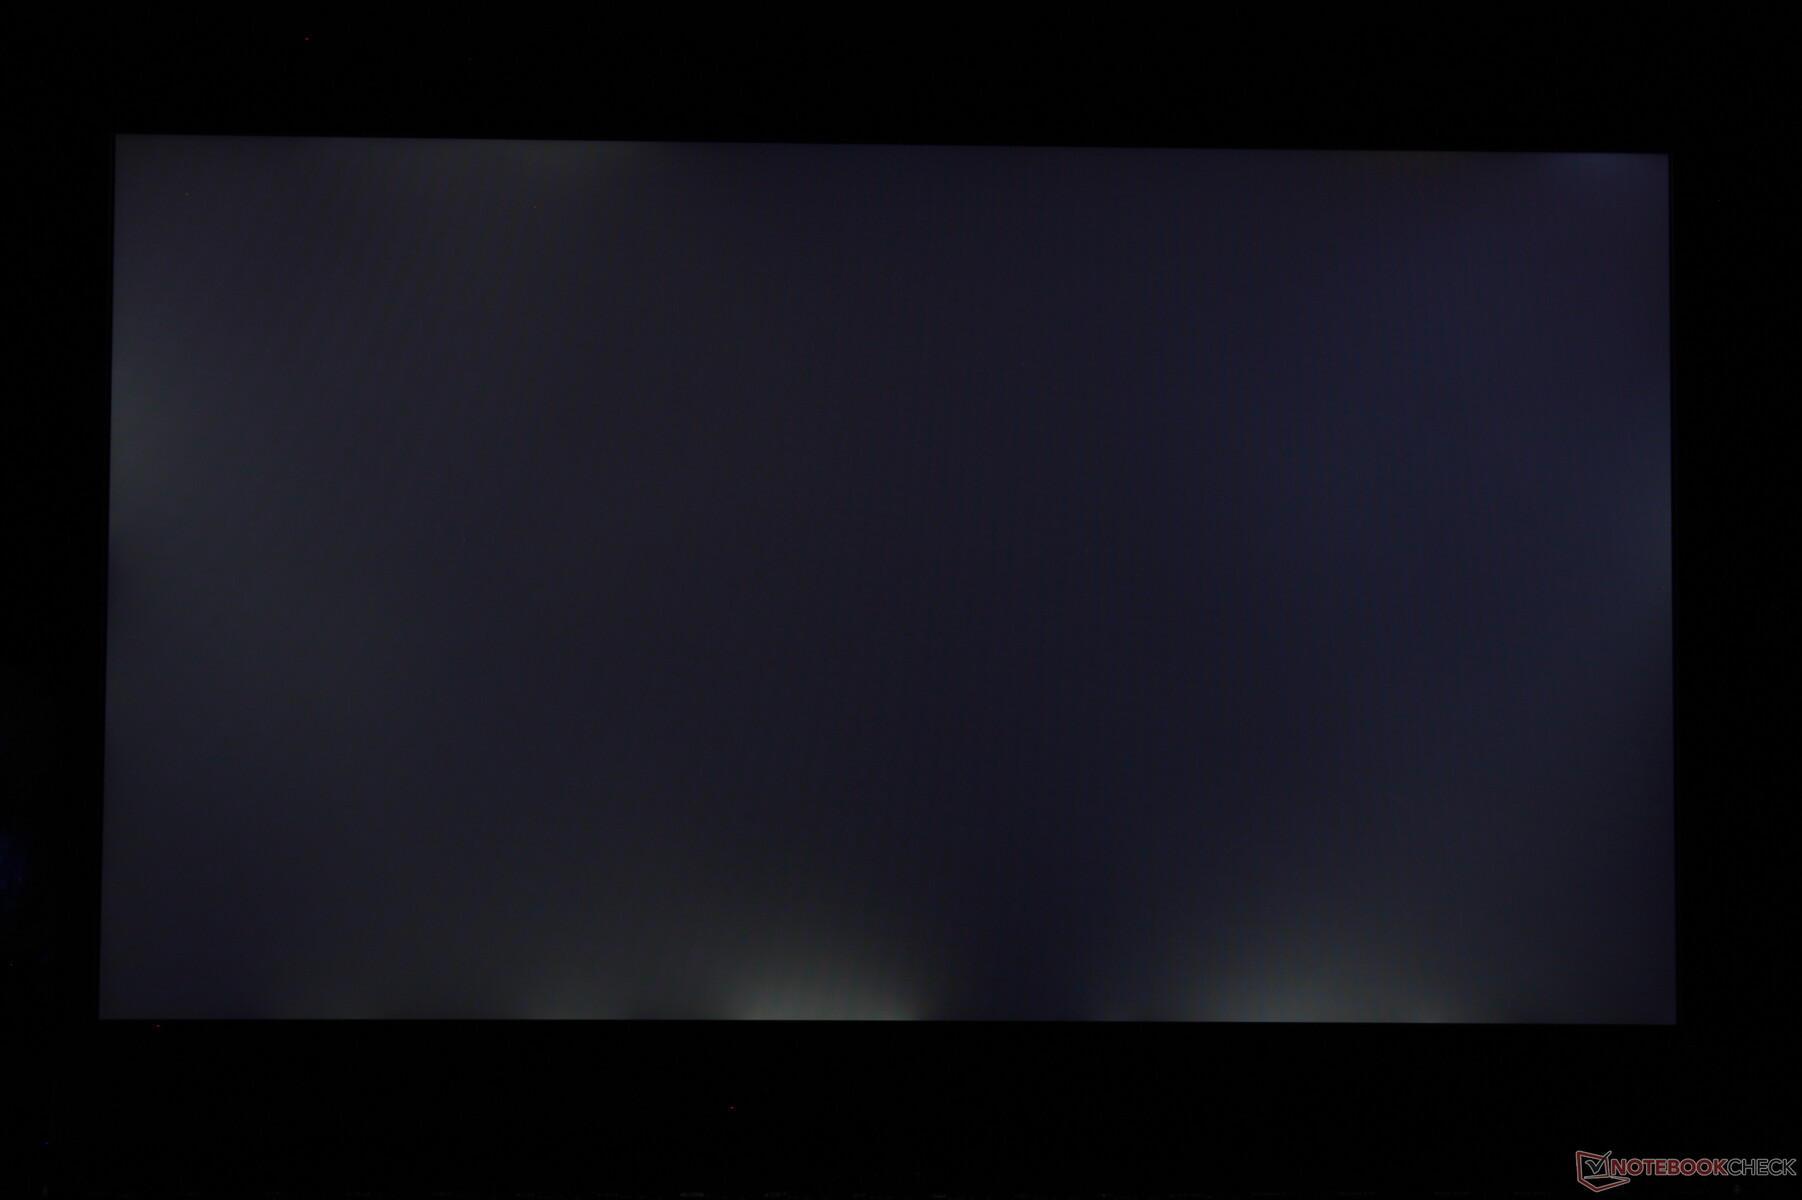
There are some unadvertised disadvantages to keep in mind. Pulse-width modulation is present on all brightness levels up to 99 percent meaning users sensitive to onscreen flickering may want to avoid the Dell G5 15 SE. Furthermore, our unit suffers from moderate uneven backlight bleeding along the bottom edge that becomes noticeable when gaming or during video playback with black borders.
| |||||||||||||||||||||||||
Brightness Distribution: 77 %
Center on Battery: 292 cd/m²
Contrast: 1081:1 (Black: 0.27 cd/m²)
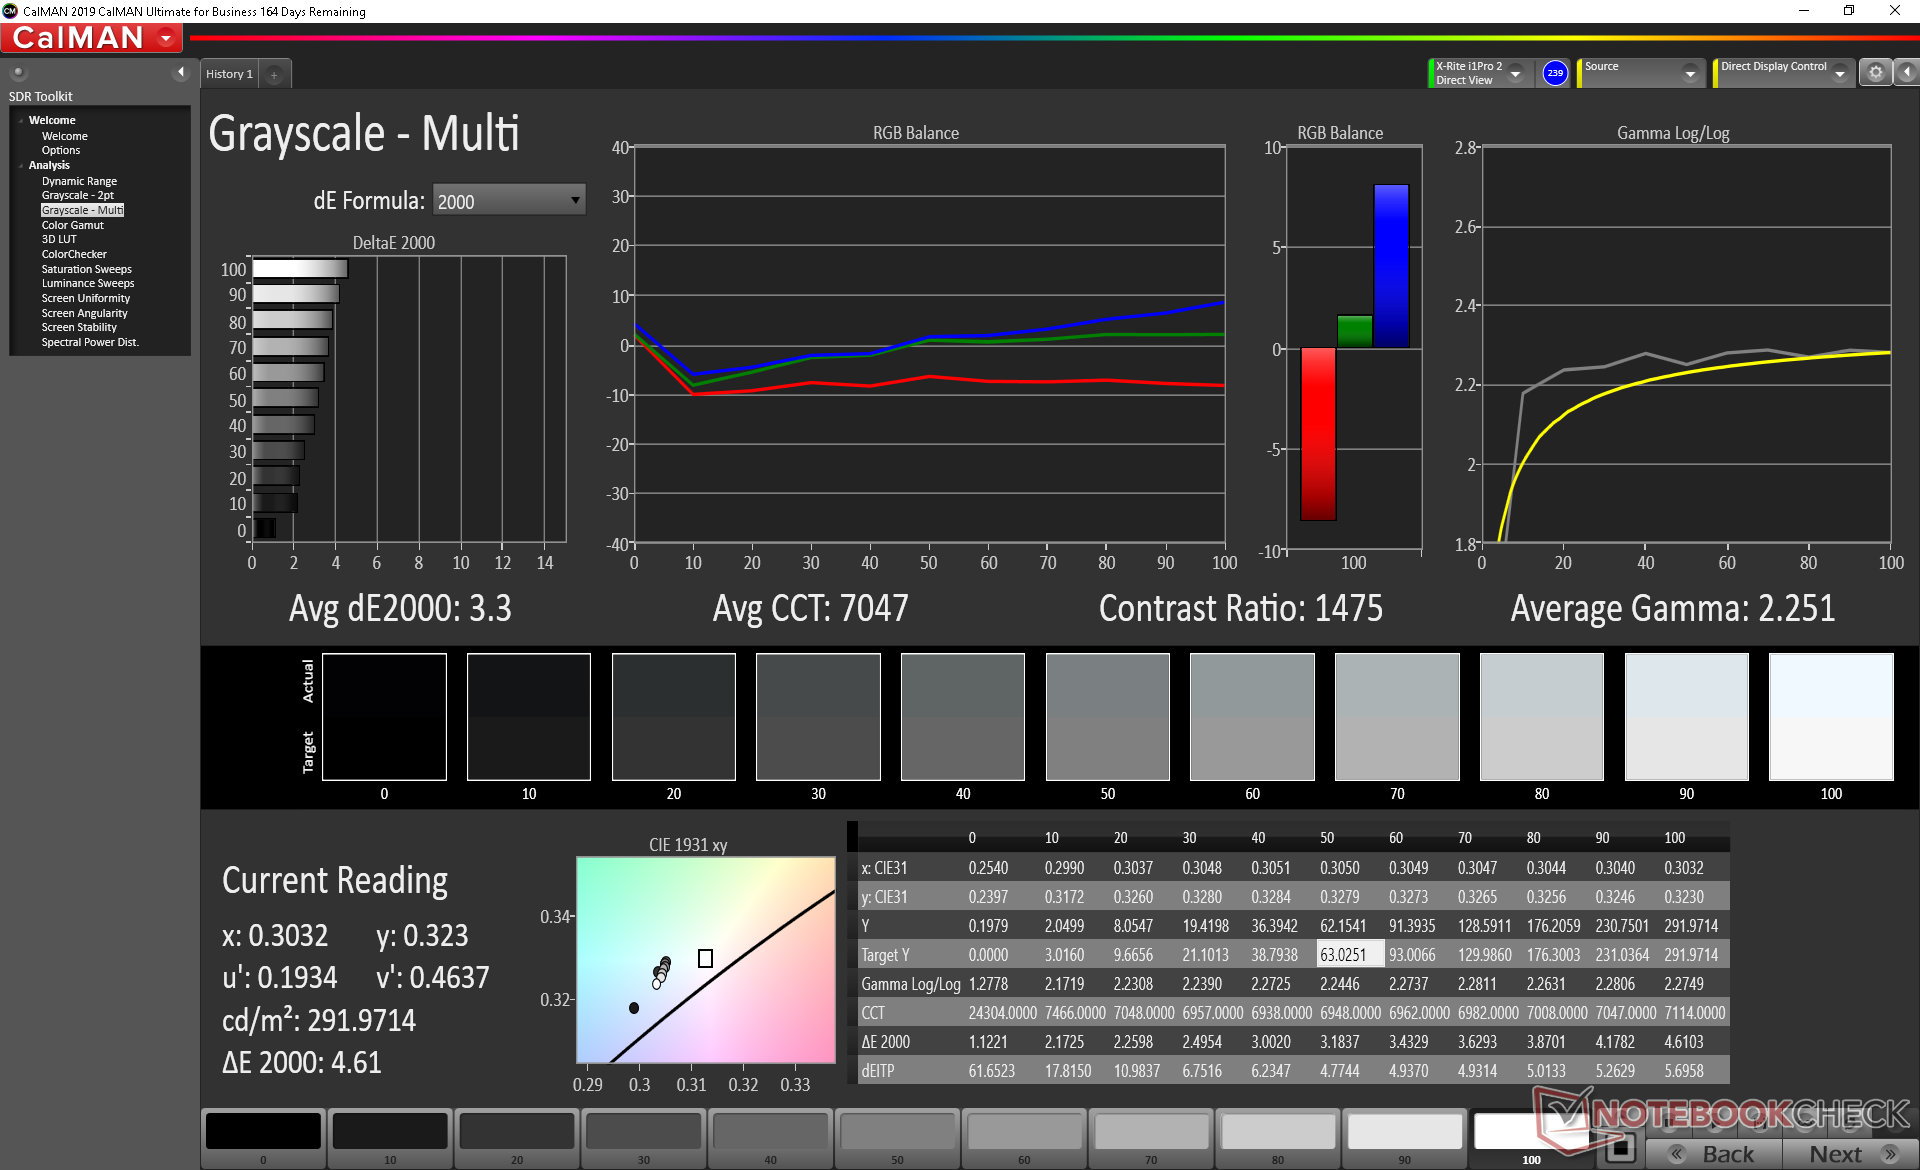
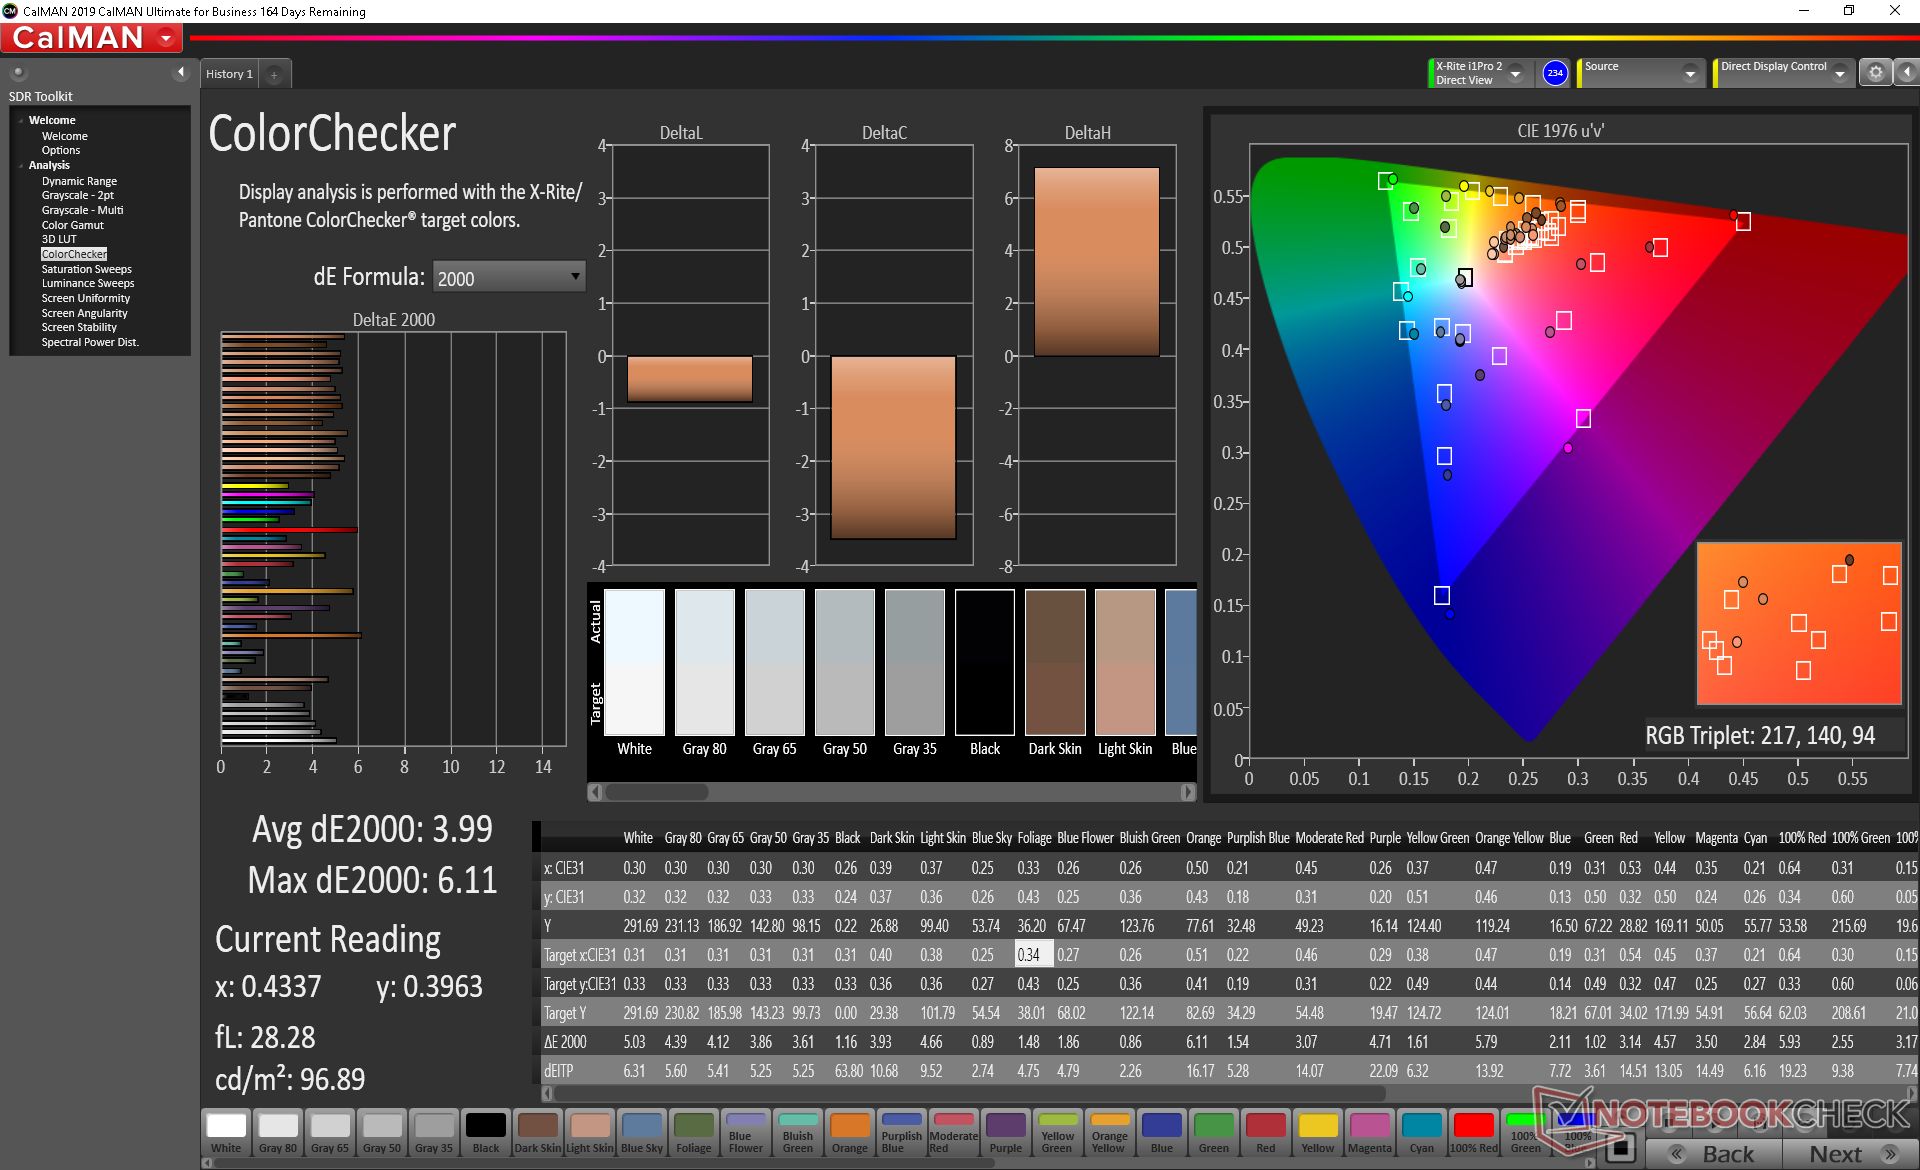
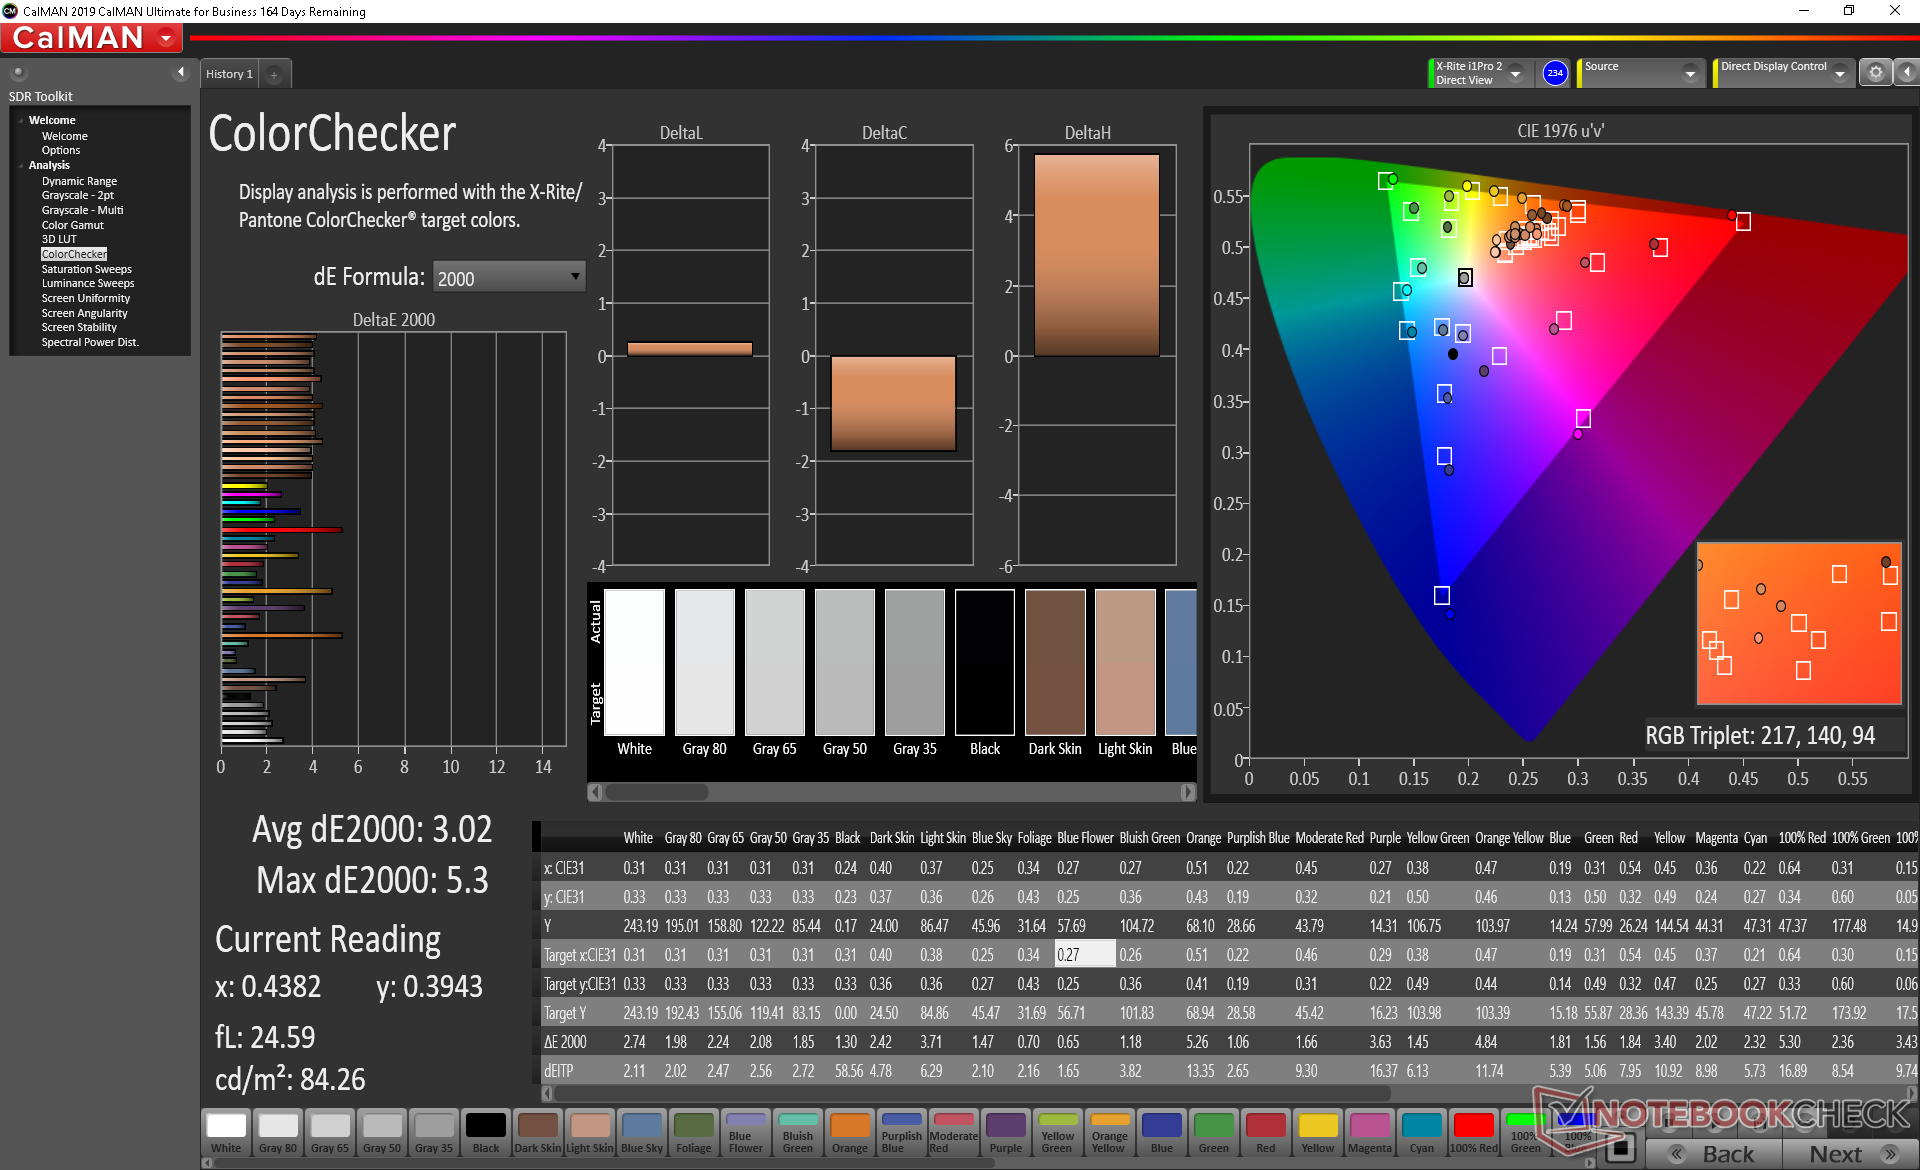
ΔE Color 3.99 | 0.5-29.43 Ø5, calibrated: 3.02
ΔE Greyscale 3.3 | 0.57-98 Ø5.3
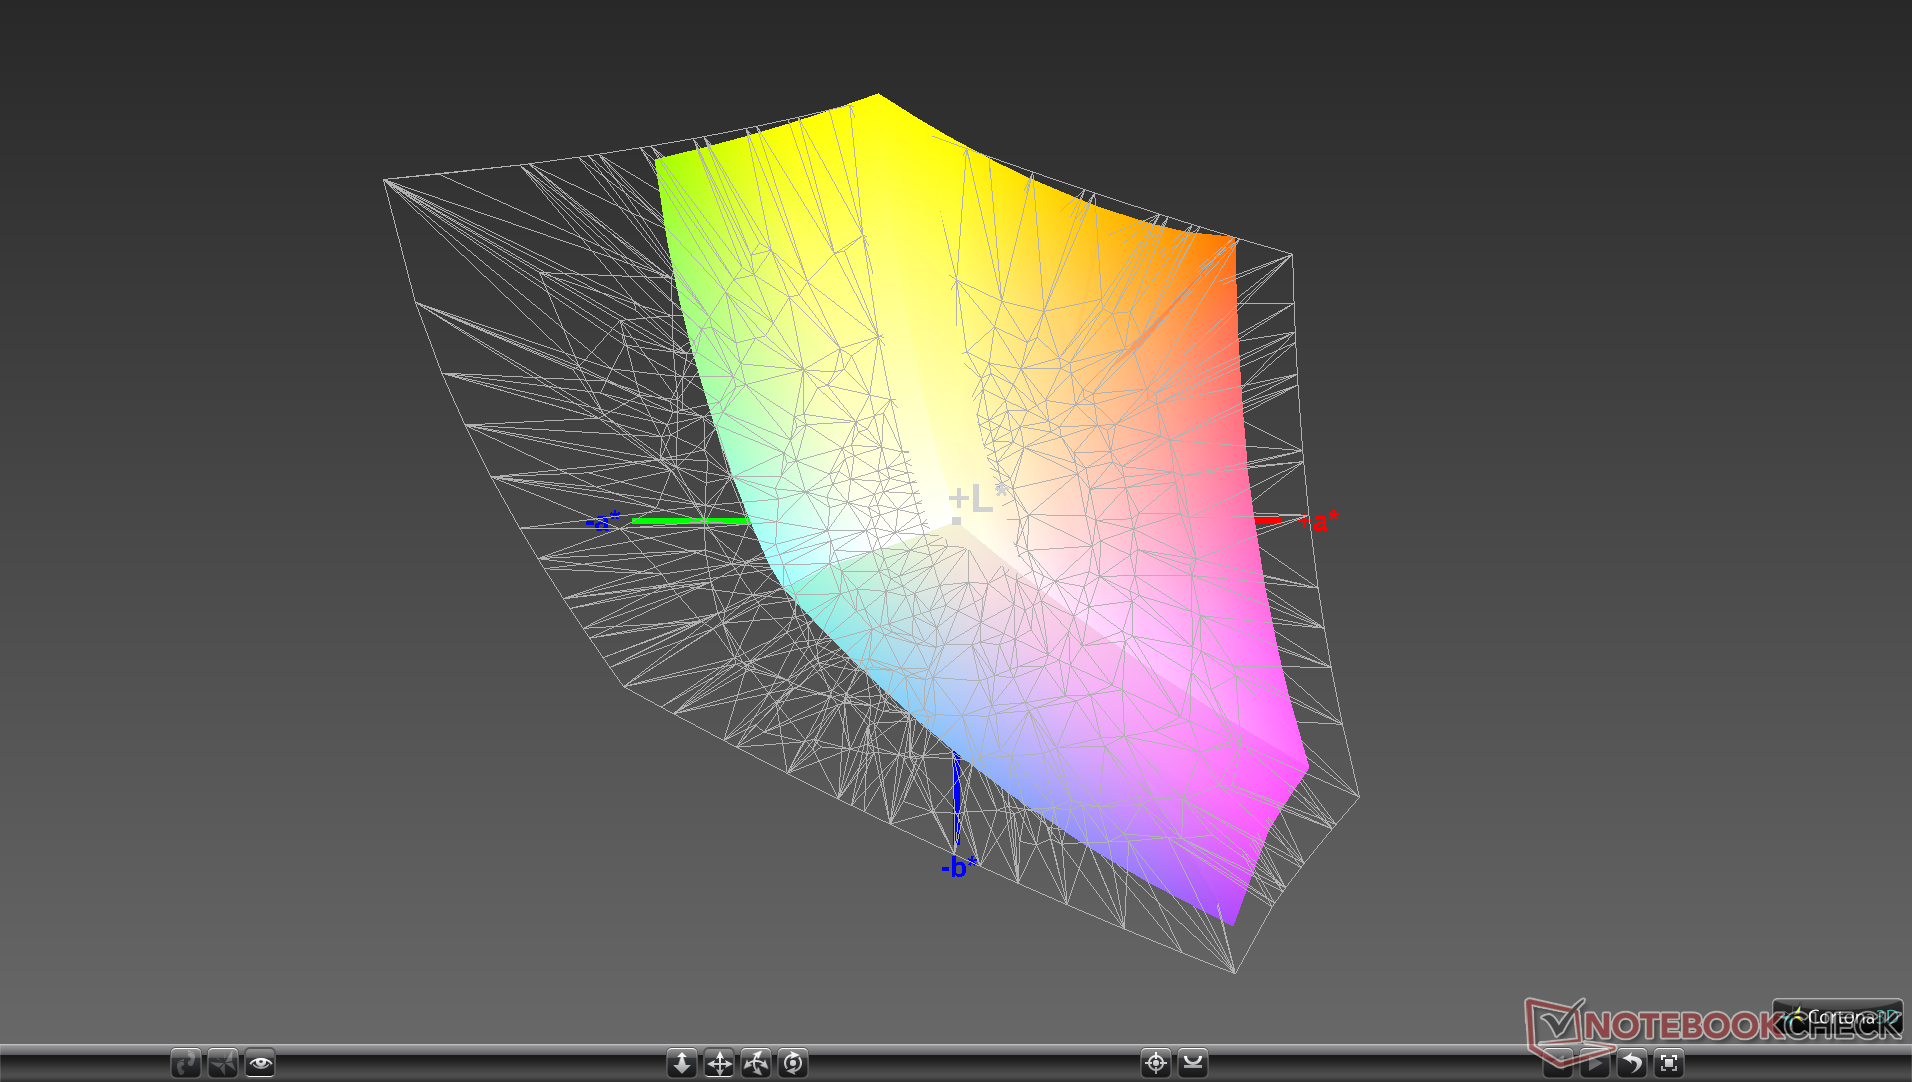
89.7% sRGB (Argyll 1.6.3 3D)
58.1% AdobeRGB 1998 (Argyll 1.6.3 3D)
64.1% AdobeRGB 1998 (Argyll 2.2.0 3D)
90.1% sRGB (Argyll 2.2.0 3D)
63% Display P3 (Argyll 2.2.0 3D)
Gamma: 2.25
| Dell G5 15 SE 5505 P89F BOE NV156FH, WVA, 15.60, 1920x1080 | Asus TUF Gaming A15 FA506IV-HN172 LM156LF-2F01, IPS, 15.60, 1920x1080 | Dell G5 15 5590-P8RVW AU Optronics B156HAN (AUO80ED), IPS, 15.60, 1920x1080 | Lenovo Legion Y740-15ICHg BOE NV156FHM-N4J, IPS, 15.60, 1920x1080 | HP Omen 15-dc1020ng LGD05CE, IPS, 15.60, 1920x1080 | MSI Alpha 15 A3DDK-034 AU Optronics B156HAN08.0 (AUO80ED), IPS, 15.60, 1920x1080 | |
|---|---|---|---|---|---|---|
| Display | -37% | 3% | 5% | -38% | 3% | |
| Display P3 Coverage | 63 | 38.92 -38% | 65.7 4% | 67.7 7% | 38.37 -39% | 66.4 5% |
| sRGB Coverage | 90.1 | 58.5 -35% | 91.2 1% | 91.6 2% | 57.6 -36% | 91 1% |
| AdobeRGB 1998 Coverage | 64.1 | 40.22 -37% | 66.7 4% | 67.1 5% | 39.69 -38% | 66.6 4% |
| Response Times | -95% | 1% | 7% | -135% | 35% | |
| Response Time Grey 50% / Grey 80% * | 20.4 ? | 34 ? -67% | 16.4 ? 20% | 19 ? 7% | 40 ? -96% | 7 ? 66% |
| Response Time Black / White * | 10.8 ? | 24 ? -122% | 12.8 ? -19% | 10 ? 7% | 29.6 ? -174% | 10.4 ? 4% |
| PWM Frequency | 198.4 ? | |||||
| Screen | -27% | 4% | 28% | -34% | -5% | |
| Brightness middle | 292 | 280 -4% | 291 0% | 477 63% | 251 -14% | 310 6% |
| Brightness | 290 | 254 -12% | 295 2% | 431 49% | 232 -20% | 310 7% |
| Brightness Distribution | 77 | 88 14% | 83 8% | 84 9% | 76 -1% | 86 12% |
| Black Level * | 0.27 | 0.15 44% | 0.22 19% | 0.175 35% | 0.17 37% | 0.29 -7% |
| Contrast | 1081 | 1867 73% | 1323 22% | 2726 152% | 1476 37% | 1069 -1% |
| Colorchecker dE 2000 * | 3.99 | 5.89 -48% | 3.95 1% | 4.17 -5% | 6.2 -55% | 4.78 -20% |
| Colorchecker dE 2000 max. * | 6.11 | 19 -211% | 7.46 -22% | 6.97 -14% | 18.6 -204% | 8.1 -33% |
| Colorchecker dE 2000 calibrated * | 3.02 | 4.79 -59% | 2.05 32% | 2.51 17% | 4.8 -59% | 2.36 22% |
| Greyscale dE 2000 * | 3.3 | 4.08 -24% | 3.82 -16% | 3.49 -6% | 4.2 -27% | 4.78 -45% |
| Gamma | 2.25 98% | 2.33 94% | 2.49 88% | 2.5 88% | 2.32 95% | 2.43 91% |
| CCT | 7047 92% | 7303 89% | 7317 89% | 7076 92% | 7454 87% | 7739 84% |
| Color Space (Percent of AdobeRGB 1998) | 58.1 | 37 -36% | 59 2% | 60 3% | 36.5 -37% | 59 2% |
| Color Space (Percent of sRGB) | 89.7 | 58 -35% | 91 1% | 91 1% | 57.4 -36% | 91 1% |
| Total Average (Program / Settings) | -53% /
-37% | 3% /
4% | 13% /
21% | -69% /
-48% | 11% /
2% |
* ... smaller is better
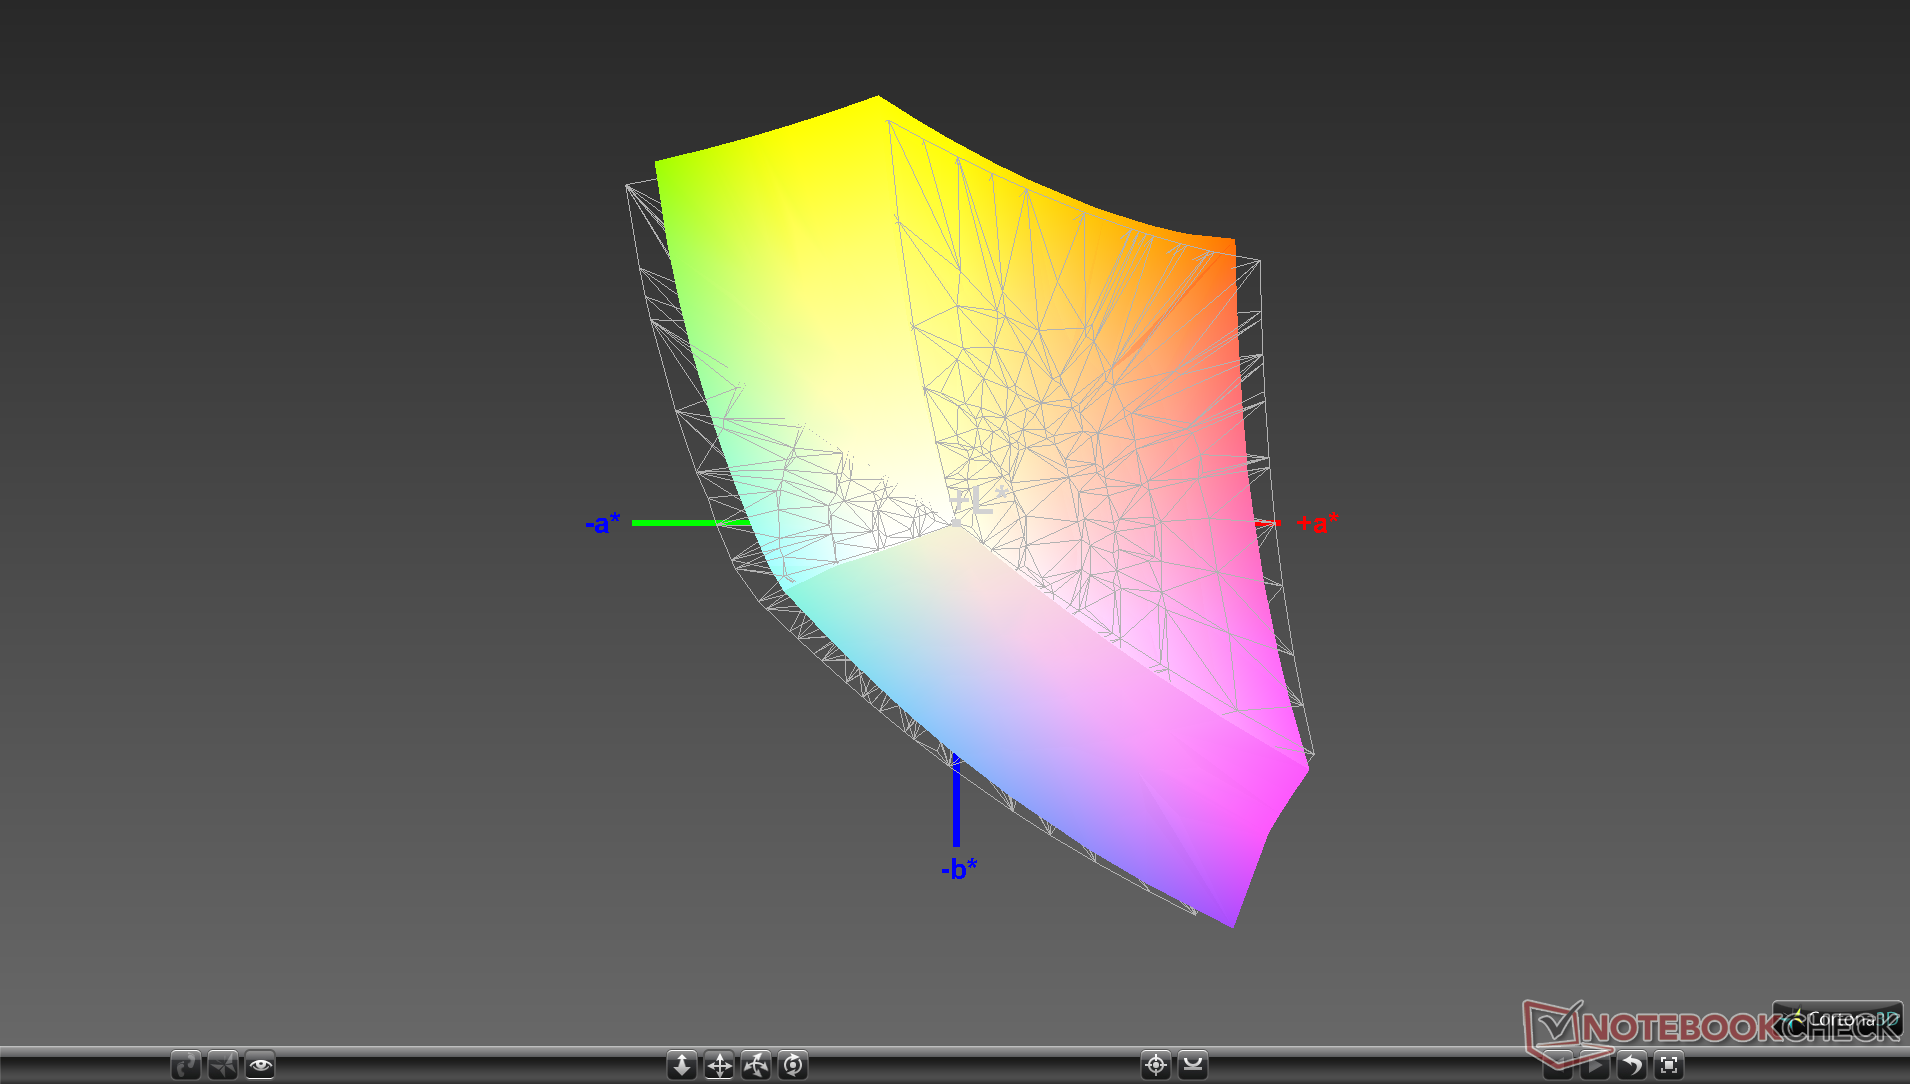
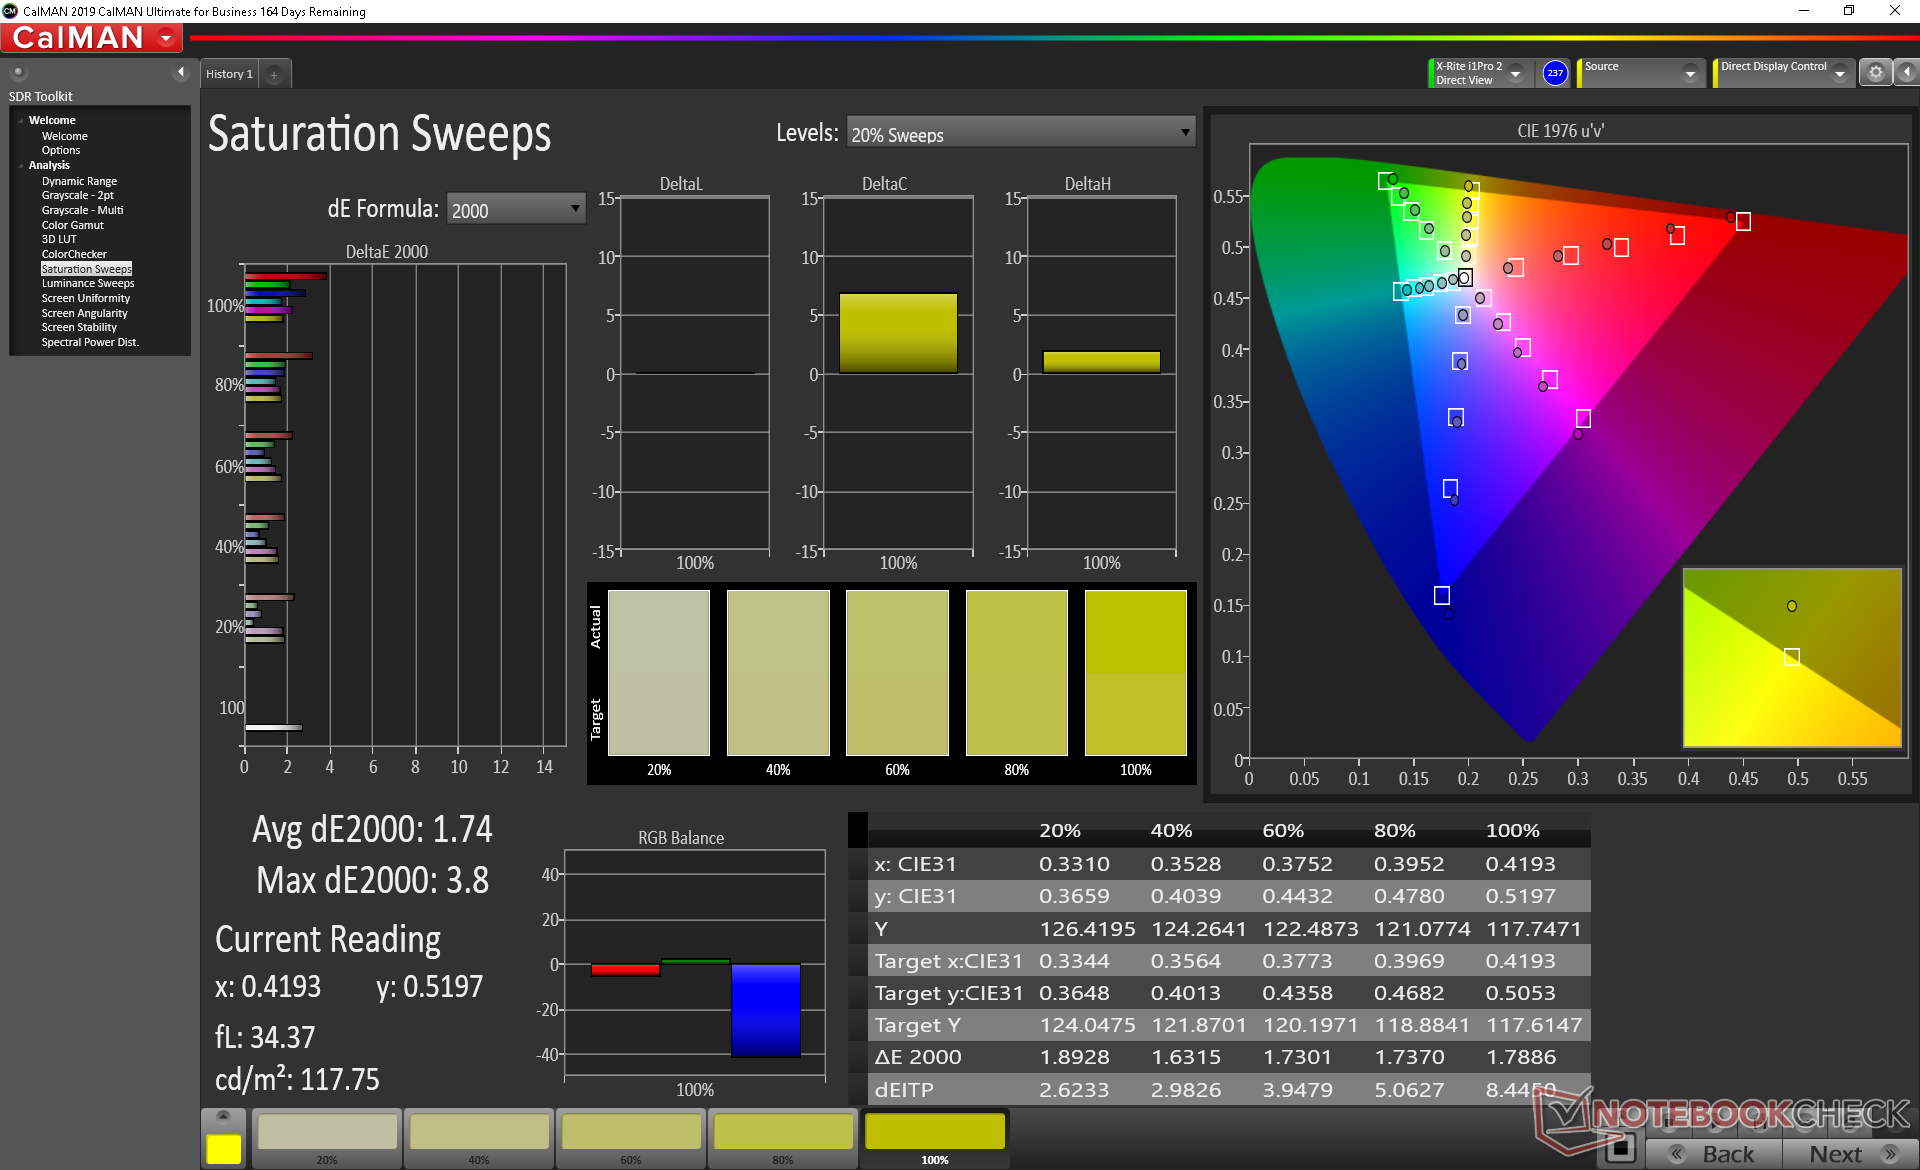
Color space is typical of a mid-range to high-end gaming laptop at approximately 90 percent and 58 percent of the sRGB and AdobeRGB standards, respectively. Demanding an even wider gamut will usually result in sacrificing refresh rate or response times which are arguably more important when gaming.
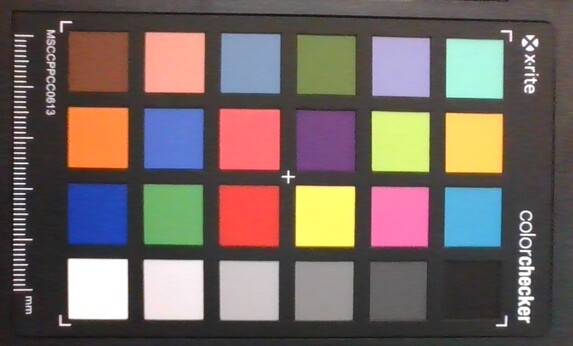
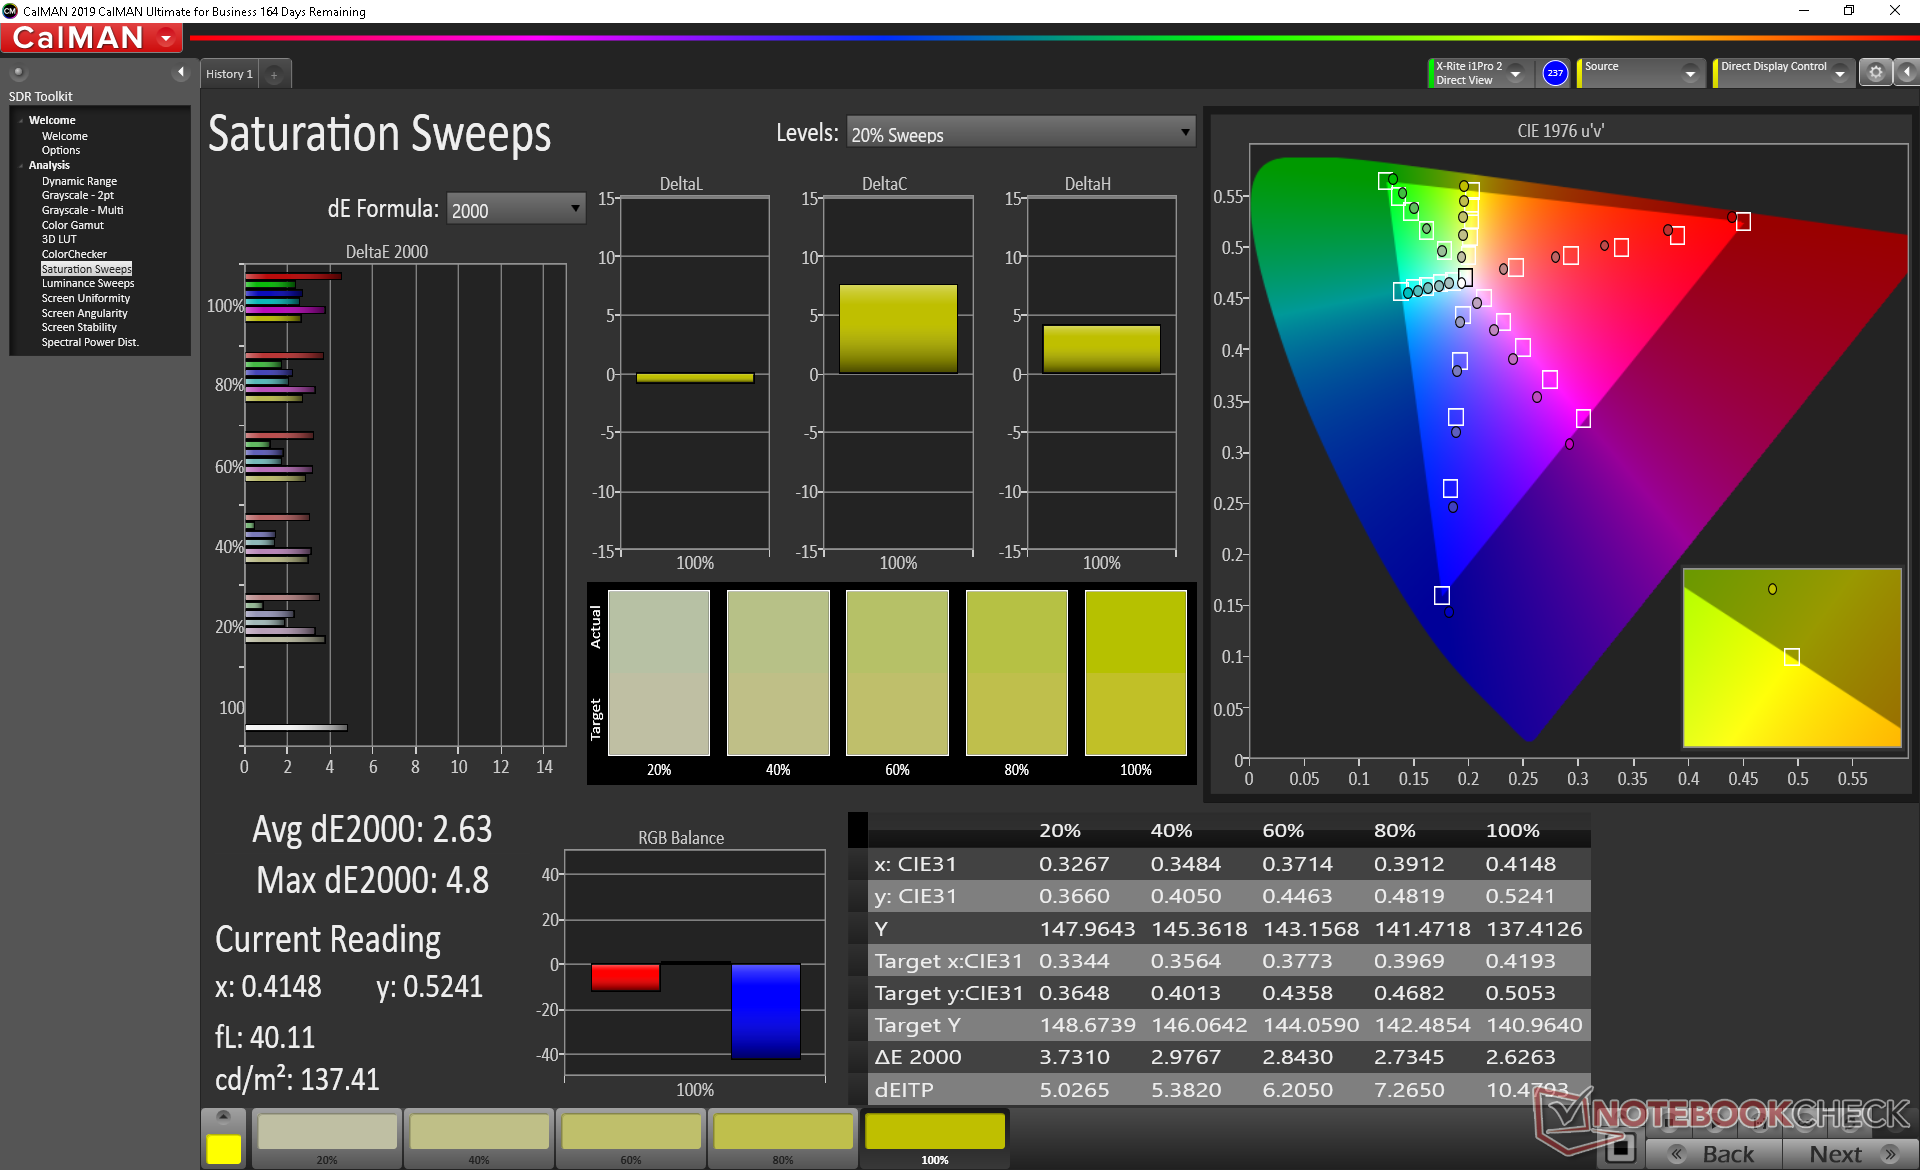
X-Rite colorimeter measurements show a decently calibrated display out of the box. Color temperature is slightly too cool, but our calibration addresses this without any issues.
Display Response Times
| ↔ Response Time Black to White | ||
|---|---|---|
| 10.8 ms ... rise ↗ and fall ↘ combined | ↗ 6.4 ms rise | 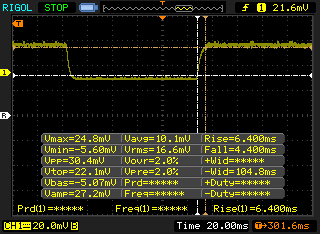 |
| ↘ 4.4 ms fall | ||
| The screen shows good response rates in our tests, but may be too slow for competitive gamers. In comparison, all tested devices range from 0.1 (minimum) to 240 (maximum) ms. » 24 % of all devices are better. This means that the measured response time is better than the average of all tested devices (21.5 ms). | ||
| ↔ Response Time 50% Grey to 80% Grey | ||
| 20.4 ms ... rise ↗ and fall ↘ combined | ↗ 10.8 ms rise | 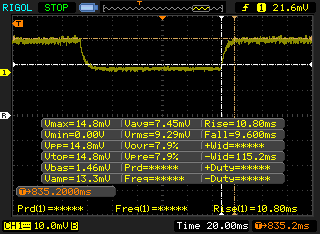 |
| ↘ 9.6 ms fall | ||
| The screen shows good response rates in our tests, but may be too slow for competitive gamers. In comparison, all tested devices range from 0.2 (minimum) to 636 (maximum) ms. » 28 % of all devices are better. This means that the measured response time is better than the average of all tested devices (33.8 ms). | ||
Screen Flickering / PWM (Pulse-Width Modulation)
| Screen flickering / PWM detected | 198.4 Hz | ≤ 99 % brightness setting | 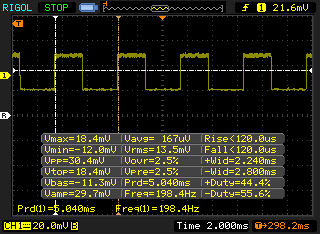 |
The display backlight flickers at 198.4 Hz (worst case, e.g., utilizing PWM) Flickering detected at a brightness setting of 99 % and below. There should be no flickering or PWM above this brightness setting. The frequency of 198.4 Hz is relatively low, so sensitive users will likely notice flickering and experience eyestrain at the stated brightness setting and below. In comparison: 53 % of all tested devices do not use PWM to dim the display. If PWM was detected, an average of 17933 (minimum: 5 - maximum: 3846000) Hz was measured. | |||
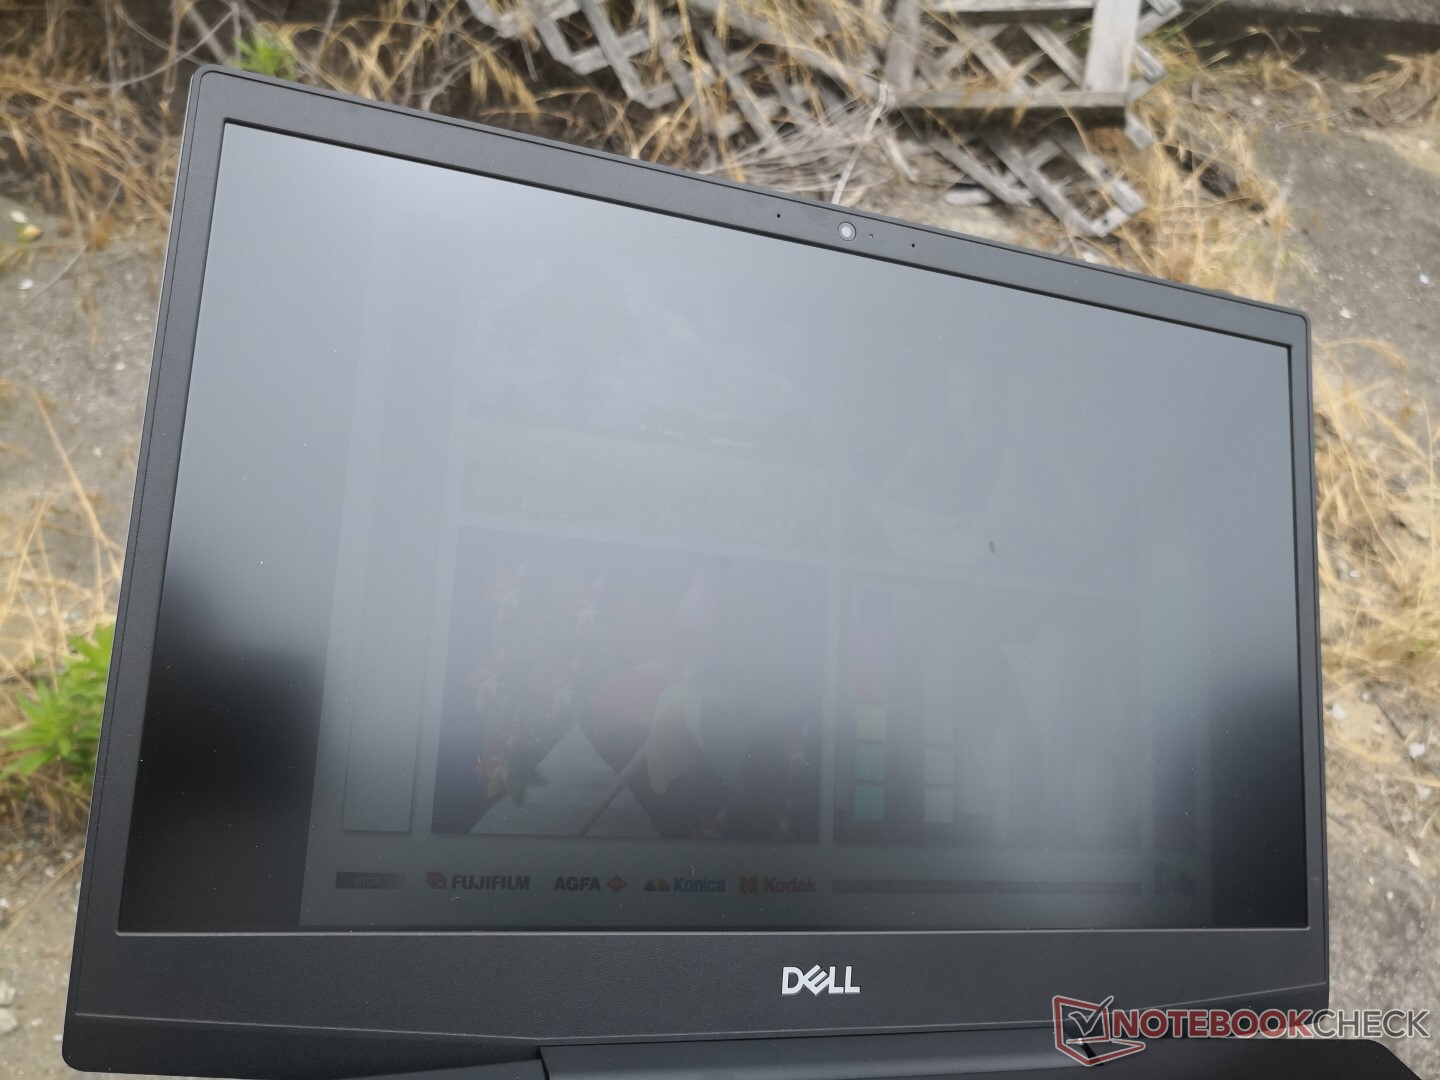
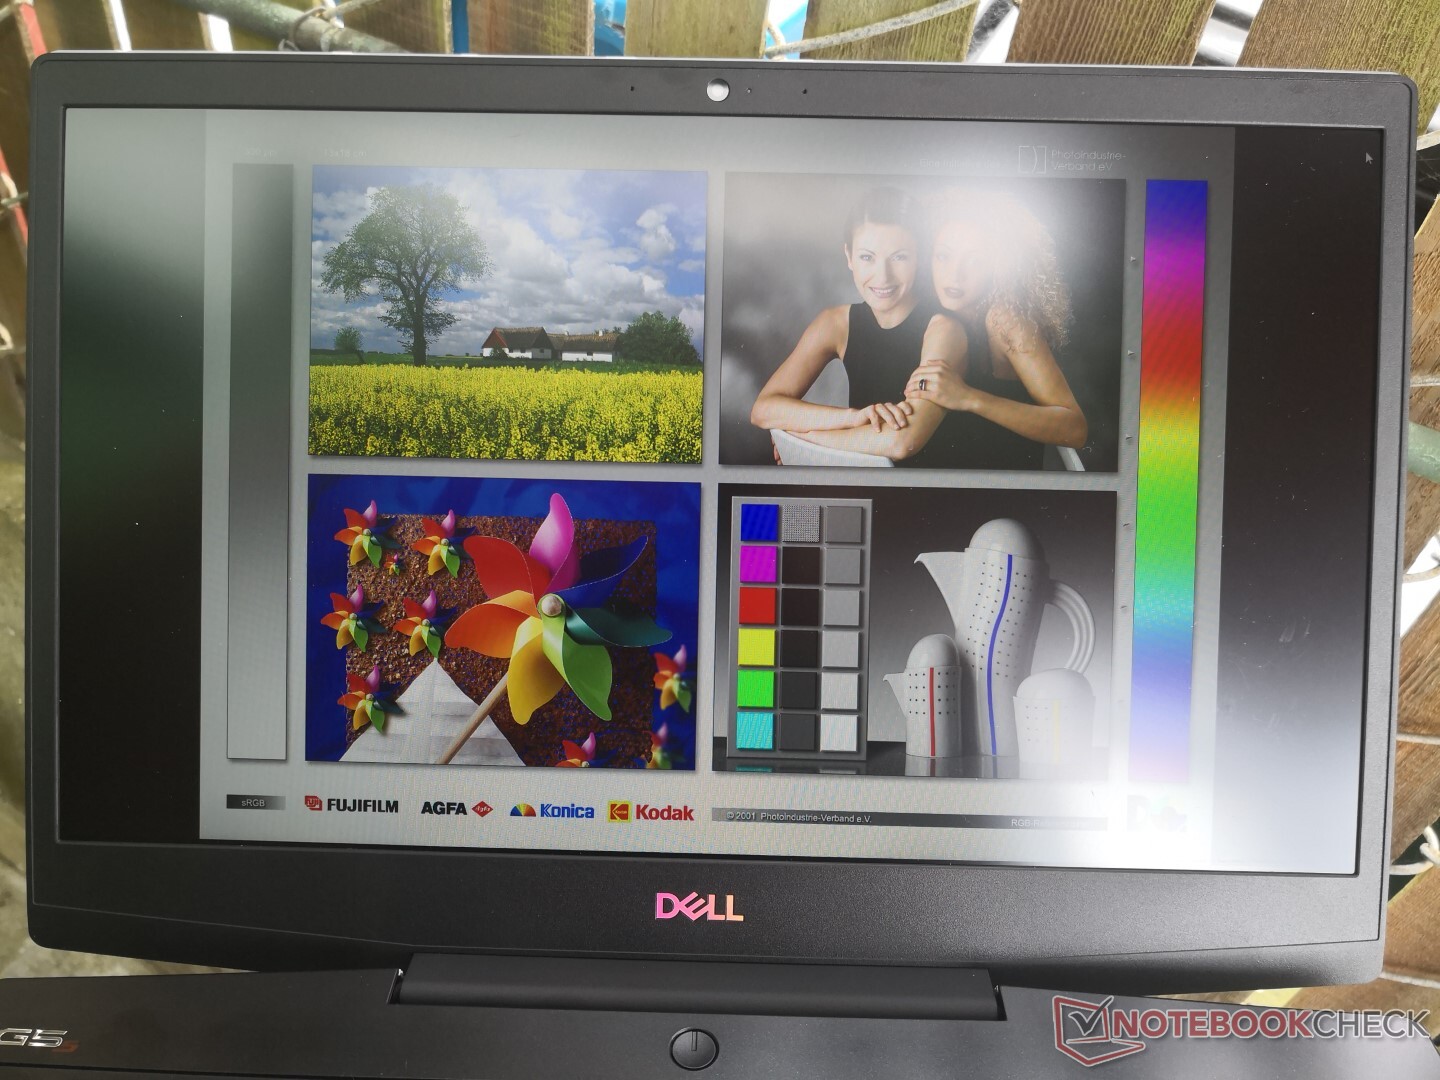
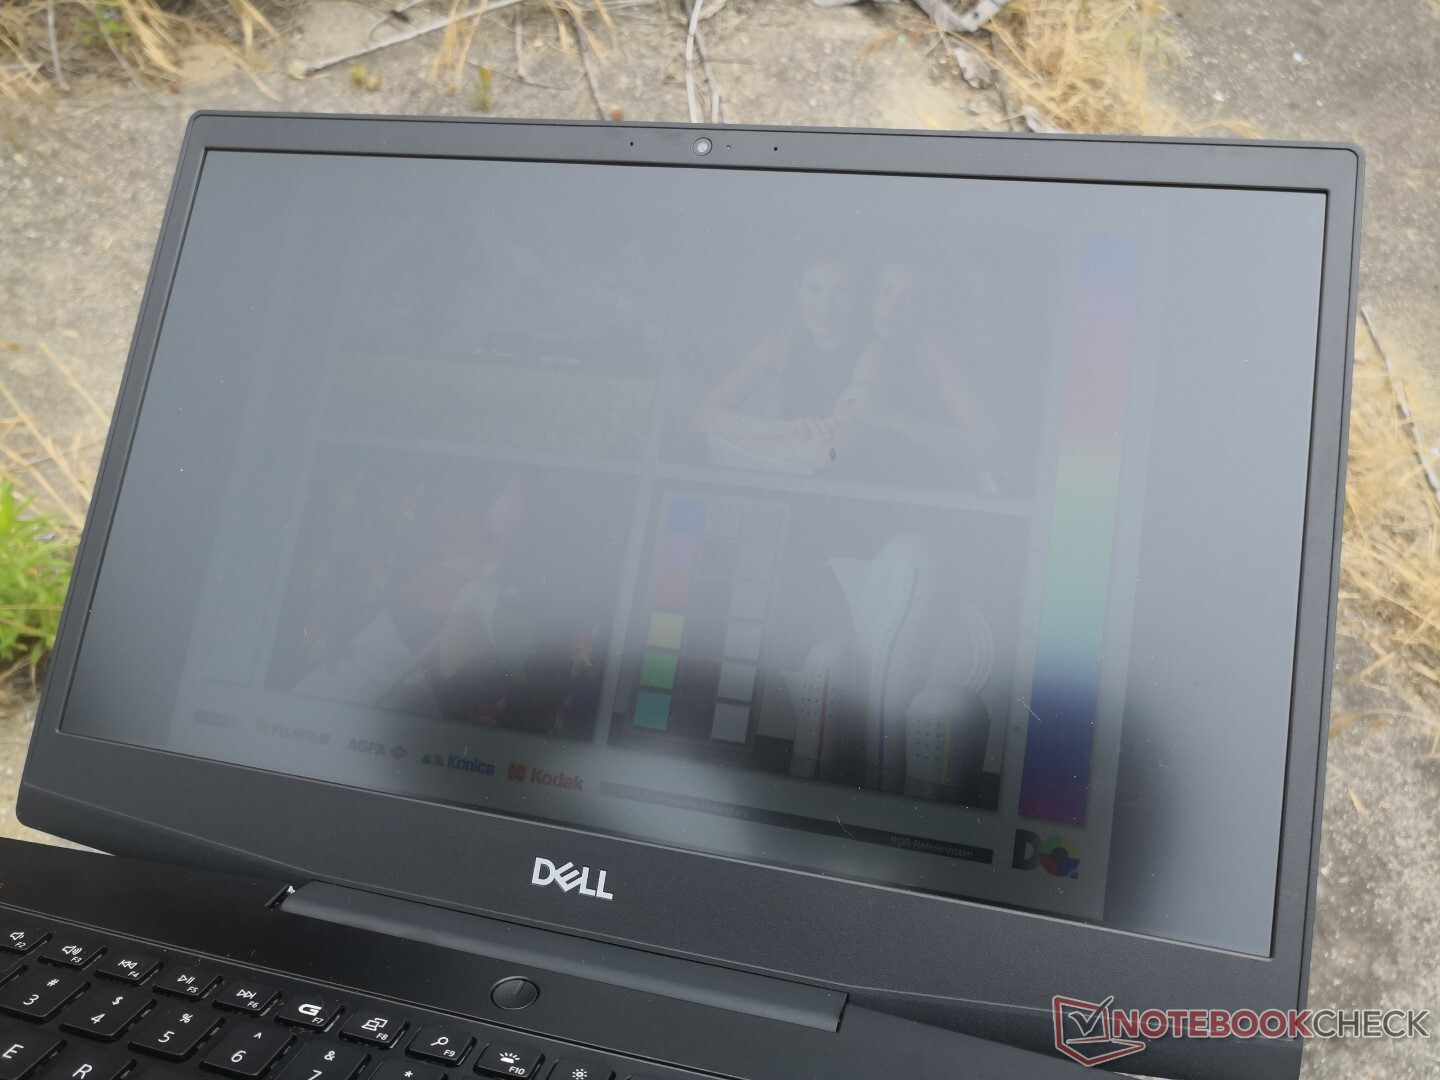
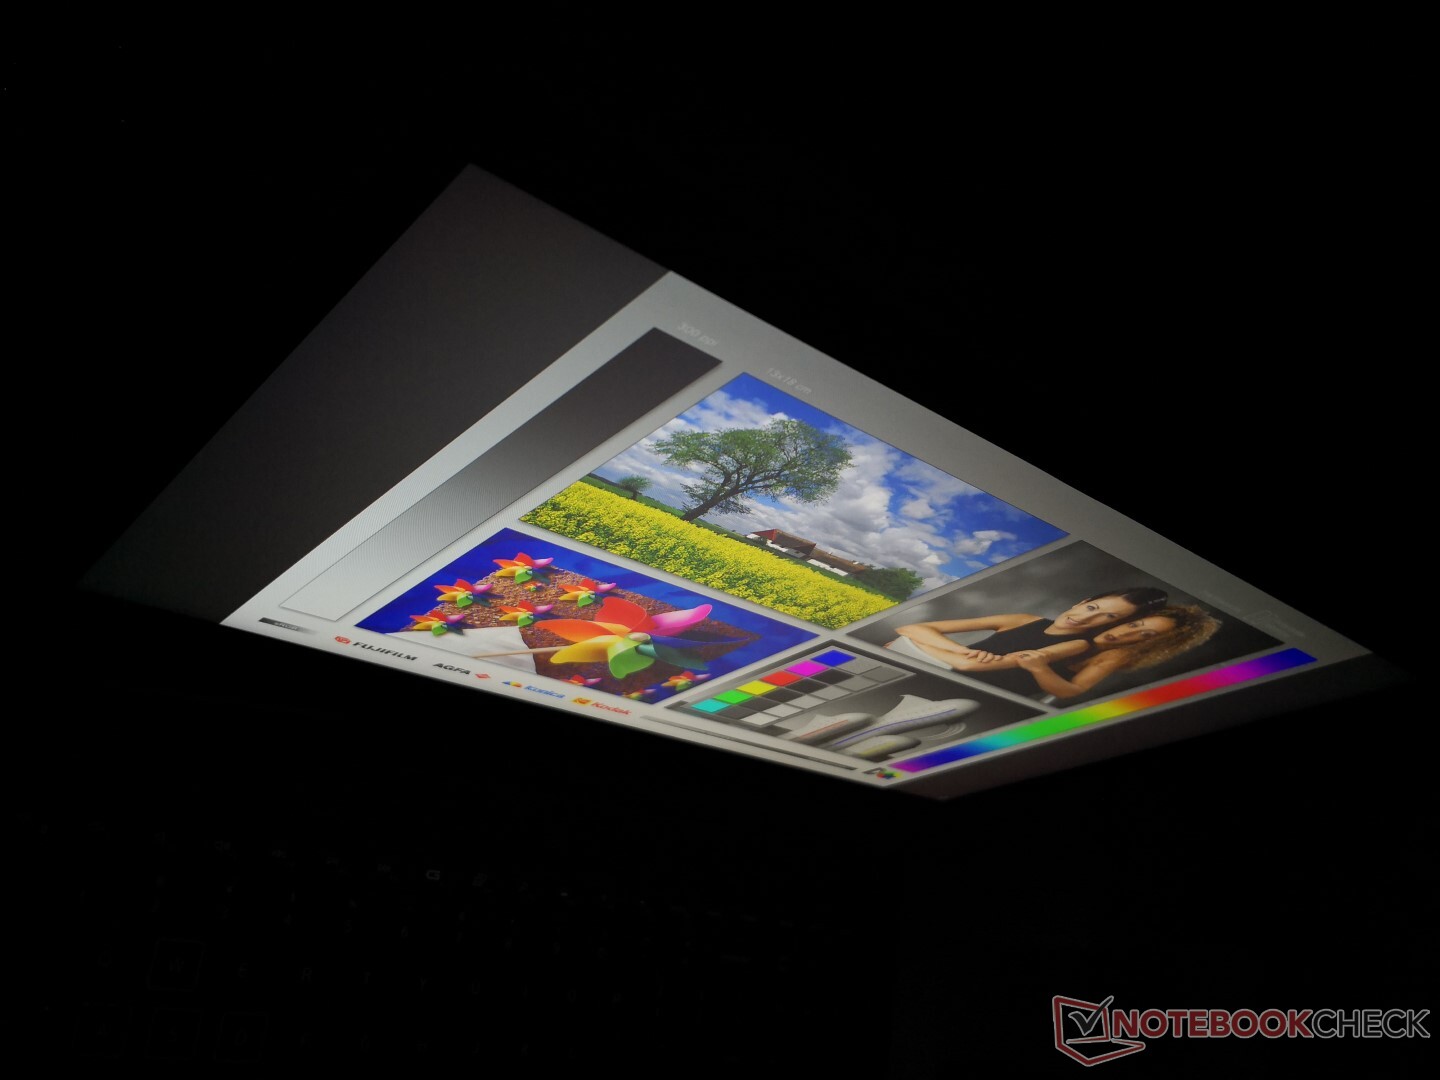
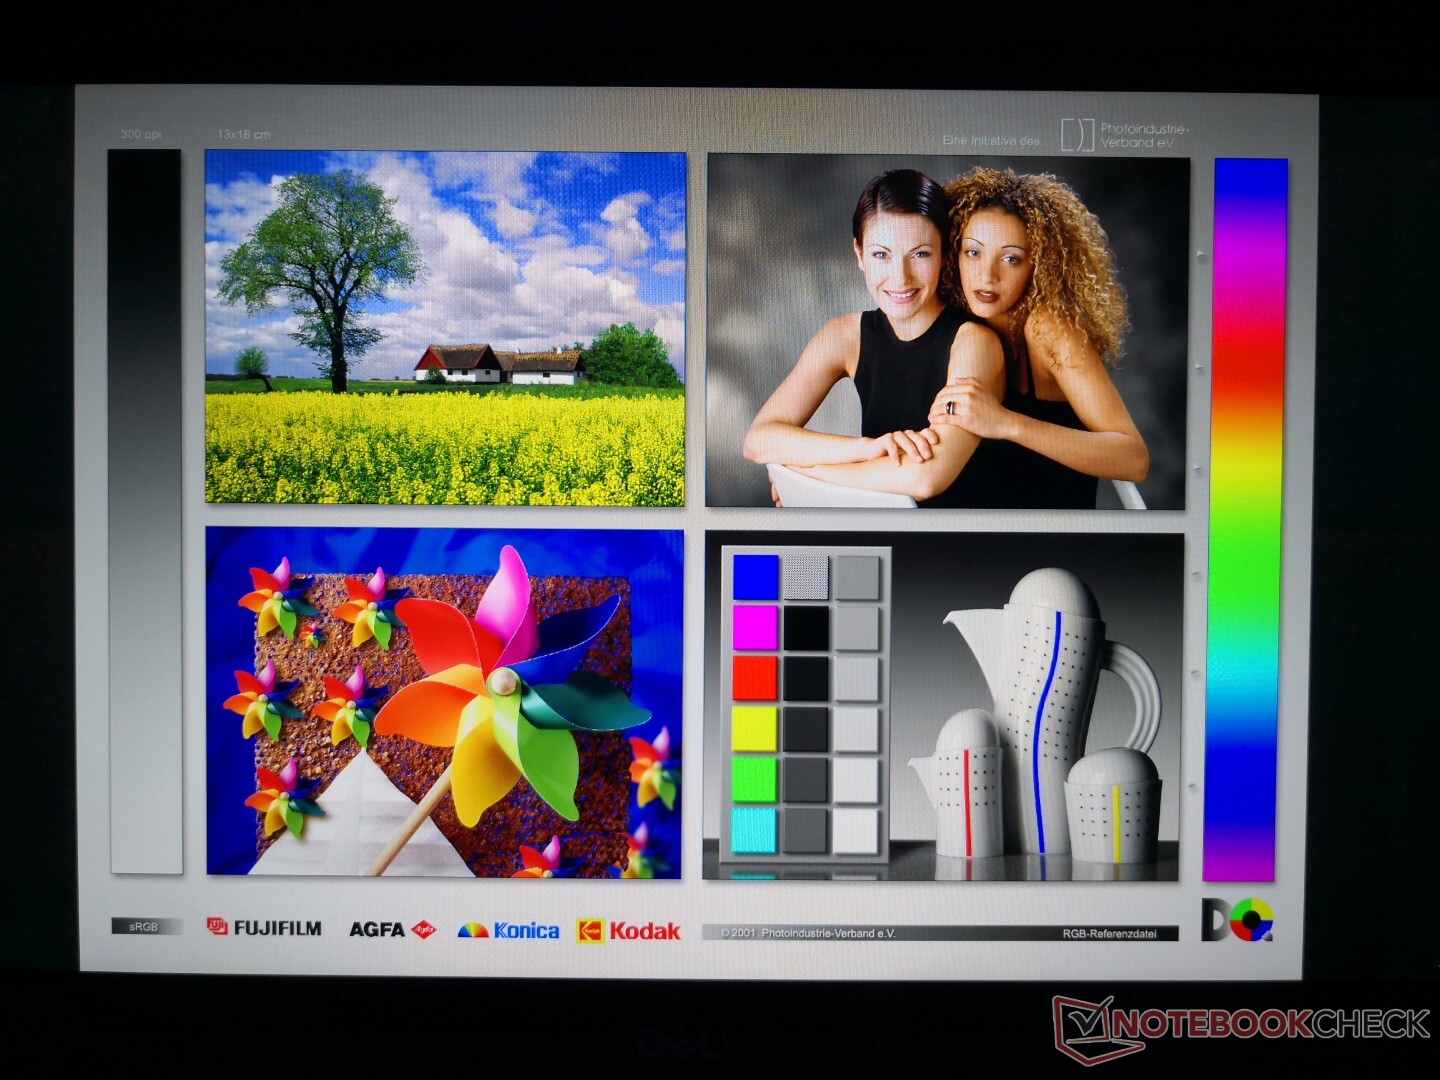
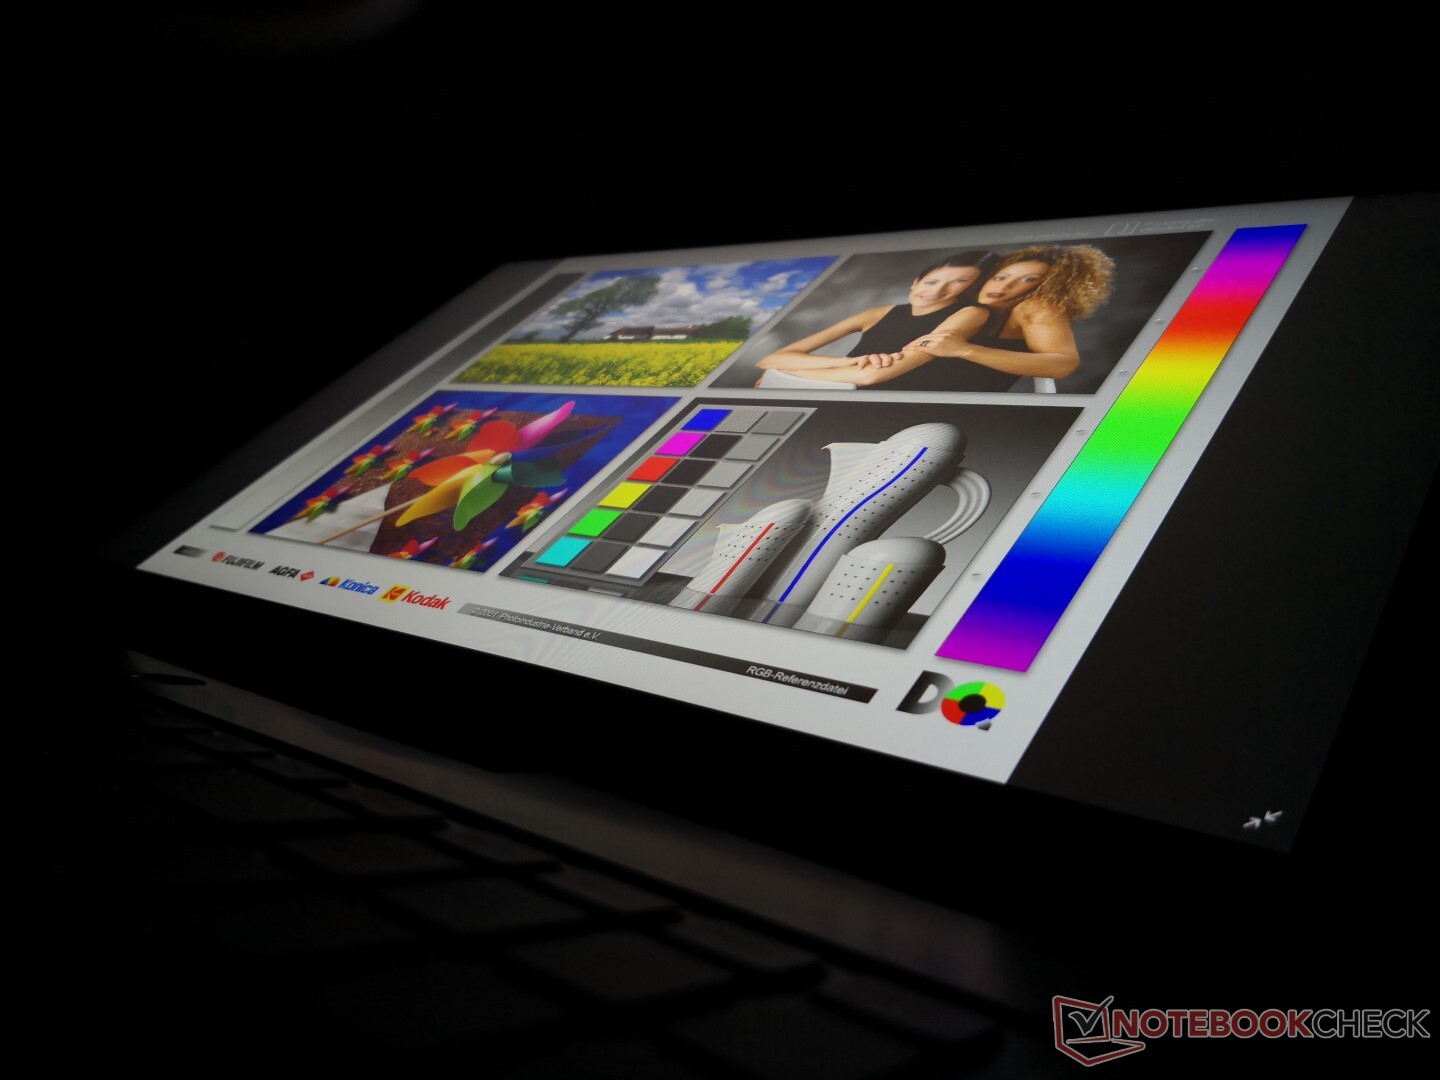
Viewing angles are similar to IPS if not the same. Colors and contrast do not degrade unless if viewing from abnormally extreme angles. Outdoor visibility is average at best as the backlight is designed mostly for indoor viewing. Remember to disable AMD Vari-Bright or else maximum brightness will drop when running on battery power.
Performance
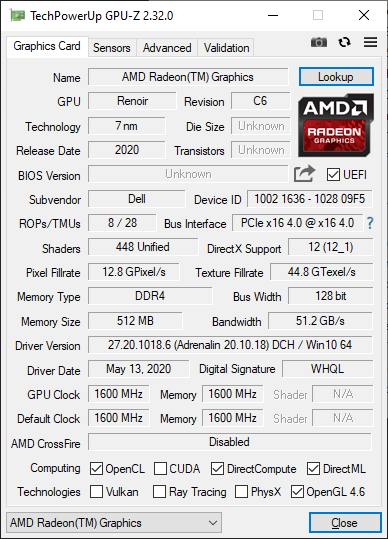
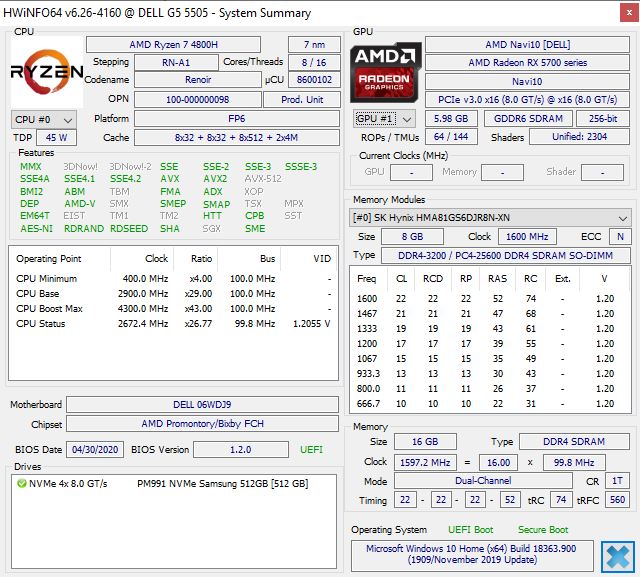
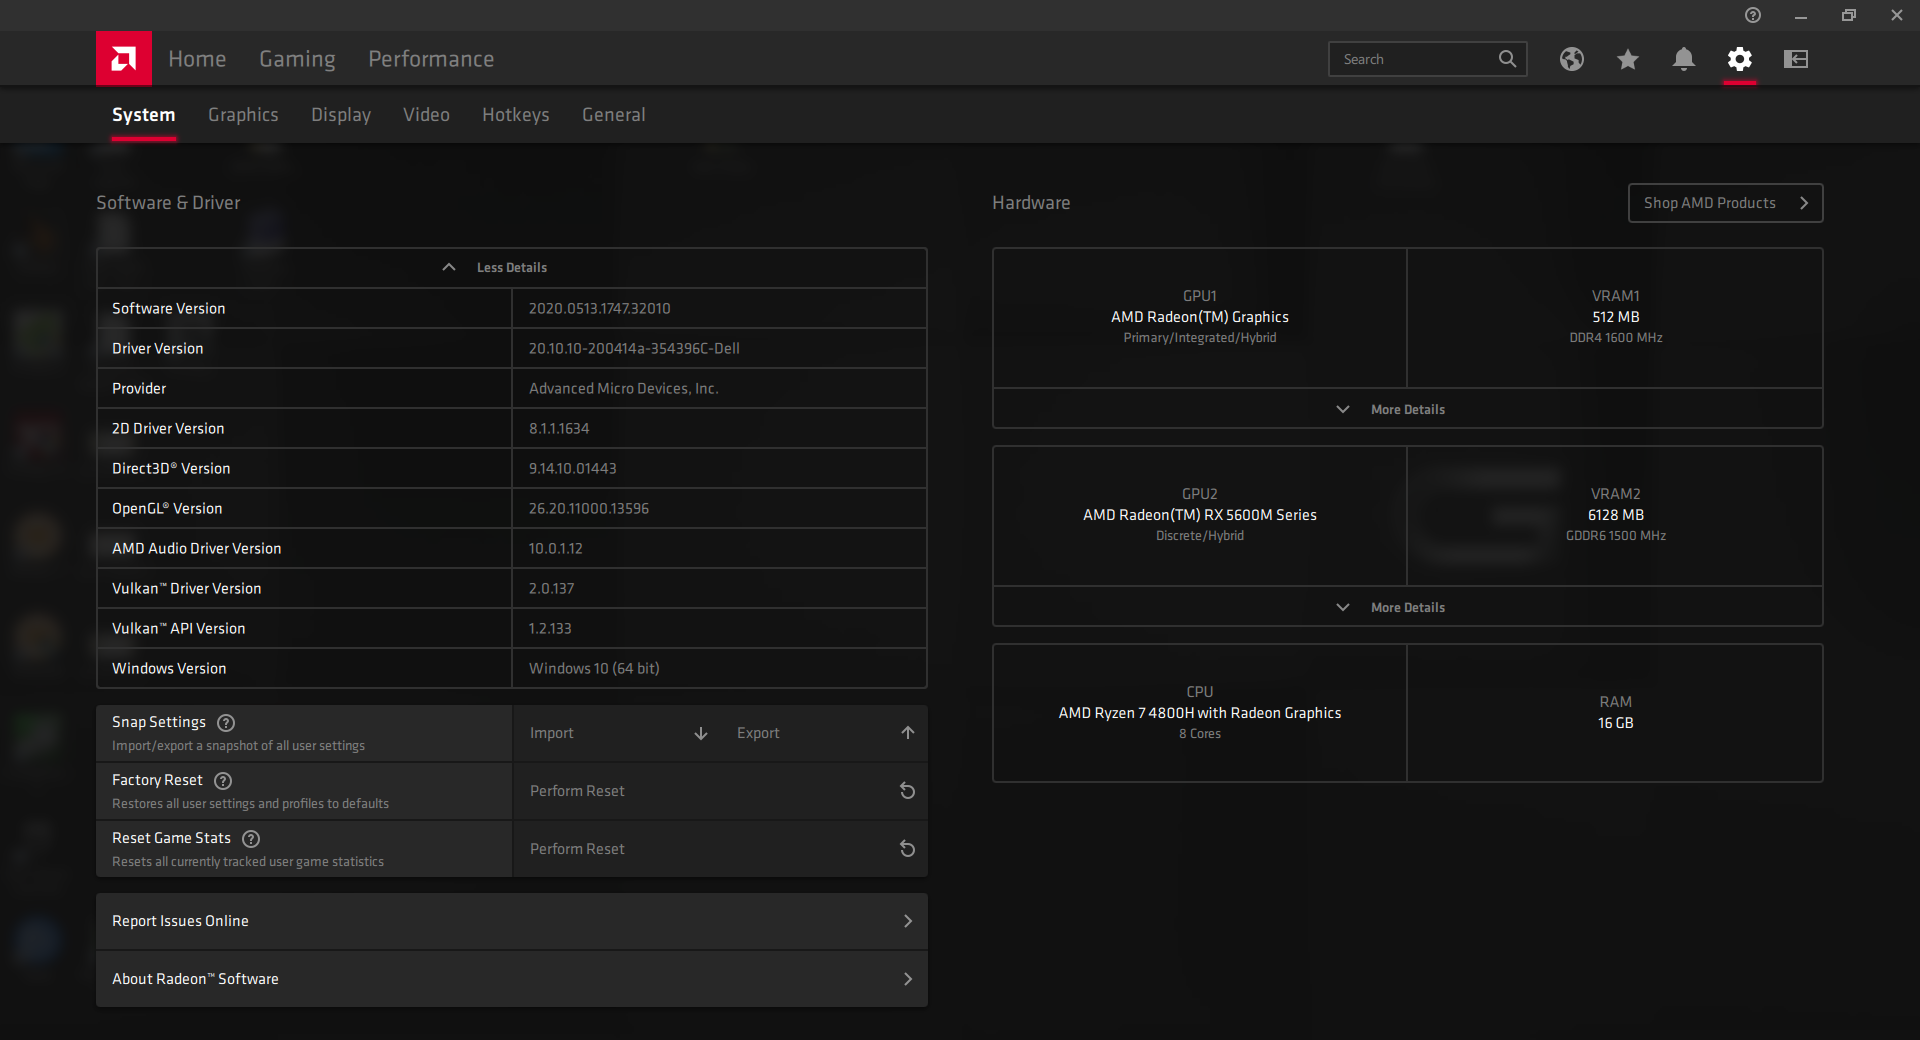
All SKUs at the moment come with either the Zen 2 hexa-core Ryzen 5 4600H or octa-core Ryzen 7 4800H. Both compete directly with the latest 10th gen Intel Core i7 CPUs and are an enormous improvement over the Zen+ quad-core Ryzen 5 3550H or Ryzen 7 3750H as found on last generation AMD gaming laptops.
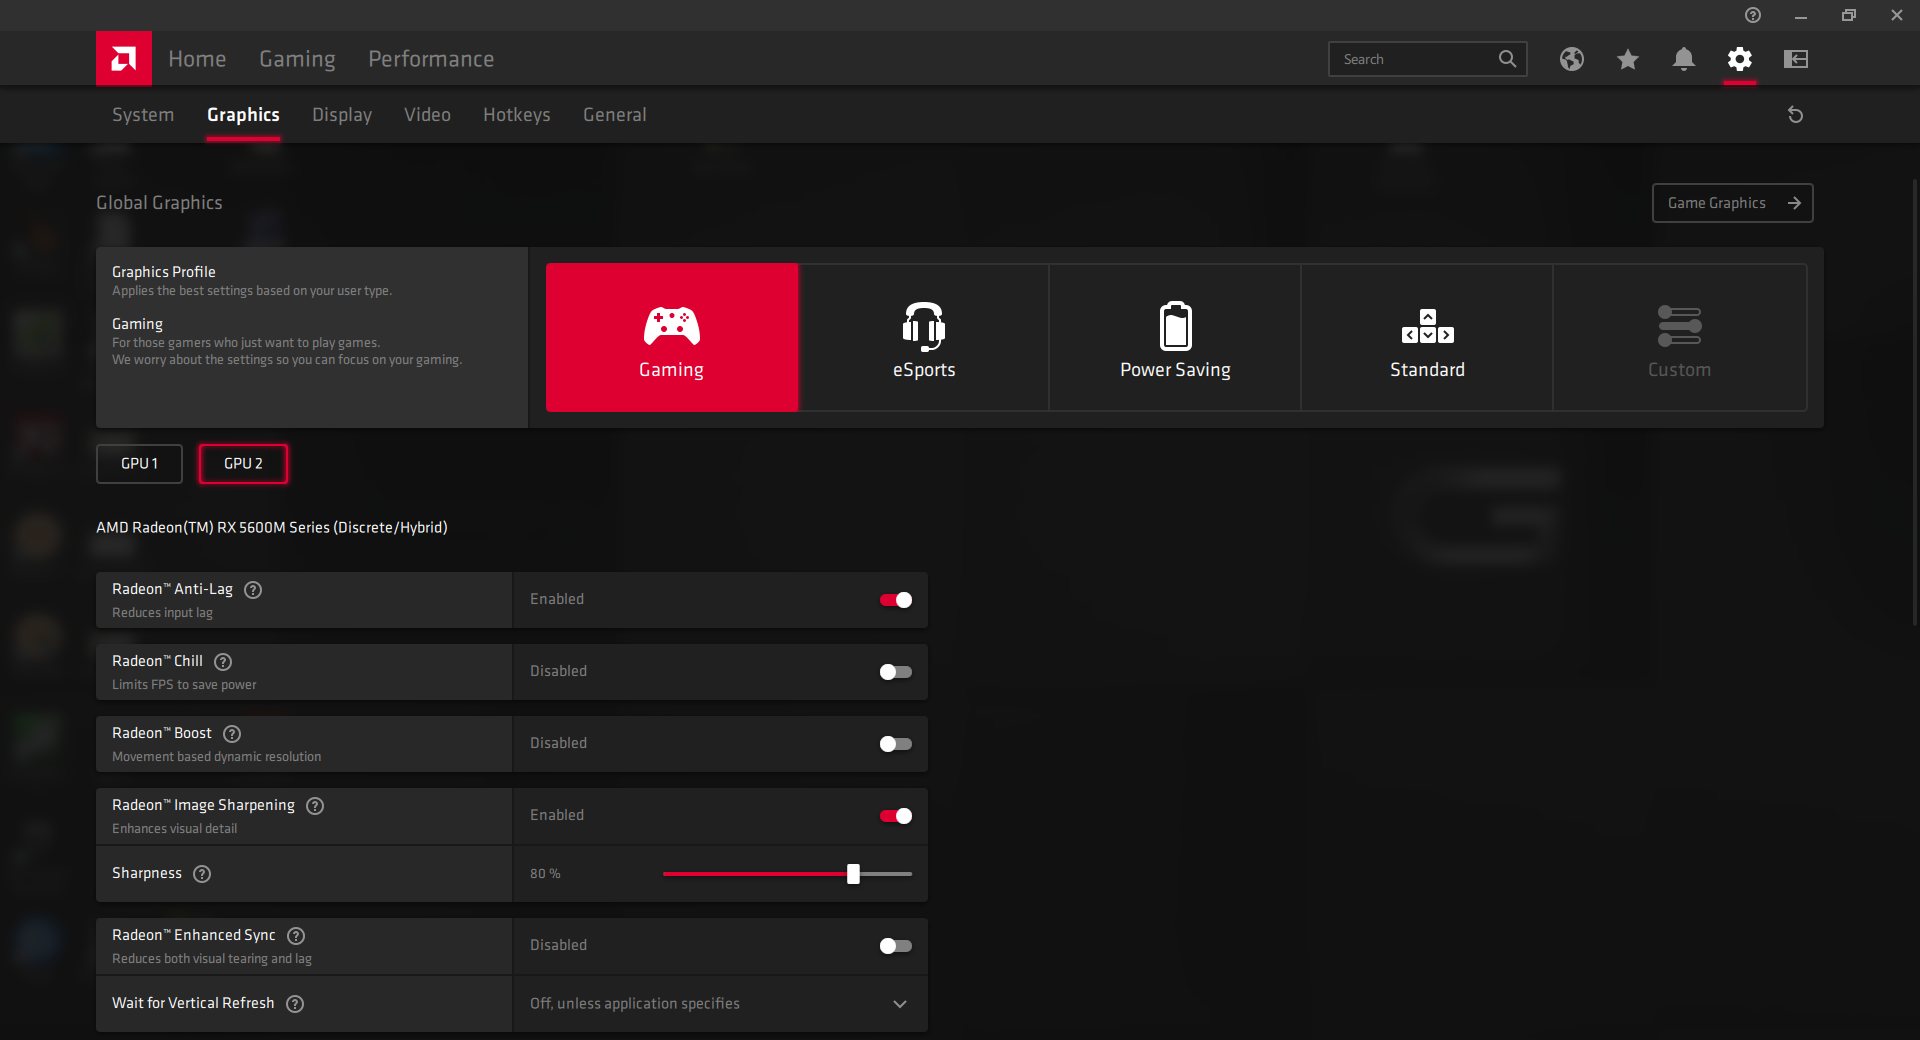
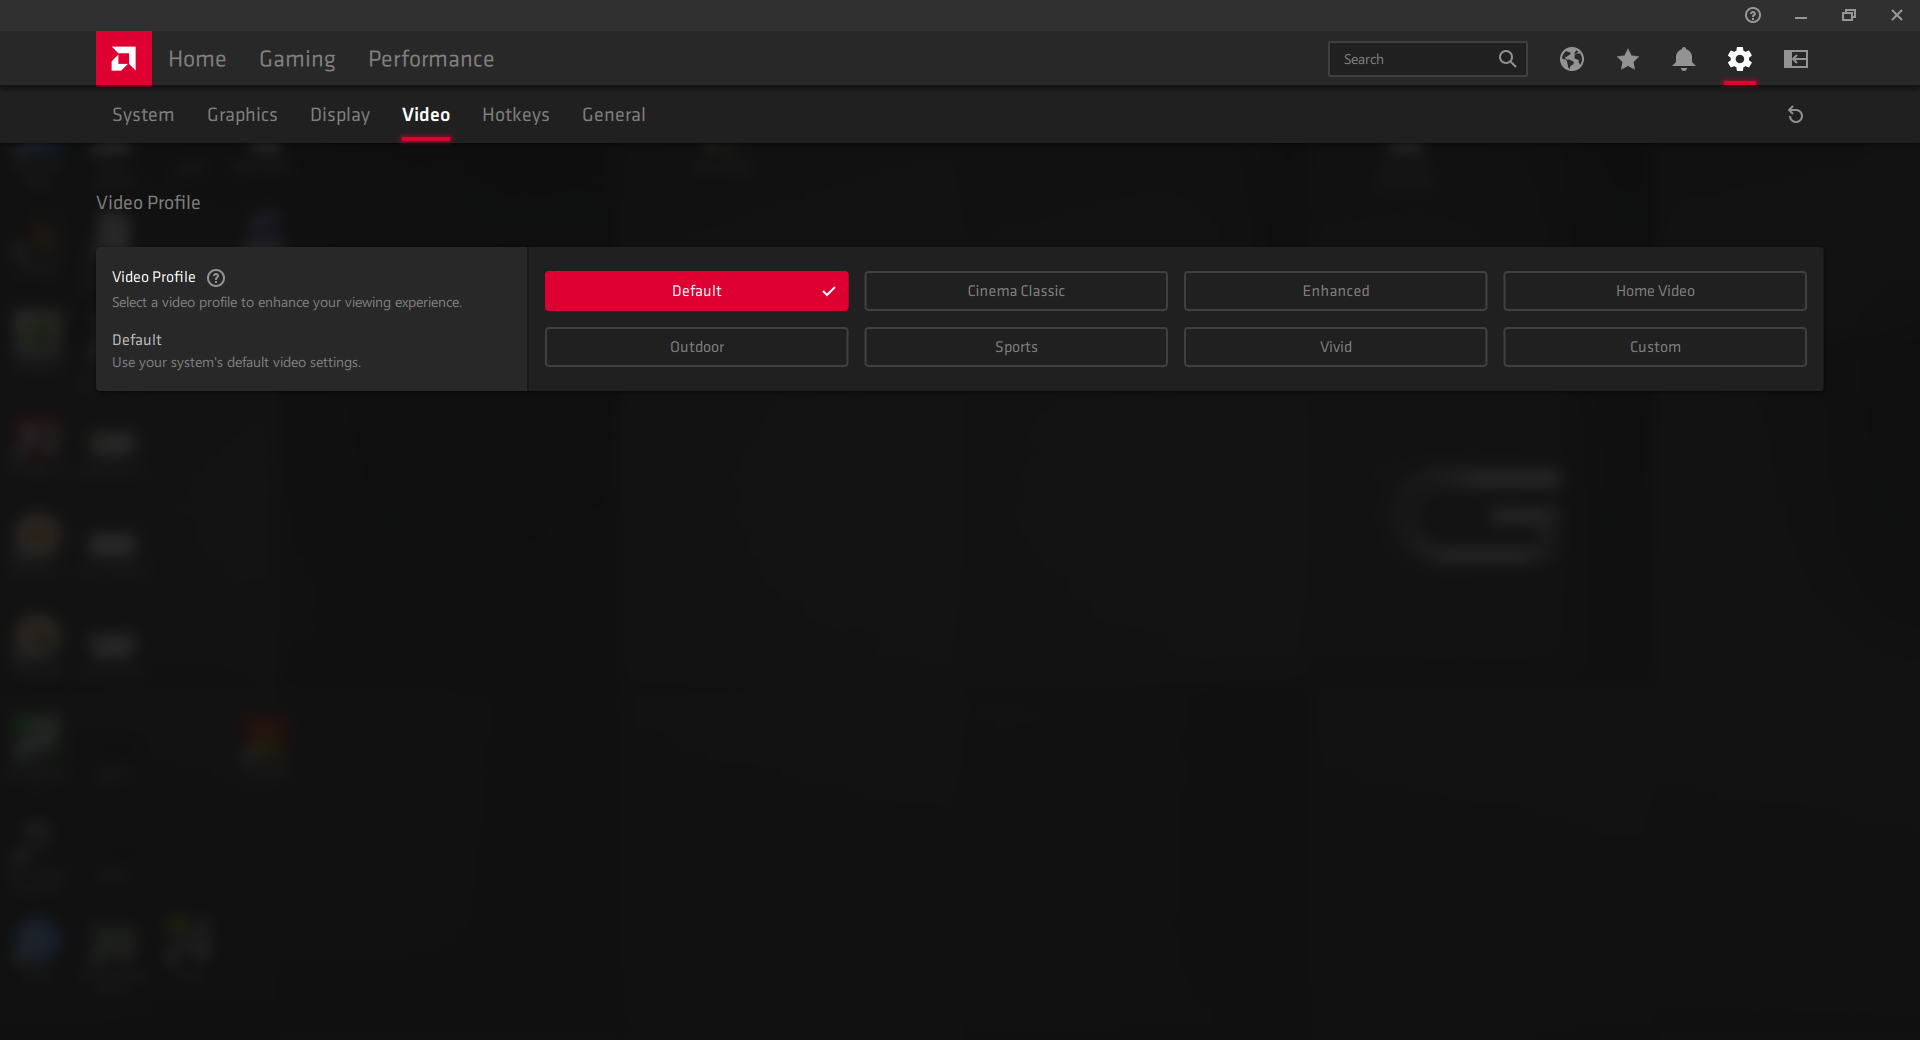
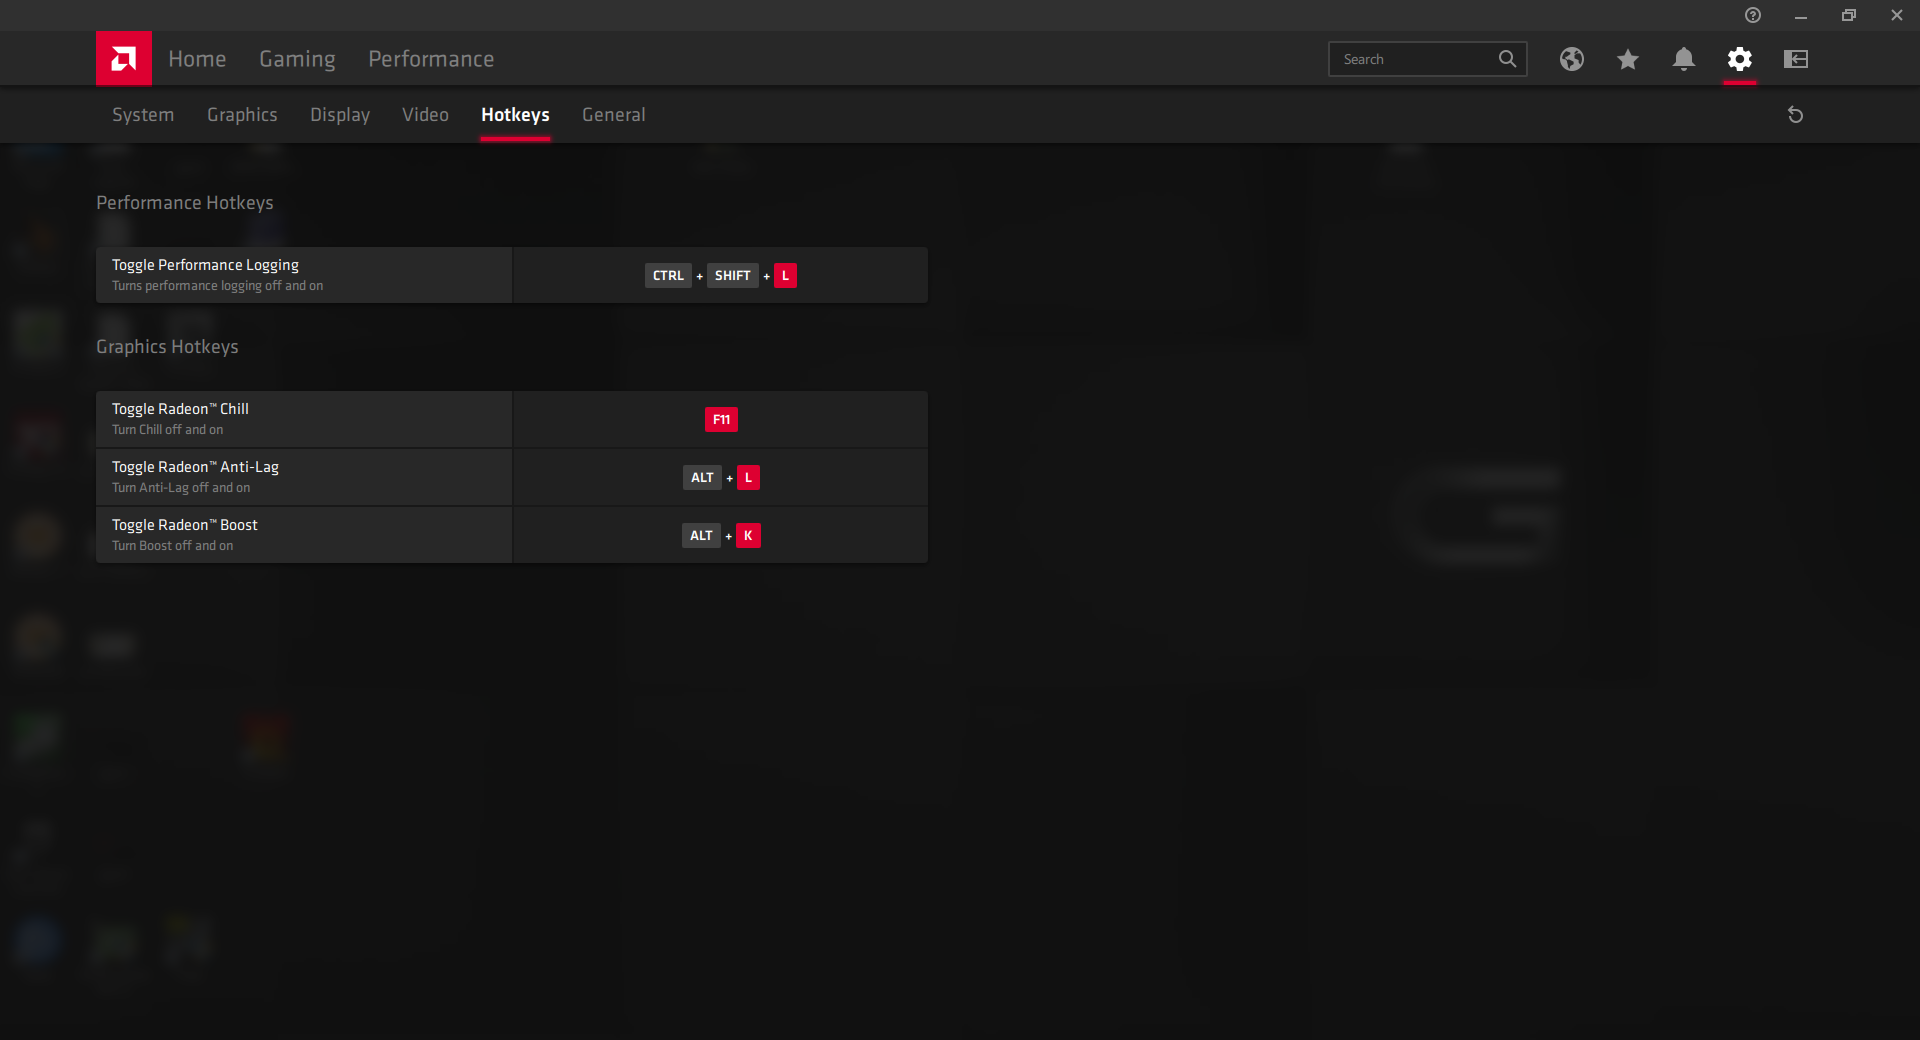
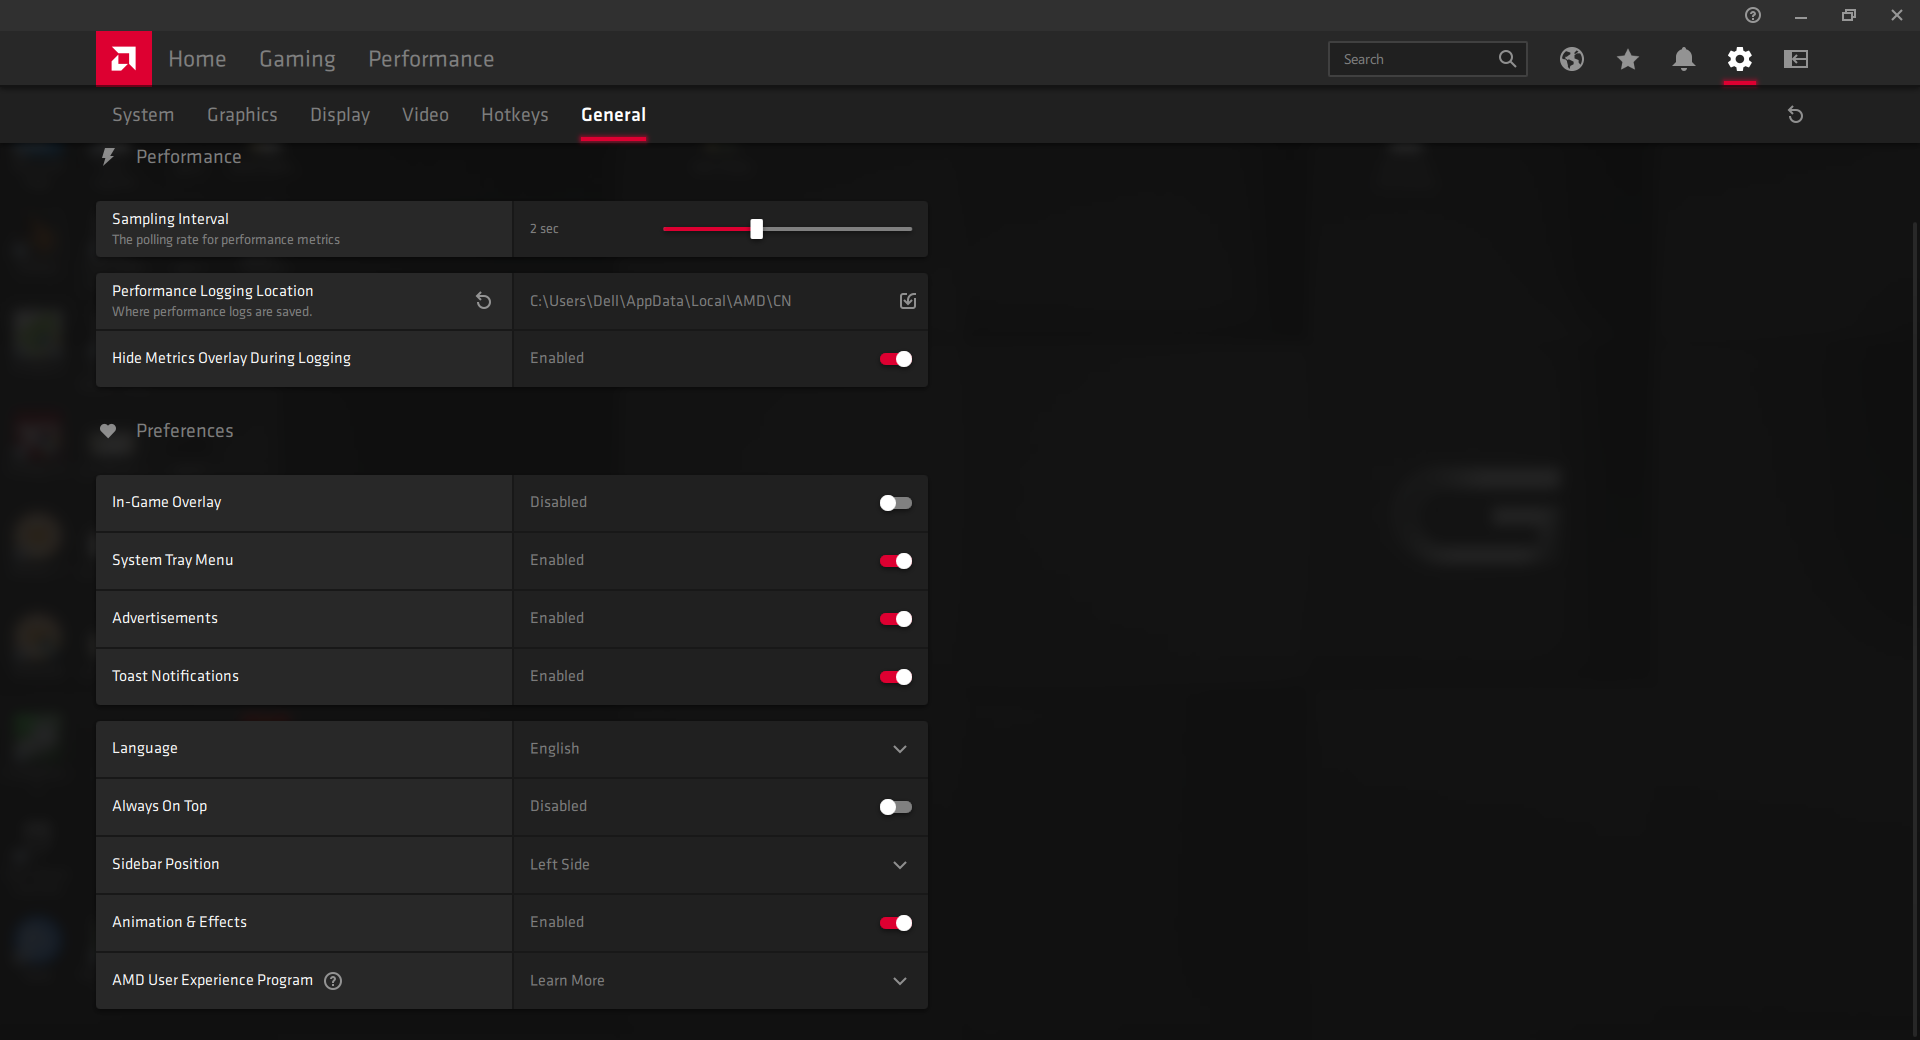
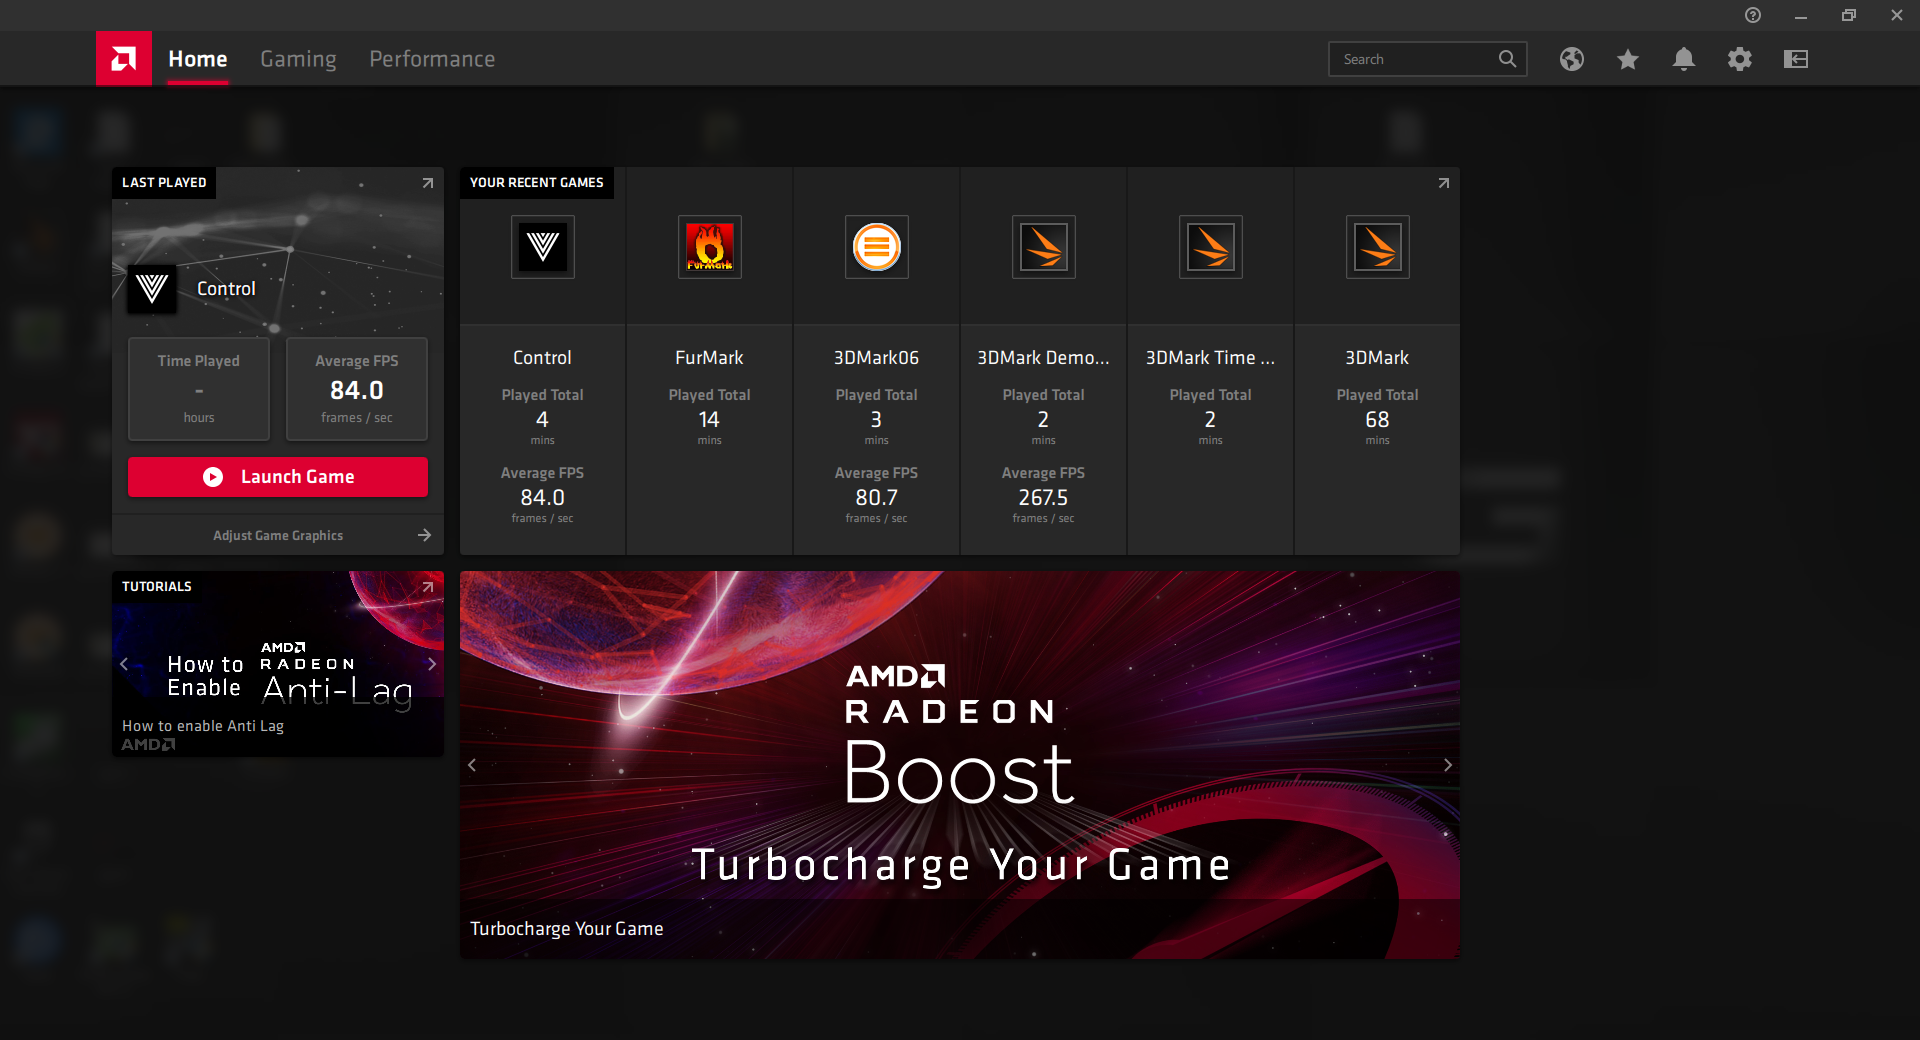
AMD SmartShift is always active and it cannot be toggled on or off. We recommend that owners become familiar with the revamped Radeon software as important features can be toggled here including Radeon Anti-Lag, Chill, Boost, Vari-Bright, vsync, and others.
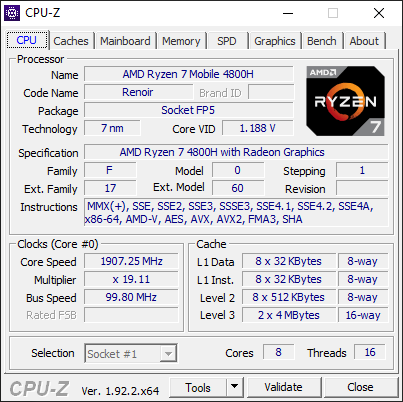
Processor
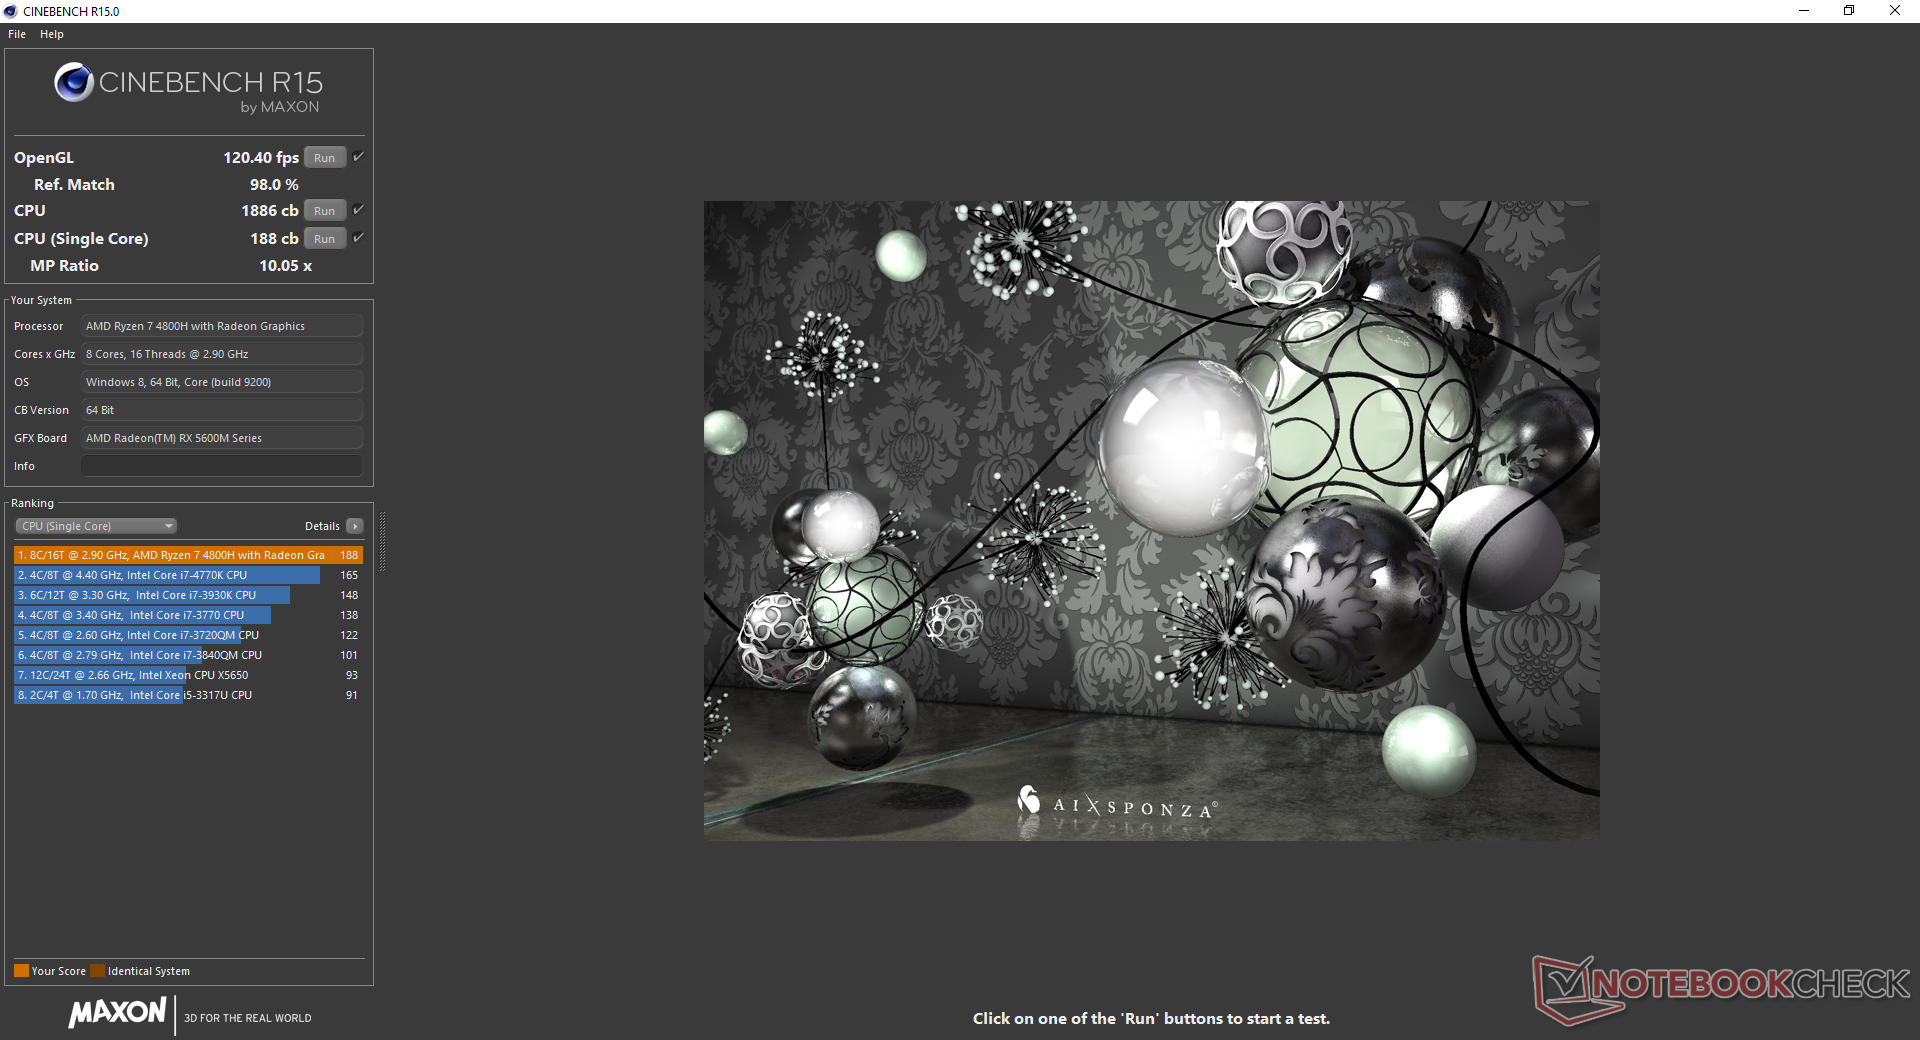
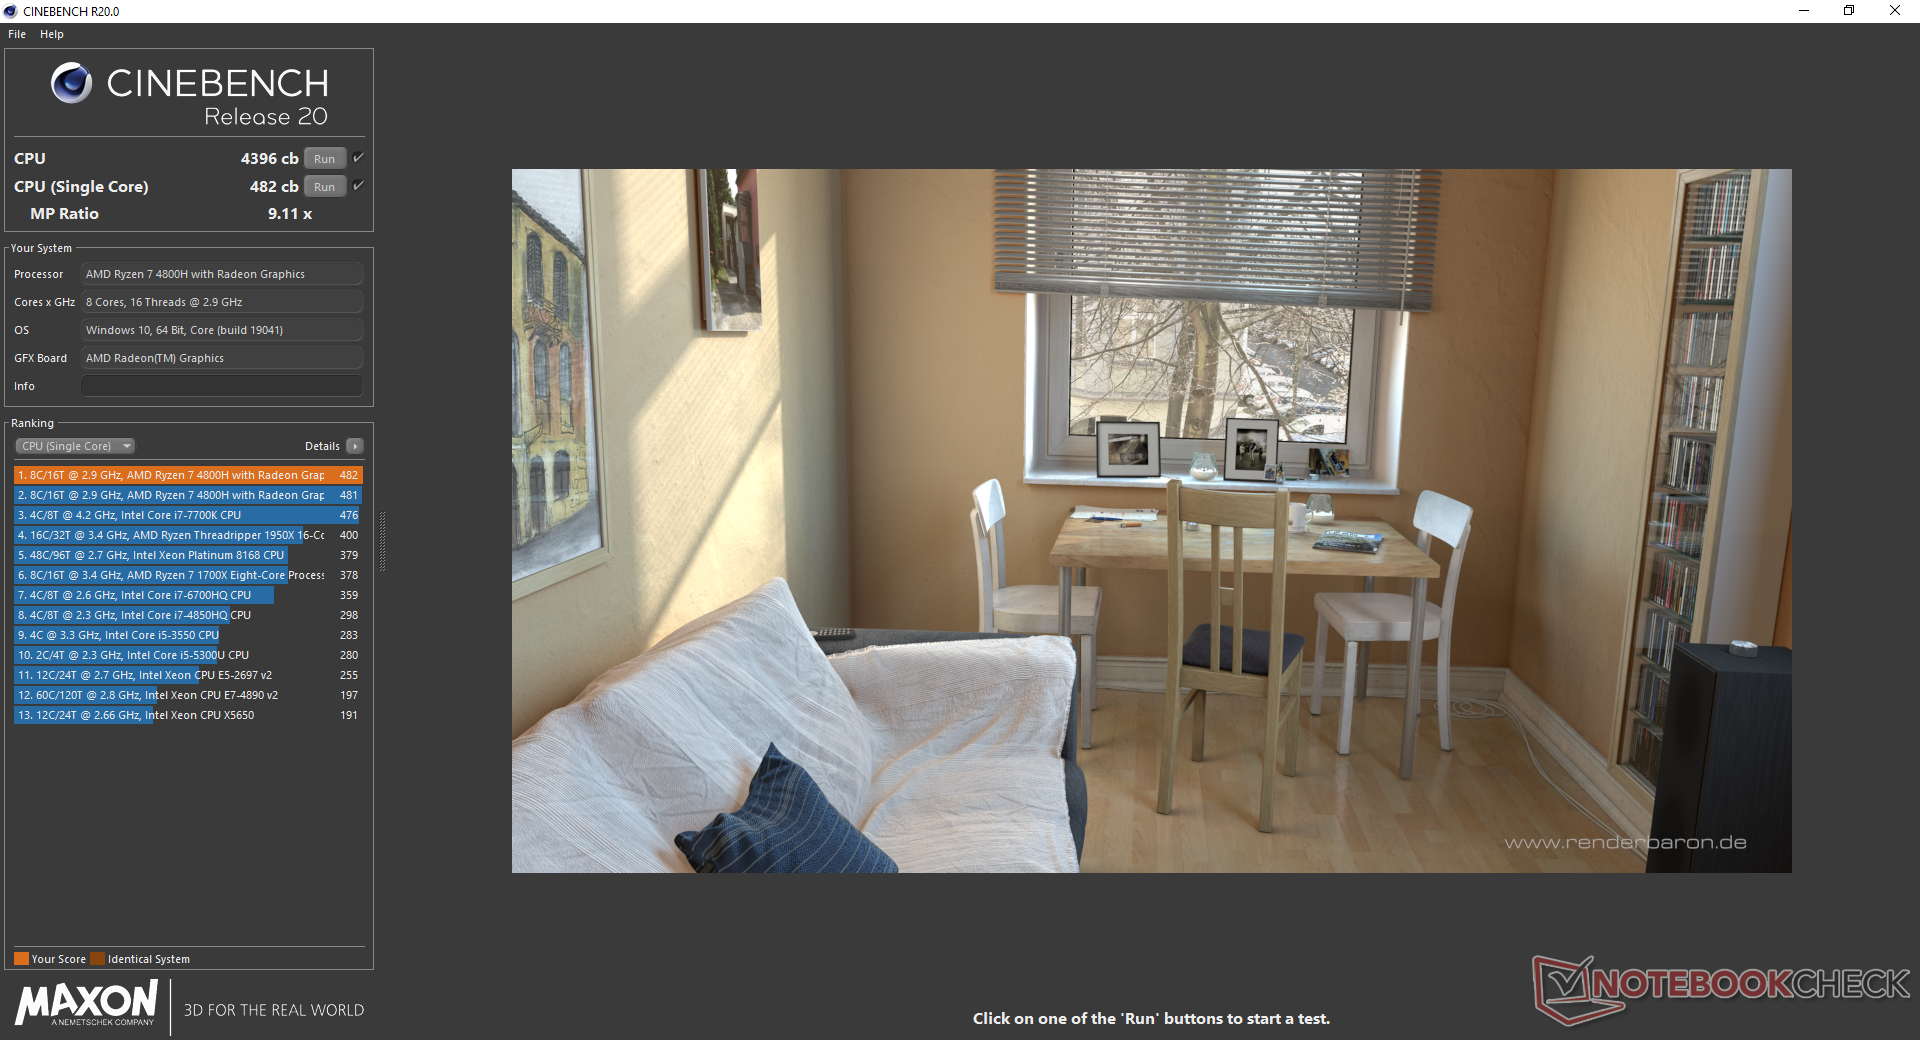
Just because SmartShift is active doesn't mean that the Dell is suddenly equipped with the fastest Ryzen 7 4800H you can get. The Eluktronics RP-15, for example, is able to run about 7 percent faster with the same CPU after accounting for throttling. Performance over time is still steadier and more consistent than what we observed on the Asus TUF A15 as shown by our CineBench R15 Multi-Thread loop test below. Upgrading from the Ryzen 5 4600H option will grant users roughly 36 percent faster multi-thread performance.
Raw processor performance continues to be insanely fast to edge out even the 10th gen Core i9-10980HK in multi-threaded workloads while being just slightly behind in single-threaded tasks. This particular Intel CPU is typically found on pricier laptops costing hundreds of dollars more.
Interestingly, performance in our CineBench R15 loop test would dip to about 1560 points midway before recovering to the 1800-point range. We initially suspected it to be a fluke and so we reran the test only to find a similar nosedive a second time. It's possible that there is a slight performance bug when the processor is stressed to extreme levels.
See our dedicated page on the Ryzen 7 4800H for more technical information and benchmark comparisons.
Cinebench R15: CPU Multi 64Bit | CPU Single 64Bit
Blender: v2.79 BMW27 CPU
7-Zip 18.03: 7z b 4 -mmt1 | 7z b 4
Geekbench 5.5: Single-Core | Multi-Core
HWBOT x265 Benchmark v2.2: 4k Preset
LibreOffice : 20 Documents To PDF
R Benchmark 2.5: Overall mean
| Cinebench R20 / CPU (Multi Core) | |
| AMD Radeon RX Vega 64 | |
| Eurocom Sky X4C i9-9900KS | |
| Dell G5 15 SE 5505 P89F | |
| Asus Zephyrus G14 GA401IV | |
| Average AMD Ryzen 7 4800H (3692 - 4663, n=18) | |
| MSI GE66 Raider 10SFS | |
| Gigabyte Aero 15 OLED XB-8DE51B0SP | |
| MSI GE65 Raider 9SF-049US | |
| Dell XPS 15 9500 Core i7 4K UHD | |
| Acer Nitro 5 AN515-44-R5FT | |
| SCHENKER XMG Fusion 15 XFU15L19 | |
| MSI GE63 Raider 8SG | |
| MSI Alpha 15 A3DDK-034 | |
| Cinebench R20 / CPU (Single Core) | |
| Gigabyte Aero 15 OLED XB-8DE51B0SP | |
| Eurocom Sky X4C i9-9900KS | |
| AMD Radeon RX Vega 64 | |
| Asus Zephyrus G14 GA401IV | |
| Dell XPS 15 9500 Core i7 4K UHD | |
| Dell G5 15 SE 5505 P89F | |
| Average AMD Ryzen 7 4800H (462 - 491, n=17) | |
| MSI GE66 Raider 10SFS | |
| MSI GE65 Raider 9SF-049US | |
| SCHENKER XMG Fusion 15 XFU15L19 | |
| Acer Nitro 5 AN515-44-R5FT | |
| MSI GE63 Raider 8SG | |
| MSI Alpha 15 A3DDK-034 | |
| Cinebench R15 / CPU Multi 64Bit | |
| AMD Radeon RX Vega 64 | |
| Dell G5 15 SE 5505 P89F | |
| Eurocom Sky X4C i9-9900KS | |
| Asus Zephyrus G14 GA401IV | |
| Average AMD Ryzen 7 4800H (1652 - 1995, n=21) | |
| Gigabyte Aero 15 OLED XB-8DE51B0SP | |
| MSI GE66 Raider 10SFS | |
| MSI GE65 Raider 9SF-049US | |
| Acer Nitro 5 AN515-44-R5FT | |
| Dell XPS 15 9500 Core i7 4K UHD | |
| SCHENKER XMG Fusion 15 XFU15L19 | |
| MSI GE63 Raider 8SG | |
| MSI Alpha 15 A3DDK-034 | |
| Cinebench R15 / CPU Single 64Bit | |
| Eurocom Sky X4C i9-9900KS | |
| Gigabyte Aero 15 OLED XB-8DE51B0SP | |
| MSI GE66 Raider 10SFS | |
| AMD Radeon RX Vega 64 | |
| Dell XPS 15 9500 Core i7 4K UHD | |
| MSI GE65 Raider 9SF-049US | |
| Asus Zephyrus G14 GA401IV | |
| Dell G5 15 SE 5505 P89F | |
| Average AMD Ryzen 7 4800H (186 - 191, n=15) | |
| SCHENKER XMG Fusion 15 XFU15L19 | |
| Acer Nitro 5 AN515-44-R5FT | |
| MSI GE63 Raider 8SG | |
| MSI Alpha 15 A3DDK-034 | |
| Blender / v2.79 BMW27 CPU | |
| SCHENKER XMG Fusion 15 XFU15L19 | |
| Dell XPS 15 9500 Core i7 4K UHD | |
| Acer Nitro 5 AN515-44-R5FT | |
| Asus Zephyrus G14 GA401IV | |
| Gigabyte Aero 15 OLED XB-8DE51B0SP | |
| MSI GE66 Raider 10SFS | |
| Dell G5 15 SE 5505 P89F | |
| Average AMD Ryzen 7 4800H (248 - 299, n=15) | |
| Eurocom Sky X4C i9-9900KS | |
| AMD Radeon RX Vega 64 | |
| 7-Zip 18.03 / 7z b 4 -mmt1 | |
| Eurocom Sky X4C i9-9900KS | |
| MSI GE66 Raider 10SFS | |
| Gigabyte Aero 15 OLED XB-8DE51B0SP | |
| Dell XPS 15 9500 Core i7 4K UHD | |
| AMD Radeon RX Vega 64 | |
| SCHENKER XMG Fusion 15 XFU15L19 | |
| Average AMD Ryzen 7 4800H (4575 - 4743, n=15) | |
| Dell G5 15 SE 5505 P89F | |
| Asus Zephyrus G14 GA401IV | |
| Acer Nitro 5 AN515-44-R5FT | |
| 7-Zip 18.03 / 7z b 4 | |
| AMD Radeon RX Vega 64 | |
| Eurocom Sky X4C i9-9900KS | |
| Average AMD Ryzen 7 4800H (44827 - 53883, n=15) | |
| Dell G5 15 SE 5505 P89F | |
| Asus Zephyrus G14 GA401IV | |
| Gigabyte Aero 15 OLED XB-8DE51B0SP | |
| MSI GE66 Raider 10SFS | |
| Acer Nitro 5 AN515-44-R5FT | |
| Dell XPS 15 9500 Core i7 4K UHD | |
| SCHENKER XMG Fusion 15 XFU15L19 | |
| Geekbench 5.5 / Single-Core | |
| Eurocom Sky X4C i9-9900KS | |
| MSI GE66 Raider 10SFS | |
| Gigabyte Aero 15 OLED XB-8DE51B0SP | |
| Dell XPS 15 9500 Core i7 4K UHD | |
| AMD Radeon RX Vega 64 | |
| SCHENKER XMG Fusion 15 XFU15L19 | |
| Asus Zephyrus G14 GA401IV | |
| Average AMD Ryzen 7 4800H (1154 - 1207, n=17) | |
| Dell G5 15 SE 5505 P89F | |
| Acer Nitro 5 AN515-44-R5FT | |
| MSI Alpha 15 A3DDK-034 | |
| Geekbench 5.5 / Multi-Core | |
| Eurocom Sky X4C i9-9900KS | |
| AMD Radeon RX Vega 64 | |
| MSI GE66 Raider 10SFS | |
| Gigabyte Aero 15 OLED XB-8DE51B0SP | |
| Dell XPS 15 9500 Core i7 4K UHD | |
| Dell G5 15 SE 5505 P89F | |
| Average AMD Ryzen 7 4800H (5920 - 8672, n=17) | |
| Asus Zephyrus G14 GA401IV | |
| SCHENKER XMG Fusion 15 XFU15L19 | |
| Acer Nitro 5 AN515-44-R5FT | |
| MSI Alpha 15 A3DDK-034 | |
| HWBOT x265 Benchmark v2.2 / 4k Preset | |
| AMD Radeon RX Vega 64 | |
| Eurocom Sky X4C i9-9900KS | |
| Gigabyte Aero 15 OLED XB-8DE51B0SP | |
| MSI GE66 Raider 10SFS | |
| Dell G5 15 SE 5505 P89F | |
| Average AMD Ryzen 7 4800H (10.8 - 14.1, n=16) | |
| Asus Zephyrus G14 GA401IV | |
| SCHENKER XMG Fusion 15 XFU15L19 | |
| Dell XPS 15 9500 Core i7 4K UHD | |
| Acer Nitro 5 AN515-44-R5FT | |
| LibreOffice / 20 Documents To PDF | |
| Dell G5 15 SE 5505 P89F | |
| Acer Nitro 5 AN515-44-R5FT | |
| Average AMD Ryzen 7 4800H (28.6 - 95.8, n=14) | |
| SCHENKER XMG Fusion 15 XFU15L19 | |
| MSI GE66 Raider 10SFS | |
| Dell XPS 15 9500 Core i7 4K UHD | |
| Gigabyte Aero 15 OLED XB-8DE51B0SP | |
| R Benchmark 2.5 / Overall mean | |
| Acer Nitro 5 AN515-44-R5FT | |
| SCHENKER XMG Fusion 15 XFU15L19 | |
| Dell XPS 15 9500 Core i7 4K UHD | |
| Average AMD Ryzen 7 4800H (0.562 - 0.603, n=15) | |
| Dell G5 15 SE 5505 P89F | |
| MSI GE66 Raider 10SFS | |
| Gigabyte Aero 15 OLED XB-8DE51B0SP | |
Cinebench R15: CPU Multi 64Bit | CPU Single 64Bit
Blender: v2.79 BMW27 CPU
7-Zip 18.03: 7z b 4 -mmt1 | 7z b 4
Geekbench 5.5: Single-Core | Multi-Core
HWBOT x265 Benchmark v2.2: 4k Preset
LibreOffice : 20 Documents To PDF
R Benchmark 2.5: Overall mean
* ... smaller is better
System Performance
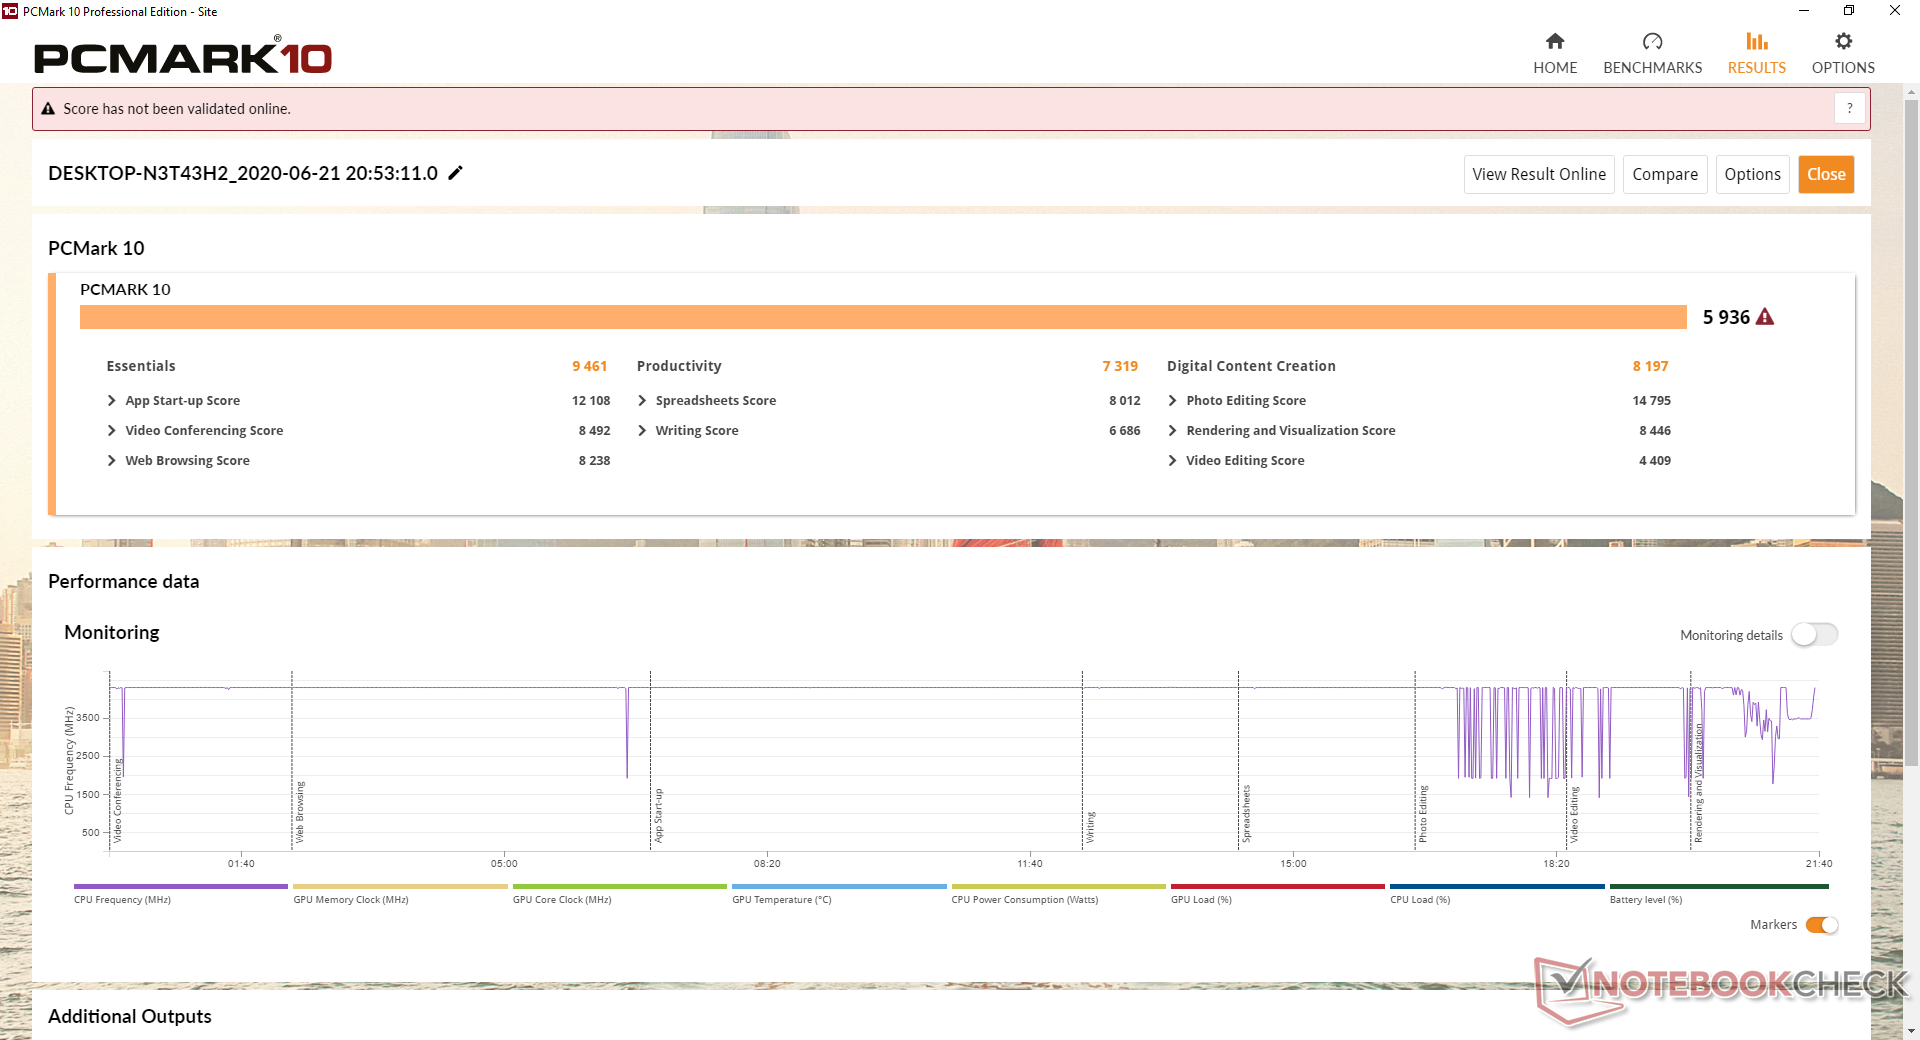
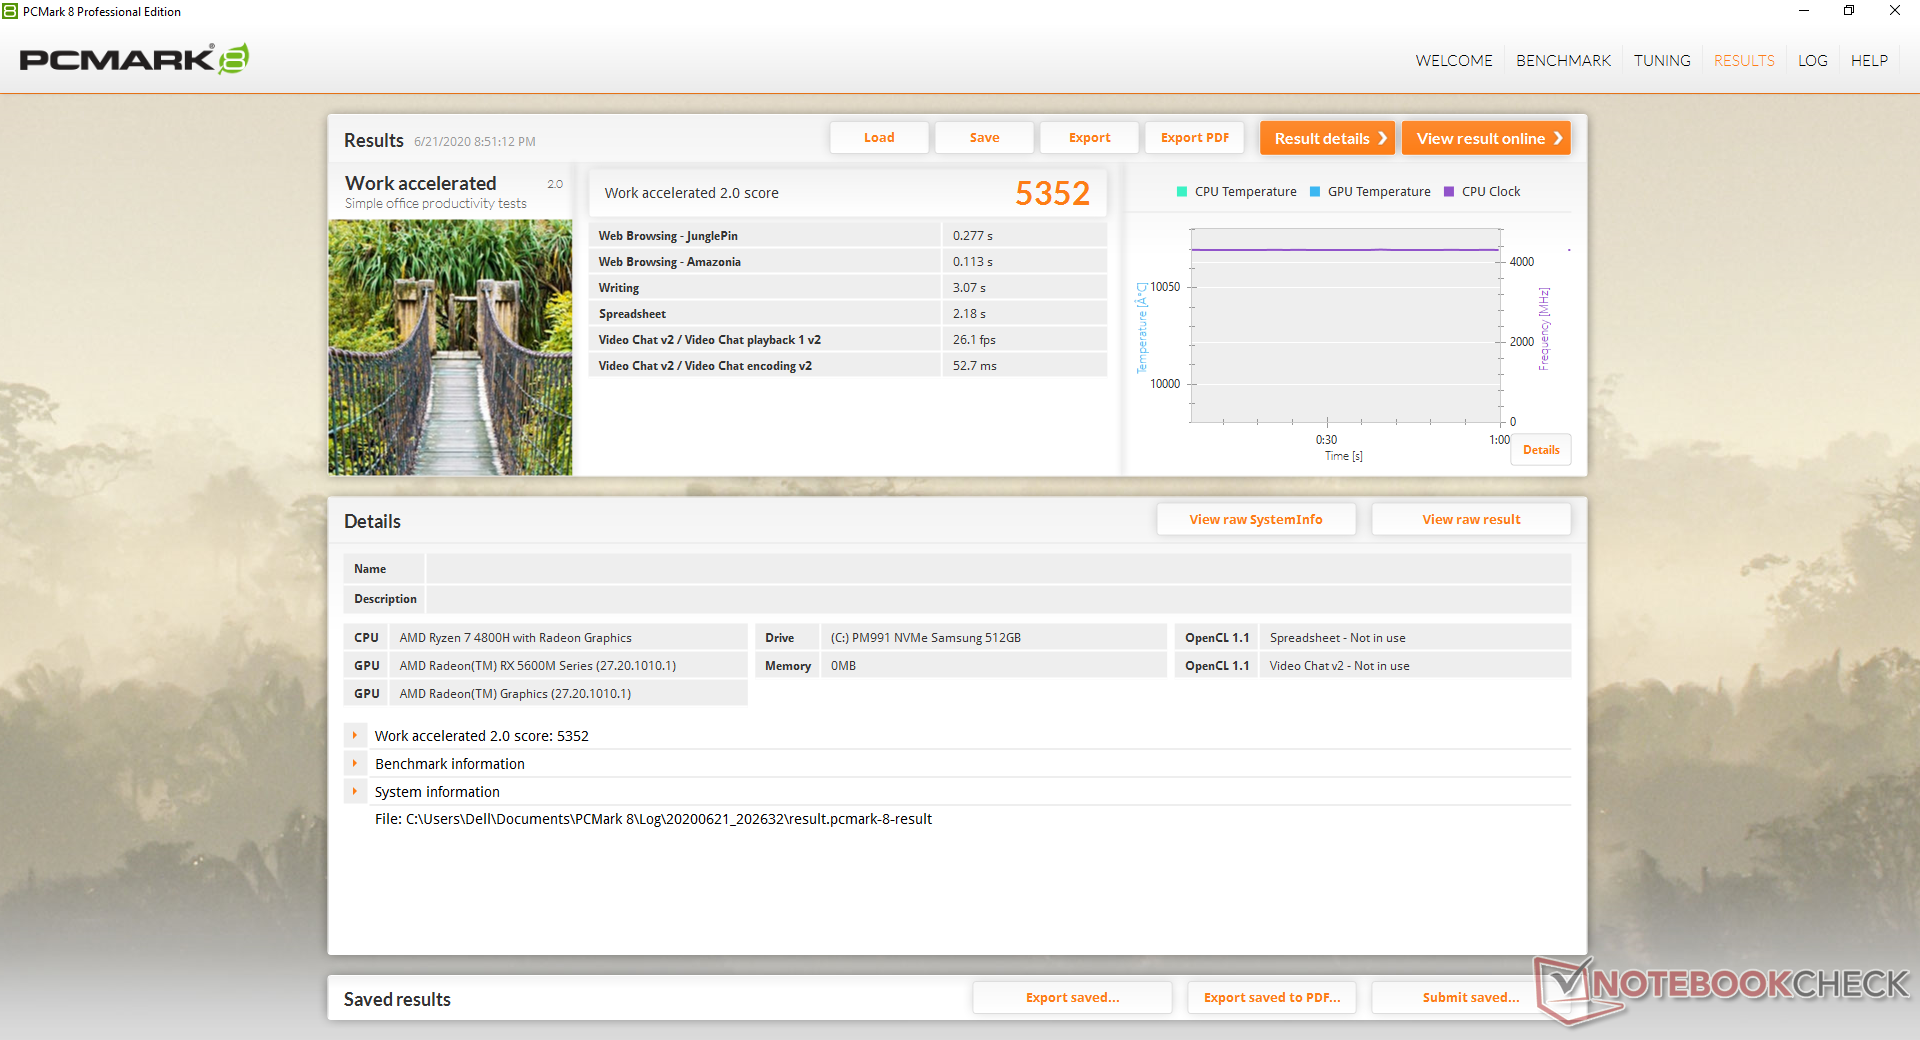
PCMark results are neck-to-neck with other high-performance gaming laptops powered by Intel H-series CPUs and Turing GPUs. Most notably, scores are consistently ahead of last year's MSI Alpha 15 series which ran on last generation AMD hardware. We didn't experience any hardware or software issues during our time with the unit.
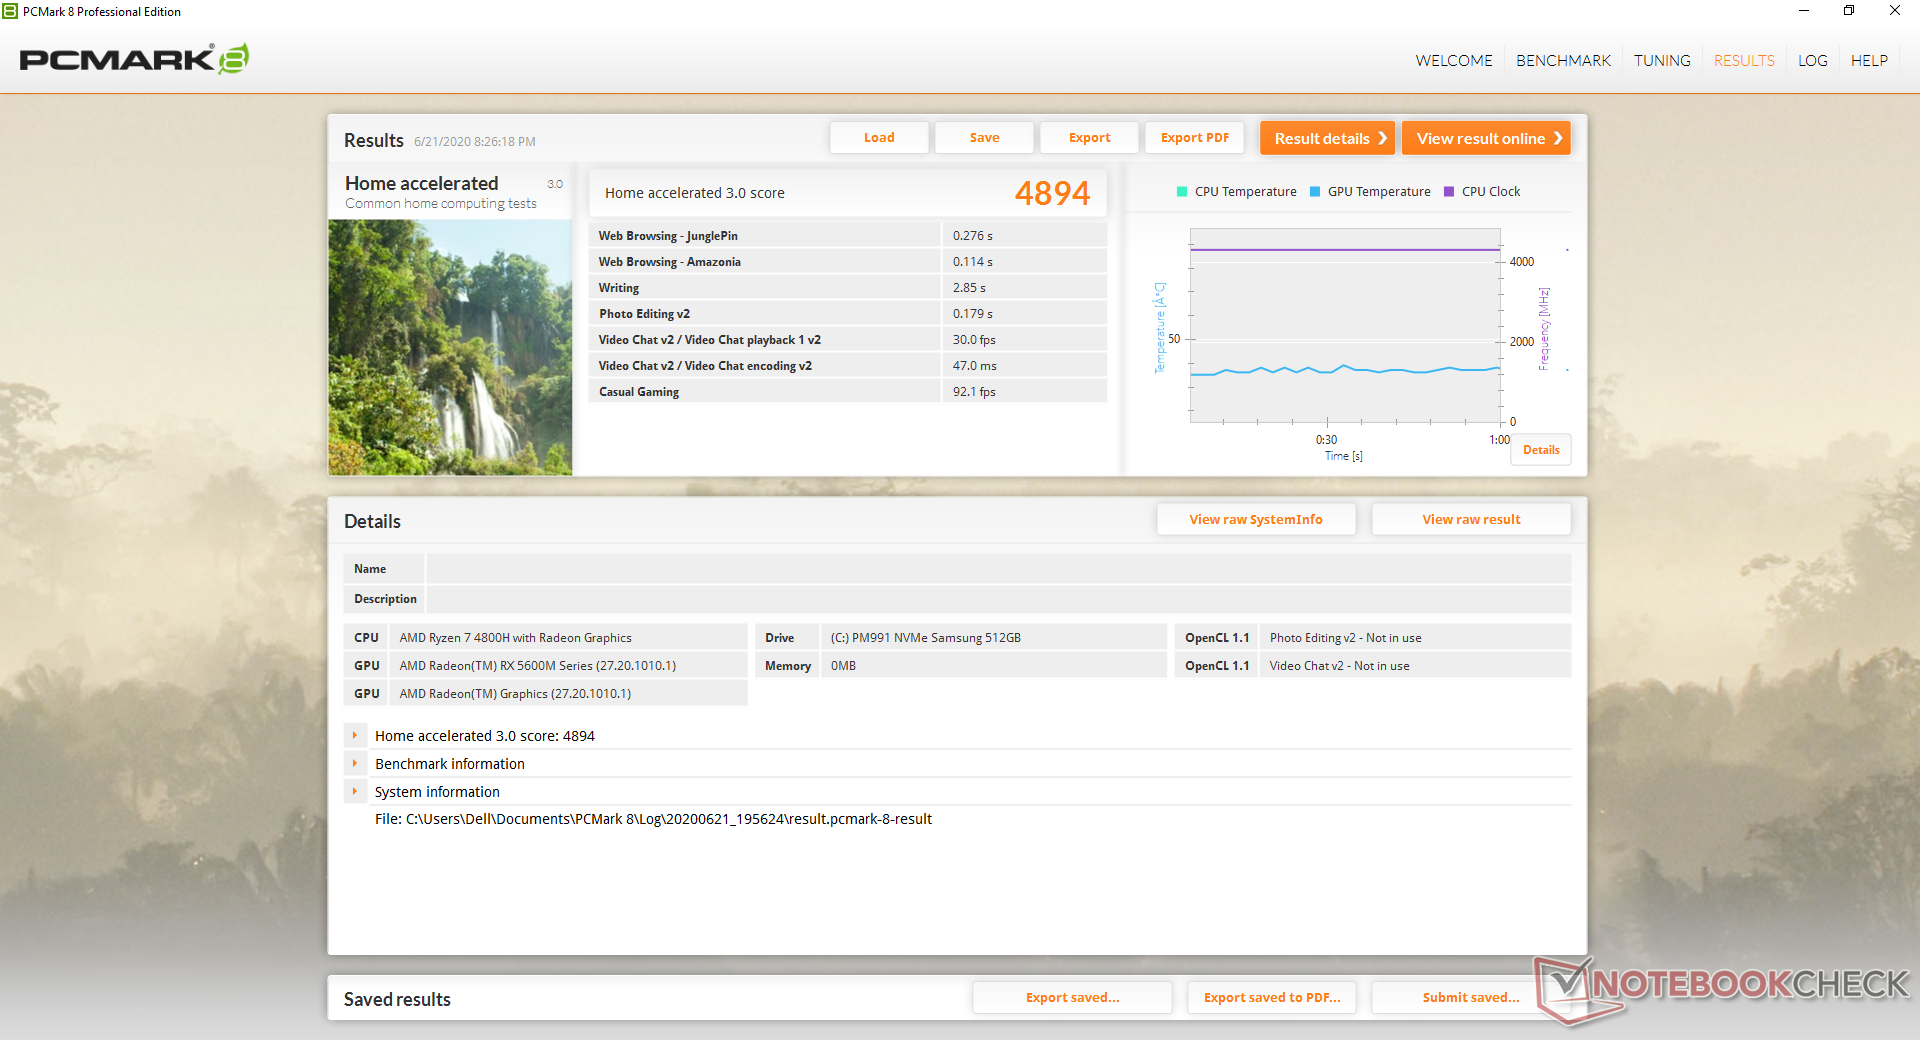
| PCMark 8 Home Score Accelerated v2 | 4894 points | |
| PCMark 8 Work Score Accelerated v2 | 5352 points | |
| PCMark 10 Score | 5936 points | |
Help | ||
DPC Latency
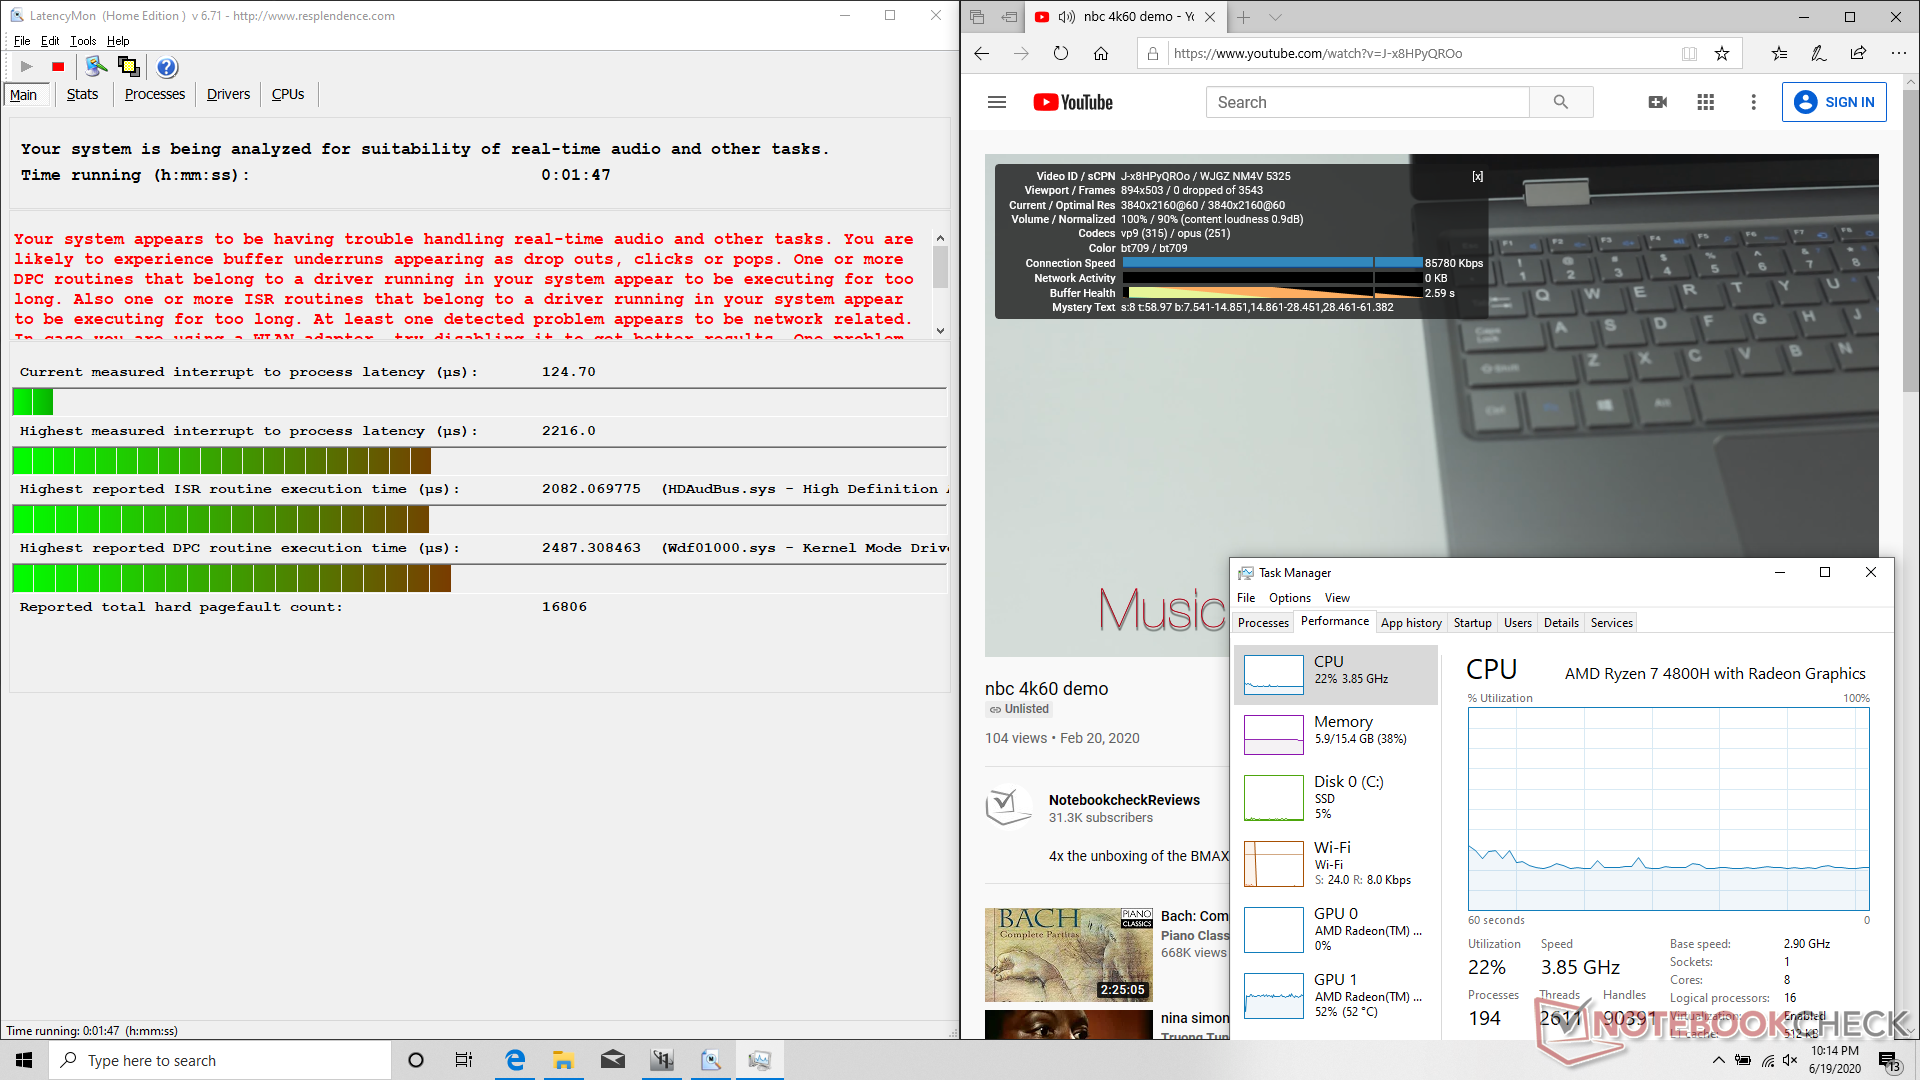
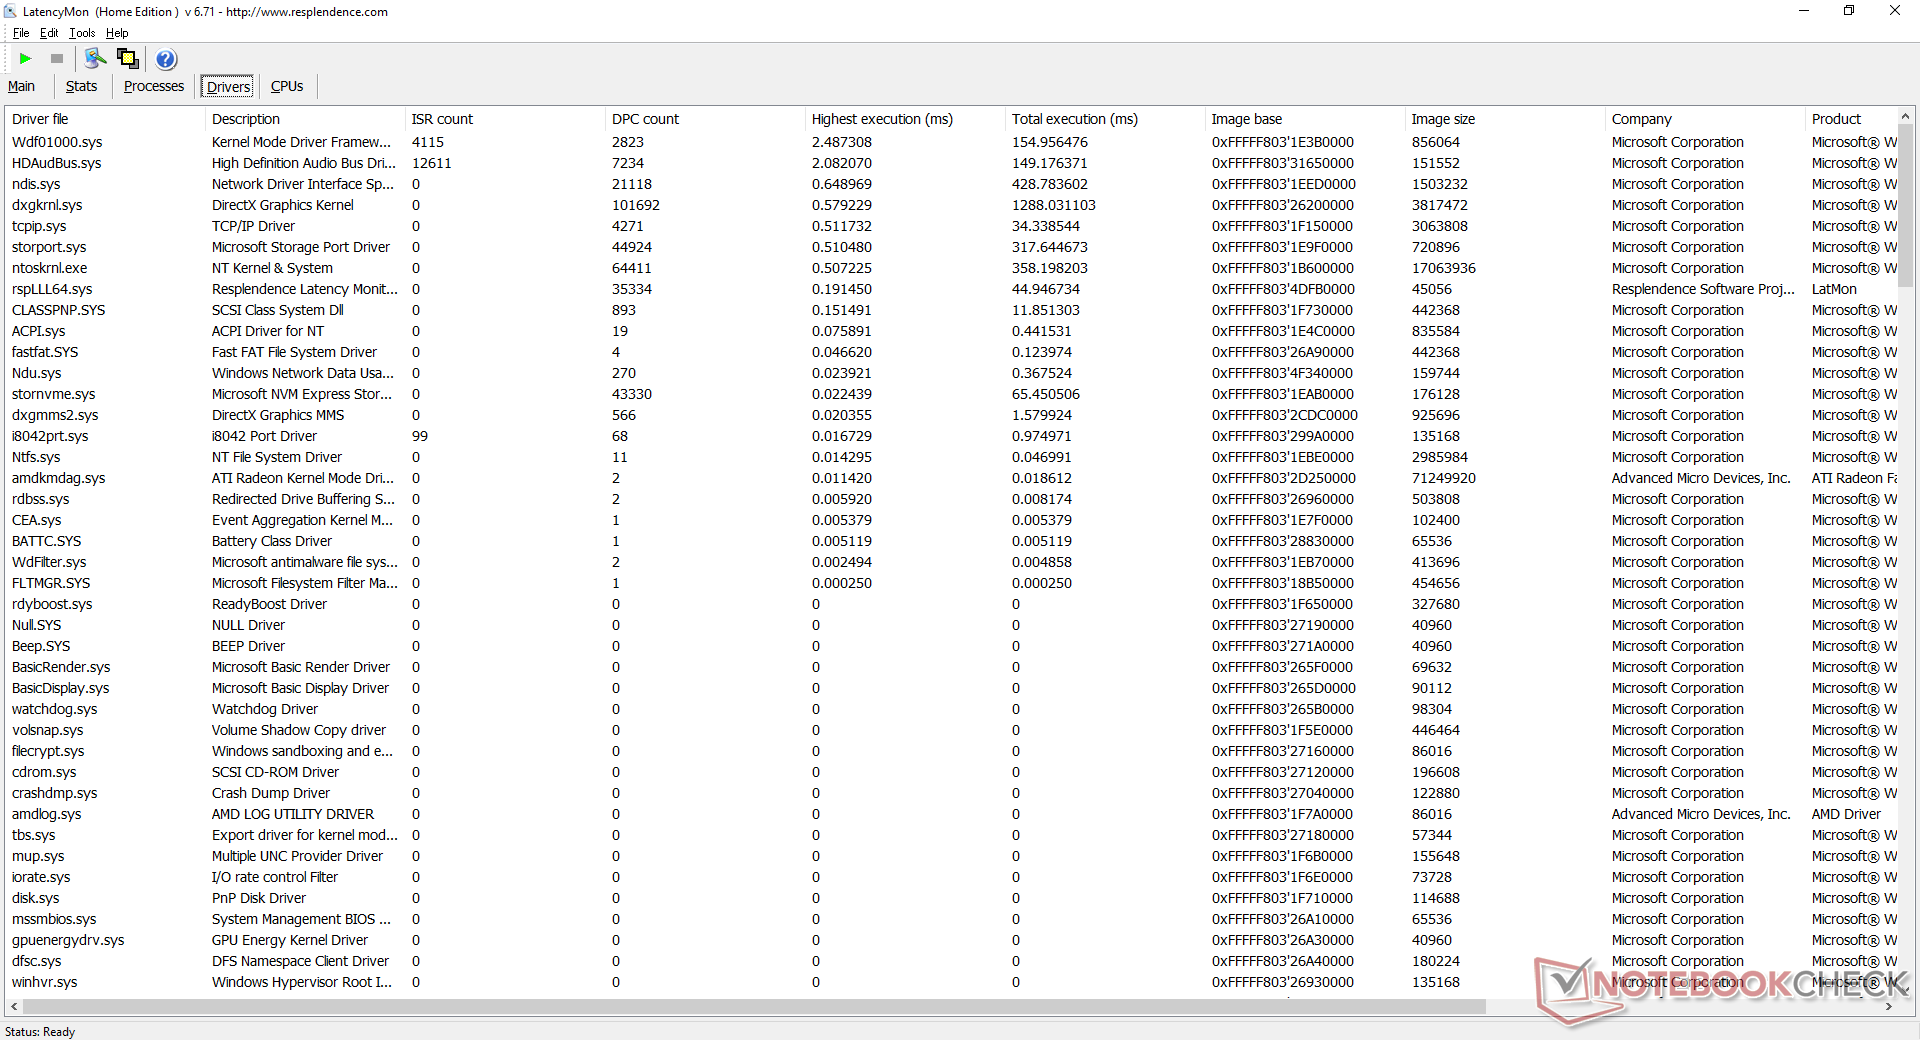
LatencyMon shows DPC latency issues when opening multiple tabs on our homepage. 4K video playback on YouTube is otherwise smooth with no dropped frames.
| DPC Latencies / LatencyMon - interrupt to process latency (max), Web, Youtube, Prime95 | |
| Dell XPS 15 9500 Core i7 4K UHD | |
| HP Envy x360 15-dr1679cl | |
| Dell G5 15 SE 5505 P89F | |
| Gigabyte Aero 15 OLED XB-8DE51B0SP | |
| MSI GP65 10SFK-047US | |
| Acer Nitro 5 AN515-44-R5FT | |
| MSI GE66 Raider 10SFS | |
| Asus TUF Gaming A15 FA506IV-HN172 | |
* ... smaller is better
Storage Devices
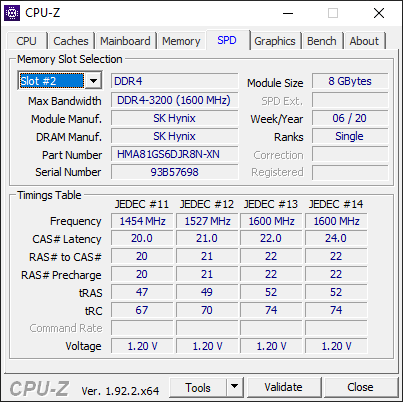
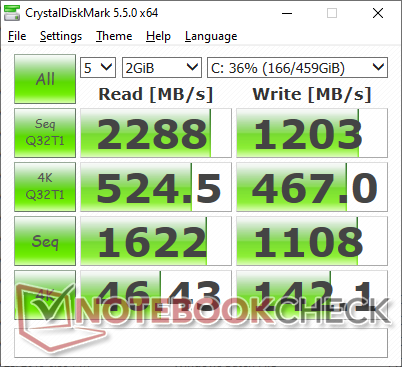
Up to two M.2 2280 NVMe drives are supported. Curiously, our unit comes with an uncommon M.2 2230 NVMe SSD, but the more popular 2280 form factor will work as well. Transfer rates from our miniature Samsing PM991 SSD are faster than the cheaper SK Hynix BC501 but still slower than the full-size Samsing PM981 series.
See our table of SSDs and HDDs for more benchmark comparisons.
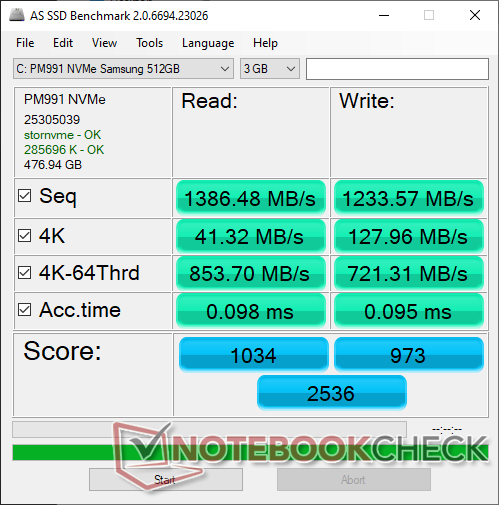
| Dell G5 15 SE 5505 P89F Samsung PM991 MZ9LQ512HALU | Dell G5 15 5590-P8RVW SK Hynix BC501 HFM512GDJTNG | Asus TUF Gaming A15 FA506IV-HN172 Kingston OM8PCP3512F-AB | HP Omen 15-dc1020ng WDC PC SN720 SDAQNTW-512G | MSI Alpha 15 A3DDK-034 Kingston RBUSNS8154P3512GJ | |
|---|---|---|---|---|---|
| AS SSD | -10% | -3% | 48% | -12% | |
| Seq Read | 1386 | 1221 -12% | 1682 21% | 2955 113% | 1423 3% |
| Seq Write | 1234 | 731 -41% | 904 -27% | 2440 98% | 958 -22% |
| 4K Read | 41.32 | 37.93 -8% | 60.2 46% | 40.56 -2% | 33.2 -20% |
| 4K Write | 128 | 88.1 -31% | 164.8 29% | 118.6 -7% | 80.7 -37% |
| 4K-64 Read | 854 | 778 -9% | 472.5 -45% | 1283 50% | 816 -4% |
| 4K-64 Write | 721 | 552 -23% | 845 17% | 1538 113% | 708 -2% |
| Access Time Read * | 0.098 | 0.091 7% | 0.087 11% | 0.084 14% | 0.1 -2% |
| Access Time Write * | 0.095 | 0.043 55% | 0.02 79% | 0.032 66% | 0.047 51% |
| Score Read | 1034 | 938 -9% | 701 -32% | 1619 57% | 991 -4% |
| Score Write | 973 | 713 -27% | 1101 13% | 1901 95% | 885 -9% |
| Score Total | 2536 | 2114 -17% | 2143 -15% | 4323 70% | 2365 -7% |
| Copy ISO MB/s | 1284 | 675 -47% | 1418 10% | 1043 -19% | |
| Copy Program MB/s | 401.9 | 248.4 -38% | 392.5 -2% | 252.7 -37% | |
| Copy Game MB/s | 1013 | 535 -47% | 907 -10% | 483.6 -52% | |
| CrystalDiskMark 5.2 / 6 | -32% | 1% | 22% | -25% | |
| Write 4K | 142.1 | 64.6 -55% | 219.8 55% | 112.1 -21% | 105.4 -26% |
| Read 4K | 46.43 | 35.64 -23% | 50.2 8% | 42.01 -10% | 33.24 -28% |
| Write Seq | 1108 | 748 -32% | 979 -12% | 1964 77% | 1029 -7% |
| Read Seq | 1622 | 1039 -36% | 1990 23% | 2065 27% | 1098 -32% |
| Write 4K Q32T1 | 467 | 435.7 -7% | 516 10% | 318.2 -32% | 322.1 -31% |
| Read 4K Q32T1 | 525 | 292.4 -44% | 298.3 -43% | 406.7 -23% | 352 -33% |
| Write Seq Q32T1 | 1203 | 870 -28% | 982 -18% | 2534 111% | 1036 -14% |
| Read Seq Q32T1 | 2288 | 1557 -32% | 1907 -17% | 3438 50% | 1606 -30% |
| Write 4K Q8T8 | 981 | ||||
| Read 4K Q8T8 | 300.9 | ||||
| Total Average (Program / Settings) | -21% /
-20% | -1% /
-1% | 35% /
38% | -19% /
-16% |
* ... smaller is better

Disk Throttling: DiskSpd Read Loop, Queue Depth 8
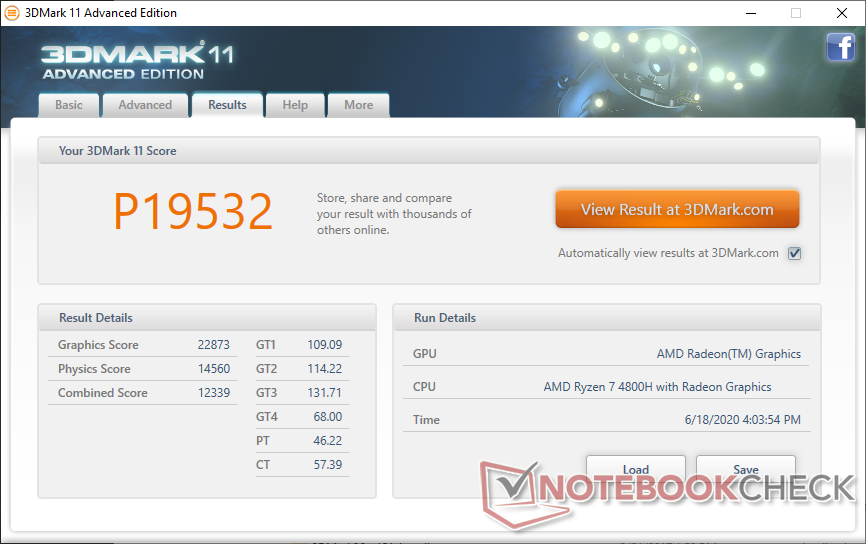
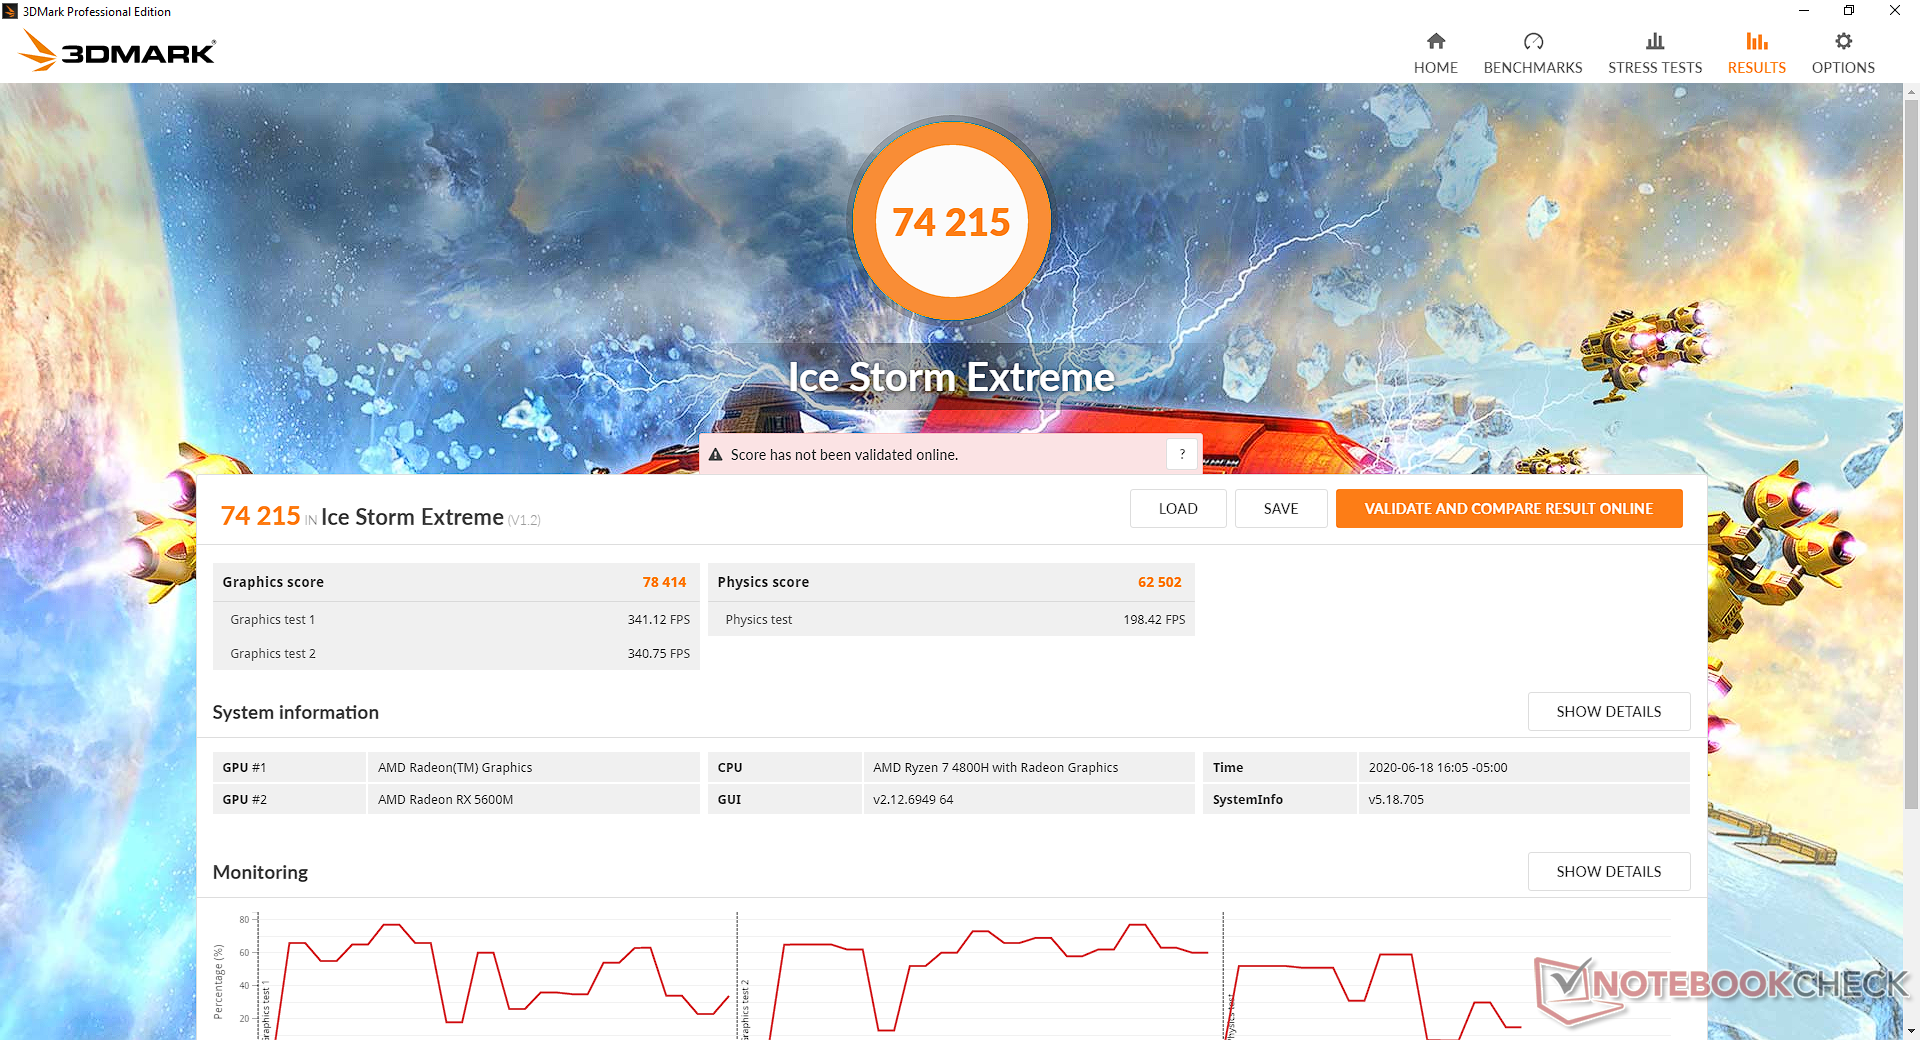
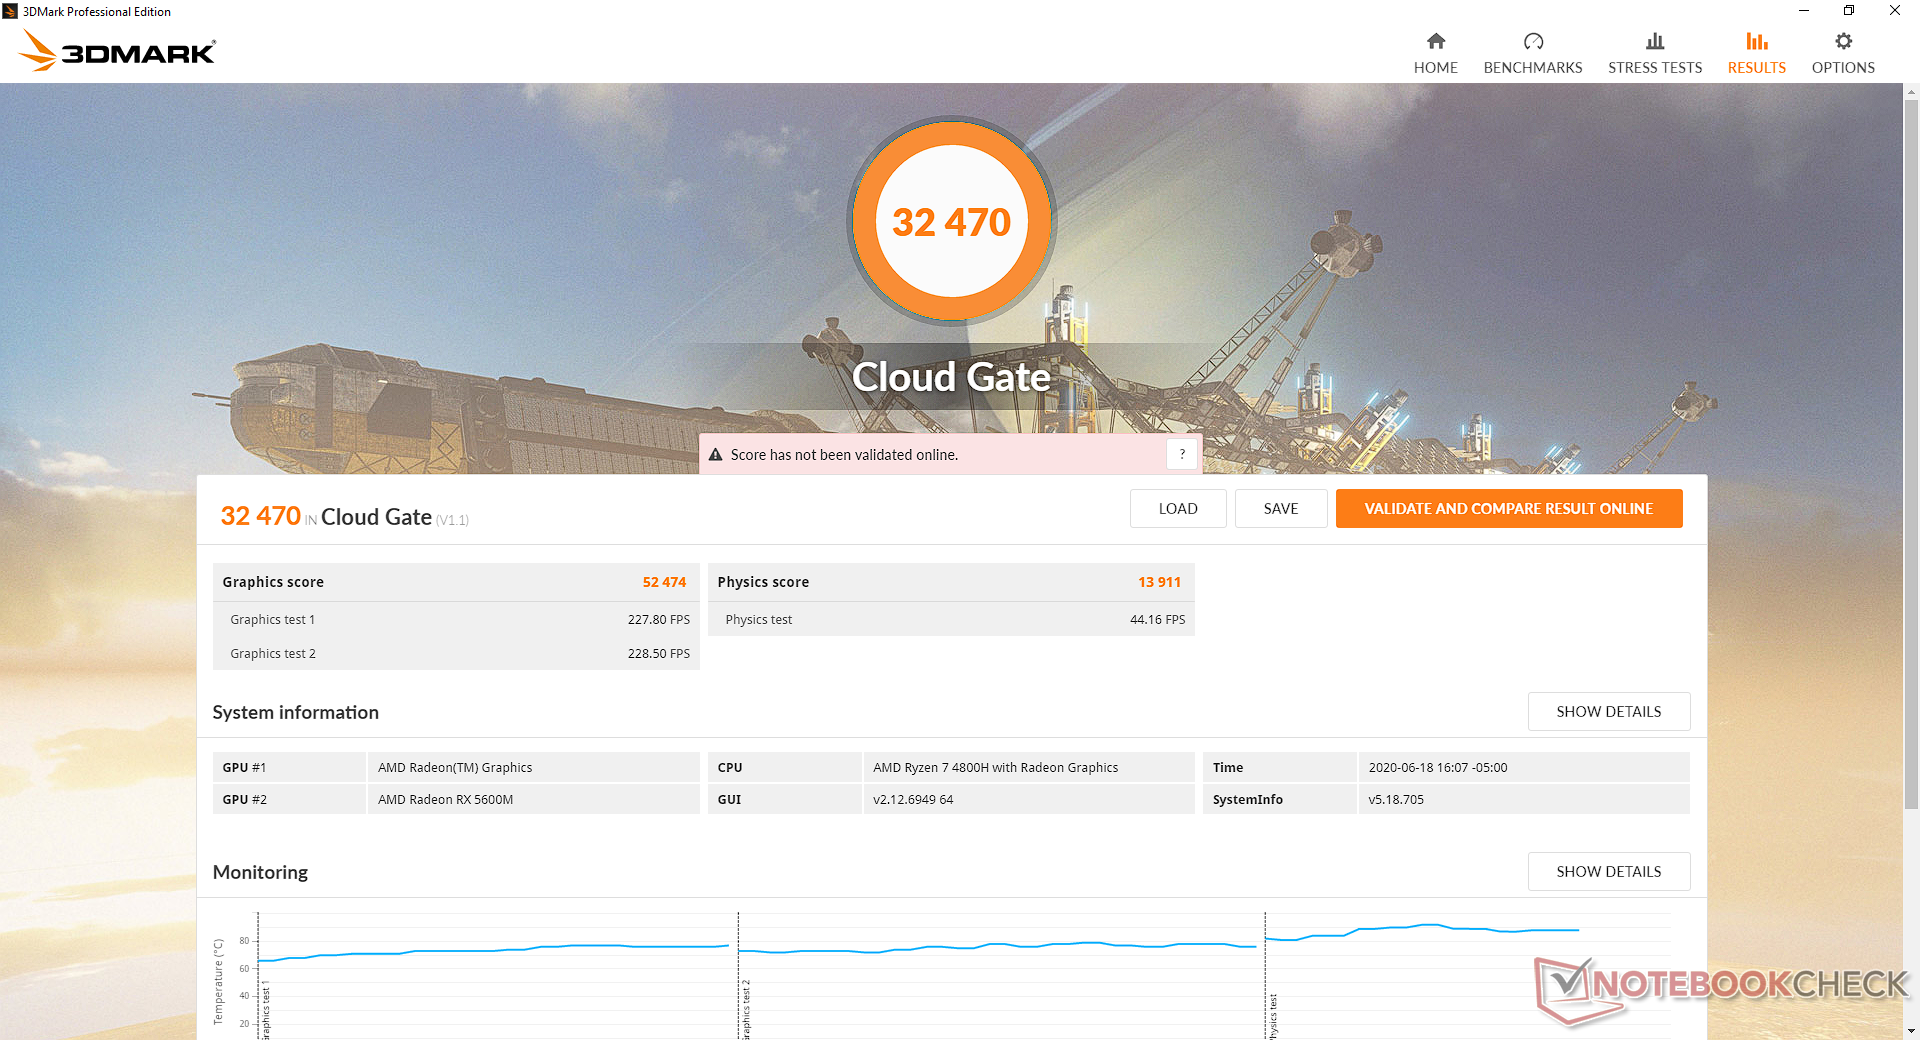
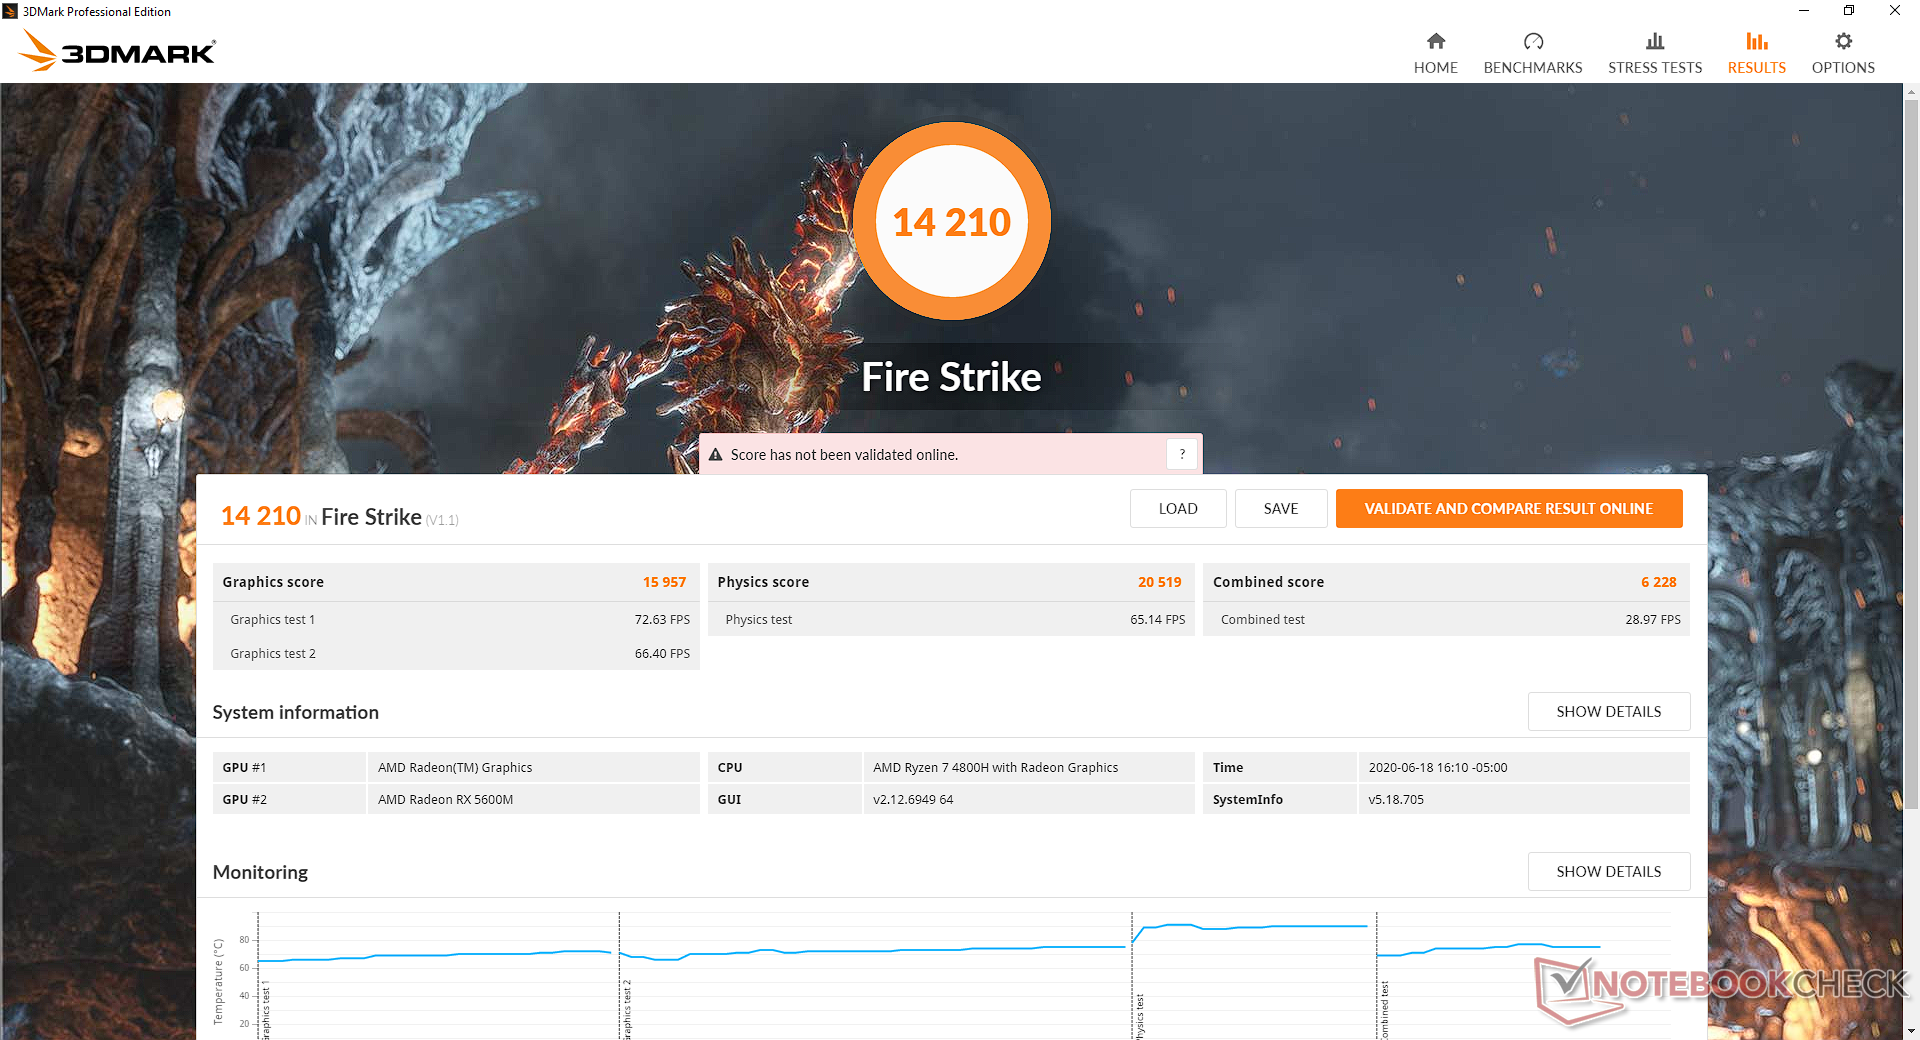
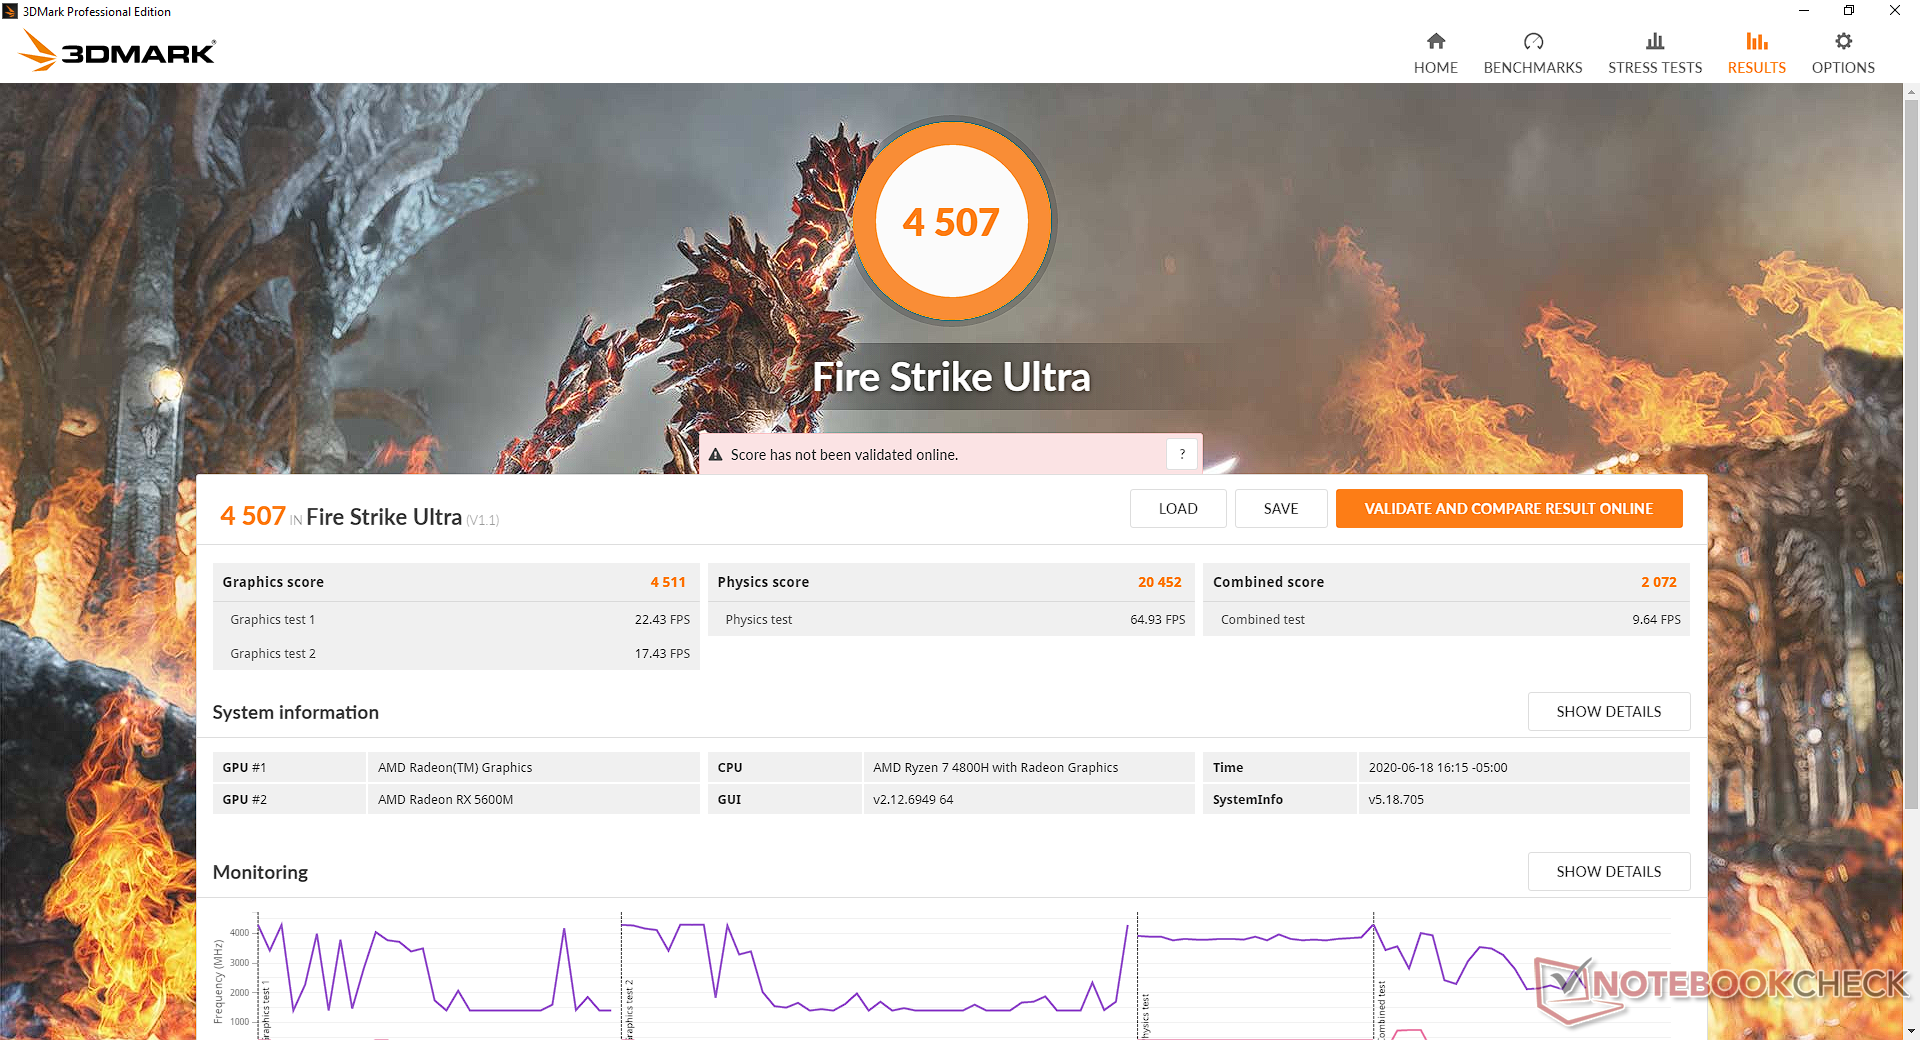
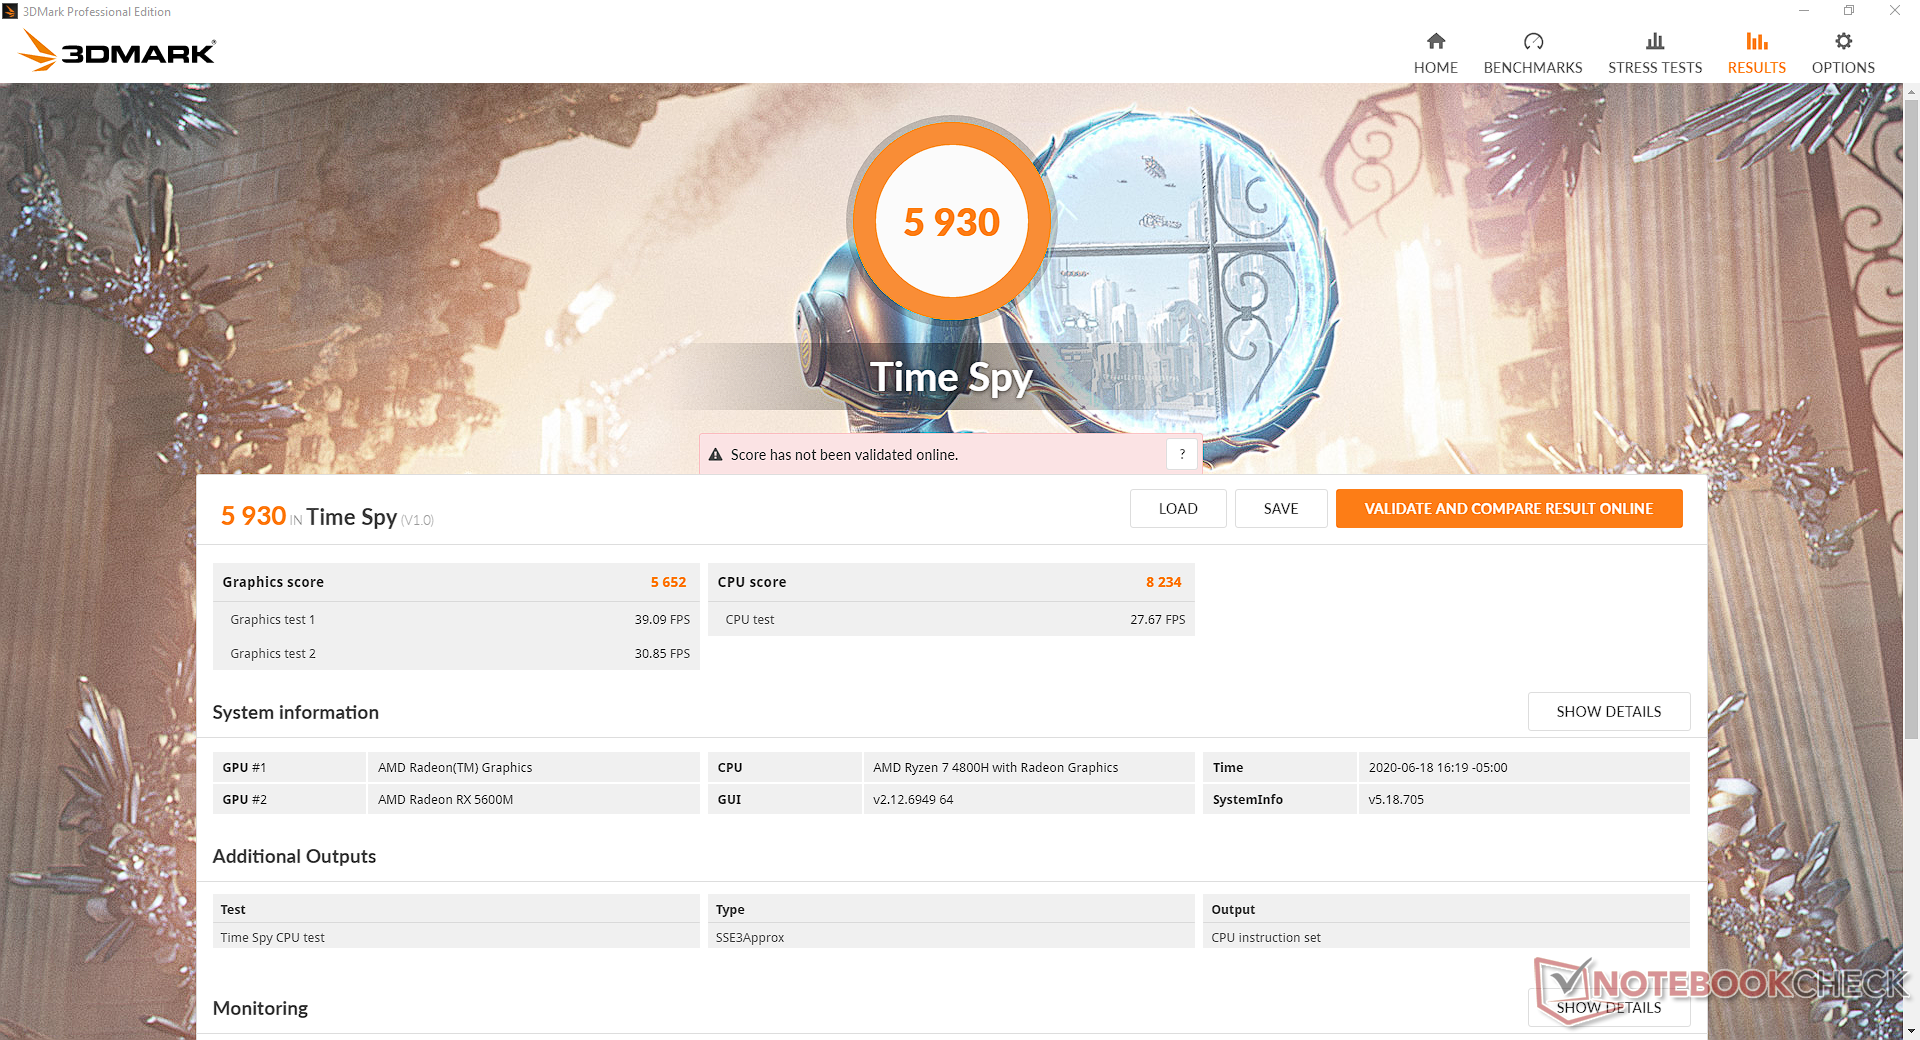
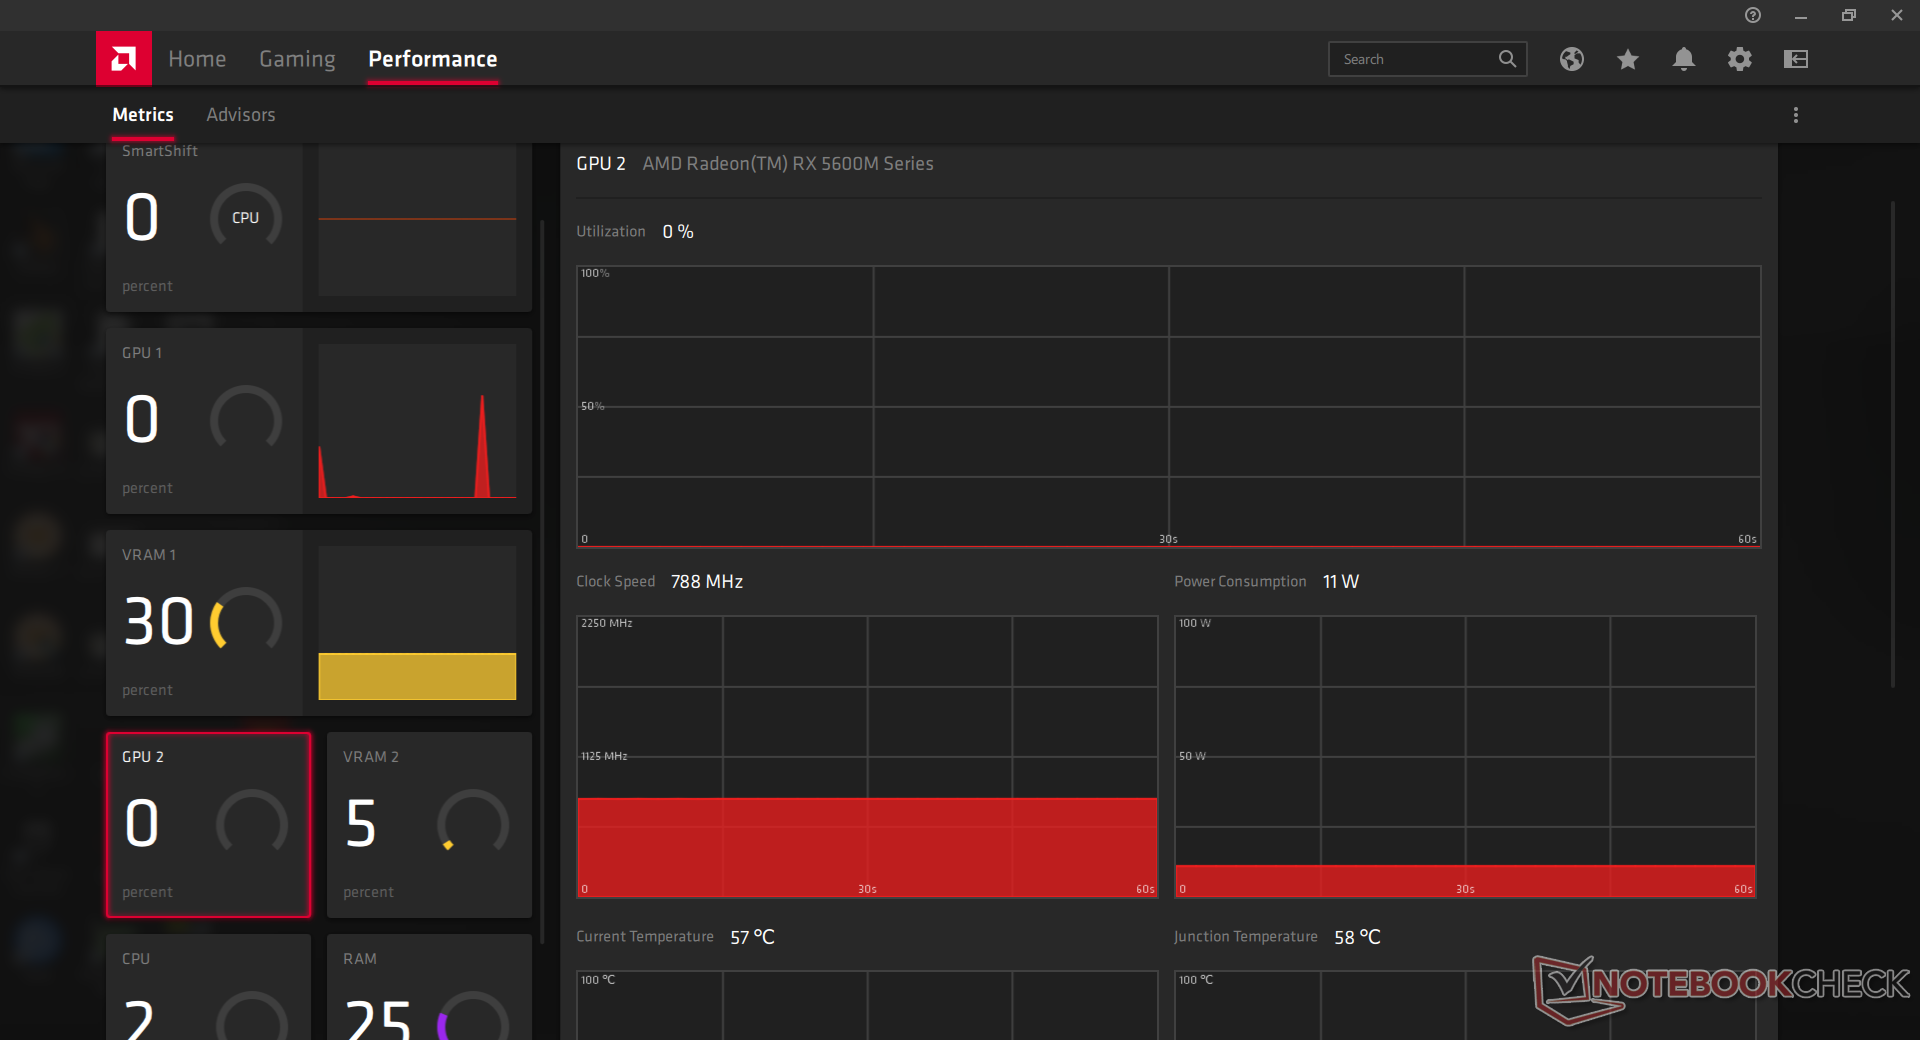
GPU Performance
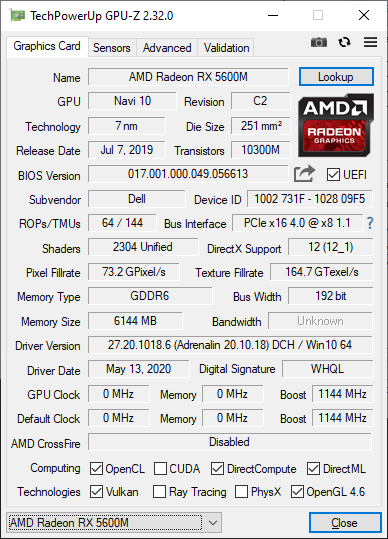
3DMark scores are approximately 45 percent faster than the Radeon RX 5500M to edge out the all-popular mobile GeForce RTX 2060. It's almost on par with the much more expensive RTX 2070 Max-Q. Laptops in this price range typically come with the GTX 1660 Ti instead which will be about 10 to 20 percent slower than our Navi 10 chip.
The main catch is that the AMD GPU offers no hardware-accelerated ray-tracing unlike on the RTX 2060. If such features are important to you, then GeForce RTX-based laptops will still offer more value.
| 3DMark 06 Standard Score | 38139 points | |
| 3DMark Vantage P Result | 18582 points | |
| 3DMark 11 Performance | 21400 points | |
| 3DMark Ice Storm Standard Score | 76143 points | |
| 3DMark Cloud Gate Standard Score | 36805 points | |
| 3DMark Fire Strike Score | 16652 points | |
| 3DMark Time Spy Score | 6610 points | |
Help | ||
Gaming Performance
Of course, 3DMark never tells the whole story. Real-world performance in games is most similar to the mobile GeForce RTX 2060 if not slightly lower by a few percentage points in most games. Still, it's a noticeable improvement over last year's Radeon RX 5500M.
See our dedicated page on the Radeon RX 5600M for more technical information and benchmark comparisons.
| Borderlands 3 - 1920x1080 Badass Overall Quality (DX11) | |
| MSI GE66 Raider 10SFS | |
| Lenovo Legion Y740-17IRH | |
| Average NVIDIA GeForce RTX 2060 Mobile (47.5 - 57.3, n=7) | |
| Asus Zephyrus G14 GA401IV | |
| Dell G5 15 SE 5505 P89F | |
| Eluktronics RP-15 | |
| NVIDIA GeForce GTX 1060 | |
| MSI Bravo 17 A4DDR | |
| Acer Nitro 5 AN515-44-R5FT | |
| Razer Blade Stealth Core i7 GTX 1650 Ti Max-Q 4K | |
| Asus ZenBook 15 UX534FTC-A8190T | |
| MSI Prestige 14 A10RD | |
Idling on Witcher 3 shows steady frame rates except towards the end where frame rates jarringly jumped between ~85 FPS to ~95 FPS for seemingly no reason.
| low | med. | high | ultra | |
| The Witcher 3 (2015) | 266.4 | 103.6 | 66.1 | |
| Dota 2 Reborn (2015) | 124 | 119 | 106 | 102 |
| X-Plane 11.11 (2018) | 48.2 | 37.6 | 33.7 | |
| Shadow of the Tomb Raider (2018) | 122 | 89 | 83 | 68 |
| Assassin´s Creed Odyssey (2018) | 78 | 67 | 60 | 49 |
| Apex Legends (2019) | 143.7 | 137.1 | 110.7 | 104.1 |
| Far Cry New Dawn (2019) | 91 | 77 | 74 | 67 |
| Metro Exodus (2019) | 146.4 | 75.5 | 55.2 | 44.9 |
| Dirt Rally 2.0 (2019) | 215 | 135 | 113.6 | 77.3 |
| The Division 2 (2019) | 129 | 93 | 75 | 57 |
| Anno 1800 (2019) | 80.4 | 79.1 | 63.5 | 40 |
| Total War: Three Kingdoms (2019) | 196.8 | 96.9 | 64.9 | 44.2 |
| F1 2019 (2019) | 191 | 140 | 114 | 106 |
| Control (2019) | 176.7 | 72.3 | 53.1 | |
| Borderlands 3 (2019) | 105.2 | 81.7 | 61.2 | 47.8 |
| Ghost Recon Breakpoint (2019) | 96 | 76 | 68 | 50 |
| GRID 2019 (2019) | 186.2 | 134.3 | 116.6 | 88.6 |
| Need for Speed Heat (2019) | 86.9 | 76.6 | 70.1 | 60.1 |
| Star Wars Jedi Fallen Order (2019) | 76 | 68.4 | 67.1 | |
| Hunt Showdown (2020) | 150.7 | 91.3 | 66.2 | |
| Doom Eternal (2020) | 232.3 | 144.7 | 124 | 114.6 |
| Gears Tactics (2020) | 137.8 | 135.7 | 96.1 | 70.6 |
Emissions
System Noise
Fan noise is both surprisingly quiet and way too loud depending on the workload. When browsing or playing video on the Power Saver or Balanced profiles, the fans will almost always be silent. In fact, we had to run the first benchmark scene of 3DMark 06 twice just to trigger the fans up to 32 dB(A). The G5 15 SE is one of the quieter gaming laptops in this regard.
When gaming, however, "quiet" immediately goes out the window. Fan noise will jump to 39 dB(A) before eventually stabilizing at 50.6 dB(A) to be very close to what we recorded on the Dell G5 15 5590 or Asus TUF A15 FA506IV. The G5 15 SE doesn't run any quieter than many of its closest competitors when under high loads.
| Dell G5 15 SE 5505 P89F Radeon RX 5600M, R7 4800H, Samsung PM991 MZ9LQ512HALU | Dell G5 15 5590-P8RVW GeForce RTX 2070 Max-Q, i7-9750H, SK Hynix BC501 HFM512GDJTNG | Asus TUF Gaming A15 FA506IV-HN172 GeForce RTX 2060 Mobile, R7 4800H, Kingston OM8PCP3512F-AB | HP Omen 15-dc1020ng GeForce GTX 1650 Mobile, i5-9300H, WDC PC SN720 SDAQNTW-512G | MSI Alpha 15 A3DDK-034 Radeon RX 5500M, R7 3750H, Kingston RBUSNS8154P3512GJ | Lenovo Legion Y740-15ICHg GeForce RTX 2070 Max-Q, i7-9750H, WDC PC SN520 SDAPMUW-128G | |
|---|---|---|---|---|---|---|
| Noise | -20% | -10% | 0% | -32% | -10% | |
| off / environment * | 28 | 30 -7% | 30.2 -8% | 28.8 -3% | 29 -4% | 30 -7% |
| Idle Minimum * | 28 | 32 -14% | 30.2 -8% | 28.8 -3% | 36 -29% | 31.3 -12% |
| Idle Average * | 28 | 33 -18% | 30.2 -8% | 29.5 -5% | 37 -32% | 31.3 -12% |
| Idle Maximum * | 28 | 34 -21% | 30.2 -8% | 31.1 -11% | 46 -64% | 31.3 -12% |
| Load Average * | 28 | 50 -79% | 40 -43% | 35.2 -26% | 50 -79% | 42 -50% |
| Witcher 3 ultra * | 50.6 | 50 1% | 49 3% | 35.2 30% | 51 -1% | 42.1 17% |
| Load Maximum * | 50.6 | 52 -3% | 49 3% | 41 19% | 57 -13% | 46.5 8% |
* ... smaller is better
Noise Level
| Idle |
| 28 / 28 / 28 dB(A) |
| Load |
| 28 / 50.6 dB(A) |
 | ||
30 dB silent 40 dB(A) audible 50 dB(A) loud |
||
min: | ||
Temperature
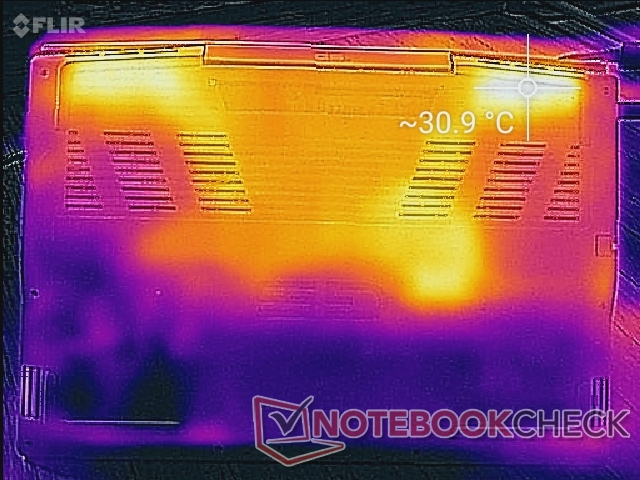
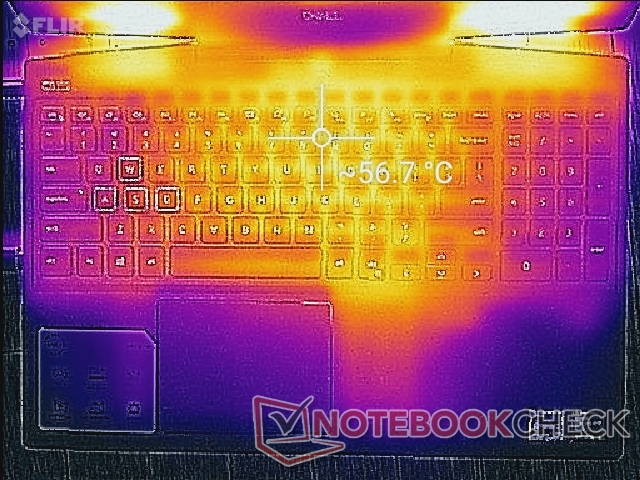
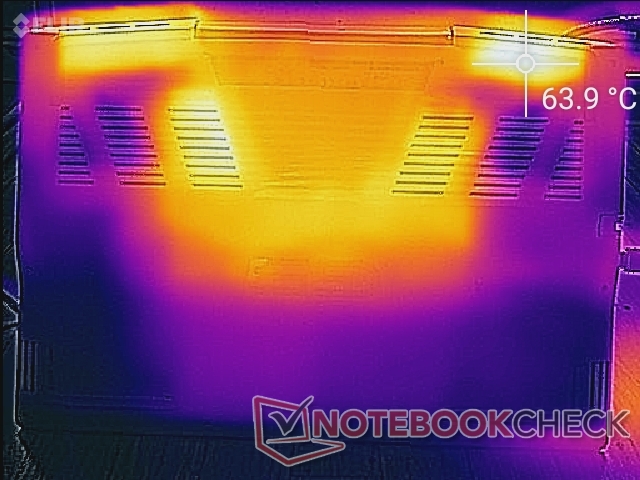
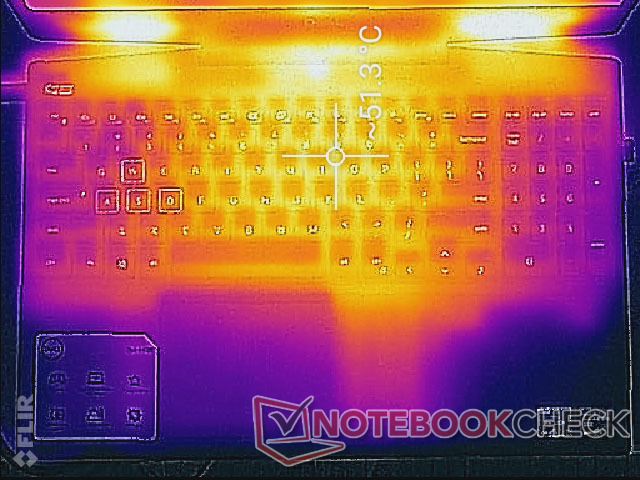
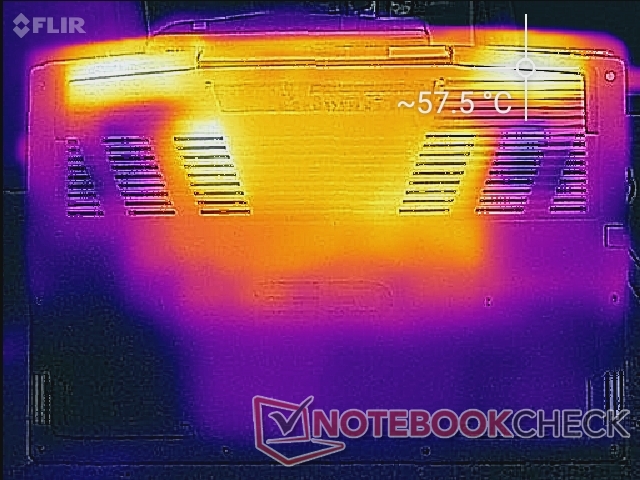
Surface temperatures are not anything to write home about. When gaming, hot spots can become as warm as 56 C to even 64 C as shown by our temperature maps below. These areas are thankfully towards the rear or keyboard center away from the palms rests and WASD keys. Even so, this is one of the warmer 15.6-inch gaming laptops we've seen. The competing Asus TUF A15, for example, runs warm as well but certainly not as hot as the Dell when under similar conditions.
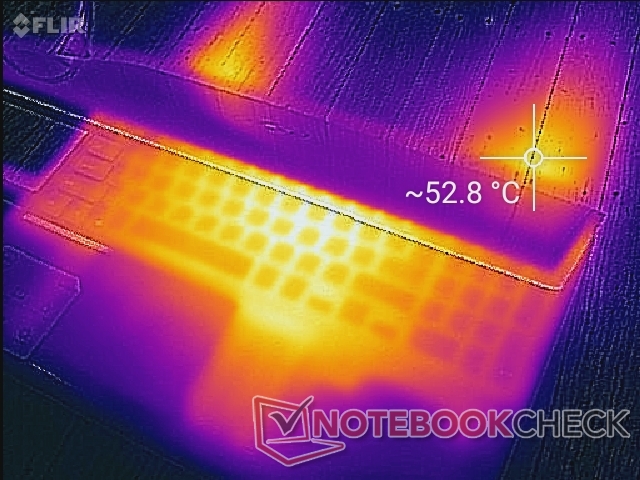
(-) The maximum temperature on the upper side is 53 °C / 127 F, compared to the average of 40.4 °C / 105 F, ranging from 21.2 to 68.8 °C for the class Gaming.
(-) The bottom heats up to a maximum of 57.6 °C / 136 F, compared to the average of 43.2 °C / 110 F
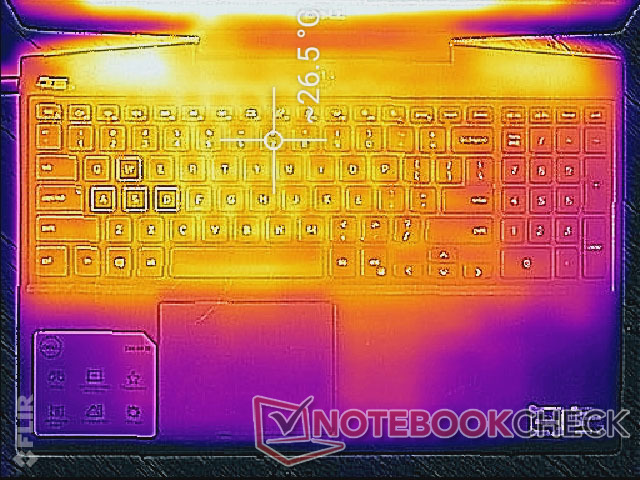
(+) In idle usage, the average temperature for the upper side is 25.4 °C / 78 F, compared to the device average of 33.8 °C / 93 F.
(-) Playing The Witcher 3, the average temperature for the upper side is 44.2 °C / 112 F, compared to the device average of 33.8 °C / 93 F.
(±) The palmrests and touchpad can get very hot to the touch with a maximum of 37.2 °C / 99 F.
(-) The average temperature of the palmrest area of similar devices was 28.9 °C / 84 F (-8.3 °C / -15 F).
Stress Test
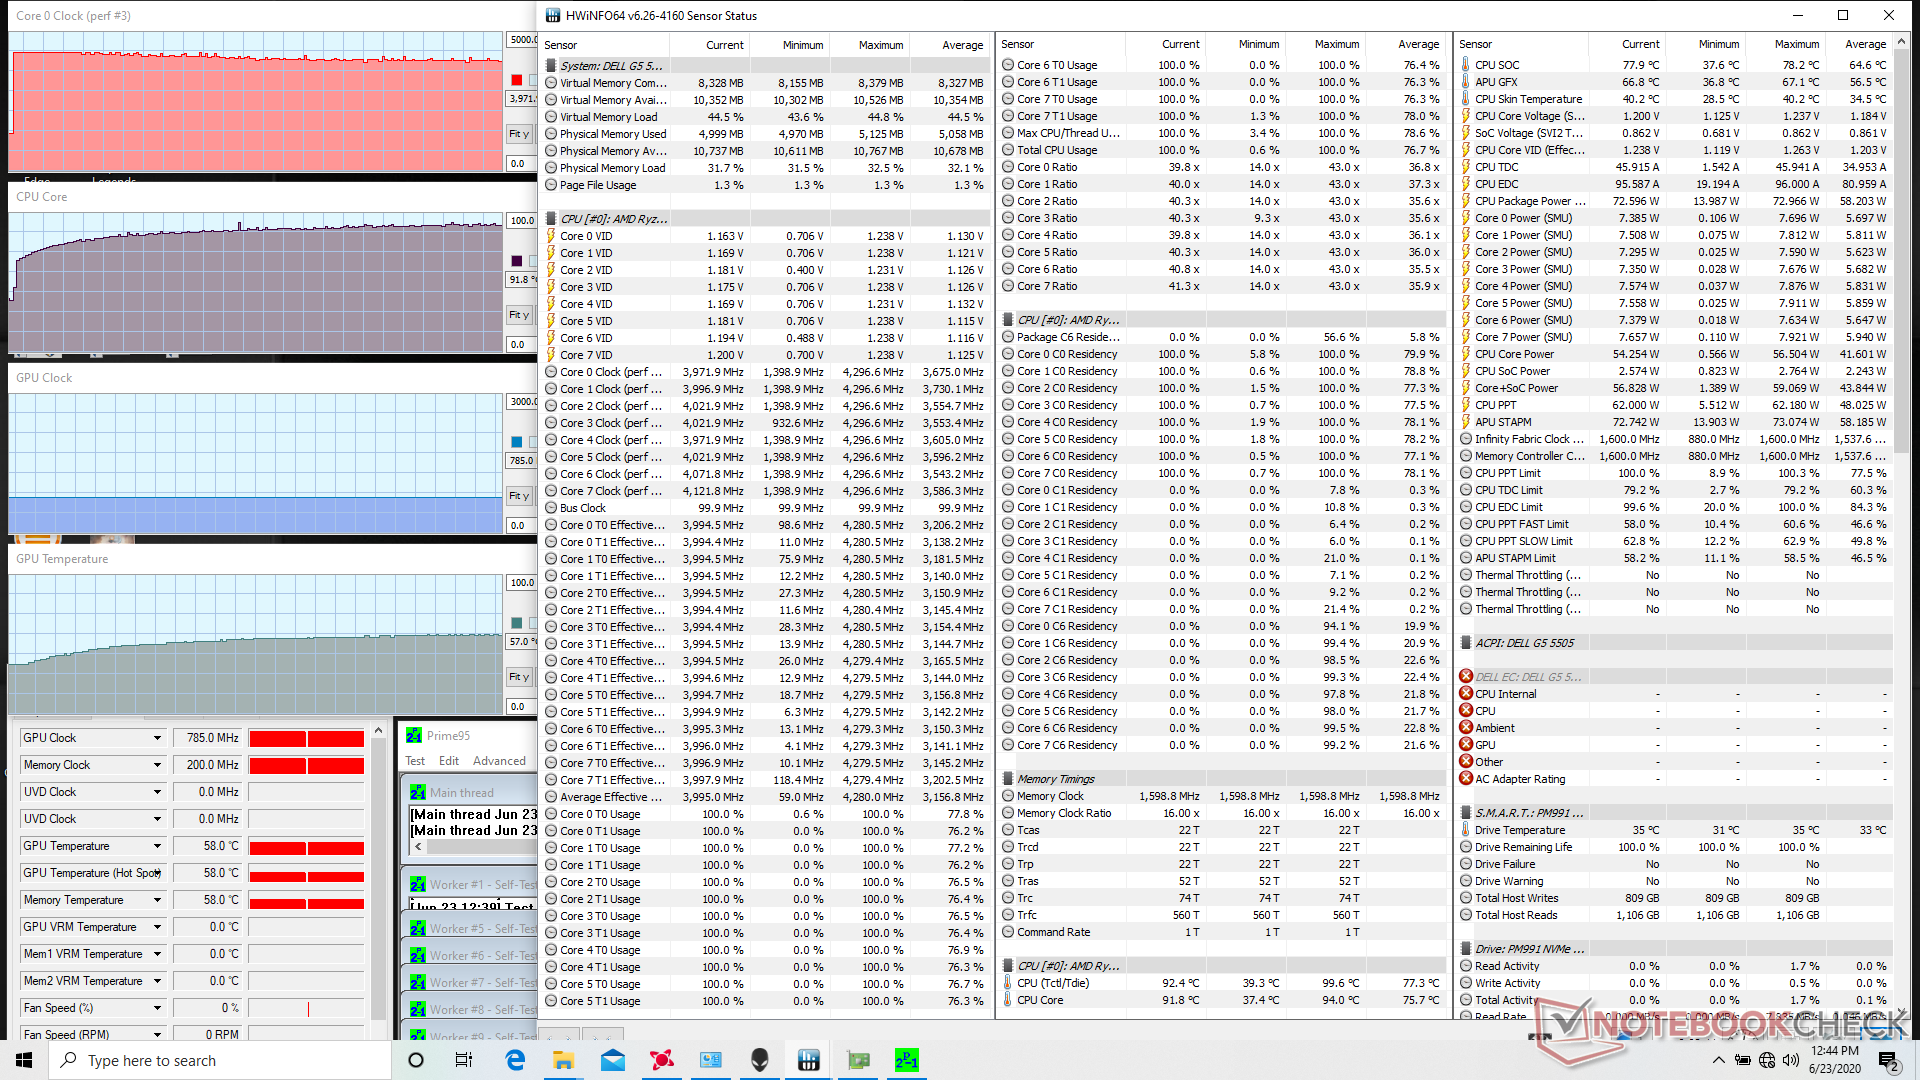
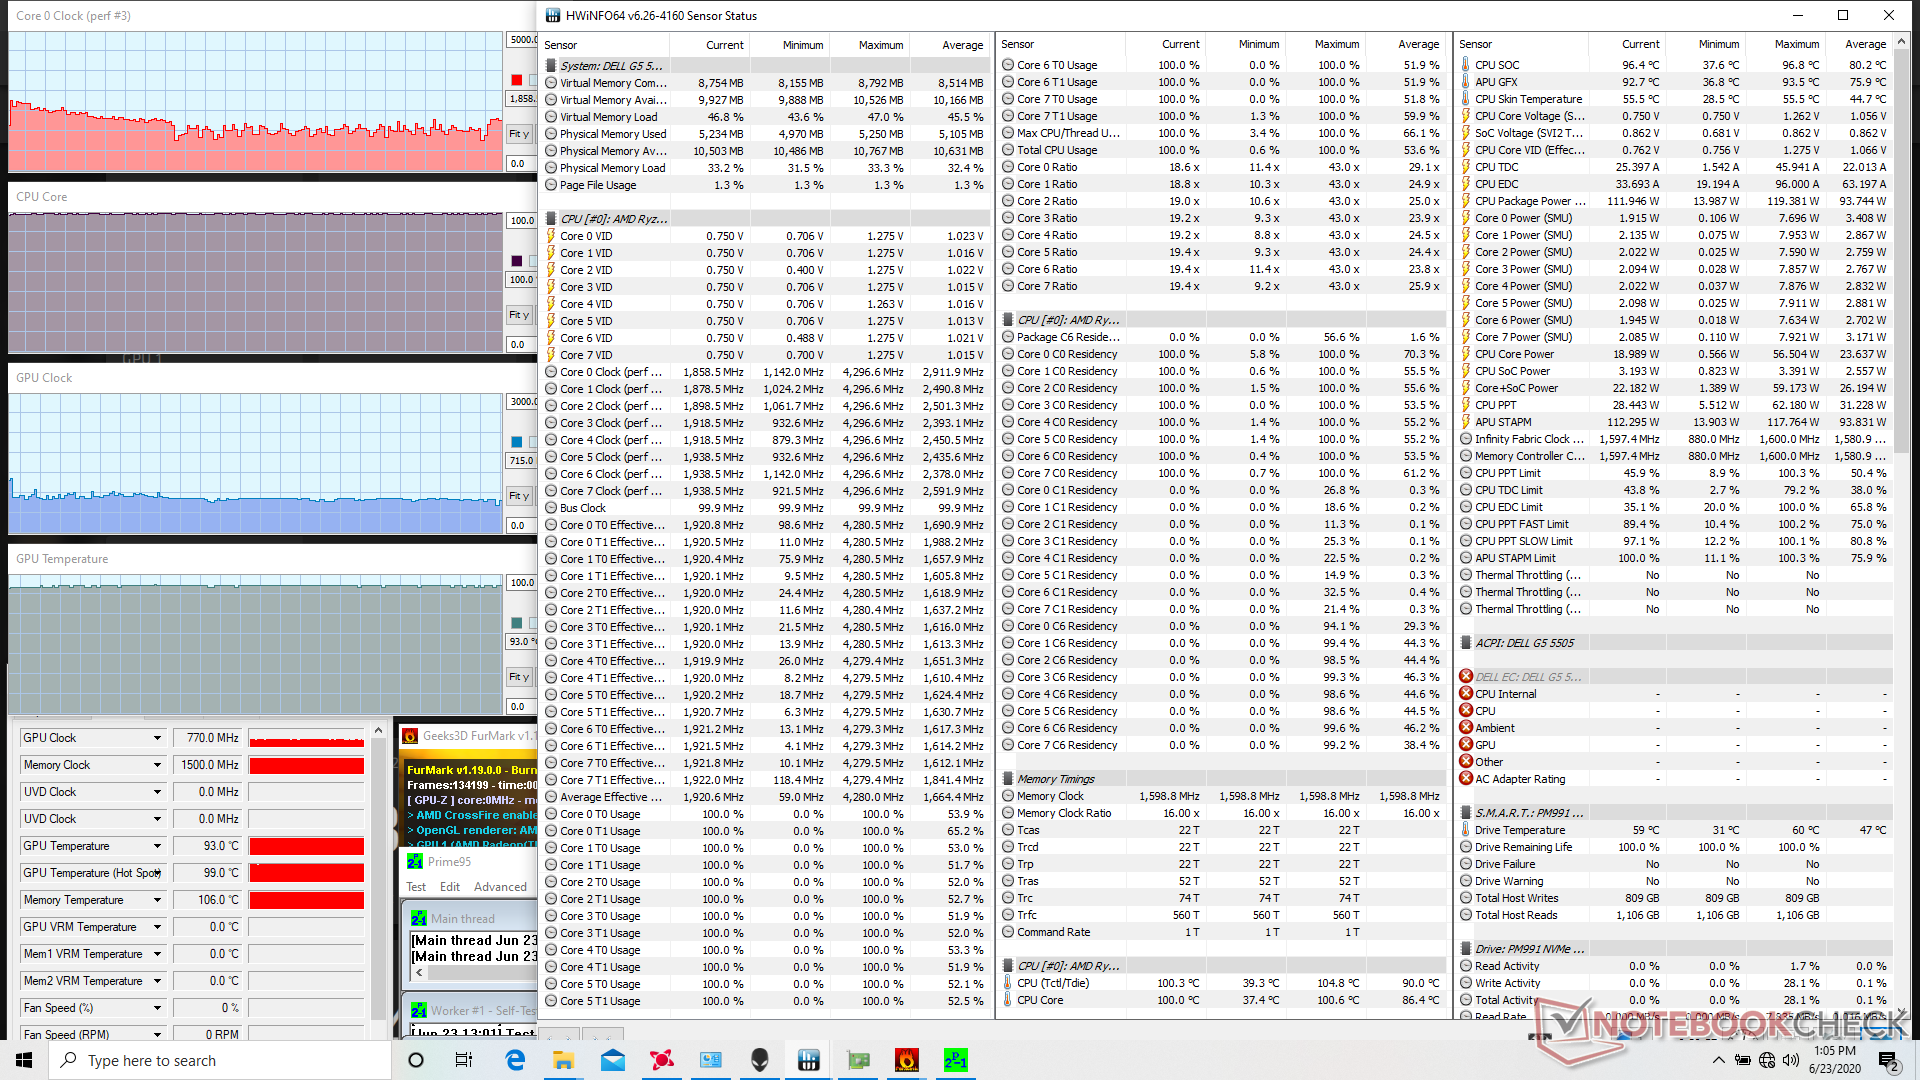
We stress the system with synthetic loads to look for any potential stability or throttling issues. When running Prime95, the CPU can be observed boosting to 4.3 GHz for the first minute or so until stabilizing at 4 GHz and at a very warm core temperature of 92 C. Though the high CPU performance sustainability is appreciated, the high core temperature will likely turn off a lot of enthusiasts.
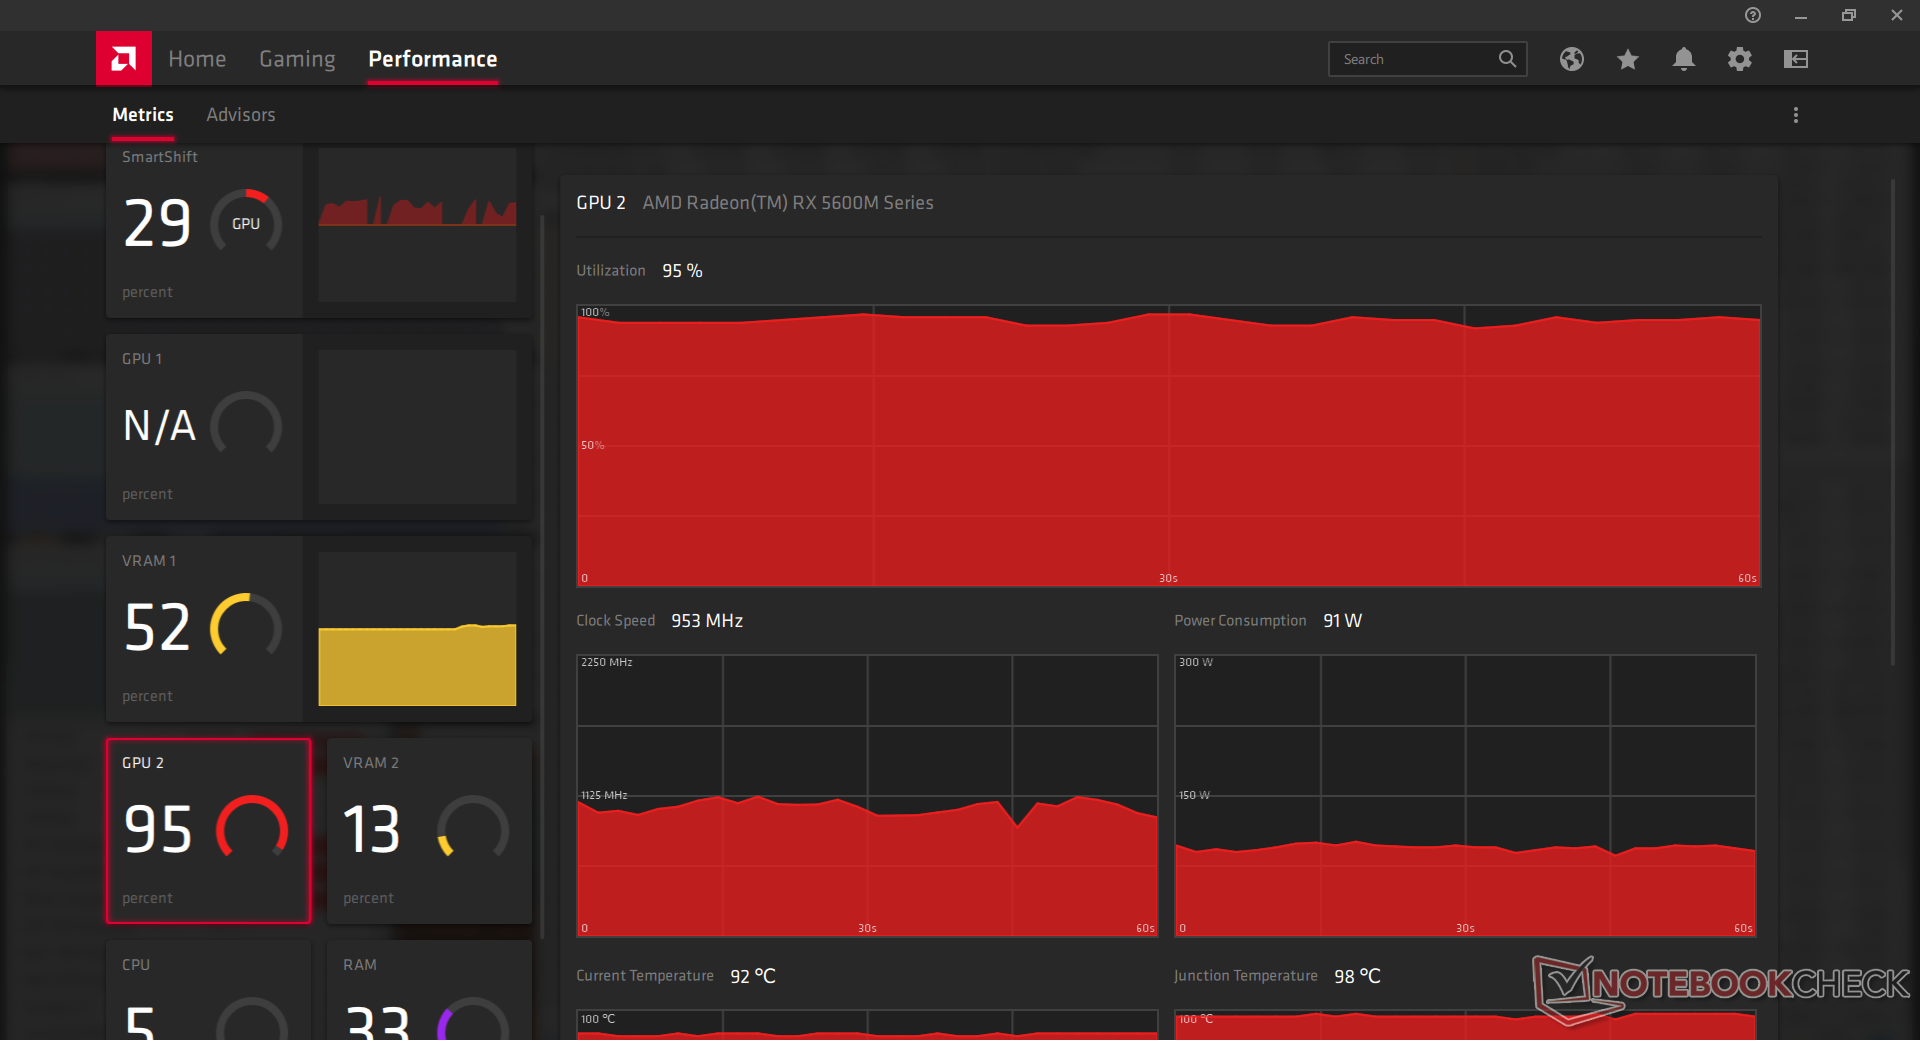
Temperature results are unfortunately similar when gaming. Running Witcher 3, for example, causes the CPU and GPU to stabilize at 99 C and 93 C, respectively, to be much warmer than expected. These readings also explain the very warm surface temperatures we recorded above. Other 15.6-inch gaming laptops with comparable GeForce GTX 1660 Ti graphics are able to run cooler than our Dell. The Razer Blade 15 Base Model and Maingear Vector 15, for example, each hover around the low to mid 80 C range when under the same gaming loads.
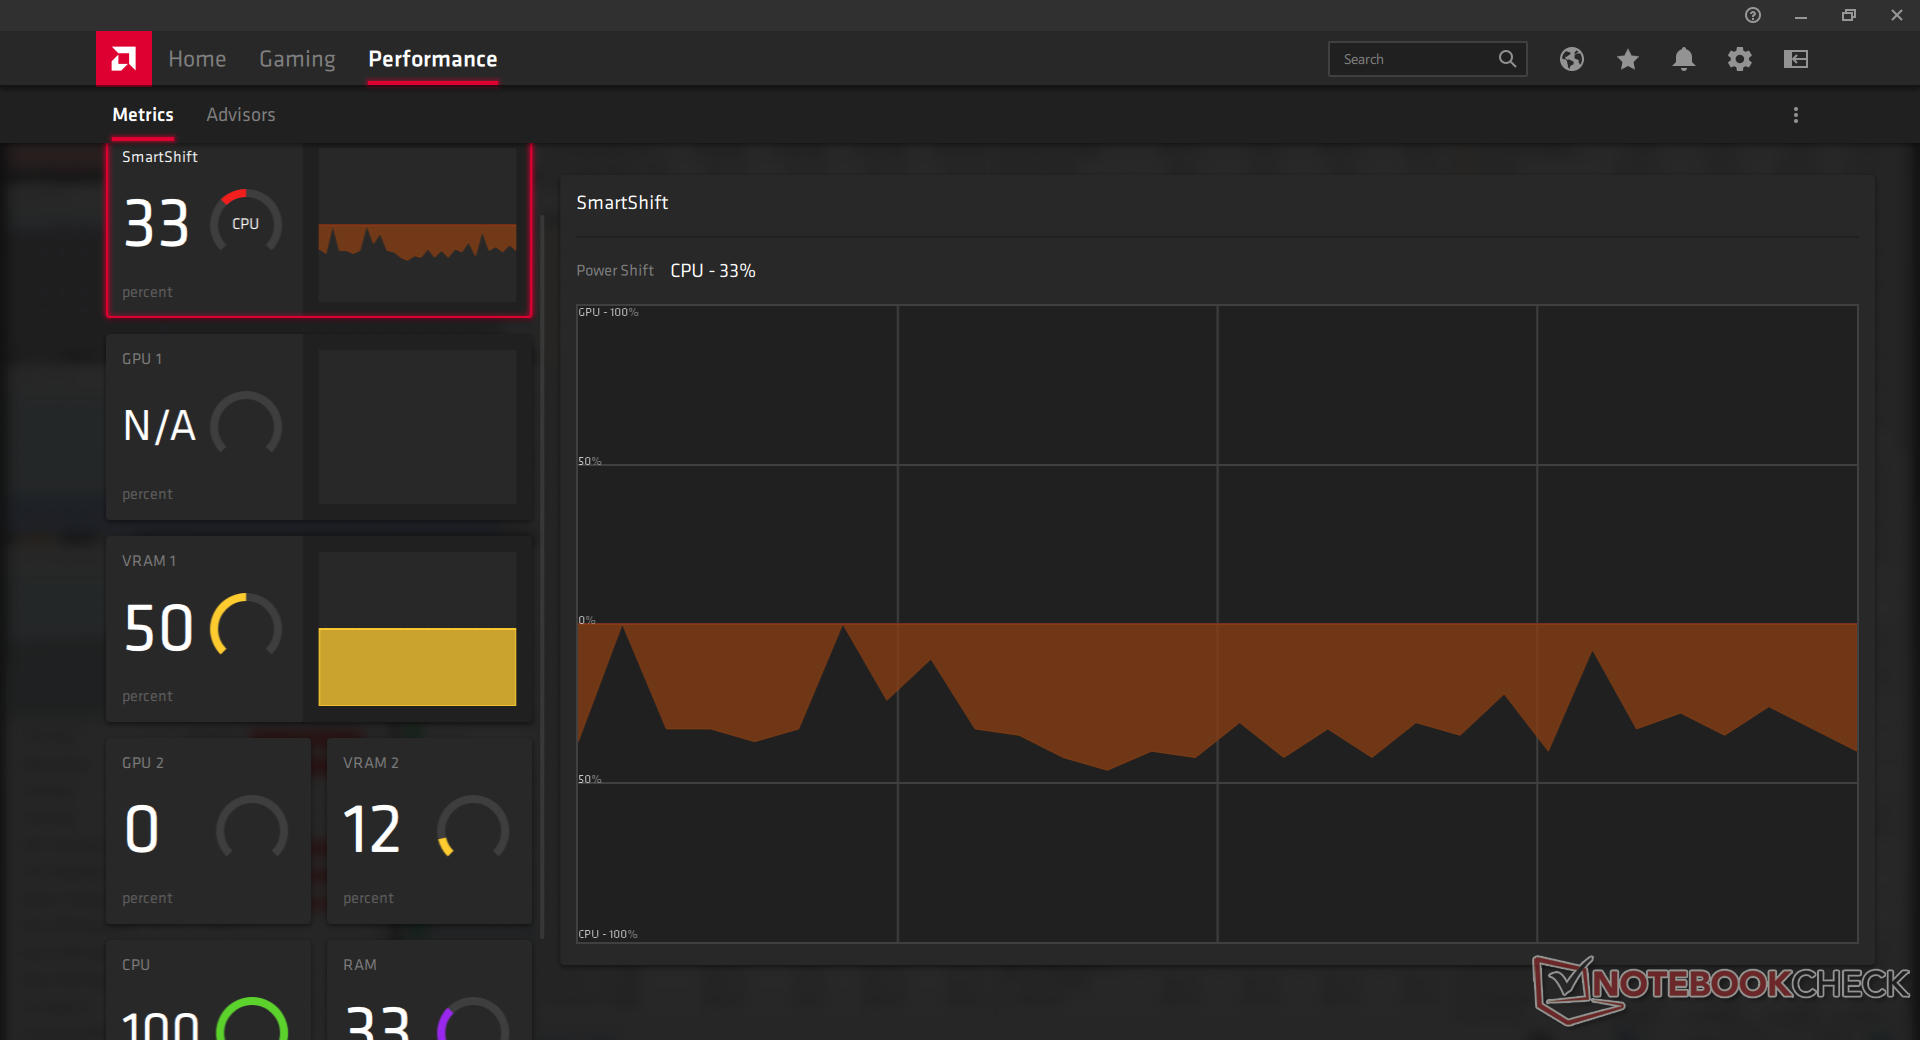
Running on battery power will limit performance especially because the system will automatically switch to the integrated Radeon GPU when disconnected from AC power. A Fire Strike test on batteries returns Physics and Graphics scores of 20266 and 3613 points, respectively, compared to 22299 and 18807 points when on mains.
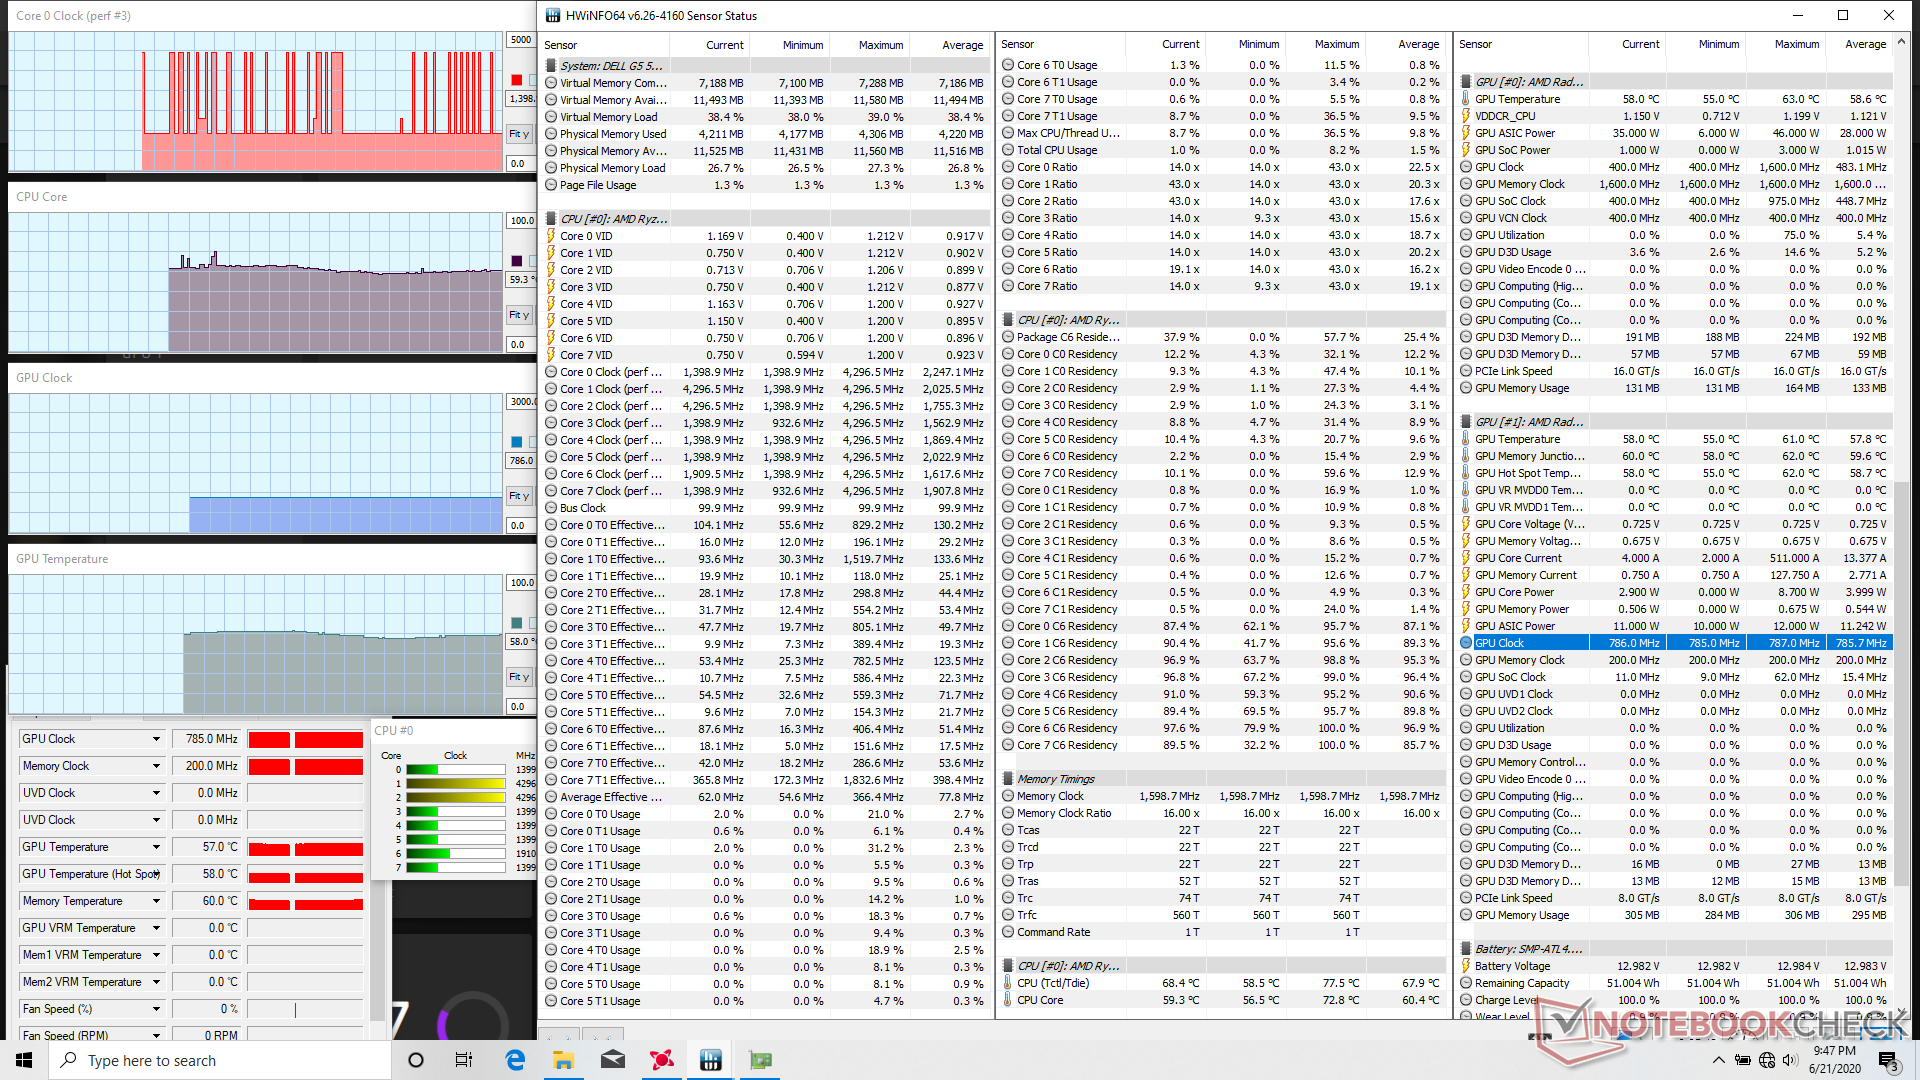
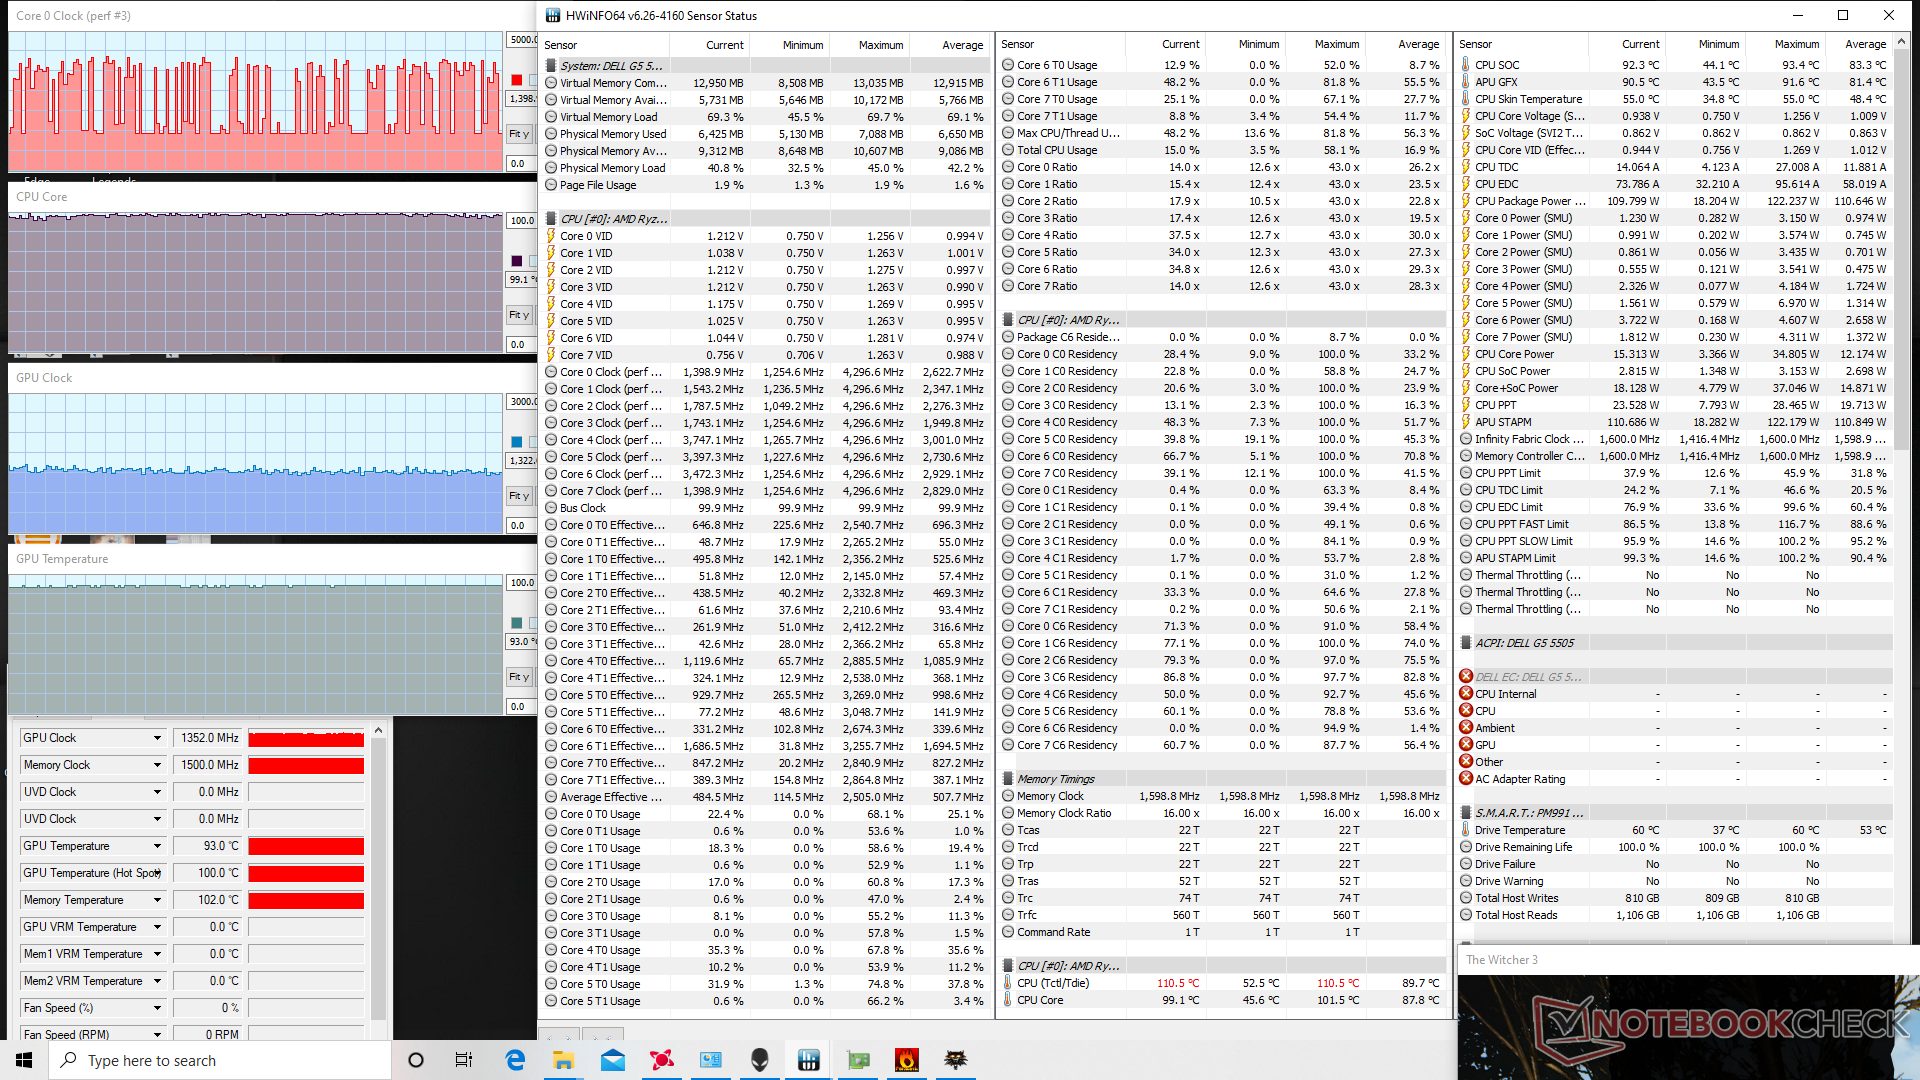
| CPU Clock (GHz) | GPU Clock (MHz) | Average CPU Temperature (°C) | Average GPU Temperature (°C) | |
| System Idle | -- | -- | 59 | 58 |
| Prime95 Stress | 4.0 | -- | 92 | 57 |
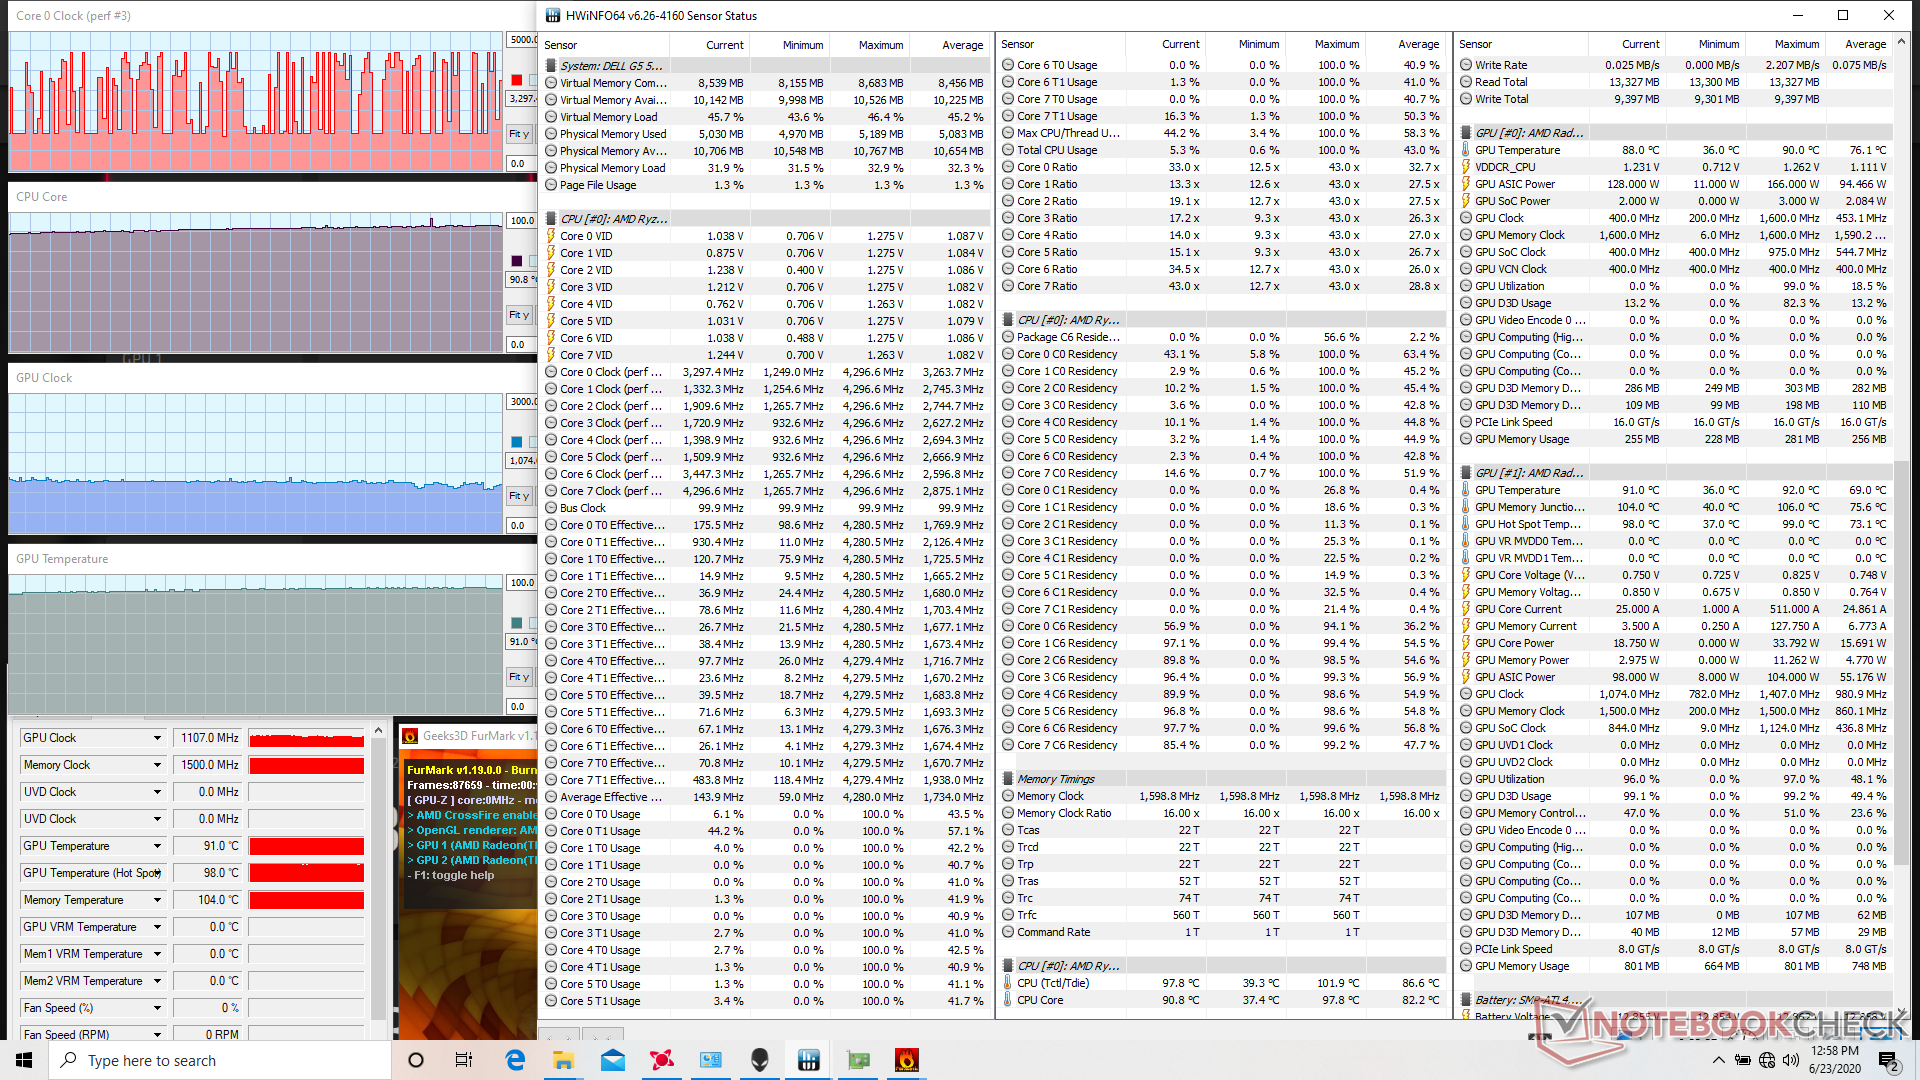
| FurMark Stress | -- | 1107 | 91 | 91 |
| Prime95 + FurMark Stress | ~1.5 | 770 | 100 | 93 |
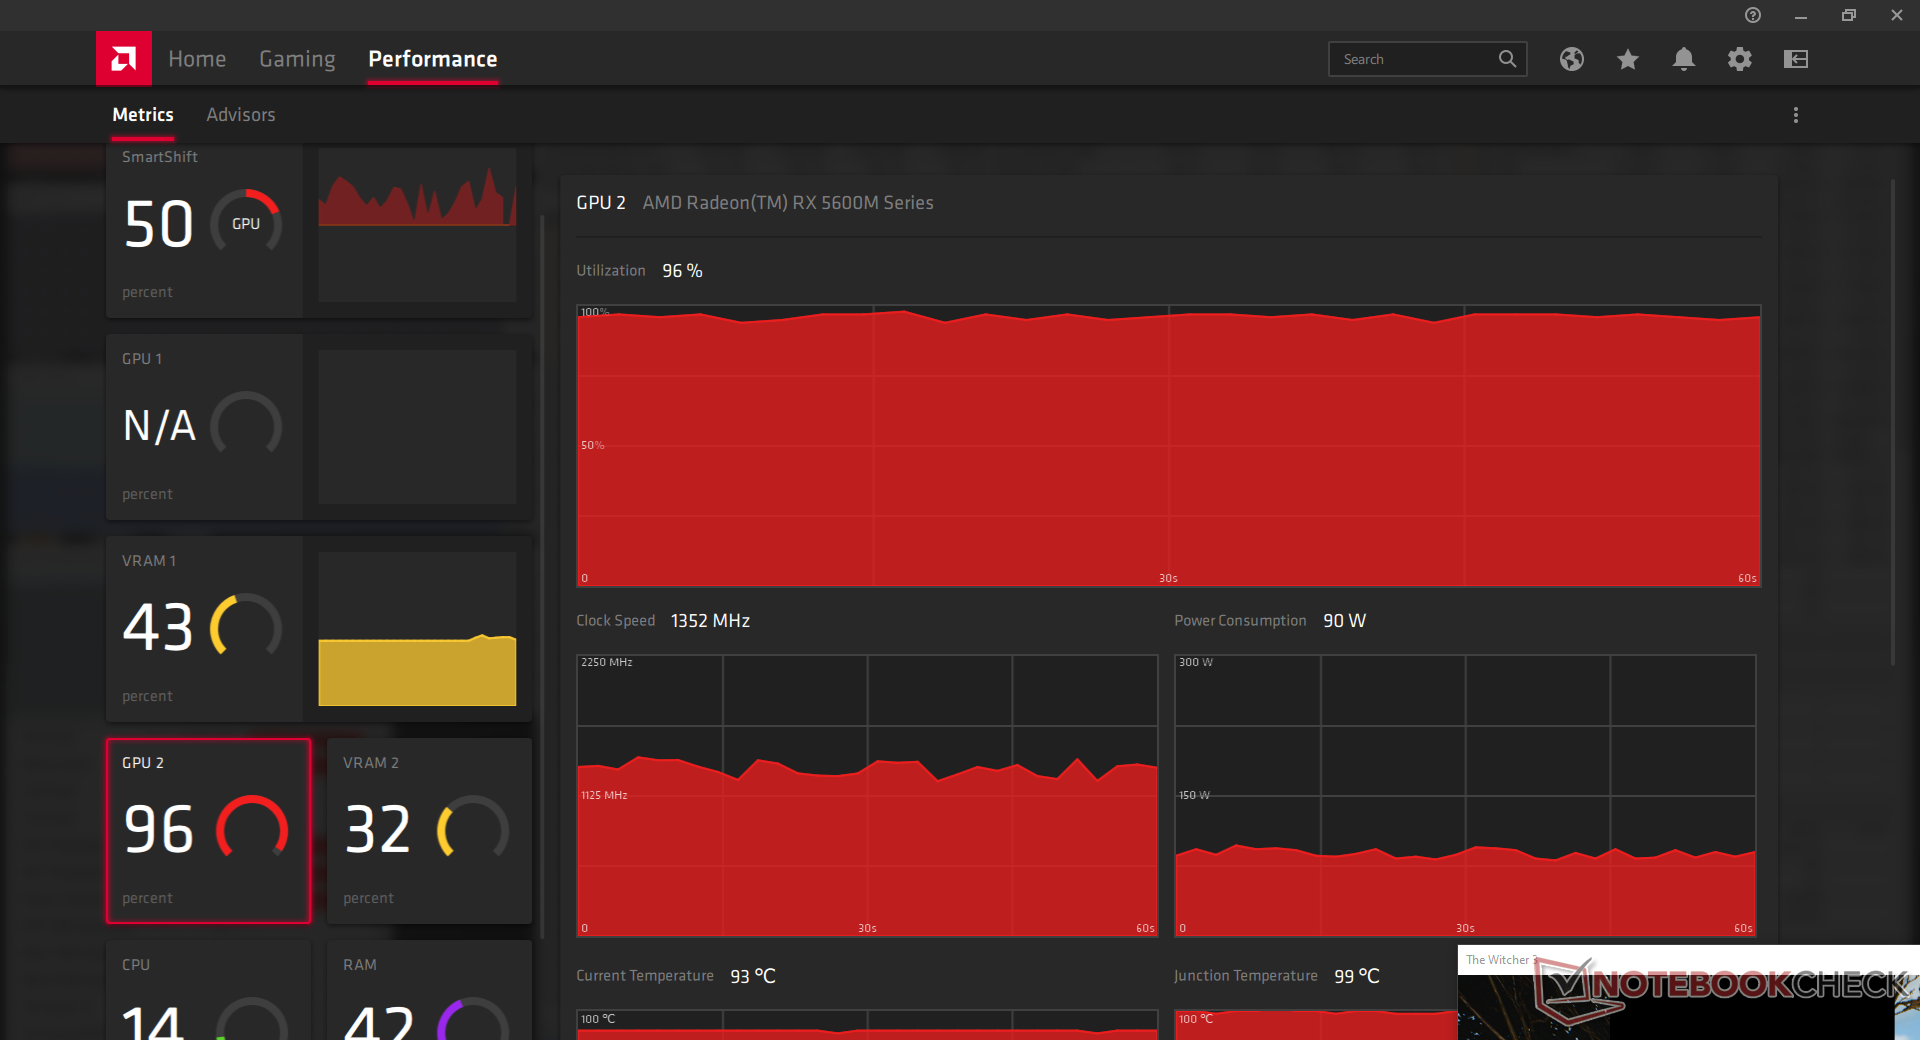
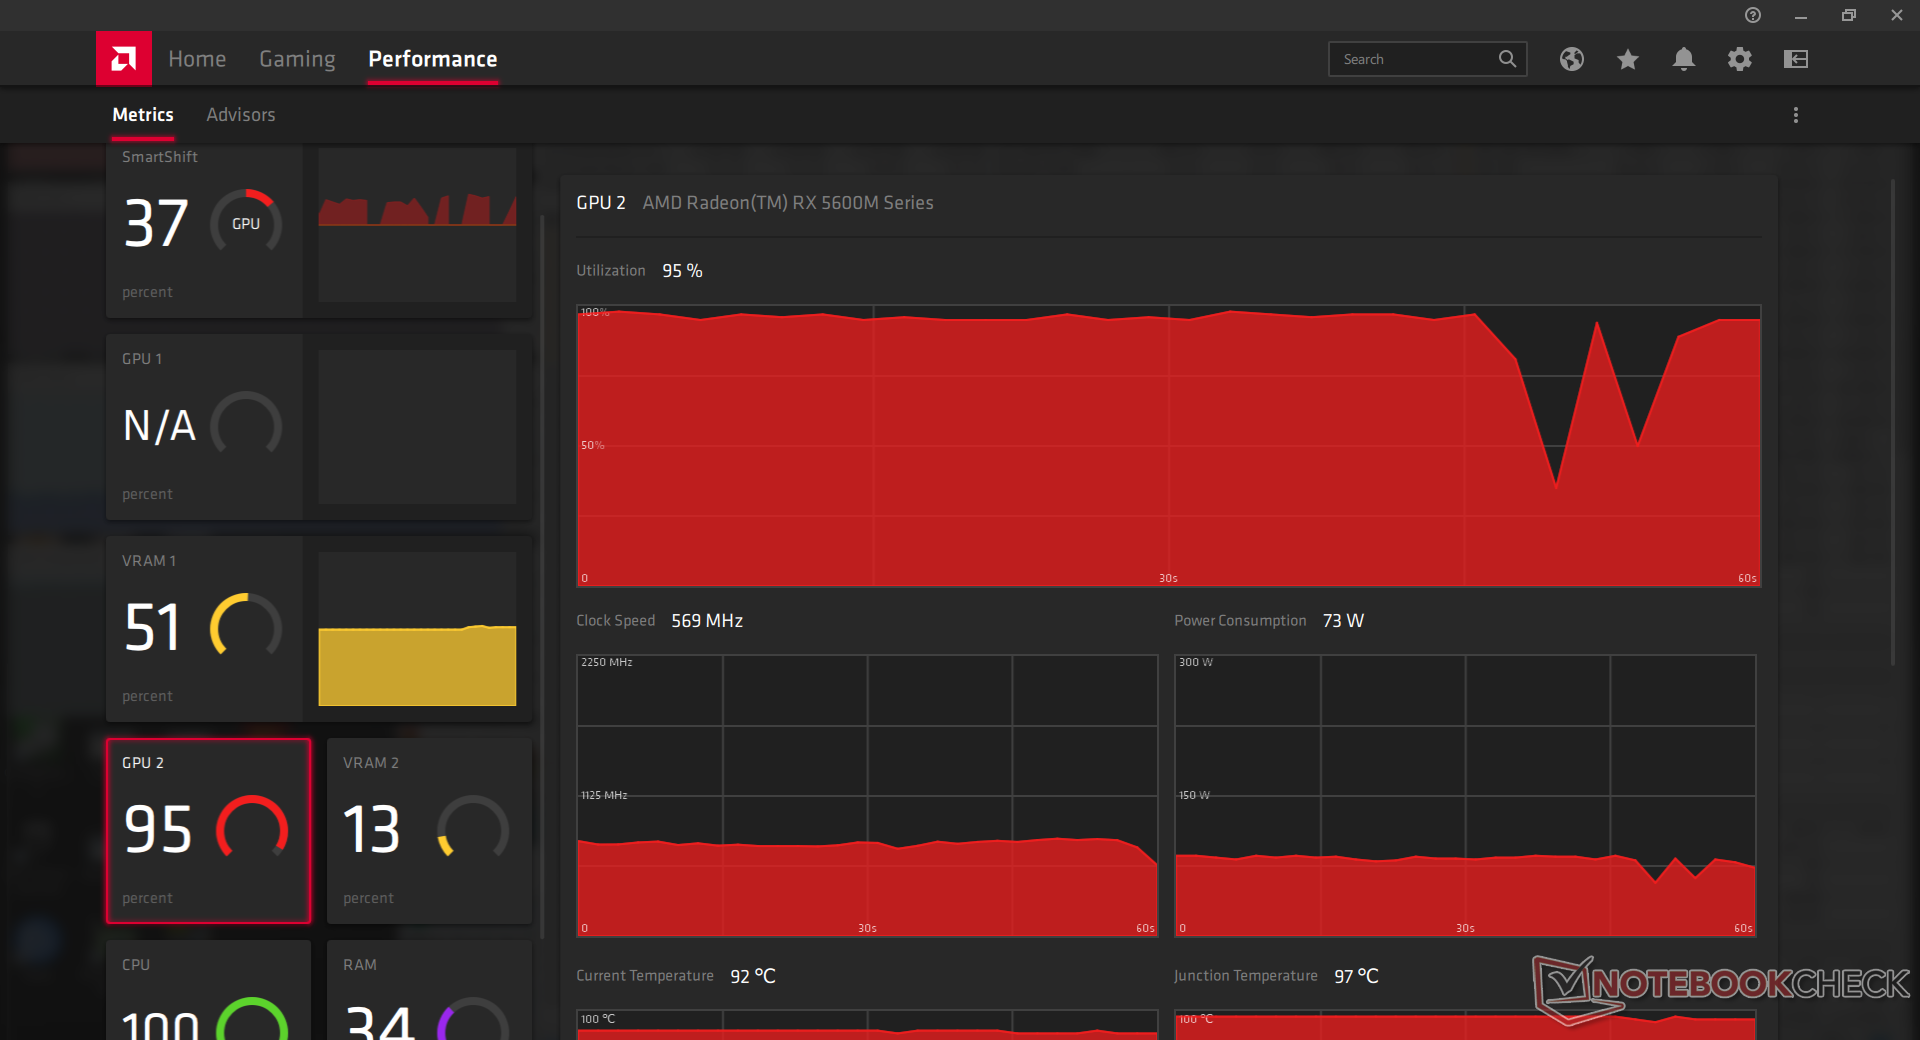
| Witcher 3 Stress | 1.4 - 3.0 | 1352 | 99 | 93 |
Speakers


Energy Management
Power Consumption
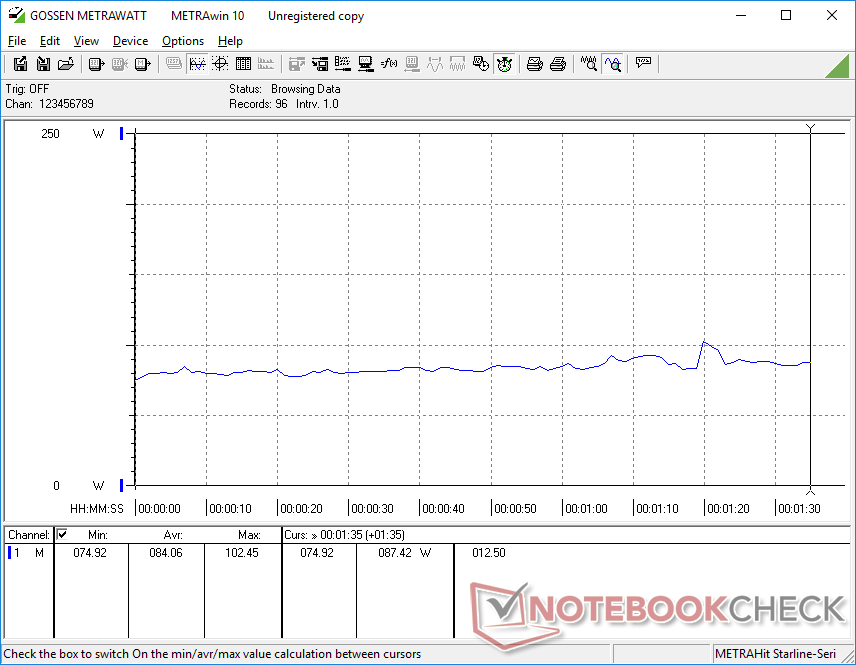
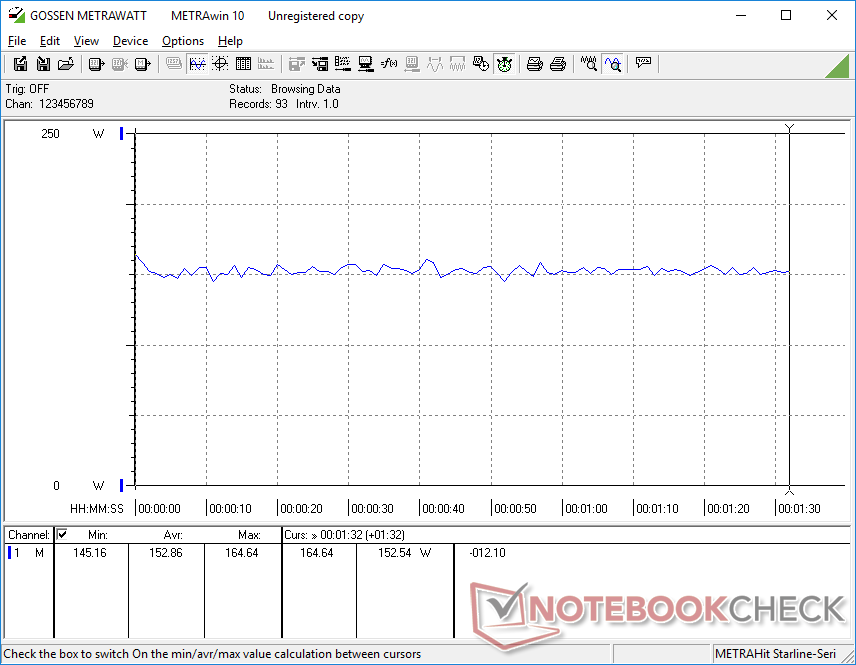
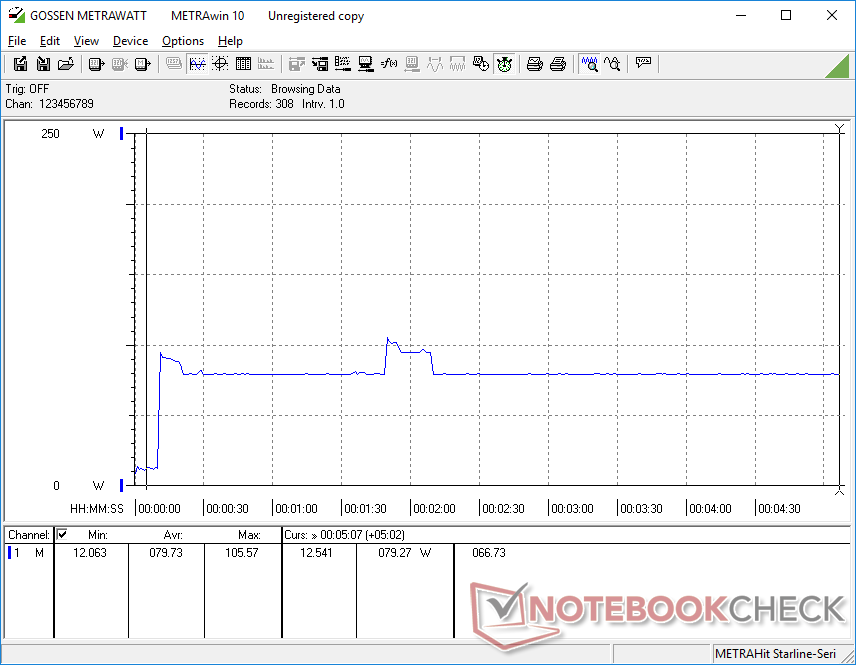
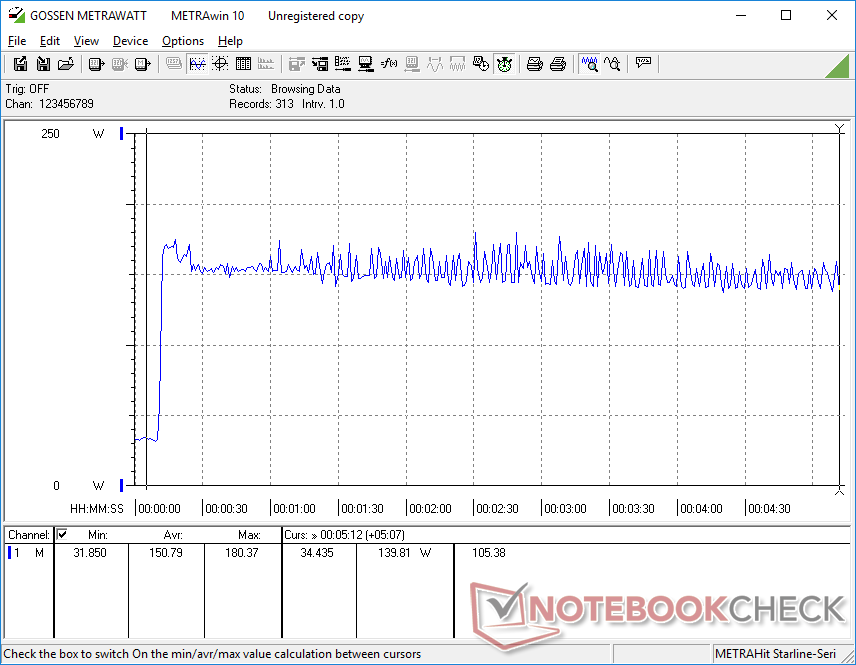
Nvidia laptops with the comparable GeForce RTX 2060 still have the performance-per-watt advantage. When running Witcher 3, for example, our Dell would consume an average of 153 W compared to 144 W and 134 W on the Asus TUF A15 FA506IV and Eluktronics RP-15, respectively, each with the same Ryzen 7 CPU but RTX 2060 GPU.
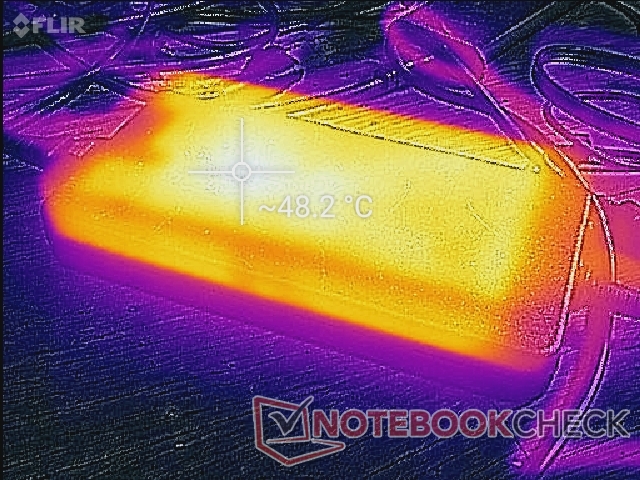
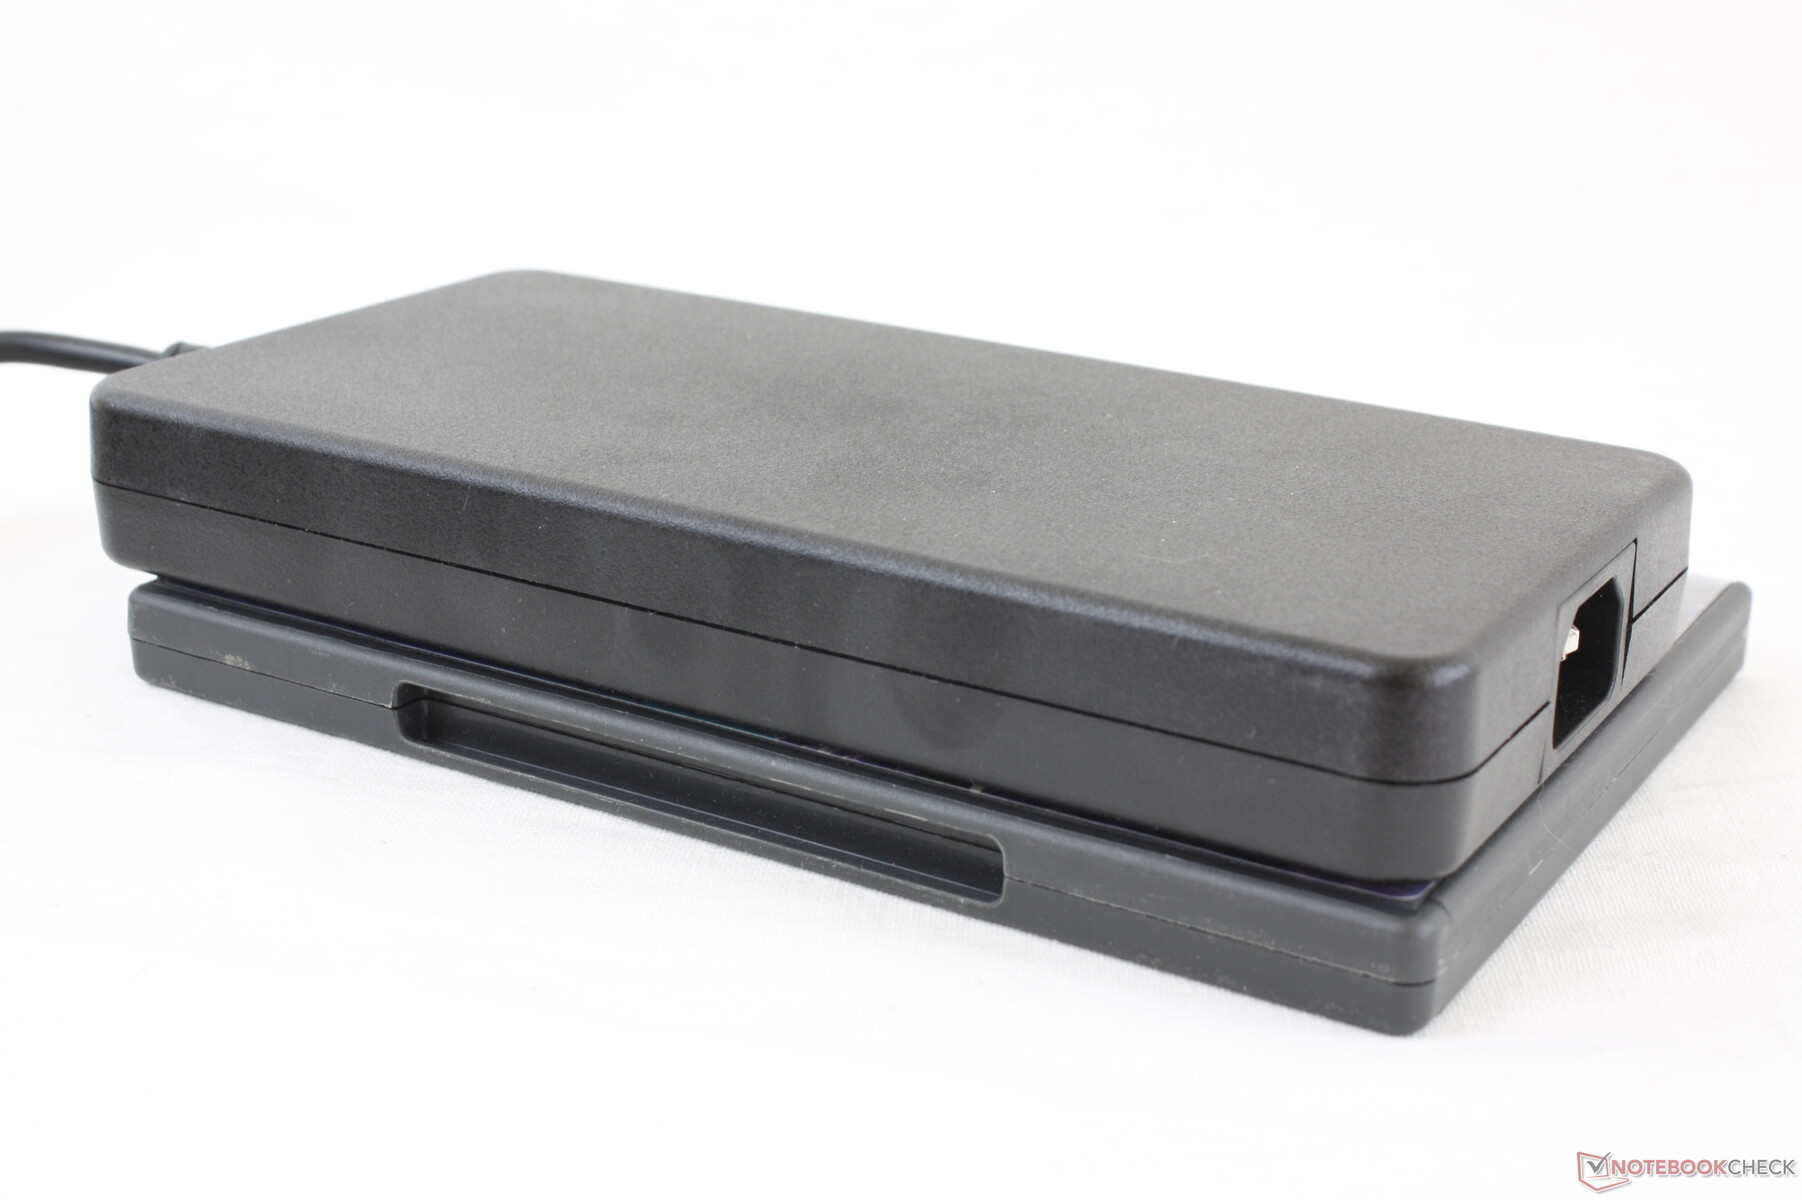
We're able to record a maximum demand of 180 W from the large (~20 x 10 x 2.9 cm) 240 W AC adapter. Dell could have probably went with a smaller and more portable adapter without having to compromise performance.
| Off / Standby | |
| Idle | |
| Load |
|
| Dell G5 15 SE 5505 P89F R7 4800H, Radeon RX 5600M, Samsung PM991 MZ9LQ512HALU, WVA, 1920x1080, 15.60 | Dell G5 15 5590-P8RVW i7-9750H, GeForce RTX 2070 Max-Q, SK Hynix BC501 HFM512GDJTNG, IPS, 1920x1080, 15.60 | Asus TUF Gaming A15 FA506IV-HN172 R7 4800H, GeForce RTX 2060 Mobile, Kingston OM8PCP3512F-AB, IPS, 1920x1080, 15.60 | HP Omen 15-dc1020ng i5-9300H, GeForce GTX 1650 Mobile, WDC PC SN720 SDAQNTW-512G, IPS, 1920x1080, 15.60 | MSI Alpha 15 A3DDK-034 R7 3750H, Radeon RX 5500M, Kingston RBUSNS8154P3512GJ, IPS, 1920x1080, 15.60 | SCHENKER XMG Core 15 GK5CP6V i7-9750H, GeForce GTX 1660 Ti Mobile, Samsung SSD 970 EVO Plus 500GB, IPS, 1920x1080, 15.60 | |
|---|---|---|---|---|---|---|
| Power Consumption | -24% | -1% | 22% | -57% | -16% | |
| Idle Minimum * | 6.5 | 5 23% | 5.4 17% | 4.04 38% | 14 -115% | 9 -38% |
| Idle Average * | 10.6 | 13 -23% | 10 6% | 7.2 32% | 18 -70% | 12 -13% |
| Idle Maximum * | 11 | 23 -109% | 10.5 5% | 11.4 -4% | 32 -191% | 18 -64% |
| Load Average * | 84.1 | 121 -44% | 135 -61% | 80.8 4% | 64 24% | 86 -2% |
| Witcher 3 ultra * | 152.9 | 133 13% | 144 6% | 93.6 39% | 123 20% | 126 18% |
| Load Maximum * | 180.4 | 184 -2% | 147 19% | 144.5 20% | 193 -7% | 173 4% |
* ... smaller is better
Battery Life
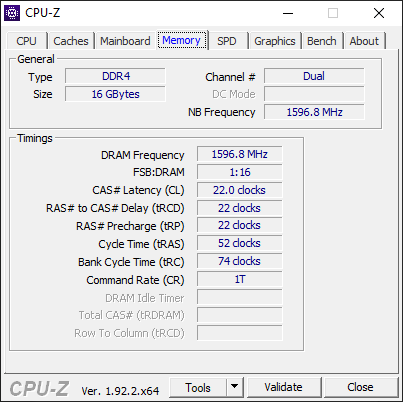
Two battery capacities are available: 51 Wh for the lower-end SKUs and 68 Wh for the higher-end SKUs. Our test unit comes with the 51 Wh option, but both are downgrades when compared to the 90 Wh option on the last generation G5 15 5590.
Runtimes are still slightly above average for a gaming laptop at just over 6 hours of real-world WLAN use despite the reduction in battery capacity. Charging from empty to full capacity, however, is slower than expected at 2 to 2.5 hours. The system cannot be recharged via USB-C.
| Dell G5 15 SE 5505 P89F R7 4800H, Radeon RX 5600M, 51 Wh | Dell G5 15 5590-P8RVW i7-9750H, GeForce RTX 2070 Max-Q, 90 Wh | Asus TUF Gaming A15 FA506IV-HN172 R7 4800H, GeForce RTX 2060 Mobile, 48 Wh | HP Omen 15-dc1020ng i5-9300H, GeForce GTX 1650 Mobile, 52.5 Wh | MSI Alpha 15 A3DDK-034 R7 3750H, Radeon RX 5500M, 51 Wh | Lenovo Legion Y740-15ICHg i7-9750H, GeForce RTX 2070 Max-Q, 57 Wh | |
|---|---|---|---|---|---|---|
| Battery Runtime | -8% | 6% | 9% | -42% | -52% | |
| Reader / Idle | 671 | 513 -24% | 587 -13% | 951 42% | 349 -48% | |
| WiFi v1.3 | 372 | 344 -8% | 370 -1% | 385 3% | 245 -34% | 179 -52% |
| Load | 87 | 95 9% | 116 33% | 71 -18% | 49 -44% | |
| Witcher 3 ultra | 59 |
Pros
Cons
Verdict
A 15.6-inch gaming laptop with Core i7-9750H CPU and GeForce RTX 2060 GPU will typically run about $1200 USD. The all-AMD Dell G5 15 SE can be configured with the Ryzen 5 4600H CPU and Radeon RX 5600M GPU for very similar results for about $300 less. Performance-per-dollar is therefore the biggest advantage of the system in a market still dominated by Intel-Nvidia options.
There are notable disadvantages to keep in mind with temperature and fan noise being the most striking. Warm processors are expected from gaming laptops, but when you're reaching ~95 C when gaming with fans on full blast, this doesn't leave very strong first impressions especially in regard to the longevity of the system.
Other drawbacks relate mostly to the inexpensive price point. The noticeable backlight bleeding, USB 2.0 ports, lack of adaptive sync on 60 Hz options, and all-plastic chassis are the usual compromises on most ~$1000 gaming laptops. From a performance, serviceability, and display perspective, however, these features could easily be part of a laptop retailing for several hundreds more.
It's a lot of power for not a lot of money. Users will want to keep in mind that the impressive performance comes at the cost of both very warm temperatures and loud fans as a result.
Dell G5 15 SE 5505 P89F
-
06/24/2020 v7
Allen Ngo


Pricecompare
