 Deutsch
 English
 Español
 Français
 Italiano
 Nederlands
 Polski
 Português
 Русский
 Türkçe
 Svenska
 Chinese
 Magyar
Asus ROG Zephyrus G15 laptop review: Eye-catcher
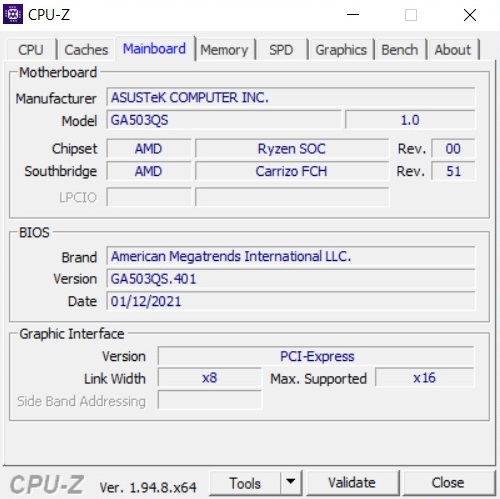
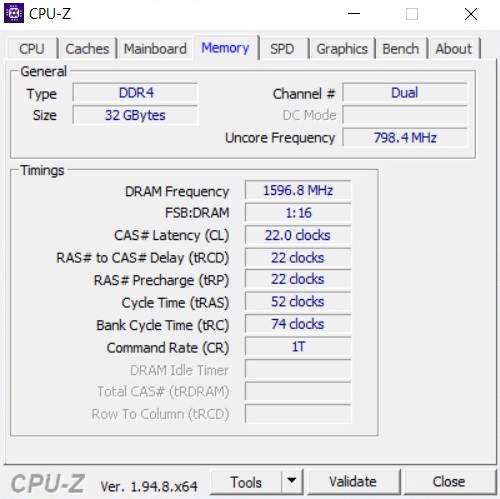
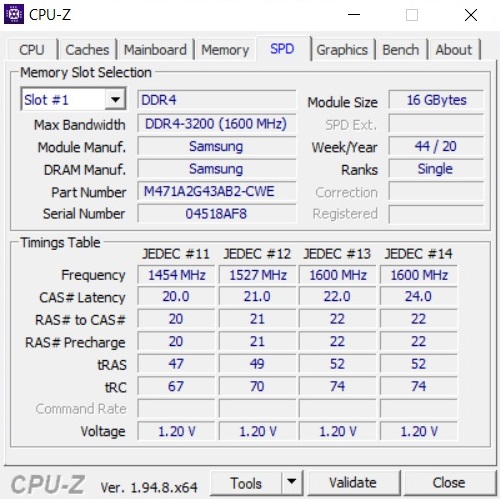
If you decide to buy the top model of the new ROG Zephyrus G15, you will get an extremely powerful overall package. In this way, the GA503Q model that we tested can boast a very powerful Ryzen 9 5900HS CPU and a GeForce RTX 3080 laptop GPU that is only specified with a TDP of 100 watts (including Dynamic Boost). Furthermore, a 1 TB NVMe-based SSD and 32 GB of DDR4 RAM (dual-channel) were installed in our test model, 16 GB of which are soldered to the motherboard. Meanwhile, a matte WQHD display with FreeSync and 165 Hz takes care of image reproduction. Note: According to our specs document, a 144 Hz Full HD display is available as a secondary panel option, but we wouldn't recommend it due to the low color-space coverage (45% NTSC).
The ROG Zephyrus G15's competitors include other slim 15-inch gaming models like the MSI GS66 10SGS, the Razer Blade 15 2020, the Acer Predator Triton 500 PT515, and the Lenovo Legion 7 15IMH. These laptops appear in the tables as comparison devices.
Possible contenders in comparison
Rating | Date | Model | Weight | Height | Size | Resolution | Best Price |
|---|---|---|---|---|---|---|---|
| 83.8 % | 02/2021 | Asus ROG Zephyrus G15 GA503Q R9 5900HS, GeForce RTX 3080 Laptop GPU | 2 kg | 20 mm | 15.60" | 2560x1440 | |
| 84 % | 05/2020 | MSI GS66 10SGS i7-10750H, GeForce RTX 2080 Super Max-Q | 2.2 kg | 20 mm | 15.60" | 1920x1080 | |
| 85.9 % | 08/2020 | Razer Blade 15 RTX 2080 Super Max-Q i7-10875H, GeForce RTX 2080 Super Max-Q | 2.2 kg | 17.8 mm | 15.60" | 1920x1080 | |
04/2020 | Acer Predator Triton 500 PT515-52-70N3 i7-10750H, GeForce RTX 2080 Super Max-Q | 2.1 kg | 18 mm | 15.60" | 1920x1080 | ||
| 86.3 % | 12/2020 | Lenovo Legion 7 15IMH05-81YT001VGE i9-10980HK, GeForce RTX 2080 Super Max-Q | 2.4 kg | 19.9 mm | 15.60" | 1920x1080 |
Case
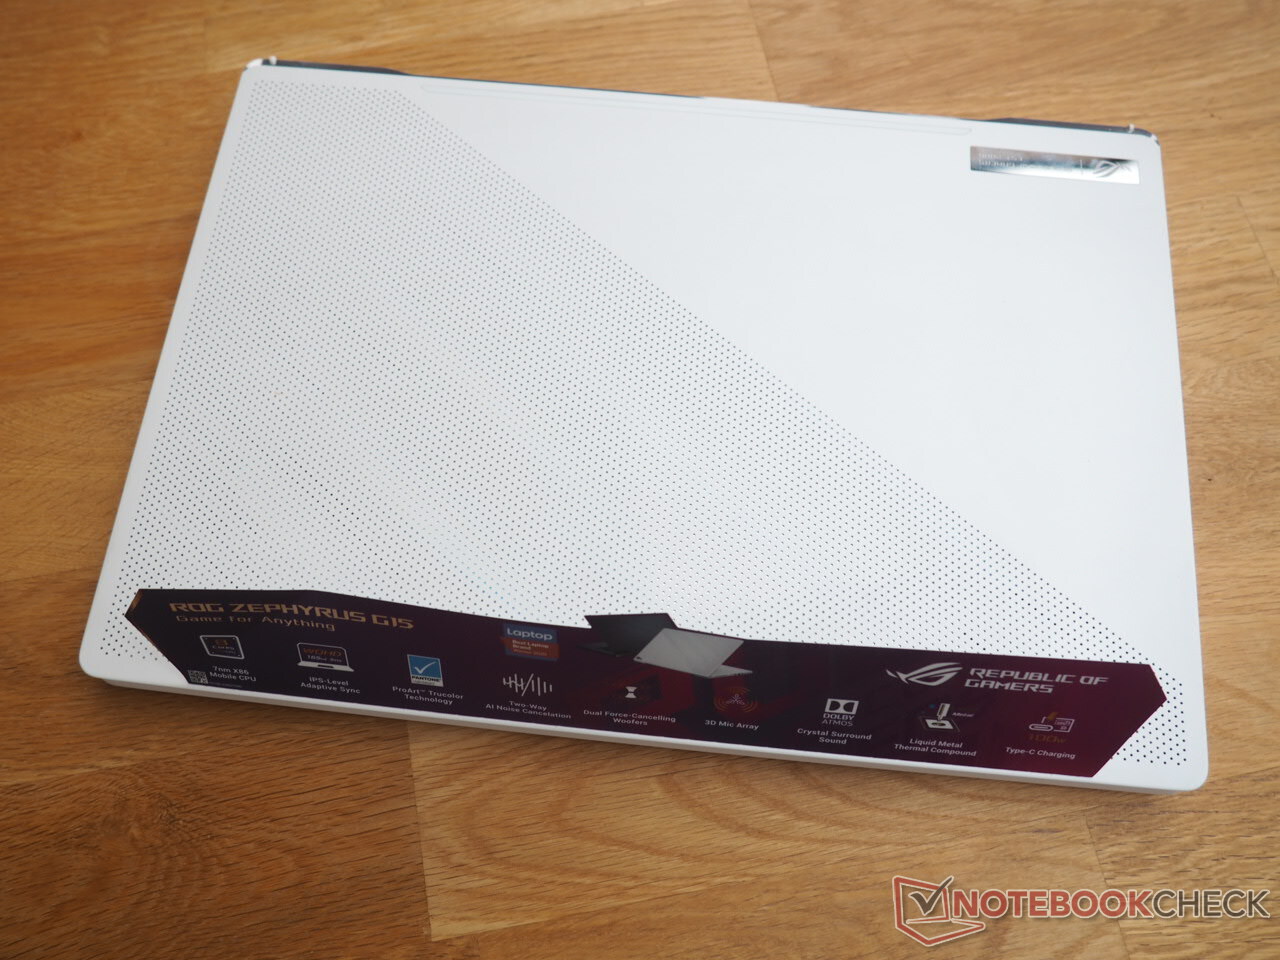
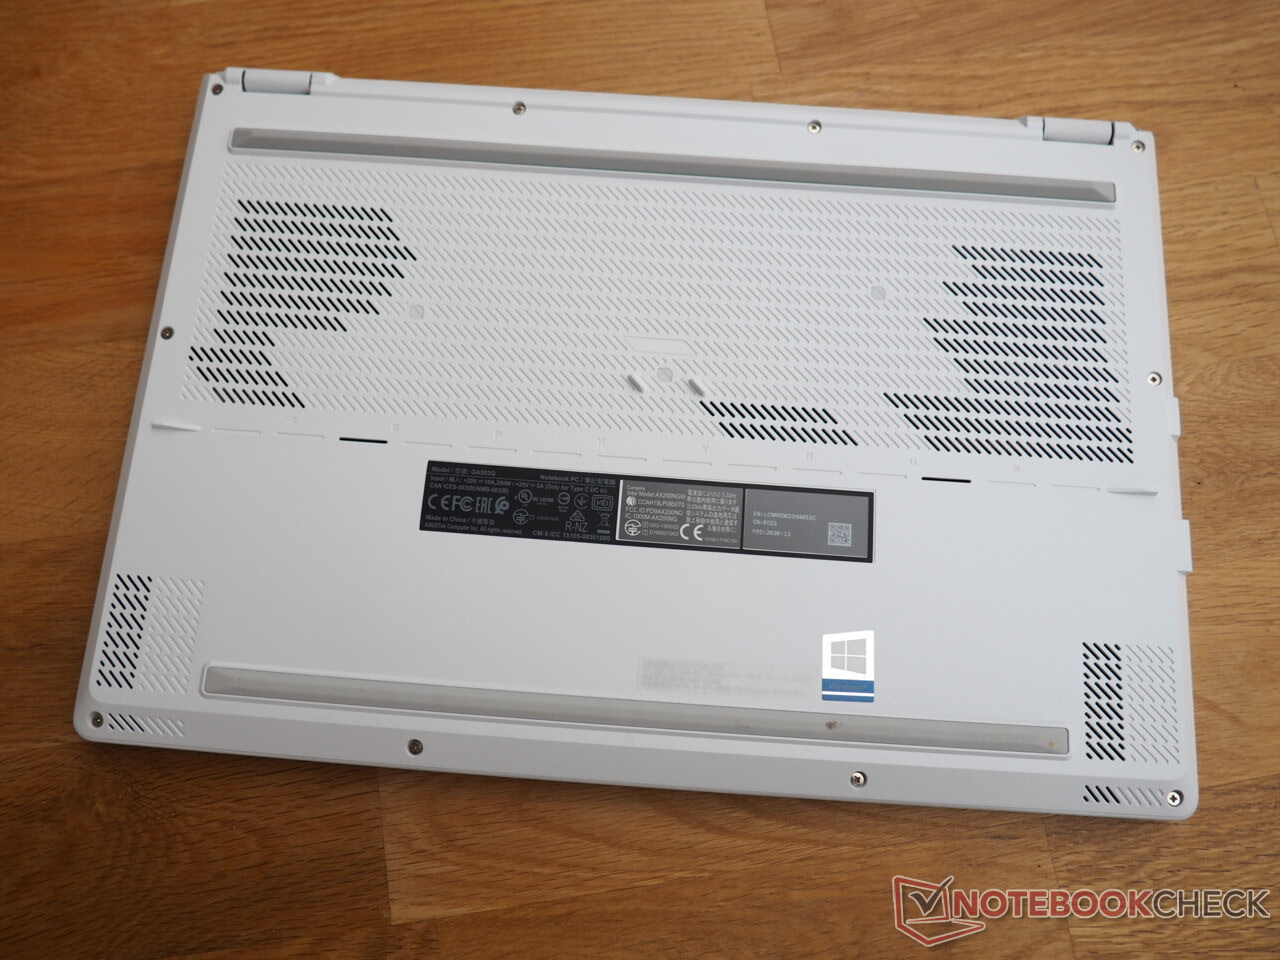
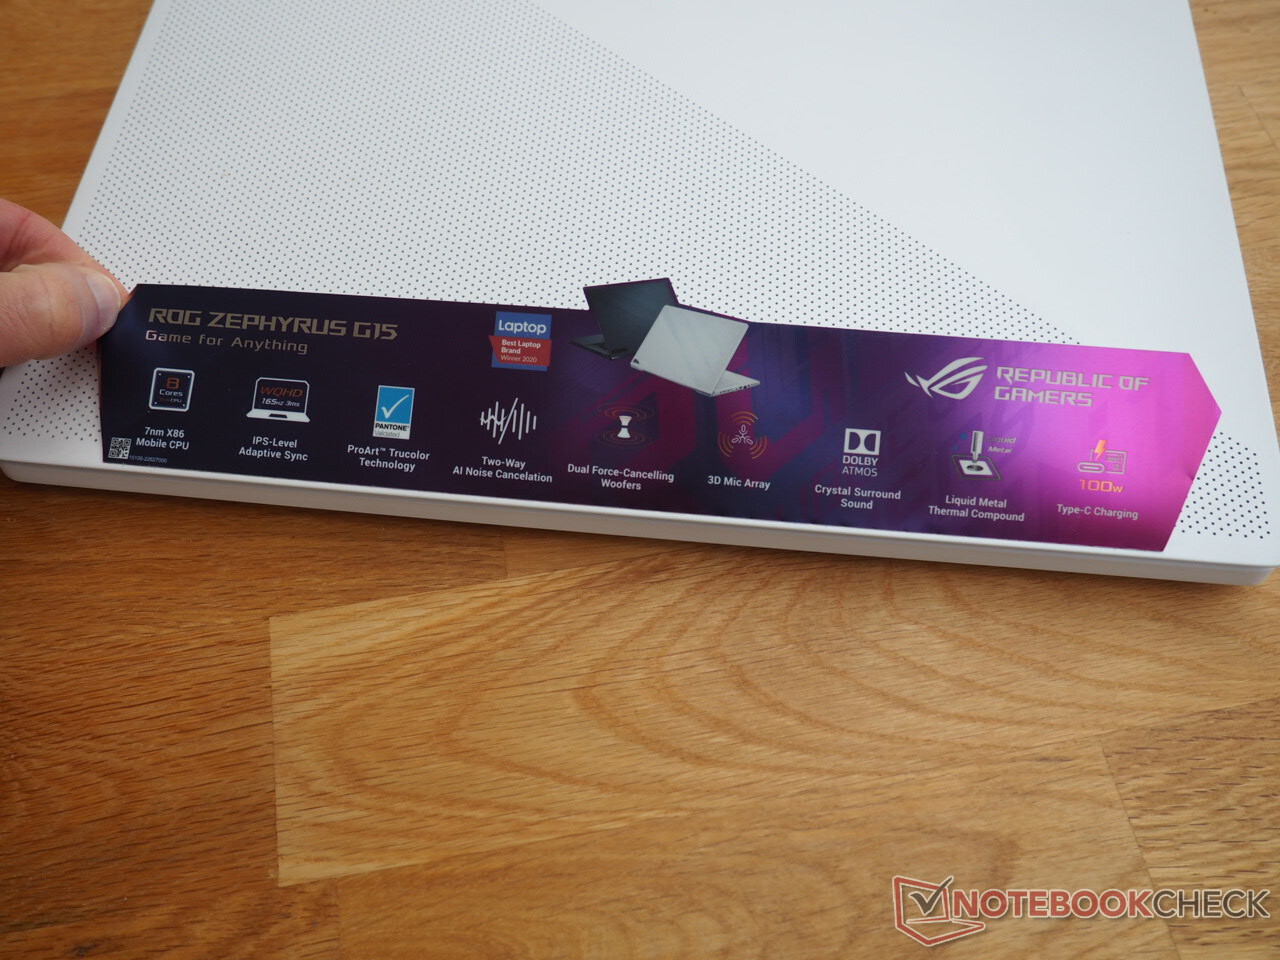
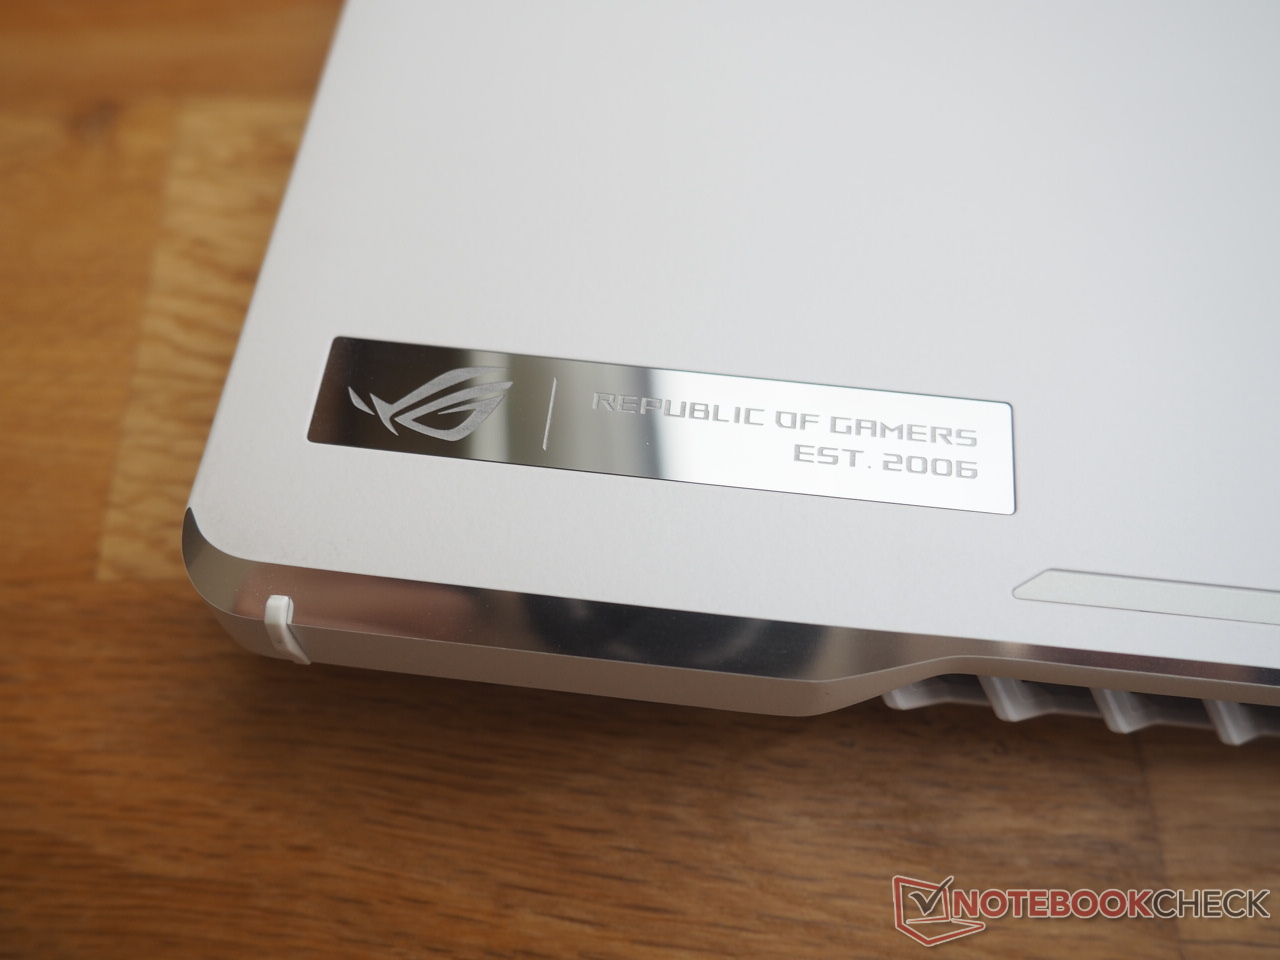
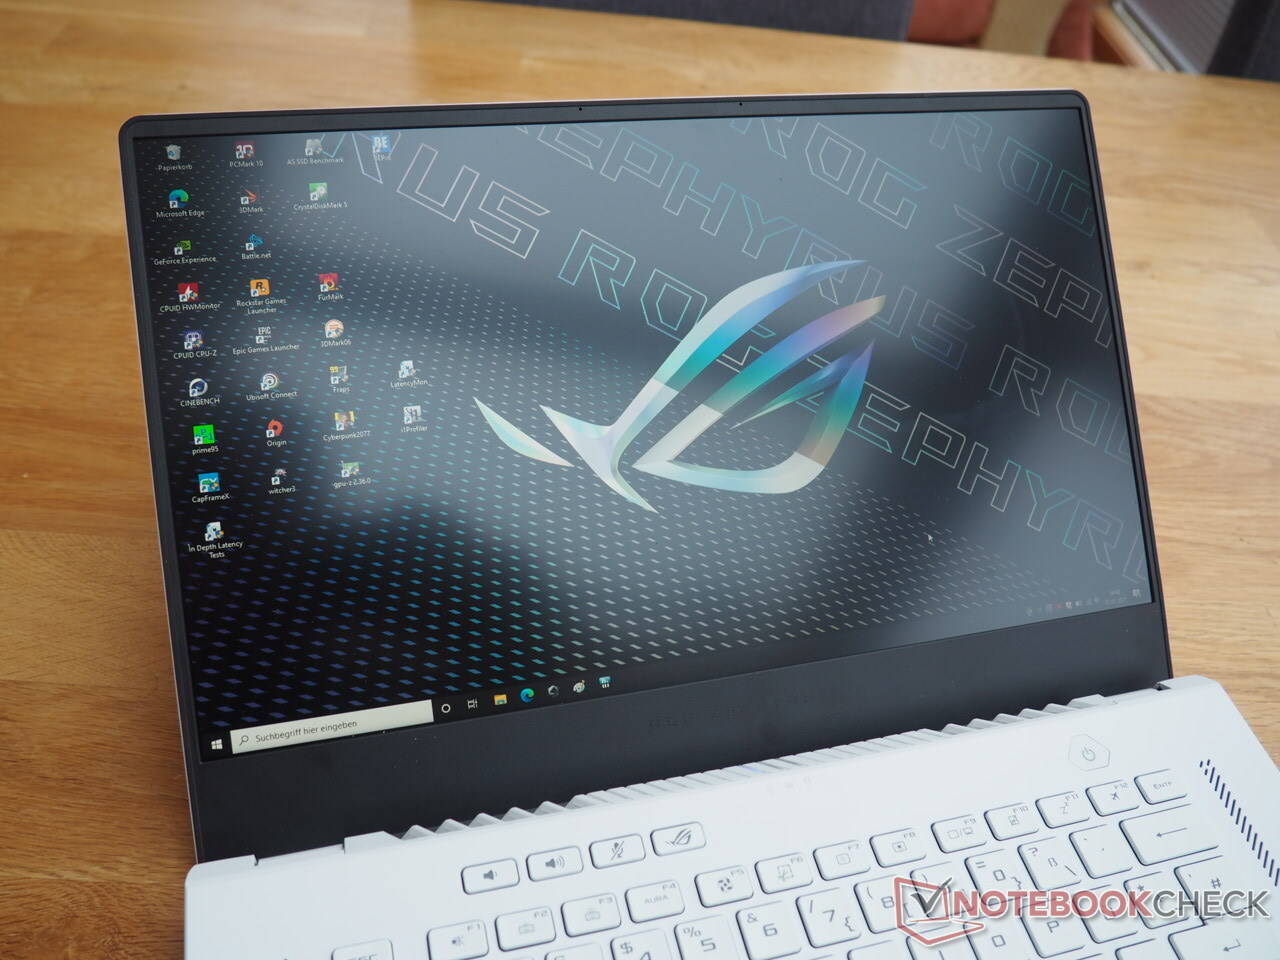
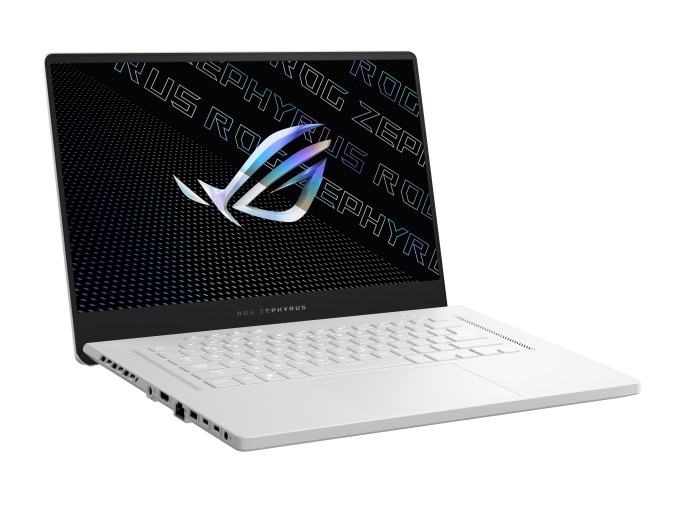
The Zephyrus G15 is available in gray or white. The latter edition is definitely an eye-catcher. On the one hand, white is hardly ever used in the laptop segment, and on the other hand, various detail accents like small dots or holes on the lid provide for a different look. Visually, the device looks very high-end, especially since the cover and keyboard area are made of a magnesium-aluminum mix (the surfaces tend to creak when twisted, though).
Stability is okay for such a slim case, as long as you don't make too many demands. The build quality is at a high level. All elements of the test device merge smoothly with each other. The hinge construction is a bit unusual for a gaming laptop. The hinges were designed in such a way that the rear area of the base unit is raised by several millimeters when the lid is opened (a maximum angle of 180°, a one-handed opening is possible), which simultaneously favors ventilation (however, the display tips backwards rather quickly when the surface is shaken).
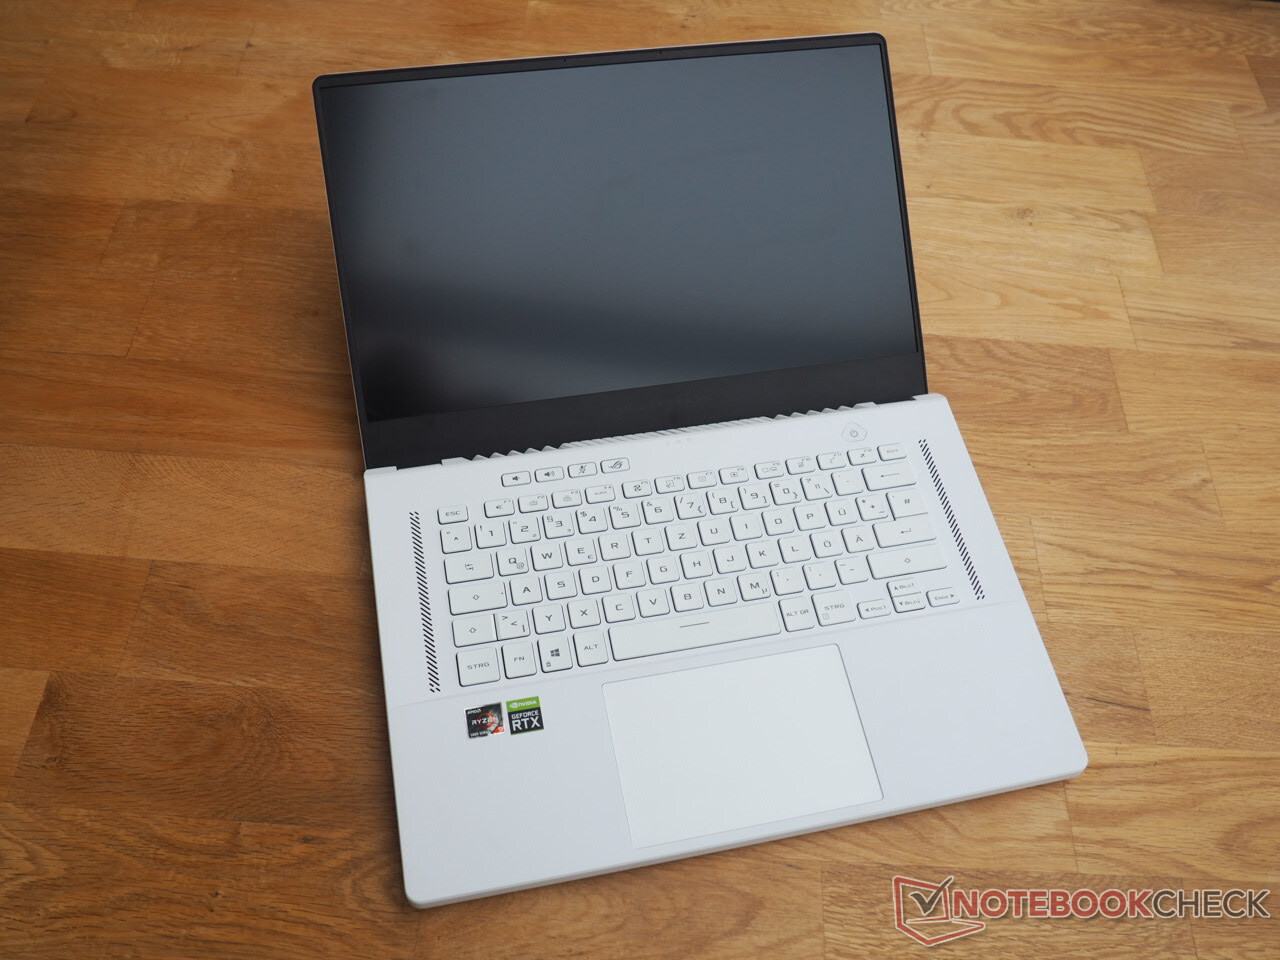
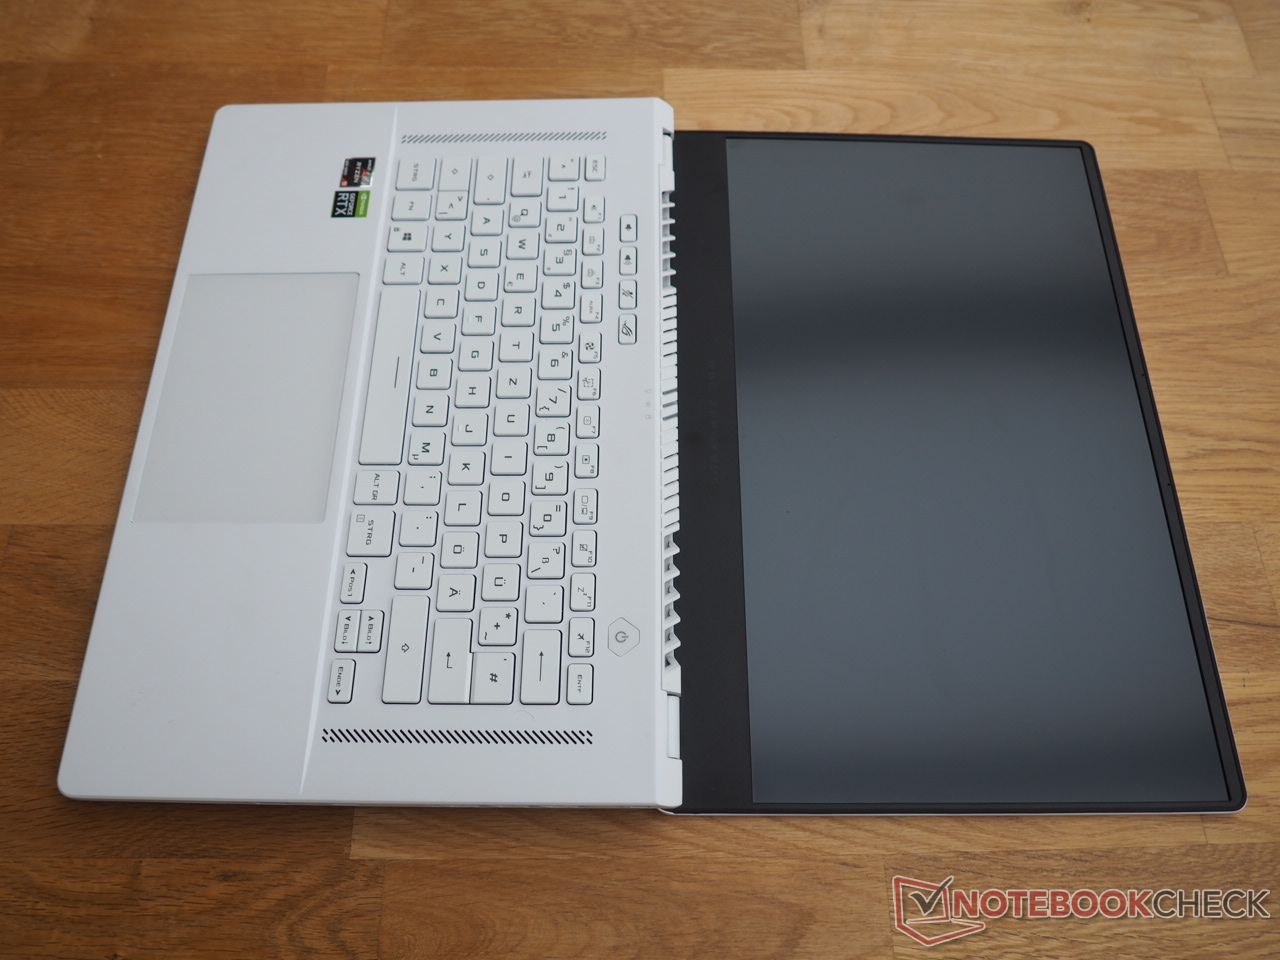
The G15 also impresses with its low weight. Just under 2 kg is the lowest value in the test field and can be transported quite comfortably. Things are similar in terms of dimensions. The combination of a slim-bezel design and 2.0 cm of height guarantee a slim appearance.
Connectivity
Ports
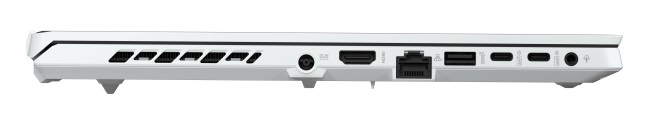
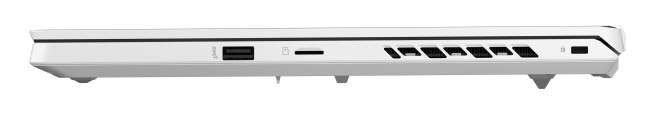
The connectivity is not bad for such a compact gaming laptop. In this way, the 15-incher accommodates an RJ45 port, an audio jack, an HDMI 2.0 output, a Kensington lock slot, and a card reader that can only accept microSD models, though, which is a bit of a pity. Speaking of a pity: Due to the use of AMD, the G15 has to do without Thunderbolt. As for the USB ports, Asus has opted for two Type-A ports and two Type-C ports (3.2 Gen 2 each) with 100 watts of Power Delivery and DisplayPort support.
While right-handed users should be satisfied with the distribution of the ports, lefties will probably complain because of the layout, since the ports on the left side have been pushed too much to the front. Attached cables can significantly restrict the range of motion of an external mouse.
Communication
The wireless module from Intel (Wi-Fi 6 AX200) supports WLAN 802.11a/b/g/n/ac/ax and Bluetooth 5.1. The speed in our test (1 meter distance to the reference router, the Netgear Nighthawk AX12) was very good.
Accessories
Asus provides the Zephyrus G15 with a 200-watt power adapter weighing just under 0.5 kg and measuring 15 x 7 x 2.5 cm.
Maintenance
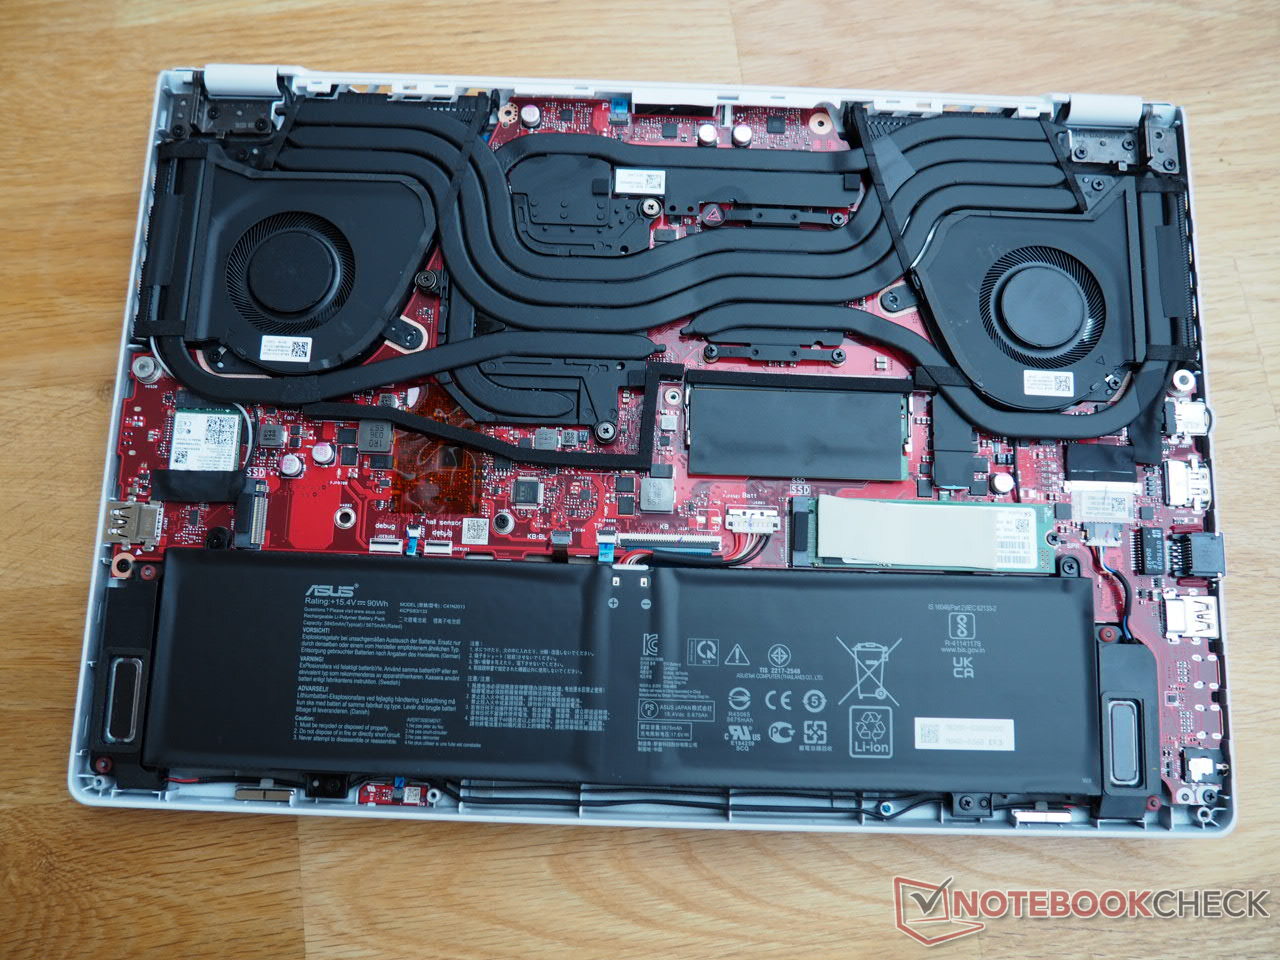
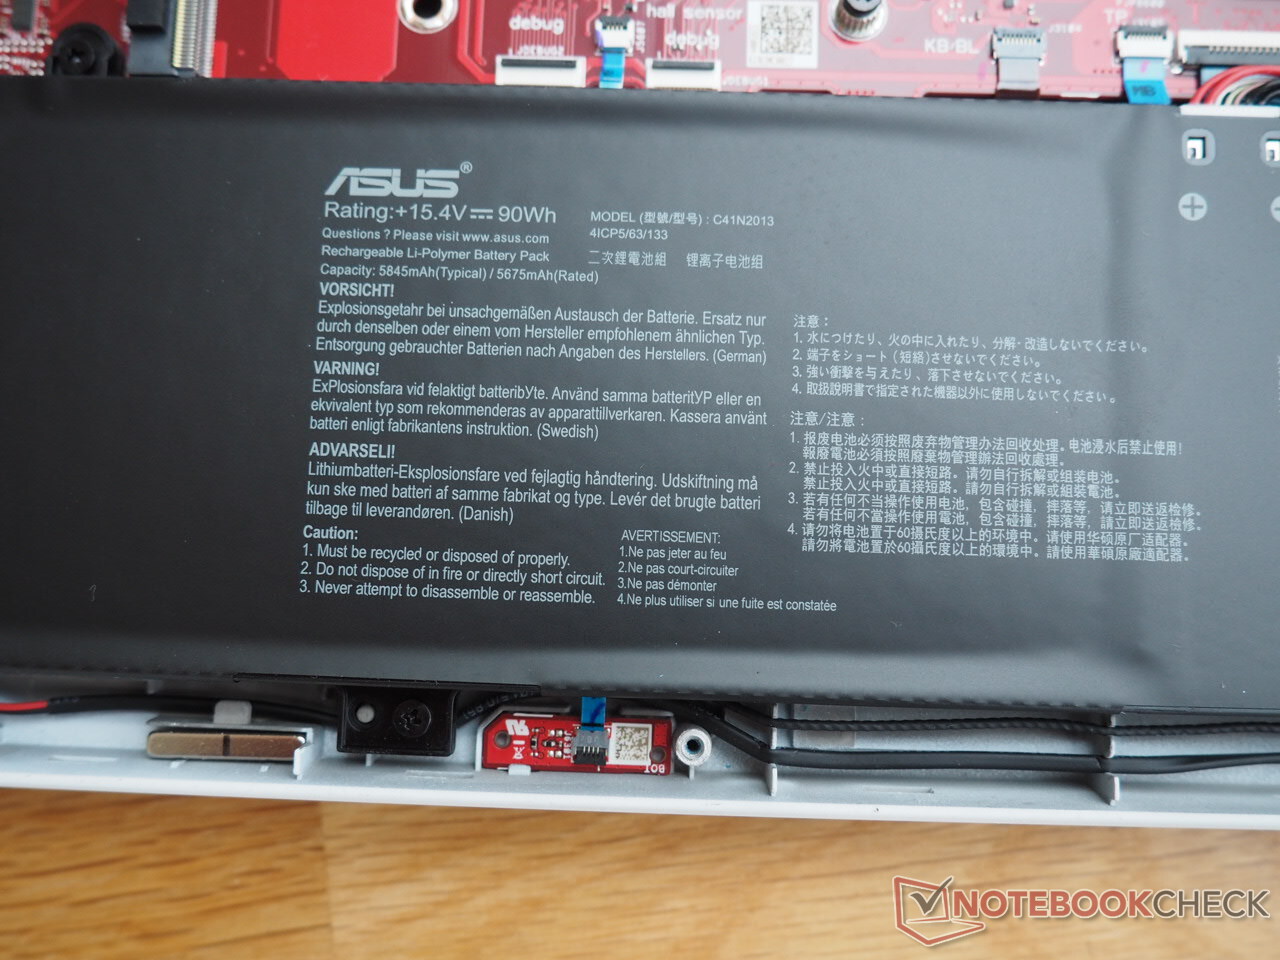
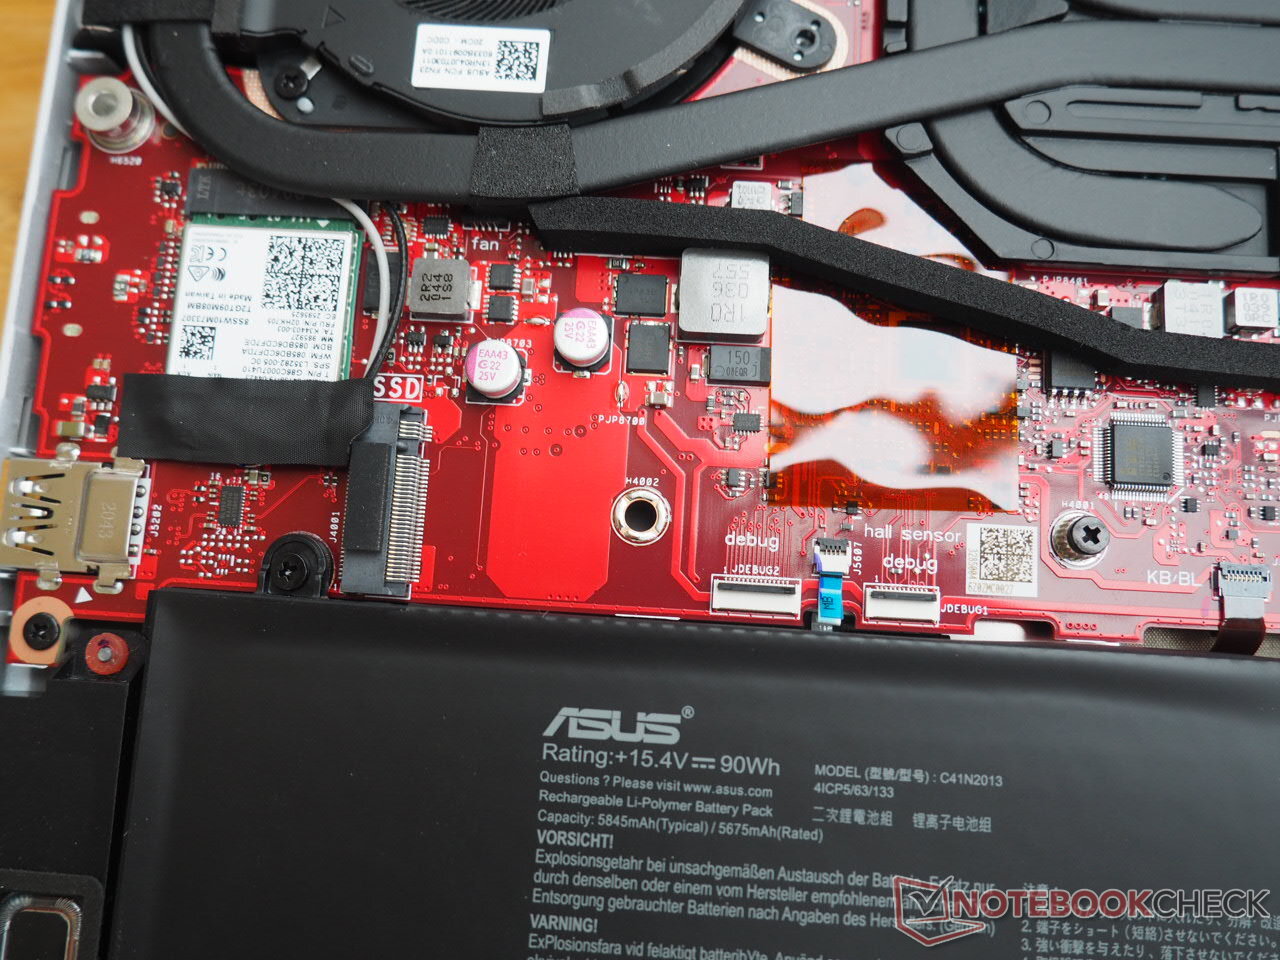
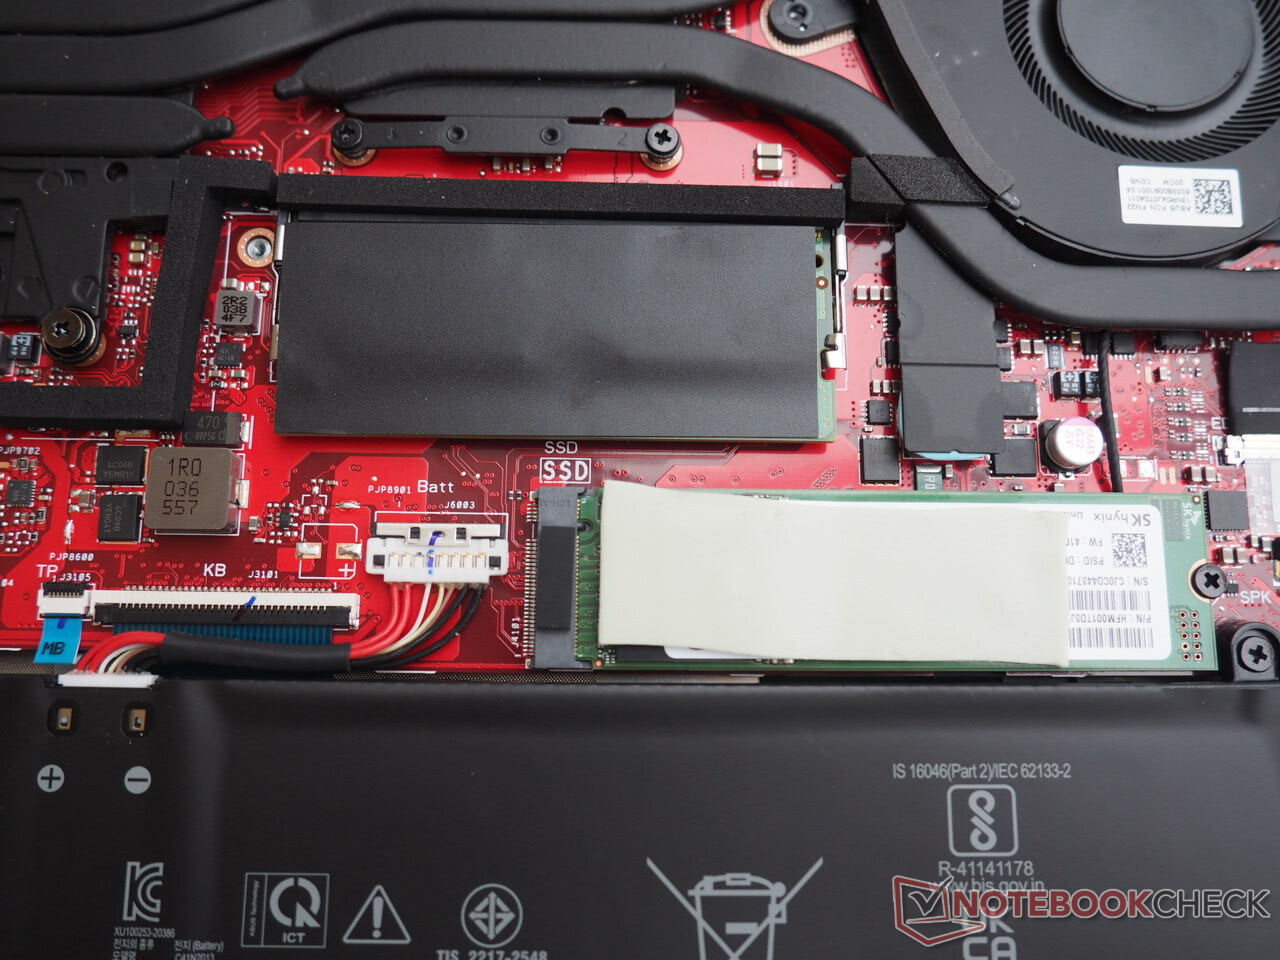
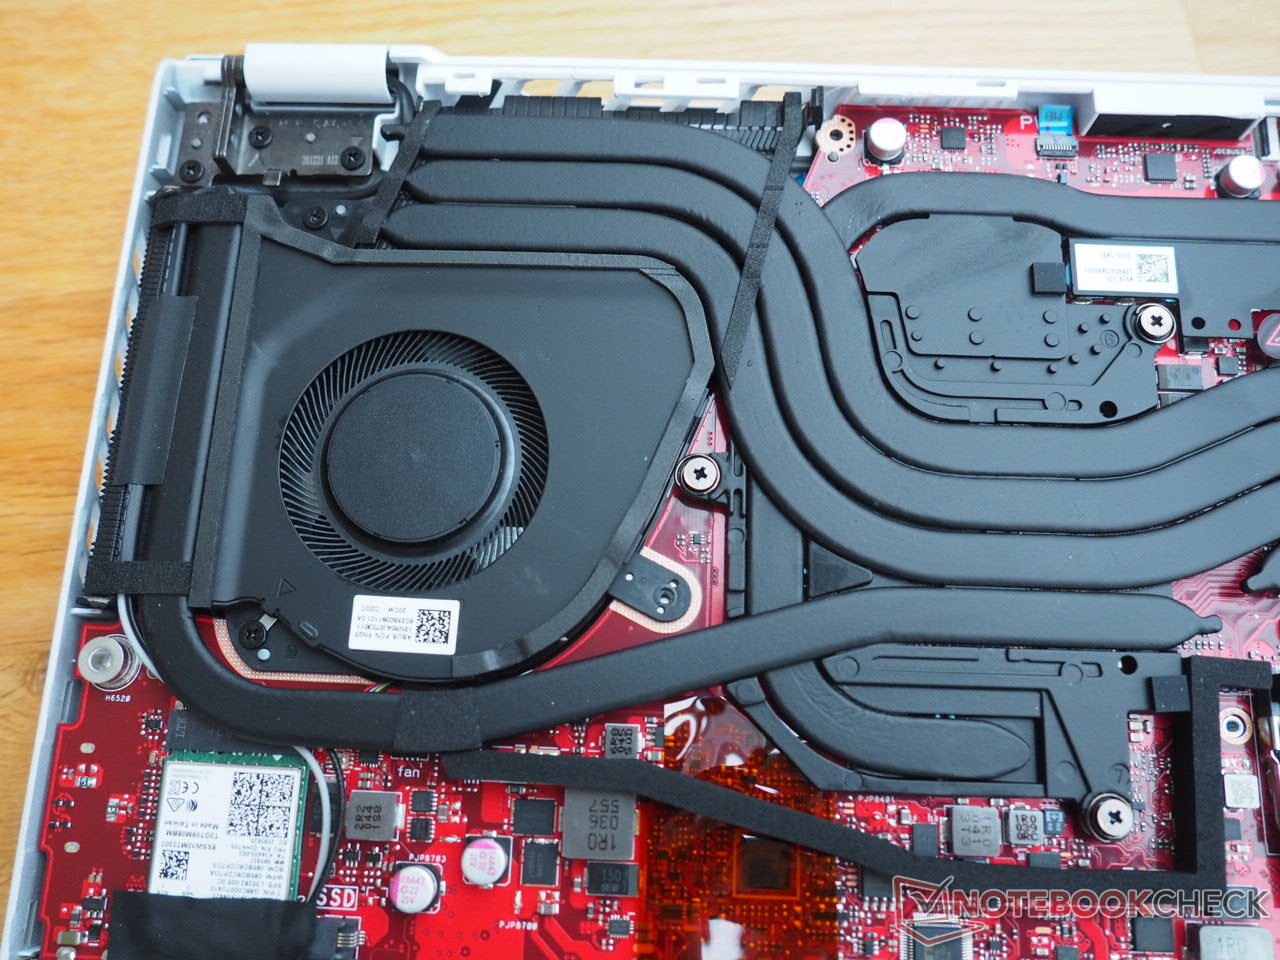
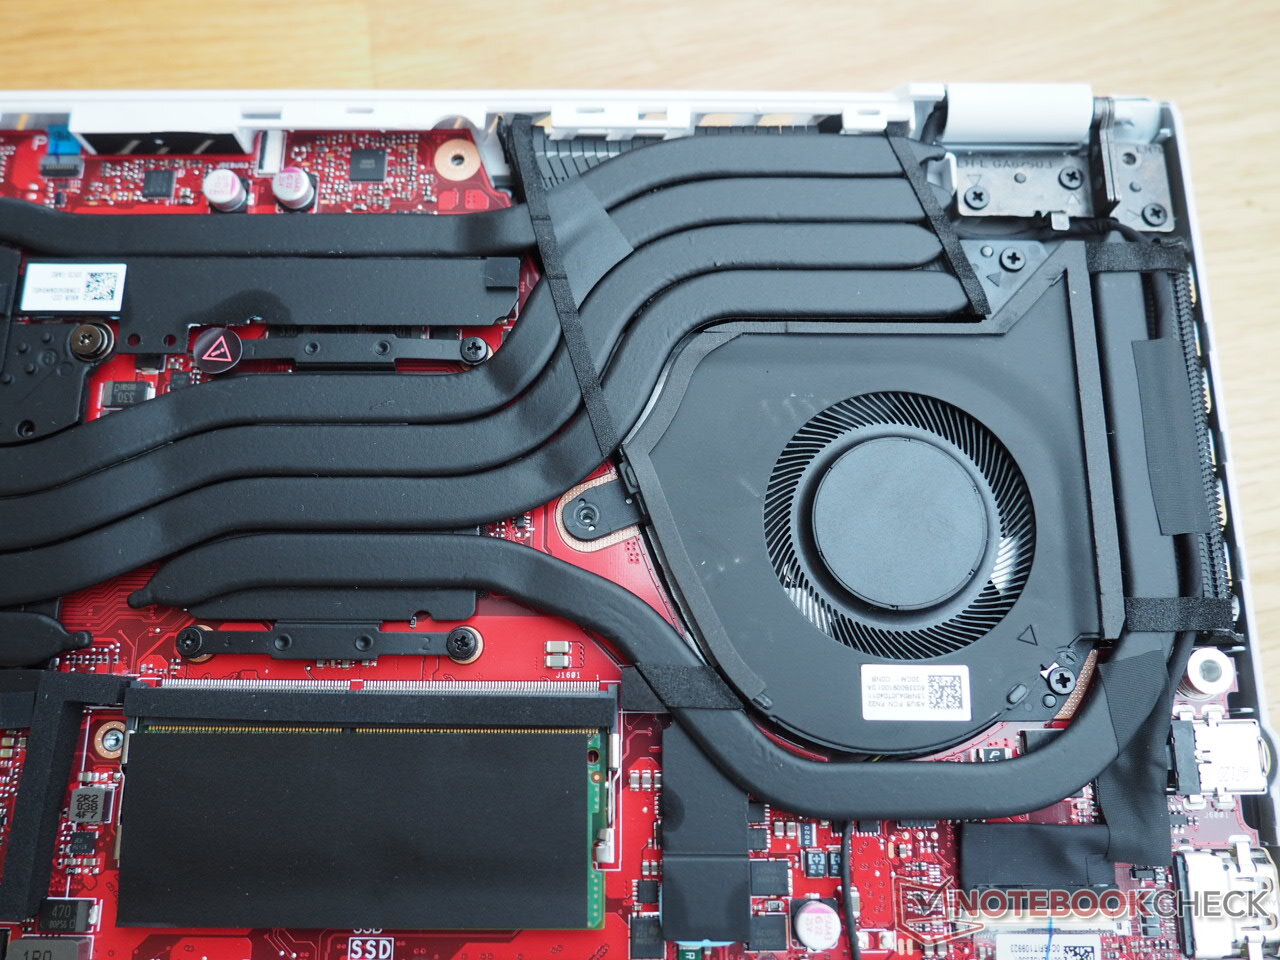
Since the 15-incher doesn't have a maintenance hatch, the entire bottom of the case has to be removed to reach the components. The bottom cover is secured with 13 screws (note: three of them are located behind rubber seals). Not only does the cooling system, which consists of two fans and several heat pipes (Liquid Metal), await inside the case, but also a SO-DIMM slot (occupied), two M.2 slots (1x free), the battery, and the wireless module are accessible.
Warranty
Asus provides a 24-month warranty for the device.
Input devices
Keyboard
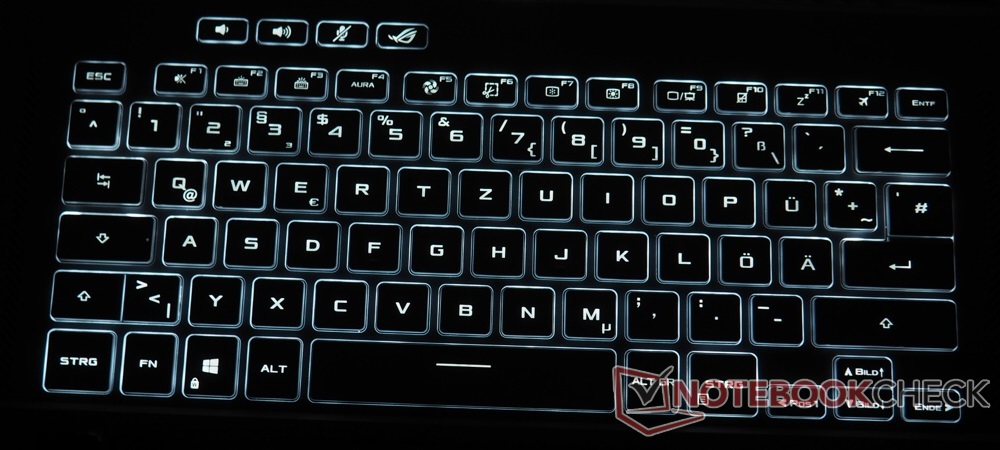
The keyboard left us with mixed feelings. Starting with the key size, which is only convincing when it comes to the main keys. The arrow keys and the F-row, on the other hand, are quite narrow. Not every user will like the layout, either. In this way, for example, the left Shift and <>| are stuck directly together. A single-line Enter is also unusual for a German model. However, the missing Insert and Print Screen keys bothered us the most in the test.
Asus should also work on the labeling. Depending on the ambient brightness, the keys can hardly be read when the backlight is activated. At least the backlight can be adjusted in several levels or turned off completely if desired. Moreover, we would describe the typing feel as quite modest. The keyboard neither reacts particularly crisp nor particularly mushy to input. Practical: Sound can be conveniently controlled using special keys.
Touchpad
Asus deserves praise for the generously sized touchpad. 13 x 8.5 cm is a rarity in the 15-inch segment; it allows running long distances on the display without having to reset your finger. Thanks to the huge touchpad, the palm rest is also generously sized, which benefits ergonomics. Beyond that, the touchpad impresses with a smooth and very gliding-friendly surface. There's nothing to complain about multitouch support either (zooming and scrolling using two-finger gestures). Only the loud and somewhat rattly click noise is a drawback.
Display
WQHD displays currently represent the perfect compromise between image sharpness and resource consumption. Asus uses a 165 Hz model from CMN (N156KME-GNA) for the Zephyrus G15; it's well suited for gamers due to the high frequency and the relatively low response time (under 10 ms gray-to-gray).
| |||||||||||||||||||||||||
Brightness Distribution: 89 %
Center on Battery: 327 cd/m²
Contrast: 991:1 (Black: 0.33 cd/m²)
ΔE Color 4.49 | 0.5-29.43 Ø5, calibrated: 2.27
ΔE Greyscale 4.2 | 0.57-98 Ø5.3
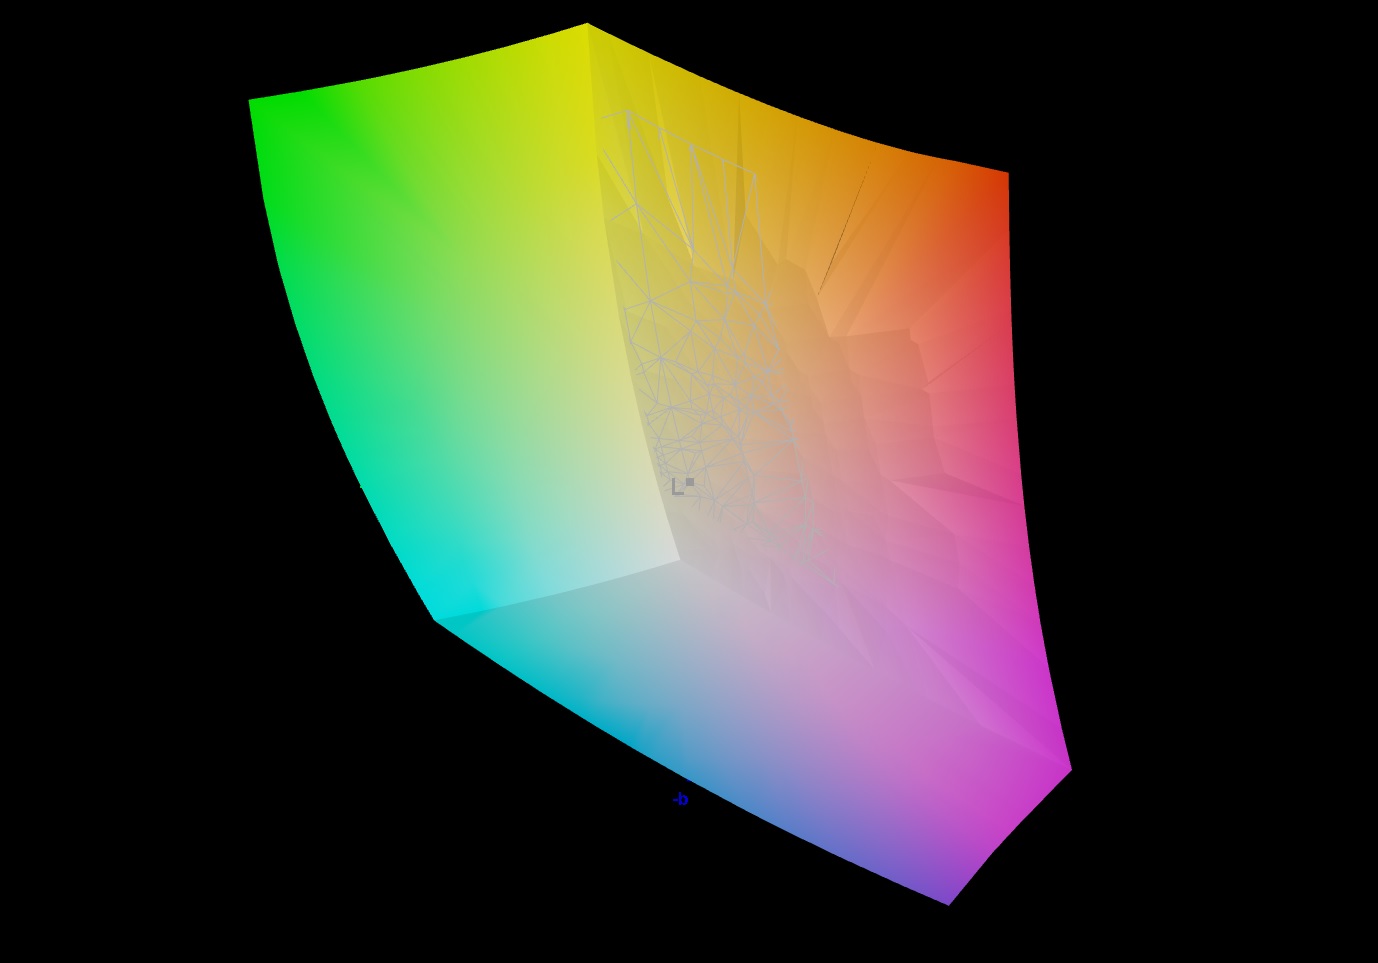
99% sRGB (Argyll 1.6.3 3D)
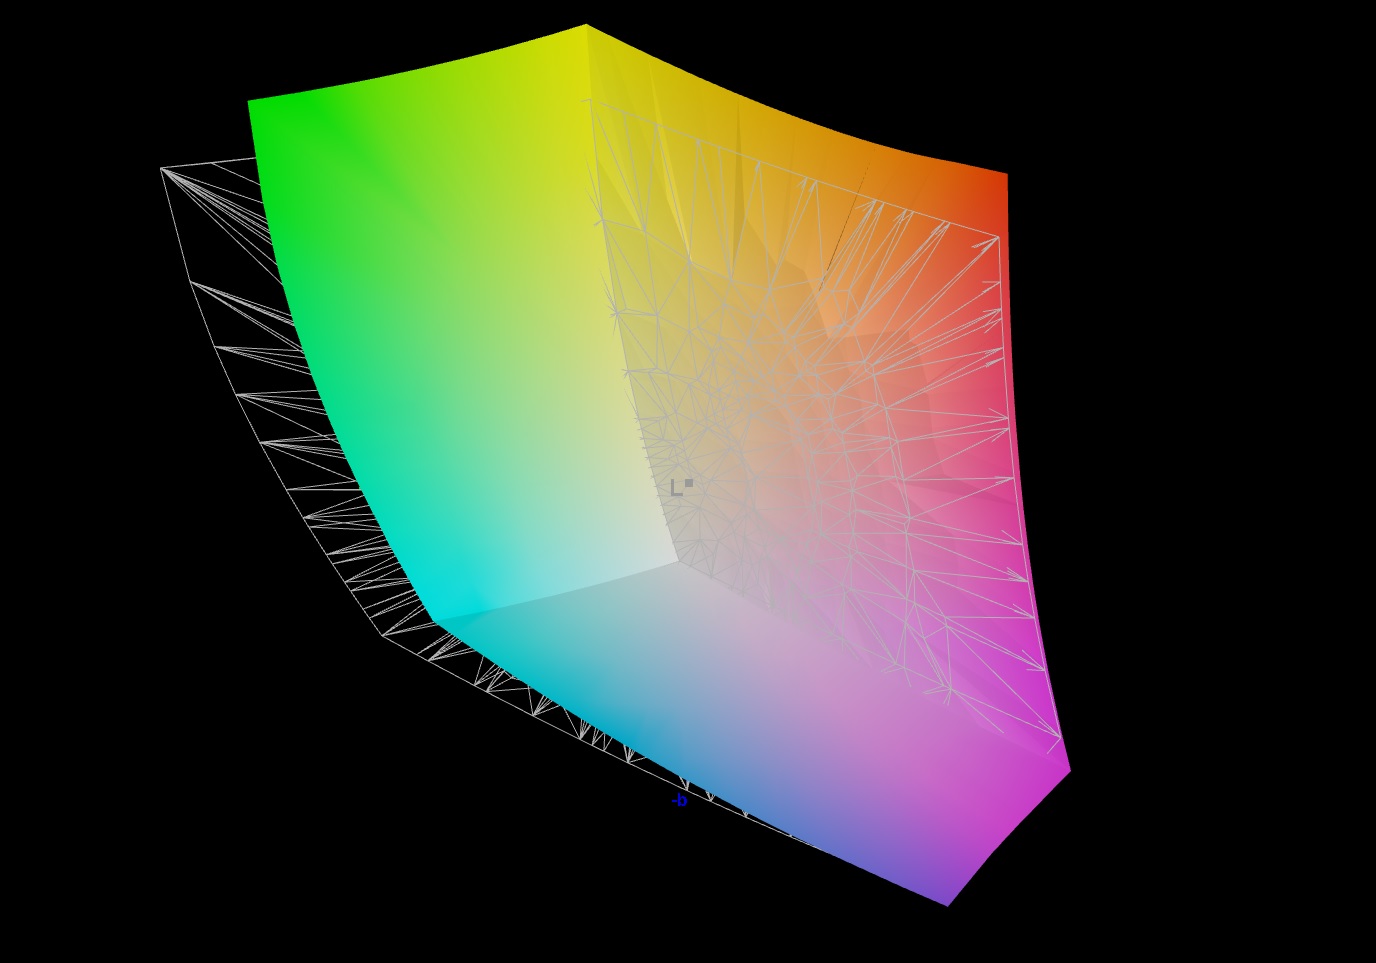
86% AdobeRGB 1998 (Argyll 1.6.3 3D)
86.2% AdobeRGB 1998 (Argyll 2.2.0 3D)
99.9% sRGB (Argyll 2.2.0 3D)
97.3% Display P3 (Argyll 2.2.0 3D)
Gamma: 2.173
| Asus ROG Zephyrus G15 GA503Q CMN N156KME-GNA (CMN152A), IPS-Level, 2560x1440, 15.60 | MSI GS66 10SGS AU Optronics B156HAN12.0, IPS, 1920x1080, 15.60 | Razer Blade 15 RTX 2080 Super Max-Q AU Optronics B156HAN12.0, IPS, 1920x1080, 15.60 | Acer Predator Triton 500 PT515-52-70N3 AUO B156HAN12.0 (AUO7A8C), IPS, 1920x1080, 15.60 | Lenovo Legion 7 15IMH05-81YT001VGE AUO048E, IPS, 1920x1080, 15.60 | |
|---|---|---|---|---|---|
| Display | -16% | -15% | -15% | -15% | |
| Display P3 Coverage | 97.3 | 69.9 -28% | 70.2 -28% | 70.3 -28% | 70.3 -28% |
| sRGB Coverage | 99.9 | 99.1 -1% | 99 -1% | 99.5 0% | 99.4 -1% |
| AdobeRGB 1998 Coverage | 86.2 | 71.1 -18% | 71.4 -17% | 72.2 -16% | 71.3 -17% |
| Response Times | -8% | 26% | -29% | 19% | |
| Response Time Grey 50% / Grey 80% * | 8.8 ? | 11.2 ? -27% | 6 ? 32% | 14.4 ? -64% | 8 ? 9% |
| Response Time Black / White * | 11.2 ? | 10 ? 11% | 9 ? 20% | 10.4 ? 7% | 8 ? 29% |
| PWM Frequency | |||||
| Screen | 24% | 18% | 6% | 30% | |
| Brightness middle | 327 | 339.4 4% | 347 6% | 320 -2% | 470 44% |
| Brightness | 309 | 331 7% | 328 6% | 318 3% | 468 51% |
| Brightness Distribution | 89 | 92 3% | 89 0% | 88 -1% | 85 -4% |
| Black Level * | 0.33 | 0.24 27% | 0.285 14% | 0.24 27% | 0.21 36% |
| Contrast | 991 | 1414 43% | 1218 23% | 1333 35% | 2238 126% |
| Colorchecker dE 2000 * | 4.49 | 1.58 65% | 2.35 48% | 4.03 10% | 3.28 27% |
| Colorchecker dE 2000 max. * | 8.42 | 3.8 55% | 4.15 51% | 8.43 -0% | 7.31 13% |
| Colorchecker dE 2000 calibrated * | 2.27 | 1.47 35% | 1.16 49% | 0.98 57% | 0.8 65% |
| Greyscale dE 2000 * | 4.2 | 2.3 45% | 3.04 28% | 5.94 -41% | 4.49 -7% |
| Gamma | 2.173 101% | 2.24 98% | 2.35 94% | 2.42 91% | 2.4 92% |
| CCT | 7014 93% | 6952 93% | 6658 98% | 6751 96% | 7438 87% |
| Color Space (Percent of AdobeRGB 1998) | 86 | 64.8 -25% | 65 -24% | 66 -23% | 65 -24% |
| Color Space (Percent of sRGB) | 99 | 99.4 0% | 99 0% | 99 0% | 99 0% |
| Total Average (Program / Settings) | 0% /
12% | 10% /
13% | -13% /
-2% | 11% /
20% |
* ... smaller is better
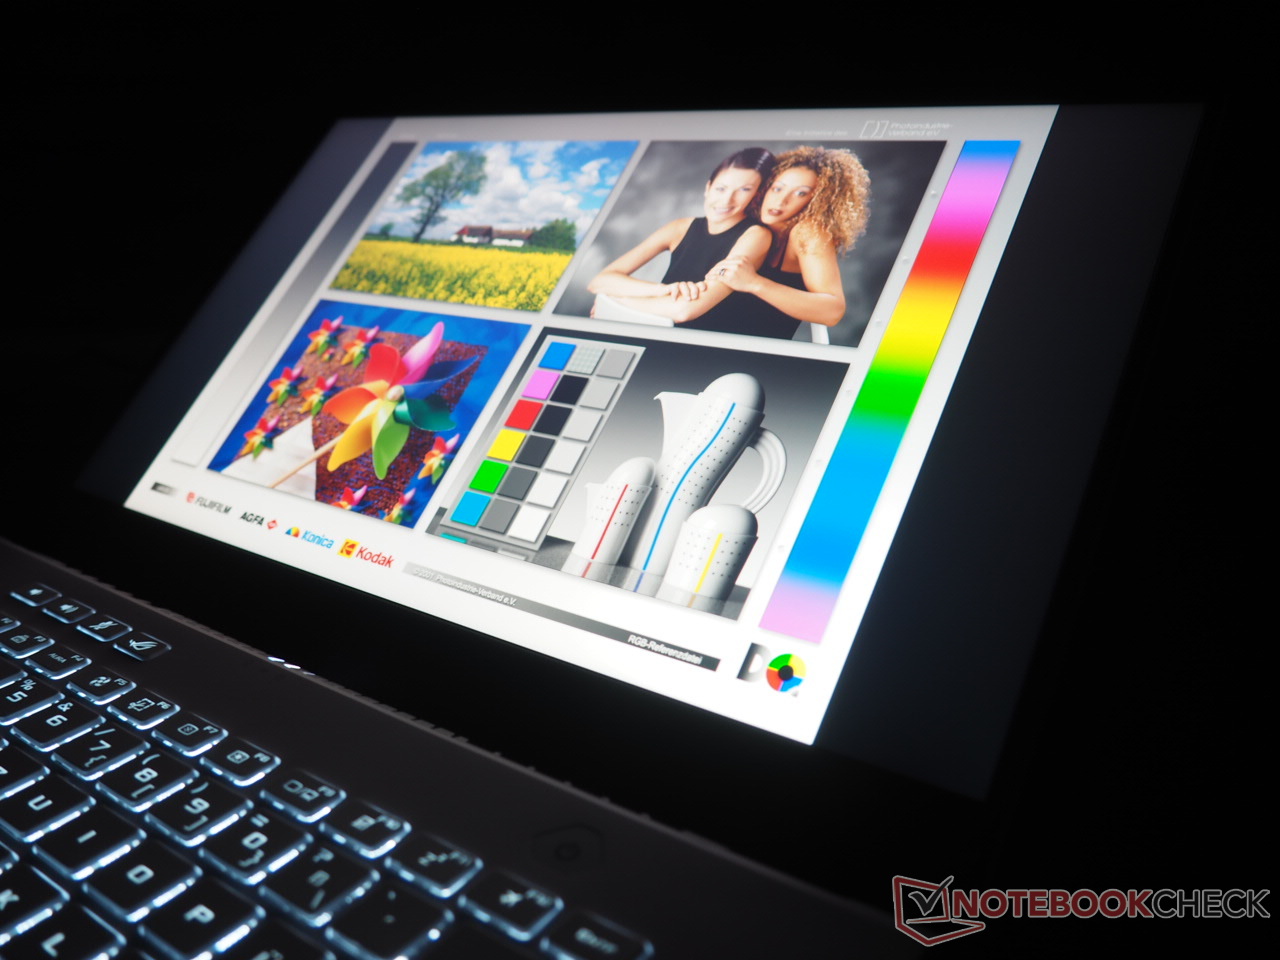
However, professional users who want to do photo or video editing, for example, and who rely on high color-space coverage should also be happy with the WQHD panel. According to our tests, the 15-inch display covers 99% of the sRGB space and 86% of the AdobeRGB space - a very good result. For comparison: The competition manages a maximum of 66% of AdobeRGB.
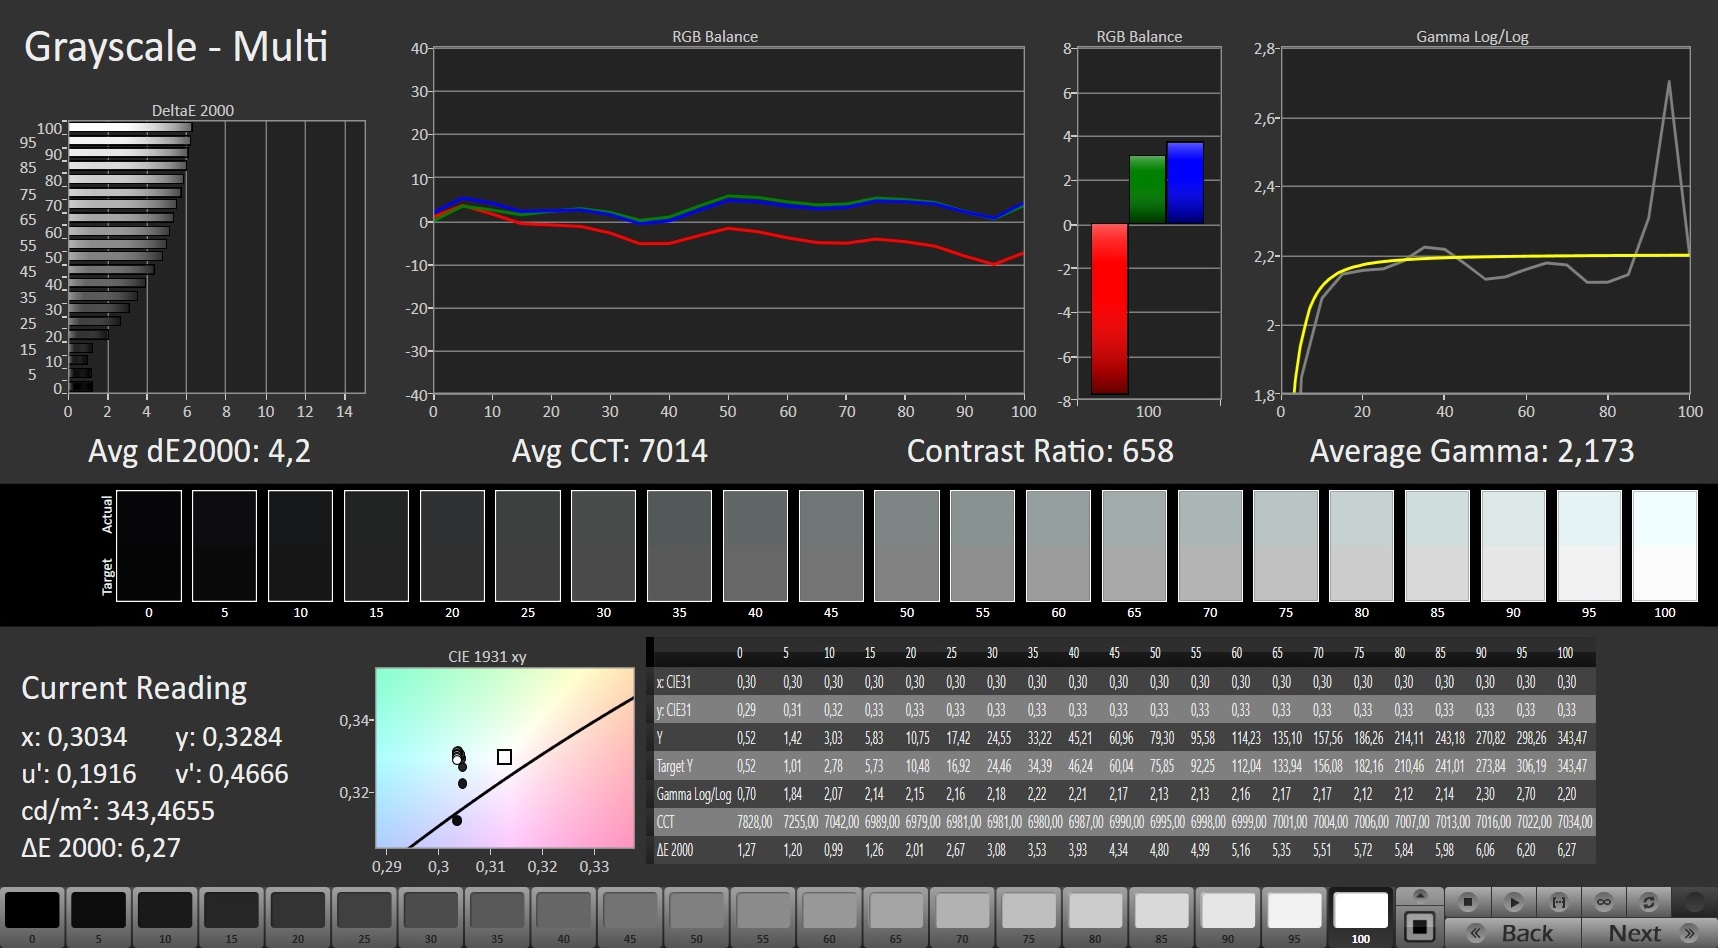
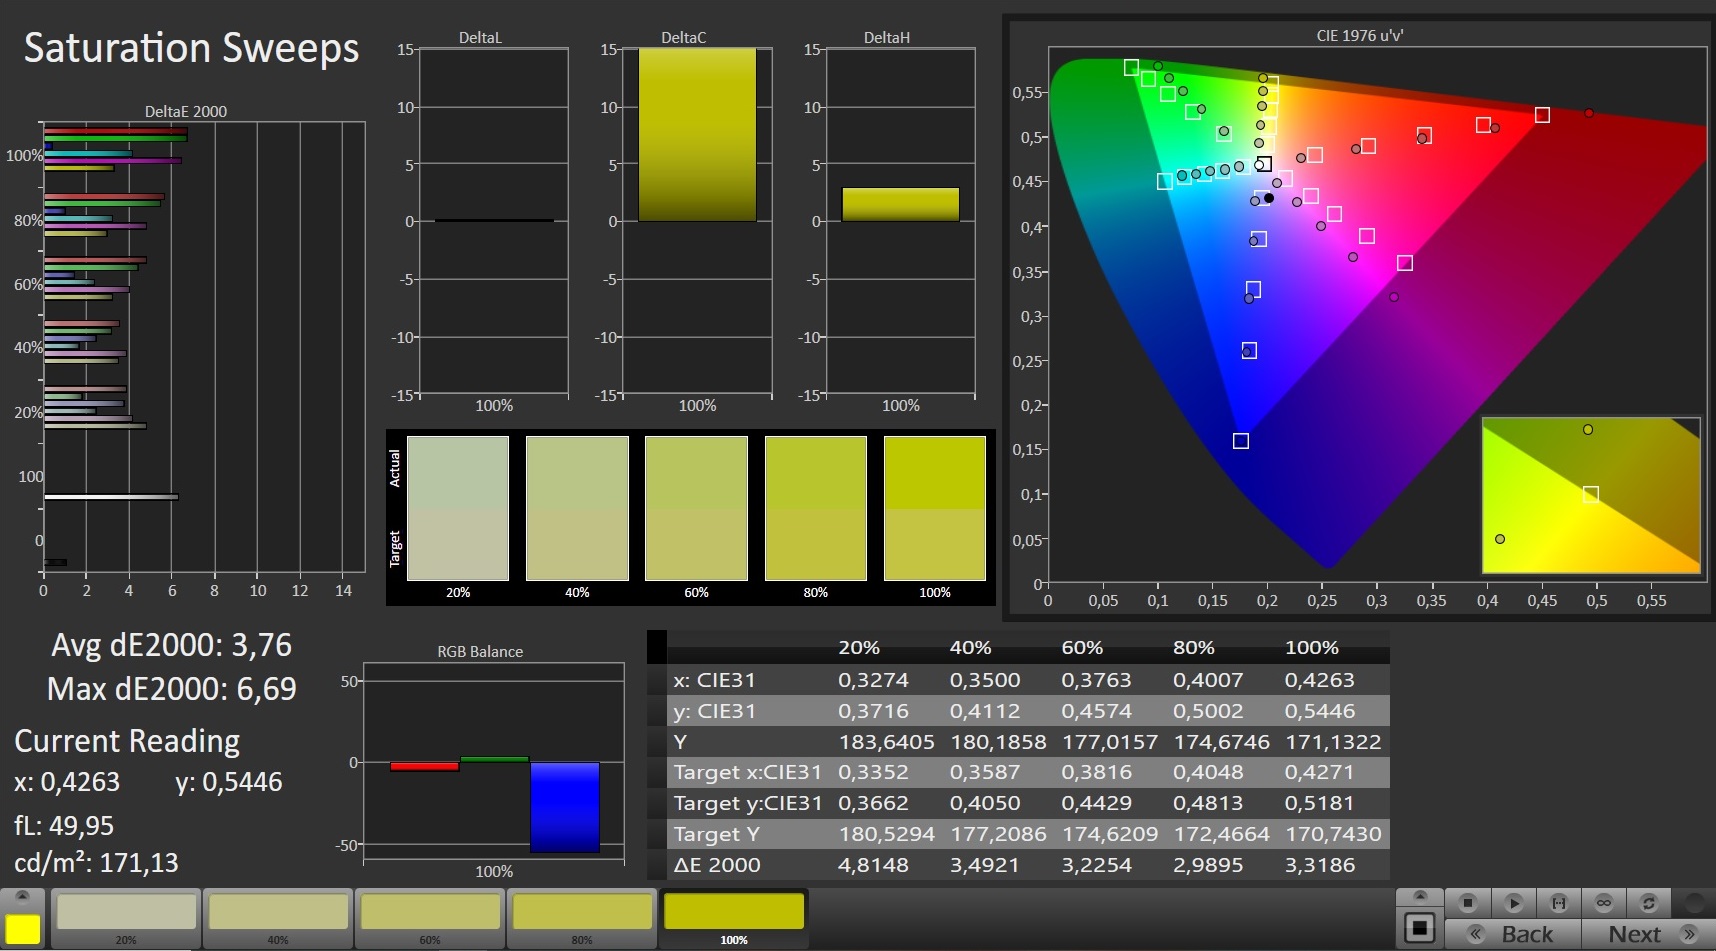
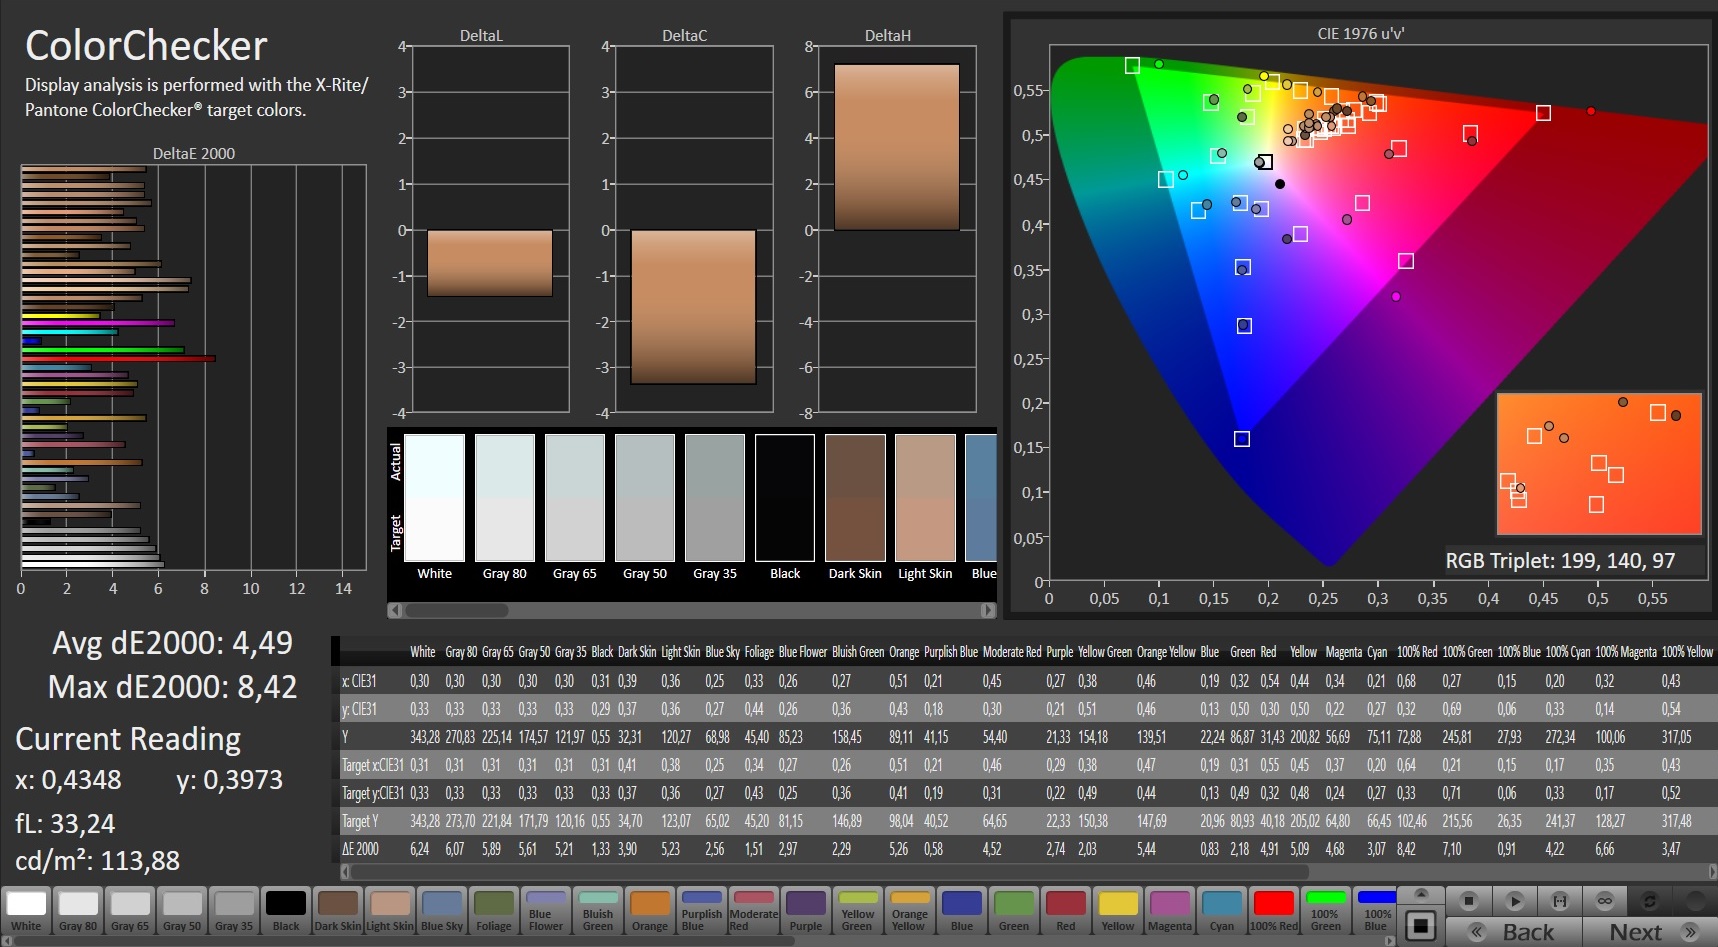
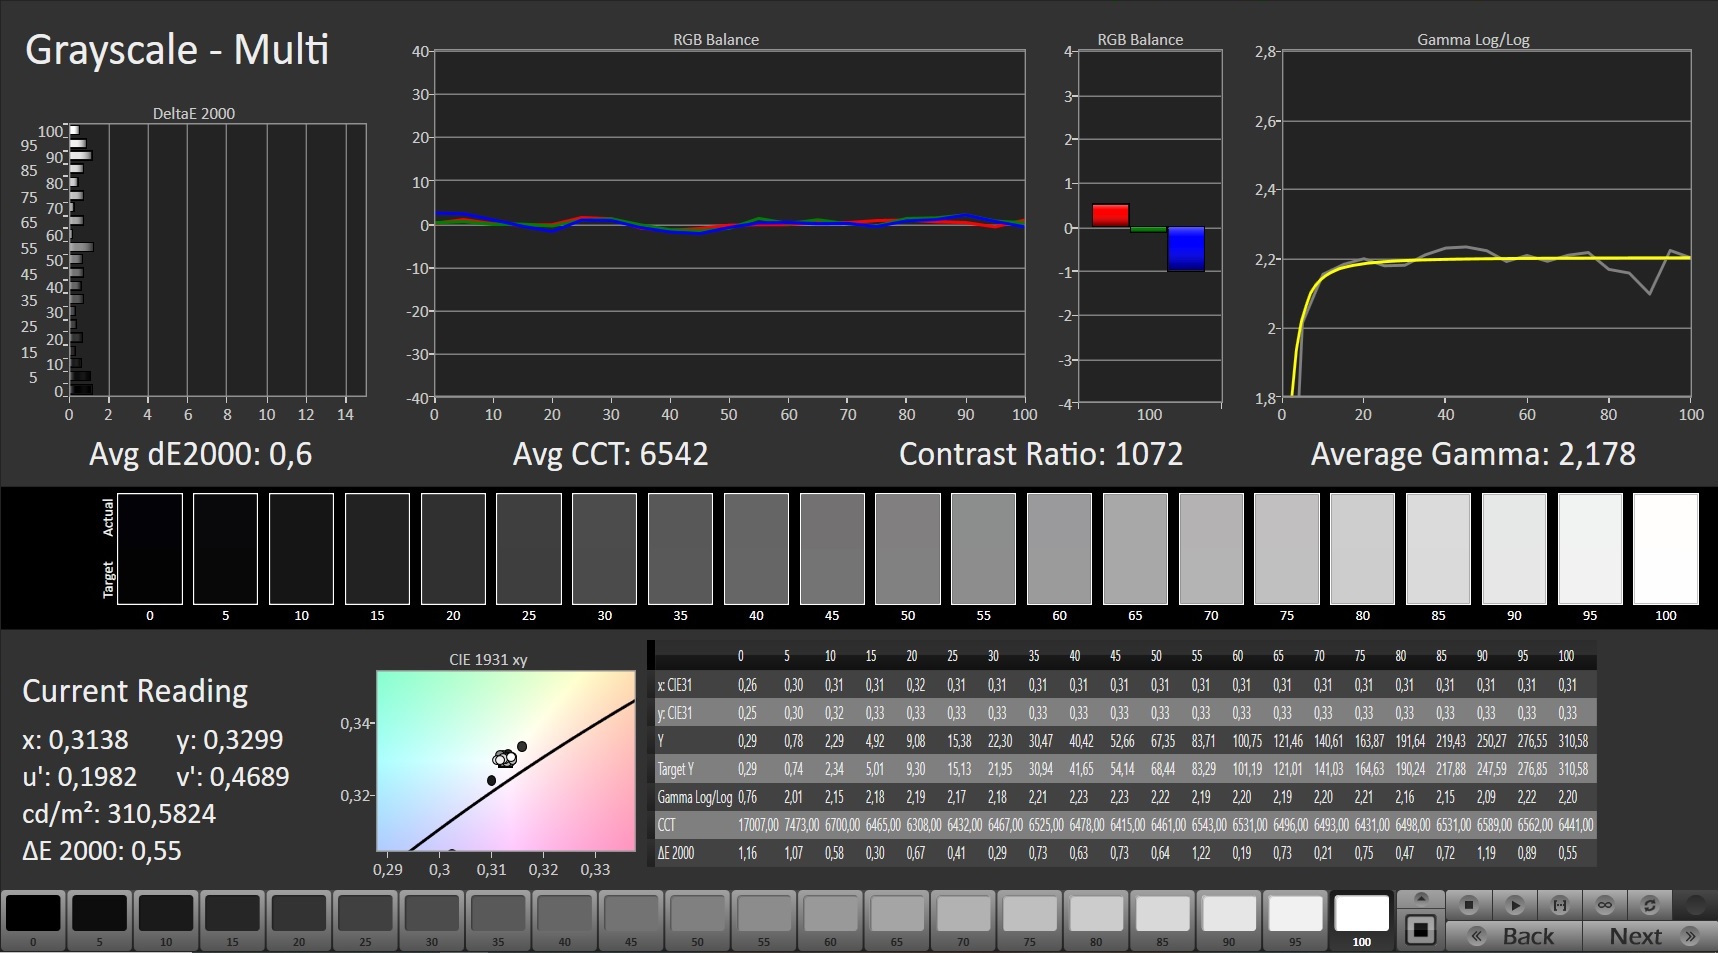
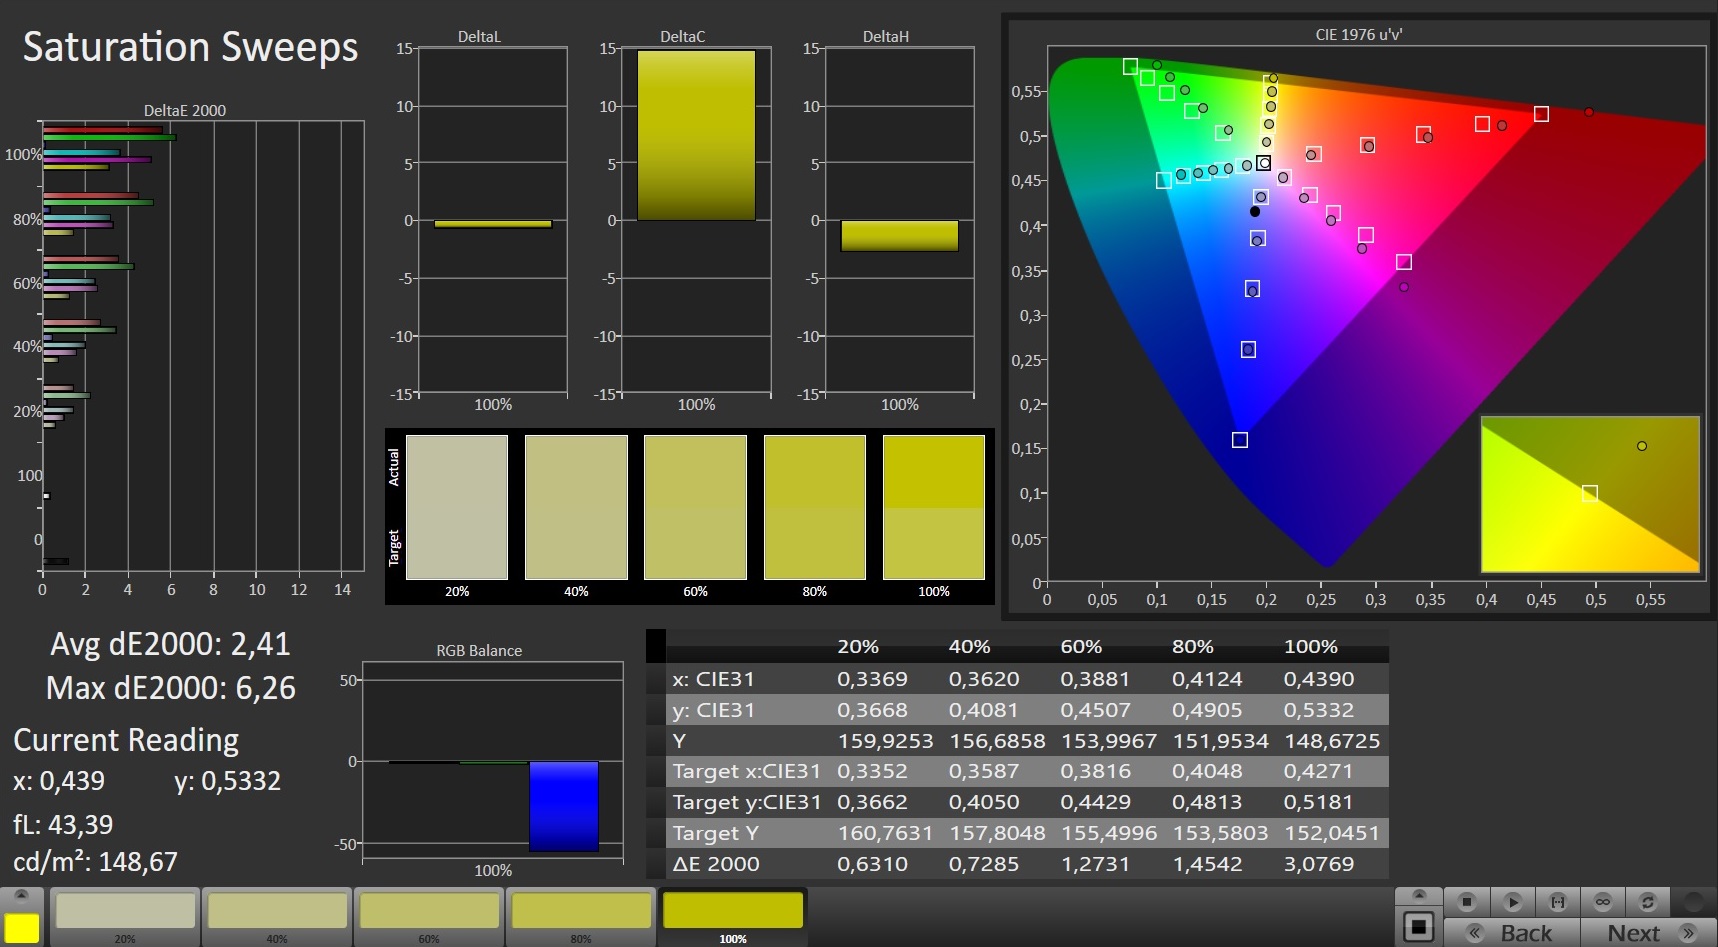
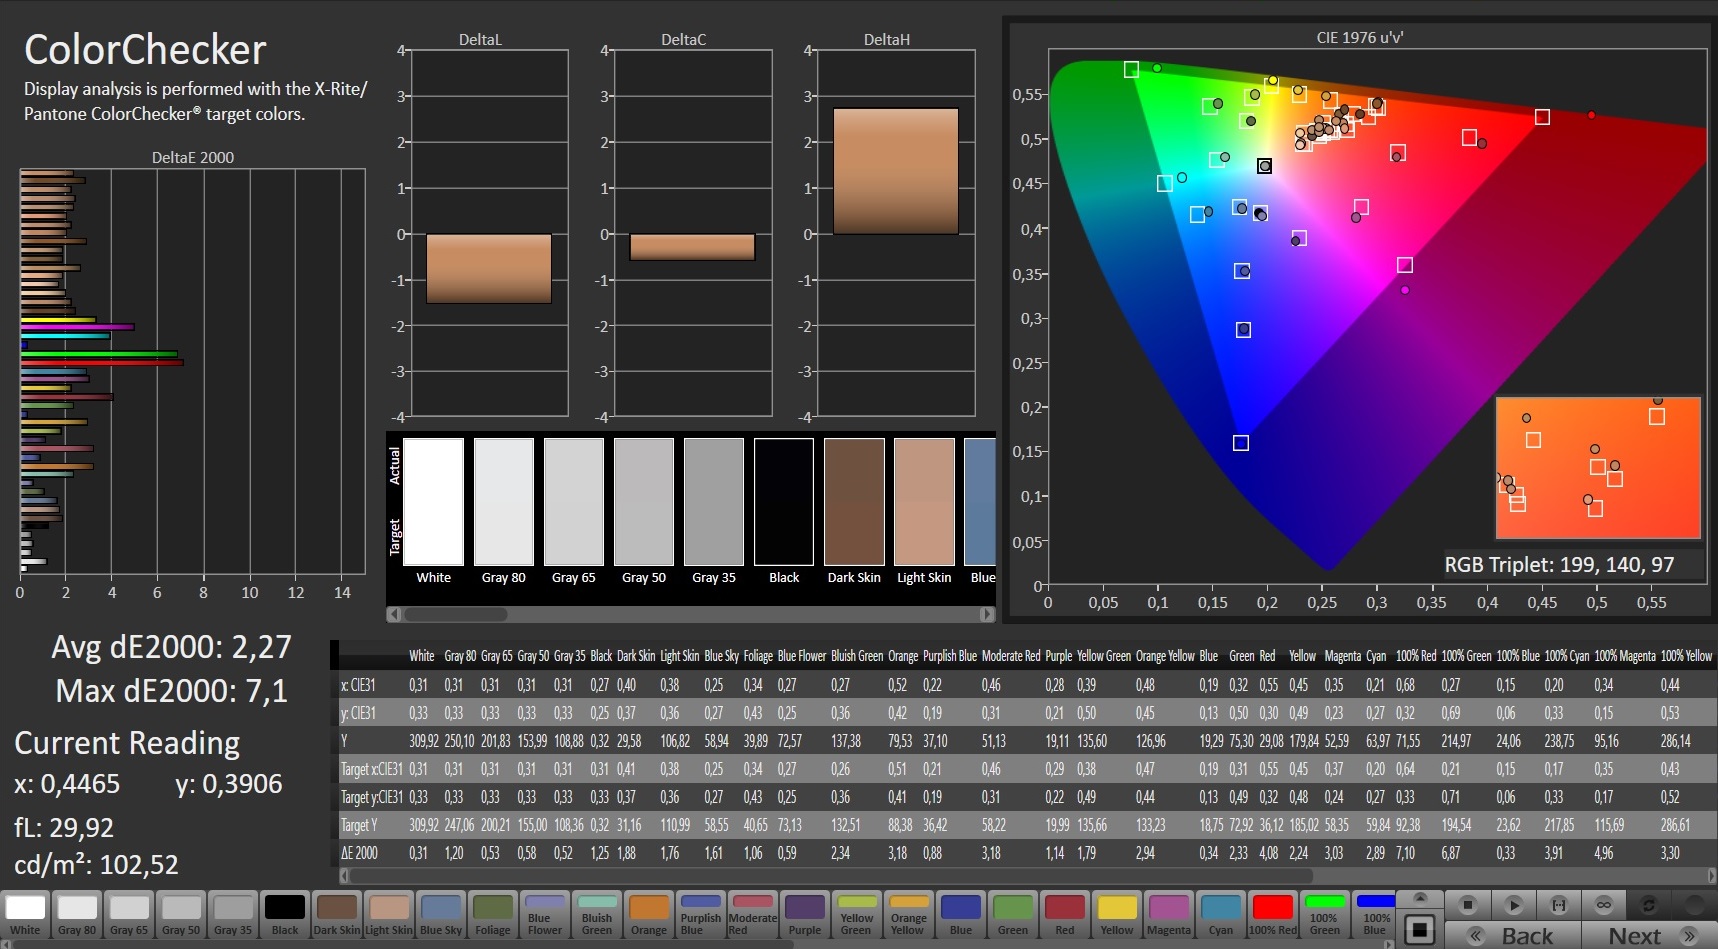
The color accuracy, which is decent out of the box, can be brought to a very good level via calibration (see Calman screenshots).
The rest of the panel's values are less spectacular. With a brightness of just under 310 cd/m² and a contrast of around 1,000:1, the ROG Zephyrus G15 settles in the midfield. The same applies to the black level (0.33 cd/m²). The viewing angles are at the typical IPS level.
Display Response Times
| ↔ Response Time Black to White | ||
|---|---|---|
| 11.2 ms ... rise ↗ and fall ↘ combined | ↗ 6.8 ms rise | 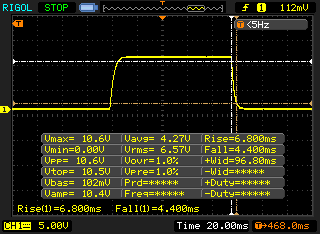 |
| ↘ 4.4 ms fall | ||
| The screen shows good response rates in our tests, but may be too slow for competitive gamers. In comparison, all tested devices range from 0.1 (minimum) to 240 (maximum) ms. » 25 % of all devices are better. This means that the measured response time is better than the average of all tested devices (21.5 ms). | ||
| ↔ Response Time 50% Grey to 80% Grey | ||
| 8.8 ms ... rise ↗ and fall ↘ combined | ↗ 4.4 ms rise | 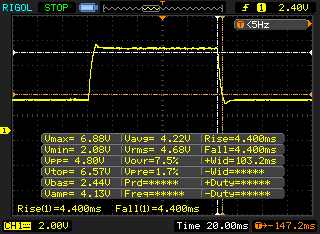 |
| ↘ 4.4 ms fall | ||
| The screen shows fast response rates in our tests and should be suited for gaming. In comparison, all tested devices range from 0.2 (minimum) to 636 (maximum) ms. » 17 % of all devices are better. This means that the measured response time is better than the average of all tested devices (33.7 ms). | ||
Screen Flickering / PWM (Pulse-Width Modulation)
| Screen flickering / PWM not detected |  | ||
In comparison: 53 % of all tested devices do not use PWM to dim the display. If PWM was detected, an average of 17900 (minimum: 5 - maximum: 3846000) Hz was measured. | |||
Test conditions
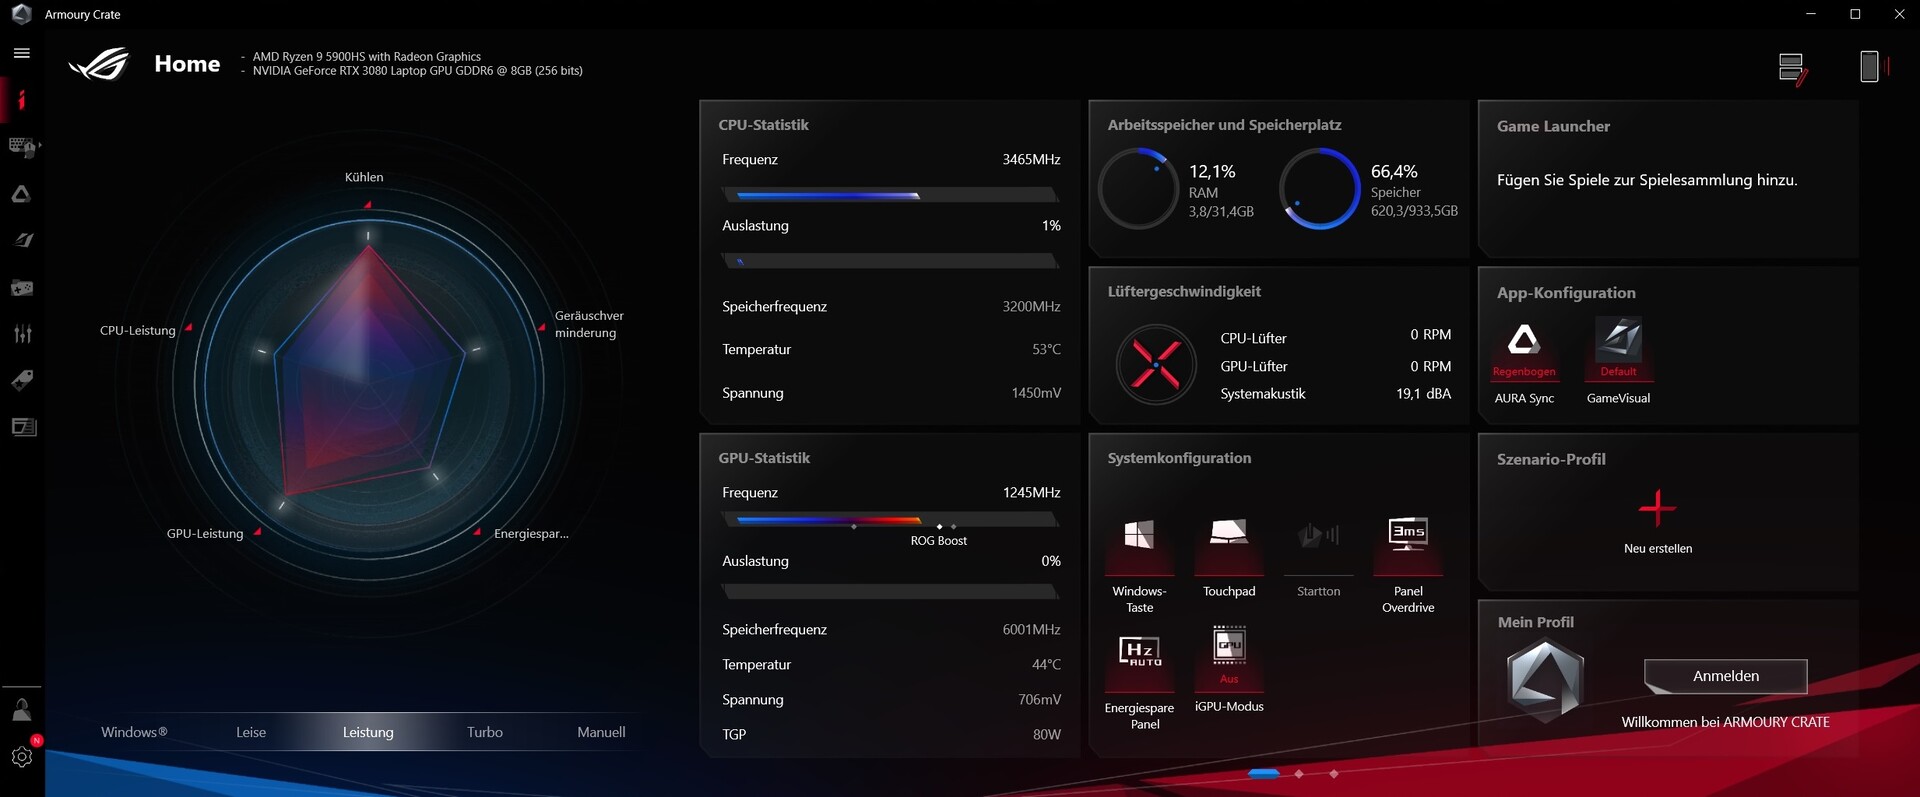
As usual, Asus puts its powerful Armoury Crate software on the system, which offers dozens of settings and tuning options. Our measurements were conducted using the "Performance" profile.
Performance
Despite its compact dimensions, the Zephyrus G15 is a true high-end laptop that should have enough power for all common application scenarios in the coming years.
Processor
With the Cezanne generation, AMD further increases the pressure on its main competitor Intel, which is increasingly falling behind in terms of technology.
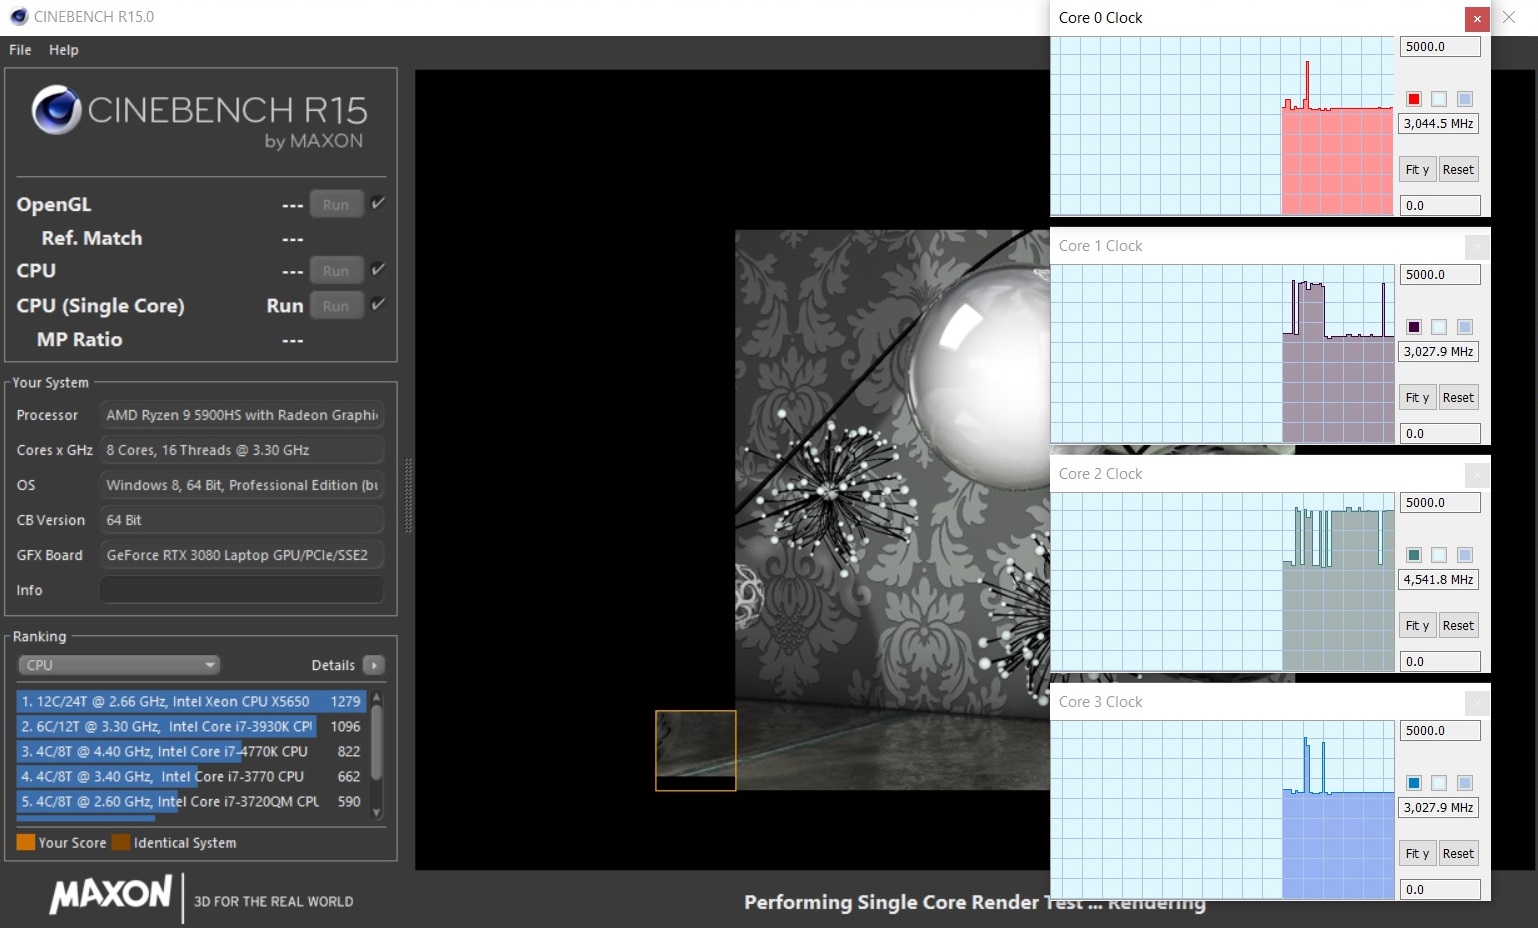
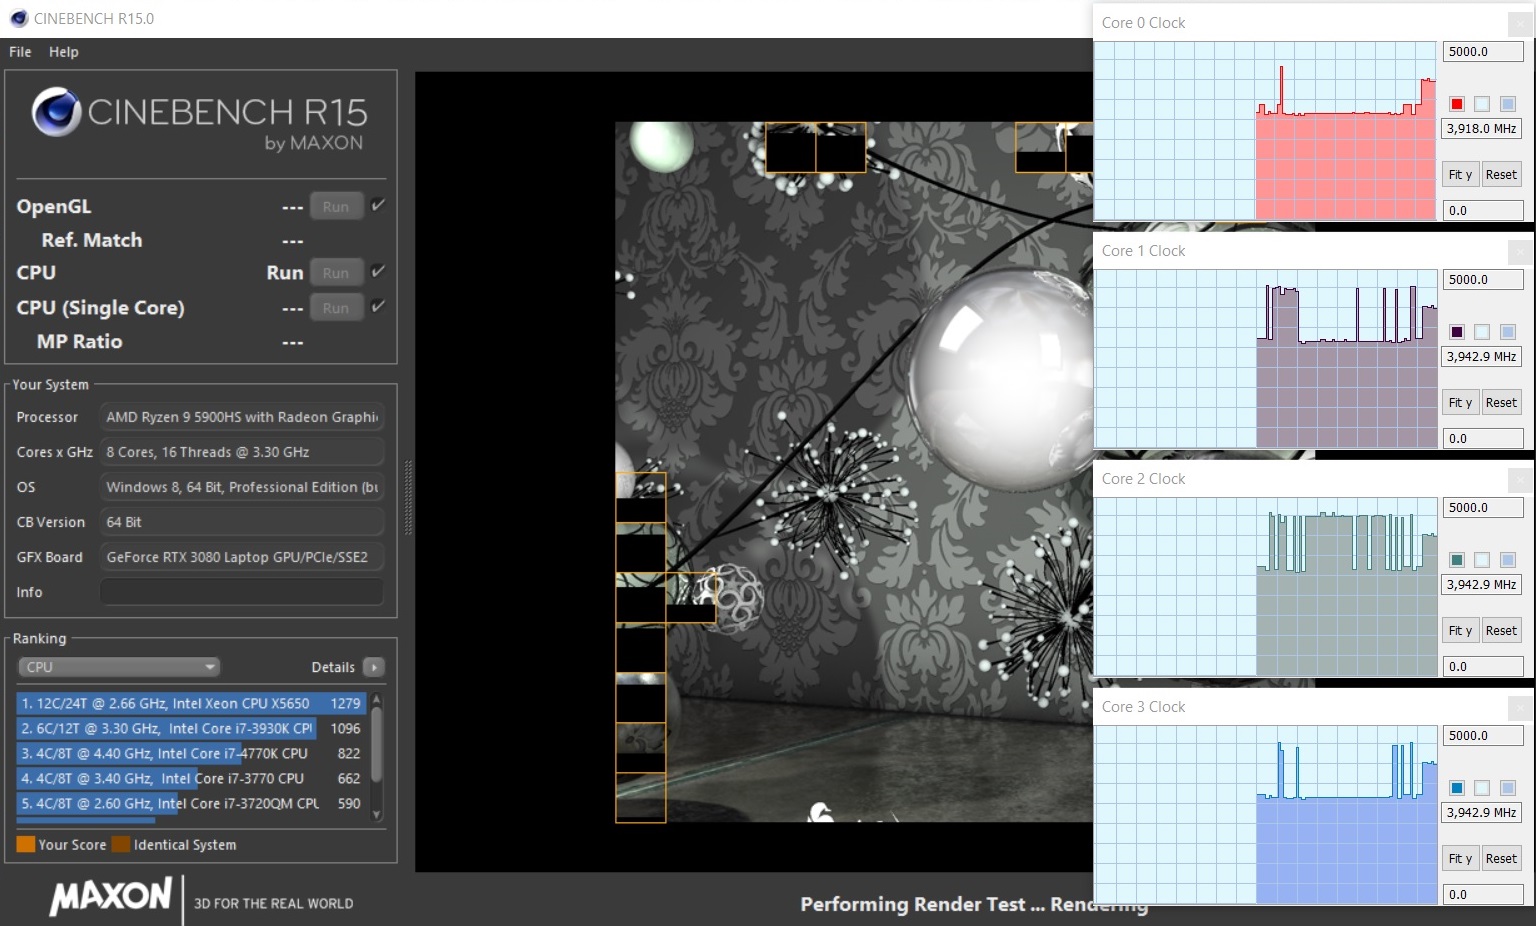
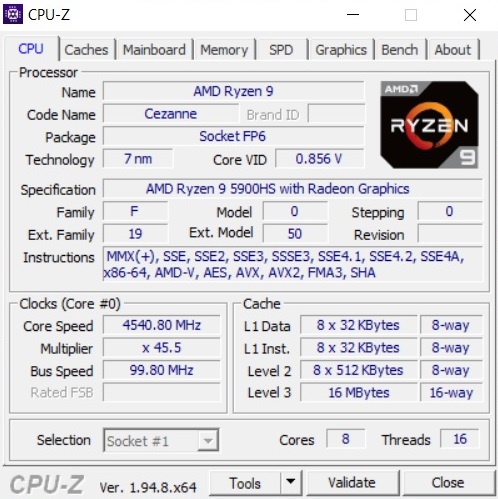
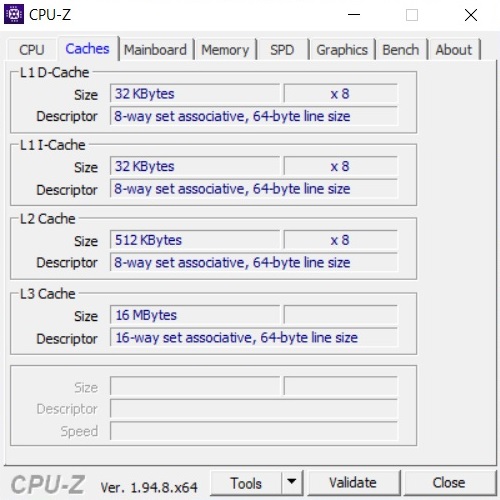
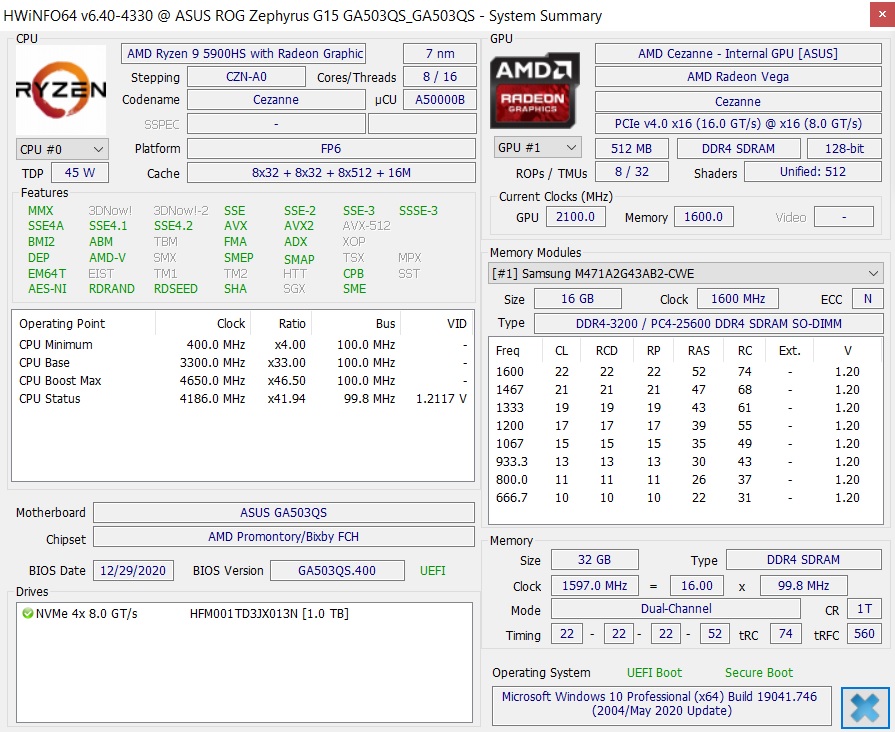
The 7 nm Ryzen 9 5900HS in the G15 belongs to the upper class and can boast 8 cores (16 threads in parallel via SMT) and 16 MB of L3 cache. The base clock speed of 3.3 GHz is increased up to 4.6 GHz under load via Turbo. According to Cinebench R15, the 35-watt CPU reaches between 3.0 and 4.5 GHz in single-core scenarios, whereas the clock rate settles at around 4.0 GHz when all cores are loaded.
Compared to Intel's Comet Lake chips, the R9 5900HS does very well. As you can see in the tables below, even the expensive Core i9-10980HK top model can't keep up with the AMD CPU. Correspondingly, the choice of a Cezanne processor is spot on from a price-performance perspective.
* ... smaller is better
System performance
System benchmarks also benefit from the fast CPU. With a PCMark 10 score of 6,896 points, the Zephyrus G15 is able to outperform the competition, which - at least on paper - lags between 5% and 26% behind. Subjectively speaking, all comparison devices offer a very high system speed.
| PCMark 10 Score | 6896 points | |
Help | ||
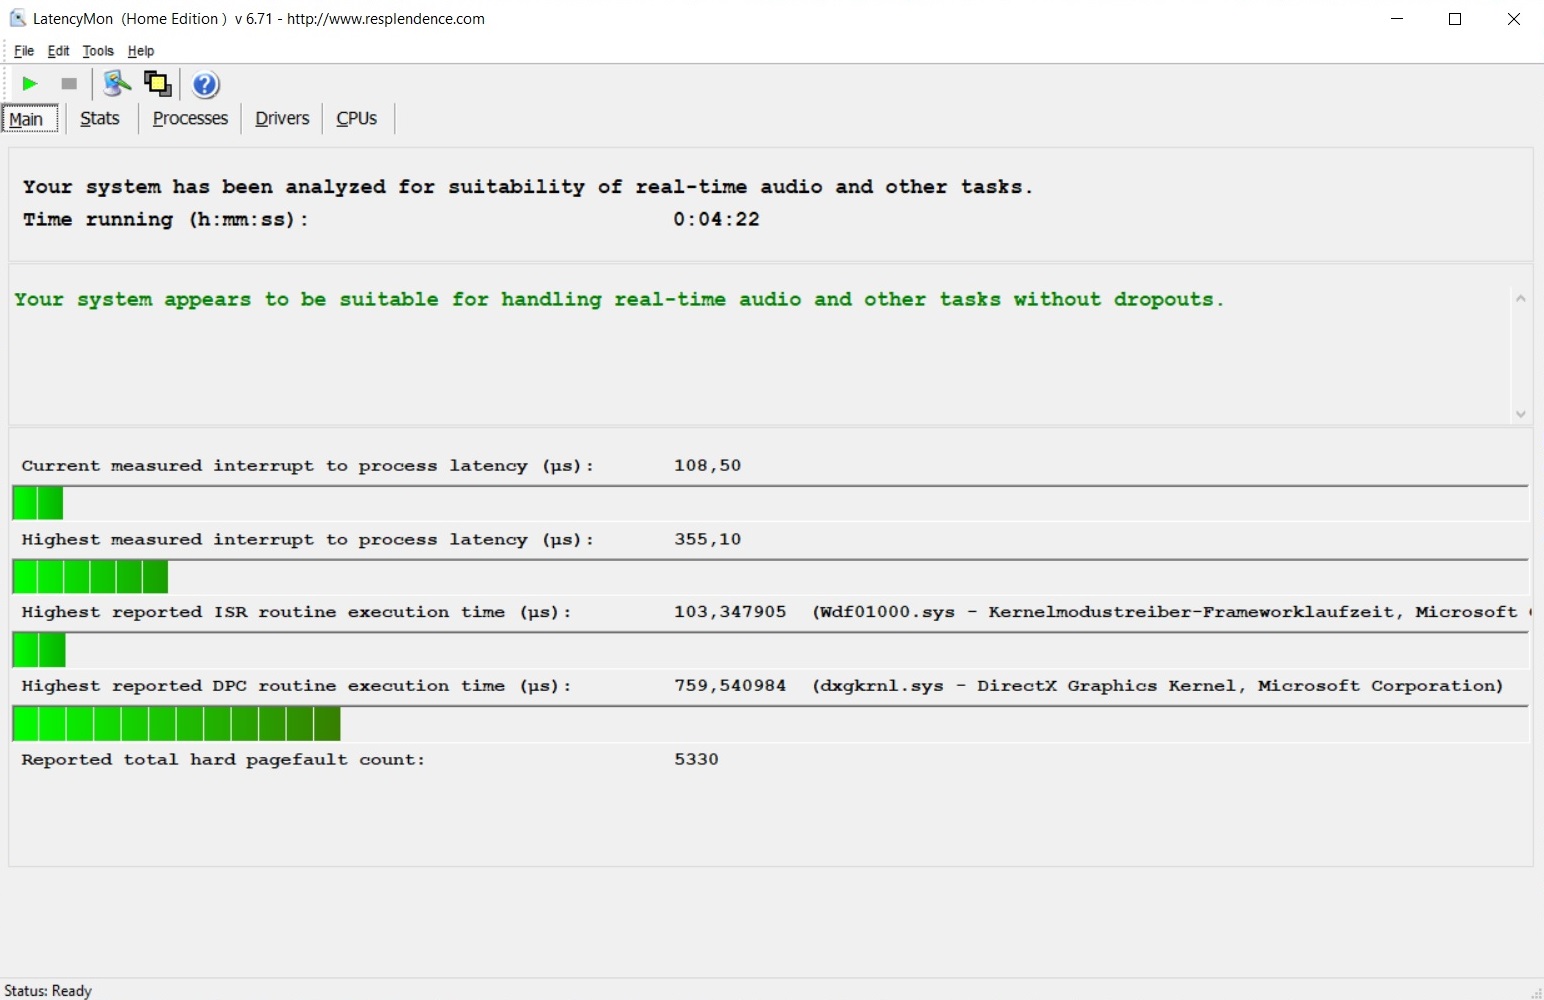
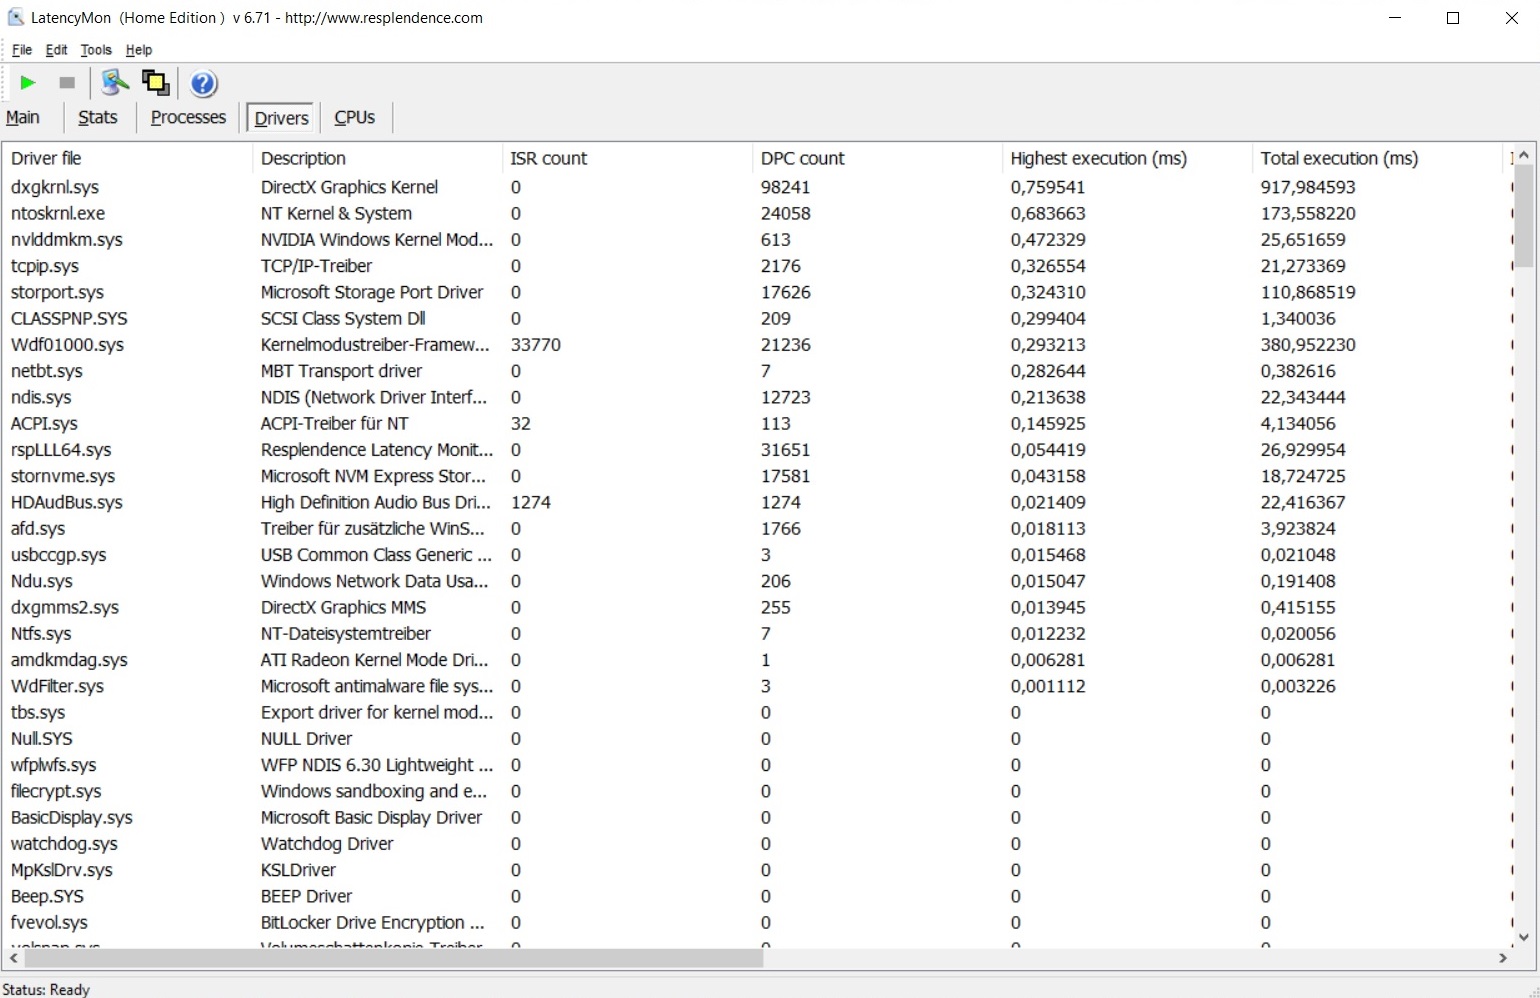
DPC latencies
Asus doesn't mess up when it comes to latencies either. The LatencyMon tool shows that the 15-incher is fully suitable for practical use. Some rivals reveal weaknesses here.
| DPC Latencies / LatencyMon - interrupt to process latency (max), Web, Youtube, Prime95 | |
| Acer Predator Triton 500 PT515-52-70N3 | |
| Lenovo Legion 7 15IMH05-81YT001VGE | |
| MSI GS66 10SGS | |
| Razer Blade 15 RTX 2080 Super Max-Q | |
| Asus ROG Zephyrus G15 GA503Q | |
* ... smaller is better
Storage
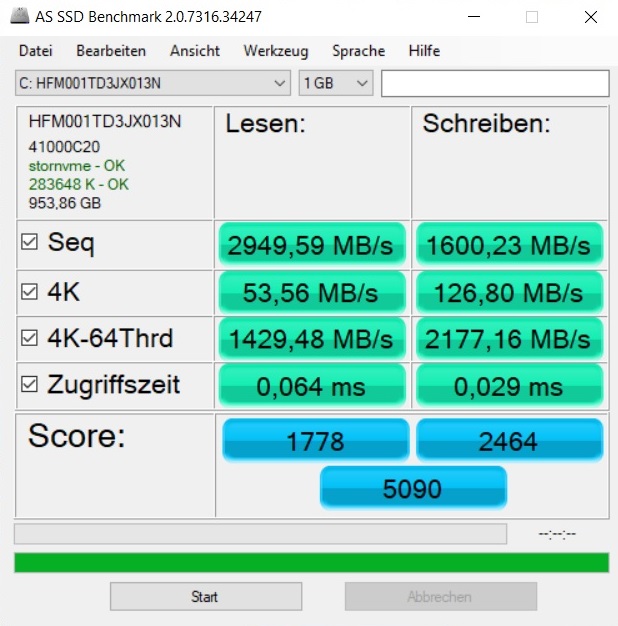
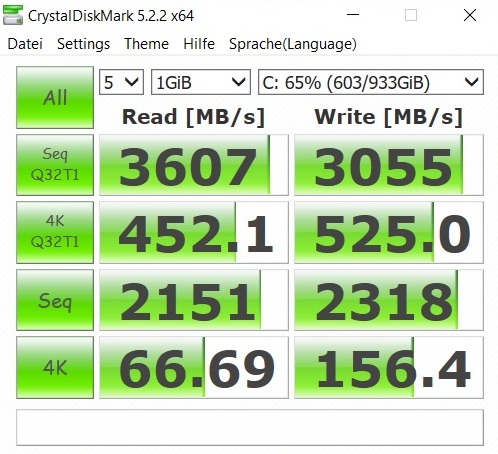
Although the storage drive comes from the rather unknown brand SK Hynix, the 1 TB SSD can easily compete with the Samsung models from the competition. The PCIe 4 drive achieves a very high speed for both small and large files. A second M.2 slot is available for upgrades.
| Asus ROG Zephyrus G15 GA503Q SK Hynix HFM001TD3JX013N | MSI GS66 10SGS Samsung SSD PM981 MZVLB512HAJQ | Razer Blade 15 RTX 2080 Super Max-Q Samsung PM981a MZVLB1T0HBLR | Acer Predator Triton 500 PT515-52-70N3 Samsung SSD PM981a MZVLB512HBJQ | Lenovo Legion 7 15IMH05-81YT001VGE 2x Samsung PM981a MZVLB1T0HBLR (RAID 0) | |
|---|---|---|---|---|---|
| CrystalDiskMark 5.2 / 6 | -16% | -6% | -5% | -6% | |
| Write 4K | 156.4 | 132.5 -15% | 135.7 -13% | 131.7 -16% | 110.4 -29% |
| Read 4K | 66.7 | 45.03 -32% | 46.98 -30% | 47.34 -29% | 55.1 -17% |
| Write Seq | 2318 | 1987 -14% | 2180 -6% | 2884 24% | |
| Read Seq | 2151 | 1434 -33% | 1949 -9% | 2303 7% | |
| Write 4K Q32T1 | 525 | 467.5 -11% | 510 -3% | 423.9 -19% | 466.6 -11% |
| Read 4K Q32T1 | 452.1 | 536 19% | 569 26% | 487.7 8% | 517 14% |
| Write Seq Q32T1 | 3055 | 2003 -34% | 2984 -2% | 2822 -8% | 3424 12% |
| Read Seq Q32T1 | 3607 | 3306 -8% | 3238 -10% | 3478 -4% | 3519 -2% |
| AS SSD | -31% | -6% | -5% | -4% | |
| Seq Read | 2950 | 1086 -63% | 1950 -34% | 2767 -6% | 3088 5% |
| Seq Write | 1600 | 1901 19% | 2322 45% | 2613 63% | 2561 60% |
| 4K Read | 53.6 | 51 -5% | 45.48 -15% | 47.55 -11% | 43.01 -20% |
| 4K Write | 126.8 | 117.3 -7% | 95.4 -25% | 98.9 -22% | 102 -20% |
| 4K-64 Read | 1429 | 1503 5% | 1484 4% | 1205 -16% | 1549 8% |
| 4K-64 Write | 2177 | 1721 -21% | 1887 -13% | 2007 -8% | 1378 -37% |
| Access Time Read * | 0.064 | 0.059 8% | 0.051 20% | 0.065 -2% | 0.051 20% |
| Access Time Write * | 0.029 | 0.1 -245% | 0.038 -31% | 0.038 -31% | 0.037 -28% |
| Score Read | 1778 | 1662 -7% | 1725 -3% | 1529 -14% | 1901 7% |
| Score Write | 2464 | 2029 -18% | 2215 -10% | 2367 -4% | 1737 -30% |
| Score Total | 5090 | 4588 -10% | 4843 -5% | 4677 -8% | 4583 -10% |
| Total Average (Program / Settings) | -24% /
-25% | -6% /
-6% | -5% /
-5% | -5% /
-5% |
* ... smaller is better

Continuous load read: DiskSpd Read Loop, Queue Depth 8
Graphics card
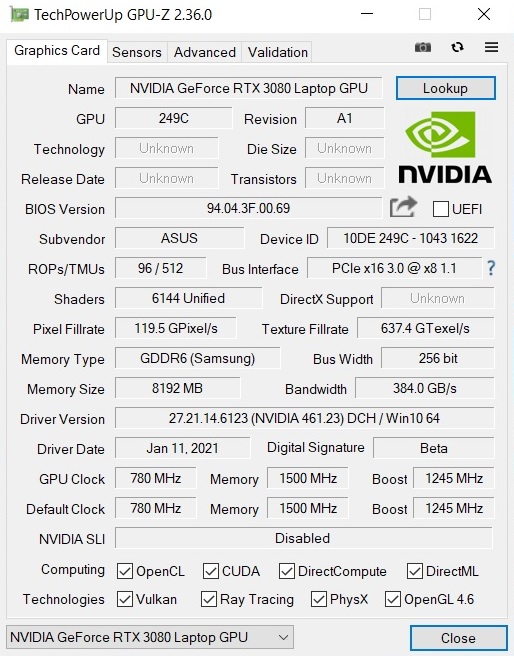
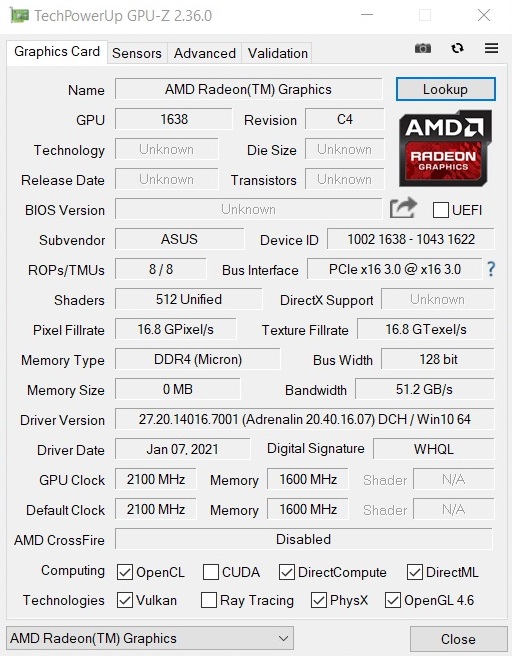
In order not to overtax the cooling system of the slim 15-inch case, Asus uses the weakest version of the RTX 3080 laptop GPU that has an 80-watt TDP (100 watts including Dynamic Boost).
| 3DMark Cloud Gate Standard Score | 42022 points | |
| 3DMark Fire Strike Score | 20784 points | |
| 3DMark Time Spy Score | 9391 points | |
Help | ||
The low TDP has a correspondingly negative impact on performance. Despite the large number of shaders, which is far from the desktop counterpart's level (6,144 vs. 8,704), the RTX 3080 laptop version can hardly distinguish itself from devices based on the RTX 2080 (Super) Max-Q in the 3D benchmarks. As a result, buyers shouldn't expect a big performance leap.
8 GB of GDDR6 VRAM is also a bit meager in 2021 considering the video memory requirements of many modern games. A minimum of 10 GB would have been appropriate here (at least the 3080 laptop version is also available as a 16 GB model).
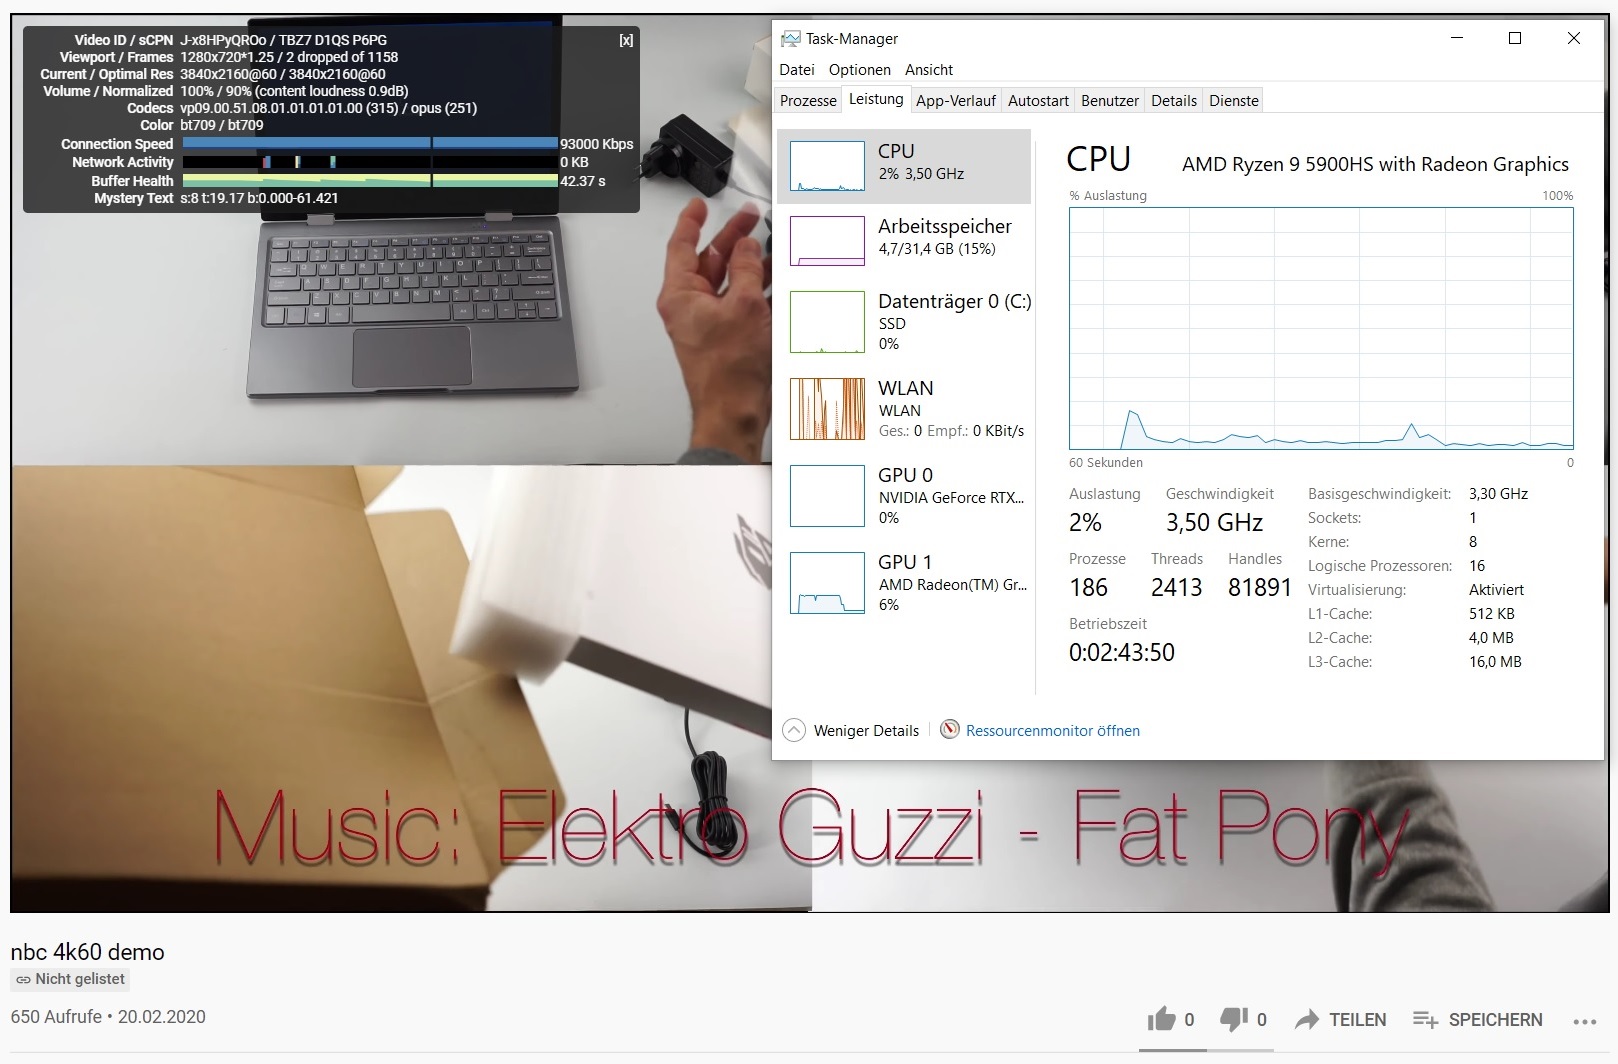
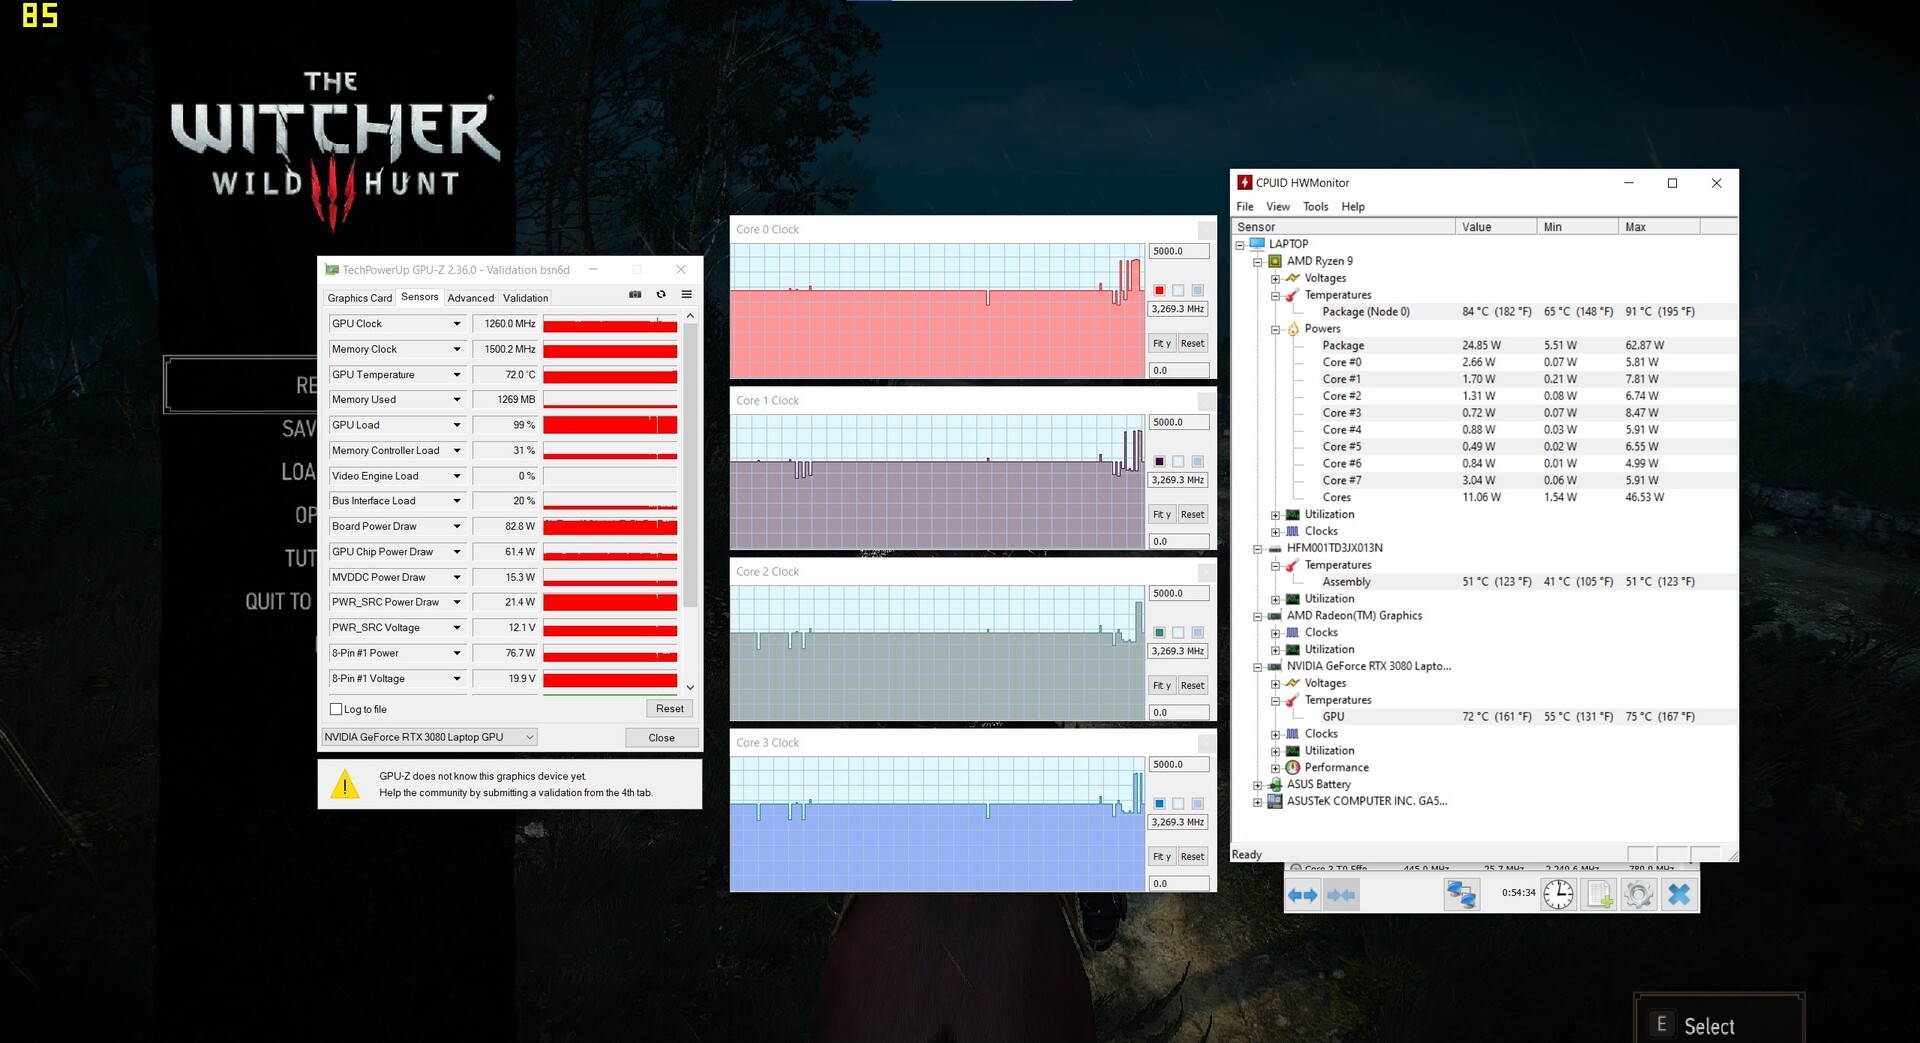
We tested how the GPU behaves over a prolonged period of time with the RPG heavyweight The Witcher 3 for about 60 minutes (Full HD/Ultra). On average, the RTX 3080 laptop GPU ran at 1,260 MHz (base clock speed of 780 MHz) and did not suffer from any performance drops
Gaming Performance
As long as you limit yourself to the native resolution, the Zephyrus G15 delivers very good performance in games. 2560x1440 pixels and maximum details is even possible in demanding titles, although it's not always enough to exceed 60 FPS (see comparison table).
| The Witcher 3 | |
| 1920x1080 Ultra Graphics & Postprocessing (HBAO+) | |
| Average of class Gaming (8.61 - 216, n=226, last 2 years) | |
| Asus ROG Zephyrus G15 GA503Q | |
| Lenovo Legion 7 15IMH05-81YT001VGE | |
| Razer Blade 15 RTX 2080 Super Max-Q | |
| Acer Predator Triton 500 PT515-52-70N3 | |
| MSI GS66 10SGS | |
| 3840x2160 High Graphics & Postprocessing (Nvidia HairWorks Off) | |
| Average of class Gaming (50.6 - 167.6, n=49, last 2 years) | |
| Asus ROG Zephyrus G15 GA503Q | |
| Acer Predator Triton 500 PT515-52-70N3 | |
| low | med. | high | ultra | QHD | 4K | |
| GTA V (2015) | 177 | 152 | 90 | |||
| The Witcher 3 (2015) | 155 | 90.2 | 62.2 | |||
| Dota 2 Reborn (2015) | 148 | 140 | 126 | 119 | ||
| X-Plane 11.11 (2018) | 103 | 88 | 72.4 | |||
| Shadow of the Tomb Raider (2018) | 111 | 106 | 79 | 43 | ||
| Battlefield V (2018) | 131 | 125 | 98.3 | 59.2 | ||
| Apex Legends (2019) | 144 | 144 | 120 | 69.2 | ||
| Far Cry New Dawn (2019) | 101 | 90 | 78 | 50 | ||
| Metro Exodus (2019) | 85 | 68.7 | 53.8 | 35.4 | ||
| The Division 2 (2019) | 105 | 82 | 56 | 31 | ||
| Anno 1800 (2019) | 77.6 | 44.3 | 37.9 | 25.2 | ||
| Rage 2 (2019) | 116 | 115 | 75.5 | 37.8 | ||
| Control (2019) | 82.3 | 55.7 | 29 | |||
| Borderlands 3 (2019) | 94.5 | 76.5 | 55.7 | 32.3 | ||
| GRID 2019 (2019) | 113 | 84.8 | 69.8 | 48.7 | ||
| Need for Speed Heat (2019) | 94.3 | 89.4 | 67.9 | 40.7 | ||
| Star Wars Jedi Fallen Order (2019) | 97.8 | 91.5 | 79 | 42.1 | ||
| Red Dead Redemption 2 (2019) | 85.1 | 57.5 | 46.9 | 31.2 | ||
| Hunt Showdown (2020) | 111 | 71.4 | 36.8 | |||
| Doom Eternal (2020) | 165 | 163 | 123 | 68 | ||
| Gears Tactics (2020) | 136 | 107 | 72.4 | 39.4 | ||
| F1 2020 (2020) | 162 | 131 | 103 | 60 | ||
| Death Stranding (2020) | 83.6 | 82.3 | 73.7 | 52.1 | ||
| Horizon Zero Dawn (2020) | 93 | 84 | 67 | 41 | ||
| Crysis Remastered (2020) | 79.2 | 56.9 | 45.2 | 29.4 | ||
| Serious Sam 4 (2020) | 93.3 | 80.2 | 67.2 | |||
| Mafia Definitive Edition (2020) | 98.7 | 70.7 | 37.2 | |||
| Star Wars Squadrons (2020) | 198 | 189 | 134 | 79.4 | ||
| FIFA 21 (2020) | 198 | 190 | 156 | 104 | ||
| Watch Dogs Legion (2020) | 82 | 65 | 52 | 31 | ||
| Dirt 5 (2020) | 85.6 | 56.4 | 42.7 | 39.6 | ||
| Assassin´s Creed Valhalla (2020) | 74 | 64 | 52 | 33 | ||
| Call of Duty Black Ops Cold War (2020) | 89.4 | 81.7 | 62.8 | 36.9 | ||
| Yakuza Like a Dragon (2020) | 112 | 101 | 67.1 | 35.8 | ||
| Immortals Fenyx Rising (2020) | 88 | 82 | 64 | 44 | ||
| Cyberpunk 2077 1.0 (2020) | 70 | 60.2 | 39.8 | 19.7 |
Emissions
Noise emissions
Although the Zephyrus G15 can get very loud in 3D mode with a maximum of 49 to 51 dB, noise development is roughly on par with the competition, which also screams for a headset when gaming. The situation is much quieter in idle mode. On the one hand, the fans sometimes turn off completely (silent operation), and on the other hand, the base noise level is quite decent considering it's only 27 dB.
Noise Level
| Idle |
| 26 / 27 / 31 dB(A) |
| Load |
| 49 / 51 dB(A) |
 | ||
30 dB silent 40 dB(A) audible 50 dB(A) loud |
||
min: | ||
| Asus ROG Zephyrus G15 GA503Q R9 5900HS, GeForce RTX 3080 Laptop GPU | MSI GS66 10SGS i7-10750H, GeForce RTX 2080 Super Max-Q | Razer Blade 15 RTX 2080 Super Max-Q i7-10875H, GeForce RTX 2080 Super Max-Q | Acer Predator Triton 500 PT515-52-70N3 i7-10750H, GeForce RTX 2080 Super Max-Q | Lenovo Legion 7 15IMH05-81YT001VGE i9-10980HK, GeForce RTX 2080 Super Max-Q | |
|---|---|---|---|---|---|
| Noise | -5% | -4% | -10% | 5% | |
| off / environment * | 25 | 28.5 -14% | 30.1 -20% | 30 -20% | 24.4 2% |
| Idle Minimum * | 26 | 30 -15% | 30.1 -16% | 30 -15% | 24.4 6% |
| Idle Average * | 27 | 30 -11% | 30.1 -11% | 33 -22% | 24.4 10% |
| Idle Maximum * | 31 | 30.9 -0% | 30.1 3% | 36 -16% | 24.4 21% |
| Load Average * | 49 | 39.5 19% | 46.8 4% | 50 -2% | 49.3 -1% |
| Witcher 3 ultra * | 49 | 48 2% | 48.4 1% | 48 2% | 54 -10% |
| Load Maximum * | 51 | 59.4 -16% | 46 10% | 50 2% | 46.6 9% |
* ... smaller is better
Temperature
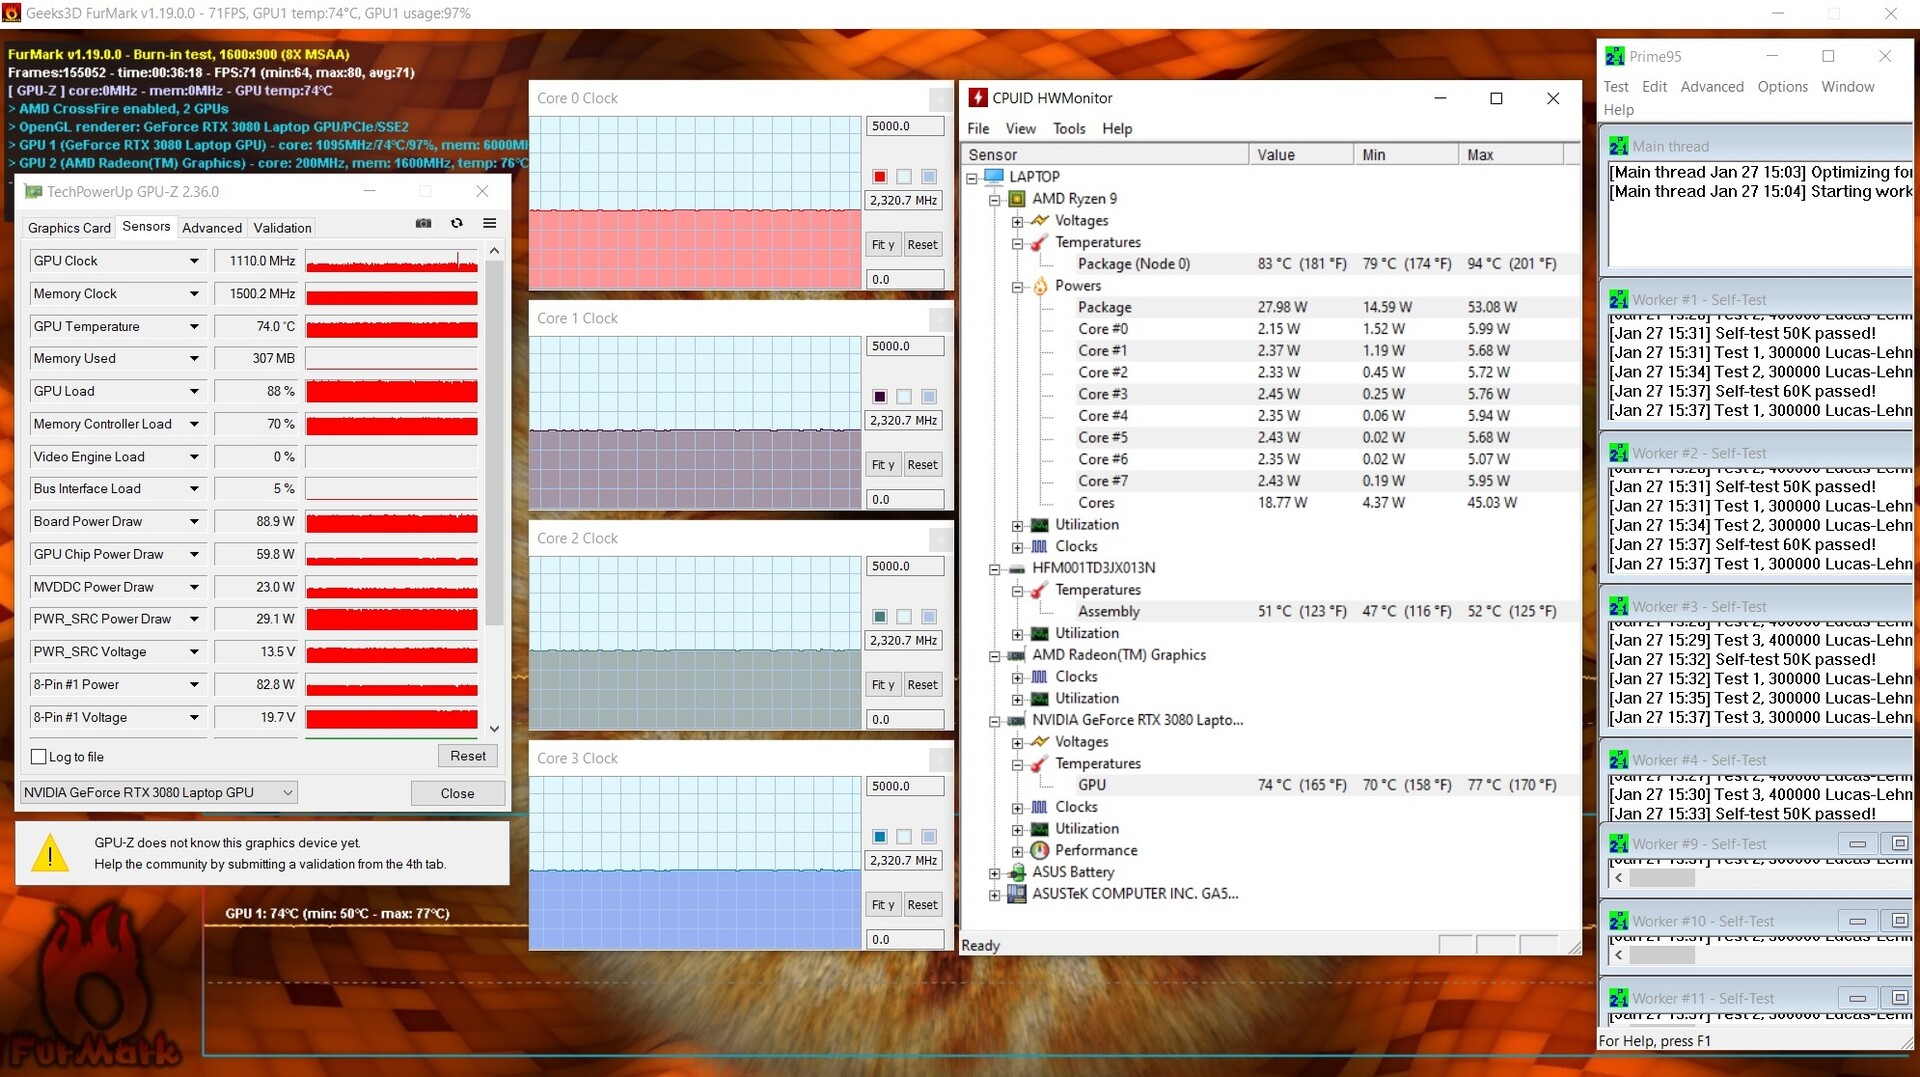
Heat development is a bit worse on the Zephyrus G15 than on its (technically outdated) opponents. In thiss way, we were able to obtain up to 51 °C (~124 °F) on the top and up to 56 °C (~133 °F) on the bottom of the chassis in the stress test with the FurMark and Prime95 tools. The case reaches about 30 °C (~86 °F) in idle usage. Furthermore, the components don't get excessively hot under load. While the GPU reaches just over 70 °C (~158 °F) in 3D applications, the CPU heats up to slightly over 80 °C (~176 °F).
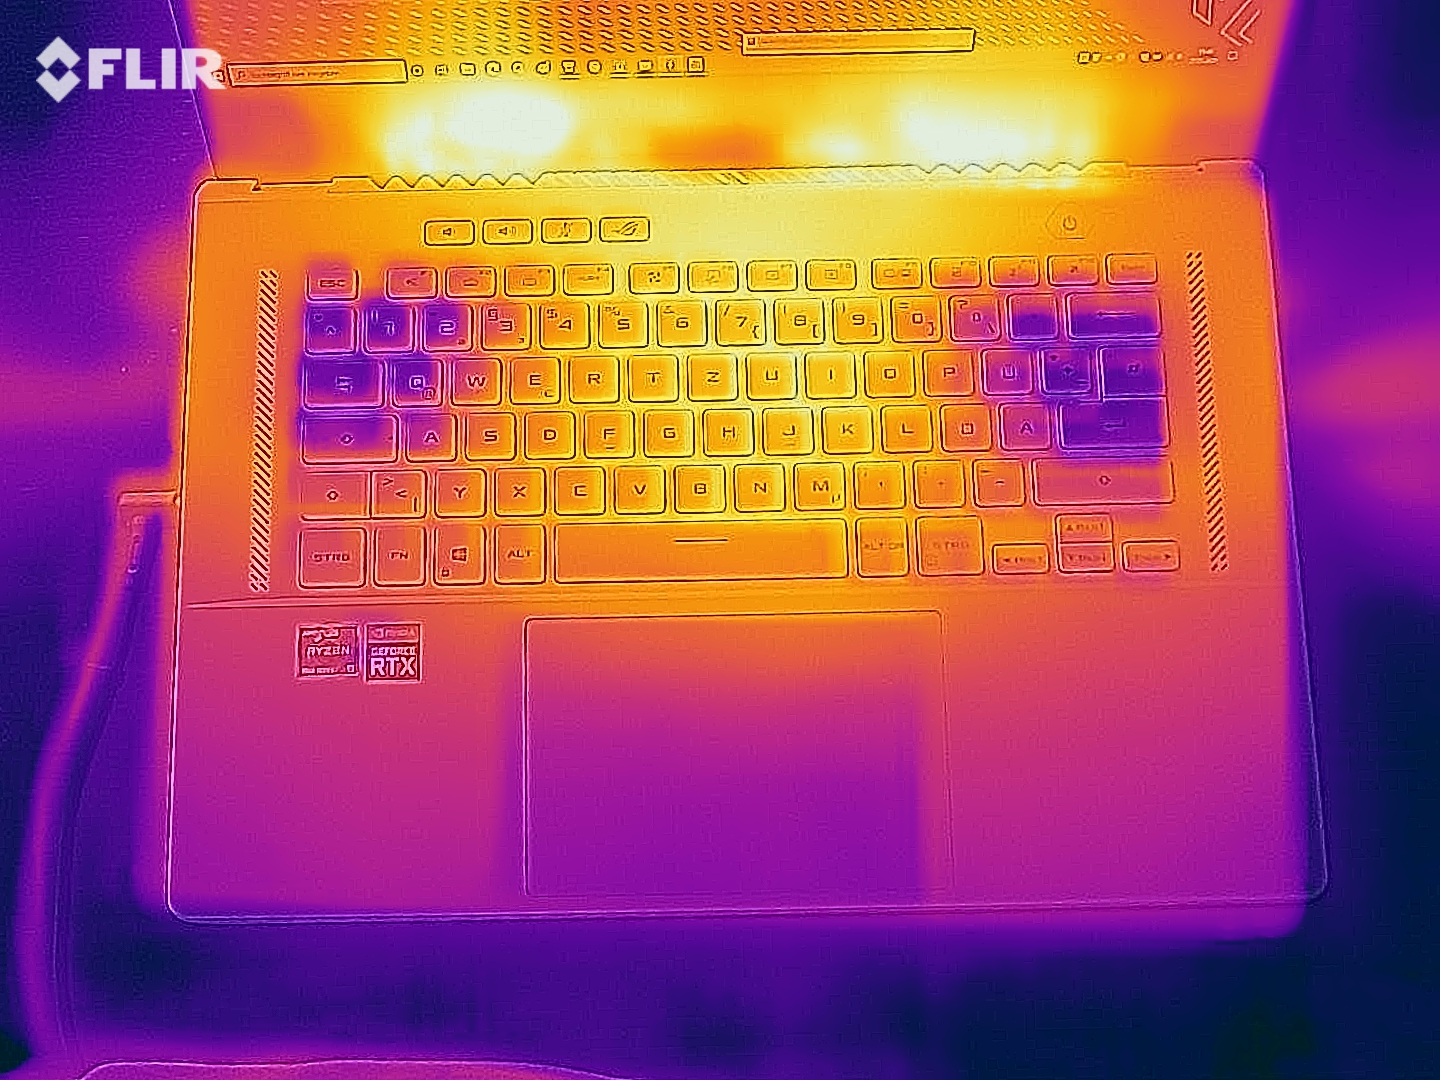
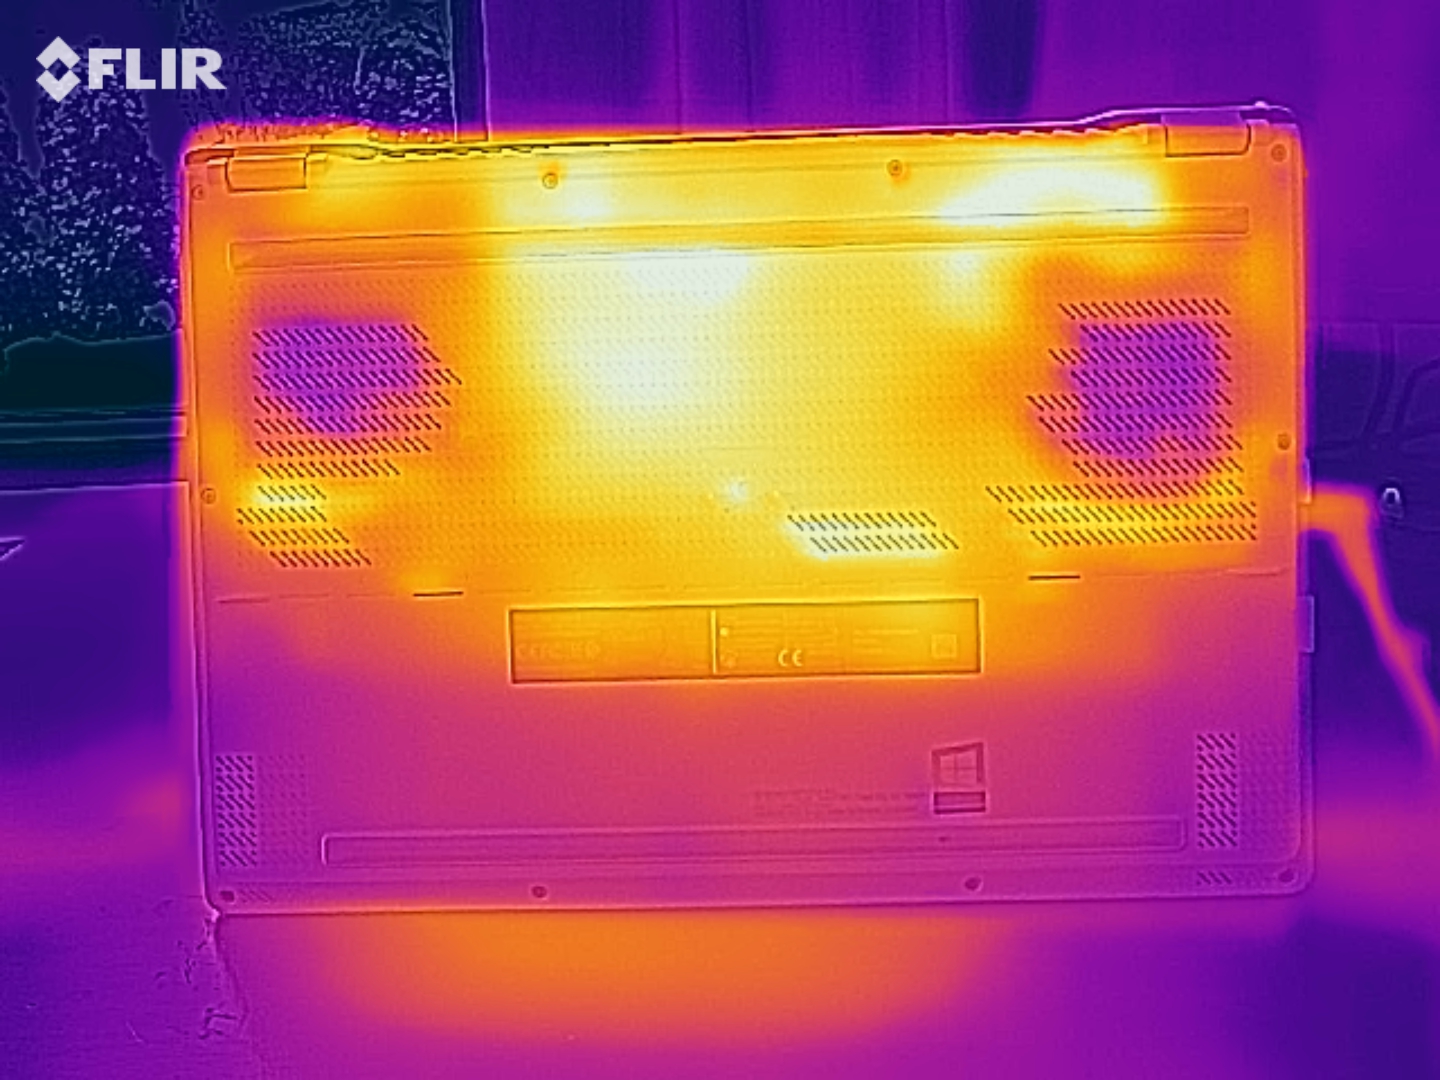
(-) The maximum temperature on the upper side is 51 °C / 124 F, compared to the average of 40.4 °C / 105 F, ranging from 21.2 to 68.8 °C for the class Gaming.
(-) The bottom heats up to a maximum of 56 °C / 133 F, compared to the average of 43.2 °C / 110 F
(+) In idle usage, the average temperature for the upper side is 28.2 °C / 83 F, compared to the device average of 33.8 °C / 93 F.
(±) Playing The Witcher 3, the average temperature for the upper side is 37.8 °C / 100 F, compared to the device average of 33.8 °C / 93 F.
(±) The palmrests and touchpad can get very hot to the touch with a maximum of 39 °C / 102.2 F.
(-) The average temperature of the palmrest area of similar devices was 28.9 °C / 84 F (-10.1 °C / -18.2 F).
| Asus ROG Zephyrus G15 GA503Q R9 5900HS, GeForce RTX 3080 Laptop GPU | MSI GS66 10SGS i7-10750H, GeForce RTX 2080 Super Max-Q | Razer Blade 15 RTX 2080 Super Max-Q i7-10875H, GeForce RTX 2080 Super Max-Q | Acer Predator Triton 500 PT515-52-70N3 i7-10750H, GeForce RTX 2080 Super Max-Q | Lenovo Legion 7 15IMH05-81YT001VGE i9-10980HK, GeForce RTX 2080 Super Max-Q | |
|---|---|---|---|---|---|
| Heat | 5% | 3% | 9% | 21% | |
| Maximum Upper Side * | 51 | 47.8 6% | 52 -2% | 44 14% | 35.2 31% |
| Maximum Bottom * | 56 | 54.4 3% | 53 5% | 50 11% | 32.5 42% |
| Idle Upper Side * | 29 | 27.4 6% | 29.3 -1% | 29 -0% | 29.4 -1% |
| Idle Bottom * | 34 | 32 6% | 30.2 11% | 31 9% | 29.6 13% |
* ... smaller is better
Speakers
A big surprise awaits when it comes to the sound system. In contrast to most laptops, which are especially weak in terms of bass, the Zephyrus G15 offers a very balanced and powerful sound - by laptop standards - that outshines the competition. No wonder, since Asus has installed a total of 6 speakers.
Asus ROG Zephyrus G15 GA503Q audio analysis
(±) | speaker loudness is average but good (78 dB)
Bass 100 - 315 Hz
(+) | good bass - only 4% away from median
(+) | bass is linear (6.5% delta to prev. frequency)
Mids 400 - 2000 Hz
(+) | balanced mids - only 4.6% away from median
(+) | mids are linear (2.1% delta to prev. frequency)
Highs 2 - 16 kHz
(+) | balanced highs - only 3.5% away from median
(+) | highs are linear (5.7% delta to prev. frequency)
Overall 100 - 16.000 Hz
(+) | overall sound is linear (11.2% difference to median)
Compared to same class
» 7% of all tested devices in this class were better, 3% similar, 90% worse
» The best had a delta of 6%, average was 18%, worst was 132%
Compared to all devices tested
» 5% of all tested devices were better, 2% similar, 94% worse
» The best had a delta of 4%, average was 25%, worst was 134%
Apple MacBook 12 (Early 2016) 1.1 GHz audio analysis
(+) | speakers can play relatively loud (83.6 dB)
Bass 100 - 315 Hz
(±) | reduced bass - on average 11.3% lower than median
(±) | linearity of bass is average (14.2% delta to prev. frequency)
Mids 400 - 2000 Hz
(+) | balanced mids - only 2.4% away from median
(+) | mids are linear (5.5% delta to prev. frequency)
Highs 2 - 16 kHz
(+) | balanced highs - only 2% away from median
(+) | highs are linear (4.5% delta to prev. frequency)
Overall 100 - 16.000 Hz
(+) | overall sound is linear (10.2% difference to median)
Compared to same class
» 5% of all tested devices in this class were better, 2% similar, 93% worse
» The best had a delta of 5%, average was 19%, worst was 53%
Compared to all devices tested
» 3% of all tested devices were better, 1% similar, 96% worse
» The best had a delta of 4%, average was 25%, worst was 134%
Energy management
Energy consumption
The built-in graphics switching solution (Nvidia Optimus) leads to moderate energy consumption in idle usage. 10 to 17 watts could also come from a much weaker multimedia laptop. Under load, our measuring device displayed between 108 and 182 watts, which is also acceptable in view of the performance offered - especially when you consider the competition.
| Off / Standby | |
| Idle | |
| Load |
|
| Asus ROG Zephyrus G15 GA503Q R9 5900HS, GeForce RTX 3080 Laptop GPU | MSI GS66 10SGS i7-10750H, GeForce RTX 2080 Super Max-Q | Razer Blade 15 RTX 2080 Super Max-Q i7-10875H, GeForce RTX 2080 Super Max-Q | Acer Predator Triton 500 PT515-52-70N3 i7-10750H, GeForce RTX 2080 Super Max-Q | Lenovo Legion 7 15IMH05-81YT001VGE i9-10980HK, GeForce RTX 2080 Super Max-Q | |
|---|---|---|---|---|---|
| Power Consumption | -32% | -7% | -17% | -8% | |
| Idle Minimum * | 10 | 14.9 -49% | 10.6 -6% | 11 -10% | 9 10% |
| Idle Average * | 12 | 17.5 -46% | 13.1 -9% | 15 -25% | 12.6 -5% |
| Idle Maximum * | 17 | 29.5 -74% | 15.8 7% | 25 -47% | 17 -0% |
| Load Average * | 108 | 94.8 12% | 131 -21% | 95 12% | 115 -6% |
| Witcher 3 ultra * | 123 | 146.1 -19% | 146 -19% | 140 -14% | 159 -29% |
| Load Maximum * | 182 | 210.9 -16% | 169 7% | 211 -16% | 216 -19% |
* ... smaller is better
Battery life
Asus impressively proves that gaming laptops with long battery life are no longer wishful thinking. A maximum of 12 hours of idle usage at minimum brightness is just as remarkable as a good 9.5 hours of Internet surfing over WLAN (brightness reduced to 150 cd/m²). With these rates, the Zephyrus G15 sprints past all its rivals. However, 3D performance also drops massively without a power adapter as our test with The Witcher 3 showed (over 90% less FPS).
| Asus ROG Zephyrus G15 GA503Q R9 5900HS, GeForce RTX 3080 Laptop GPU, 90 Wh | MSI GS66 10SGS i7-10750H, GeForce RTX 2080 Super Max-Q, 99.99 Wh | Razer Blade 15 RTX 2080 Super Max-Q i7-10875H, GeForce RTX 2080 Super Max-Q, 80 Wh | Acer Predator Triton 500 PT515-52-70N3 i7-10750H, GeForce RTX 2080 Super Max-Q, 84 Wh | Lenovo Legion 7 15IMH05-81YT001VGE i9-10980HK, GeForce RTX 2080 Super Max-Q, 80 Wh | |
|---|---|---|---|---|---|
| Battery Runtime | -13% | -12% | -26% | -35% | |
| Reader / Idle | 728 | 614 -16% | 522 -28% | 495 -32% | |
| WiFi v1.3 | 564 | 413 -27% | 366 -35% | 378 -33% | 204 -64% |
| Load | 90 | 94 4% | 113 26% | 78 -13% | 85 -6% |
| H.264 | 437 | 92 |
Pros
Cons
Verdict
As long as you're aware of the fact that the GeForce RTX 3080 laptop version can only unfold its potential to a limited extent due to Asus's low TDP setting and that it can be slower than a fast RTX 3070 laptop, the ROG Zephyrus G15 GA503Q cuts a fine figure.
One of the biggest highlights turns out to be the WQHD panel, since it attracts customers with 165 Hz, relatively fast response times, FreeSync, and good color-space coverage.
Other selling points are the surprisingly rich sound, the long battery life, and the sleek design. In terms of looks, the white edition stands out nicely from the competition.
We didn't like the noise level in 3D mode and the keyboard layout as much. The fact that Asus omits a webcam and solders part of the RAM is also annoying.
Price and availability
You will soon be able to purchase our test configuration directly from the manufacturer at a price of $2,499.99. You will also be able to find an RTX 3070 version with 16 GB of RAM in the Eclipse Gray color variant on BestBuy for $1,799.99.
Asus ROG Zephyrus G15 GA503Q
-
01/31/2021 v7
Florian Glaser
More articles related to this device
Asus ROG Zephyrus G15 GA503Q (ROG Zephyrus G15 GA503 Series)Related Articles

Pricecompare

