 Deutsch
 English
 Español
 Français
 Italiano
 Nederlands
 Polski
 Português
 Русский
 Türkçe
 Svenska
 Chinese
 Magyar
MSI Prestige 14 Evo laptop review: Intel is catching up

If you're looking for both a powerful and compact business laptop for mobile use in the price range between 1,000 and 1,500 Euros (~$1,213 and ~$1,819), you might like the MSI Prestige 14 Evo. The A11M-005 model that we tested, which costs just under 1,300 Euros (~$1,577), offers a modern quad-core chip from Intel's Tiger Lake generation with the Core i7-1185G7. This is supported by 16 GB of DDR4 RAM and a 512 GB M.2 SSD. The display is a matte Full HD IPS panel with a slim bezel design. The device was developed in close cooperation with Intel (Evo platform).
The competitors of the Prestige 14 Evo include other 14-inch business devices without a dGPU such as the Asus ZenBook 14 UX425EA (Core i7-1165G7), the Lenovo Yoga Slim 7-14ARE (Ryzen 7 4800U), the HP EliteBook 845 G7 (Ryzen 7 Pro 4750U), and the Acer Swift 3 SF314-42-R4XJ (Ryzen 7 4700U). All the aforementioned laptops appear in the tables as comparison devices.
Possible competitors in comparison
Rating | Date | Model | Weight | Height | Size | Resolution | Best Price |
|---|---|---|---|---|---|---|---|
| 82.5 % | 12/2020 | MSI Prestige 14 Evo A11M-005 i7-1185G7, Iris Xe G7 96EUs | 1.2 kg | 16 mm | 14.00" | 1920x1080 | |
| 84.2 % | 09/2020 | Asus ZenBook 14 UX425EA i7-1165G7, Iris Xe G7 96EUs | 1.2 kg | 13.9 mm | 14.00" | 1920x1080 | |
| 85.3 % | 08/2020 | Lenovo Yoga Slim 7-14ARE R7 4800U, Vega 8 | 1.4 kg | 14.9 mm | 14.00" | 1920x1080 | |
| 88.2 % | 11/2020 | HP EliteBook 845 G7 Ryzen 7 Pro 4750U R7 PRO 4750U, Vega 7 | 1.4 kg | 17.9 mm | 14.00" | 1920x1080 | |
| 86.5 % | 06/2020 | Acer Swift 3 SF314-42-R4XJ R7 4700U, Vega 7 | 1.2 kg | 16.55 mm | 14.00" | 1920x1080 |
Case
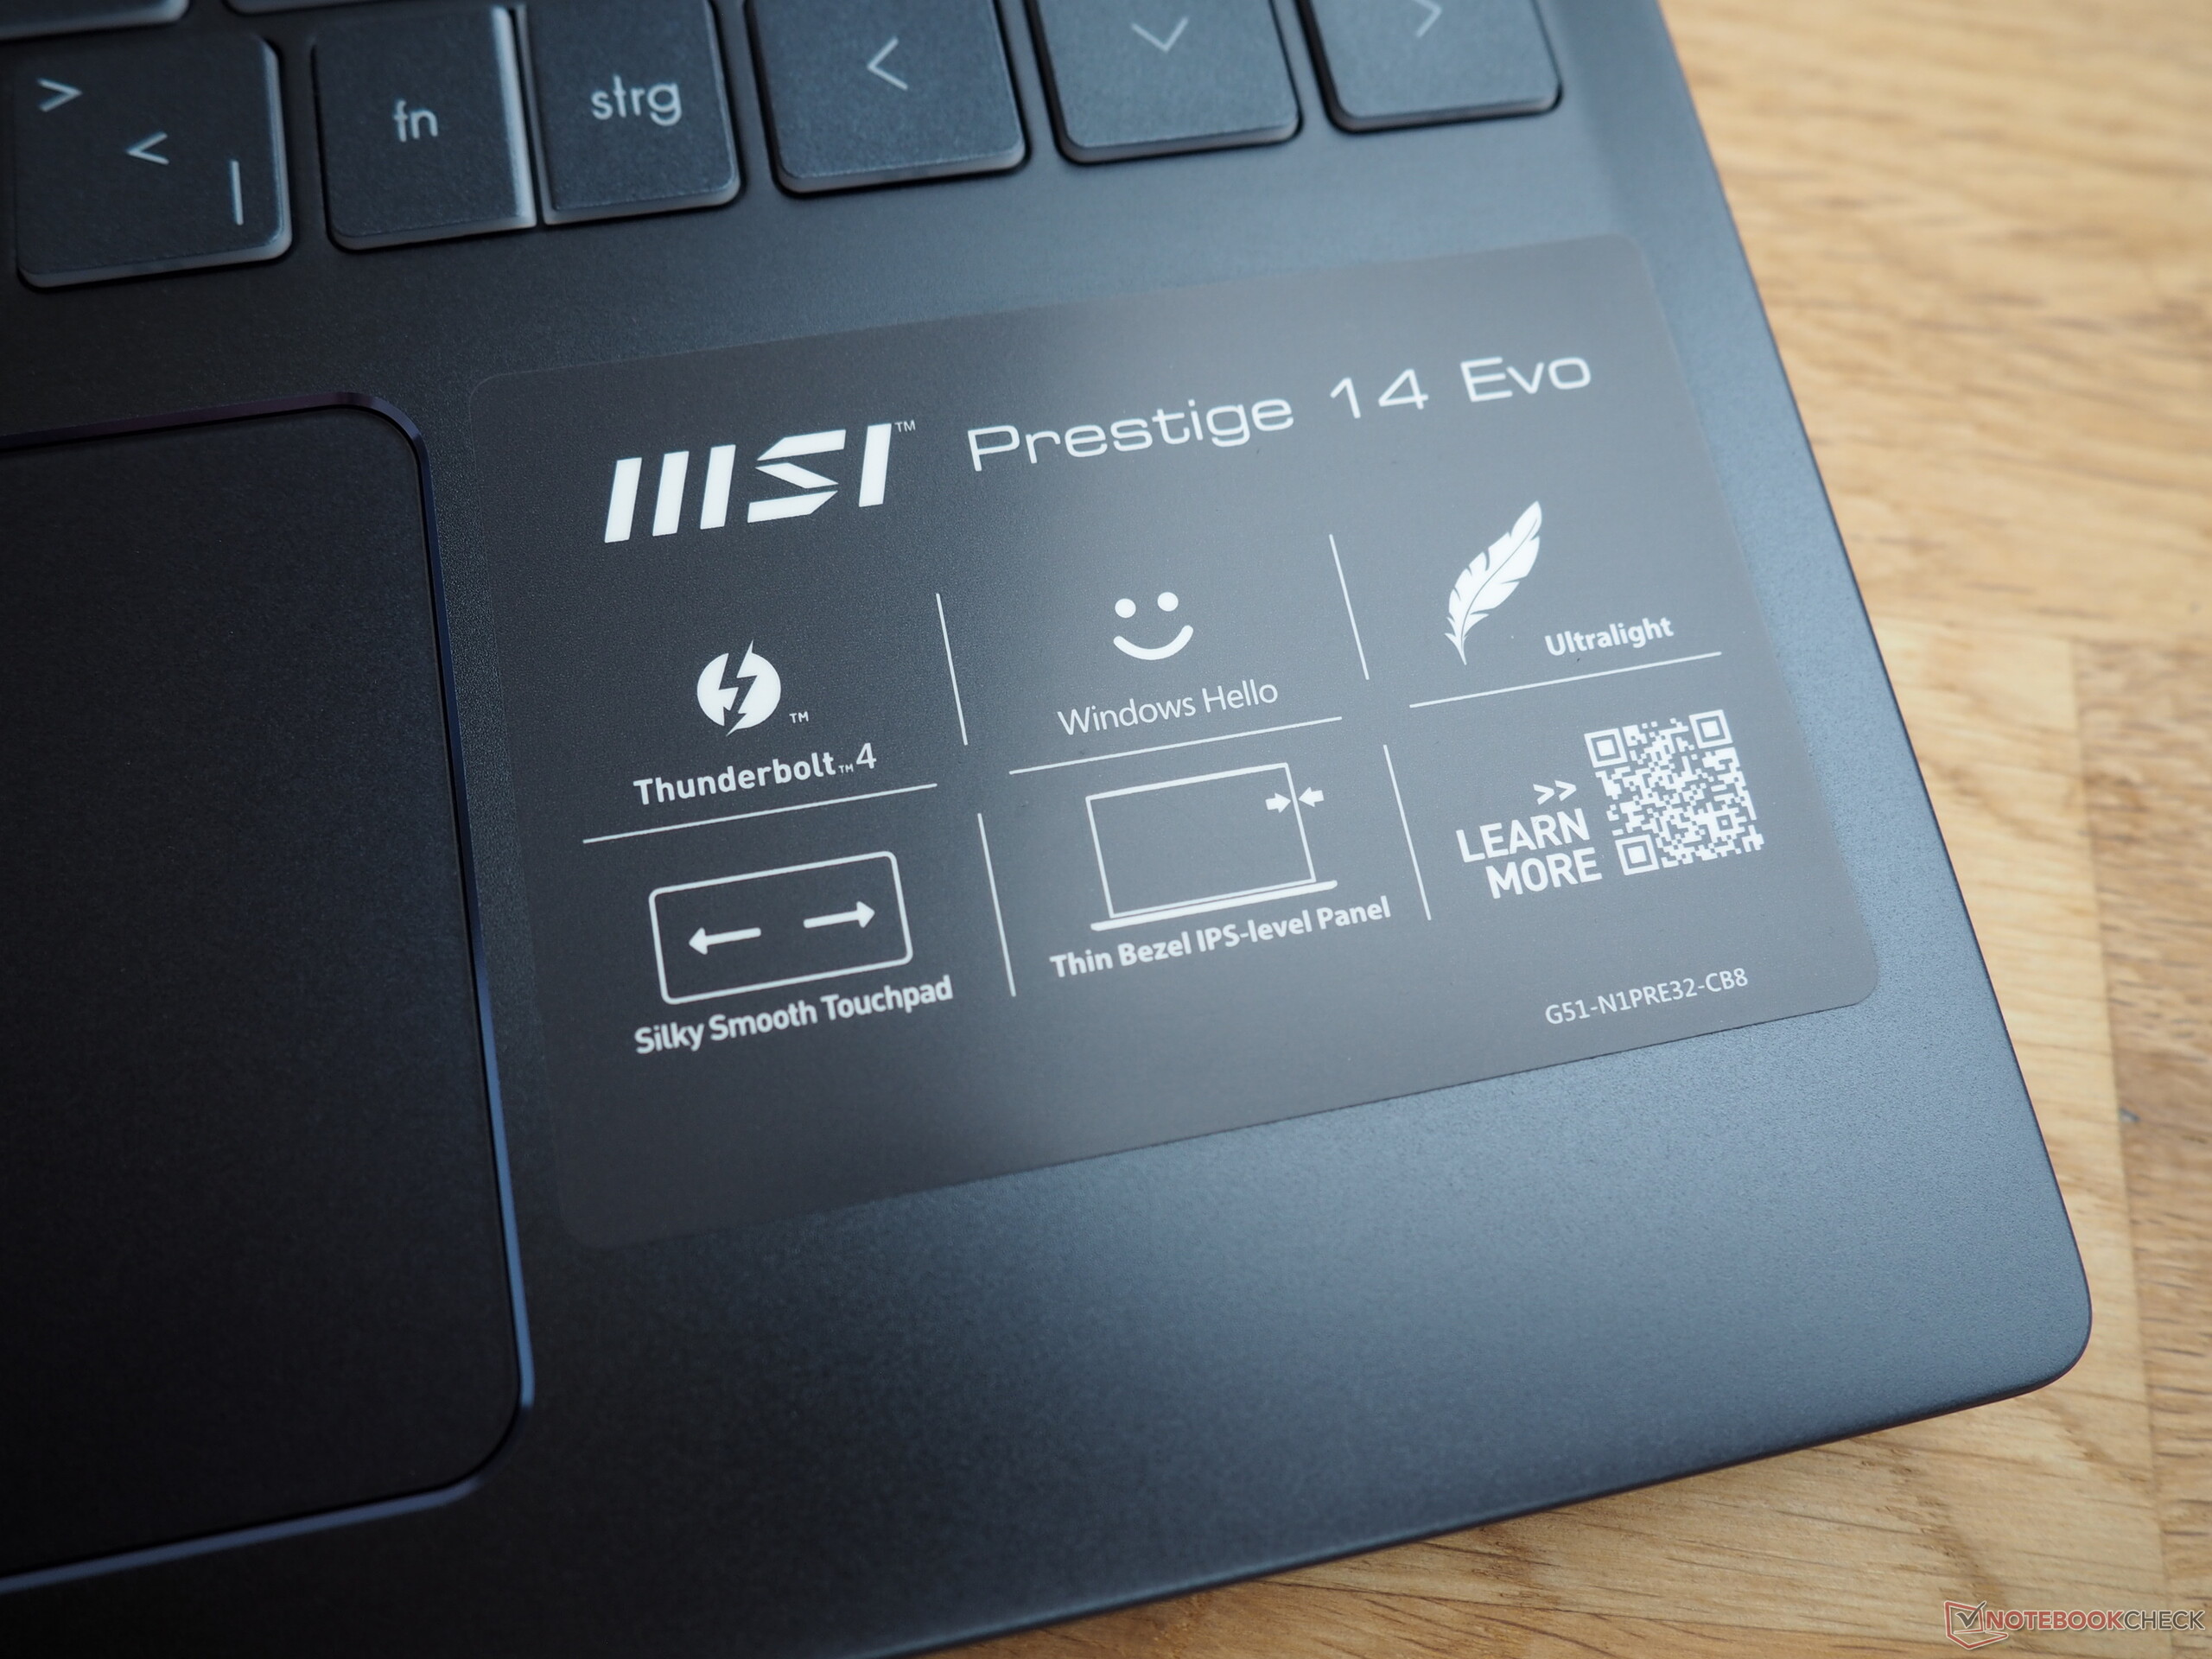
At first glance, the 14 Evo looks very much like the "conventional" Prestige 14, but a closer look and touch reveal a few differences. In this way, not only does the 14 Evo have a somewhat more stable touchpad but also a different keyboard layout as well as a finer key labeling. MSI has also tweaked the port configuration and distribution (Thunderbolt 4 instead of Thunderbolt 3, card reader relocated, 1 USB port less).
Otherwise, the case has the same characteristics. The large metal surfaces makes the chassis look very high-quality, although the build quality could be a bit better (the transition between the top and bottom cover is a bit rough). Stability is decent for such a compact device, although the surfaces bend noticeably at times in some places under strong pressure. However, this shortcoming is hardly bothersome in everyday use.
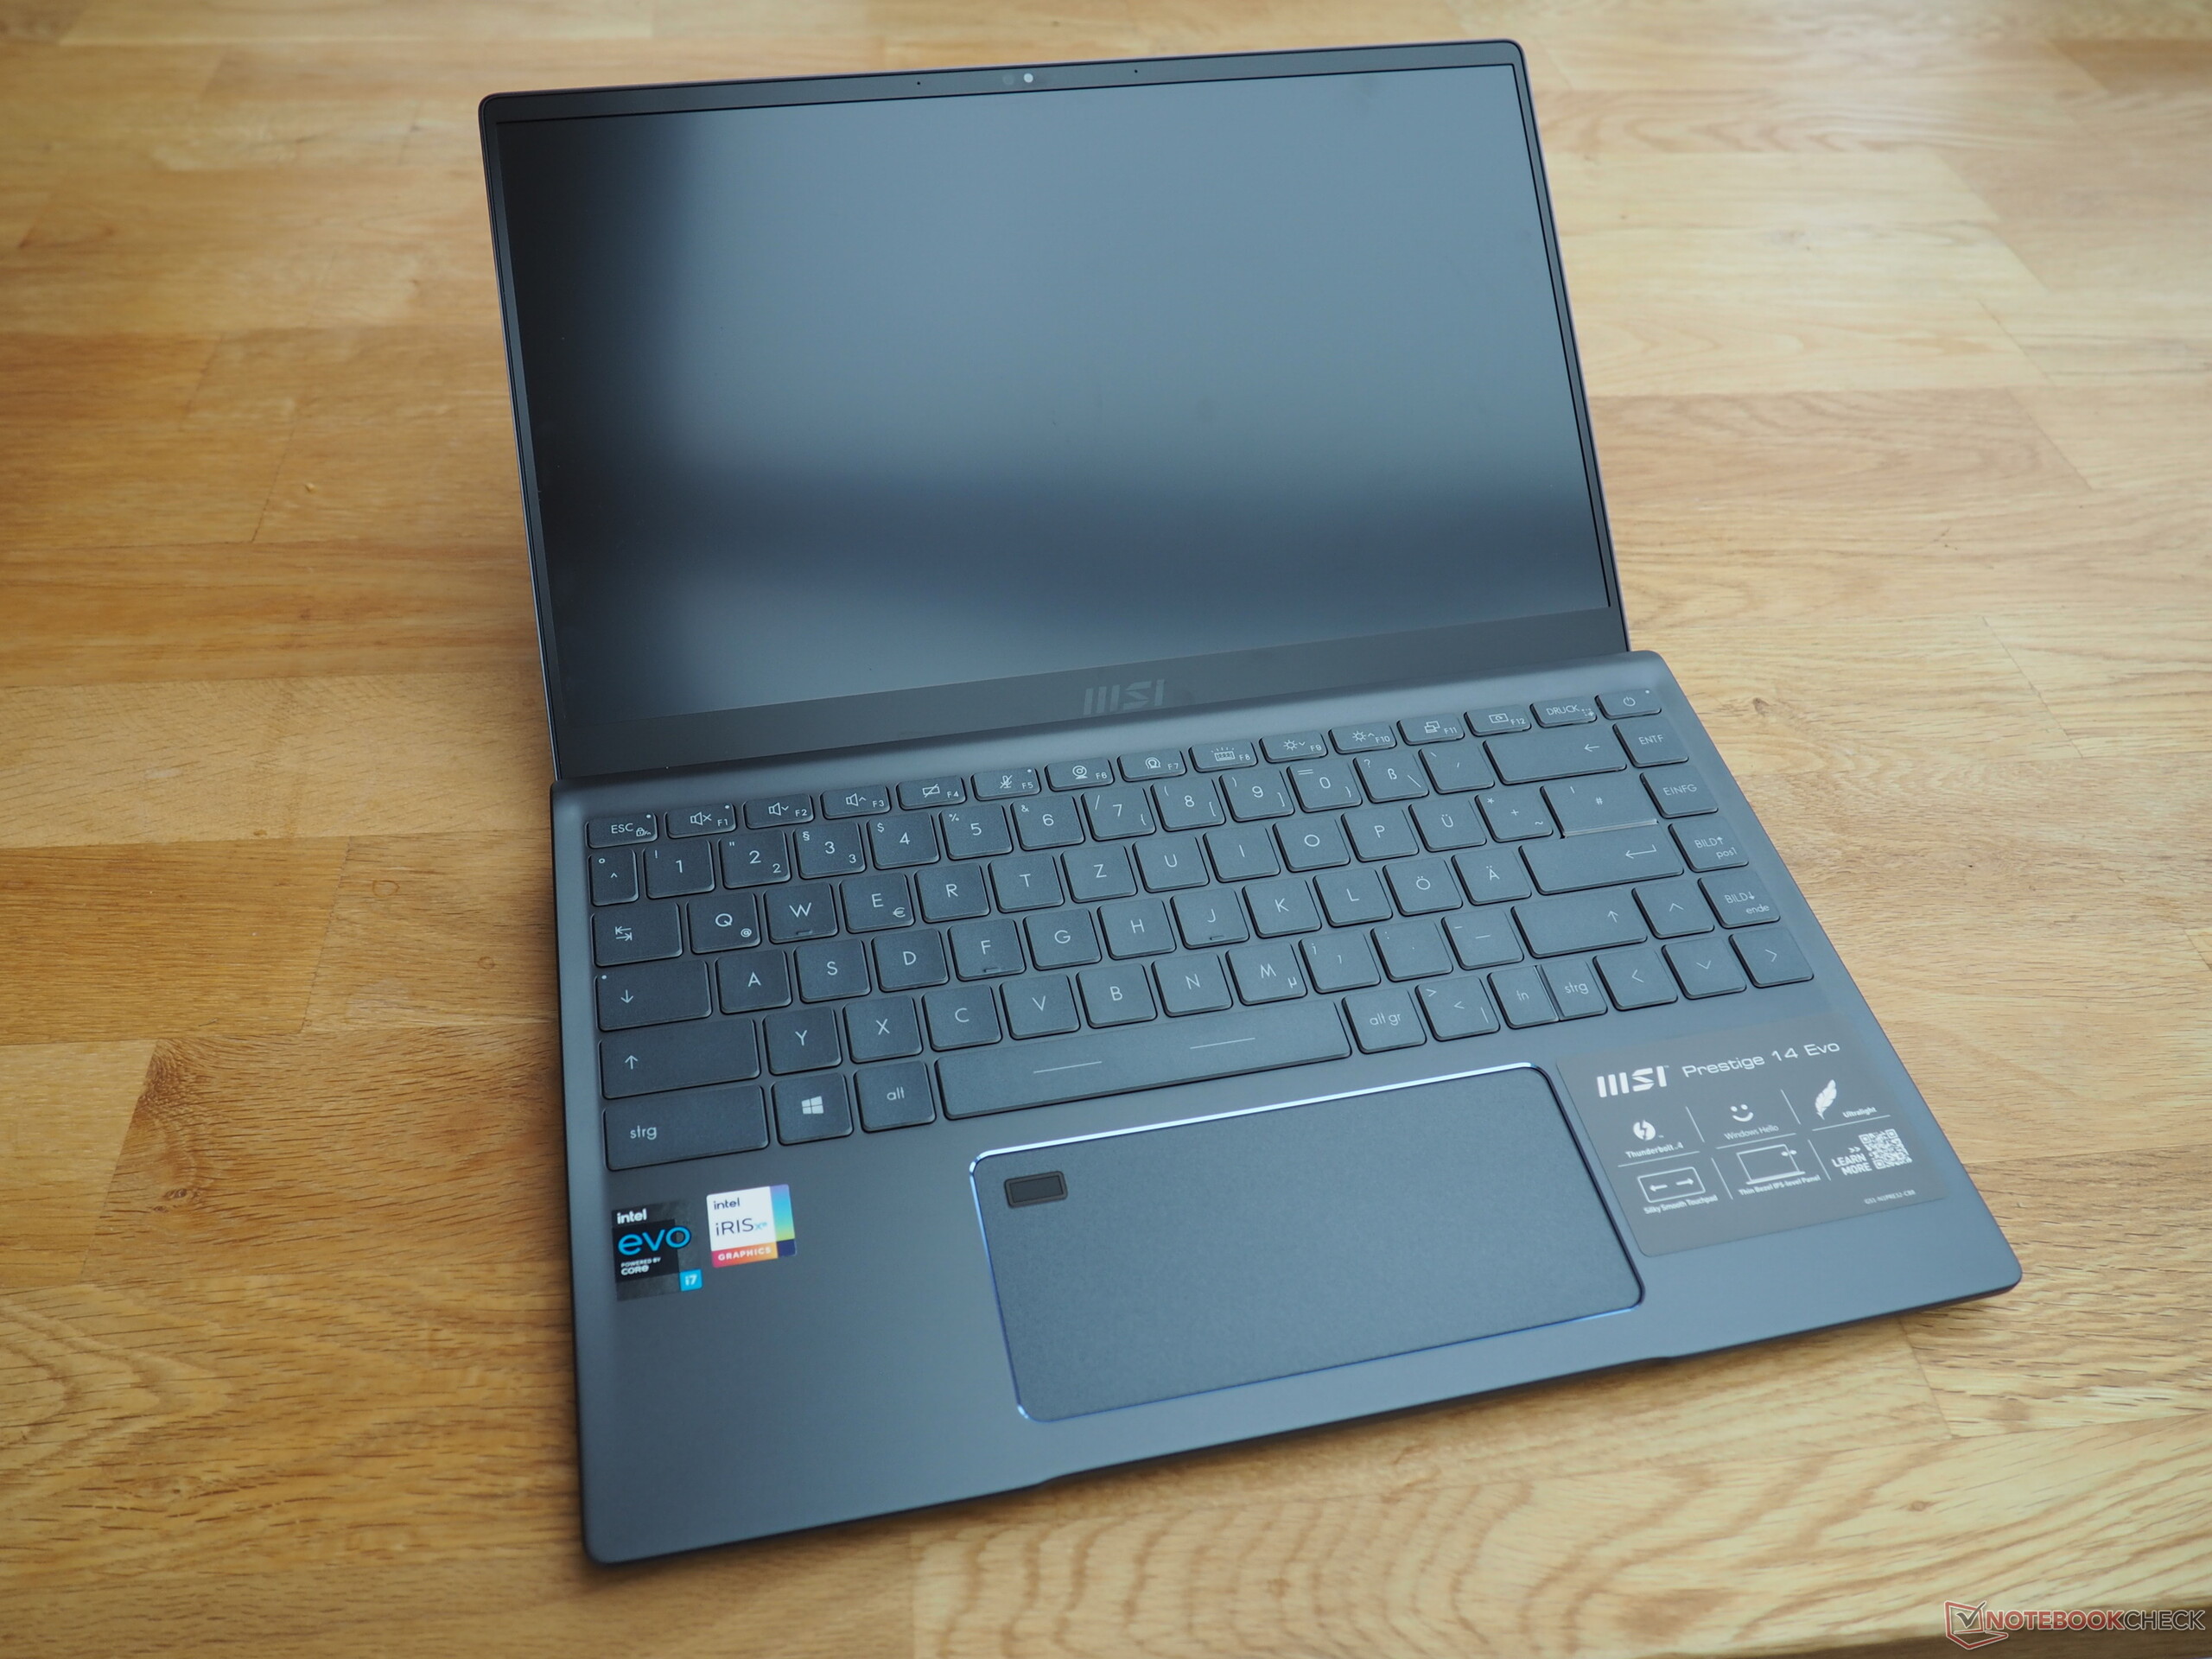
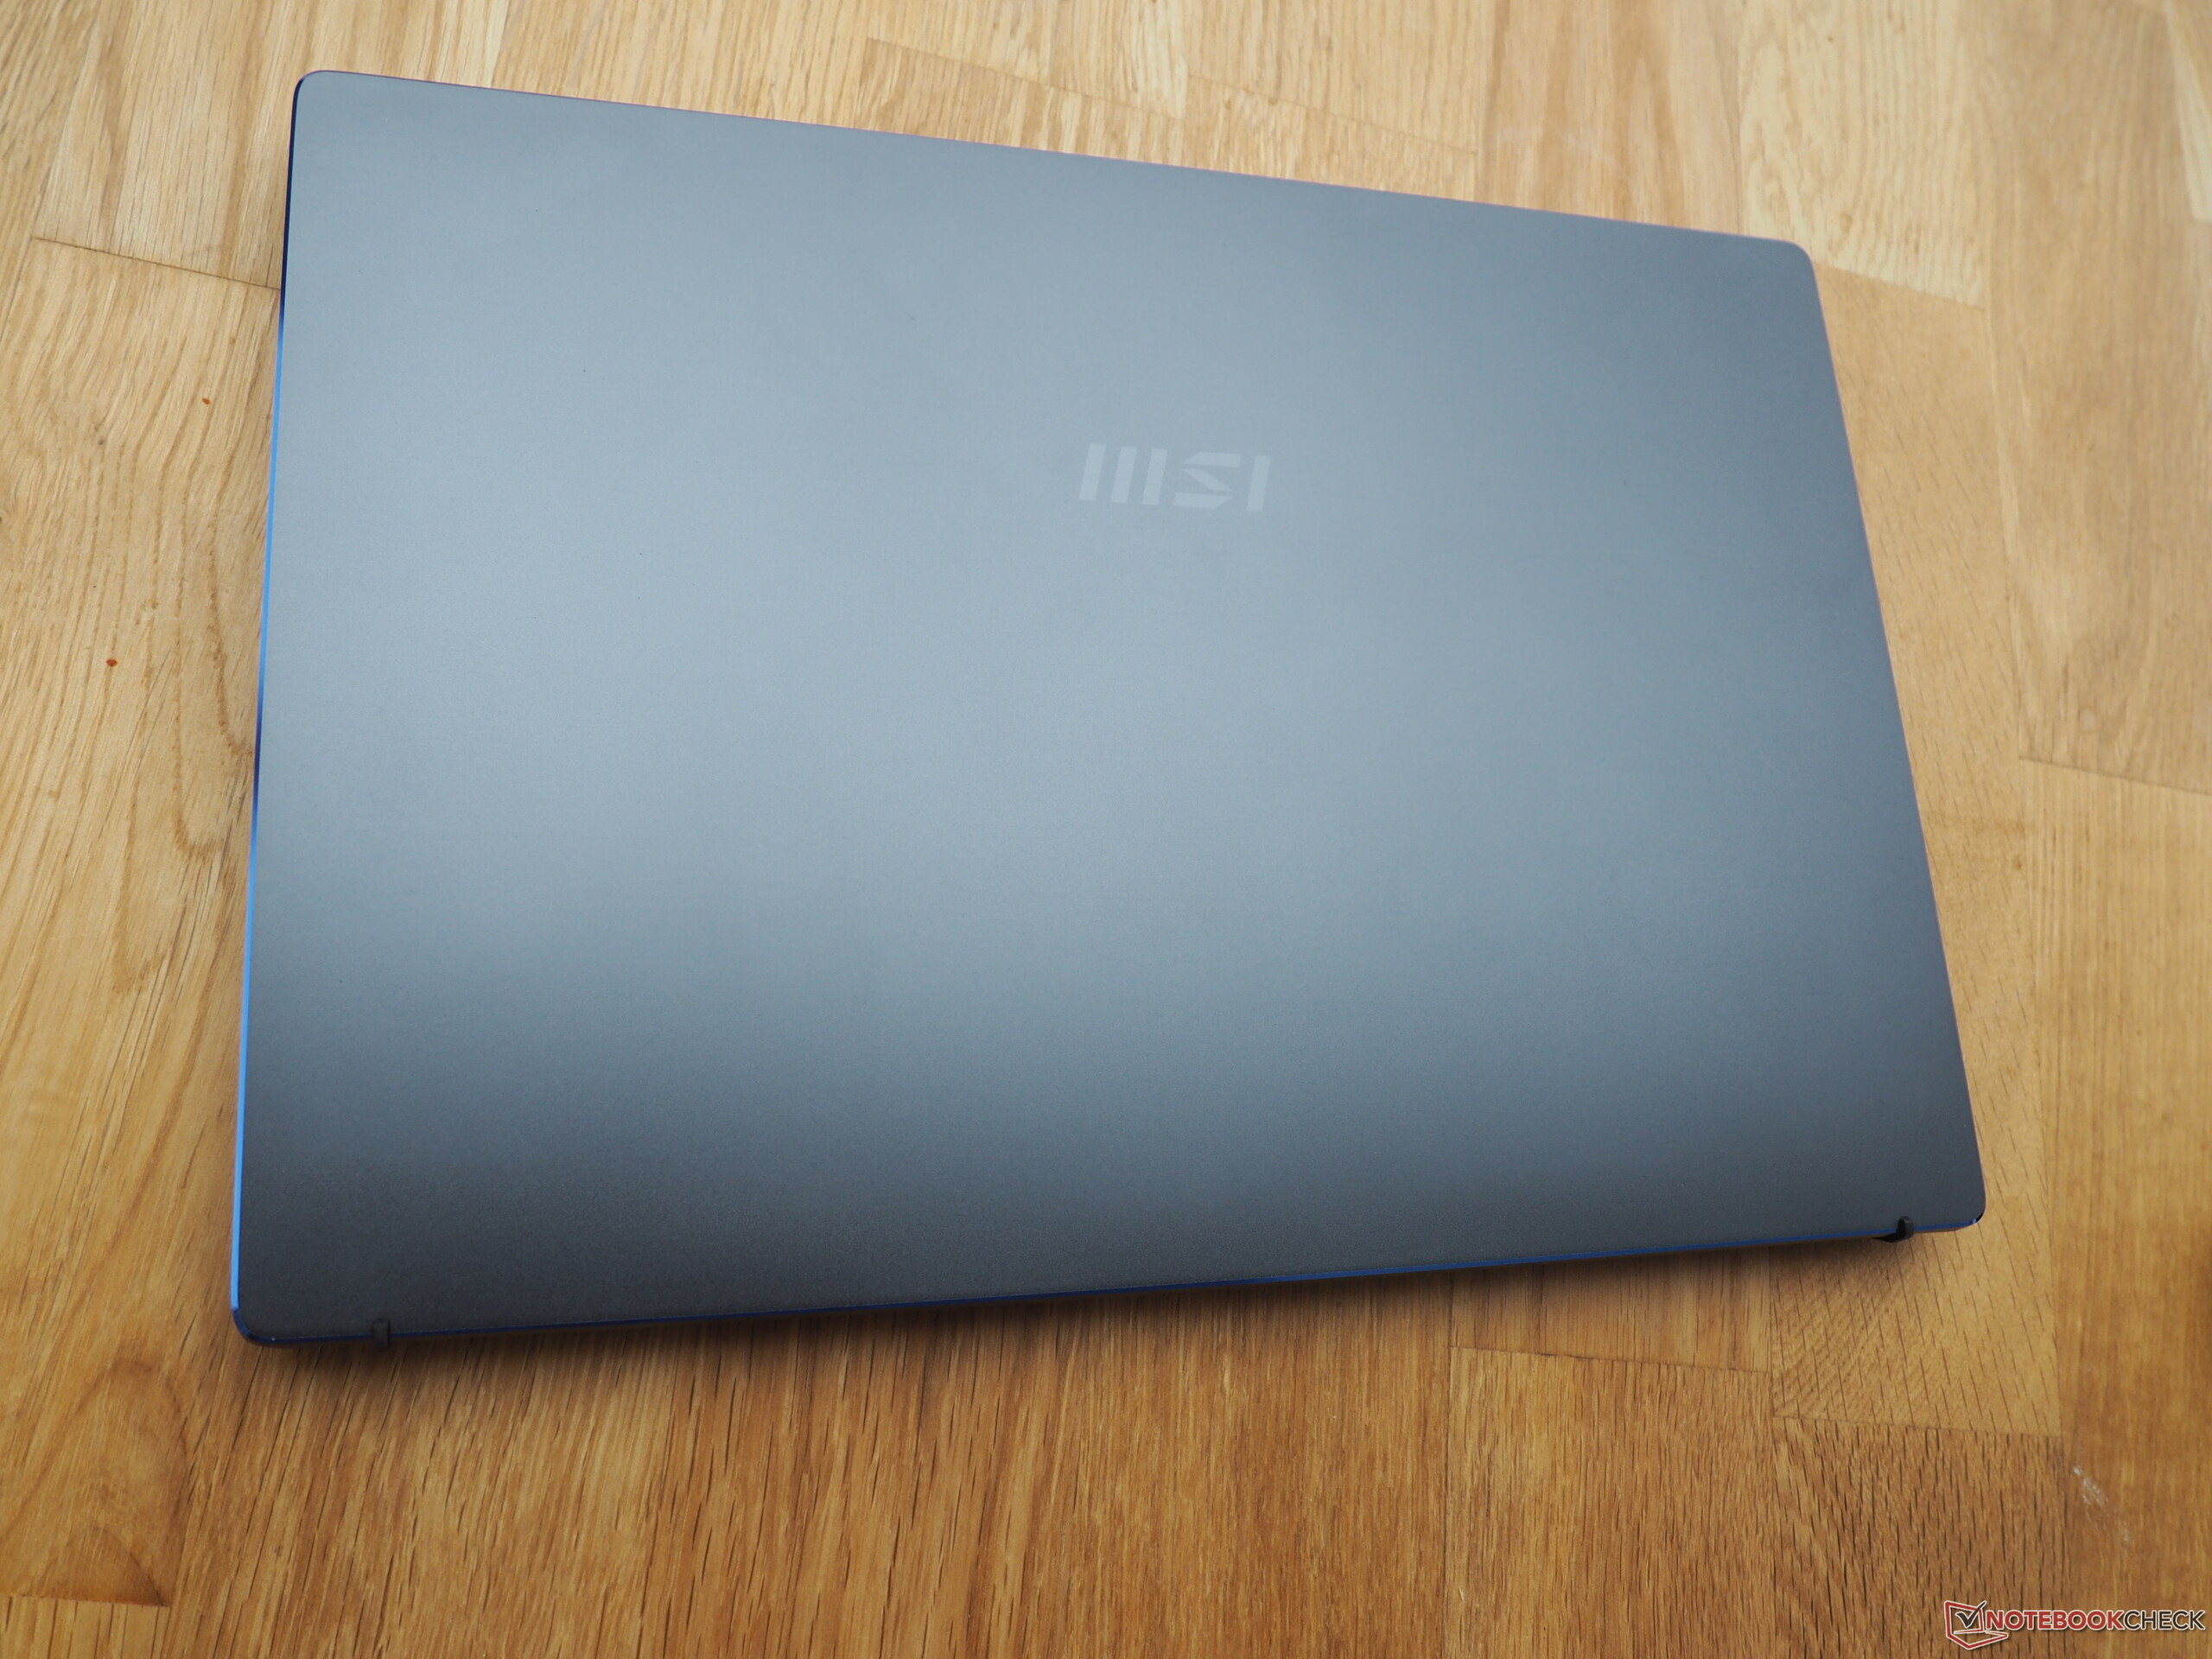
Speaking of compact: With a footprint of 31.9 x 21.5 cm and an overall height of just 1.6 cm, the 14-incher doesn't take up much space on a desk or in a bag. The low weight (only 1.2 kg) also contributes to the transport suitability. Further plus points are awarded for the stylish design. The Prestige 14 Evo looks good in any environment.
Connectivity
Ports
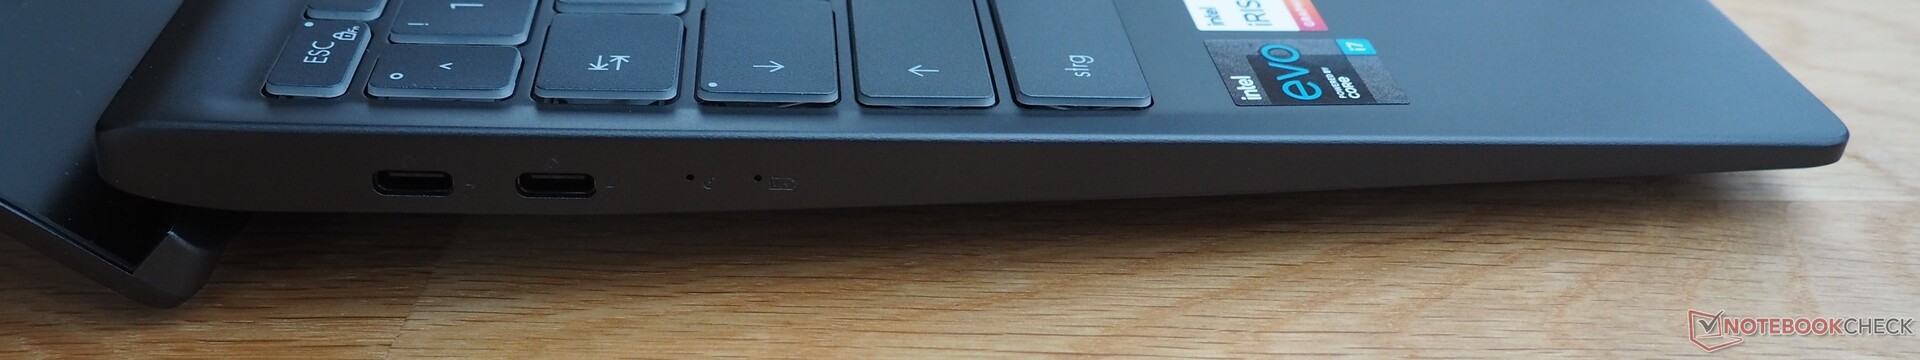
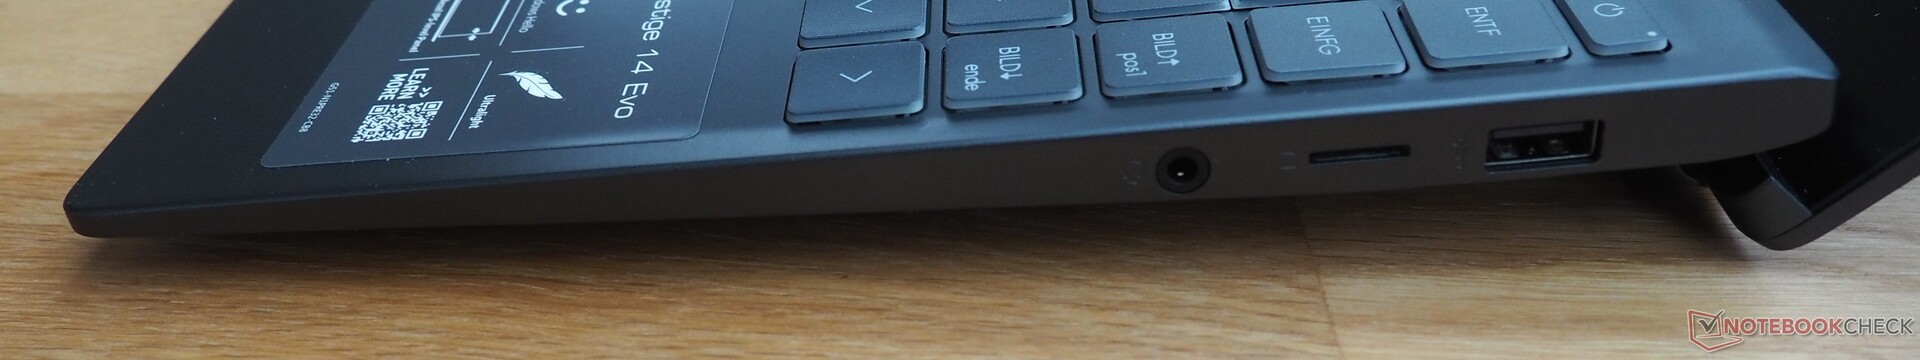
In terms of ports, MSI follows the "Apple trend" and equips the 14 Evo with only a handful of ports. In addition to two modern Thunderbolt 4 ports on the left side that are also used to charge the laptop, the 14-incher also has a USB 2.0 Type-A port, a microSD slot, and a 3.5 mm audio jack for headphones and microphones on the right side. Buyers will have to do without an RJ45 port as well as a Kensington lock slot and dedicated video outputs. External monitors are connected to the Thunderbolt ports via a DisplayPort/HDMI to USB-C adapter and the respective cable.
Communication
Intel's AX201 chip was responsible for wireless communication in our test device. The Wi-Fi 6 model supports the 802.11a/b/g/n/ac/ax WLAN standards as well as Bluetooth 5.1. The 14 Evo mastered the speed test with our reference router, the Netgear Nighthawk AX12 (distance of 1 m), with a very good 1,110 Mb/s for sending and 1,260 Mb/s for receiving data; this places it in second and third place, respectively, in the competition.
Webcam
While the webcam quality is rather unimportant for multimedia and gaming devices, it has a certain relevance in the business sector. MSI still needs to improve considerably in this respect. According to our measurements, neither color reproduction nor image sharpness are convincing (see photos).


Accessories
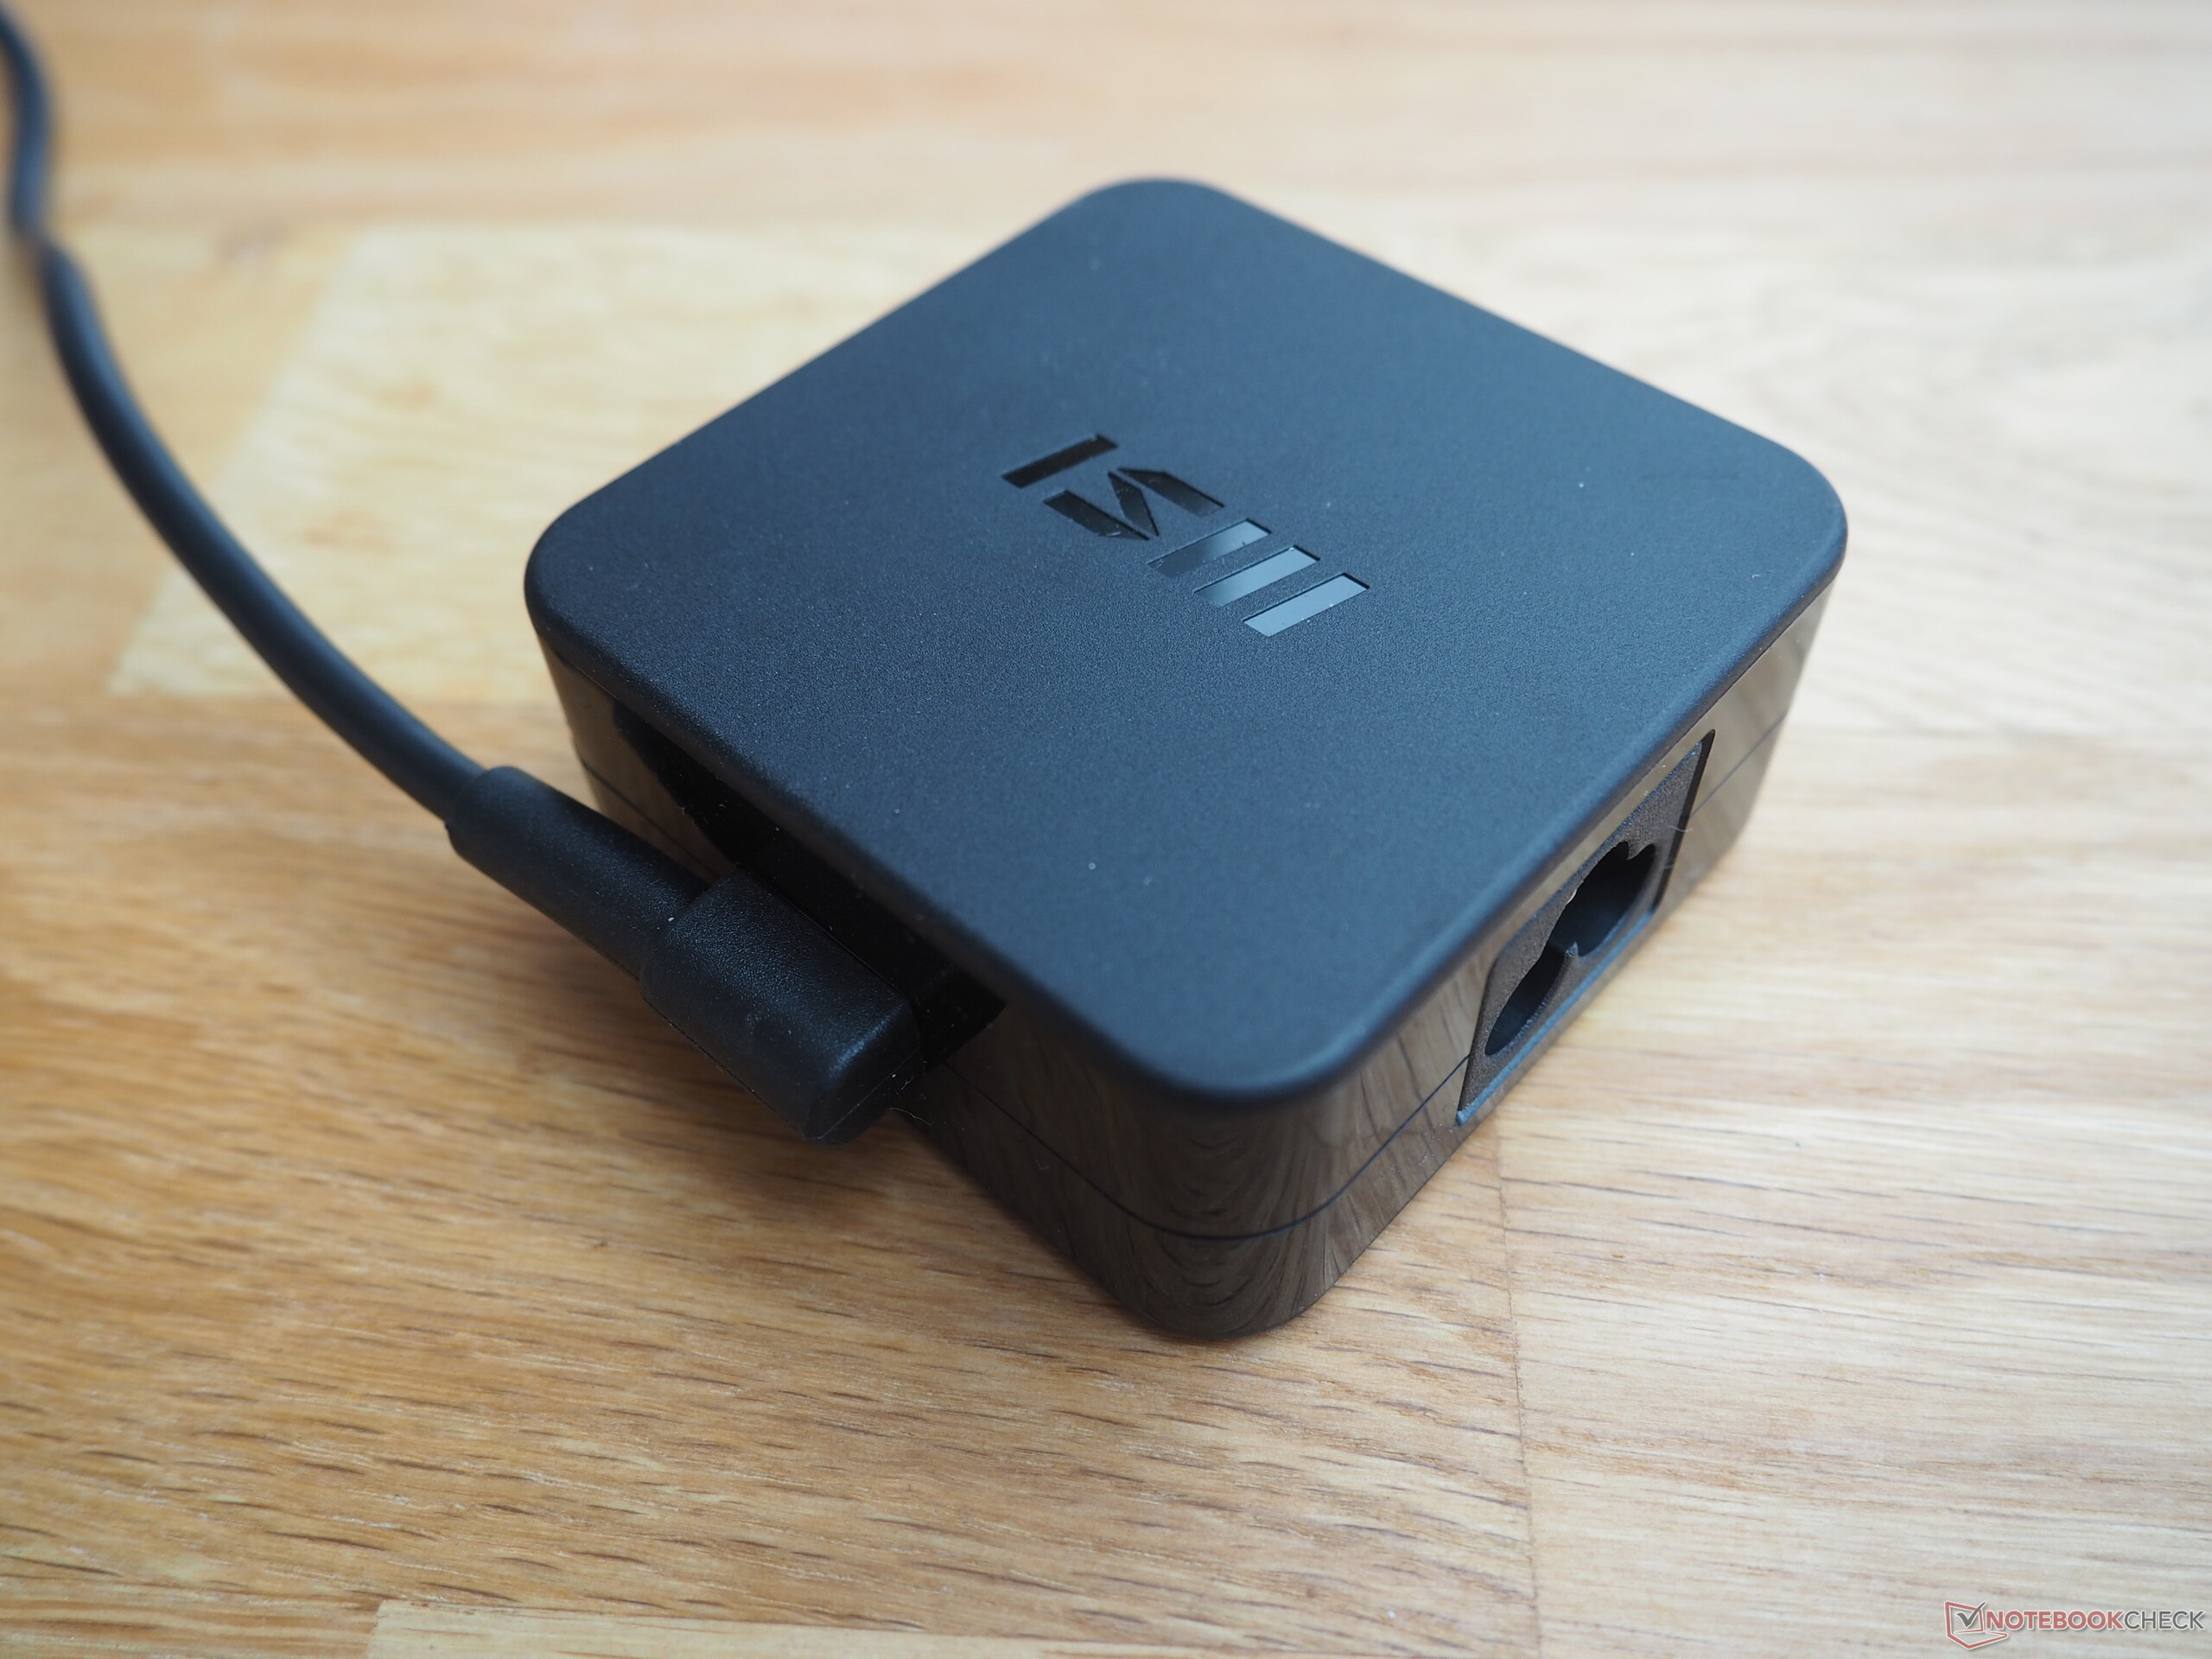
The delivery scope is limited to the usual information booklets and the power adapter (65-watt model). The latter is surprisingly small and handy at around 6.5 x 6.5 x 3 cm, which is good for transport.
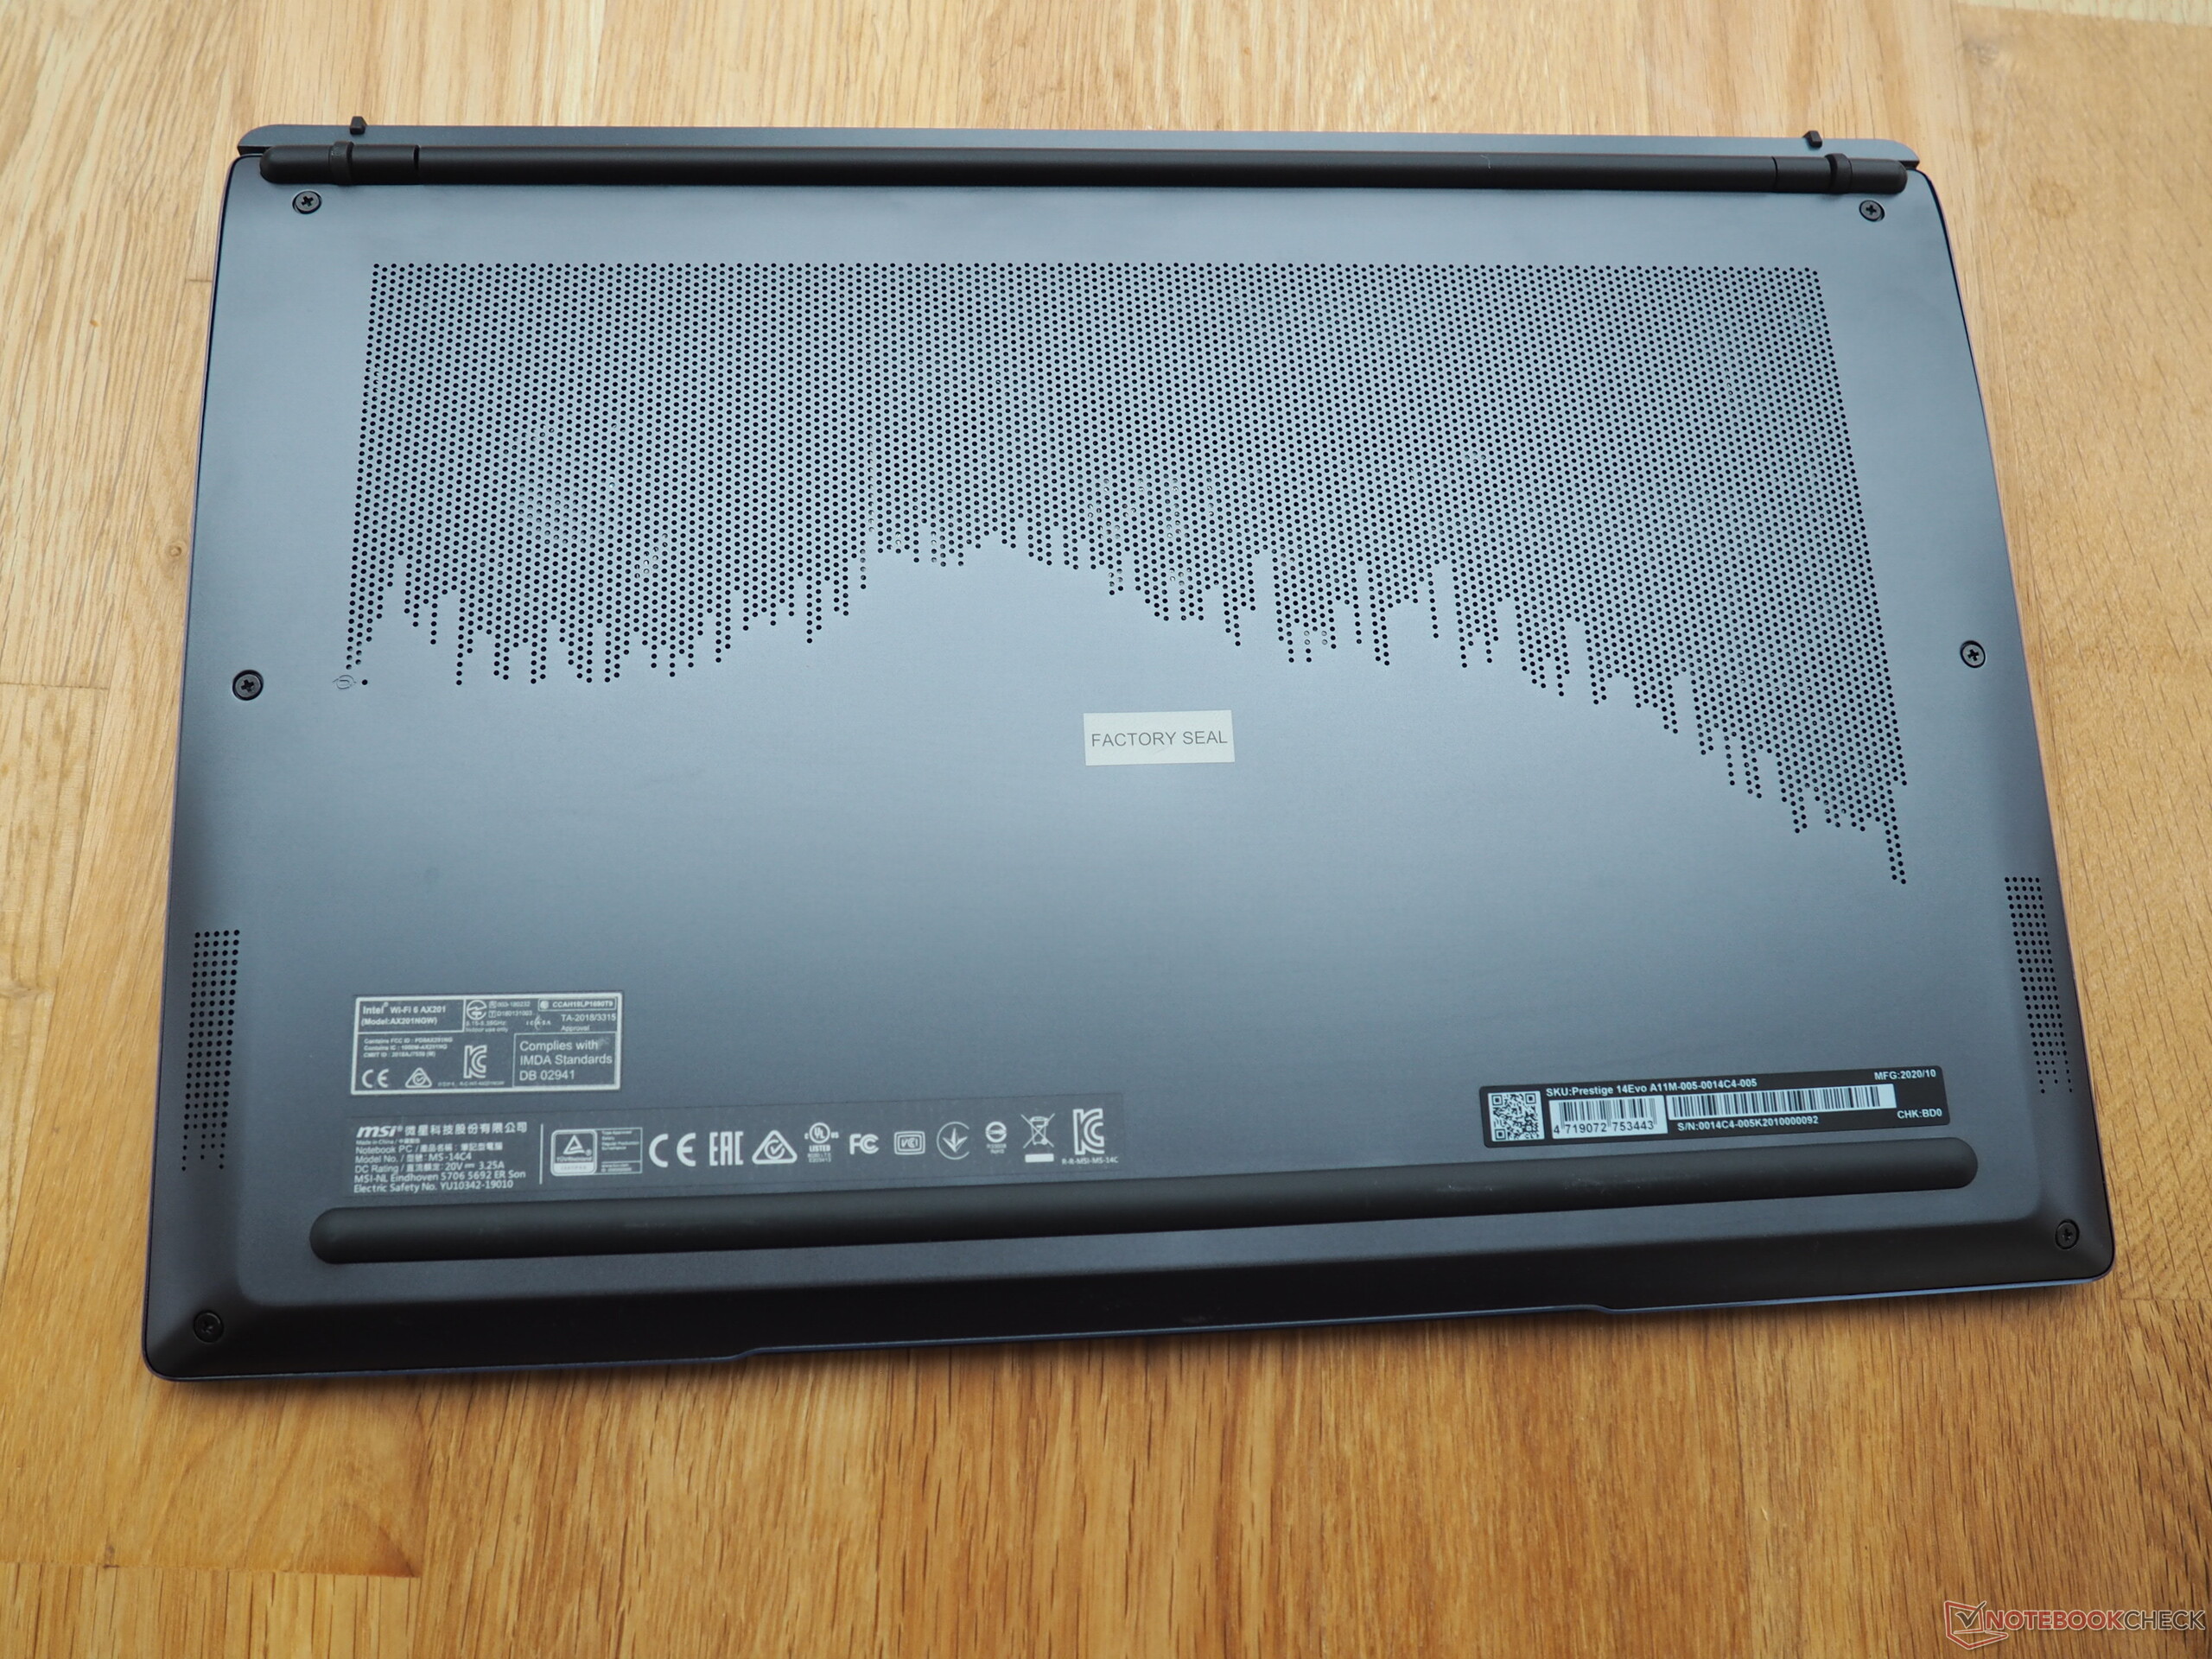
Maintenance
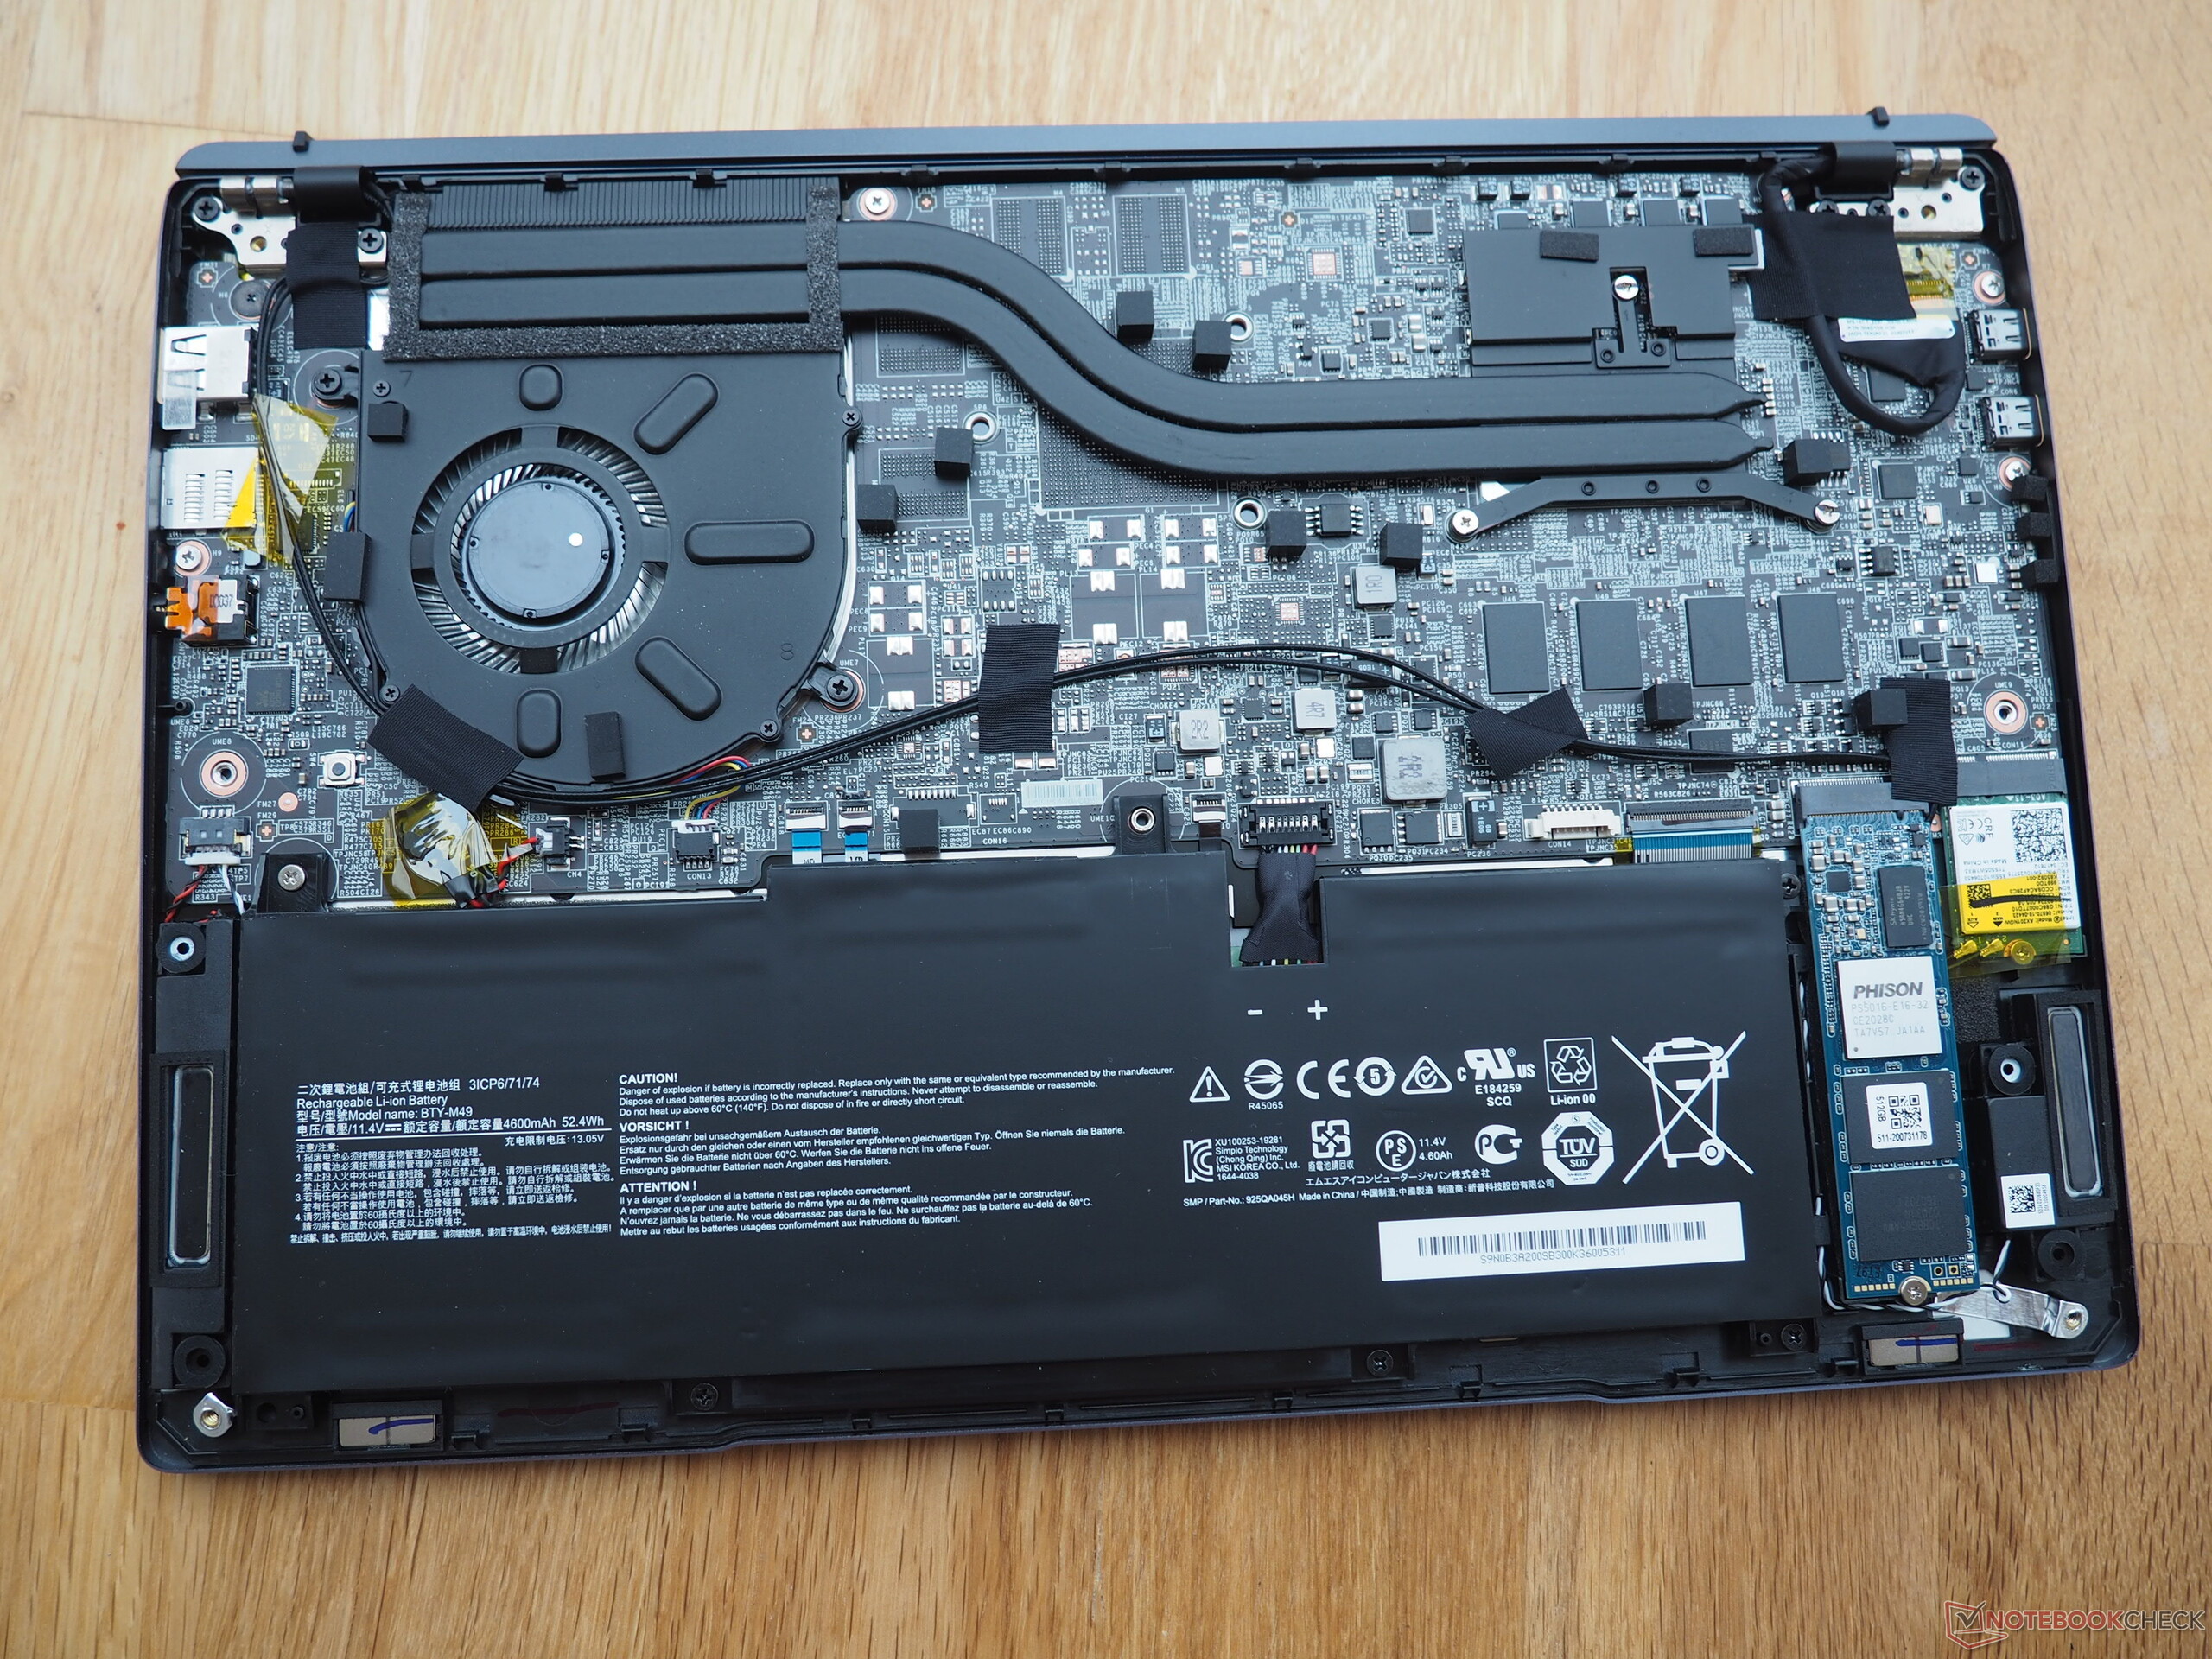
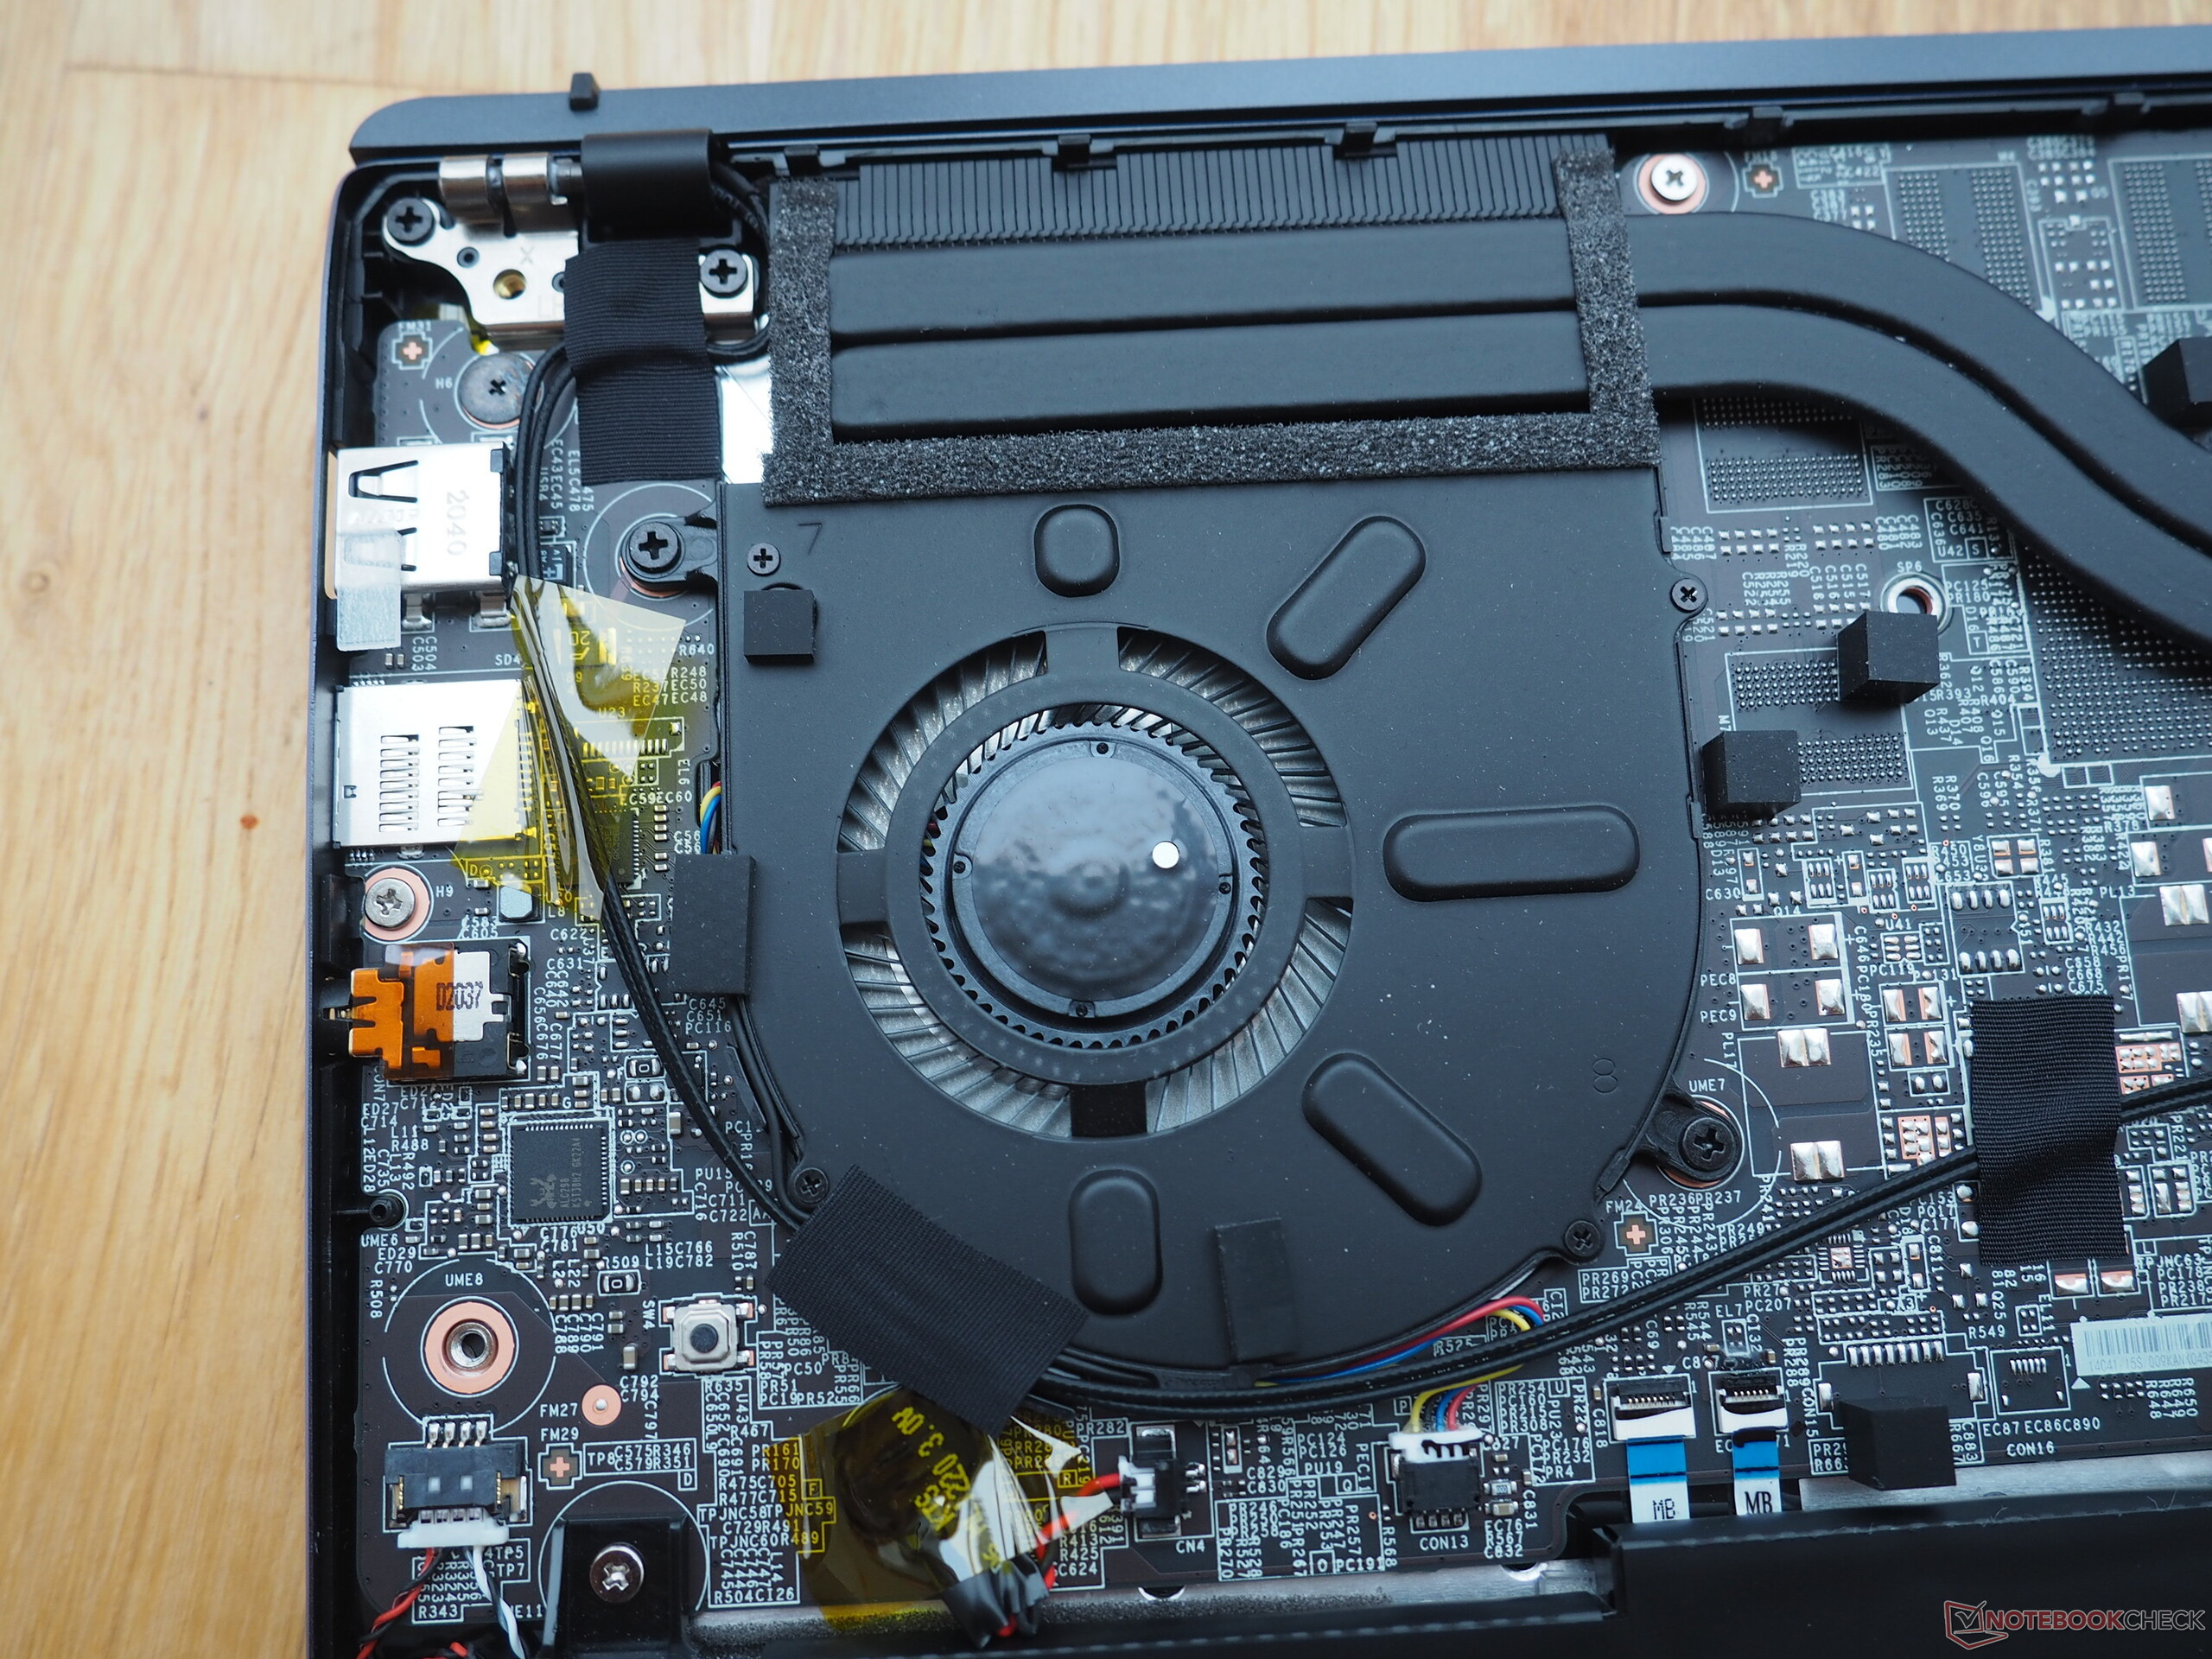
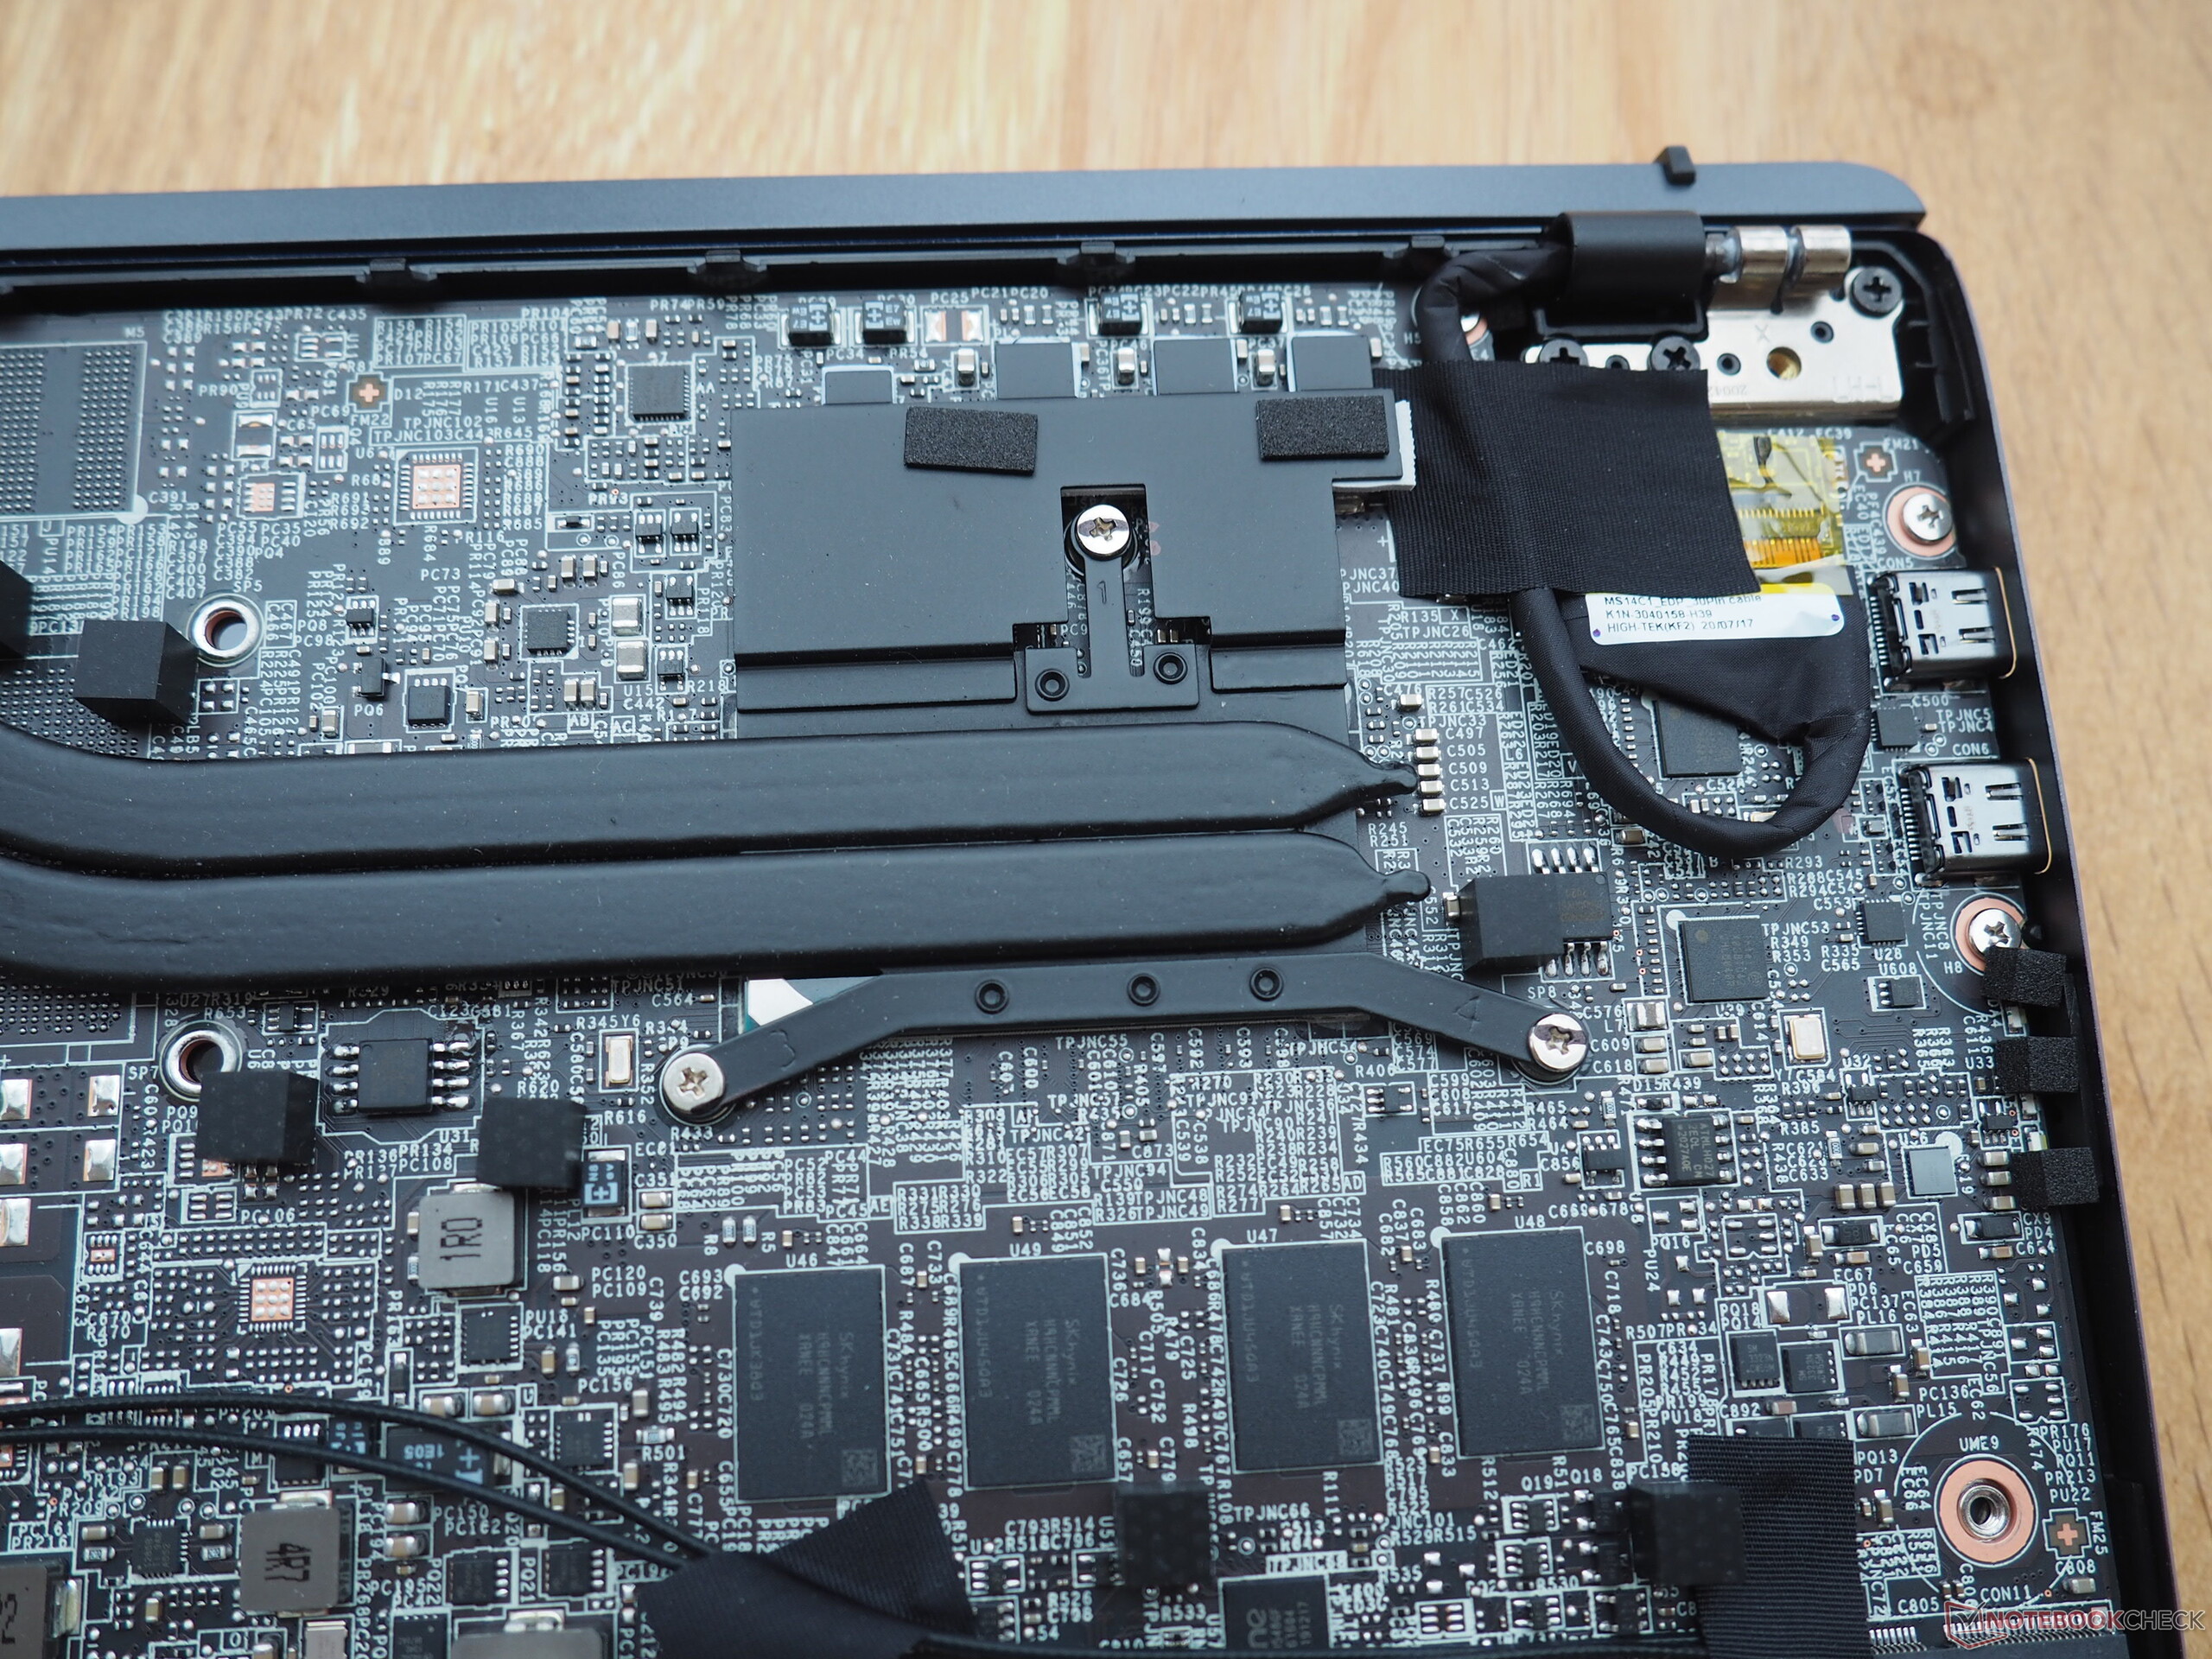
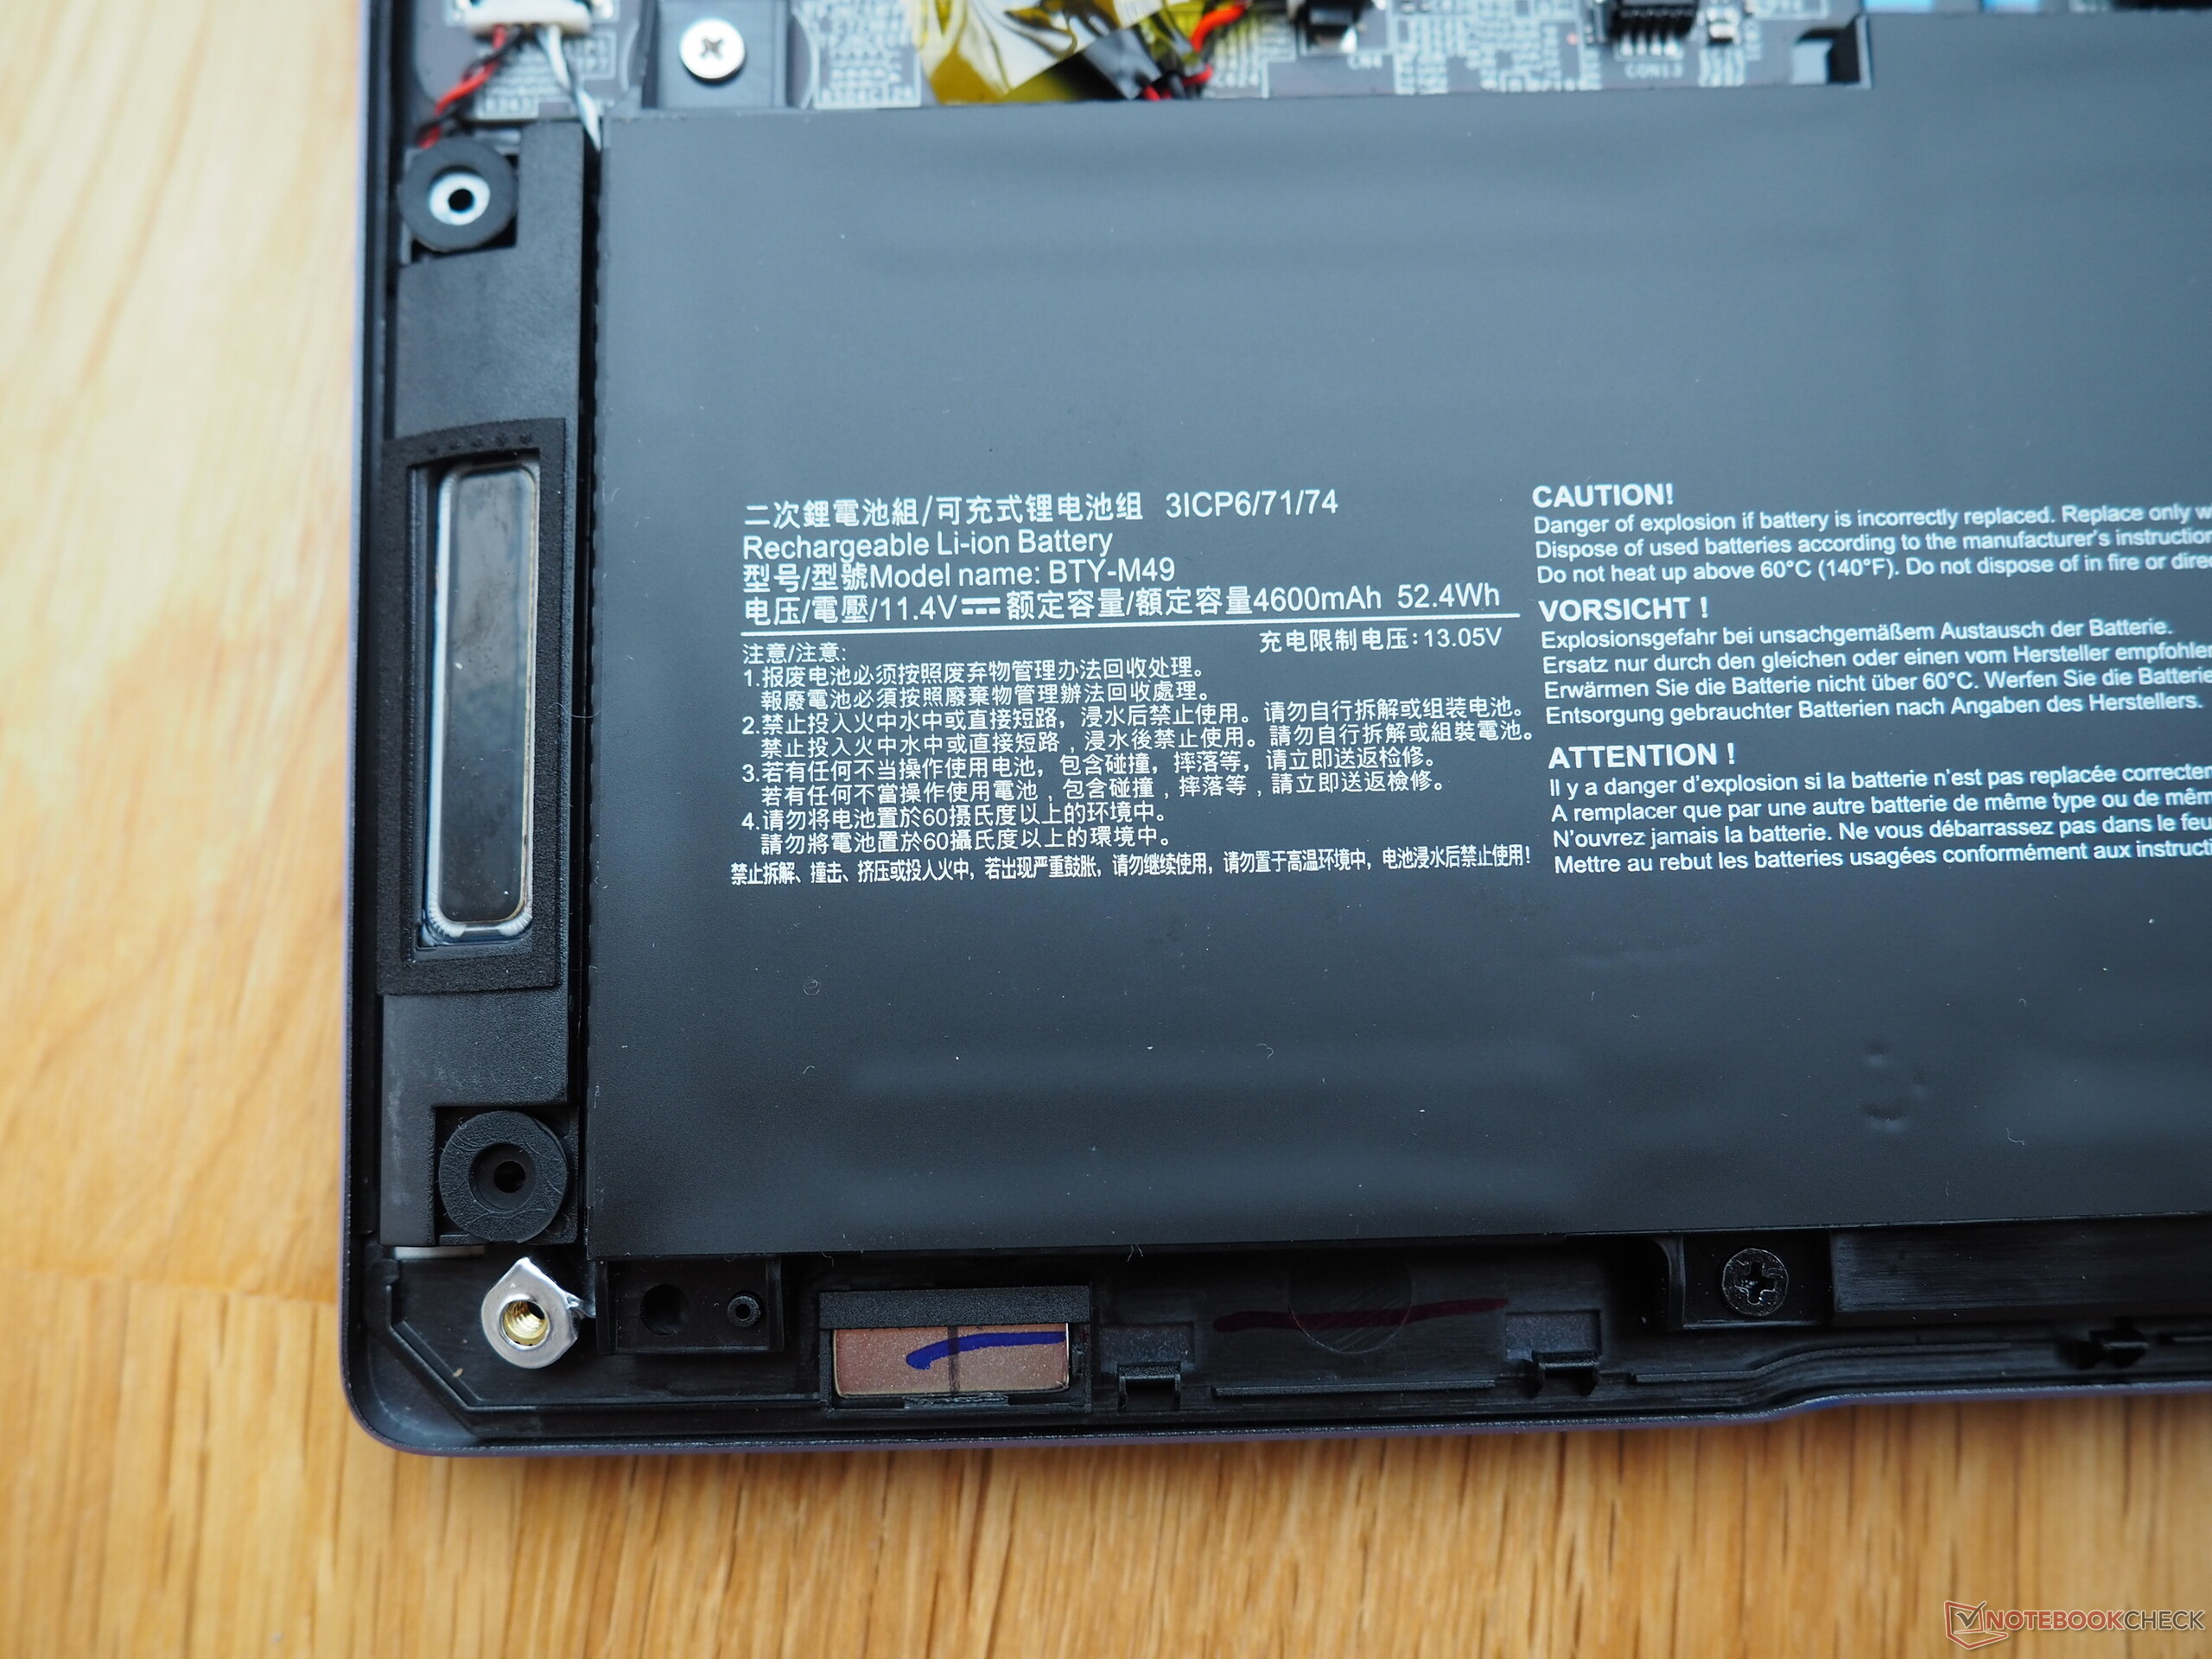
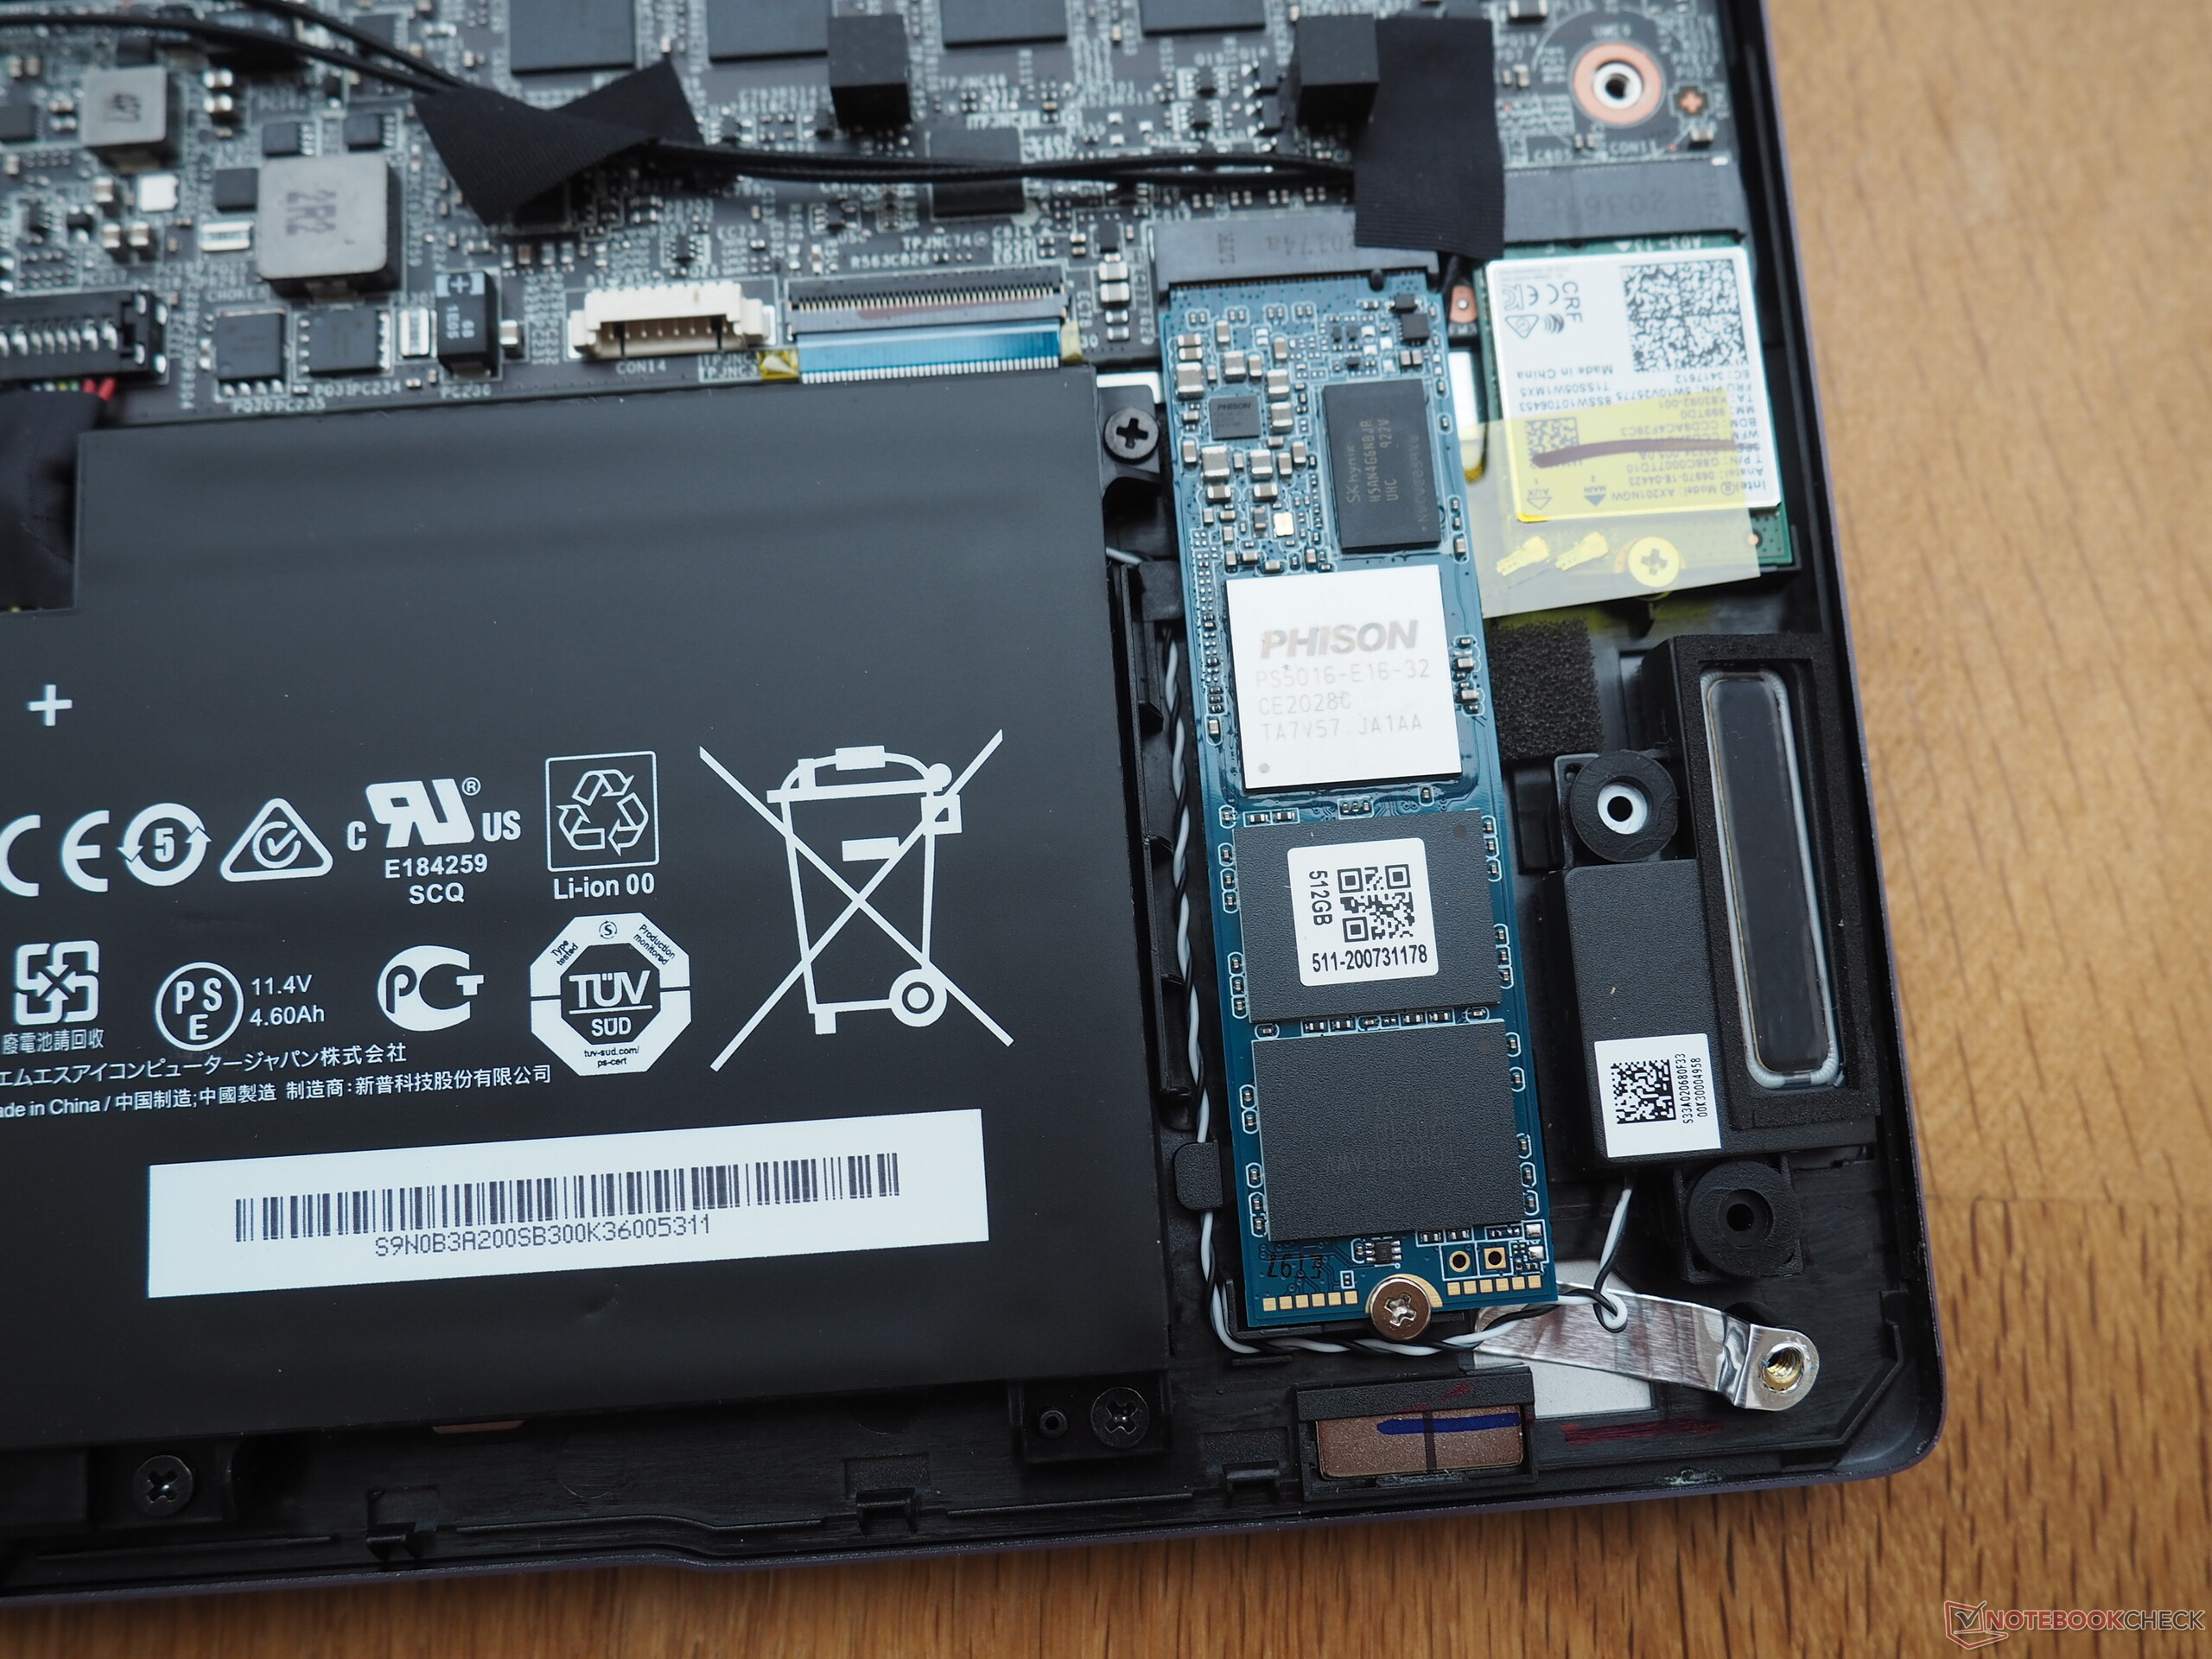
When it comes to maintenance, we were left with mixed feelings. Although the cross-head screws on the case's bottom can be removed quite quickly, the bottom cover can only be pried out of its anchoring with a flat tool (e.g. a spatula) and a good amount of muscle power. Buyers can expect a very tidy layout inside the case: The M.2 slot and the wireless module are located right next to the large battery. The cooling system consists of a fan and two heat pipes. If you're looking for RAM slots in the pictures below, you will, unfortunately, be disappointed. The entire memory is soldered to the motherboard and thus can't be replaced or expanded - a pity.
Warranty
The warranty covers 24 months. It is a classic pickup-and-return service.
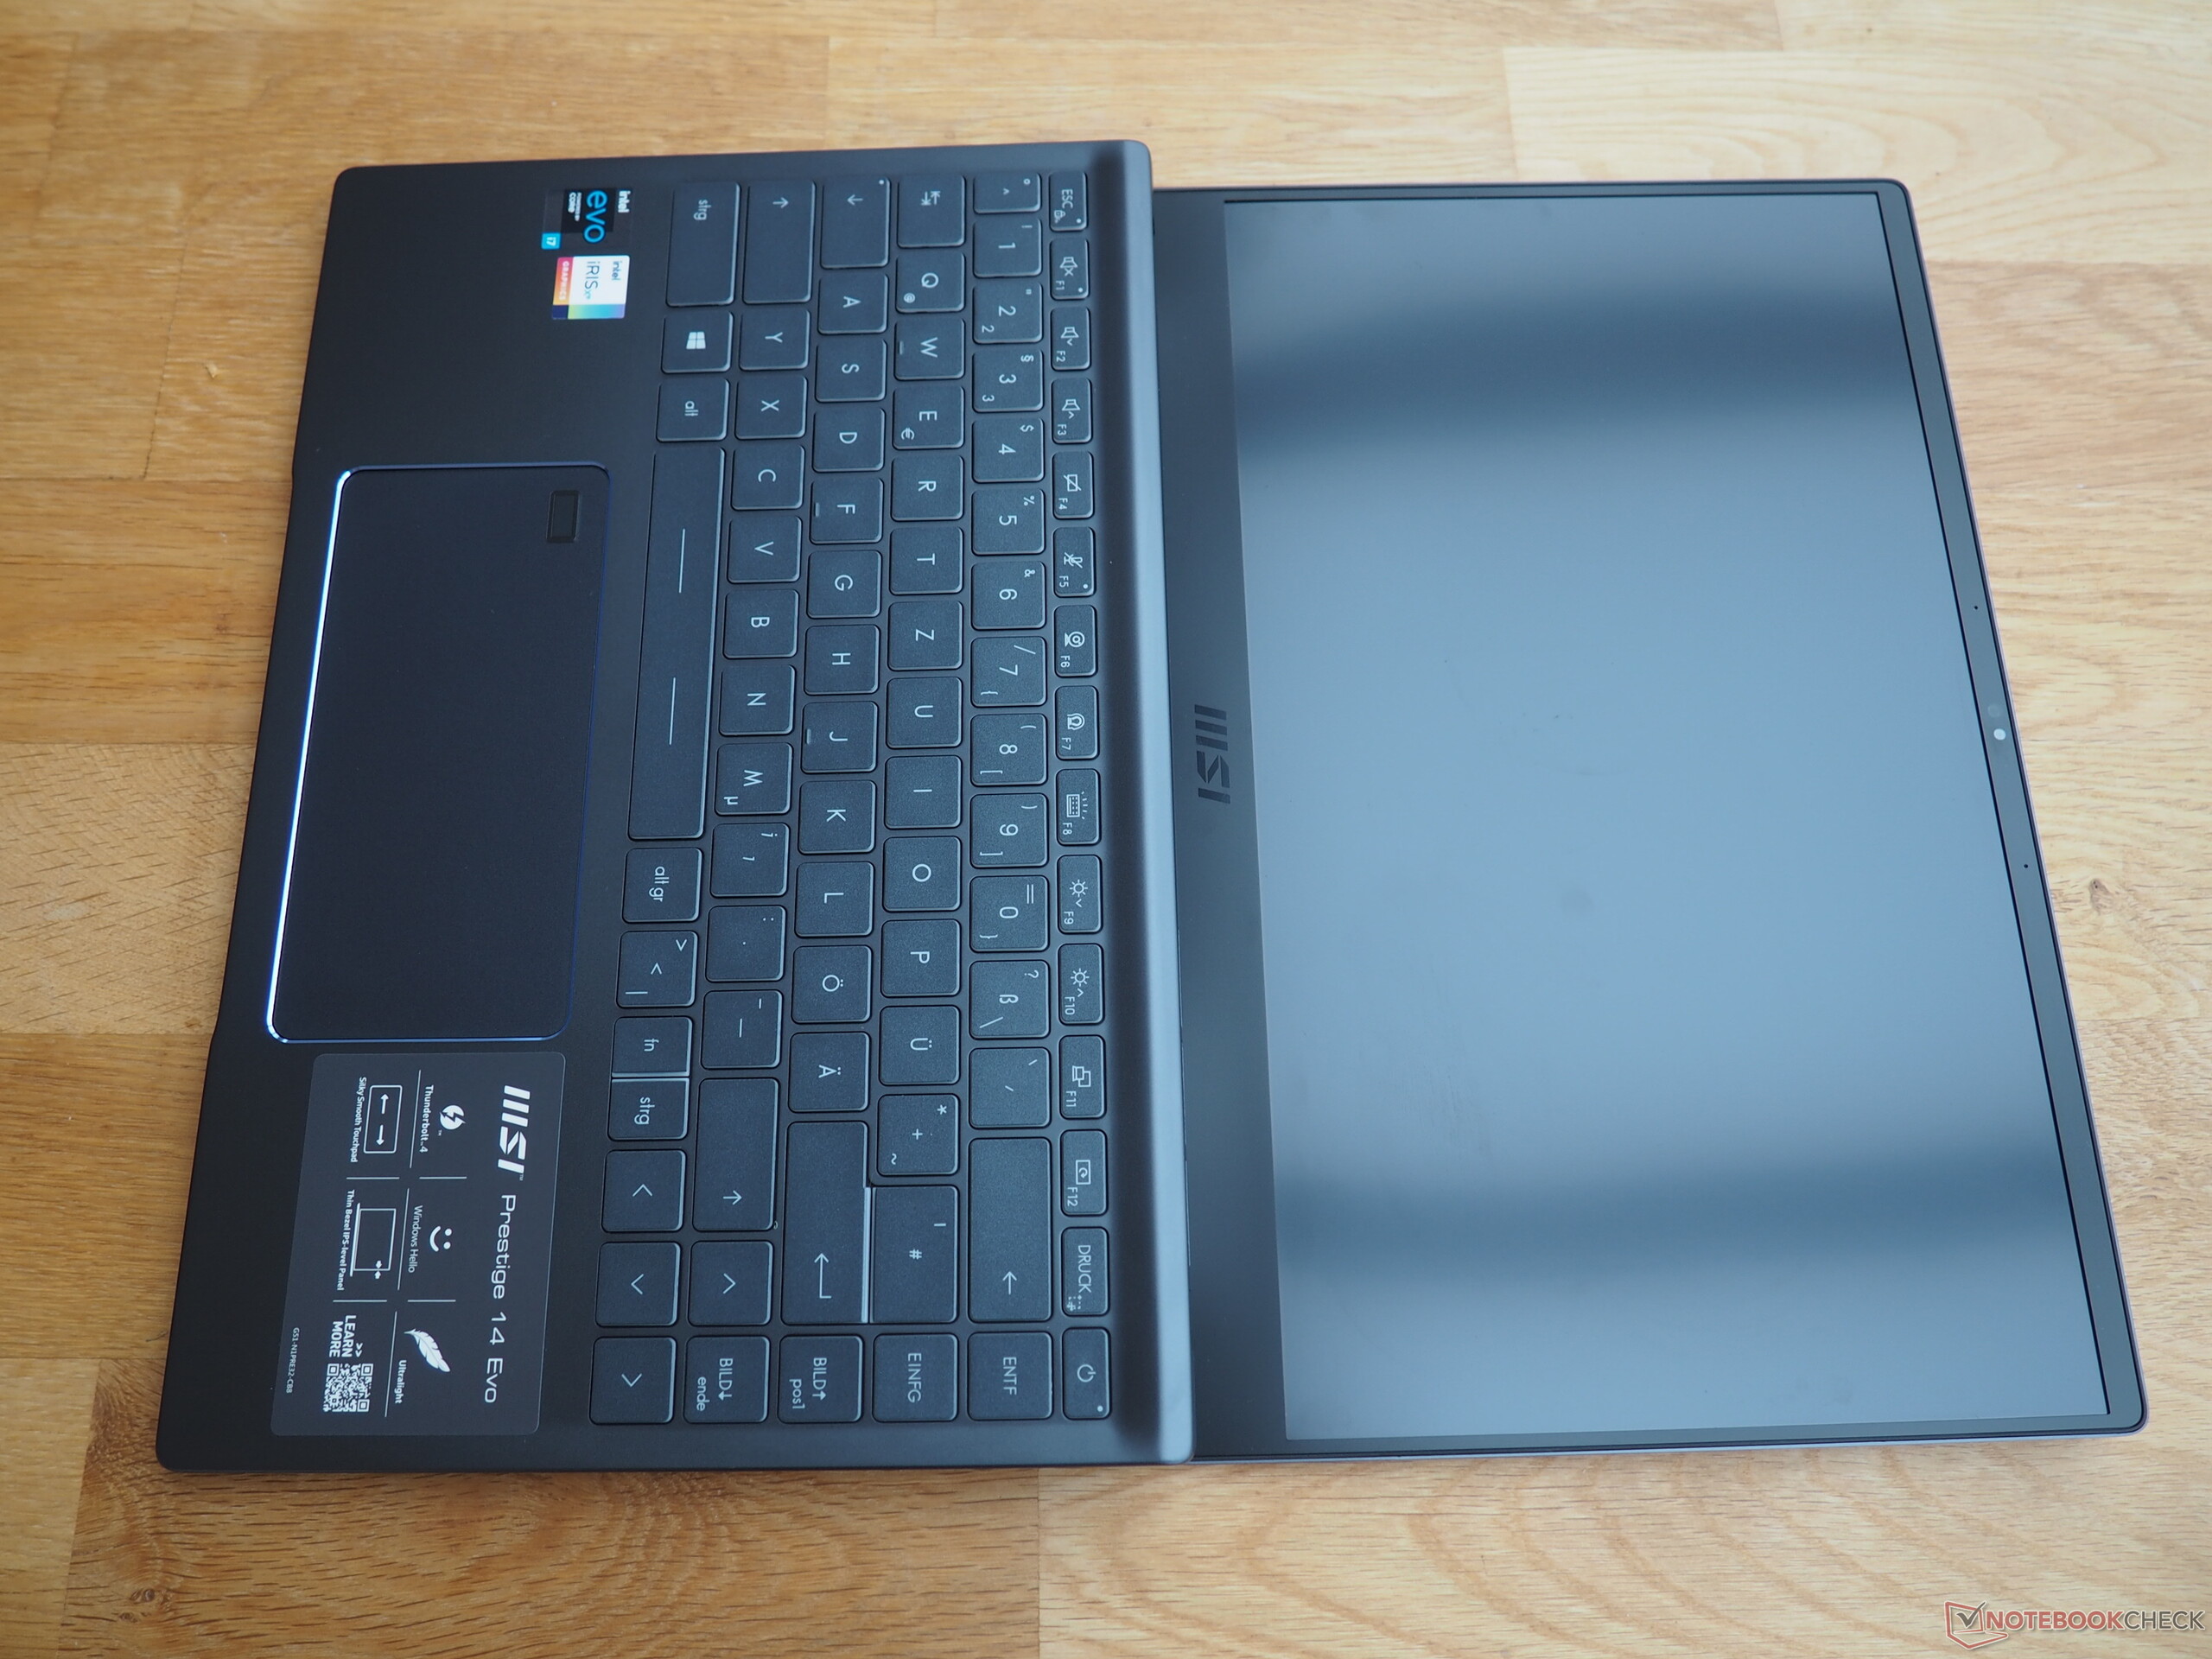
Input devices
Keyboard
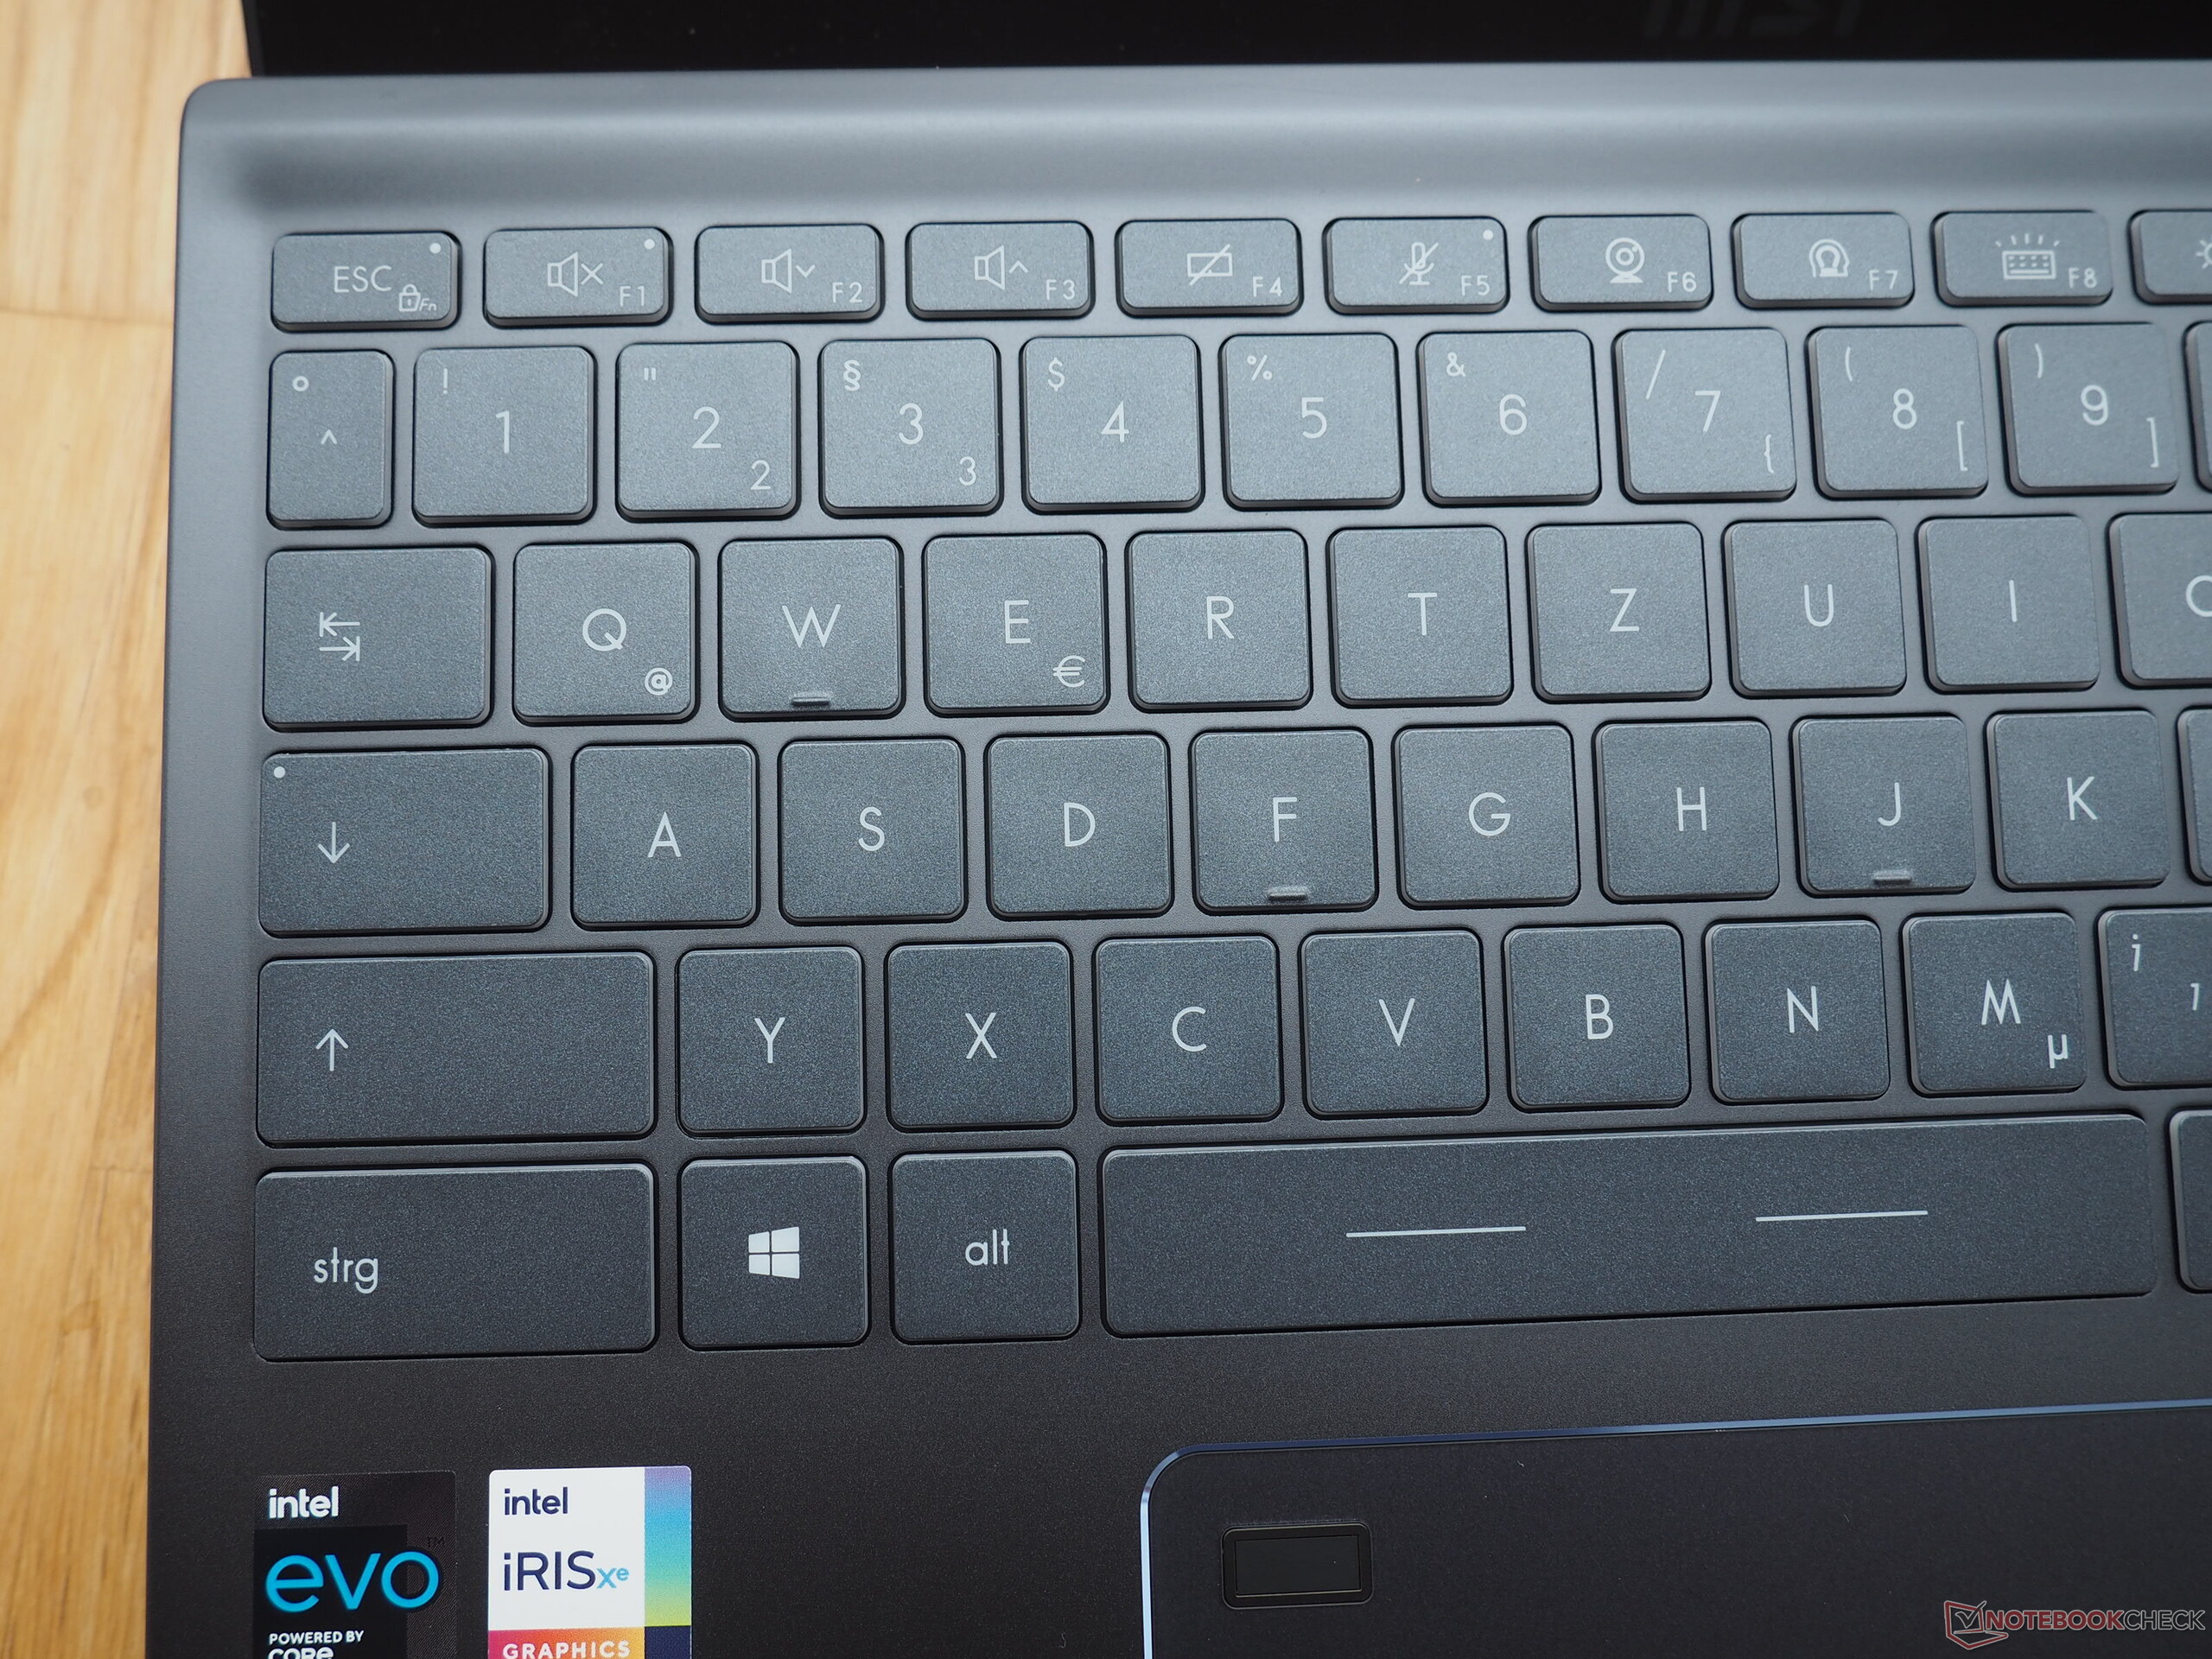
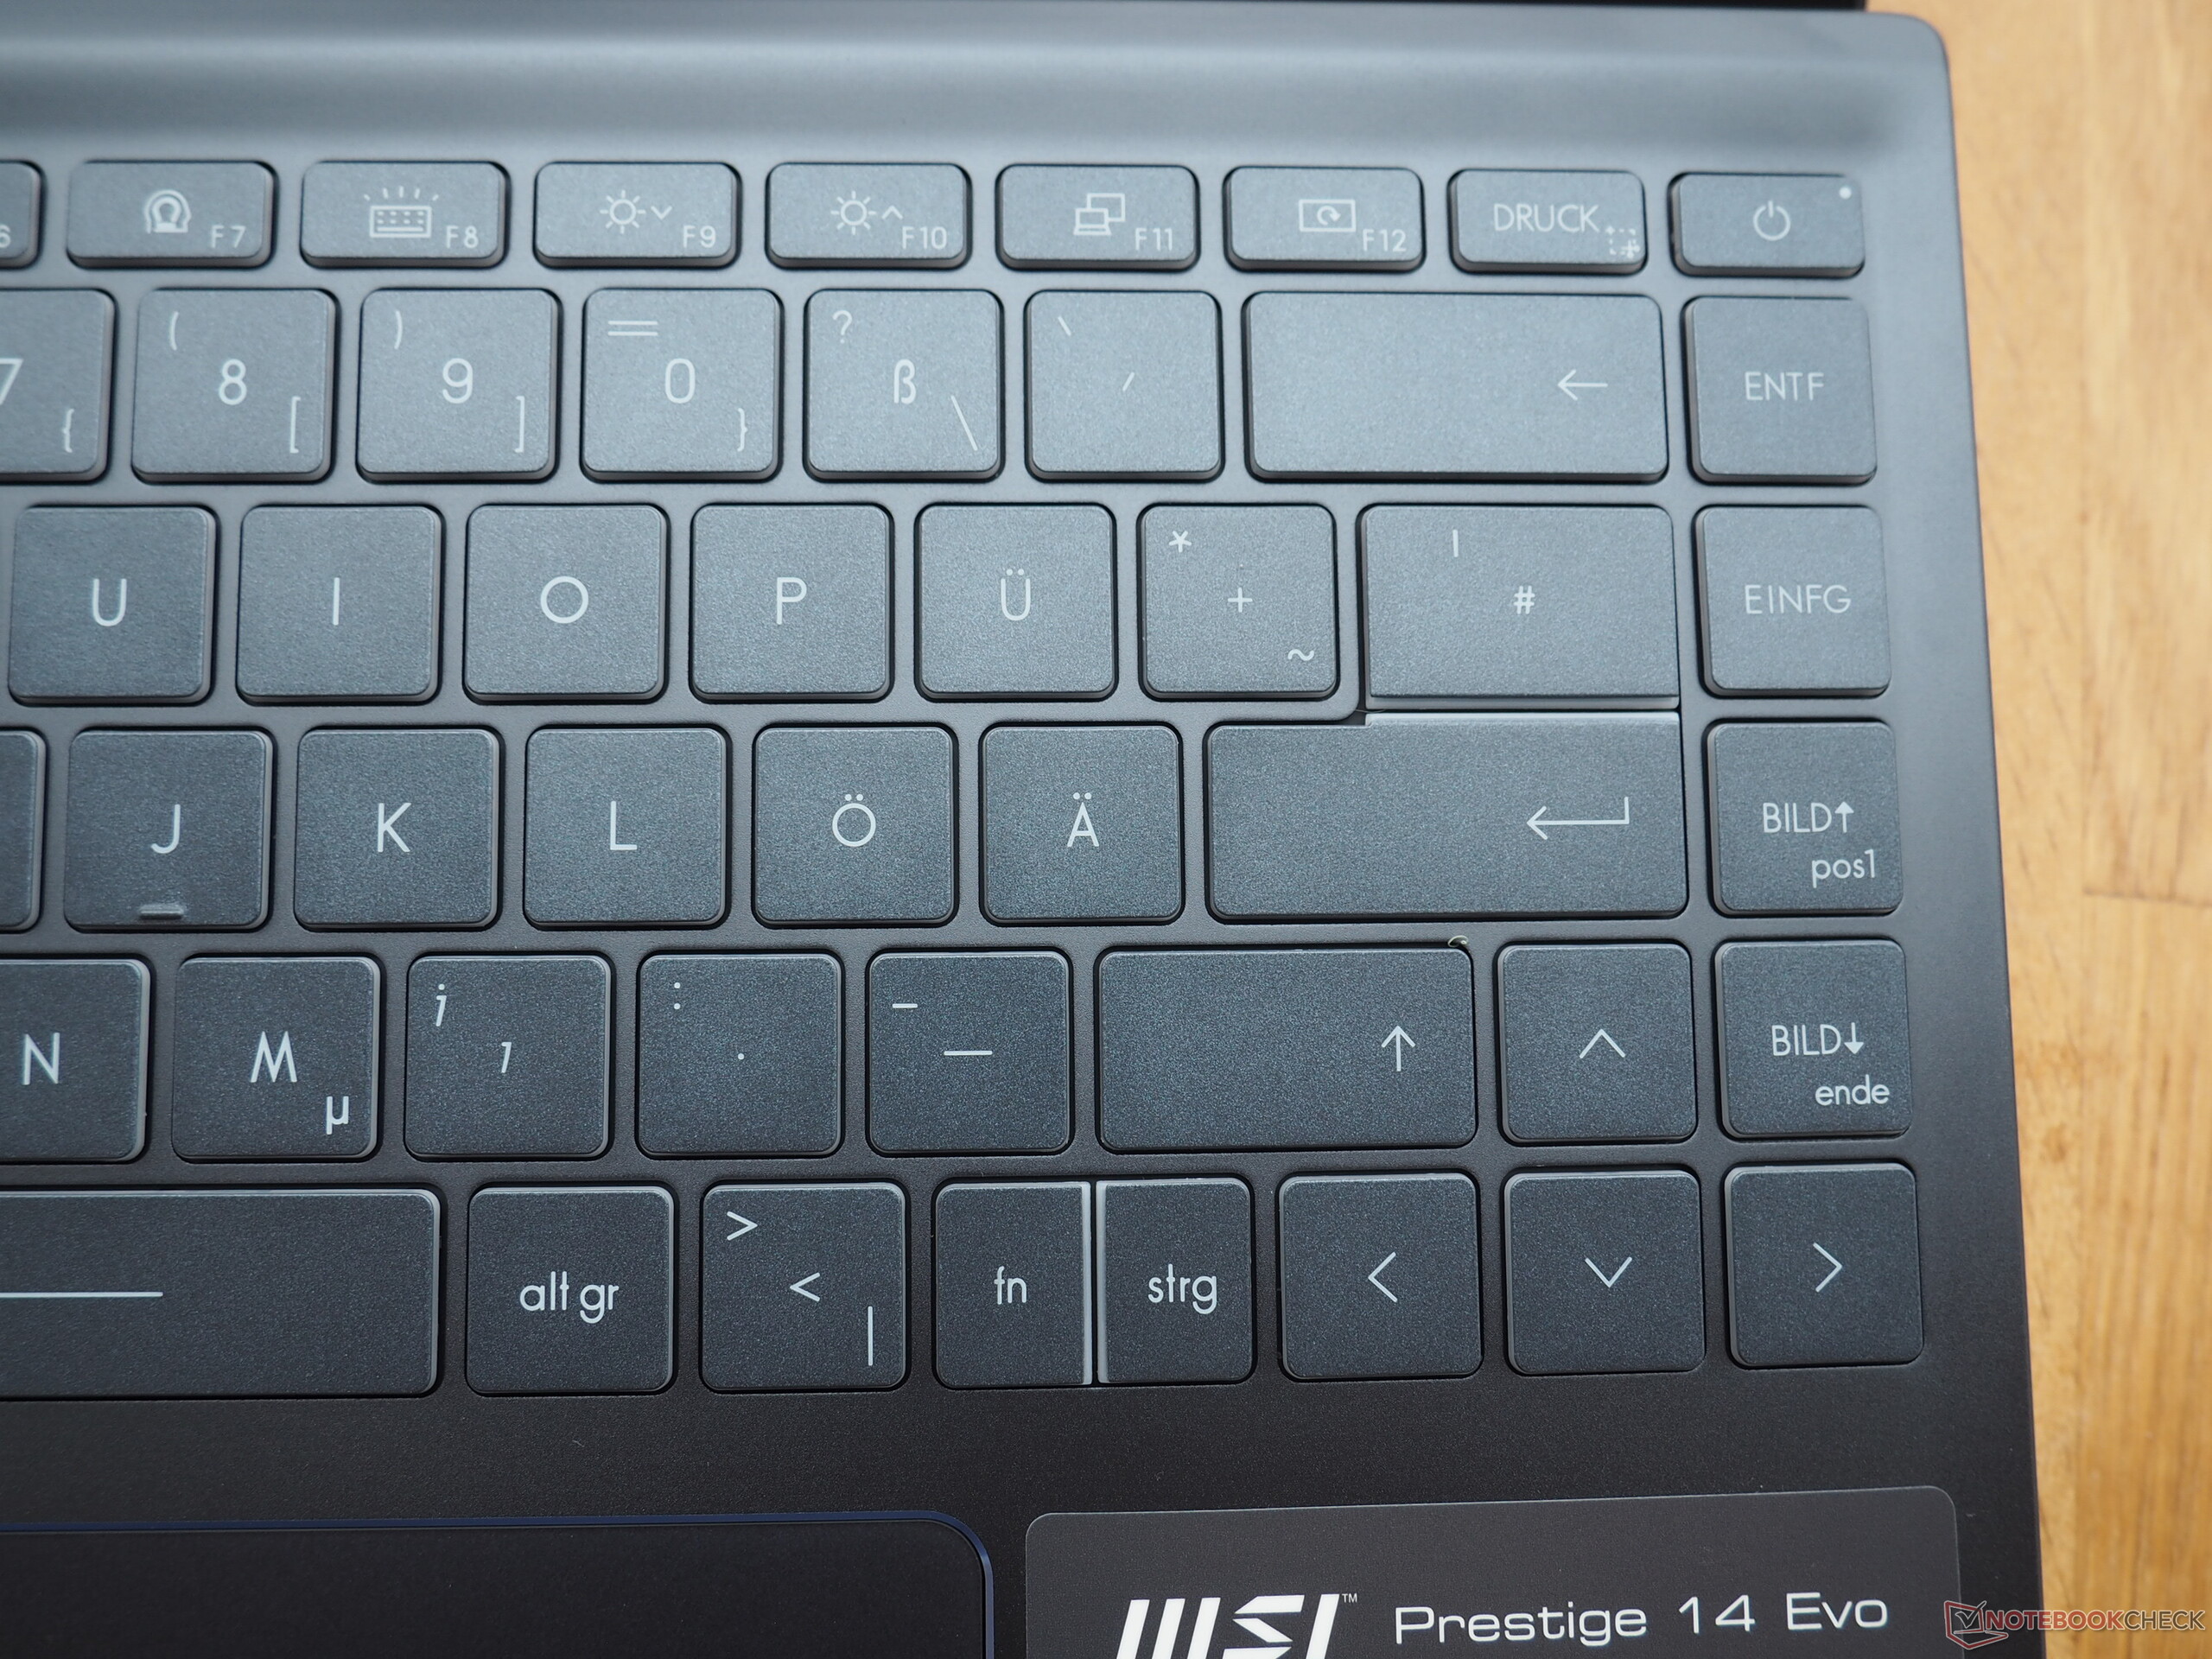
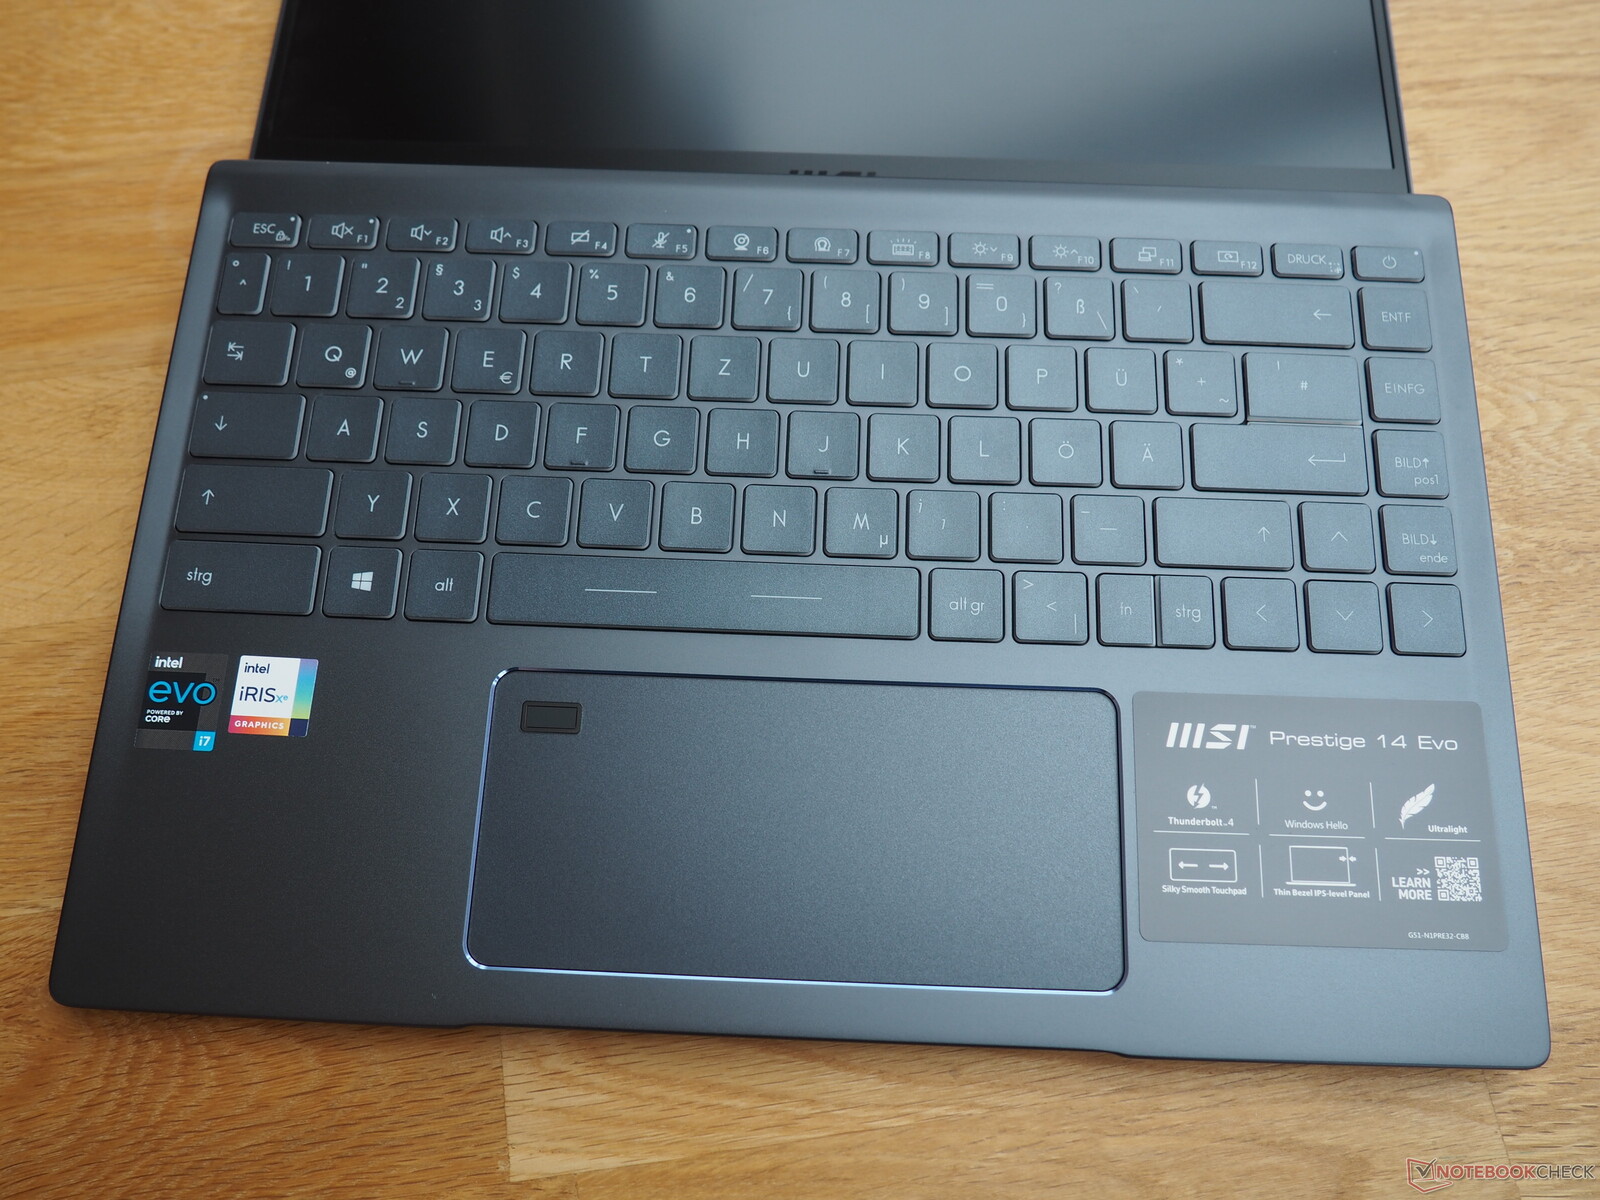
MSI uses a chiclet model as keyboard; apart from a few exceptions, it's comfortably generous in terms of key size. However, buyers will have to make do without a number pad due to the limited space. The typing experience proves to be quite good when it comes to pressure point and stroke. In terms of volume, the keyboard is in the midfield, so it's neither quiet nor particularly loud.
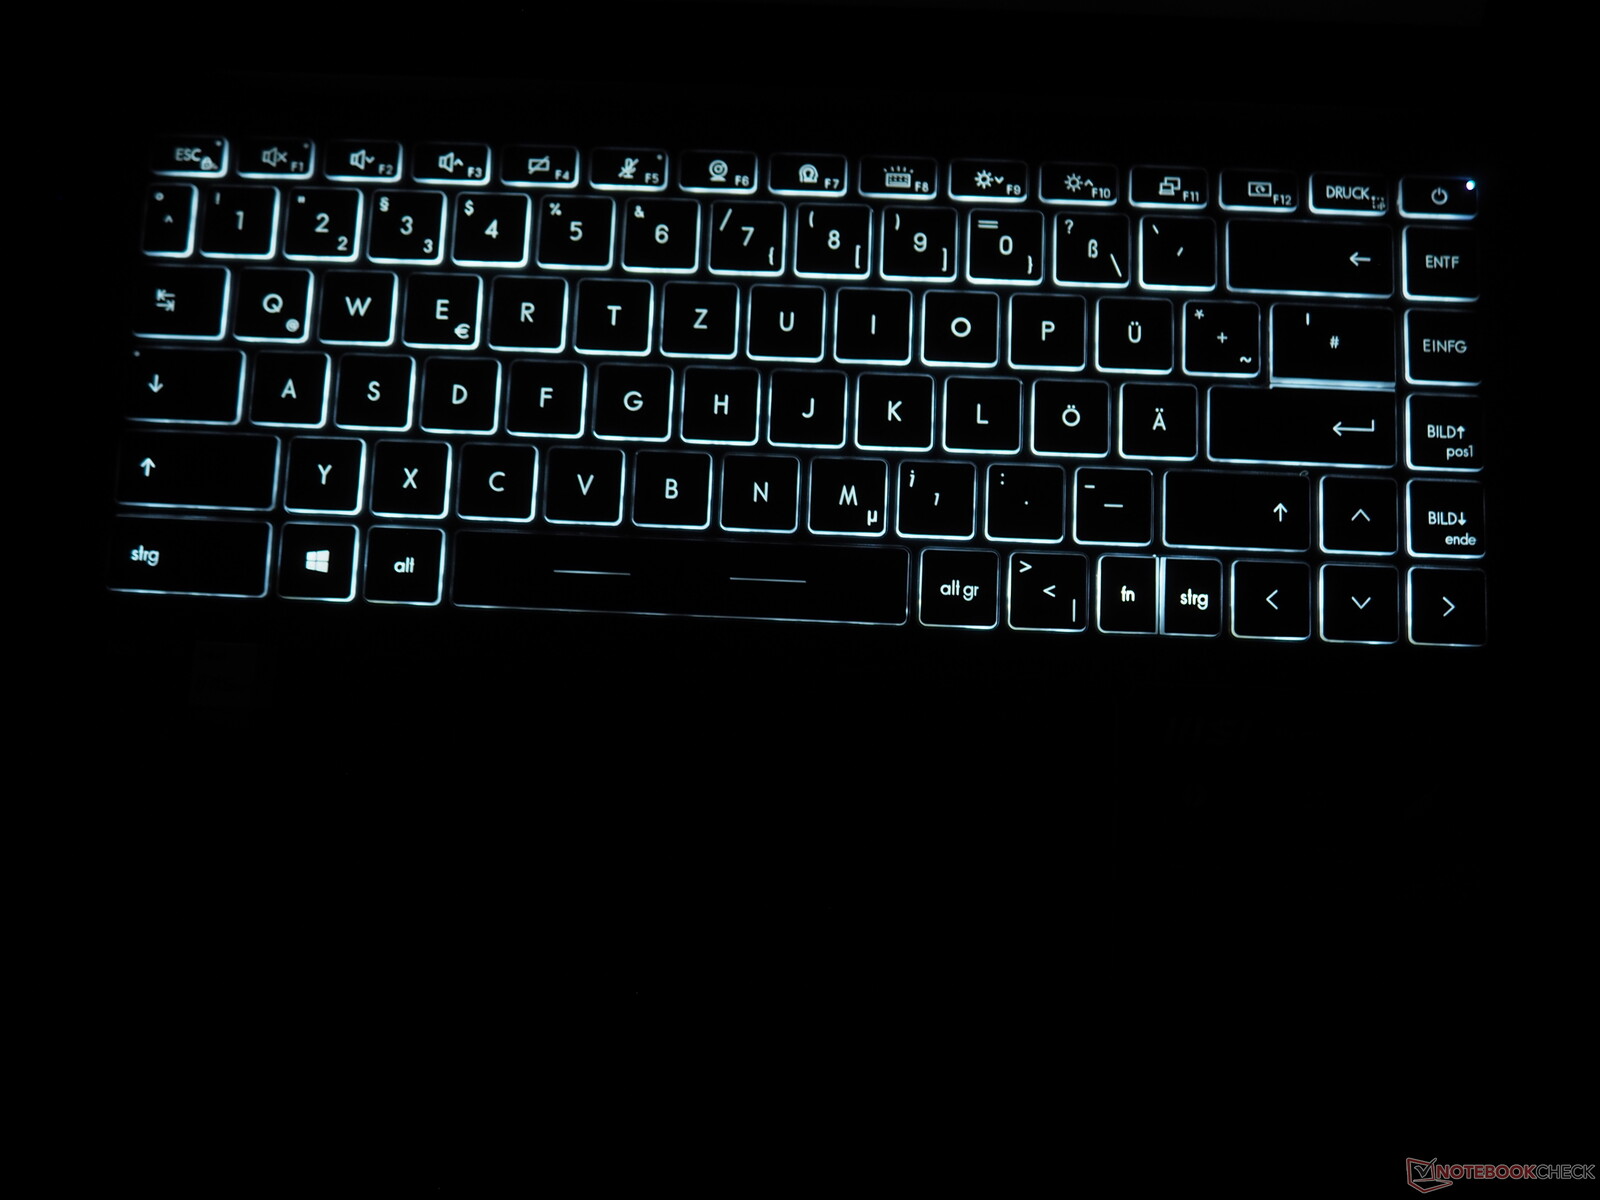
We couldn't quite get used to the layout. For a German device, the key layout is - as we've seen in many other MSI models - very unconventional (single-line Enter, shifted ><| key, ...). Due to the deviations from the standard, a certain familiarization period is required. We were most annoyed by the very narrow and closely spaced Fn/Ctrl keys. In addition, the 14 Evo offers a white keyboard backlight for nighttime use or use in poor light. It offers several adjustment stages.
Touchpad
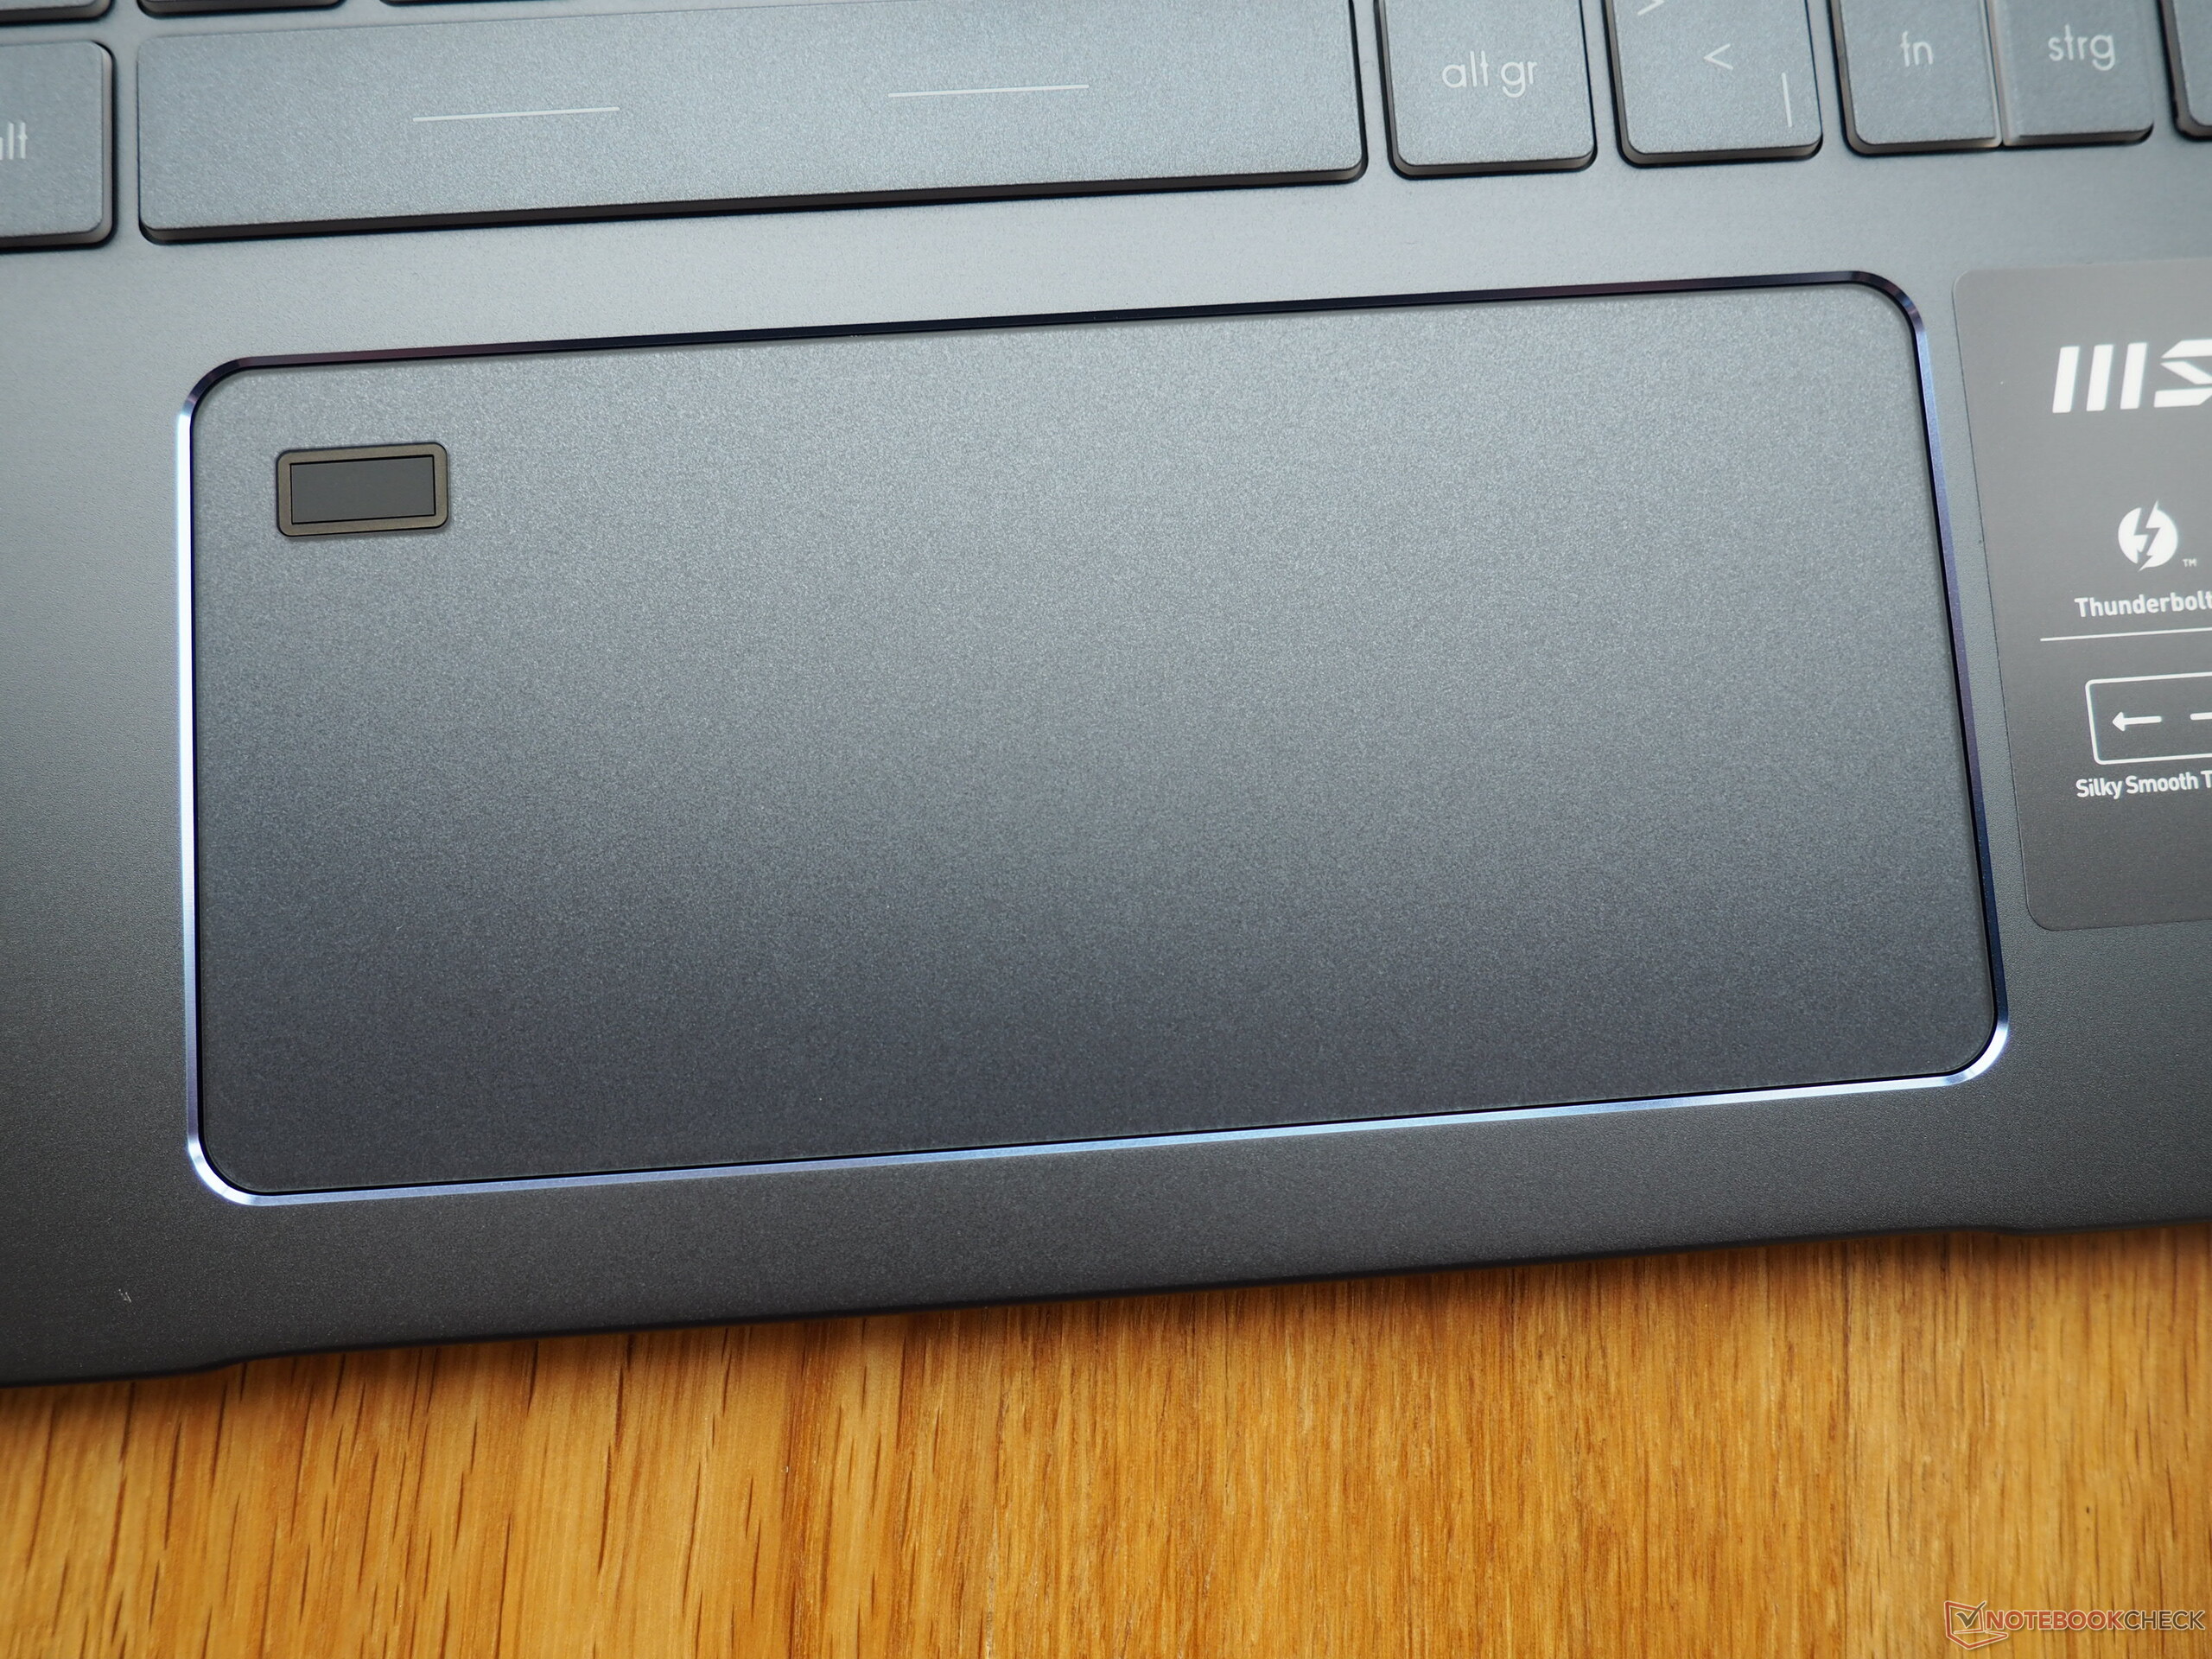
The touchpad is very large for a 14-inch device. Although the height of around 6.5 cm is moderate, the width of almost 14 cm deserves recognition and makes it easier to cover longer distances with the mouse pointer. The multi-touch support worked flawlessly in the test. Thanks to the smooth surface, content can be comfortably zoomed and scrolled with two fingers. MSI has also integrated a fingerprint scanner into the upper left corner of the touchpad.
Display
As mentioned at the beginning, the image reproduction is handled by a matte IPS panel with a resolution of 1920x1080 pixels, which is just right for the laptop's format.
| |||||||||||||||||||||||||
Brightness Distribution: 89 %
Center on Battery: 293 cd/m²
Contrast: 1628:1 (Black: 0.18 cd/m²)
ΔE Color 2.95 | 0.5-29.43 Ø5, calibrated: 0.9
ΔE Greyscale 4.2 | 0.57-98 Ø5.3
93% sRGB (Argyll 1.6.3 3D)
71% AdobeRGB 1998 (Argyll 1.6.3 3D)
70.9% AdobeRGB 1998 (Argyll 2.2.0 3D)
99.4% sRGB (Argyll 2.2.0 3D)
68.8% Display P3 (Argyll 2.2.0 3D)
Gamma: 2.099
| MSI Prestige 14 Evo A11M-005 AUO B140HAN06.2 (AUO623D), IPS-Level, 1920x1080, 14.00 | Asus ZenBook 14 UX425EA AU Optronics B140HAN06.8, IPS, 1920x1080, 14.00 | Lenovo Yoga Slim 7-14ARE AU Optronics B140HAN06.8, IPS, 1920x1080, 14.00 | HP EliteBook 845 G7 Ryzen 7 Pro 4750U AU Optronics AUO068B, IPS, 1920x1080, 14.00 | Acer Swift 3 SF314-42-R4XJ AU Optronics B140HAN04.0, IPS, 1920x1080, 14.00 | |
|---|---|---|---|---|---|
| Display | -1% | 2% | -1% | -45% | |
| Display P3 Coverage | 68.8 | 68.6 0% | 71.7 4% | 68.2 -1% | 37.2 -46% |
| sRGB Coverage | 99.4 | 98.3 -1% | 99.3 0% | 98.5 -1% | 55.9 -44% |
| AdobeRGB 1998 Coverage | 70.9 | 69.8 -2% | 72.9 3% | 69.8 -2% | 38.43 -46% |
| Response Times | 19% | 17% | -15% | 28% | |
| Response Time Grey 50% / Grey 80% * | 59.6 ? | 49.6 ? 17% | 45.6 ? 23% | 65.2 ? -9% | 41 ? 31% |
| Response Time Black / White * | 32.8 ? | 26.4 ? 20% | 29.6 ? 10% | 39.6 ? -21% | 25 ? 24% |
| PWM Frequency | |||||
| Screen | -2% | -17% | 1% | -80% | |
| Brightness middle | 293 | 375.1 28% | 399.6 36% | 432.5 48% | 269 -8% |
| Brightness | 277 | 371 34% | 385 39% | 405 46% | 244 -12% |
| Brightness Distribution | 89 | 91 2% | 89 0% | 86 -3% | 83 -7% |
| Black Level * | 0.18 | 0.34 -89% | 0.37 -106% | 0.3 -67% | 0.23 -28% |
| Contrast | 1628 | 1103 -32% | 1080 -34% | 1442 -11% | 1170 -28% |
| Colorchecker dE 2000 * | 2.95 | 1.79 39% | 3.2 -8% | 2.34 21% | 4.94 -67% |
| Colorchecker dE 2000 max. * | 6.03 | 3.05 49% | 6.44 -7% | 3.59 40% | 20.37 -238% |
| Colorchecker dE 2000 calibrated * | 0.9 | 1.79 -99% | 1.73 -92% | 1.83 -103% | 5.03 -459% |
| Greyscale dE 2000 * | 4.2 | 2.3 45% | 4.7 -12% | 2.5 40% | 1.71 59% |
| Gamma | 2.099 105% | 2.29 96% | 2.21 100% | 2.1 105% | 2.52 87% |
| CCT | 6622 98% | 6405 101% | 7184 90% | 6582 99% | 6535 99% |
| Color Space (Percent of AdobeRGB 1998) | 71 | 63.9 -10% | 66.3 -7% | 63.8 -10% | 35 -51% |
| Color Space (Percent of sRGB) | 93 | 98.8 6% | 99.5 7% | 99.4 7% | 56 -40% |
| Total Average (Program / Settings) | 5% /
0% | 1% /
-9% | -5% /
-2% | -32% /
-60% |
* ... smaller is better
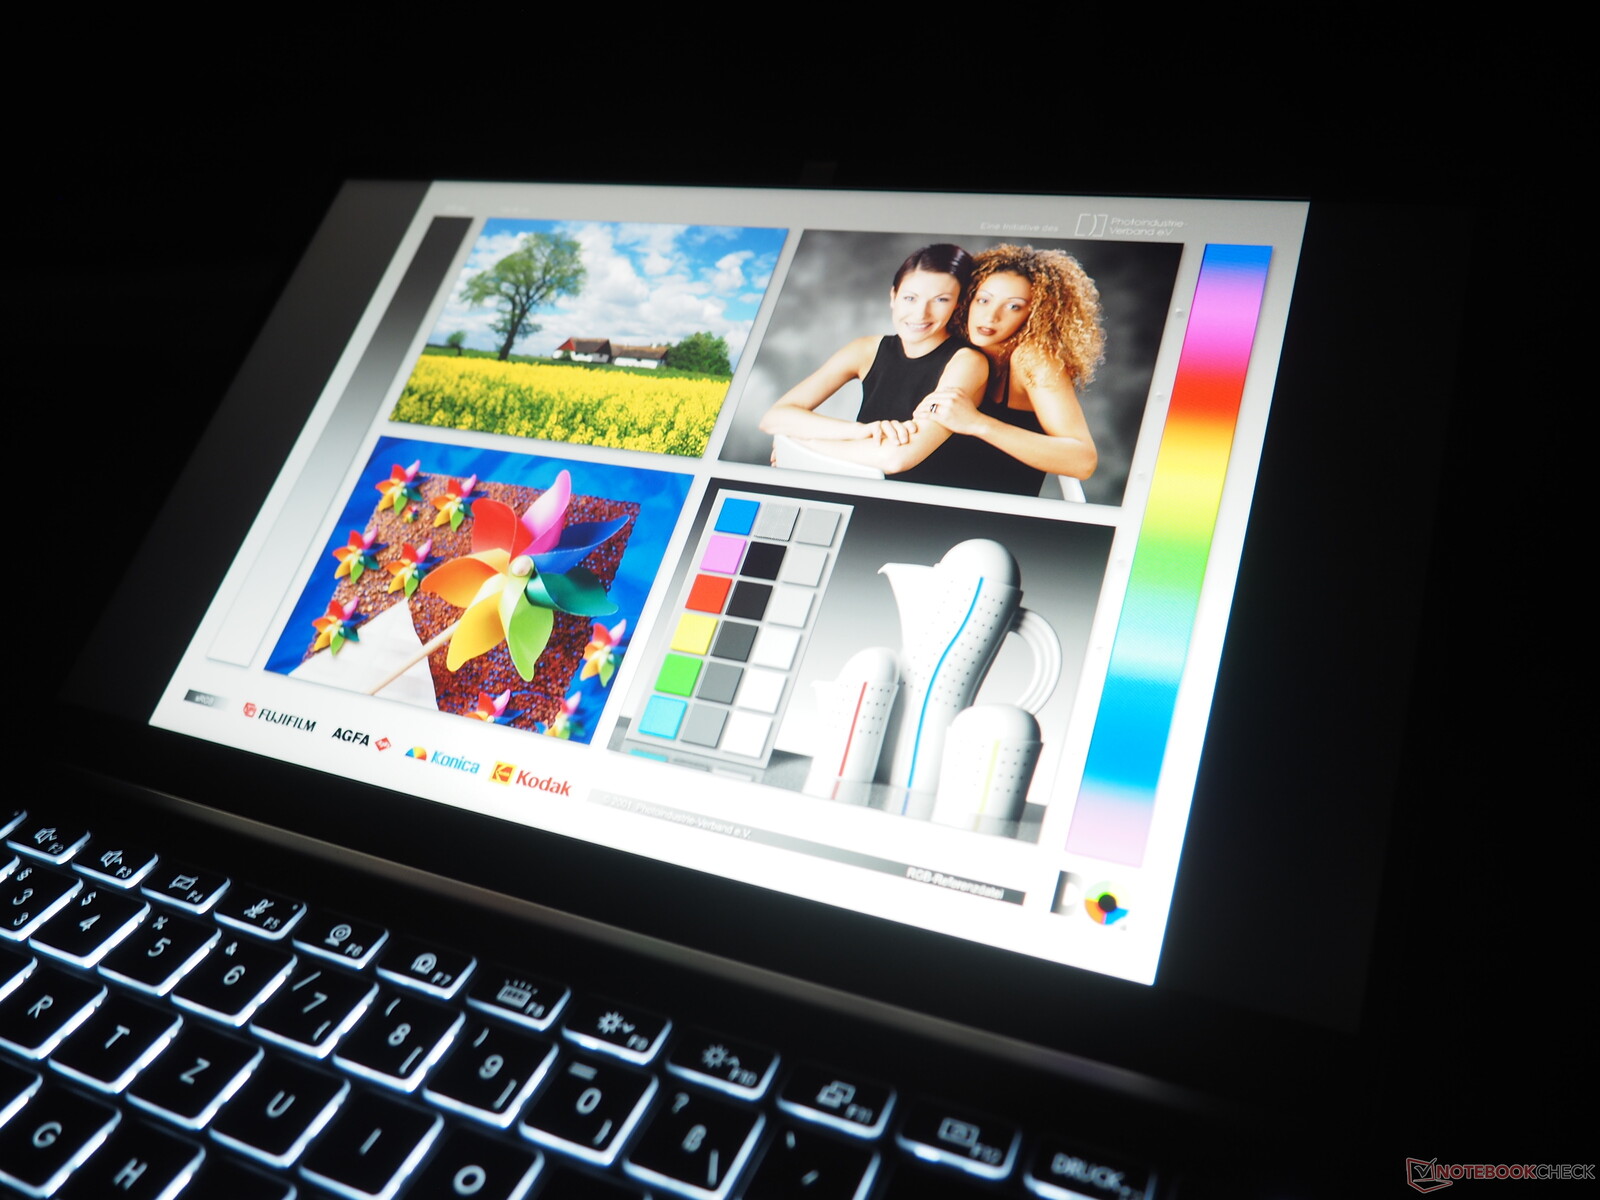
While the black level (0.18 cd/m²) and contrast (over 1,600:1) are convincing, brightness falls short of expectations and possibilities. An average of 277 cd/m² is primarily suitable for indoor use and not for outdoor sessions - annoying in view of the device's mobile nature. With the exception of the Acer Swift 3, all rivals manage around 400 cd/m².
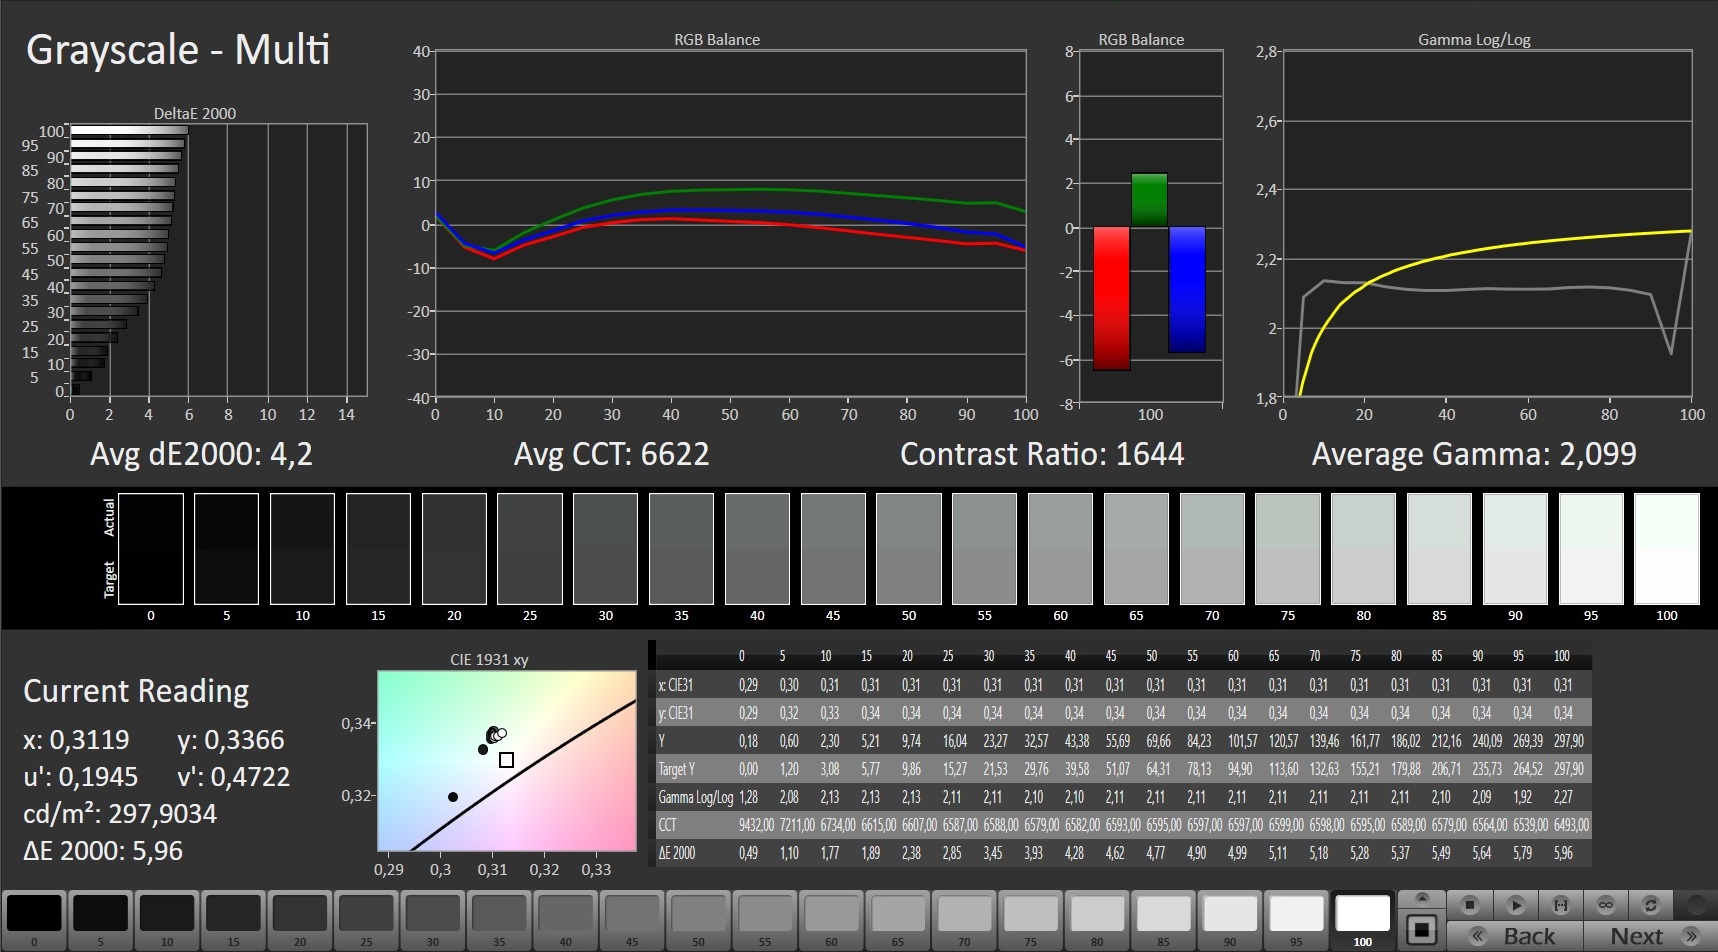
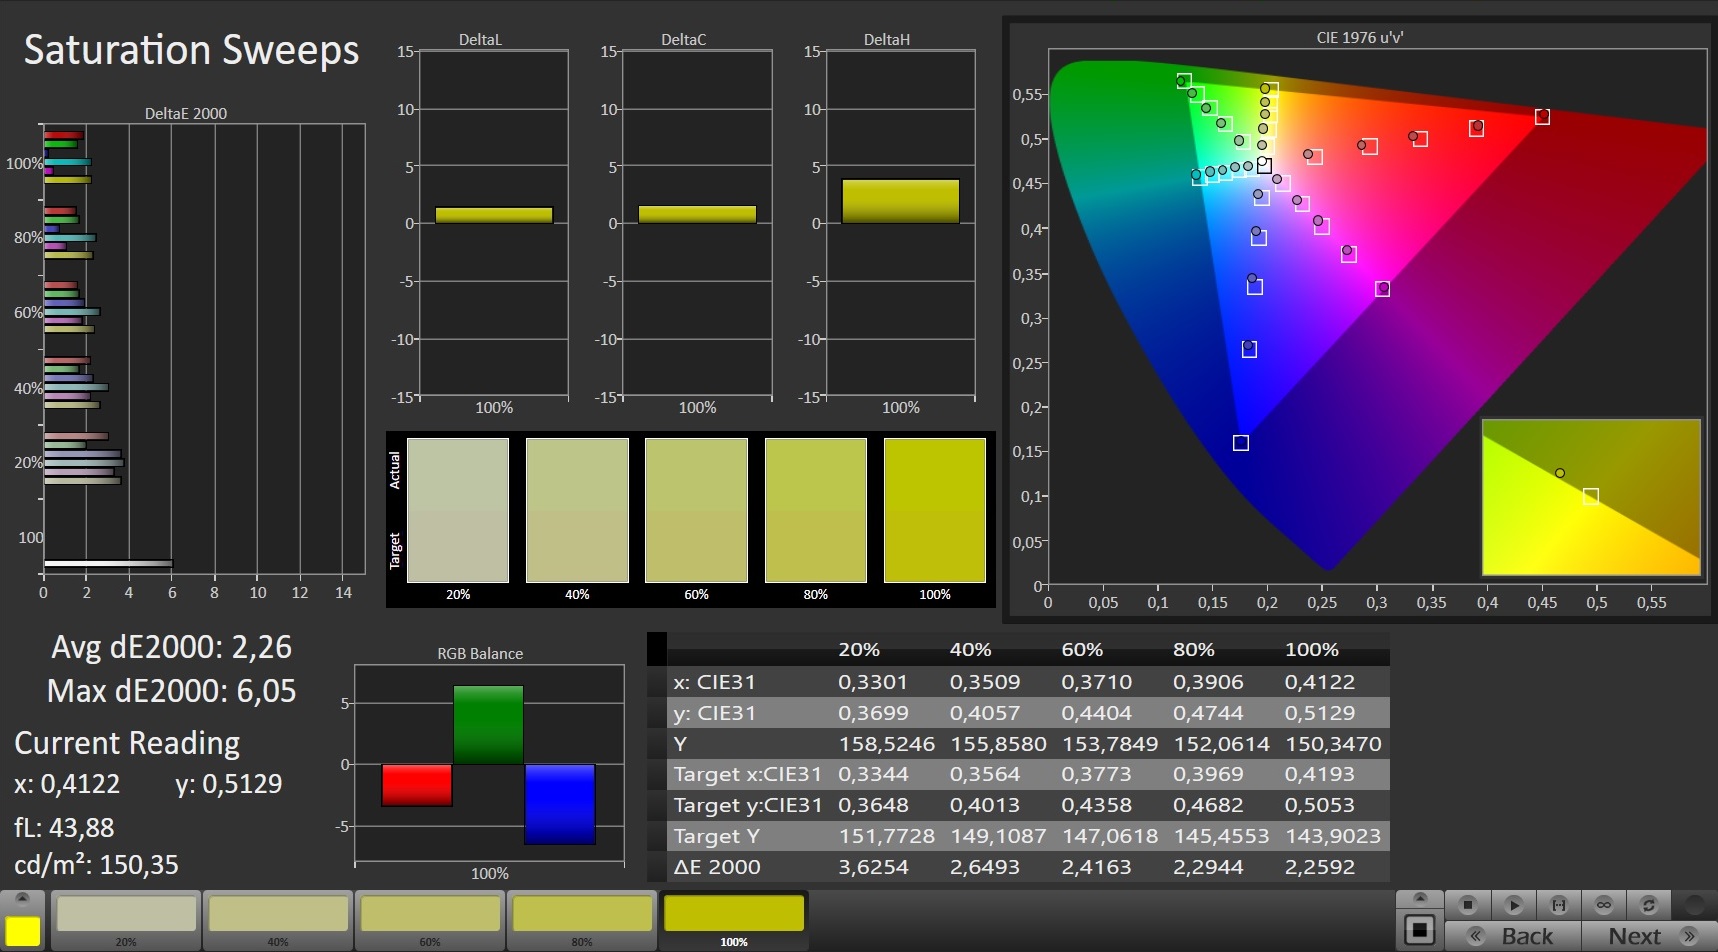
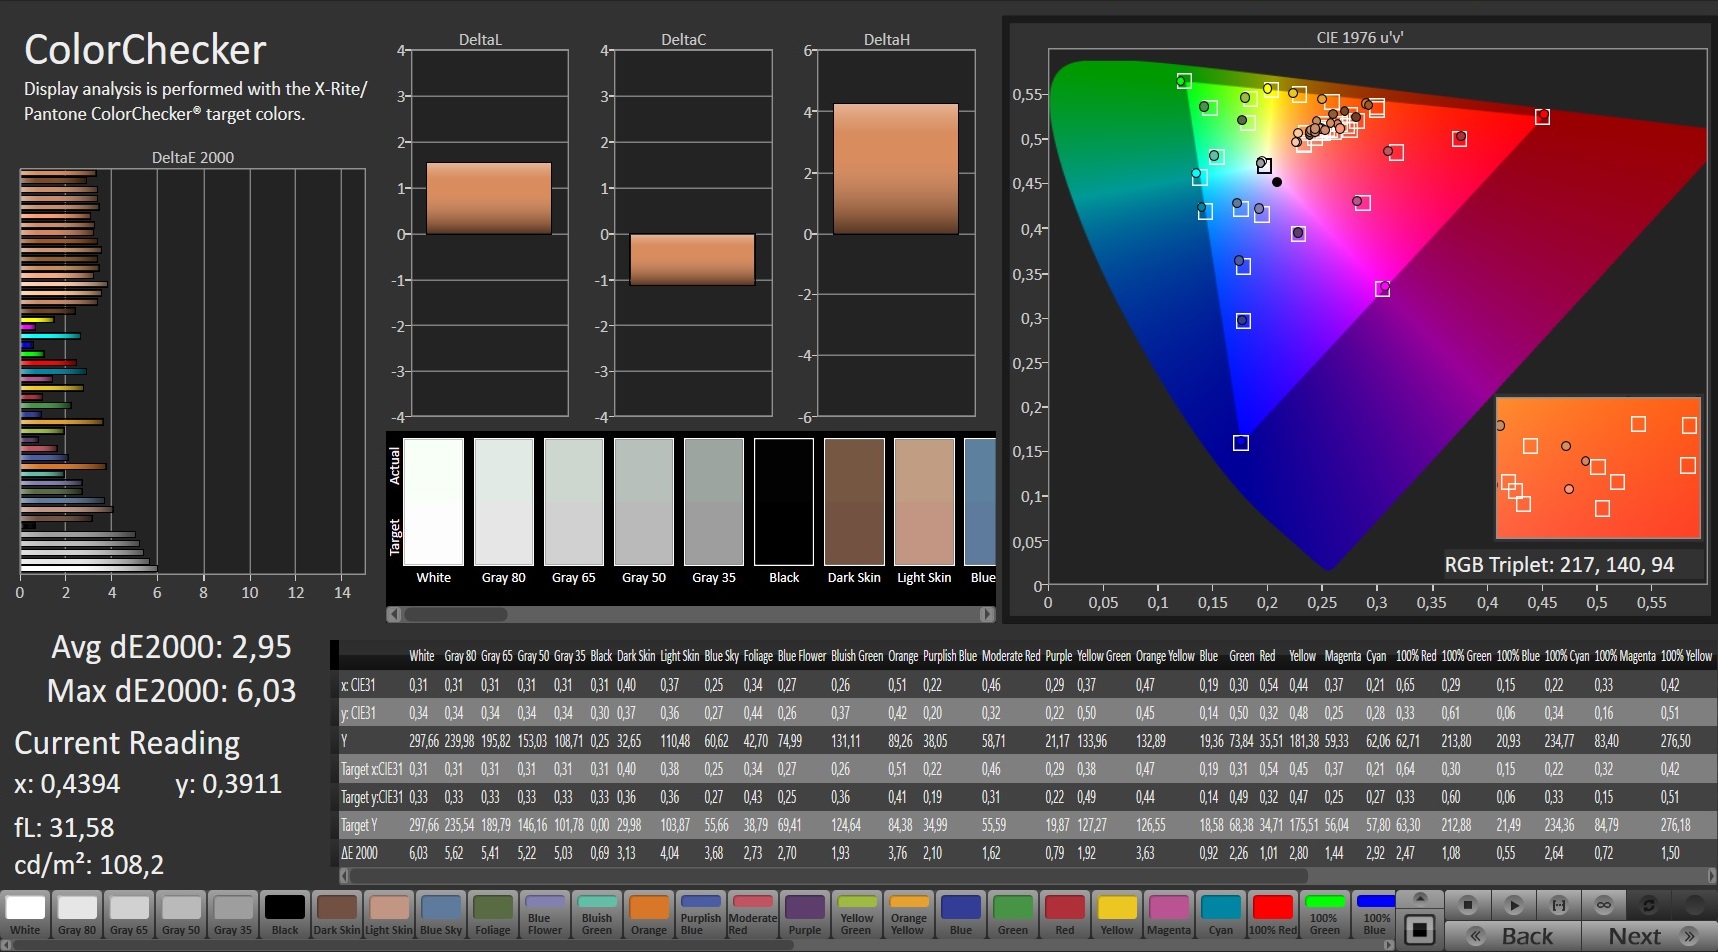
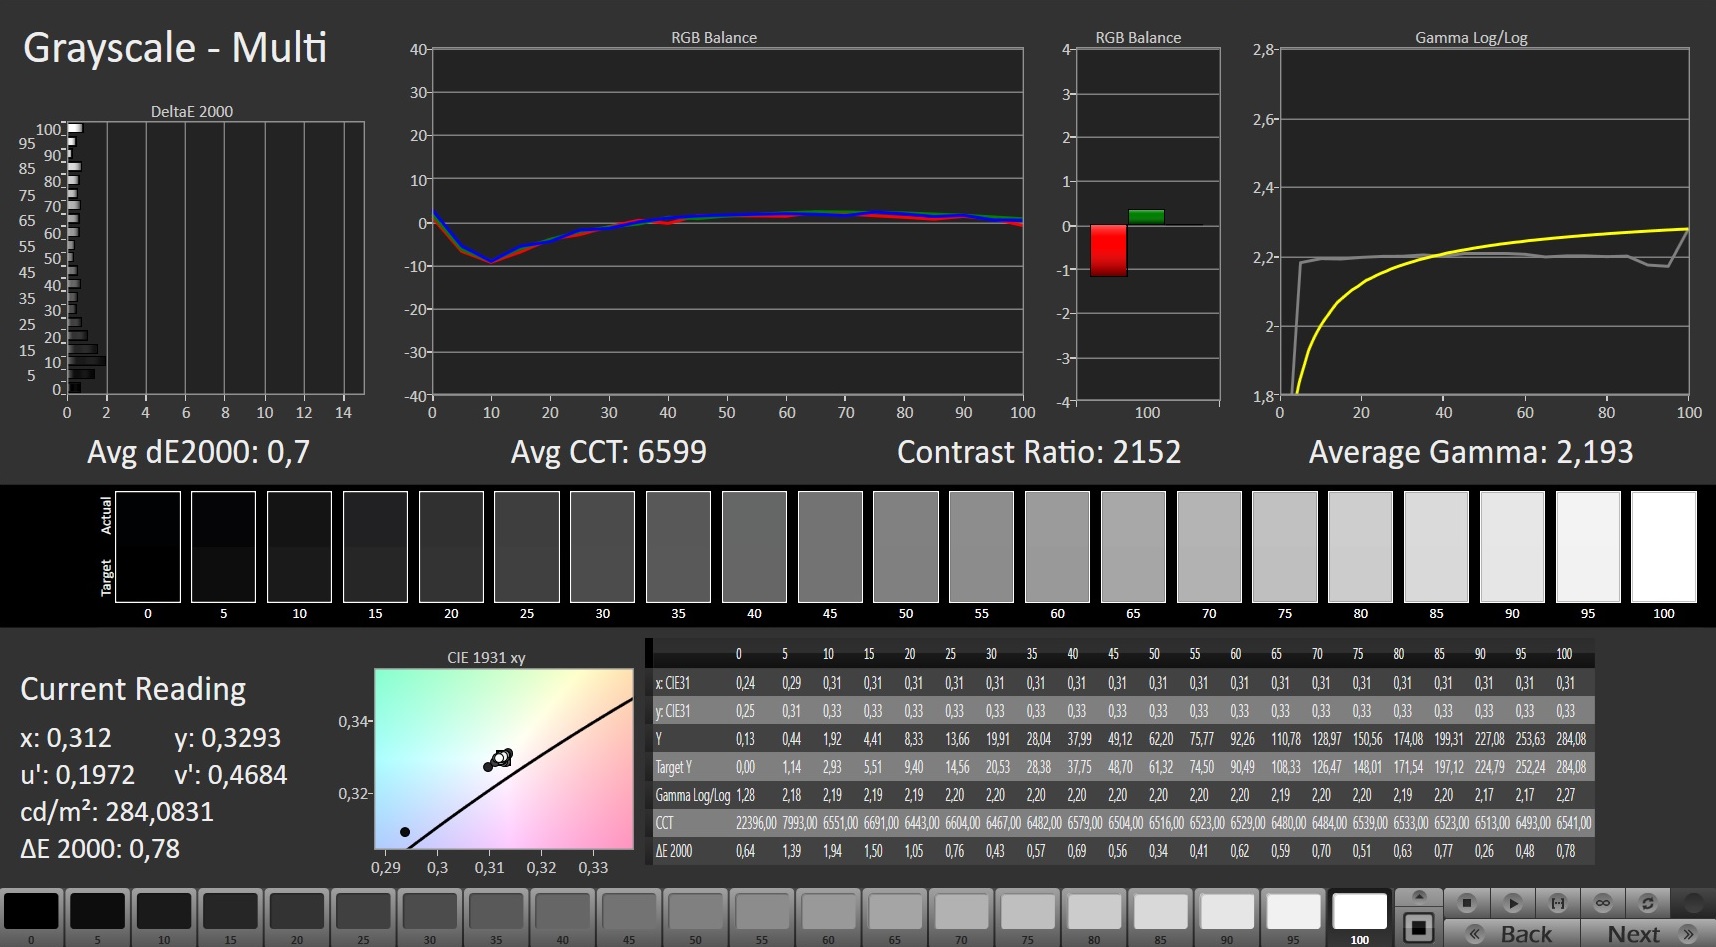
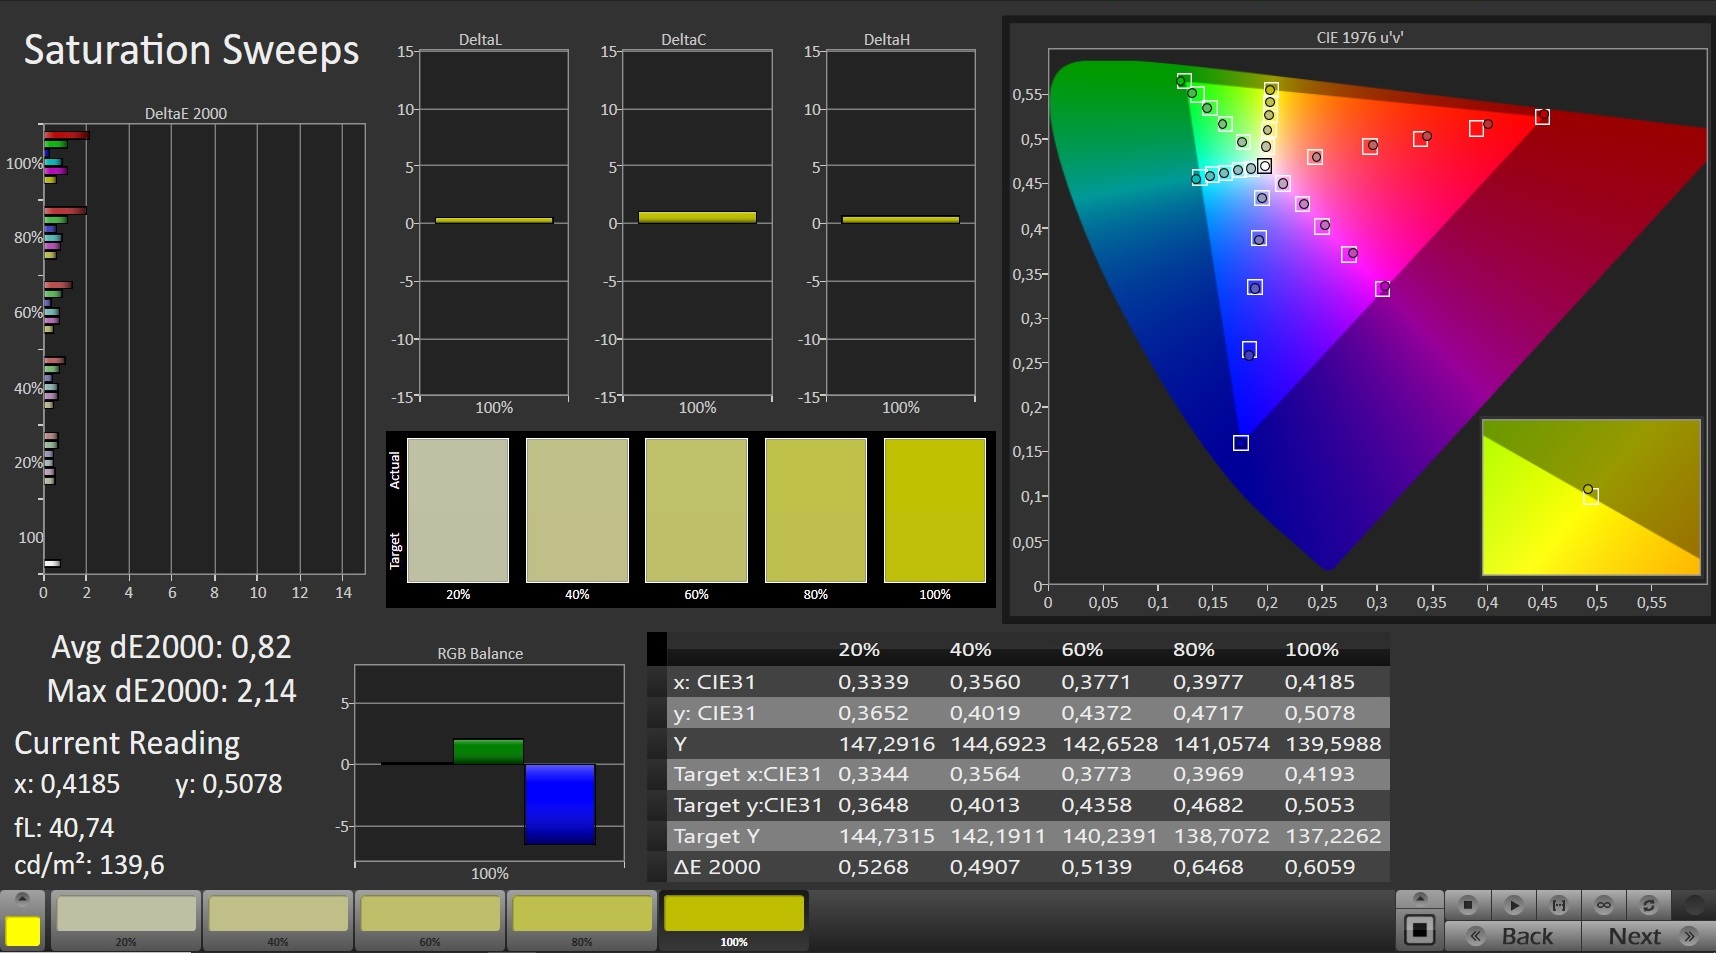
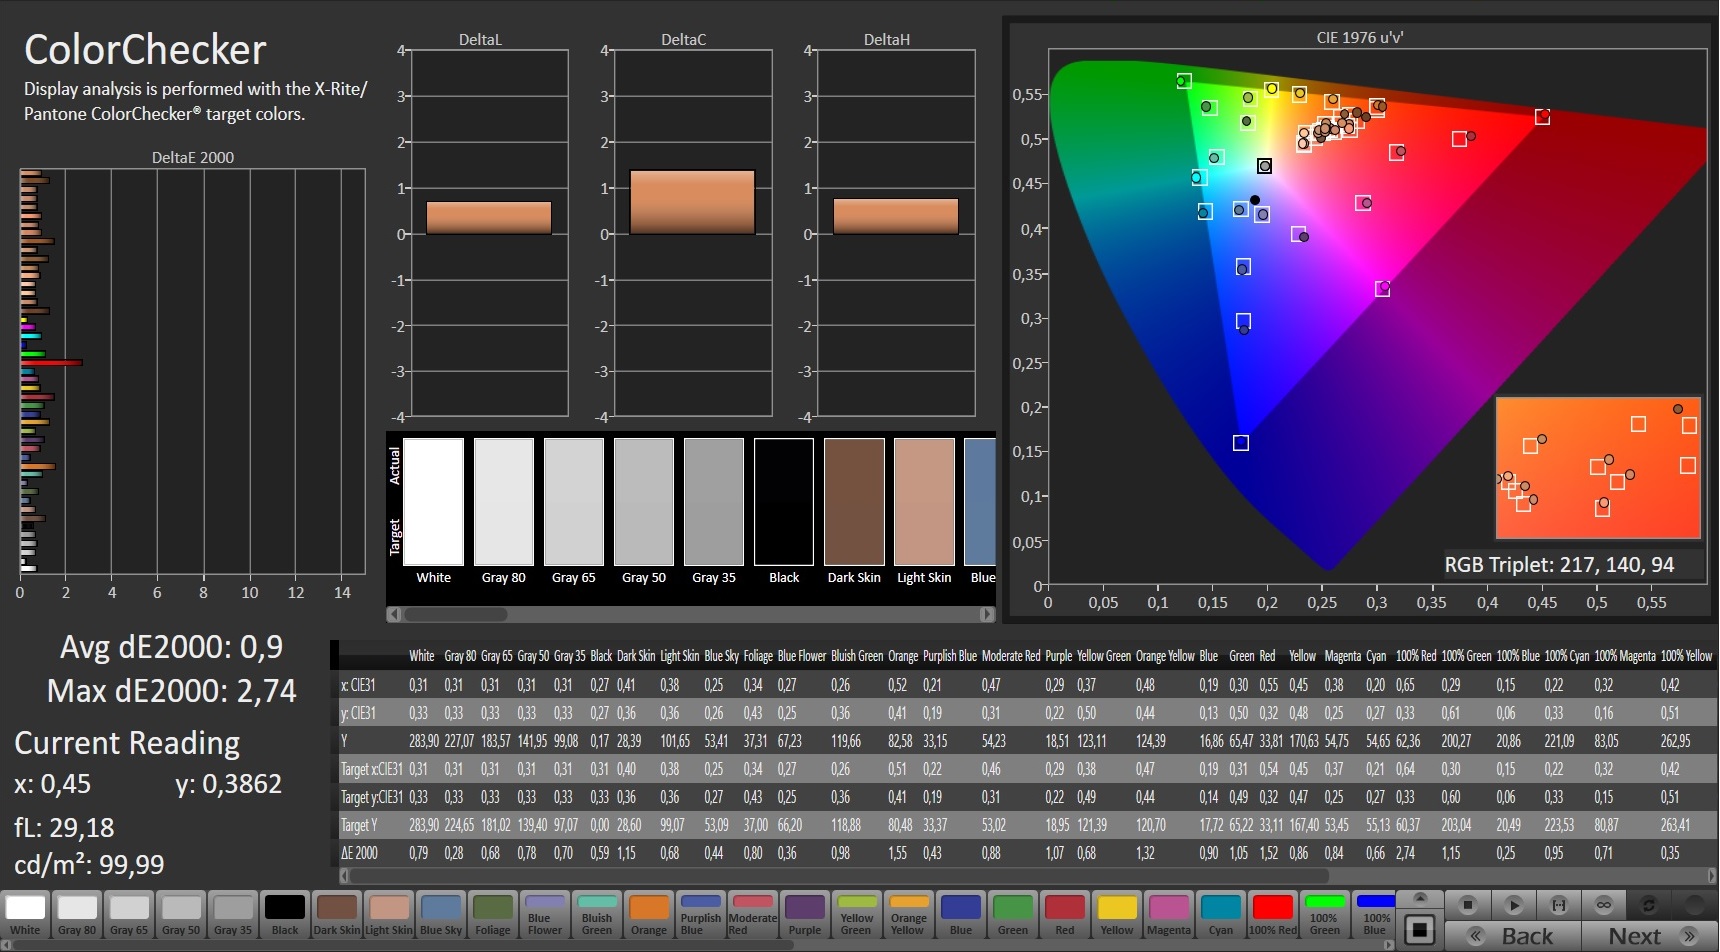
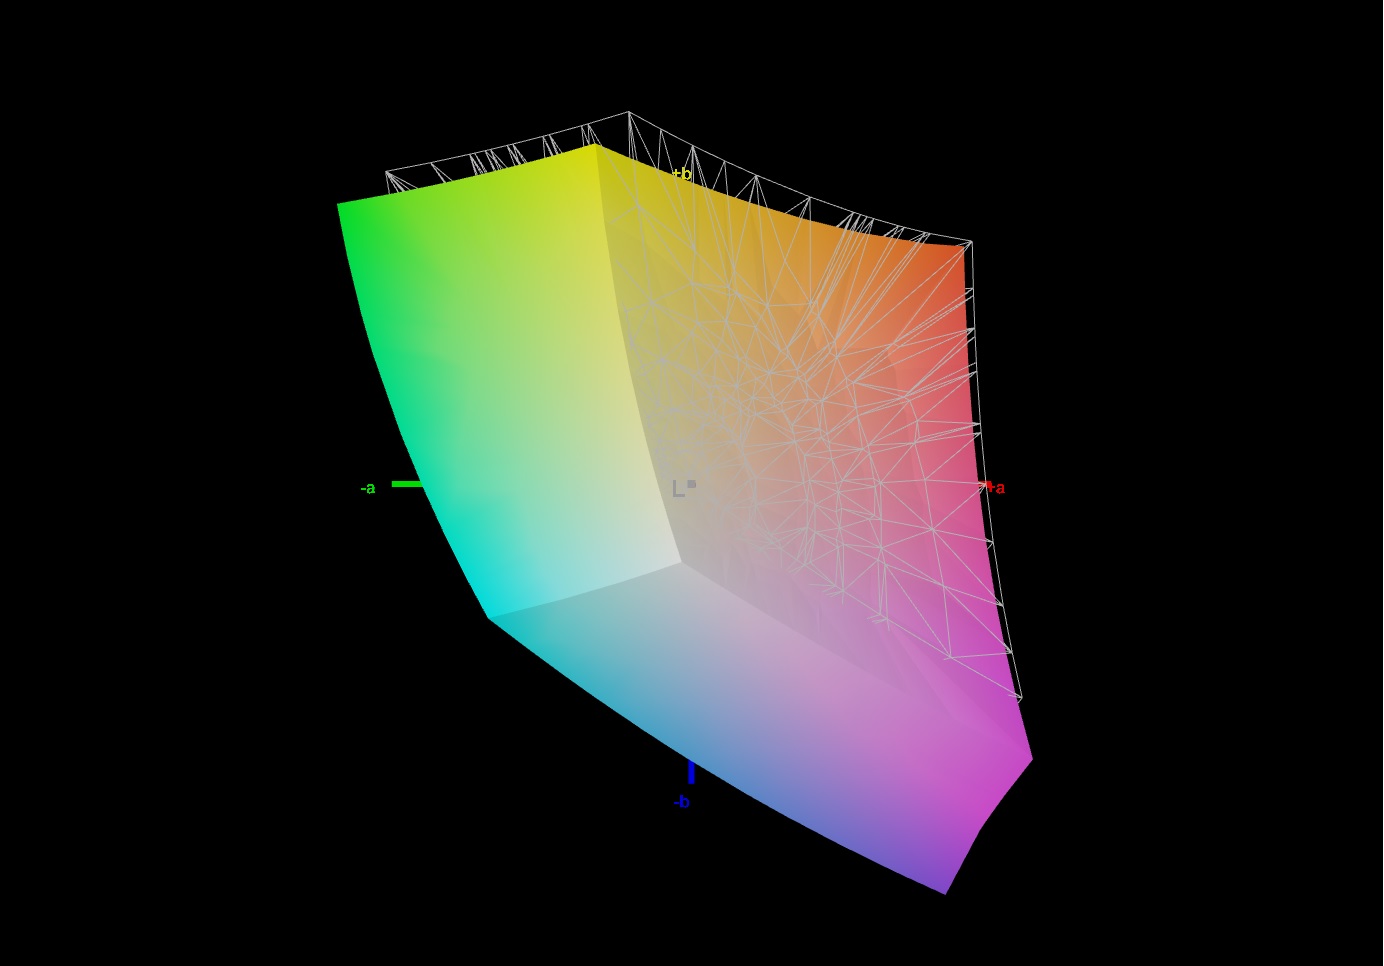
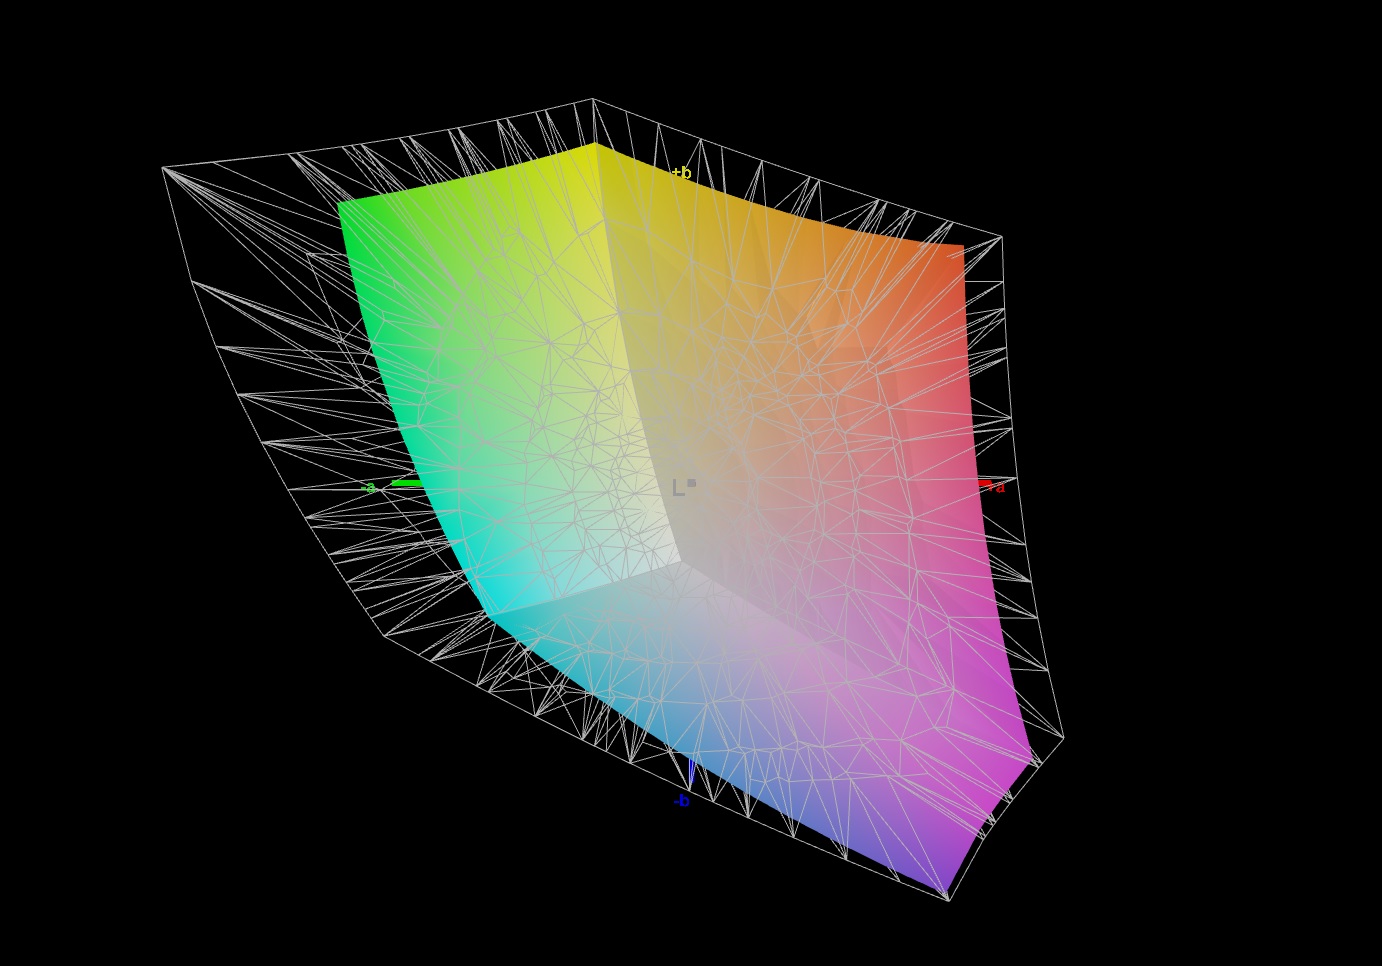
In terms of color reproduction, the 14 Evo places itself in the middle of the test field. With a Delta E 2000 value of 2.95 (ColorChecker @Calman), the display is still just within the ideal range. The color space is no cause for criticism either: 93% coverage of sRGB and 71% of AdobeRGB should satisfy most buyers. In addition, the viewing-angle stability is good as is typical for IPS panels.
However, the 14-inch display is hardly suitable for gaming. With response times of 33 ms (black-to-white) and 60 ms (gray-to-gray), respectively, the panel transitions quite slowly.
Display Response Times
| ↔ Response Time Black to White | ||
|---|---|---|
| 32.8 ms ... rise ↗ and fall ↘ combined | ↗ 16.4 ms rise | 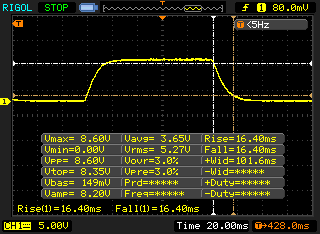 |
| ↘ 16.4 ms fall | ||
| The screen shows slow response rates in our tests and will be unsatisfactory for gamers. In comparison, all tested devices range from 0.1 (minimum) to 240 (maximum) ms. » 87 % of all devices are better. This means that the measured response time is worse than the average of all tested devices (21.5 ms). | ||
| ↔ Response Time 50% Grey to 80% Grey | ||
| 59.6 ms ... rise ↗ and fall ↘ combined | ↗ 26.4 ms rise | 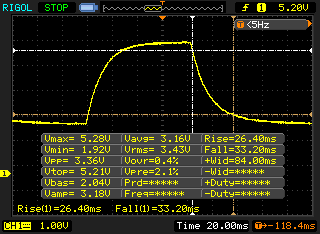 |
| ↘ 33.2 ms fall | ||
| The screen shows slow response rates in our tests and will be unsatisfactory for gamers. In comparison, all tested devices range from 0.2 (minimum) to 636 (maximum) ms. » 95 % of all devices are better. This means that the measured response time is worse than the average of all tested devices (33.7 ms). | ||
Screen Flickering / PWM (Pulse-Width Modulation)
| Screen flickering / PWM not detected | 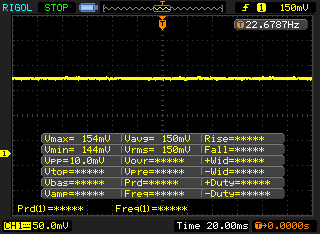 | ||
In comparison: 53 % of all tested devices do not use PWM to dim the display. If PWM was detected, an average of 17924 (minimum: 5 - maximum: 3846000) Hz was measured. | |||
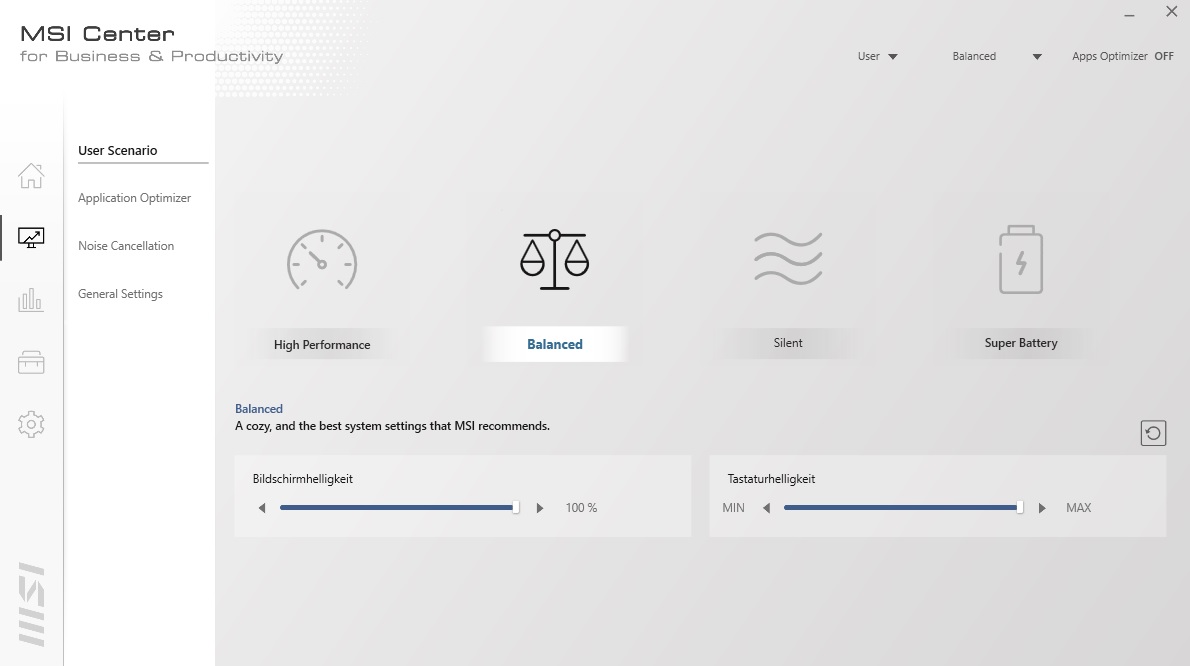
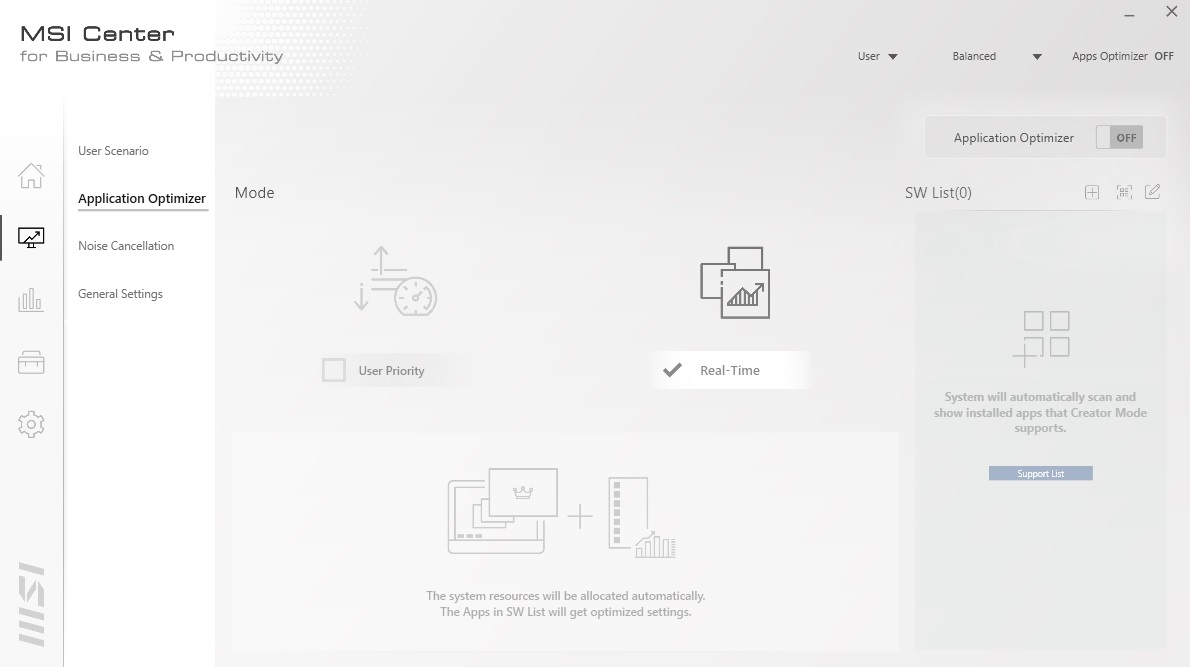
Test conditions
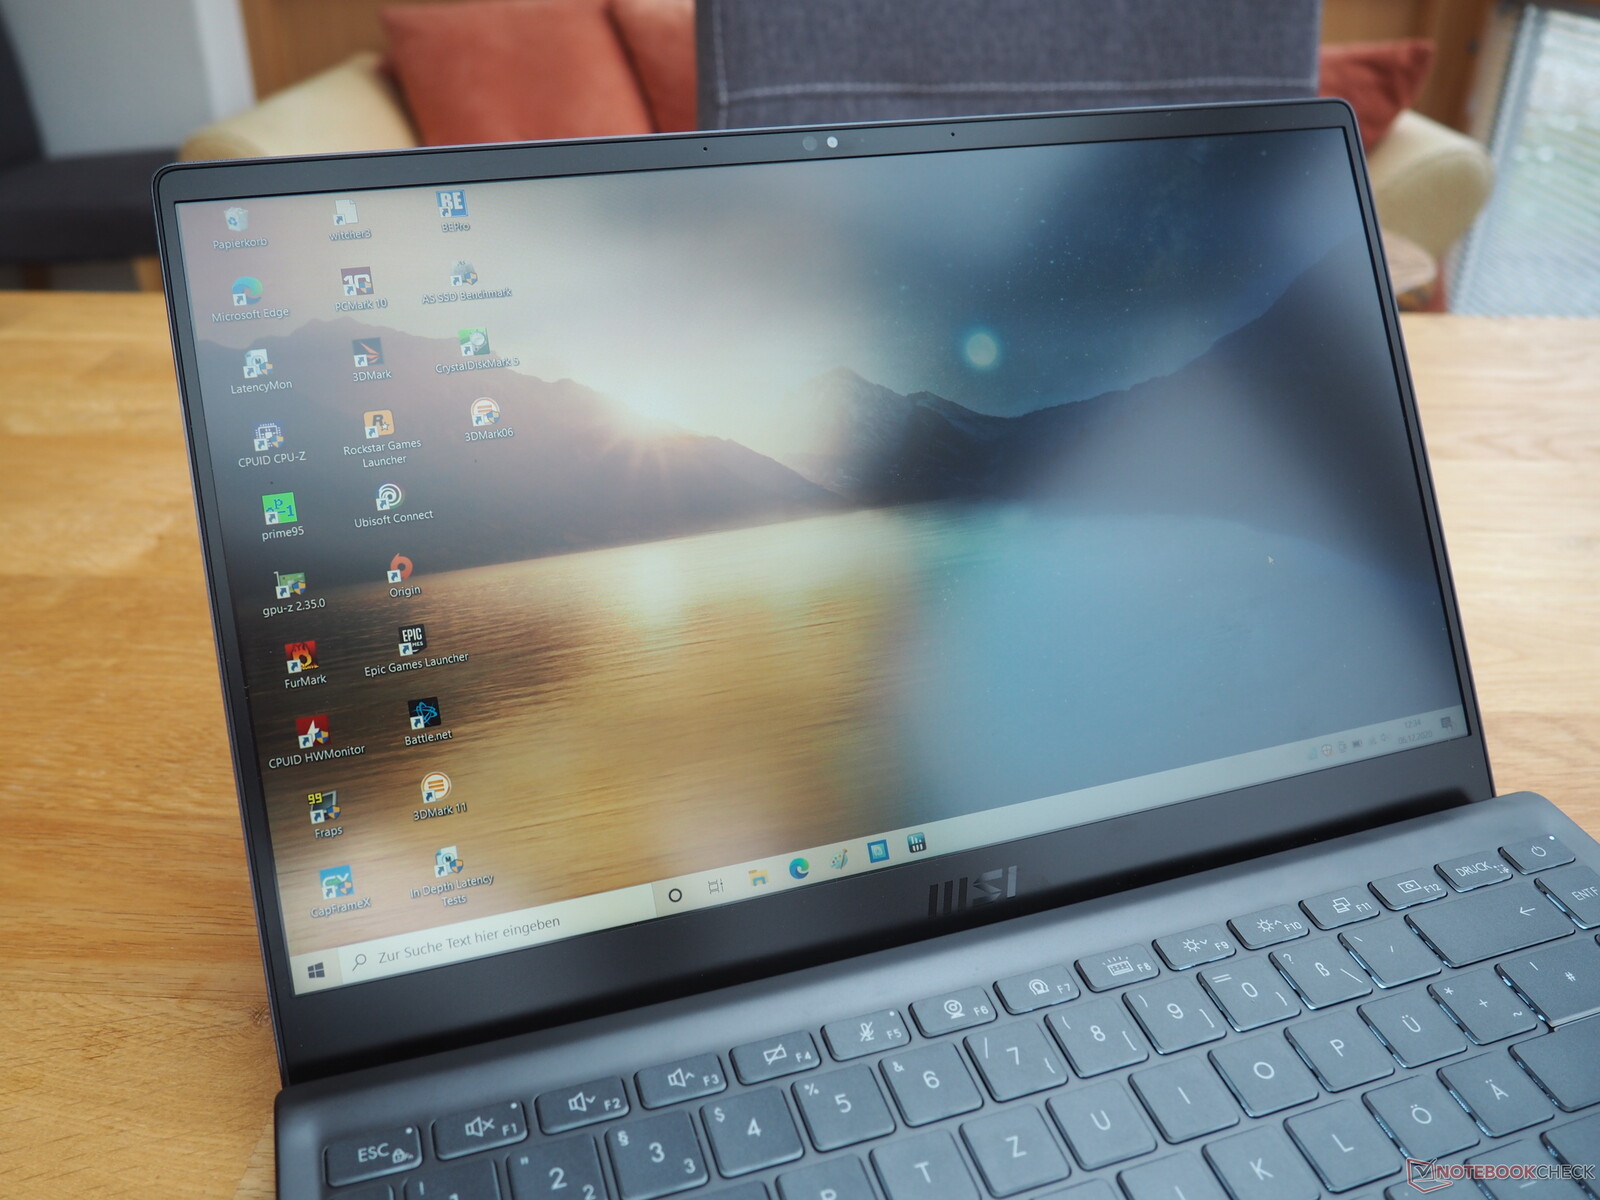
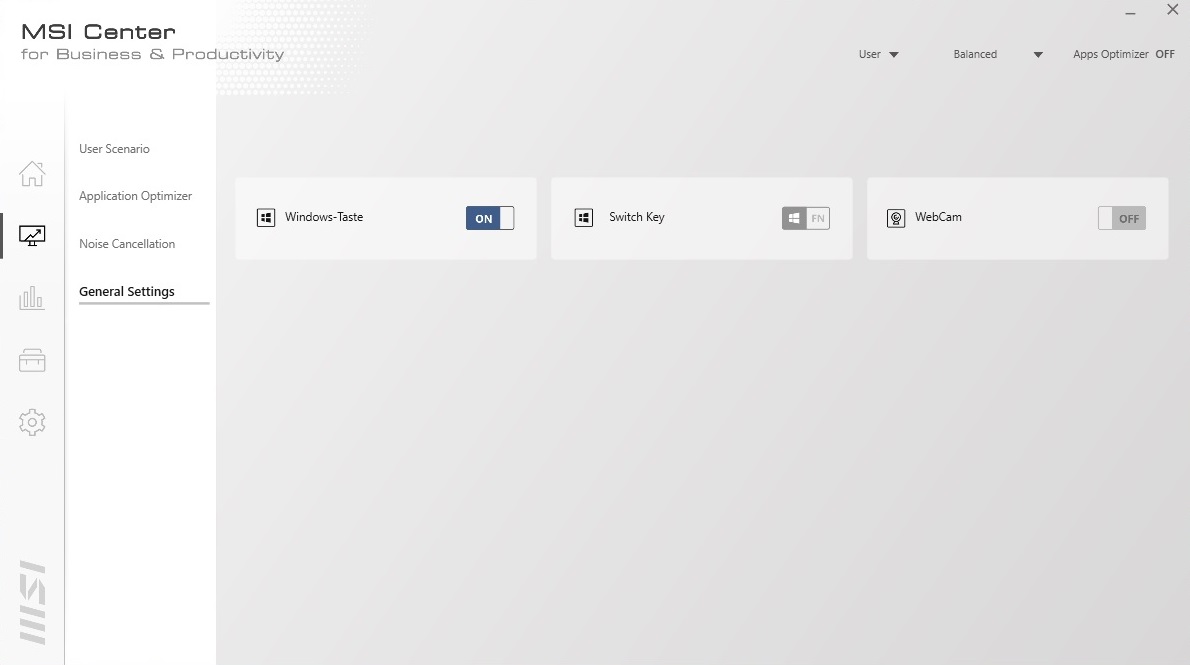
In the preinstalled MSI Center, you have the option to modify various software and hardware aspects. The most interesting is the User Scenario menu, which contains four profiles. Unless otherwise mentioned, all our measurements were performed in the Balanced mode, which is automatically enabled after setup.
Performance
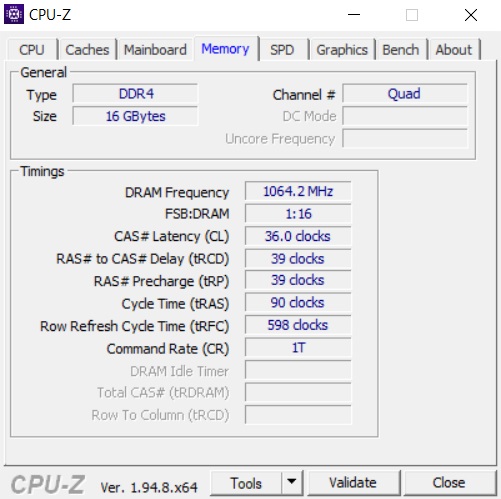
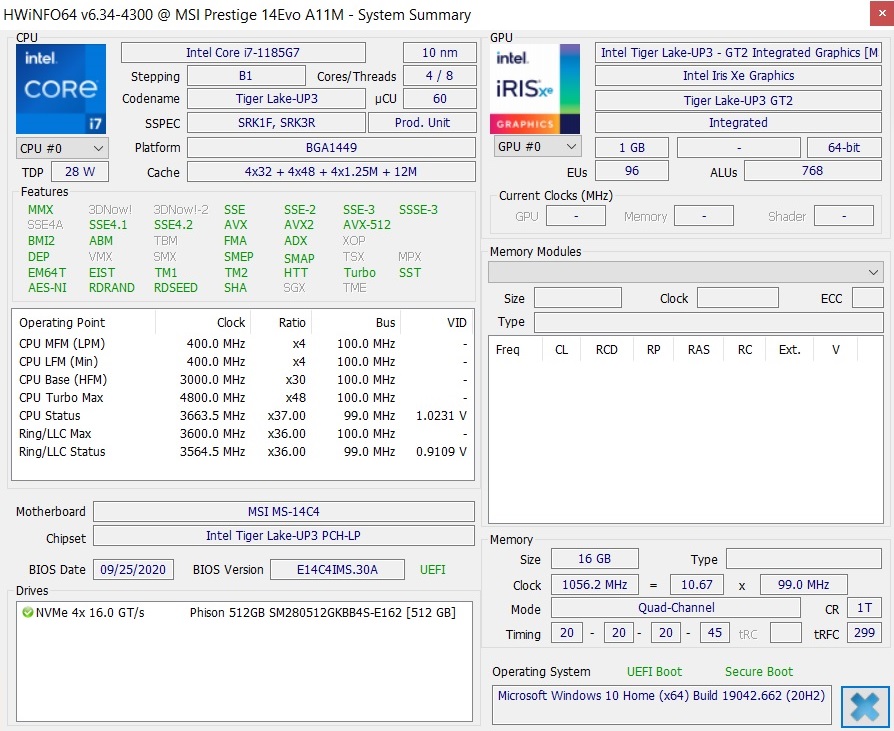
To justify the price of over 1,000 Euros (~$1,214) and to ensure high mobility, MSI resorts to powerful energy-saving components. The brand-new Tiger Lake CPU should be mentioned in particular here; it features the surprisingly fast Iris Xe Graphics G7 as we'll see in more detail in a moment. 16 GB of RAM should also be sufficient for several years for most business customers. The 512 GB SSD can theoretically be replaced with a larger model.
Processor
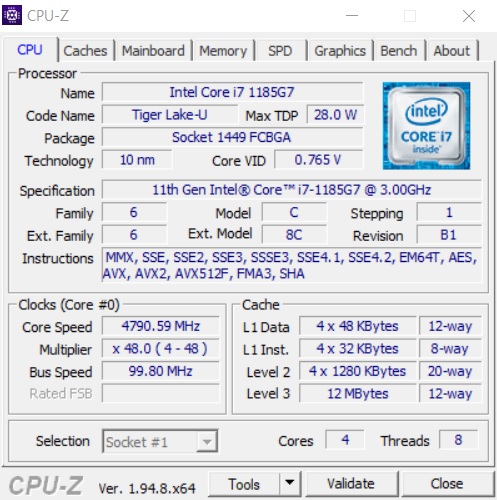
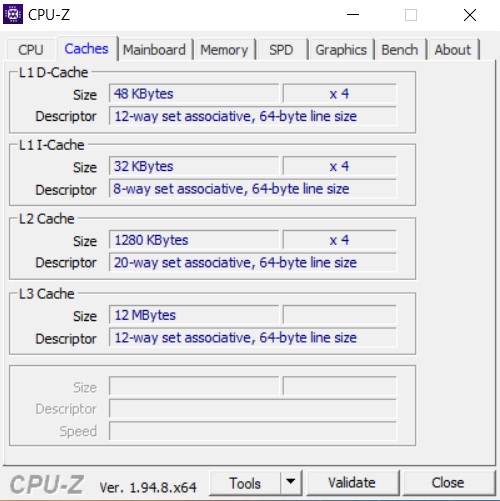
The Core i7-1185G7 is an ideal companion for users who value both performance and battery life. The 28-watt model offers 12 MB of L3 cache as well as four cores, and it can process up to eight threads in parallel via Hyper-Threading. One of the biggest improvements compared to the predecessor Comet Lake architecture is the reduced manufacturing process. In order to catch up to some extent with AMD's 7 nm technology, Intel has finally stopped using a 14 nm process and has at least switched to 10 nm instead.
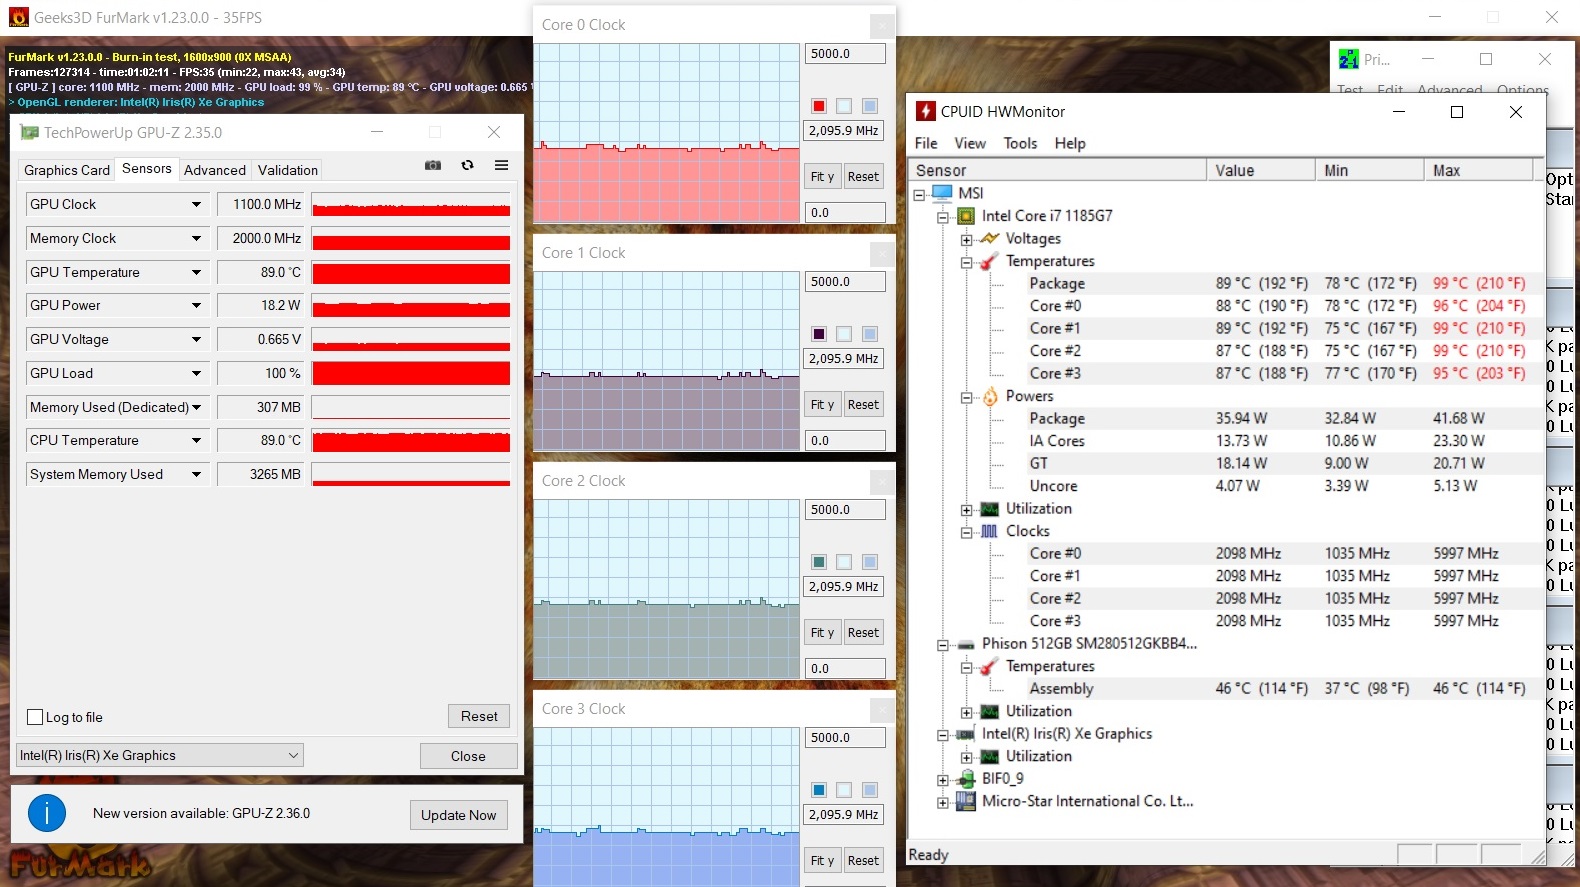
The quad-core processor's base clock speed is 3.0 GHz, and up to 4.8 GHz is possible via Turbo Boost, which is quite a lot for a power-saving CPU. We tested how the processor behaves under load with our Cinebench Loop.
This revealed two things. Firstly: While the Silent mode throttles performance significantly, the High Performance mode found in the MSI Center hardly brings any advantages. Secondly: The Core i7-1185G7 can roughly match the Ryzen 7 4700U (8C/8T), but the Intel chip doesn't stand a chance against the Ryzen 7 Pro 4750U and the Ryzen 7 4800U (8C/16T each), which are often found in similarly expensive laptops - at least not in multithread applications.
* ... smaller is better
System performance
Thanks to the NVMe SSD in particular, the Prestige 14 Evo boasts a very good system performance. 4,894 points in PCMark 10 could also come from a multimedia or gaming laptop. From a subjective standpoint, the operating system (Windows 10 Home 64-bit) responds quickly too, be it loading times, transfers, installations or boot processes.
| PCMark 10 Score | 4894 points | |
Help | ||
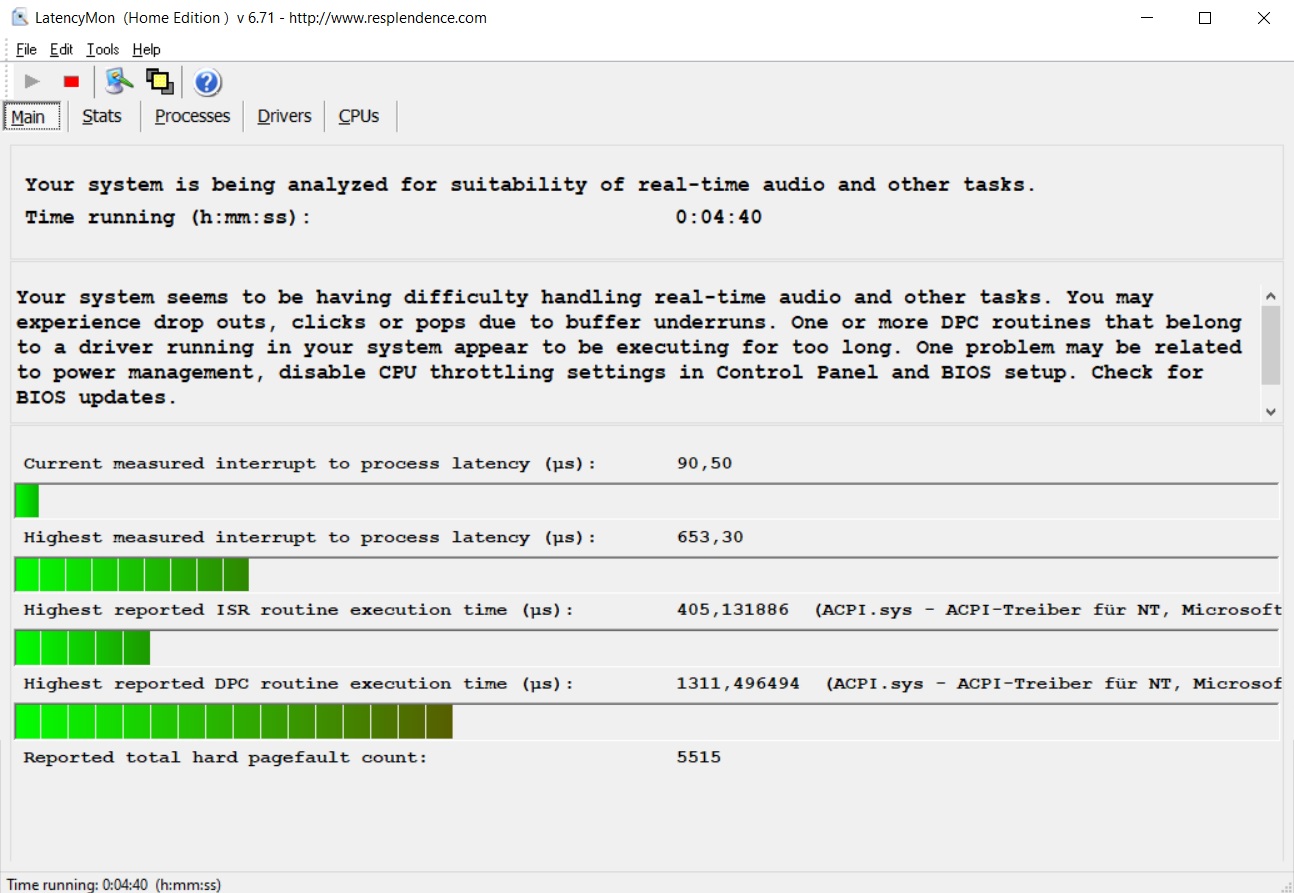
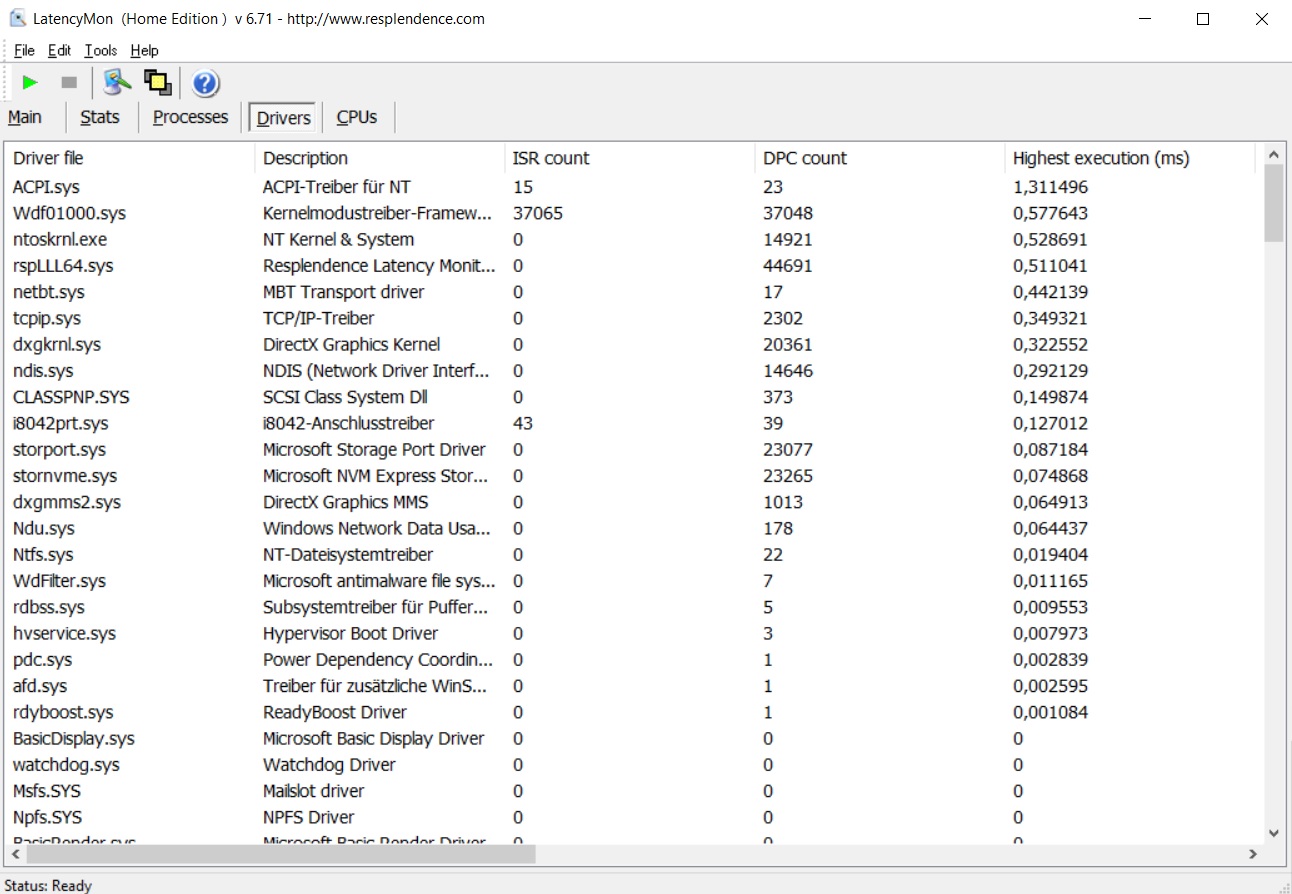
DPC latencies
Although the 14 Evo has the lowest latency rates in the test field, it's not necessarily suitable for real-time audio and video-editing according to the LatencyMon tool.
| DPC Latencies / LatencyMon - interrupt to process latency (max), Web, Youtube, Prime95 | |
| Lenovo Yoga Slim 7-14ARE | |
| Acer Swift 3 SF314-42-R4XJ | |
| Asus ZenBook 14 UX425EA | |
| HP EliteBook 845 G7 Ryzen 7 Pro 4750U | |
| MSI Prestige 14 Evo A11M-005 | |
* ... smaller is better
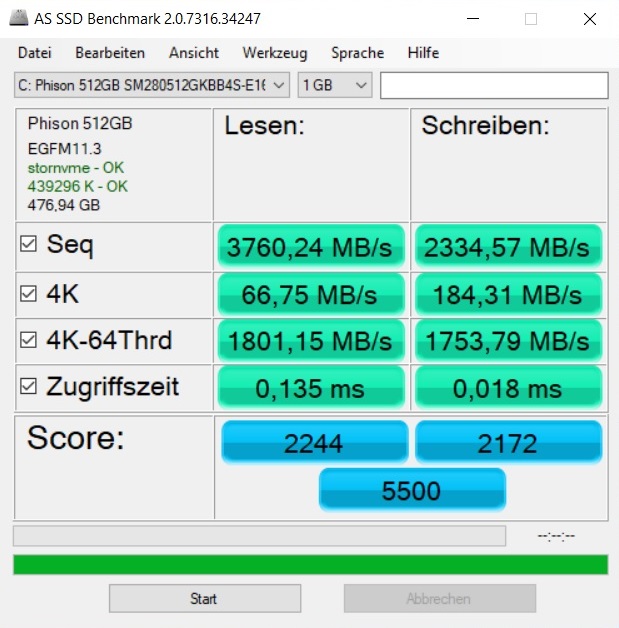
Storage
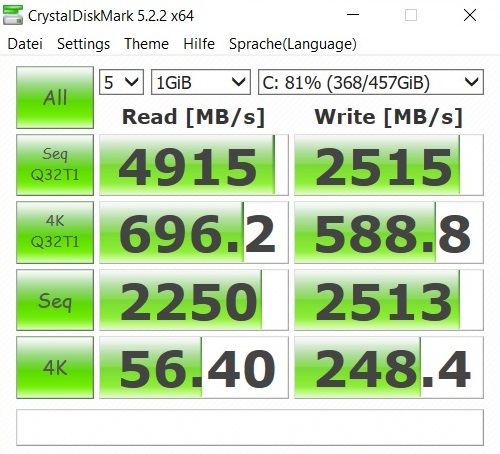
MSI doesn't make any compromises when it comes to the installed storage device. The 512 GB drive from Phison partly leaves the Samsung and Intel SSDs of the competitors behind in the CrystalDiskMark and AS SSD benchmarks.
| MSI Prestige 14 Evo A11M-005 Phison 512GB SM280512GKBB4S-E162 | Asus ZenBook 14 UX425EA Intel SSD 660p 1TB SSDPEKNW010T8 | Lenovo Yoga Slim 7-14ARE Samsung SSD PM981a MZVLB512HBJQ | HP EliteBook 845 G7 Ryzen 7 Pro 4750U Samsung SSD PM981a MZVLB256HBHQ | Acer Swift 3 SF314-42-R4XJ Samsung PM991 MZVLQ1T0HALB | |
|---|---|---|---|---|---|
| CrystalDiskMark 5.2 / 6 | -37% | -10% | -19% | -41% | |
| Write 4K | 248.4 | 132.3 -47% | 146.1 -41% | 111.4 -55% | 98.8 -60% |
| Read 4K | 56.4 | 51.7 -8% | 47.18 -16% | 58.2 3% | 32.44 -42% |
| Write Seq | 2513 | 1264 -50% | 2896 15% | 2195 -13% | 1582 -37% |
| Read Seq | 2250 | 1484 -34% | 2754 22% | 2516 12% | 1471 -35% |
| Write 4K Q32T1 | 589 | 478.4 -19% | 425.8 -28% | 472.1 -20% | 375.4 -36% |
| Read 4K Q32T1 | 696 | 366.9 -47% | 514 -26% | 380.5 -45% | 491.9 -29% |
| Write Seq Q32T1 | 2515 | 1750 -30% | 2989 19% | 2339 -7% | 1574 -37% |
| Read Seq Q32T1 | 4915 | 1970 -60% | 3568 -27% | 3565 -27% | 2329 -53% |
| AS SSD | -87% | -39% | -63% | -64% | |
| Seq Read | 3760 | 1219 -68% | 1658 -56% | 1976 -47% | 1960 -48% |
| Seq Write | 2335 | 947 -59% | 2464 6% | 1389 -41% | 1547 -34% |
| 4K Read | 66.8 | 50.9 -24% | 59.5 -11% | 50.7 -24% | 31.56 -53% |
| 4K Write | 184.3 | 150.9 -18% | 128.6 -30% | 105.5 -43% | 116.6 -37% |
| 4K-64 Read | 1801 | 587 -67% | 1576 -12% | 853 -53% | 454.7 -75% |
| 4K-64 Write | 1754 | 862 -51% | 1986 13% | 1970 12% | 262.1 -85% |
| Access Time Read * | 0.135 | 0.083 39% | 0.049 64% | 0.058 57% | |
| Access Time Write * | 0.018 | 0.114 -533% | 0.087 -383% | 0.104 -478% | 0.034 -89% |
| Score Read | 2244 | 760 -66% | 1802 -20% | 1101 -51% | 682 -70% |
| Score Write | 2172 | 1108 -49% | 2361 9% | 2214 2% | 533 -75% |
| Score Total | 5500 | 2260 -59% | 5133 -7% | 3862 -30% | 1552 -72% |
| Total Average (Program / Settings) | -62% /
-66% | -25% /
-27% | -41% /
-45% | -53% /
-54% |
* ... smaller is better

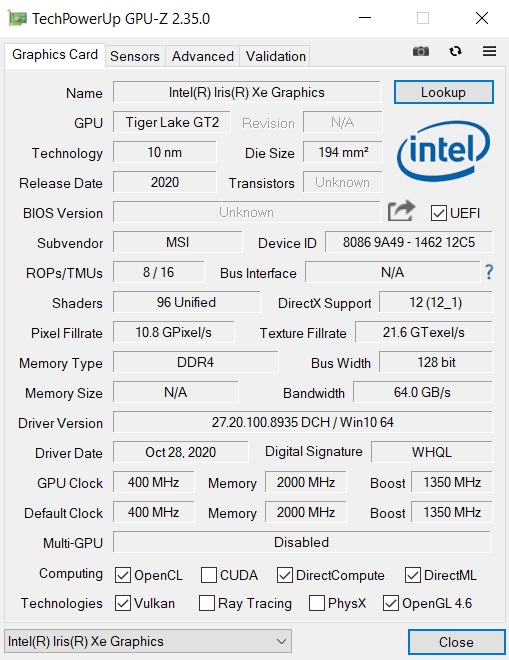
Graphics card
The Xe Graphics G7 GPU that's integrated into the processor is responsible for graphics calculations. The DirectX 12 capable chip has 96 execution units and clocks at 400 to 1,350 MHz.
| 3DMark 11 Performance | 7522 points | |
| 3DMark Ice Storm Standard Score | 101457 points | |
| 3DMark Cloud Gate Standard Score | 20821 points | |
| 3DMark Fire Strike Score | 5332 points | |
| 3DMark Time Spy Score | 1859 points | |
Help | ||
As the graphics benchmarks prove, performance is surprisingly good for an iGPU and especially for Intel standards. Both in 3DMark 11 and in the current 3DMark, the 14 Evo comes out on top of the comparison field. AMD's Vega 7 is outperformed by at least 20% in each case (maximum lead: Almost 90%), and a Vega 8 performs at least 10% slower. Even the Asus ZenBook 14, which is also equipped with an Iris Xe G7, has to admit some defeat.
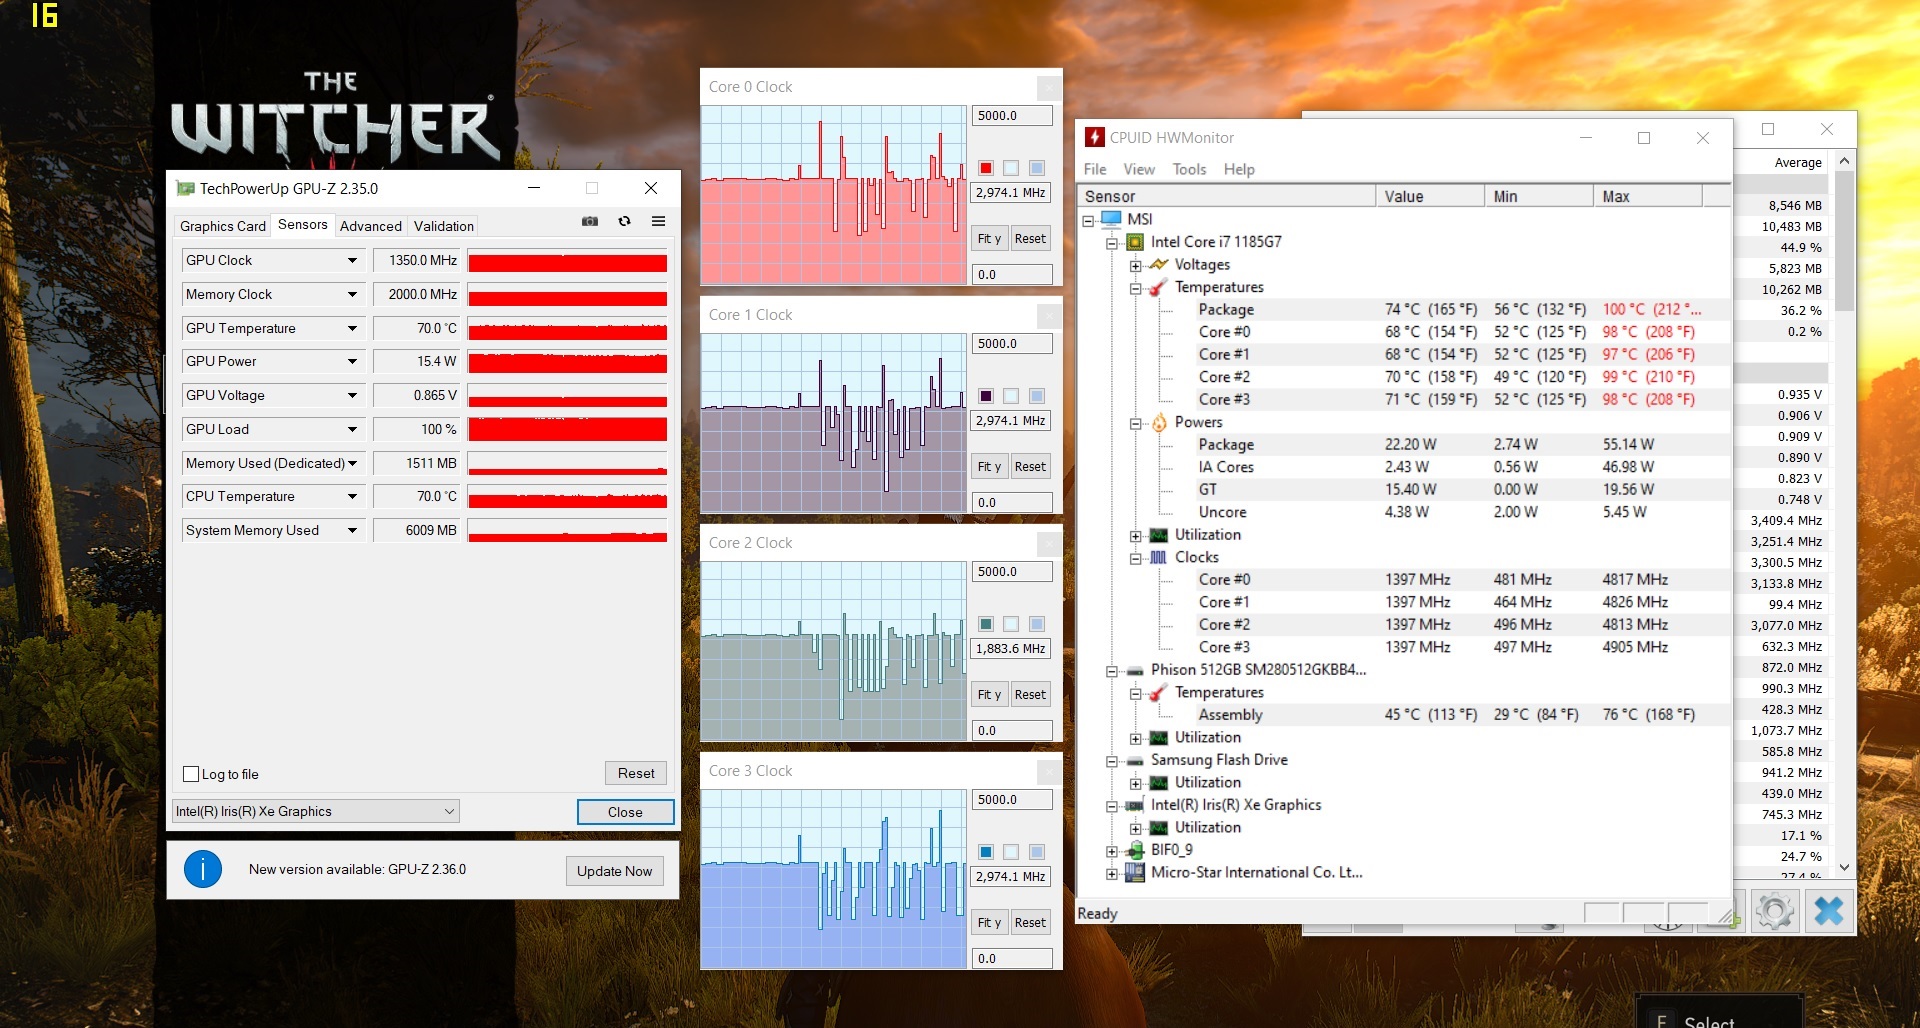
We tested whether the graphics performance remains constant over prolonged periods of time with the role-playing game The Witcher 3 for a good 60 minutes (Full HD, maximum details). No frame-rate drops could be observed here.
Gaming performance
Although the 14 Evo would definitely be gaming-capable, the 14-incher is definitely not a gaming platform. For one thing, performance is often only sufficient for minimum settings and 1280x720 pixels in modern games. On the other hand, many games generally don't run smoothly - probably due to driver problems. We had to deal with crashes (Cyberpunk 2077, Horizon Zero Dawn, Dirt 5, Assassin's Creed Valhalla, Call of Duty Cold War) and/or massive graphics errors (Ghost Recon Breakpoint, Watch Dogs Legion) in some cases. On the other hand, older or less demanding games, such as Dota 2 and Fifa 21, can be enjoyed with good visuals and at the native resolution.
| The Witcher 3 | |
| 1920x1080 High Graphics & Postprocessing (Nvidia HairWorks Off) | |
| MSI Prestige 14 Evo A11M-005 | |
| Asus ZenBook 14 UX425EA | |
| Average of class Office (3.49 - 59.1, n=104, last 2 years) | |
| Lenovo Yoga Slim 7-14ARE | |
| HP EliteBook 845 G7 Ryzen 7 Pro 4750U | |
| Acer Swift 3 SF314-42-R4XJ | |
| 1920x1080 Ultra Graphics & Postprocessing (HBAO+) | |
| MSI Prestige 14 Evo A11M-005 | |
| Lenovo Yoga Slim 7-14ARE | |
| HP EliteBook 845 G7 Ryzen 7 Pro 4750U | |
| Average of class Office (2.66 - 34, n=110, last 2 years) | |
| Asus ZenBook 14 UX425EA | |
| Acer Swift 3 SF314-42-R4XJ | |
| low | med. | high | ultra | |
| GTA V (2015) | 96.4 | 87.8 | 31.9 | 12.2 |
| The Witcher 3 (2015) | 96.4 | 64.7 | 33.4 | 16 |
| Dota 2 Reborn (2015) | 83.2 | 76.4 | 54.3 | 51.6 |
| X-Plane 11.11 (2018) | 50.5 | 37 | 32.4 | |
| Shadow of the Tomb Raider (2018) | 63 | 24 | 22 | 0 |
| Battlefield V (2018) | 83.9 | 42.5 | 36.8 | 29.9 |
| Borderlands 3 (2019) | 50.3 | 26.4 | 15.9 | 12.1 |
| Ghost Recon Breakpoint (2019) | 46 severe graphical problems | 36 severe graphical problems | 32 severe graphical problems | 23 severe graphical problems |
| Valorant (2020) | 171 | 124 | 112 | |
| Horizon Zero Dawn (2020) | 0 game wont start | 0 game wont start | 0 game wont start | 0 game wont start |
| Crysis Remastered (2020) | 58.3 | 19.5 | 11.7 | 8.99 |
| FIFA 21 (2020) | 190 | 90.3 | 84.3 | 60.9 |
| Watch Dogs Legion (2020) | 46 severe graphical problems | 27 severe graphical problems | 0 severe graphical problems | 0 severe graphical problems |
| Dirt 5 (2020) | 0 game wont start | 0 game wont start | 0 game wont start | 0 game wont start |
| Assassin´s Creed Valhalla (2020) | 0 game wont start | 0 game wont start | 0 game wont start | 0 game wont start |
| Call of Duty Black Ops Cold War (2020) | 0 game wont start | 0 game wont start | 0 game wont start | 0 game wont start |
| Yakuza Like a Dragon (2020) | 43.4 | 24.4 | 23.3 | 20.2 |
| Immortals Fenyx Rising (2020) | 39 | 26 | 23 | 21 |
| Cyberpunk 2077 1.0 (2020) | 0 game wont start | 0 game wont start | 0 game wont start | 0 game wont start |
| Hitman 3 (2021) | 85 | 39 | ||
| Outriders (2021) | 49.9 | 29.9 | 26.2 | 26.2 |
| Resident Evil Village (2021) | 53.4 | 24.9 | 23.2 | 21.4 |
| Mass Effect Legendary Edition (2021) | 63.8 | 0 () | ||
| Days Gone (2021) | 31.9 | 23.4 | 21 | 16.5 |
| Monster Hunter Stories 2 (2021) | 79.6 | 56.6 | 50.1 | |
| F1 2021 (2021) | 0 game wont start | 0 game wont start | 0 game wont start | 0 game wont start |
| Deathloop (2021) | 0 game wont start | |||
| New World (2021) | 35.2 | 23.6 | 20.9 | 17.1 |
| Alan Wake Remastered (2021) | 53.1 | 42.2 | ||
| Far Cry 6 (2021) | 0 game wont start (crash) | 0 game wont start (crash) | 0 game wont start (crash) | 0 game wont start (crash) |
| Back 4 Blood (2021) | 49.1 | 39.1 | 35 | 33.7 |
| Guardians of the Galaxy (2021) | 0 game wont start | 0 game wont start | 0 game wont start | 0 game wont start |
| Riders Republic (2021) | 33 | 22 | 18 | 16 |
| Call of Duty Vanguard (2021) | 0 severe graphical problems | |||
| Forza Horizon 5 (2021) | 49 | 0 () | ||
| Battlefield 2042 (2021) | 0 game wont start (crash) | |||
| Farming Simulator 22 (2021) | 103 | 0 () | 0 () | 0 () |
| Halo Infinite (2021) | 0 game wont start (no GPU support) |
Emissions
Noise emissions
Although the 14 Evo gets louder than its rivals under load, the noise level in 3D mode is acceptable at 39 to 43 dB(A). The case fan is completely silent in idle usage - apart from intermittent spikes. However, the device is never completely silent. In this way, our test device exhibited a quite prominent coil whine. Depending on your sense of hearing and your personal perception, this noise can become annoying.
Noise Level
| Idle |
| 25 / 27 / 39 dB(A) |
| Load |
| 43 / 43 dB(A) |
 | ||
30 dB silent 40 dB(A) audible 50 dB(A) loud |
||
min: | ||
| MSI Prestige 14 Evo A11M-005 i7-1185G7, Iris Xe G7 96EUs | Asus ZenBook 14 UX425EA i7-1165G7, Iris Xe G7 96EUs | Lenovo Yoga Slim 7-14ARE R7 4800U, Vega 8 | HP EliteBook 845 G7 Ryzen 7 Pro 4750U R7 PRO 4750U, Vega 7 | Acer Swift 3 SF314-42-R4XJ R7 4700U, Vega 7 | Average of class Office | |
|---|---|---|---|---|---|---|
| Noise | -2% | 10% | -1% | -0% | 11% | |
| off / environment * | 24 | 29.8 -24% | 26.3 -10% | 30 -25% | 31.2 -30% | 24.5 ? -2% |
| Idle Minimum * | 25 | 29.9 -20% | 26.5 -6% | 30.6 -22% | 31.2 -25% | 24.7 ? 1% |
| Idle Average * | 27 | 31 -15% | 26.5 2% | 30.6 -13% | 31.2 -16% | 25 ? 7% |
| Idle Maximum * | 39 | 31 21% | 26.5 32% | 30.6 22% | 31.2 20% | 26 ? 33% |
| Load Average * | 43 | 35.6 17% | 31.8 26% | 33.6 22% | 33.8 21% | 34.7 ? 19% |
| Witcher 3 ultra * | 39 | 37.4 4% | 35.9 8% | 36.3 7% | ||
| Load Maximum * | 43 | 40.8 5% | 35.9 17% | 39.2 9% | 33.5 22% | 40 ? 7% |
* ... smaller is better
Temperature
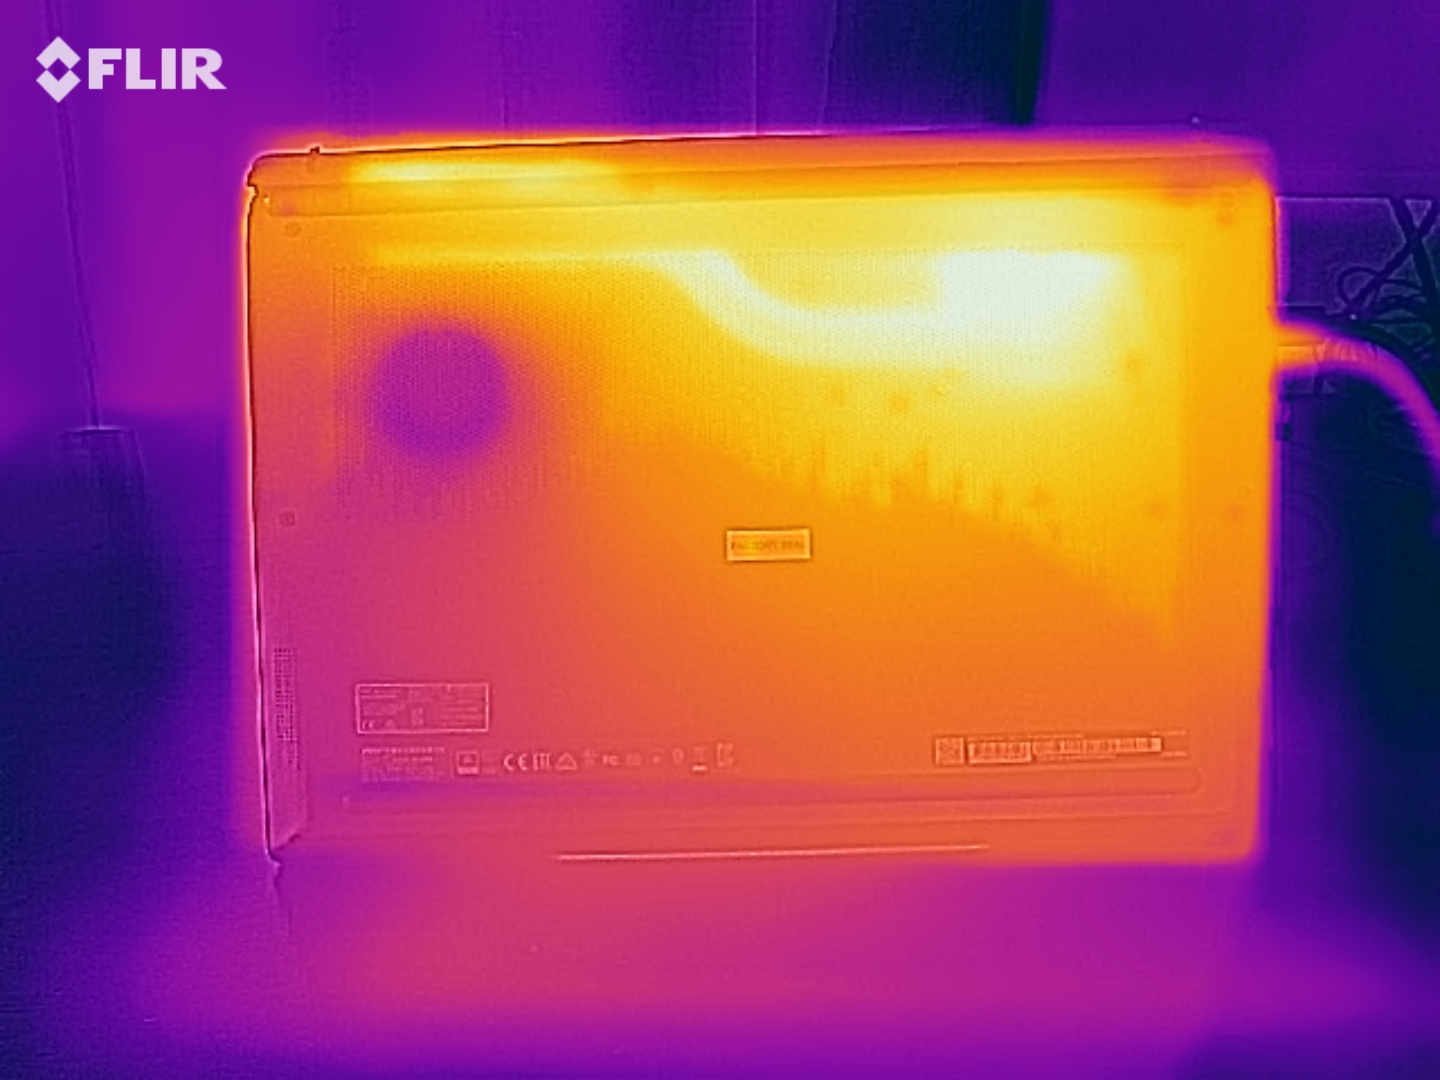
The 14 Evo also surpasses the comparison field in terms of heat development. The highest graphics performance also leads to the highest temperatures in 3D mode. In view of a maximum bottom temperature of 61 °C (~142 °F), the 14-inch laptop shouldn't necessarily be placed on the lap under full load. A maximum of 54 °C (~129 °F) in our The Witcher 3 test is also quite a lot. However, most users will probably only rarely put their business laptop under such load. The case surfaces stay fairly cool under normal conditions. We couldn't measure more than 30 °C (~86 °F) on the chassis in idle usage.
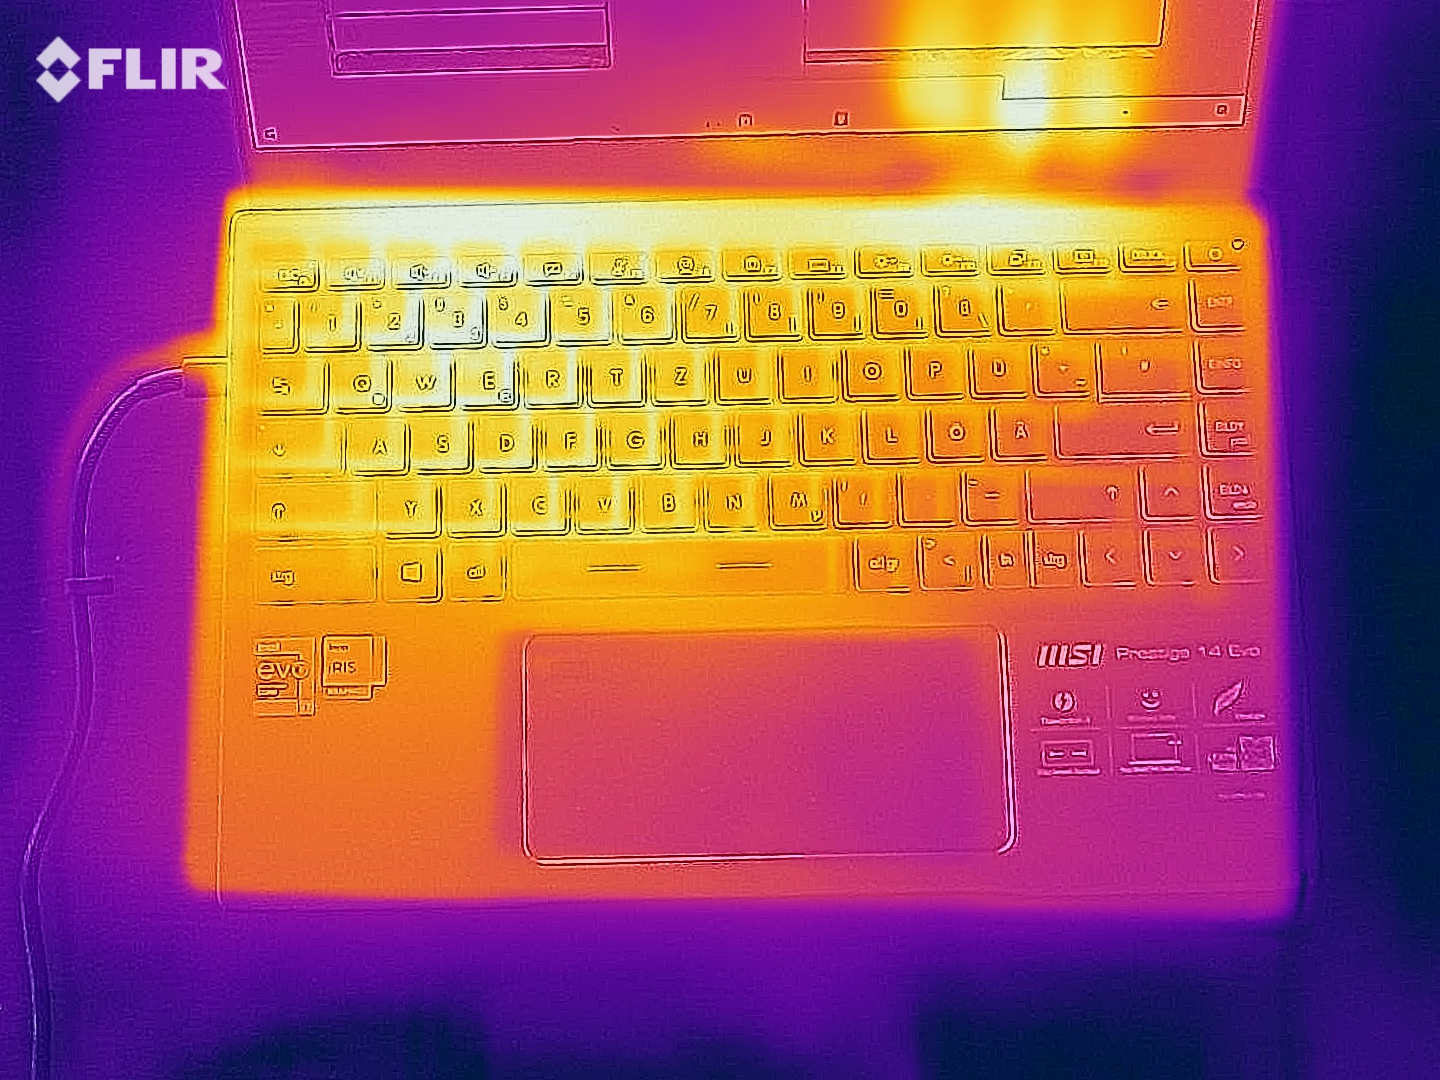
(-) The maximum temperature on the upper side is 50 °C / 122 F, compared to the average of 34.2 °C / 94 F, ranging from 21.2 to 62.5 °C for the class Office.
(-) The bottom heats up to a maximum of 61 °C / 142 F, compared to the average of 36.7 °C / 98 F
(+) In idle usage, the average temperature for the upper side is 27.6 °C / 82 F, compared to the device average of 29.5 °C / 85 F.
(-) Playing The Witcher 3, the average temperature for the upper side is 41.3 °C / 106 F, compared to the device average of 29.5 °C / 85 F.
(-) The palmrests and touchpad can get very hot to the touch with a maximum of 41 °C / 105.8 F.
(-) The average temperature of the palmrest area of similar devices was 27.7 °C / 81.9 F (-13.3 °C / -23.9 F).
| MSI Prestige 14 Evo A11M-005 i7-1185G7, Iris Xe G7 96EUs | Asus ZenBook 14 UX425EA i7-1165G7, Iris Xe G7 96EUs | Lenovo Yoga Slim 7-14ARE R7 4800U, Vega 8 | HP EliteBook 845 G7 Ryzen 7 Pro 4750U R7 PRO 4750U, Vega 7 | Acer Swift 3 SF314-42-R4XJ R7 4700U, Vega 7 | Average of class Office | |
|---|---|---|---|---|---|---|
| Heat | 11% | 14% | 13% | 16% | 11% | |
| Maximum Upper Side * | 50 | 41 18% | 43.8 12% | 43.6 13% | 39.5 21% | 41 ? 18% |
| Maximum Bottom * | 61 | 44.4 27% | 43 30% | 52.6 14% | 43.6 29% | 43.7 ? 28% |
| Idle Upper Side * | 28 | 28 -0% | 24.8 11% | 22.4 20% | 25.9 7% | 28.1 ? -0% |
| Idle Bottom * | 29 | 29.8 -3% | 28.6 1% | 27.2 6% | 26.6 8% | 29.4 ? -1% |
* ... smaller is better
Speakers
Unfortunately, the sound quality doesn't live up to the purchase price. According to our audio analysis, the bass and the mids are particularly lacking. The maximum volume of 75 dB is also modest. The competing ZenBook 14 performs better almost across all frequency ranges and can be turned up higher (up to 87 dB). To enjoy media content, headphones or external speakers should be plugged into the 14 Evo.
MSI Prestige 14 Evo A11M-005 audio analysis
(±) | speaker loudness is average but good (75 dB)
Bass 100 - 315 Hz
(-) | nearly no bass - on average 24.3% lower than median
(±) | linearity of bass is average (9.8% delta to prev. frequency)
Mids 400 - 2000 Hz
(±) | higher mids - on average 8.5% higher than median
(±) | linearity of mids is average (11% delta to prev. frequency)
Highs 2 - 16 kHz
(+) | balanced highs - only 2.8% away from median
(+) | highs are linear (6.5% delta to prev. frequency)
Overall 100 - 16.000 Hz
(±) | linearity of overall sound is average (27.2% difference to median)
Compared to same class
» 82% of all tested devices in this class were better, 6% similar, 11% worse
» The best had a delta of 7%, average was 22%, worst was 53%
Compared to all devices tested
» 80% of all tested devices were better, 4% similar, 16% worse
» The best had a delta of 4%, average was 25%, worst was 134%
Asus ZenBook 14 UX425EA audio analysis
(+) | speakers can play relatively loud (87.5 dB)
Bass 100 - 315 Hz
(-) | nearly no bass - on average 18.5% lower than median
(±) | linearity of bass is average (12.1% delta to prev. frequency)
Mids 400 - 2000 Hz
(±) | higher mids - on average 6.9% higher than median
(+) | mids are linear (4.5% delta to prev. frequency)
Highs 2 - 16 kHz
(+) | balanced highs - only 4.1% away from median
(±) | linearity of highs is average (7.3% delta to prev. frequency)
Overall 100 - 16.000 Hz
(±) | linearity of overall sound is average (17.3% difference to median)
Compared to same class
» 42% of all tested devices in this class were better, 8% similar, 49% worse
» The best had a delta of 5%, average was 18%, worst was 45%
Compared to all devices tested
» 27% of all tested devices were better, 8% similar, 65% worse
» The best had a delta of 4%, average was 25%, worst was 134%
Energy management
Energy consumption
Even though the competition needs a bit less power, we would describe energy consumption as decent. 5 to 11 watts in idle usage speak for good battery life. Under load, our measuring device displayed between 39 and 65 watts.
| Off / Standby | |
| Idle | |
| Load |
|
| MSI Prestige 14 Evo A11M-005 i7-1185G7, Iris Xe G7 96EUs | Asus ZenBook 14 UX425EA i7-1165G7, Iris Xe G7 96EUs | Lenovo Yoga Slim 7-14ARE R7 4800U, Vega 8 | HP EliteBook 845 G7 Ryzen 7 Pro 4750U R7 PRO 4750U, Vega 7 | Acer Swift 3 SF314-42-R4XJ R7 4700U, Vega 7 | Average of class Office | |
|---|---|---|---|---|---|---|
| Power Consumption | 21% | 9% | 30% | 28% | 12% | |
| Idle Minimum * | 5 | 4.8 4% | 4 20% | 2.6 48% | 2.8 44% | 4.3 ? 14% |
| Idle Average * | 7 | 6.5 7% | 6.3 10% | 5 29% | 4.8 31% | 7.35 ? -5% |
| Idle Maximum * | 11 | 7.7 30% | 7.7 30% | 5.6 49% | 6.7 39% | 9.15 ? 17% |
| Load Average * | 54 | 29.6 45% | 48.3 11% | 39.8 26% | 28 48% | 41.1 ? 24% |
| Witcher 3 ultra * | 39 | 28.6 27% | 49 -26% | 37.1 5% | 57 -46% | |
| Load Maximum * | 65 | 57.8 11% | 57.6 11% | 49.9 23% | 31 52% | 58.1 ? 11% |
* ... smaller is better
Battery life
The battery capacity of 52 Wh is in the range of the competition, which has 48 to 67 Wh. The 14 Evo's runtime is more than solid in practical scenarios. In our Wi-Fi test with reduced display brightness (approx. 150 cd/m²), the 14-incher shut down after about 7.5 hours. However, the comparison devices do even better: They achieve between 10 and 13 hours in the WLAN test. Only in an ideal case (low load and low brightness) is it possible to squeeze more than 10 hours out from the MSI laptop's battery.
| MSI Prestige 14 Evo A11M-005 i7-1185G7, Iris Xe G7 96EUs, 52.4 Wh | Asus ZenBook 14 UX425EA i7-1165G7, Iris Xe G7 96EUs, 67 Wh | Lenovo Yoga Slim 7-14ARE R7 4800U, Vega 8, 61 Wh | HP EliteBook 845 G7 Ryzen 7 Pro 4750U R7 PRO 4750U, Vega 7, 53 Wh | Acer Swift 3 SF314-42-R4XJ R7 4700U, Vega 7, 48.85 Wh | Average of class Office | |
|---|---|---|---|---|---|---|
| Battery Runtime | 116% | 50% | 76% | 65% | 60% | |
| Reader / Idle | 825 | 1554 88% | 1623 97% | 1392 69% | 1436 ? 74% | |
| WiFi v1.3 | 451 | 786 74% | 619 37% | 795 76% | 715 59% | 594 ? 32% |
| Load | 68 | 194 185% | 79 16% | 114 68% | 117.7 ? 73% | |
| H.264 | 968 | 705 ? |
Pros
Cons
Verdict
With the Tiger Lake generation, Intel is trying to close the performance gap to AMD, which was long overdue.
However, the plan has only been partially successful. While graphics performance makes a big leap forward in the case of the Core i7-1185G7 (Iris Xe Graphics G7), the relationship between the processor performance and the cost is still better with AMD. In the corresponding price range, the main competitor already offers octa-core processors with 16 threads instead of quad-core ones with eight threads, which rewards certain applications with a significantly higher performance. In addition, the AMD models are more energy-efficient (lower heat development, higher battery life).
MSI has successfully created a nice all-rounder for on-the-go use here.
Otherwise, MSI has focused more on the mobility aspect than on the professional aspect. The port range and maintenance/upgrade options (soldered RAM) fall victim to the compact and light case. The quality of the webcam and the speakers could also be criticized. In return, the Prestige 14 Evo scores points with a stylish design and a large touchpad, among other things.
Price and availability
The MSI Prestige 14 Evo is currently available in the A11M-005 configuration (i7-1185G7, Iris Xe, 16 GB of RAM, 512 GB SSD) for around 1,300 Euros (~$1,580) at Notebooksbilliger.de and Amazon.de, among others.
MSI Prestige 14 Evo A11M-005
-
12/09/2020 v7
Florian Glaser
More articles related to this device
MSI Prestige 14 Evo A11M-005 (Prestige 14 Series)Related Articles


Pricecompare

