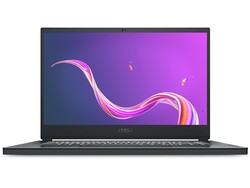
MSI Creator 15 Laptop Review: A bright 4K display for Content Creators

MSI have updated their content creator series with a new device: the Creator 15. While this isn't equipped with a mini LED display, such as the one on the Creator 17, it still its a lot more modern compared to the similar P65 Creator 9SF. The Creator 15 is equipped with a Core i7-10875H - an Intel CPU of the 10th generation - and the well-known Nvidia GeForce RTX 2070 Max-Q as well as 16 GB of RAM and two 1-TB RAID SSDs.
We will be comparing the MSI Creator 15 to the devices listed below. You can add further devuces from our database to the comparison beneath every graph.
Rating | Date | Model | Weight | Height | Size | Resolution | Price |
|---|---|---|---|---|---|---|---|
| 84.7 % v7 (old) | 10 / 2020 | MSI Creator 15 i7-10875H, GeForce RTX 2070 Max-Q | 1.9 kg | 22 mm | 15.60" | 3840x2160 | |
| 85 % v7 (old) | 06 / 2019 | MSI P65 Creator 9SF-657 i9-9880H, GeForce RTX 2070 Max-Q | 1.9 kg | 18 mm | 15.60" | 3840x2160 | |
| 85.8 % v7 (old) | 05 / 2020 | Gigabyte Aero 15 OLED XB-8DE51B0SP i7-10875H, GeForce RTX 2070 Super Max-Q | 2.2 kg | 20 mm | 15.60" | 3840x2160 | |
| 86.9 % v7 (old) | 08 / 2020 | Razer Blade 15 RTX 2070 Super Max-Q i7-10875H, GeForce RTX 2070 Super Max-Q | 2.1 kg | 17.8 mm | 15.60" | 1920x1080 | |
| 82.9 % v7 (old) | 09 / 2020 | Asus Zephyrus S15 GX502L i7-10875H, GeForce RTX 2070 Super Mobile | 2.1 kg | 19 mm | 15.60" | 1920x1080 |
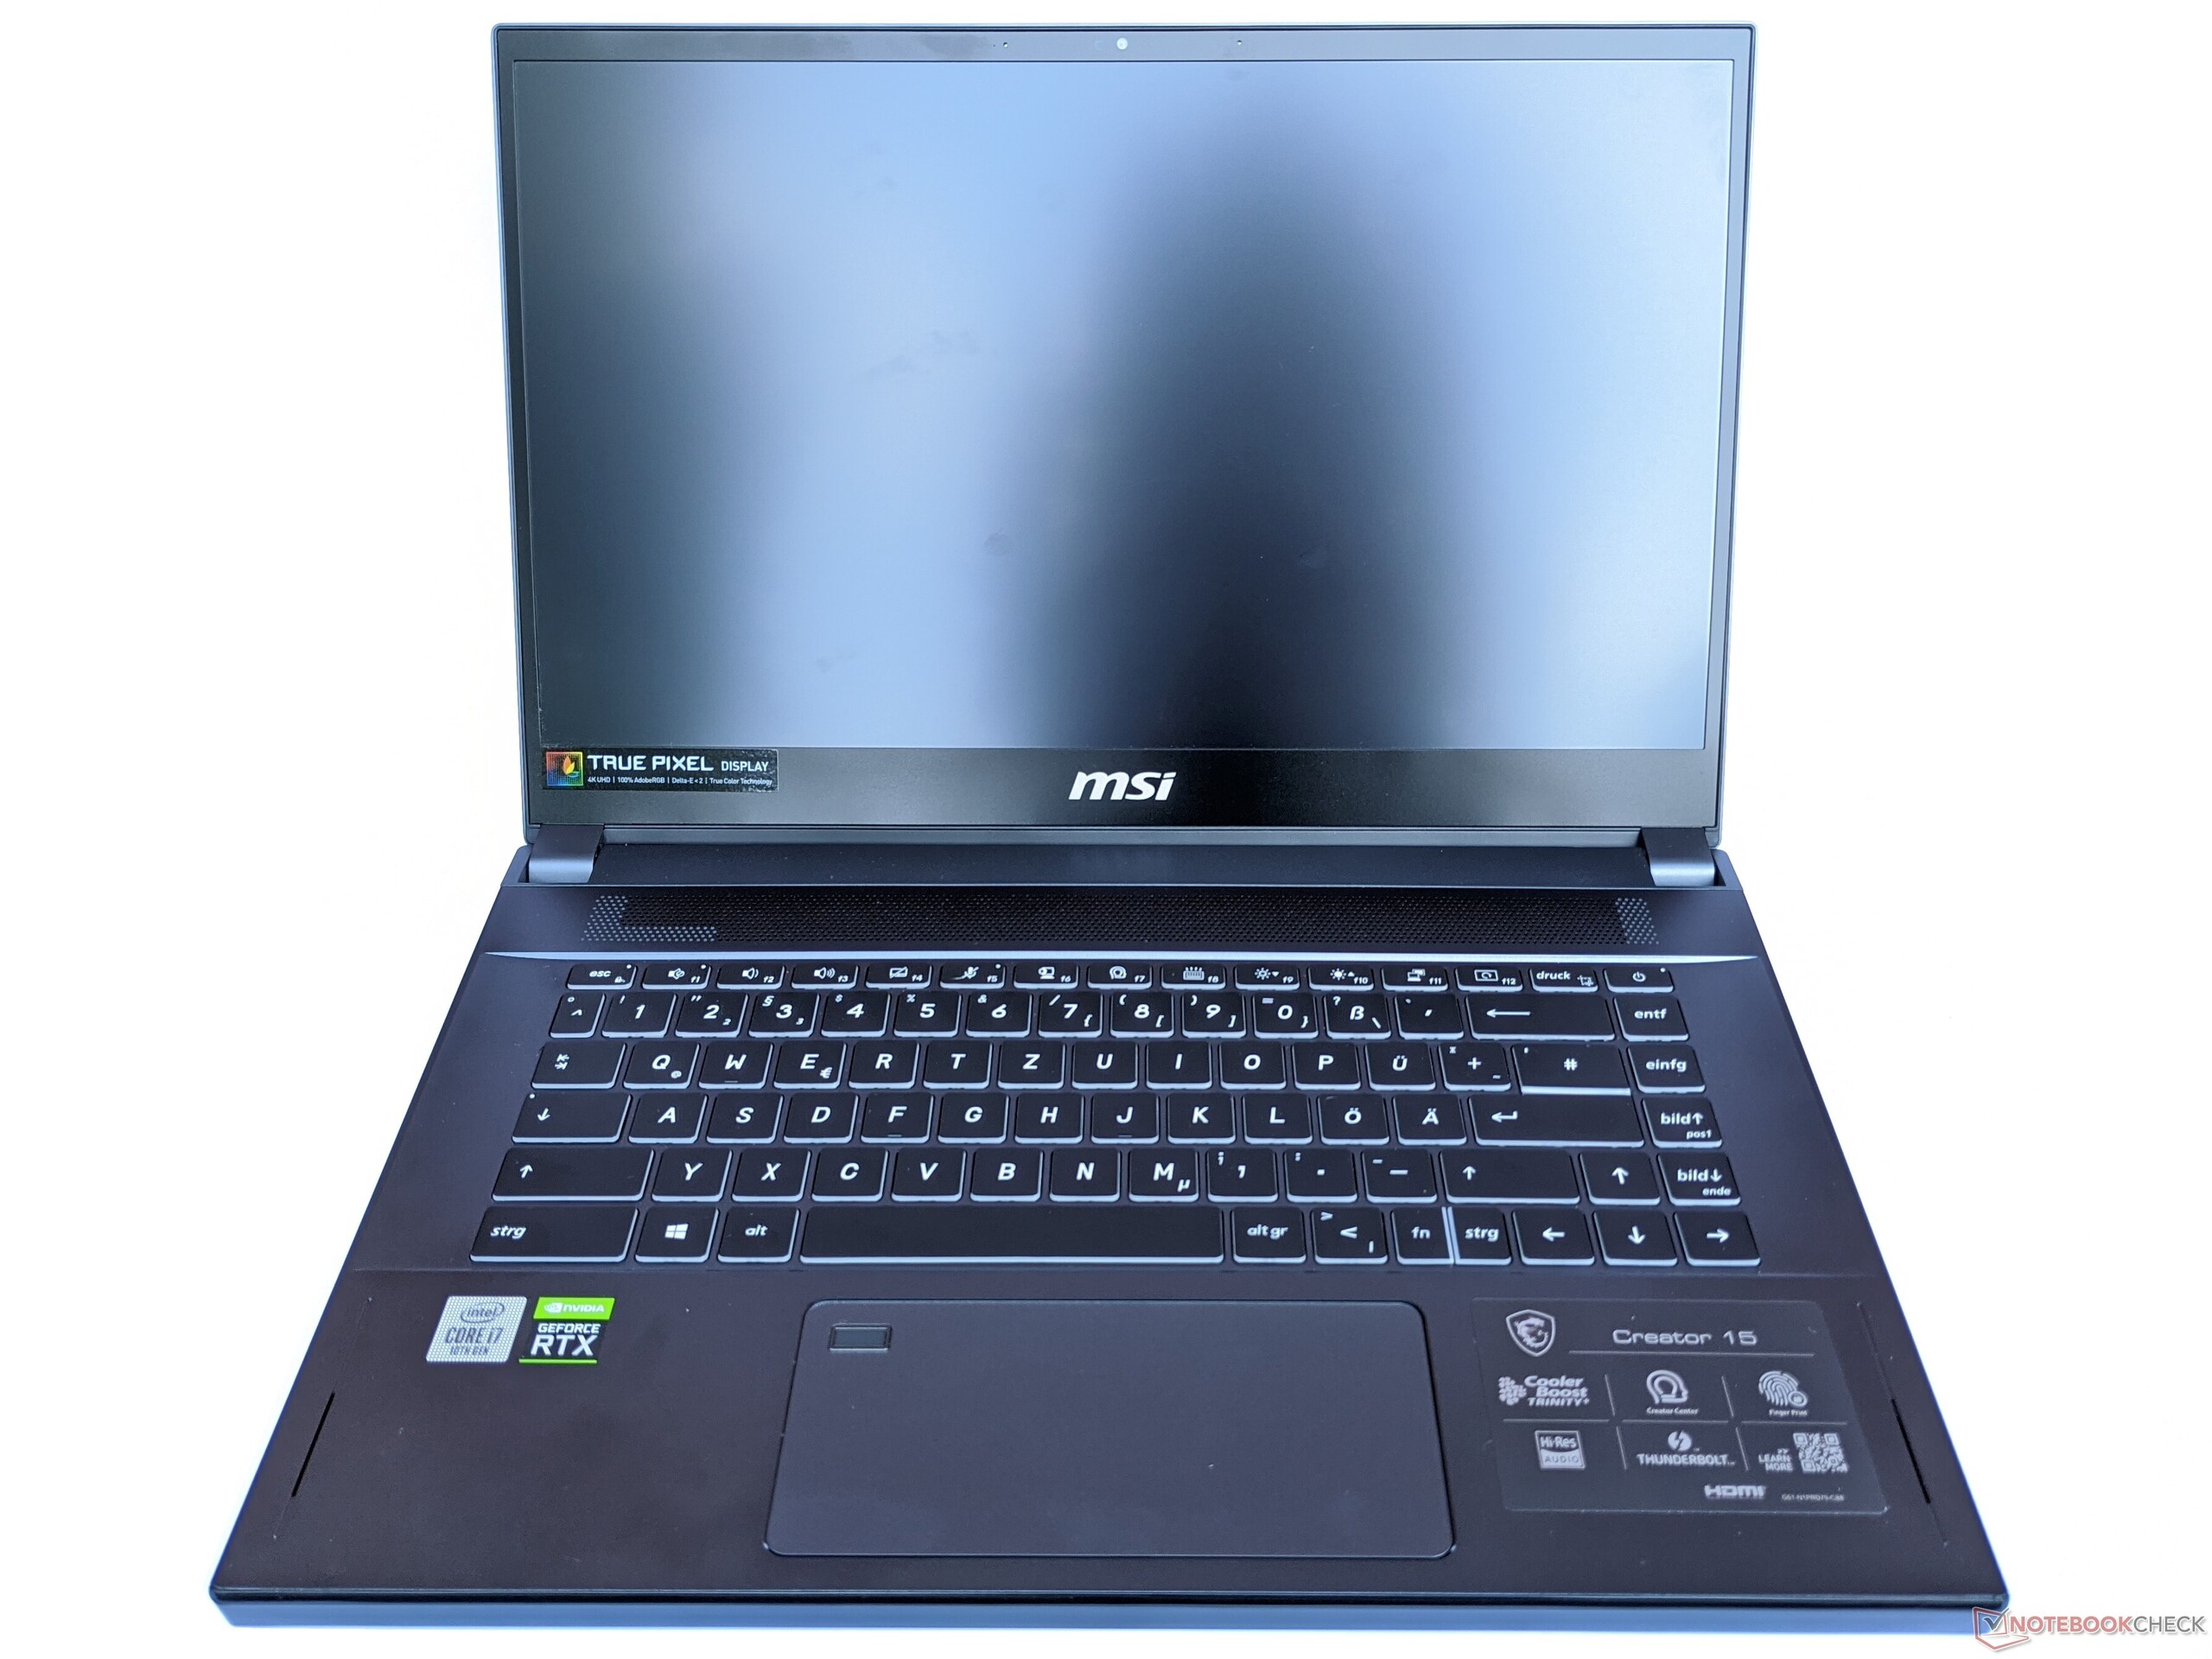
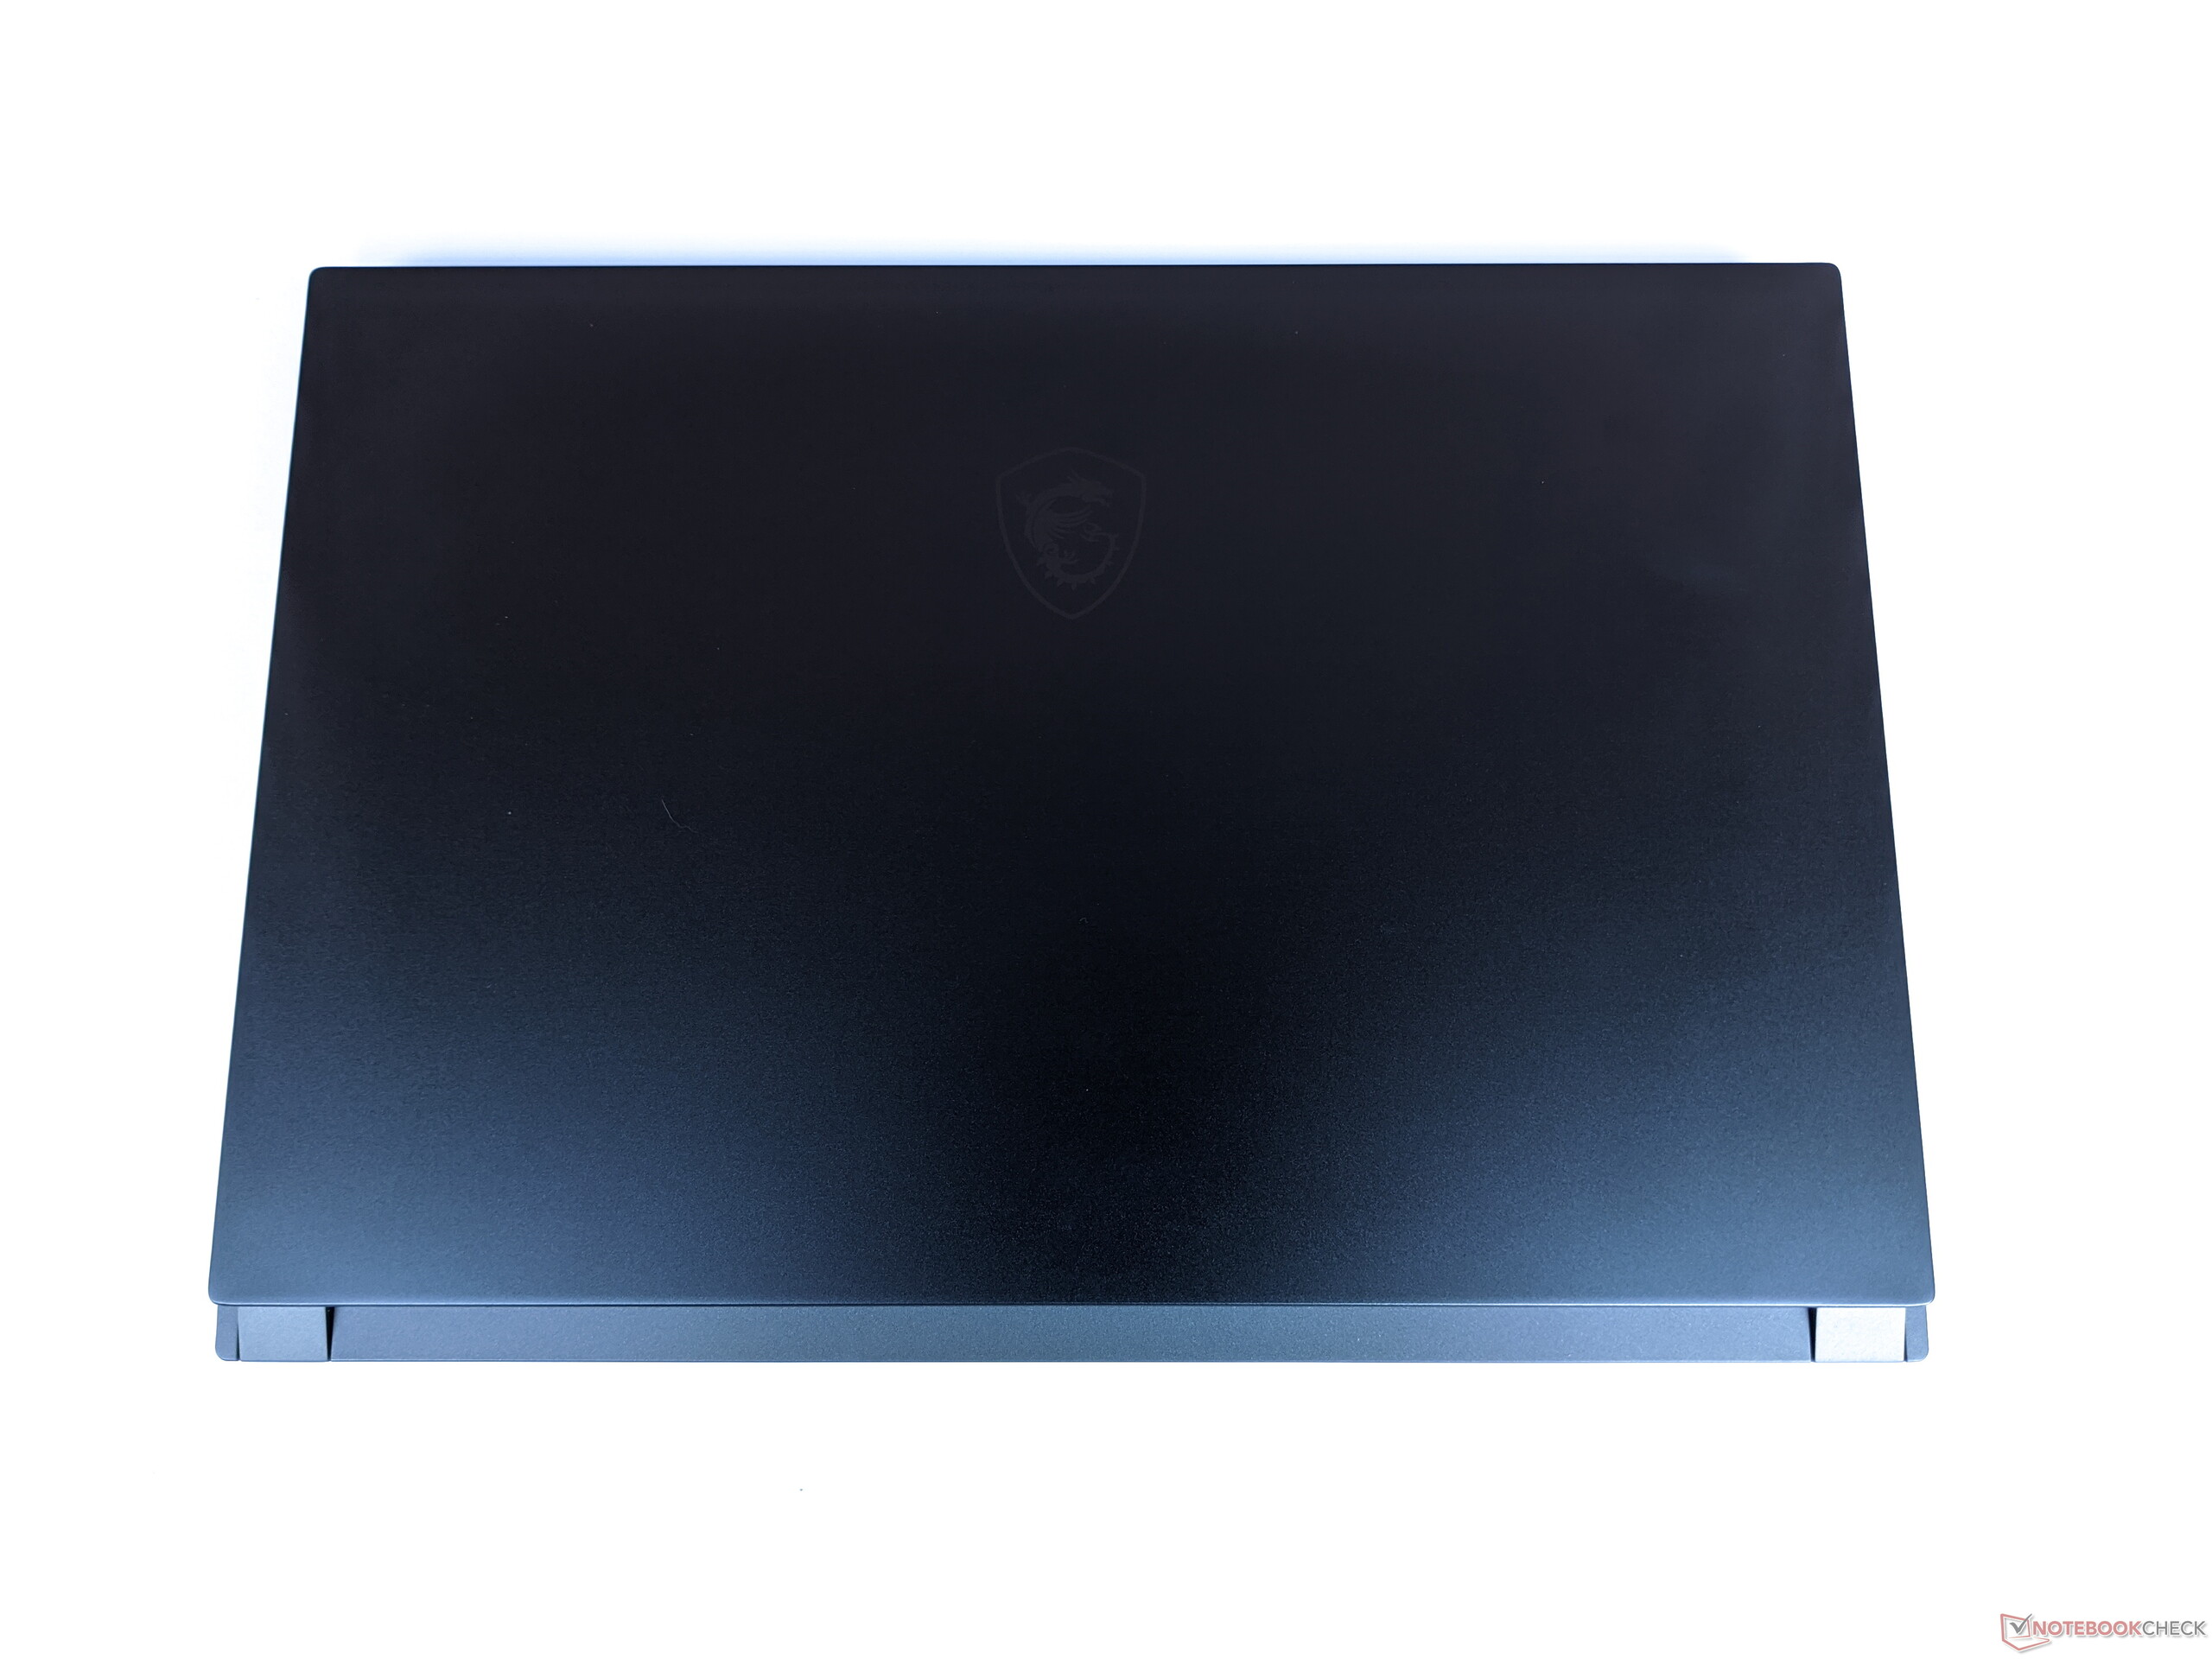
Case - robust MIL-STD-810G certification
The MSI Creator 15 is a very high-quality device with good workmanship. The notebook appears to be very robust and fulfills the MIL-STD-810G requirements in terms of durability and reliability according to the manufacturer. Our test unit did not produce any creaking noises or have uneven gap dimensions. The display opens up to 180° and is held tight by the hinges.
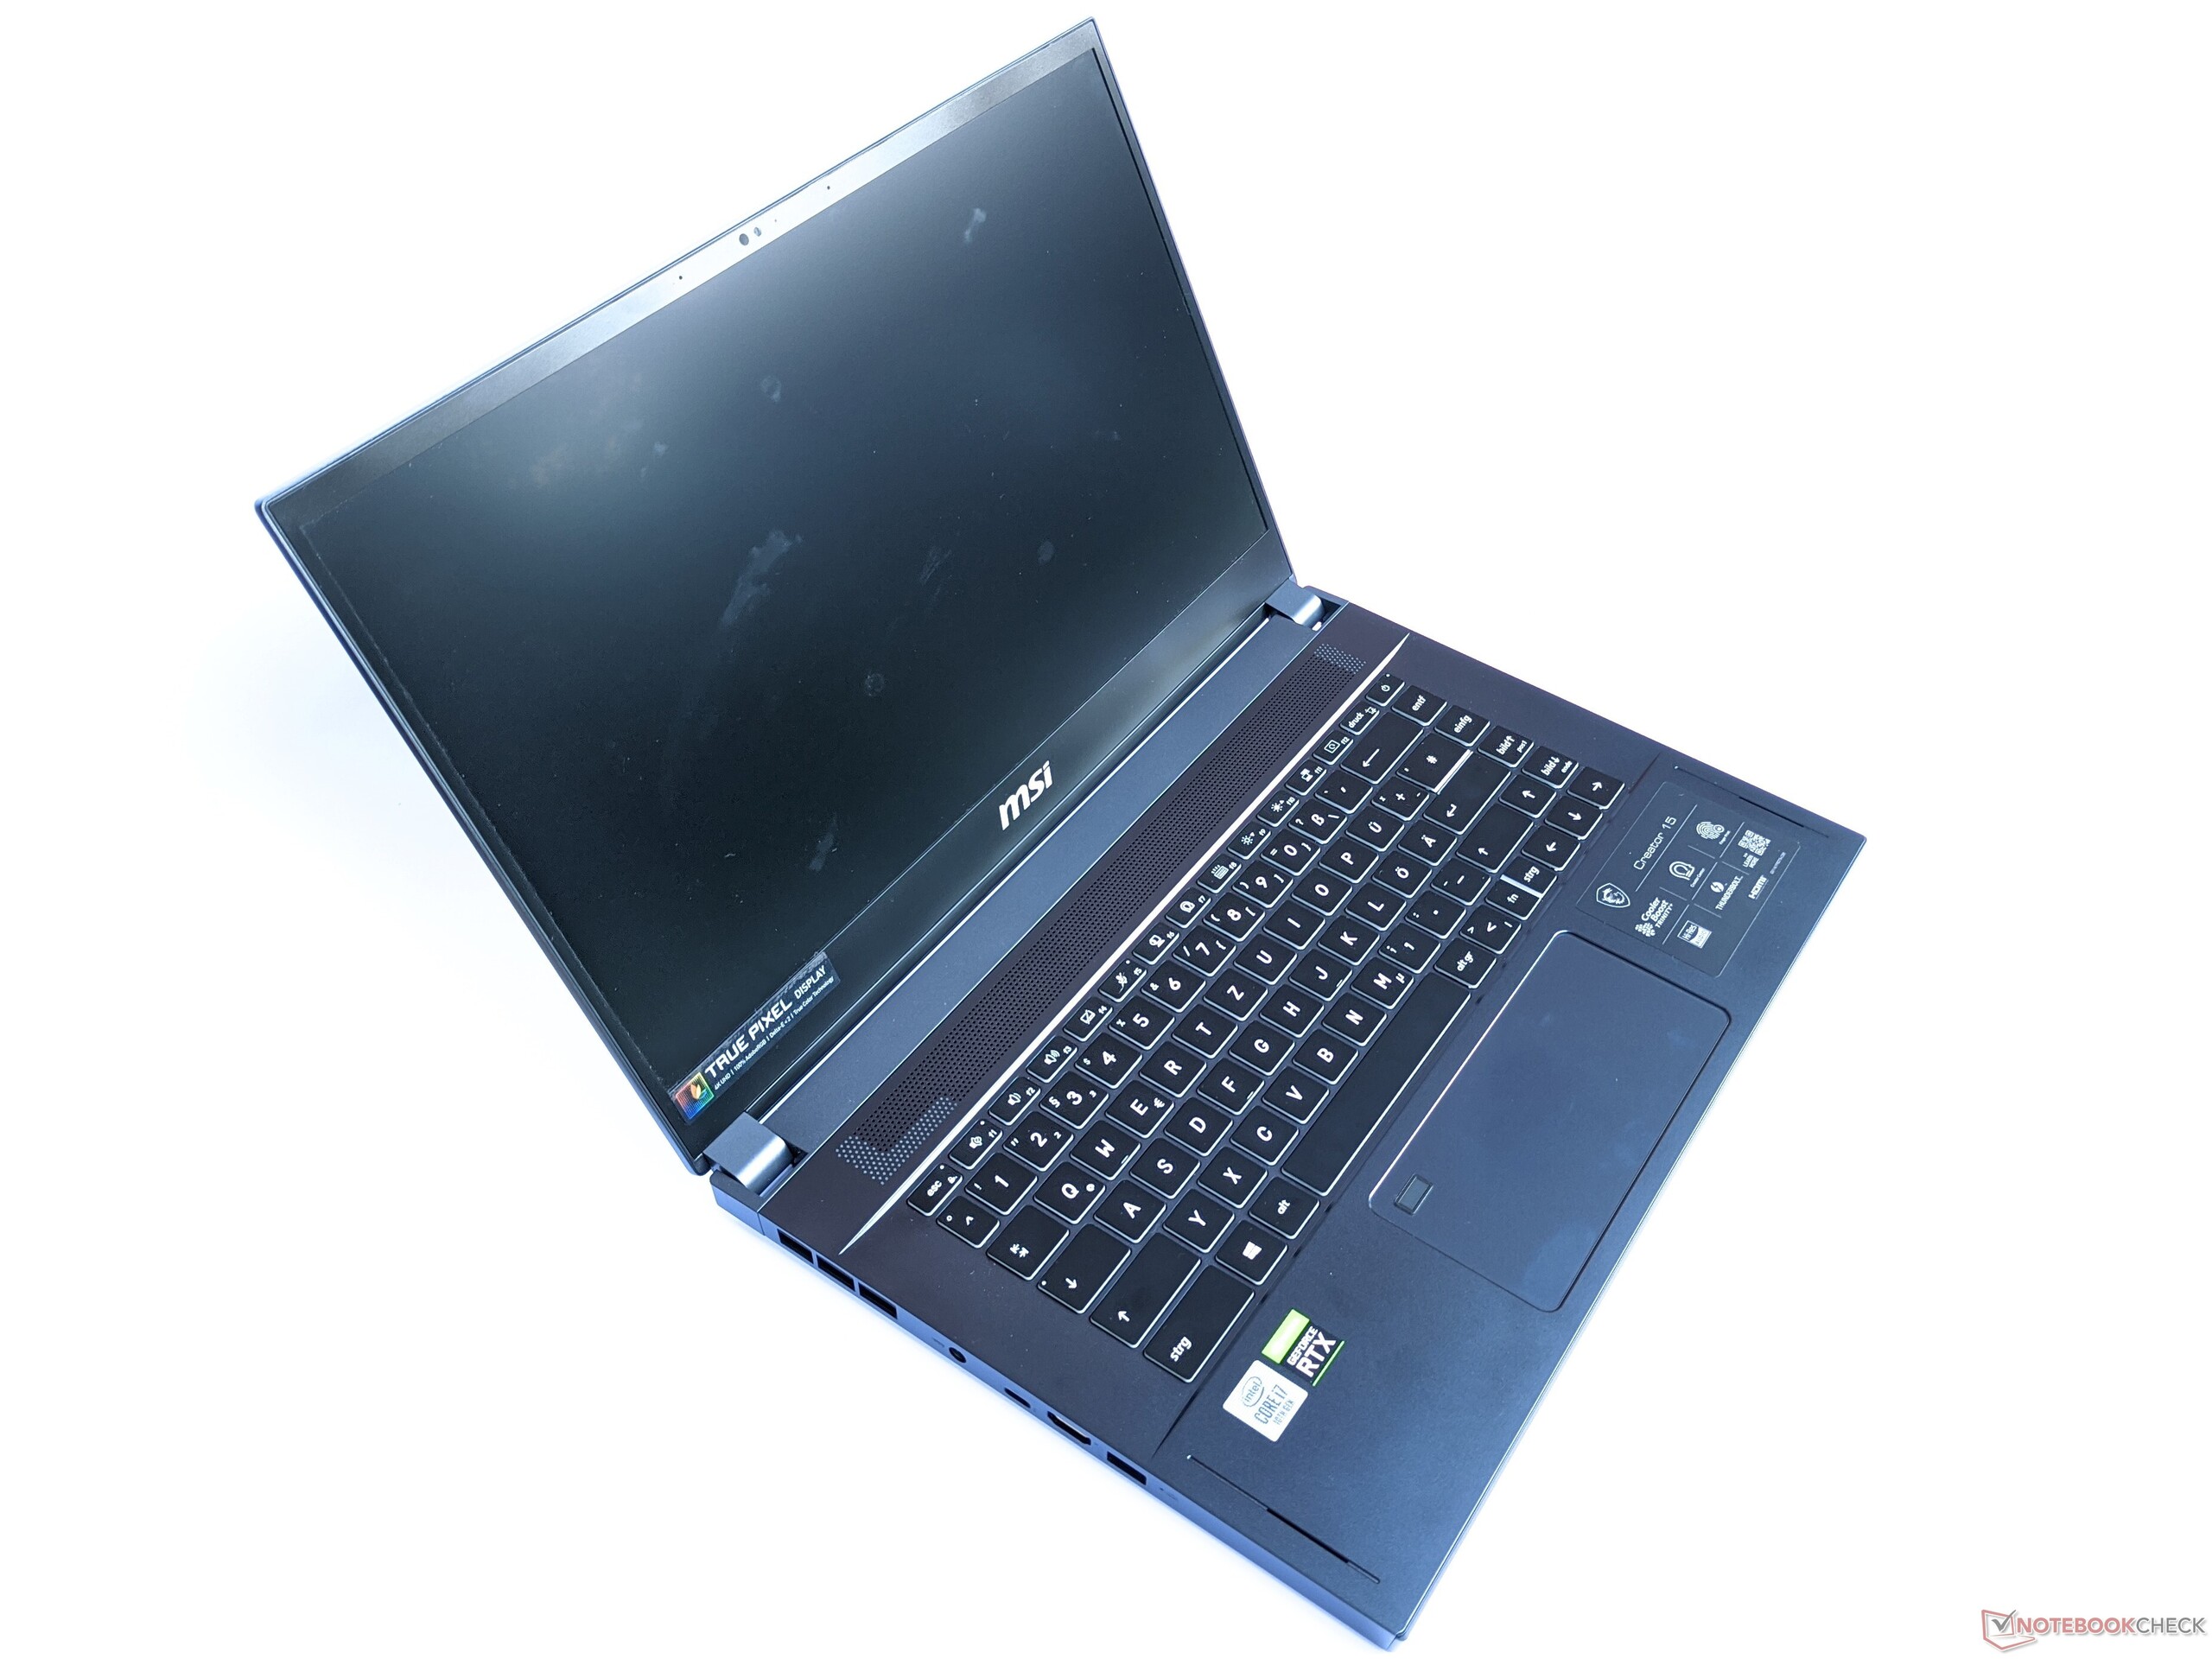
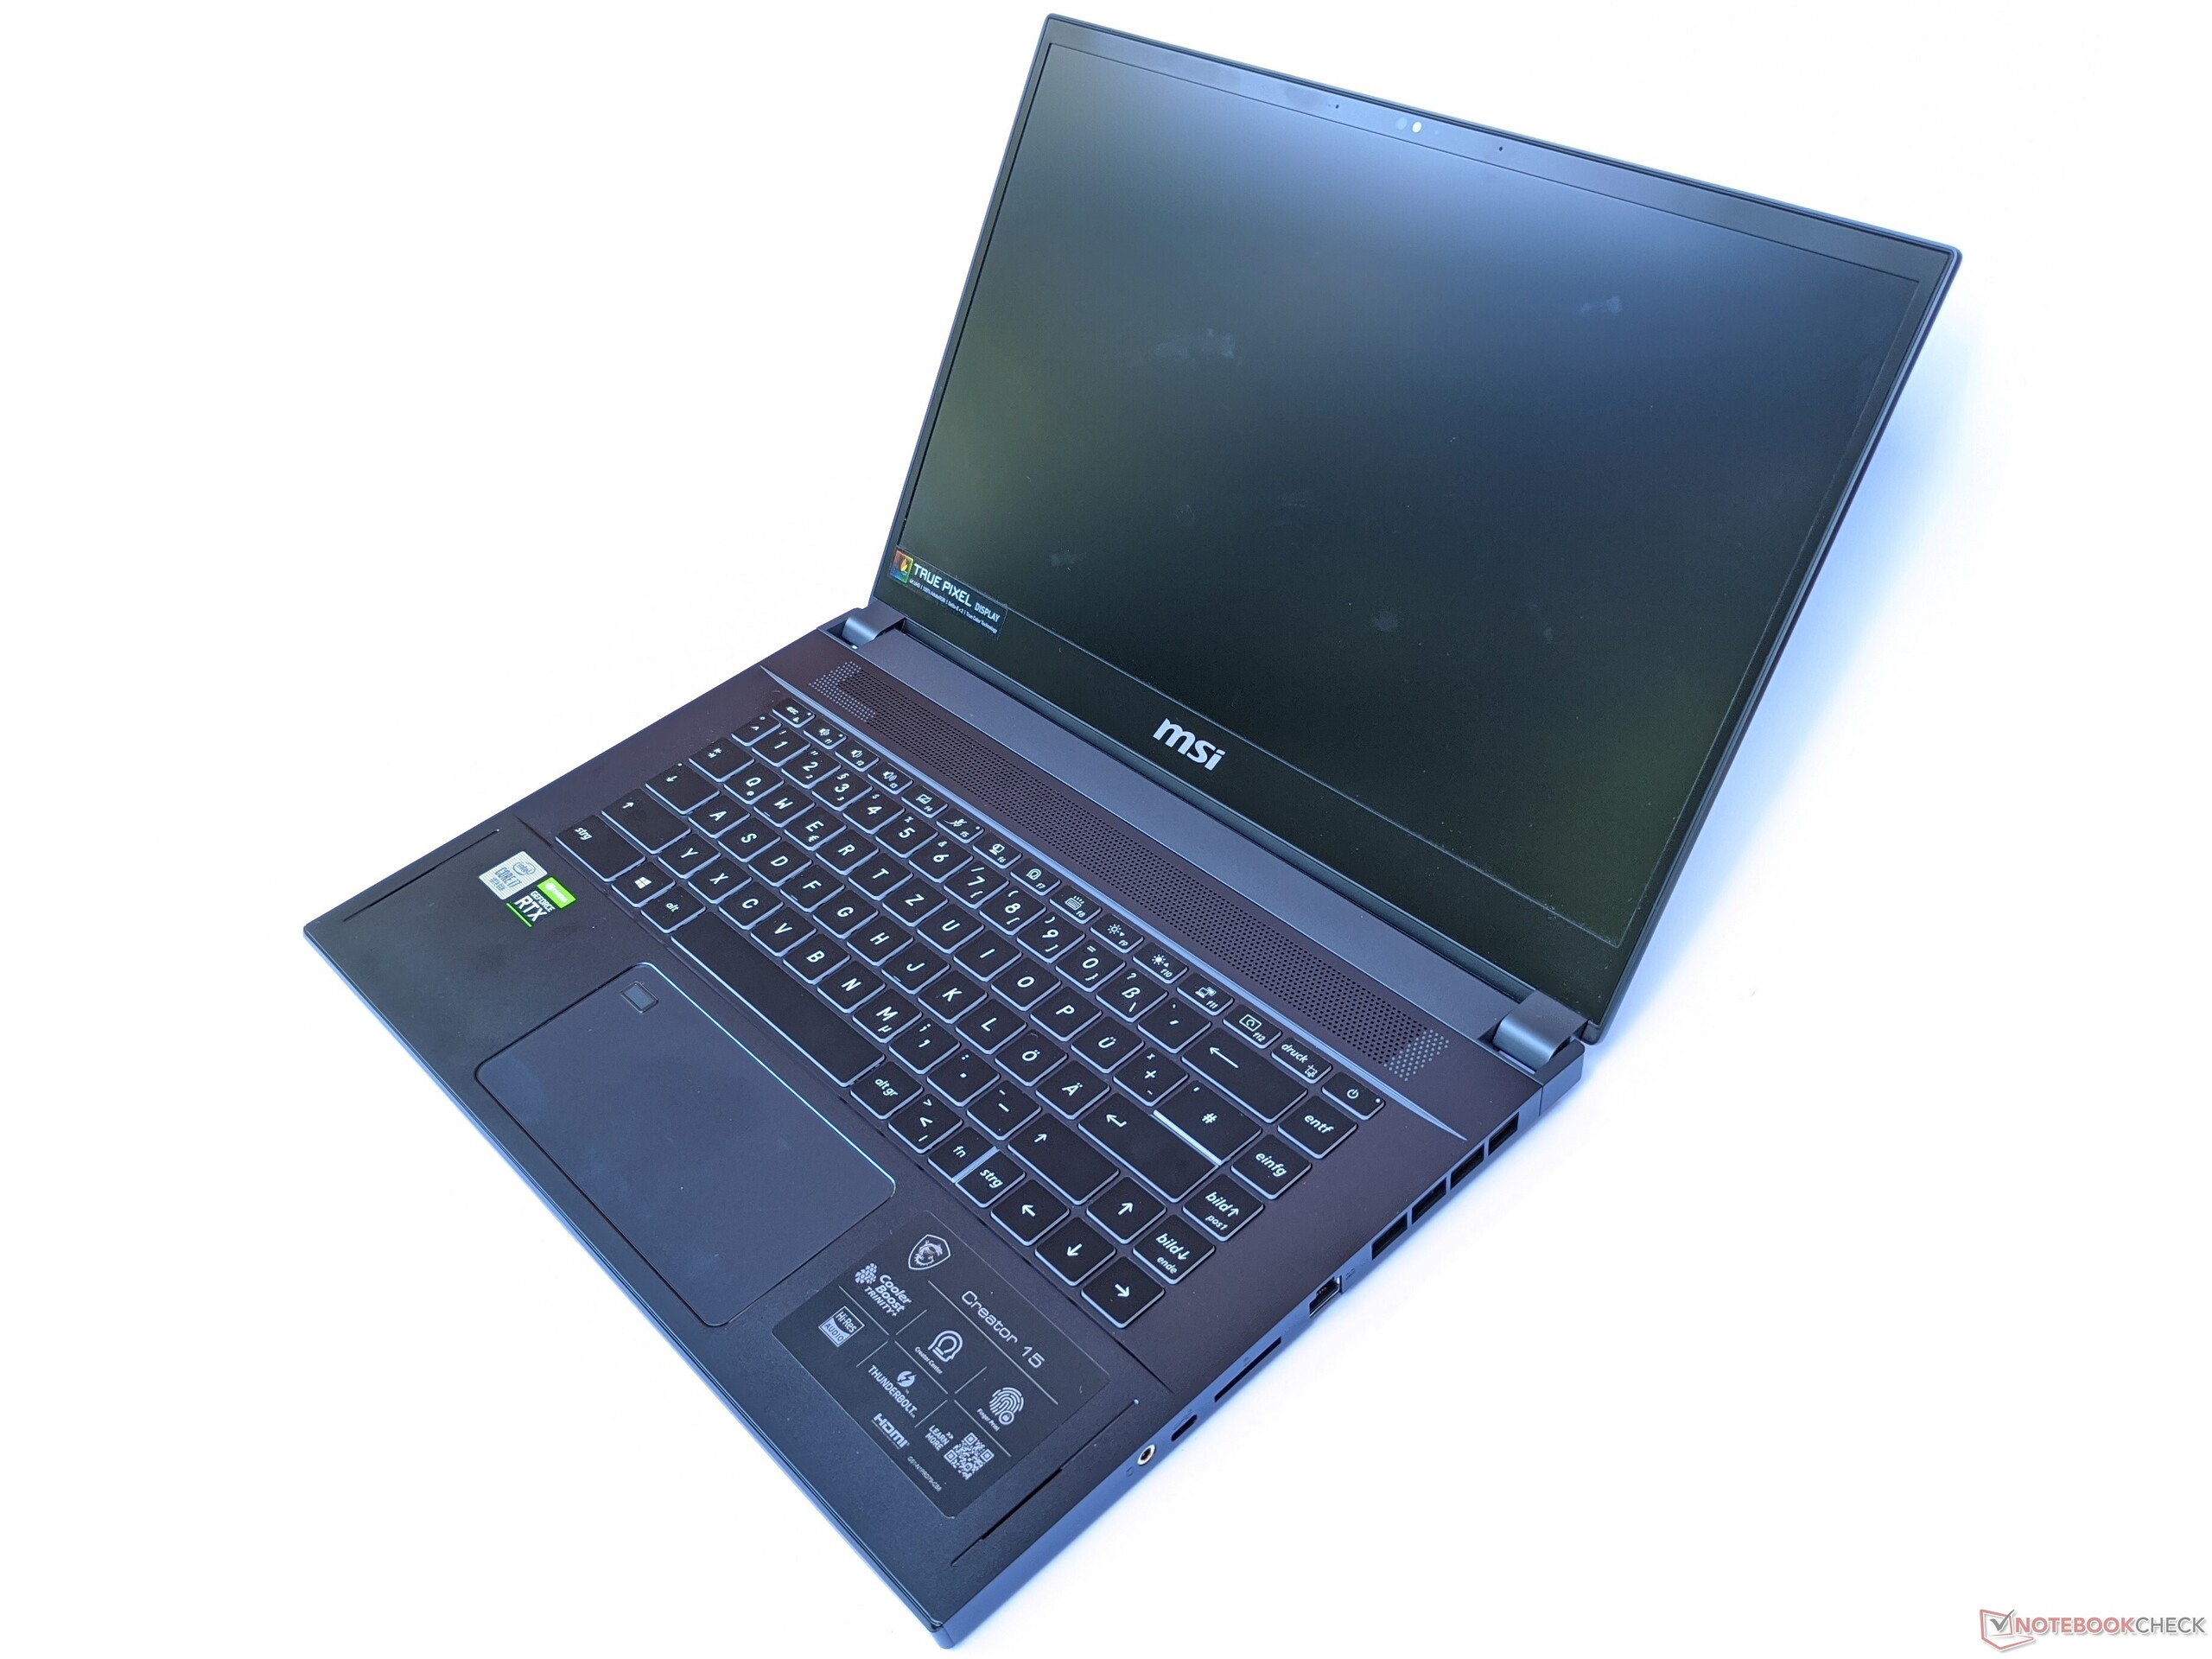
At 1.9 kg the Creator 15 is one of the lightest models in our test field. Its dimensions are very compact as well, although our competitors are even smaller, in particular in terms of depth.
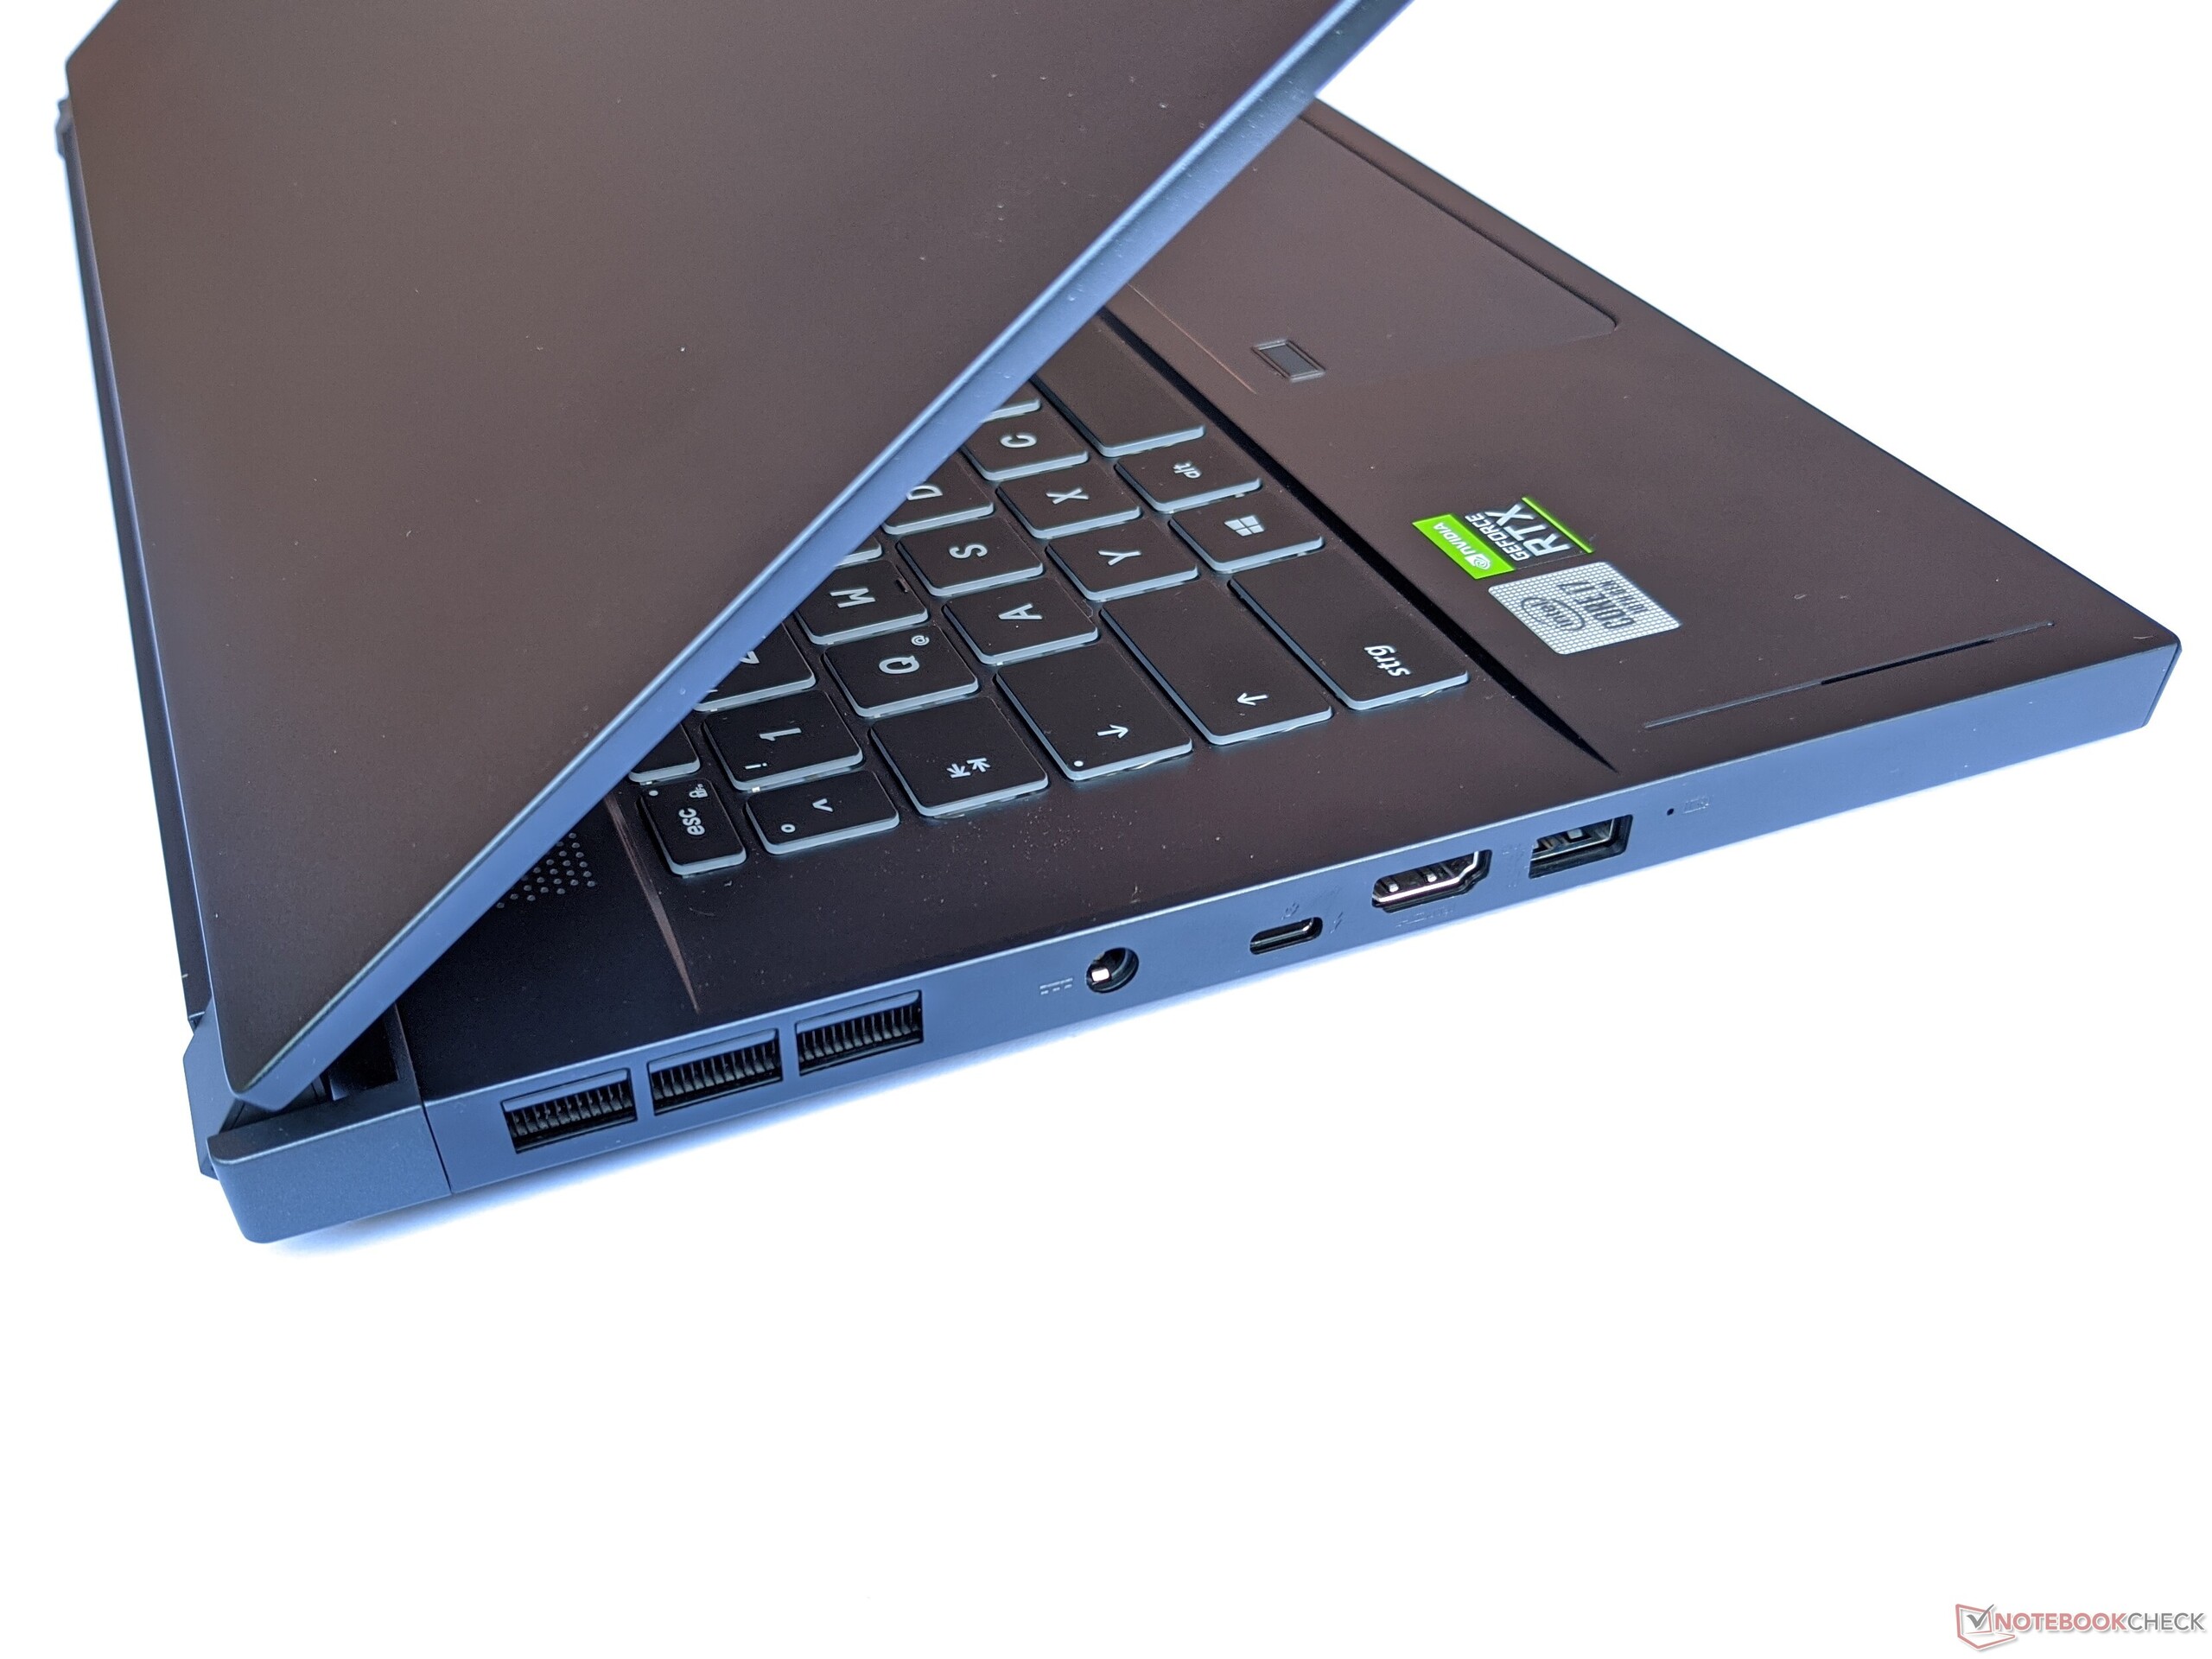
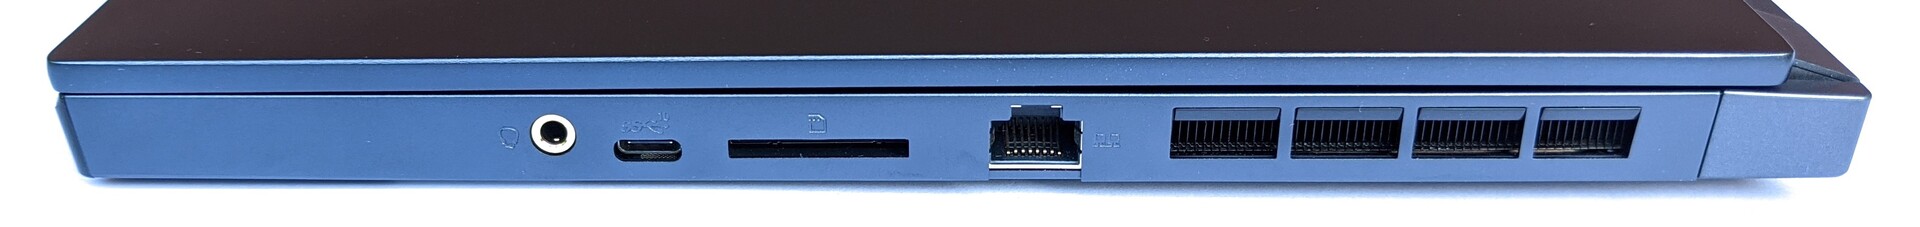
Connectivity - Thunderbolt 3 and fast Wi-Fi
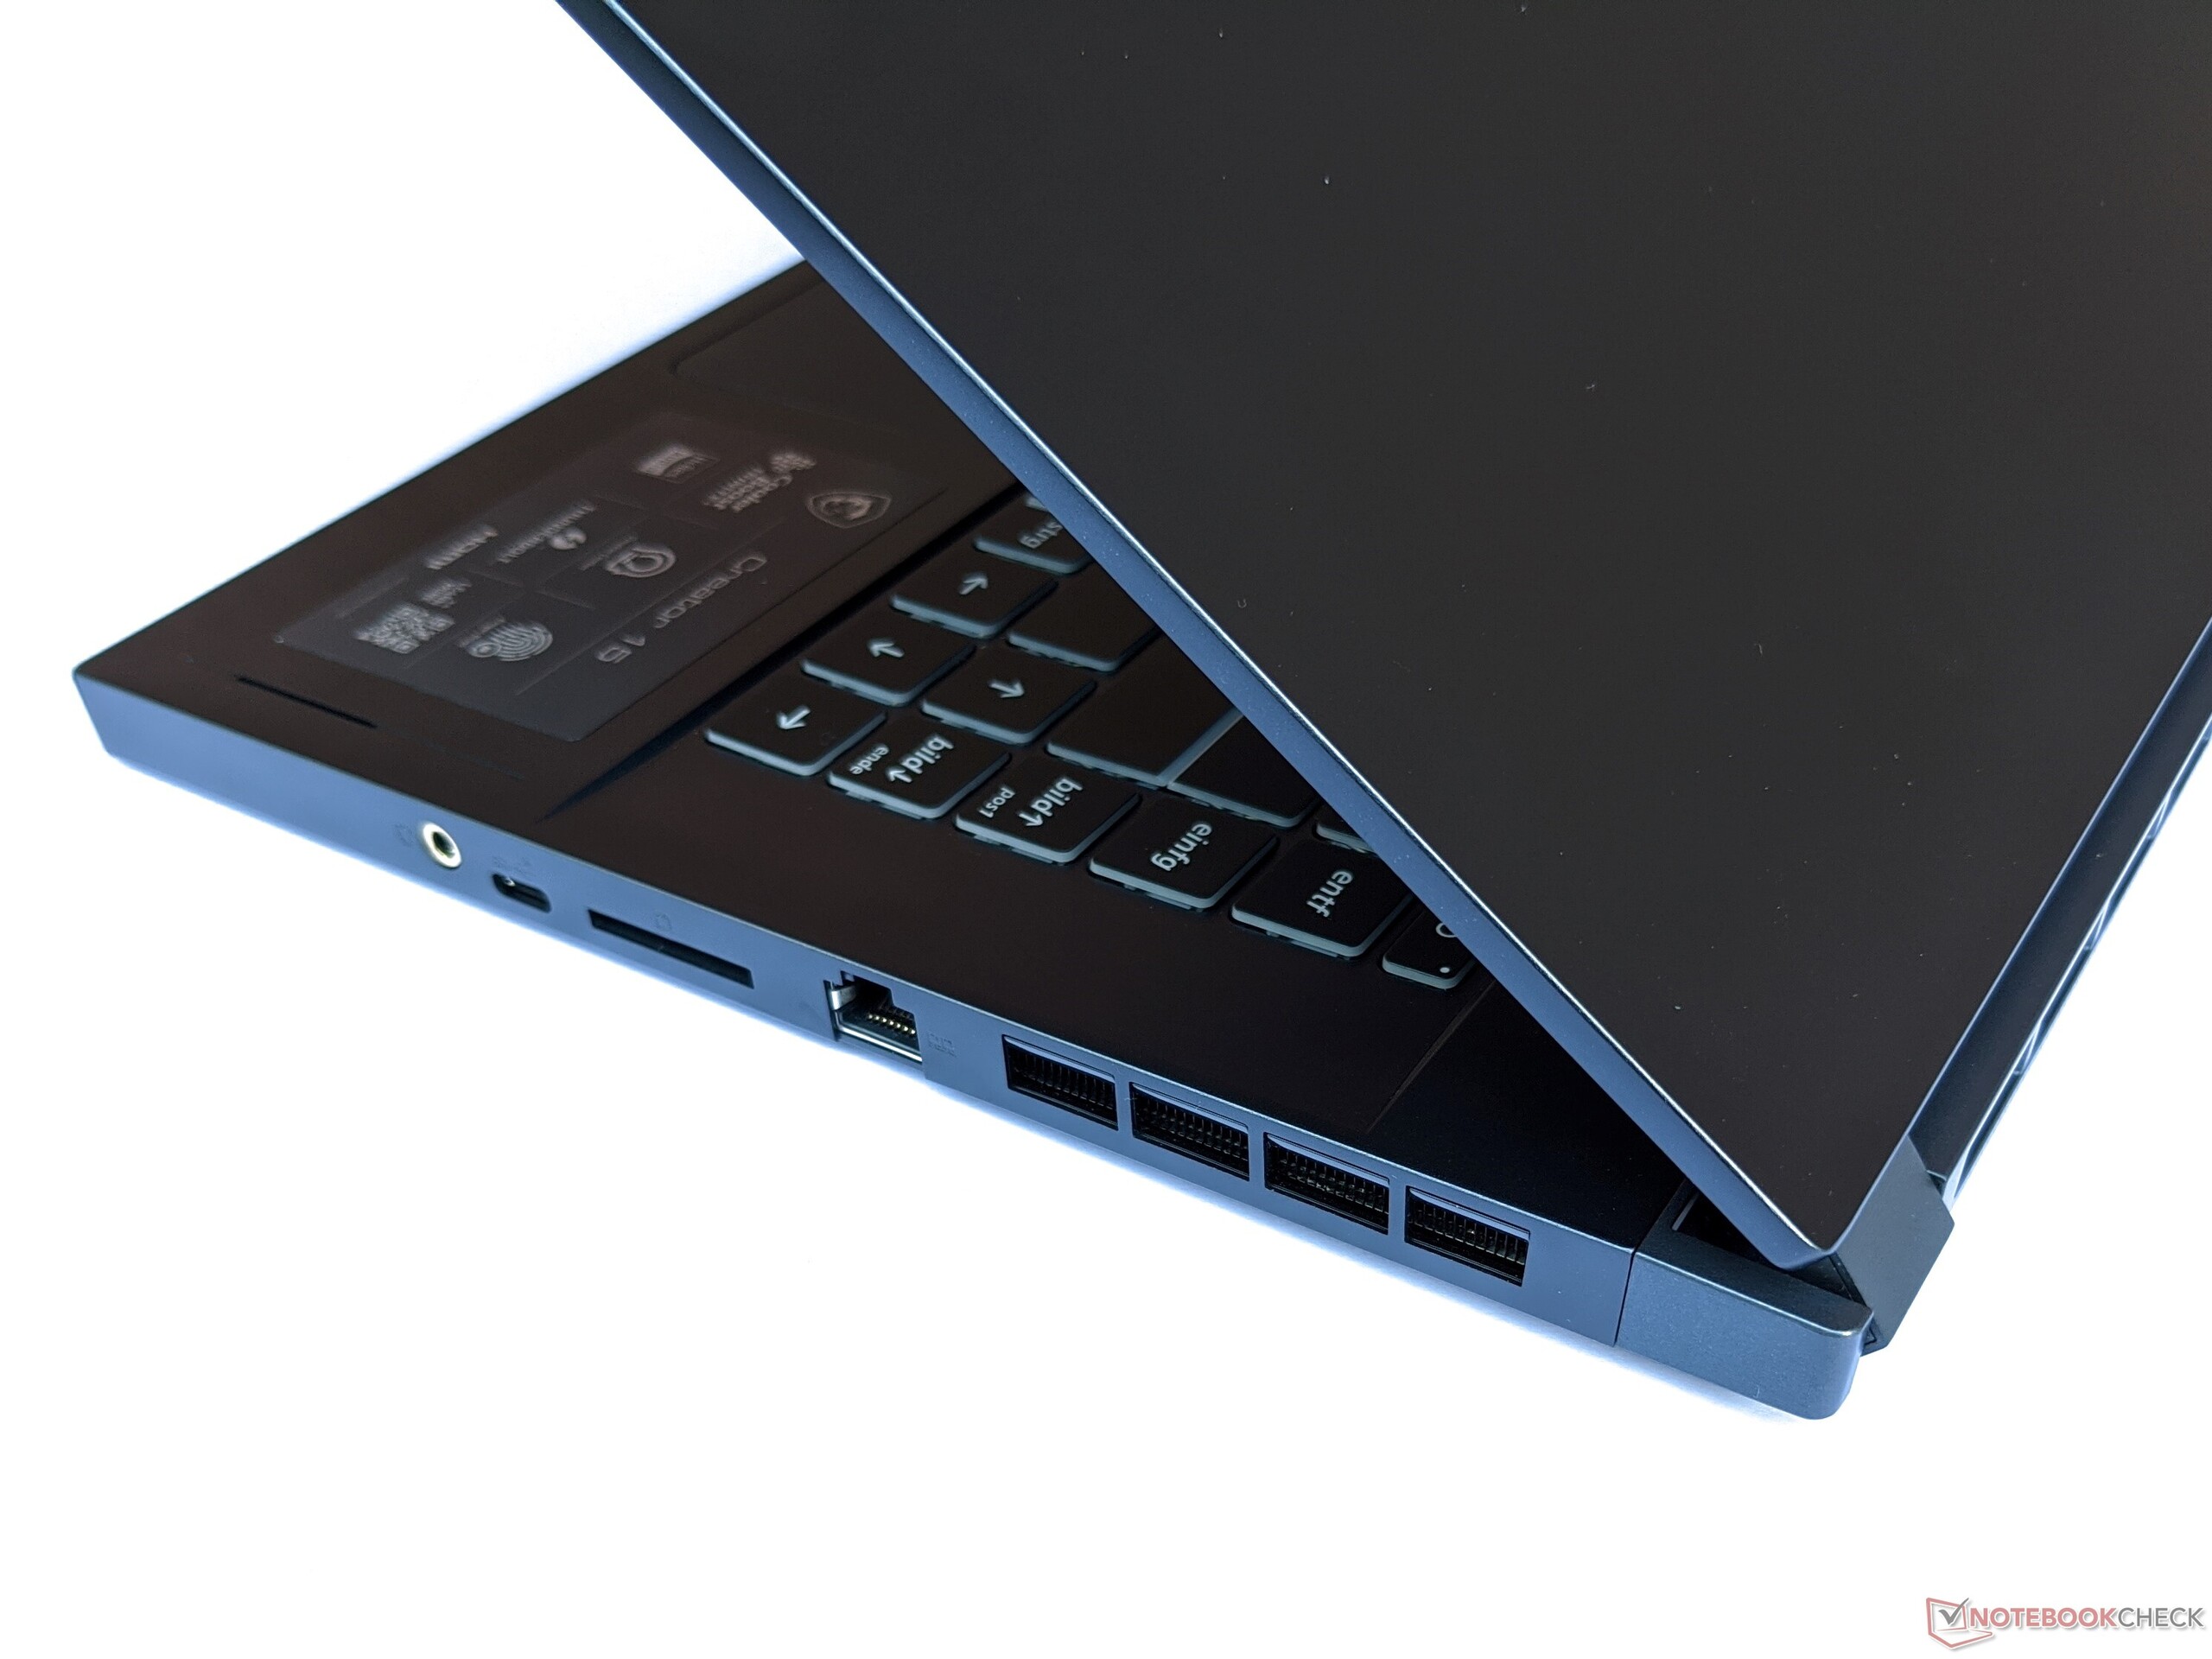
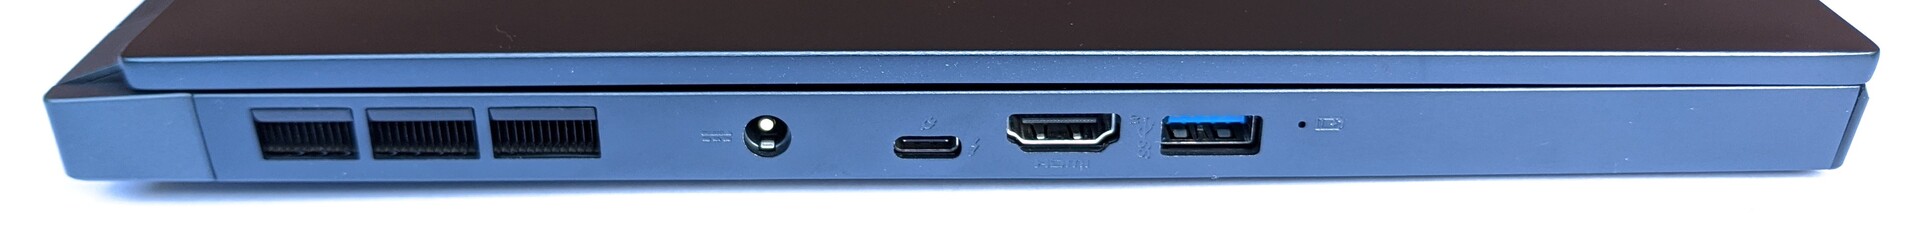
The MSI Creator 15 offers the standard port selection, although the fact that there is only one USB Type A port means that users will need to work with adapters. These can also be used in combination with the USB Type C port while the Thunderbolt 3 can be used for a variety of applications. The ventilation holes at either side mean that the ports are pushed toward the front, which means you might have some cables in the way, depending on what you use the ports for.
SD card reader
The SD card reader in the MSI Creator 15 reaches very good speeds of 222 MB/s when copying and 217 MB/s when writing data in combination with our reference card Toshiba Exceria Pro SDXC 64 GB UHS-II.
| SD Card Reader | |
| average JPG Copy Test (av. of 3 runs) | |
| MSI Creator 15 (Toshiba Exceria Pro SDXC 64 GB UHS-II) | |
| Gigabyte Aero 15 OLED XB-8DE51B0SP (Toshiba Exceria Pro SDXC 64 GB UHS-II) | |
| Razer Blade 15 RTX 2070 Super Max-Q (Toshiba Exceria Pro SDXC 64 GB UHS-II) | |
| Average of class Multimedia (21.1 - 531, n=45, last 2 years) | |
| maximum AS SSD Seq Read Test (1GB) | |
| Gigabyte Aero 15 OLED XB-8DE51B0SP (Toshiba Exceria Pro SDXC 64 GB UHS-II) | |
| MSI Creator 15 (Toshiba Exceria Pro SDXC 64 GB UHS-II) | |
| Razer Blade 15 RTX 2070 Super Max-Q (Toshiba Exceria Pro SDXC 64 GB UHS-II) | |
| Average of class Multimedia (27.4 - 1455, n=45, last 2 years) | |
Communication
When connecting via our reference router Netgear Nighthawk AX12, the MSI Creator 15 reaches an average 1437 MBit/s when receiving and 1497 MBit/s when sending data. This result places it at the top of our comparison field. The device is equipped with a GigabitLAN port for cable-based data transfer.
Webcam
As with most current notebooks, the MSI Creator 15's webcam records images with a low 0.9 MP. Image content appears blurry even in good lighting and colors are lighter than they should be.

")
")
Accessories
The Creator 15 comes with a 230-Watt AC adapter. Buyers can purchase additional accessories such as a physical mouse, keyboards and more from the MSI website.
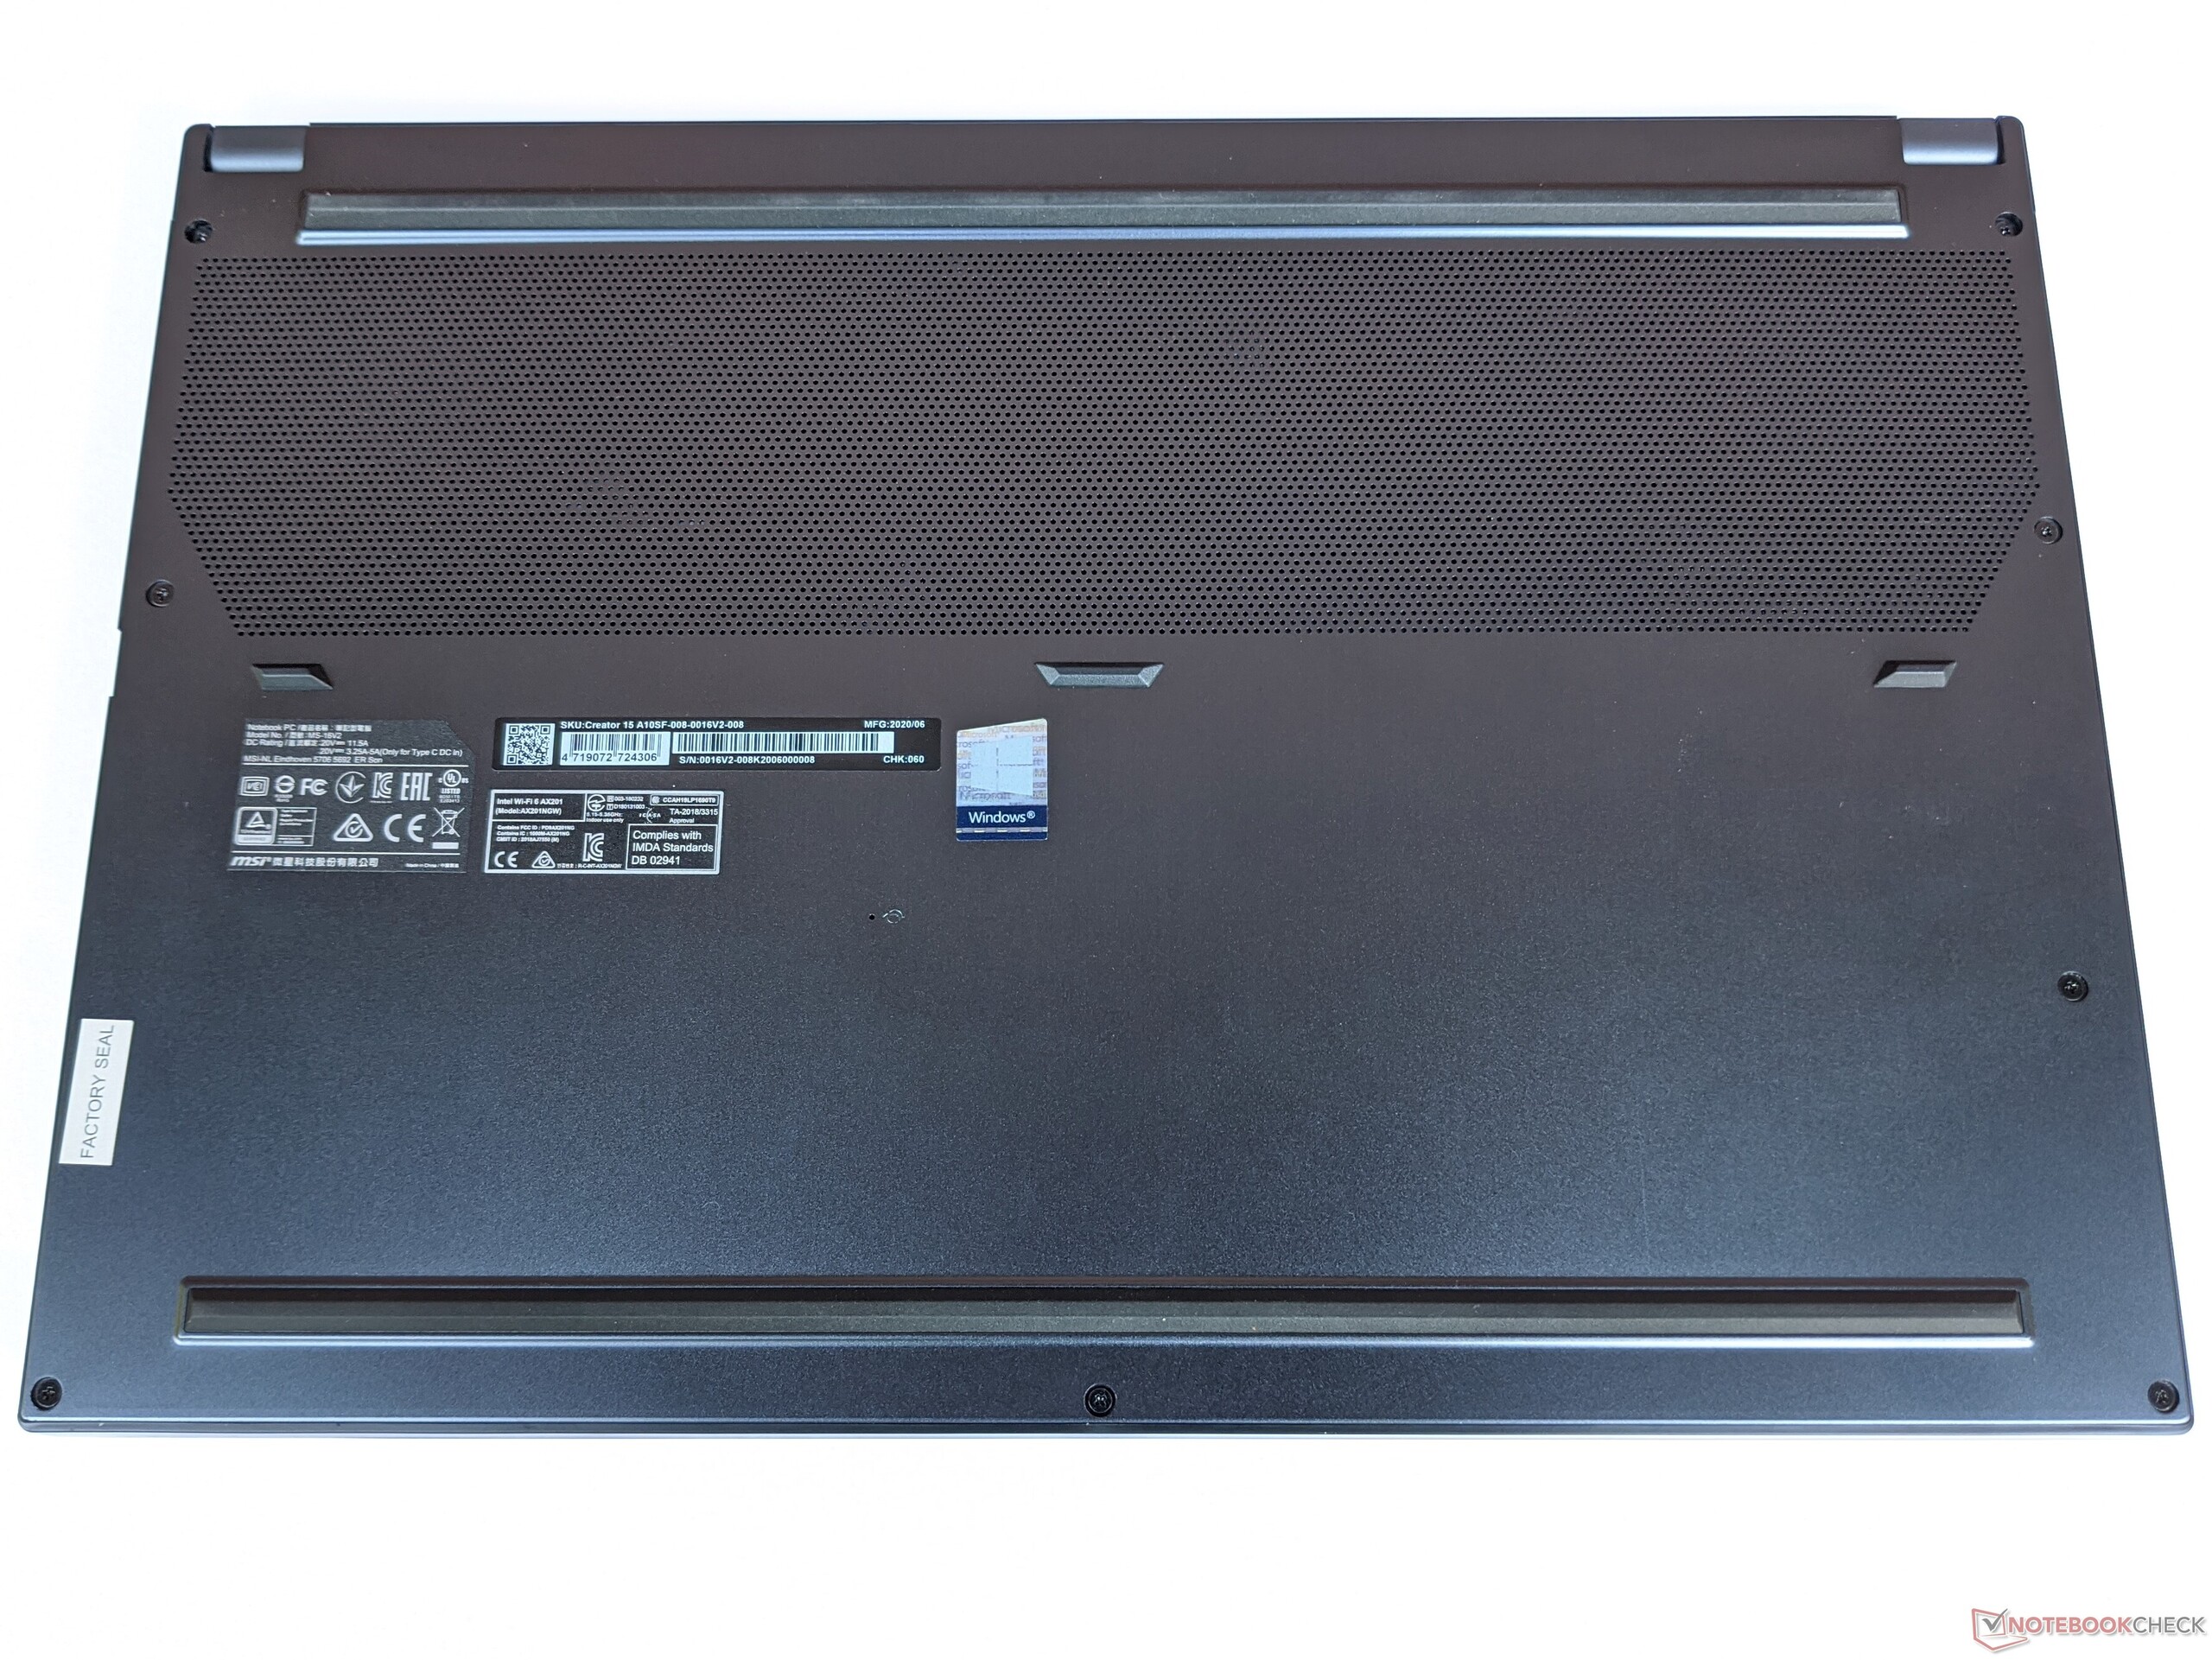
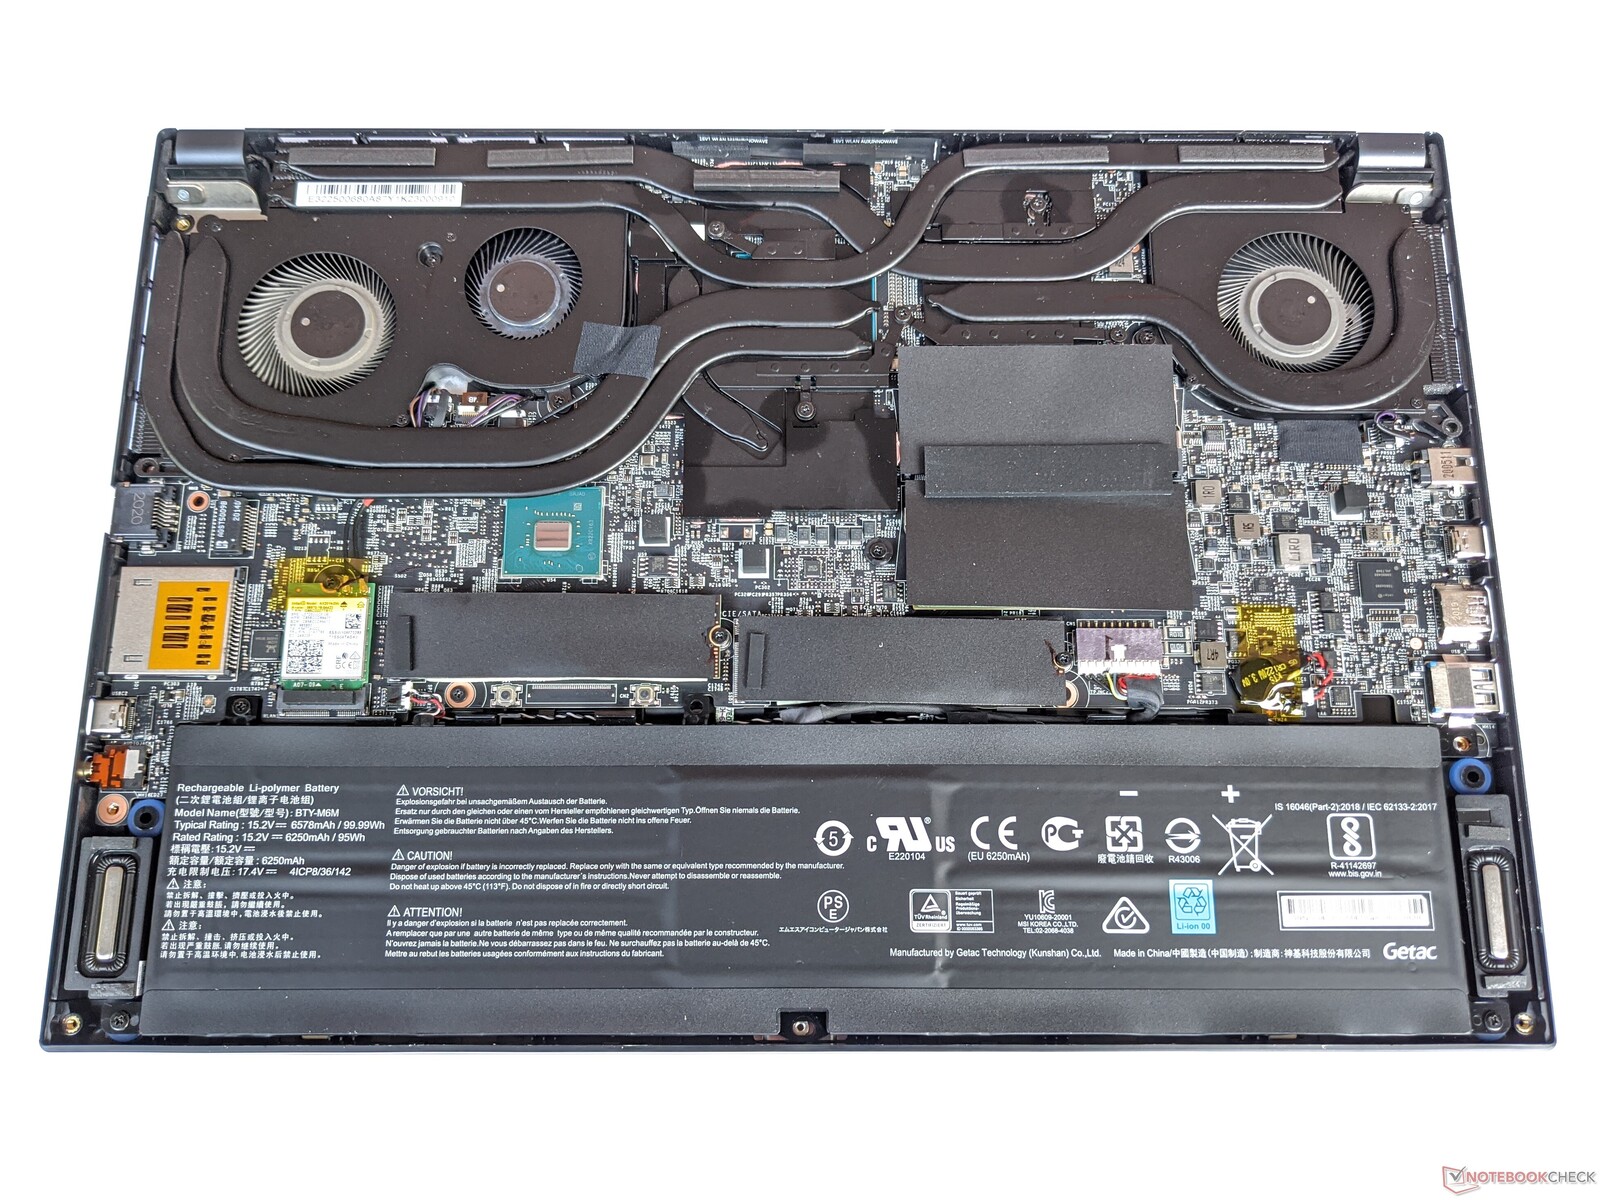
Maintenance
The base unit of the MSI Creator 15 can be opened by removing all the screws. Users then have access to the two SSD slots and the two RAM banks. The Wi-Fi module can be exchanged as well.
Warranty
MSI provides buyers of the Creator 15 with a 24 month warranty which can be extended for an additional charge.
Input Devices - large clickpad enables precise input
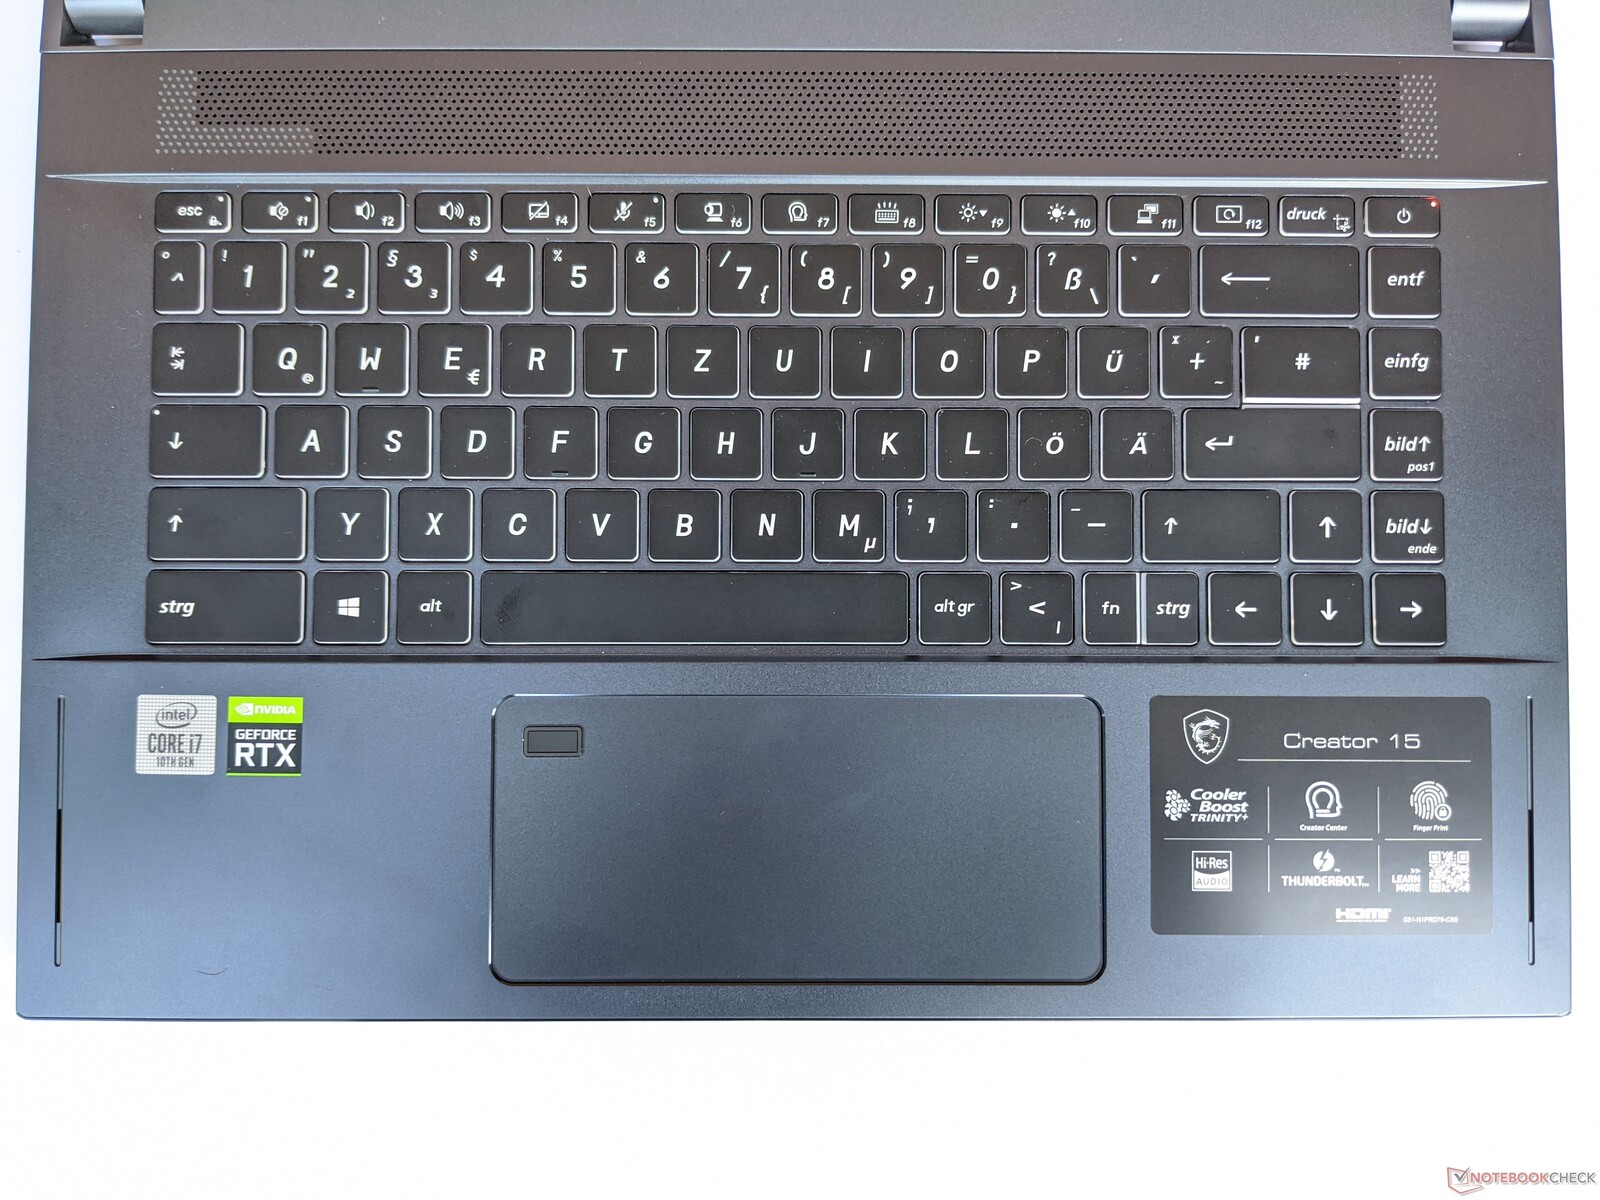
Keyboard
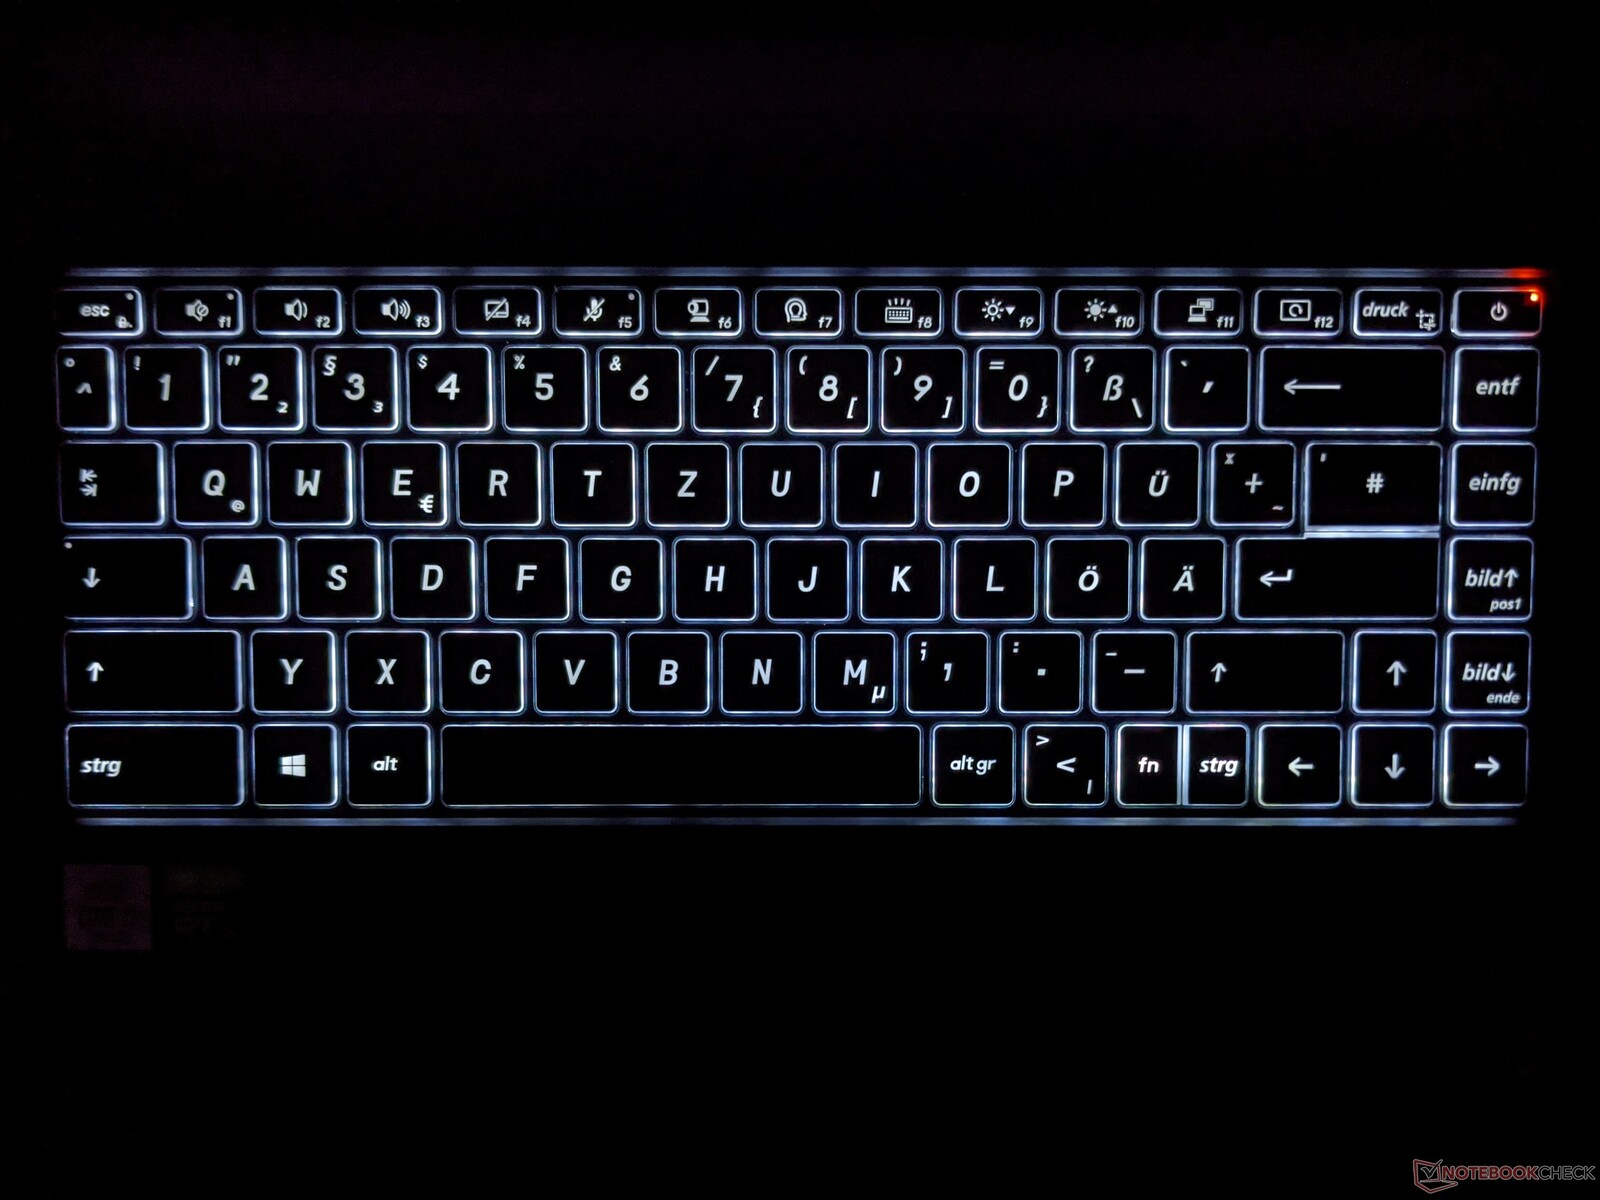
The keyboard of the MSI Creator 15 has large keys and a significant pressure point. This makes for comfortable typing. Even the arrow keys and delete, insert and position keys are normally sized. The only thing that takes a bit of getting used to is the horizontally divided enter key.
The three-tier backlighting enables users to light up the keys in dark surroundings. The light doesn't dazzle and illuminates the keys evenly, ensuring readability of the lettering. This, by the way, is easy to read even when the backlight is turned off.
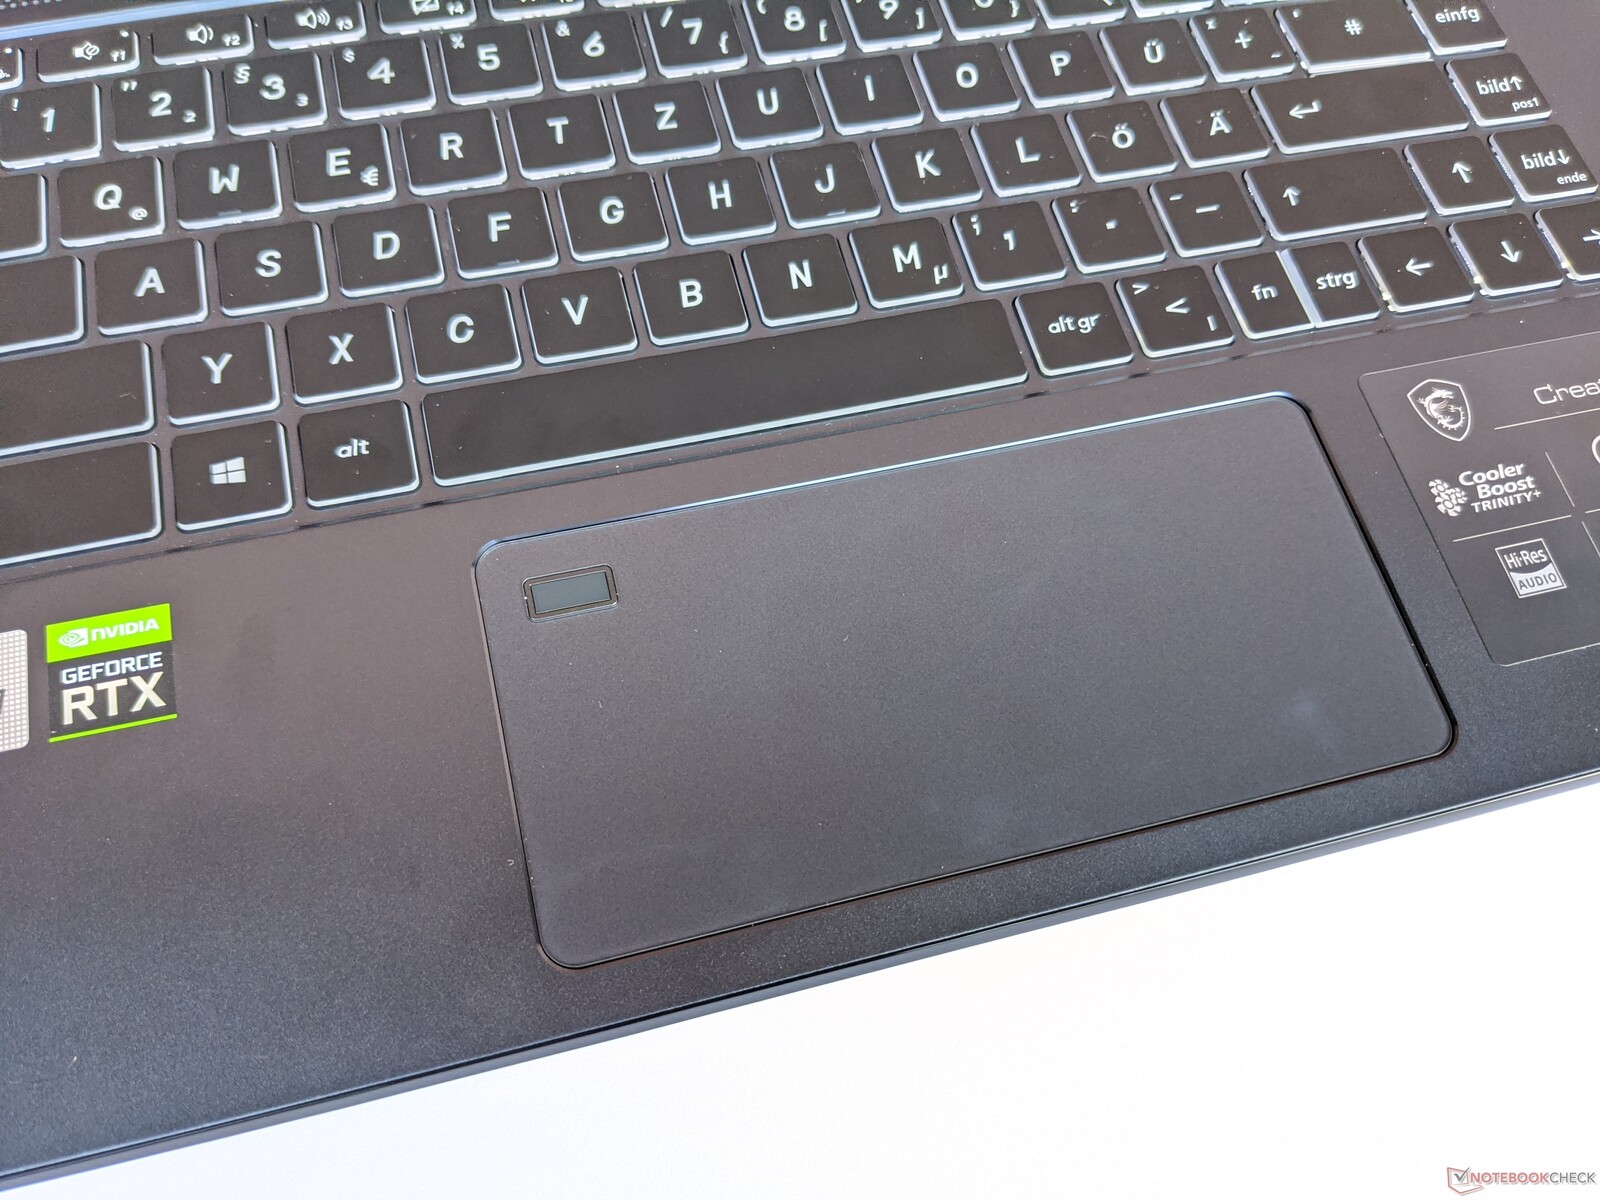
Touchpad
MSI has chosen to install a very wide clickpad with a surface that is ideal for navigation. The integrated fingerprint sensor doesn't get in the way and clicks can be actuated reliably both by touch and by mechanical pressure.
Display - MSI Creator 15 with UHD display
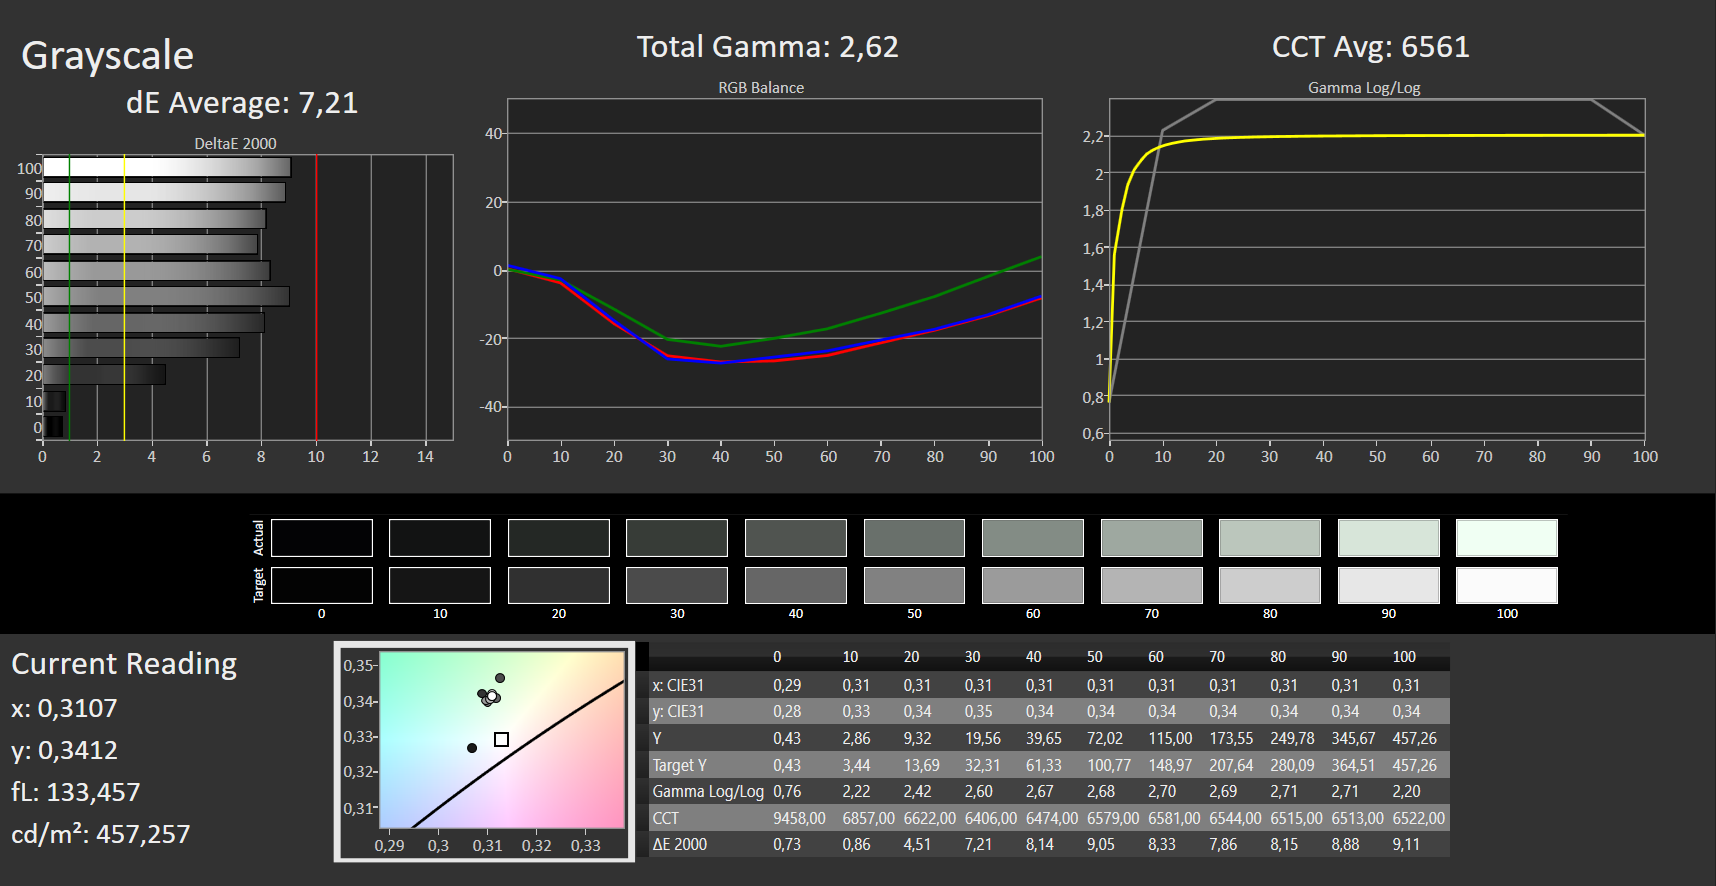
The screen of our test unit of the MSI Creator 15 consists of a 15.6-inch IPS panel with a resolution of 3840 x 2160 pixels. The brightness of 464 cd/m² positions it at the top of our comparison field while the brightness distribution is comparably low at 86 percent. Our measurements also show that the display flickers at brightness levels below 20 percent with a frequency of 25000 Hz. As this value is very high, even users with sensitive eyes shouldn't have any problems.
Alternatively, the Creator 15 is available with a FullHD panel that is optionally available as a touchscreen.
| |||||||||||||||||||||||||
Brightness Distribution: 85 %
Center on Battery: 463 cd/m²
Contrast: 1326:1 (Black: 0.35 cd/m²)
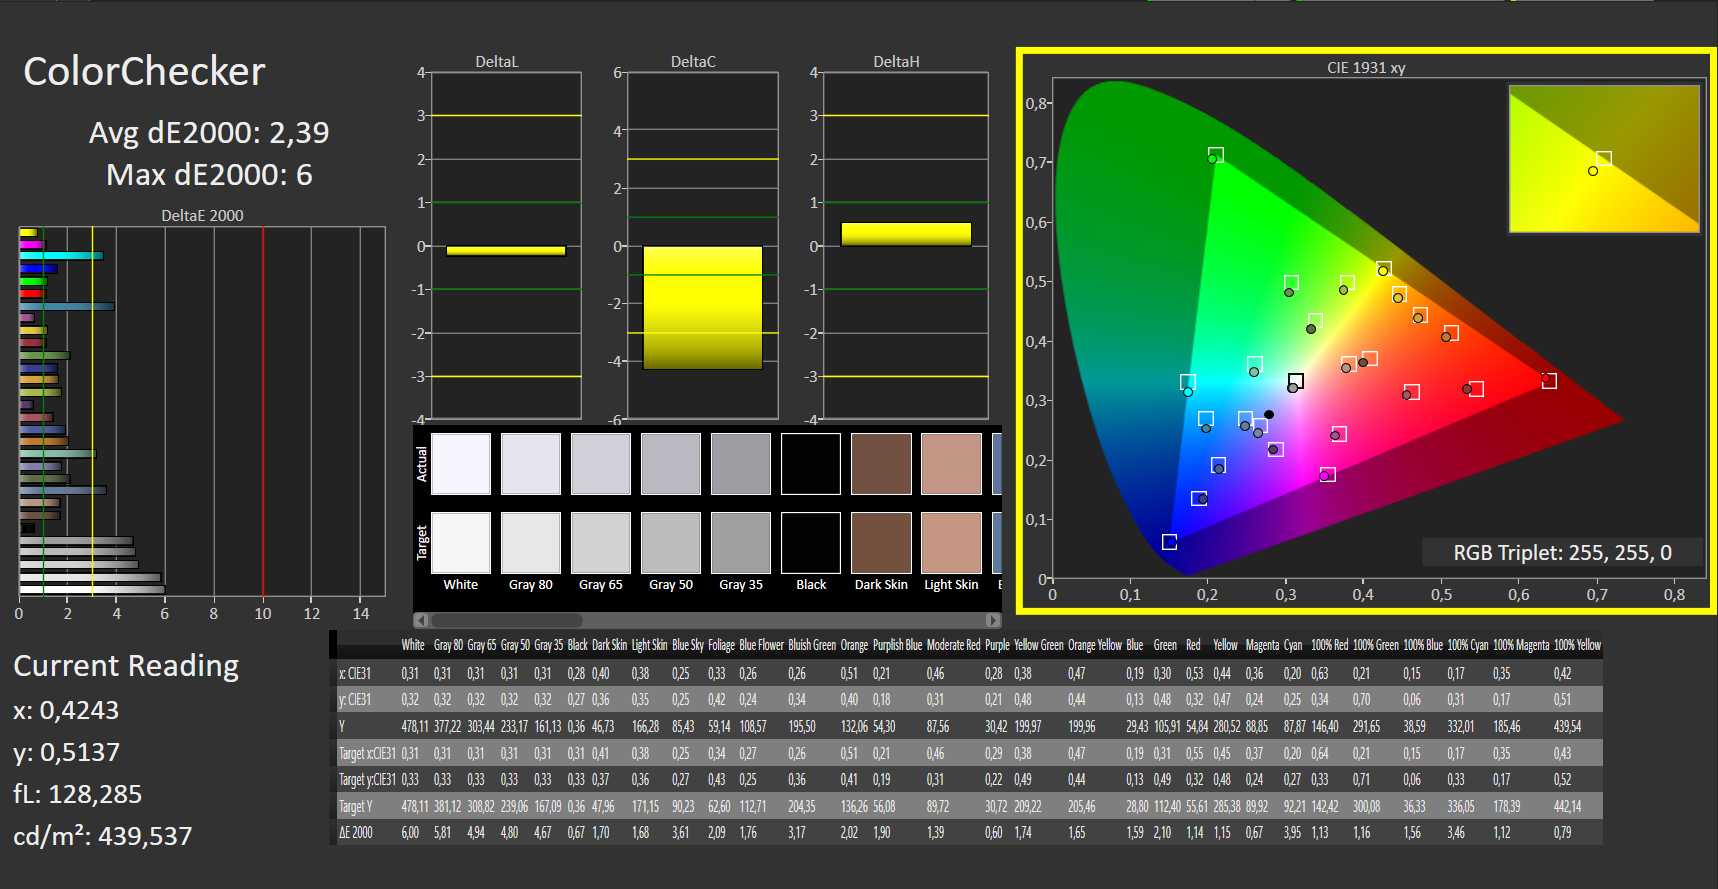
ΔE ColorChecker Calman: 2.39 | ∀{0.5-29.43 Ø4.77}
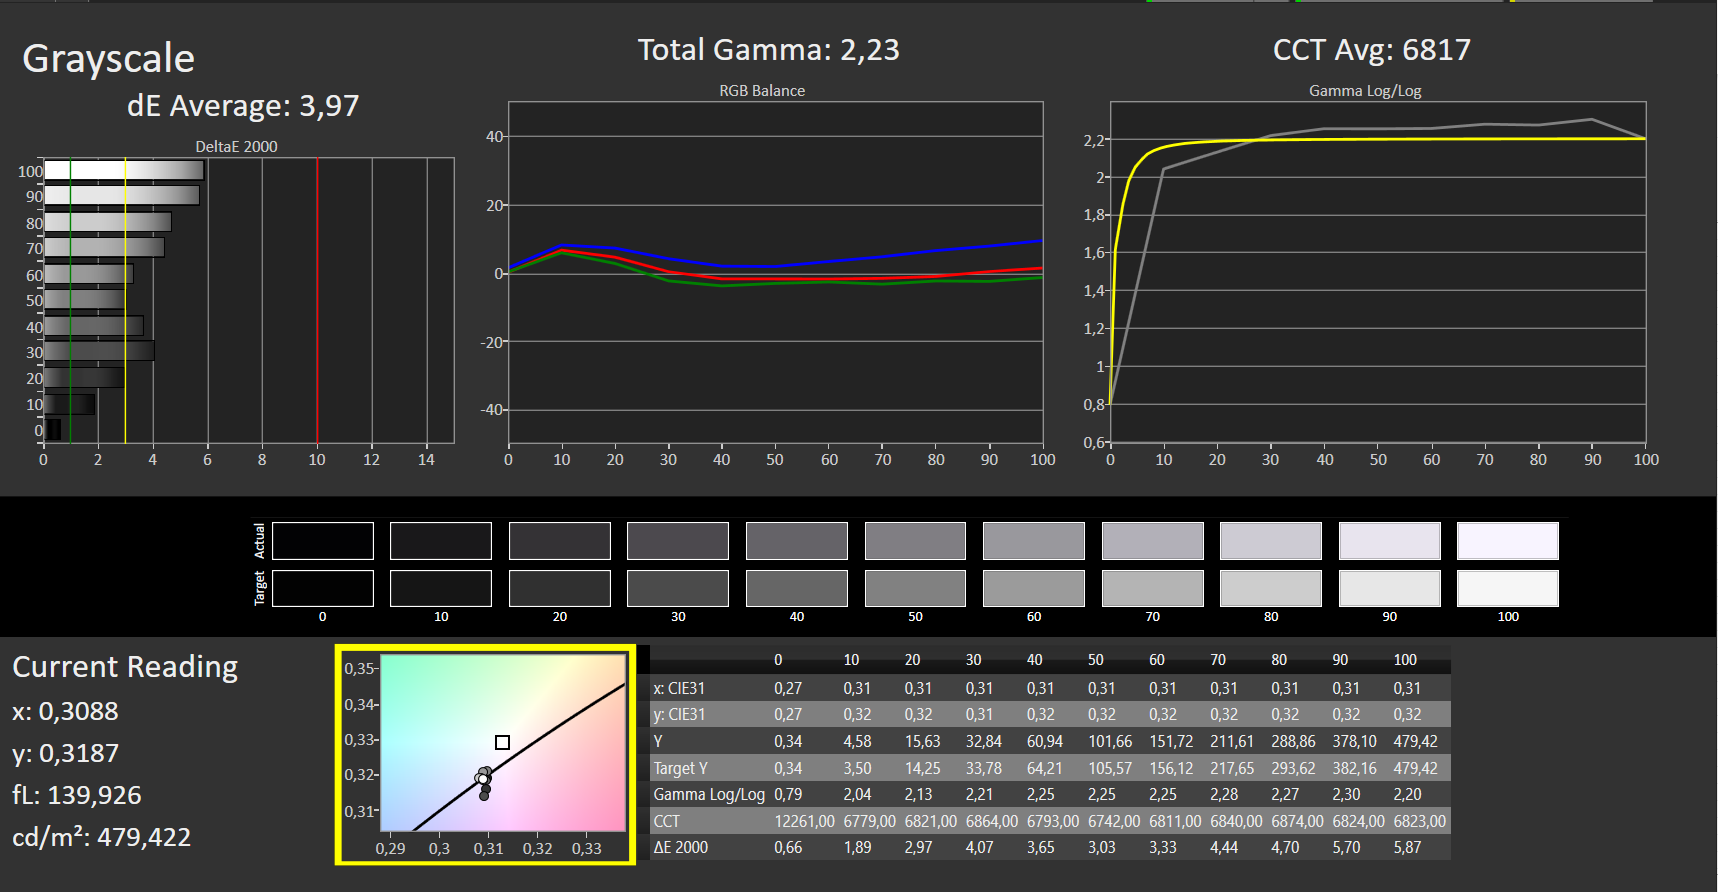
ΔE Greyscale Calman: 3.97 | ∀{0.09-98 Ø5}
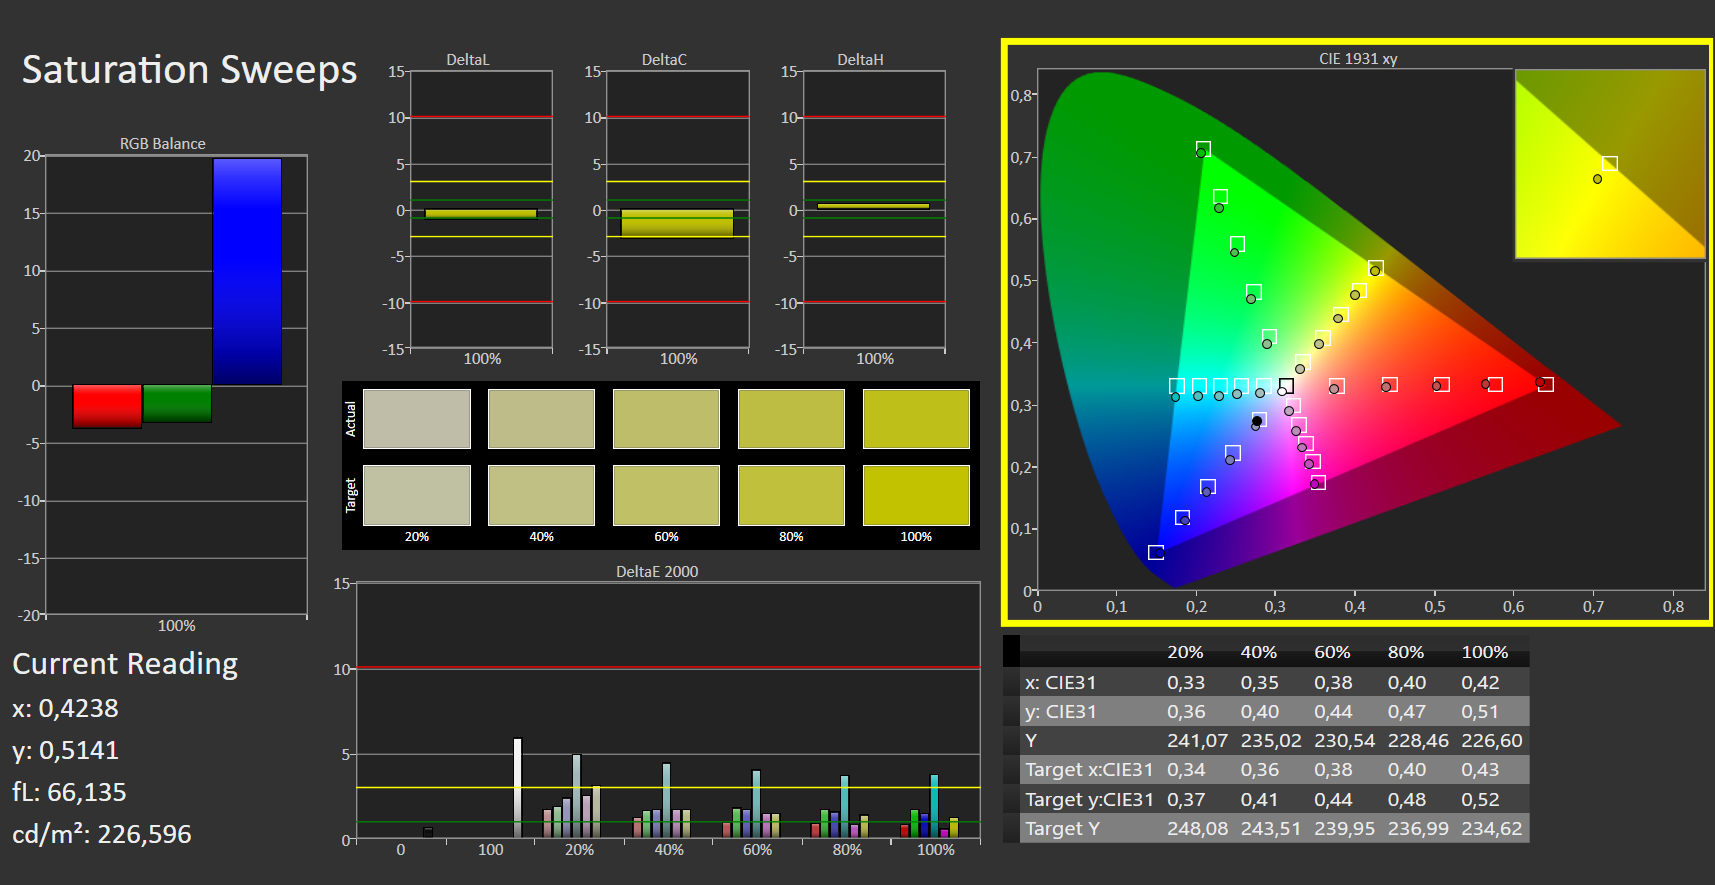
100% sRGB (Argyll 1.6.3 3D)
75% AdobeRGB 1998 (Argyll 1.6.3 3D)
84.9% AdobeRGB 1998 (Argyll 3D)
99.7% sRGB (Argyll 3D)
85.4% Display P3 (Argyll 3D)
Gamma: 2.23
CCT: 6817 K
| MSI Creator 15 Sharp SHP14A1, IPS, 3840x2160, 15.6" | MSI P65 Creator 9SF-657 AU Optronics AUO41EB, IPS, 3840x2160, 15.6" | Gigabyte Aero 15 OLED XB-8DE51B0SP Samsung SDCA029, OLED, 3840x2160, 15.6" | Razer Blade 15 RTX 2070 Super Max-Q AU Optronics B156HAN12.0, IPS, 1920x1080, 15.6" | Asus Zephyrus S15 GX502L B156HAN12.0 (AUOBC8C), IPS, 1920x1080, 15.6" | |
|---|---|---|---|---|---|
| Display | 5% | 11% | -12% | -11% | |
| Display P3 Coverage (%) | 85.4 | 84.4 -1% | 99.9 17% | 69.4 -19% | 69.7 -18% |
| sRGB Coverage (%) | 99.7 | 100 0% | 100 0% | 98.8 -1% | 99.7 0% |
| AdobeRGB 1998 Coverage (%) | 84.9 | 98.5 16% | 98.2 16% | 70.5 -17% | 71.1 -16% |
| Response Times | 24% | 96% | 89% | 78% | |
| Response Time Grey 50% / Grey 80% * (ms) | 62 ? | 51 ? 18% | 2.2 ? 96% | 3.2 ? 95% | 14 ? 77% |
| Response Time Black / White * (ms) | 44 ? | 31 ? 30% | 1.8 ? 96% | 8 ? 82% | 9.6 ? 78% |
| PWM Frequency (Hz) | 25000 ? | 60 ? | |||
| Screen | -20% | 13% | -12% | -4% | |
| Brightness middle (cd/m²) | 464 | 445 -4% | 385 -17% | 345.4 -26% | 283 -39% |
| Brightness (cd/m²) | 446 | 462 4% | 390 -13% | 342 -23% | 289 -35% |
| Brightness Distribution (%) | 85 | 83 -2% | 93 9% | 90 6% | 90 6% |
| Black Level * (cd/m²) | 0.35 | 0.5 -43% | 0.34 3% | 0.24 31% | |
| Contrast (:1) | 1326 | 890 -33% | 1016 -23% | 1179 -11% | |
| Colorchecker dE 2000 * | 2.39 | 4.75 -99% | 2.46 -3% | 3.18 -33% | 2.26 5% |
| Colorchecker dE 2000 max. * | 6 | 7.79 -30% | 4.01 33% | 6.57 -10% | 5.64 6% |
| Greyscale dE 2000 * | 3.97 | 4.49 -13% | 1.39 65% | 3.8 4% | 3.4 14% |
| Gamma | 2.23 99% | 2.49 88% | 2.31 95% | 2.15 102% | 2.228 99% |
| CCT | 6817 95% | 7374 88% | 6395 102% | 7109 91% | 7249 90% |
| Color Space (Percent of AdobeRGB 1998) (%) | 75 | 87 16% | 98 31% | 64.3 -14% | 71 -5% |
| Color Space (Percent of sRGB) (%) | 100 | 100 0% | 100 0% | 99 -1% | 93 -7% |
| Colorchecker dE 2000 calibrated * | 2.6 | 1.77 | 1.11 | ||
| Total Average (Program / Settings) | 3% /
-9% | 40% /
25% | 22% /
2% | 21% /
6% |
* ... smaller is better
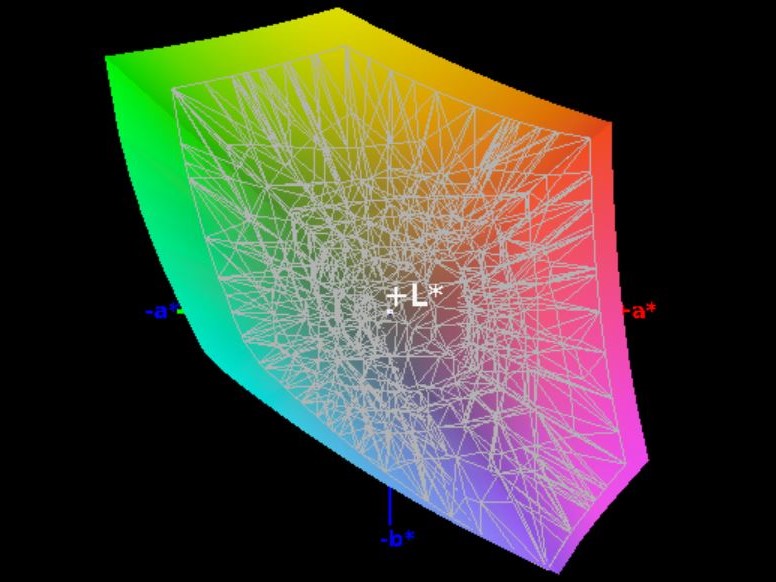
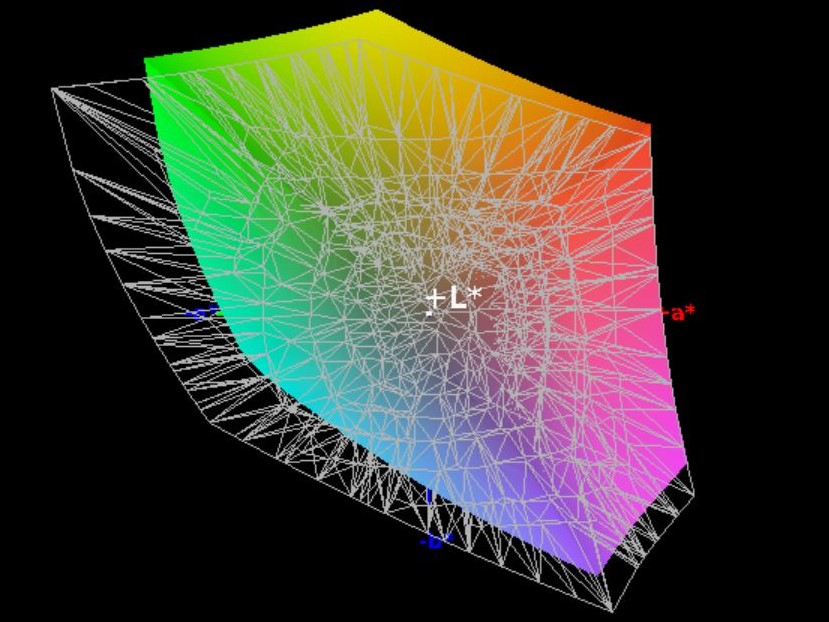
The MSI notebook offers a good contrast ratio of 1326:1 and an only slightly elevated black value of 0.35 cd/m². Combined with the good color space coverage of 100 percent (sRGB) and 75 percent (AdobeRGB) this creates vivid and clear screen content. Black screen content only has a minimal gray cast.
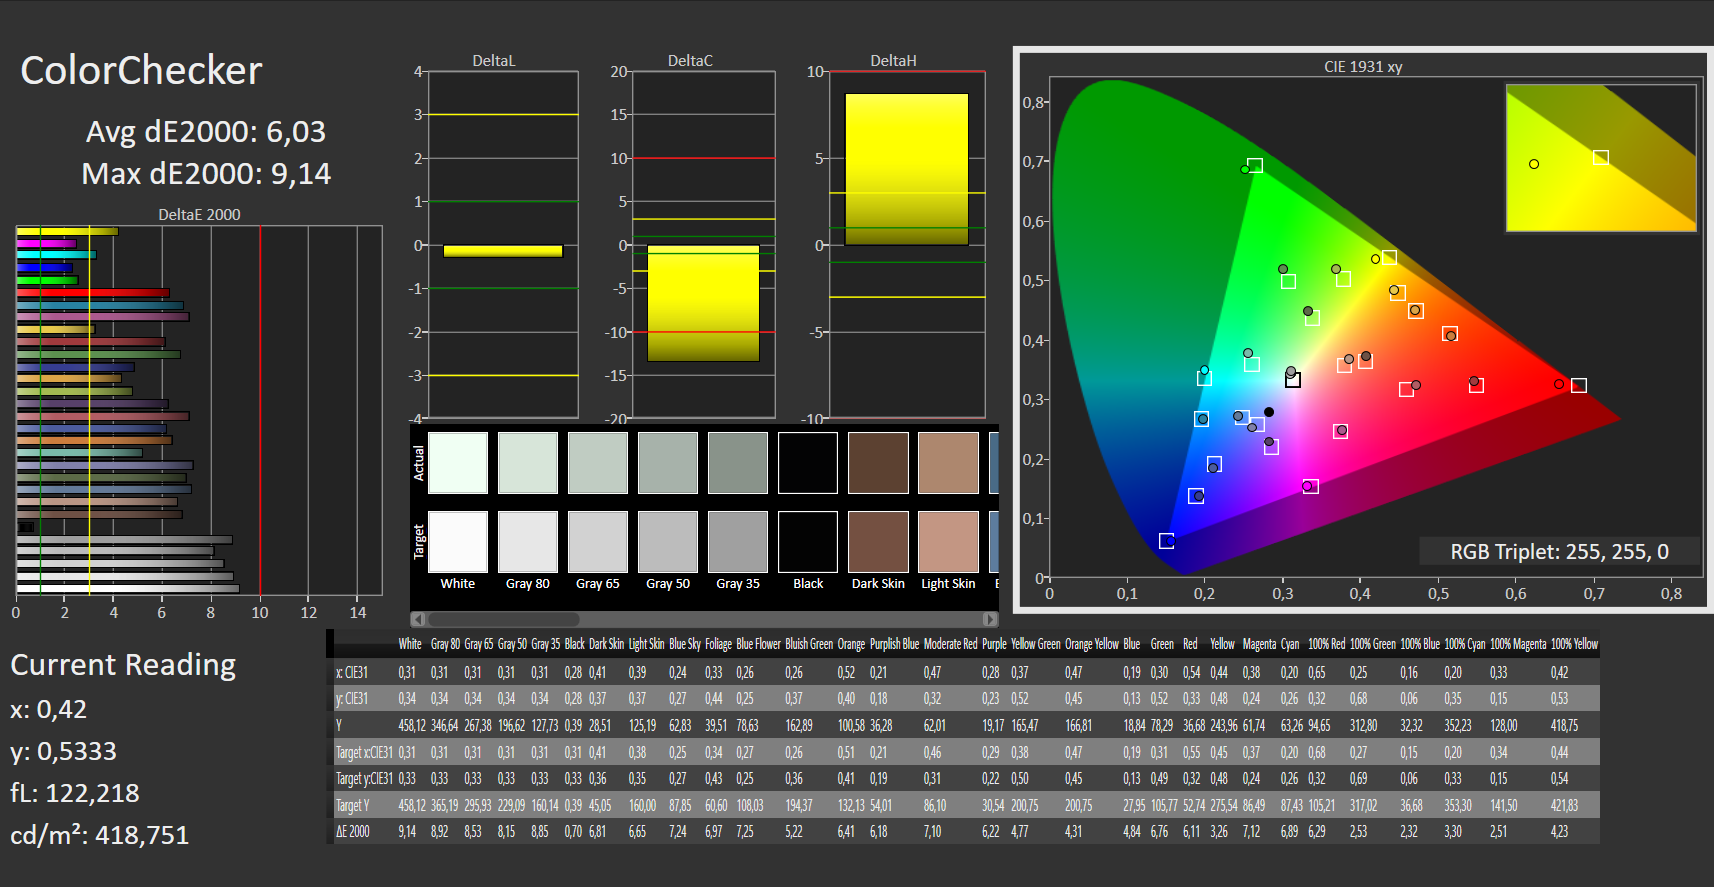
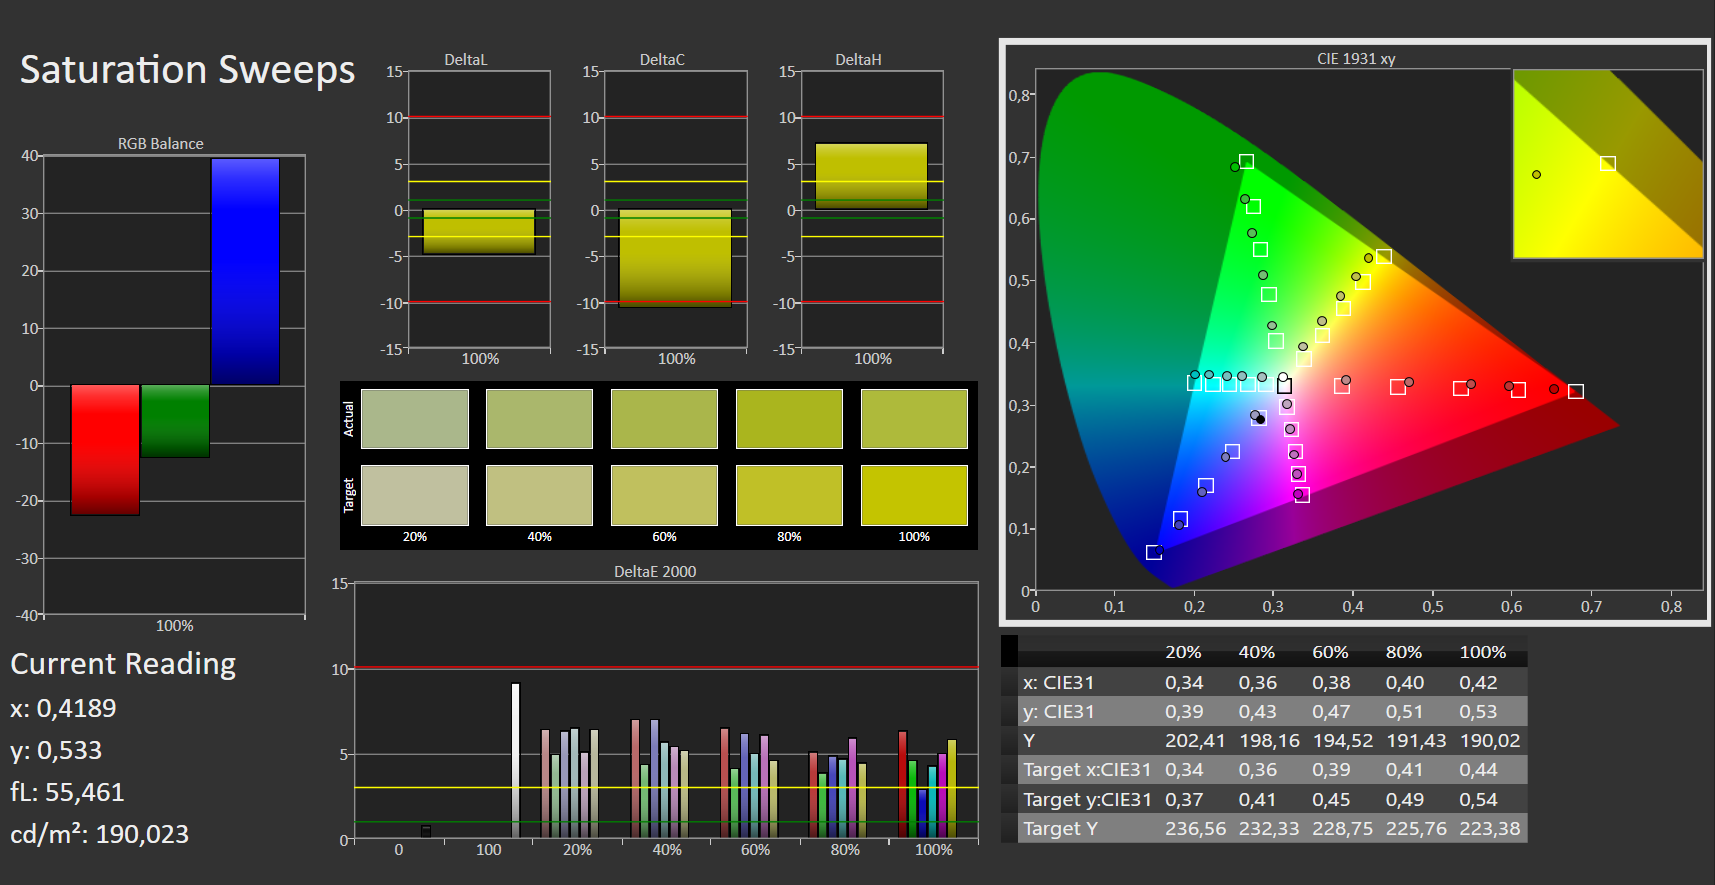
The preinstalled MSI Creator Center enables users to adjust the color display of the screen themselves. The standard settings show a slightly elevated proportion of blue and a DeltaE 2000 deviation of 2.39. The color profile P3, on the other hand, increases the green content and leads to a DeltaE 2000 deviation of 6.03.
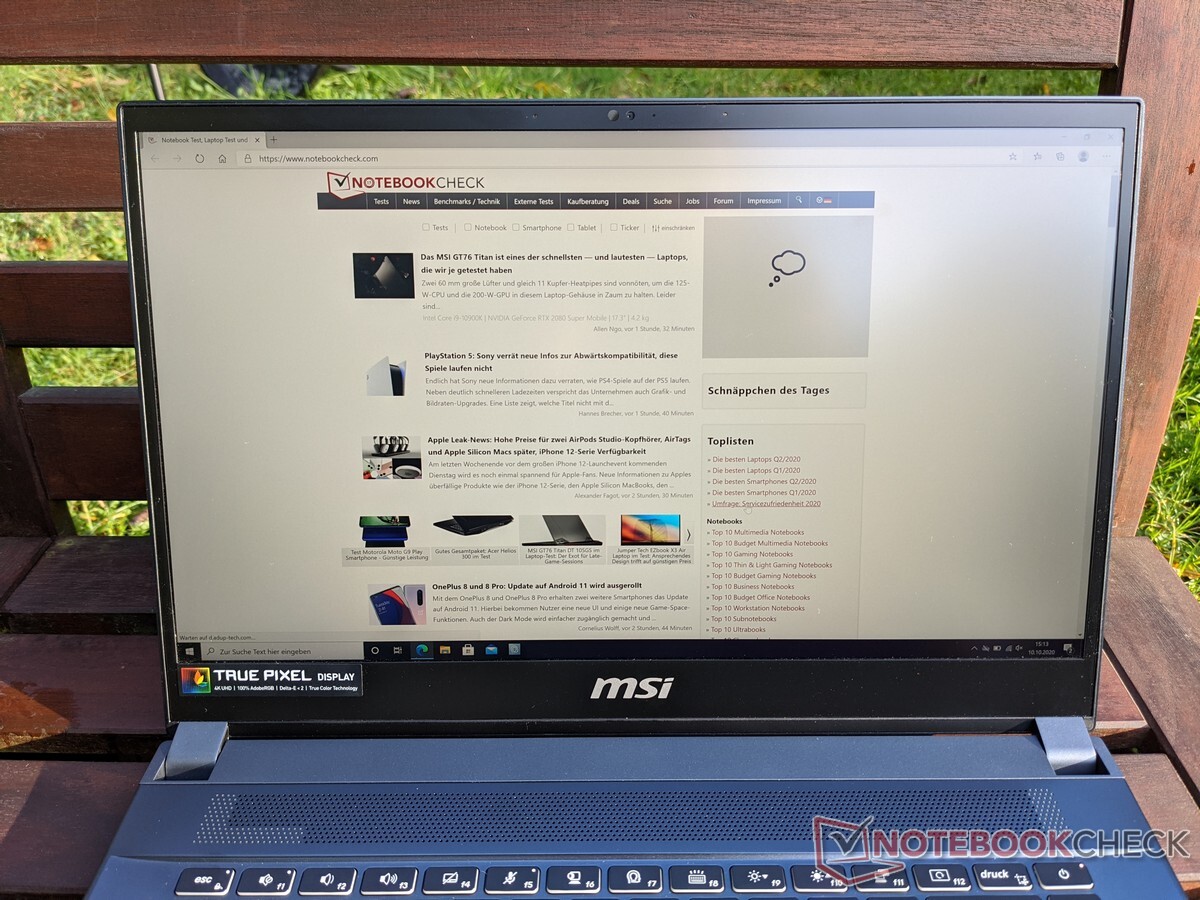
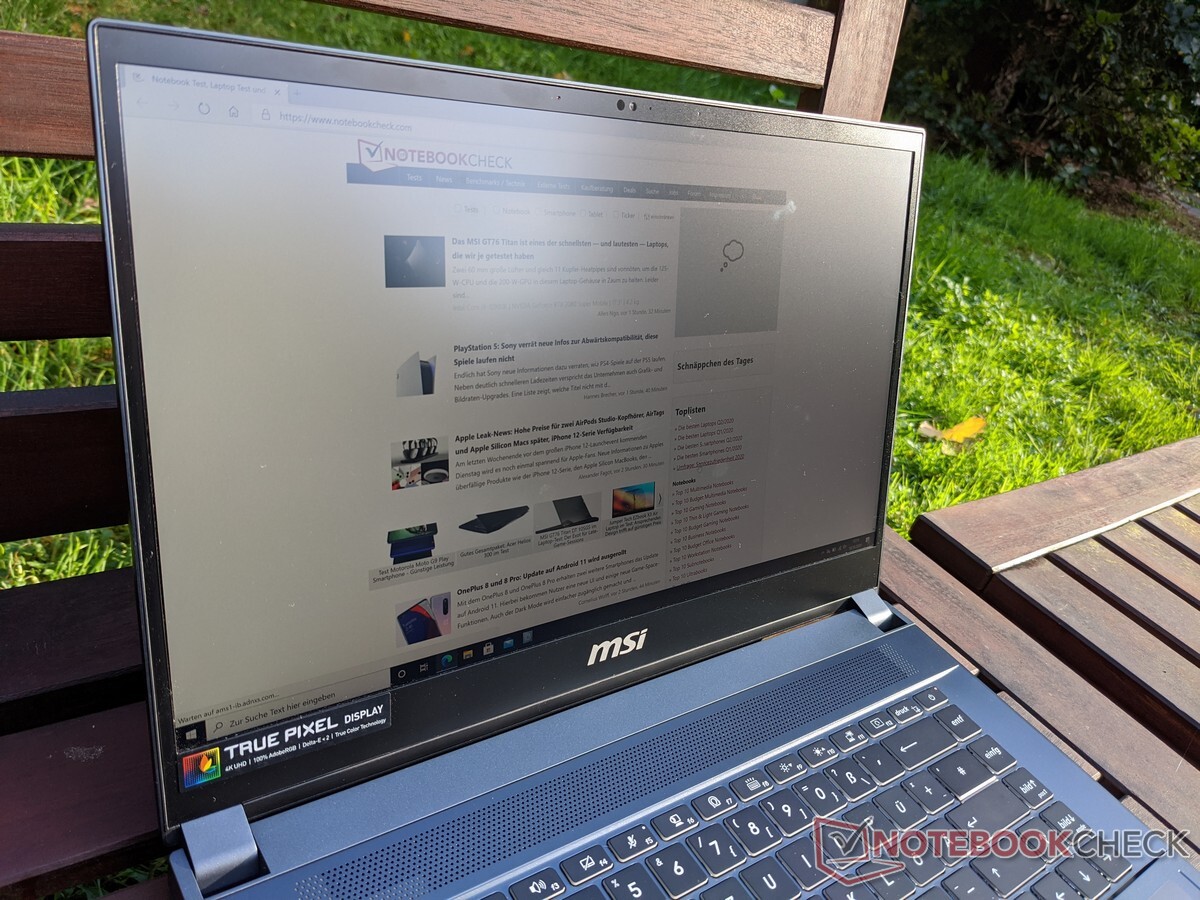
The good brightness value and matte display surface make the MSI Creator 15 suitable for use outdoors.
Display Response Times
| ↔ Response Time Black to White | ||
|---|---|---|
| 44 ms ... rise ↗ and fall ↘ combined | ↗ 26 ms rise | 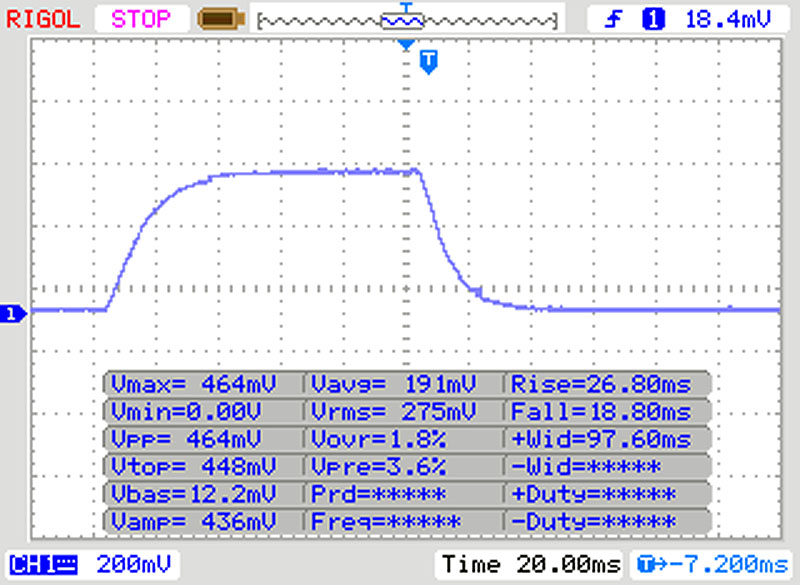 |
| ↘ 18 ms fall | ||
| The screen shows slow response rates in our tests and will be unsatisfactory for gamers. In comparison, all tested devices range from 0.1 (minimum) to 240 (maximum) ms. » 98 % of all devices are better. This means that the measured response time is worse than the average of all tested devices (20.1 ms). | ||
| ↔ Response Time 50% Grey to 80% Grey | ||
| 62 ms ... rise ↗ and fall ↘ combined | ↗ 32 ms rise | 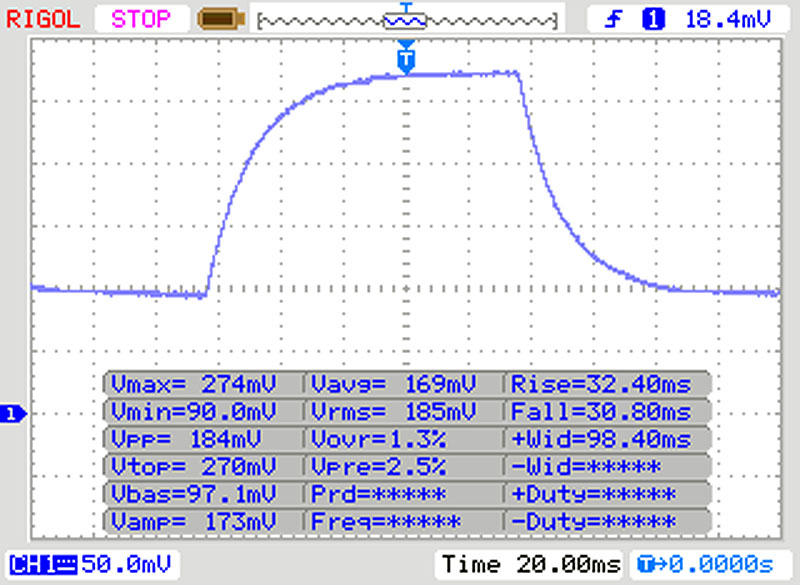 |
| ↘ 30 ms fall | ||
| The screen shows slow response rates in our tests and will be unsatisfactory for gamers. In comparison, all tested devices range from 0.165 (minimum) to 636 (maximum) ms. » 97 % of all devices are better. This means that the measured response time is worse than the average of all tested devices (31.5 ms). | ||
Screen Flickering / PWM (Pulse-Width Modulation)
| Screen flickering / PWM detected | 25000 Hz | ≤ 20 % brightness setting | 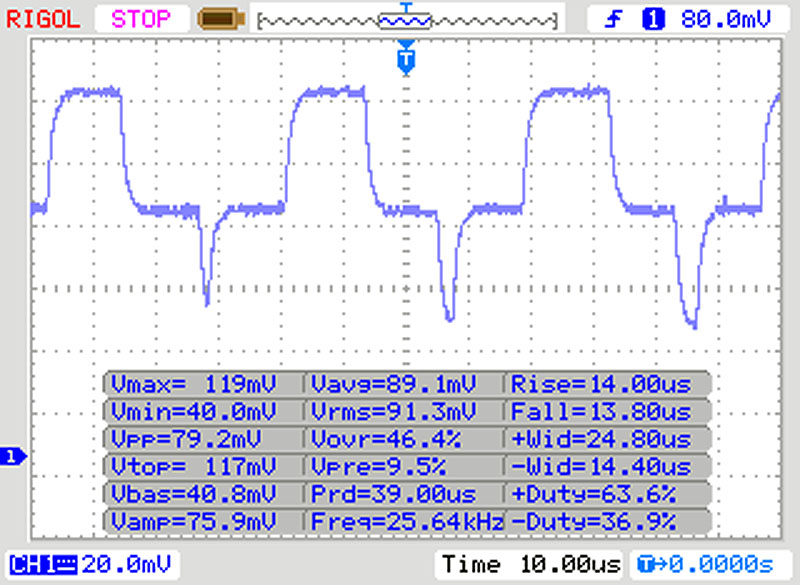 |
The display backlight flickers at 25000 Hz (worst case, e.g., utilizing PWM) Flickering detected at a brightness setting of 20 % and below. There should be no flickering or PWM above this brightness setting. The frequency of 25000 Hz is quite high, so most users sensitive to PWM should not notice any flickering. In comparison: 53 % of all tested devices do not use PWM to dim the display. If PWM was detected, an average of 8042 (minimum: 5 - maximum: 343500) Hz was measured. | |||
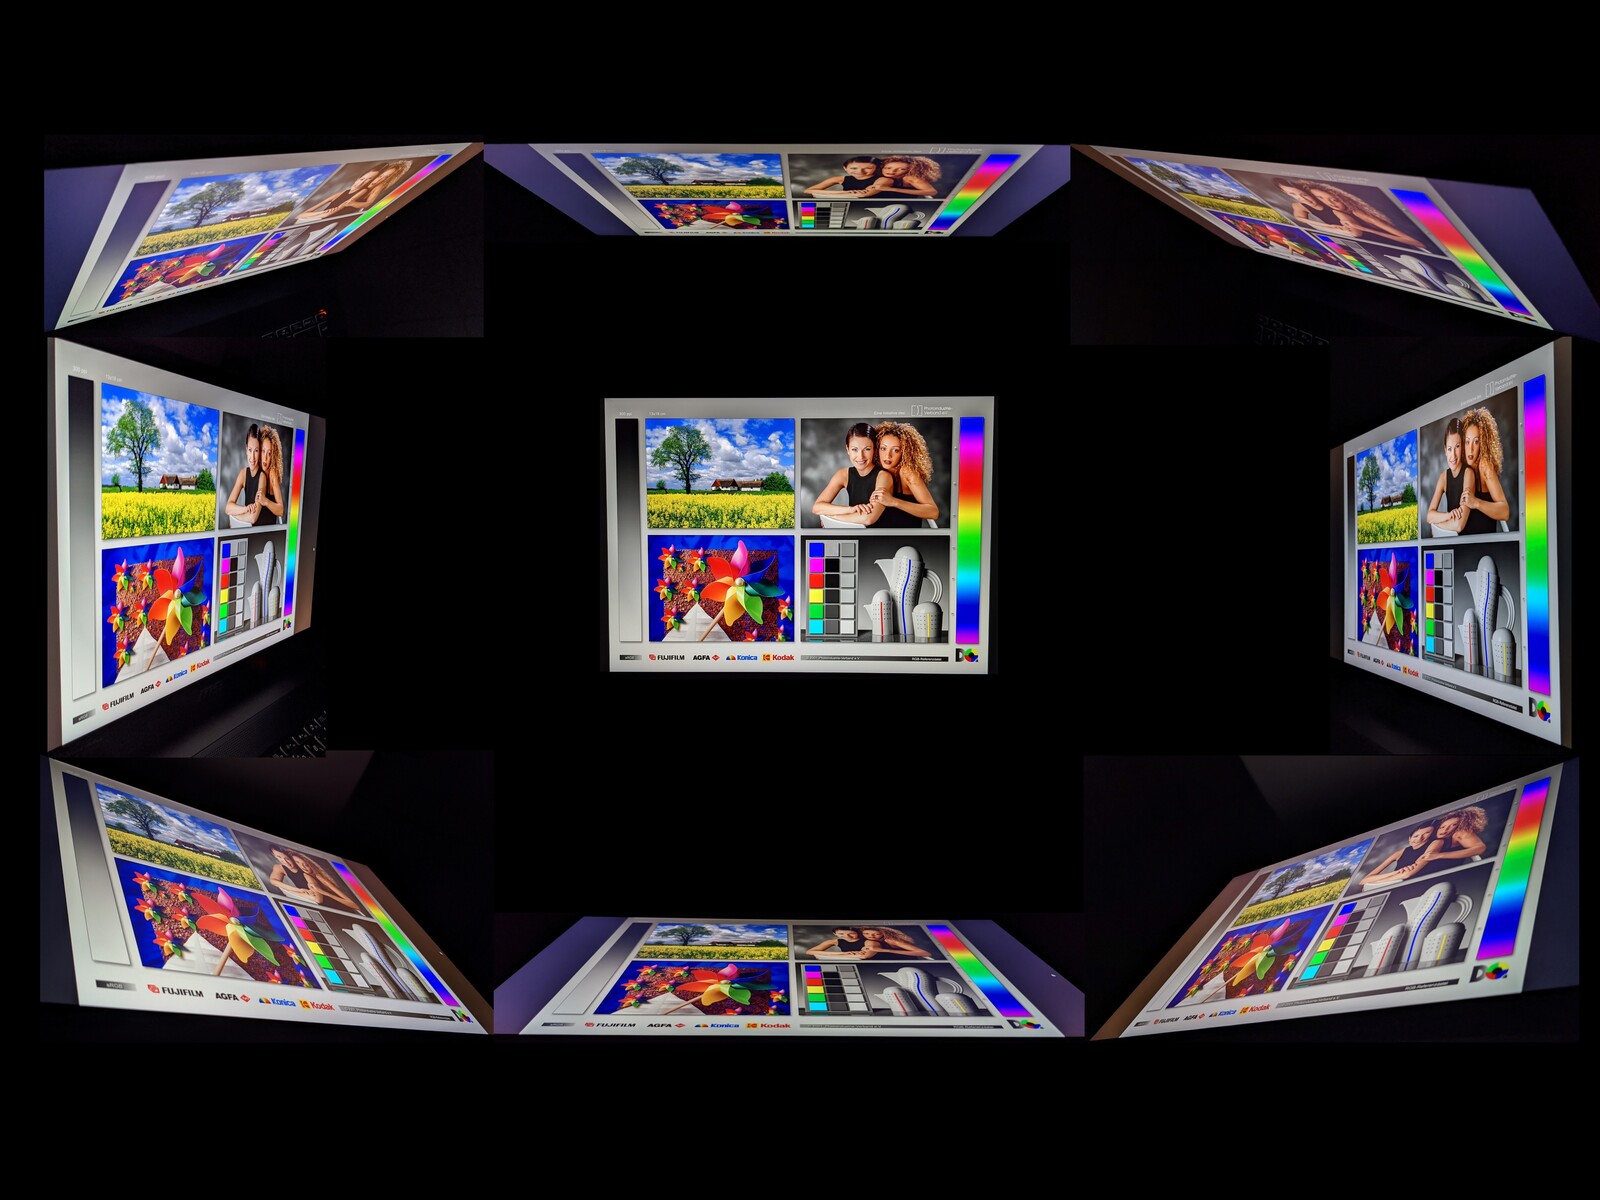
The IPS panel of the Creator 15 has very stable viewing angles and displays content correctly from almost every angle.
Performance - better performance with Comet Lake
MSI has directed its Creator 15 at users who are looking for a performative laptop for demanding applications. Performance largely depends on the selected hardware, which puts our test configuration in a promising position.
The following benchmarks were completed in the performance mode "high performance".
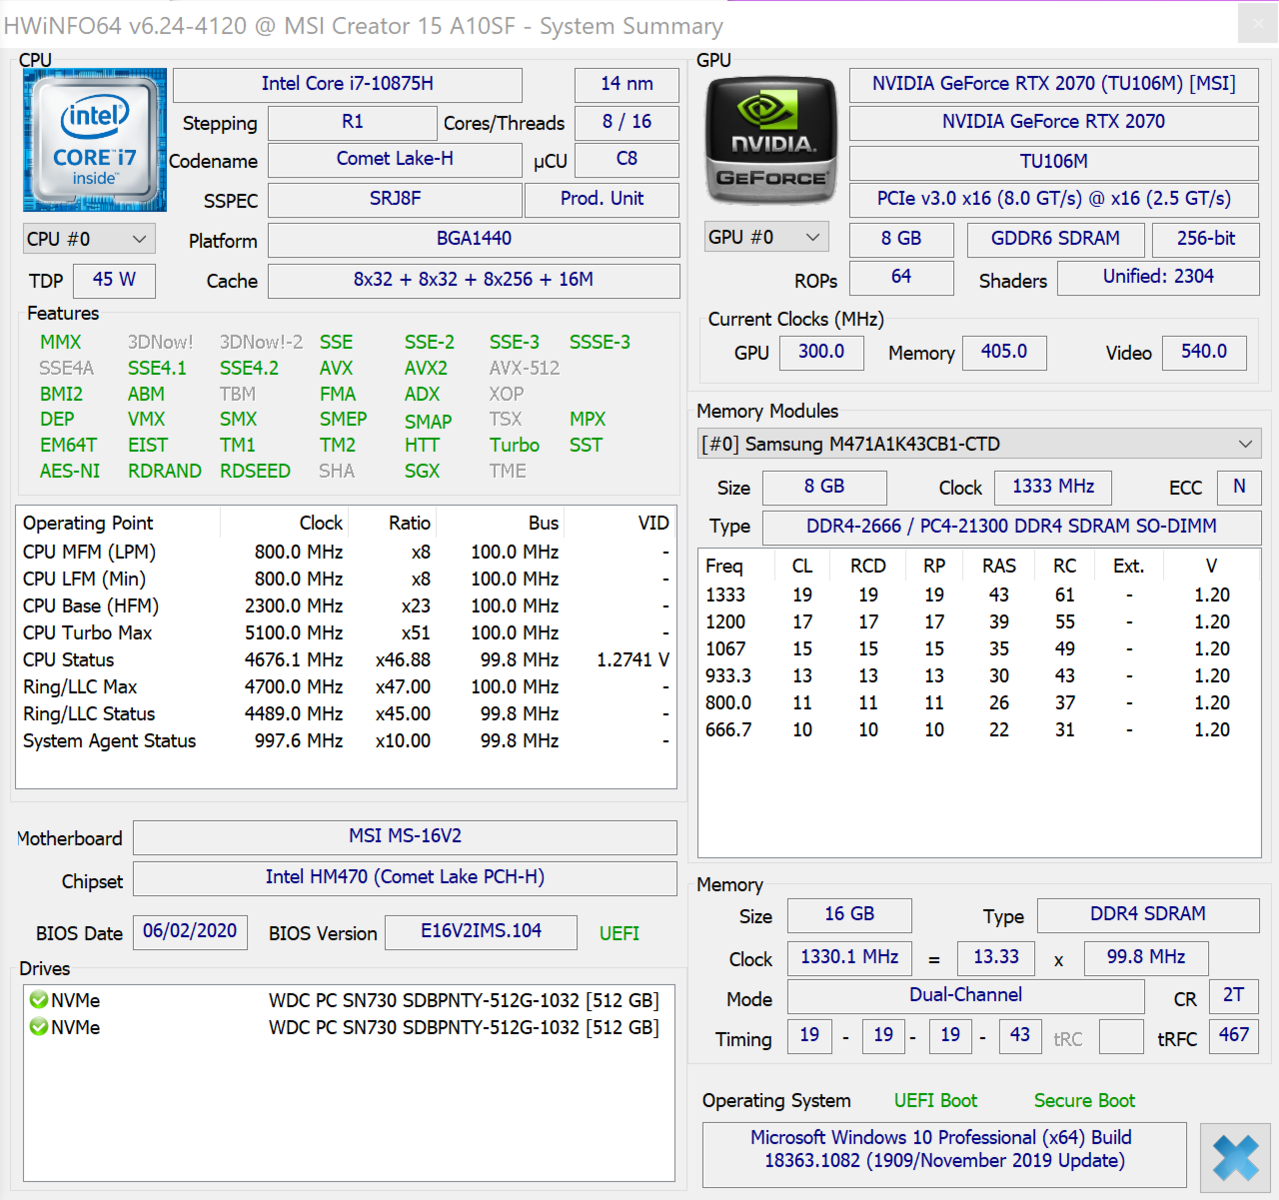
Processor
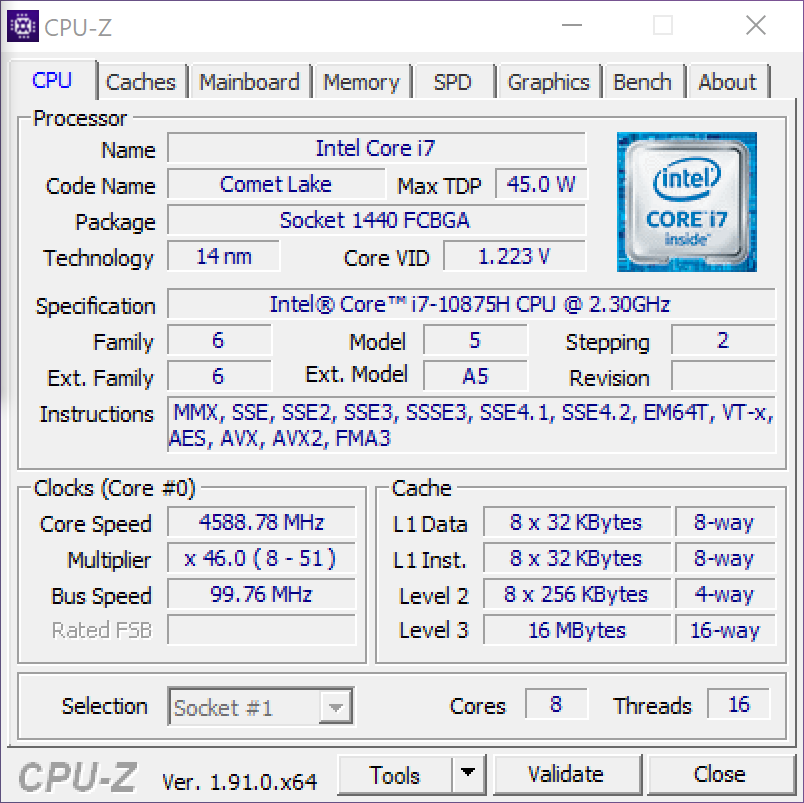
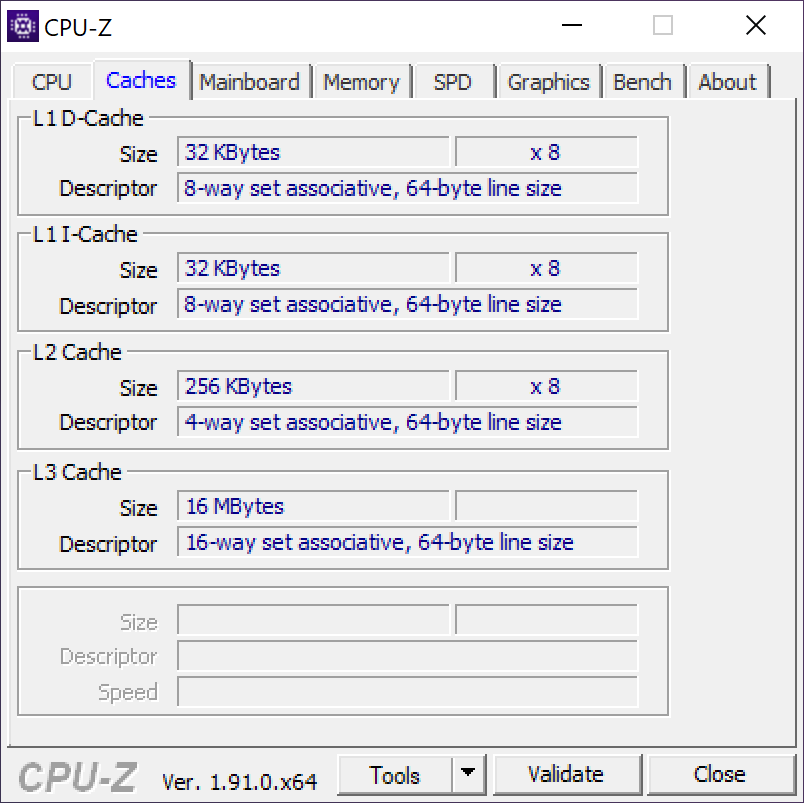
MSI has equipped its Creator 15 with an Intel processor of the 10th generation. The octa-core Intel Core i7-10875H can work up to 16 threads simultaneously and clocks at between 2.3 and 5.1 GHz. The cooling system plays a major role in defining how long these high clock rates can be kept up. Our CineBench R15 long duration test shows that the performance of the MSI notebook does drop by about 10 percent under continuous load, but that the notebook's average performance is still better than that of other notebooks that are equipped with this CPU. The individual benchmarks' results are average.
Cinebench R15: CPU Single 64Bit | CPU Multi 64Bit
Blender: v2.79 BMW27 CPU
7-Zip 18.03: 7z b 4 -mmt1 | 7z b 4
Geekbench 5.5: Single-Core | Multi-Core
HWBOT x265 Benchmark v2.2: 4k Preset
LibreOffice : 20 Documents To PDF
R Benchmark 2.5: Overall mean
| Cinebench R20 / CPU (Single Core) | |
| Average of class Multimedia (420 - 853, n=61, last 2 years) | |
| Gigabyte Aero 15 OLED XB-8DE51B0SP | |
| Razer Blade 15 RTX 2070 Super Max-Q | |
| Average Intel Core i7-10875H (430 - 524, n=32) | |
| MSI Creator 15 | |
| MSI Creator 15 | |
| Asus Zephyrus S15 GX502L | |
| Cinebench R20 / CPU (Multi Core) | |
| Average of class Multimedia (1887 - 12912, n=61, last 2 years) | |
| MSI Creator 15 | |
| MSI Creator 15 | |
| Asus Zephyrus S15 GX502L | |
| Gigabyte Aero 15 OLED XB-8DE51B0SP | |
| Average Intel Core i7-10875H (1986 - 4176, n=32) | |
| Razer Blade 15 RTX 2070 Super Max-Q | |
| Cinebench R15 / CPU Single 64Bit | |
| Average of class Multimedia (99.6 - 326, n=64, last 2 years) | |
| Gigabyte Aero 15 OLED XB-8DE51B0SP | |
| Average Intel Core i7-10875H (190 - 220, n=37) | |
| Razer Blade 15 RTX 2070 Super Max-Q | |
| MSI Creator 15 | |
| MSI P65 Creator 9SF-657 | |
| Asus Zephyrus S15 GX502L | |
| Cinebench R15 / CPU Multi 64Bit | |
| Average of class Multimedia (856 - 5224, n=67, last 2 years) | |
| Gigabyte Aero 15 OLED XB-8DE51B0SP | |
| MSI Creator 15 | |
| Asus Zephyrus S15 GX502L | |
| Average Intel Core i7-10875H (1003 - 1833, n=38) | |
| MSI P65 Creator 9SF-657 | |
| Razer Blade 15 RTX 2070 Super Max-Q | |
| Blender / v2.79 BMW27 CPU | |
| MSI Creator 15 | |
| MSI Creator 15 | |
| Razer Blade 15 RTX 2070 Super Max-Q | |
| Average Intel Core i7-10875H (259 - 535, n=30) | |
| Gigabyte Aero 15 OLED XB-8DE51B0SP | |
| Asus Zephyrus S15 GX502L | |
| Average of class Multimedia (100 - 557, n=62, last 2 years) | |
| 7-Zip 18.03 / 7z b 4 -mmt1 | |
| Average of class Multimedia (3666 - 7545, n=60, last 2 years) | |
| Gigabyte Aero 15 OLED XB-8DE51B0SP | |
| Average Intel Core i7-10875H (5071 - 5780, n=31) | |
| Razer Blade 15 RTX 2070 Super Max-Q | |
| MSI Creator 15 | |
| MSI Creator 15 | |
| Asus Zephyrus S15 GX502L | |
| 7-Zip 18.03 / 7z b 4 | |
| Average of class Multimedia (29095 - 130368, n=60, last 2 years) | |
| Asus Zephyrus S15 GX502L | |
| MSI Creator 15 | |
| MSI Creator 15 | |
| Gigabyte Aero 15 OLED XB-8DE51B0SP | |
| Average Intel Core i7-10875H (29844 - 49562, n=31) | |
| Razer Blade 15 RTX 2070 Super Max-Q | |
| Geekbench 5.5 / Single-Core | |
| Average of class Multimedia (805 - 2974, n=61, last 2 years) | |
| Gigabyte Aero 15 OLED XB-8DE51B0SP | |
| Average Intel Core i7-10875H (1233 - 1371, n=29) | |
| Razer Blade 15 RTX 2070 Super Max-Q | |
| MSI Creator 15 | |
| Asus Zephyrus S15 GX502L | |
| Geekbench 5.5 / Multi-Core | |
| Average of class Multimedia (4652 - 20422, n=61, last 2 years) | |
| Gigabyte Aero 15 OLED XB-8DE51B0SP | |
| MSI Creator 15 | |
| Average Intel Core i7-10875H (5715 - 8620, n=29) | |
| Asus Zephyrus S15 GX502L | |
| Razer Blade 15 RTX 2070 Super Max-Q | |
| HWBOT x265 Benchmark v2.2 / 4k Preset | |
| Average of class Multimedia (5.26 - 36.1, n=60, last 2 years) | |
| Asus Zephyrus S15 GX502L | |
| Gigabyte Aero 15 OLED XB-8DE51B0SP | |
| Average Intel Core i7-10875H (7.27 - 14.1, n=27) | |
| Razer Blade 15 RTX 2070 Super Max-Q | |
| LibreOffice / 20 Documents To PDF | |
| Gigabyte Aero 15 OLED XB-8DE51B0SP | |
| MSI Creator 15 | |
| MSI Creator 15 | |
| Average Intel Core i7-10875H (30.2 - 84.3, n=30) | |
| Average of class Multimedia (23.9 - 146.7, n=61, last 2 years) | |
| Asus Zephyrus S15 GX502L | |
| Razer Blade 15 RTX 2070 Super Max-Q | |
| R Benchmark 2.5 / Overall mean | |
| MSI Creator 15 | |
| MSI Creator 15 | |
| Asus Zephyrus S15 GX502L | |
| Razer Blade 15 RTX 2070 Super Max-Q | |
| Average Intel Core i7-10875H (0.546 - 0.662, n=29) | |
| Gigabyte Aero 15 OLED XB-8DE51B0SP | |
| Average of class Multimedia (0.3604 - 0.947, n=60, last 2 years) | |
* ... smaller is better
System Performance
The results of the PCMark 10 system performance benchmark confirm our expectations of the MSI Creator 15. The results are slightly above average compared to the other notebooks tested with this hardware. The notebook runs smoothly at all times during everyday use without any micro freezes or similar issues. Programs start up smoothly and files and folders open quickly as well.
Find out what performance other notebooks can offer in our CPU benchmark list.
| PCMark 10 Score | 6514 points | |
Help | ||
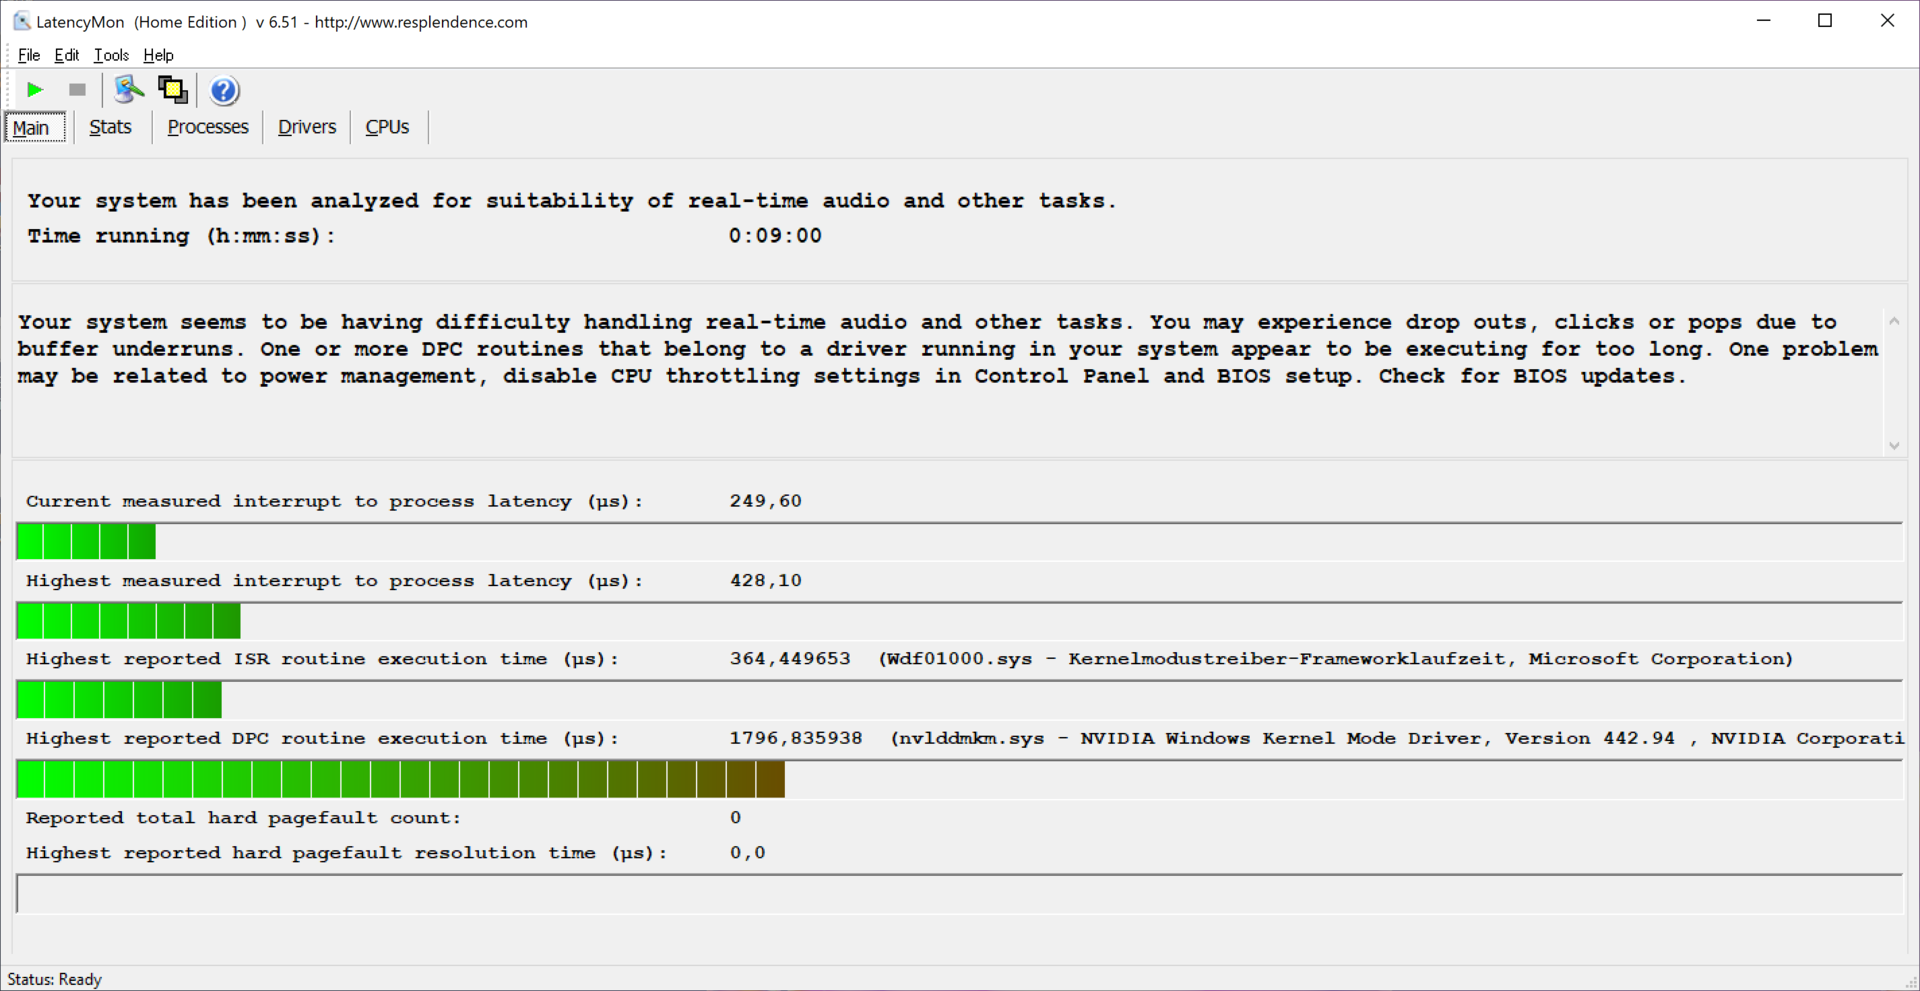
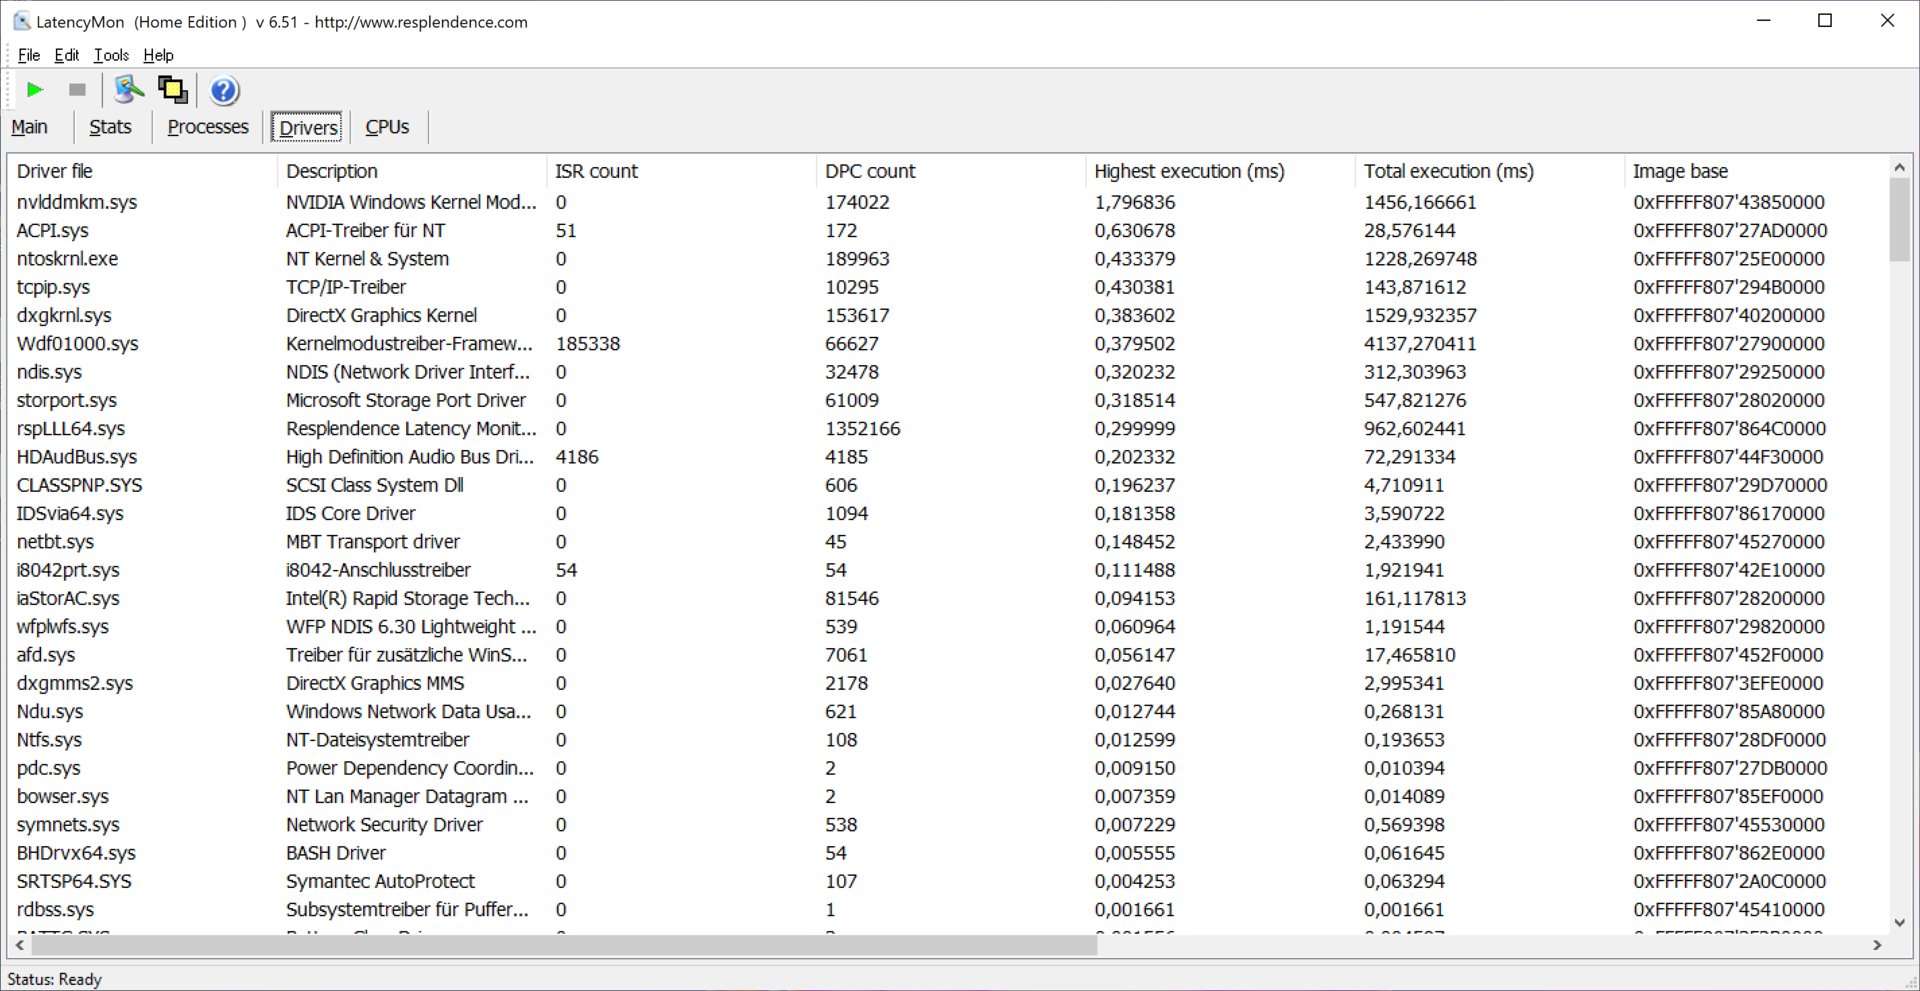
DPC latencies
Our LatencyMon test shows that the MSI Creator 15 does not have any increased latencies. Only the DPC routines can take a little longer to be completed. This means that the notebook is suitable for real-time applications.
| DPC Latencies / LatencyMon - interrupt to process latency (max), Web, Youtube, Prime95 | |
| Asus Zephyrus S15 GX502L | |
| Gigabyte Aero 15 OLED XB-8DE51B0SP | |
| Razer Blade 15 RTX 2070 Super Max-Q | |
| MSI Creator 15 | |
* ... smaller is better
Storage Devices
MSI has equipped our test unit with two 1-TB SSDs from Western Digital which are configured as RAID. They reach good reading and writing speeds that can compete with comparable storage devices. The Creator 15 is positioned in the center field in terms of storage performance compared to today's comparison devices.
Find out what performance to expect from other storage devices in our HDD / SSD benchmark list.
| MSI Creator 15 2x WDC PC SN730 SDBPNTY-1T00 (RAID 0) | MSI P65 Creator 9SF-657 2x Samsung SSD PM981 MZVLB512HAJQ (RAID 0) | Gigabyte Aero 15 OLED XB-8DE51B0SP Intel Optane Memory H10 with Solid State Storage 32GB + 512GB HBRPEKNX0202A(L/H) | Razer Blade 15 RTX 2070 Super Max-Q Samsung SSD PM981a MZVLB512HBJQ | Asus Zephyrus S15 GX502L WDC PC SN730 SDBPNTY-1T00 | Average 2x WDC PC SN730 SDBPNTY-1T00 (RAID 0) | |
|---|---|---|---|---|---|---|
| CrystalDiskMark 5.2 / 6 | 10% | 4% | 2% | -8% | 10% | |
| Write 4K (MB/s) | 134.4 | 105.6 -21% | 127.4 -5% | 139.8 4% | 127.4 -5% | 136.7 ? 2% |
| Read 4K (MB/s) | 45.7 | 46.32 1% | 147.5 223% | 48.62 6% | 46.38 1% | 47.2 ? 3% |
| Write Seq (MB/s) | 2480 | 2910 17% | 485.9 -80% | 2260 -9% | 2034 -18% | 2841 ? 15% |
| Read Seq (MB/s) | 2583 | 2820 9% | 1352 -48% | 2135 -17% | 2172 -16% | 2626 ? 2% |
| Write 4K Q32T1 (MB/s) | 351.8 | 545 55% | 476.5 35% | 499.3 42% | 413.7 18% | 404 ? 15% |
| Read 4K Q32T1 (MB/s) | 526 | 632 20% | 531 1% | 552 5% | 354 -33% | 513 ? -2% |
| Write Seq Q32T1 (MB/s) | 3227 | 3349 4% | 1061 -67% | 2960 -8% | 3063 -5% | 3640 ? 13% |
| Read Seq Q32T1 (MB/s) | 3491 | 3333 -5% | 2552 -27% | 3269 -6% | 3396 -3% | 4598 ? 32% |
| AS SSD | 2% | -35% | -13% | 12% | -5% | |
| Seq Read (MB/s) | 3015 | 2860 -5% | 1200 -60% | 1957 -35% | 2714 -10% | 3466 ? 15% |
| Seq Write (MB/s) | 2742 | 2604 -5% | 836 -70% | 2092 -24% | 928 -66% | 2556 ? -7% |
| 4K Read (MB/s) | 43.22 | 45.15 4% | 65.8 52% | 50.2 16% | 42.83 -1% | 42.7 ? -1% |
| 4K Write (MB/s) | 122.9 | 100.2 -18% | 103.8 -16% | 96.5 -21% | 120.5 -2% | 126.2 ? 3% |
| 4K-64 Read (MB/s) | 1420 | 1428 1% | 789 -44% | 1594 12% | 978 -31% | 1402 ? -1% |
| 4K-64 Write (MB/s) | 1113 | 1401 26% | 929 -17% | 2005 80% | 2797 151% | 1307 ? 17% |
| Access Time Read * (ms) | 0.056 | 0.049 12% | 0.103 -84% | 0.057 -2% | 0.057 -2% | 0.04533 ? 19% |
| Access Time Write * (ms) | 0.032 | 0.037 -16% | 0.045 -41% | 0.112 -250% | 0.032 -0% | 0.06933 ? -117% |
| Score Read (Points) | 1765 | 1759 0% | 975 -45% | 1840 4% | 1292 -27% | 1791 ? 1% |
| Score Write (Points) | 1510 | 1762 17% | 1117 -26% | 2310 53% | 3011 99% | 1689 ? 12% |
| Score Total (Points) | 4166 | 4411 6% | 2594 -38% | 5103 22% | 4881 17% | 4351 ? 4% |
| Copy ISO MB/s (MB/s) | 1793 | 2307 ? | ||||
| Copy Program MB/s (MB/s) | 573 | 875 ? | ||||
| Copy Game MB/s (MB/s) | 1418 | 1795 ? | ||||
| Total Average (Program / Settings) | 6% /
5% | -16% /
-19% | -6% /
-7% | 2% /
4% | 3% /
1% |
* ... smaller is better

Dauerleistung Lesen: DiskSpd Read Loop, Queue Depth 8
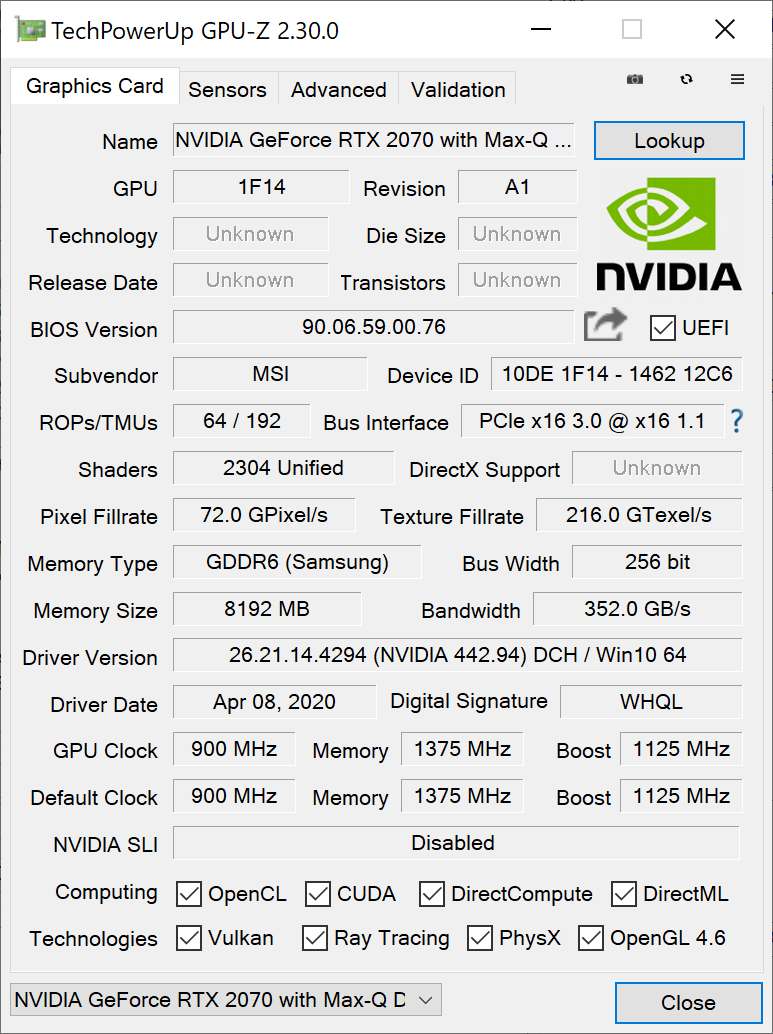
Graphics
MSI has a variety of Nvidia GPUs available for the Creator 15. They range from the GeForce GTX 1660 Ti Max-Q all the way to the RTX 2080 Super Max-Q. Our test unit is equipped with a Nvidia GeForce RTX 2070 Max-Q. According to the 3DMark benchmarks, its performance is slightly below average for notebooks equipped with this graphics card.
Find out what performance other GPUS have to offer in our GPU benchmark list.
| 3DMark 11 Performance | 20251 points | |
| 3DMark Cloud Gate Standard Score | 45260 points | |
| 3DMark Fire Strike Score | 15264 points | |
Help | ||
Gaming Performance
Nvidia's GeForce RTX 2070 Max-Q is very suitable for gaming. Even current games can be displayed at high graphics settings and 60 fps in FullHD resolution. In 4K or UHD resolution, the performance strongly depends on the individual game. For example, we were able to play Doom Eternal at 55 fps while Far Cry 5 only managed 33 fps.
Find out what performance to expect from our Nvidia GeForce RTX 2070 Max-Q with other titles in our GPU gaming list.
| The Witcher 3 - 1920x1080 Ultra Graphics & Postprocessing (HBAO+) | |
| MSI P65 Creator 9SF-657 | |
| Gigabyte Aero 15 OLED XB-8DE51B0SP | |
| Asus Zephyrus S15 GX502L | |
| Razer Blade 15 RTX 2070 Super Max-Q | |
| Average NVIDIA GeForce RTX 2070 Max-Q (56 - 83.8, n=31) | |
| MSI Creator 15 | |
| Average of class Multimedia (11 - 121, n=25, last 2 years) | |
| Final Fantasy XV Benchmark | |
| 3840x2160 High Quality | |
| Average of class Multimedia (8.98 - 83.4, n=4, last 2 years) | |
| MSI Creator 15 | |
| Average NVIDIA GeForce RTX 2070 Max-Q (23.3 - 27, n=2) | |
| 1920x1080 High Quality | |
| Razer Blade 15 RTX 2070 Super Max-Q | |
| Asus Zephyrus S15 GX502L | |
| MSI Creator 15 | |
| Average NVIDIA GeForce RTX 2070 Max-Q (55.1 - 62.9, n=3) | |
| Average of class Multimedia (7.61 - 144.4, n=64, last 2 years) | |
| Far Cry 5 | |
| 3840x2160 Ultra Preset AA:T | |
| Average of class Multimedia (54 - 59, n=2, last 2 years) | |
| Average NVIDIA GeForce RTX 2070 Max-Q (30 - 37, n=3) | |
| MSI Creator 15 | |
| 2560x1440 Ultra Preset AA:T | |
| Average of class Multimedia (32 - 109, n=11, last 2 years) | |
| MSI Creator 15 | |
| Average NVIDIA GeForce RTX 2070 Max-Q (60 - 68, n=3) | |
| 1920x1080 Ultra Preset AA:T | |
| Asus Zephyrus S15 GX502L | |
| Average NVIDIA GeForce RTX 2070 Max-Q (67 - 101, n=7) | |
| Average of class Multimedia (17 - 145, n=33, last 2 years) | |
Our continuous load test with The Witcher 3 showed that users can expect to have long gaming sessions without any limitations.
| low | med. | high | ultra | QHD | 4K | |
|---|---|---|---|---|---|---|
| The Witcher 3 (2015) | 56 | |||||
| Dota 2 Reborn (2015) | 153 | 136 | 132 | 123 | 94.8 | |
| Final Fantasy XV Benchmark (2018) | 61 | 27 | ||||
| Far Cry 5 (2018) | 66 | 33 | ||||
| Doom Eternal (2020) | 54.8 |
Emissions - From loud to silent
System Noise
The MSI Creator 15 can be used in various performance settings, each of which has an impact on system noise. The device remains silent in the quiet mode, which means that the notebook can be used in surroundings sensitive to noise. The high performance mode, on the other hand, causes the cooling fans to turn up significantly and reach an audible but uniform 49.1 dB(A). We did not notice any coil whine or similar noises coming from the test unit.
Noise level
| Idle |
| 30.4 / 30.4 / 30.7 dB(A) |
| Load |
| 45.5 / 49.1 dB(A) |
 | ||
30 dB silent 40 dB(A) audible 50 dB(A) loud |
||
min: | ||
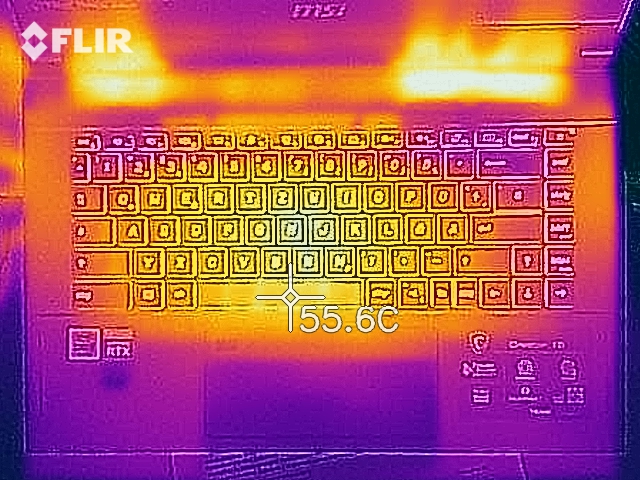
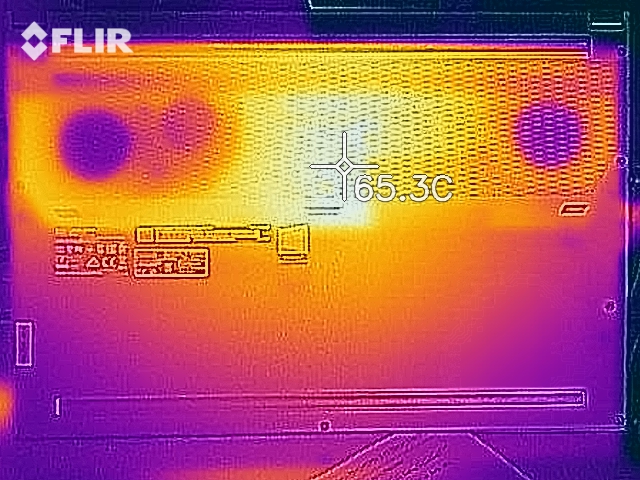
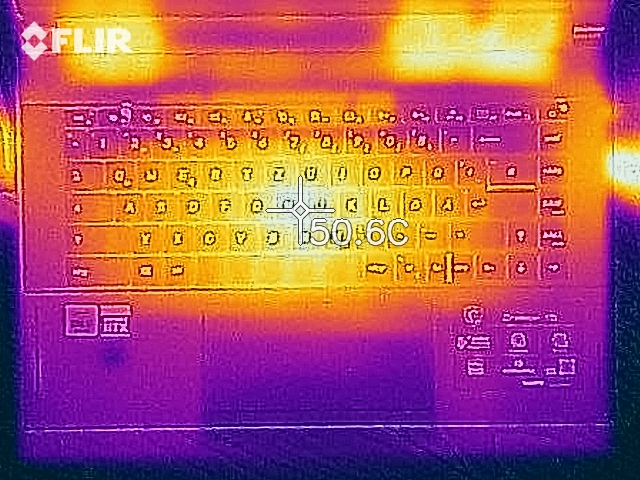
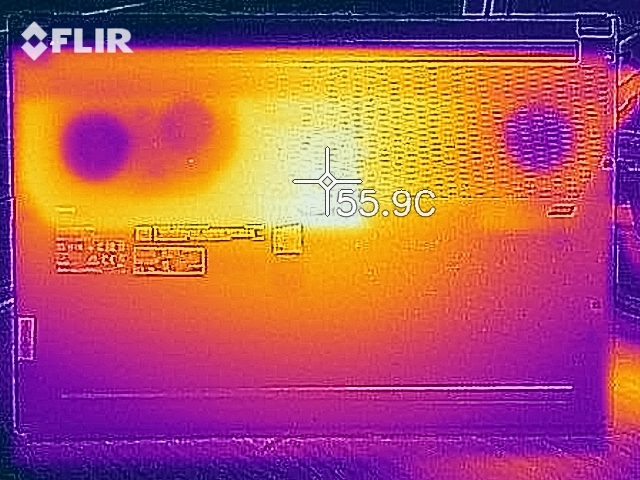
Temperature
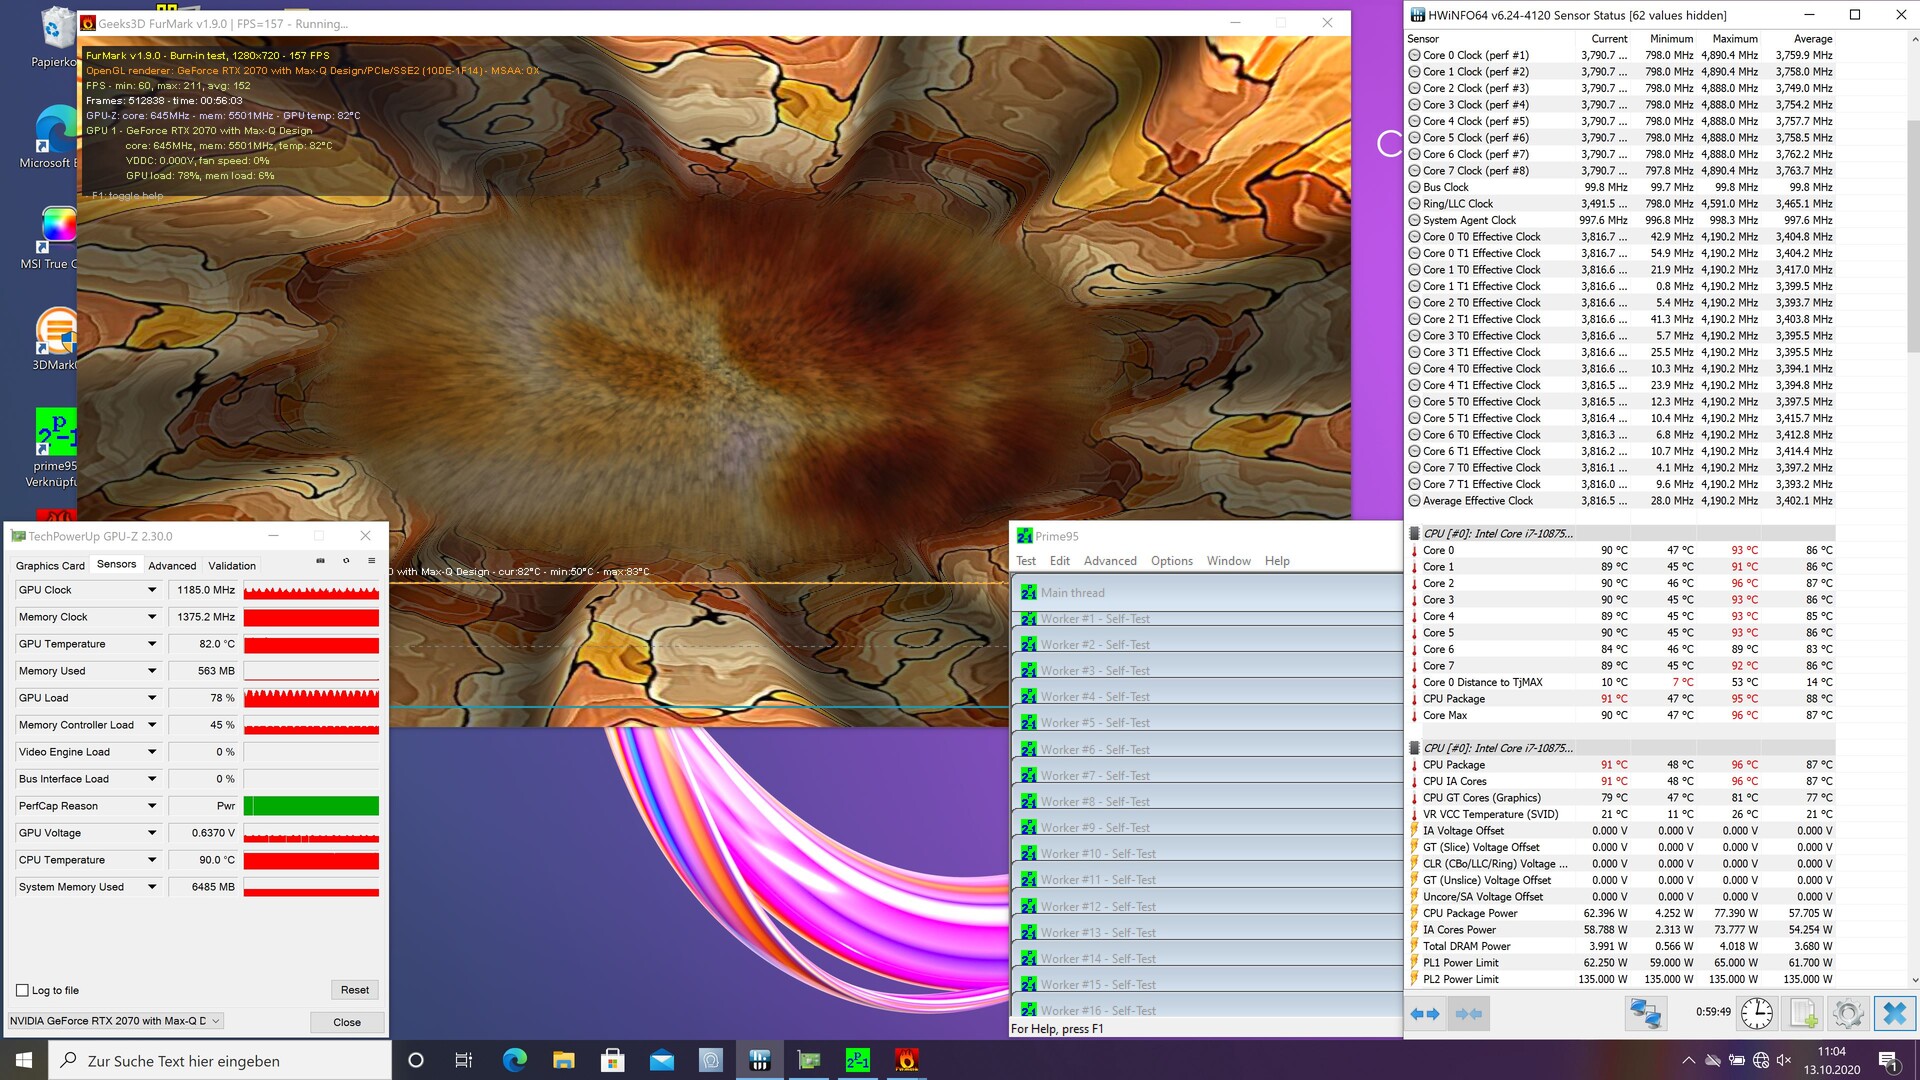
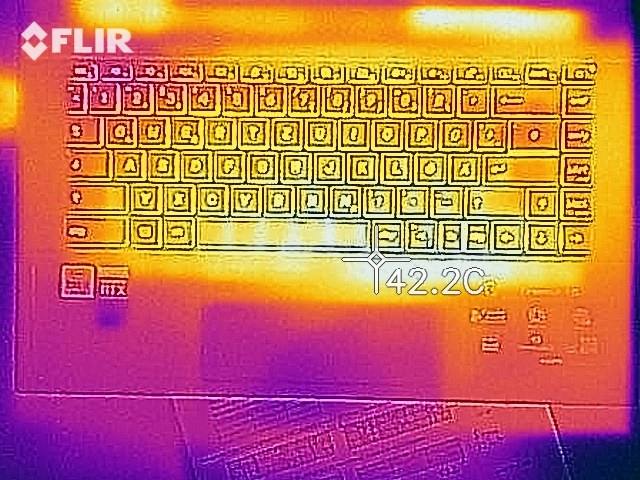
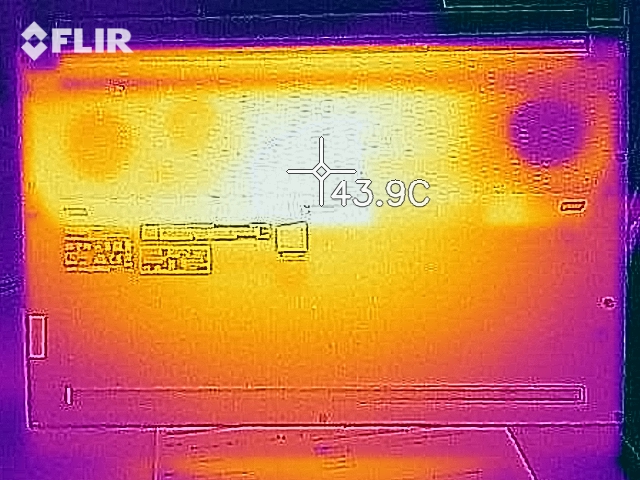
Our measurements show that the MSI Creator 15 reaches surface temperatures of up to 49 °C under load. The device feels particularly warm towards the back, which makes using the device on your lap a little difficult.
The temperatures on the inside of the notebook increased to up to 93 °C during our one-hour stress test. The clock rates dropped below the base clock rate shortly, but then increased to an average of 3.7 GHz. Users do not have to expect any limitations coming from high temperatures even under continuous load.
(-) The maximum temperature on the upper side is 49 °C / 120 F, compared to the average of 36.9 °C / 98 F, ranging from 21.1 to 71 °C for the class Multimedia.
(-) The bottom heats up to a maximum of 46.9 °C / 116 F, compared to the average of 39.2 °C / 103 F
(+) In idle usage, the average temperature for the upper side is 31 °C / 88 F, compared to the device average of 31.3 °C / 88 F.
(±) Playing The Witcher 3, the average temperature for the upper side is 33.7 °C / 93 F, compared to the device average of 31.3 °C / 88 F.
(+) The palmrests and touchpad are cooler than skin temperature with a maximum of 30.3 °C / 86.5 F and are therefore cool to the touch.
(±) The average temperature of the palmrest area of similar devices was 28.7 °C / 83.7 F (-1.6 °C / -2.8 F).
Speaker
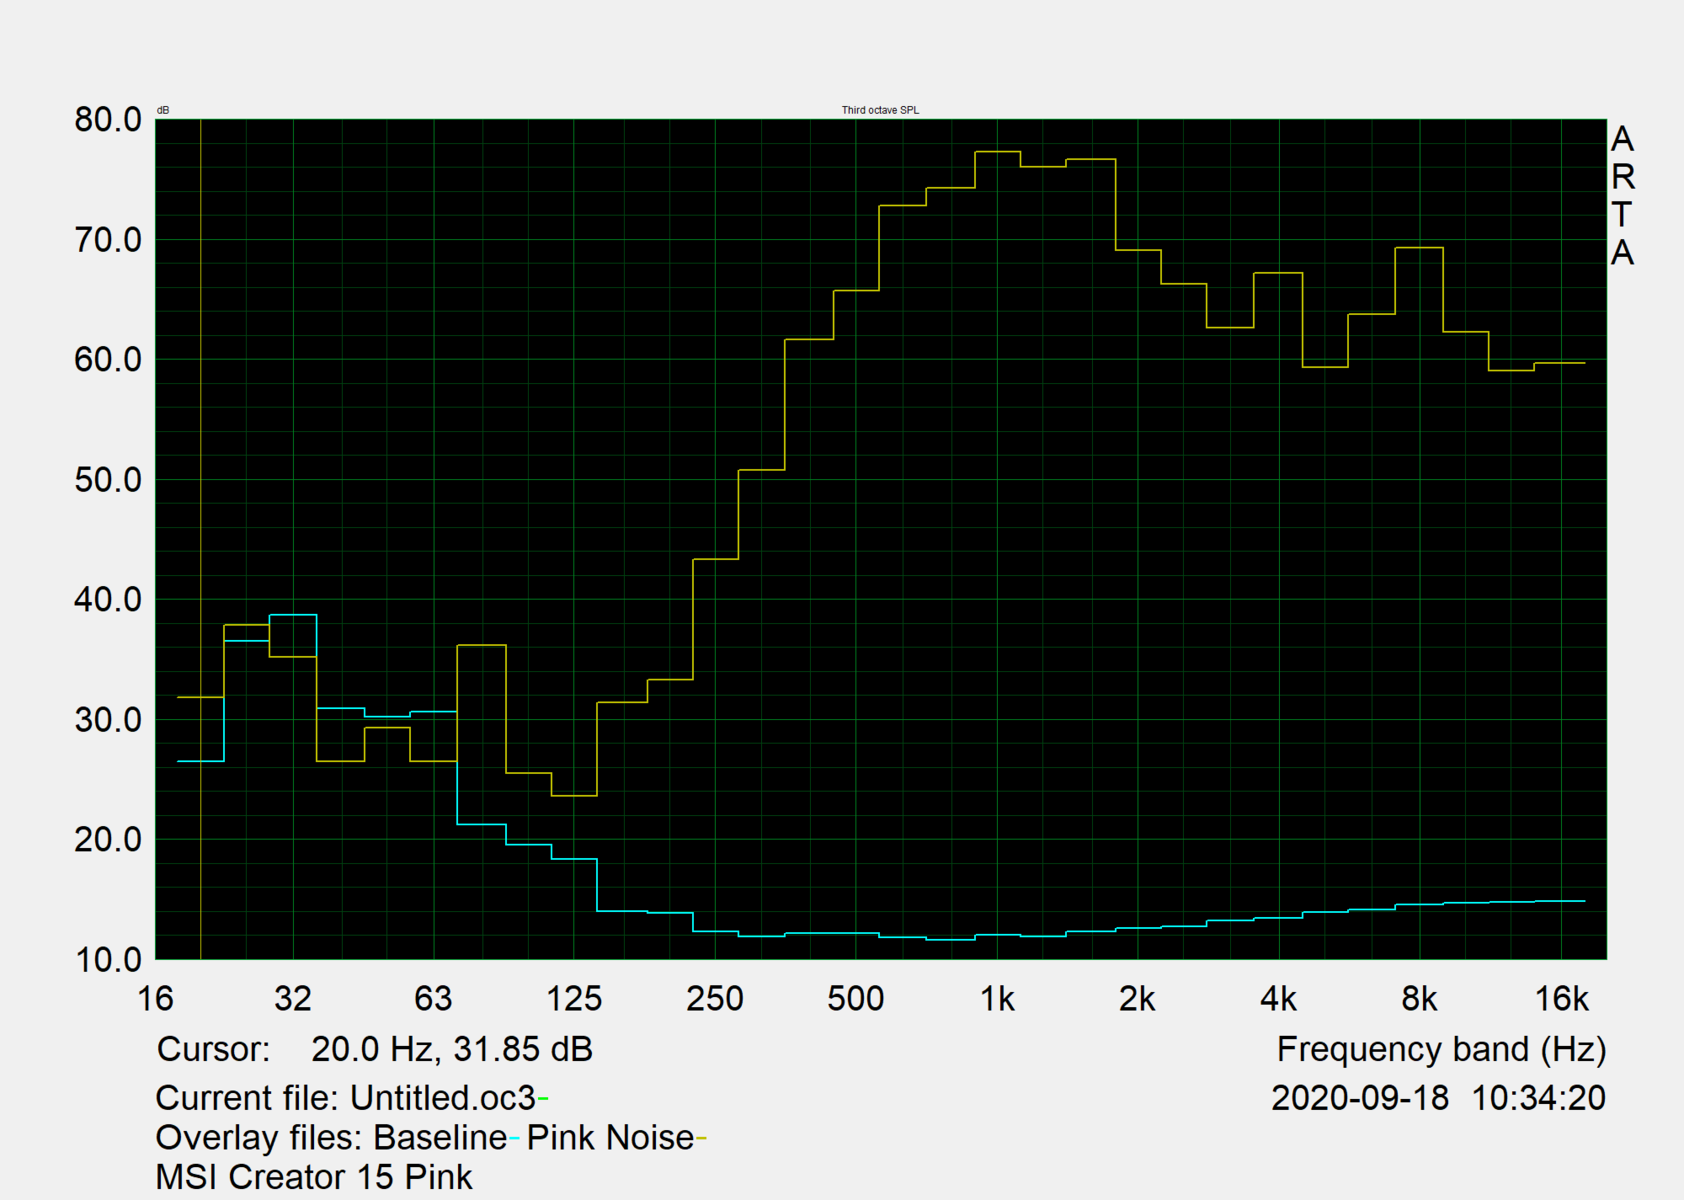
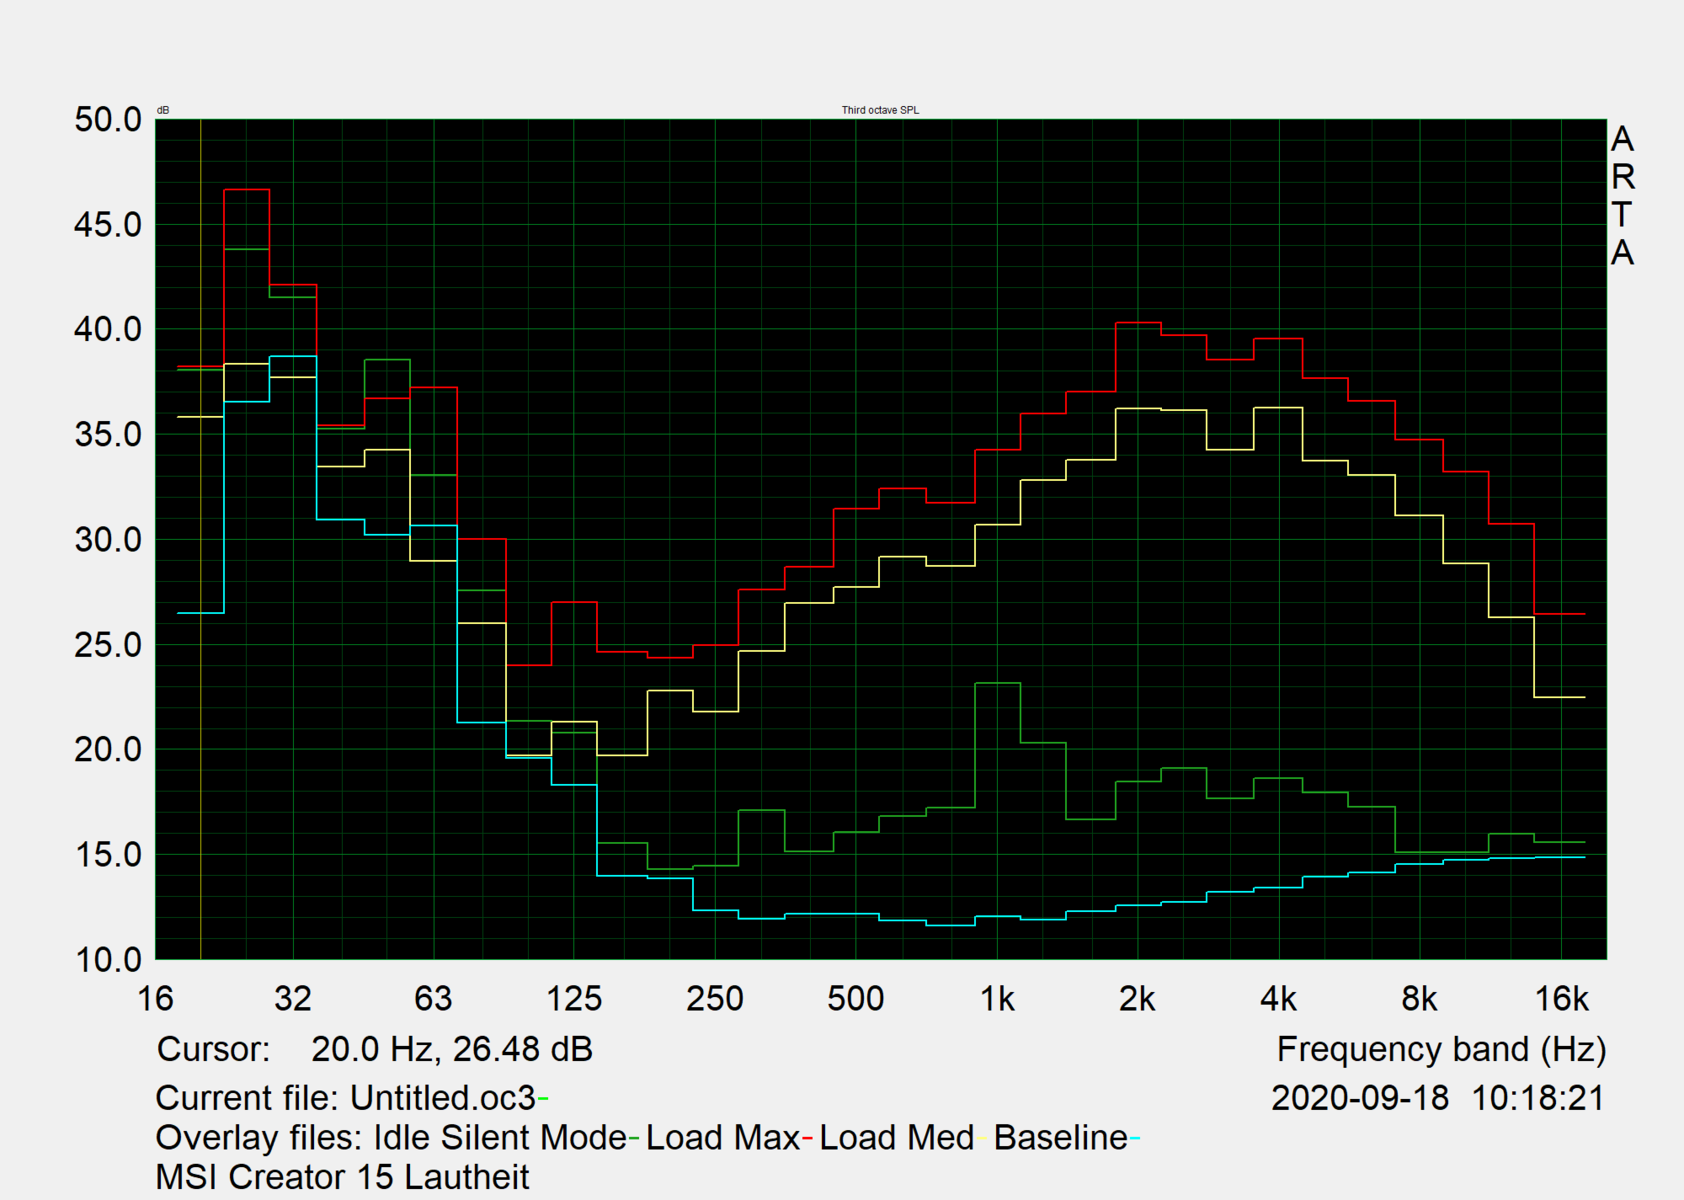
The speaker of the Creator 15 creates a sound spectrum that is focused on mids. This means that audio content lacks bass, but is still suitable for reproducing voice. More demanding users might want to connect external speakers or headphones.
MSI Creator 15 audio analysis
(±) | speaker loudness is average but good (77.3 dB)
Bass 100 - 315 Hz
(-) | nearly no bass - on average 29.7% lower than median
(±) | linearity of bass is average (11.1% delta to prev. frequency)
Mids 400 - 2000 Hz
(±) | higher mids - on average 8.9% higher than median
(±) | linearity of mids is average (8.2% delta to prev. frequency)
Highs 2 - 16 kHz
(+) | balanced highs - only 2.4% away from median
(±) | linearity of highs is average (7.7% delta to prev. frequency)
Overall 100 - 16.000 Hz
(±) | linearity of overall sound is average (24% difference to median)
Compared to same class
» 84% of all tested devices in this class were better, 6% similar, 10% worse
» The best had a delta of 5%, average was 17%, worst was 45%
Compared to all devices tested
» 72% of all tested devices were better, 6% similar, 22% worse
» The best had a delta of 4%, average was 24%, worst was 134%
Apple MacBook 12 (Early 2016) 1.1 GHz audio analysis
(+) | speakers can play relatively loud (83.6 dB)
Bass 100 - 315 Hz
(±) | reduced bass - on average 11.3% lower than median
(±) | linearity of bass is average (14.2% delta to prev. frequency)
Mids 400 - 2000 Hz
(+) | balanced mids - only 2.4% away from median
(+) | mids are linear (5.5% delta to prev. frequency)
Highs 2 - 16 kHz
(+) | balanced highs - only 2% away from median
(+) | highs are linear (4.5% delta to prev. frequency)
Overall 100 - 16.000 Hz
(+) | overall sound is linear (10.2% difference to median)
Compared to same class
» 7% of all tested devices in this class were better, 2% similar, 91% worse
» The best had a delta of 5%, average was 18%, worst was 53%
Compared to all devices tested
» 4% of all tested devices were better, 1% similar, 94% worse
» The best had a delta of 4%, average was 24%, worst was 134%
Energy Management - high power consumption
Power Consumption
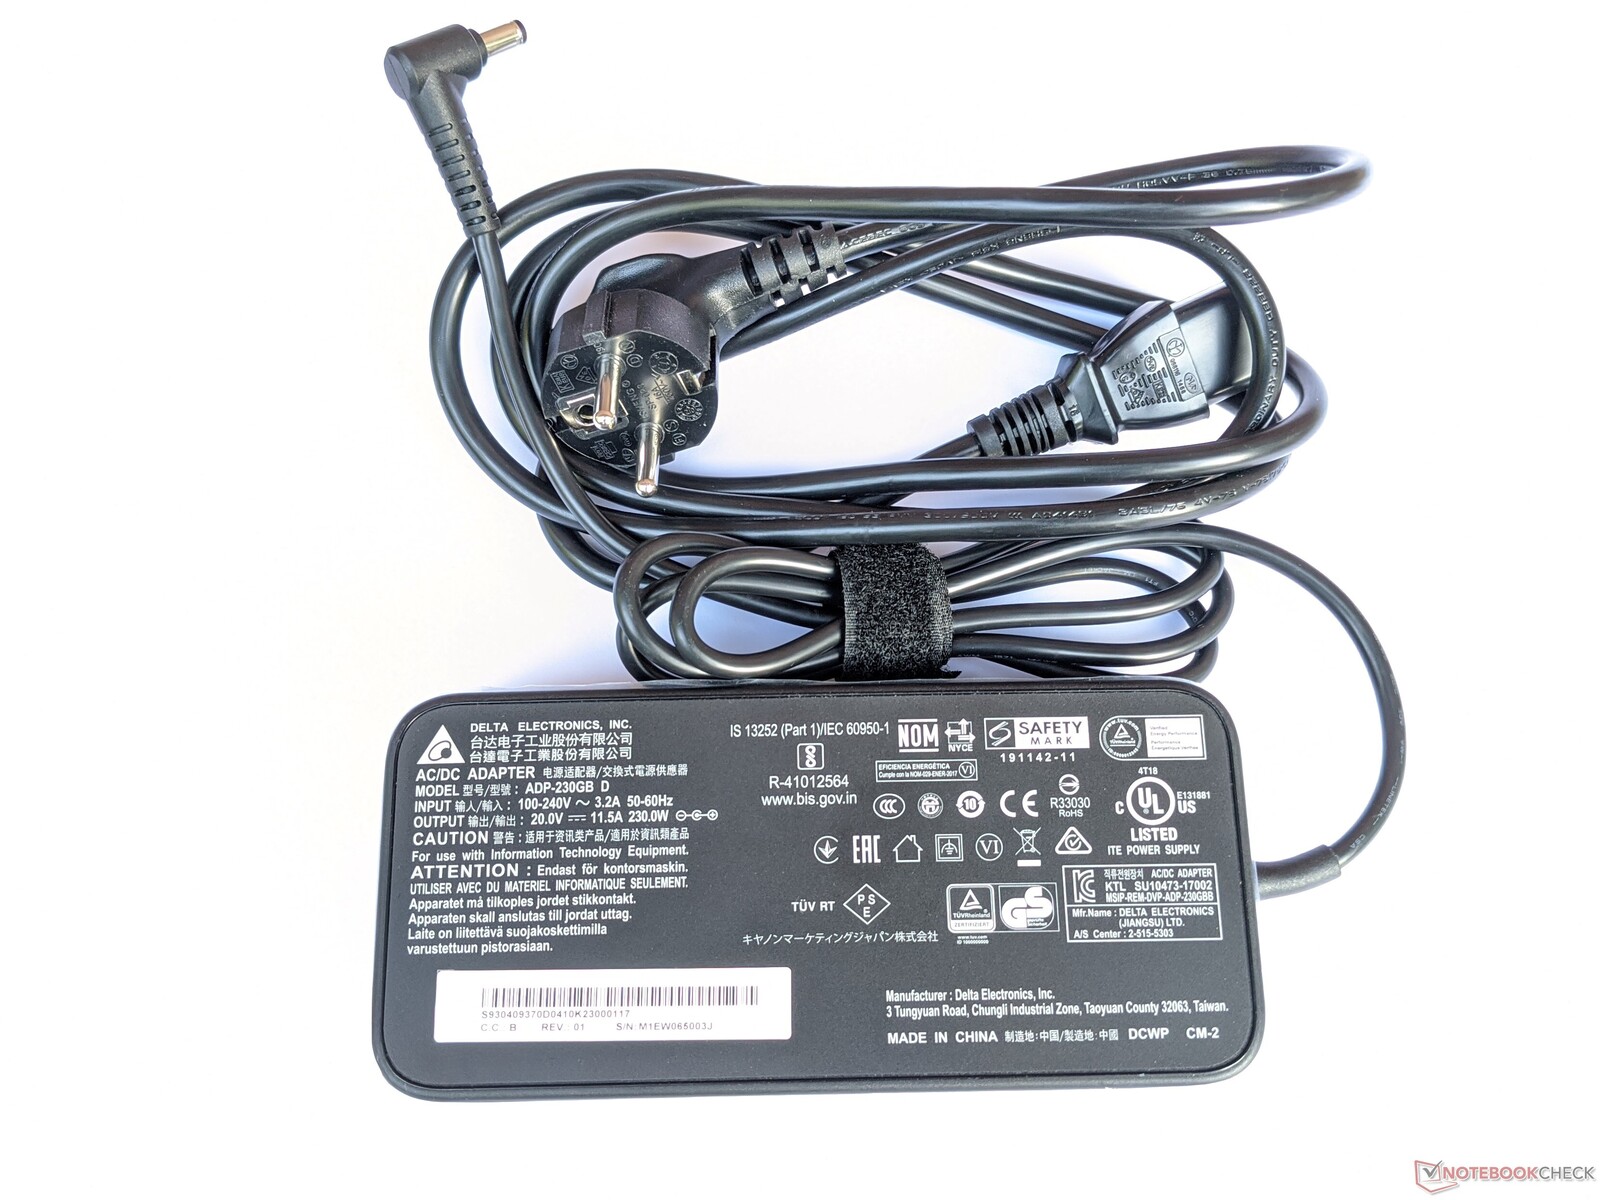
The MSI Creator 15 has the highest power consumption in our comparison field - both when idling and under load. The maximum consumption is 209 Watt according to our measurements while the average under load is 109 Watt. The included 230-Watt AC adapter is definitely large enough to ensure sufficient power supply at all times.
| Off / Standby | |
| Idle | |
| Load |
|
Key:
min: | |
| MSI Creator 15 i7-10875H, GeForce RTX 2070 Max-Q, 2x WDC PC SN730 SDBPNTY-1T00 (RAID 0), IPS, 3840x2160, 15.6" | MSI P65 Creator 9SF-657 i9-9880H, GeForce RTX 2070 Max-Q, 2x Samsung SSD PM981 MZVLB512HAJQ (RAID 0), IPS, 3840x2160, 15.6" | Gigabyte Aero 15 OLED XB-8DE51B0SP i7-10875H, GeForce RTX 2070 Super Max-Q, Intel Optane Memory H10 with Solid State Storage 32GB + 512GB HBRPEKNX0202A(L/H), OLED, 3840x2160, 15.6" | Razer Blade 15 RTX 2070 Super Max-Q i7-10875H, GeForce RTX 2070 Super Max-Q, Samsung SSD PM981a MZVLB512HBJQ, IPS, 1920x1080, 15.6" | Asus Zephyrus S15 GX502L i7-10875H, GeForce RTX 2070 Super Mobile, WDC PC SN730 SDBPNTY-1T00, IPS, 1920x1080, 15.6" | Average NVIDIA GeForce RTX 2070 Max-Q | Average of class Multimedia | |
|---|---|---|---|---|---|---|---|
| Power Consumption | 22% | -8% | -4% | 9% | 9% | 52% | |
| Idle Minimum * (Watt) | 18.7 | 9.4 50% | 18 4% | 14.3 24% | 7 63% | 15.4 ? 18% | 6.09 ? 67% |
| Idle Average * (Watt) | 24.9 | 17.4 30% | 21 16% | 22.3 10% | 13 48% | 20 ? 20% | 10.6 ? 57% |
| Idle Maximum * (Watt) | 27 | 19.6 27% | 38 -41% | 36.9 -37% | 25 7% | 26.7 ? 1% | 12.6 ? 53% |
| Load Average * (Watt) | 109 | 103 6% | 113 -4% | 118.4 -9% | 148 -36% | 105.2 ? 3% | 69.2 ? 37% |
| Witcher 3 ultra * (Watt) | 147 | 149 -1% | 153.7 -5% | 175 -19% | |||
| Load Maximum * (Watt) | 209 | 216 -3% | 256 -22% | 220.8 -6% | 232 -11% | 201 ? 4% | 115.8 ? 45% |
* ... smaller is better
Battery Life
The battery lasts around four hours in our realistic Wi-fi test. This is not as long as what our comparison devices can offer.
| MSI Creator 15 i7-10875H, GeForce RTX 2070 Max-Q, 99.99 Wh | MSI P65 Creator 9SF-657 i9-9880H, GeForce RTX 2070 Max-Q, 82 Wh | Gigabyte Aero 15 OLED XB-8DE51B0SP i7-10875H, GeForce RTX 2070 Super Max-Q, 94.2 Wh | Razer Blade 15 RTX 2070 Super Max-Q i7-10875H, GeForce RTX 2070 Super Max-Q, 80 Wh | Asus Zephyrus S15 GX502L i7-10875H, GeForce RTX 2070 Super Mobile, 76 Wh | Average of class Multimedia | |
|---|---|---|---|---|---|---|
| Battery runtime | 41% | 66% | 62% | 16% | 210% | |
| Reader / Idle (h) | 4.6 | 9.6 109% | 8.6 87% | 8.7 89% | 25.2 ? 448% | |
| WiFi v1.3 (h) | 3.9 | 6 54% | 6.1 56% | 6.3 62% | 3 -23% | 11.3 ? 190% |
| Load (h) | 1.8 | 1.1 -39% | 2.8 56% | 1.5 -17% | 1.667 ? -7% |
Pros
Cons
Verdict - Model maintenance
The compact design and high-resolution display are the two highlights of the MSI Creator 15. Combined with the input devices this makes it a very productivity-friendly device that can also be carried around with you. The port selection contains all basic ports and can be expanded limitlessly thanks to its Thunderbolt 3 connector. The various performance modes and changeable color spaces enable further applications as well.
The MSI Creator 15 offers a very good UHD panel but only average performance.
The hardware is good and ensures a smooth system performance. Compared to the competition, but also to the manufacturer's own MSI P65 Creator 9SF, for example, the test results are in the upper mid-range. The battery life could be better, which is most probably caused by the UHD panel, which has a high power consumption. Users who are looking for an excellent display in a compact 15-inch notebook might still find that the MSI Creator 15 is the right choice for them.
MSI Creator 15
- 10/18/2020 v7 (old)
Mike Wobker
Price comparison

