 Deutsch
 English
 Español
 Français
 Italiano
 Nederlands
 Polski
 Português
 Русский
 Türkçe
 Svenska
 Chinese
 Magyar
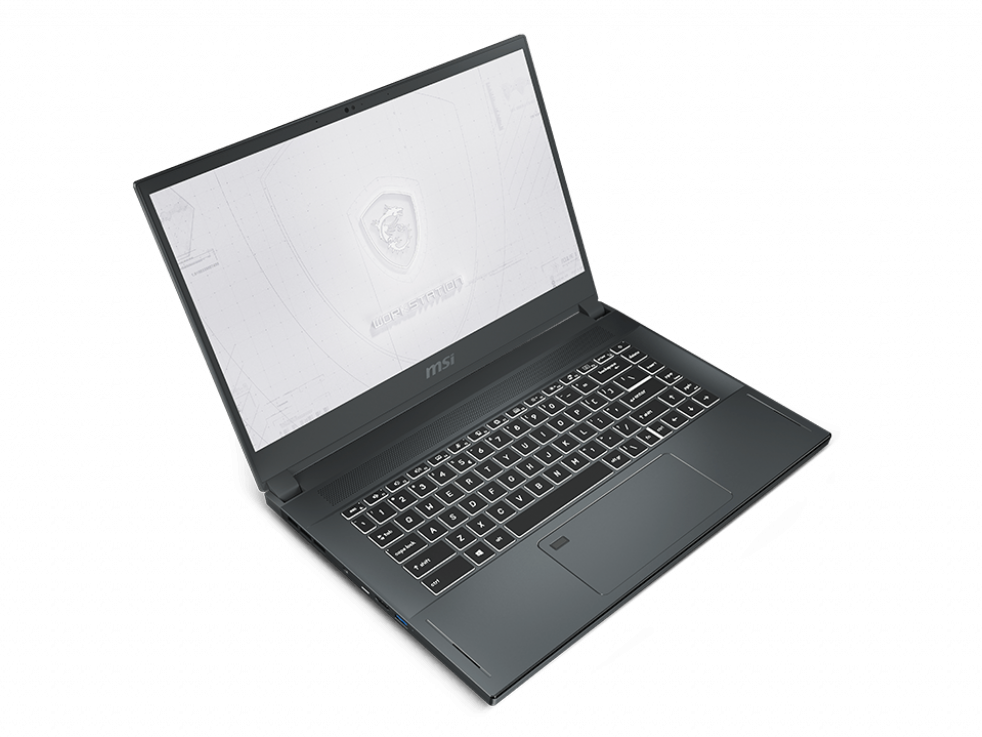
MSI WS66 10TMT Workstation Laptop Review: Faster Than The Razer Blade 15 Studio Edition
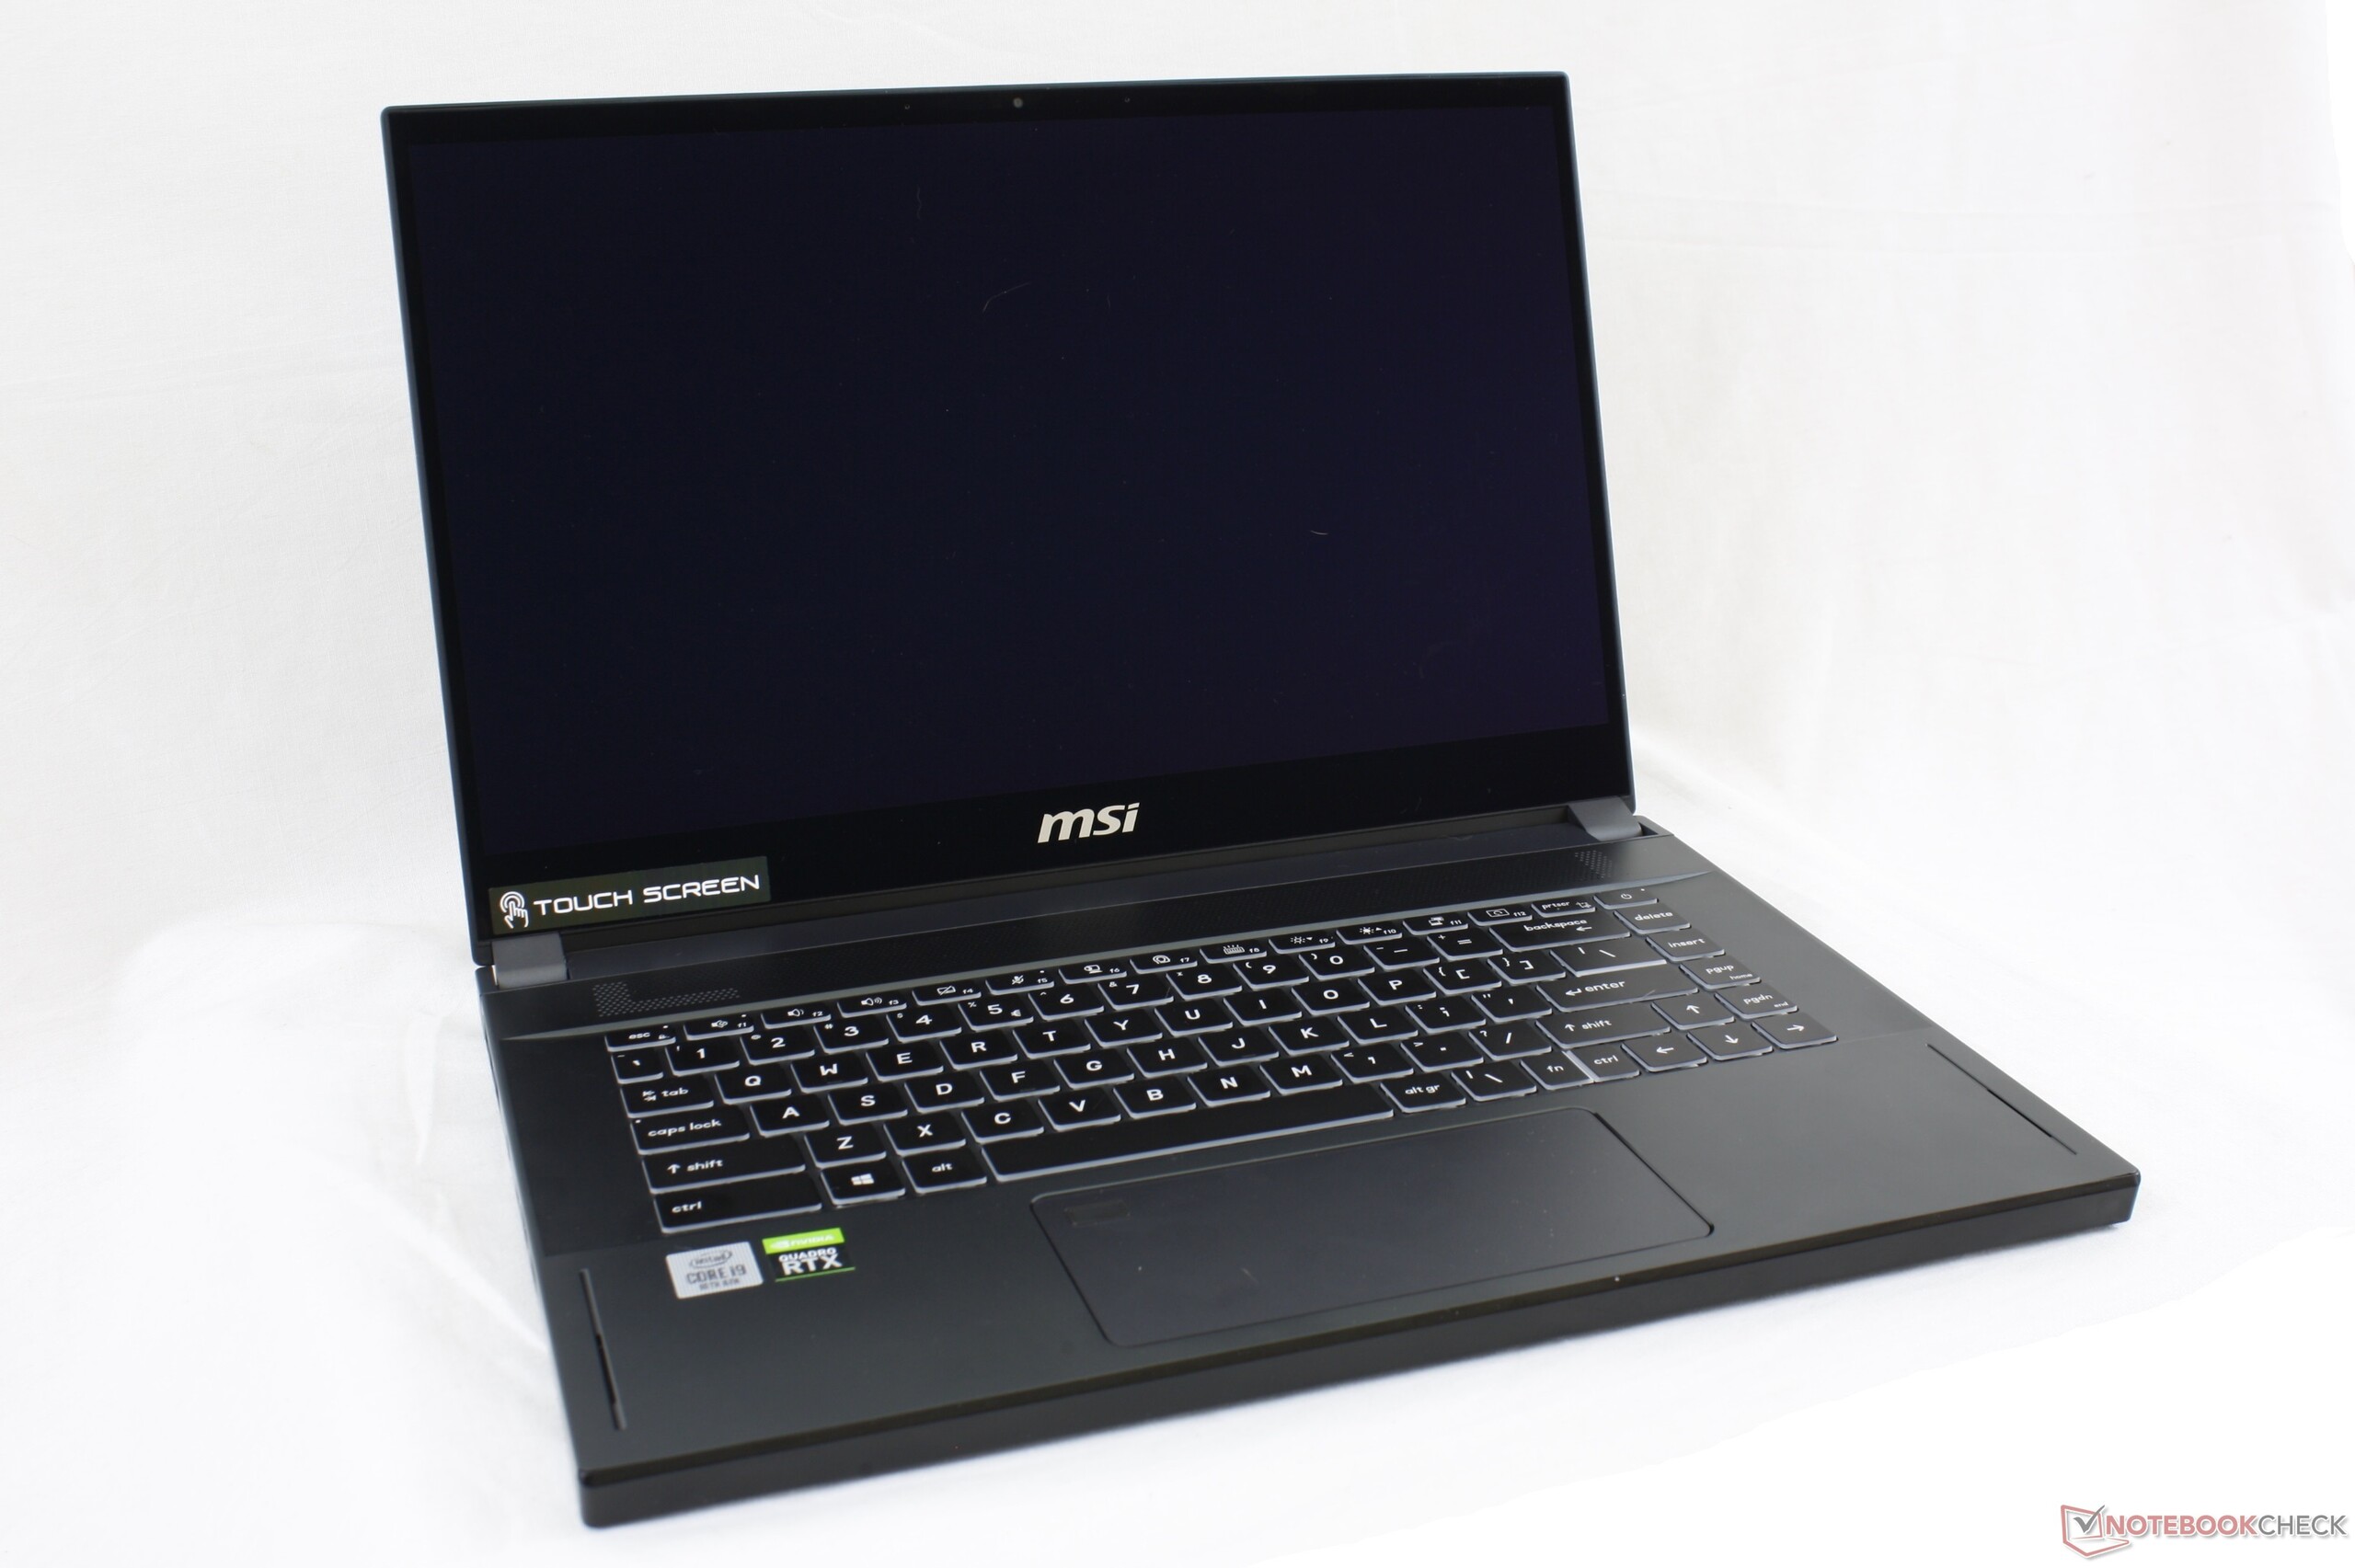
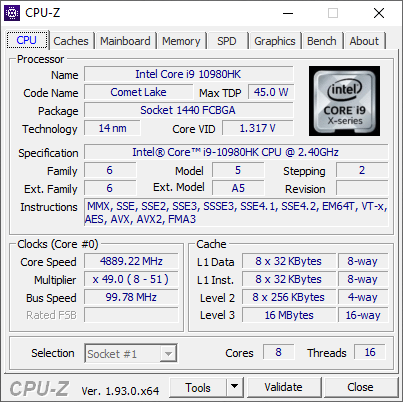
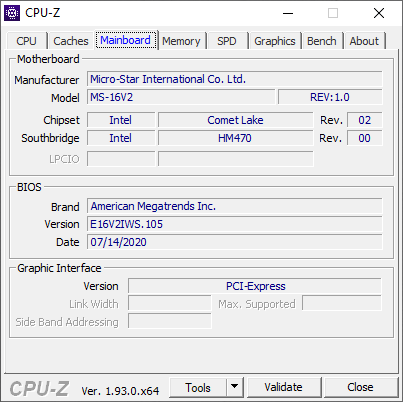
The WS66 is MSI's latest ultra-thin mobile workstation derived from the GS66 gaming laptop to succeed last year's WS63 and WS65. It's a complete redesign when compared to the last generation model to better compete against other sleek Nvidia Studio workstations like the Razer Blade 15 Studio, Asus ProArt series, HP ZBook Studio, or the Dell Precision 5550.
Current SKUs range from the Core i7-10875H CPU, Quadro RTX 3000 GPU, and FHD touchscreen for $2500 up to the Core i9-10980HK, Quadro RTX 5000 Max-Q, and 4K UHD touchscreen for as much as $4000 depending on the RAM or storage.
We recommend checking out our existing reviews on the GS66 for more information on the chassis, keyboard, clickpad, and other physical features as the WS66 shares almost the same external design.
More MSI reviews:
Rating | Date | Model | Weight | Height | Size | Resolution | Best Price |
|---|---|---|---|---|---|---|---|
| 83.4 % | 08/2020 | MSI WS66 10TMT-207US i9-10980HK, Quadro RTX 5000 Max-Q | 2.3 kg | 19.8 mm | 15.60" | 1920x1080 | |
| 87.8 % | 08/2020 | Dell Precision 7550 W-10885M, Quadro RTX 5000 Max-Q | 2.8 kg | 27.36 mm | 15.60" | 3840x2160 | |
| 86.3 % | 08/2020 | Dell Precision 5550 P91F i7-10875H, Quadro T2000 Max-Q | 2 kg | 18 mm | 15.60" | 3840x2400 | |
| 87 % | 08/2020 | Razer Blade 15 Studio Edition 2020 i7-10875H, Quadro RTX 5000 Max-Q | 2.2 kg | 13.98 mm | 15.60" | 3840x2160 | |
| 85.6 % | 09/2017 | MSI WS63VR 7RL-023US i7-7700HQ, Quadro P4000 Max-Q | 1.9 kg | 18 mm | 15.60" | 3840x2160 | |
| 82.1 % | 06/2020 | Acer ConceptD 3 Pro CN315-71P-73W1 i7-9750H, Quadro T1000 (Laptop) | 2.4 kg | 23.4 mm | 15.60" | 1920x1080 |
Case
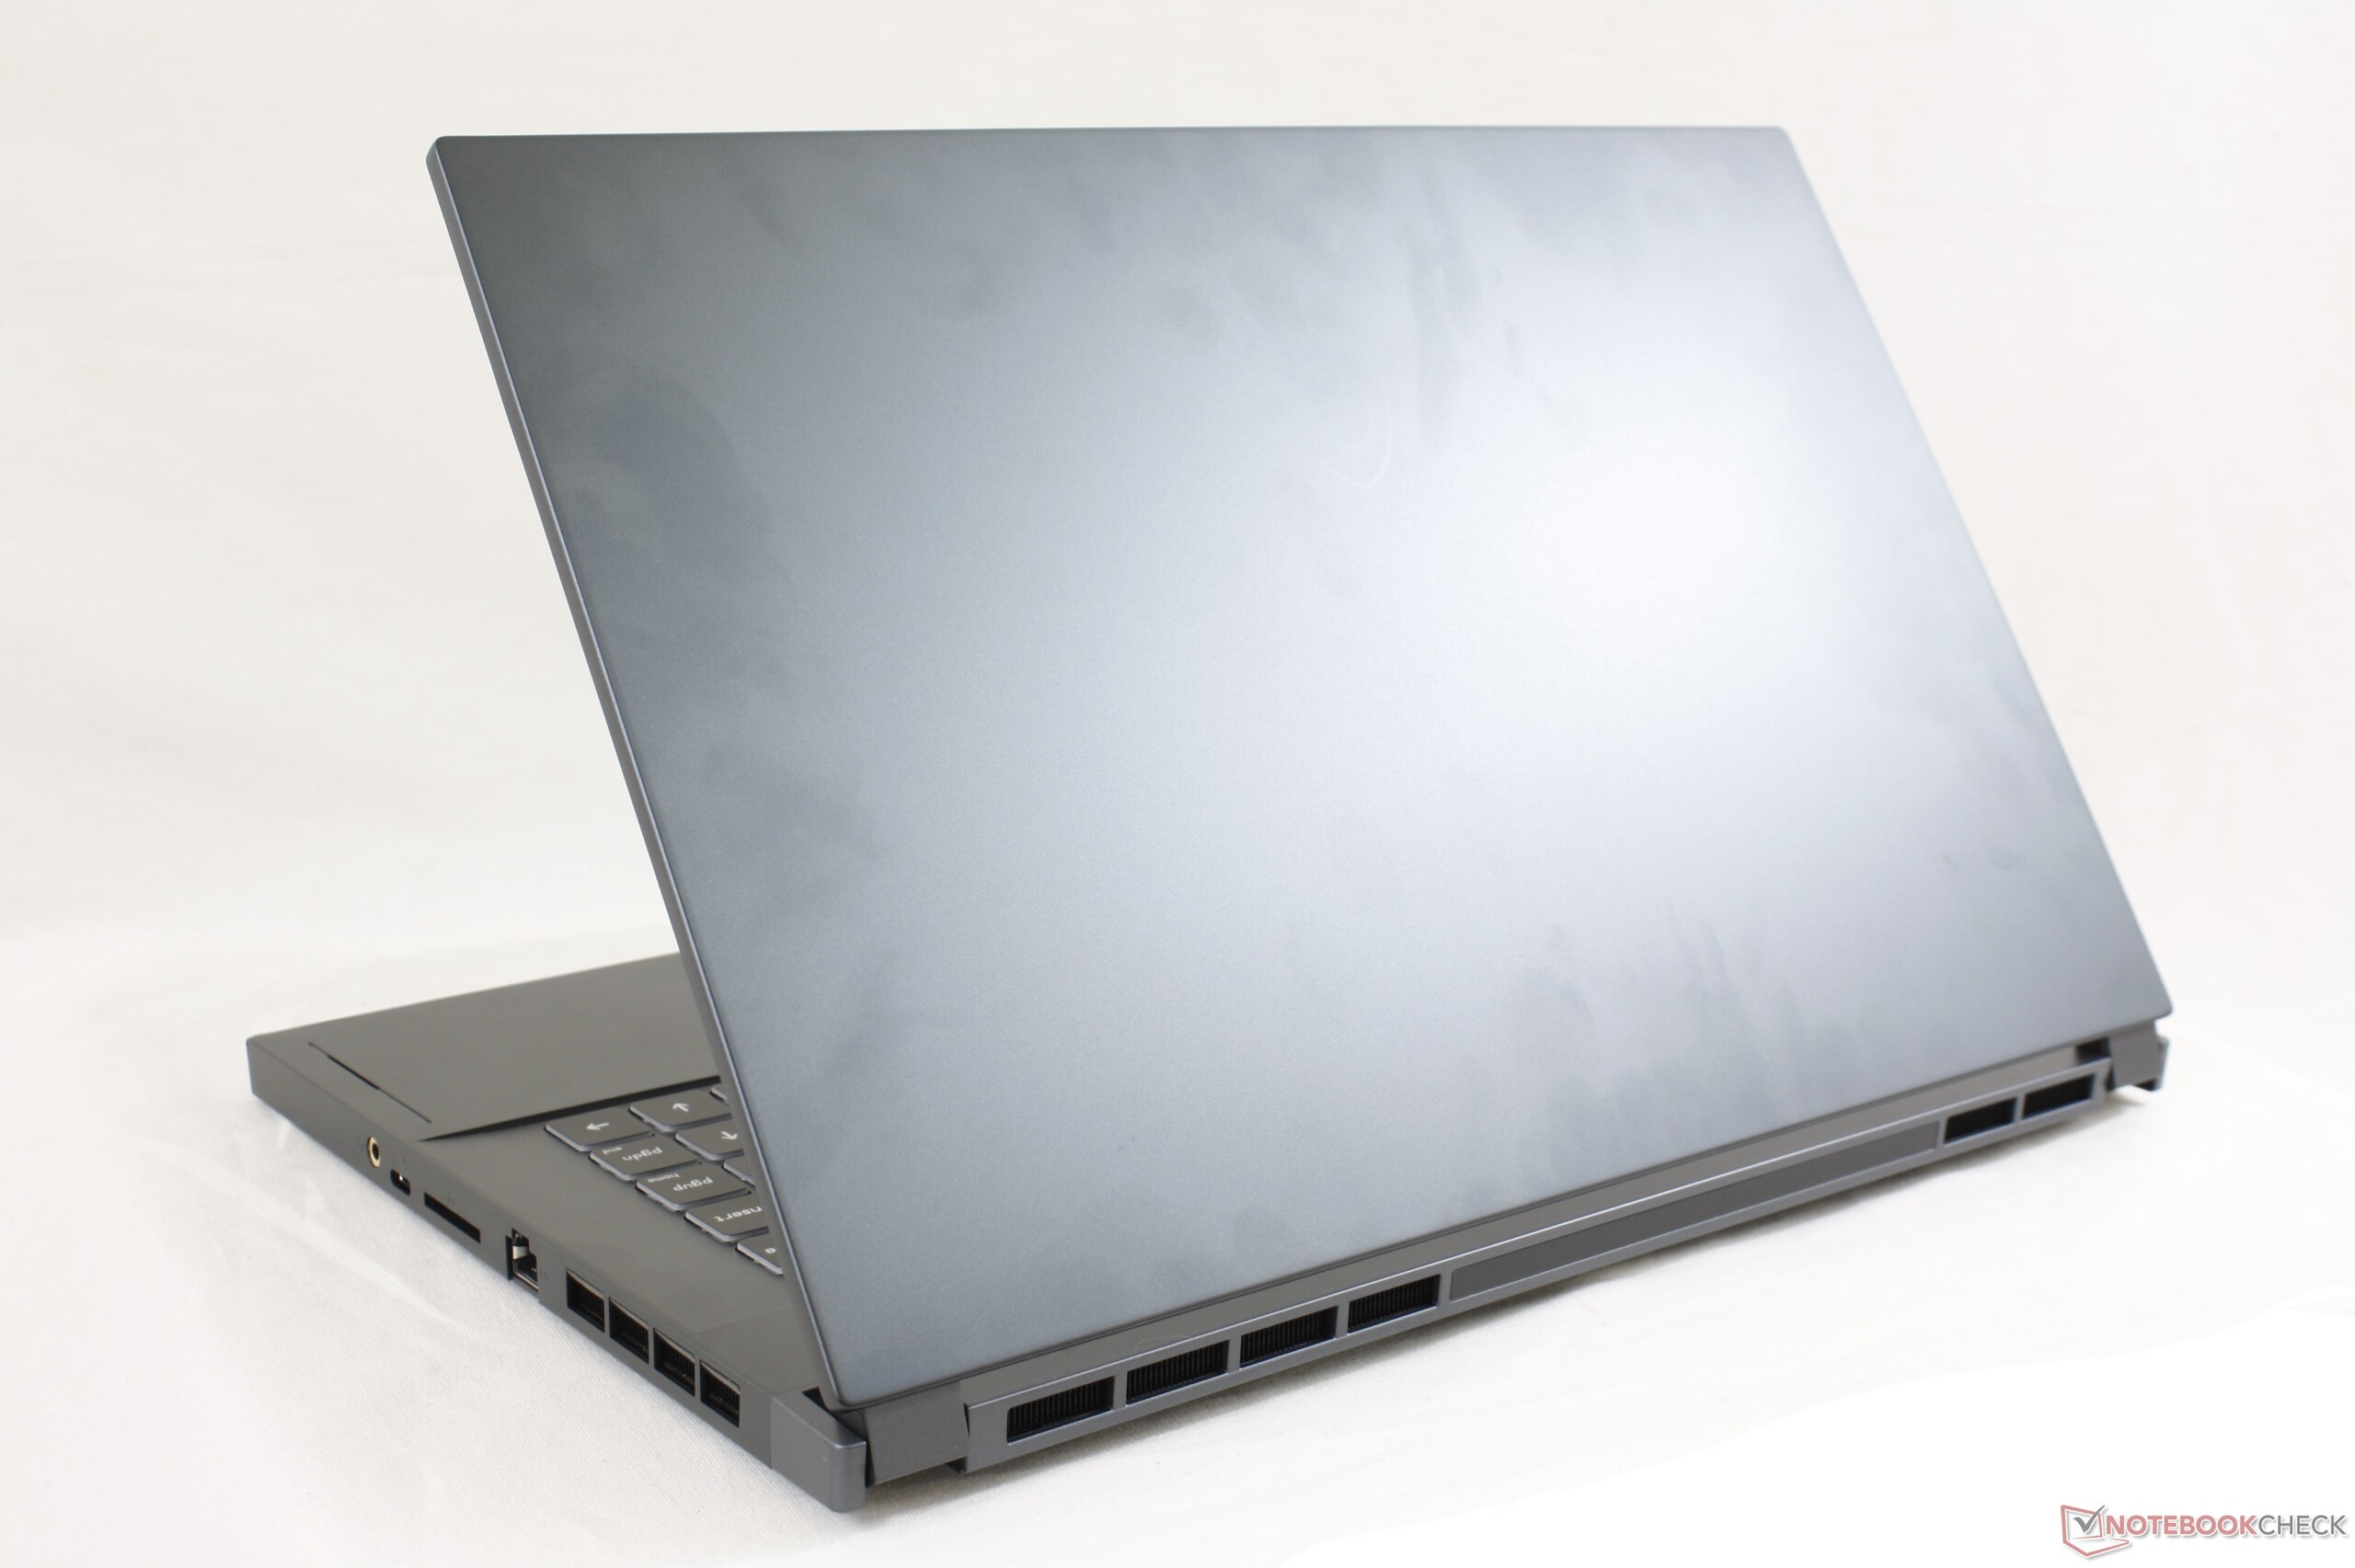
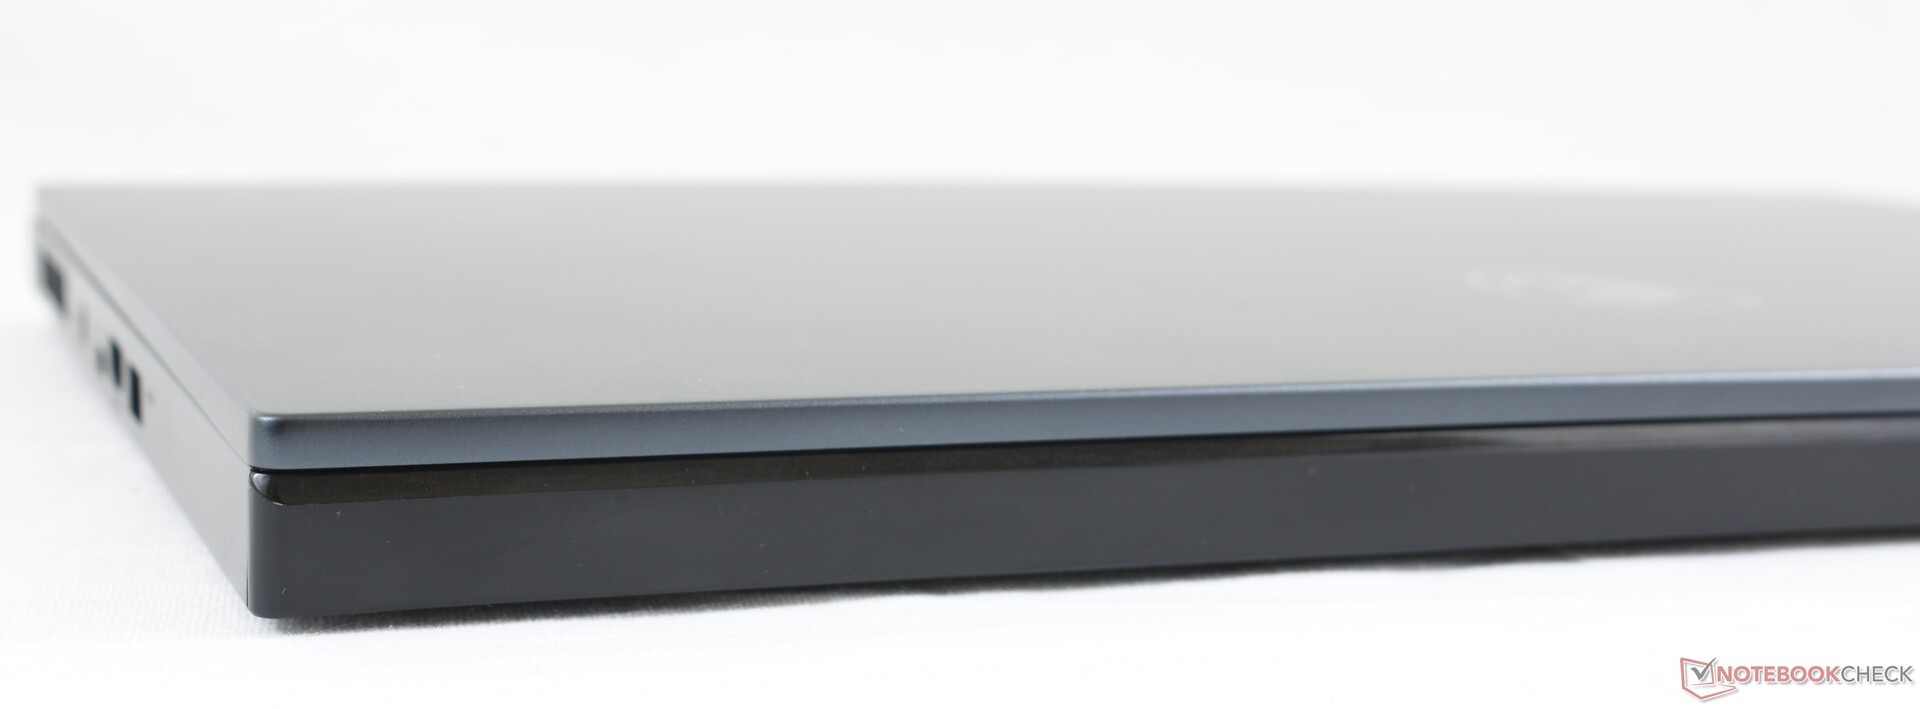
The new case feels stronger than the last generation WS63, but it is still a step down from the Razer Blade 15 Studio. Creaking and bending is more noticeable on the MSI system than on the Razer.
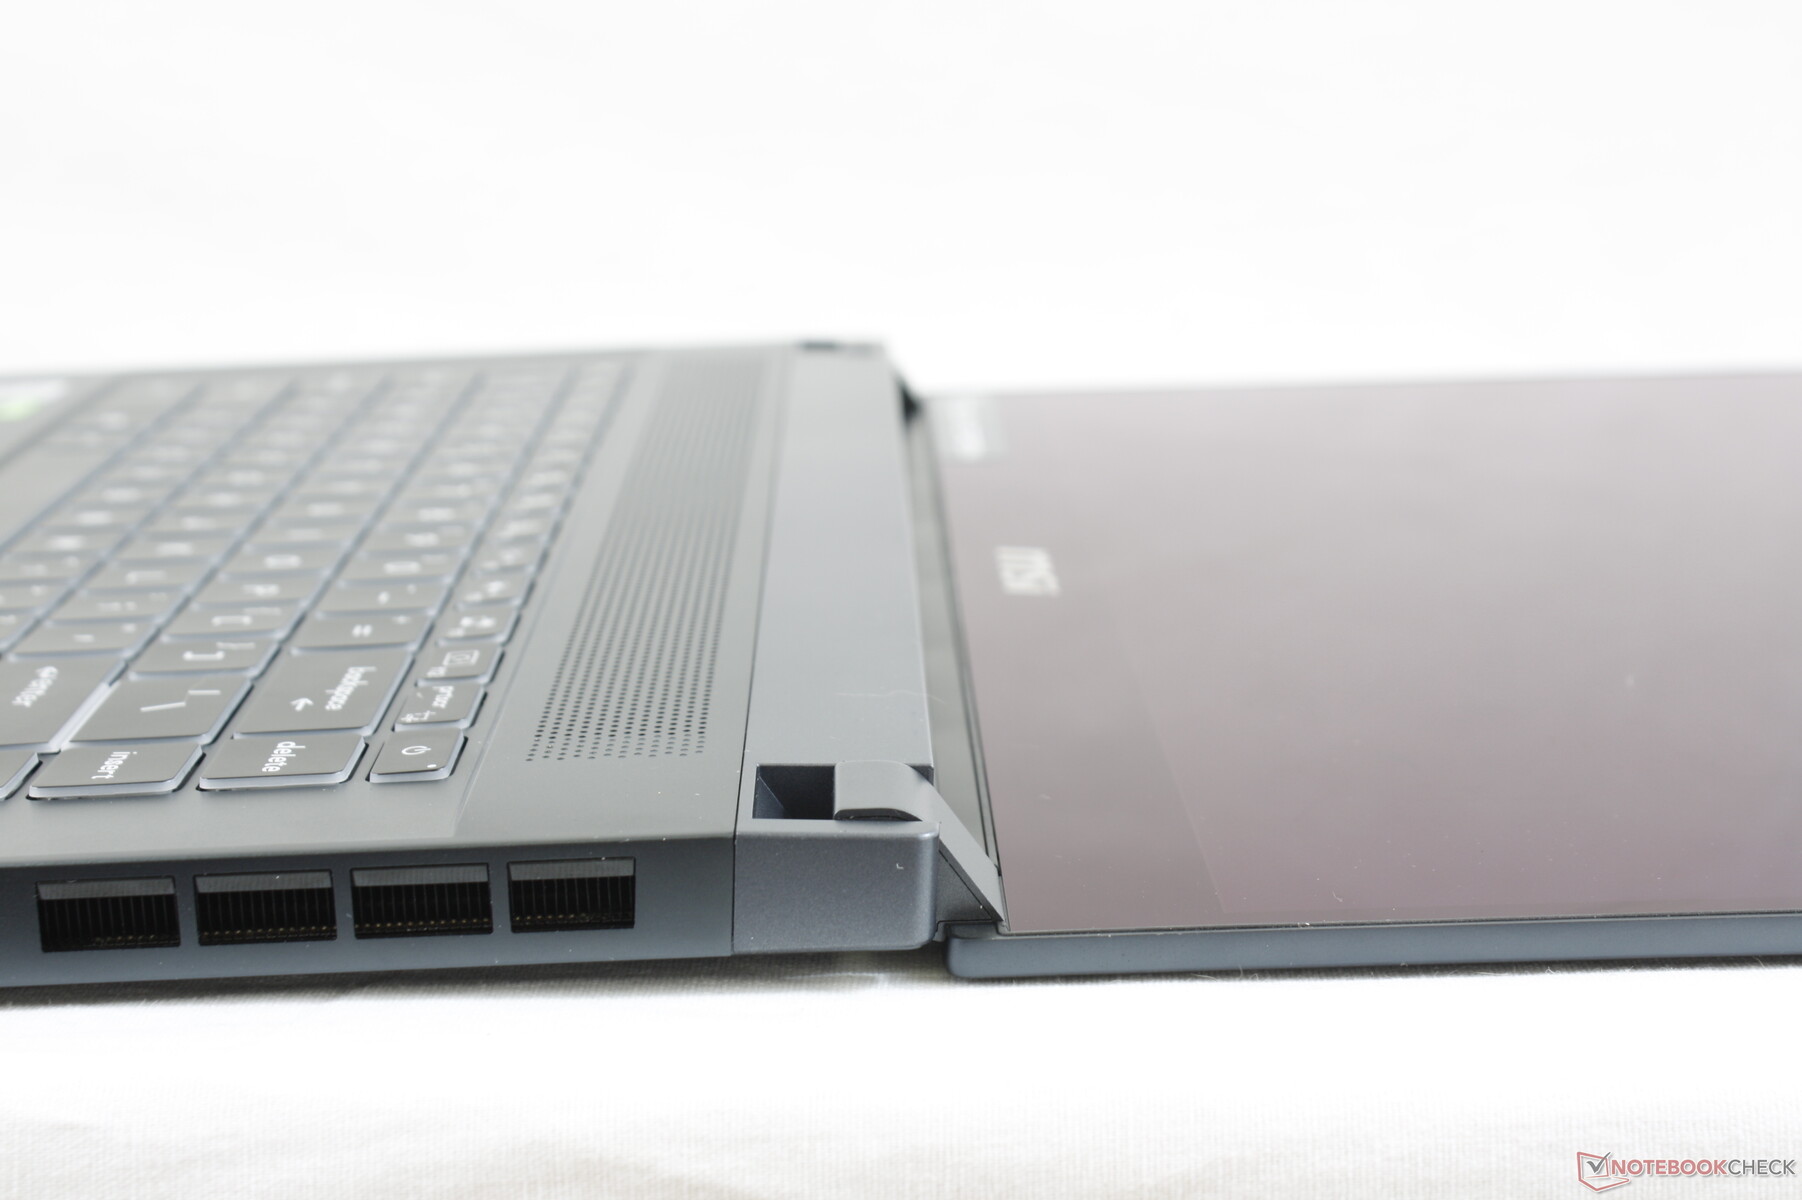
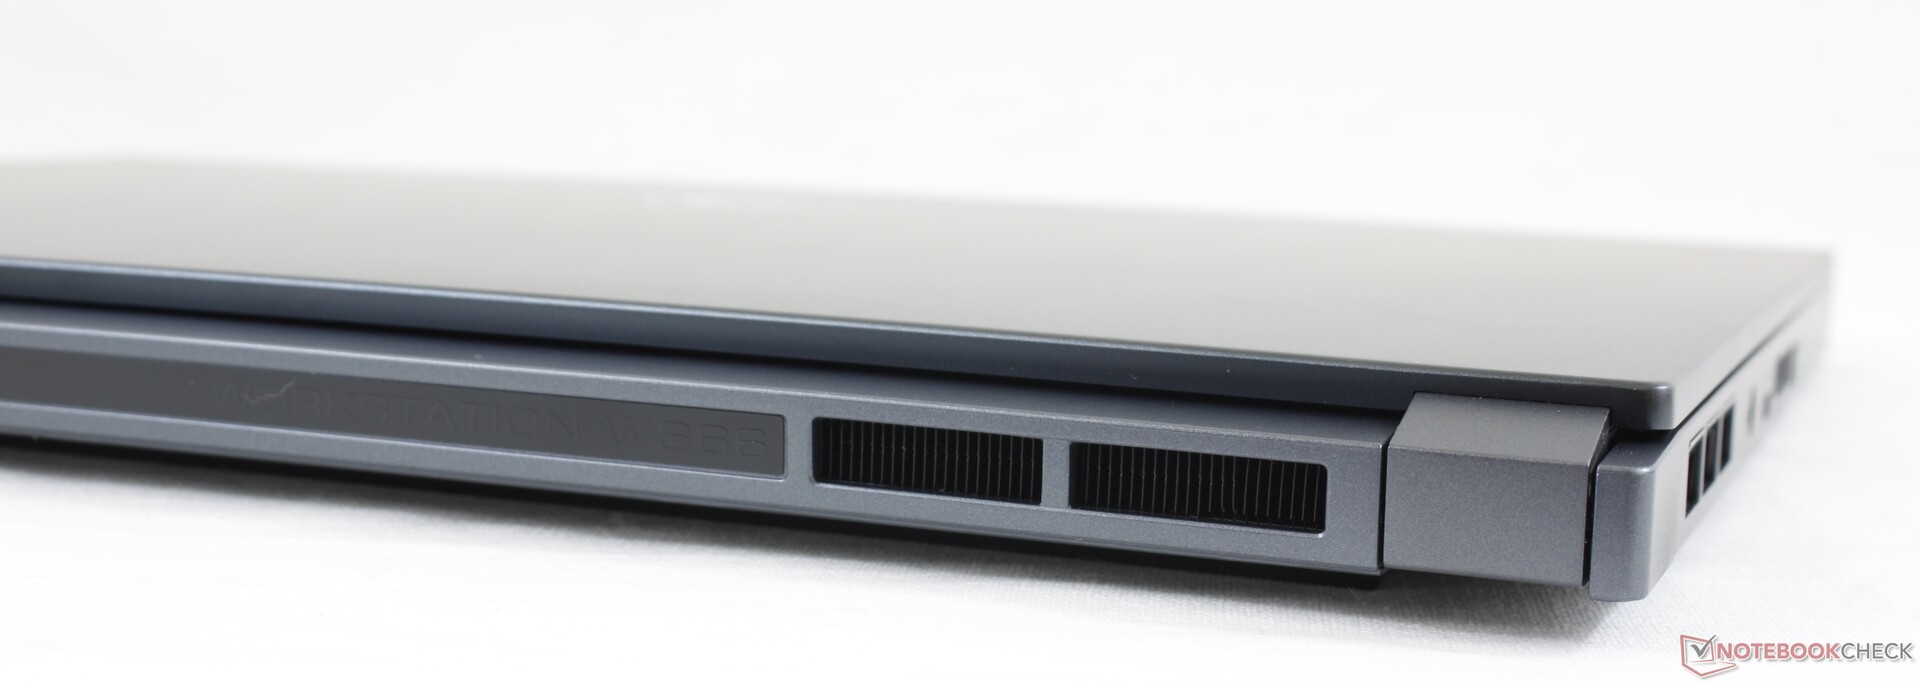
Much like the jump from the GS63 to the GS66, the WS66 is both thicker and heavier than the older WS63 due to the gen-to-gen improvements to chassis rigidity and thermals. Despite this, it continues to be one of the slimmest workstations you can get that can be configured with both a Core i9 CPU and Quadro RTX 5000 Max-Q GPU.
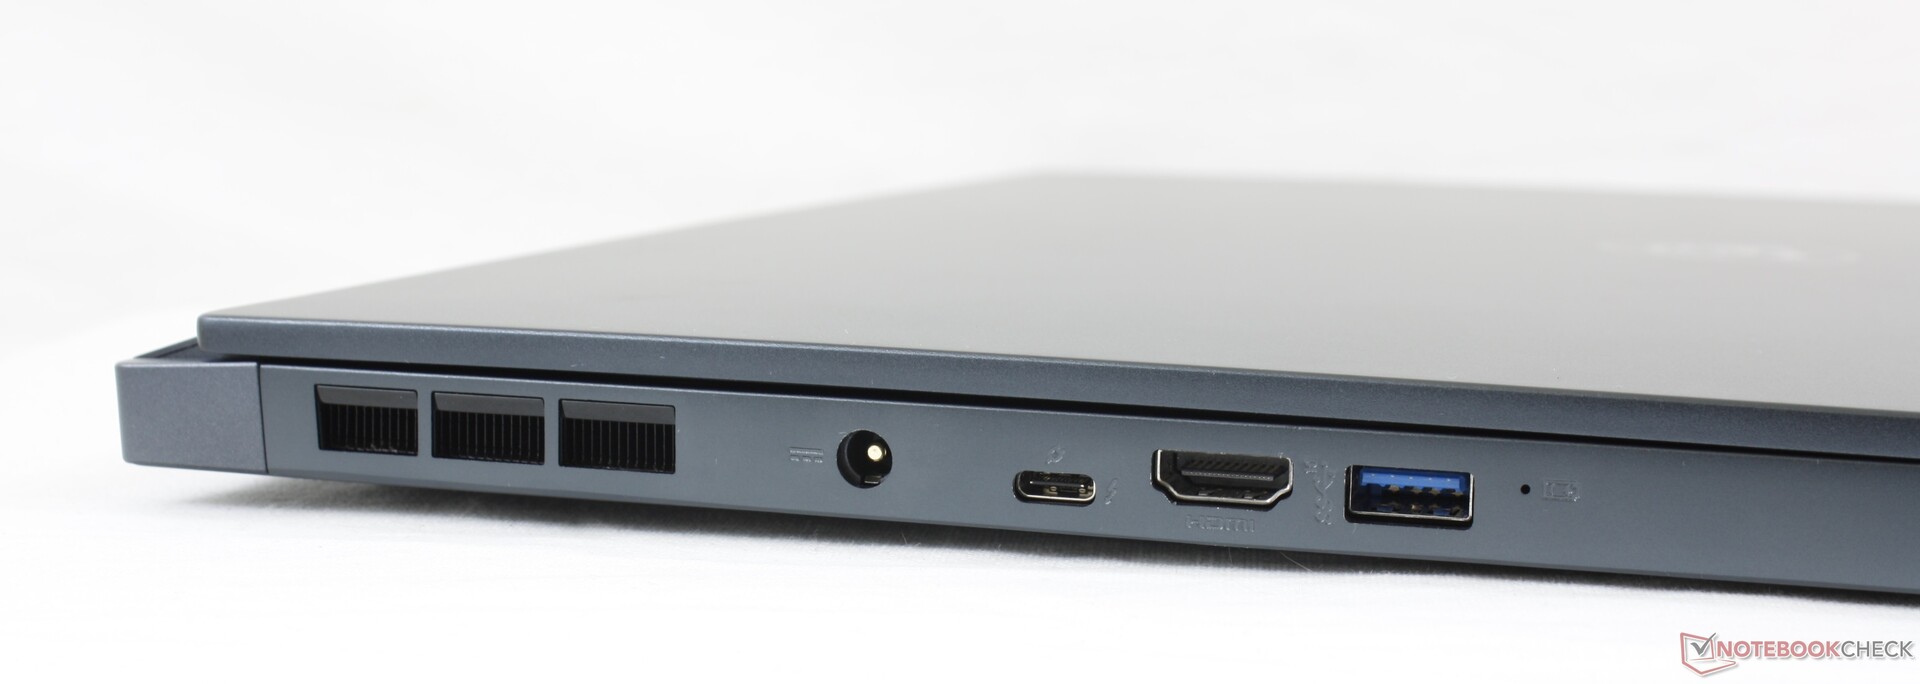
Connectivity
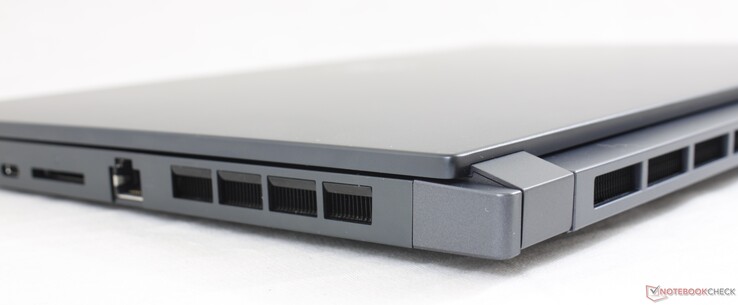
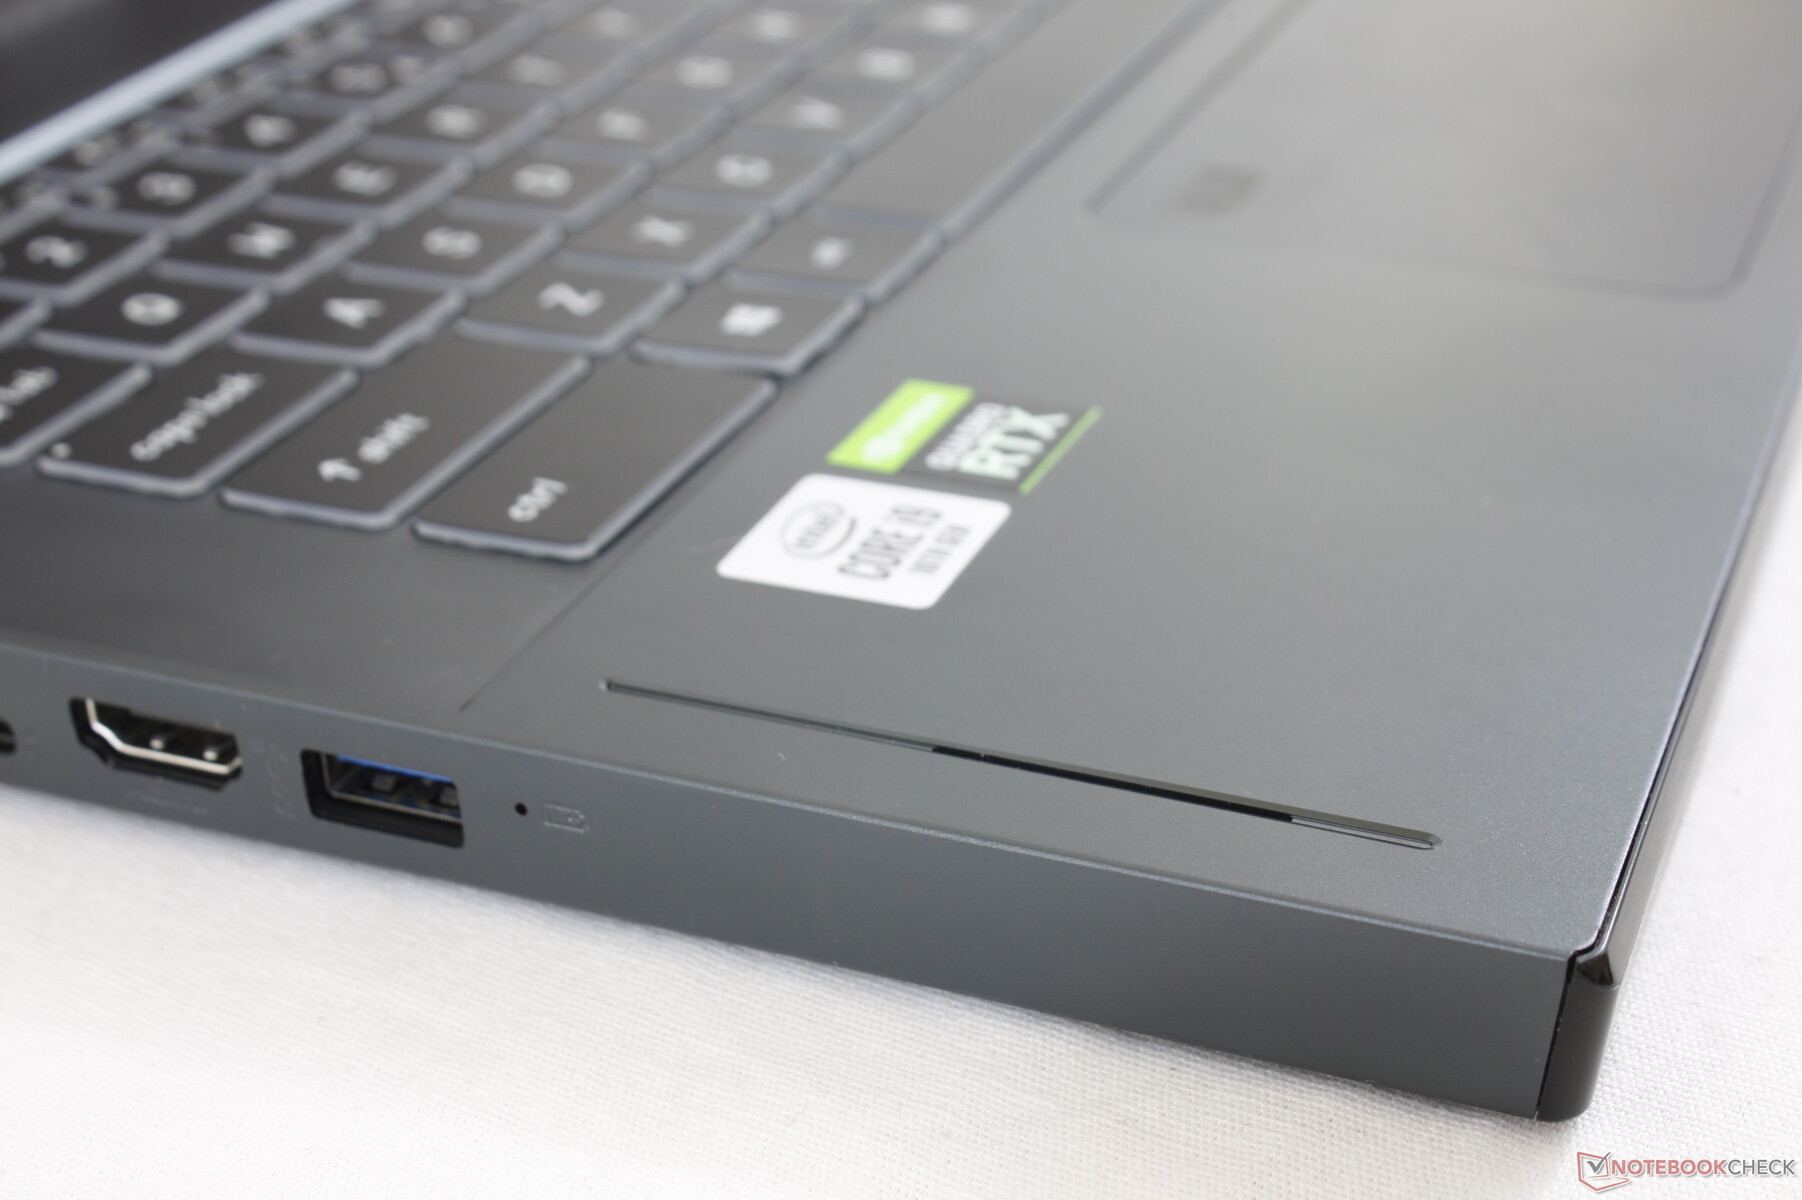
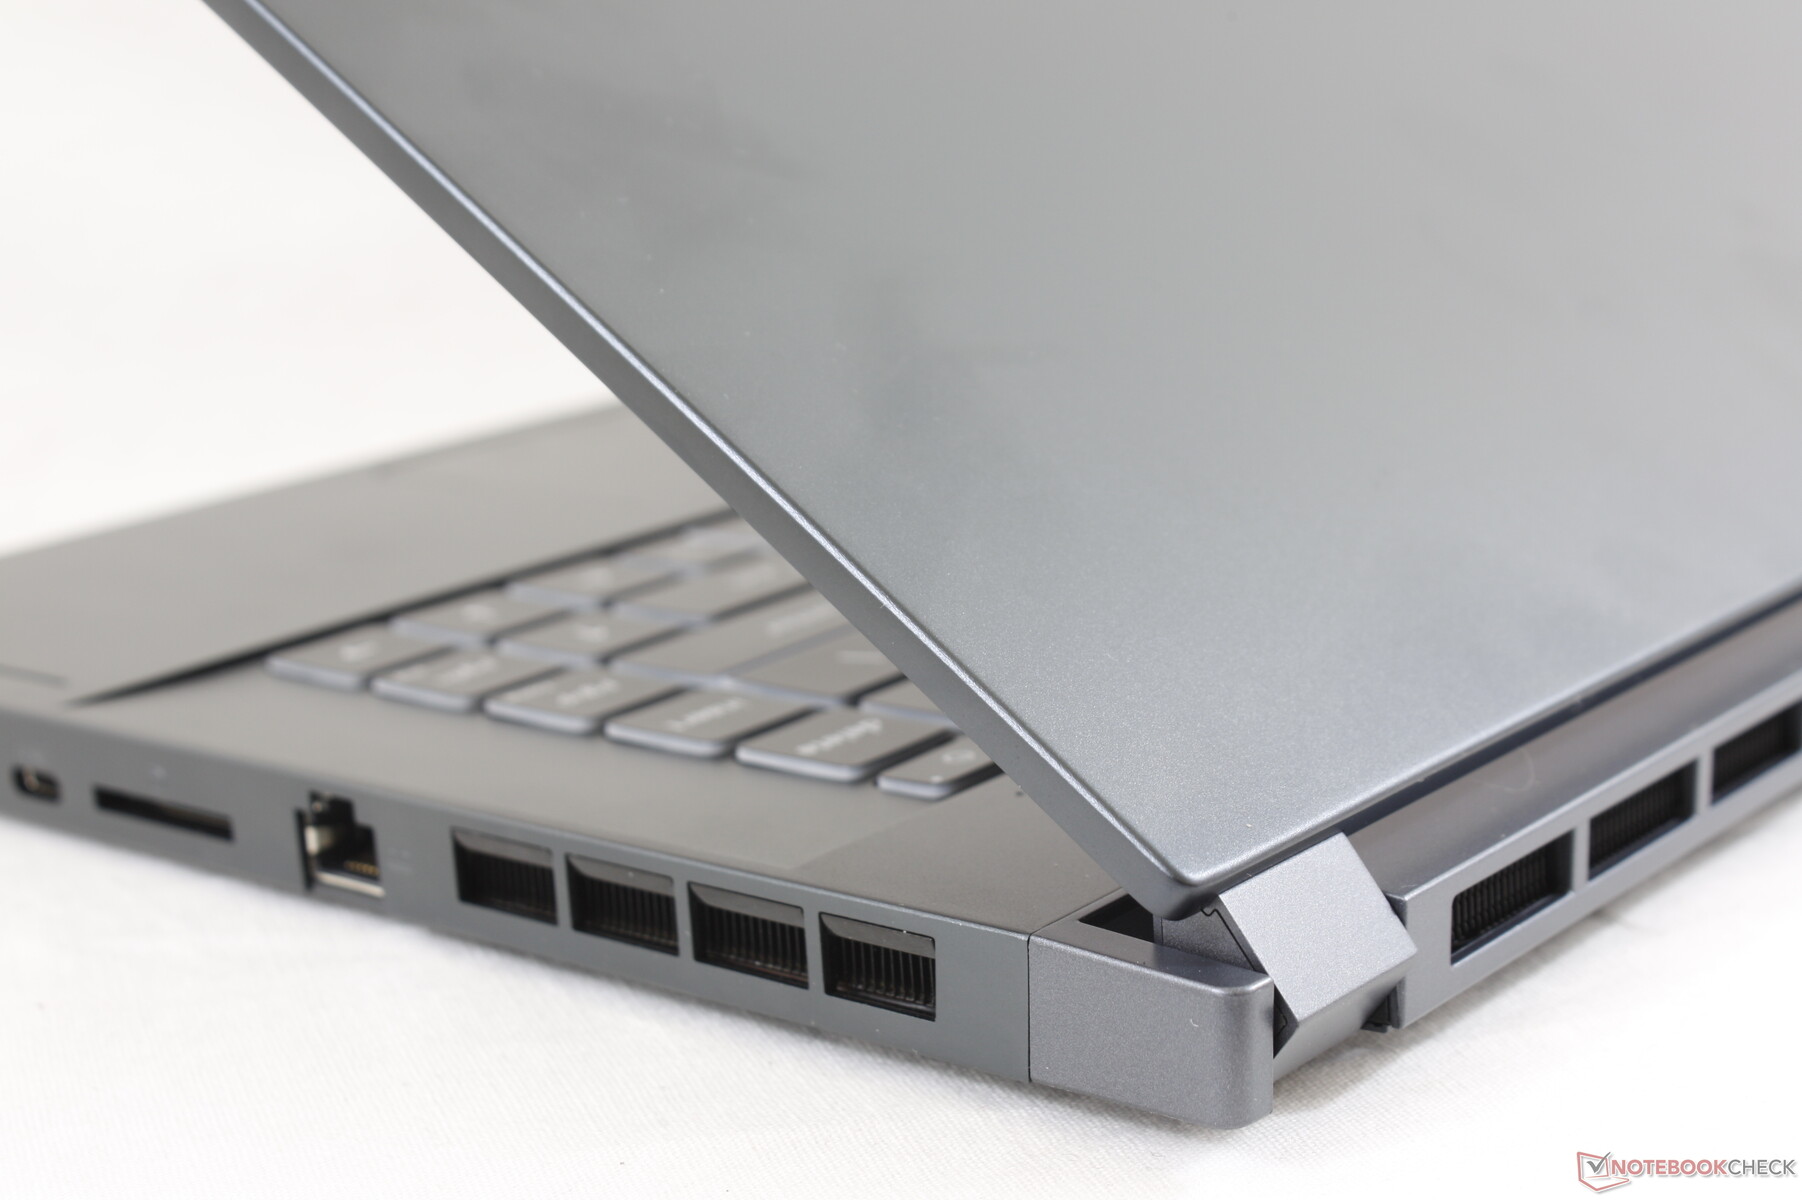
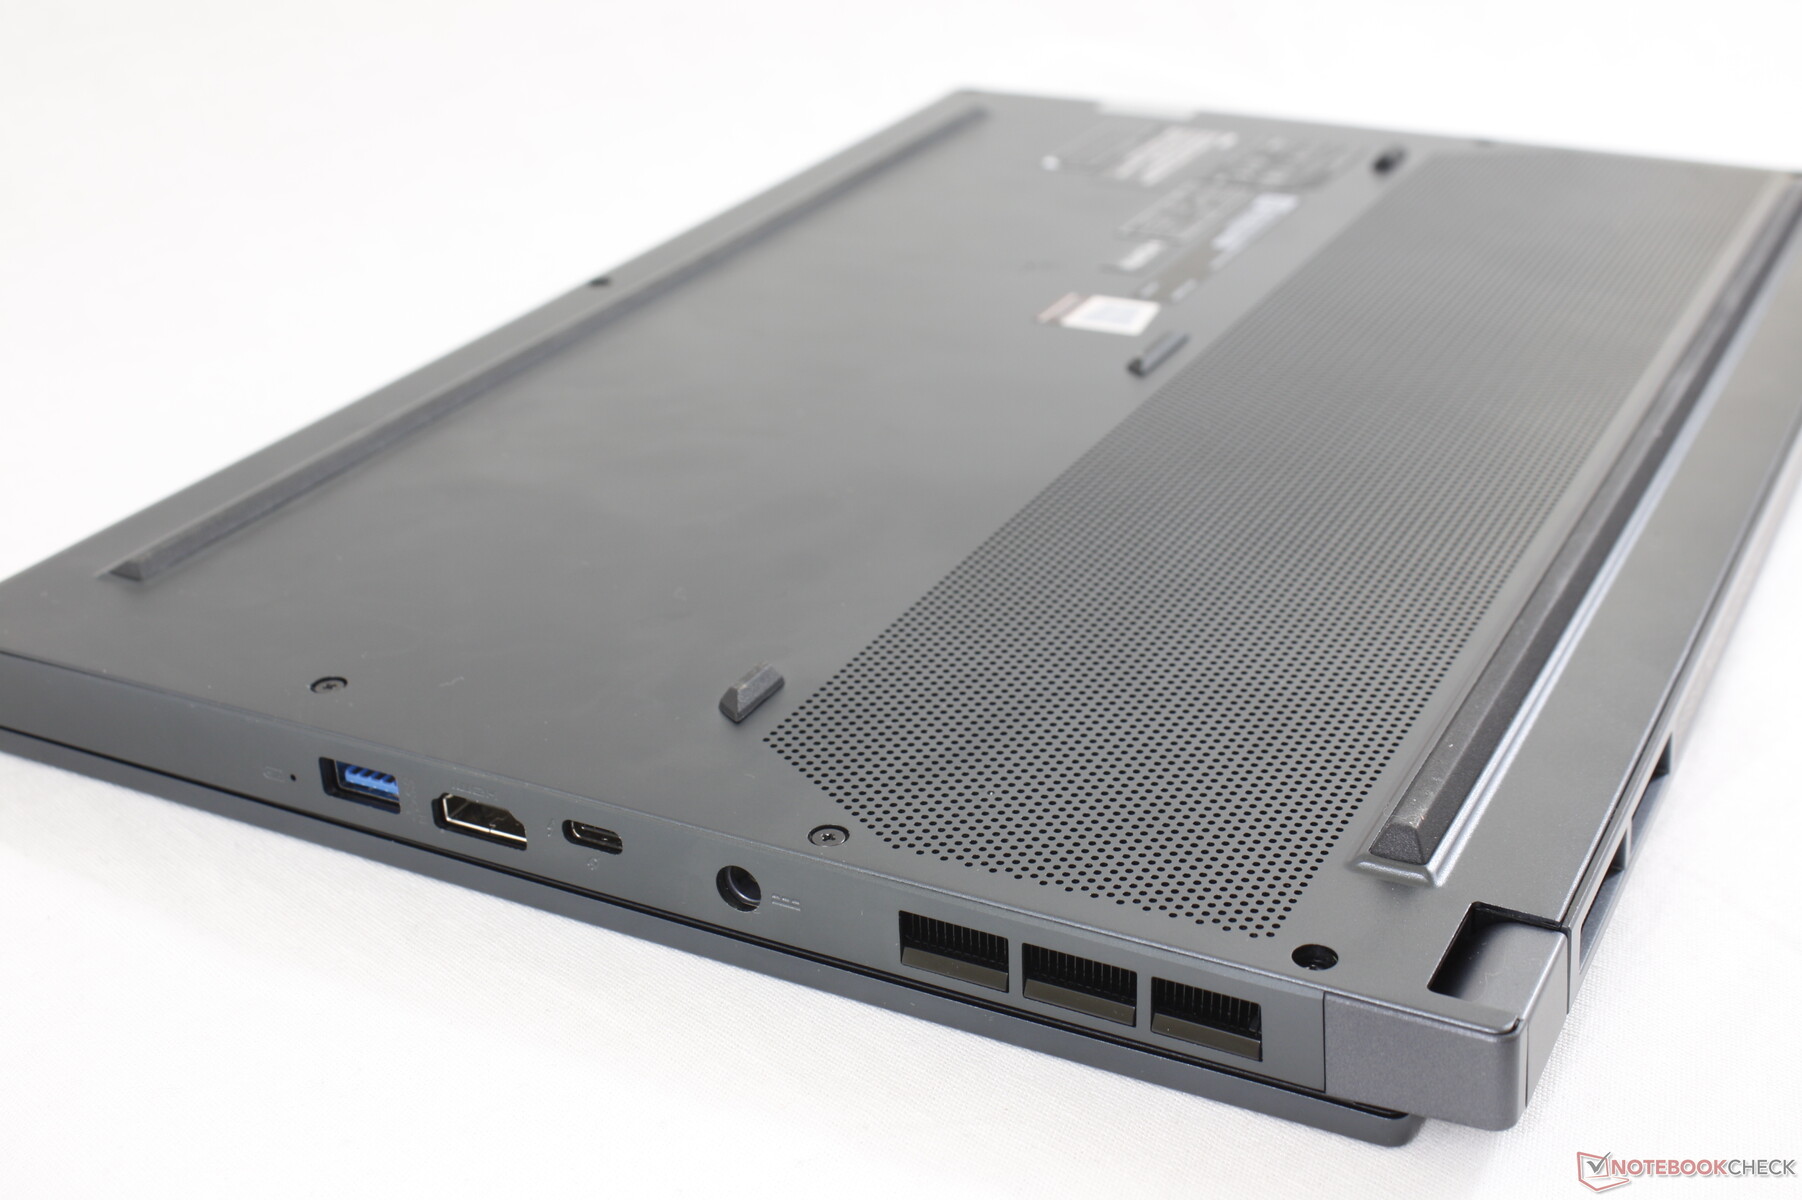
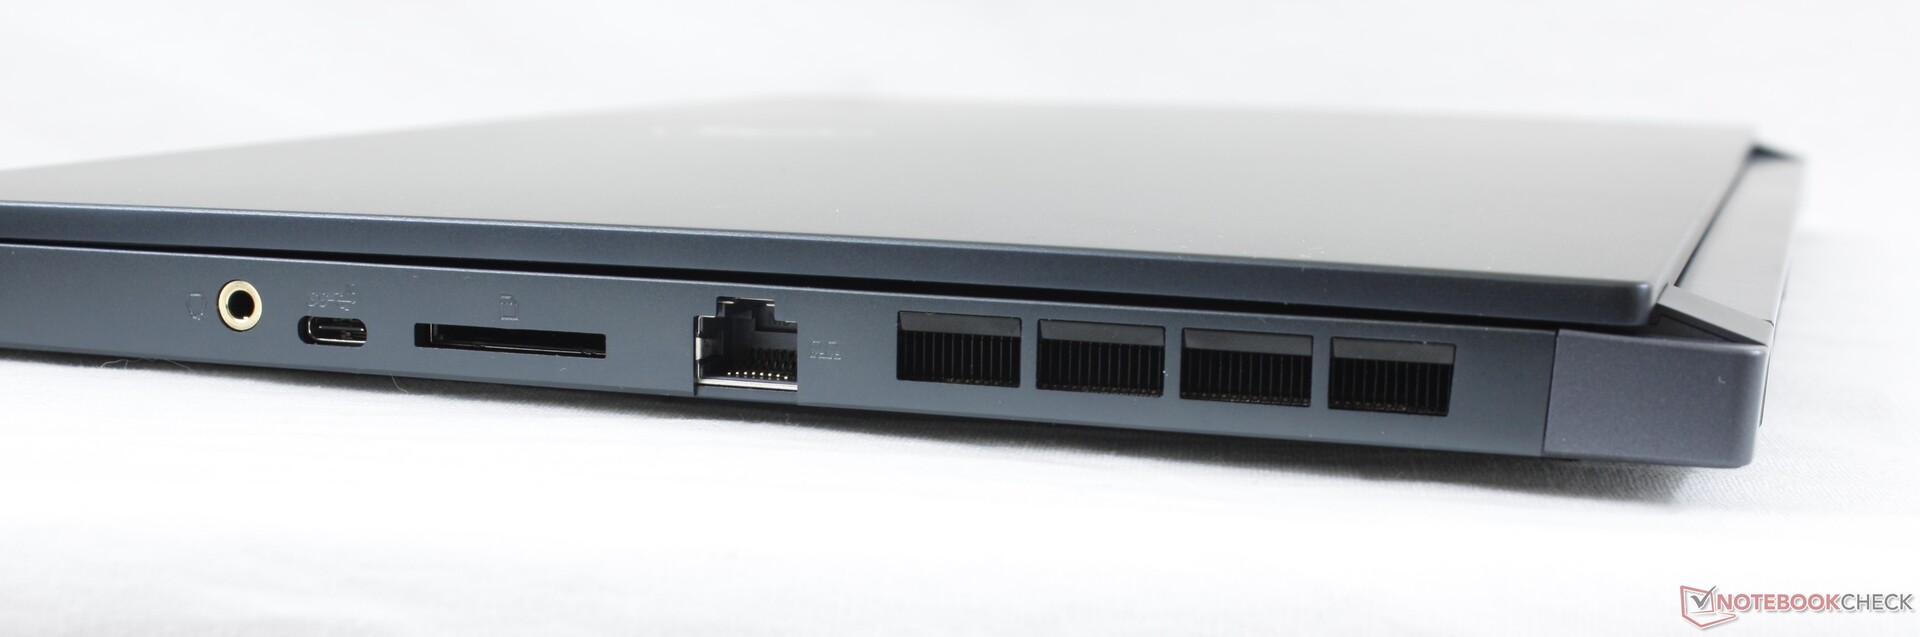
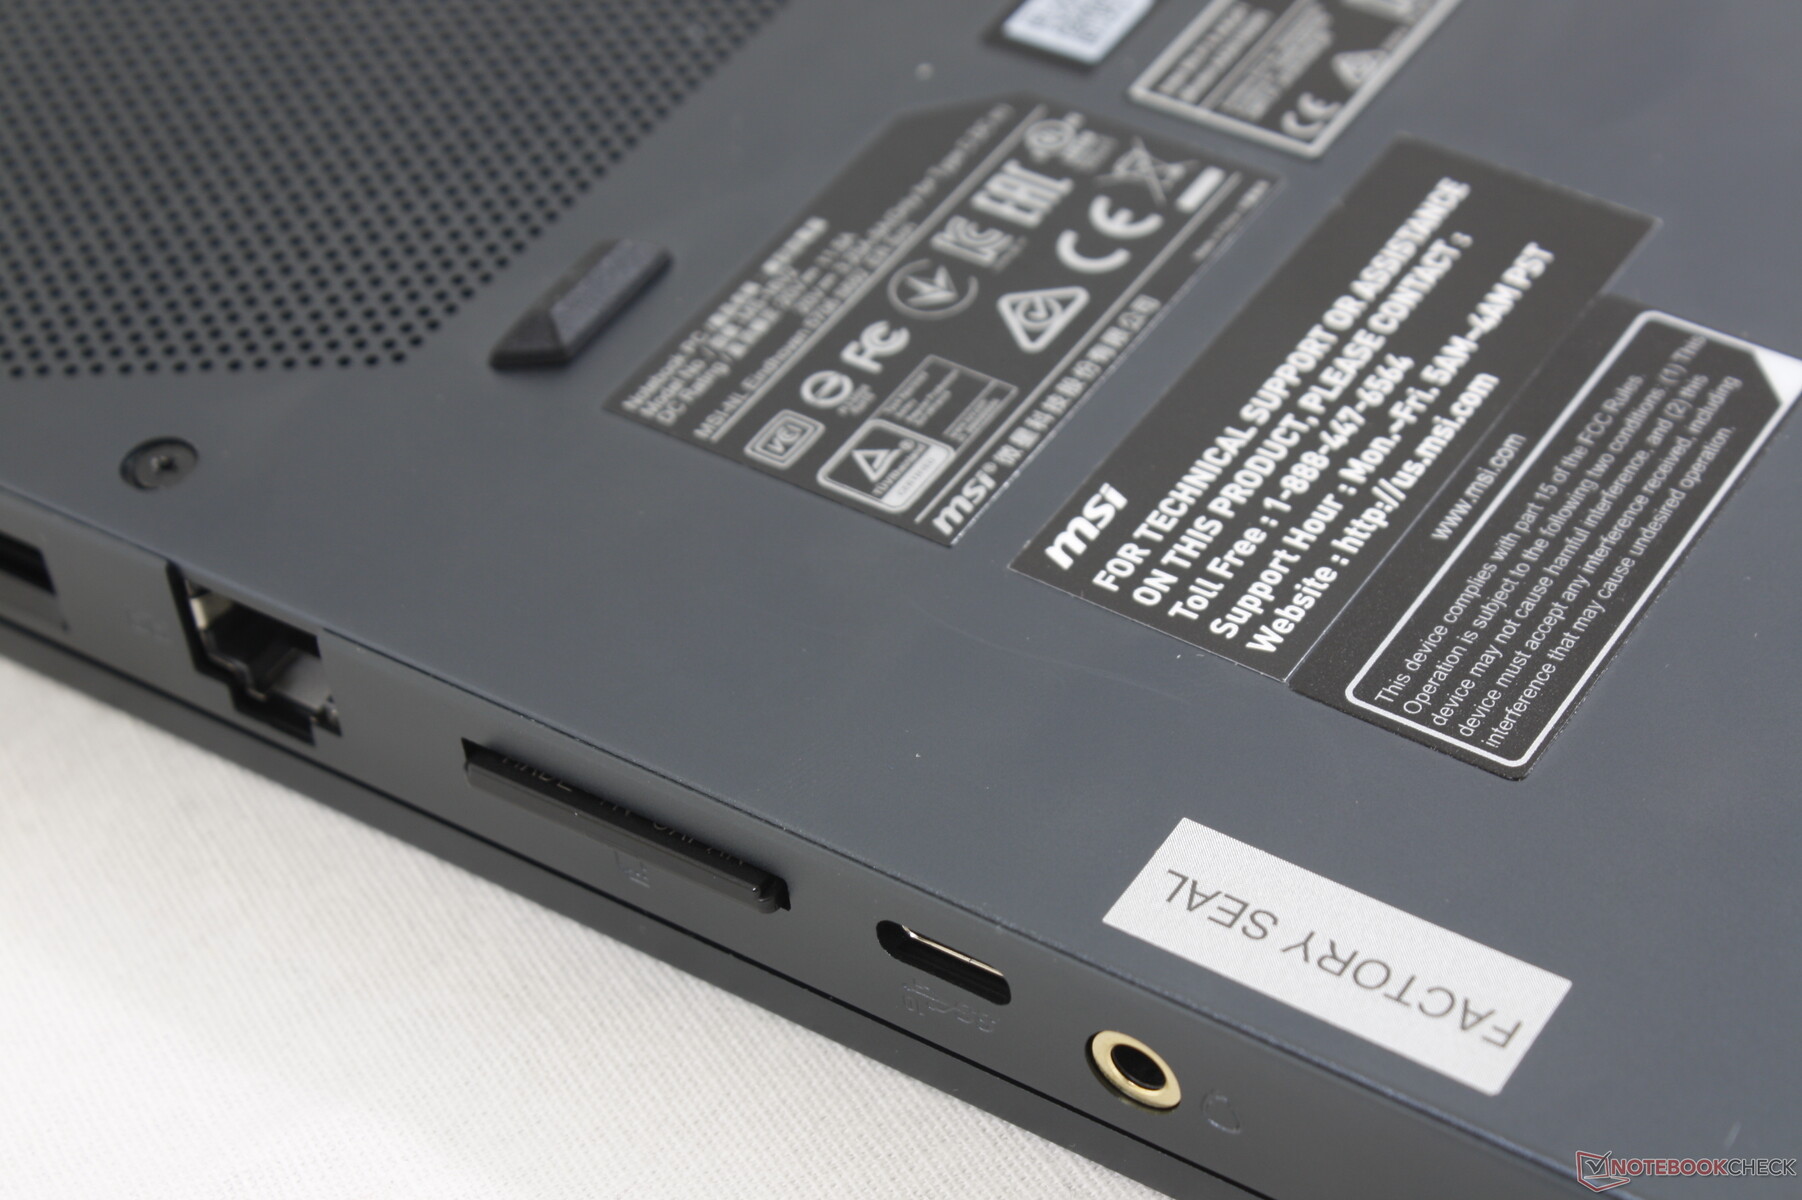
An easy way to distinguish the WS66 from the GS66 is by looking at their USB-A ports. The WS66 has only one USB-A port whereas the GS66 has three. In return, the WS66 gains a full-size SD card reader.
SD Card Reader
Transfer rates from the integrated SD reader are extremely fast. Moving 1 GB of pictures from our UHS-II test card to desktop takes less than 5 seconds compared to almost 40 seconds on the MSI WE75.
| SD Card Reader | |
| average JPG Copy Test (av. of 3 runs) | |
| MSI WS66 10TMT-207US (Toshiba Exceria Pro SDXC 64 GB UHS-II) | |
| Razer Blade 15 RTX 2070 Super Max-Q (Toshiba Exceria Pro SDXC 64 GB UHS-II) | |
| Dell Precision 5550 P91F (Toshiba Exceria Pro SDXC 64 GB UHS-II) | |
| Dell Precision 7550 (Toshiba Exceria Pro SDXC 64 GB UHS-II) | |
| MSI WS63VR 7RL-023US | |
| MSI WE75 9TK (Toshiba Exceria Pro SDXC 64 GB UHS-II) | |
| maximum AS SSD Seq Read Test (1GB) | |
| MSI WS63VR 7RL-023US | |
| MSI WS66 10TMT-207US (Toshiba Exceria Pro SDXC 64 GB UHS-II) | |
| Razer Blade 15 RTX 2070 Super Max-Q (Toshiba Exceria Pro SDXC 64 GB UHS-II) | |
| Dell Precision 5550 P91F (Toshiba Exceria Pro SDXC 64 GB UHS-II) | |
| Dell Precision 7550 (Toshiba Exceria Pro SDXC 64 GB UHS-II) | |
| MSI WE75 9TK (Toshiba Exceria Pro SDXC 64 GB UHS-II) | |
Communication
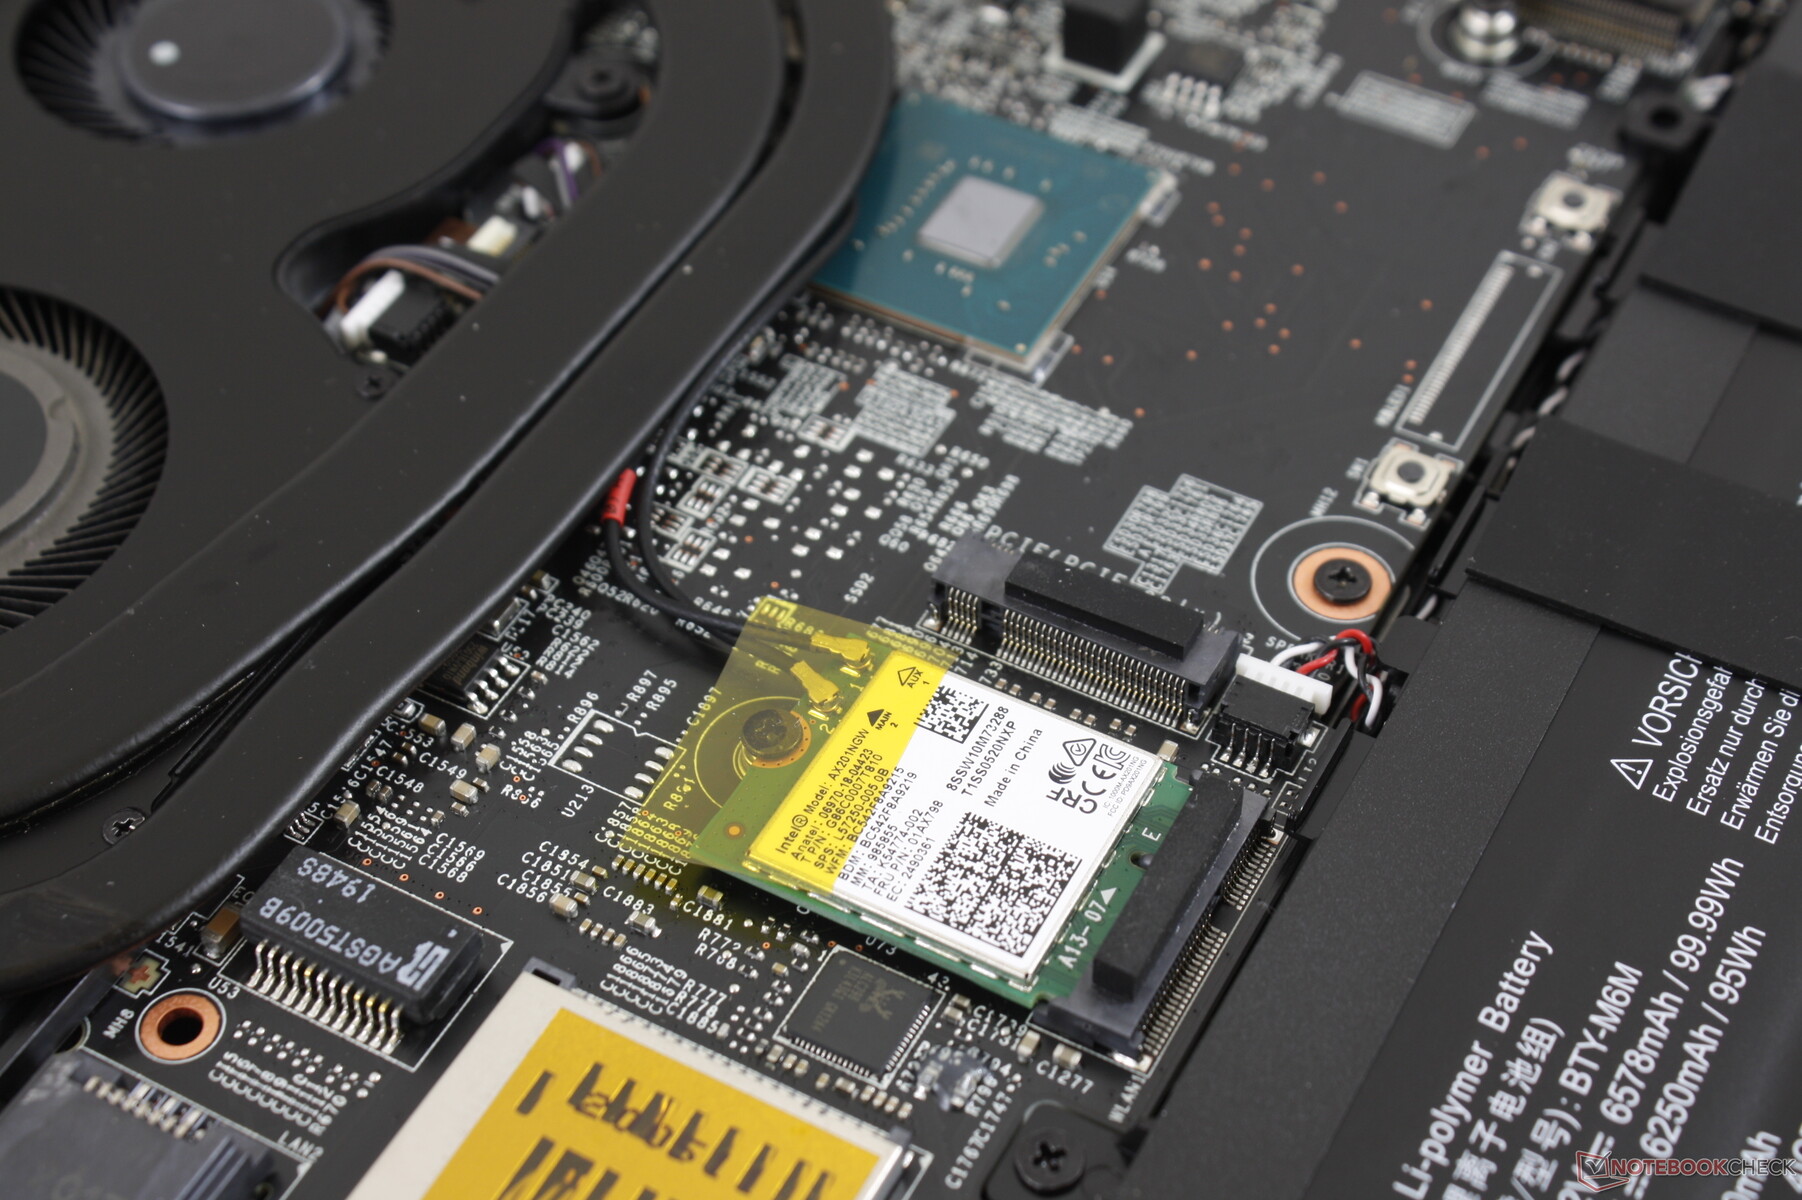
The Intel AX201 comes standard for Wi-Fi 6 and Bluetooth 5.1 connectivity. Interestingly, receive rates top out at about 900 Mbps when we know they are capable of much higher, but we otherwise experienced no issues when connected to our Netgear RAX200 router.
Webcam


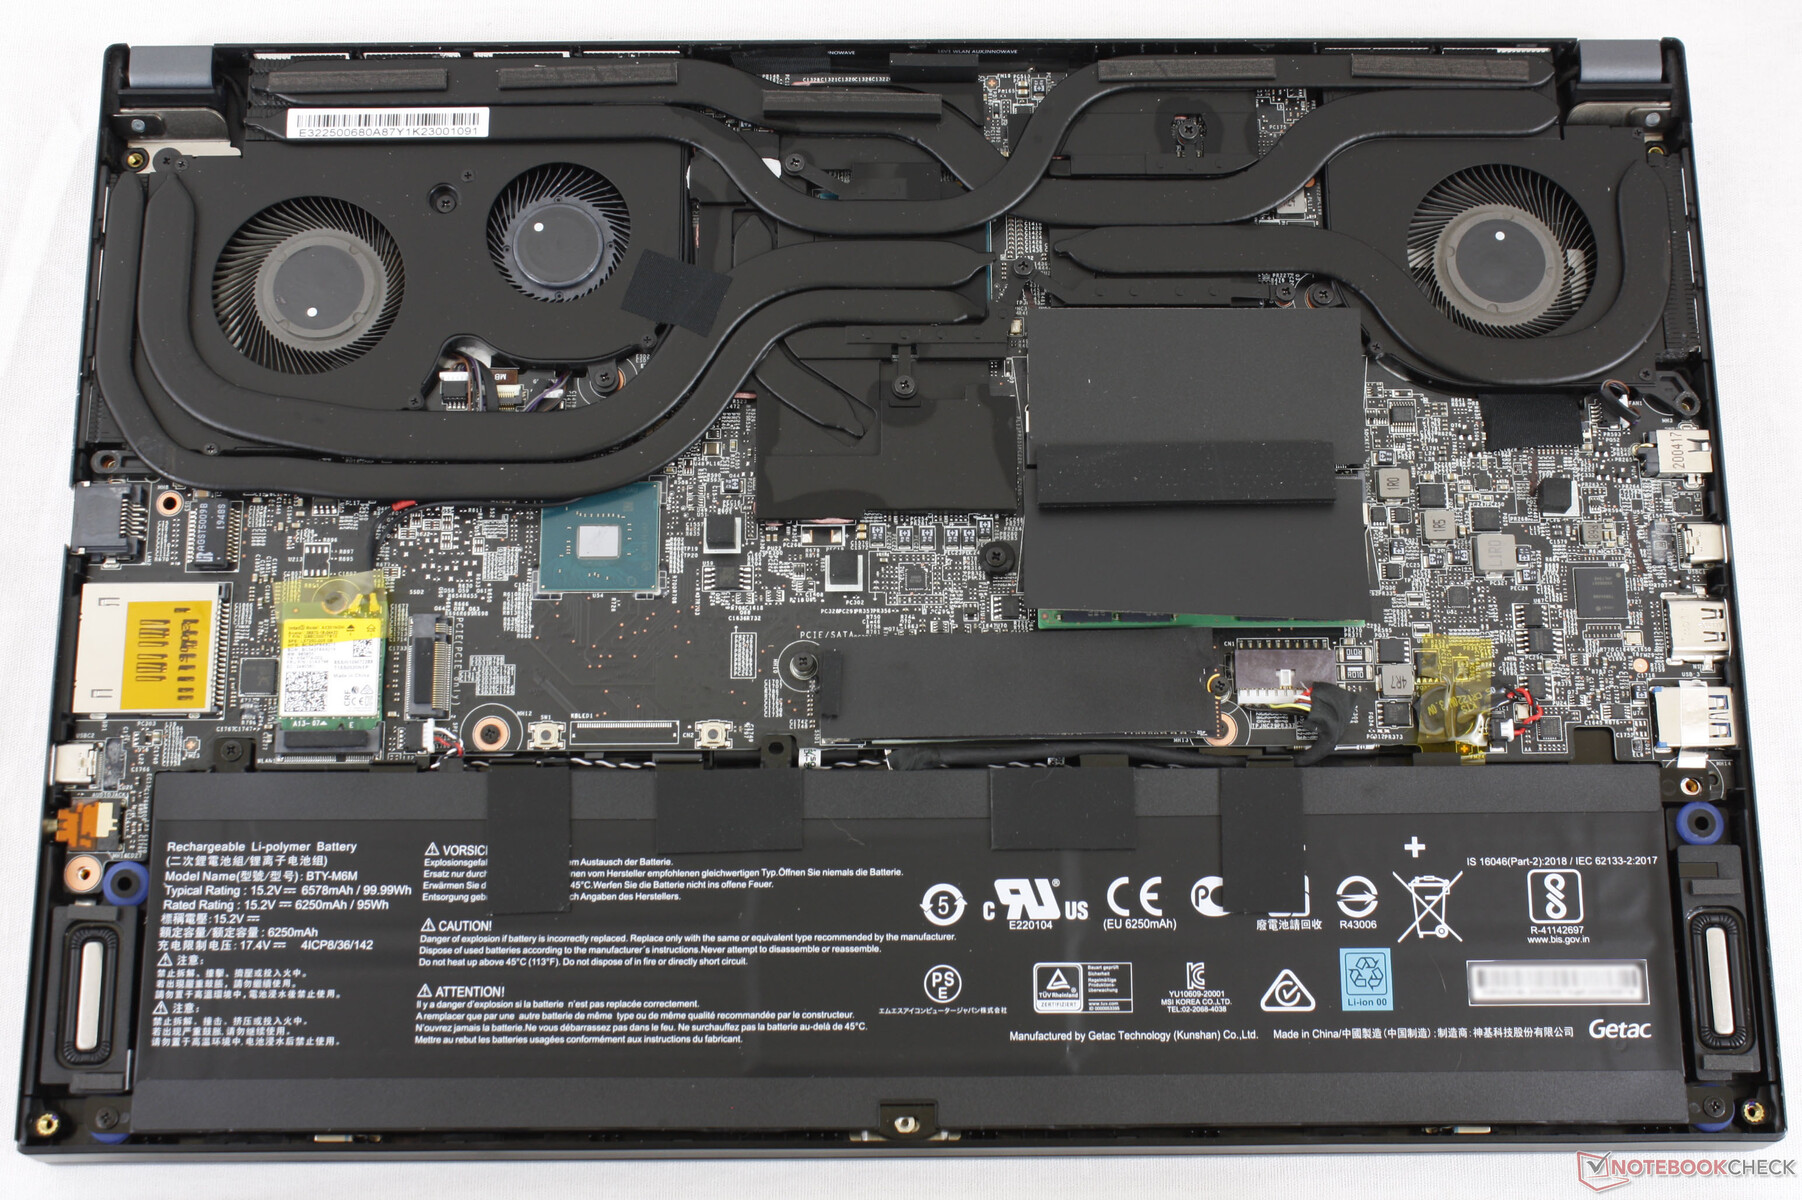
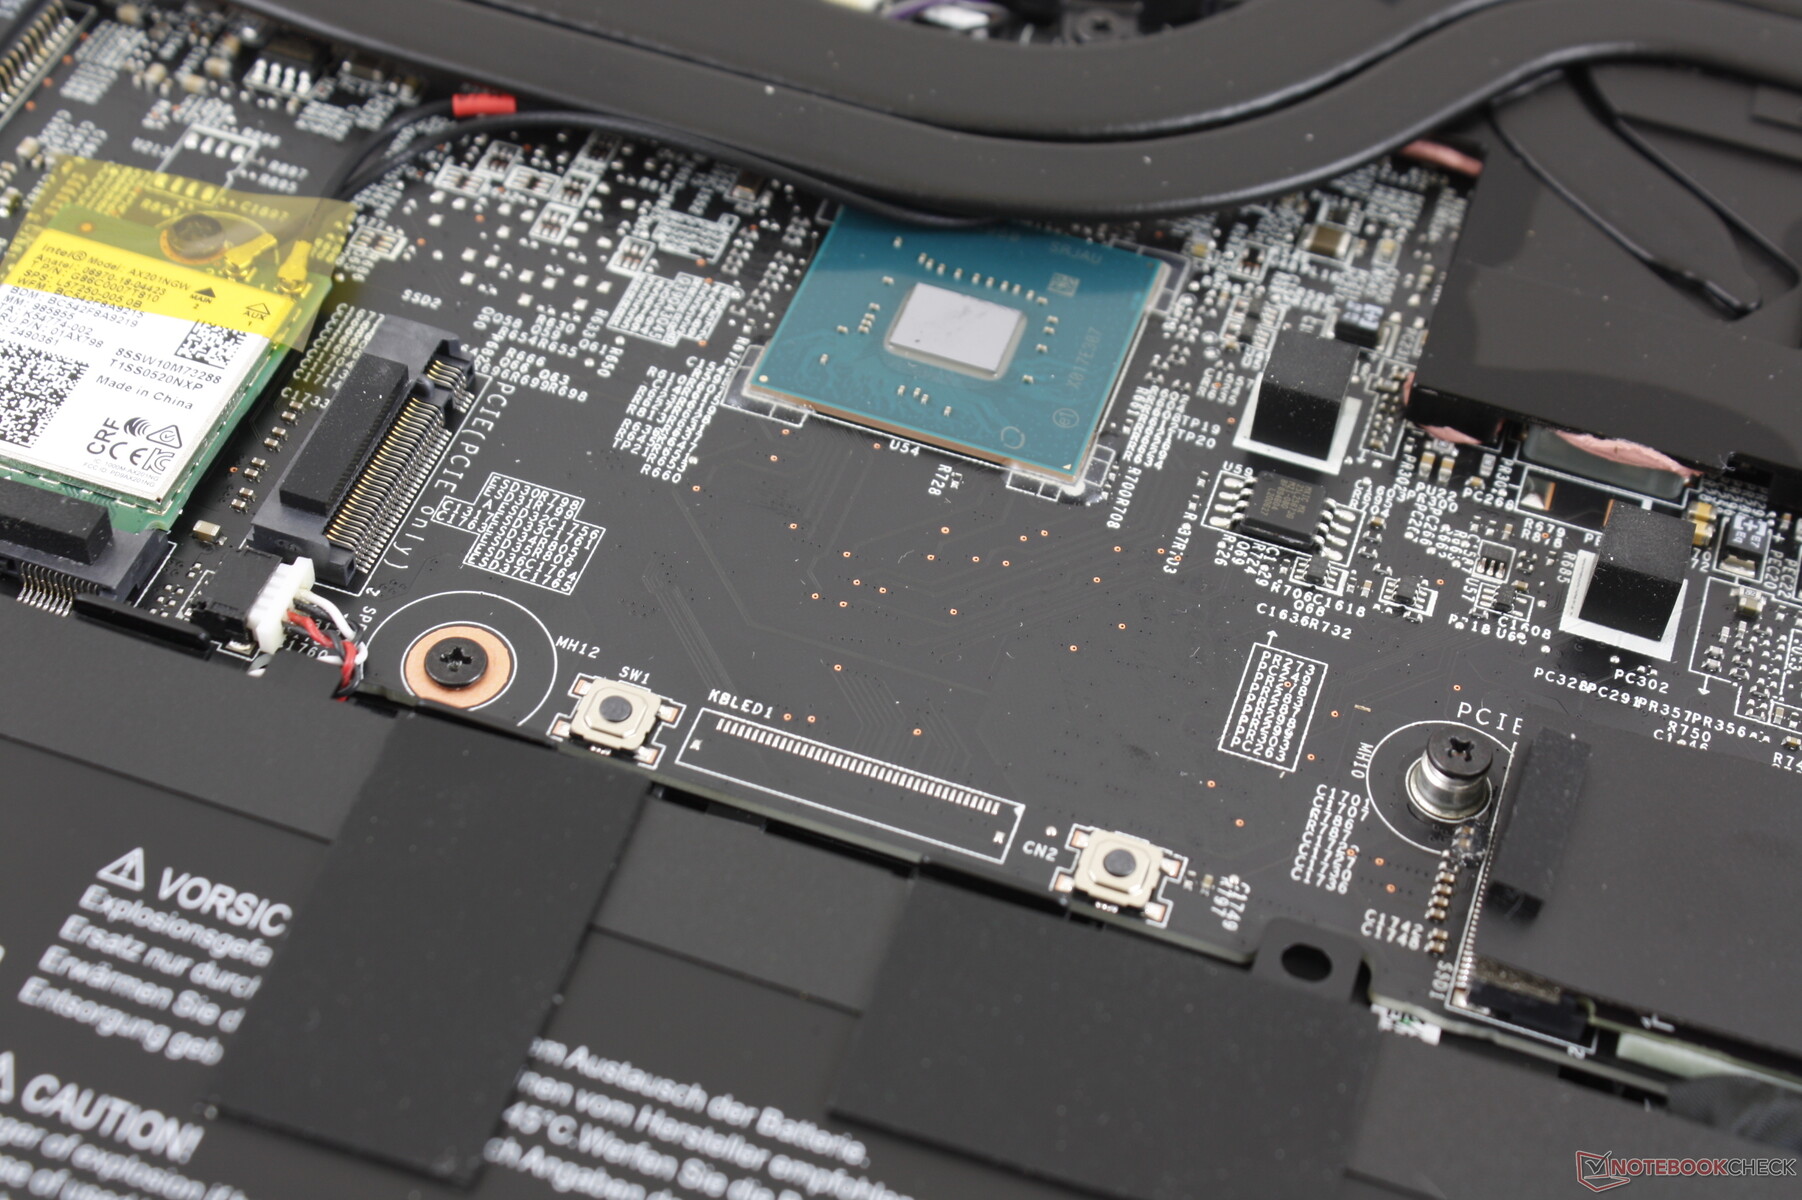
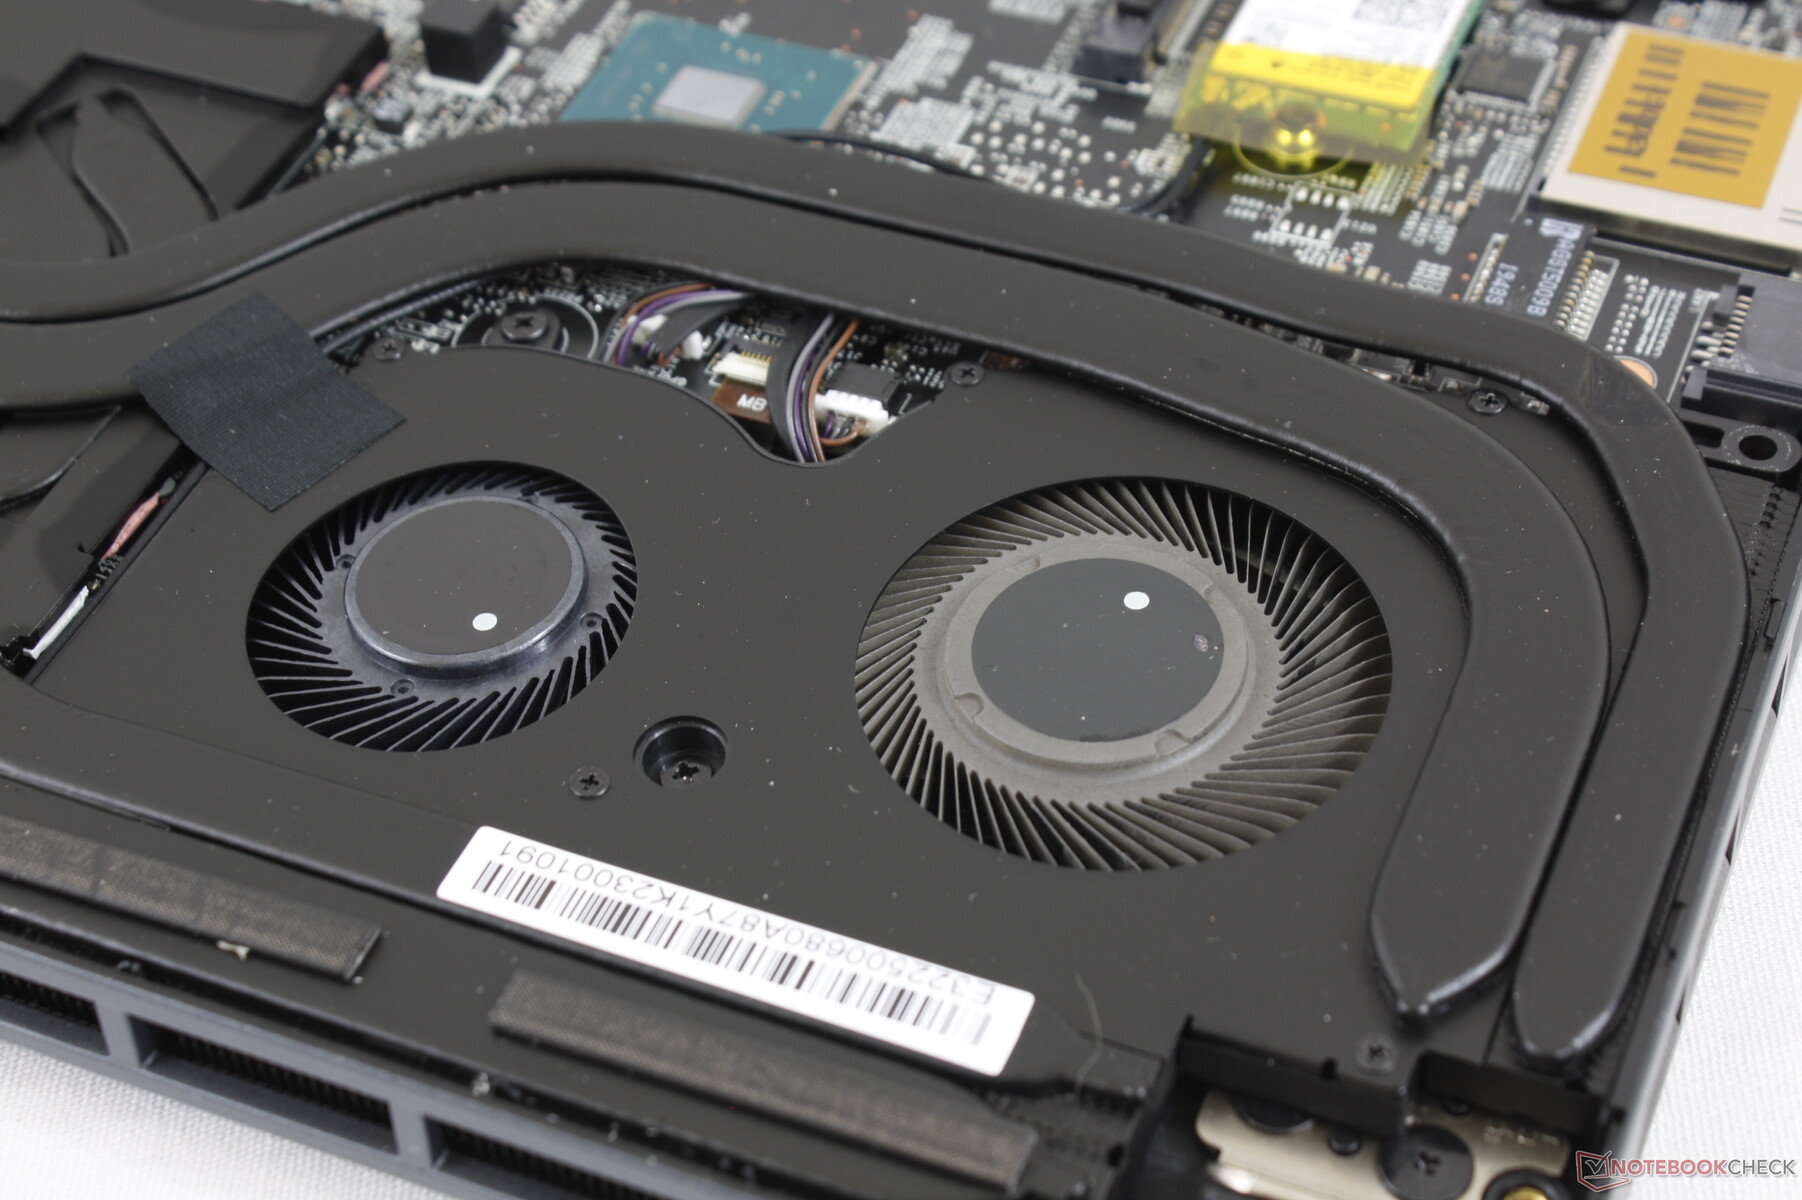
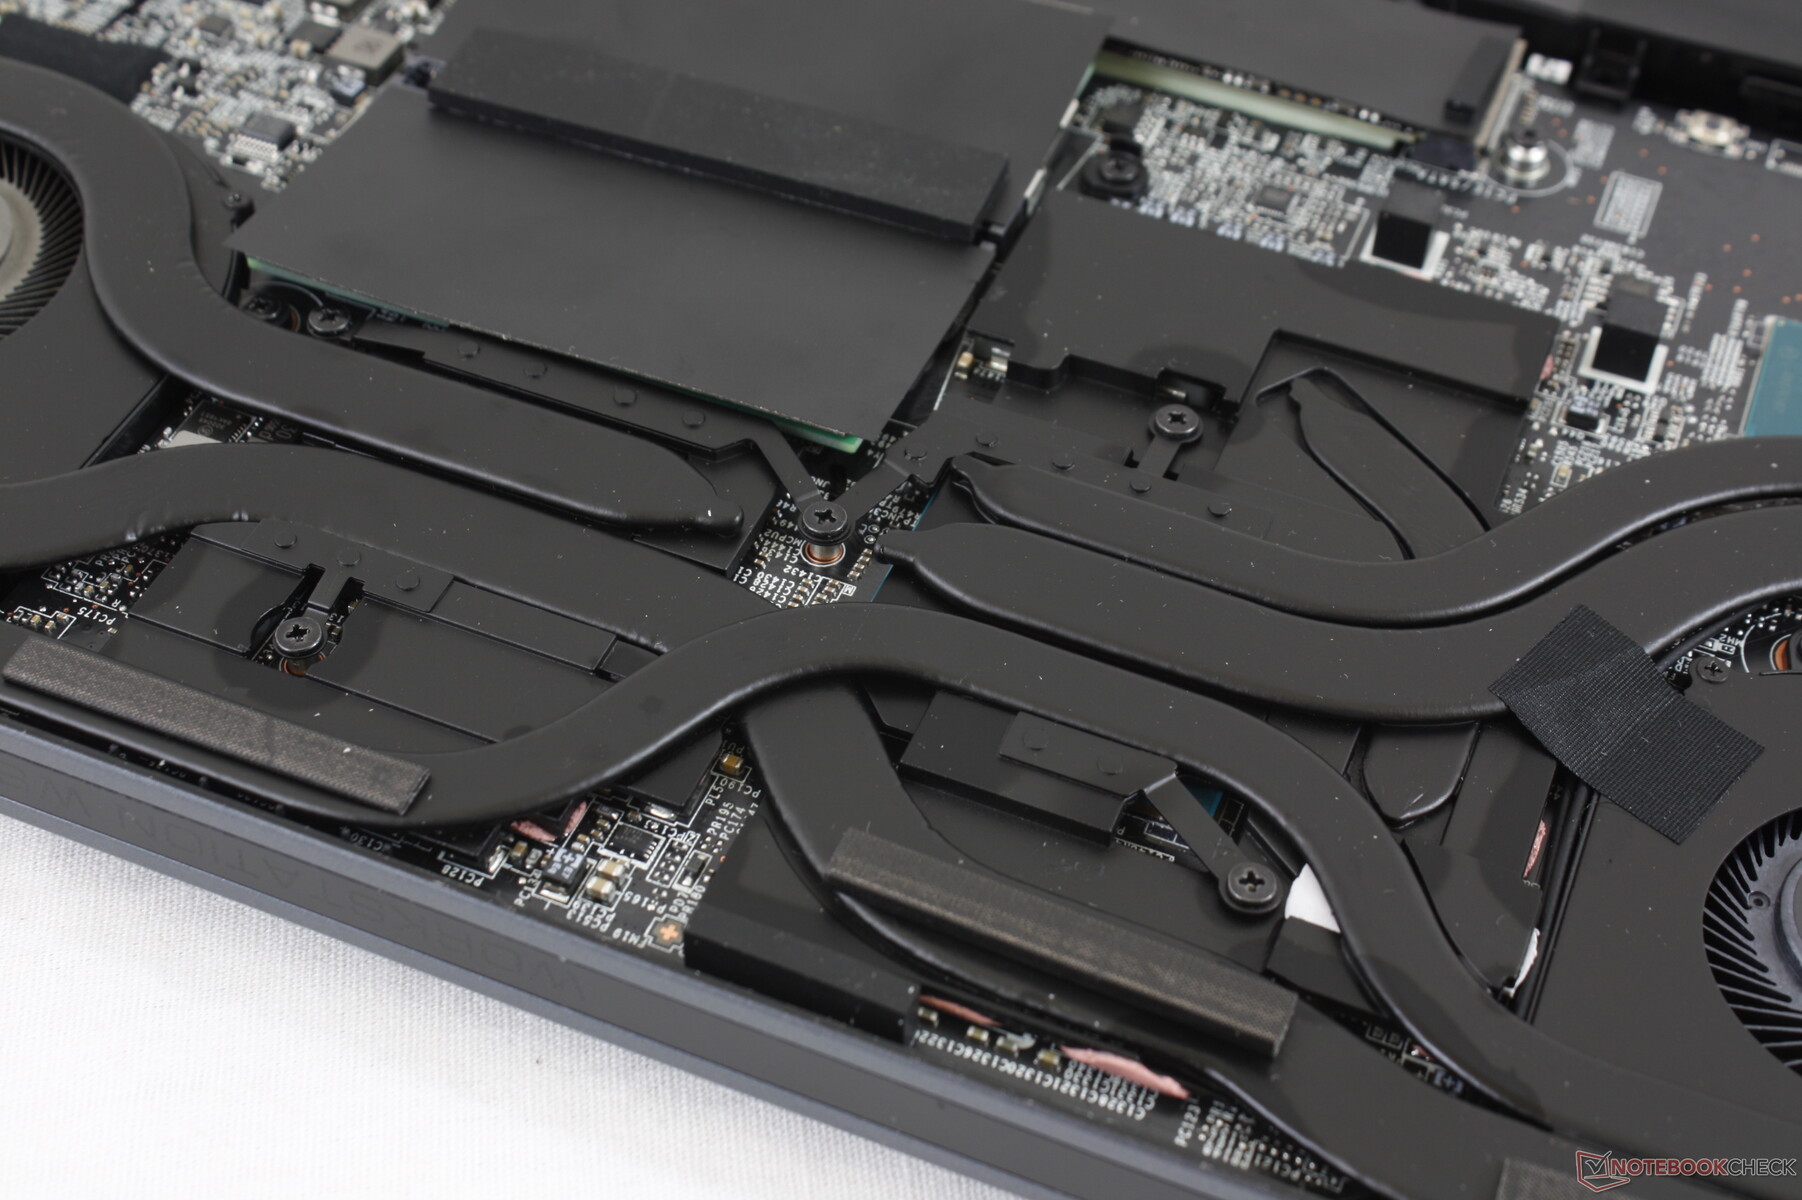
Maintenance
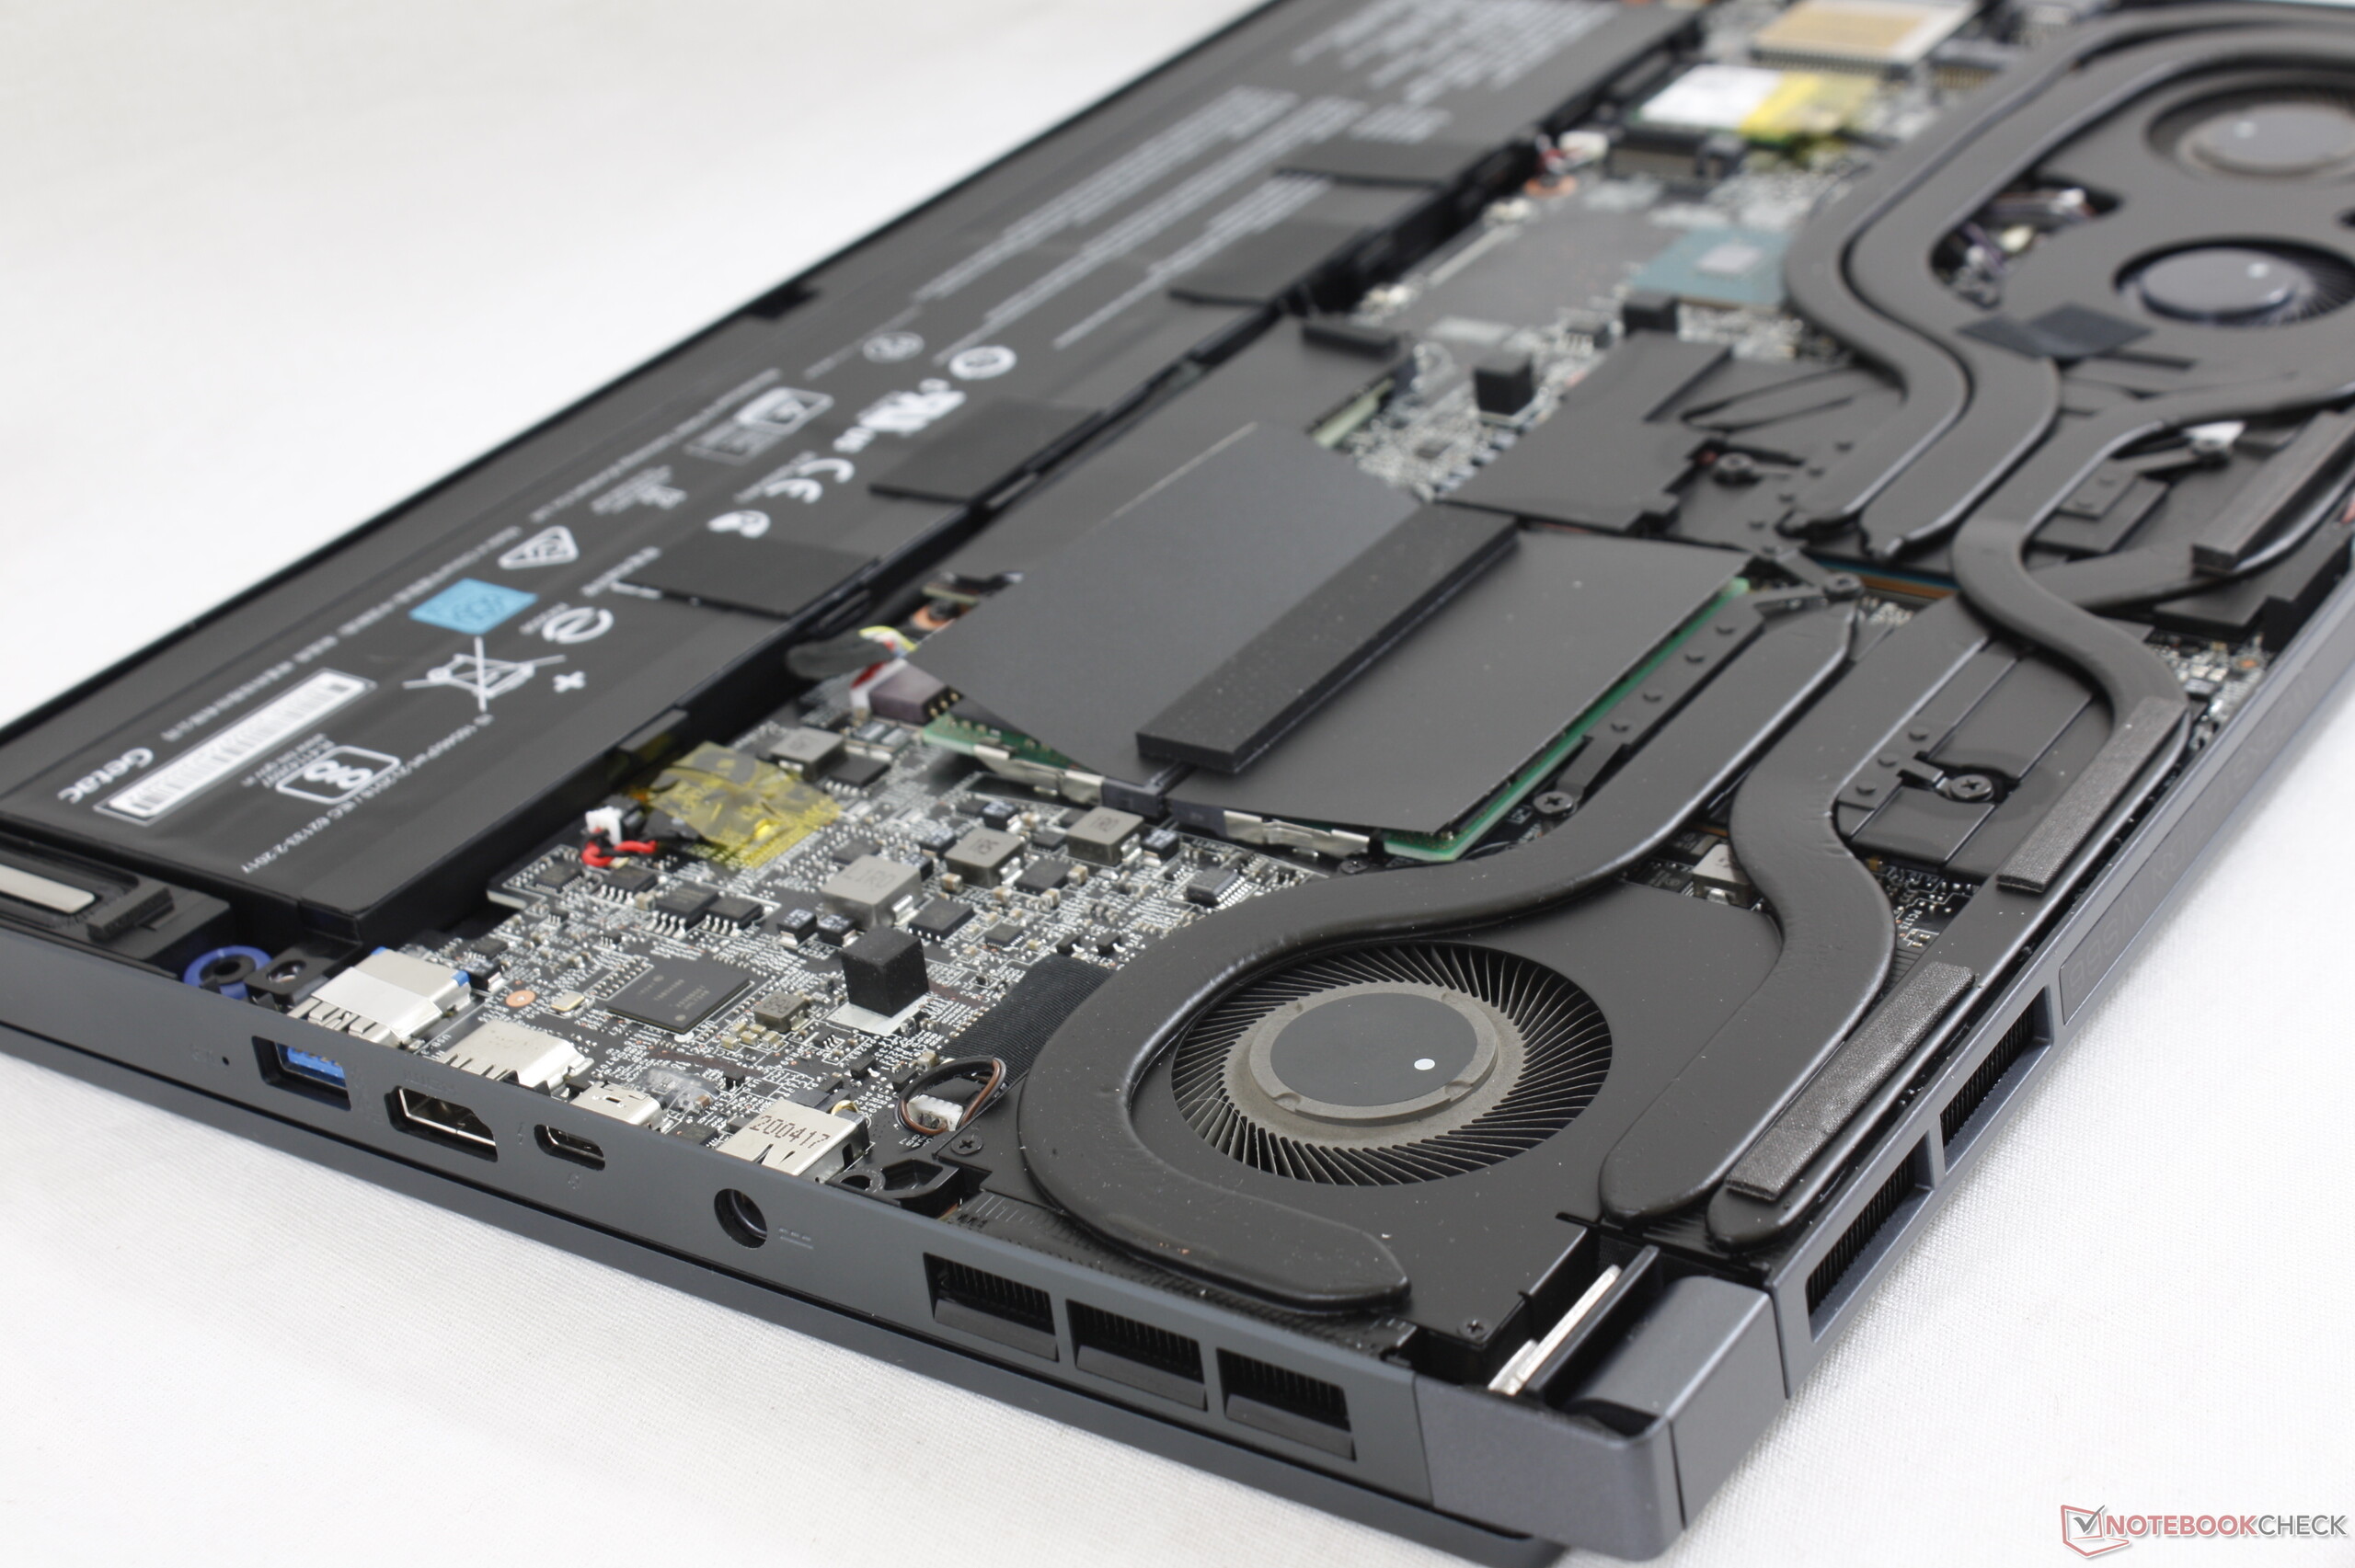
The bottom panel is secured by 9 Philips screws. Removing it is tricky because the sharp edges and corners are latched tightly to the base when compared to the bottom panels on the WS63 or Razer Blade 15 Studio.
Accessories and Warranty
There are no extras in the box other than the AC adapter and paperwork. MSI offers three-year limited warranty with on-site service as standard.
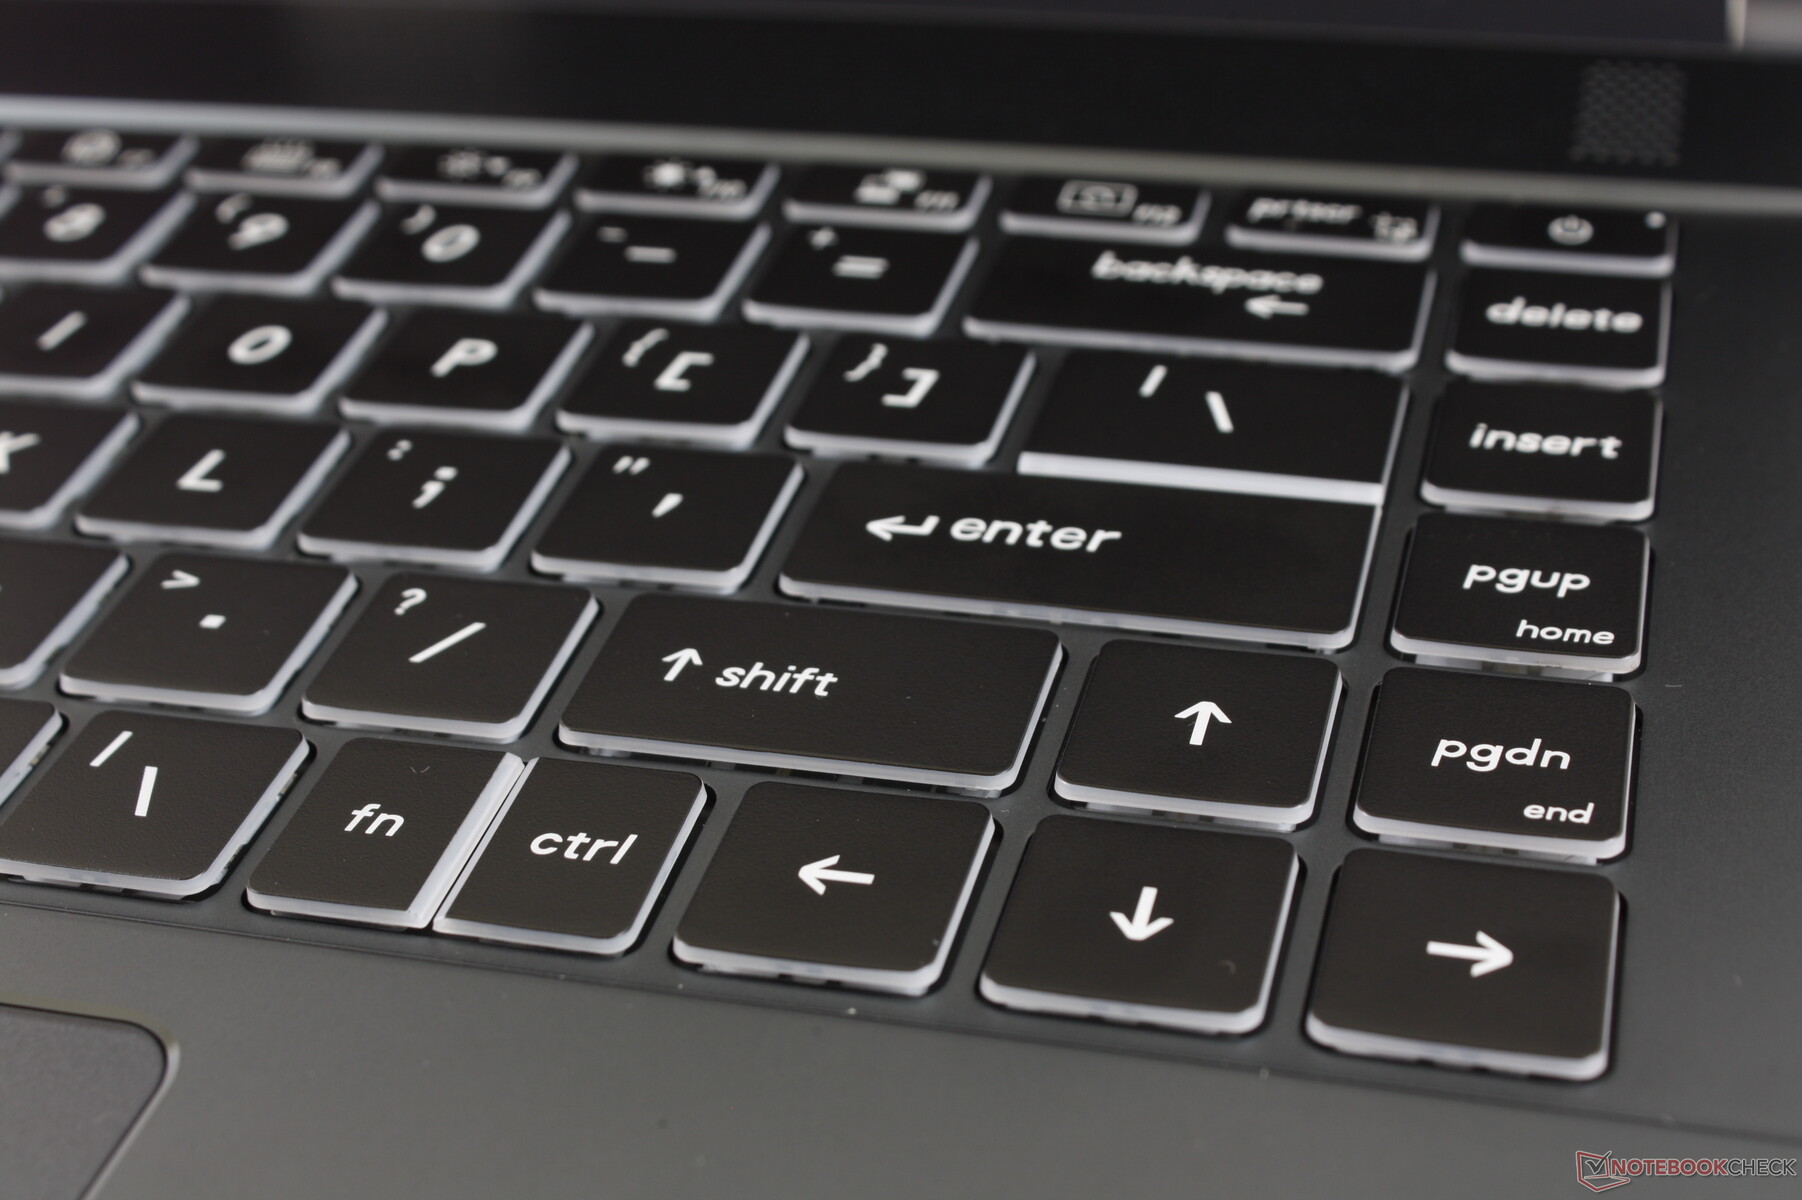
Input Devices
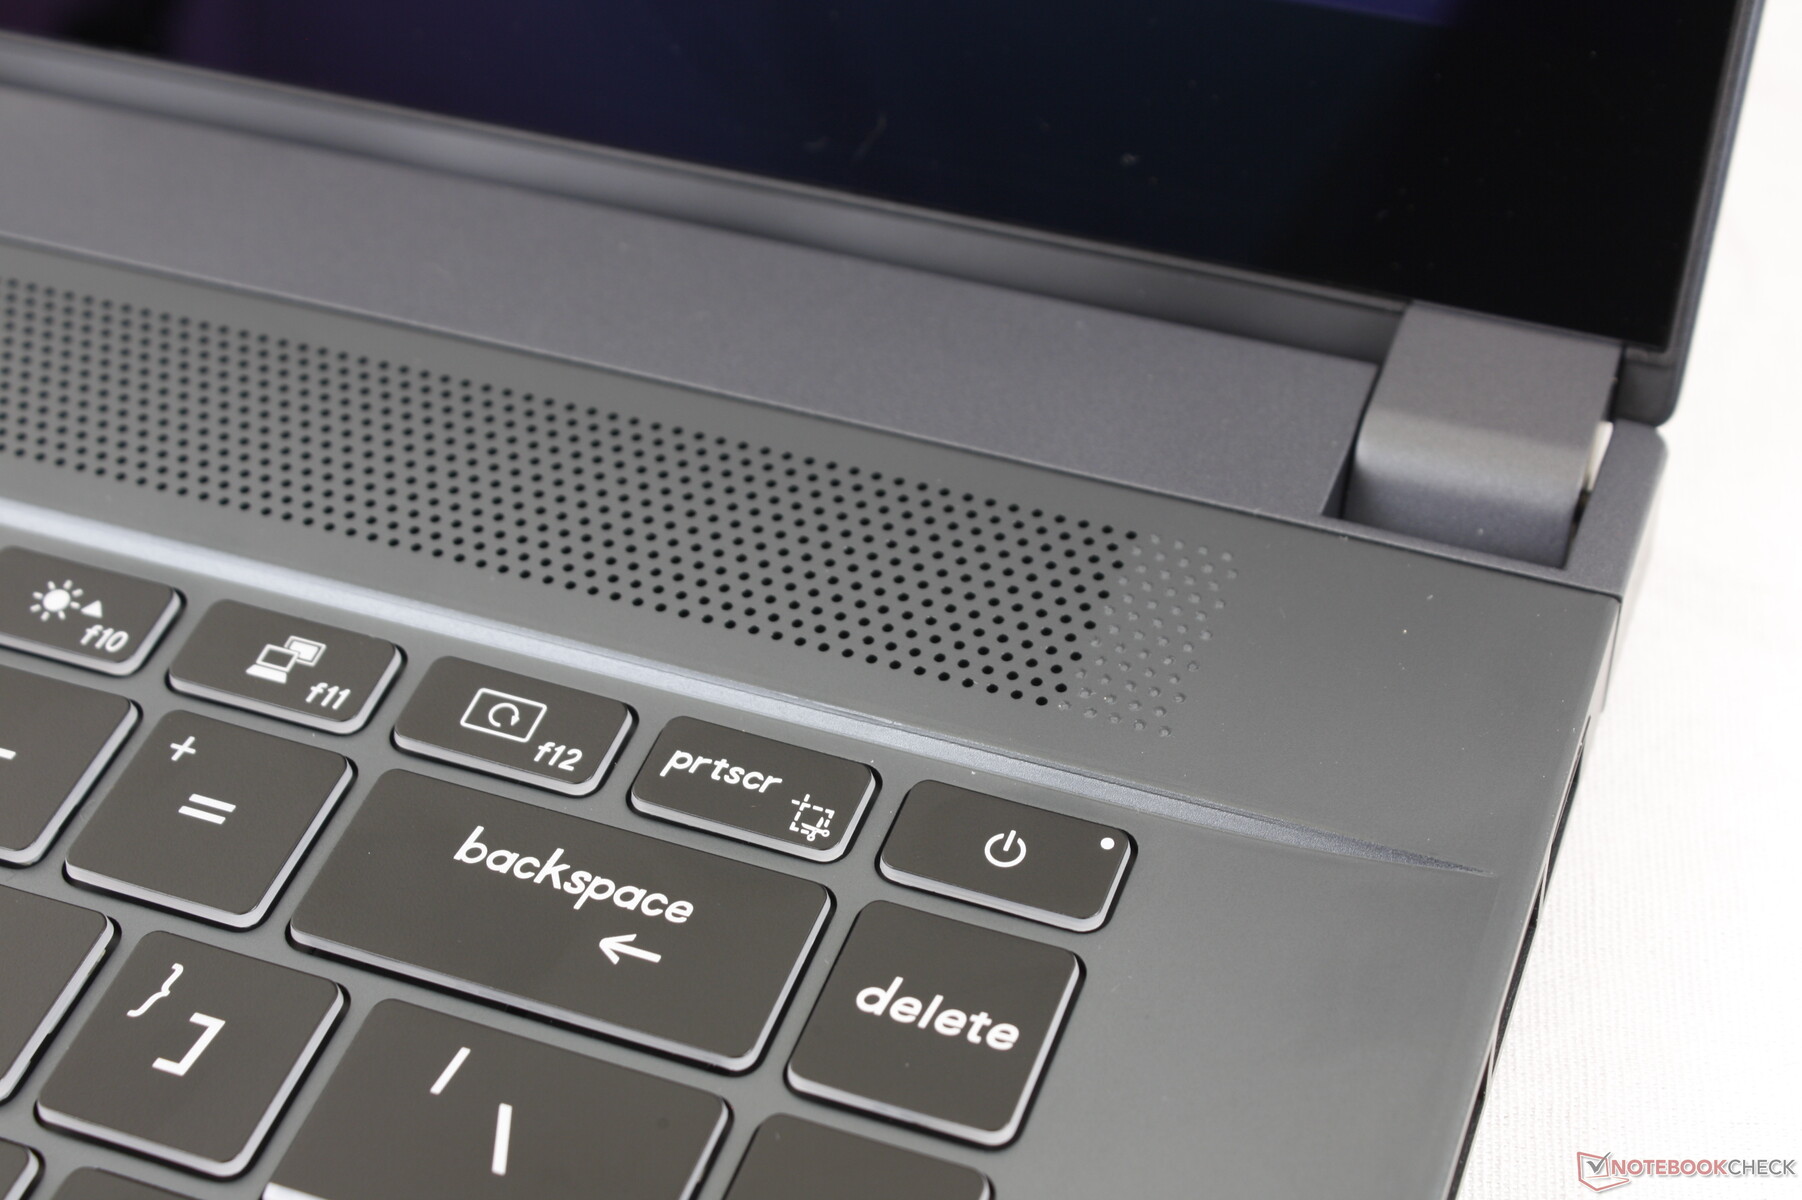
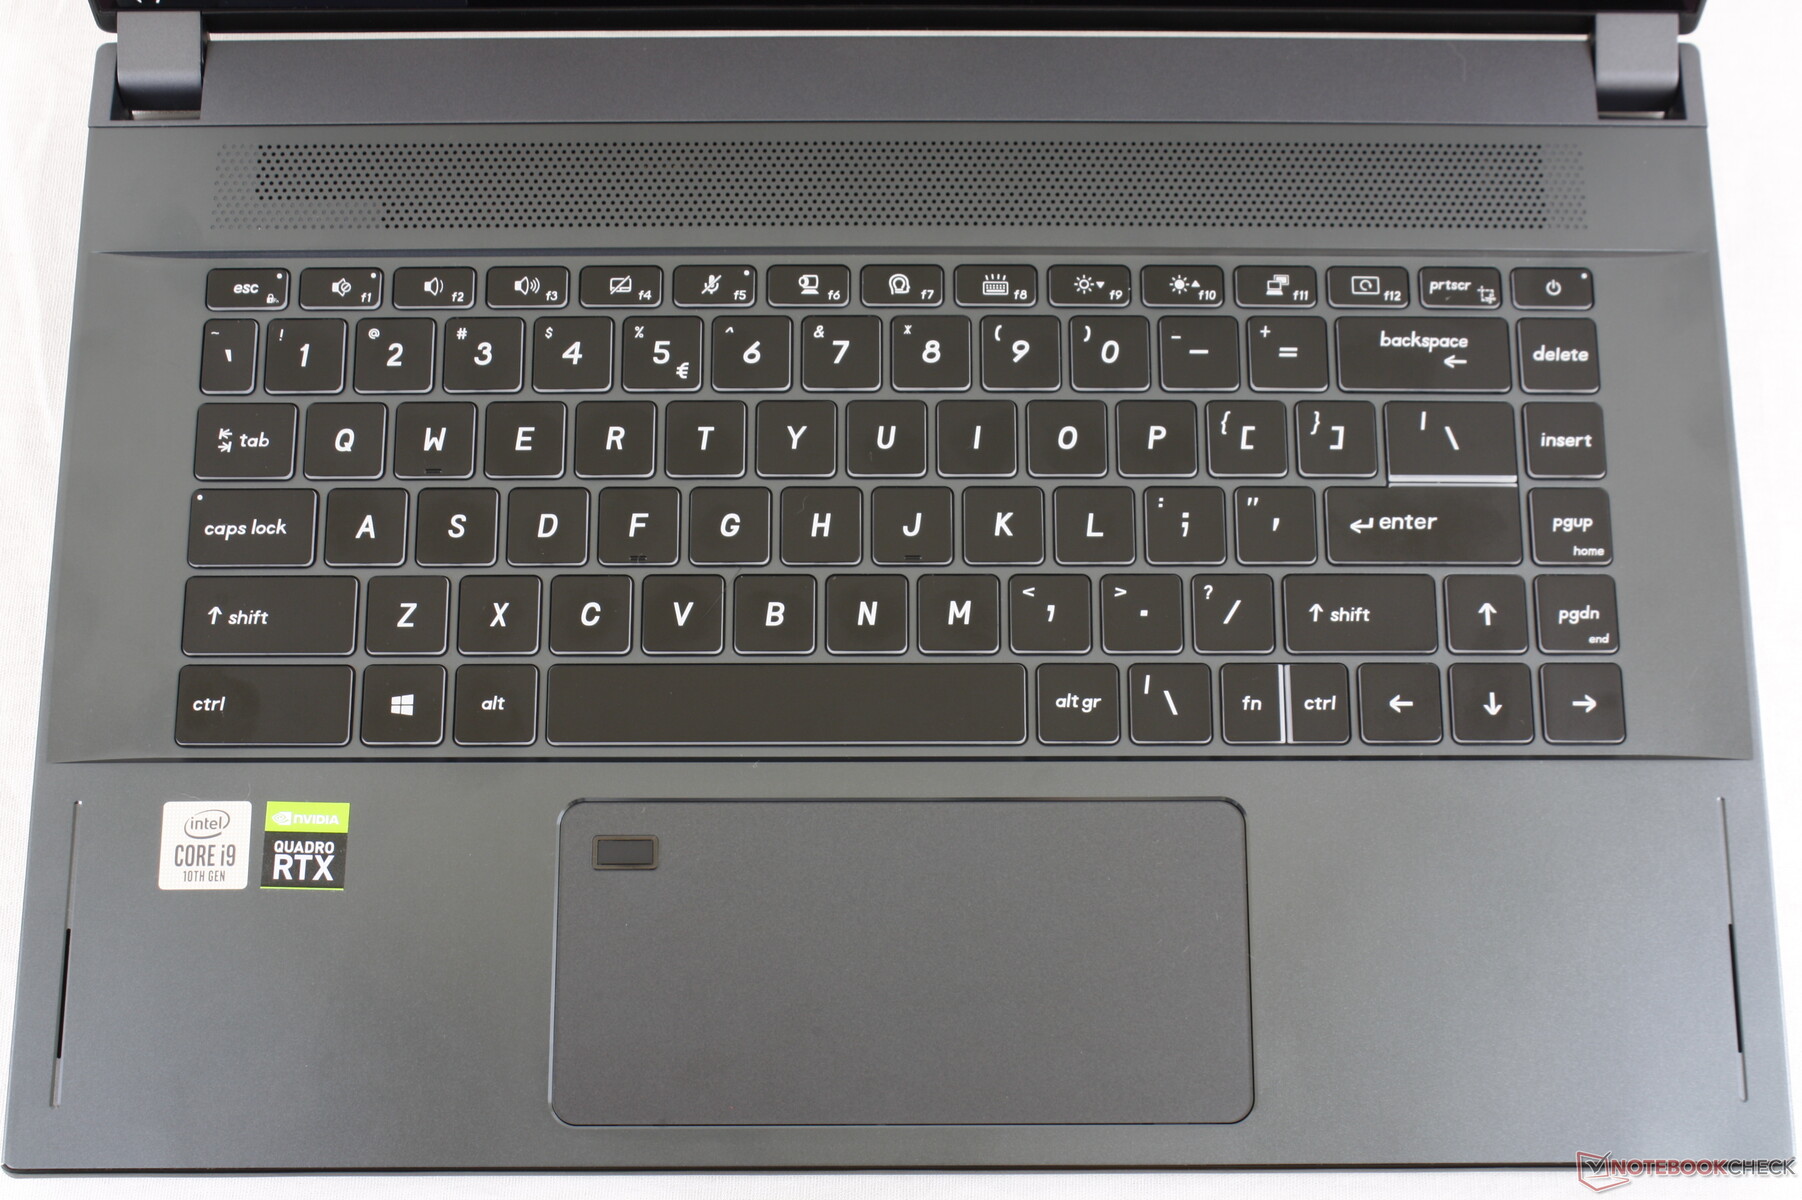
Keyboard
Key layout and feedback are identical to the GS66 for better or worse but with different font styles and secondary functions. The brightness hotkeys, for example, are switched on the WS66. We find the keys to be too shallow with weak feedback especially when compared to the superior keyboards on MSI's own WE or WT series. If you're already accustomed to typing on Ultrabooks, however, then the WS66 won't feel all that different.
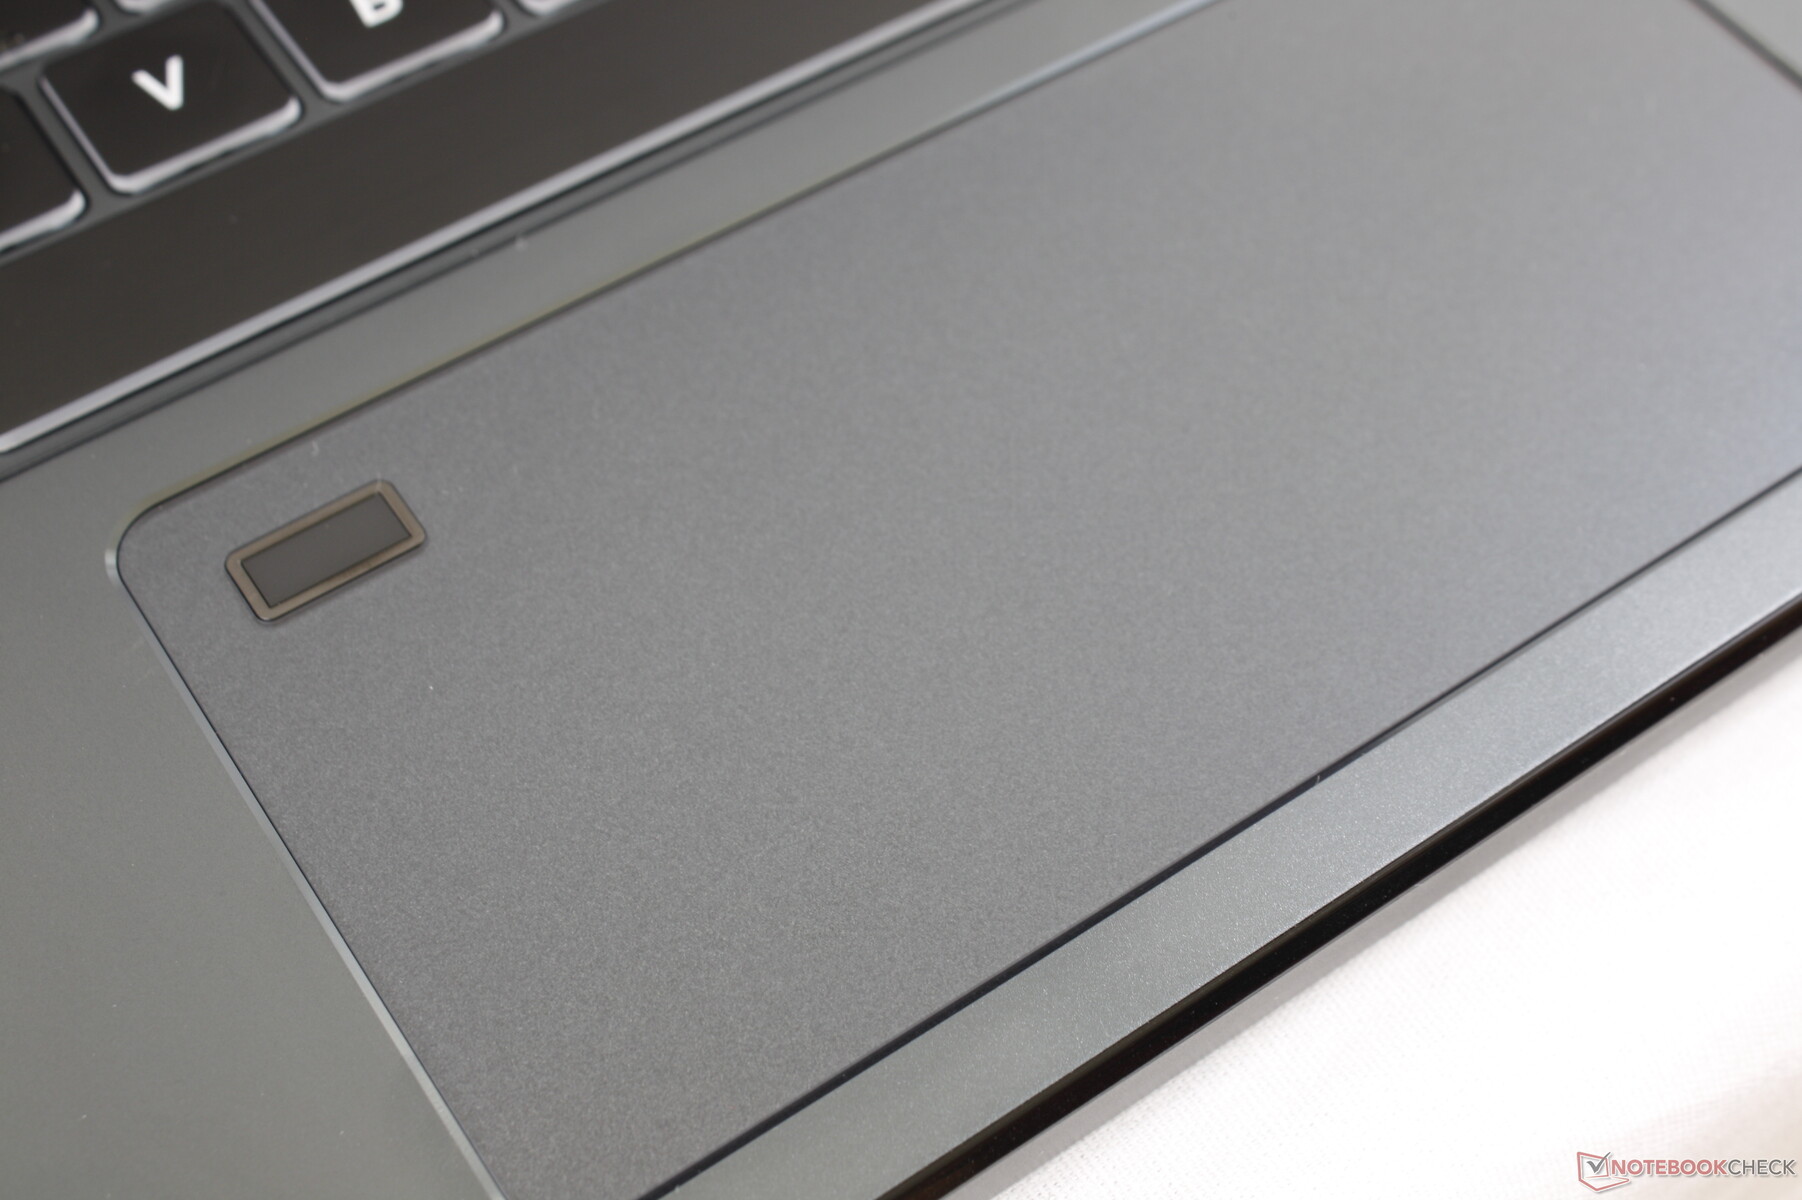
Touchpad
The wide Precision clickpad (14 x 6.5 cm) is smooth with only a little sticking when gliding at slow speeds. Unfortunately, the integrated mouse buttons are soft in feedback with shallow travel for an unsatisfying experience. Furthermore, clicking on the right half of the clickpad feels spongier than the left half when it should be uniform from one edge to the other. The extra space is nice for multi-touch inputs, but we prefer the accuracy of dedicated mouse buttons like those on the MSI WT75.
An annoying consequence of the elongated clickpad is that your right palm will almost always be pressing on it while typing. Palm rejection isn't perfect and so you can expect some accidental mouse inputs every now and then.

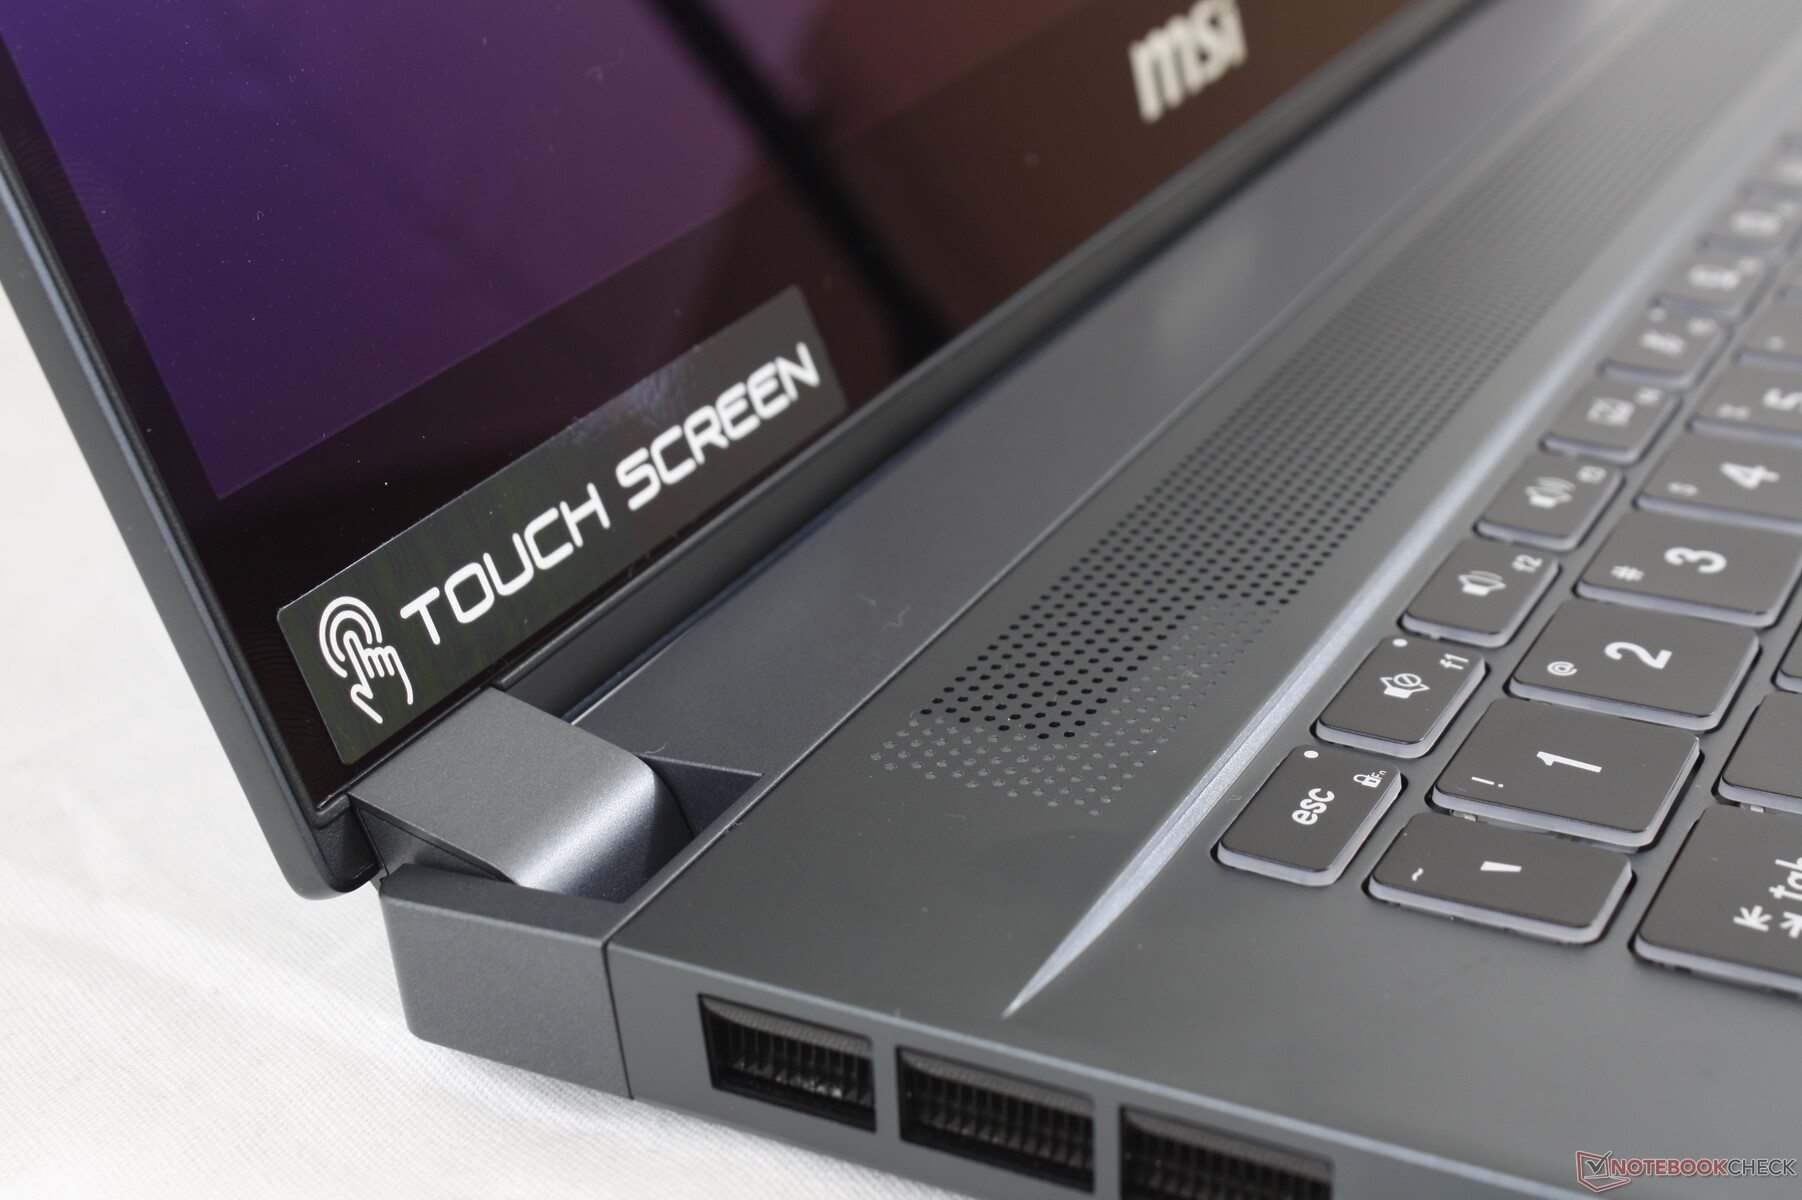
Display
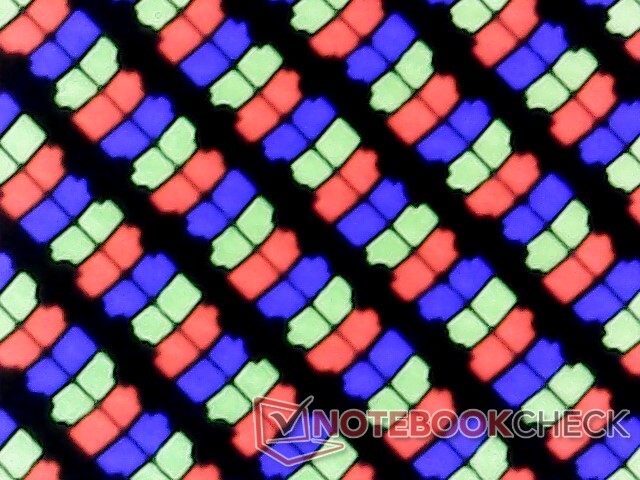
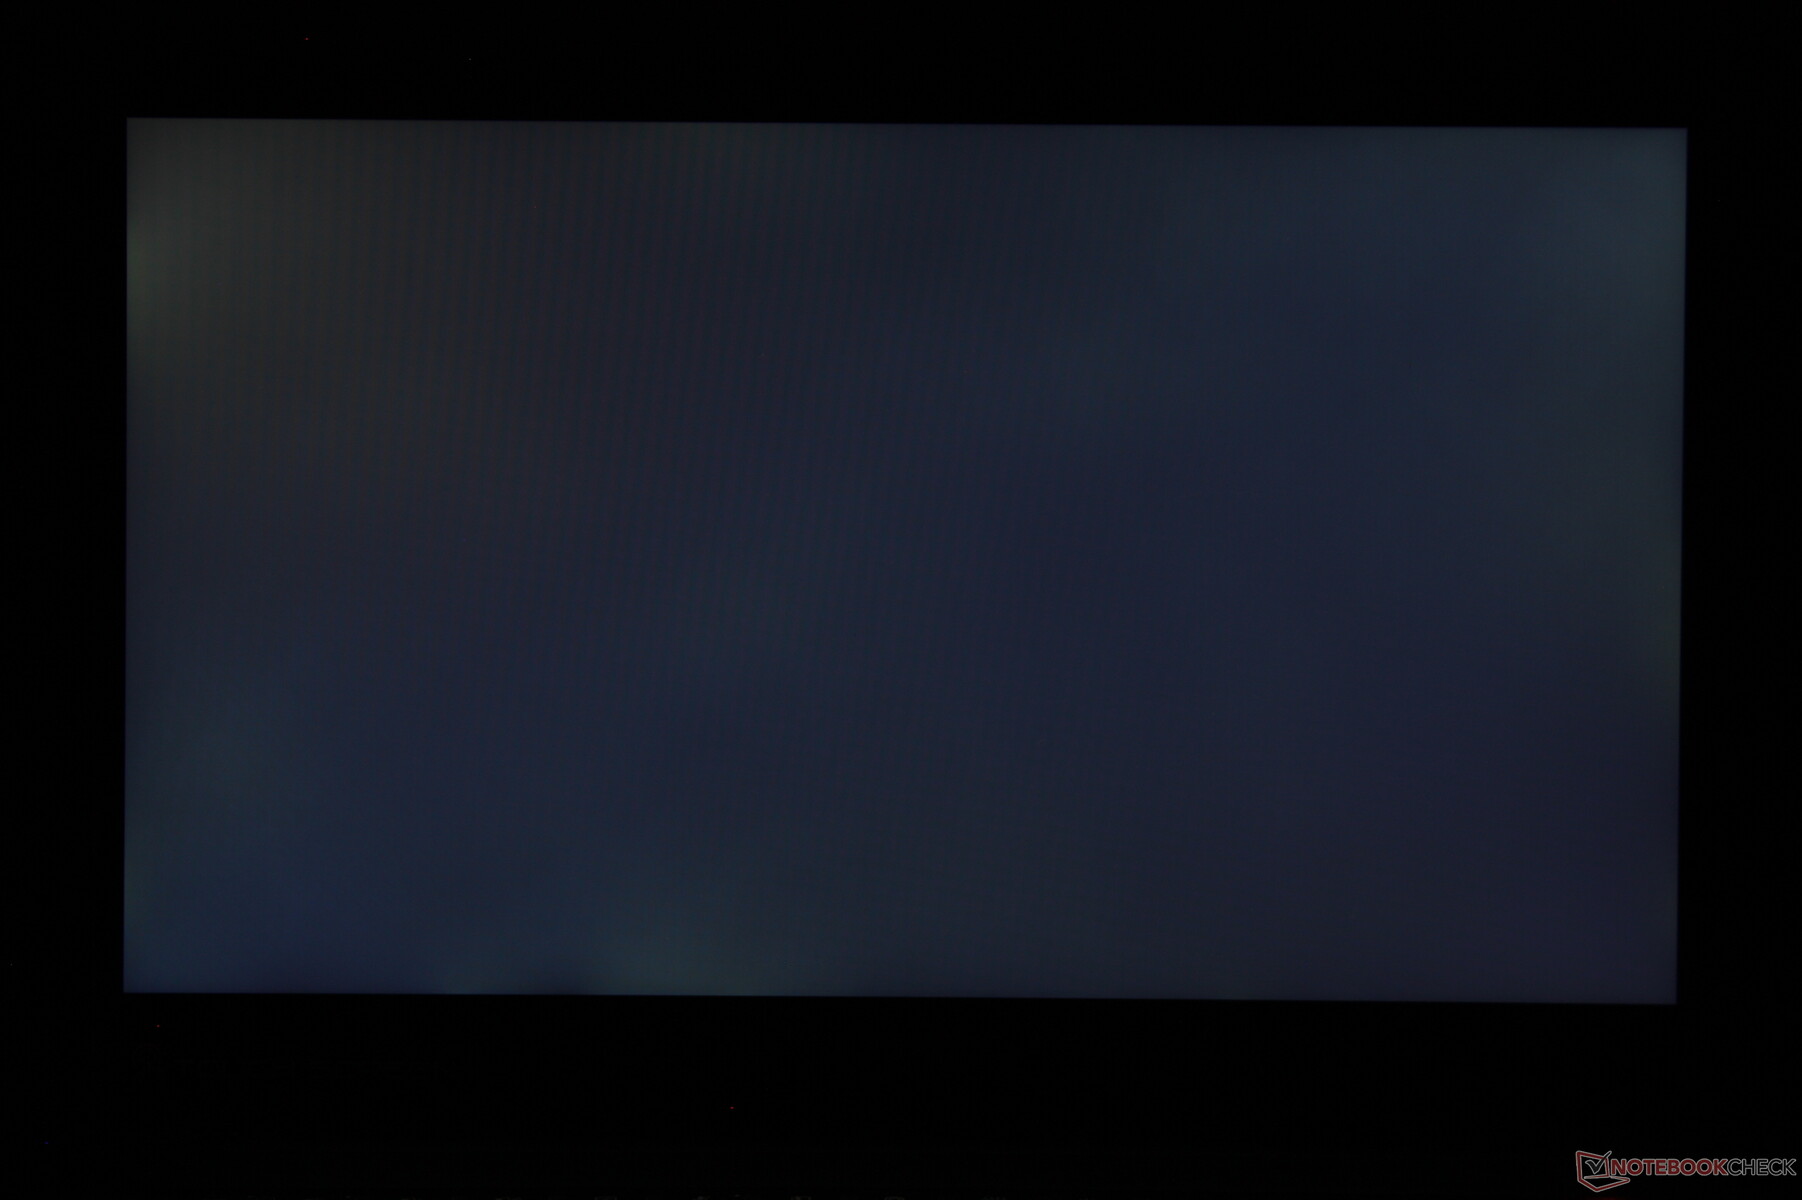
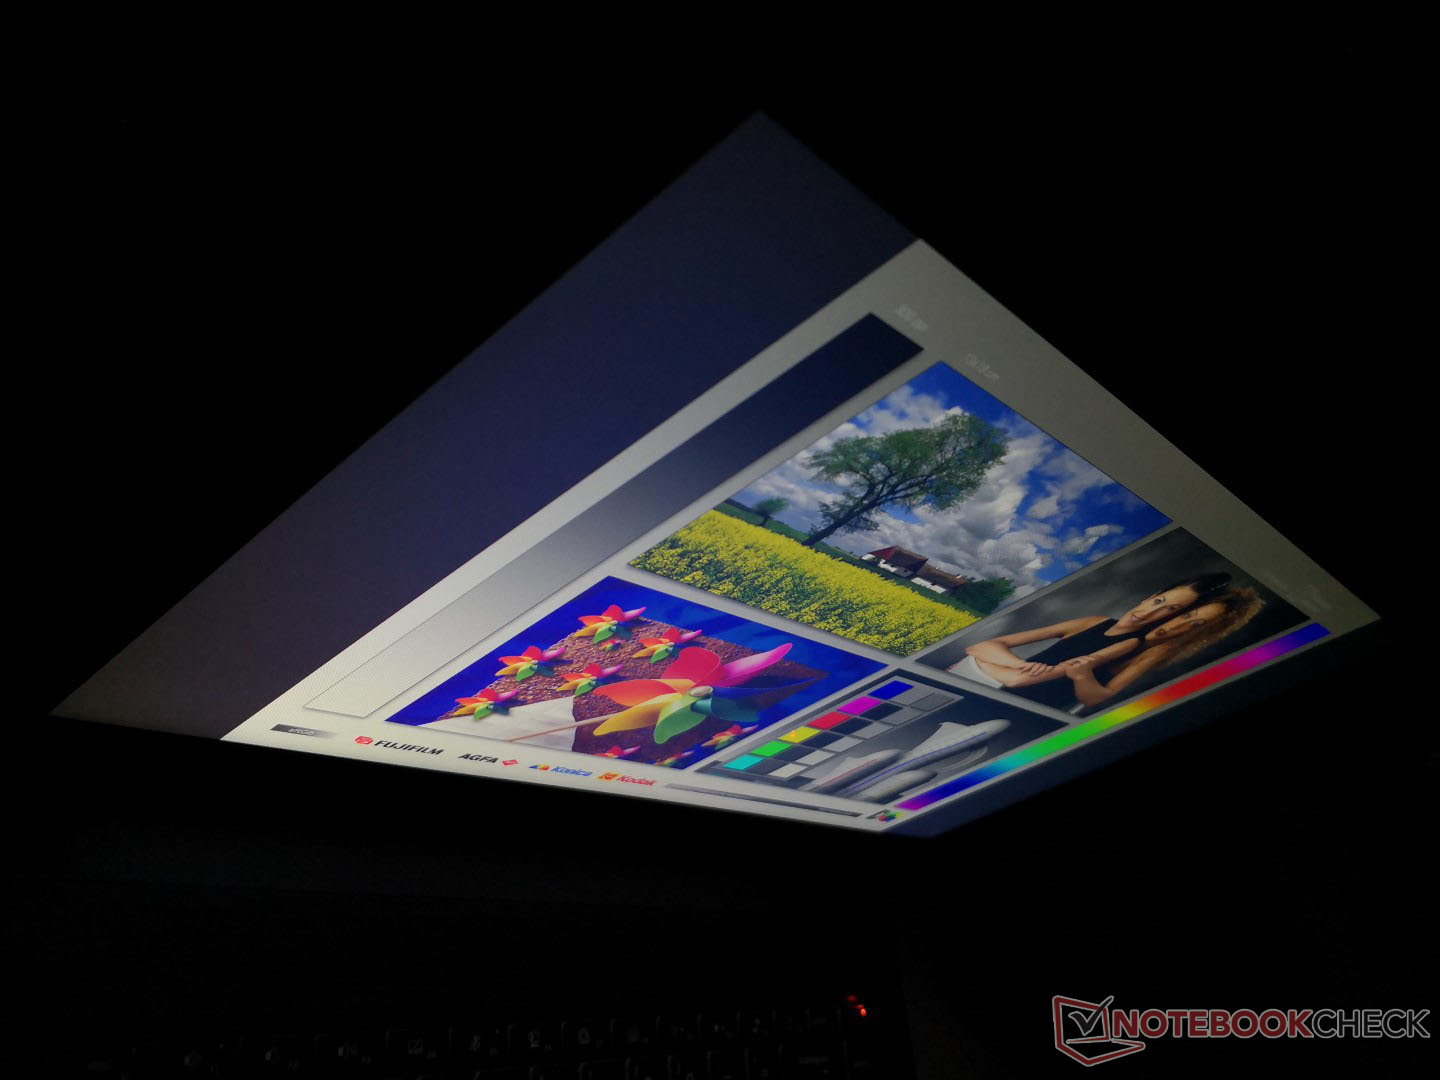
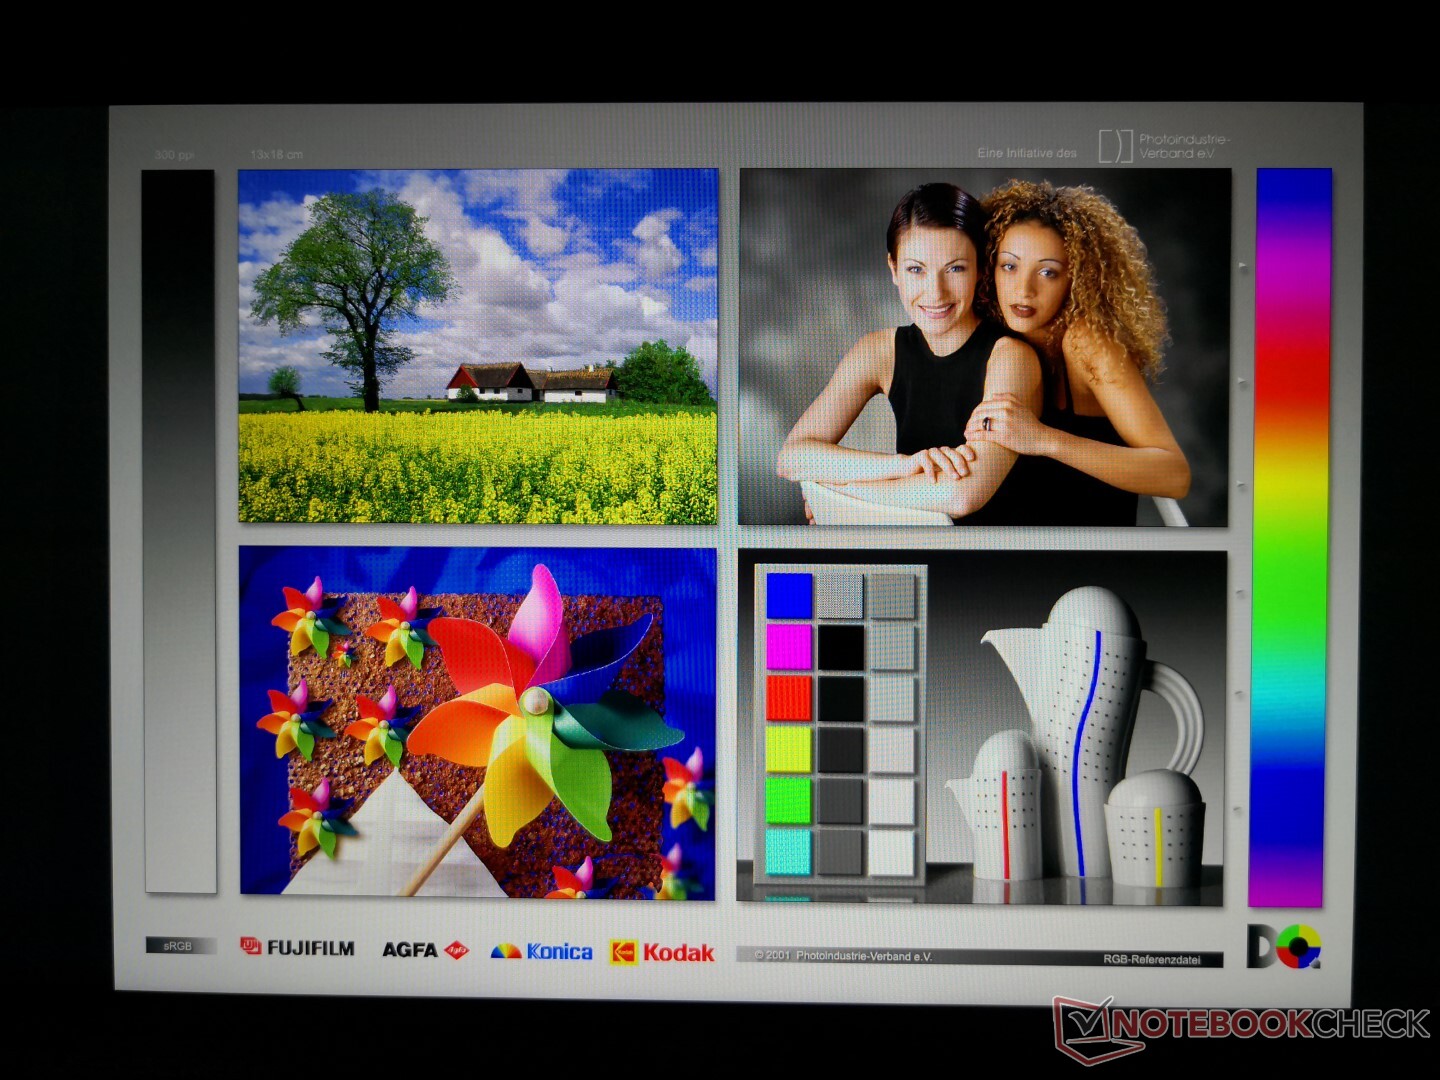
The AU Optronics B156HAB03.0 IPS panel here is the first to appear in our database. Contrast and brightness are both good for the category at about 900:1 and 363 nits, respectively, but some other ultra-thin workstations like the Precision 5550 are brighter, more colorful, and have deeper black levels for superior image quality. Black-white response times are average which is to be expected since this is not a gaming machine.
| |||||||||||||||||||||||||
Brightness Distribution: 91 %
Center on Battery: 374.5 cd/m²
Contrast: 892:1 (Black: 0.42 cd/m²)
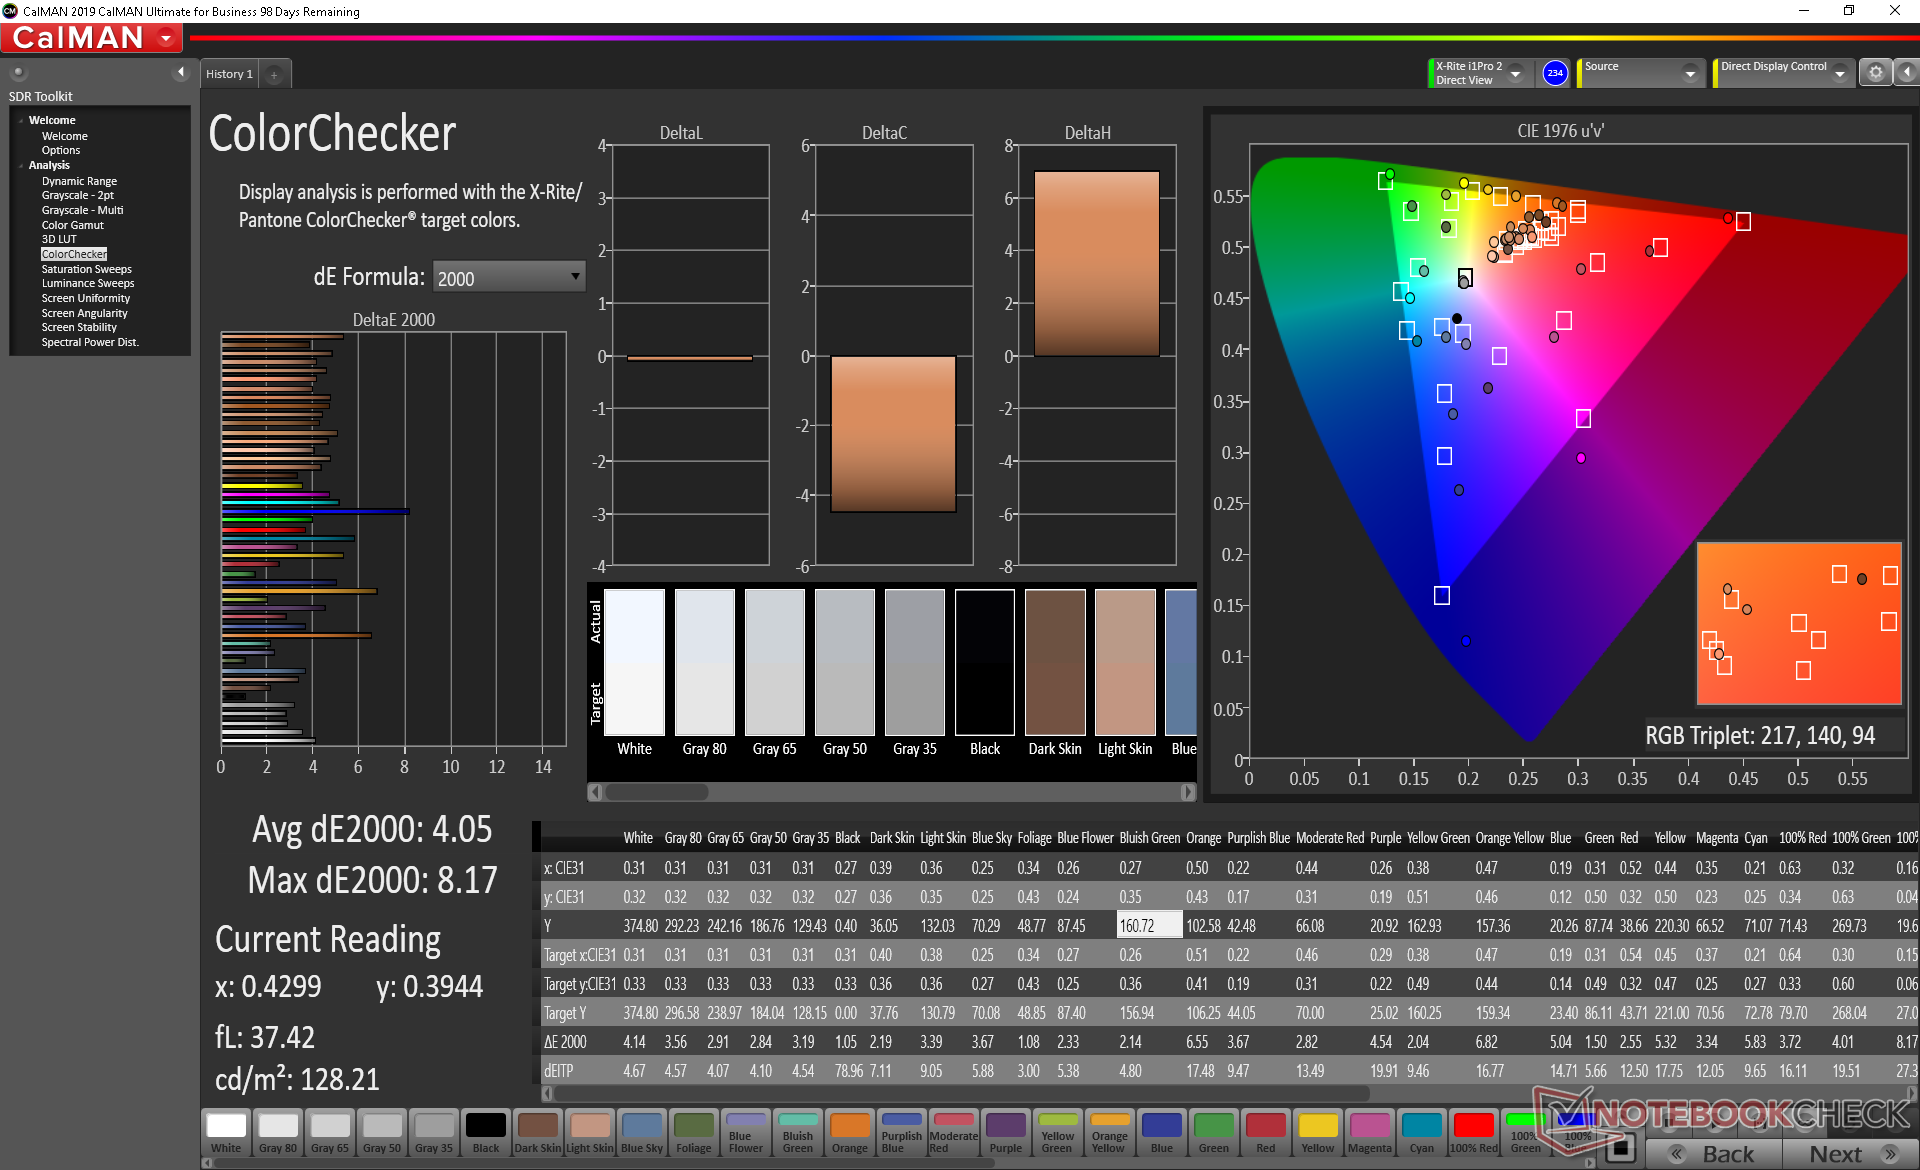
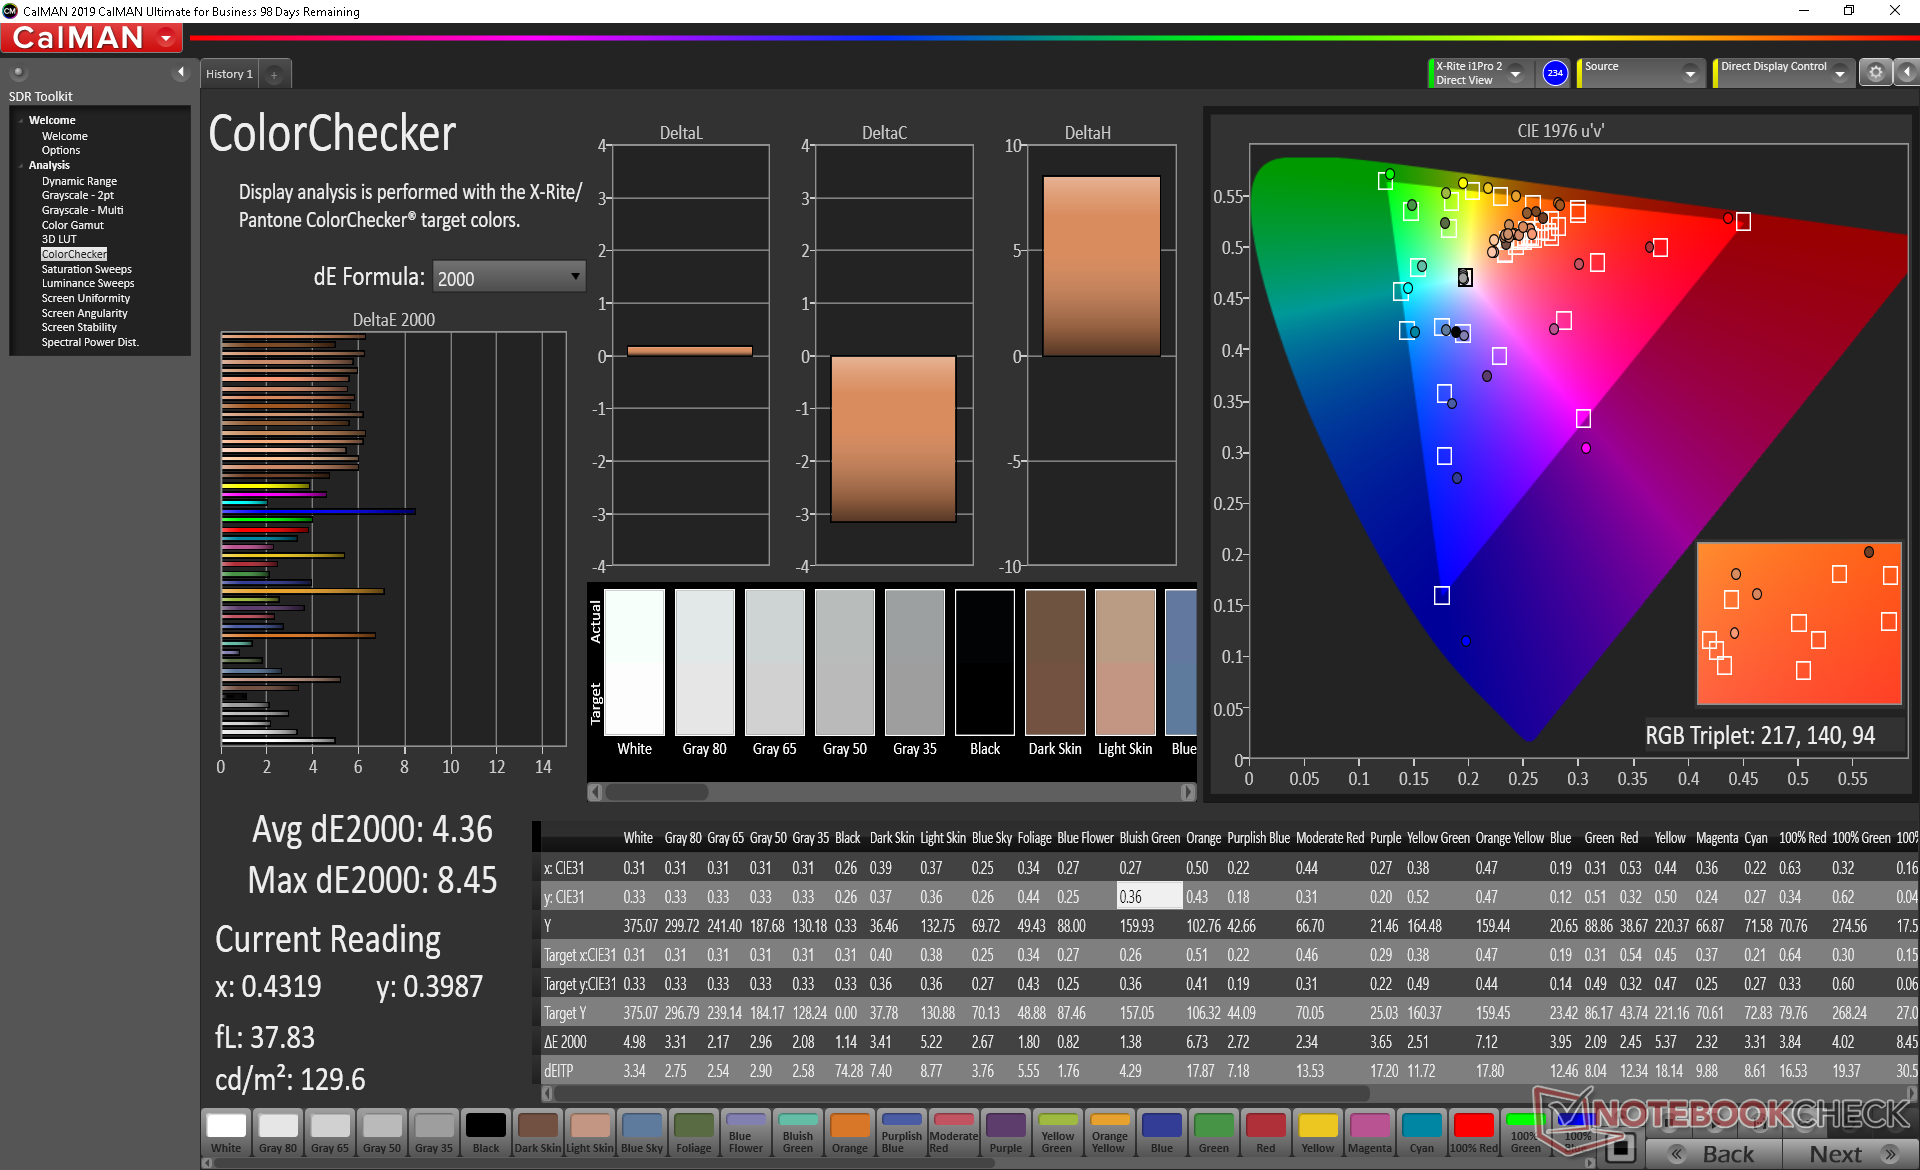
ΔE Color 4.05 | 0.5-29.43 Ø5, calibrated: 4.36
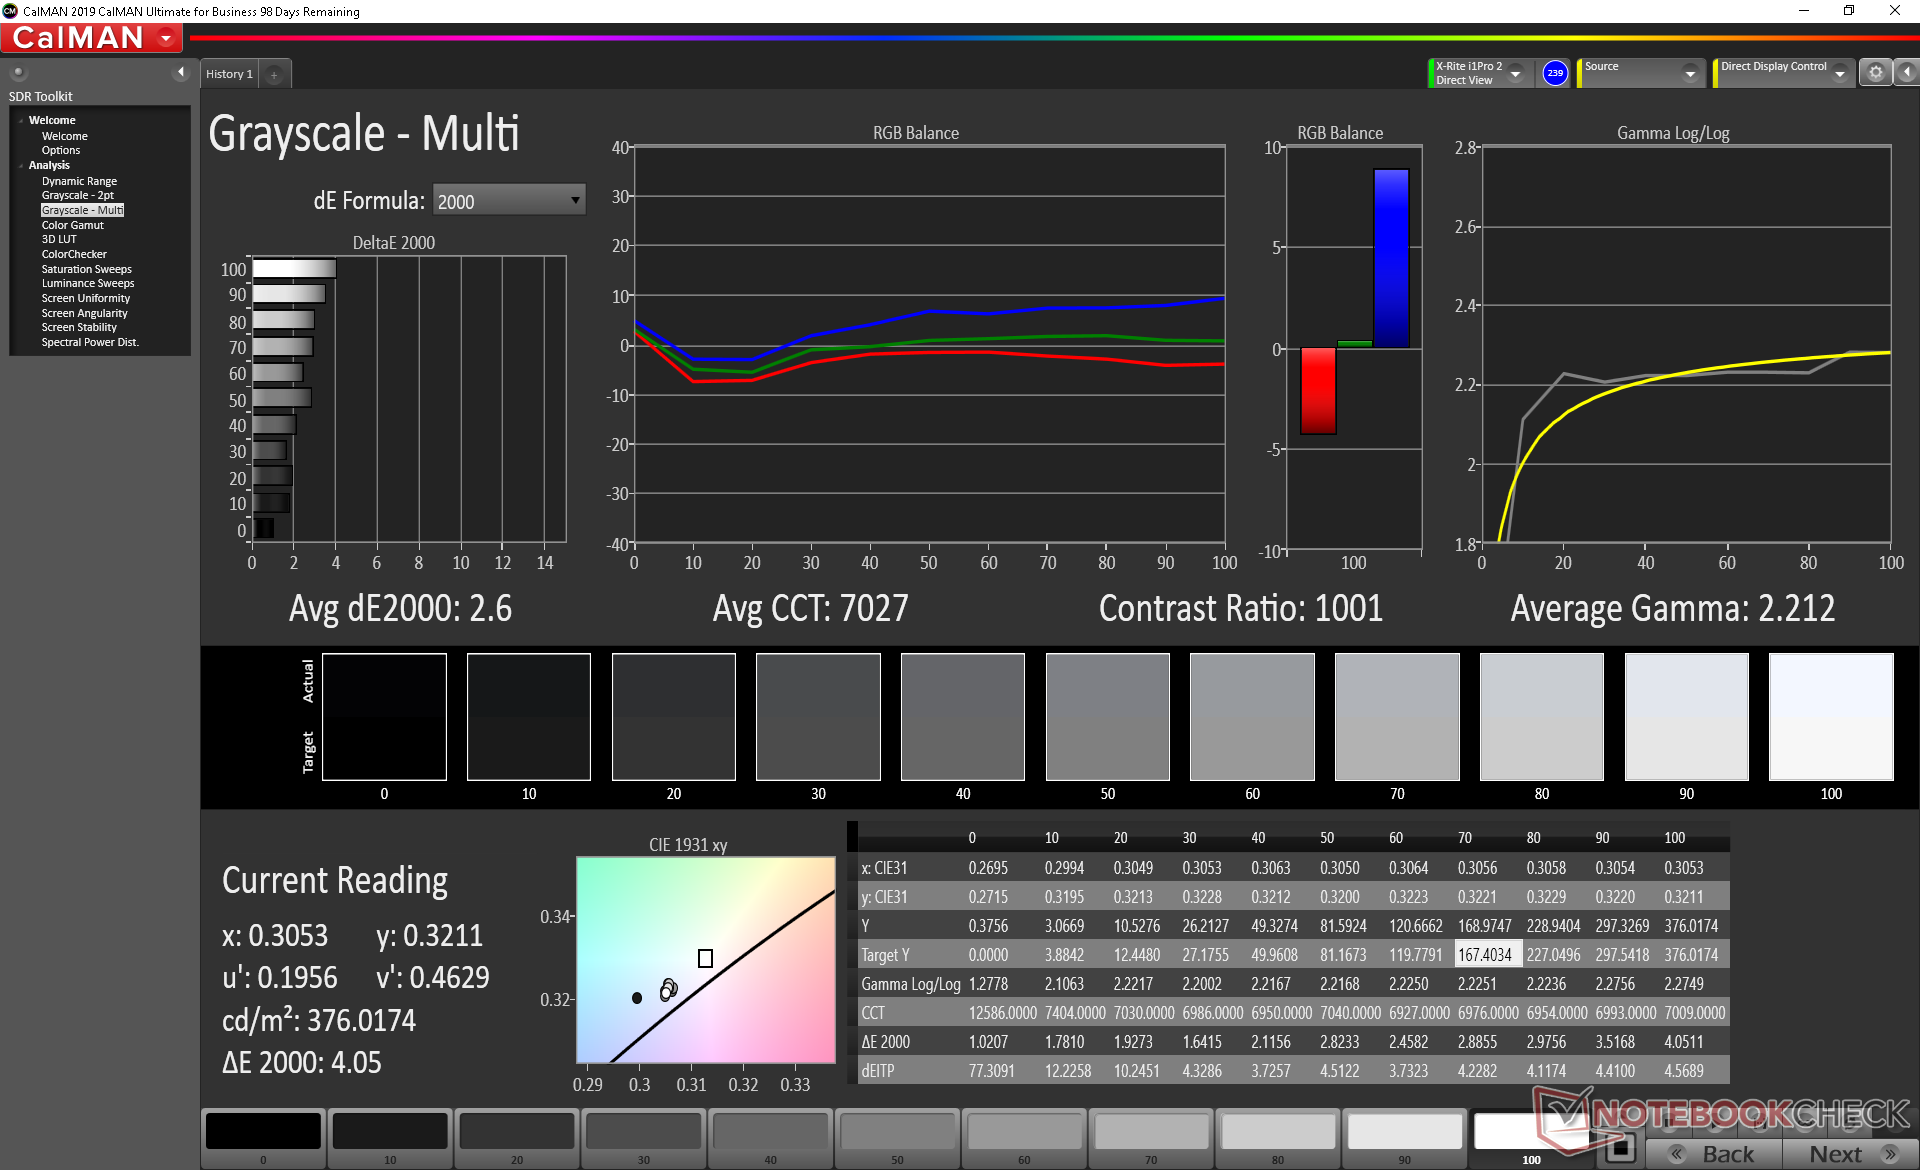
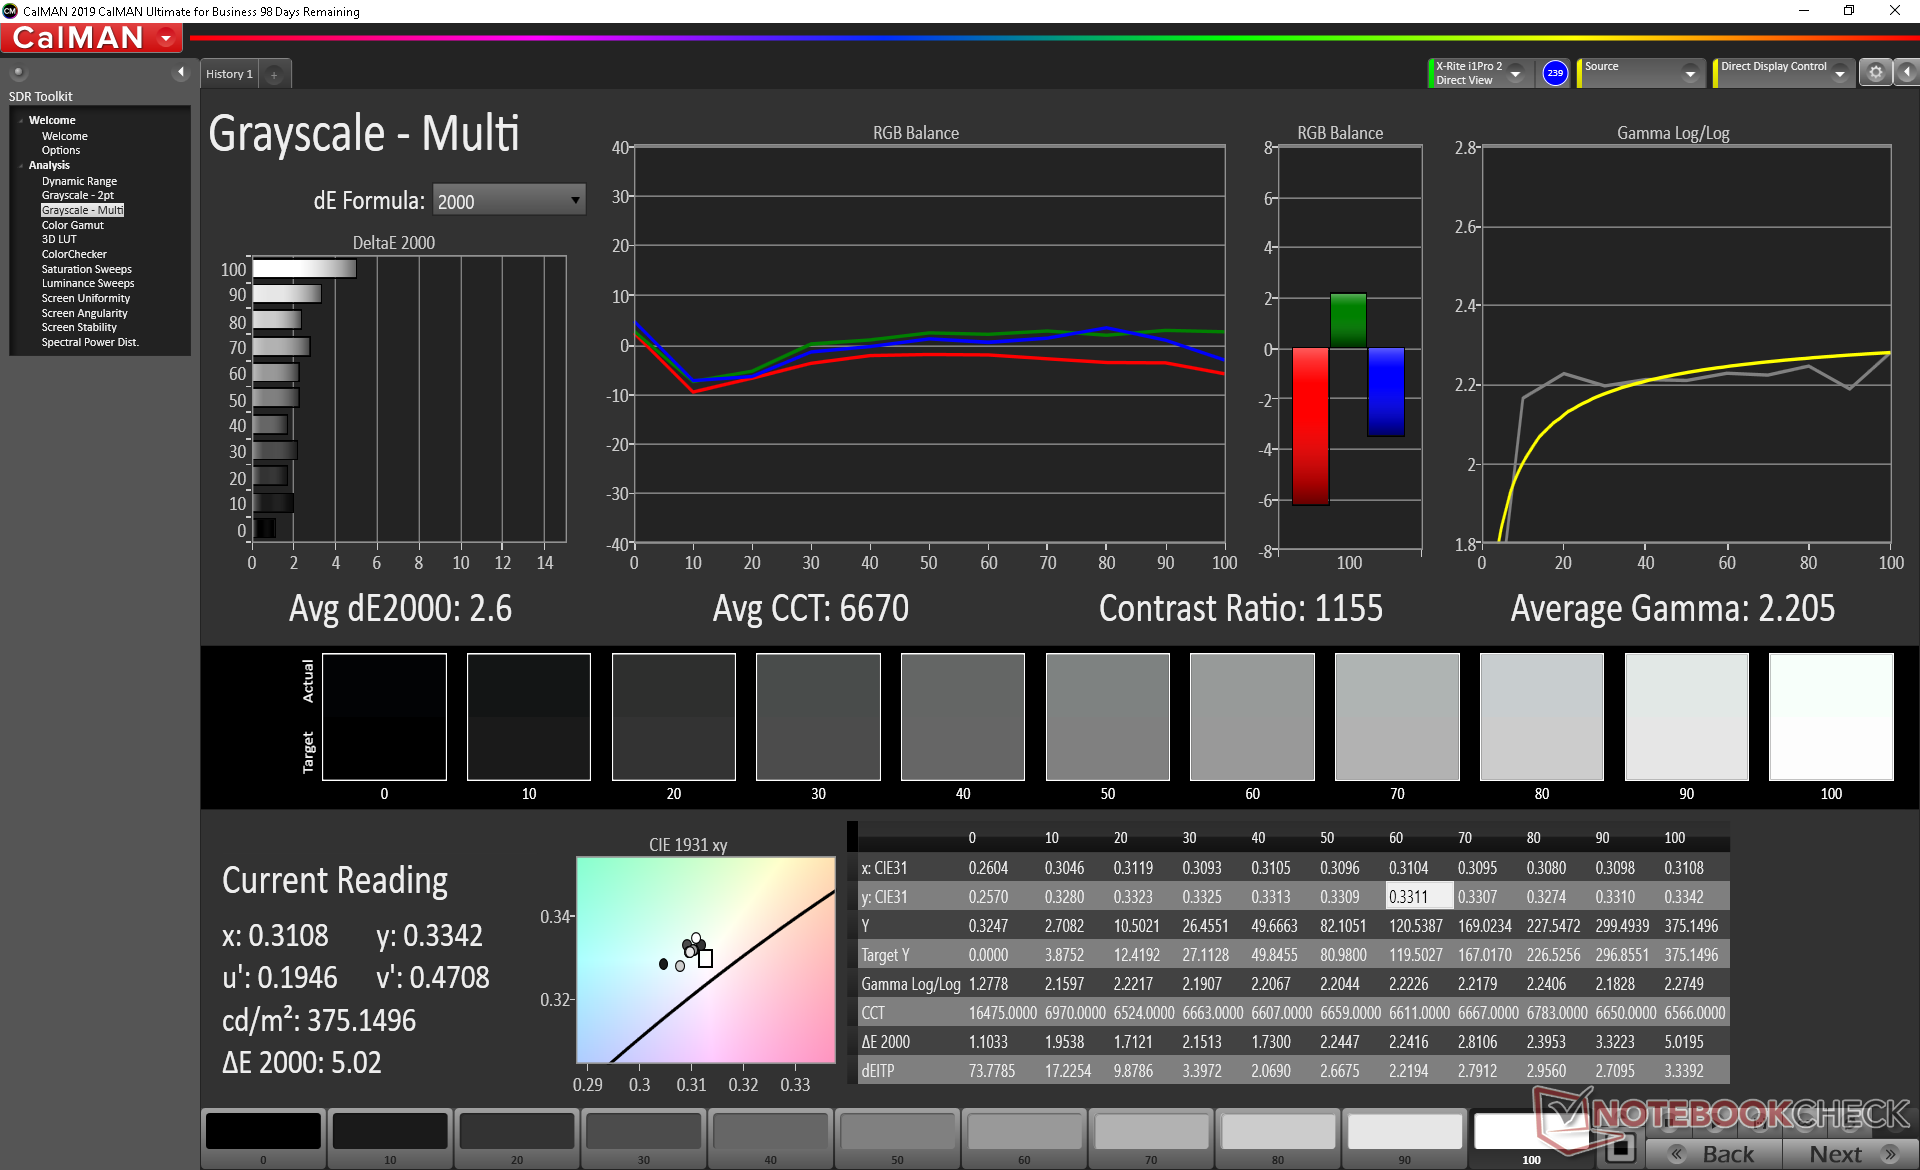
ΔE Greyscale 2.6 | 0.57-98 Ø5.3
86.3% sRGB (Argyll 1.6.3 3D)
56.4% AdobeRGB 1998 (Argyll 1.6.3 3D)
63.6% AdobeRGB 1998 (Argyll 2.2.0 3D)
86.9% sRGB (Argyll 2.2.0 3D)
62.8% Display P3 (Argyll 2.2.0 3D)
Gamma: 2.21
| MSI WS66 10TMT-207US AU Optronics B156HAB03.0, IPS, 15.60, 1920x1080 | Dell Precision 7550 AU Optronics B156ZAN, IPS, 15.60, 3840x2160 | Dell Precision 5550 P91F Sharp LQ156R1, IPS, 15.60, 3840x2400 | Razer Blade 15 Studio Edition 2020 Samsung SDCA029, OLED, 15.60, 3840x2160 | MSI WS63VR 7RL-023US SAMSUNG LƒFL156FL02-101 , IPS, 15.60, 3840x2160 | Acer ConceptD 3 Pro CN315-71P-73W1 Chi Mei N156HCE-EN2, IPS, 15.60, 1920x1080 | |
|---|---|---|---|---|---|---|
| Display | 33% | 38% | 42% | -22% | 36% | |
| Display P3 Coverage | 62.8 | 82.1 31% | 89.9 43% | 99.9 59% | 47.43 -24% | 97.9 56% |
| sRGB Coverage | 86.9 | 99.6 15% | 100 15% | 100 15% | 71.4 -18% | 99.9 15% |
| AdobeRGB 1998 Coverage | 63.6 | 96.8 52% | 99.9 57% | 97.3 53% | 49 -23% | 87.2 37% |
| Response Times | -16% | -11% | 89% | 10% | 25% | |
| Response Time Grey 50% / Grey 80% * | 44.8 ? | 51.2 ? -14% | 46 ? -3% | 4 ? 91% | 36.8 ? 18% | 33 ? 26% |
| Response Time Black / White * | 28.8 ? | 34 ? -18% | 34 ? -18% | 4 ? 86% | 28.4 ? 1% | 22 ? 24% |
| PWM Frequency | 1351 ? | |||||
| Screen | -2% | 1% | 212% | -27% | 16% | |
| Brightness middle | 374.5 | 473.5 26% | 469.8 25% | 380 1% | 259.4 -31% | 343 -8% |
| Brightness | 363 | 461 27% | 464 28% | 388 7% | 247 -32% | 309 -15% |
| Brightness Distribution | 91 | 90 -1% | 85 -7% | 93 2% | 85 -7% | 85 -7% |
| Black Level * | 0.42 | 0.55 -31% | 0.42 -0% | 0.018 96% | 0.43 -2% | 0.22 48% |
| Contrast | 892 | 861 -3% | 1119 25% | 21111 2267% | 603 -32% | 1559 75% |
| Colorchecker dE 2000 * | 4.05 | 4.8 -19% | 5.16 -27% | 5.47 -35% | 5.5 -36% | 3.73 8% |
| Colorchecker dE 2000 max. * | 8.17 | 8.73 -7% | 9.33 -14% | 8.19 -0% | 12.7 -55% | 6.51 20% |
| Colorchecker dE 2000 calibrated * | 4.36 | 3.08 29% | 3.75 14% | 3.04 30% | 1.43 67% | |
| Greyscale dE 2000 * | 2.6 | 5.6 -115% | 5.5 -112% | 5.3 -104% | 3.6 -38% | 4.24 -63% |
| Gamma | 2.21 100% | 2.34 94% | 2 110% | 2.15 102% | 2.24 98% | 2.2 100% |
| CCT | 7027 93% | 7549 86% | 6198 105% | 6128 106% | 7163 91% | 6329 103% |
| Color Space (Percent of AdobeRGB 1998) | 56.4 | 86.4 53% | 89.2 58% | 86 52% | 45 -20% | 78 38% |
| Color Space (Percent of sRGB) | 86.3 | 99.7 16% | 100 16% | 100 16% | 71 -18% | 100 16% |
| Total Average (Program / Settings) | 5% /
3% | 9% /
6% | 114% /
165% | -13% /
-21% | 26% /
21% |
* ... smaller is better
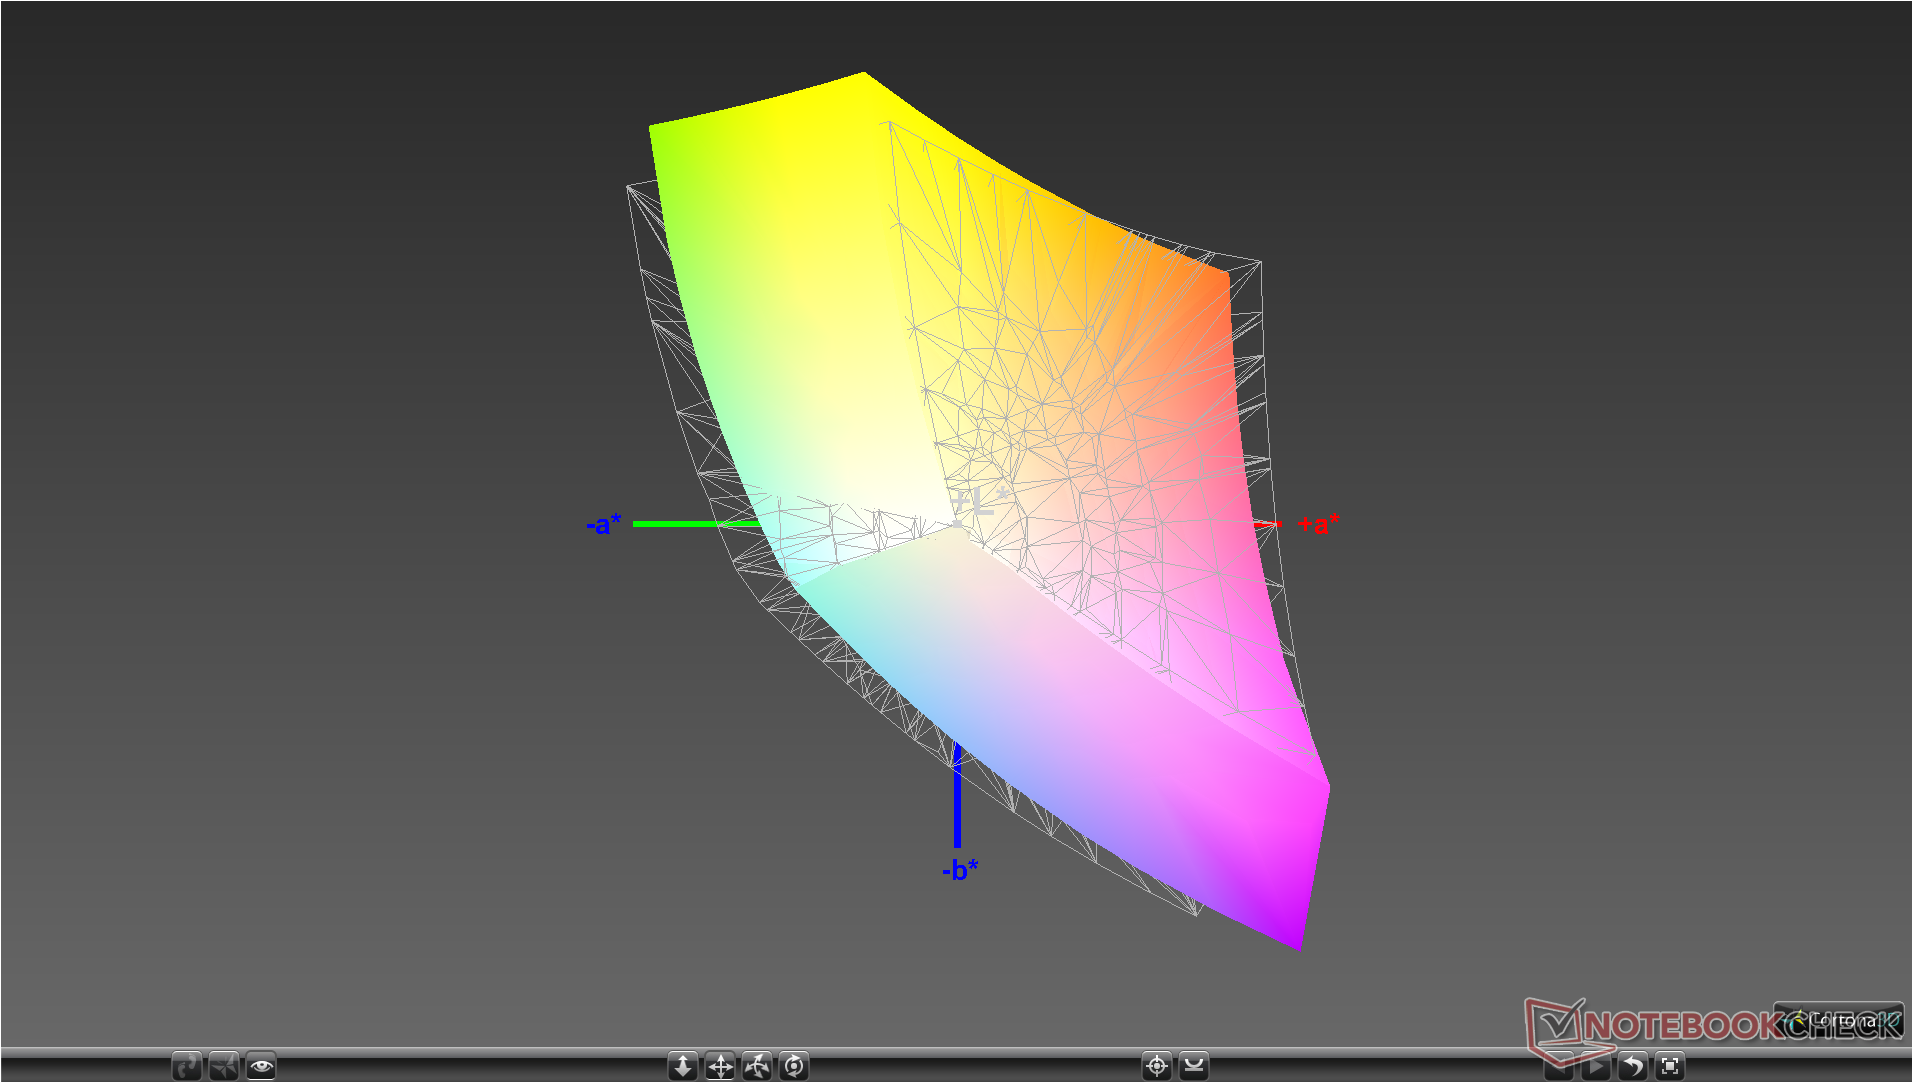
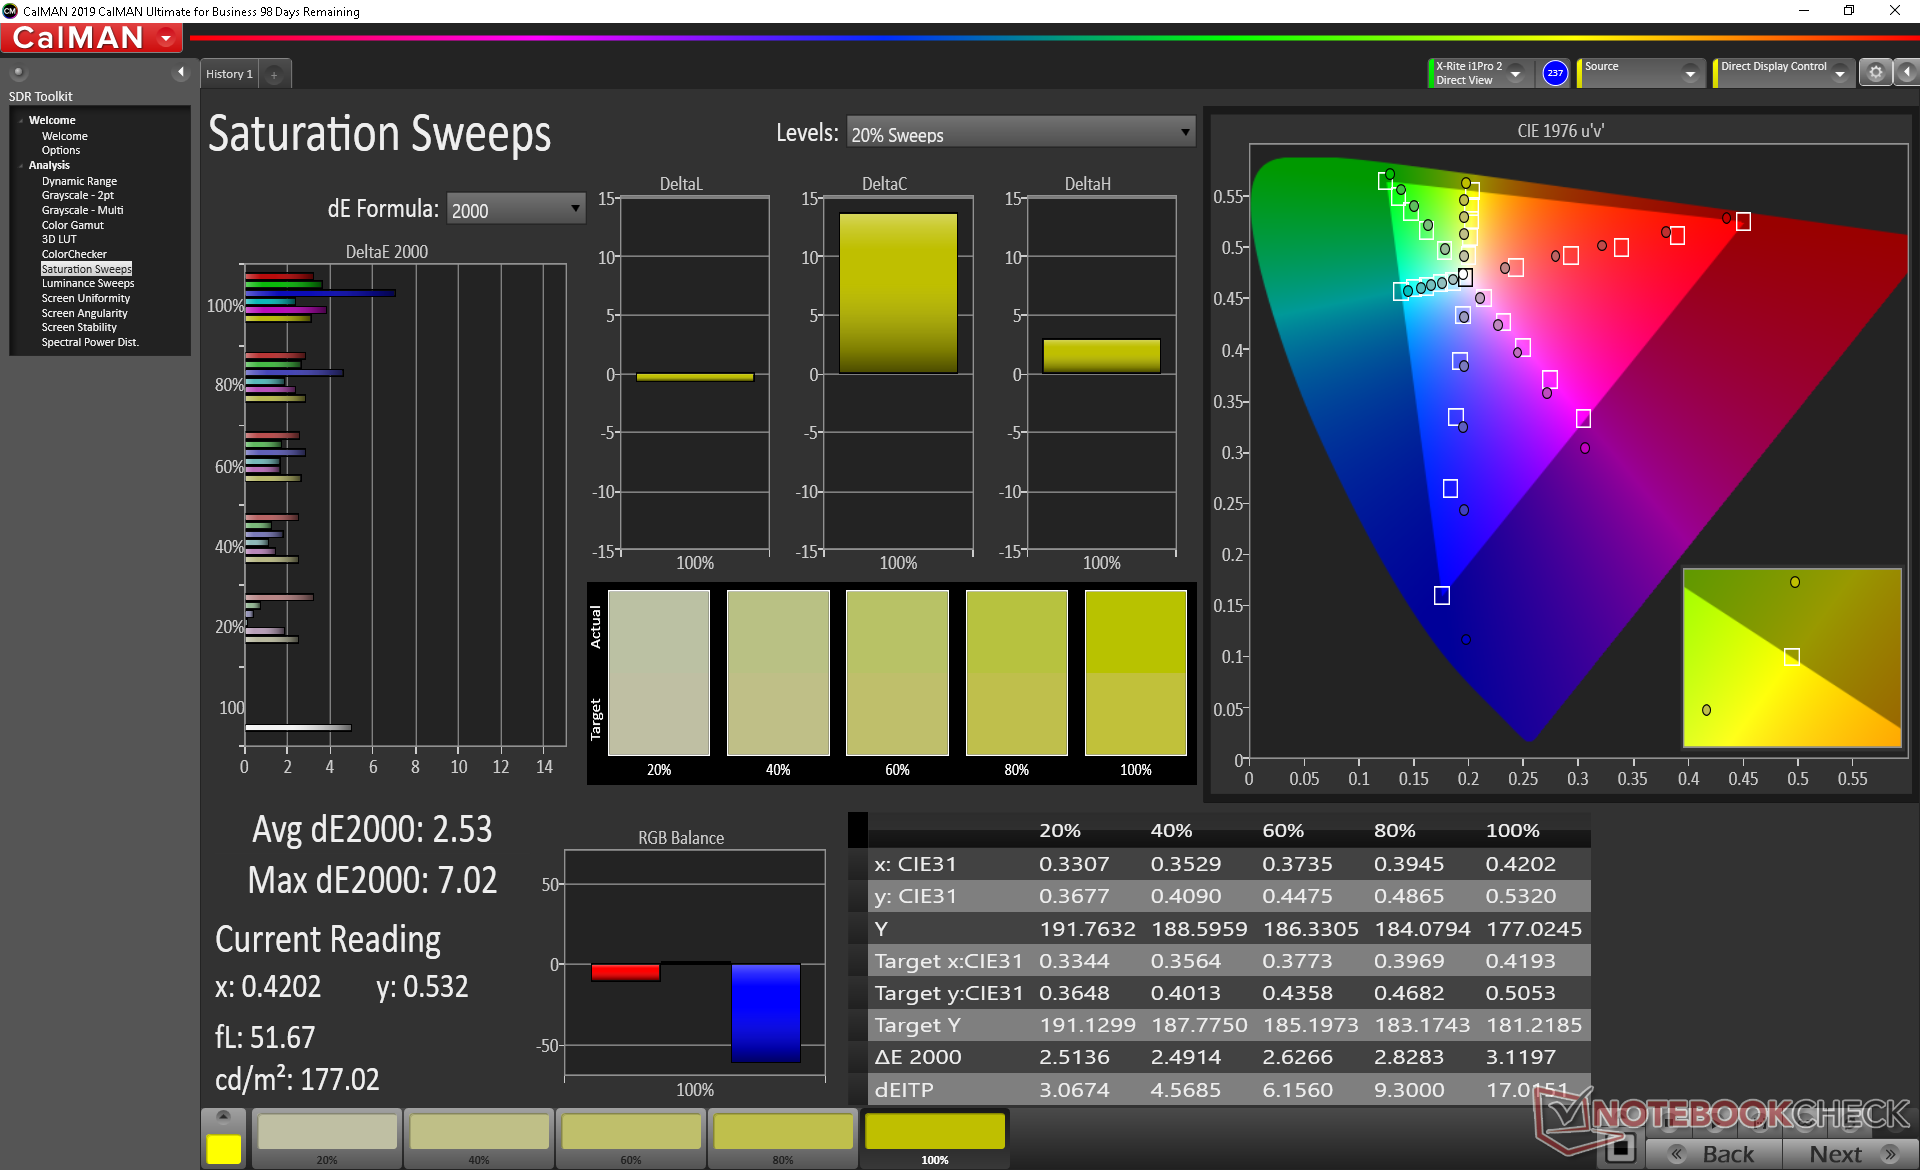
Color space covers approximately 86 percent of sRGB to be an improvement over last year's WS63, but it's still smaller than the 100 percent coverage offered on most other mobile workstations. OLED options are not available here which would have granted DCI-P3 coverage.
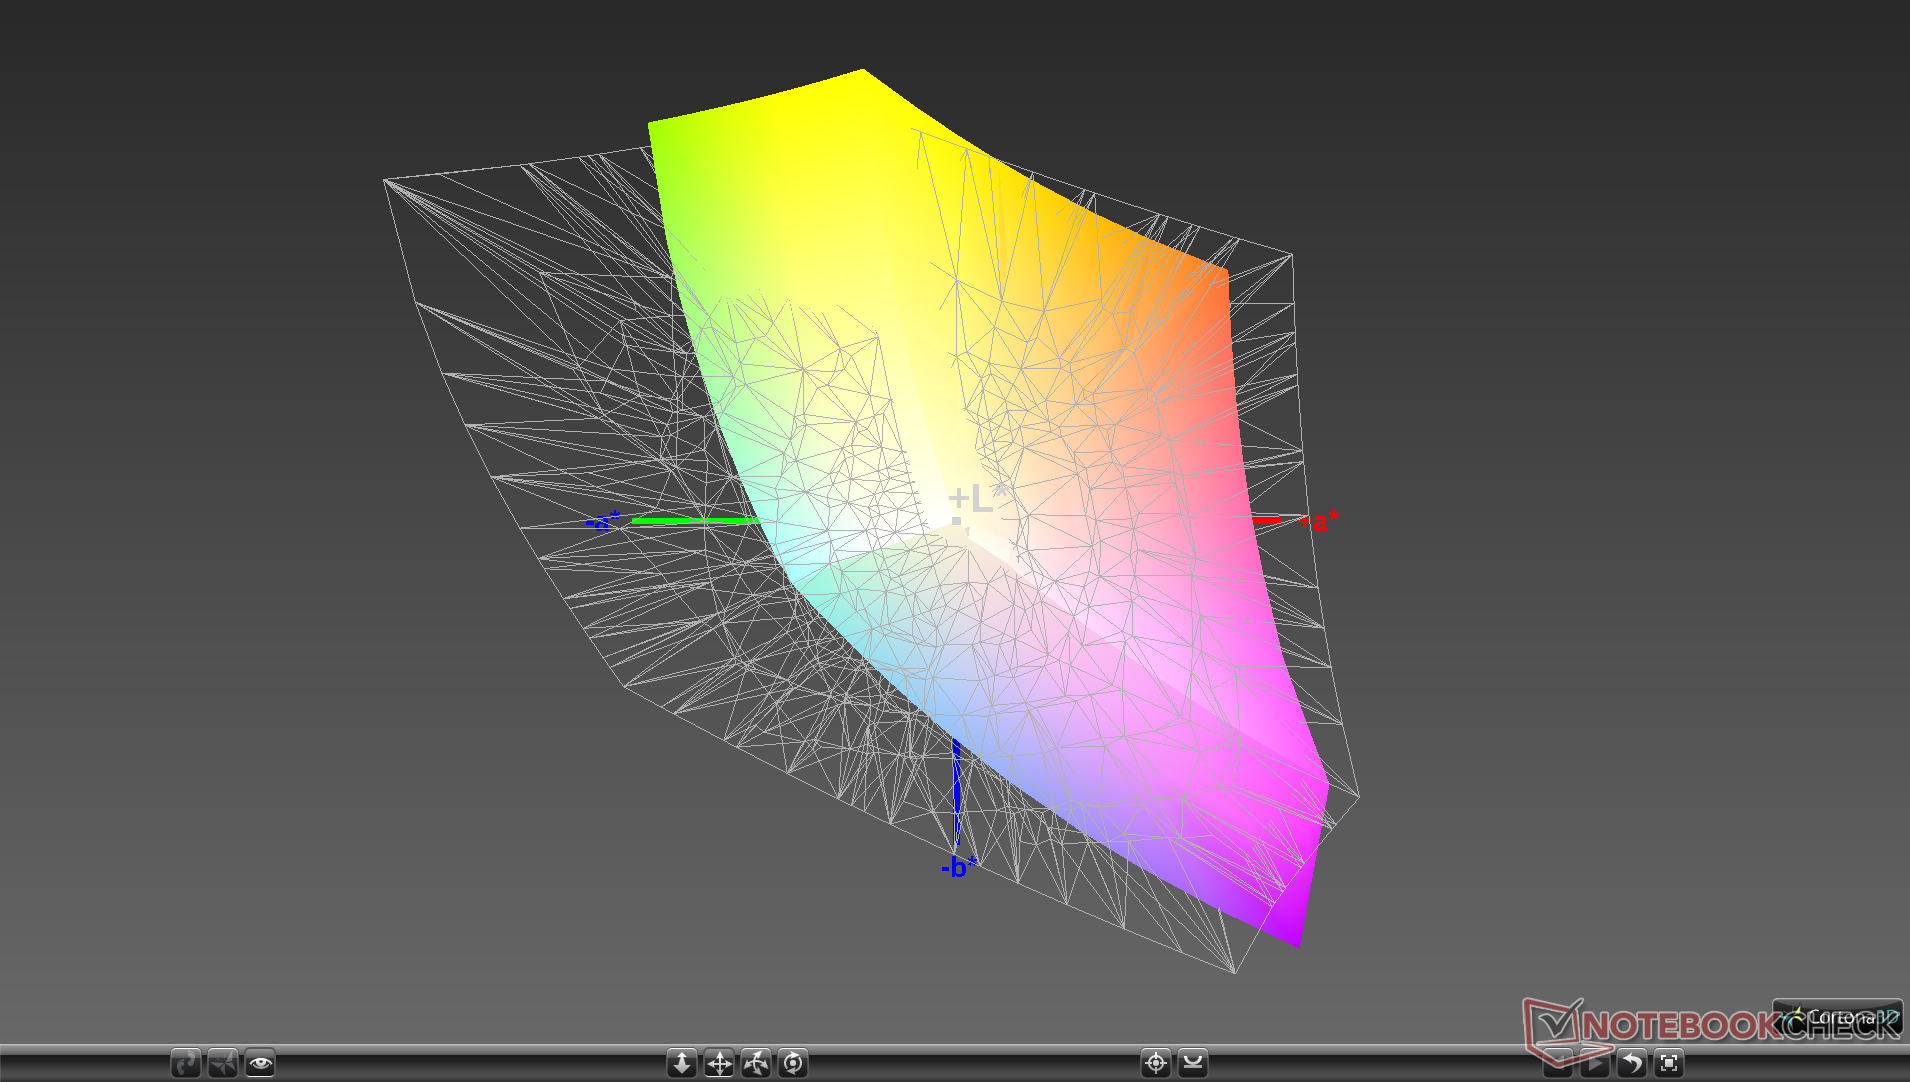
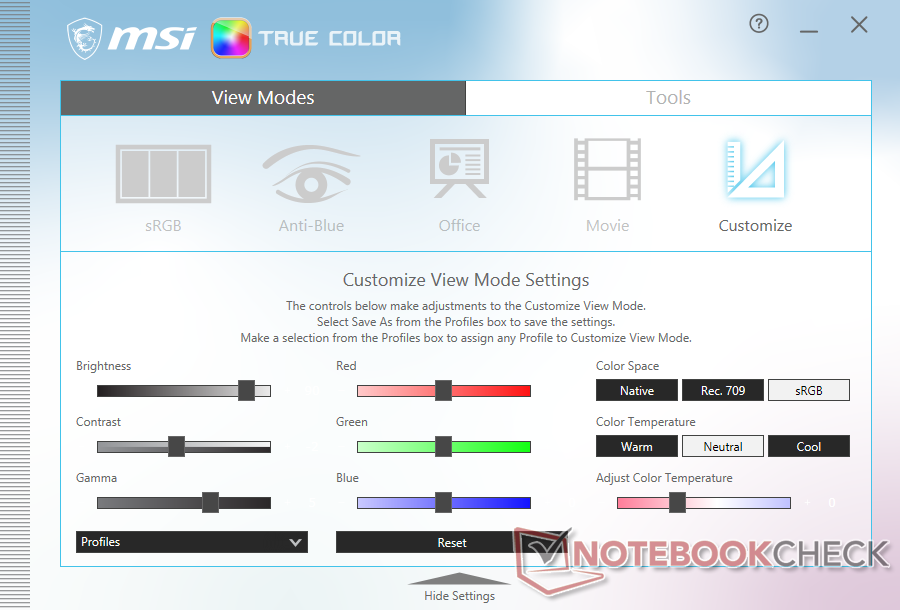
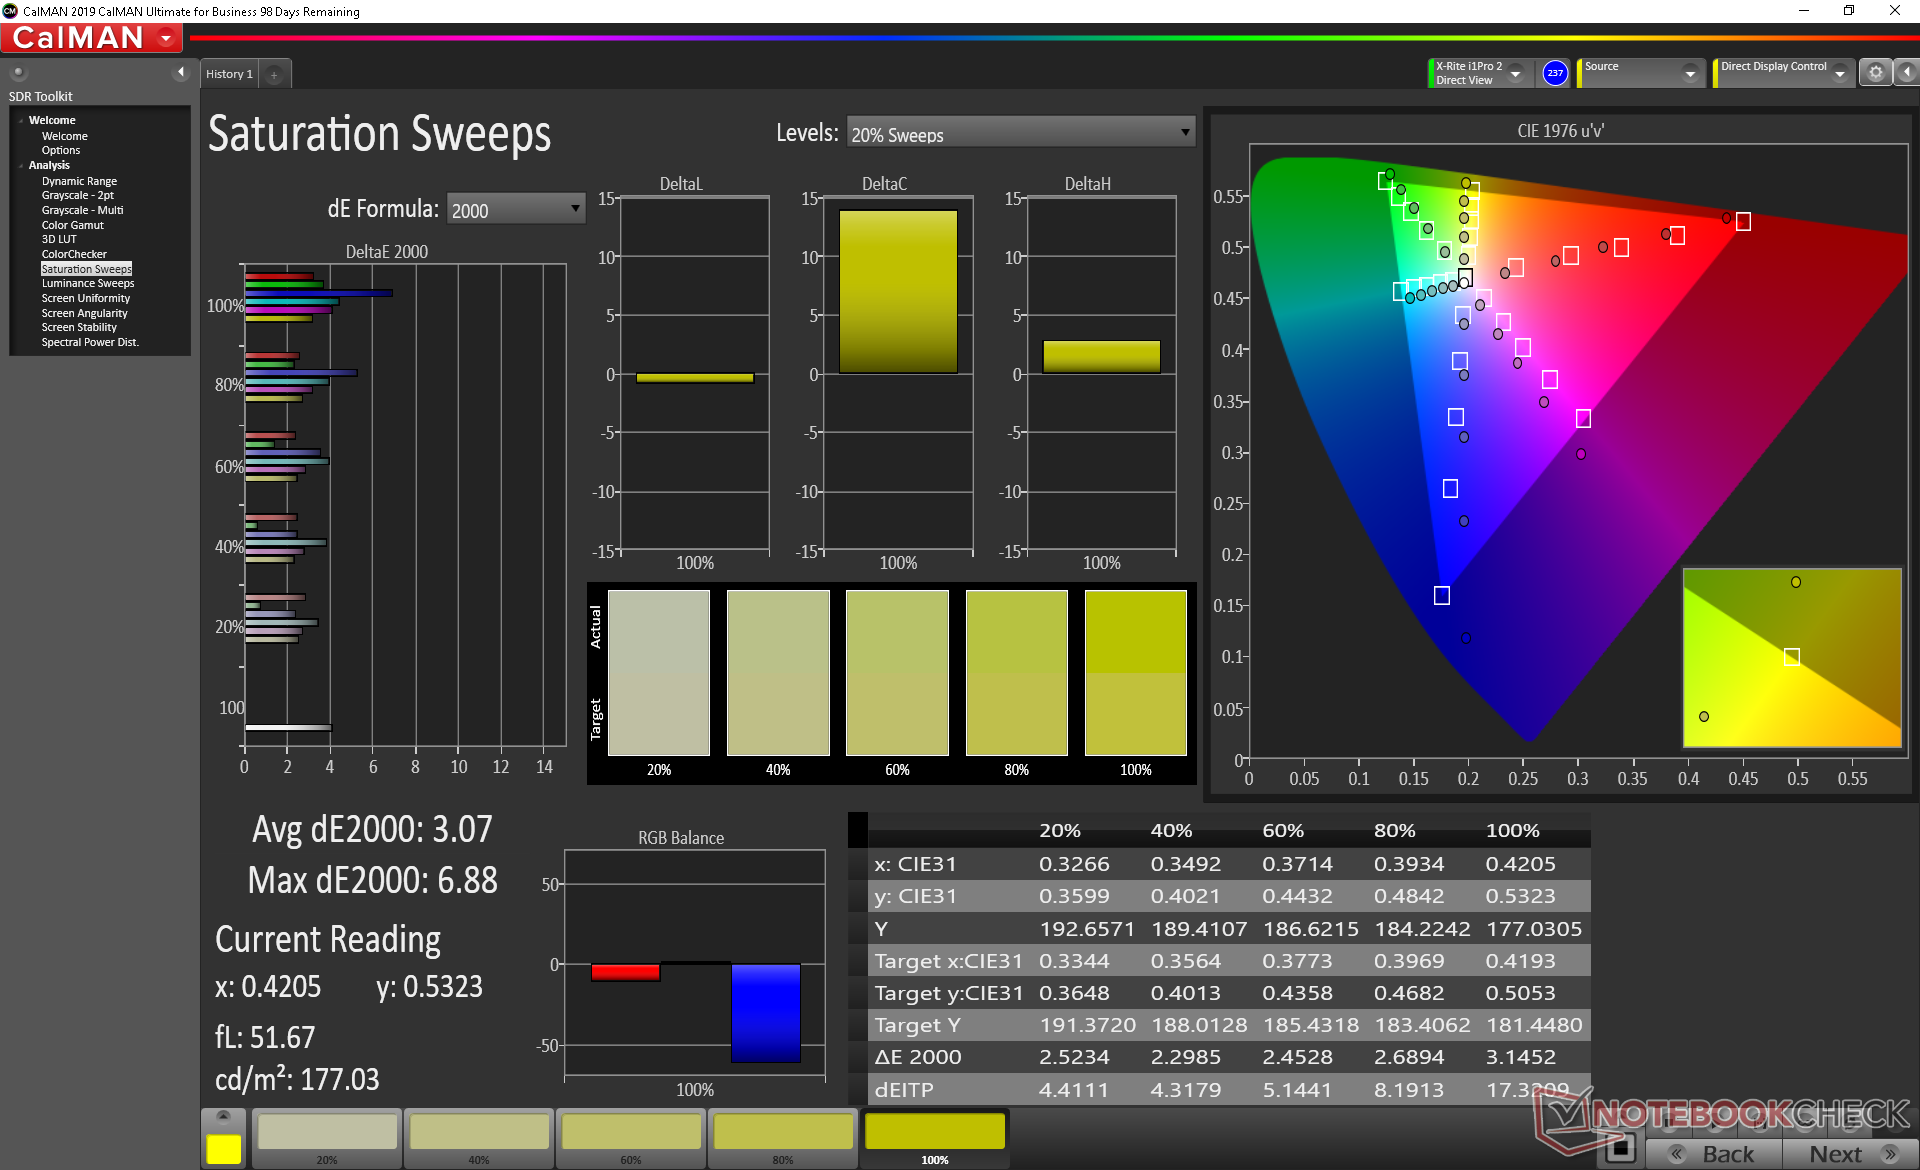
X-Rite colorimeter measurements show a well-calibrated display out of the box as advertised by MSI. Color temperature is slightly on the cool side, but this can be addressed with an end-user calibration.
Display Response Times
| ↔ Response Time Black to White | ||
|---|---|---|
| 28.8 ms ... rise ↗ and fall ↘ combined | ↗ 17.2 ms rise | 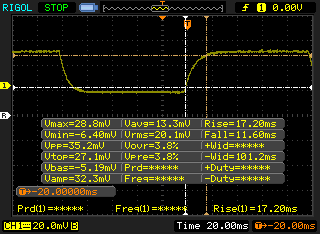 |
| ↘ 11.6 ms fall | ||
| The screen shows relatively slow response rates in our tests and may be too slow for gamers. In comparison, all tested devices range from 0.1 (minimum) to 240 (maximum) ms. » 72 % of all devices are better. This means that the measured response time is worse than the average of all tested devices (21.5 ms). | ||
| ↔ Response Time 50% Grey to 80% Grey | ||
| 44.8 ms ... rise ↗ and fall ↘ combined | ↗ 21.2 ms rise | 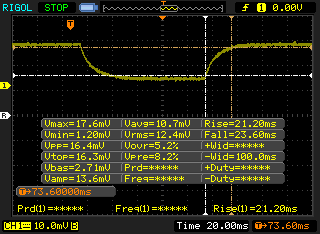 |
| ↘ 23.6 ms fall | ||
| The screen shows slow response rates in our tests and will be unsatisfactory for gamers. In comparison, all tested devices range from 0.2 (minimum) to 636 (maximum) ms. » 73 % of all devices are better. This means that the measured response time is worse than the average of all tested devices (33.7 ms). | ||
Screen Flickering / PWM (Pulse-Width Modulation)
| Screen flickering / PWM not detected | 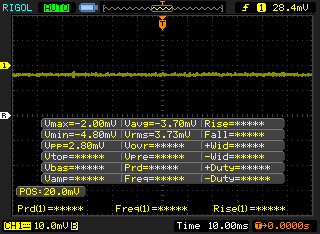 | ||
In comparison: 53 % of all tested devices do not use PWM to dim the display. If PWM was detected, an average of 17900 (minimum: 5 - maximum: 3846000) Hz was measured. | |||
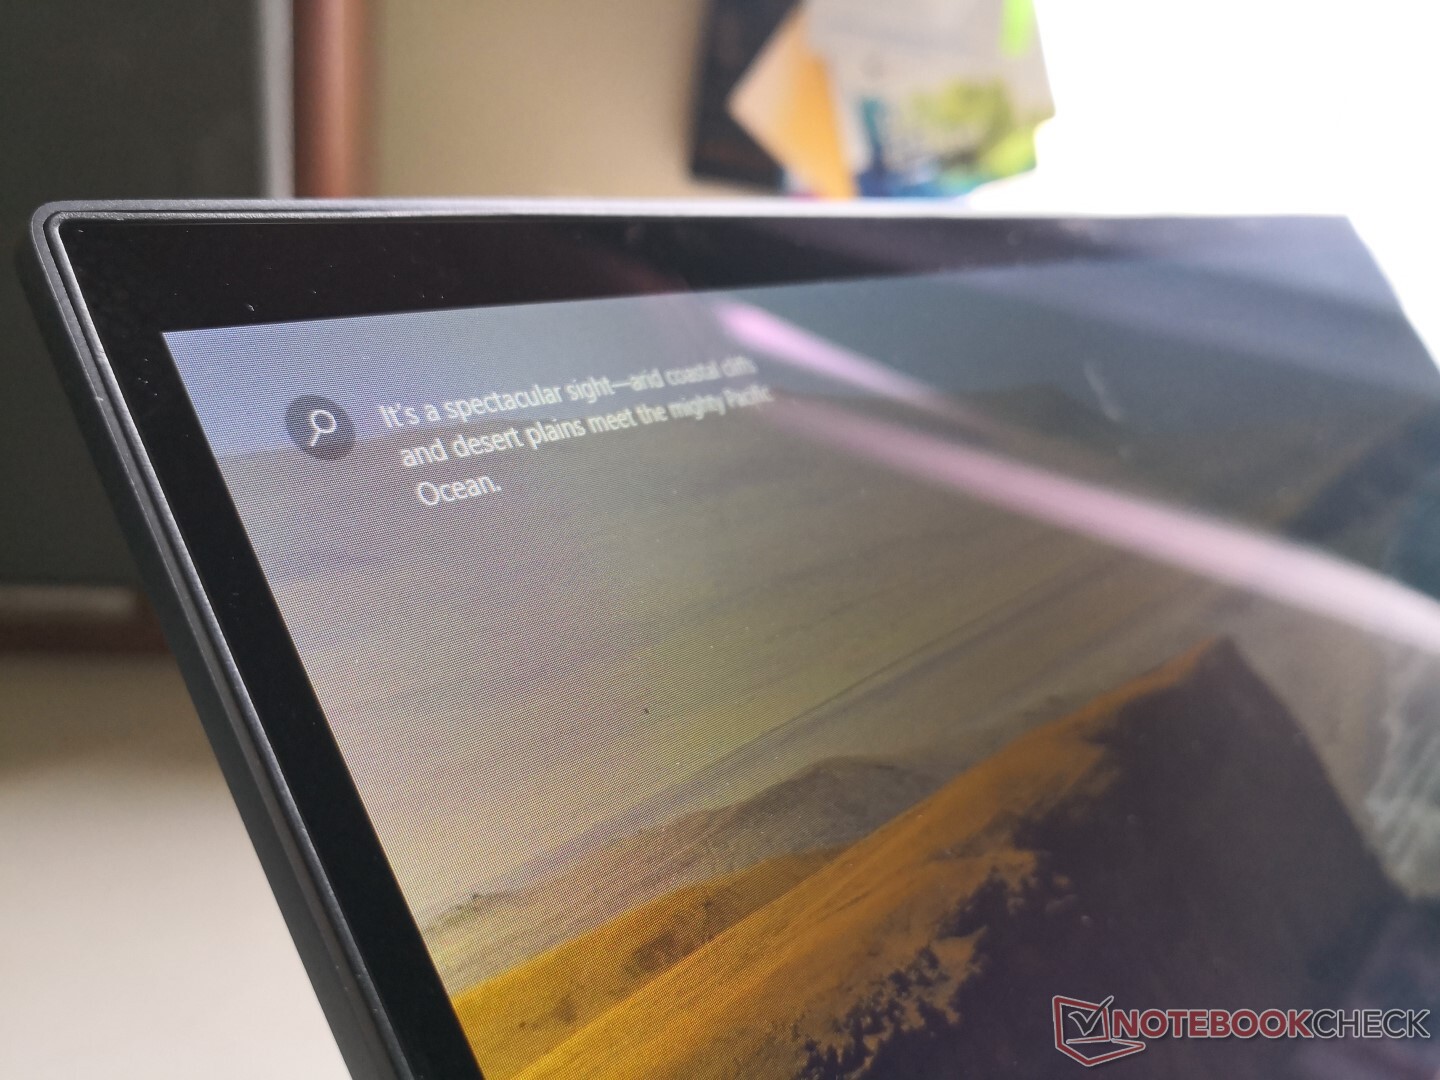
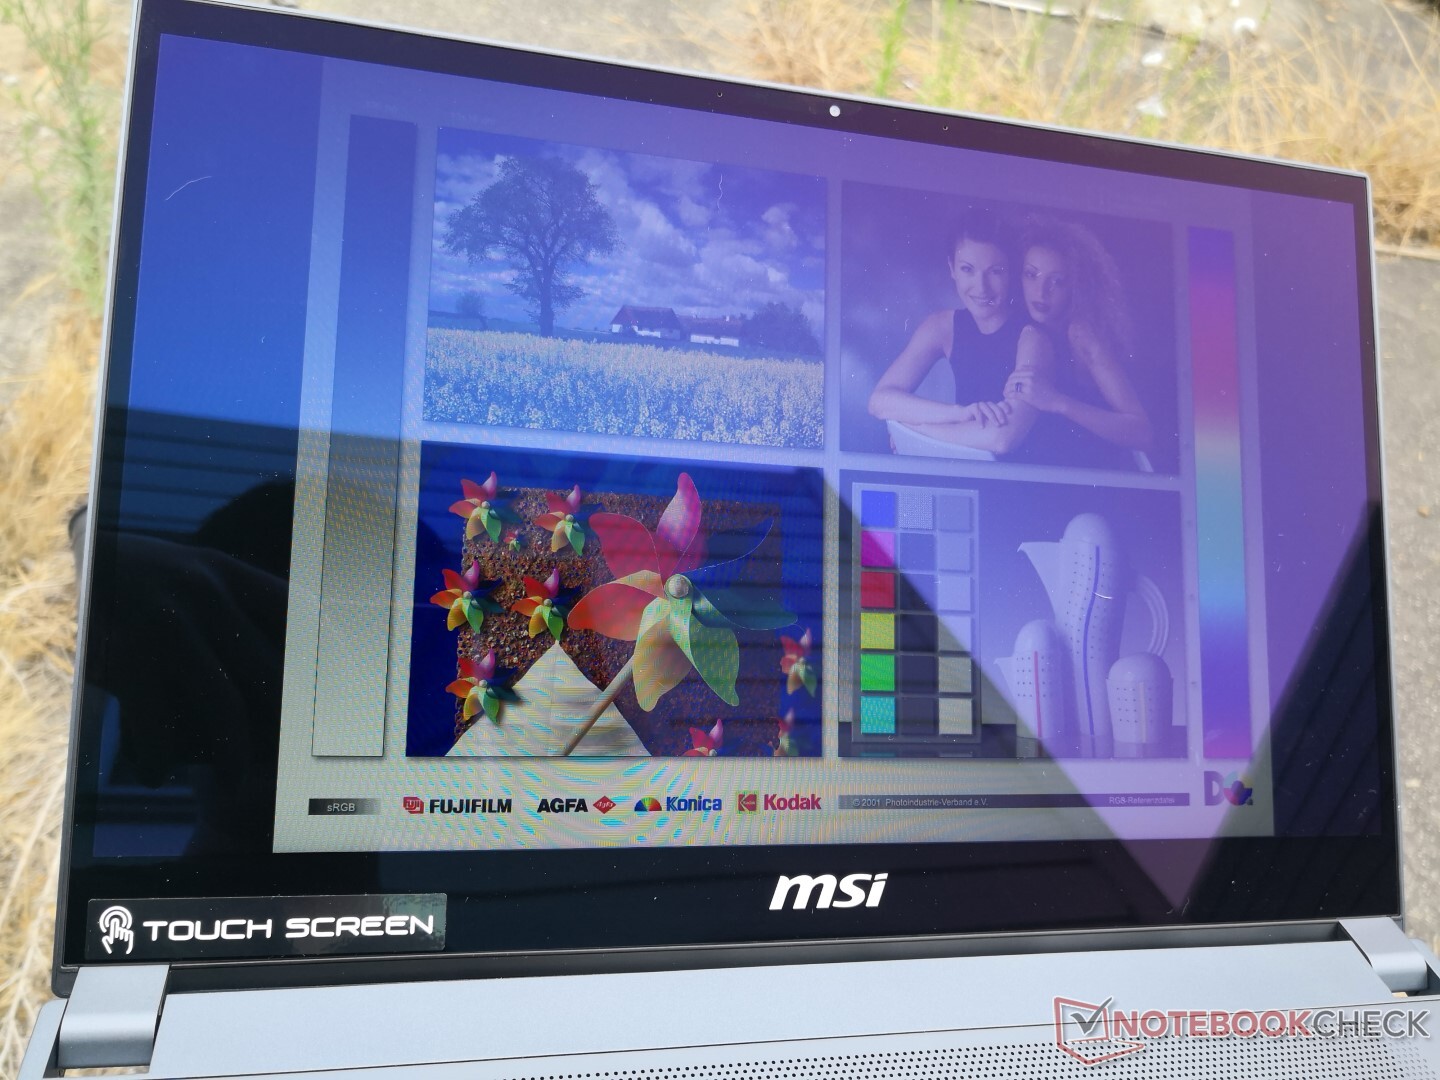
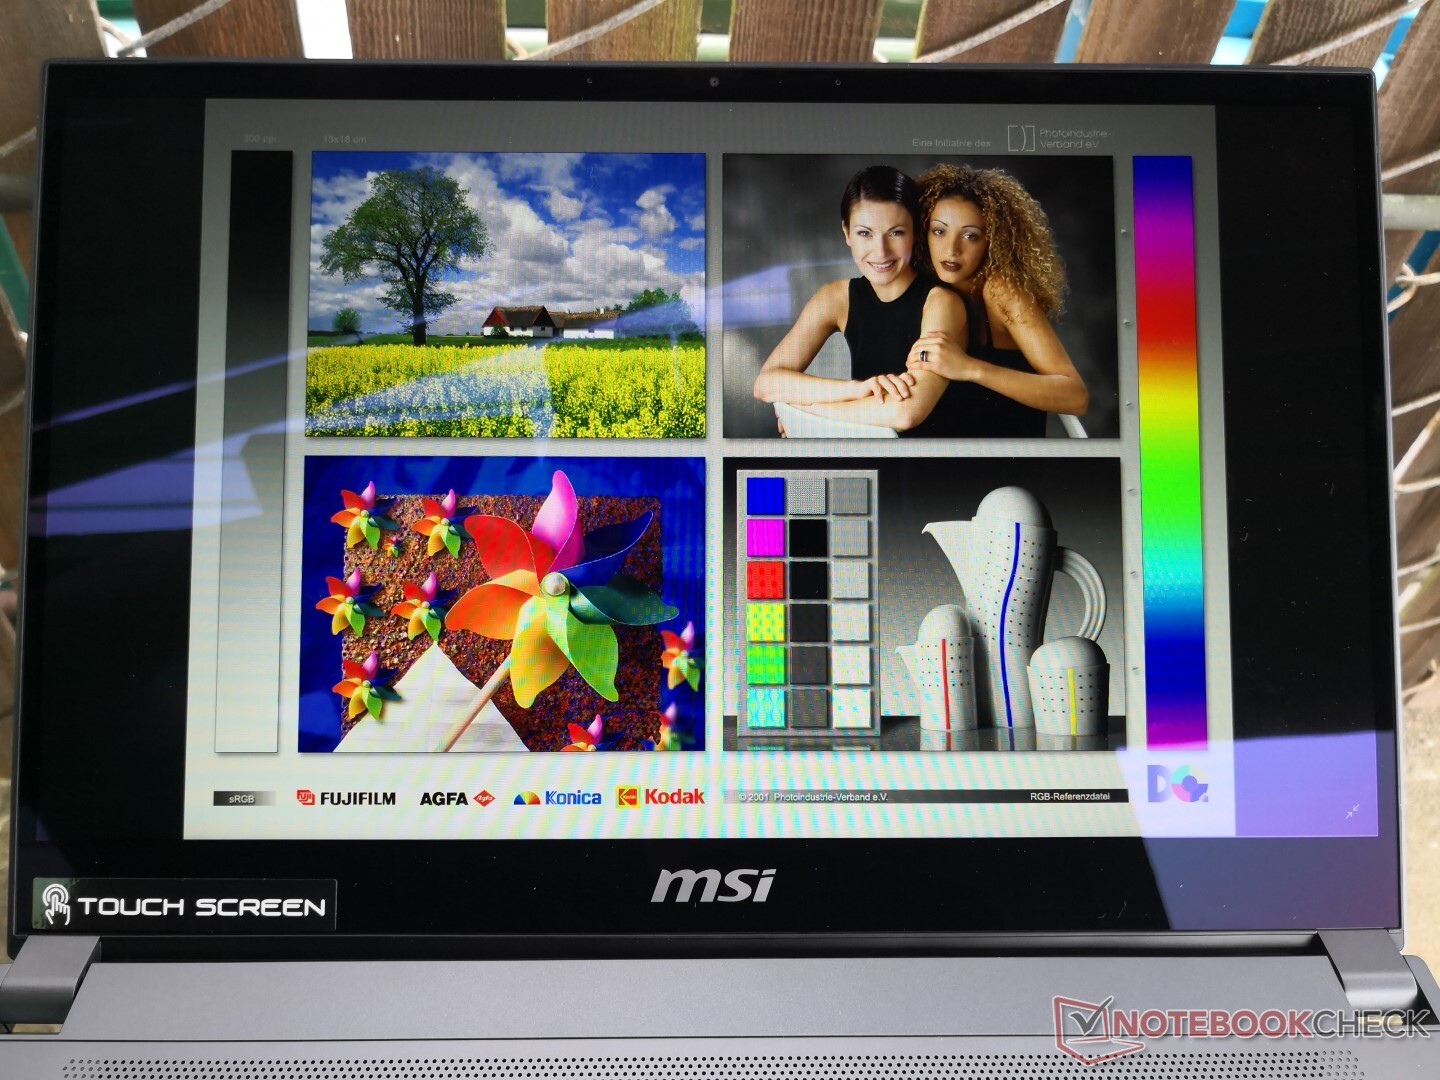
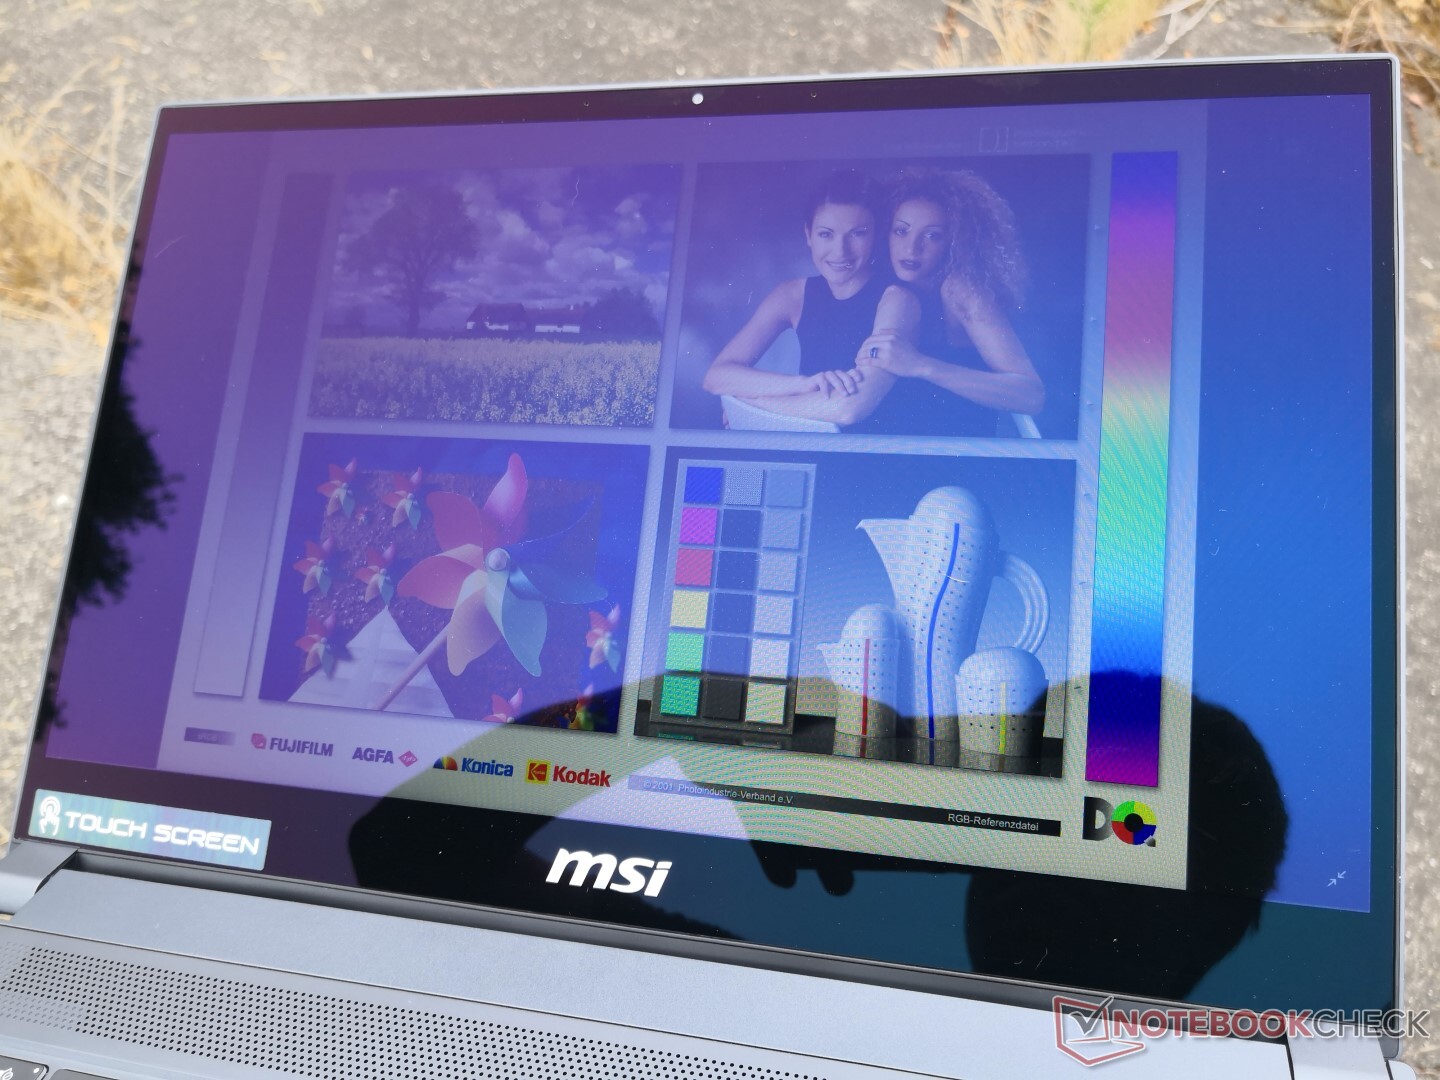
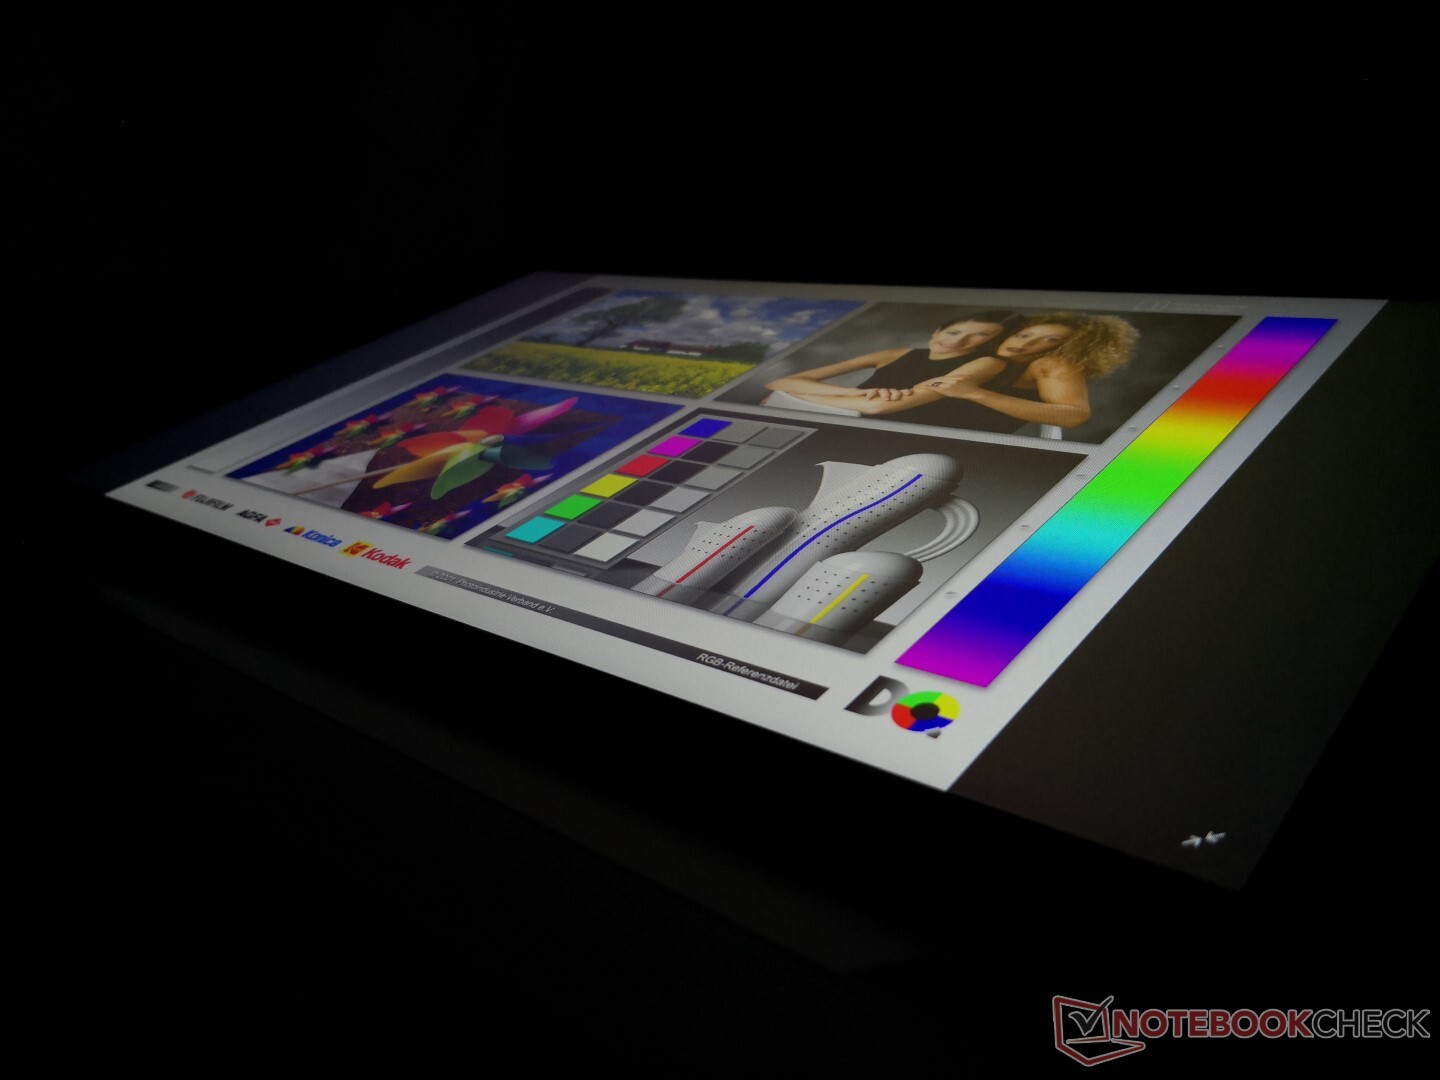
Outdoor visibility is decent when under shade. Otherwise, bright ambient lighting will overwhelm onscreen content and cause glare. The glossy panel exhibits a slight purple reflection unlike on most other laptops which impacts colors if viewing from an angle.
Performance
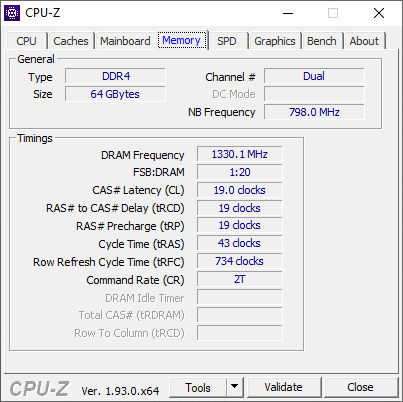
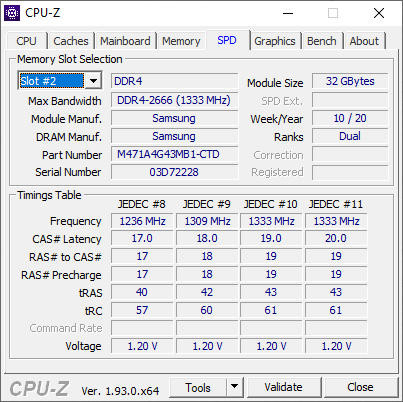
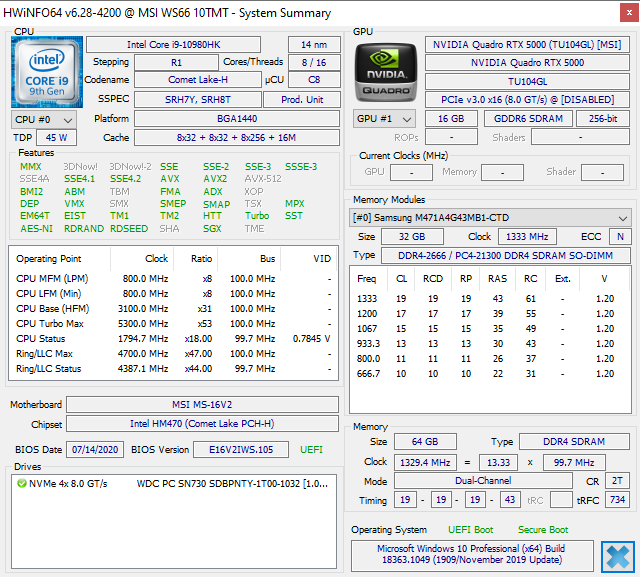
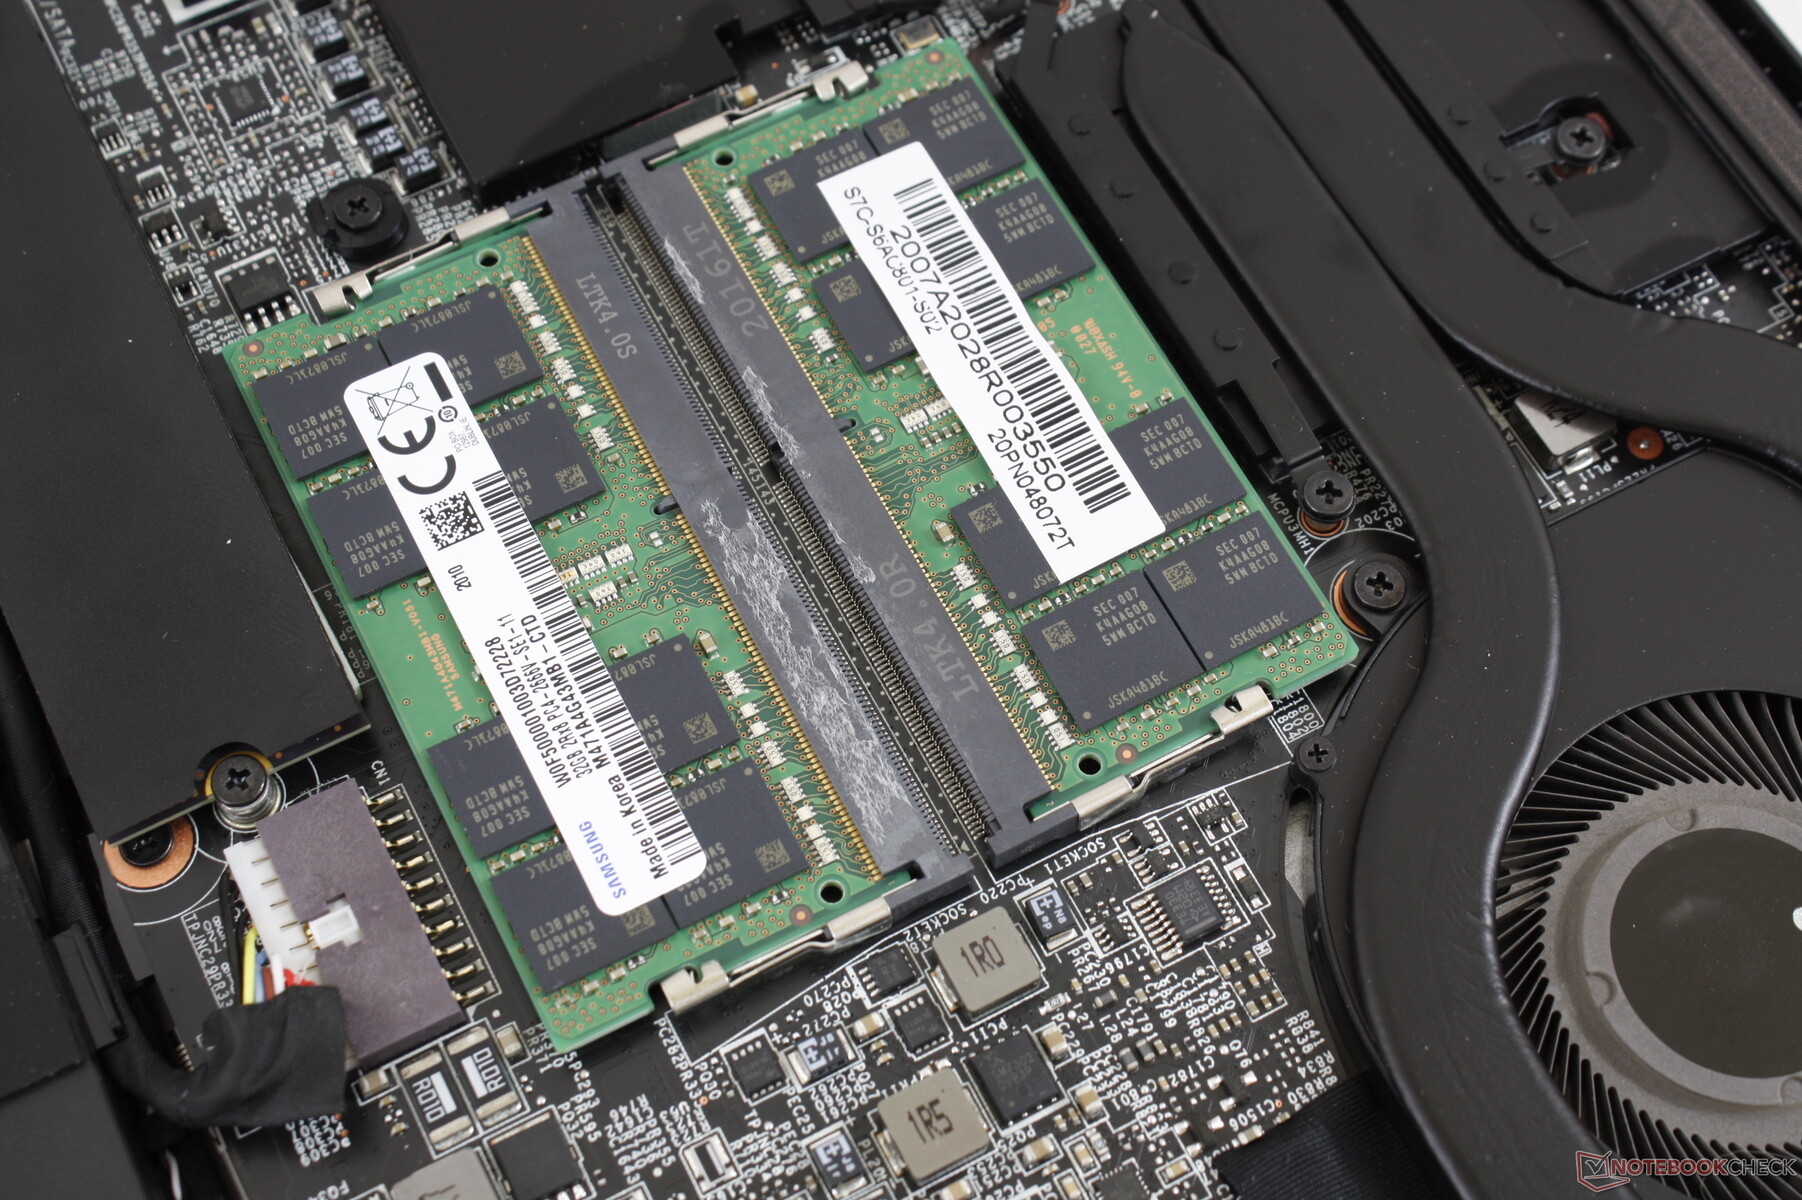
Unlike the Razer Blade 15 Studio which is fixed at the Core i7-10875H, the WS66 offers Xeon and Core i9 options for ECC RAM support and faster raw computing power, respectively. RAM is configurable up to 64 GB compared to 128 GB on full-size workstations like the Dell Precision 7550. Optimus comes standard for automatic graphics switching.
We used MSI's Ultra Performance power profile with Cooler Boost active to run the performance benchmarks below for the highest scores possible.
Processor
CPU performance is excellent with CineBench Multi-Thread scores that are 25 to 30 percent higher than the under-performing Core i7-10875H in the Razer Blade 15 Studio. Performance sustainability is also respectable with a 10 percent drop over time as shown by our CineBench R15 xT loop graph below. Configuring with an Intel Xeon CPU will result in slightly slower processor performance but with the added benefit of ECC RAM.
See our page on the Core i9-10980HK for more technical information and benchmark comparisons.
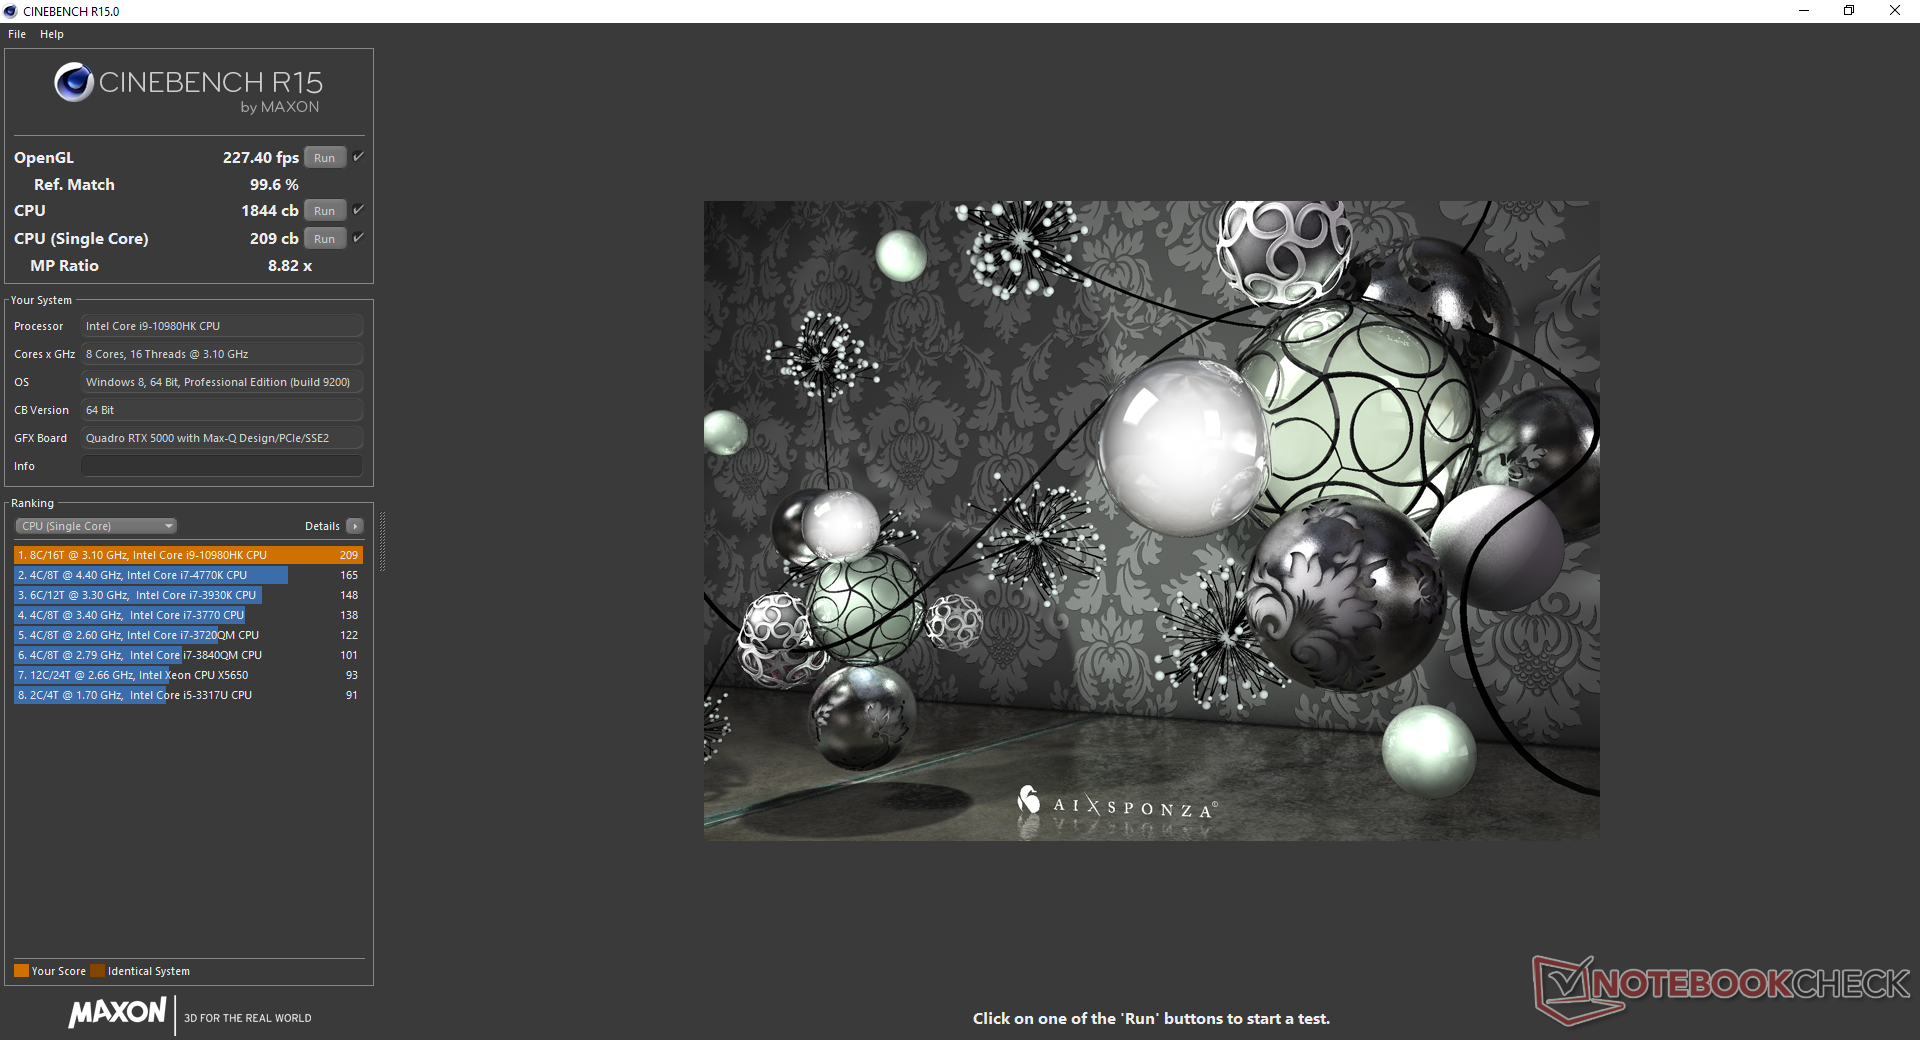
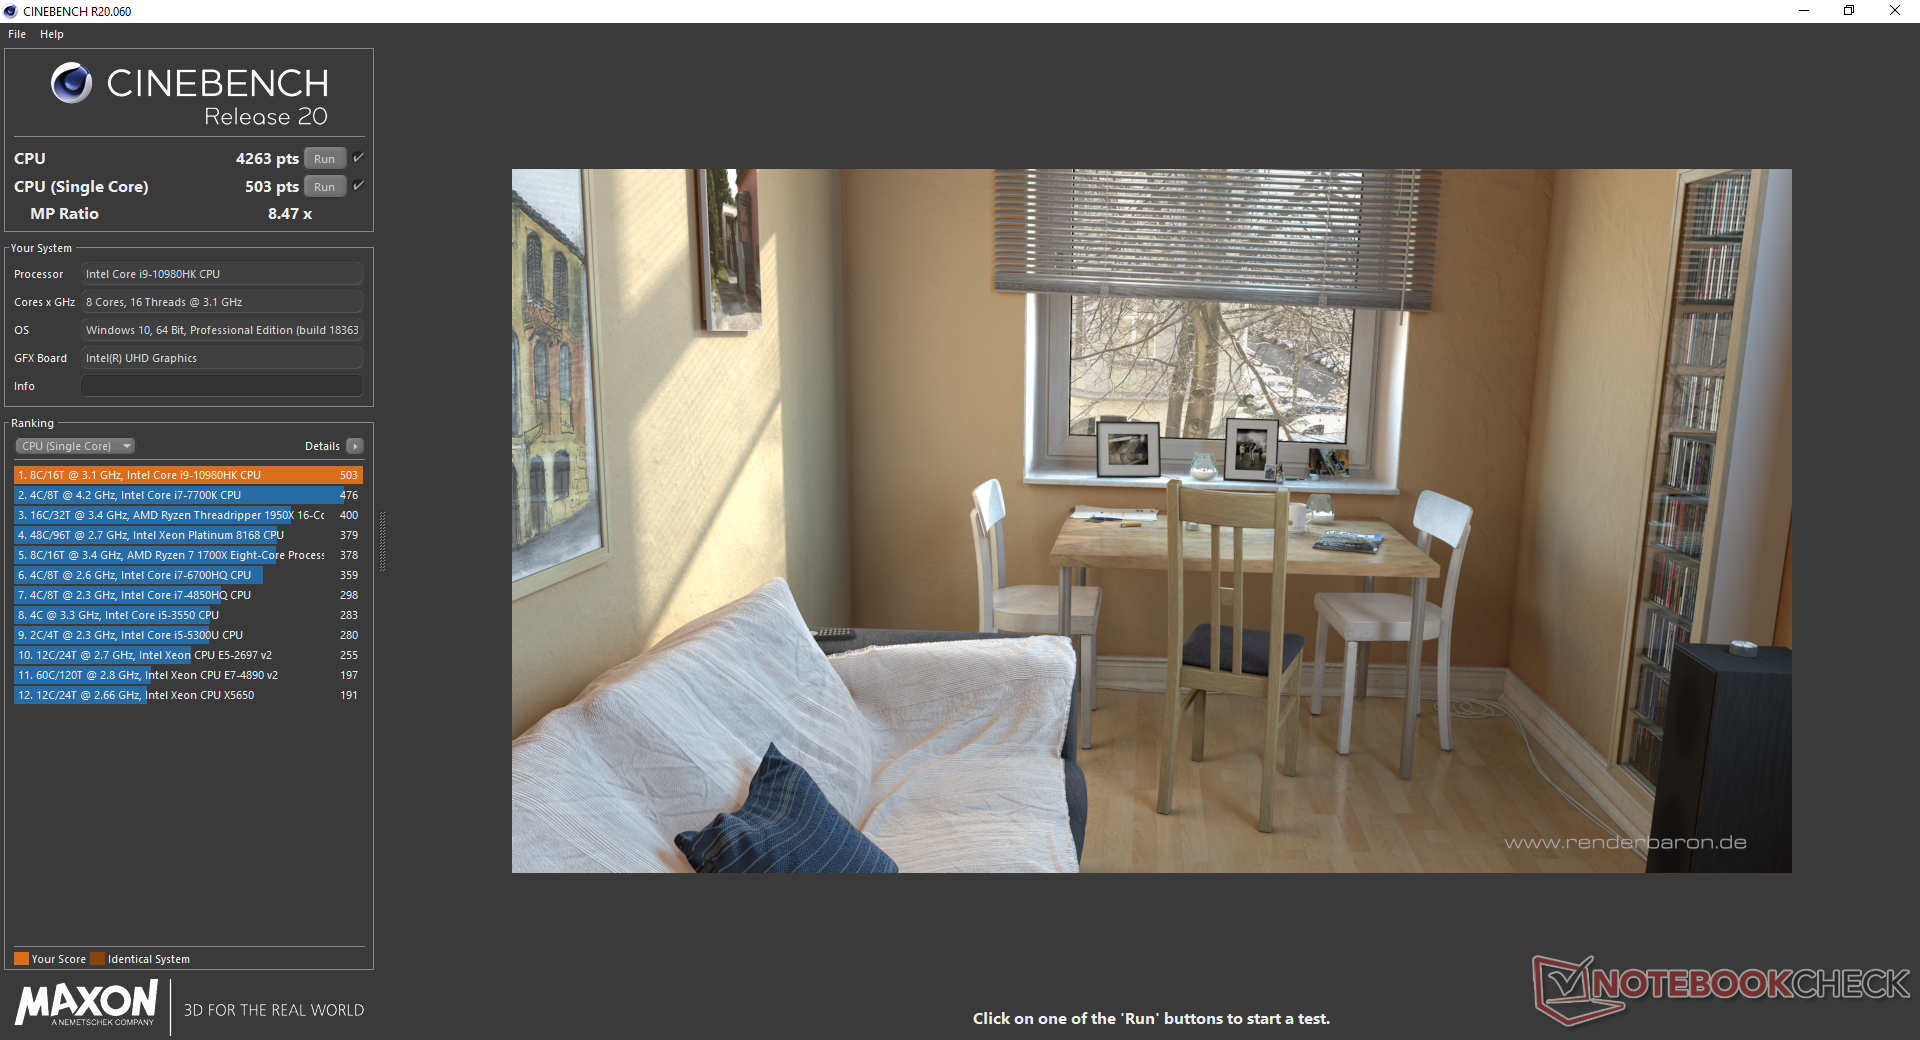
Cinebench R15: CPU Single 64Bit | CPU Multi 64Bit
Blender: v2.79 BMW27 CPU
7-Zip 18.03: 7z b 4 -mmt1 | 7z b 4
Geekbench 5.5: Single-Core | Multi-Core
HWBOT x265 Benchmark v2.2: 4k Preset
LibreOffice : 20 Documents To PDF
R Benchmark 2.5: Overall mean
| Cinebench R20 / CPU (Multi Core) | |
| Intel Core i9-9900KS, Nvidia Titan RTX | |
| Eluktronics RP-15 | |
| MSI WS66 10TMT-207US | |
| Average Intel Core i9-10980HK (3526 - 4487, n=13) | |
| Dell Precision 7550 | |
| Dell Precision 5550 P91F | |
| Razer Blade 15 RTX 2070 Super Max-Q | |
| HP Envy 15-ep0098nr | |
| Acer ConceptD 9 Pro | |
| Acer ConceptD 3 Pro CN315-71P-73W1 | |
| Cinebench R20 / CPU (Single Core) | |
| Intel Core i9-9900KS, Nvidia Titan RTX | |
| Acer ConceptD 9 Pro | |
| MSI WS66 10TMT-207US | |
| Dell Precision 5550 P91F | |
| Eluktronics RP-15 | |
| Razer Blade 15 RTX 2070 Super Max-Q | |
| Dell Precision 7550 | |
| Average Intel Core i9-10980HK (465 - 507, n=13) | |
| Acer ConceptD 3 Pro CN315-71P-73W1 | |
| HP Envy 15-ep0098nr | |
| Cinebench R15 / CPU Single 64Bit | |
| Intel Core i9-9900KS, Nvidia Titan RTX | |
| MSI WS66 10TMT-207US | |
| Dell Precision 7550 | |
| Average Intel Core i9-10980HK (198 - 219, n=15) | |
| Dell Precision 5550 P91F | |
| Razer Blade 15 RTX 2070 Super Max-Q | |
| Acer ConceptD 9 Pro | |
| HP Envy 15-ep0098nr | |
| Eluktronics RP-15 | |
| Acer ConceptD 3 Pro CN315-71P-73W1 | |
| Cinebench R15 / CPU Multi 64Bit | |
| Intel Core i9-9900KS, Nvidia Titan RTX | |
| Eluktronics RP-15 | |
| Average Intel Core i9-10980HK (1606 - 1862, n=15) | |
| MSI WS66 10TMT-207US | |
| Dell Precision 7550 | |
| Acer ConceptD 9 Pro | |
| Dell Precision 5550 P91F | |
| Razer Blade 15 RTX 2070 Super Max-Q | |
| HP Envy 15-ep0098nr | |
| Acer ConceptD 3 Pro CN315-71P-73W1 | |
| Blender / v2.79 BMW27 CPU | |
| Acer ConceptD 3 Pro CN315-71P-73W1 | |
| HP Envy 15-ep0098nr | |
| Dell Precision 5550 P91F | |
| Razer Blade 15 RTX 2070 Super Max-Q | |
| Dell Precision 7550 | |
| Average Intel Core i9-10980HK (239 - 299, n=13) | |
| MSI WS66 10TMT-207US | |
| Eluktronics RP-15 | |
| Intel Core i9-9900KS, Nvidia Titan RTX | |
| Geekbench 5.5 / Single-Core | |
| MSI WS66 10TMT-207US | |
| Average Intel Core i9-10980HK (1283 - 1401, n=12) | |
| Dell Precision 7550 | |
| Dell Precision 5550 P91F | |
| Acer ConceptD 9 Pro | |
| Razer Blade 15 RTX 2070 Super Max-Q | |
| HP Envy 15-ep0098nr | |
| Eluktronics RP-15 | |
| Acer ConceptD 3 Pro CN315-71P-73W1 | |
| Geekbench 5.5 / Multi-Core | |
| Eluktronics RP-15 | |
| Dell Precision 5550 P91F | |
| Dell Precision 7550 | |
| MSI WS66 10TMT-207US | |
| Average Intel Core i9-10980HK (7634 - 8666, n=12) | |
| Acer ConceptD 9 Pro | |
| Razer Blade 15 RTX 2070 Super Max-Q | |
| HP Envy 15-ep0098nr | |
| Acer ConceptD 3 Pro CN315-71P-73W1 | |
| HWBOT x265 Benchmark v2.2 / 4k Preset | |
| Intel Core i9-9900KS, Nvidia Titan RTX | |
| Eluktronics RP-15 | |
| Dell Precision 7550 | |
| MSI WS66 10TMT-207US | |
| Average Intel Core i9-10980HK (12 - 14.6, n=13) | |
| Razer Blade 15 RTX 2070 Super Max-Q | |
| Dell Precision 5550 P91F | |
| HP Envy 15-ep0098nr | |
| Acer ConceptD 3 Pro CN315-71P-73W1 | |
| LibreOffice / 20 Documents To PDF | |
| Eluktronics RP-15 | |
| Acer ConceptD 9 Pro | |
| Acer ConceptD 3 Pro CN315-71P-73W1 | |
| Average Intel Core i9-10980HK (44 - 89, n=13) | |
| HP Envy 15-ep0098nr | |
| Dell Precision 7550 | |
| Razer Blade 15 RTX 2070 Super Max-Q | |
| MSI WS66 10TMT-207US | |
| Dell Precision 5550 P91F | |
| R Benchmark 2.5 / Overall mean | |
| Acer ConceptD 3 Pro CN315-71P-73W1 | |
| HP Envy 15-ep0098nr | |
| Dell Precision 5550 P91F | |
| Razer Blade 15 RTX 2070 Super Max-Q | |
| Average Intel Core i9-10980HK (0.561 - 0.596, n=13) | |
| Eluktronics RP-15 | |
| MSI WS66 10TMT-207US | |
| Dell Precision 7550 | |
* ... smaller is better
System Performance
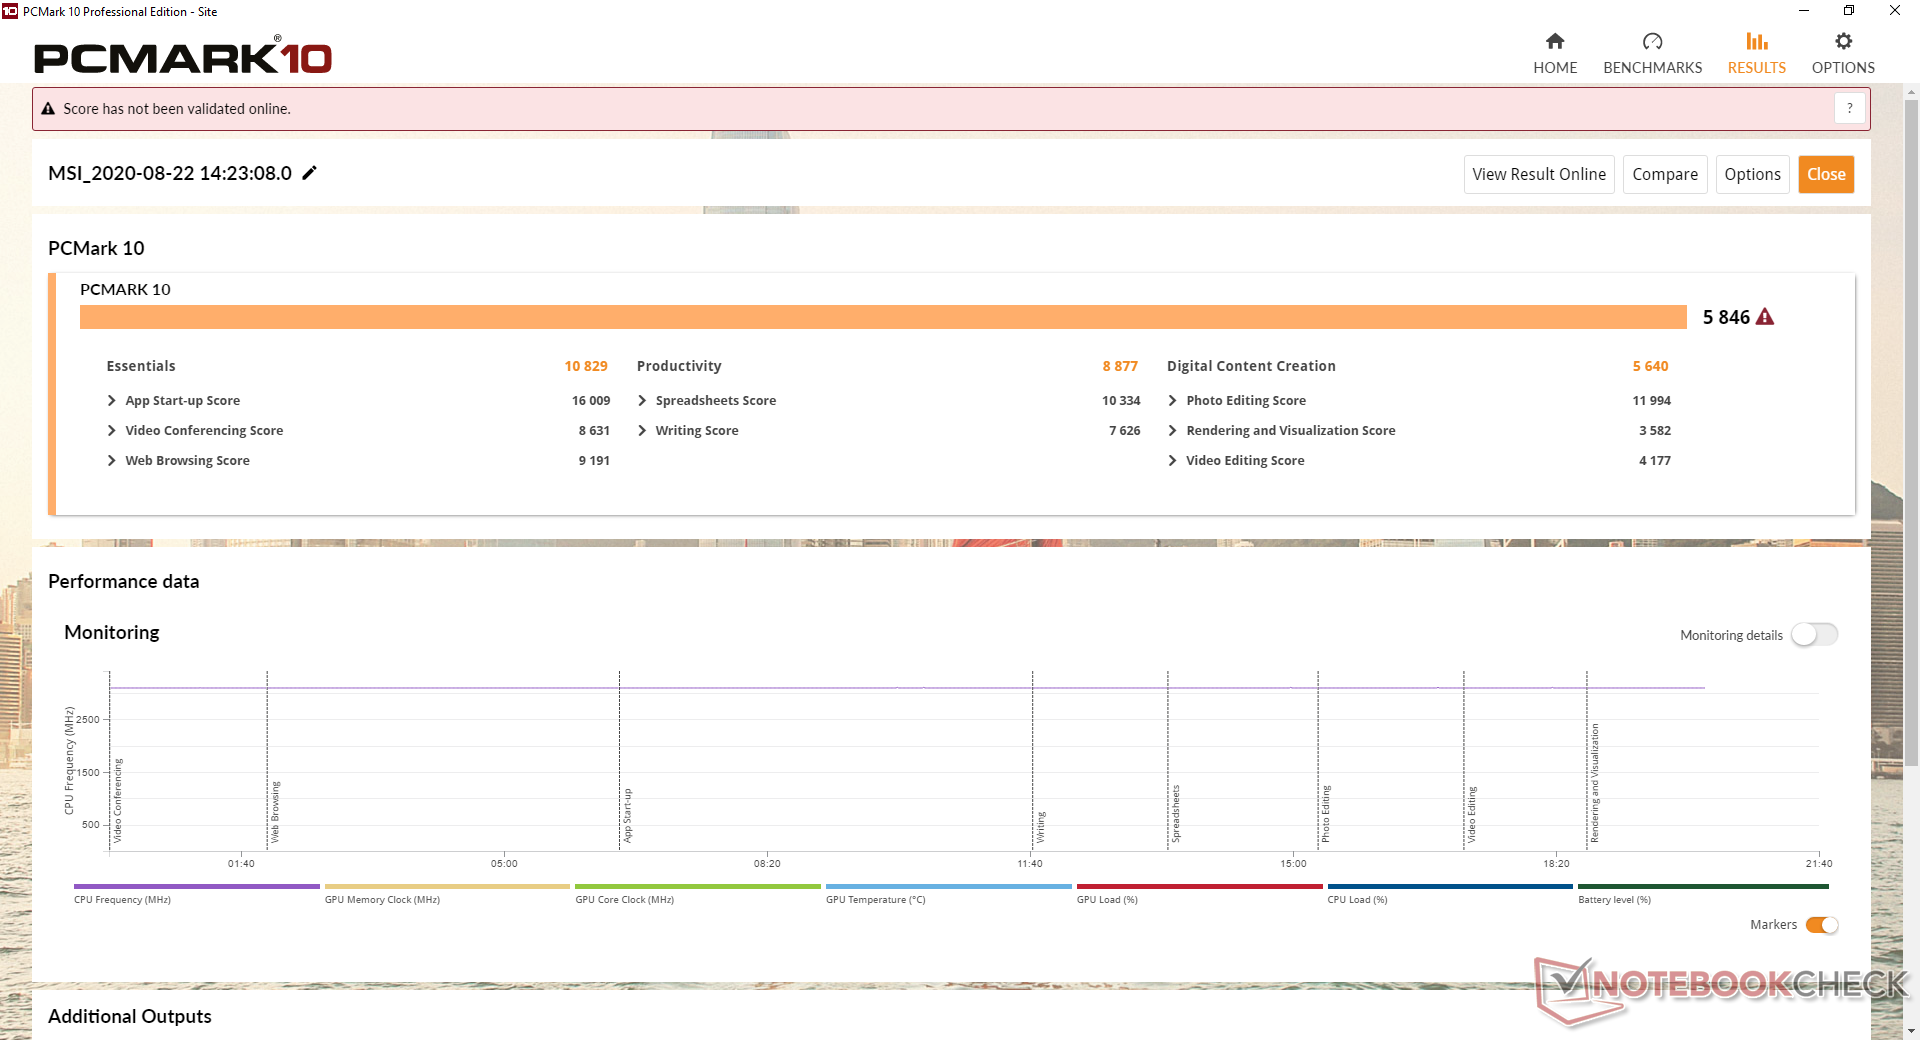
PCMark benchmarks are consistently ahead of the Razer Blade 15 Studio likely due in part to the overall faster CPU performance mentioned above. We didn't experience any software issues during our time with the test unit, but we recommend becoming familiar with MSI Creator Center as performance and fan noise controls reside here.
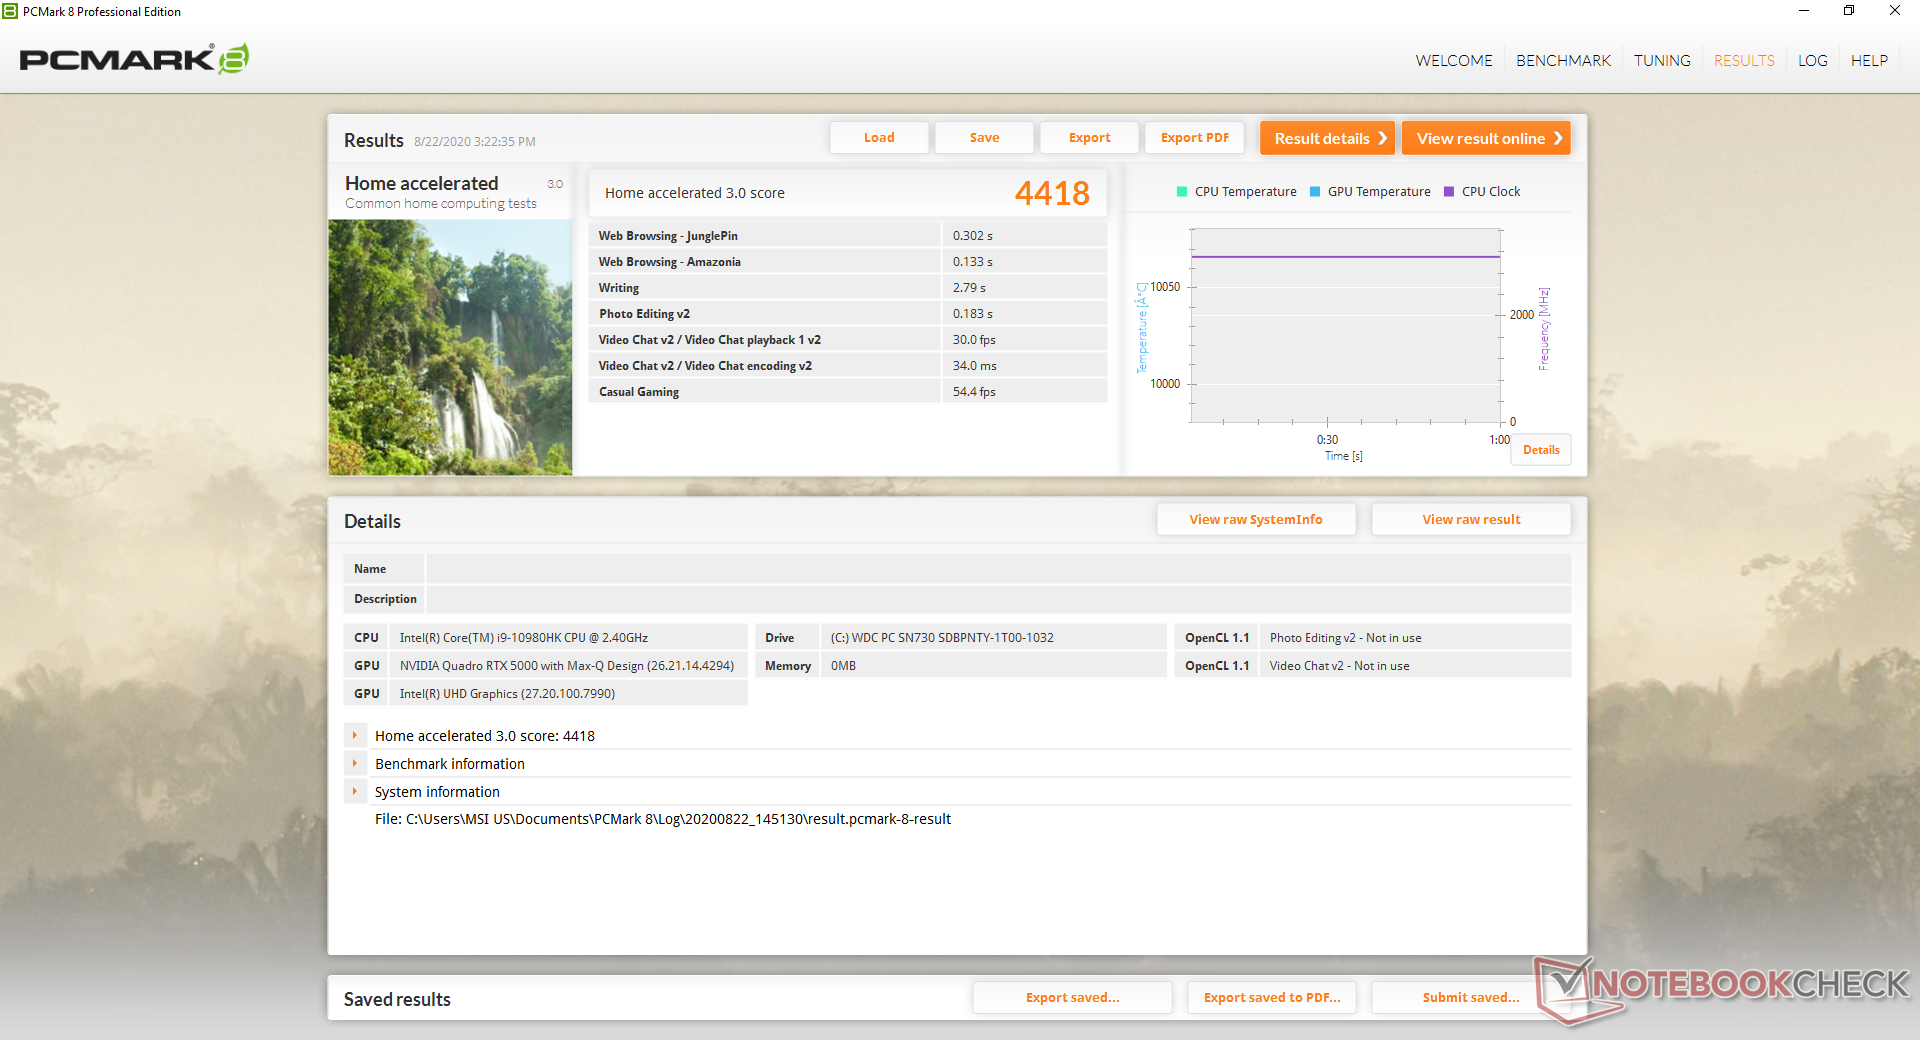
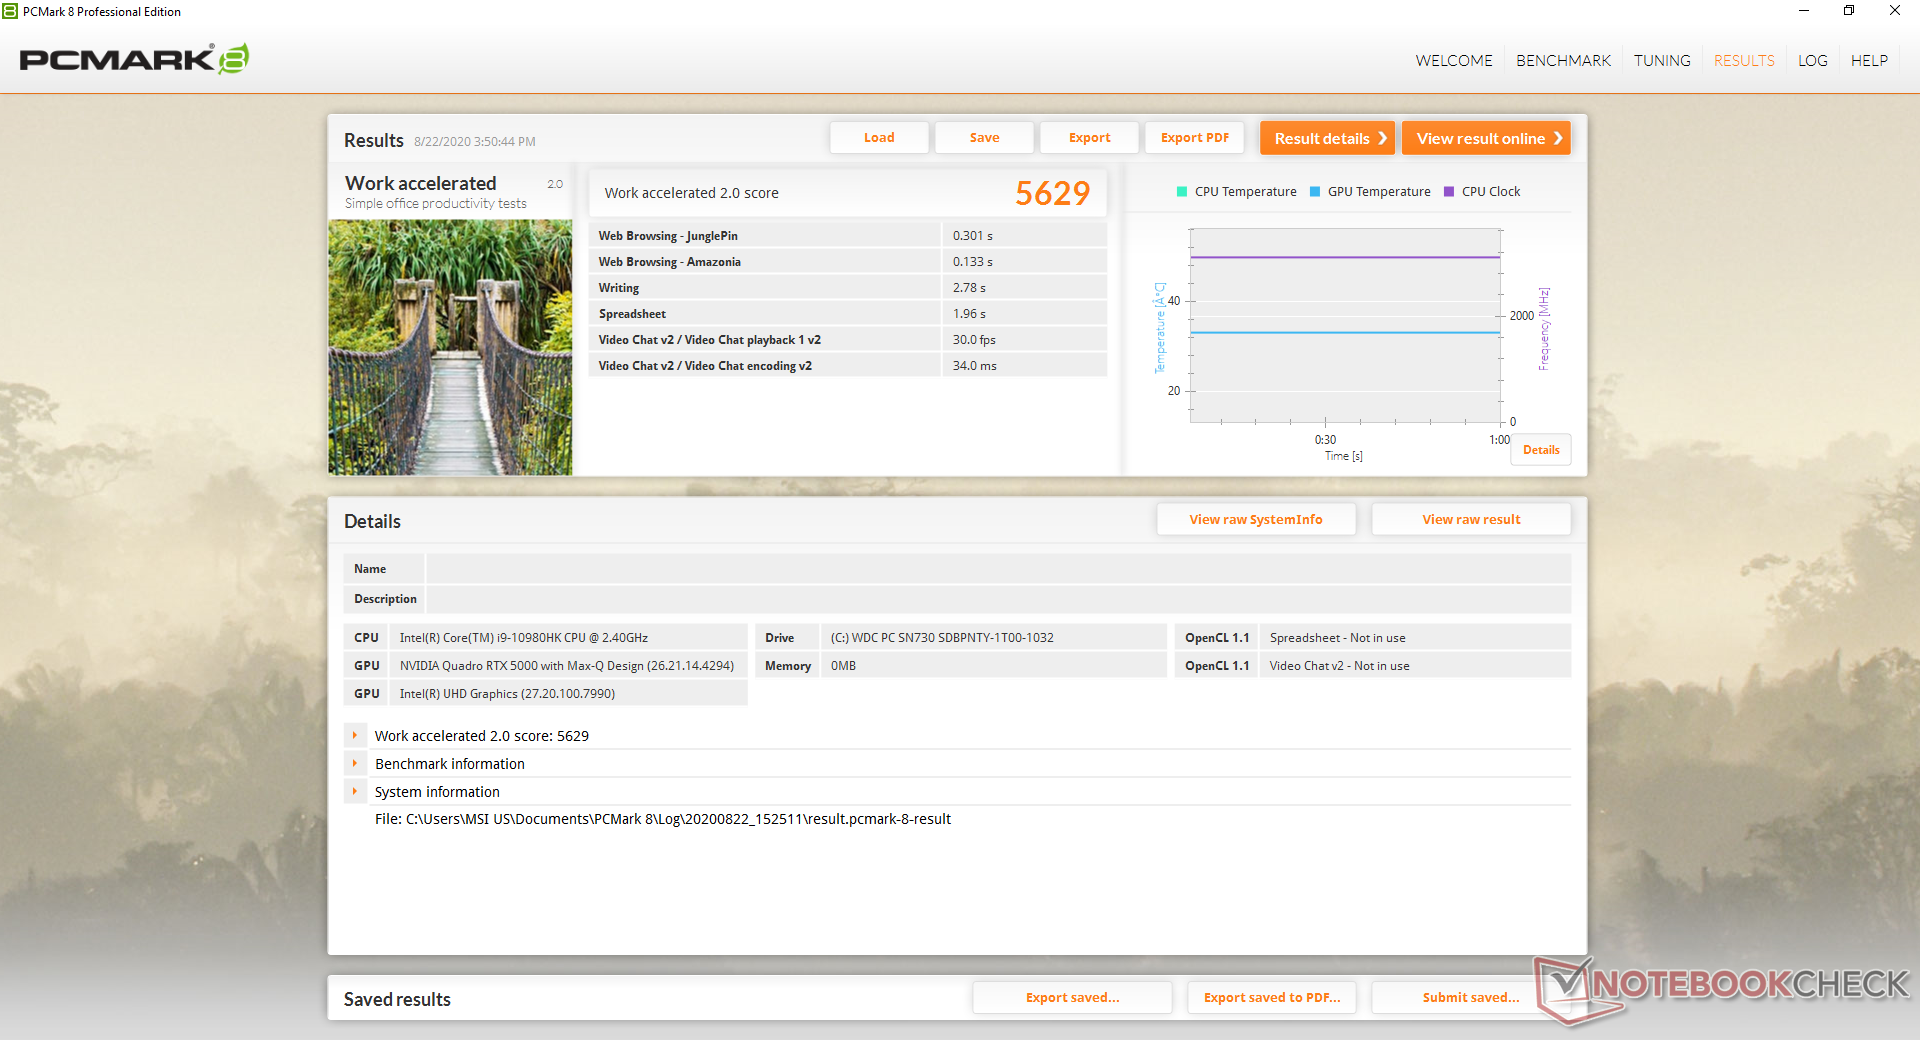
| PCMark 8 Home Score Accelerated v2 | 4418 points | |
| PCMark 8 Work Score Accelerated v2 | 5629 points | |
| PCMark 10 Score | 5846 points | |
Help | ||
DPC Latency
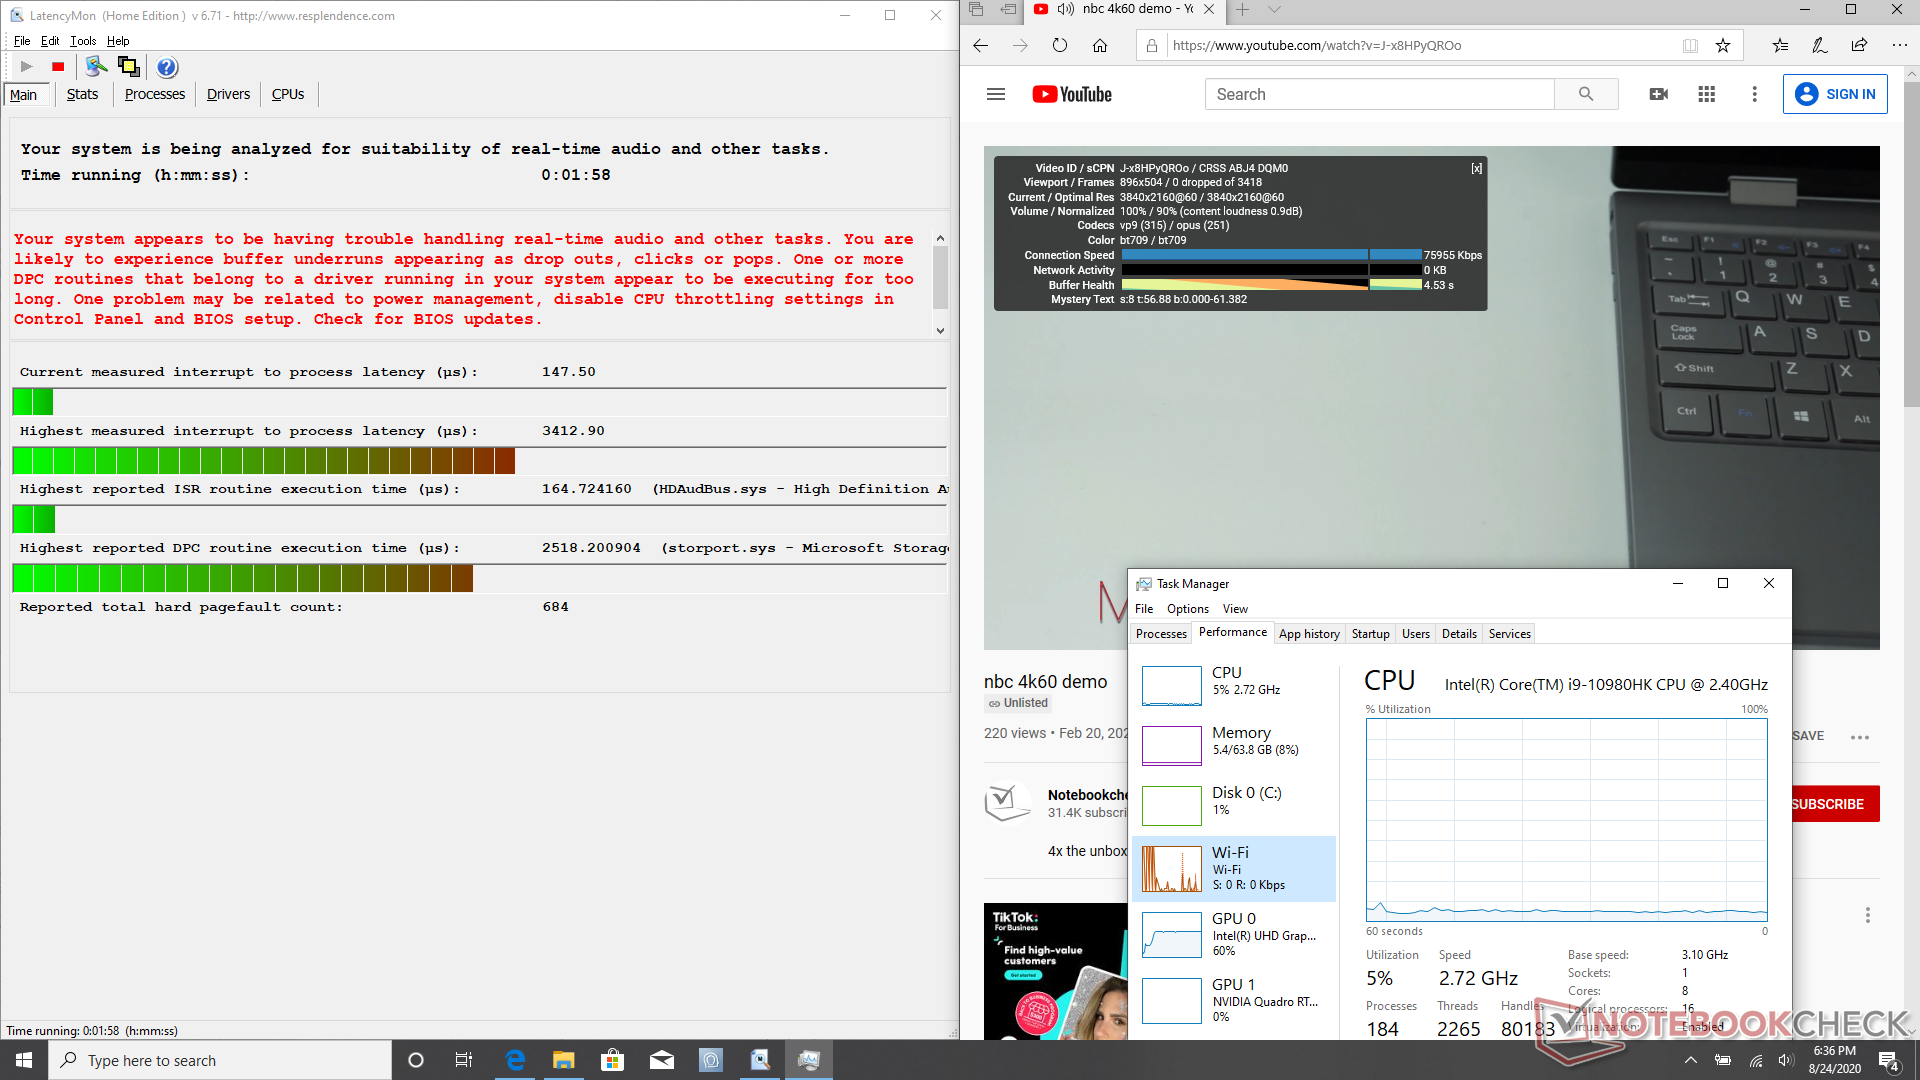
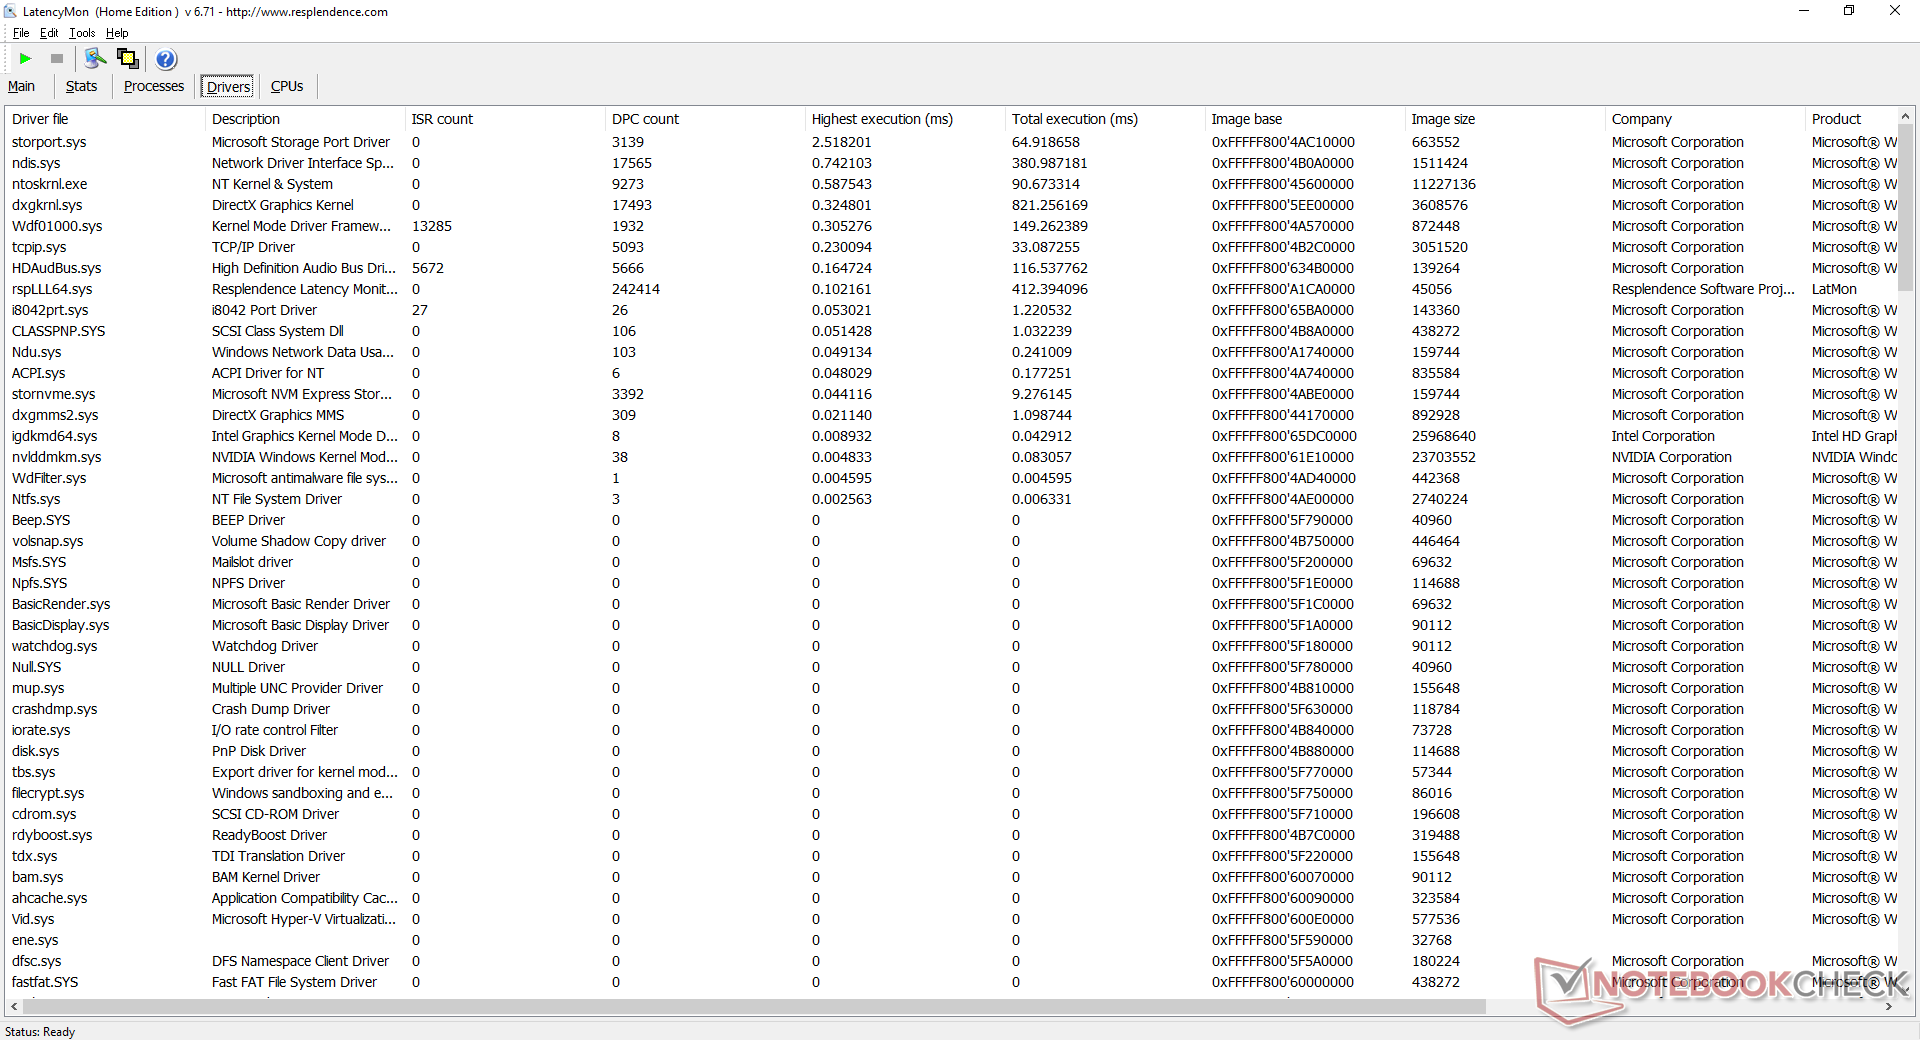
LatencyMon shows DPC latency issues while opening multiple tabs on our homepage which is disappointing to see on a mobile workstation. 4K60 playback is otherwise smooth and with no dropped frames during our minute-long YouTube test video.
| DPC Latencies / LatencyMon - interrupt to process latency (max), Web, Youtube, Prime95 | |
| Dell Precision 7550 | |
| MSI WS66 10TMT-207US | |
| Razer Blade 15 RTX 2070 Super Max-Q | |
| Acer ConceptD 3 Pro CN315-71P-73W1 | |
| Razer Blade 15 Studio Edition 2020 | |
| Dell Precision 5550 P91F | |
* ... smaller is better
Storage Devices
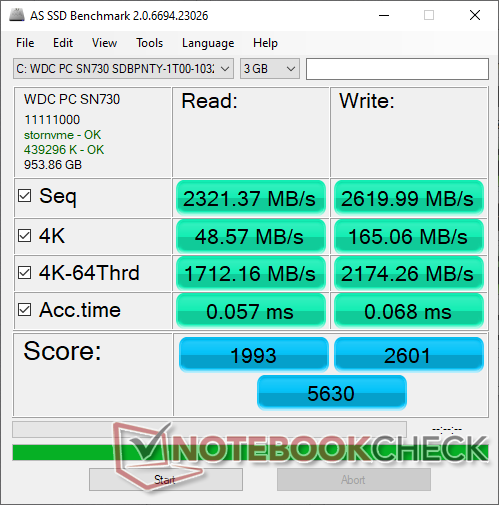
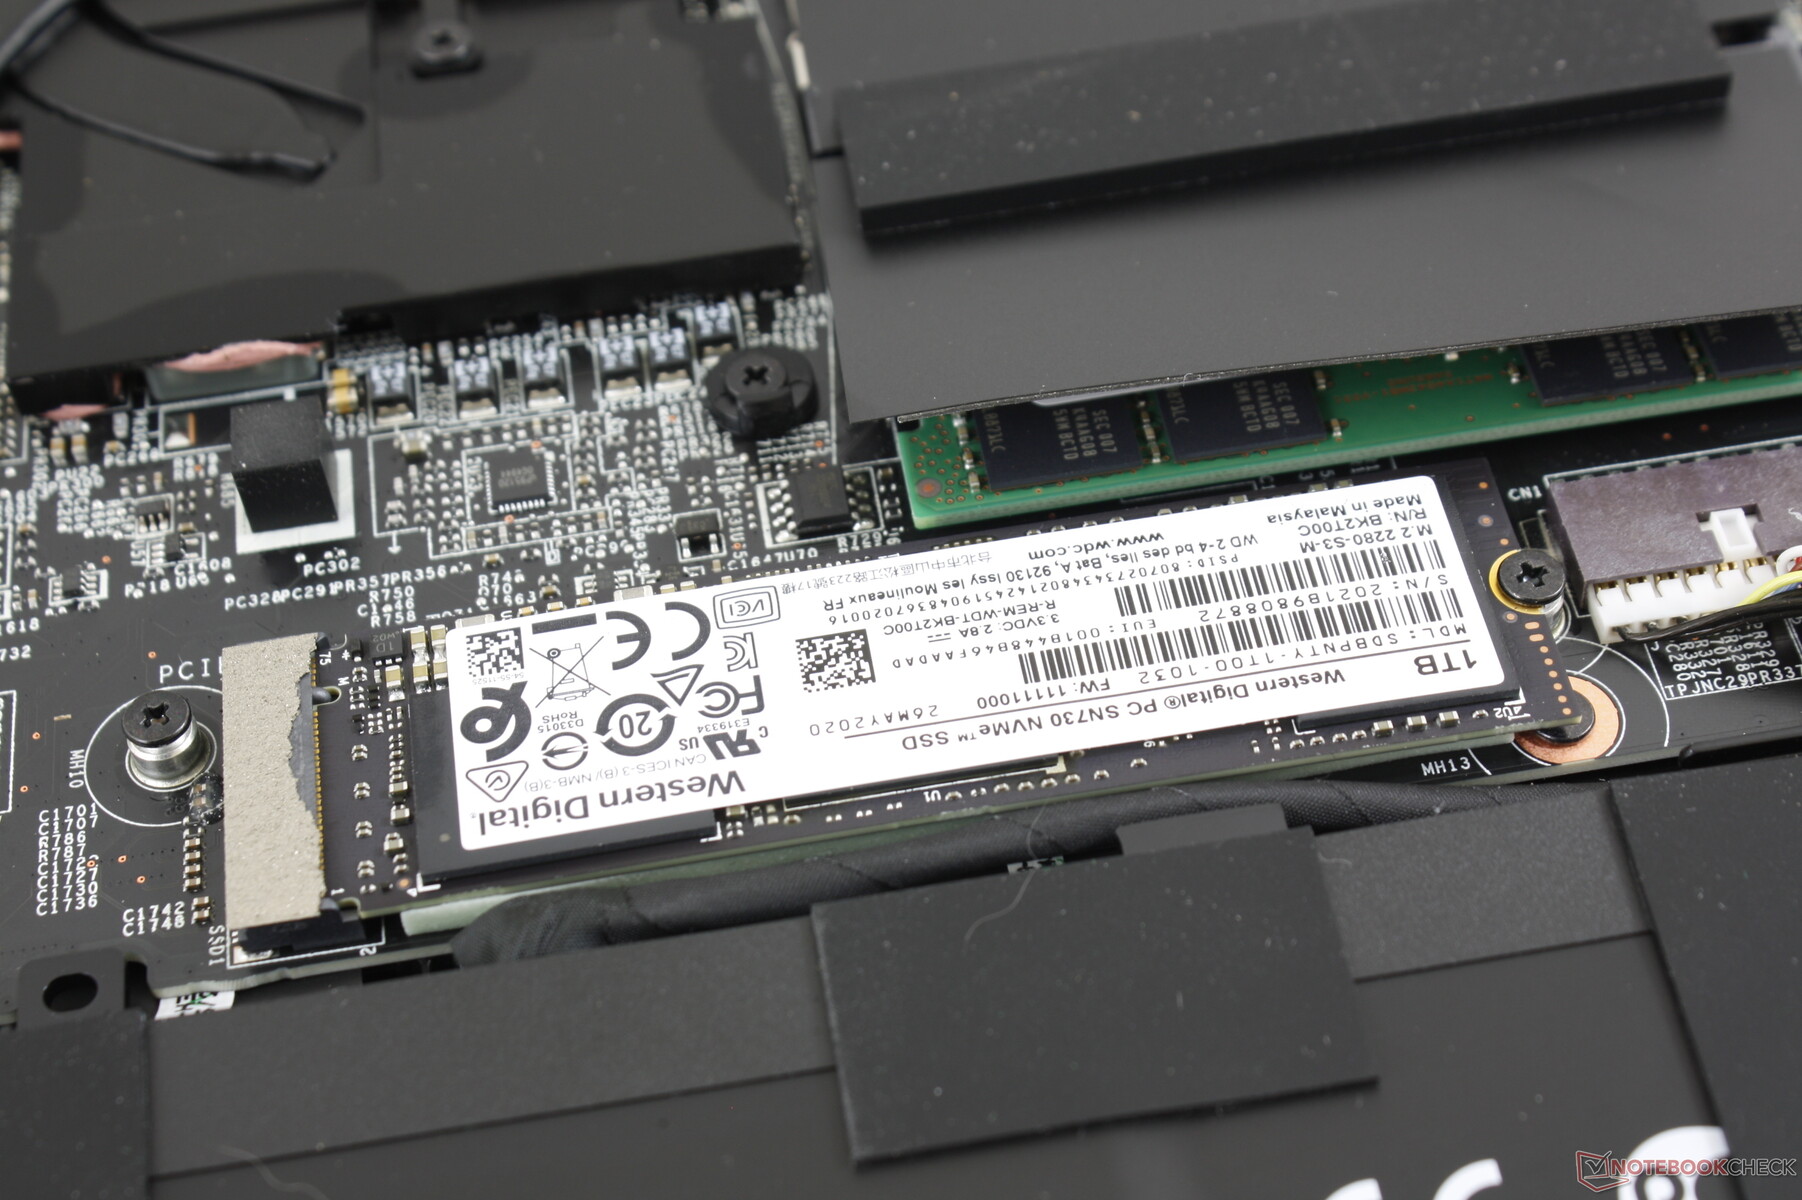
| MSI WS66 10TMT-207US WDC PC SN730 SDBPNTY-1T00 | Dell Precision 7550 SK Hynix PC601A NVMe 1TB | Dell Precision 5550 P91F SK Hynix PC601A NVMe 1TB | Razer Blade 15 Studio Edition 2020 Samsung PM981a MZVLB1T0HBLR | MSI WS63VR 7RL-023US Toshiba NVMe THNSN5512GPU7 | Acer ConceptD 3 Pro CN315-71P-73W1 WDC PC SN720 SDAPNTW-512G | |
|---|---|---|---|---|---|---|
| AS SSD | -30% | -117% | -18% | -47% | -22% | |
| Seq Read | 2321 | 2028 -13% | 2039 -12% | 1982 -15% | 2133 -8% | 2973 28% |
| Seq Write | 2620 | 1193 -54% | 1376 -47% | 2252 -14% | 1287 -51% | 2429 -7% |
| 4K Read | 48.57 | 42.31 -13% | 44.11 -9% | 47.13 -3% | 40.2 -17% | 24.7 -49% |
| 4K Write | 165.1 | 105.5 -36% | 113.3 -31% | 88.2 -47% | 114.6 -31% | 115.3 -30% |
| 4K-64 Read | 1712 | 1128 -34% | 1094 -36% | 1481 -13% | 710 -59% | 1243 -27% |
| 4K-64 Write | 2174 | 1537 -29% | 1630 -25% | 1842 -15% | 314 -86% | 835 -62% |
| Access Time Read * | 0.057 | 0.069 -21% | 0.059 -4% | 0.087 -53% | 0.128 -125% | |
| Access Time Write * | 0.068 | 0.106 -56% | 0.99 -1356% | 0.04 41% | 0.033 51% | 0.034 50% |
| Score Read | 1993 | 1373 -31% | 1342 -33% | 1726 -13% | 962 -52% | 1565 -21% |
| Score Write | 2601 | 1762 -32% | 1881 -28% | 2155 -17% | 557 -79% | 1193 -54% |
| Score Total | 5630 | 3801 -32% | 3883 -31% | 4781 -15% | 1979 -65% | 3525 -37% |
| Copy ISO MB/s | 2589 | 1768 -32% | 2489 -4% | 1982 -23% | 2136 -17% | |
| Copy Program MB/s | 791 | 627 -21% | 682 -14% | 501 -37% | 489.6 -38% | |
| Copy Game MB/s | 1625 | 1477 -9% | 1515 -7% | 1140 -30% | 1163 -28% | |
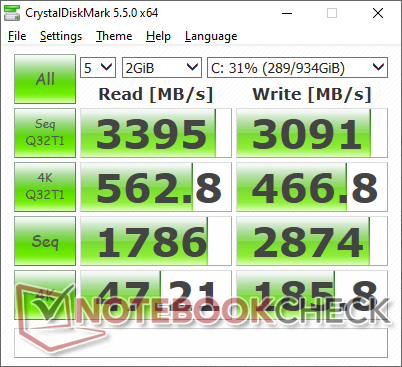
| CrystalDiskMark 5.2 / 6 | -16% | -17% | -6% | -27% | -19% | |
| Write 4K | 185.8 | 121 -35% | 122.6 -34% | 132.9 -28% | 157.1 -15% | 113.2 -39% |
| Read 4K | 47.21 | 42.16 -11% | 42.4 -10% | 46.73 -1% | 43.82 -7% | 31.1 -34% |
| Write Seq | 2874 | 2150 -25% | 2167 -25% | 2214 -23% | 1110 -61% | 2540 -12% |
| Read Seq | 1786 | 1755 -2% | 1747 -2% | 2018 13% | 1162 -35% | 2005 12% |
| Write 4K Q32T1 | 466.8 | 395.3 -15% | 388.8 -17% | 478.9 3% | 361.3 -23% | 331.4 -29% |
| Read 4K Q32T1 | 563 | 381.8 -32% | 367.3 -35% | 540 -4% | 563 0% | 368.3 -35% |
| Write Seq Q32T1 | 3091 | 2730 -12% | 2629 -15% | 2975 -4% | 1558 -50% | 2535 -18% |
| Read Seq Q32T1 | 3395 | 3468 2% | 3460 2% | 3195 -6% | 2635 -22% | 3427 1% |
| Total Average (Program / Settings) | -23% /
-25% | -67% /
-81% | -12% /
-14% | -37% /
-39% | -21% /
-21% |
* ... smaller is better

Disk Throttling: DiskSpd Read Loop, Queue Depth 8
GPU Performance
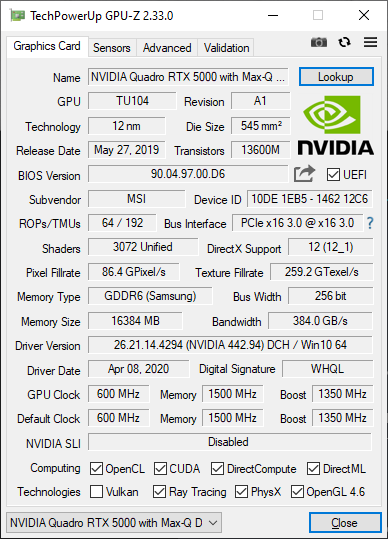
The Quadro RTX 5000 Max-Q is performing where we expect it to be relative to other laptops with the same GPU. Upgrading to thicker workstations like the Acer ConceptD 9 Pro or Eurocom Tornado F5W with the full-power Quadro RTX 5000 can give a 30 to 50 percent increase in graphics power.
See our dedicated page on the Quadro RTX 5000 Max-Q for more technical information and benchmark comparisons.
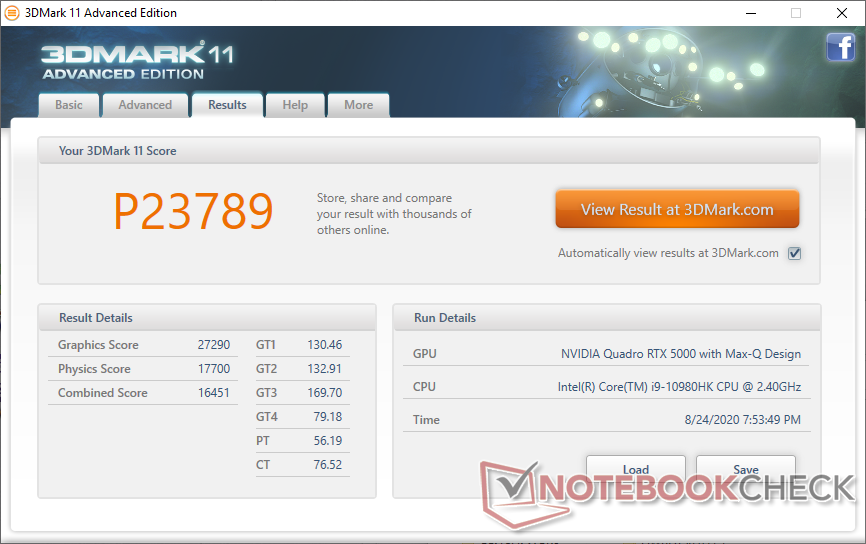
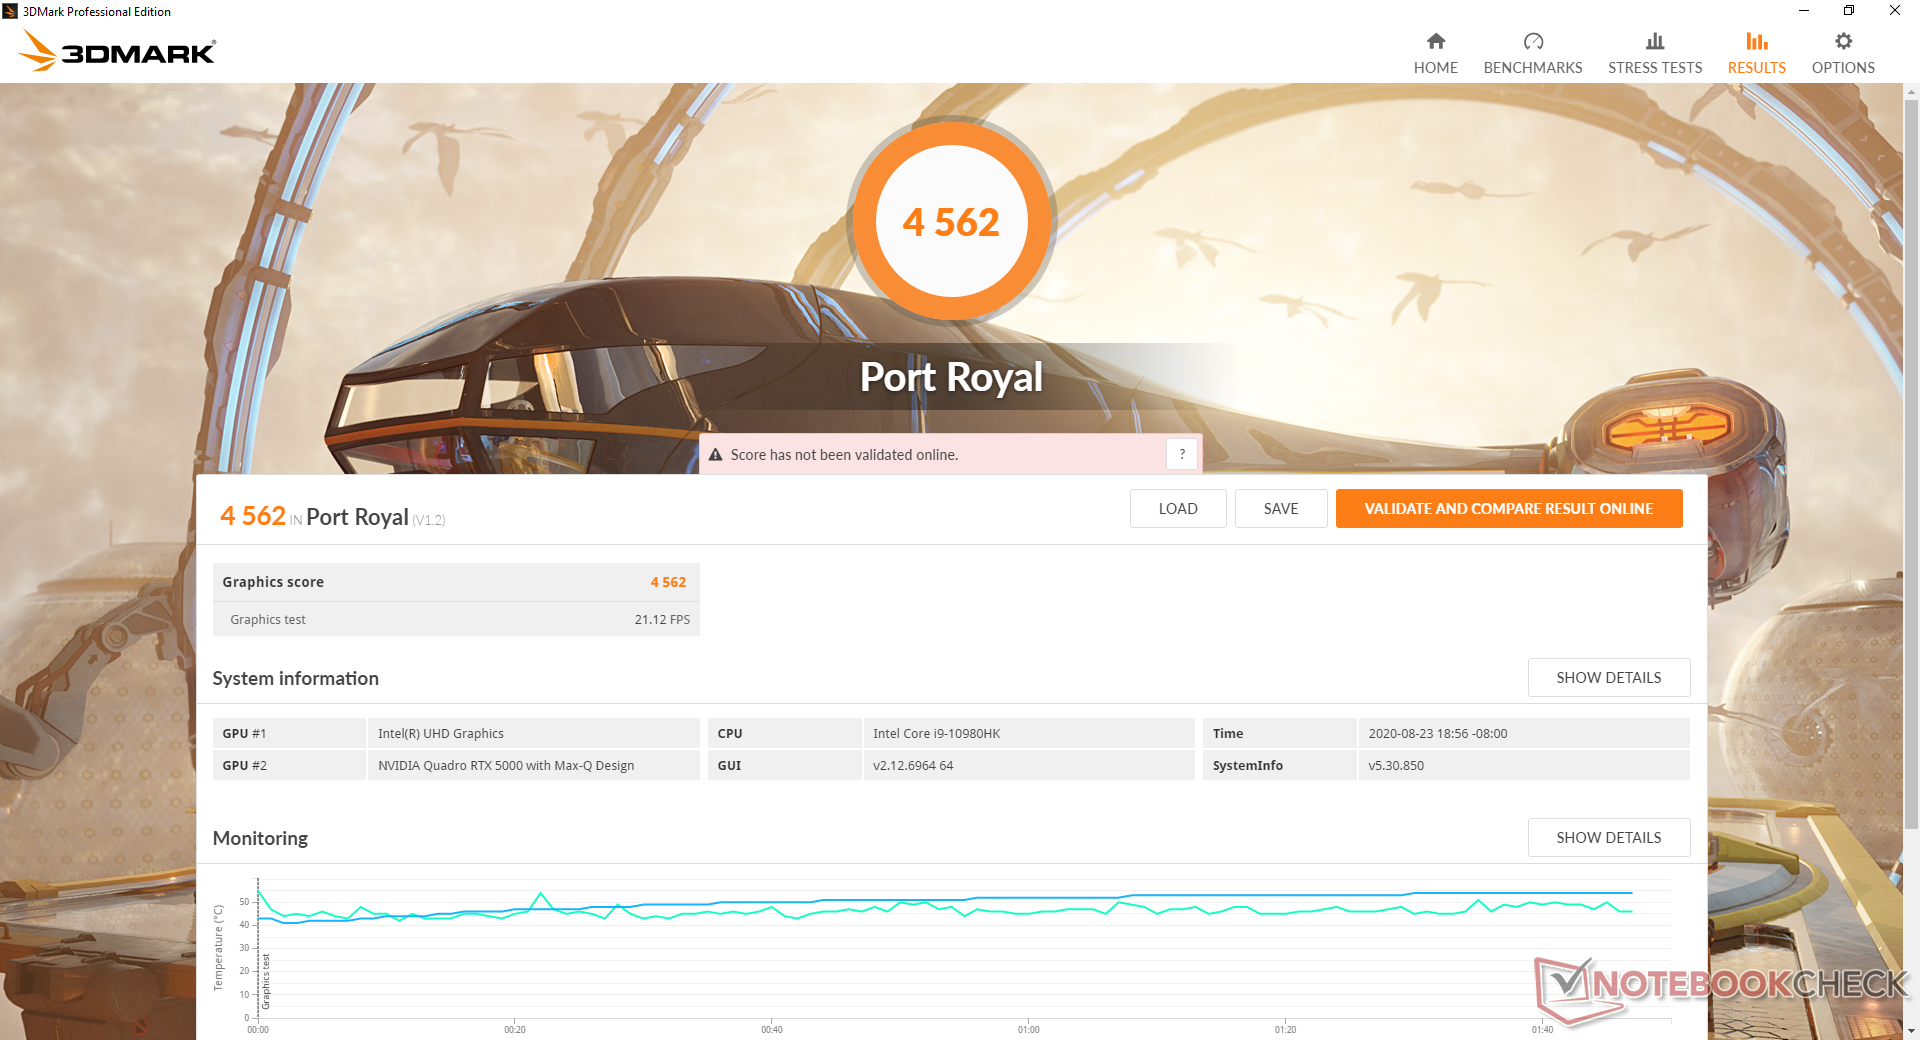
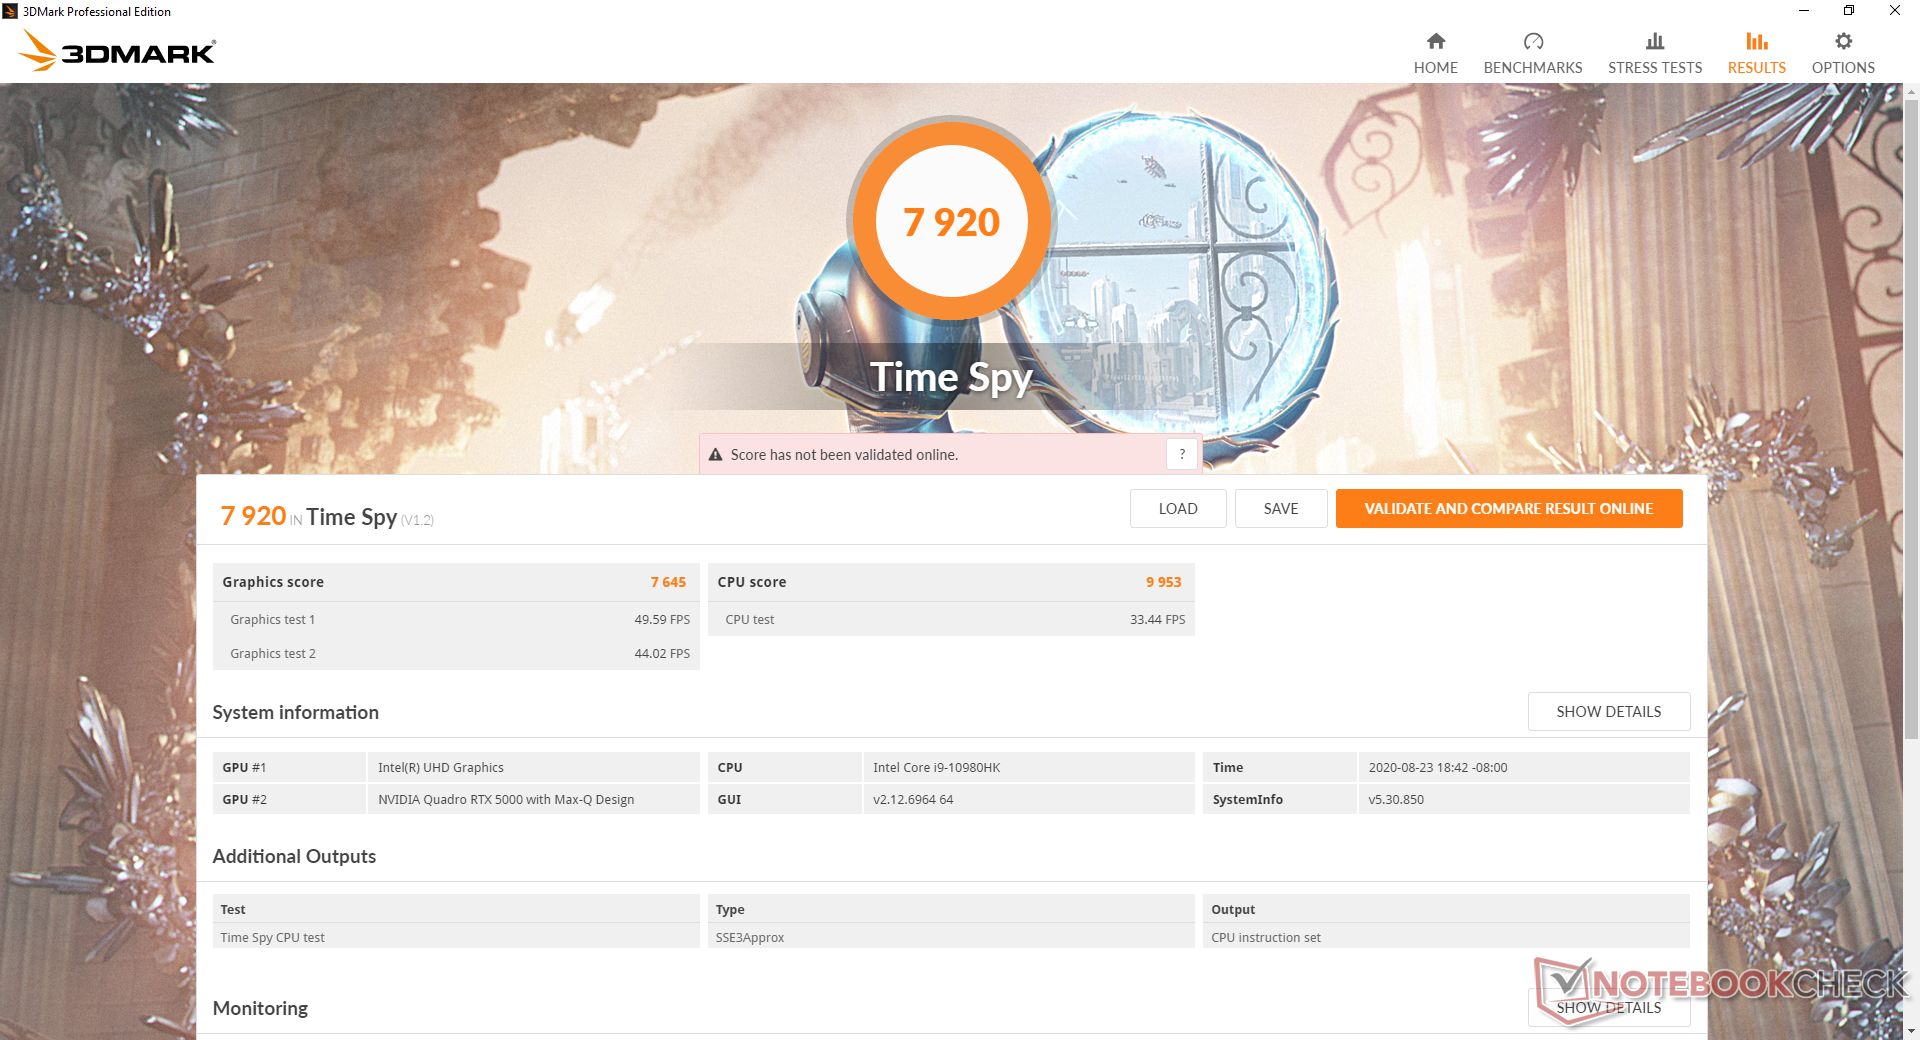

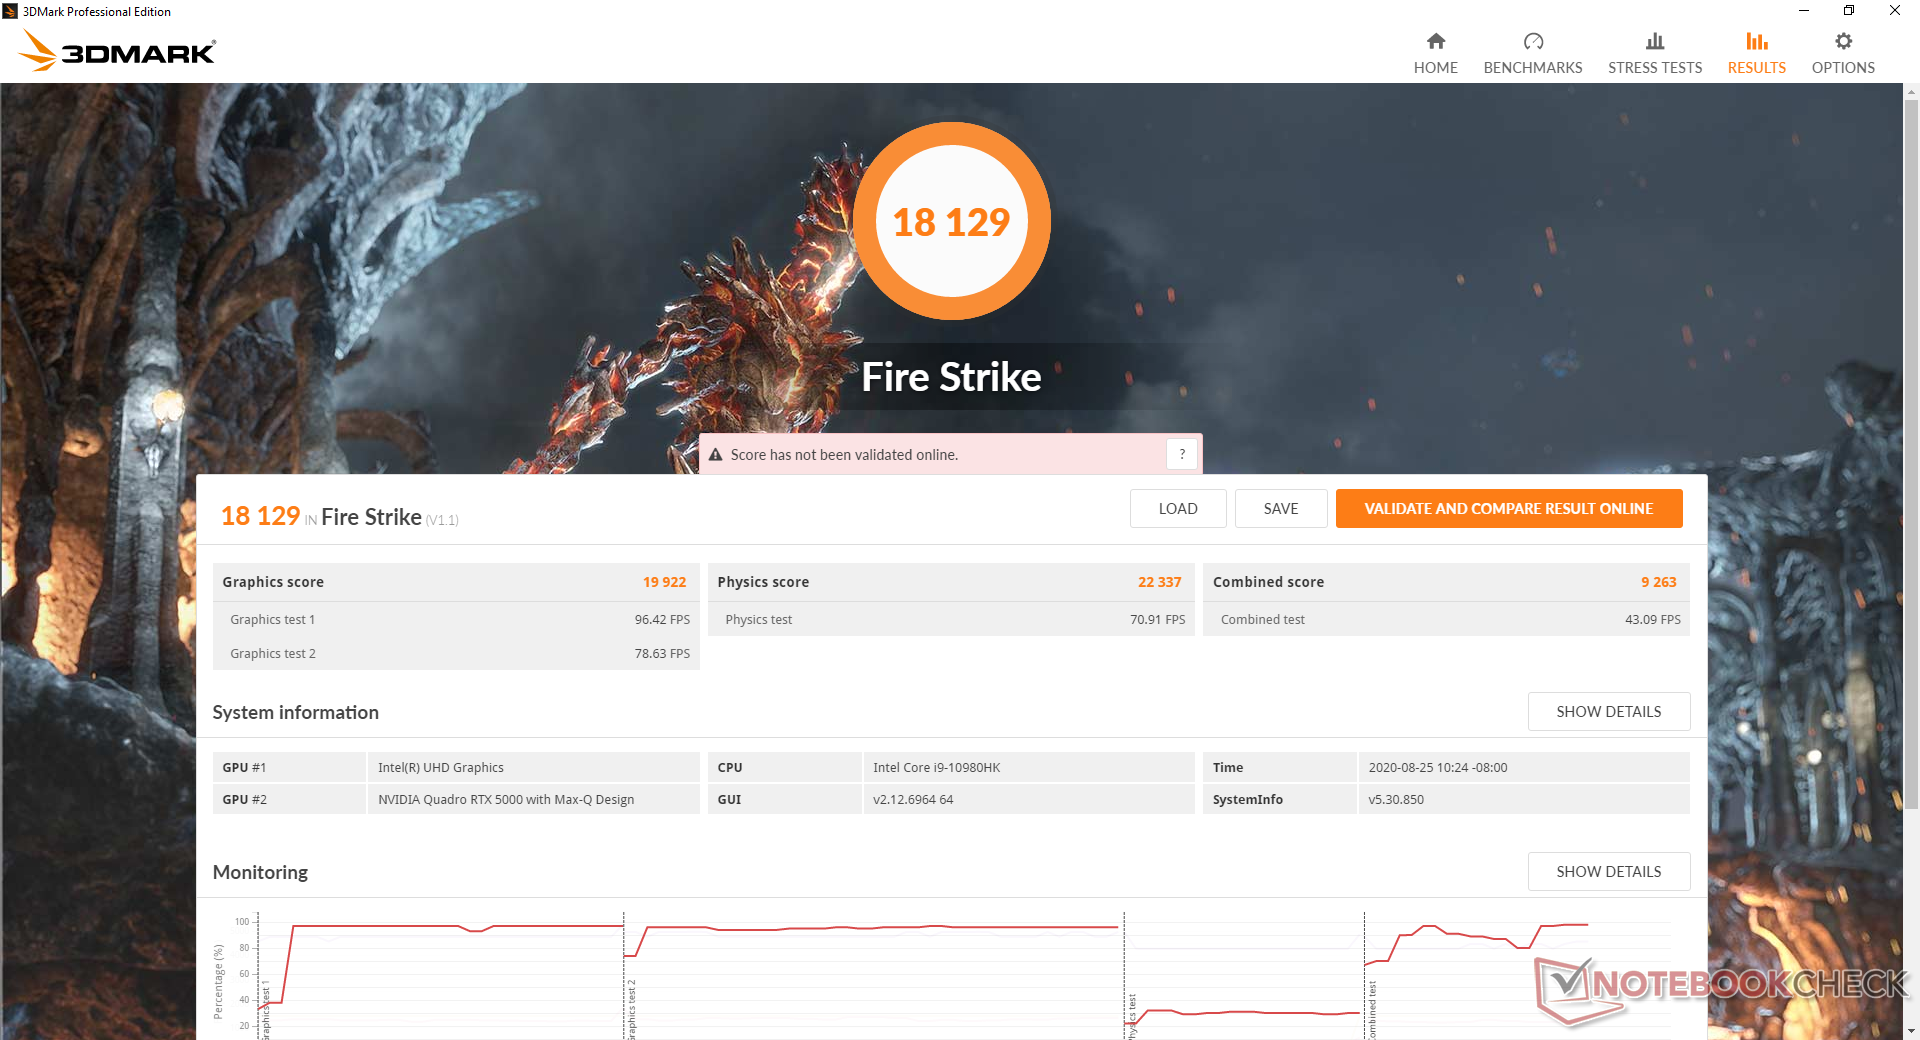
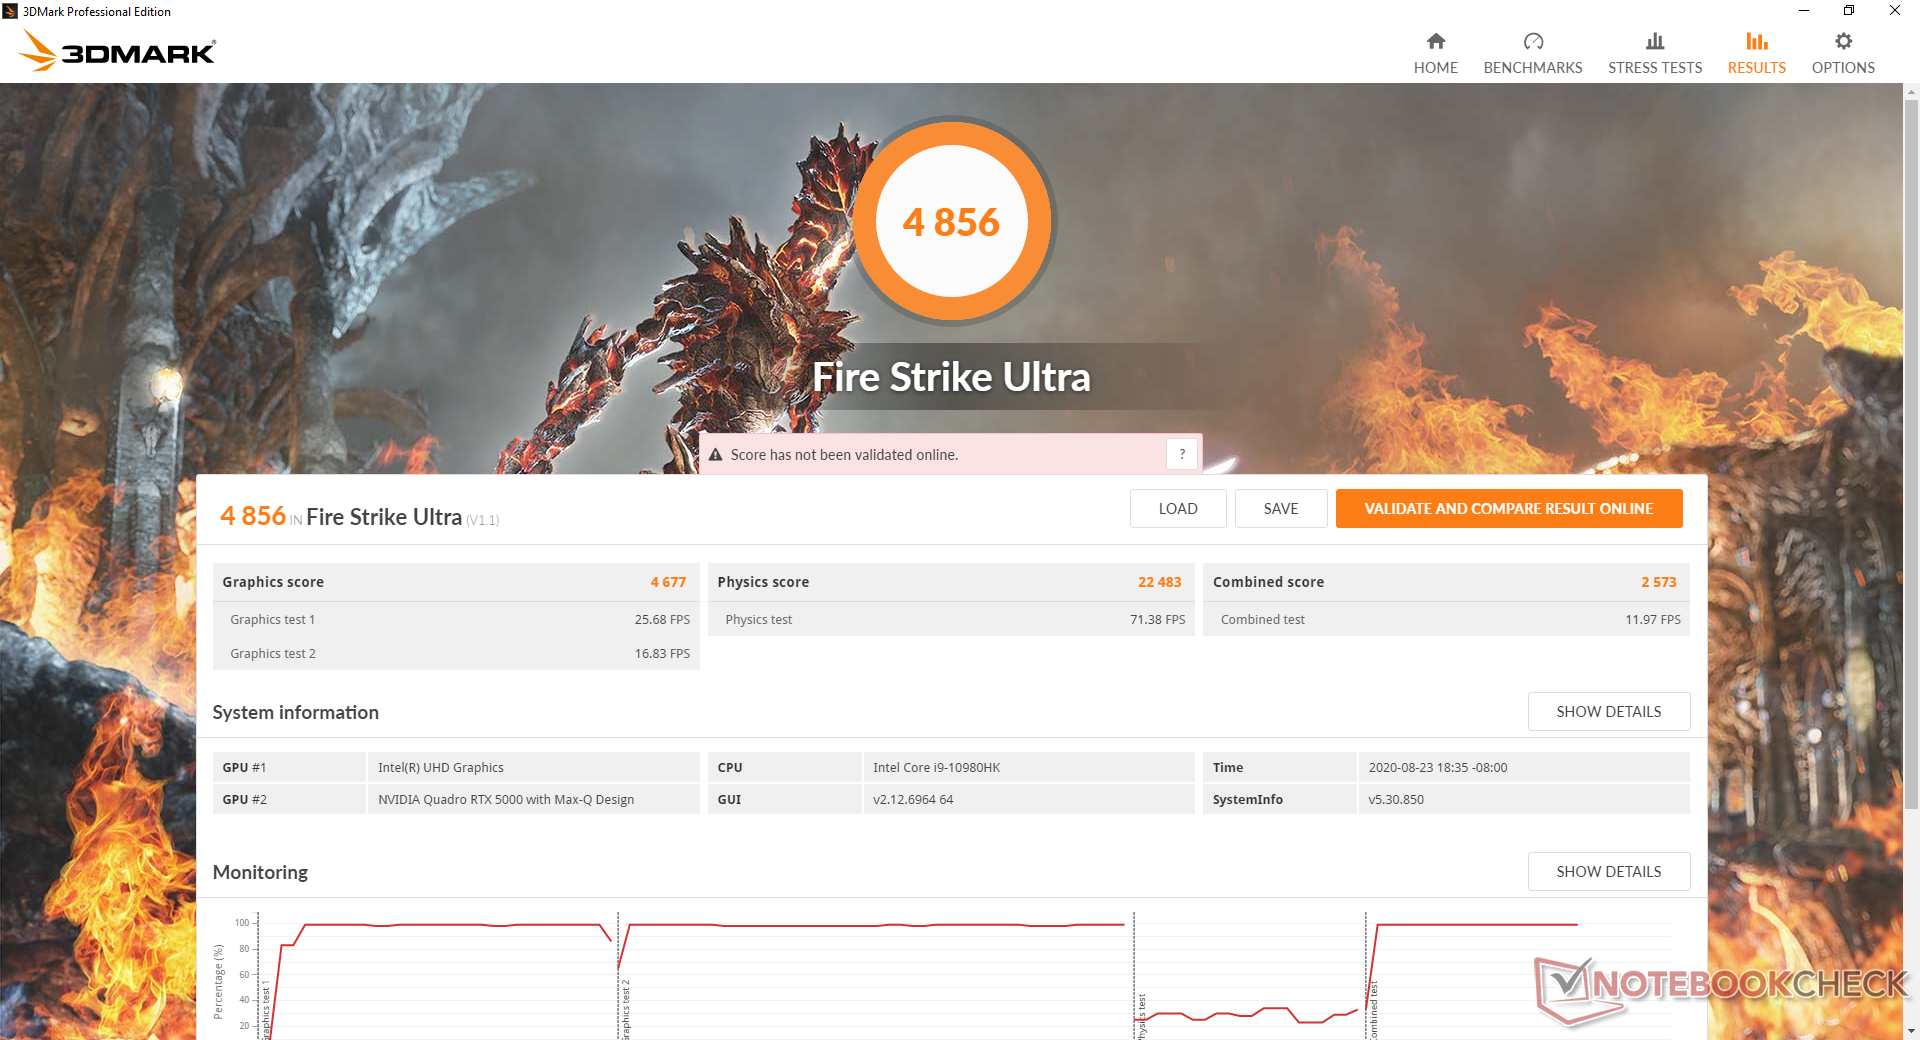
| 3DMark 11 Performance | 23789 points | |
| 3DMark Cloud Gate Standard Score | 52005 points | |
| 3DMark Fire Strike Score | 18226 points | |
| 3DMark Time Spy Score | 7920 points | |
Help | ||
| low | med. | high | ultra | |
| The Witcher 3 (2015) | 353.2 | 249.8 | 158.2 | 81.1 |
| Dota 2 Reborn (2015) | 161 | 143 | 130 | 122 |
| Final Fantasy XV Benchmark (2018) | 177 | 103 | 80.8 | |
| X-Plane 11.11 (2018) | 113 | 98.9 | 82 |
Emissions
System Noise
The fans are never silent even when set to Silent mode at about 32 dB(A) minimum against a background of 26 dB(A). This is similar to what we observed on last year's WS63 suggesting that fan behavior hasn't really improved between generations despite the chassis redesign. Nonetheless, Silent mode is recommended when web browsing or video streaming as the fans will pulse more frequently when set to other power profiles.
Running demanding loads like Witcher 3 will induce a cycling fan noise between 45.5 dB(A) and 47.4 d(A) when Cooler Boost is off. If Cooler Boost is on, fan noise will jump and stabilize at 59.7 dB(A) to be one of the loudest 15.6-inch workstations we've ever recorded.

| MSI WS66 10TMT-207US Quadro RTX 5000 Max-Q, i9-10980HK, WDC PC SN730 SDBPNTY-1T00 | Dell Precision 7550 Quadro RTX 5000 Max-Q, W-10885M, SK Hynix PC601A NVMe 1TB | Dell Precision 5550 P91F Quadro T2000 Max-Q, i7-10875H, SK Hynix PC601A NVMe 1TB | Razer Blade 15 Studio Edition 2020 Quadro RTX 5000 Max-Q, i7-10875H, Samsung PM981a MZVLB1T0HBLR | MSI WS63VR 7RL-023US Quadro P4000 Max-Q, i7-7700HQ, Toshiba NVMe THNSN5512GPU7 | Acer ConceptD 3 Pro CN315-71P-73W1 Quadro T1000 (Laptop), i7-9750H, WDC PC SN720 SDAPNTW-512G | |
|---|---|---|---|---|---|---|
| Noise | 6% | 13% | 4% | 4% | 7% | |
| off / environment * | 26 | 25.8 1% | 26.2 -1% | 30.1 -16% | 28 -8% | 31.2 -20% |
| Idle Minimum * | 32 | 25.8 19% | 26.2 18% | 30.1 6% | 33.2 -4% | 31.2 2% |
| Idle Average * | 32 | 25.8 19% | 26.2 18% | 30.1 6% | 33.2 -4% | 31.2 2% |
| Idle Maximum * | 32 | 25.9 19% | 26.2 18% | 30.1 6% | 33.2 -4% | 31.5 2% |
| Load Average * | 42 | 51.2 -22% | 39.2 7% | 42.3 -1% | 41.4 1% | 38.4 9% |
| Witcher 3 ultra * | 47.4 | 51.9 -9% | 39 18% | 48.2 -2% | 38.4 19% | 36.9 22% |
| Load Maximum * | 59.7 | 51.9 13% | 50.6 15% | 42.1 29% | 43.5 27% | 41.2 31% |
* ... smaller is better
Noise Level
| Idle |
| 32 / 32 / 32 dB(A) |
| Load |
| 42 / 59.7 dB(A) |
 | ||
30 dB silent 40 dB(A) audible 50 dB(A) loud |
||
min: | ||
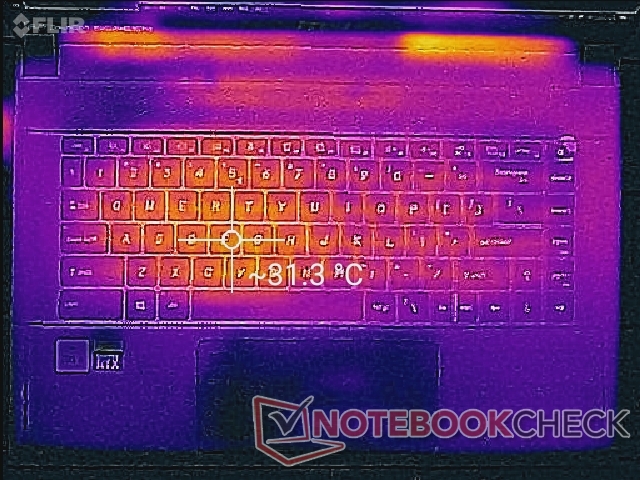
Temperature
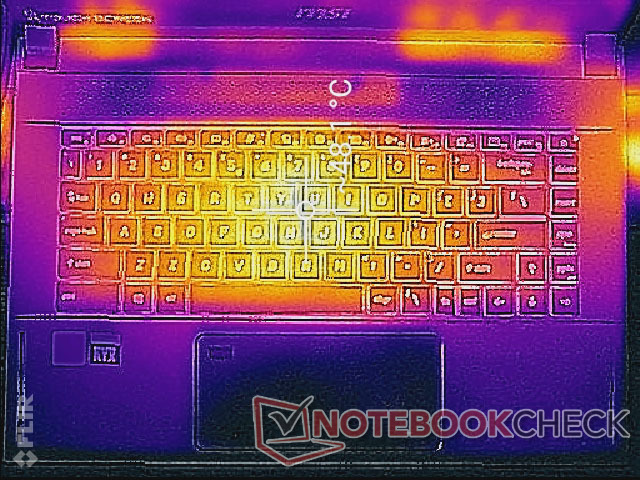
Surface temperatures are warmest toward the center of the keyboard where it can be 44 C to 48 C when under extreme processing loads. Results are cooler than what we recorded on the Razer Blade 15 Studio where hot spots and the palm rests can be as warm as 60 C and 38 C, respectively. The louder fans of the MSI may be partly responsible for the lower surface temperatures overall when compared to the Razer alternative.
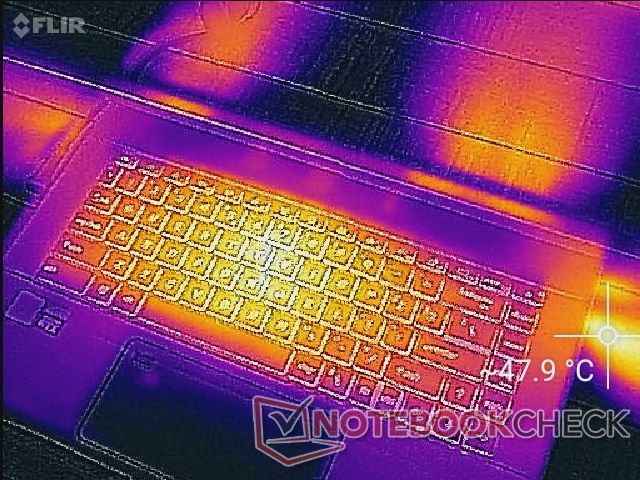
(±) The maximum temperature on the upper side is 44.2 °C / 112 F, compared to the average of 38.1 °C / 101 F, ranging from 22.2 to 69.8 °C for the class Workstation.
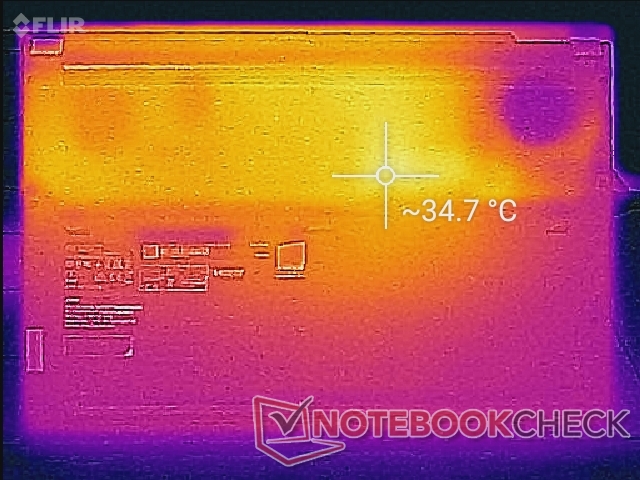
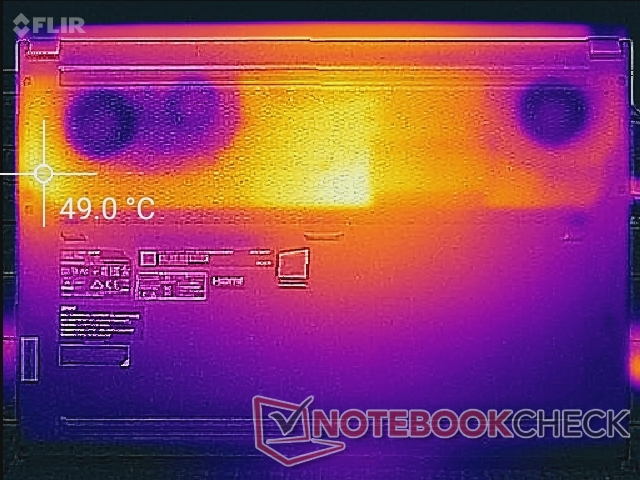
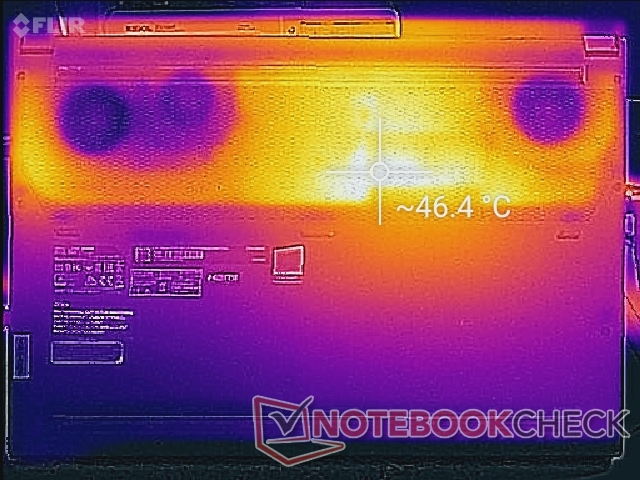
(-) The bottom heats up to a maximum of 46.2 °C / 115 F, compared to the average of 41.3 °C / 106 F
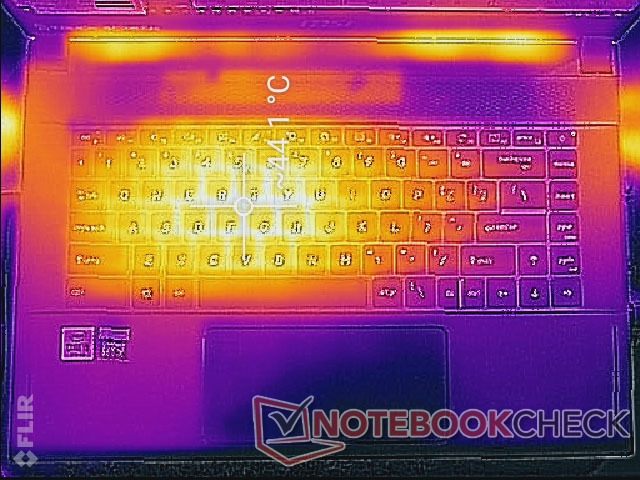
(+) In idle usage, the average temperature for the upper side is 29 °C / 84 F, compared to the device average of 32 °C / 90 F.
(±) Playing The Witcher 3, the average temperature for the upper side is 36.8 °C / 98 F, compared to the device average of 32 °C / 90 F.
(+) The palmrests and touchpad are reaching skin temperature as a maximum (32 °C / 89.6 F) and are therefore not hot.
(-) The average temperature of the palmrest area of similar devices was 27.8 °C / 82 F (-4.2 °C / -7.6 F).
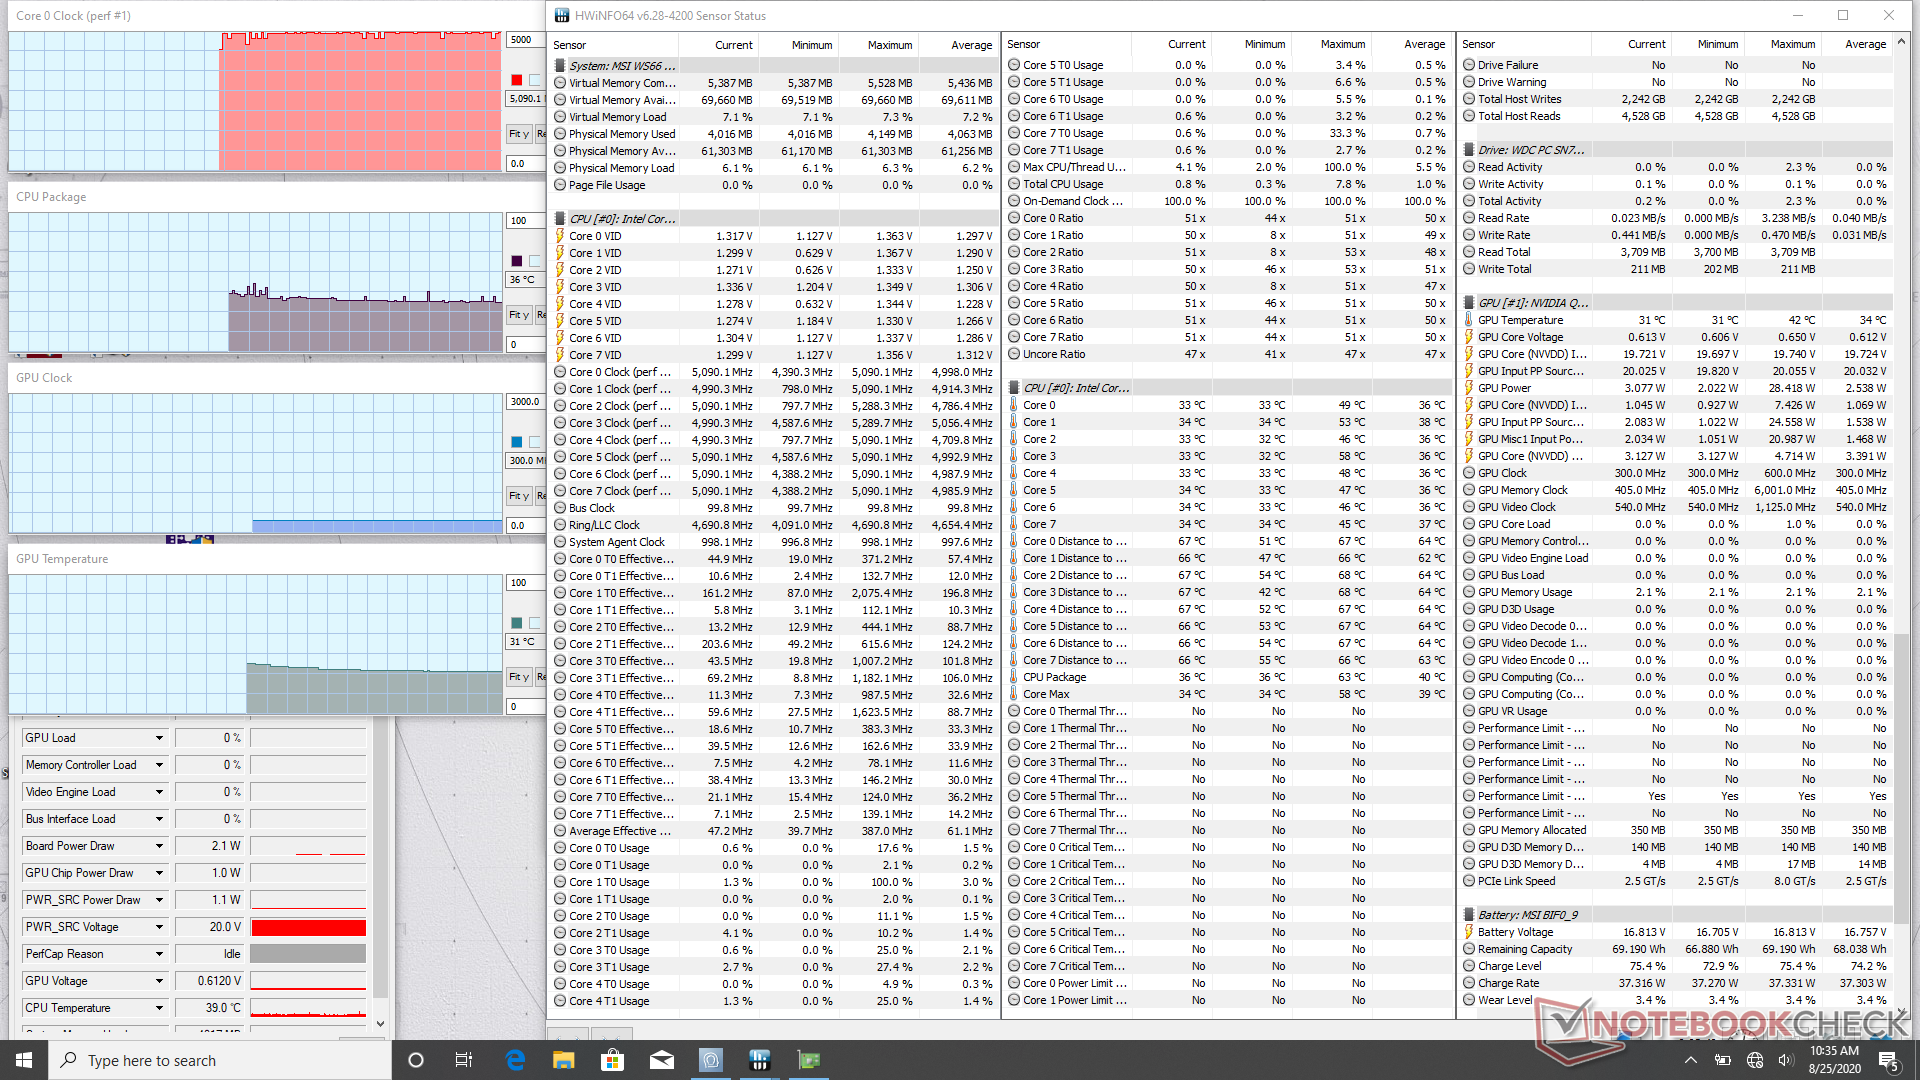
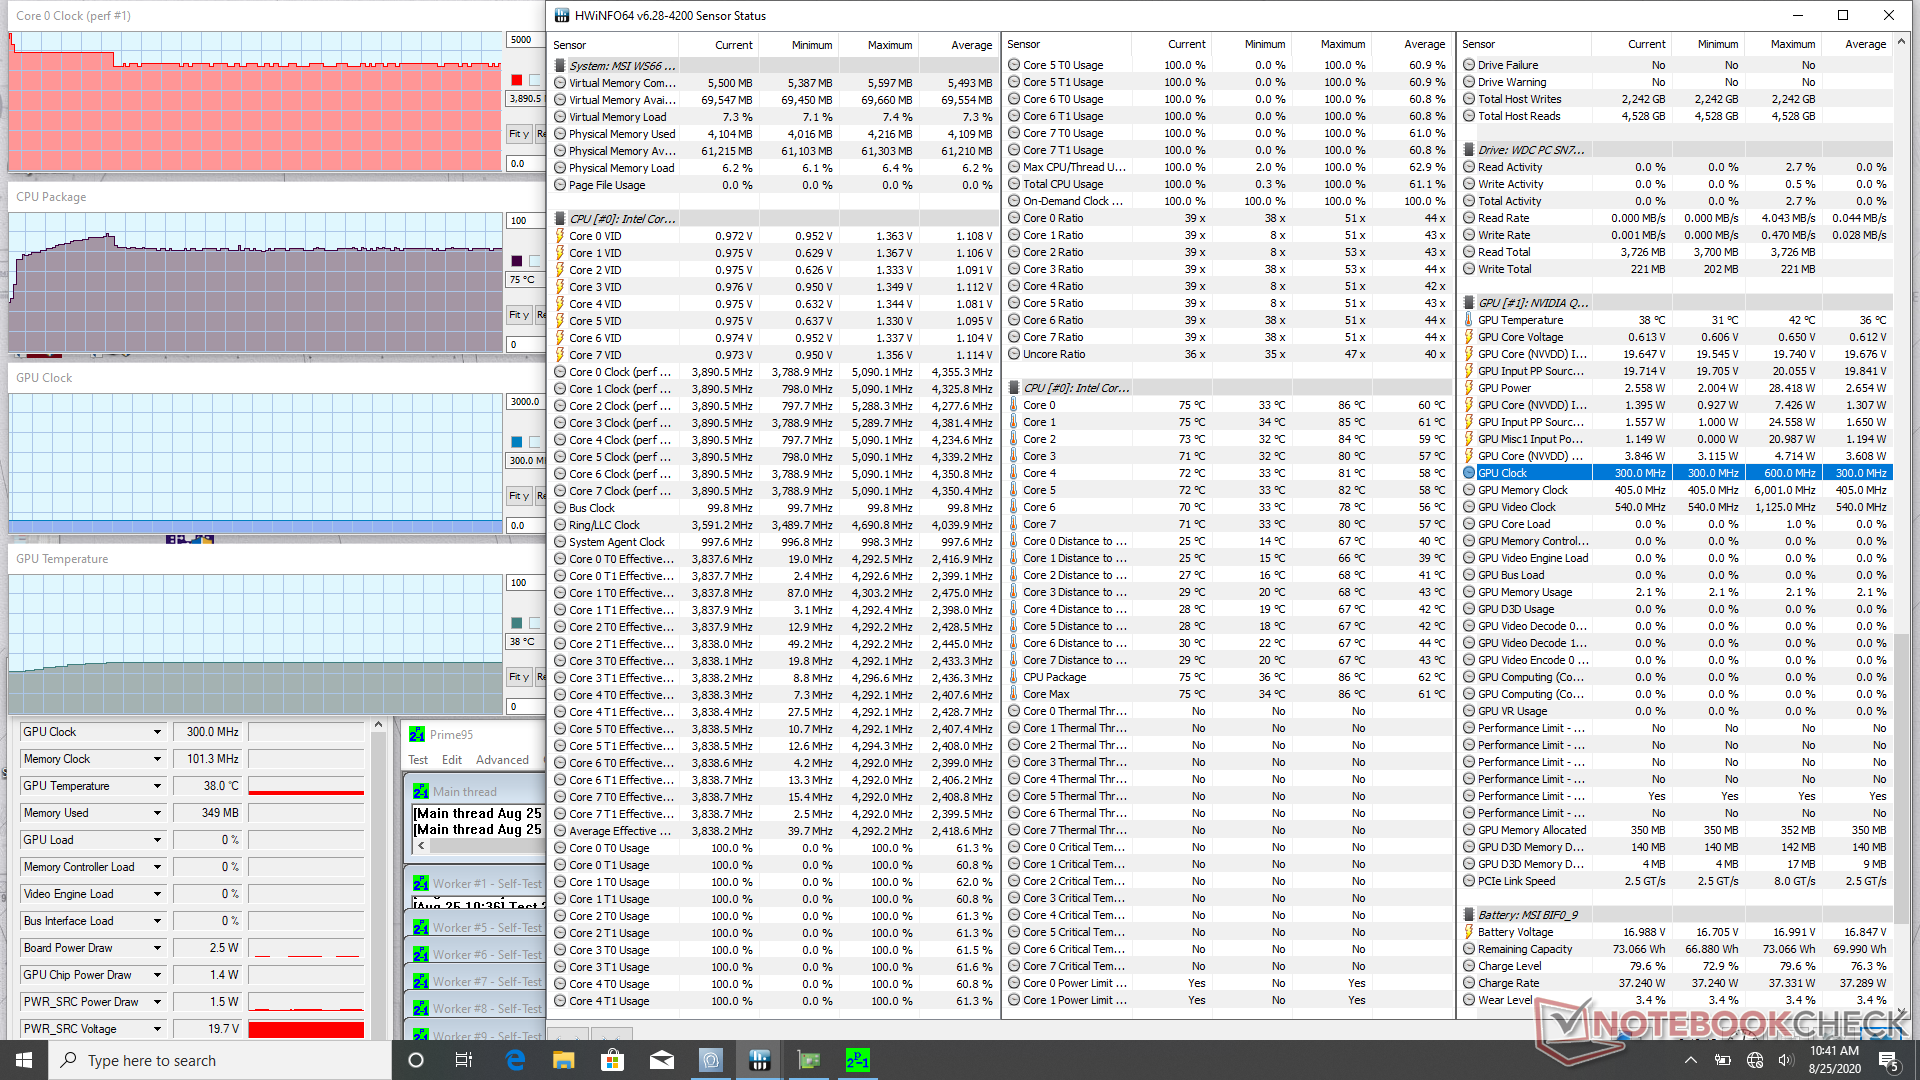
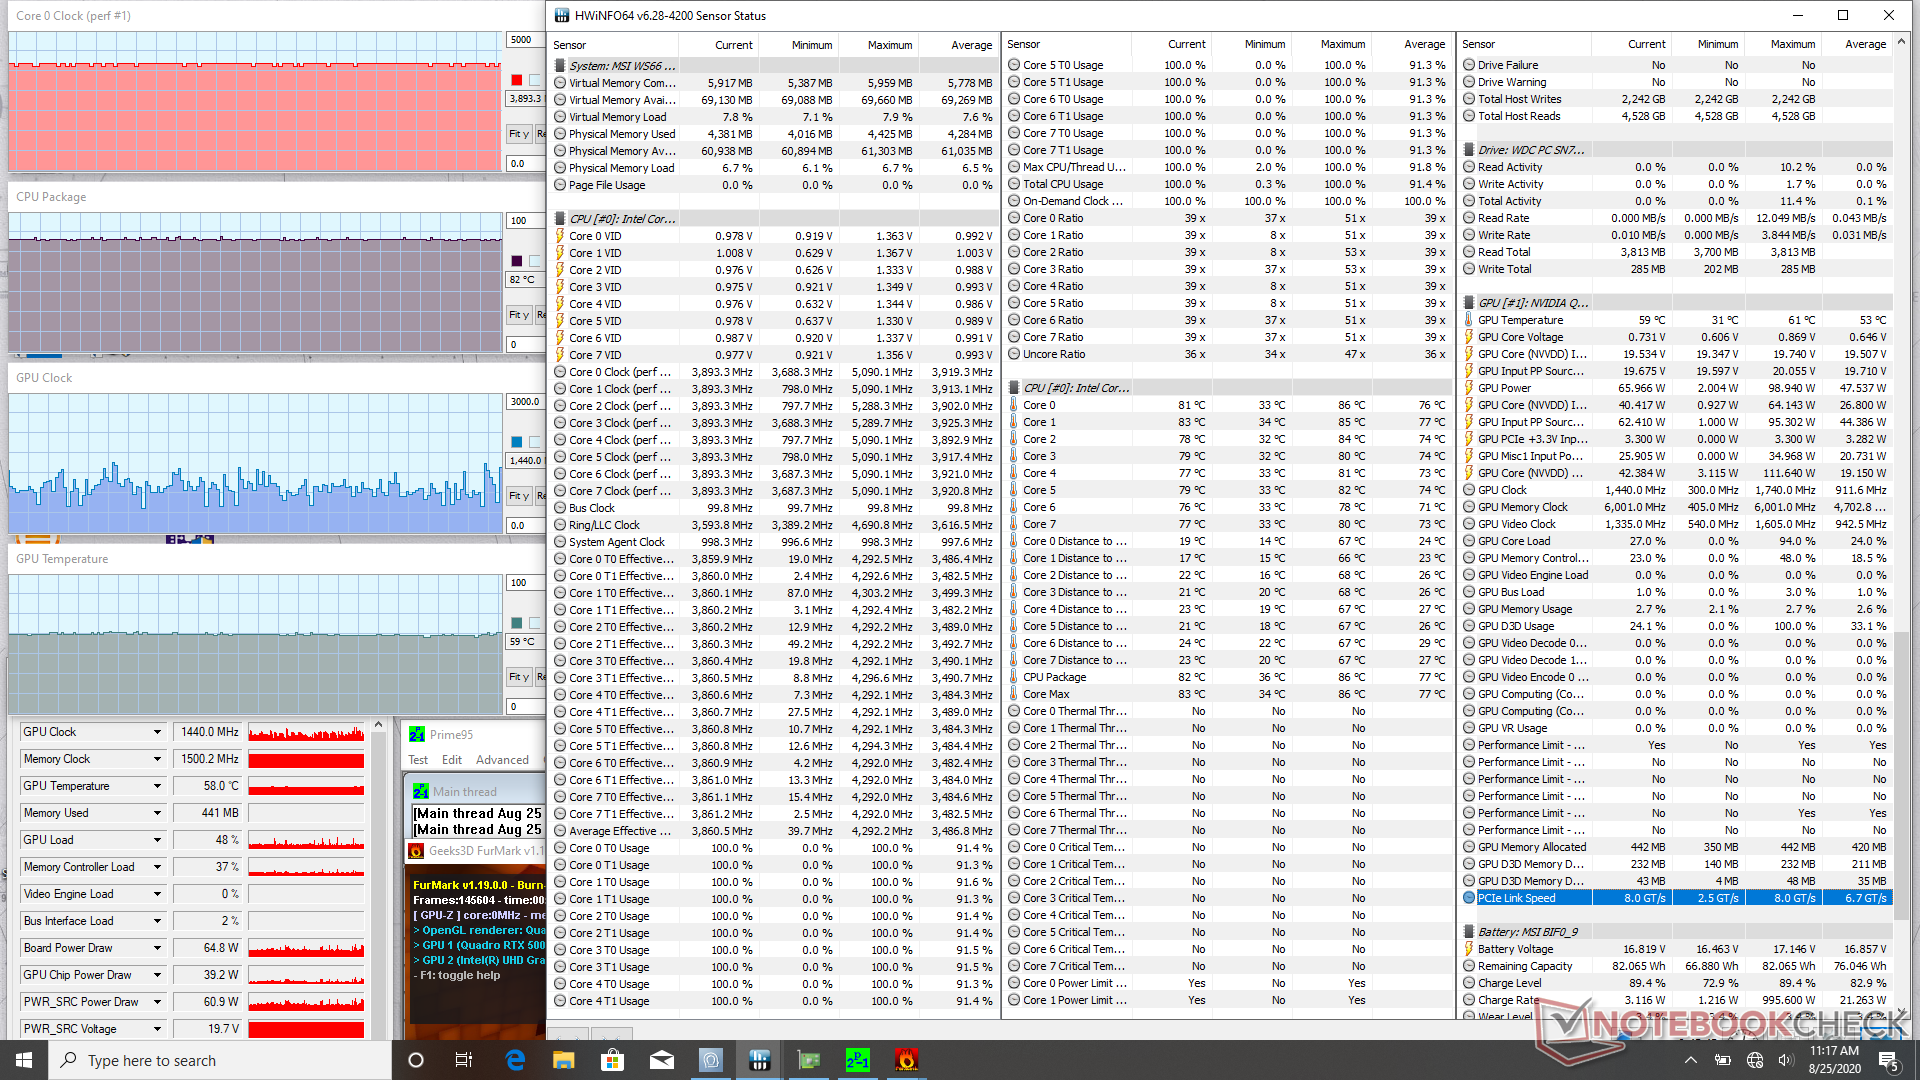
Stress Test
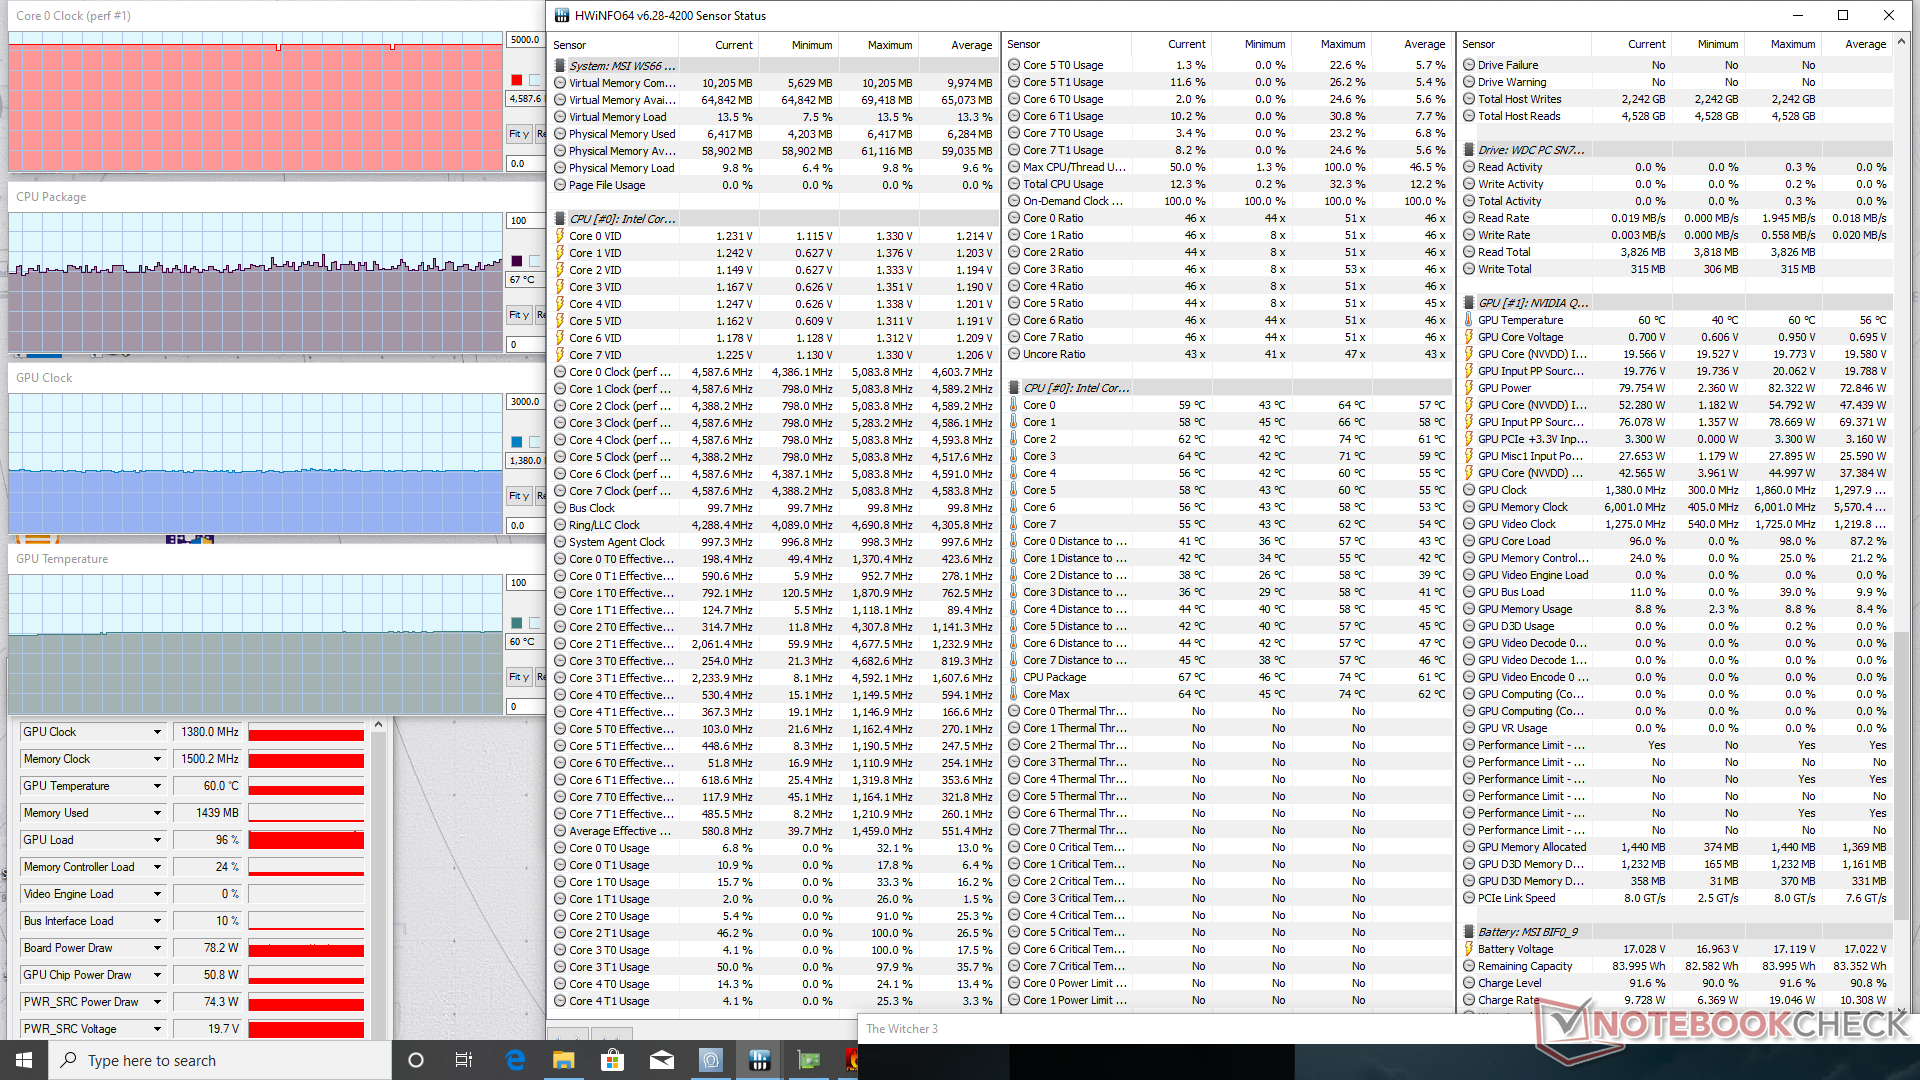
When running Prime95 to stress the CPU, clock rates would boost to 4.3 GHz for about a minute until hitting a core temperature of 84 C. Clock rates would then dip to 3.9 GHz in order to maintain a cooler core temperature of 74 C. This behavior can also be observed in our Power Consumption section below.
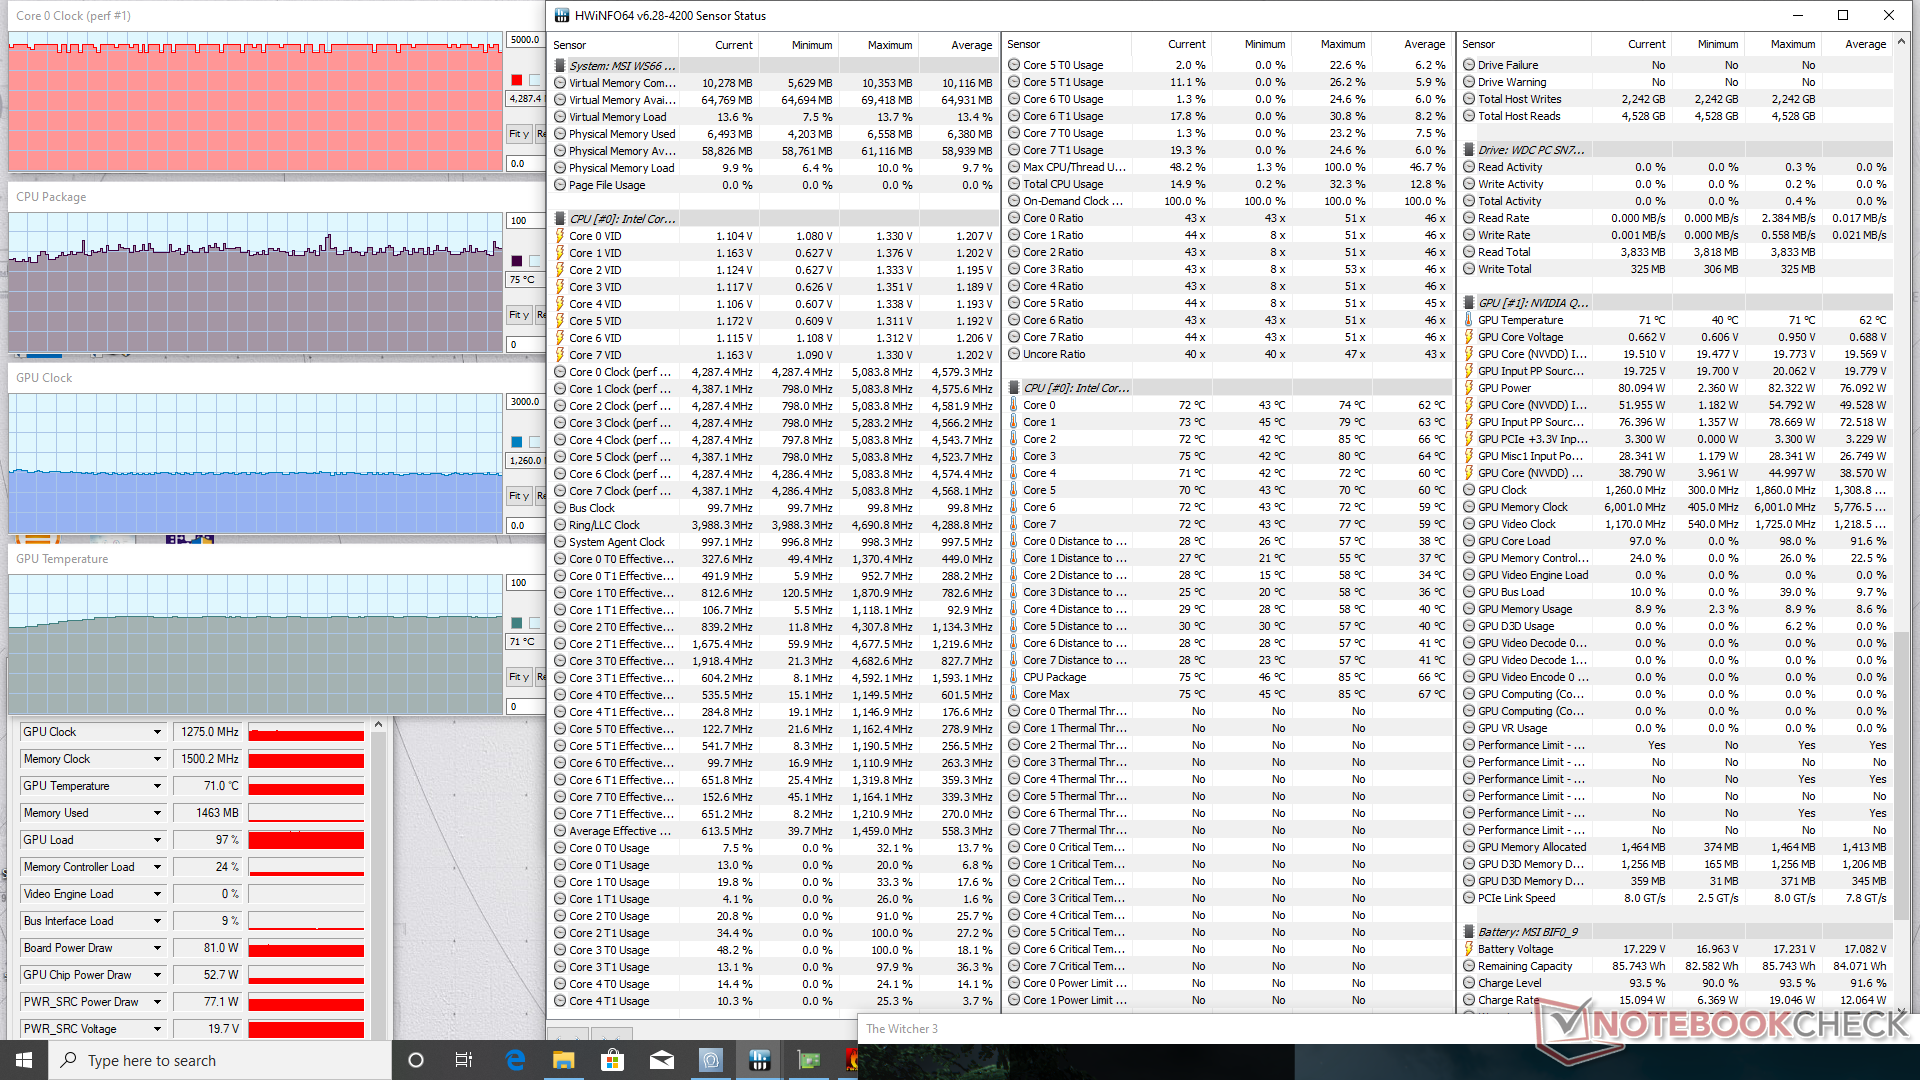
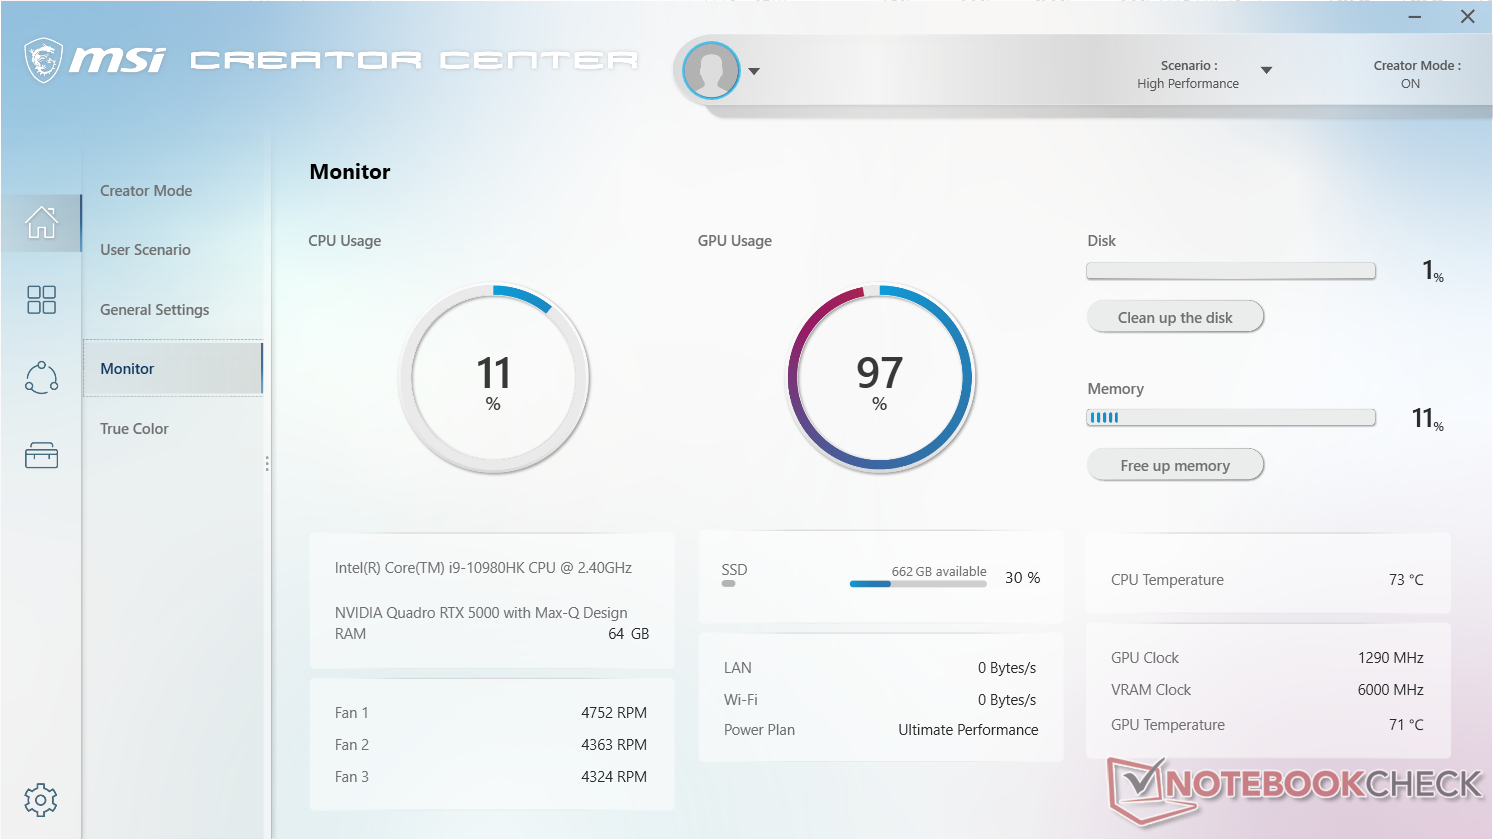
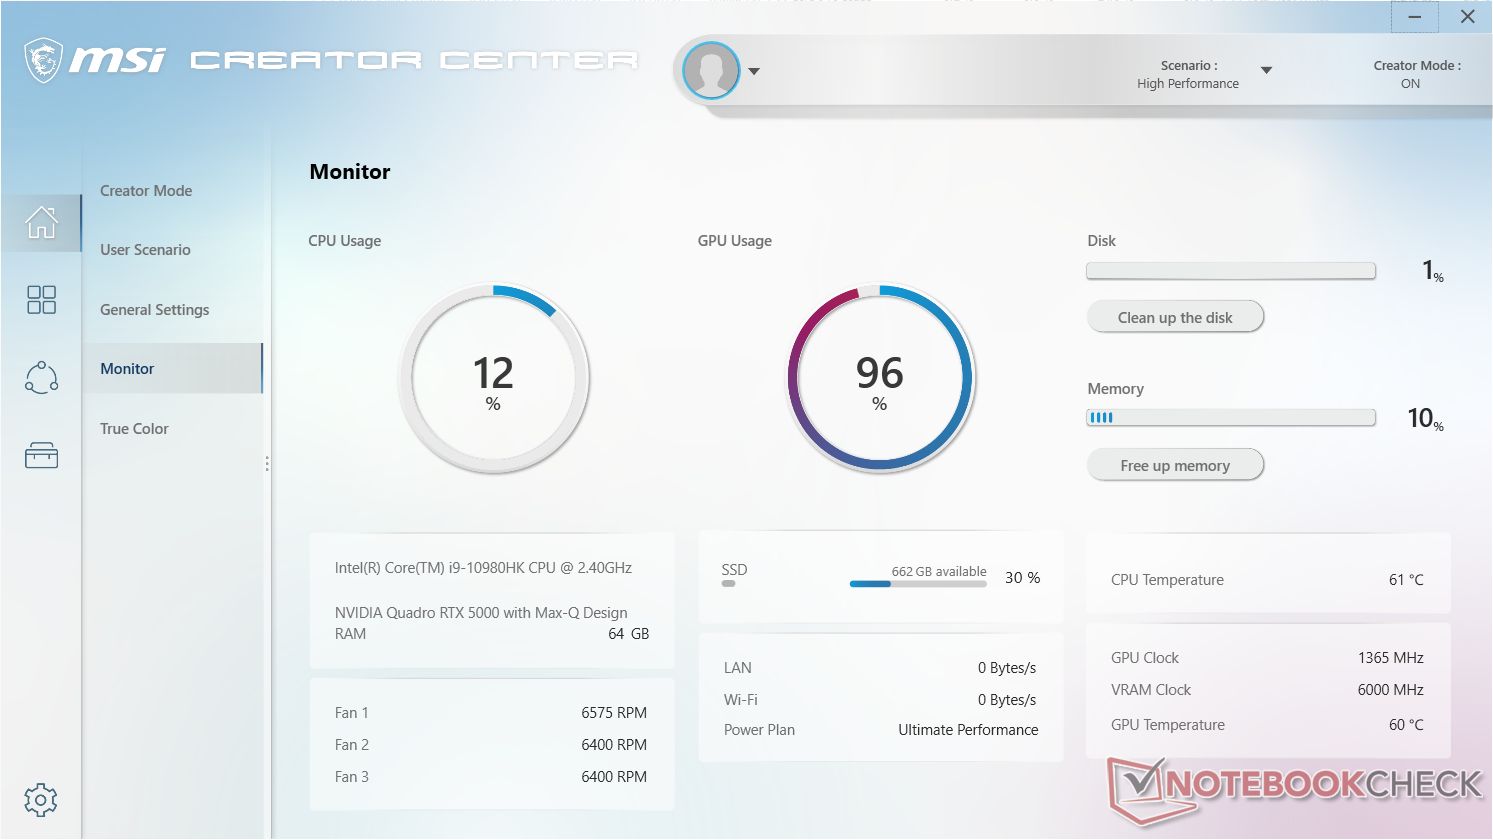
Enabling Cooler Boost will boost both CPU and GPU clock rates slightly while reducing core temperatures as shown by our table below. When running Witcher 3 with the feature disabled, for example, CPU and GPU temperatures would settle at 75 C and 71 C, respectively, compared to 67 C and 60 C when the feature is enabled.
Running on battery power will limit performance. A Fire Strike run on batteries would produce Physics and Graphics scores of 13238 and 5944 points, respectively, compared to 22317 and 20164 points when on mains.

| CPU Clock (GHz) | GPU Clock (MHz) | Average CPU Temperature (°C) | Average GPU Temperature (°C) | |
| System Idle (Cooler Boost on) | -- | -- | 36 | 31 |
| Prime95 Stress (Cooler Boost on) | 3.8 - 3.9 | -- | 75 | 38 |
| Prime95 + FurMark Stress (Cooler Boost on) | 3.8 - 3.9 | ~500 - 1440 | 82 | 59 |
| Witcher 3 Stress (Cooler Boost off) | 4.3 - 4.4 | 1275 | 75 | 71 |
| Witcher 3 Stress (Cooler Boost on) | 4.6 | 1380 | 67 | 60 |
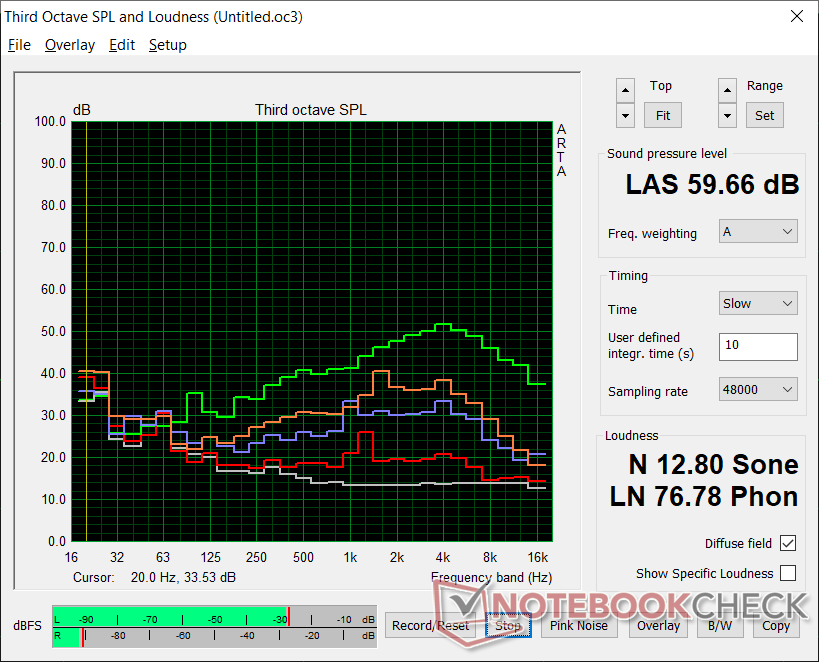
Speakers


MSI WS66 10TMT-207US audio analysis
(±) | speaker loudness is average but good (80.5 dB)
Bass 100 - 315 Hz
(-) | nearly no bass - on average 22.6% lower than median
(±) | linearity of bass is average (9.8% delta to prev. frequency)
Mids 400 - 2000 Hz
(±) | higher mids - on average 7.5% higher than median
(±) | linearity of mids is average (11.7% delta to prev. frequency)
Highs 2 - 16 kHz
(+) | balanced highs - only 3.4% away from median
(±) | linearity of highs is average (8.5% delta to prev. frequency)
Overall 100 - 16.000 Hz
(±) | linearity of overall sound is average (26.1% difference to median)
Compared to same class
» 85% of all tested devices in this class were better, 7% similar, 8% worse
» The best had a delta of 7%, average was 18%, worst was 35%
Compared to all devices tested
» 77% of all tested devices were better, 5% similar, 18% worse
» The best had a delta of 4%, average was 25%, worst was 134%
Apple MacBook 12 (Early 2016) 1.1 GHz audio analysis
(+) | speakers can play relatively loud (83.6 dB)
Bass 100 - 315 Hz
(±) | reduced bass - on average 11.3% lower than median
(±) | linearity of bass is average (14.2% delta to prev. frequency)
Mids 400 - 2000 Hz
(+) | balanced mids - only 2.4% away from median
(+) | mids are linear (5.5% delta to prev. frequency)
Highs 2 - 16 kHz
(+) | balanced highs - only 2% away from median
(+) | highs are linear (4.5% delta to prev. frequency)
Overall 100 - 16.000 Hz
(+) | overall sound is linear (10.2% difference to median)
Compared to same class
» 5% of all tested devices in this class were better, 2% similar, 93% worse
» The best had a delta of 5%, average was 19%, worst was 53%
Compared to all devices tested
» 3% of all tested devices were better, 1% similar, 96% worse
» The best had a delta of 4%, average was 25%, worst was 134%
Energy Management
Power Consumption
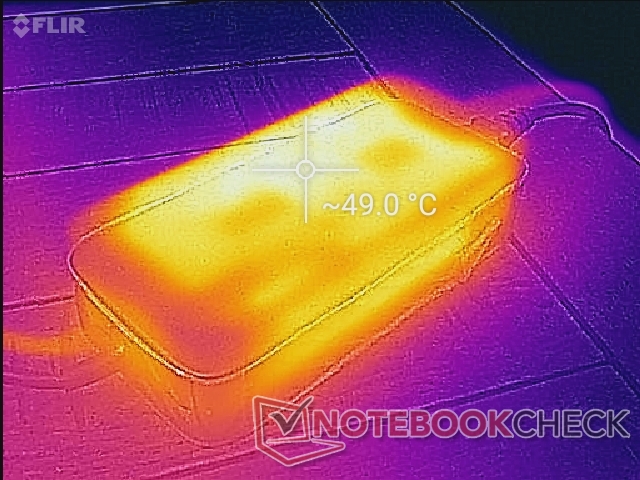
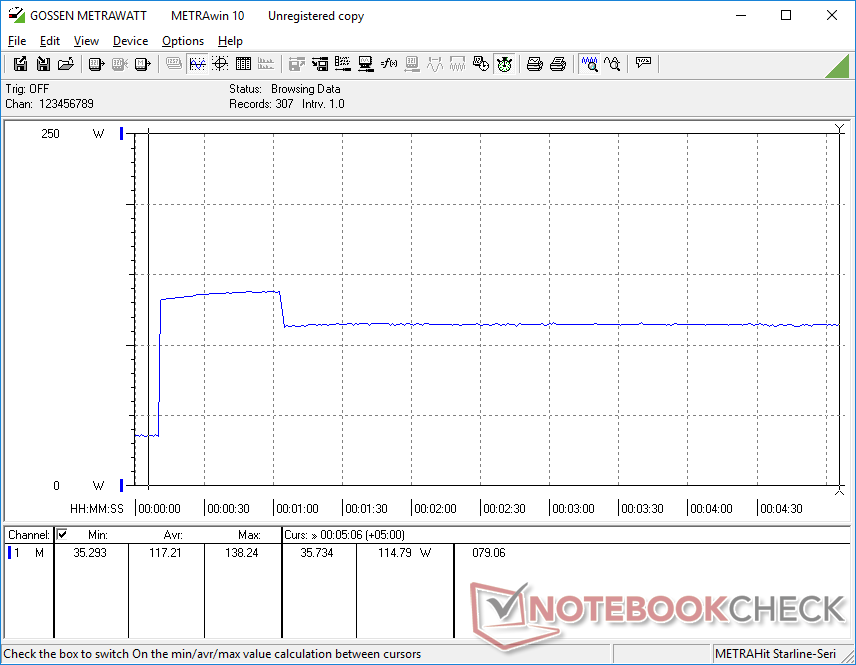
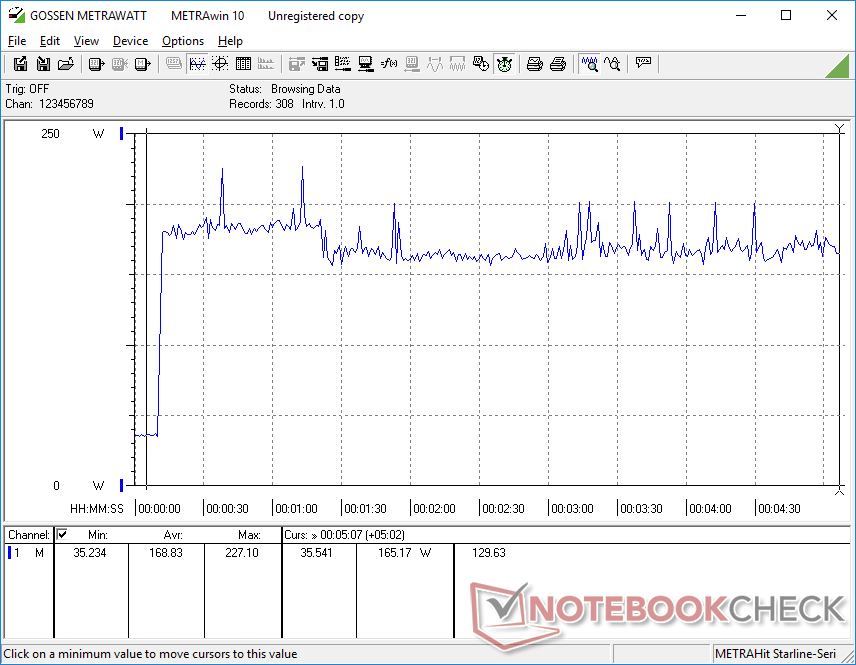
Idling on desktop with the iGPU active and the brightness set to minimum will demand about 14 W. If brightness is set to maximum, this jumps to 19 W. Idling on Ultra Performance Cooler Boost mode will draw 42 W minimum meaning it's not the ideal mode for simple tasks like video streaming or emailing.
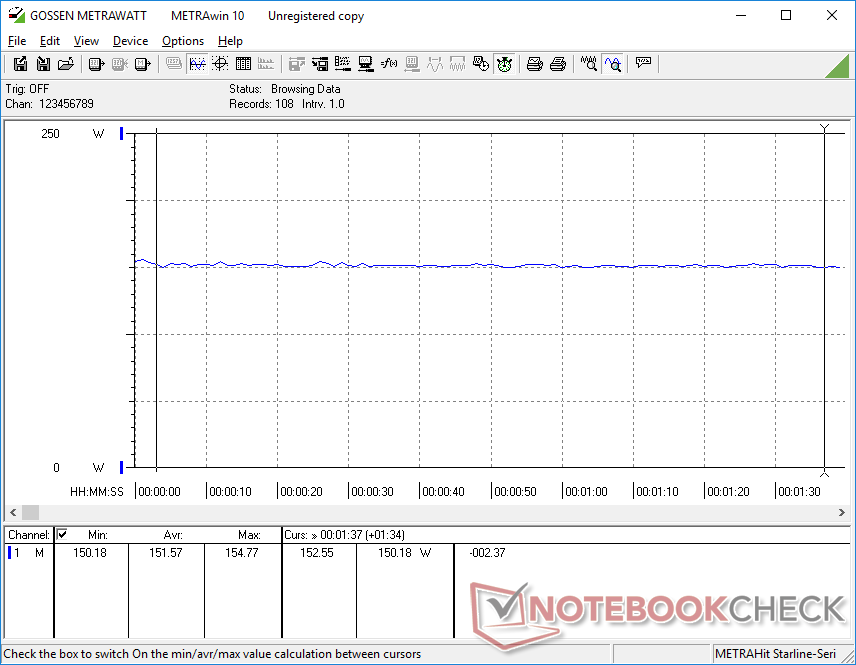
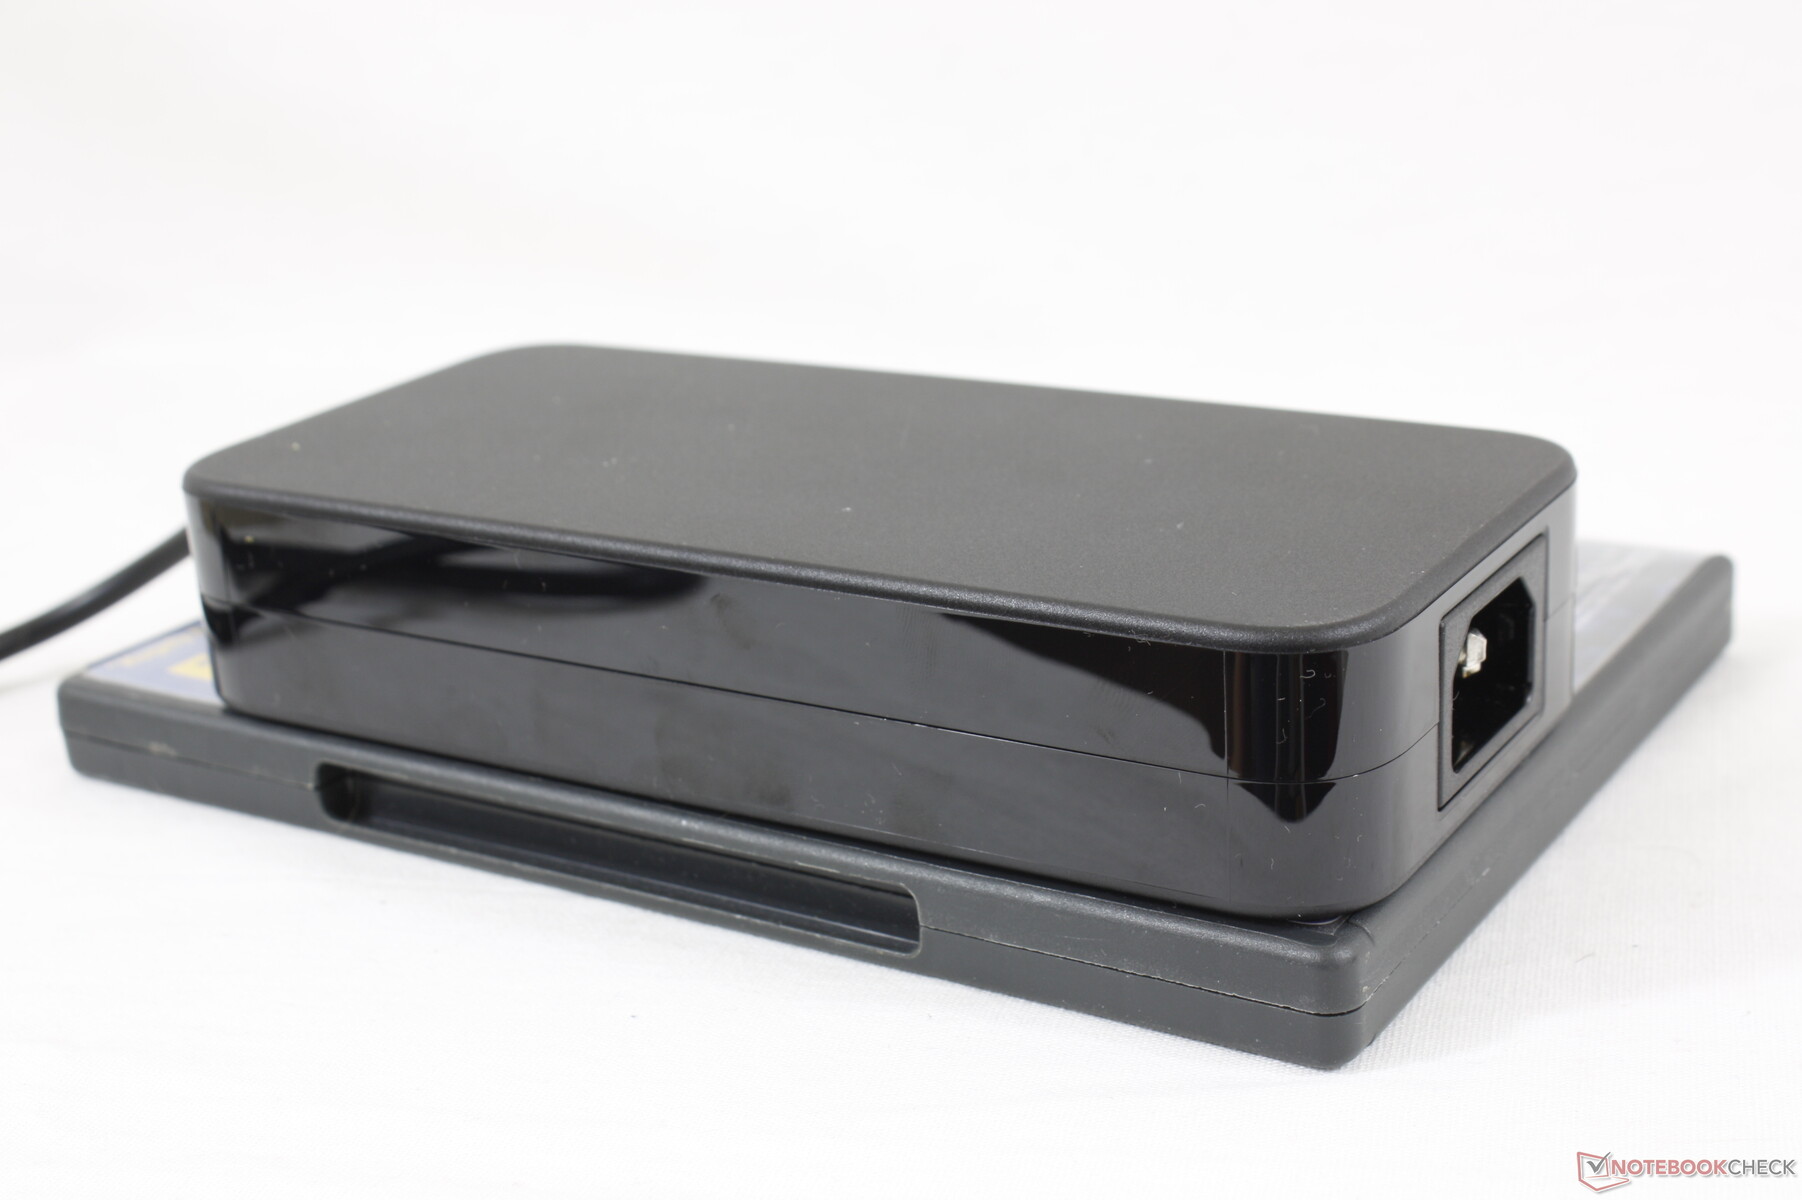
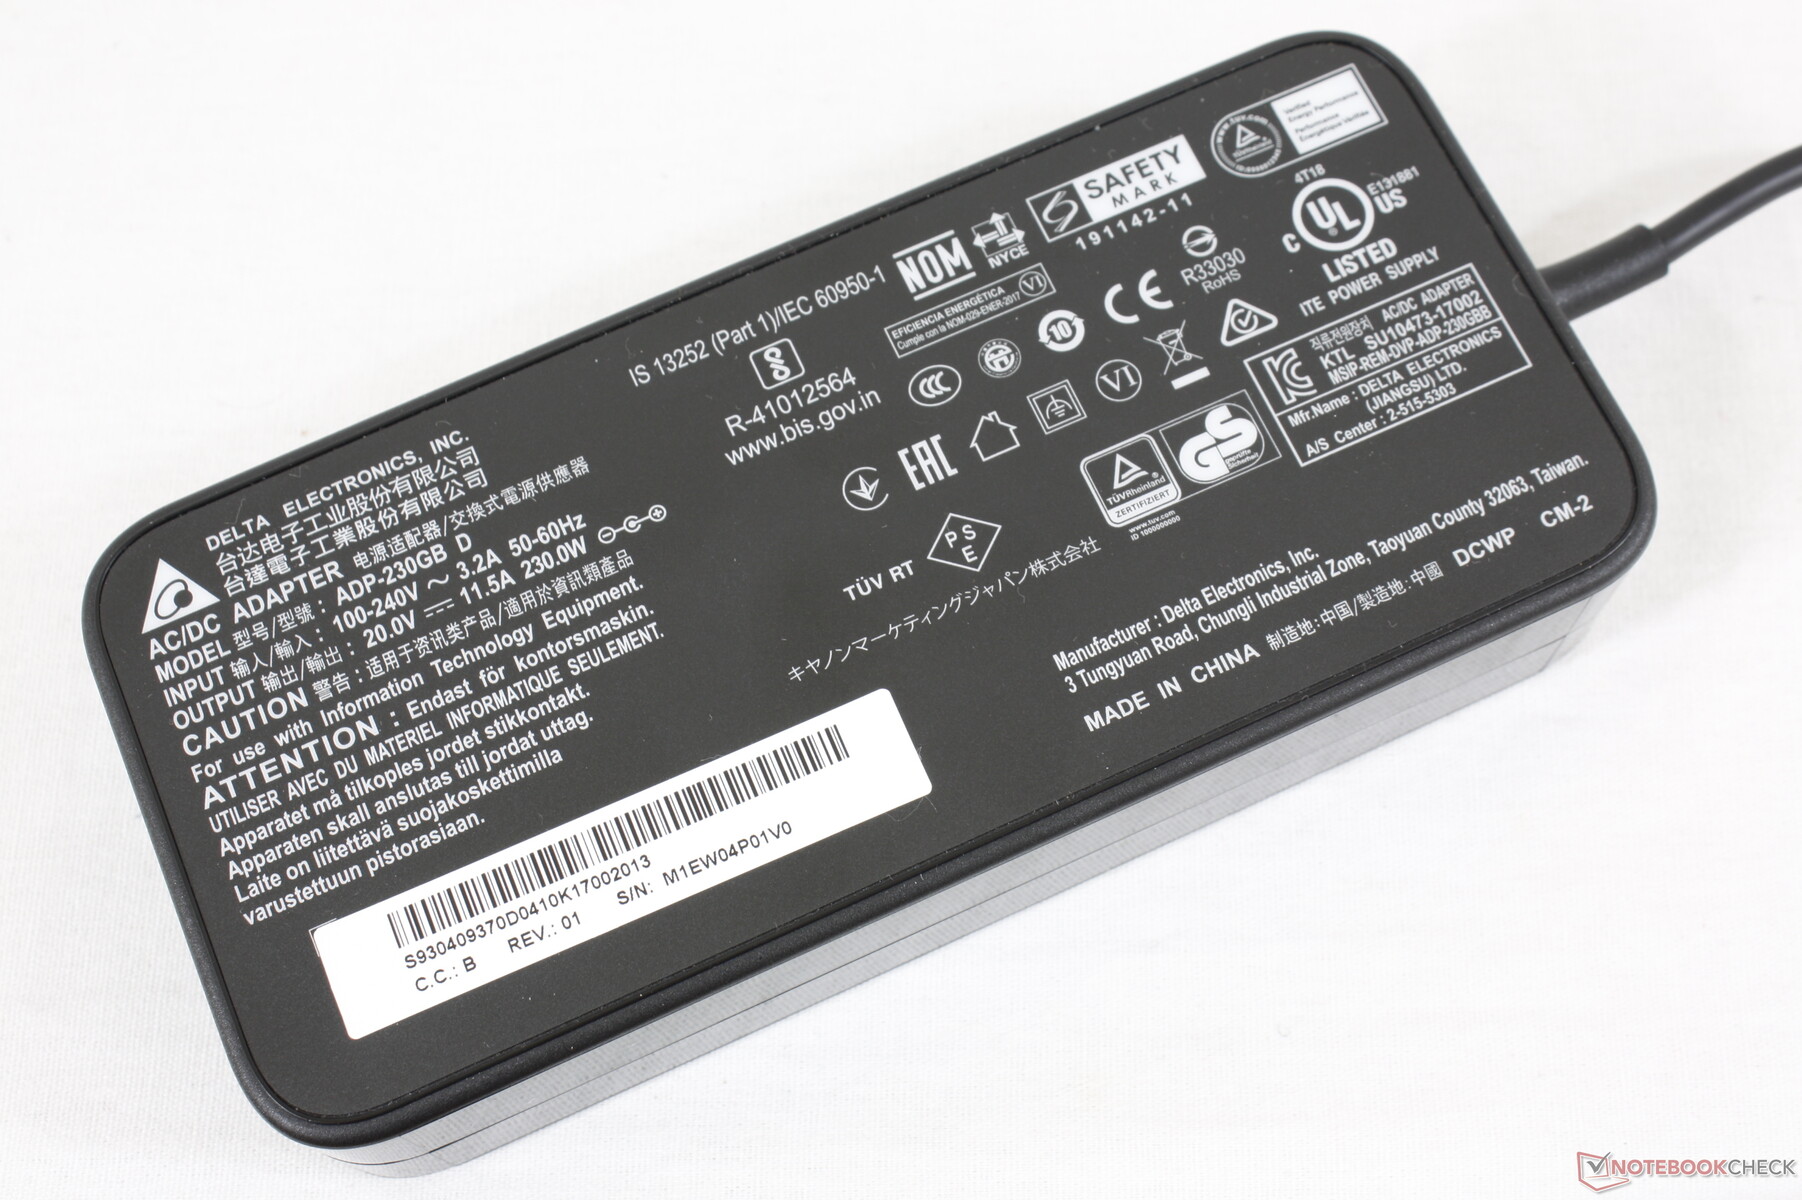
Running stressful loads like gaming will draw about 152 W to be similar to what we recorded on the Dell Precision 7550 or Razer Blade 15 Studio each equipped with the same Quadro RTX 5000 Max-Q GPU. We're able to record temporary spikes of up to 227 W from the medium-sized (16.4 x 7.5 x 3.4 cm) 230 W AC adapter when both the CPU and GPU are at 100 percent utilization. Average consumption will always be much lower meaning the laptop can still recharge at a decent rate even when running extreme loads unlike on the Precision 5750.

| Off / Standby | |
| Idle | |
| Load |
|
| MSI WS66 10TMT-207US i9-10980HK, Quadro RTX 5000 Max-Q, WDC PC SN730 SDBPNTY-1T00, IPS, 1920x1080, 15.60 | Dell Precision 7550 W-10885M, Quadro RTX 5000 Max-Q, SK Hynix PC601A NVMe 1TB, IPS, 3840x2160, 15.60 | Dell Precision 5550 P91F i7-10875H, Quadro T2000 Max-Q, SK Hynix PC601A NVMe 1TB, IPS, 3840x2400, 15.60 | Razer Blade 15 Studio Edition 2020 i7-10875H, Quadro RTX 5000 Max-Q, Samsung PM981a MZVLB1T0HBLR, OLED, 3840x2160, 15.60 | MSI WS63VR 7RL-023US i7-7700HQ, Quadro P4000 Max-Q, Toshiba NVMe THNSN5512GPU7, IPS, 3840x2160, 15.60 | Acer ConceptD 3 Pro CN315-71P-73W1 i7-9750H, Quadro T1000 (Laptop), WDC PC SN720 SDAPNTW-512G, IPS, 1920x1080, 15.60 | |
|---|---|---|---|---|---|---|
| Power Consumption | 13% | 40% | 12% | 29% | 58% | |
| Idle Minimum * | 13.8 | 8.2 41% | 5.6 59% | 13.4 3% | 13.3 4% | 2.9 79% |
| Idle Average * | 18.4 | 16.8 9% | 11.2 39% | 18 2% | 17.2 7% | 5.5 70% |
| Idle Maximum * | 41.5 | 24.4 41% | 18.4 56% | 26.1 37% | 17.9 57% | 10.6 74% |
| Load Average * | 110.5 | 131 -19% | 114 -3% | 115 -4% | 83.7 24% | 86 22% |
| Witcher 3 ultra * | 151.6 | 156.6 -3% | 76.7 49% | 145 4% | 101.9 33% | 83 45% |
| Load Maximum * | 227.1 | 201.8 11% | 134.2 41% | 165 27% | 114.3 50% | 100.7 56% |
* ... smaller is better
Battery Life
Runtimes are just shy of 8 hours when browsing the web even when set to MSI's Super Battery power profile. Charging the large 99.99 Wh battery from empty to full takes about 2 hours.
The system can also recharge via the USB-C port along the left edge only.
| MSI WS66 10TMT-207US i9-10980HK, Quadro RTX 5000 Max-Q, 99.99 Wh | Dell Precision 7550 W-10885M, Quadro RTX 5000 Max-Q, 95 Wh | Dell Precision 5550 P91F i7-10875H, Quadro T2000 Max-Q, 86 Wh | Razer Blade 15 Studio Edition 2020 i7-10875H, Quadro RTX 5000 Max-Q, 80 Wh | MSI WS63VR 7RL-023US i7-7700HQ, Quadro P4000 Max-Q, 48 Wh | Acer ConceptD 3 Pro CN315-71P-73W1 i7-9750H, Quadro T1000 (Laptop), 58.7 Wh | |
|---|---|---|---|---|---|---|
| Battery Runtime | 11% | 67% | 16% | -47% | 3% | |
| Reader / Idle | 499 | 666 33% | 1354 171% | 527 6% | 235 -53% | |
| WiFi v1.3 | 469 | 534 14% | 540 15% | 341 -27% | 175 -63% | 484 3% |
| Load | 71 | 62 -13% | 82 15% | 119 68% | 54 -24% |
Pros
Cons
Verdict
If you want the fastest performance possible out of a super-thin chassis design, then the MSI WS66 will not disappoint. Its Core i9 CPU is consistently faster than the Razer Blade 15 Studio especially since the latter is limited to a Core i7.
The "performance at all cost" mentality of the WS66 has its fair share of disadvantages. Most notably, fan noise is significantly louder than the aforementioned Razer and most other workstations for that matter. Furthermore, the gaming origins of the ultra-thin WS66 mean that the system excludes a lot of basic features that traditional workstations carry. You're going to have to look at bulkier models like the Dell Precision 7550, Lenovo ThinkPad P53, or HP ZBook 15 if features like Smart Card readers, wide color gamut, mouse buttons, NumPad keys, NFC, SIM, or matte panel options are important for your line of work.
The MSI WS66 is laser-focused at maximizing performance to be faster than what its thin design may otherwise suggest. Auxiliary features get the short end of the stick and fan noise will be very high if you want the most out of the system.
MSI WS66 10TMT-207US
-
08/30/2020 v7
Allen Ngo


Pricecompare
