

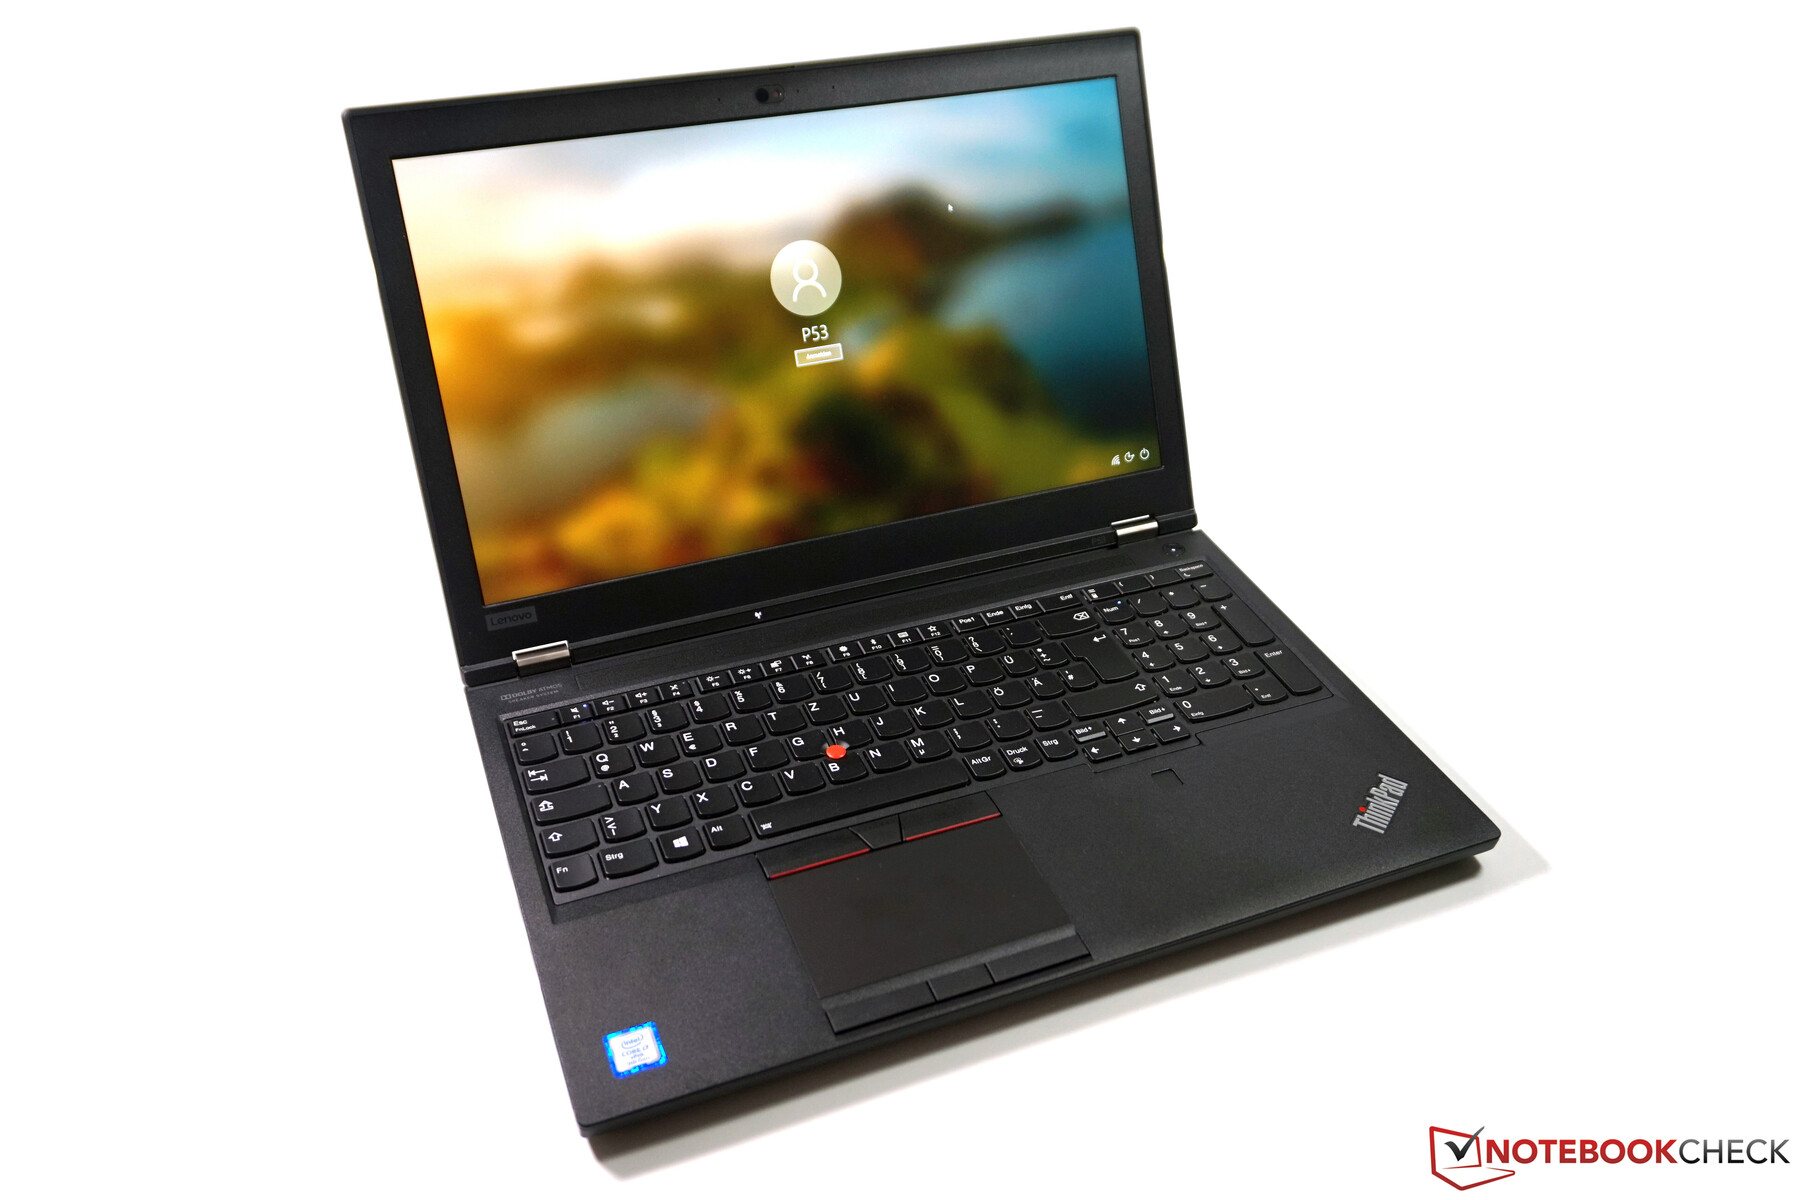
Lenovo ThinkPad P53 in Review: Classic workstation with a lot of GPU performance
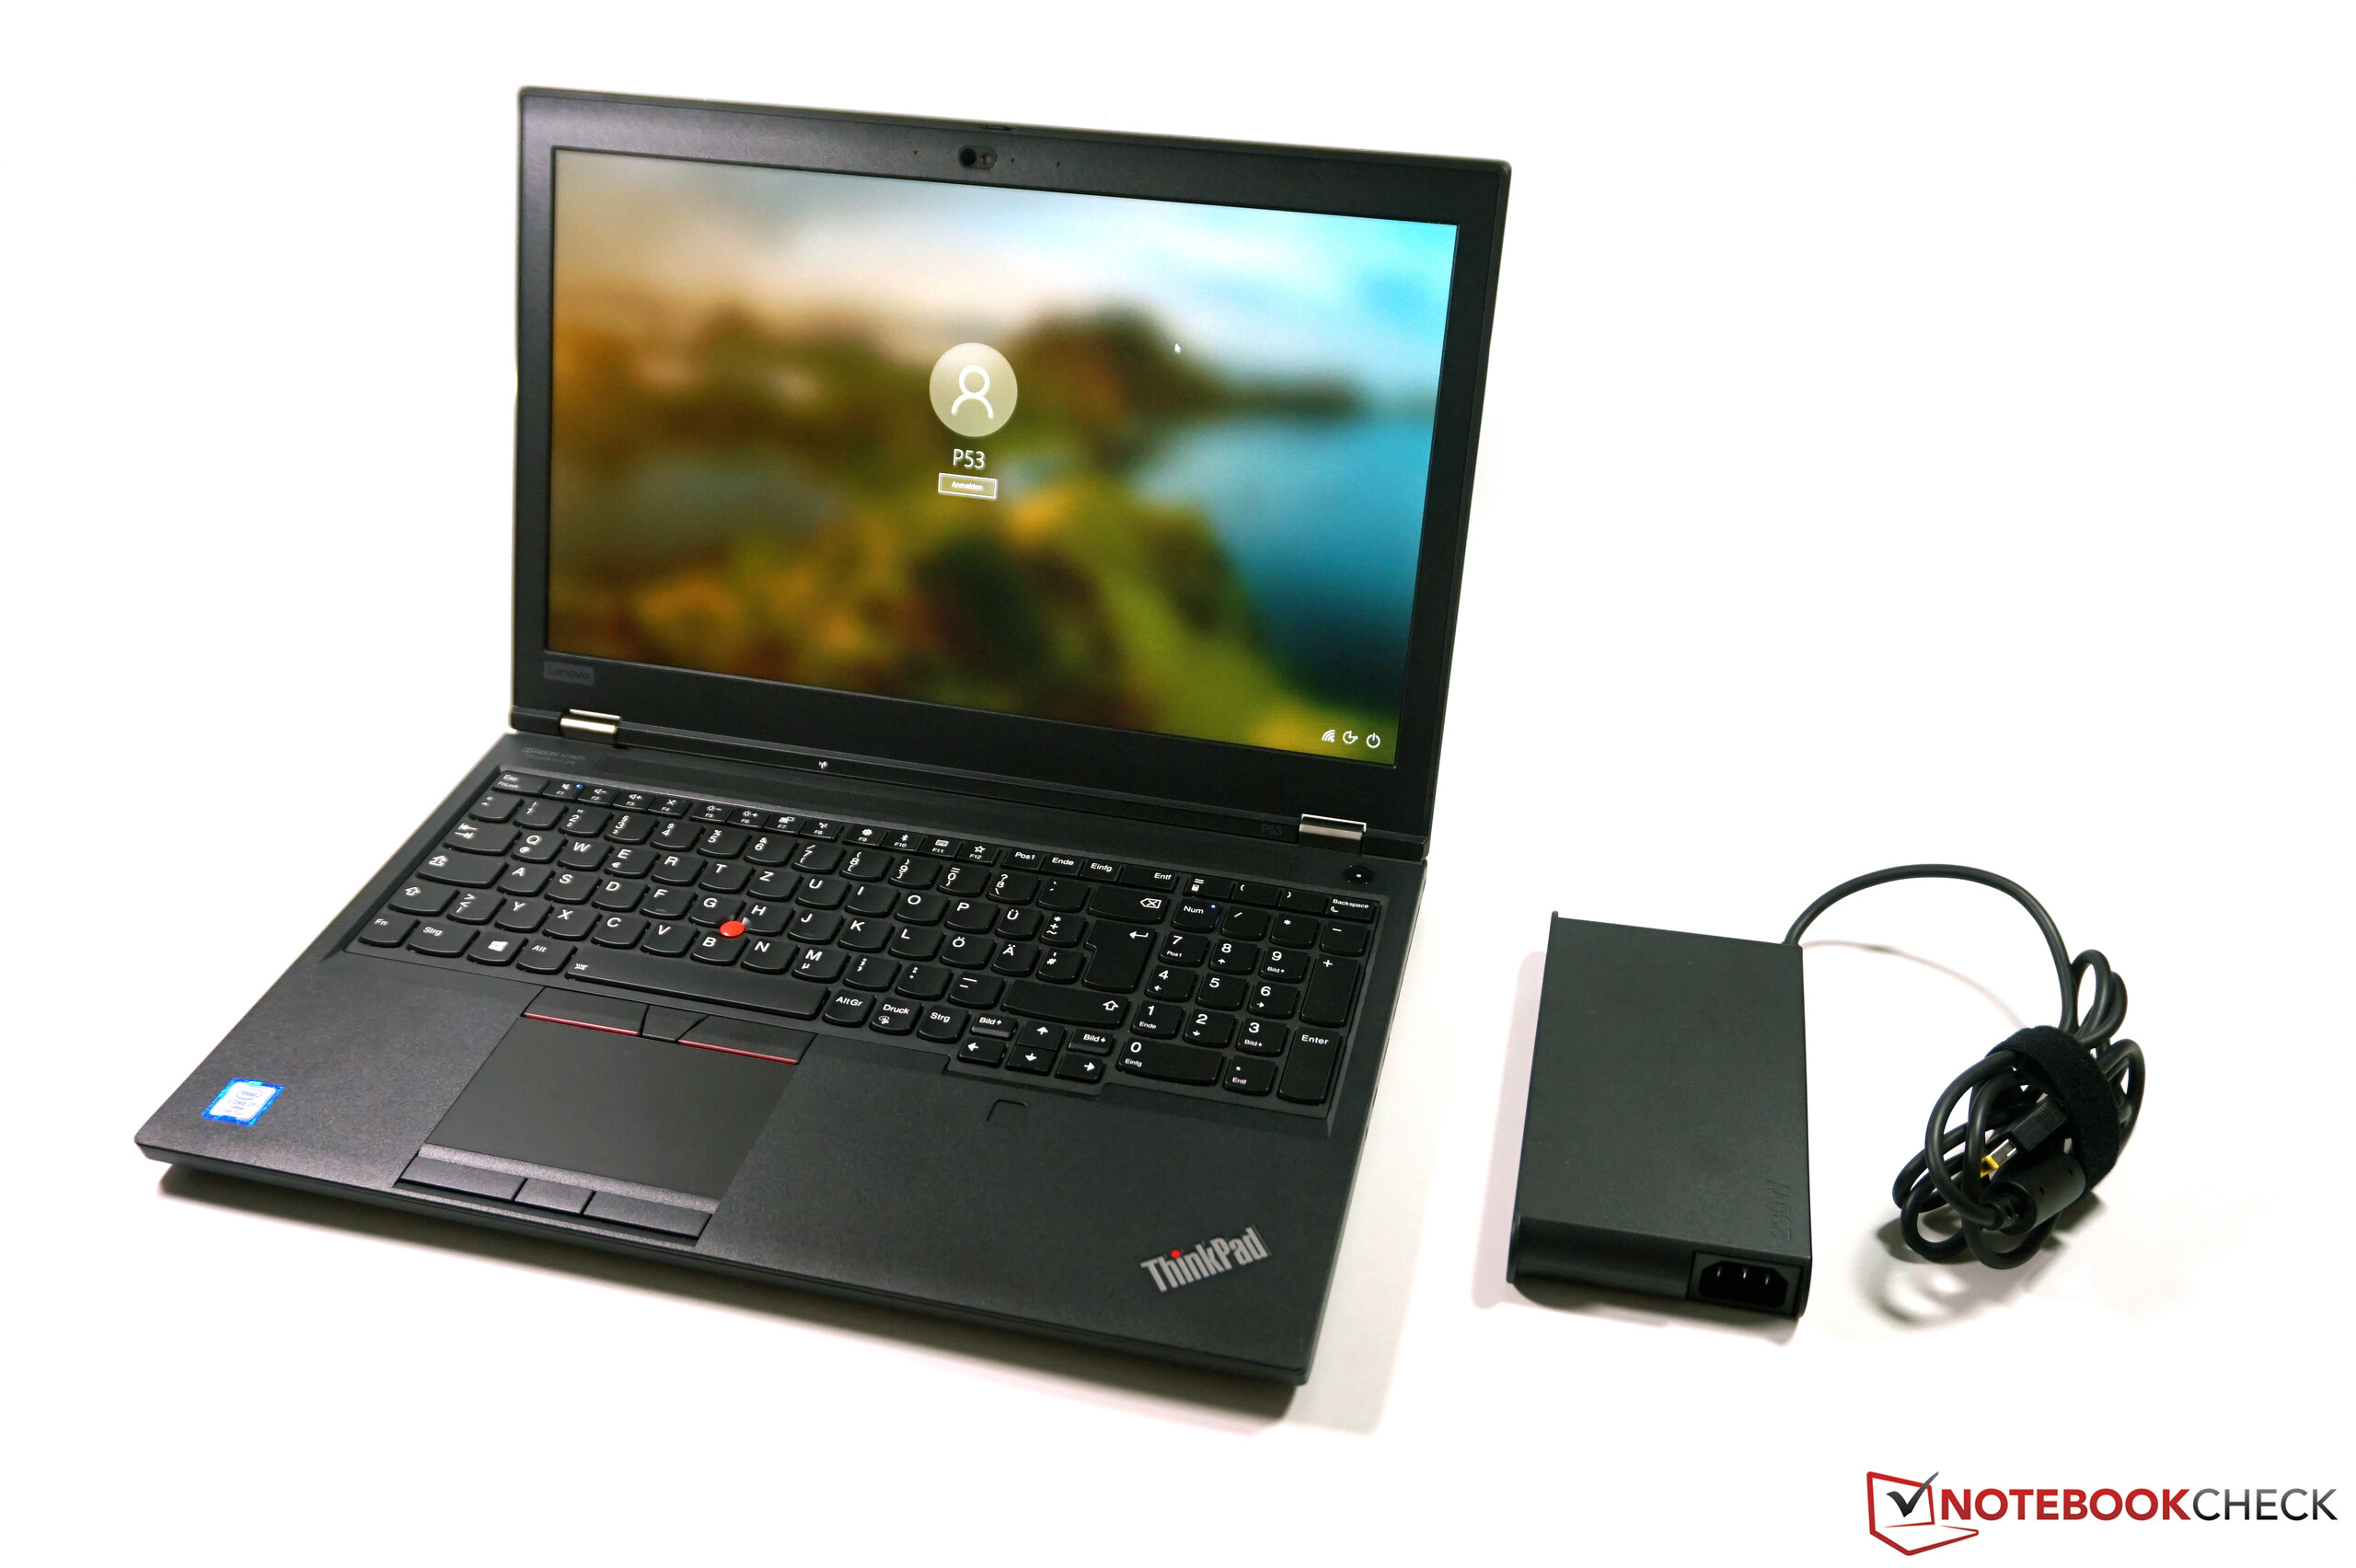
With the ThinkPad P53, Lenovo has a traditional 15.6-inch mobile workstation on offer. In this case, traditional hints at the fact that unlike for example the ThinkPad P1 2019, it is not a very slim or light device. In return, users reap the benefits of faster hardware (particularly in terms of the GPU), more ports and greater expandability.
The ThinkPad P53 starts at 1,800 Euros (~$1,984) with almost no upper limit. The highest-end configuration (Xeon, RTX 5000, OLED, 3x SSD, 128 GB of RAM) costs almost 8,000 Euros (~$8,816). Our test model, which comes with a Core i7, an RTX 5000, a Full-HD panel, 32 GB of RAM and a 1-TB SSD is available for around 4,500 Euros (~$4,959), although the GPU option makes up a large portion of the cost.
Rating | Date | Model | Weight | Height | Size | Resolution | Price |
|---|---|---|---|---|---|---|---|
| 89.8 % v7 (old) | 11 / 2019 | Lenovo ThinkPad P53-20QN000YGE i7-9850H, Quadro RTX 5000 Max-Q | 2.7 kg | 29.4 mm | 15.60" | 1920x1080 | |
| 87.8 % v7 (old) | 08 / 2019 | Lenovo ThinkPad P1 2019-20QT000RGE i7-9850H, Quadro T1000 (Laptop) | 1.7 kg | 18.4 mm | 15.60" | 1920x1080 | |
| 86.9 % v7 (old) | 10 / 2018 | Dell Precision 7530 i9-8950HK, Quadro P3200 | 2.6 kg | 29.95 mm | 15.60" | 3840x2160 | |
| 85.6 % v6 (old) | 04 / 2019 | Fujitsu Celsius H780 i7-8850H, Quadro P2000 | 2.8 kg | 31.9 mm | 15.60" | 1920x1080 | |
| 85 % v7 (old) | 06 / 2019 | MSI P65 Creator 9SF-657 i9-9880H, GeForce RTX 2070 Max-Q | 1.9 kg | 18 mm | 15.60" | 3840x2160 |
Chassis
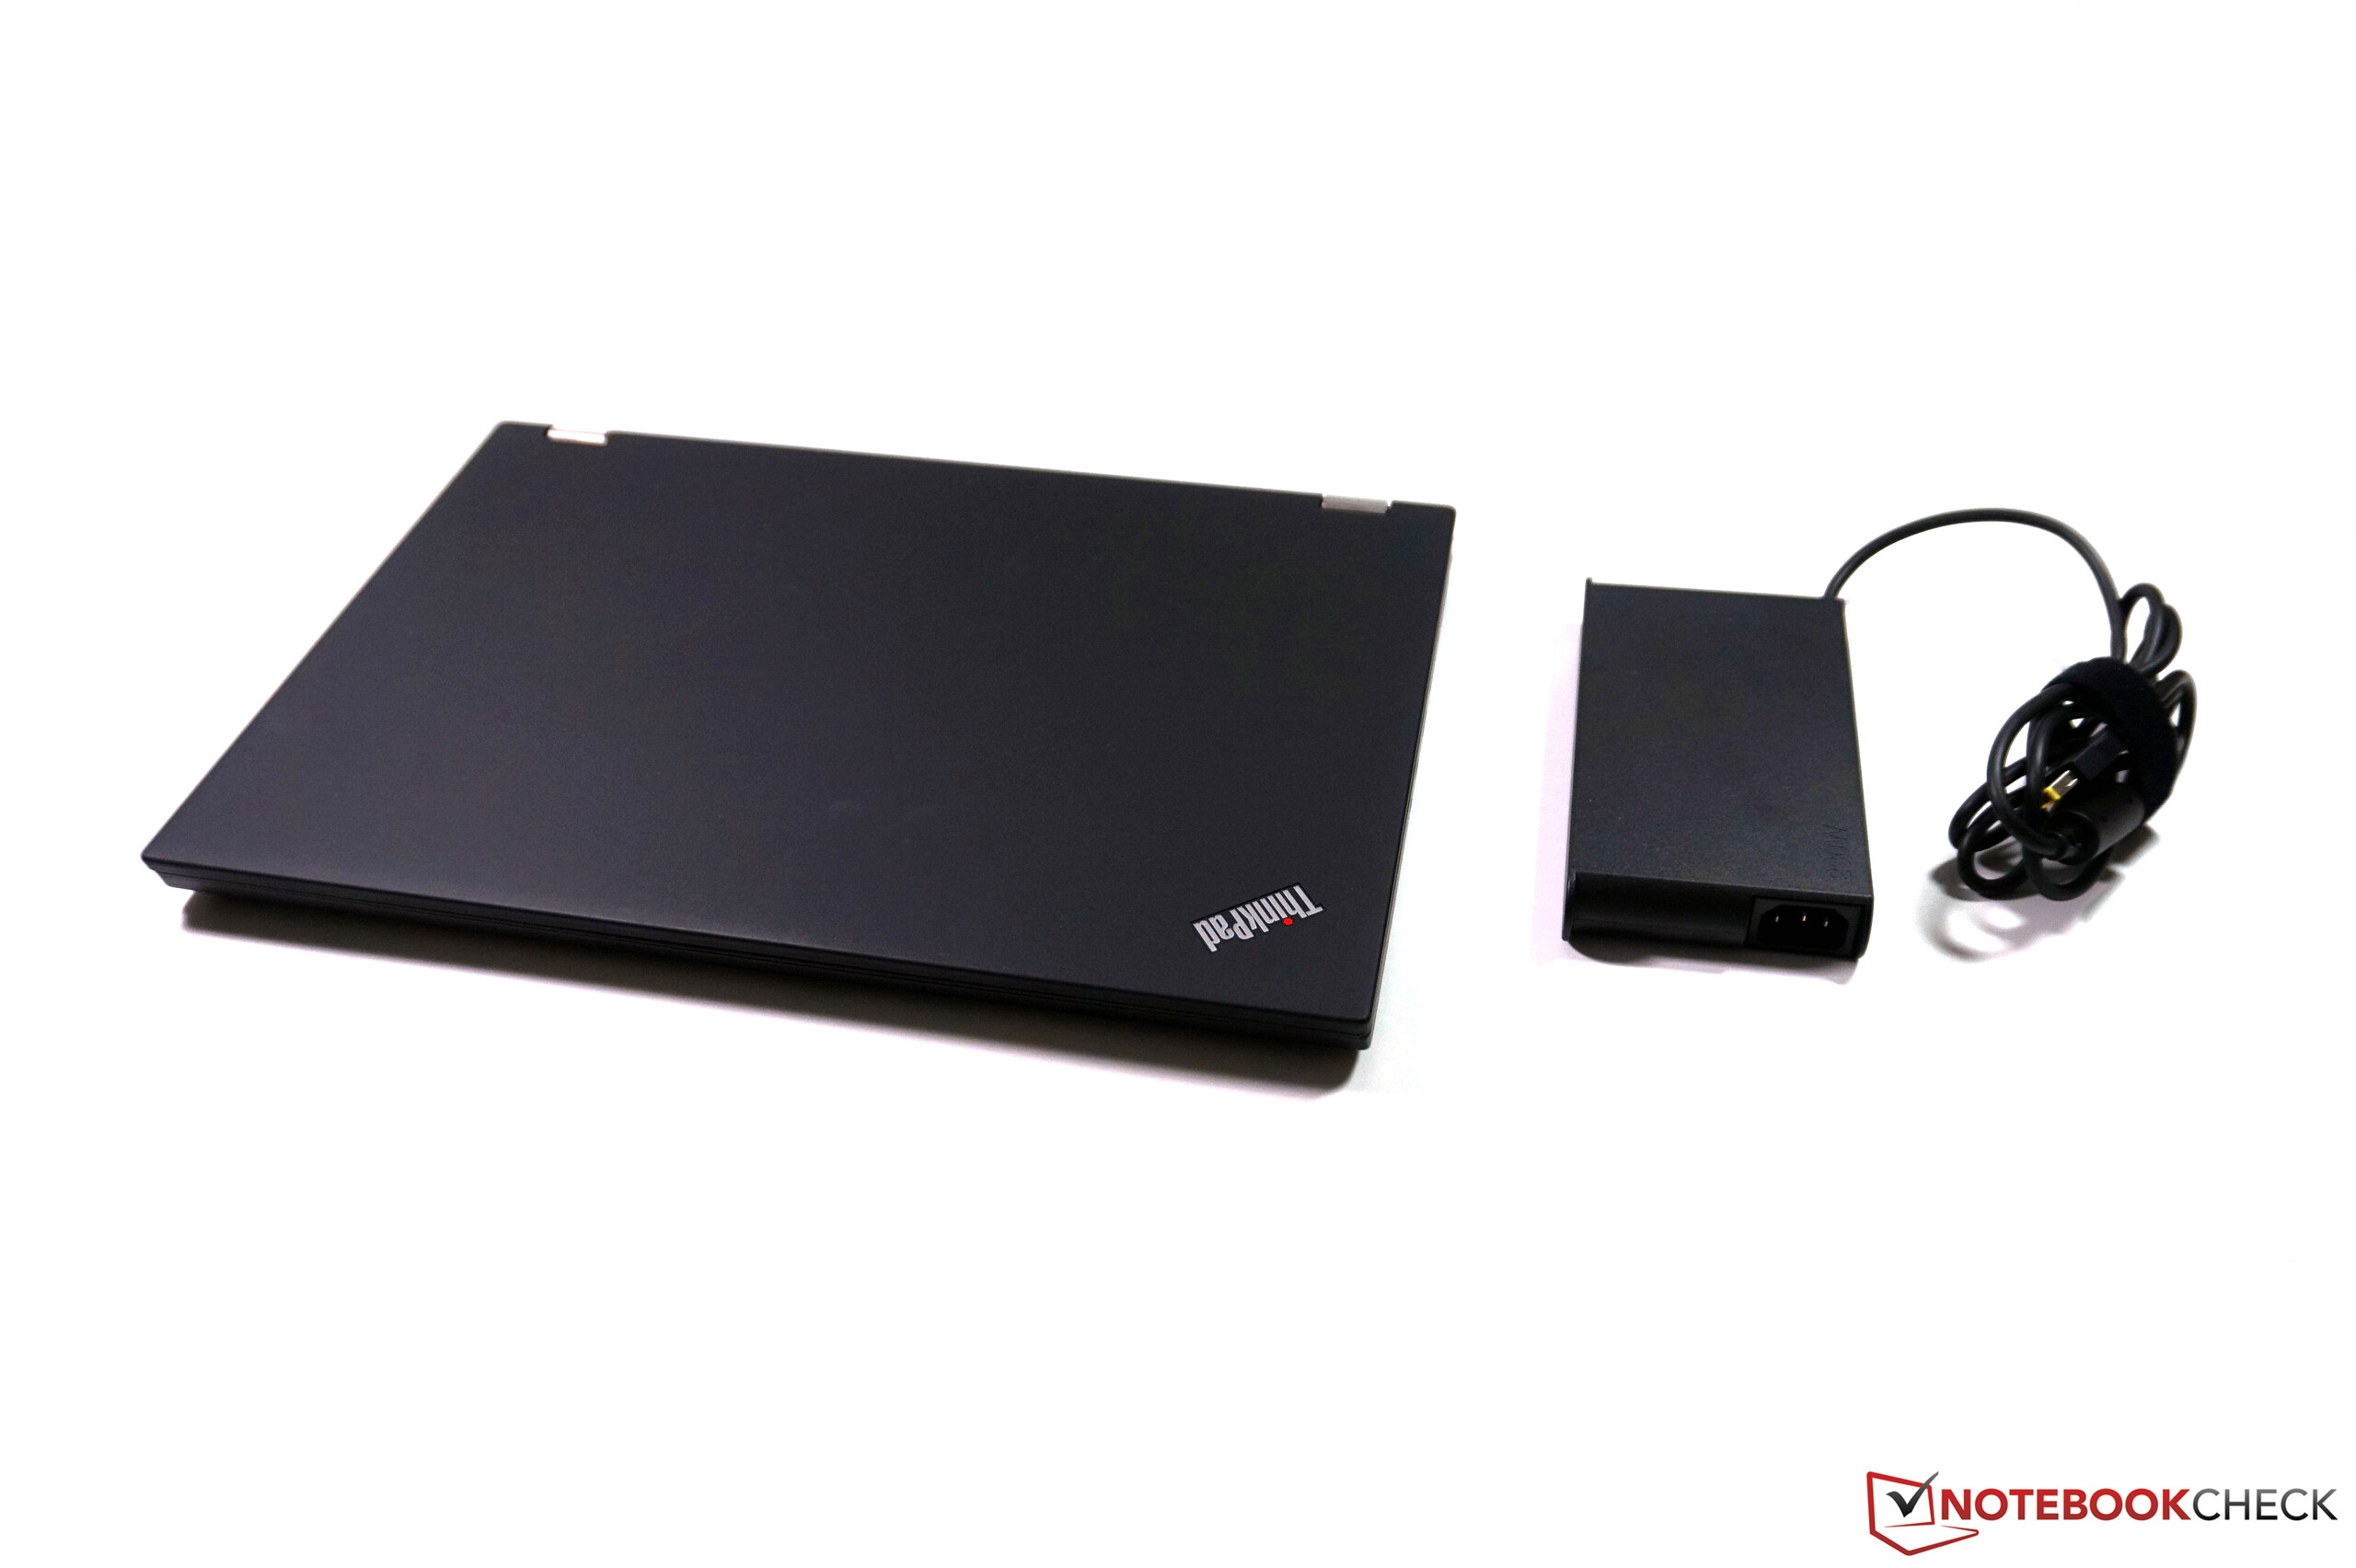
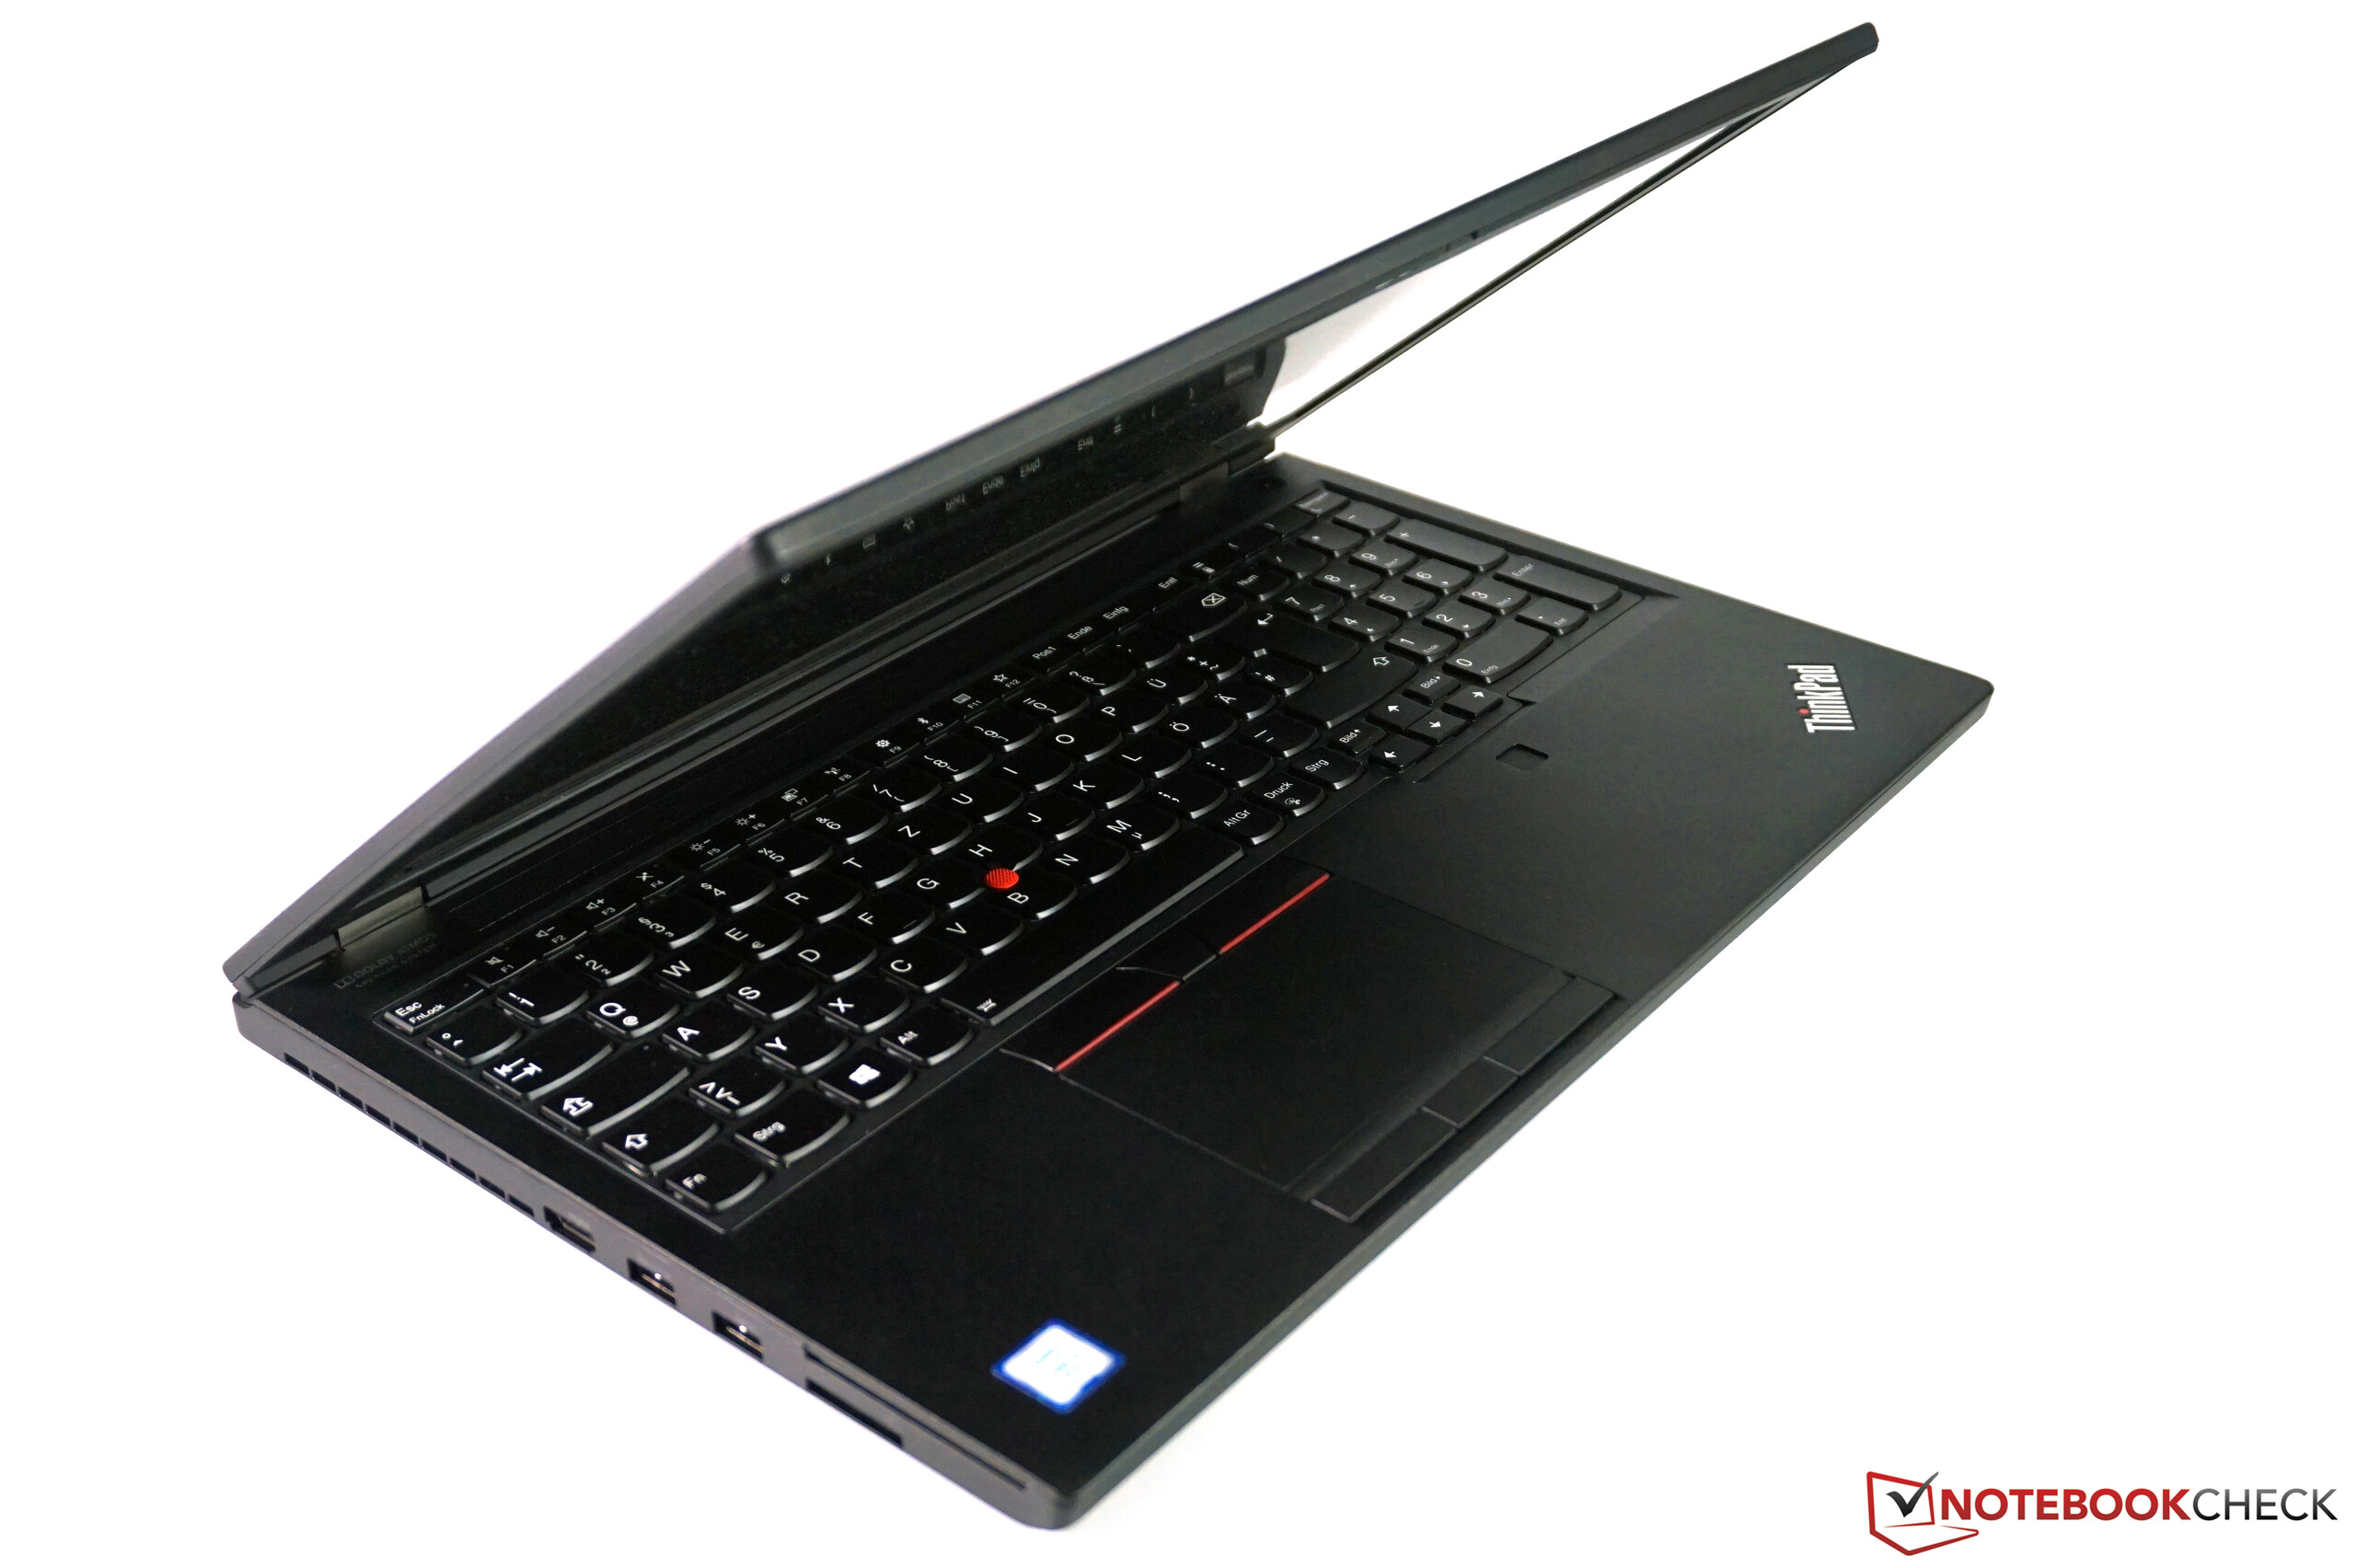
Chassis updates to professional models usually follow a two-year cycle. As for the Lenovo ThinkPad P-5x series, this is not the case and even last year's P52 was more of a facelift than a comprehensive update. The ThinkPad P53 follows the same trend, at least externally. Aside from the differences in terms of the ports, the visuals of the P53 including the black plastic surfaces remain unchanged. By contrast, a lot has changed on the inside.
Thankfully, this does not negatively impact the rigidity or build quality and the ThinkPad is still an extremely rigid device without any flaws in terms of construction. The base unit cannot be twisted, it does not noticeably yield and there is no annoying creaking either. While both of the hinges are very rigid and able to prevent teetering reliably, they are unable to support the lid at small angles, where it instead snaps shut. Speaking of the lid, the P53's cover does not appear to be aware of the slim-bezel trend. While the lid itself is not quite as rigid as the base unit, there are no problems in terms of stability here, either. Our impression of the chassis is good overall, although competing HP and particularly Dell alternatives (with large amounts of metal and rubberized surfaces) achieve even more high-quality looks.
The dimensions remain unchanged compared to the predecessor and there are only minor differences in terms of weight (this may vary, depending on the configuration). The display choice continues to be an important aspect, since versions with a matte display weigh around 400 grams (~14 oz) less than models with reflective panels. However, the latter only applies to the 4K OLED display variant of the ThinkPad P53.
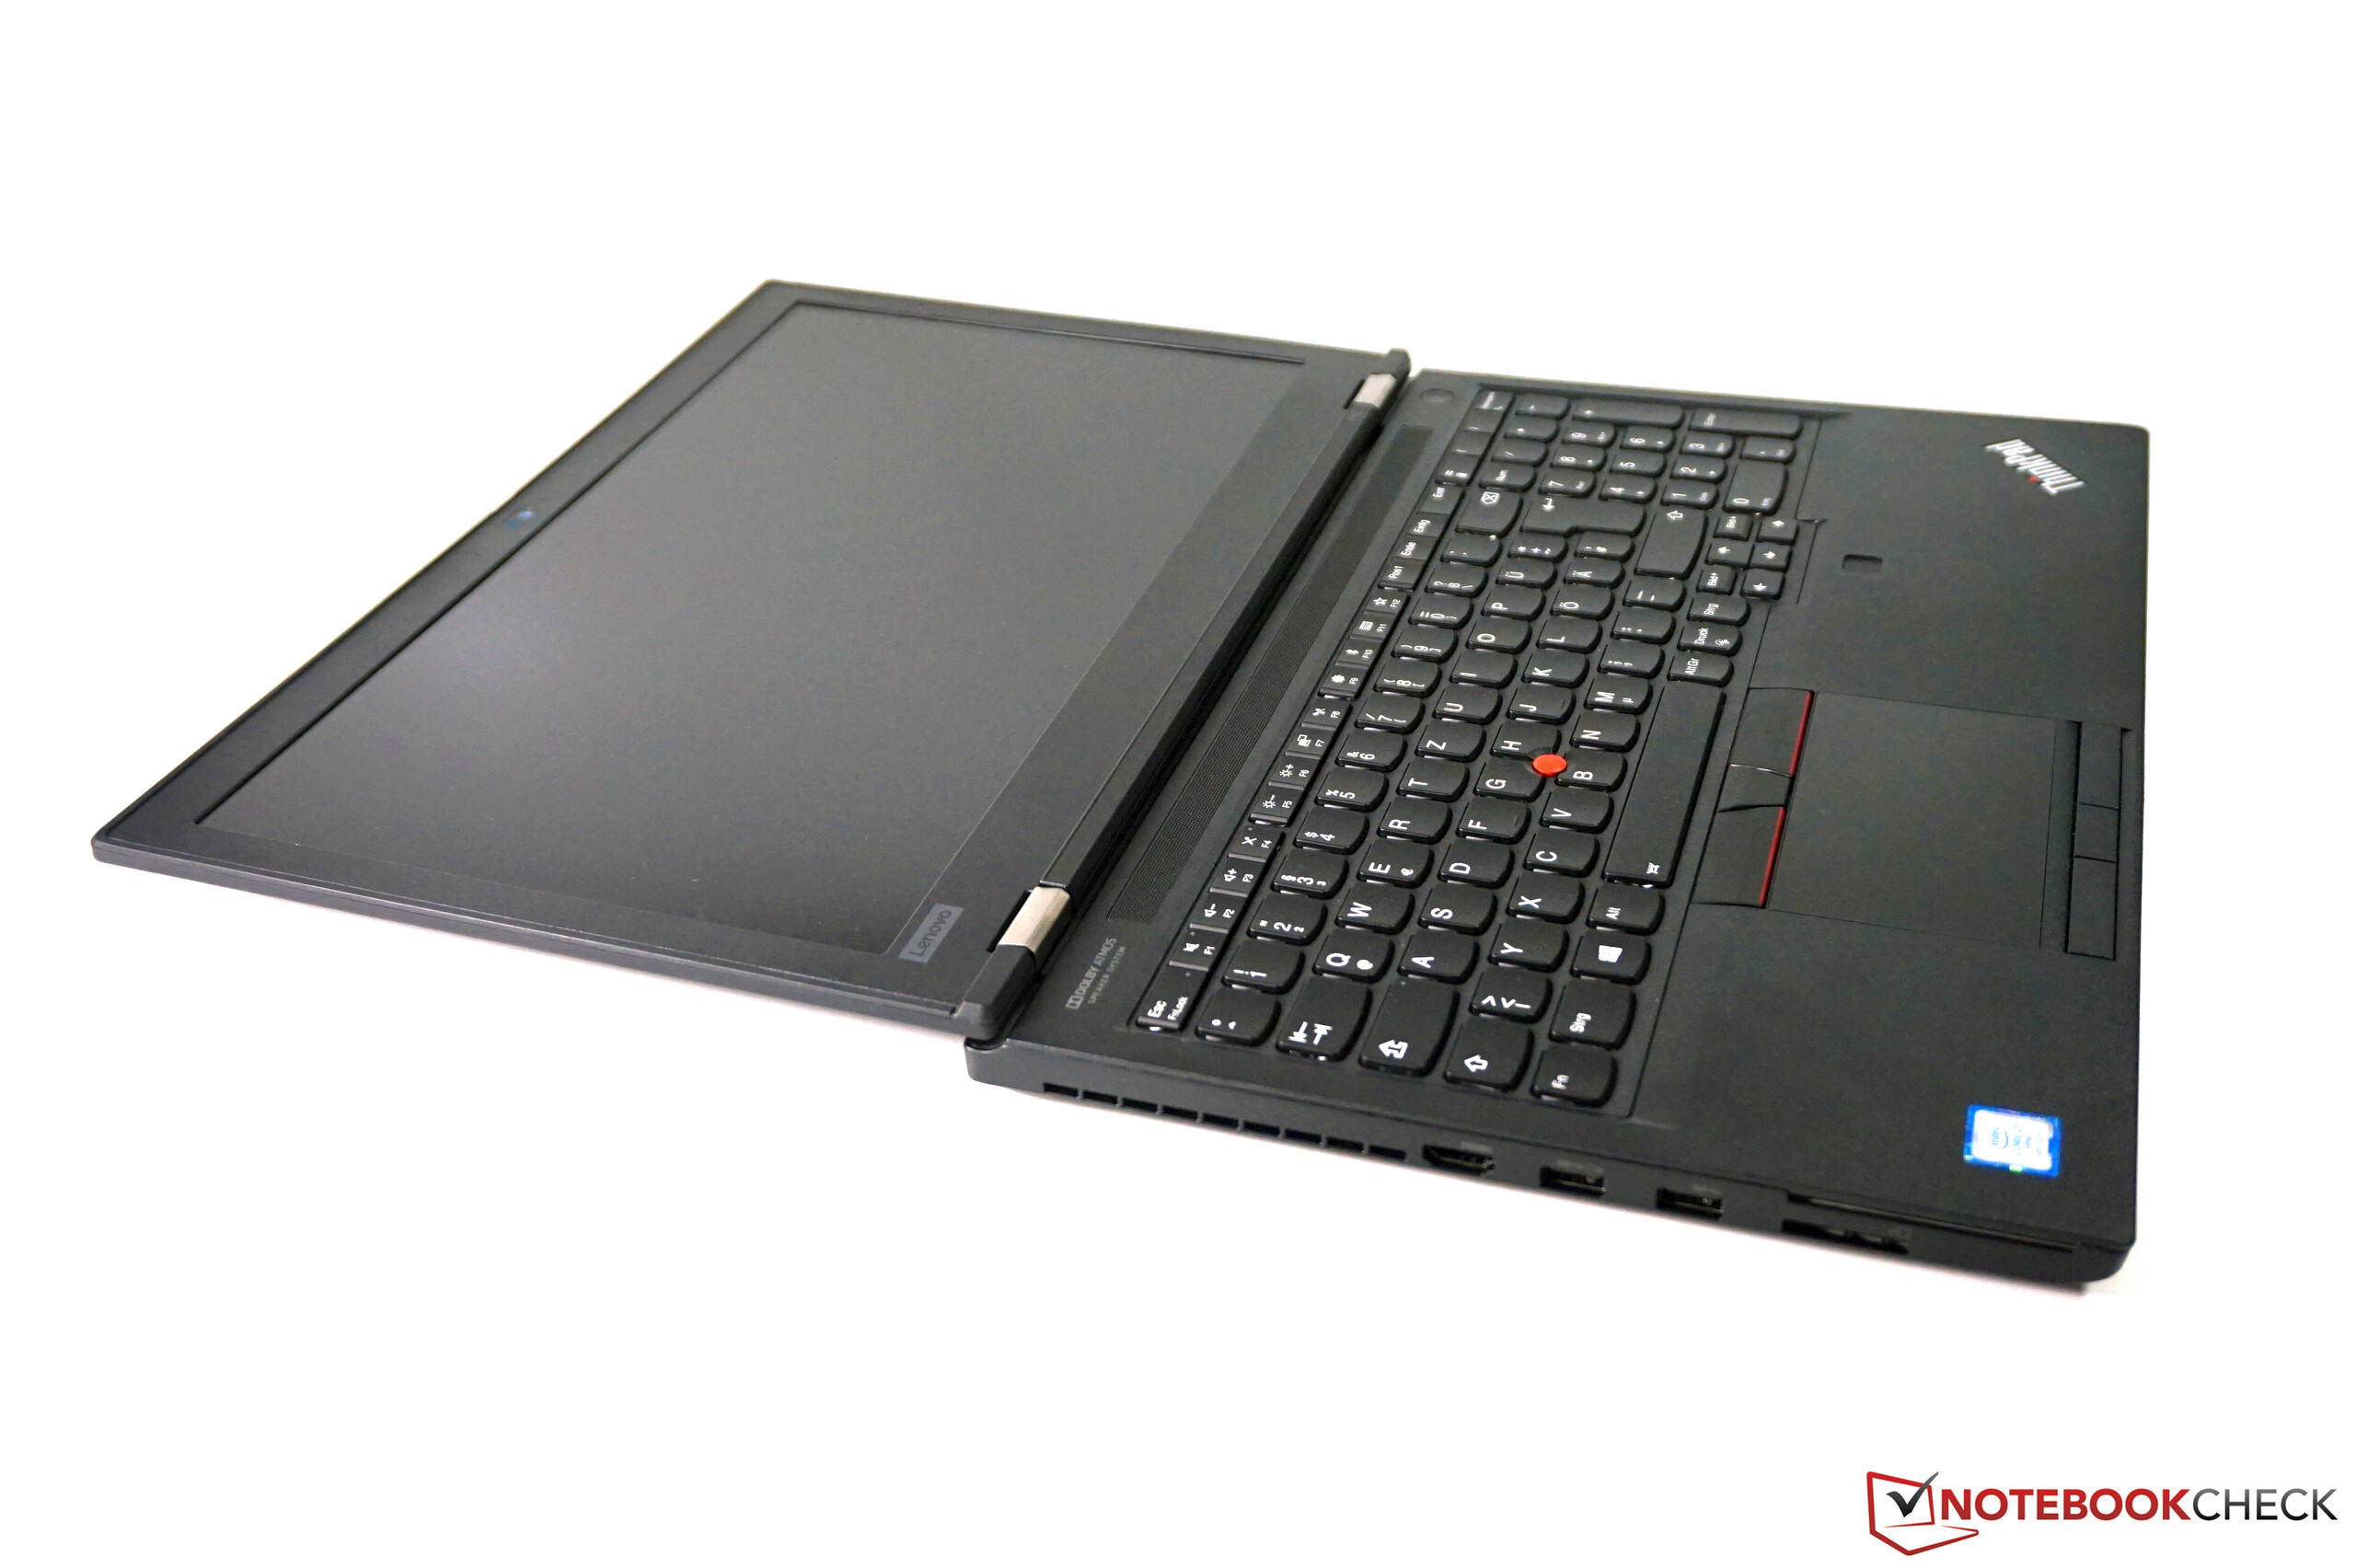
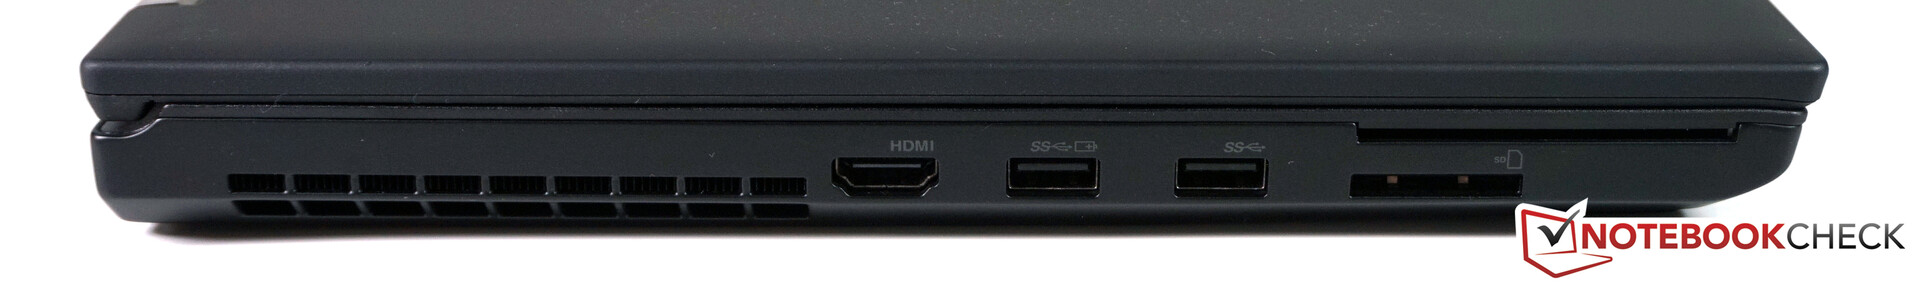
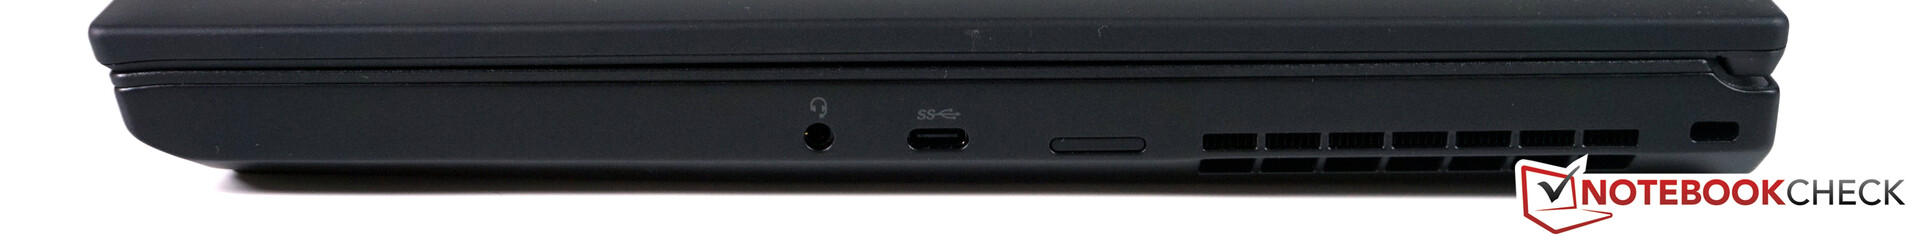
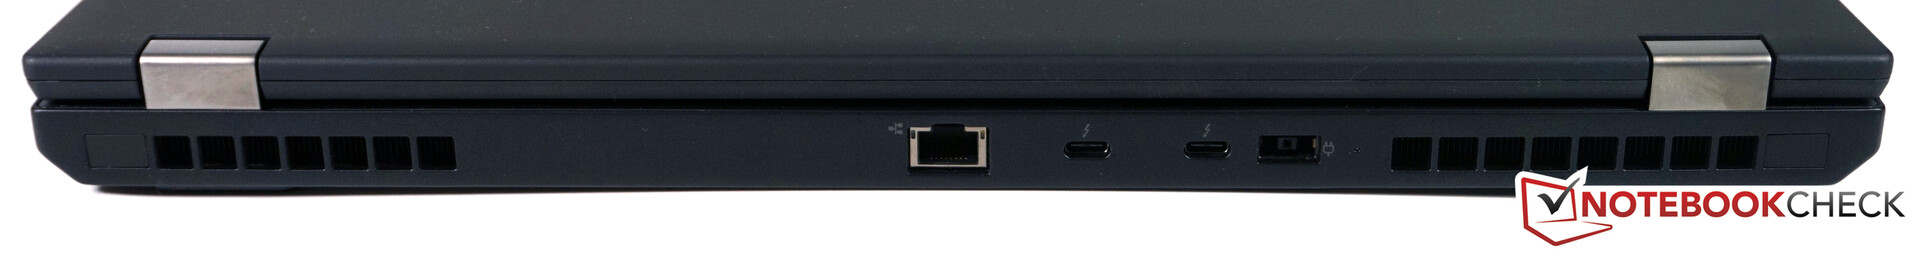
Connectivity – P53 with Thunderbolt 3 and Wi-Fi 6
There are a few differences in terms of port selection and layout compared to the older ThinkPad P52. There is an HDMI 2.0 output on the left (that used to be on the back), two traditional USB type-A ports and two card readers. The nano-SIM card slot can now be found on the left side to be more accessible than on the inside of the battery compartment, where it used to be located. Additionally, there is a USB type-C port (Gen 1). Both of the Thunderbolt 3 ports can still be found on the back of the device. The port layout is decent overall, although the lack of a USB type-A port on the right may negatively affect the user experience in some cases. At least there is now more space between the ports, which is convenient for larger connectors.
| SD Card Reader | |
| average JPG Copy Test (av. of 3 runs) | |
| Dell Precision 7530 (Toshiba Exceria Pro SDXC 64 GB UHS-II) | |
| Lenovo ThinkPad P53-20QN000YGE (Toshiba Exceria Pro SDXC 64 GB UHS-II) | |
| Lenovo ThinkPad P1 2019-20QT000RGE (Toshiba Exceria Pro SDXC 64 GB UHS-II) | |
| Lenovo ThinkPad P52 20MAS03N00 (Toshiba Exceria Pro SDXC 64 GB UHS-II) | |
| Fujitsu Celsius H780 (Toshiba Exceria Pro SDXC 64 GB UHS-II) | |
| Average of class Workstation (49.6 - 200, n=11, last 2 years) | |
| maximum AS SSD Seq Read Test (1GB) | |
| Lenovo ThinkPad P53-20QN000YGE (Toshiba Exceria Pro SDXC 64 GB UHS-II) | |
| Lenovo ThinkPad P1 2019-20QT000RGE (Toshiba Exceria Pro SDXC 64 GB UHS-II) | |
| Dell Precision 7530 (Toshiba Exceria Pro SDXC 64 GB UHS-II) | |
| Lenovo ThinkPad P52 20MAS03N00 (Toshiba Exceria Pro SDXC 64 GB UHS-II) | |
| Fujitsu Celsius H780 (Toshiba Exceria Pro SDXC 64 GB UHS-II) | |
| Average of class Workstation (85.1 - 227, n=11, last 2 years) | |
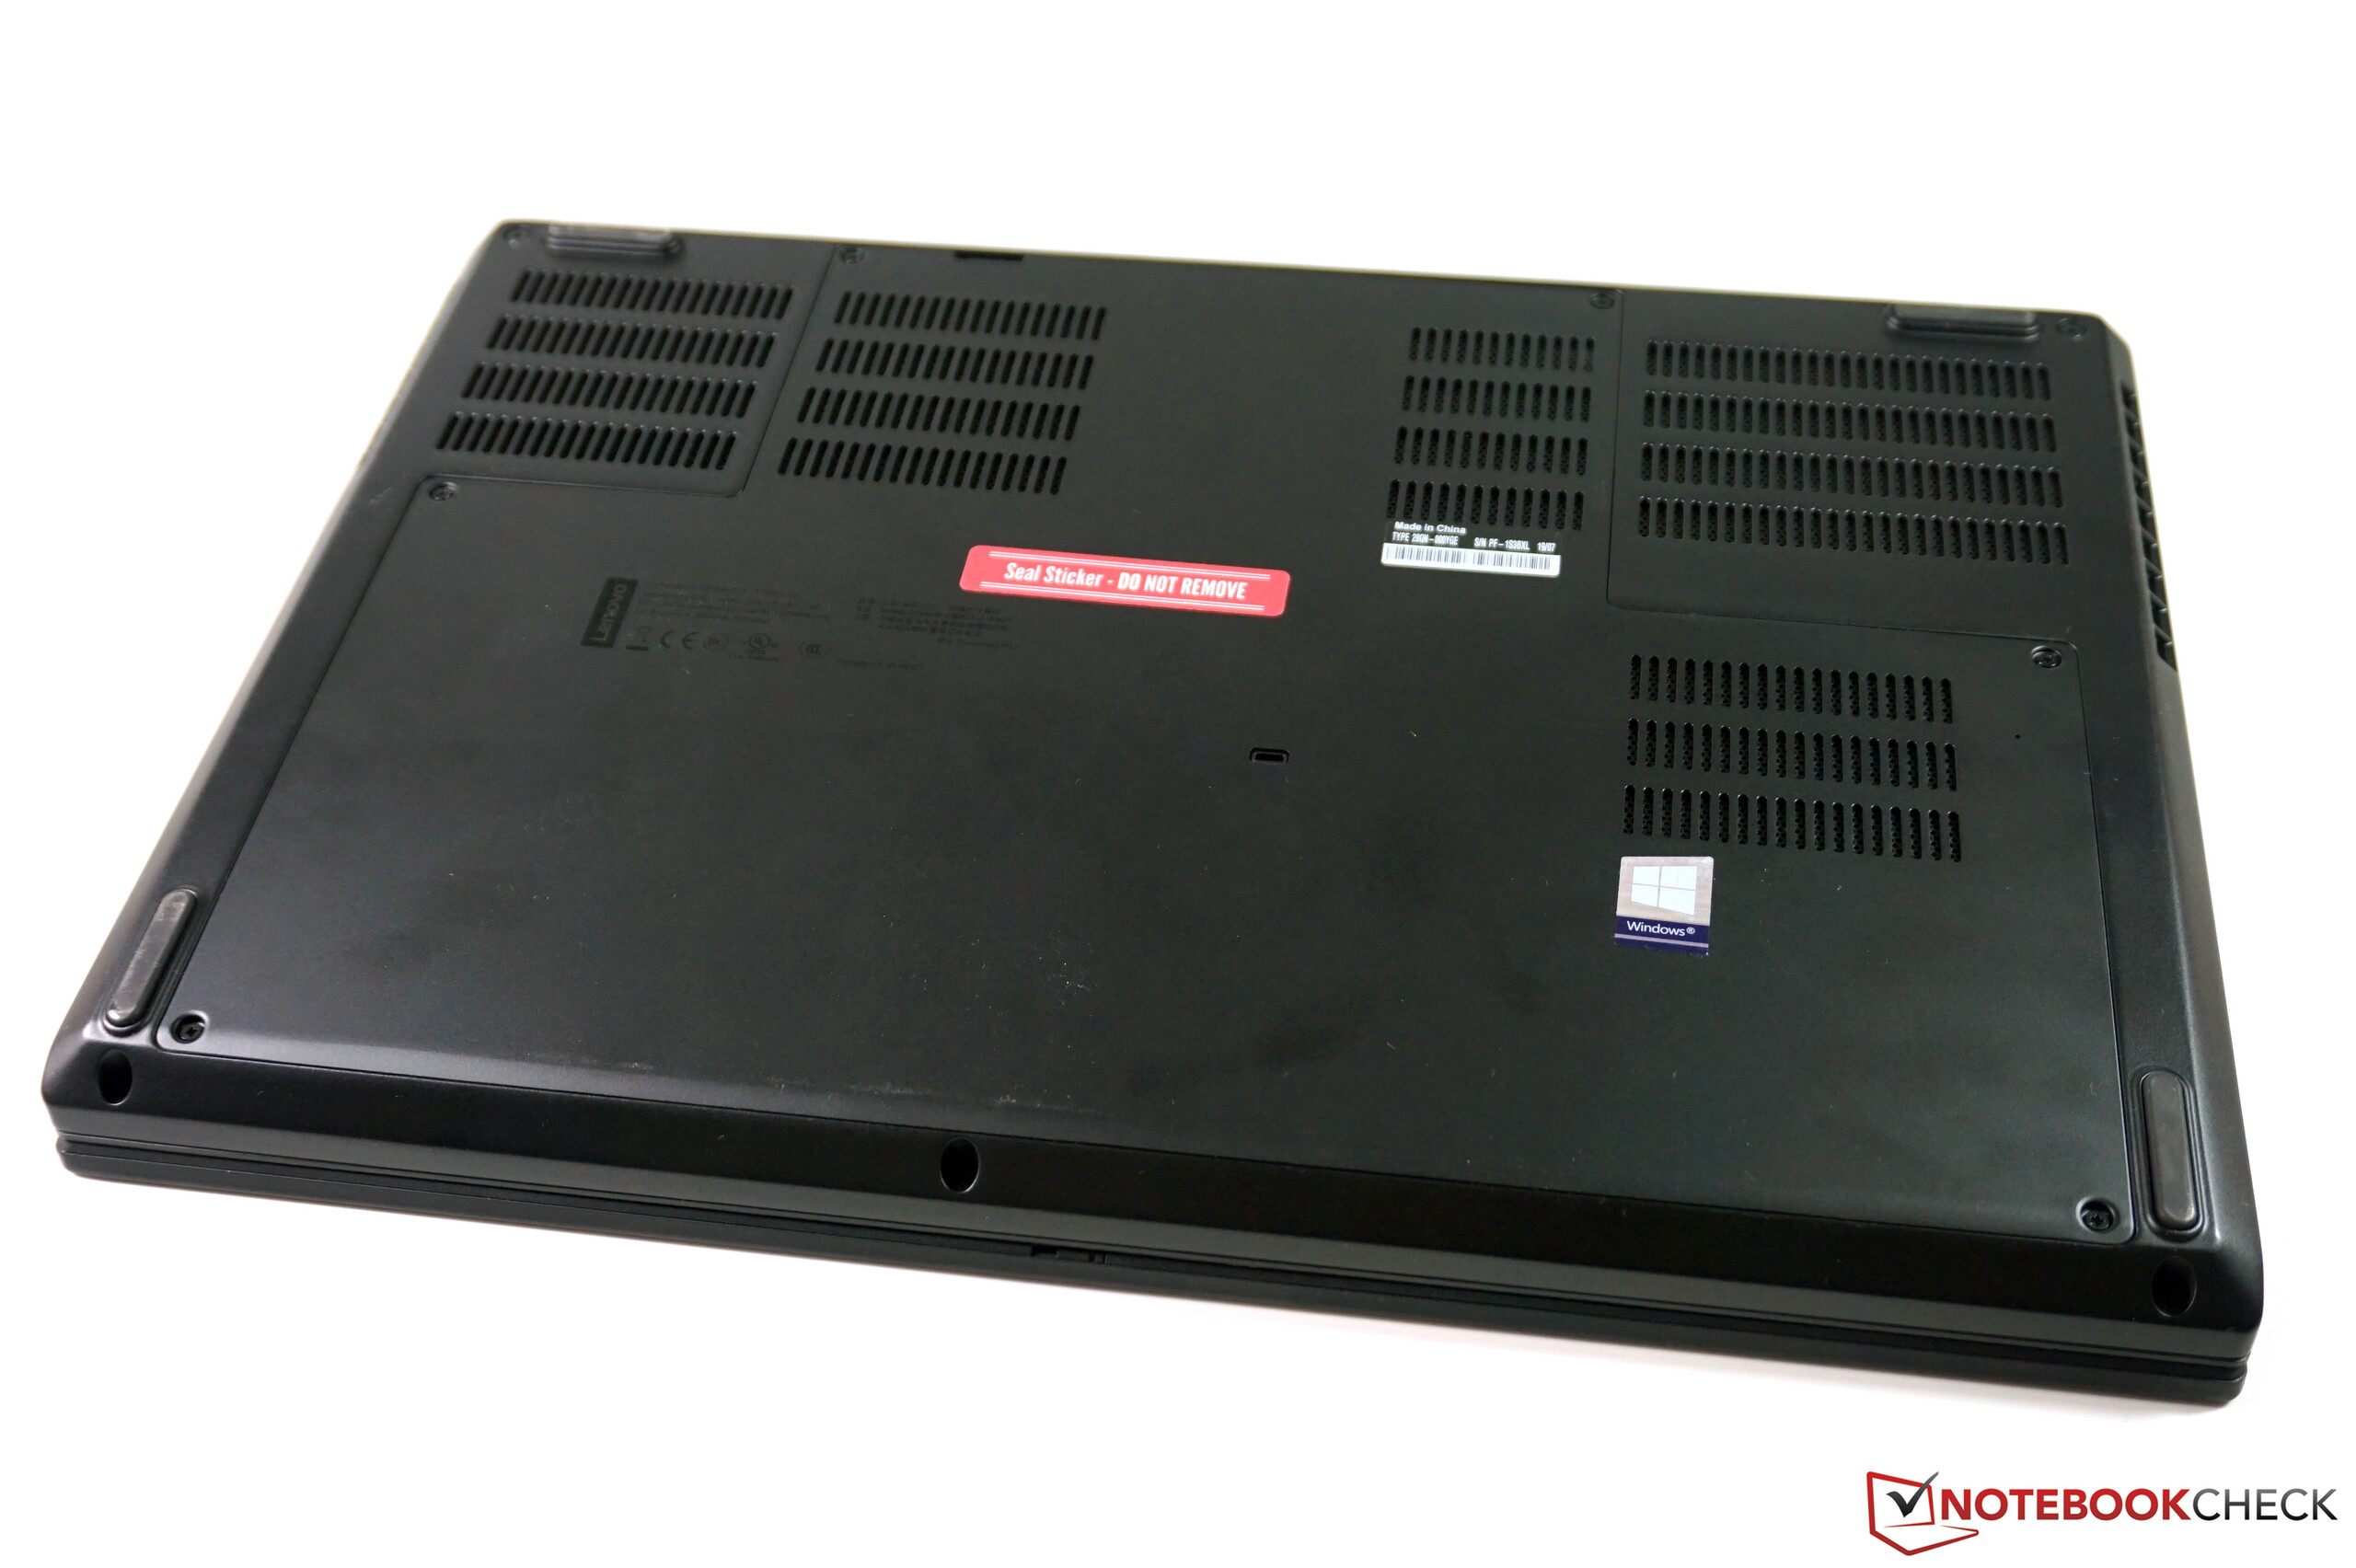
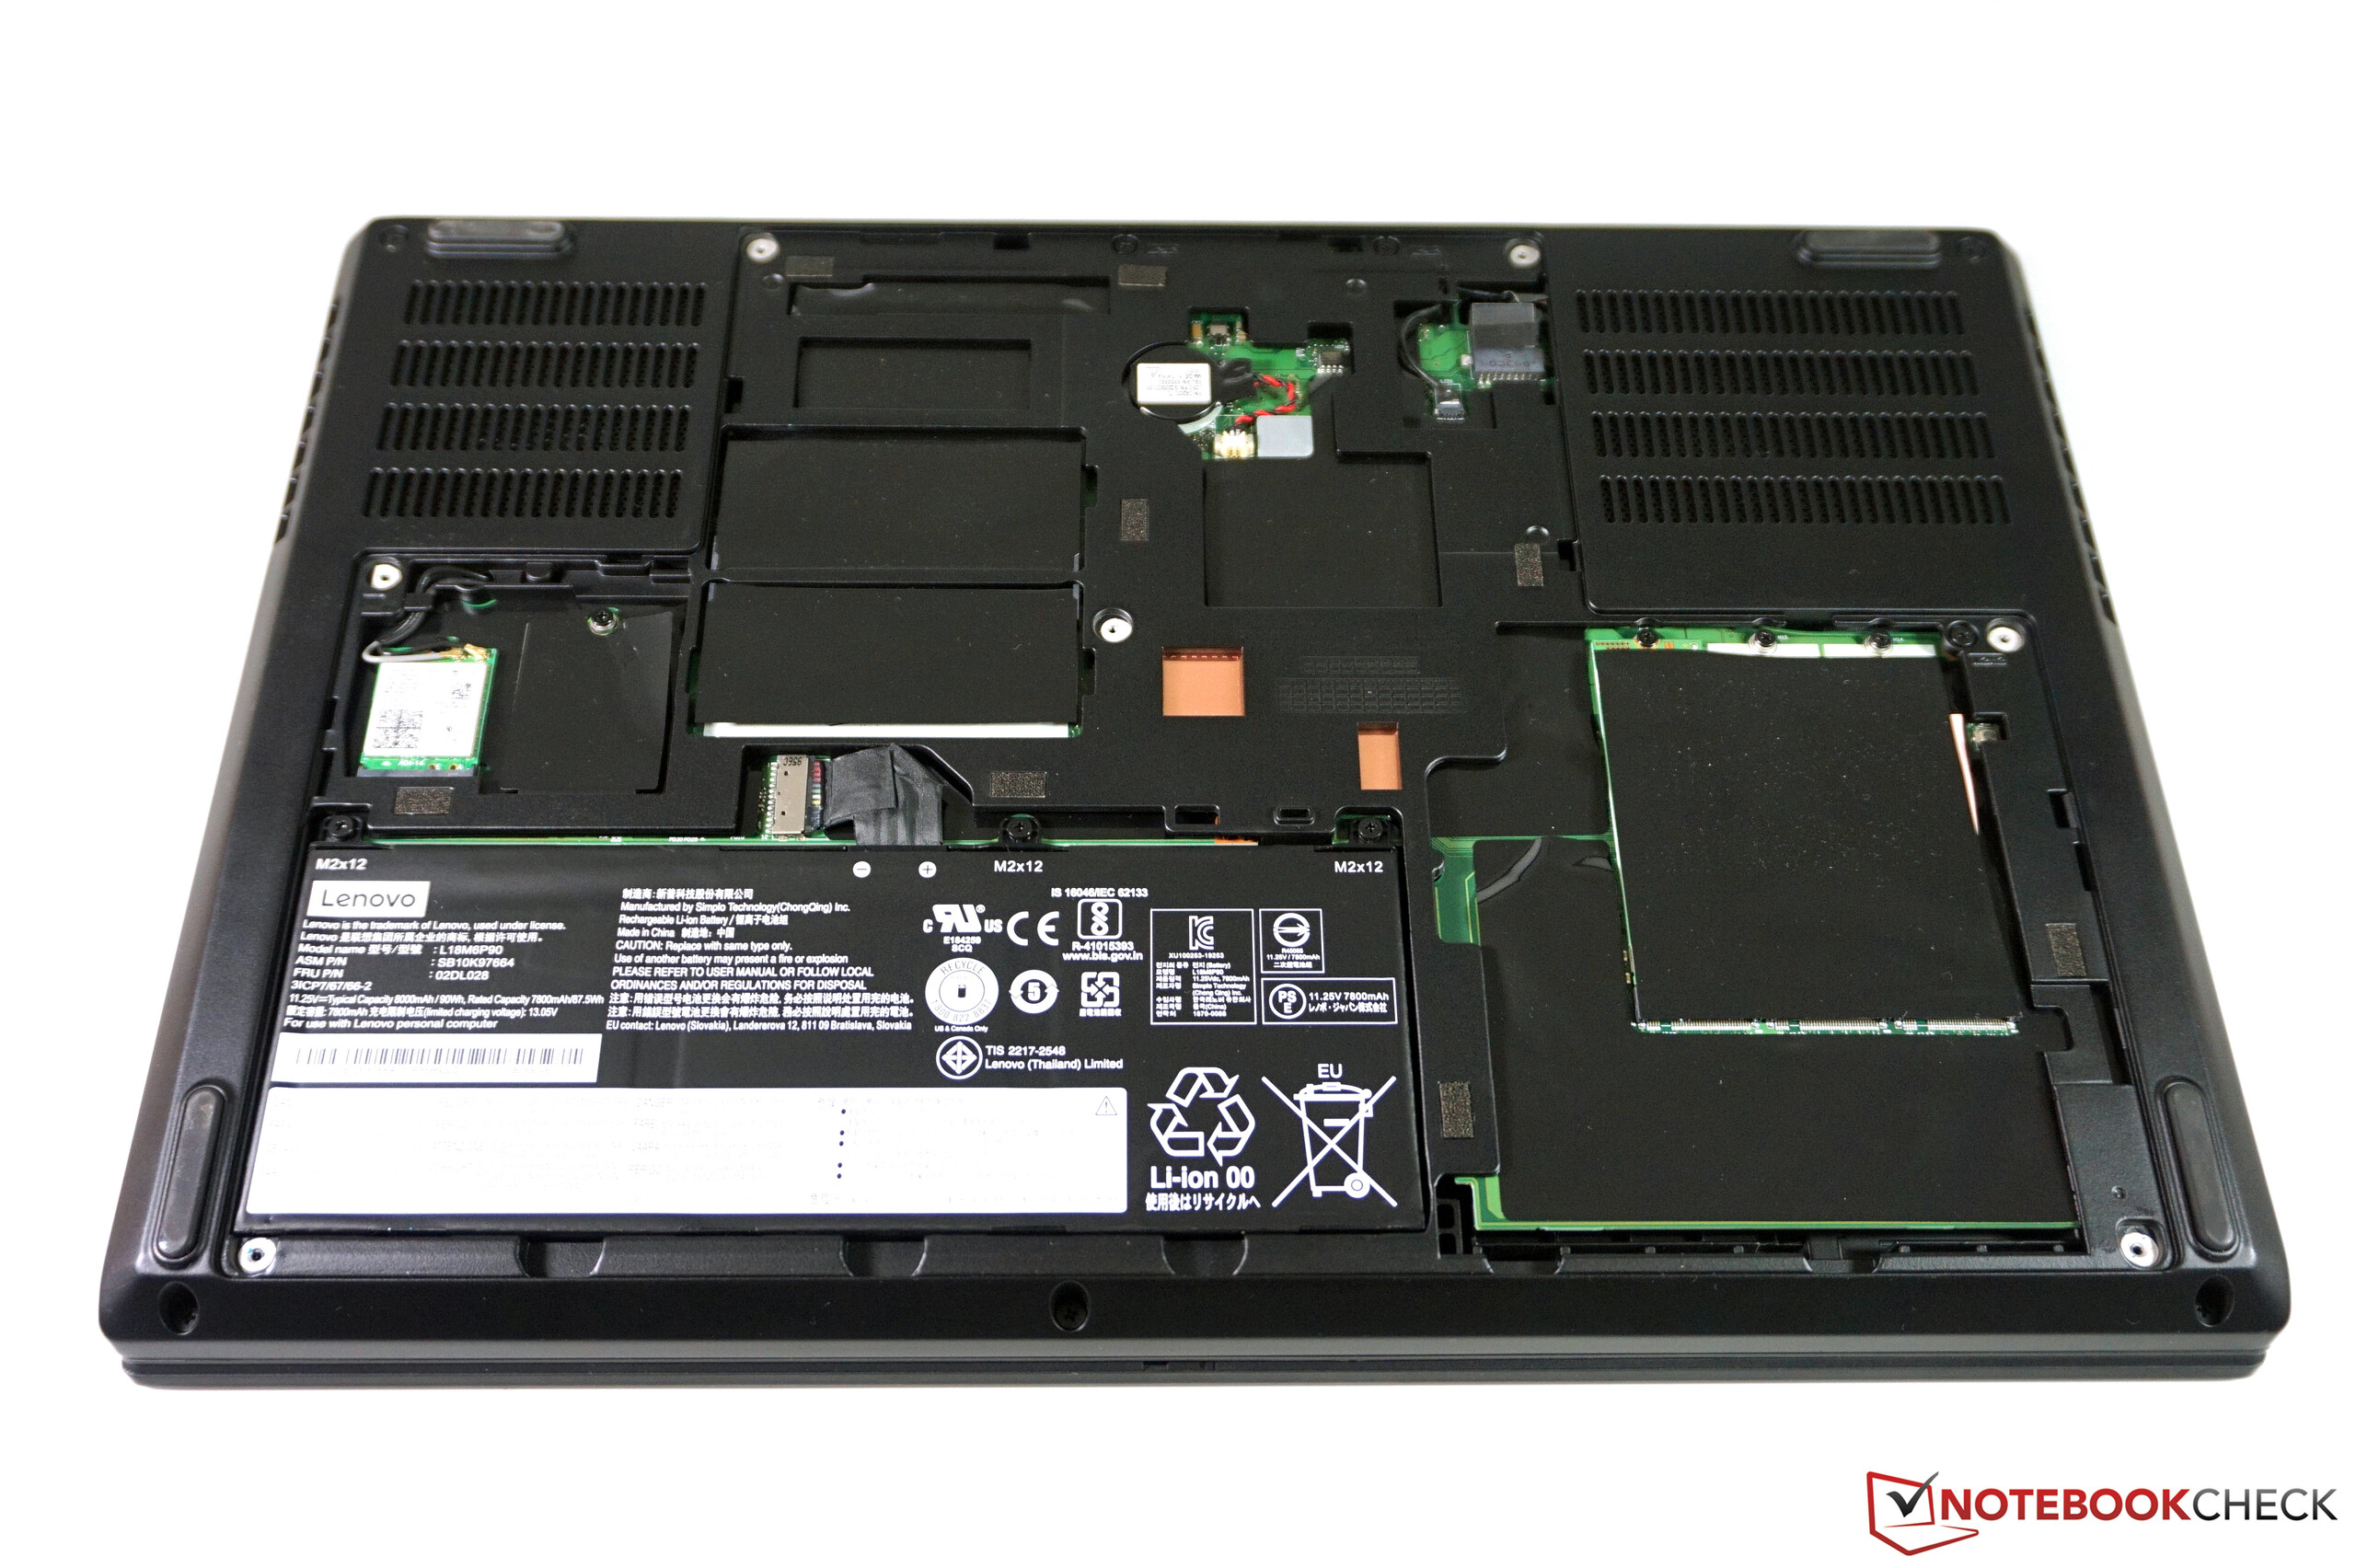
Maintenance
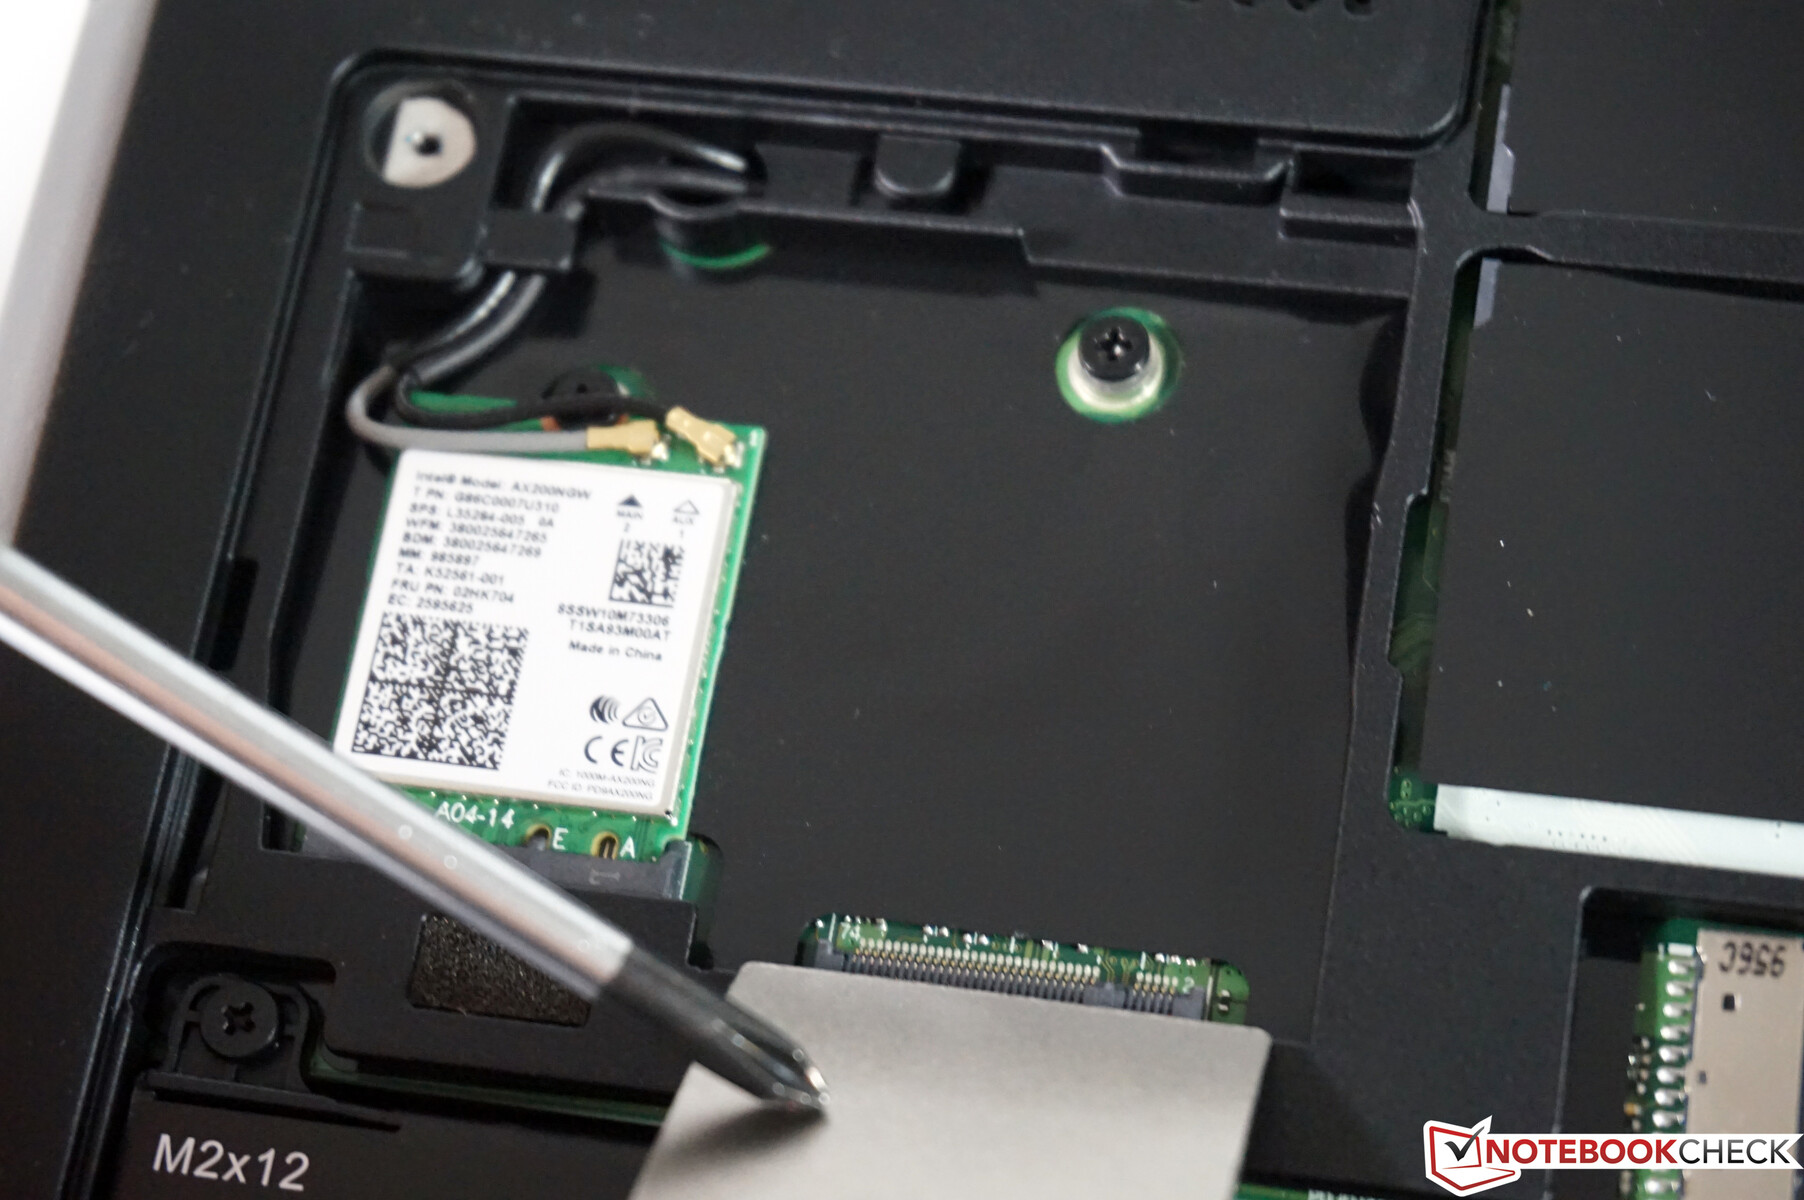
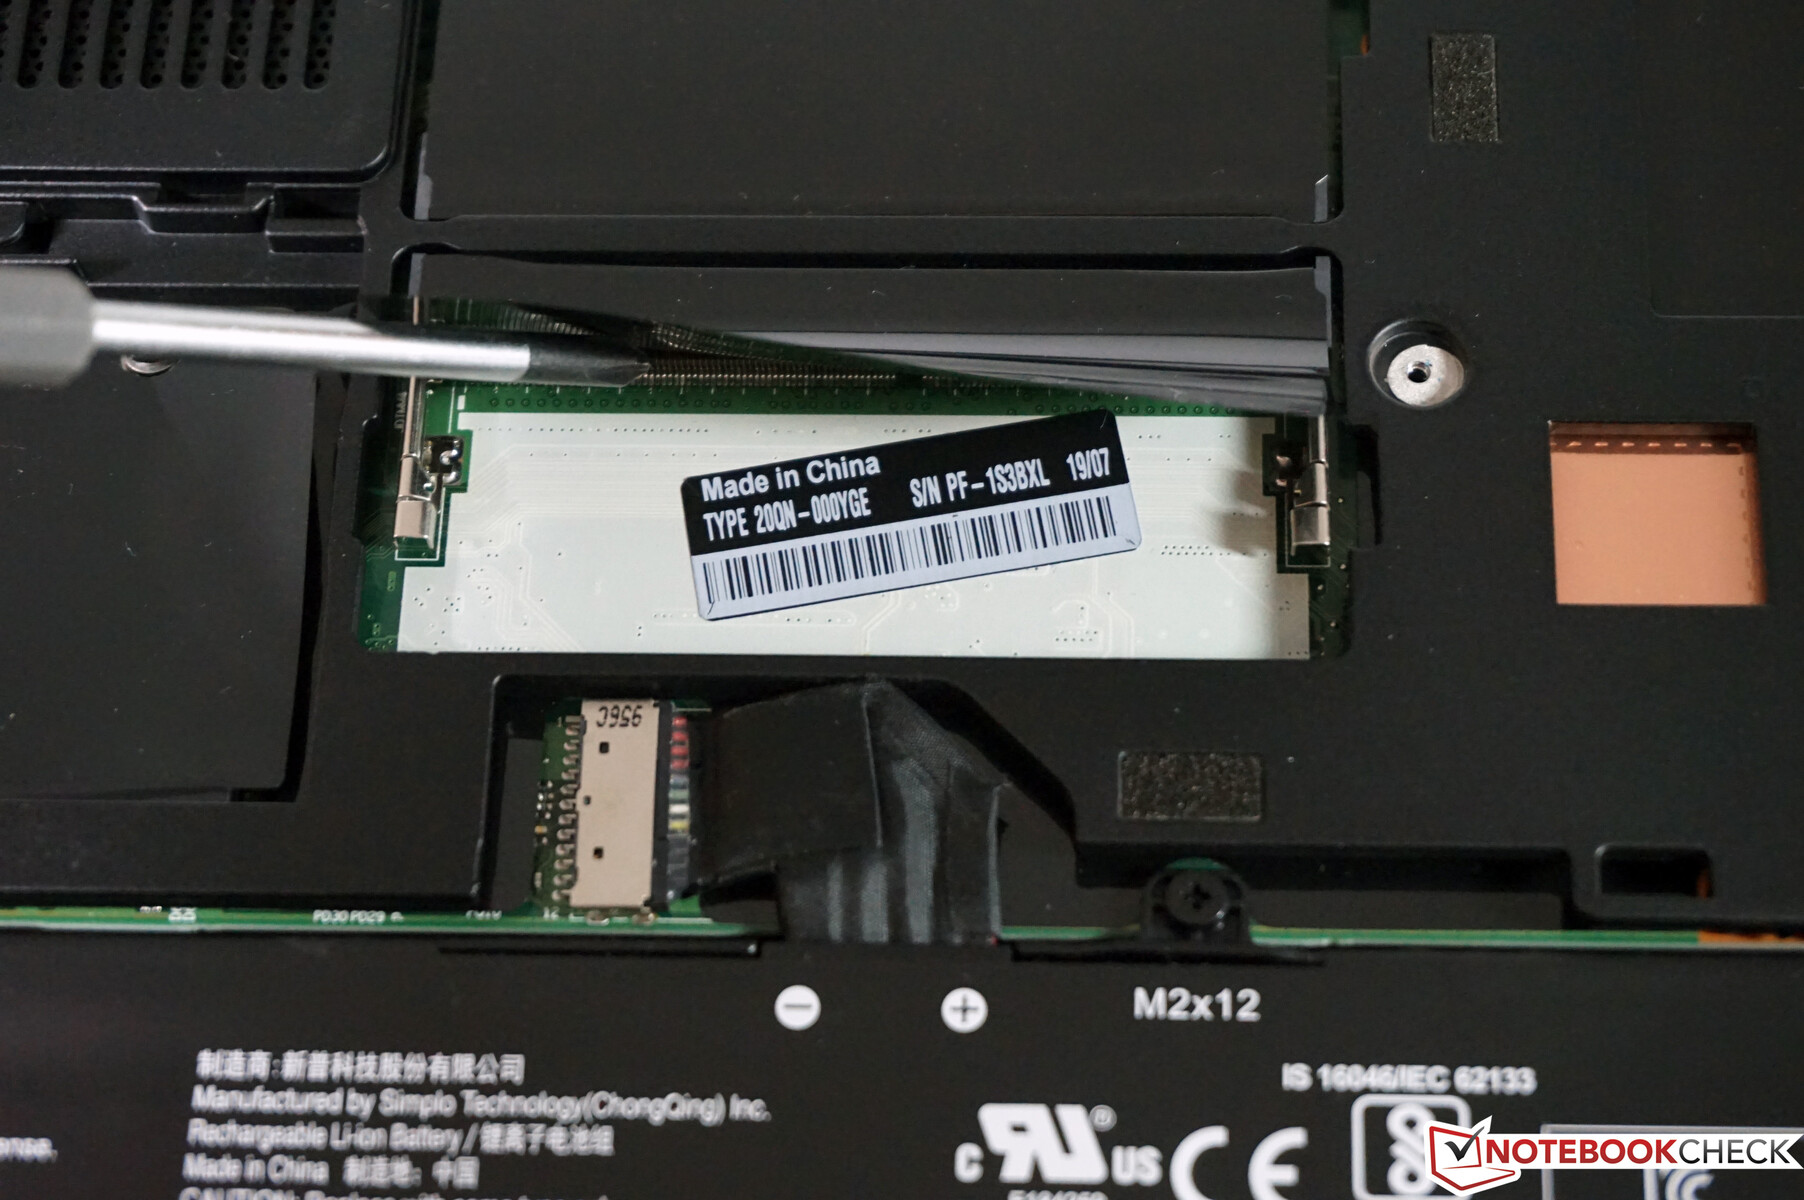
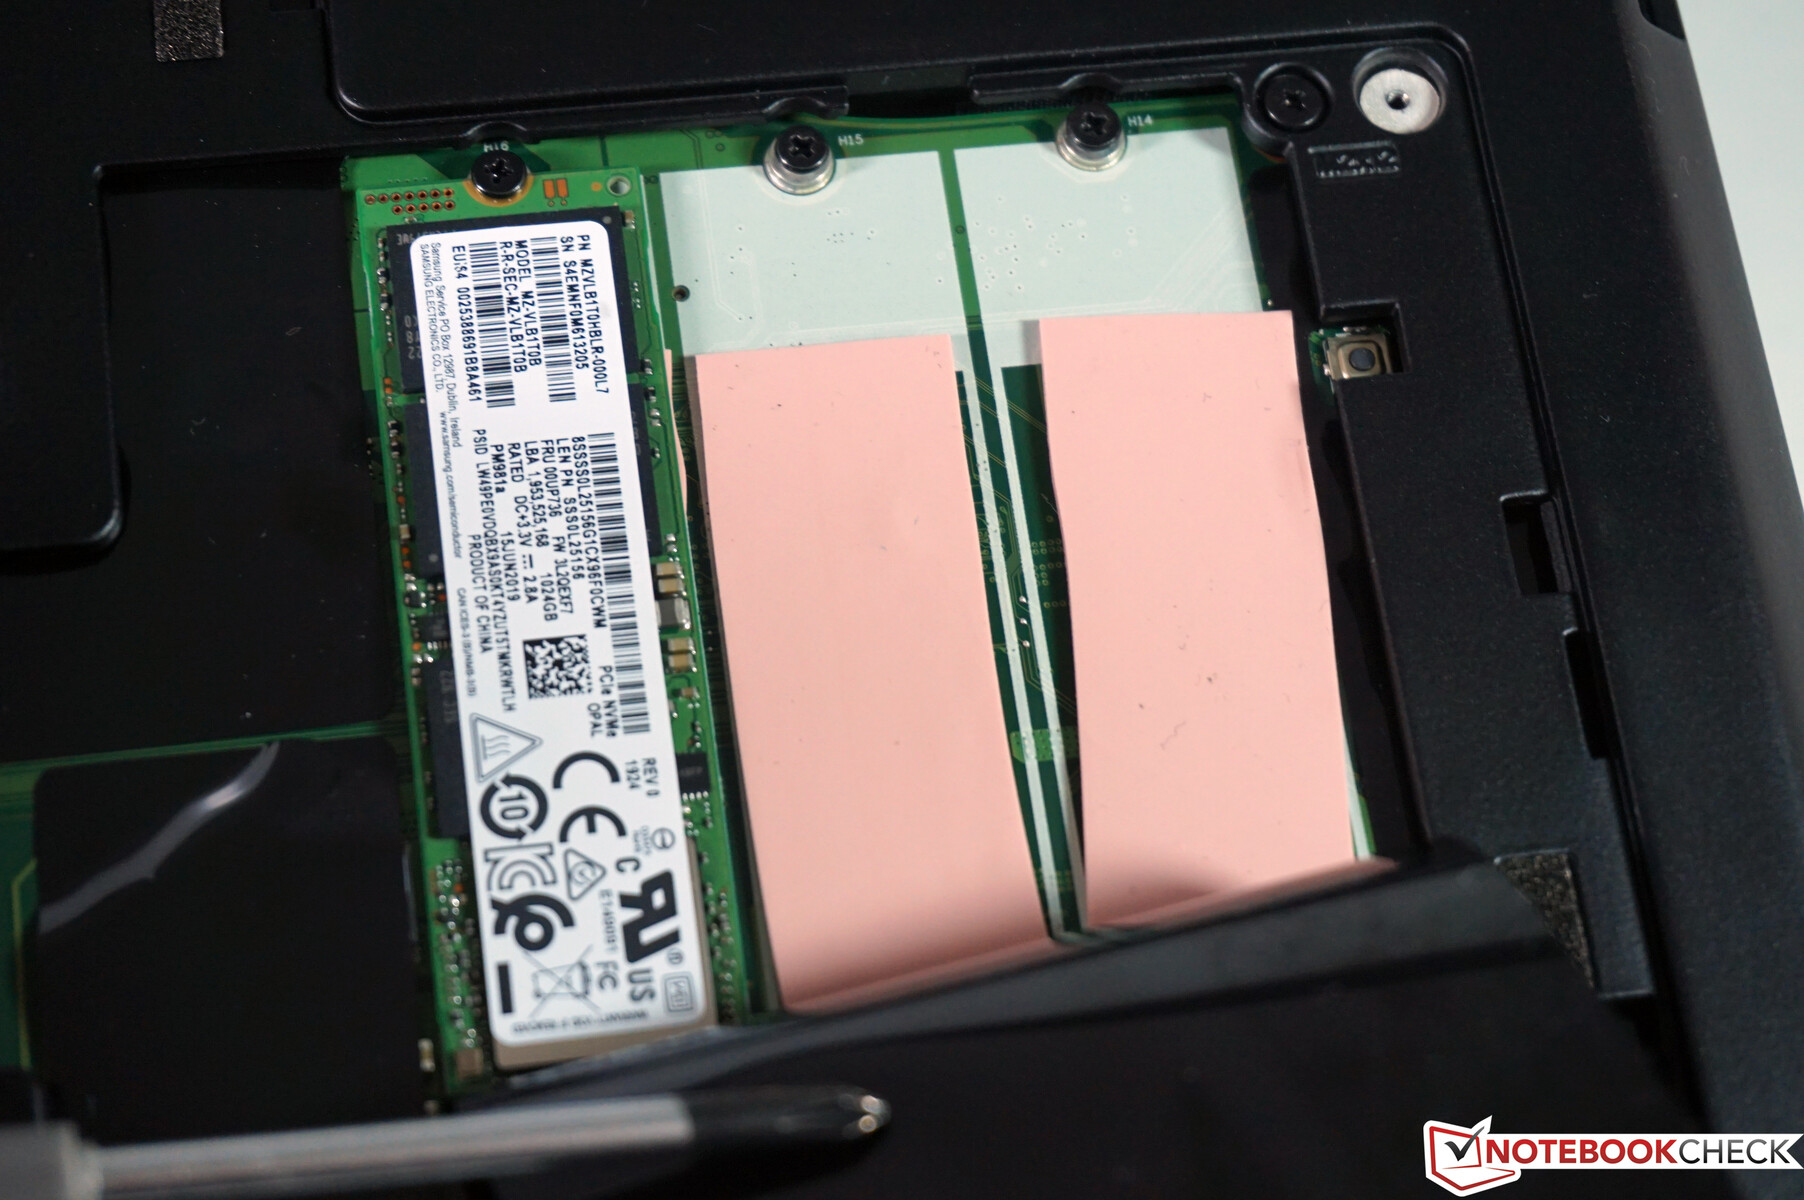
A large maintenance hatch, which is only secured by a few philips screws, is located on the bottom and easily removable. The most important components such as two of the four RAM slots, all three of the M.2-2280 slots, the battery and the communications modules are accessible on the inside. However, our model is not WWAN-ready since the required antennas are missing - we are unsure as to why. Additional disassembly is required to access the other components and taking a look at the hardware maintenance manual of the manufacturer or the service videos, which can be found on the support page of the manufacturer, is recommended.
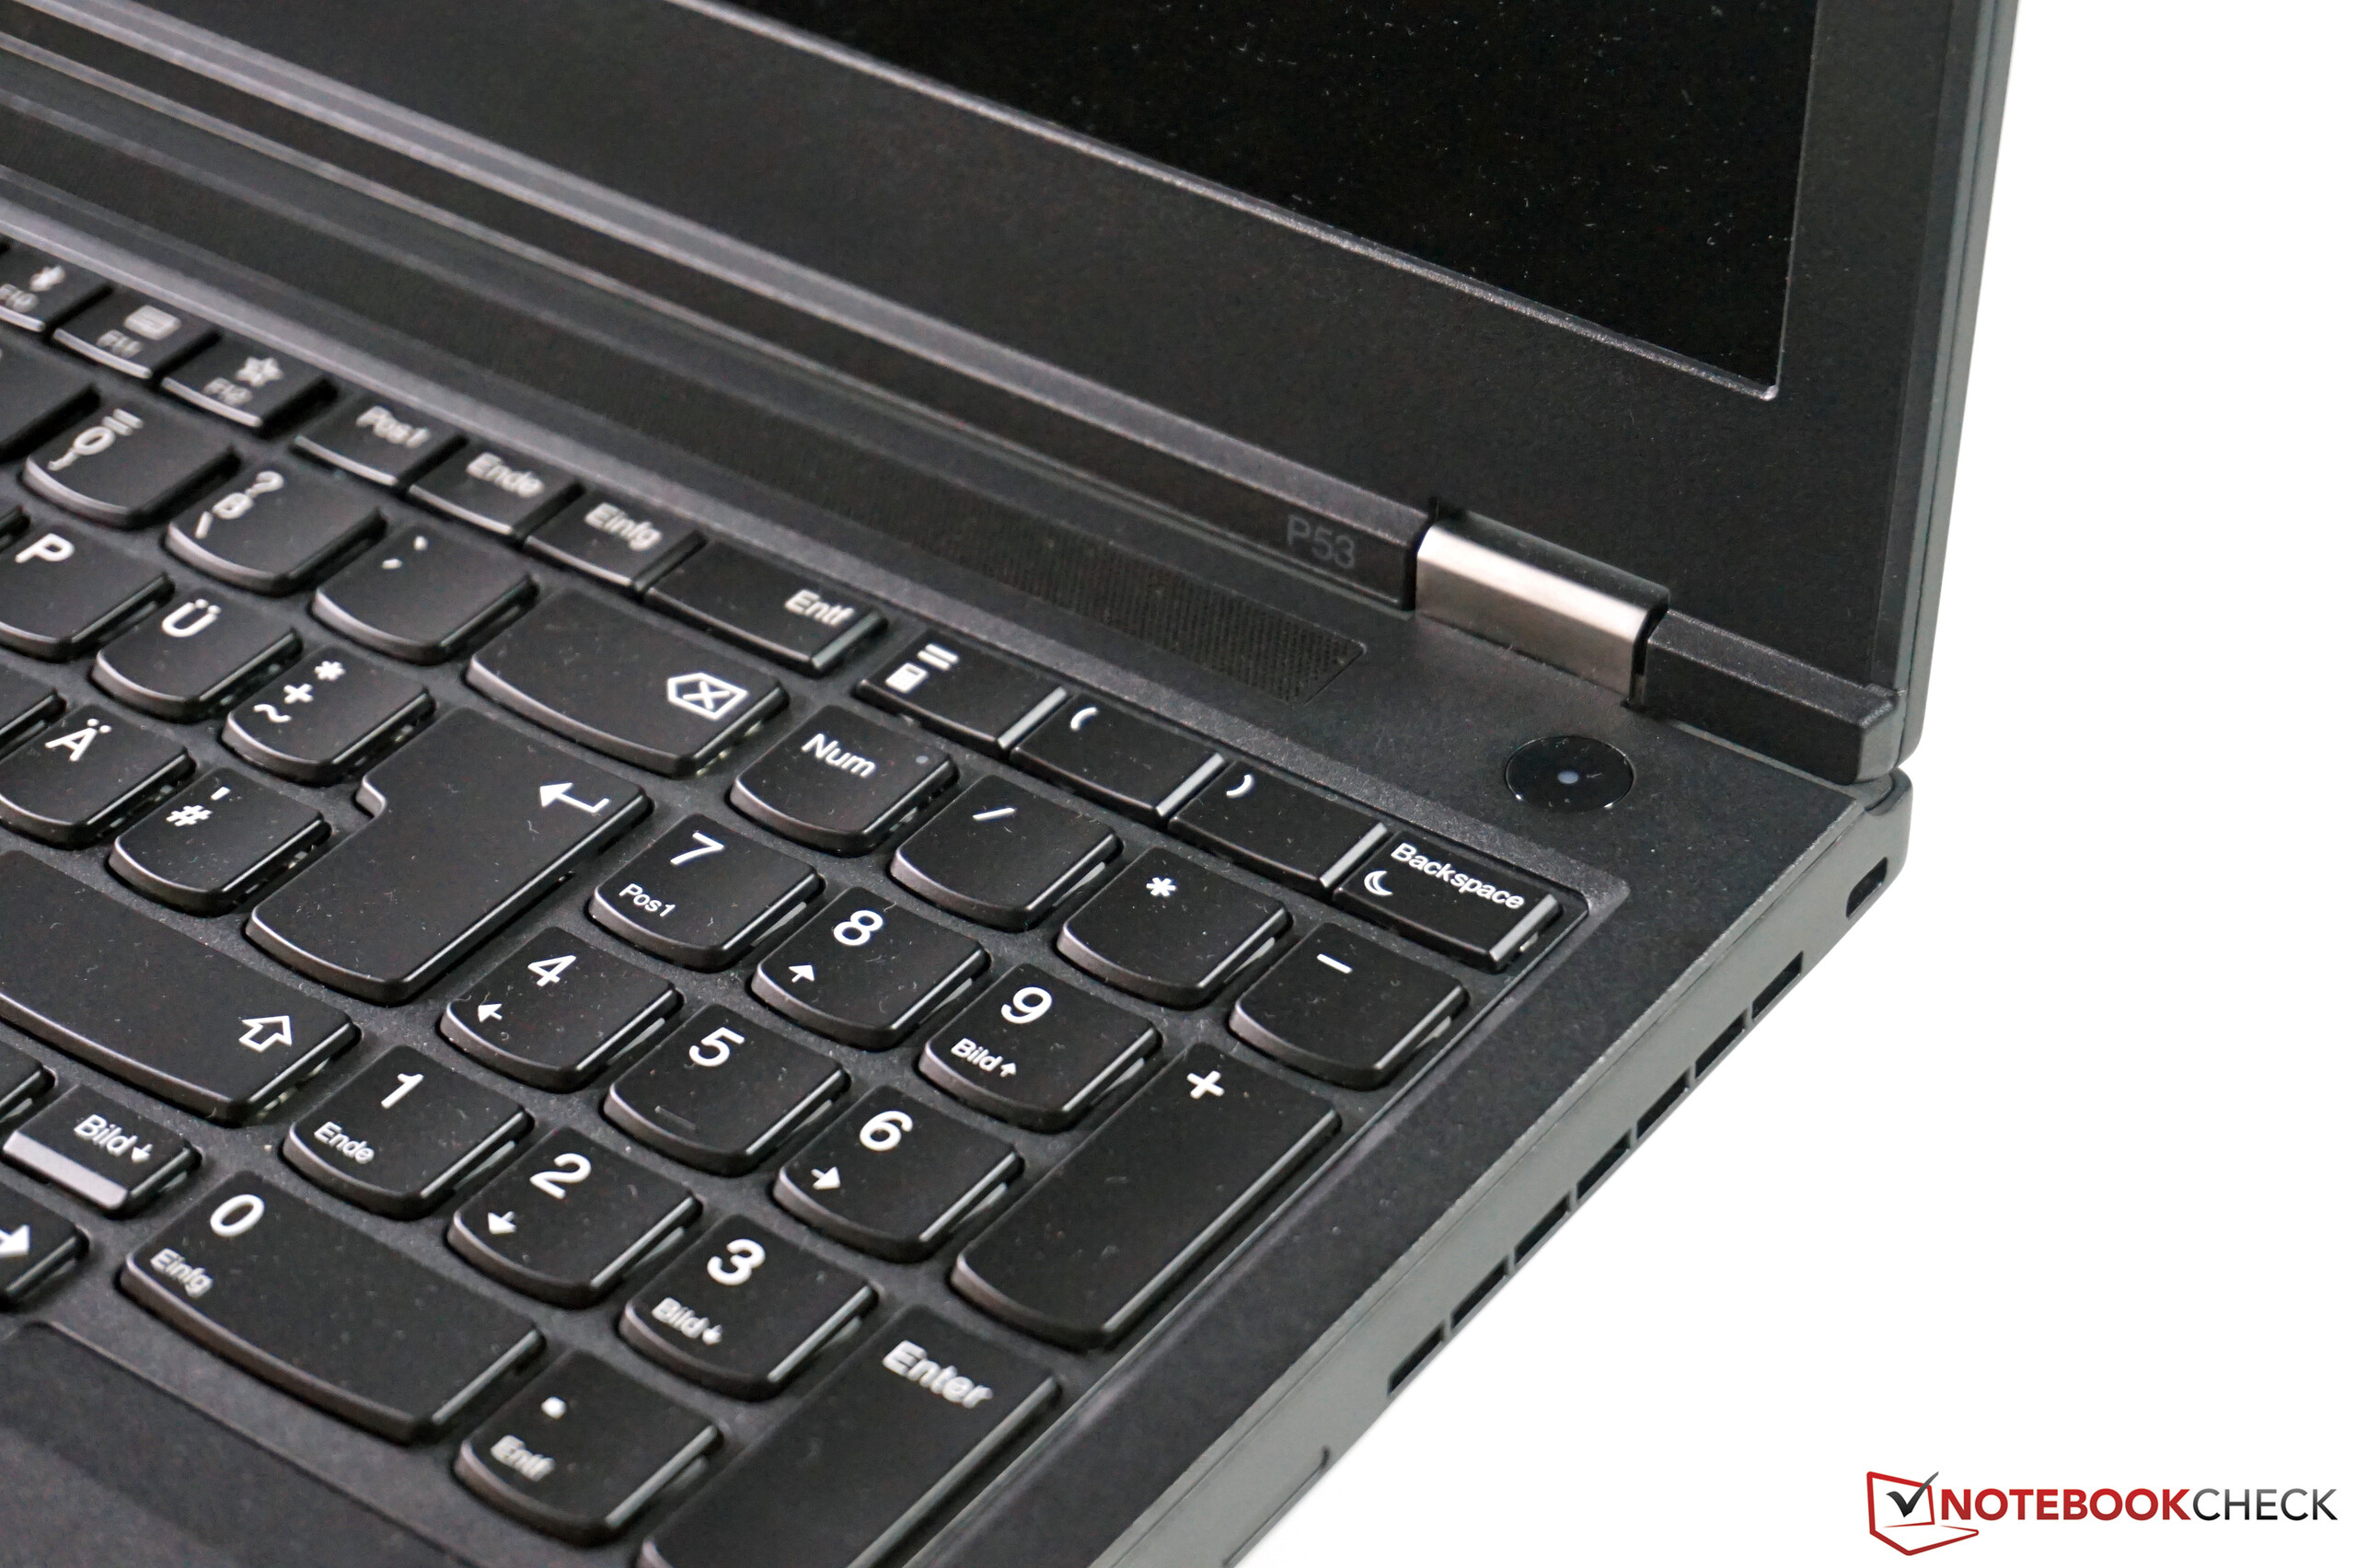
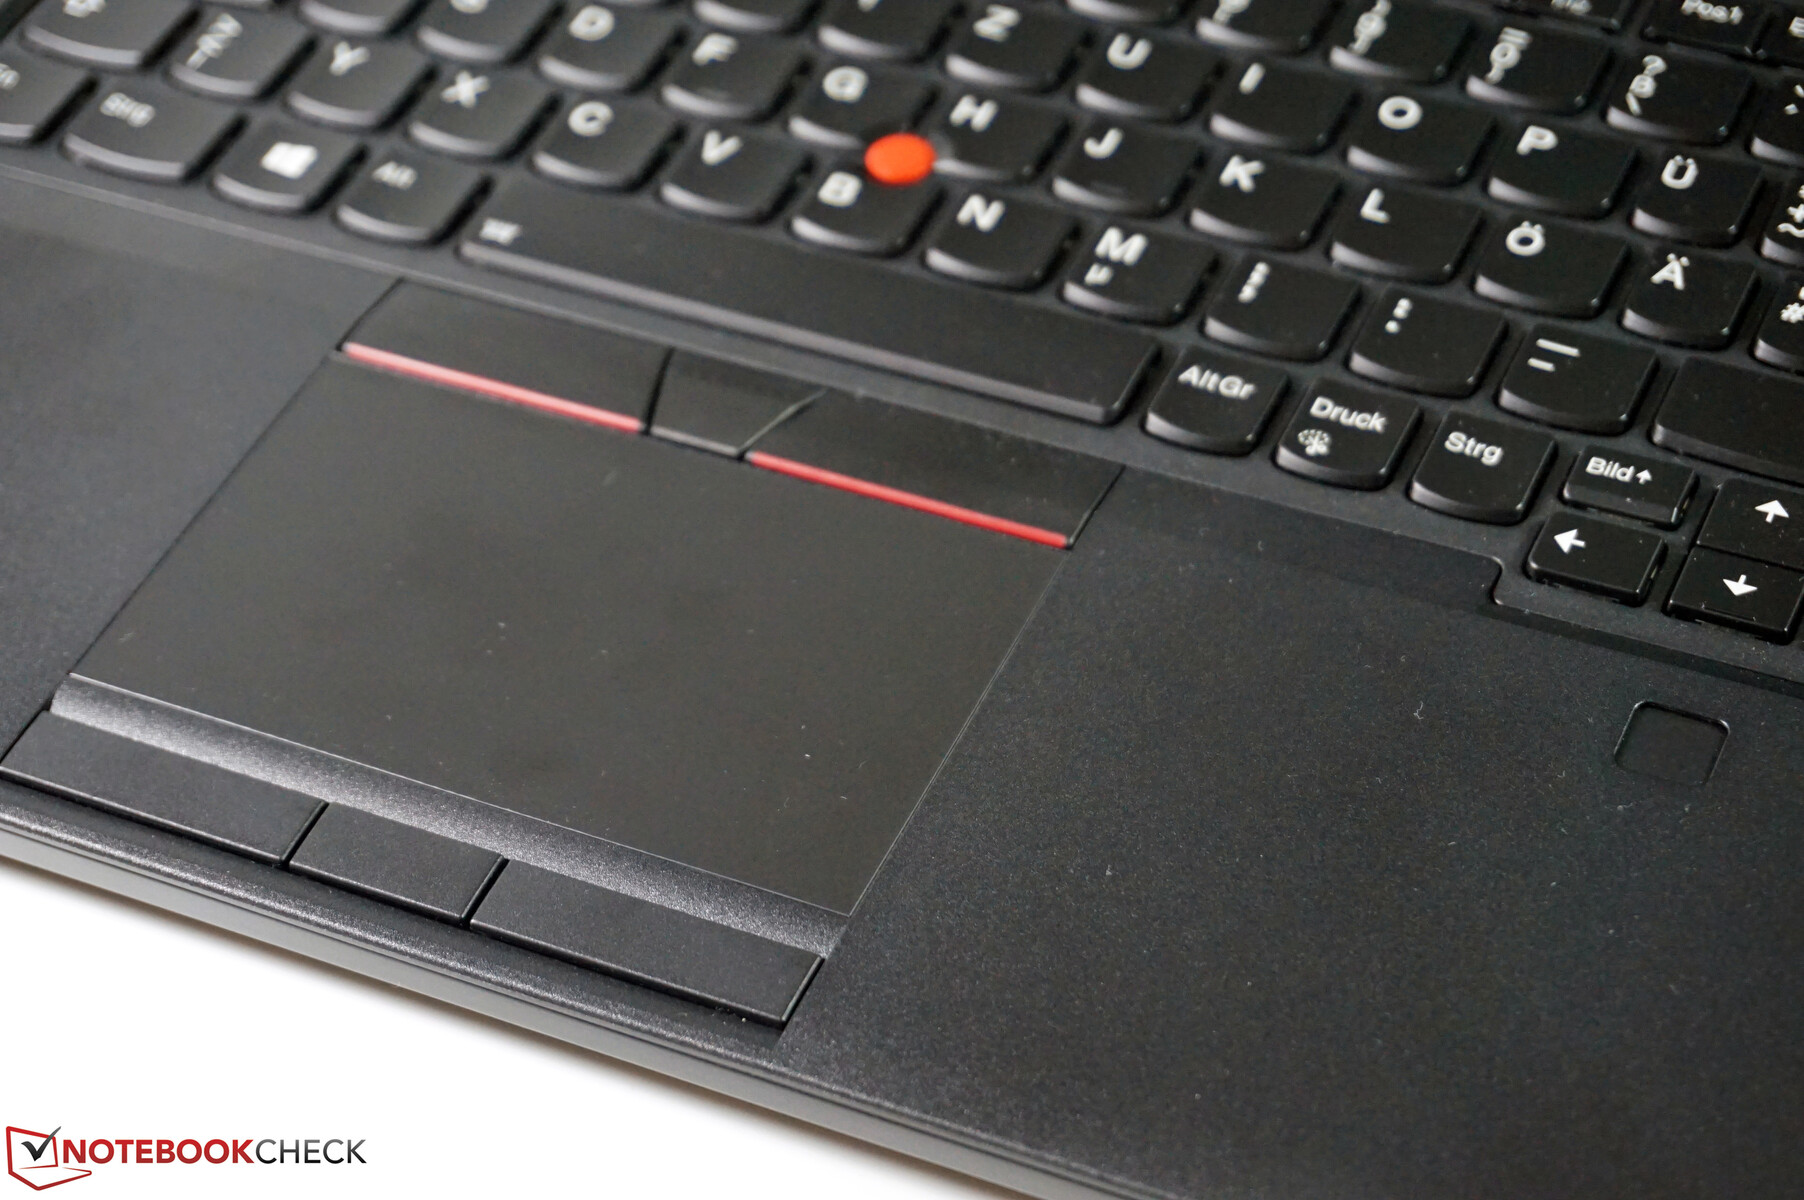
Input Devices – ThinkPad with an Excellent Keyboard
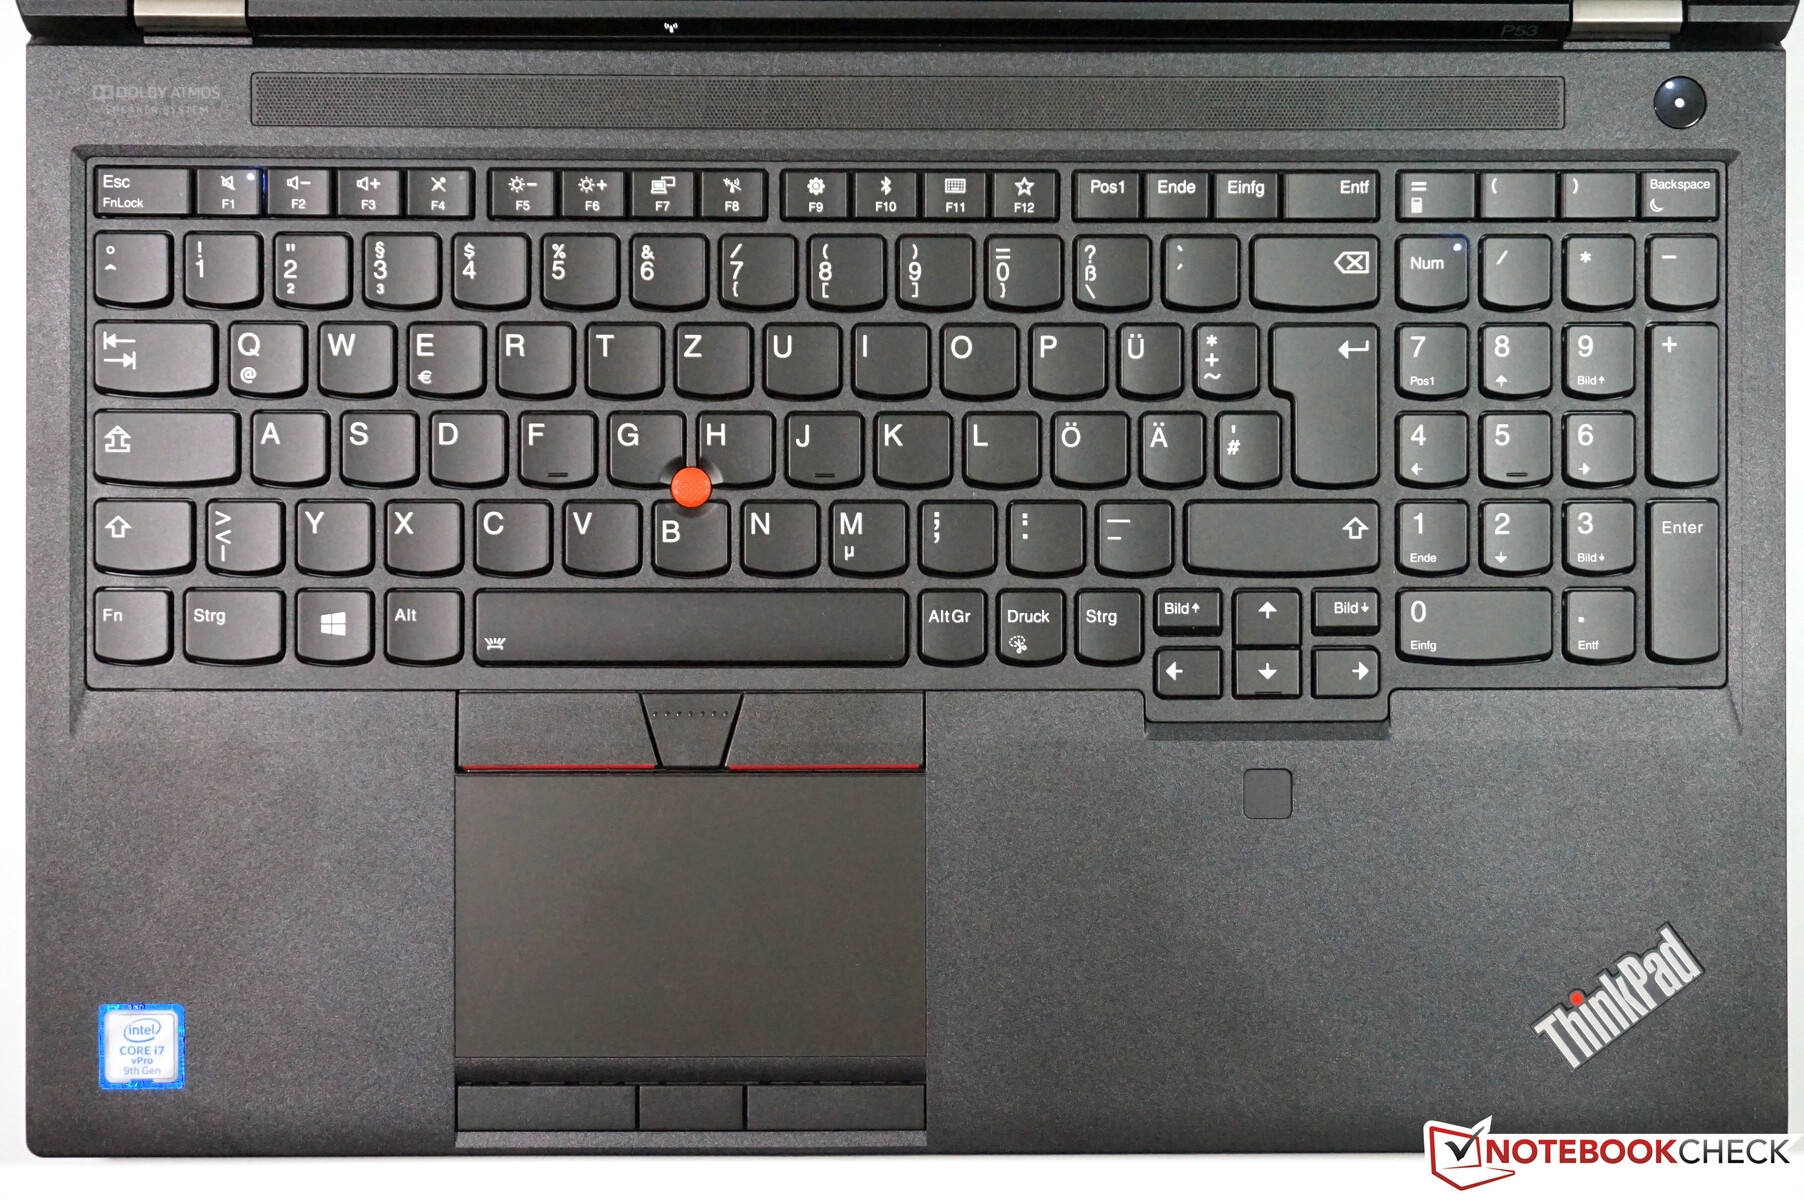
Although the input devices have not received any updates, we have no complaints. The backlit keyboard is one of the best on the market thanks to its long travel and crisp feedback. Moving the cursor using the touchpad with dedicated mouse keys and a (Synaptics) TrackPoint works reliably as well. For more information, please consult our existing review of the predecessor ThinkPad P52.
Display – P53 with Full-HD HDR

There were a few changes in terms of the display and the quality has increased overall compared to the previous year. The base configuration still includes the same Full-HD panel with a brightness level of 300 cd/m² that can also be found on the ThinkPad P52. Additionally, three other panels are available starting this year:
- Full HD HDR 400 (matte, IPS, 500 cd/m², 72% NTSC)
- 4K UHD HDR 400 (matte, IPS, 500 cd/m², 100% NTSC)
- 4K UHD HDR 500 (glossy, OLED, 350-400 cd/m², 100% DCI-P3)
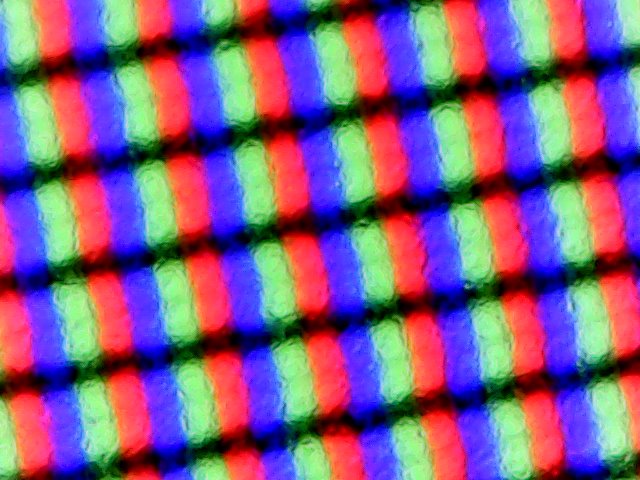
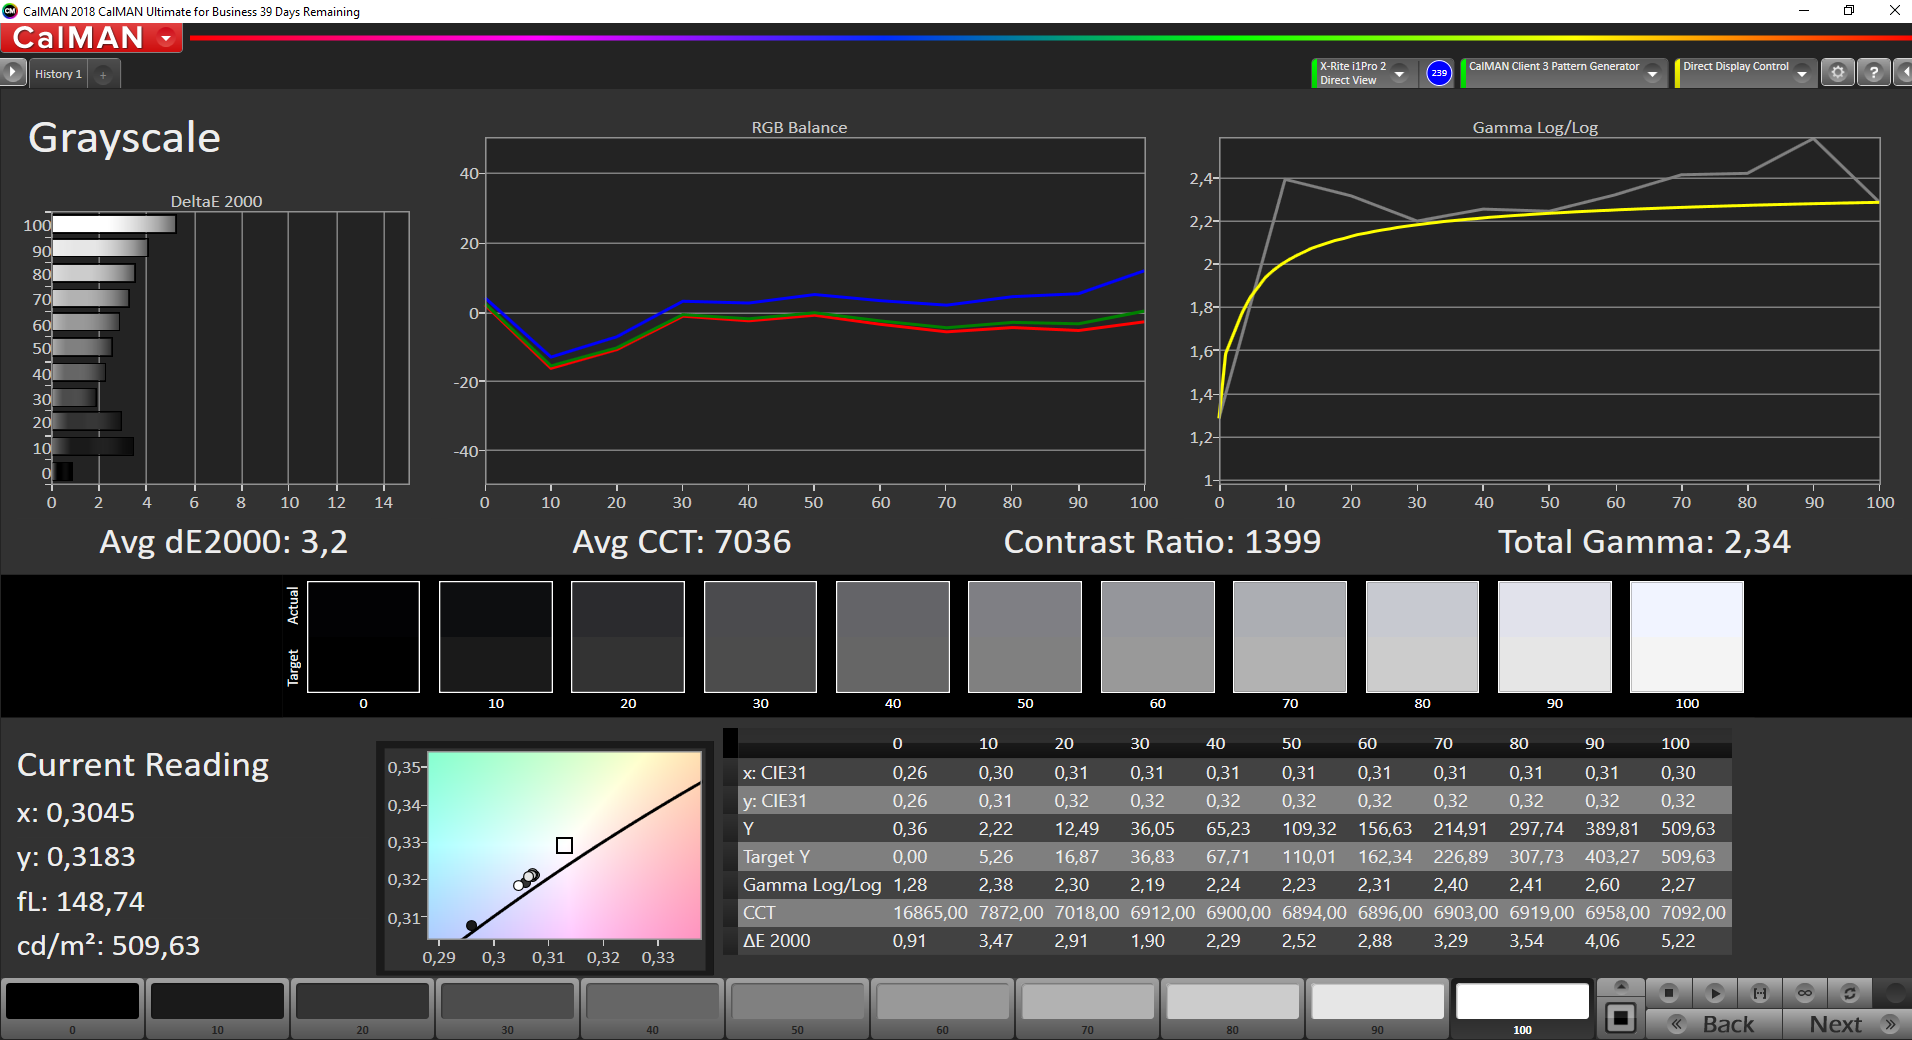
Now, the better Full-HD variant is finally available and installed in our test device. The matte 4K display is now brighter and there is a completely new OLED panel option. Subjectively, the Full-HD screen looks fantastic. In spite of the matte overlay, even bright screen content does not look noticeably grainy. The measurements support the good subjective impressions, even though we were only able to confirm the advertised brightness in the center of the display. The contrast ratio of above 1,400:1 makes for a vivid image.
However, there are two negative aspects: Particularly at maximum brightness, noticeable backlight bleeding can be observed when viewing dark pictures and the brightness levels are not linearly spaced. At 90%, the brightness falls from 510 to just 236 cd/m² and to 149 cd/m² at 80%. Our measurements were also able to confirm backlight flickering at brightness levels of 77% or less. Note that due to its extremely high frequency of 26 kHz, this is not typical PWM.
| |||||||||||||||||||||||||
Brightness Distribution: 89 %
Center on Battery: 490 cd/m²
Contrast: 1417:1 (Black: 0.36 cd/m²)
ΔE ColorChecker Calman: 2.3 | ∀{0.5-29.43 Ø4.82}
calibrated: 1.2
ΔE Greyscale Calman: 3.2 | ∀{0.09-98 Ø5.1}
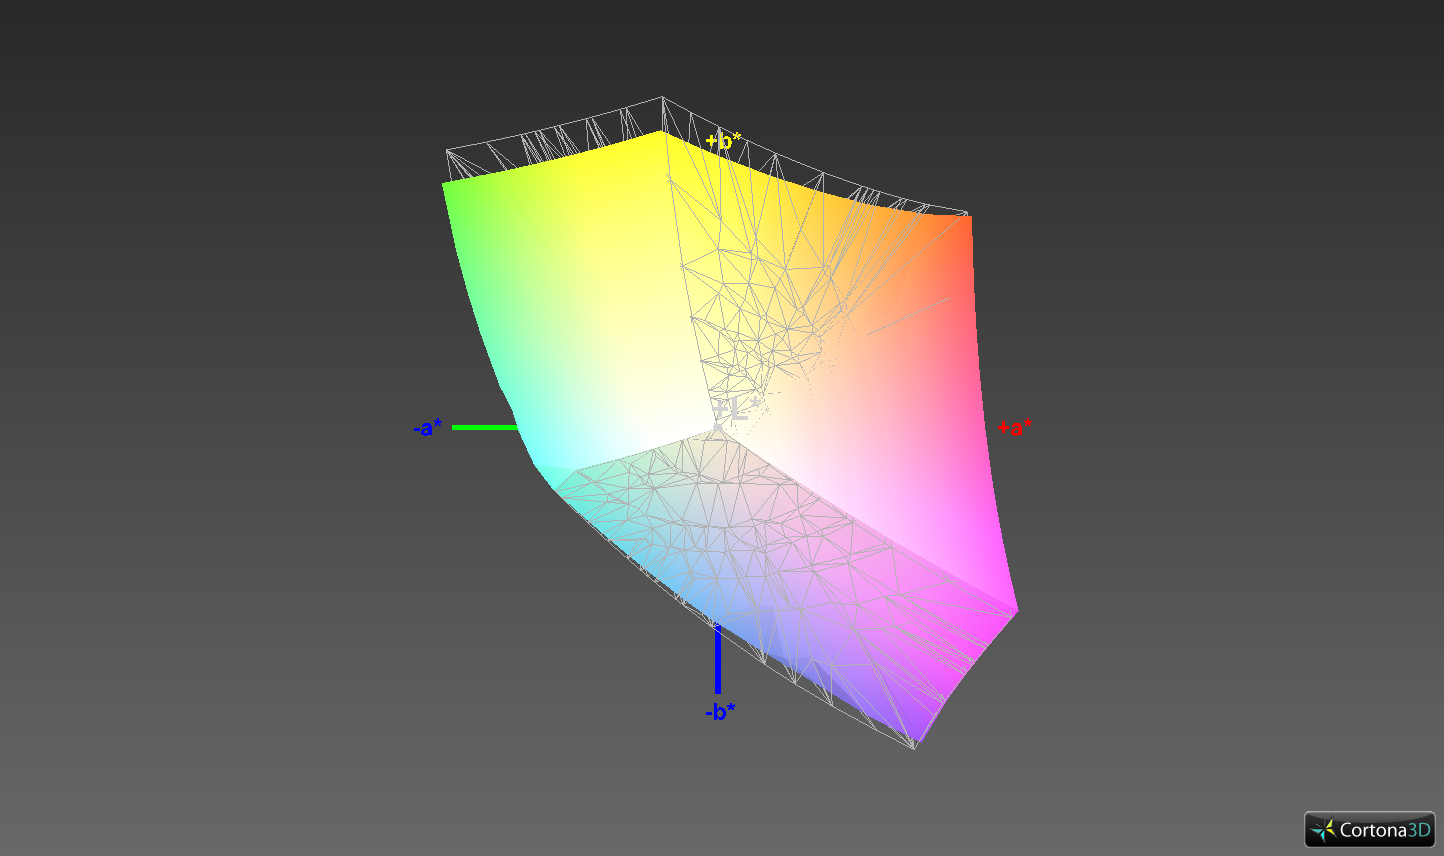
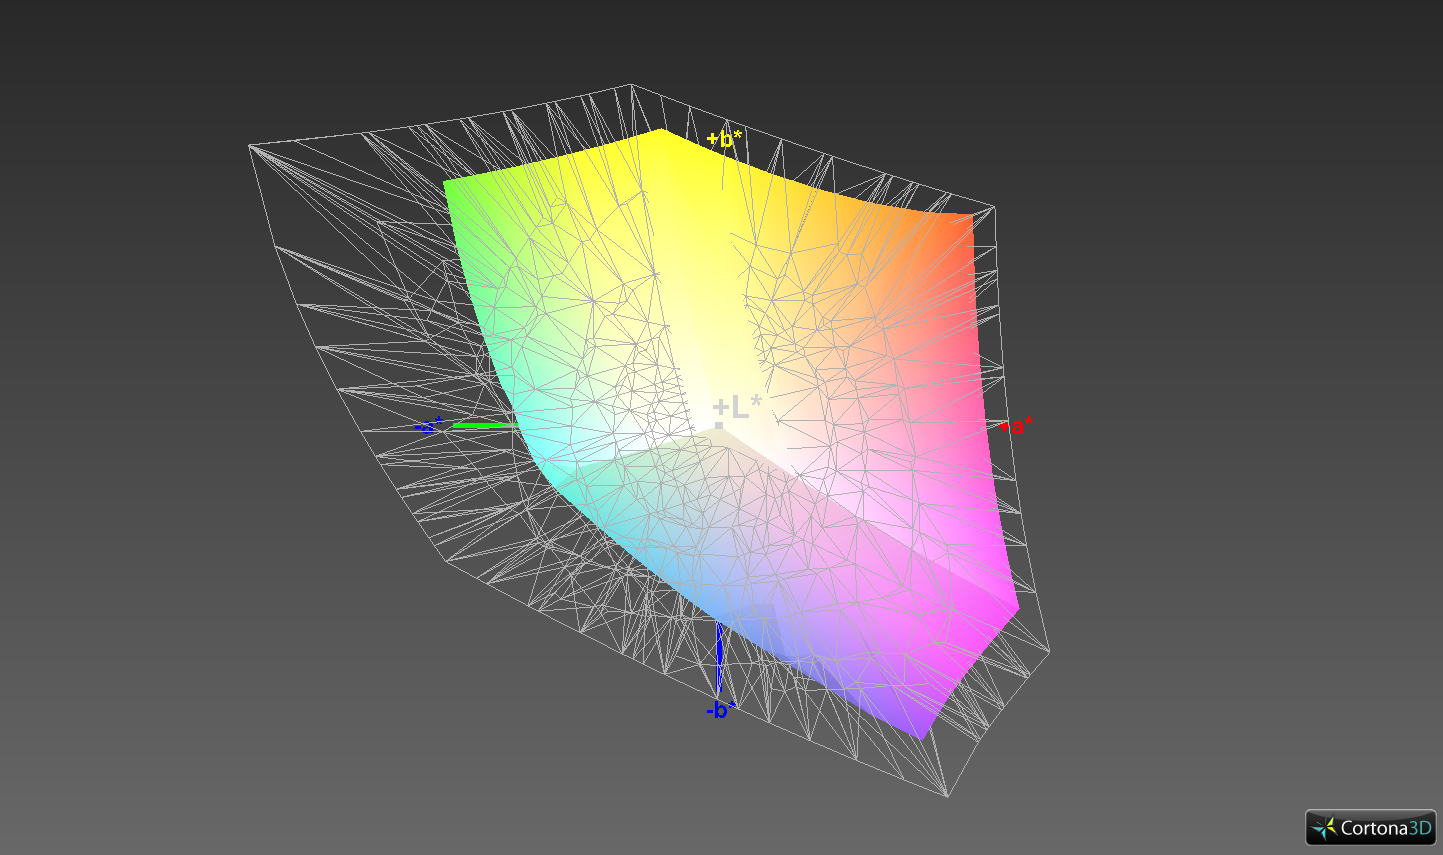
93.1% sRGB (Argyll 1.6.3 3D)
59.4% AdobeRGB 1998 (Argyll 1.6.3 3D)
64.3% AdobeRGB 1998 (Argyll 3D)
92.9% sRGB (Argyll 3D)
63.2% Display P3 (Argyll 3D)
Gamma: 2.34
CCT: 7036 K
| Lenovo ThinkPad P53-20QN000YGE N156HCE-GN1, IPS, 1920x1080, 15.6" | Lenovo ThinkPad P52 20MAS03N00 N156HCE-EN1, IPS LED, 1920x1080, 15.6" | Lenovo ThinkPad P1 2019-20QT000RGE N156HCE-GN1, IPS LED, 1920x1080, 15.6" | Dell Precision 7530 Sharp LQ156D1, IPS, 3840x2160, 15.6" | Fujitsu Celsius H780 LP156WF6-SPP1, IPS LED, 1920x1080, 15.6" | MSI P65 Creator 9SF-657 AU Optronics AUO41EB, IPS, 3840x2160, 15.6" | |
|---|---|---|---|---|---|---|
| Display | 1% | -1% | 29% | -2% | 32% | |
| Display P3 Coverage | 63.2 | 65.6 4% | 62.4 -1% | 82.5 31% | 66.3 5% | 84.4 34% |
| sRGB Coverage | 92.9 | 90.3 -3% | 91.5 -2% | 99.4 7% | 85.9 -8% | 100 8% |
| AdobeRGB 1998 Coverage | 64.3 | 65.9 2% | 63.4 -1% | 96.2 50% | 62.8 -2% | 98.5 53% |
| Response Times | -3% | 27% | 2% | -3% | -28% | |
| Response Time Grey 50% / Grey 80% * | 38.4 ? | 39.2 ? -2% | 34.4 ? 10% | 35.2 ? 8% | 38 ? 1% | 51 ? -33% |
| Response Time Black / White * | 25.2 ? | 26 ? -3% | 14 ? 44% | 26.4 ? -5% | 26.8 ? -6% | 31 ? -23% |
| PWM Frequency | 26040 ? | 25250 ? | 26040 ? | 198.4 ? | 20830 ? | |
| Screen | -34% | -15% | -31% | -36% | -23% | |
| Brightness middle | 510 | 304 -40% | 542 6% | 292.8 -43% | 271 -47% | 445 -13% |
| Brightness | 468 | 293 -37% | 528 13% | 295 -37% | 260 -44% | 462 -1% |
| Brightness Distribution | 89 | 88 -1% | 84 -6% | 85 -4% | 86 -3% | 83 -7% |
| Black Level * | 0.36 | 0.26 28% | 0.41 -14% | 0.36 -0% | 0.29 19% | 0.5 -39% |
| Contrast | 1417 | 1169 -18% | 1322 -7% | 813 -43% | 934 -34% | 890 -37% |
| Colorchecker dE 2000 * | 2.3 | 4.5 -96% | 3.5 -52% | 3.48 -51% | 3.9 -70% | 4.75 -107% |
| Colorchecker dE 2000 max. * | 5.5 | 7.7 -40% | 7.8 -42% | 6.81 -24% | 10.2 -85% | 7.79 -42% |
| Colorchecker dE 2000 calibrated * | 1.2 | 2.4 -100% | 1.3 -8% | 3.13 -161% | 2.9 -142% | |
| Greyscale dE 2000 * | 3.2 | 5.2 -63% | 4.8 -50% | 4.1 -28% | 2.6 19% | 4.49 -40% |
| Gamma | 2.34 94% | 2.26 97% | 2.33 94% | 2.2 100% | 2.29 96% | 2.49 88% |
| CCT | 7036 92% | 6789 96% | 7690 85% | 6740 96% | 6517 100% | 7374 88% |
| Color Space (Percent of AdobeRGB 1998) | 59.4 | 53.8 -9% | 58.8 -1% | 84.4 42% | 56.1 -6% | 87 46% |
| Color Space (Percent of sRGB) | 93.1 | 90.1 -3% | 91.1 -2% | 99.6 7% | 85.8 -8% | 100 7% |
| Total Average (Program / Settings) | -12% /
-24% | 4% /
-7% | 0% /
-16% | -14% /
-26% | -6% /
-13% |
* ... smaller is better
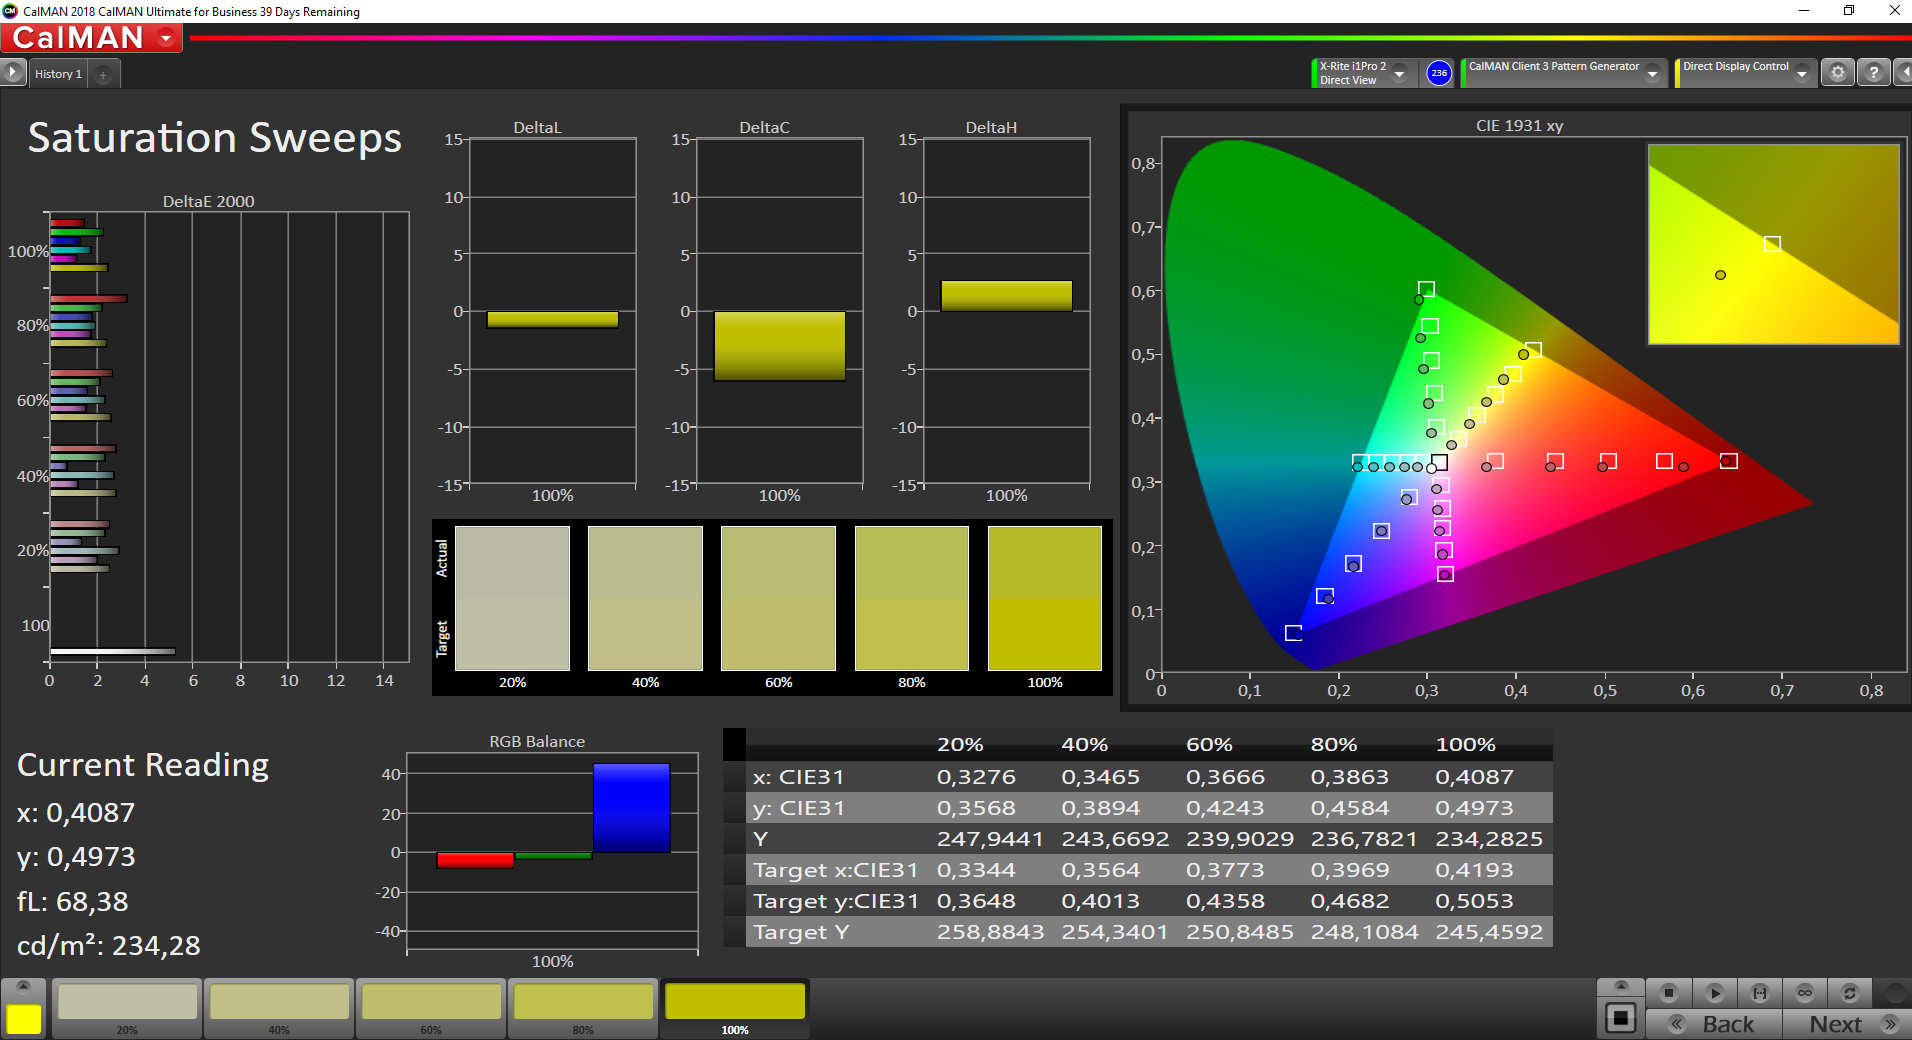
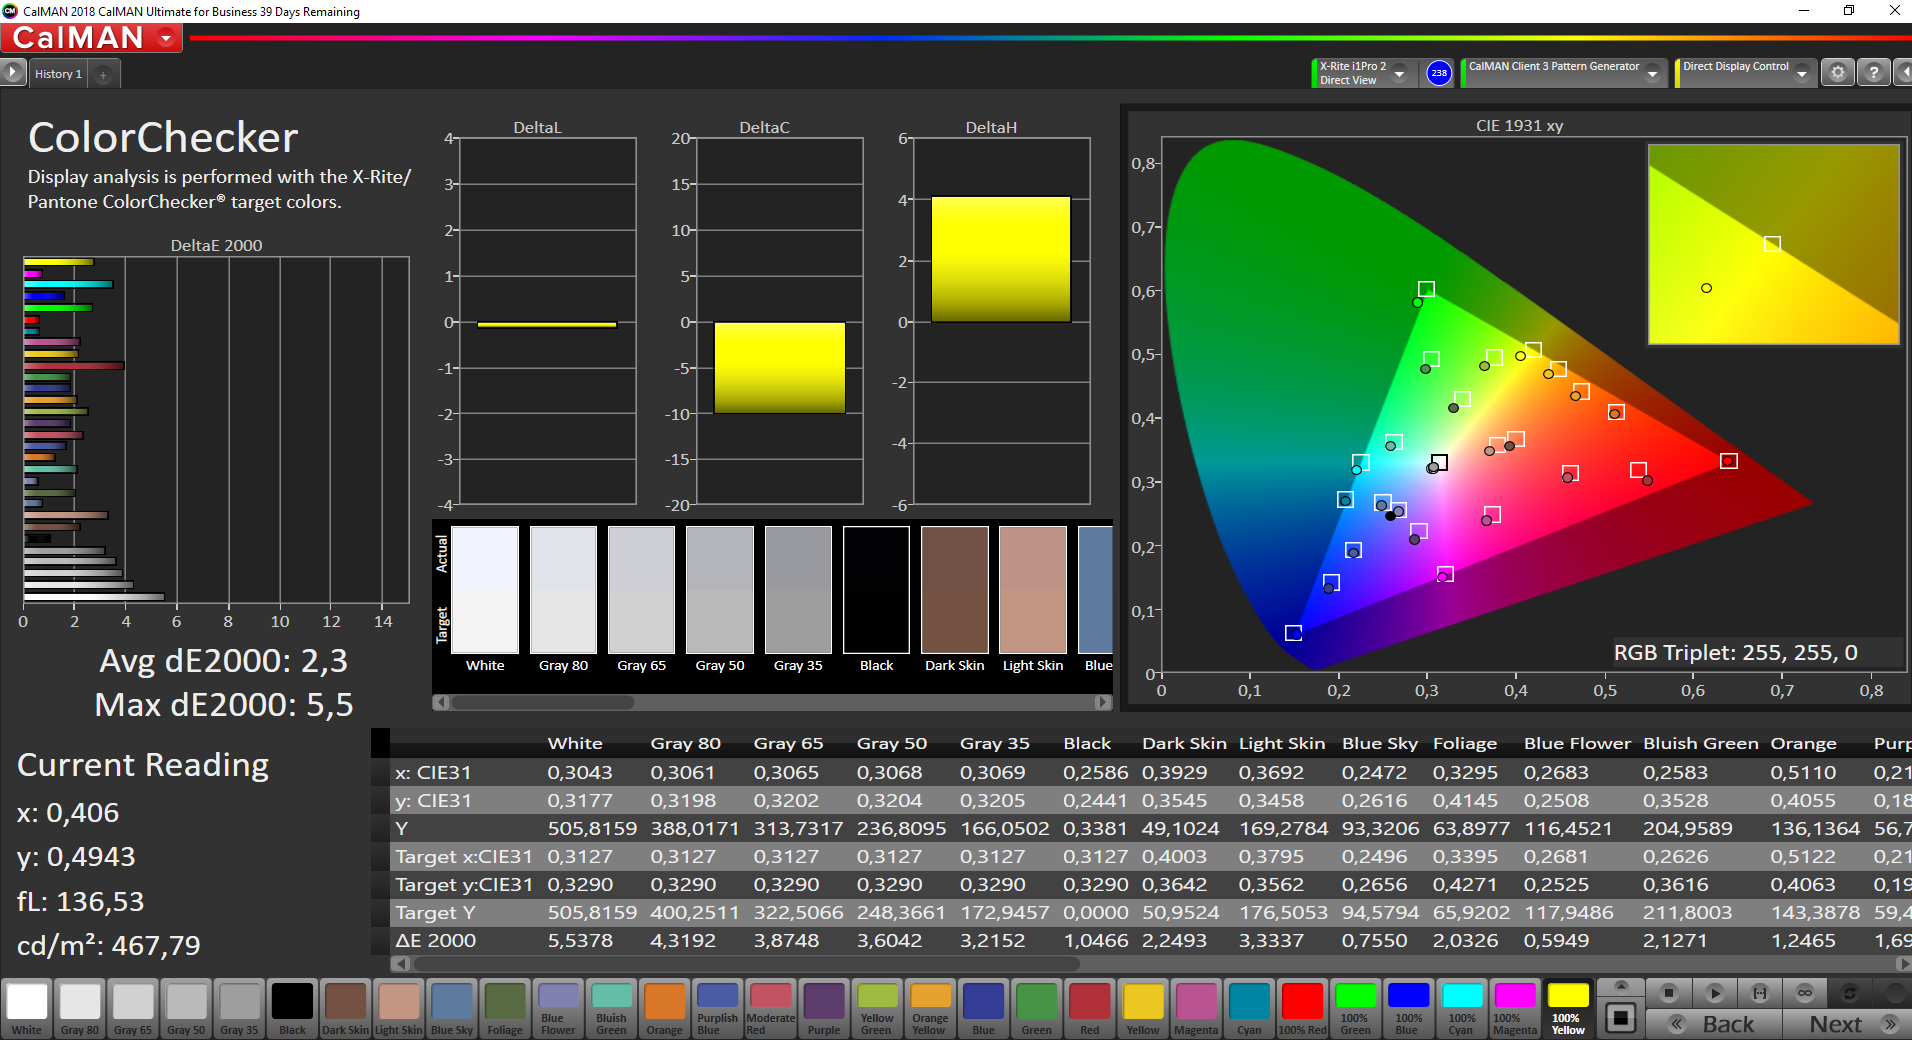
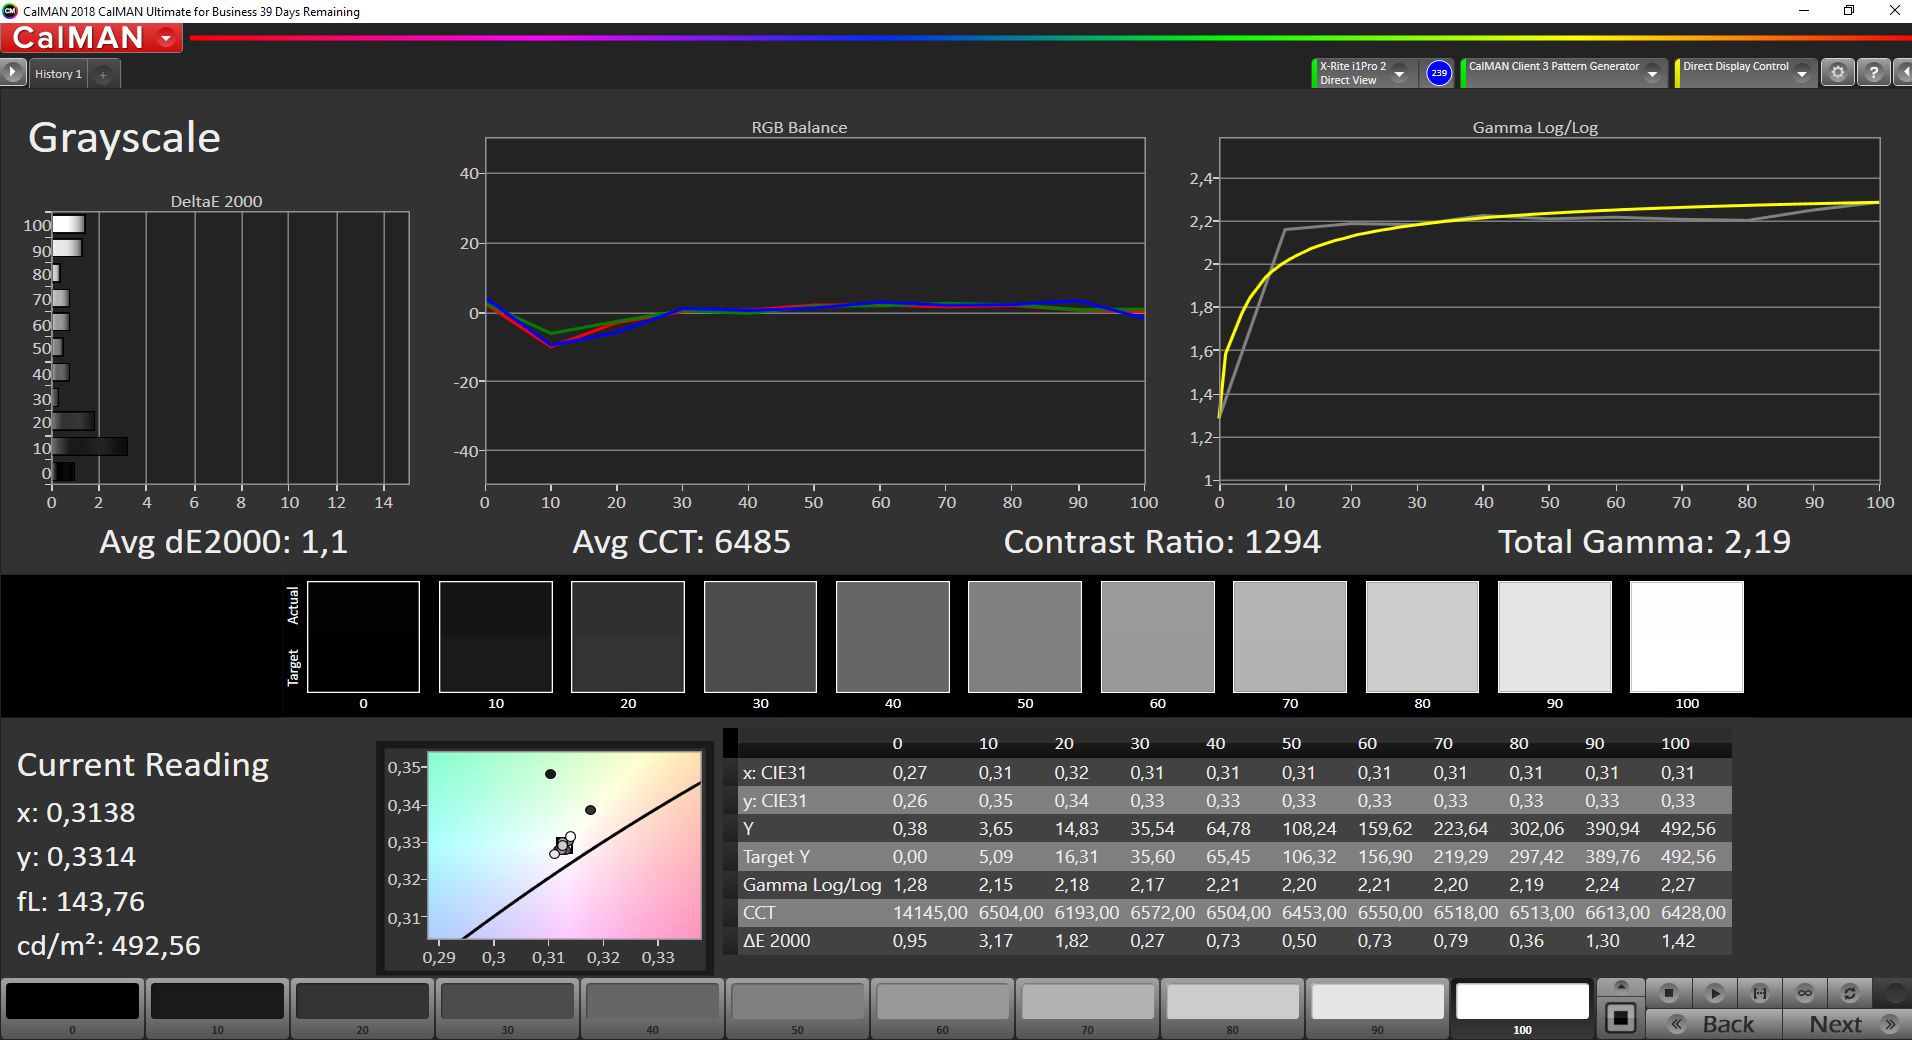
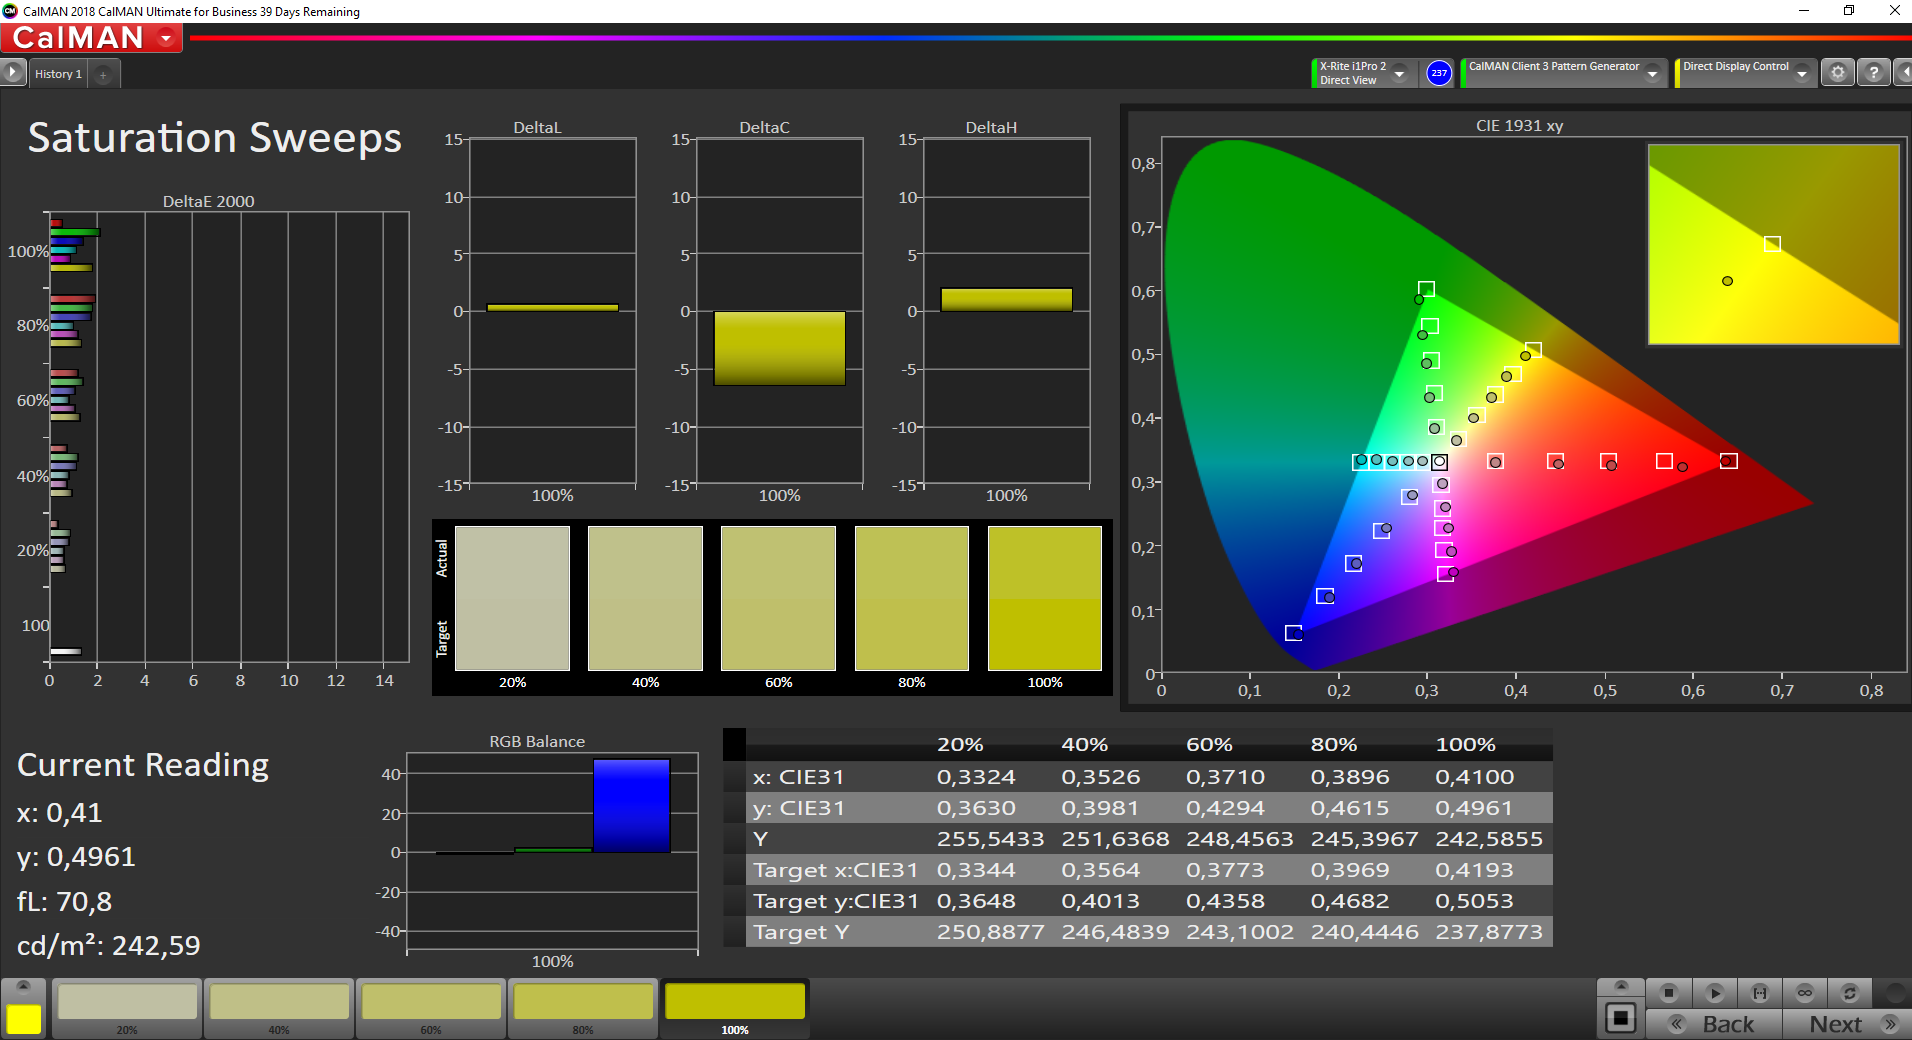
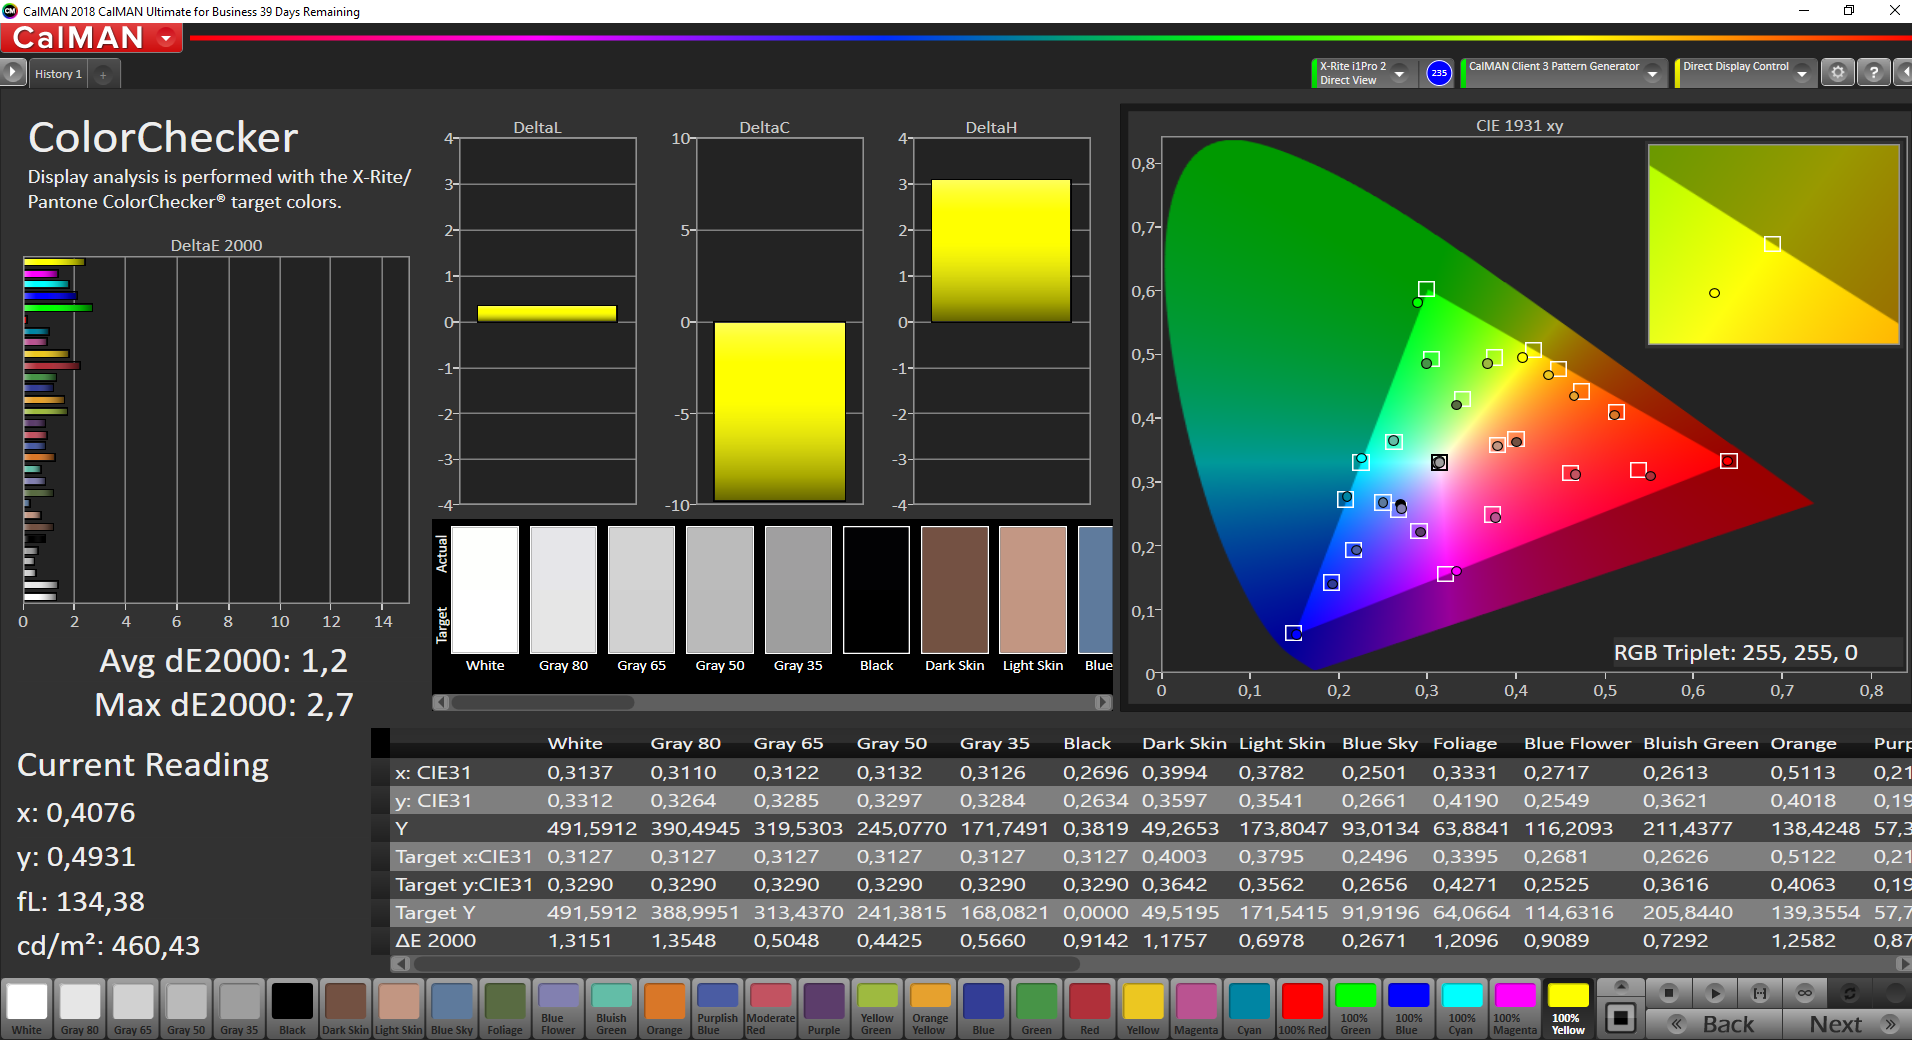
The color temperature is slightly too cool ex-factory, causing a slight blue tint that can be remedied with a calibration (we used an i1 Pro 2). That said, the colors and grayscale are decent, even without a calibration. However, in order to achieve maximum color accuracy, users should still calibrate the panel. While photo editing is possible, there are better options due to the incomplete sRGB coverage.
Display Response Times
| ↔ Response Time Black to White | ||
|---|---|---|
| 25.2 ms ... rise ↗ and fall ↘ combined | ↗ 15.2 ms rise | 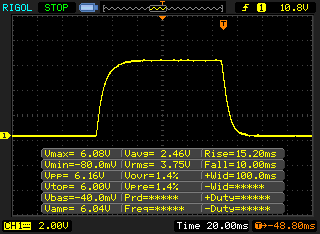 |
| ↘ 10 ms fall | ||
| The screen shows relatively slow response rates in our tests and may be too slow for gamers. In comparison, all tested devices range from 0.1 (minimum) to 240 (maximum) ms. » 59 % of all devices are better. This means that the measured response time is worse than the average of all tested devices (20.5 ms). | ||
| ↔ Response Time 50% Grey to 80% Grey | ||
| 38.4 ms ... rise ↗ and fall ↘ combined | ↗ 18.8 ms rise | 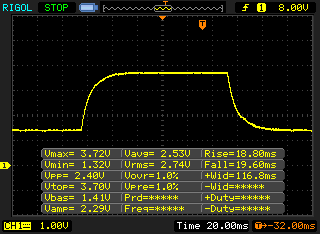 |
| ↘ 19.6 ms fall | ||
| The screen shows slow response rates in our tests and will be unsatisfactory for gamers. In comparison, all tested devices range from 0.165 (minimum) to 636 (maximum) ms. » 56 % of all devices are better. This means that the measured response time is worse than the average of all tested devices (32 ms). | ||
Screen Flickering / PWM (Pulse-Width Modulation)
| Screen flickering / PWM detected | 26040 Hz | ≤ 77 % brightness setting | 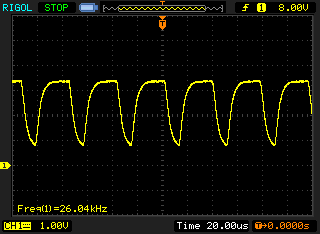 |
The display backlight flickers at 26040 Hz (worst case, e.g., utilizing PWM) Flickering detected at a brightness setting of 77 % and below. There should be no flickering or PWM above this brightness setting. The frequency of 26040 Hz is quite high, so most users sensitive to PWM should not notice any flickering. In comparison: 53 % of all tested devices do not use PWM to dim the display. If PWM was detected, an average of 8323 (minimum: 5 - maximum: 343500) Hz was measured. | |||
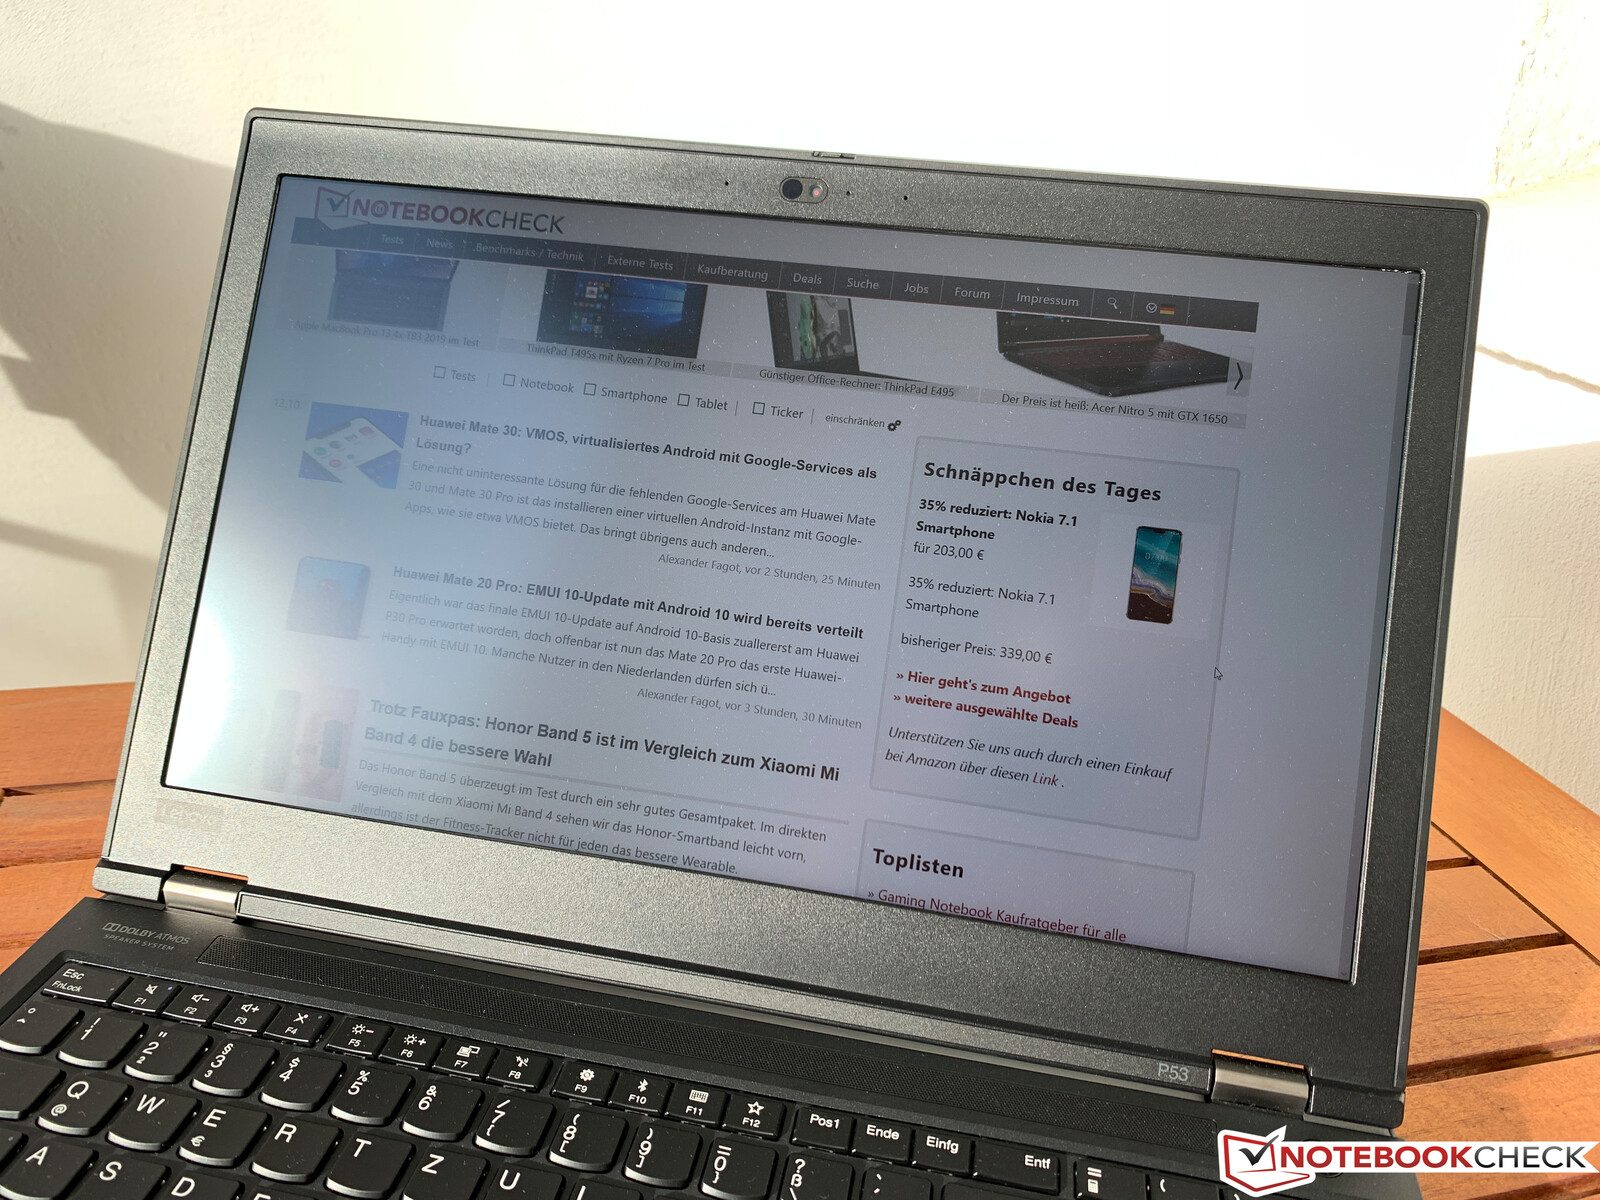
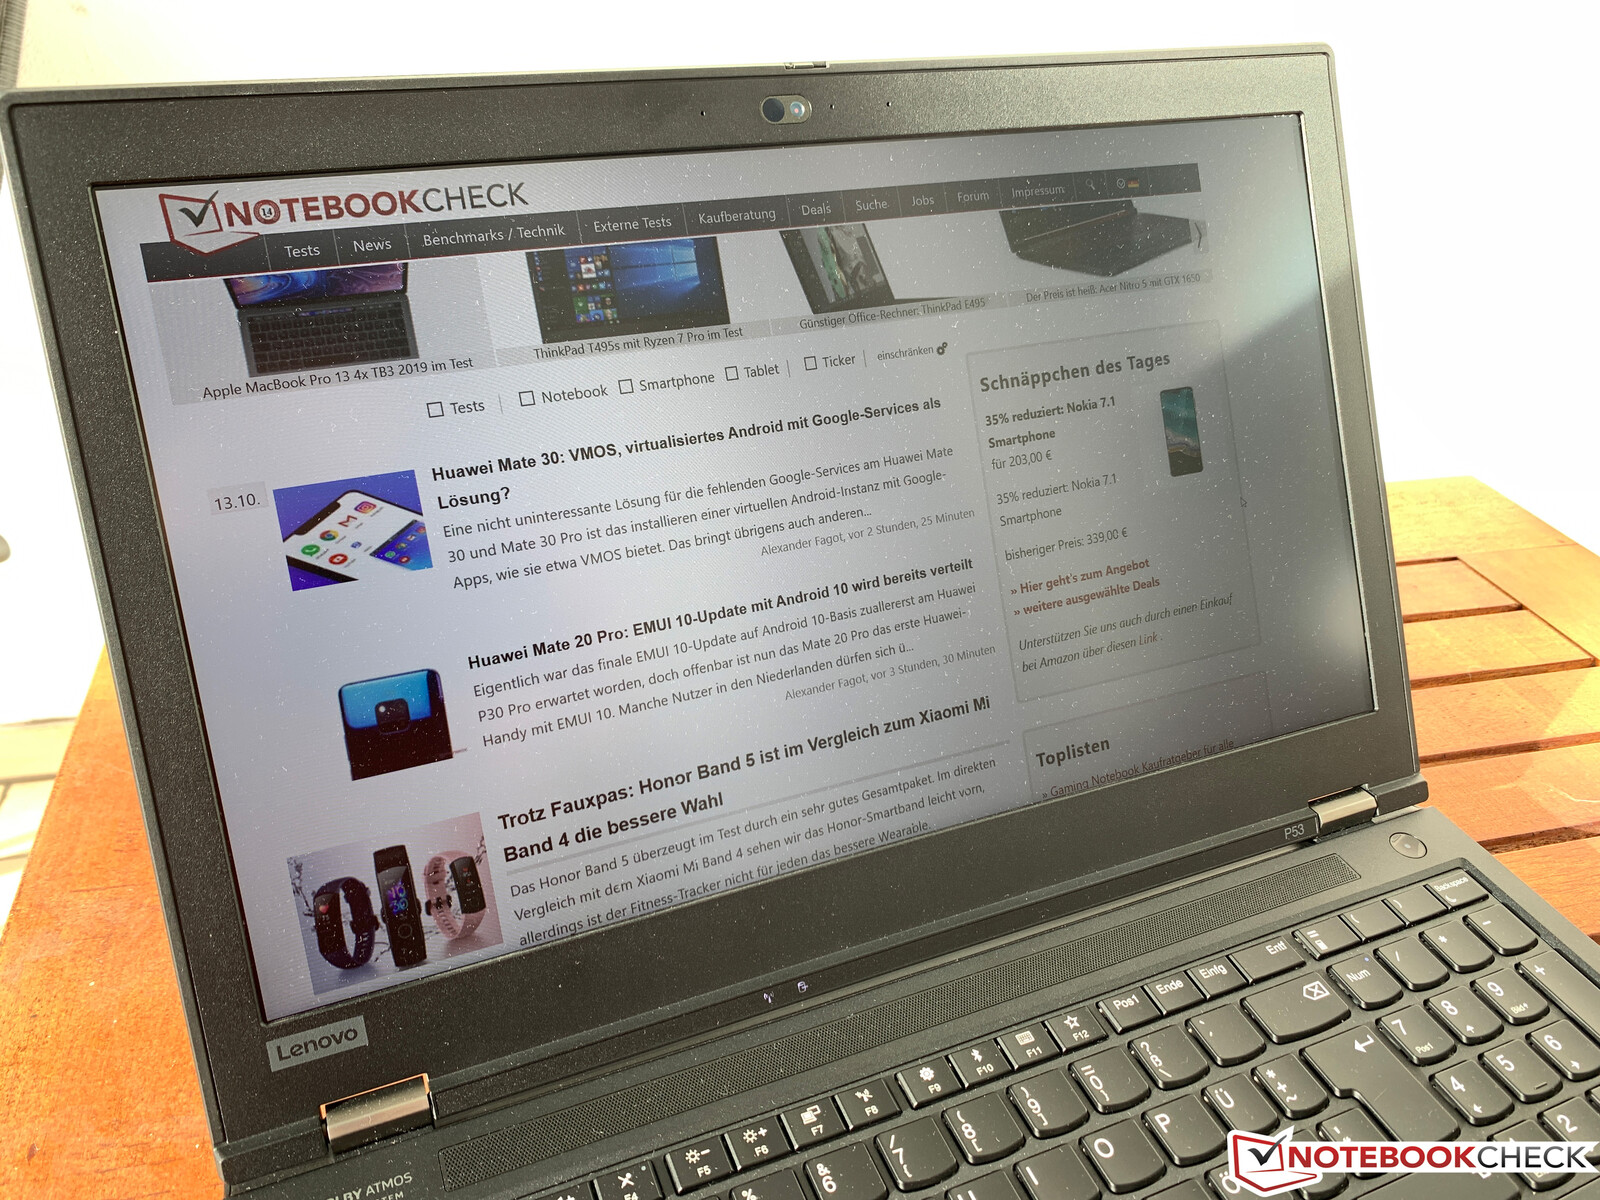
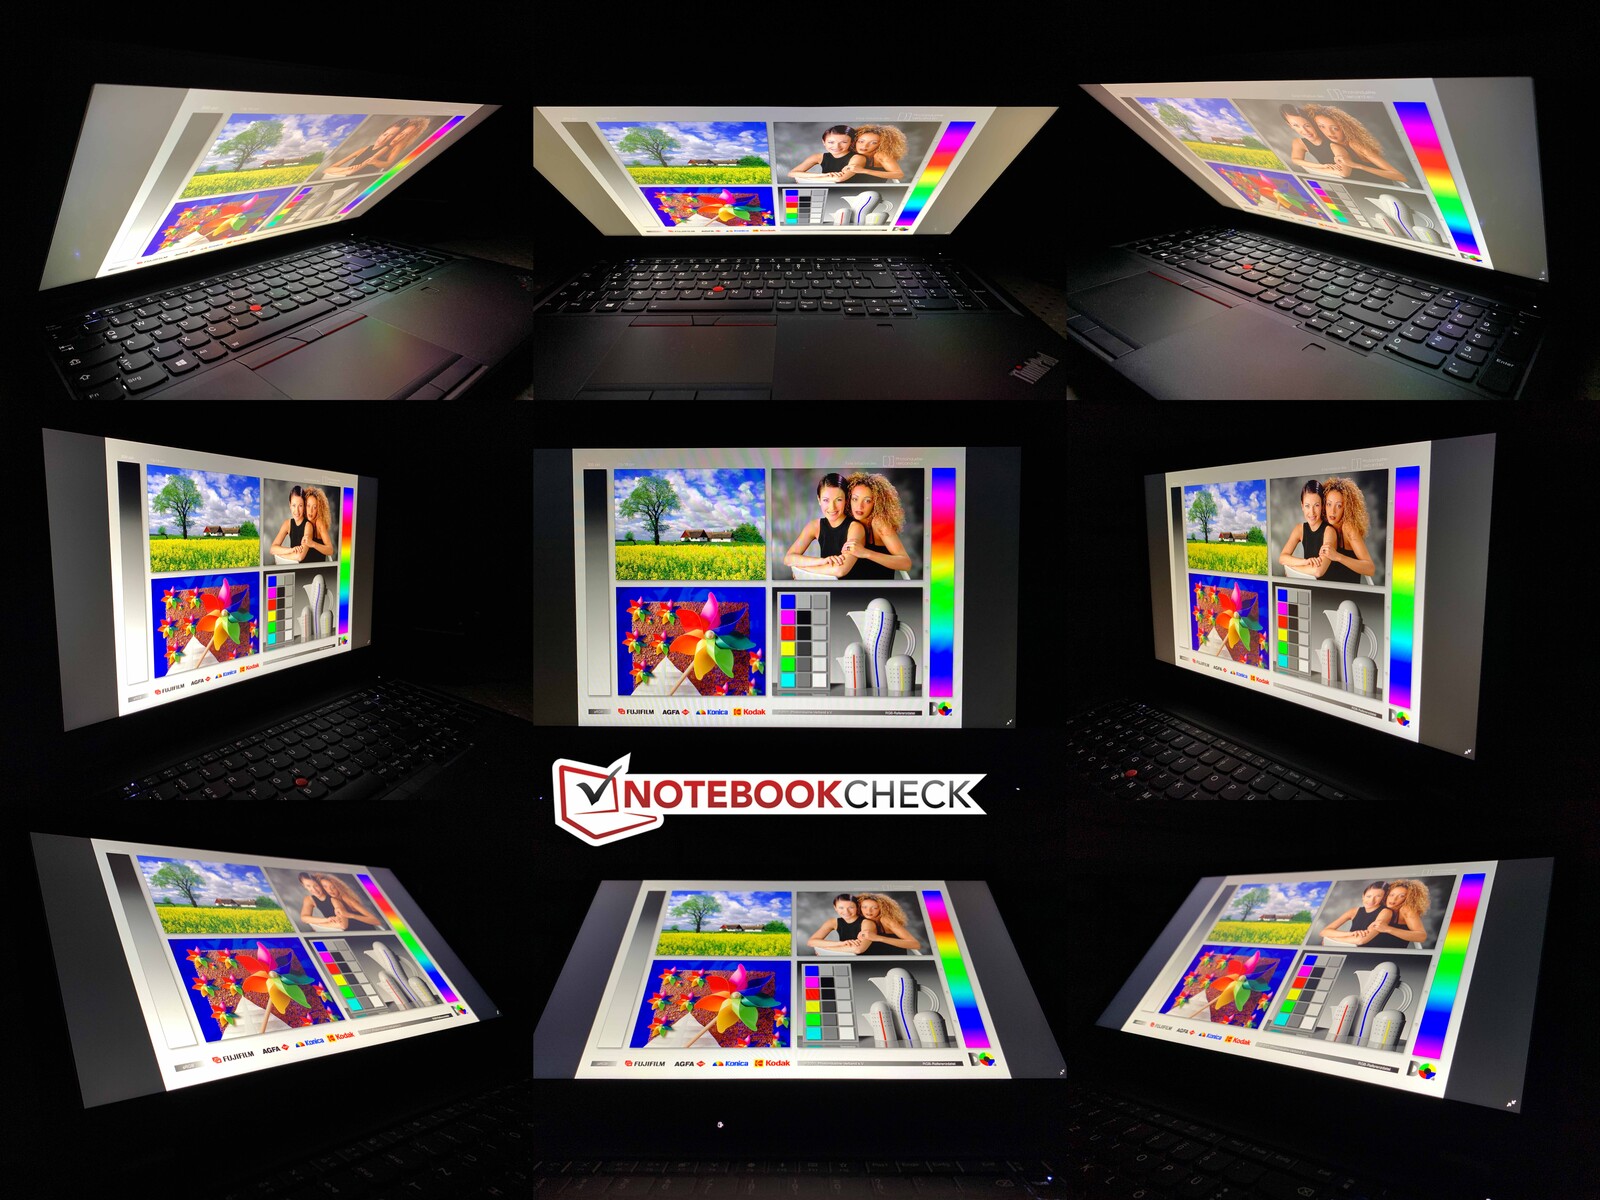
The matte panel, of course, benefits from its high maximum brightness outdoors and is suitable for very bright environments. As long as the angle of the display is adjusted properly, even sunshine is no problem, as demonstrated by the pictures below. The IPS panel looks good from all angles.
Performance – ThinkPad with Lots of Hardware Choices
Lenovo offers a wide variety of components in its ThinkPad P53 series, meaning that the performance and emissions can vary widely, depending on the selected configuration. On the latest models, Lenovo's "intelligent cooling" is no longer controlled with the Vantage app, but through the standard Windows power profile (selectable from the battery symbol in the task bar).
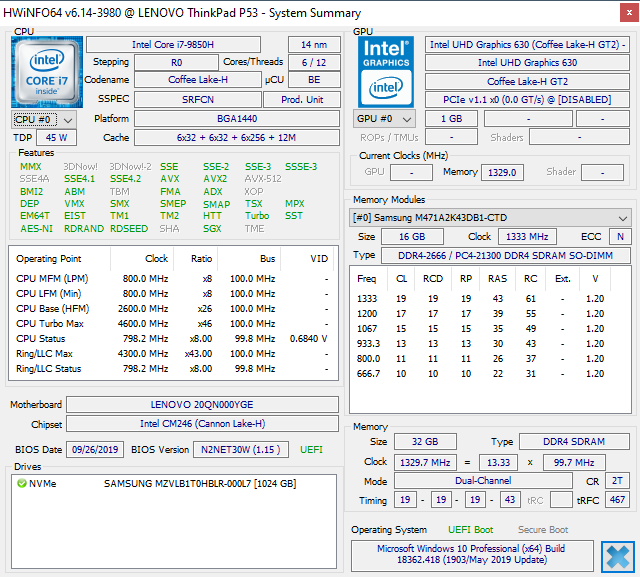
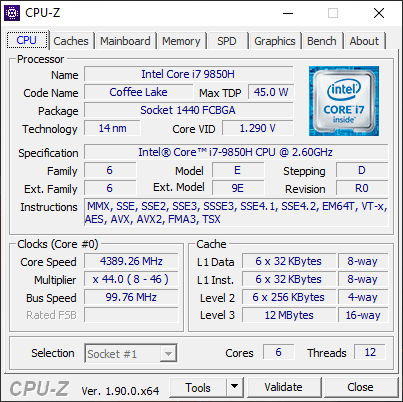
Processor – P53 with Core i7-9850H
Lenovo gives users the choice between various 45-watt processors, which include a Core i5-9400H with 4 cores, different i7 models (with 6 or 8 cores) and a mobile Xeon processor (6 cores) that supports ECC-RAM. Our test device uses a Core i7-9850H, which is a powerful 6-core CPU with a base clock of 2.6 GHz and a 4.6 GHz Turbo Boost frequency. See our dedicated page on the CPU for more technical information.
The performance gap compared to a mobile processor from the last generation is quite small overall, since not a lot has changed in the cooling department. Thick workstations such as the P53 tend to have an advantage over their slimmer counterparts, which for example, includes the ThinkPad P1, in this regard and particularly when it comes to prolonged stress.
Our Cinebench (R15 multi) loop, which shows the slim ThinkPad P1 that is equipped with the same processor to be around 14% slower than our test device, illustrates this quite clearly. Although the Core i7-9850H in our ThinkPad P53 achieves a very good result initially, scoring 1,230 points in the first loop, its score subsequently drops and stabilizes at around 1,100 points. While this result puts it ahead of the older ThinkPad P52, the Precision 7530 is still marginally faster.
With 90 watts (temporary) and 60 watts (continuous), Lenovo has set two very generous CPU power limits. When the device has completely cooled off, we actually see a consumption of up to 89 watts at 6x 3.7-4.1 GHz, even though it only lasts for a few seconds. Subsequently, this value drops to around 54 watts and 6x 3.3-3.4 GHz. The average values during the Cinebench loop are as follows: 53 watts consumption, 95.3 °C (~204 °F) CPU temperature, 3.4 GHz clock speed. Here, the CPU does not reach its true potential, since the cooling solution remains fairly passive during raw CPU stress (only really audible after about 7 minutes).
As these observations show, the i7-9850H does not have a clear advantage over the more common i7-9750H, since the performance will be essentially identical in practice. The optional Core i9-9880H is a good choice for workloads that can take advantage of all 16 threads, although users will not be able to fully exhaust its capabilities either. Due to the aforementioned CPU option, the Xeon E-2276M (6 cores) is no longer the fastest processor on paper (only during single-core use) and only worth it if you are planning to use ECC-RAM.
While the CPU behavior is practically identical in battery mode, there are occasional, short-lived performance dips, which also affect the end results. In CB R15 single, the final score drops from 196 to 183 points and in Cinebench's multi test, our test device scores only 969 instead of 1,230 points.
System Performance – Workstation with 1-TB PCIe SSD
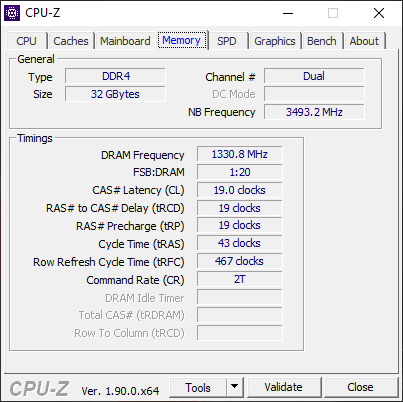
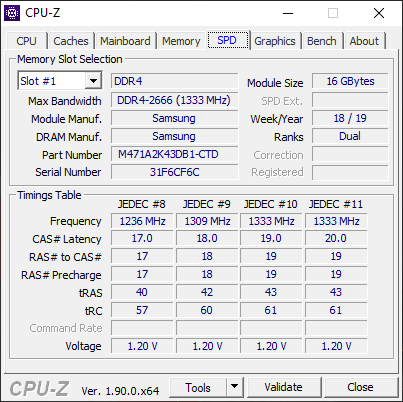
As expected, our ThinkPad P53 performs very well in the synthetic benchmark PCMark 10 and in our SSD tests. The installed Samsung M.2 PCIe SSD P981a offers 1 TB storage space (903 GB available to users after booting up the laptop for the first time) and some of the fastest read and write speeds on the market.
In practice, the mobile workstation allows for smooth system operation with fast response times and no noticeable delays. We also did not encounter any issues during our tests (such as freezing or bluescreens).

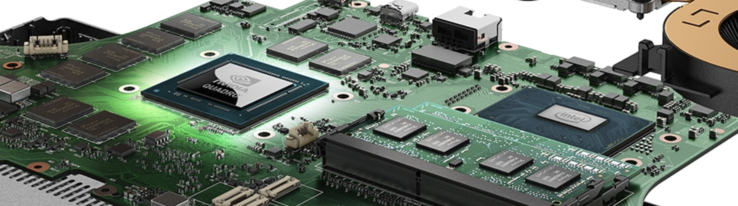
GPU Performance – Is the RTX 5000 Max-Q Worth It?
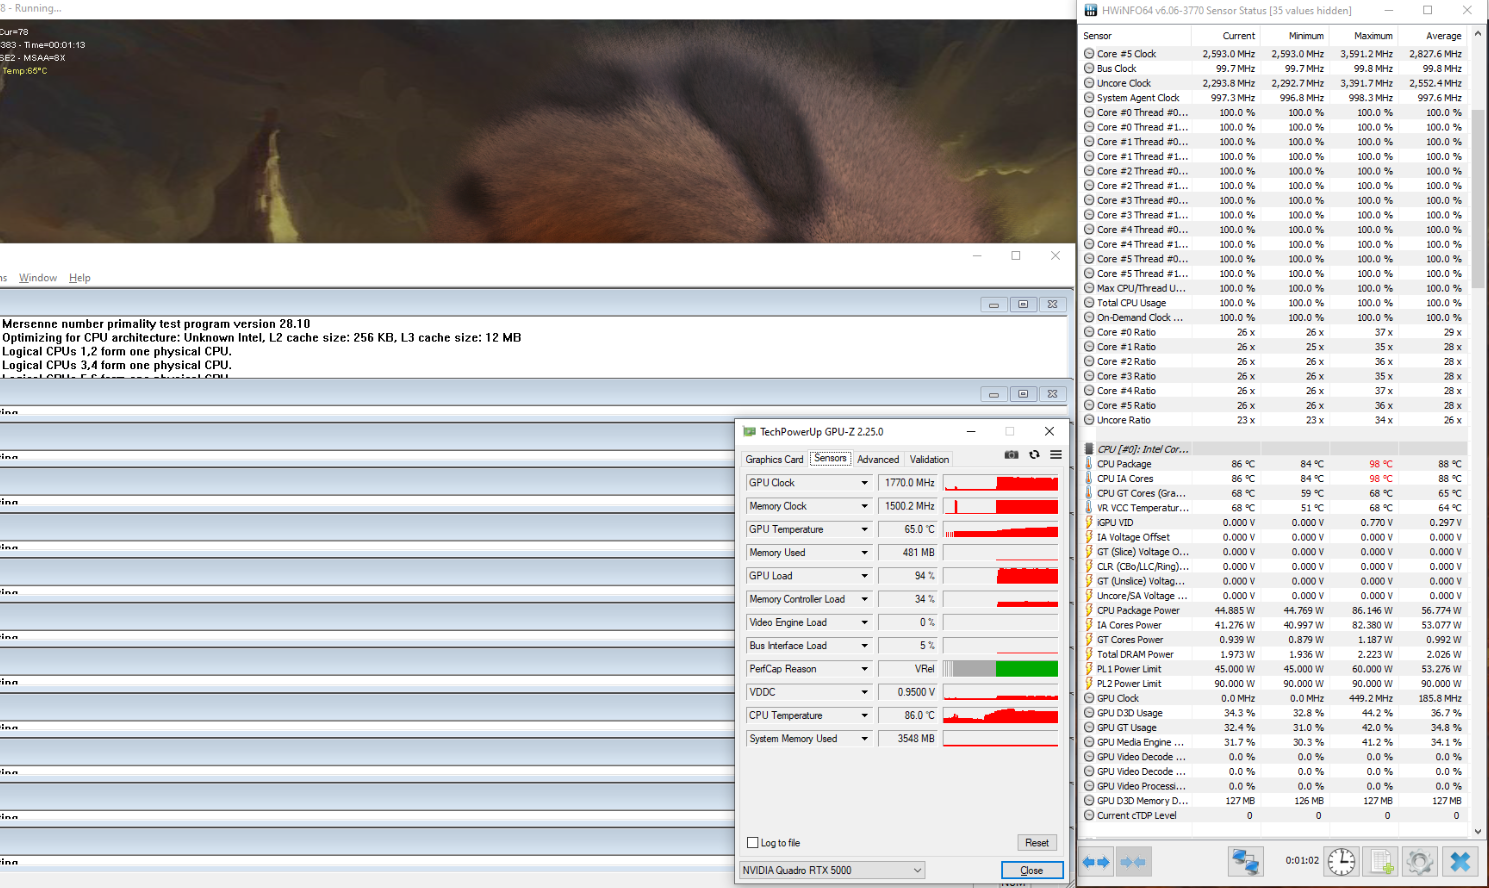
Nvidia offers different variants of the Quadro RTX 5000 and we had a hard time determining which one Lenovo had chosen for the ThinkPad P53. According to the information provided to us, the slowest, 80-watt model of the normal RTX 5000 (non Max-Q) is installed. An overview of the various different versions can be found on our RTX 5000 GPU page. In a nutshell: Only the core clock is different and in our case ranges from 600 MHz (base) to 1,350 MHz (boost). However, users have no reason to worry about the theoretical values too much, since the GPU almost always runs at a minimum of 1,350 MHz in pure GPU benchmarks and at at least 1,450 MHz in combined GPU benchmarks; there was even a 1,770 MHz peak. Thus, the RTX 5000 is able to run faster as long as there is sufficient cooling.
What does this mean for the overall performance? While the performance is not up to par with the "big" Quadro RTX 5000, which is only available on larger 17-inch devices, even the 80-watt version is marginally faster than a regular Quadro RTX 4000. This is an incredible performance level for a 15-inch workstation and still far more power than what the Quadro P3200 inside of the predecessor ThinkPad P52 can offer.
The ThinkPad P53 passes 3DMark Time Spy with a score of 97%, meaning the GPU performance remains consistent even during prolonged stress. However, there is a performance deficit of about 70% in battery mode (6,999 vs. 2,051 points @Time Spy Graphics).
| 3DMark 06 Standard Score | 38739 points | |
| 3DMark Vantage P Result | 54153 points | |
| 3DMark 11 Performance | 19250 points | |
| 3DMark Ice Storm Standard Score | 98630 points | |
| 3DMark Cloud Gate Standard Score | 38066 points | |
| 3DMark Fire Strike Score | 16547 points | |
| 3DMark Time Spy Score | 6879 points | |
Help | ||
Gaming Performance
The Quadro RTX 5000 handles games very well. During our gaming benchmarks, we only encountered an issue with "Anno 1800's" 4K preset, which caused the game to crash repeatedly. Nvidia's Quadro driver worked well otherwise, however. For the native display resolution, the RTX 5000 is almost unnecessarily powerful and even the latest games run smoothly at maximum detail settings. As our long-term "The Witcher 3" test shows, the performance remains consistent while gaming.
| low | med. | high | ultra | QHD | 4K | |
|---|---|---|---|---|---|---|
| GTA V (2015) | 177 | 170 | 150.4 | 77.6 | 68.4 | |
| The Witcher 3 (2015) | 320 | 235 | 141 | 71 | 46.4 | |
| Dota 2 Reborn (2015) | 148 | 137 | 132 | 126 | 102 | |
| Rise of the Tomb Raider (2016) | 281.4 | 198.6 | 134.5 | 110.1 | 45.4 | |
| X-Plane 11.11 (2018) | 117 | 99 | 85 | |||
| Shadow of the Tomb Raider (2018) | 127 | 102 | 98 | 87 | 59 | 29 |
| Hitman 2 (2018) | 87.7 | 85.3 | 78.4 | 75.3 | 73.3 | 46.6 |
| Battlefield V (2018) | 153.6 | 105.4 | 88.2 | 81.2 | 68.3 | 42.5 |
| Far Cry New Dawn (2019) | 107 | 98 | 90 | 86 | 72 | 43 |
| Dirt Rally 2.0 (2019) | 275 | 188.9 | 160.3 | 89.3 | 66.8 | |
| Anno 1800 (2019) | 94.5 | 97.8 | 73.9 | 38.9 | 31.5 | |
| F1 2019 (2019) | 113 | 101 | 93 | 88 | 83 | 52 |
| Ghost Recon Breakpoint (2019) | 127 | 105 | 93 | 65 | 47 | 26 |
| GRID 2019 (2019) | 178.8 | 155.6 | 118.5 | 79.2 | 61.4 | 36.8 |
Emissions
System Noise
We noticed that the latest Lenovo workstations are equipped with fairly lethargic fan controls that usually take a while to increase the fan speeds under load. The current P53 also follows this trend and, despite its powerful Quadro RTX 5000, only really becomes audible after a few minutes. The laptop is almost always silent under low loads.
Both during gaming and our stress test, we recorded a maximum noise level of only 38.3 dB(A). While this is a good result, it also shows that there is still potential for a better CPU usage and higher performance. Selecting a different power profile (from the Windows settings) reduces the noise level even further to be as low as 38.3 dB(A) (best performance), 33.3 dB(A) (better performance) and 32.2 dB(A) (longer battery life) during our stress test, respectively.
Noise Level
| Idle |
| 28.3 / 28.3 / 28.3 dB(A) |
| Load |
| 29.8 / 38.3 dB(A) |
 | ||
30 dB silent 40 dB(A) audible 50 dB(A) loud |
||
min: | ||
| Lenovo ThinkPad P53-20QN000YGE Quadro RTX 5000 Max-Q, i7-9850H, Samsung PM981a MZVLB1T0HBLR | Lenovo ThinkPad P1 2019-20QT000RGE Quadro T1000 (Laptop), i7-9850H, WDC PC SN720 SDAQNTW-512G | Dell Precision 7530 Quadro P3200, i9-8950HK, Samsung PM961 NVMe MZVLW512HMJP | Fujitsu Celsius H780 Quadro P2000, i7-8850H, Samsung SSD PM981 MZVLB512HAJQ | MSI P65 Creator 9SF-657 GeForce RTX 2070 Max-Q, i9-9880H, 2x Samsung SSD PM981 MZVLB512HAJQ (RAID 0) | Lenovo ThinkPad P52 20MAS03N00 Quadro P1000, i7-8750H, Samsung SSD PM981 MZVLB512HAJQ | |
|---|---|---|---|---|---|---|
| Noise | -4% | -12% | -20% | -18% | -3% | |
| off / environment * | 28.3 | 28.8 -2% | 28.3 -0% | 29.6 -5% | 30.2 -7% | 29.5 -4% |
| Idle Minimum * | 28.3 | 28.8 -2% | 28.3 -0% | 29.6 -5% | 32.8 -16% | 29.5 -4% |
| Idle Average * | 28.3 | 28.8 -2% | 28.3 -0% | 32.2 -14% | 32.8 -16% | 29.5 -4% |
| Idle Maximum * | 28.3 | 28.8 -2% | 30.5 -8% | 37 -31% | 33.6 -19% | 29.5 -4% |
| Load Average * | 29.8 | 36.1 -21% | 34.5 -16% | 40.3 -35% | 40.9 -37% | 34.7 -16% |
| Witcher 3 ultra * | 38.3 | 49.5 -29% | 33.1 14% | |||
| Load Maximum * | 38.3 | 36.7 4% | 49.5 -29% | 49.4 -29% | 42.7 -11% | 39.4 -3% |
* ... smaller is better
Temperature
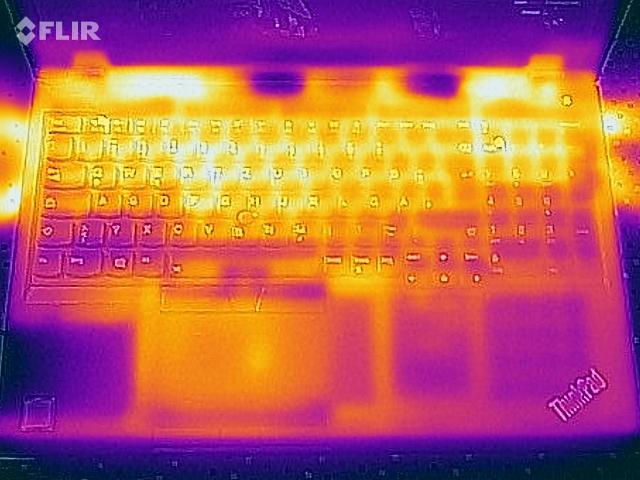
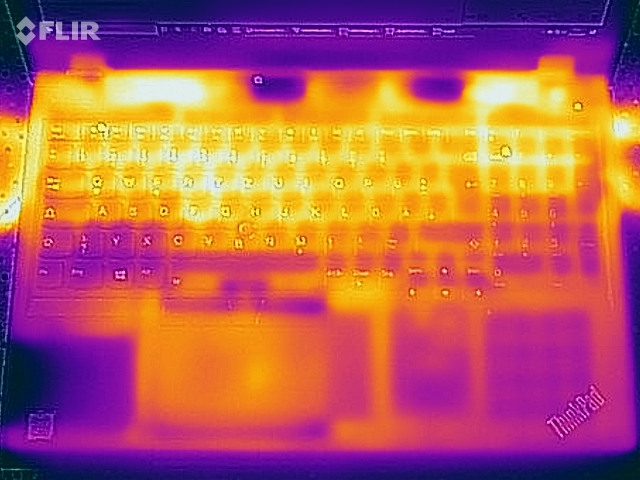
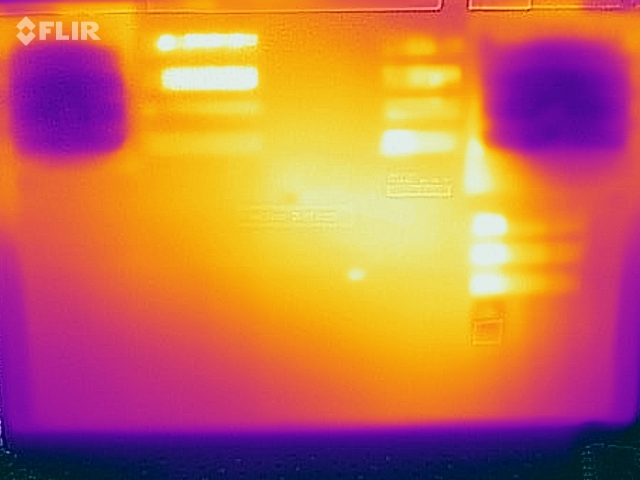
The surface temperatures of the mobile workstation remained unproblematic even under load, although the device should be set up on a flat table rather than on your lap if possible. While the keyboard also becomes warm, this does not really affect typing. Considering the performance level, this is a good result.
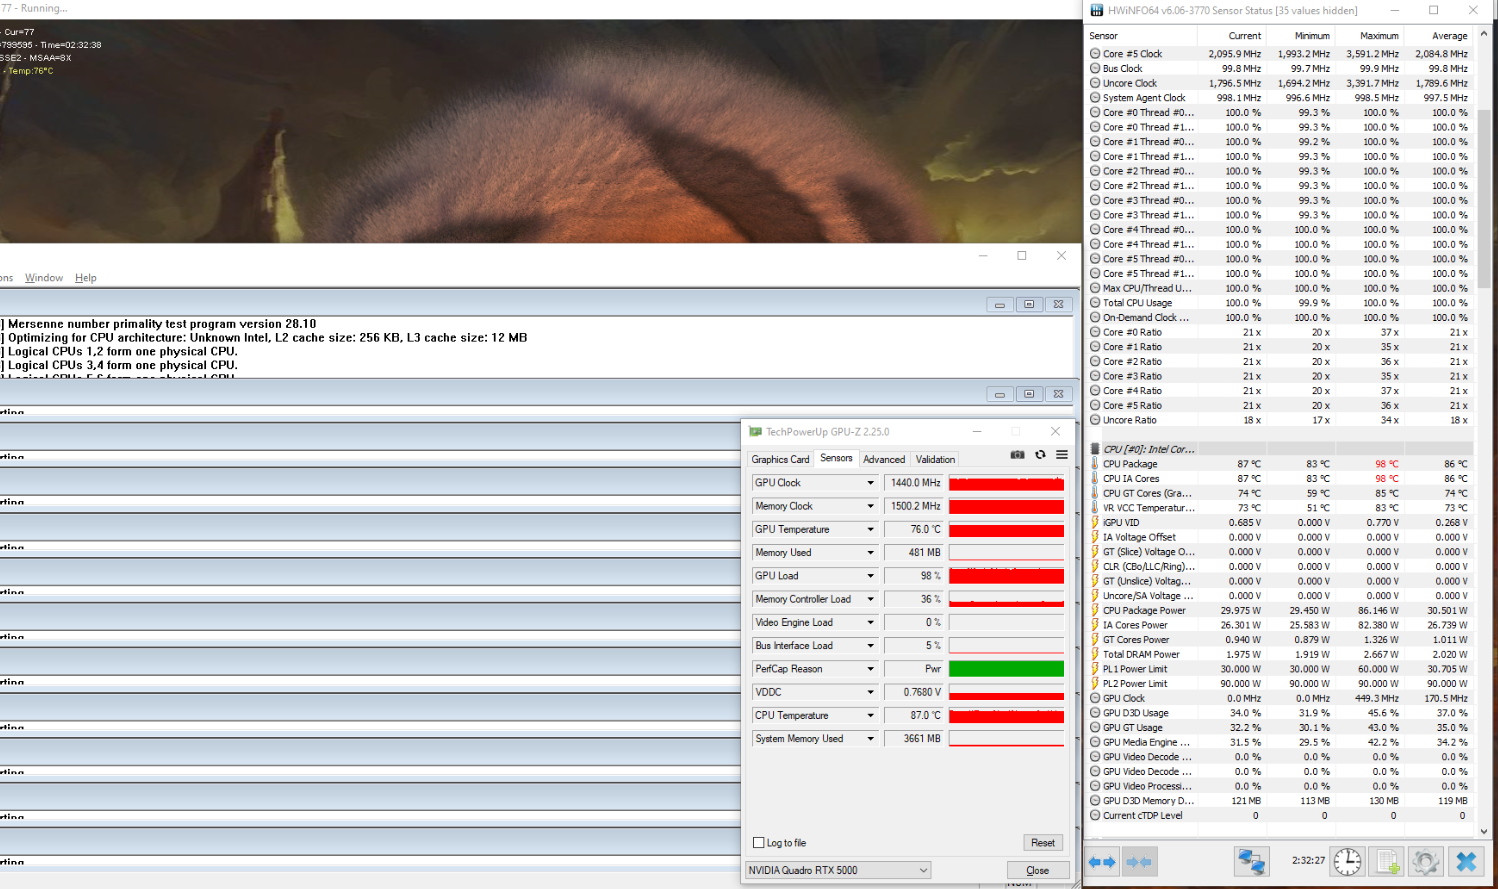
Our stress test shows that Lenovo prioritizes GPU performance, since the Quadro RTX 5000's clock speed stays within reach of the normal boost frequency (~1,350-1,440 MHz). While this is obviously a good result for such a powerful GPU inside of a 15-inch workstation, it comes at the cost of CPU power. The latter has to contend with a power budget of 30 watts after just a few minutes, which allows it to run at only 6x 2.1 GHz. Here, we would have liked to see a more balanced power distribution with a minimum continuous consumption of 45 watts.
When choosing a lower-end graphics card, the cooling solution should be able to devote more cooling power to the processor, although we cannot confirm this to be the case at this point.
(±) The maximum temperature on the upper side is 41.8 °C / 107 F, compared to the average of 38.2 °C / 101 F, ranging from 22.2 to 69.8 °C for the class Workstation.
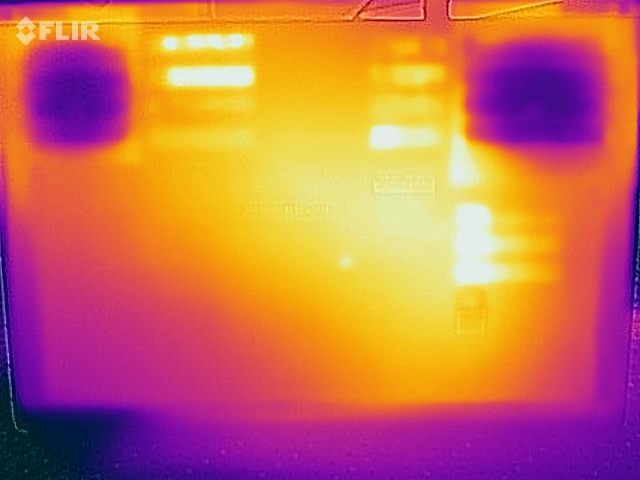
(-) The bottom heats up to a maximum of 46.1 °C / 115 F, compared to the average of 41.2 °C / 106 F
(+) In idle usage, the average temperature for the upper side is 21.9 °C / 71 F, compared to the device average of 32 °C / 90 F.
(±) Playing The Witcher 3, the average temperature for the upper side is 38 °C / 100 F, compared to the device average of 32 °C / 90 F.
(±) The palmrests and touchpad can get very hot to the touch with a maximum of 37.1 °C / 98.8 F.
(-) The average temperature of the palmrest area of similar devices was 27.9 °C / 82.2 F (-9.2 °C / -16.6 F).
Speakers
Not a lot has changed in terms of the speakers. The two stereo modules with 2 watts each are still neither very loud nor very good. While the sound quality is sufficient for speech, we recommend using headphones or external speakers for music and videos. Although the Lenovo's X1 Extreme shows that the manufacturer knows how to implement high-quality speakers, this feature does not appear to be a priority for workstation users.
Lenovo ThinkPad P53-20QN000YGE audio analysis
(±) | speaker loudness is average but good (72.8 dB)
Bass 100 - 315 Hz
(±) | reduced bass - on average 11.6% lower than median
(±) | linearity of bass is average (13.6% delta to prev. frequency)
Mids 400 - 2000 Hz
(±) | higher mids - on average 7.8% higher than median
(±) | linearity of mids is average (7.5% delta to prev. frequency)
Highs 2 - 16 kHz
(+) | balanced highs - only 1.9% away from median
(+) | highs are linear (4.8% delta to prev. frequency)
Overall 100 - 16.000 Hz
(±) | linearity of overall sound is average (23.1% difference to median)
Compared to same class
» 81% of all tested devices in this class were better, 3% similar, 16% worse
» The best had a delta of 7%, average was 18%, worst was 35%
Compared to all devices tested
» 67% of all tested devices were better, 5% similar, 27% worse
» The best had a delta of 4%, average was 24%, worst was 134%
Dell Precision 7530 audio analysis
(±) | speaker loudness is average but good (74.4 dB)
Bass 100 - 315 Hz
(±) | reduced bass - on average 8% lower than median
(±) | linearity of bass is average (12.3% delta to prev. frequency)
Mids 400 - 2000 Hz
(+) | balanced mids - only 3.3% away from median
(±) | linearity of mids is average (7.8% delta to prev. frequency)
Highs 2 - 16 kHz
(+) | balanced highs - only 2.3% away from median
(+) | highs are linear (5% delta to prev. frequency)
Overall 100 - 16.000 Hz
(+) | overall sound is linear (11.4% difference to median)
Compared to same class
» 10% of all tested devices in this class were better, 3% similar, 87% worse
» The best had a delta of 7%, average was 18%, worst was 35%
Compared to all devices tested
» 7% of all tested devices were better, 2% similar, 91% worse
» The best had a delta of 4%, average was 24%, worst was 134%
Energy Management
Energy Consumption
While the consumption during idle has increased compared to the predecessor ThinkPad P52, the results are still excellent. The temporary peak consumption of around 208 watts was only maintained for the first few seconds of the stress test. Similar to the CPU performance, the consumption steadily drops, before stabilizing at 137 watts (CPU @30 watts).
| Off / Standby | |
| Idle | |
| Load |
|
Key:
min: | |
| Lenovo ThinkPad P53-20QN000YGE i7-9850H, Quadro RTX 5000 Max-Q, Samsung PM981a MZVLB1T0HBLR, IPS, 1920x1080, 15.6" | Lenovo ThinkPad P1 2019-20QT000RGE i7-9850H, Quadro T1000 (Laptop), WDC PC SN720 SDAQNTW-512G, IPS LED, 1920x1080, 15.6" | Dell Precision 7530 i9-8950HK, Quadro P3200, Samsung PM961 NVMe MZVLW512HMJP, IPS, 3840x2160, 15.6" | Fujitsu Celsius H780 i7-8850H, Quadro P2000, Samsung SSD PM981 MZVLB512HAJQ, IPS LED, 1920x1080, 15.6" | MSI P65 Creator 9SF-657 i9-9880H, GeForce RTX 2070 Max-Q, 2x Samsung SSD PM981 MZVLB512HAJQ (RAID 0), IPS, 3840x2160, 15.6" | Lenovo ThinkPad P52 20MAS03N00 i7-8750H, Quadro P1000, Samsung SSD PM981 MZVLB512HAJQ, IPS LED, 1920x1080, 15.6" | |
|---|---|---|---|---|---|---|
| Power Consumption | -20% | -40% | 3% | -22% | 35% | |
| Idle Minimum * | 7.9 | 13.7 -73% | 15.7 -99% | 9.1 -15% | 9.4 -19% | 4.02 49% |
| Idle Average * | 11.8 | 17.5 -48% | 20.3 -72% | 13.2 -12% | 17.4 -47% | 7.2 39% |
| Idle Maximum * | 14.9 | 20.9 -40% | 25.7 -72% | 14.04 6% | 19.6 -32% | 11.46 23% |
| Load Average * | 96 | 77.2 20% | 118.9 -24% | 78.8 18% | 103 -7% | 76.3 21% |
| Witcher 3 ultra * | 149 | 131.2 12% | 74 50% | |||
| Load Maximum * | 207.8 | 123.7 40% | 174 16% | 172.5 17% | 216 -4% | 154 26% |
* ... smaller is better
Battery Life
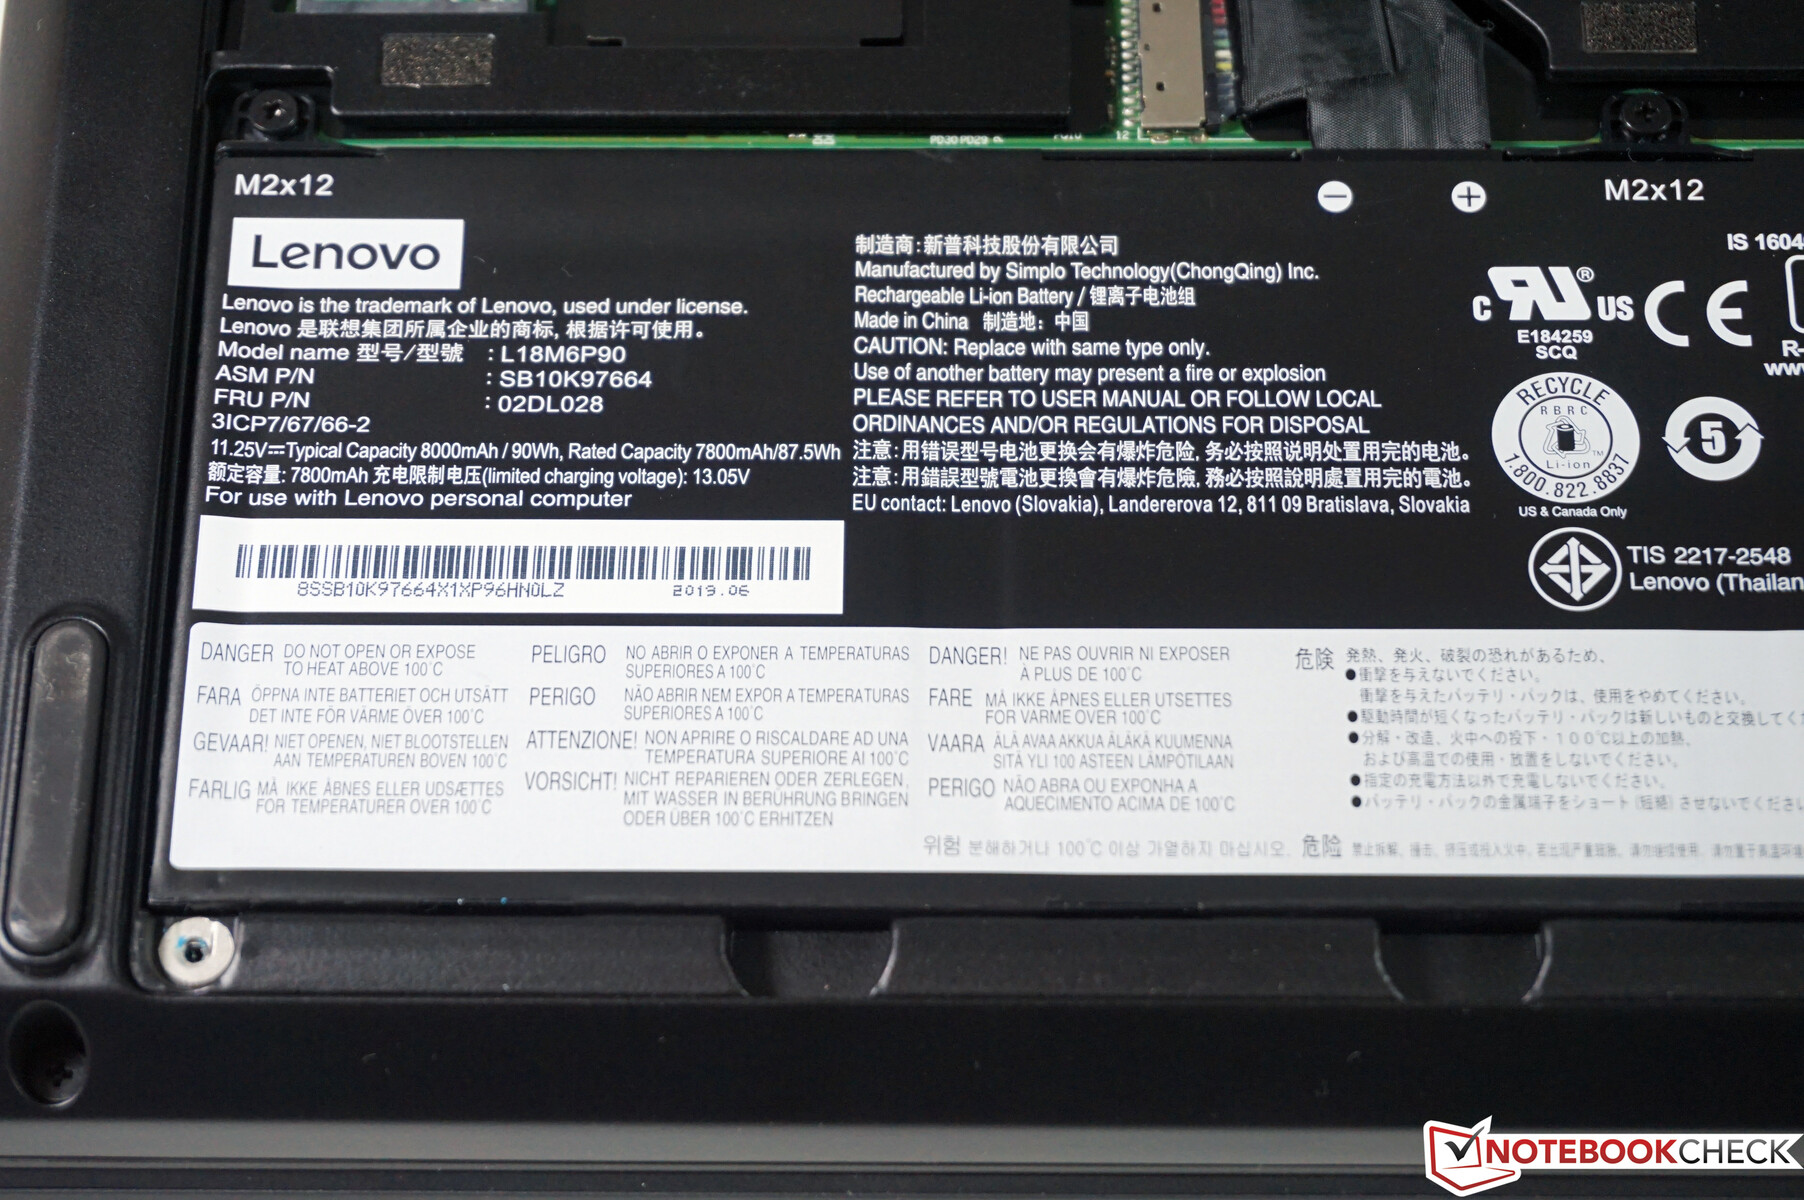
The large 90-Wh battery allows for very good runtimes of 10-11 hours in our Wi-Fi and video test, respectively. At maximum brightness, the laptop still lasts between 8 and 9 hours. While these results are very good overall, they are unlikely to be a big factor for users of a large 15-inch workstation. Under load, users can still expect around 2 hours of runtime, although the performance in battery mode is limited.
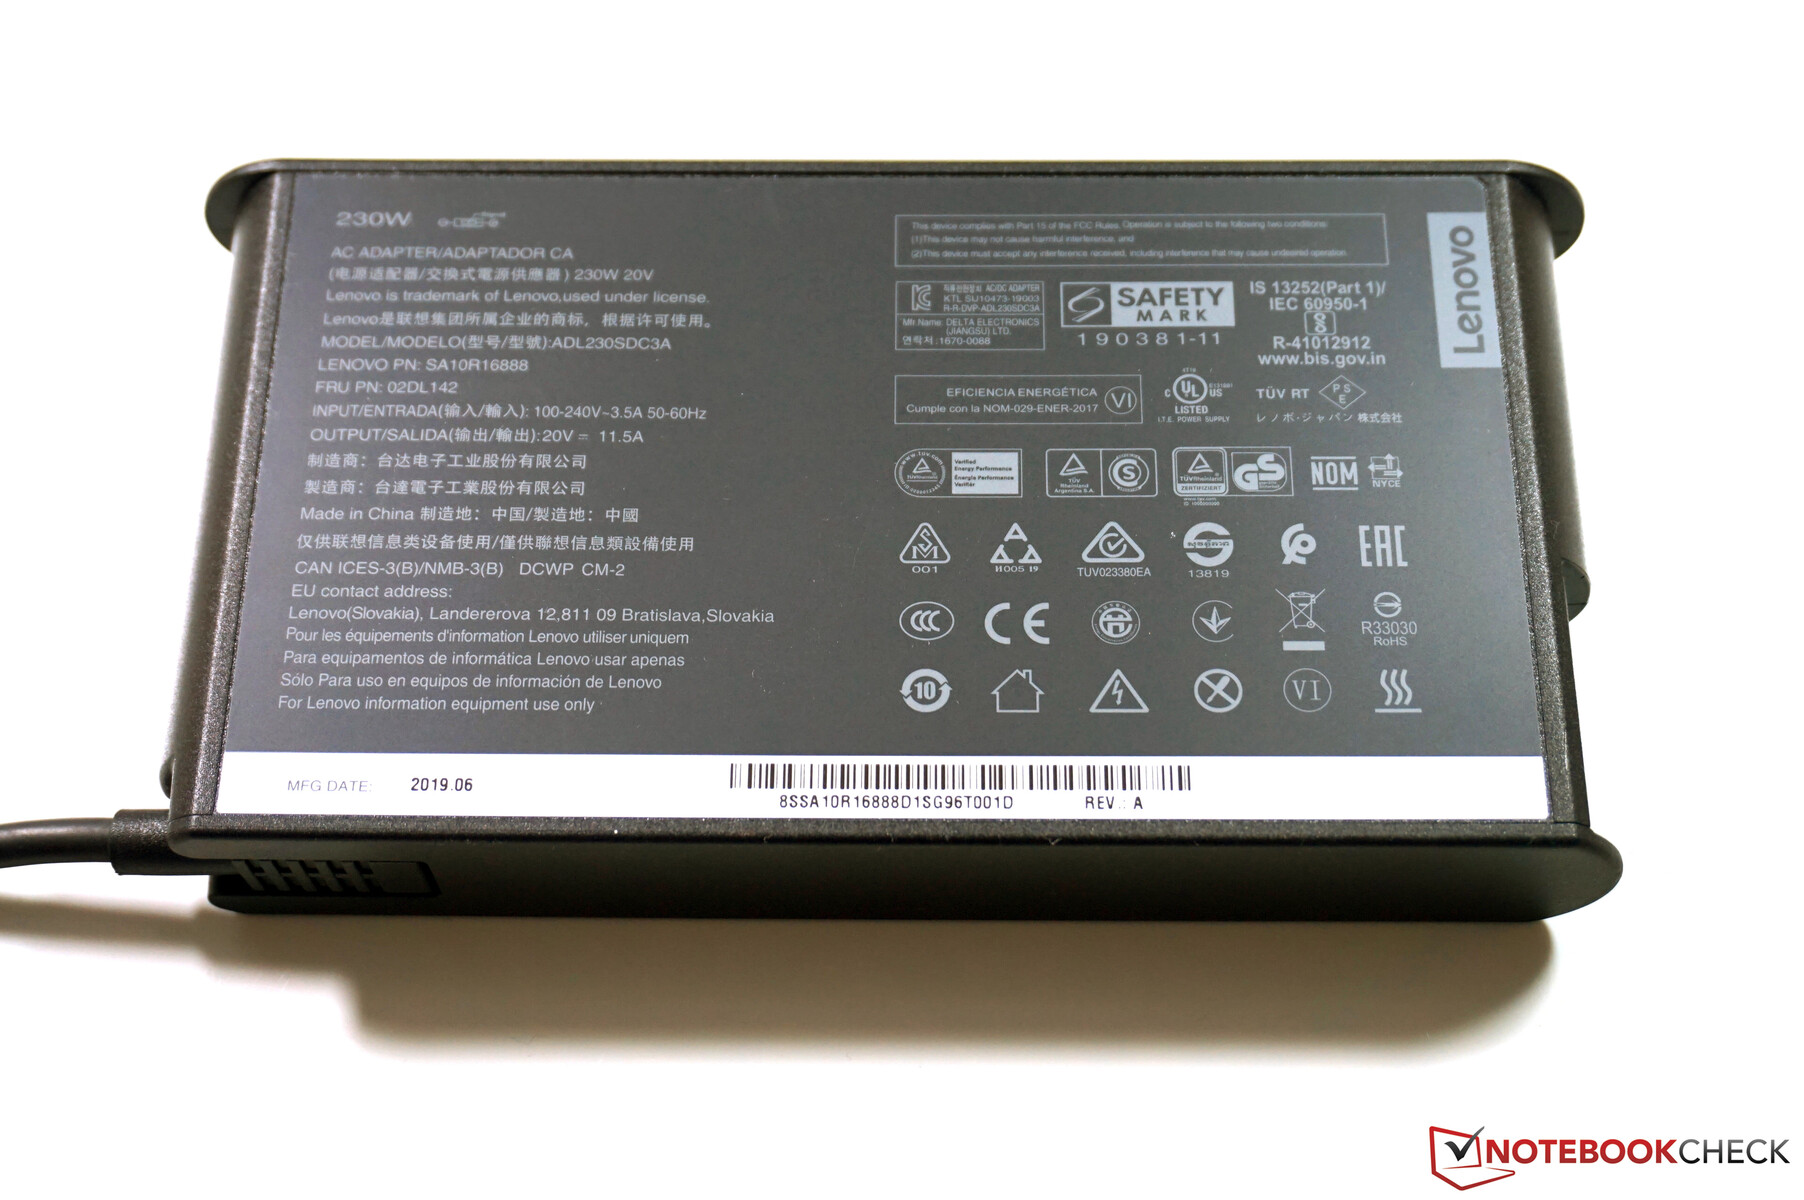
These results are likely to be far worse when opting for the 4K or even the OLED display. The device can be fully charged (while it is running) in just under 2 hours with the included 230-watt AC adapter and 80% battery life is available after just 60 minutes.
| Lenovo ThinkPad P53-20QN000YGE i7-9850H, Quadro RTX 5000 Max-Q, 90 Wh | Lenovo ThinkPad P1 2019-20QT000RGE i7-9850H, Quadro T1000 (Laptop), 80 Wh | Dell Precision 7530 i9-8950HK, Quadro P3200, 97 Wh | Fujitsu Celsius H780 i7-8850H, Quadro P2000, 96 Wh | MSI P65 Creator 9SF-657 i9-9880H, GeForce RTX 2070 Max-Q, 82 Wh | Lenovo ThinkPad P52 20MAS03N00 i7-8750H, Quadro P1000, 96 Wh | Average of class Workstation | |
|---|---|---|---|---|---|---|---|
| Battery Runtime | -19% | -39% | -32% | -45% | -4% | -11% | |
| H.264 | 590 | 560 -5% | 733 24% | 733 ? 24% | |||
| WiFi v1.3 | 664 | 532 -20% | 278 -58% | 450 -32% | 357 -46% | 637 -4% | 522 ? -21% |
| Load | 117 | 79 -32% | 95 -19% | 65 -44% | 79 -32% | 76.5 ? -35% | |
| Reader / Idle | 382 | 577 | 1519 | 1319 ? |
Pros
Cons
Verdict
The ThinkPad P53 is still a traditional mobile workstation that does not pay a lot of attention to current trends of slimmer and slimmer cases and bezels. As a result however, the case is very robust, there are a lot of ports, upgrading is easily possible and the hardware is very powerful, particularly in the graphics department.
On the exterior, not a lot has changed compared to the ThinkPad P52 from the previous year, but there have been some changes under the hood. The main selling points are more powerful graphics cards (Quadro RTX 4000 & 5000), which are usually reserved for larger 17-inch workstations. Here, some criticism is warranted, since customers do not know which version of the graphics card to expect. Neither Nvidia nor Lenovo state the fact that the slower 80-watt version is built into the system. Lenovo probably relies on the slower variant of the RTX 4000 as well. All in all, the graphics performance is still impressive regardless.
Bright 1080p panel, excellent input devices and a ton of performance: The ThinkPad P53 is a very well-rounded product with no real weaknesses. The only thing we are able to criticize is the cooling solution that could be slightly better optimized for combined CPU & GPU loads.
The cooling solution is not perfect either. We like the defensive fan control, which prevents the fans from spinning even after short stress periods. However, the cooling solution is unable to keep up during combined CPU & GPU loads, resulting in reduced processor performance. While quiet fans are good, users who choose high-end components in this price class probably want them to be able to unleash their maximum potential. We are convinced that the cooling solution is capable of being more effective, even if it results in more fan noise. We can only guess how well other configurations of the P53 perform at this point in time. We expect the models with smaller GPUs in particular (such as the RTX 3000 or T series) to make better use of the CPU.
Similar to many current ThinkPads, Lenovo's P53 has received significant upgrades to its display options. While the base configuration still includes an IPS panel with 300 cd/m², a better and more importantly brighter 1080p model is now available. Furthermore, Lenovo offers two high-resolution displays (a 4K IPS or a 4K OLED panel), which ensures that all users find the model they are looking for.
These criticisms are somewhat nitpicky, since the ThinkPad P53 does not have any real weaknesses and deserves its good overall score.
Lenovo ThinkPad P53-20QN000YGE
- 11/14/2019 v7 (old)
Andreas Osthoff
More articles related to this device
Lenovo ThinkPad P53-20QN000YGE (ThinkPad P53 Series)Related Articles


Price comparison

