

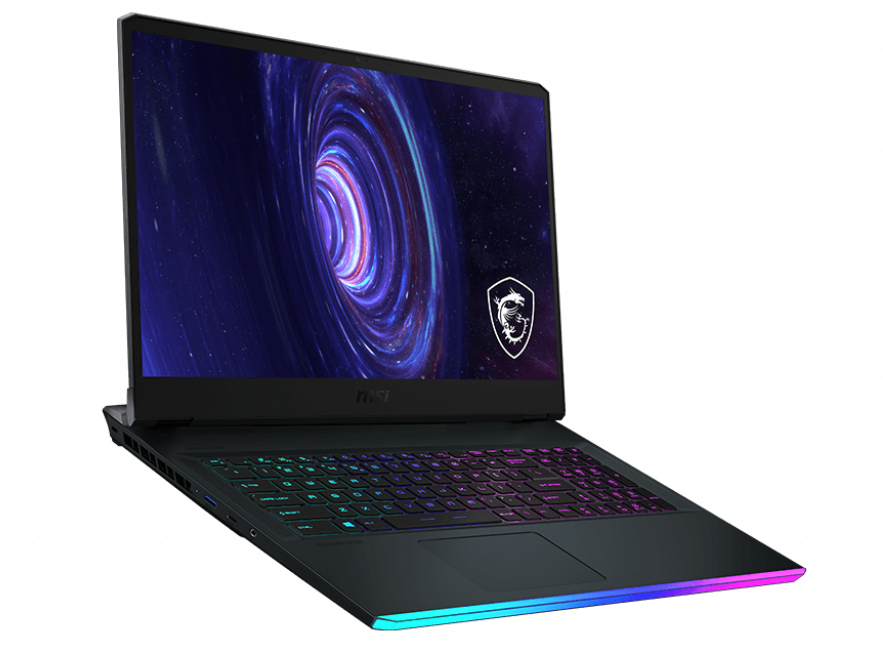
MSI GE76 Raider 10UH Laptop Review: A GeForce RTX 3080 PC You Can Actually Buy
Announced earlier this year, the GE76 replaces the aging GE75 with new hardware and a completely new chassis design that MSI will be using for the next few years. It's a huge leap for the GE series aimed at cementing the family as an upper mid-range product well above the cheaper GP, GL, or GF series.
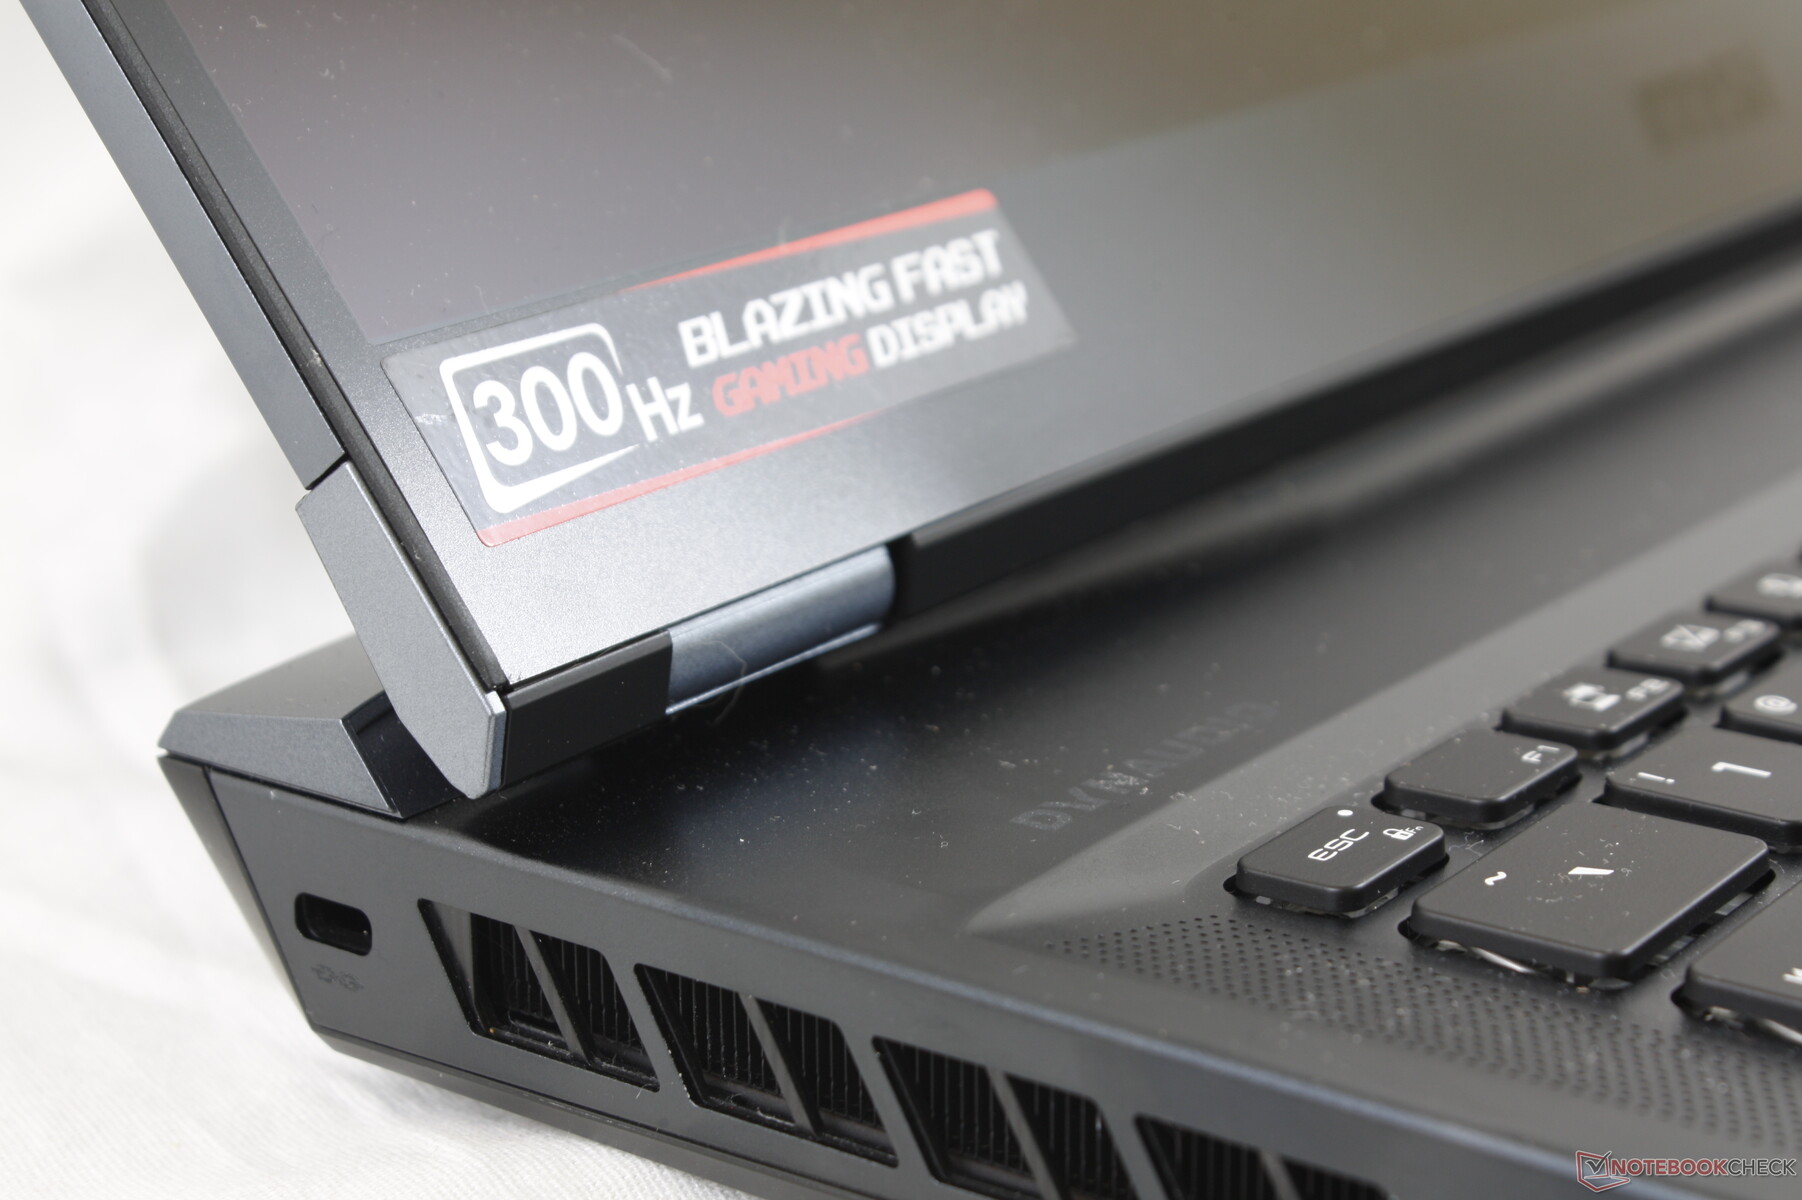
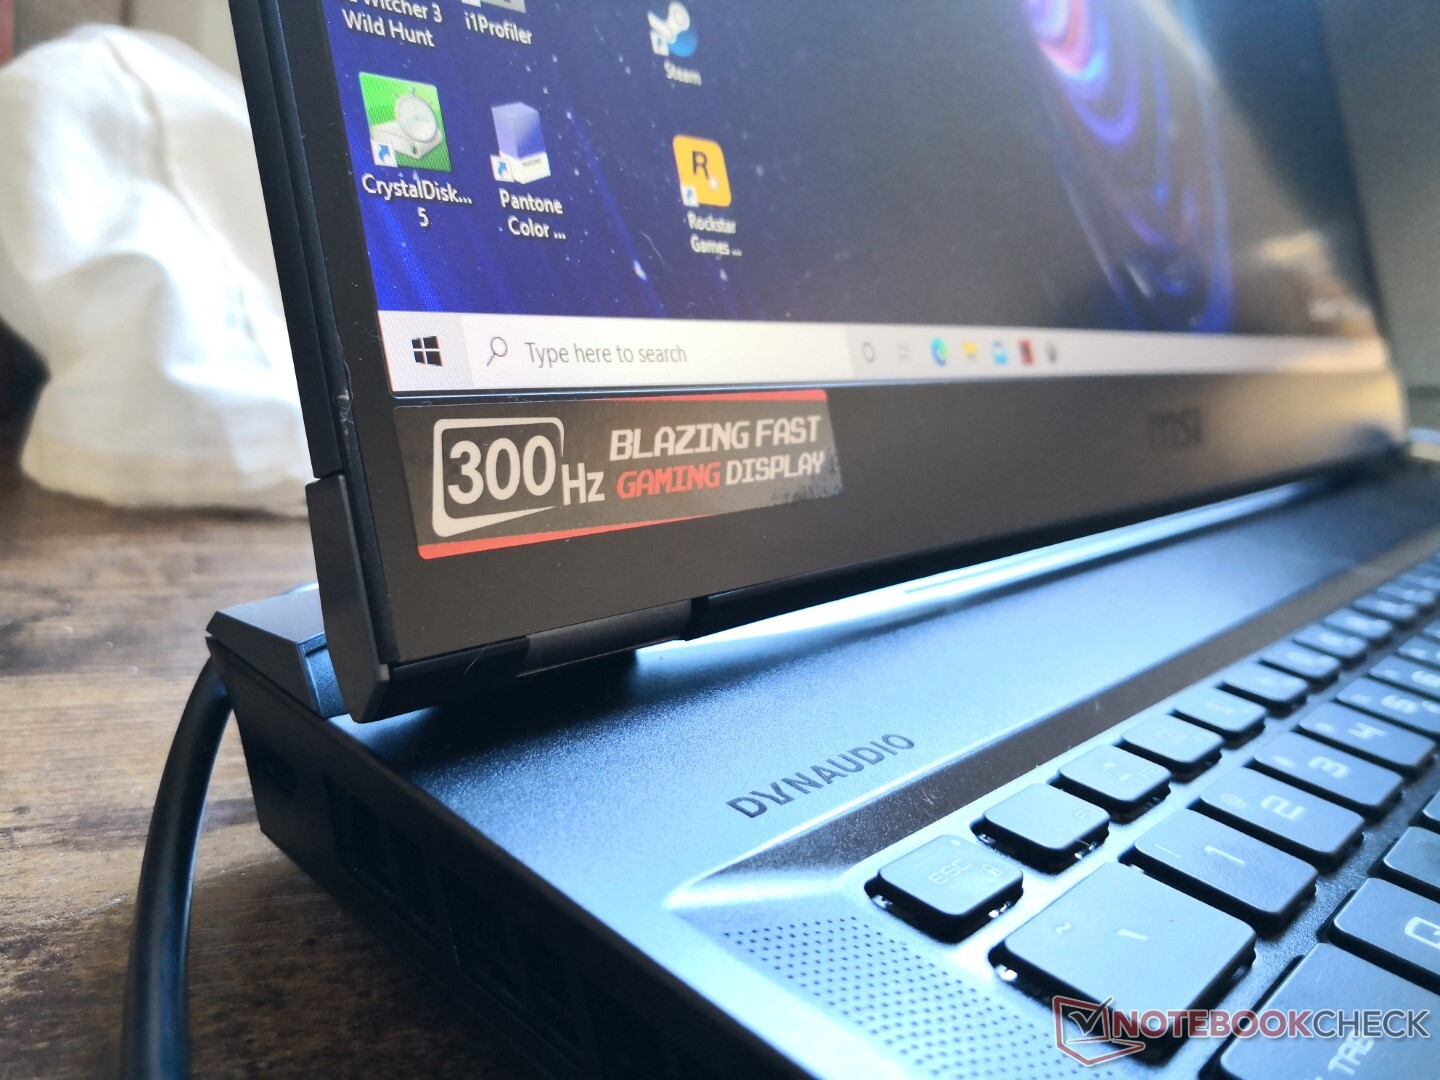
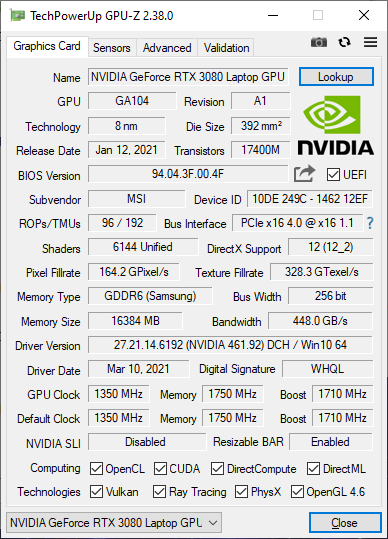
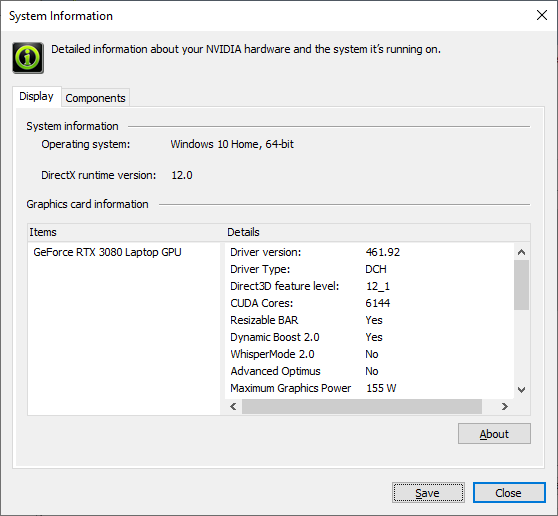
Our test unit is a higher-end configuration with the Core i7-10870H CPU, 155 W GeForce RTX 3080 GPU, and 300 Hz 1080p display for approximately $2900 USD retail. Lesser SKUs with the Core i7-10750H, 130 W RTX 3060 or 140 W 3070, and 240 Hz or 144 Hz panels are also available.
Competitors to the GE76 include other high-performance 17.3-inch gaming laptops like the Asus ROG Strix Scar 17, Schenker XMG Neo 17, Dell Alienware m17, or Gigabyte Aorus 17.
More MSI reviews:
potential competitors in comparison
Rating | Date | Model | Weight | Height | Size | Resolution | Price |
|---|---|---|---|---|---|---|---|
| 87.1 % v7 (old) | 03 / 2021 | MSI GE76 Raider 10UH i7-10870H, GeForce RTX 3080 Laptop GPU | 3 kg | 27.4 mm | 17.30" | 1920x1080 | |
| 87.6 % v6 (old) | 03 / 2019 | MSI GE75 8SG Raider i7-8750H, GeForce RTX 2080 Mobile | 2.6 kg | 27.5 mm | 17.30" | 1920x1080 | |
| 82.7 % v7 (old) | 07 / 2020 | Asus Strix Scar 17 G732LXS i9-10980HK, GeForce RTX 2080 Super Mobile | 2.9 kg | 26.5 mm | 17.30" | 1920x1080 | |
| 85.3 % v7 (old) | 09 / 2020 | Alienware m17 R3 P45E i9-10980HK, GeForce RTX 2080 Super Mobile | 3 kg | 20.7 mm | 17.30" | 1920x1080 | |
| 81.4 % v7 (old) | 12 / 2020 | Schenker XMG Core 17 Comet Lake i7-10750H, GeForce GTX 1650 Ti Mobile | 2.5 kg | 30 mm | 17.30" | 1920x1080 | |
| 87.4 % v7 (old) | 10 / 2020 | MSI GT76 Titan DT 10SGS i9-10900K, GeForce RTX 2080 Super Mobile | 4.2 kg | 42 mm | 17.30" | 3840x2160 |
Case
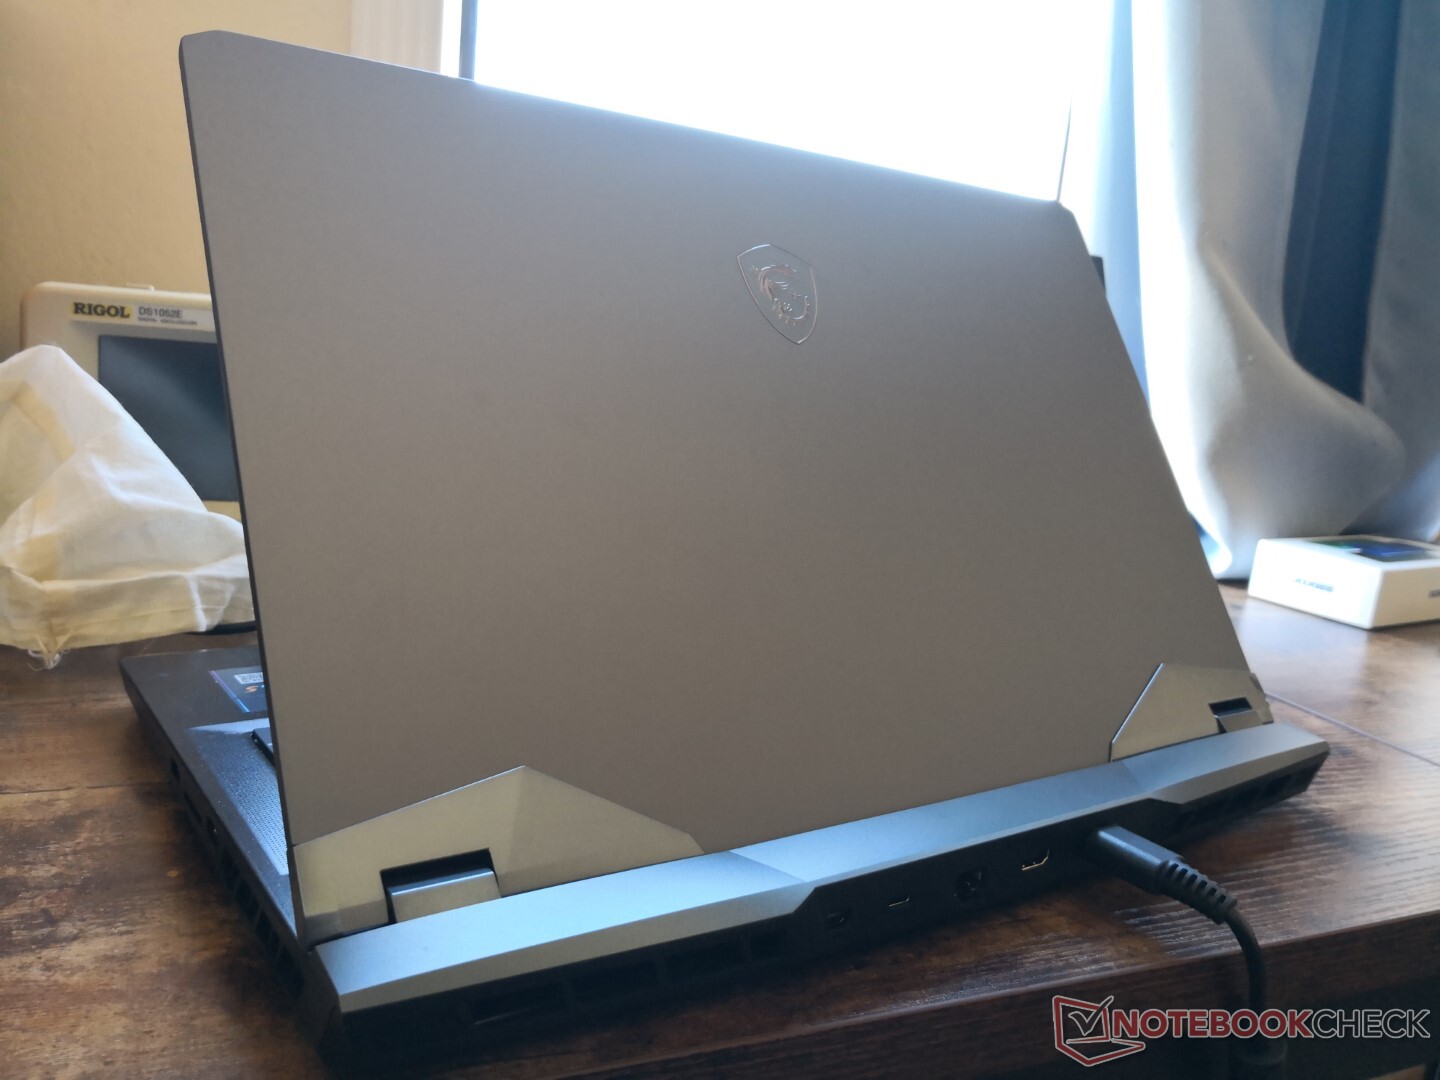
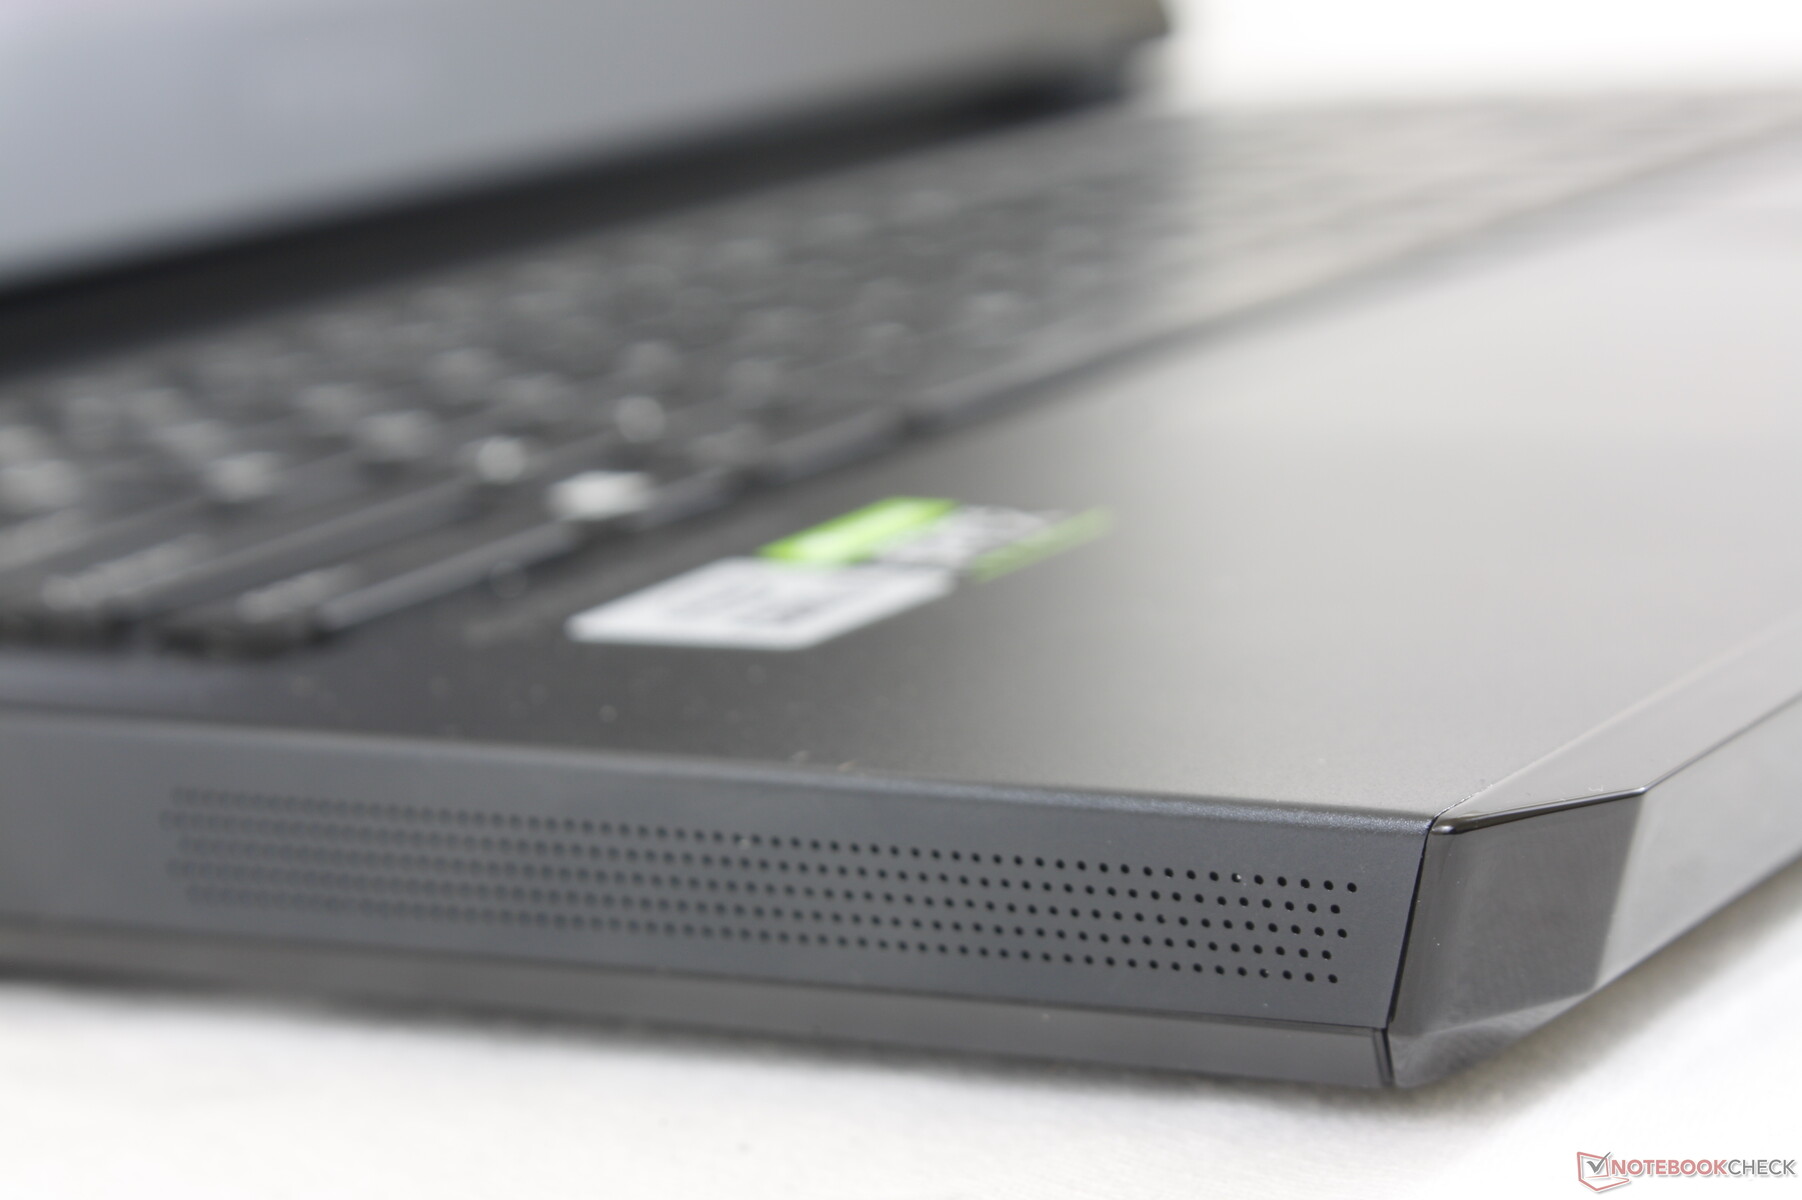
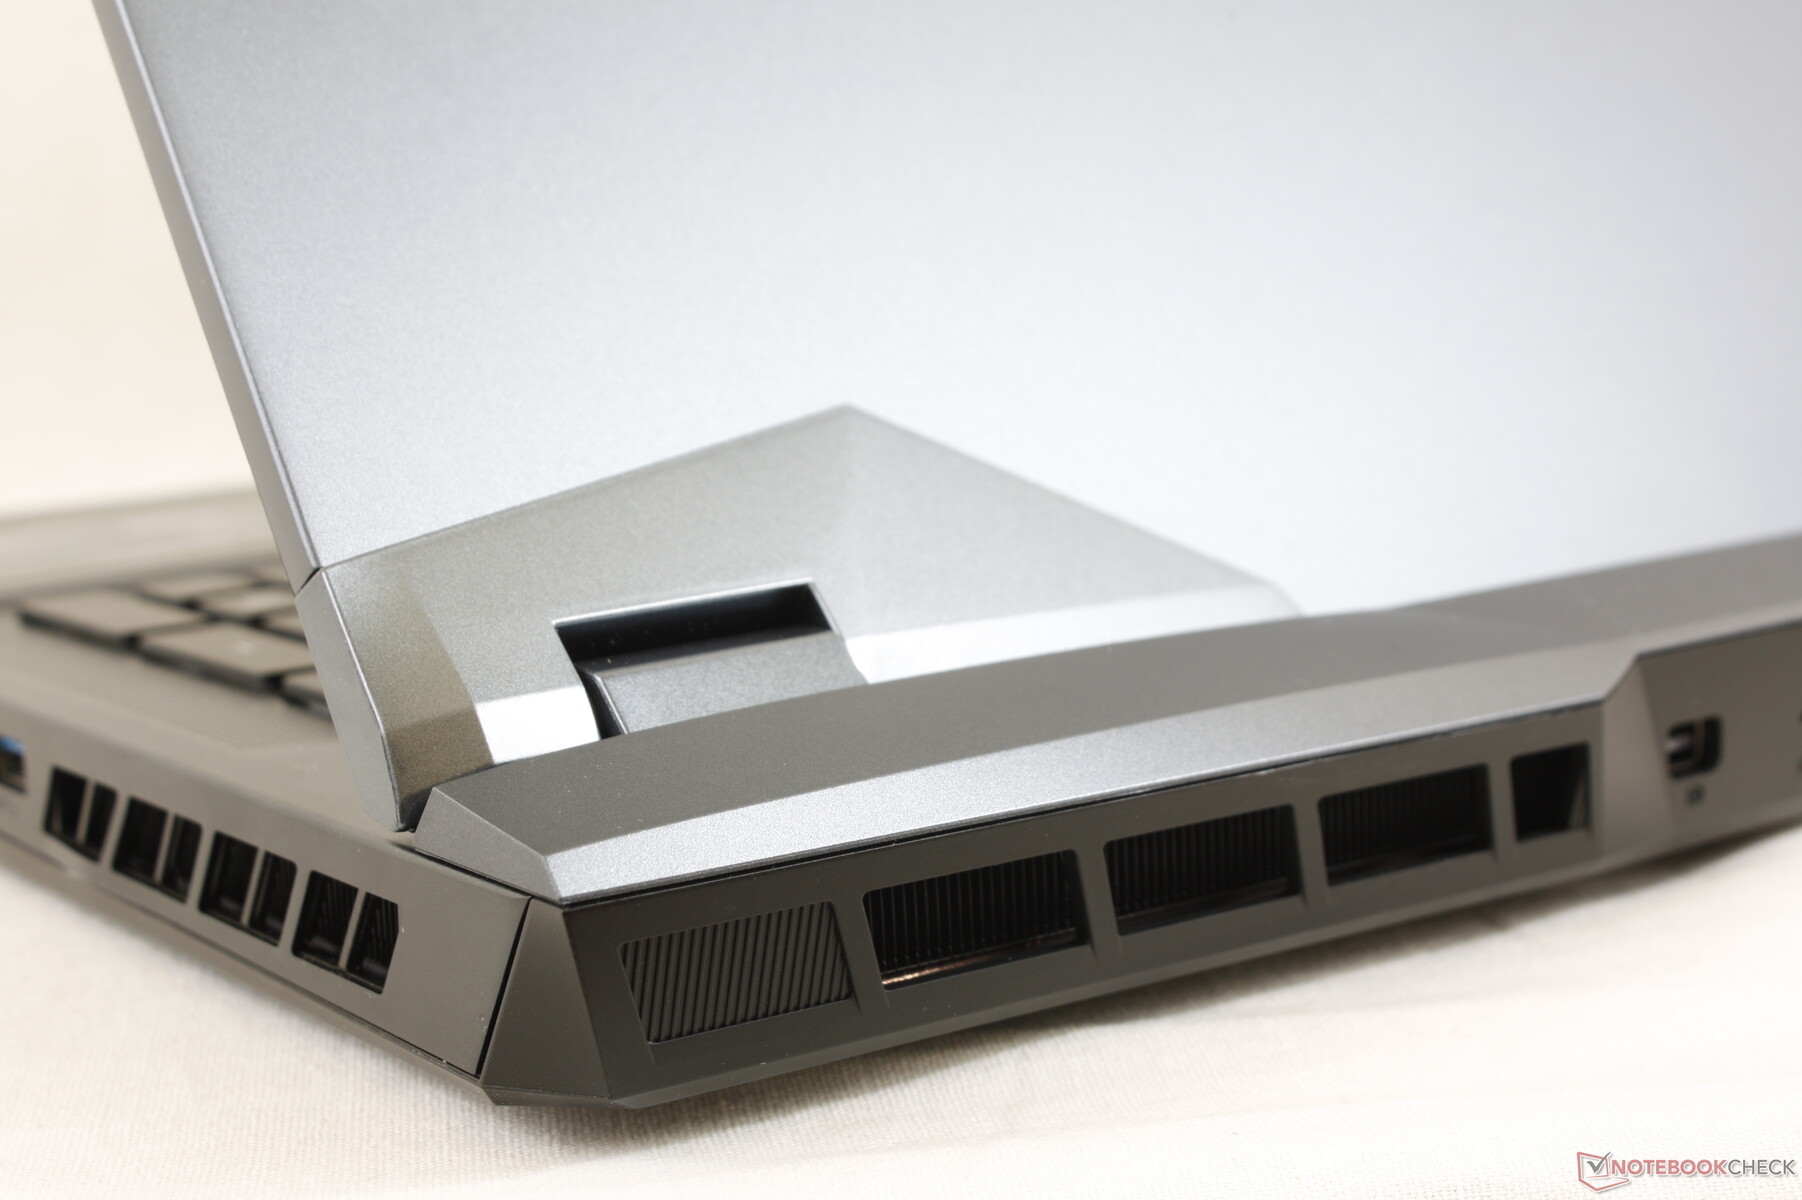
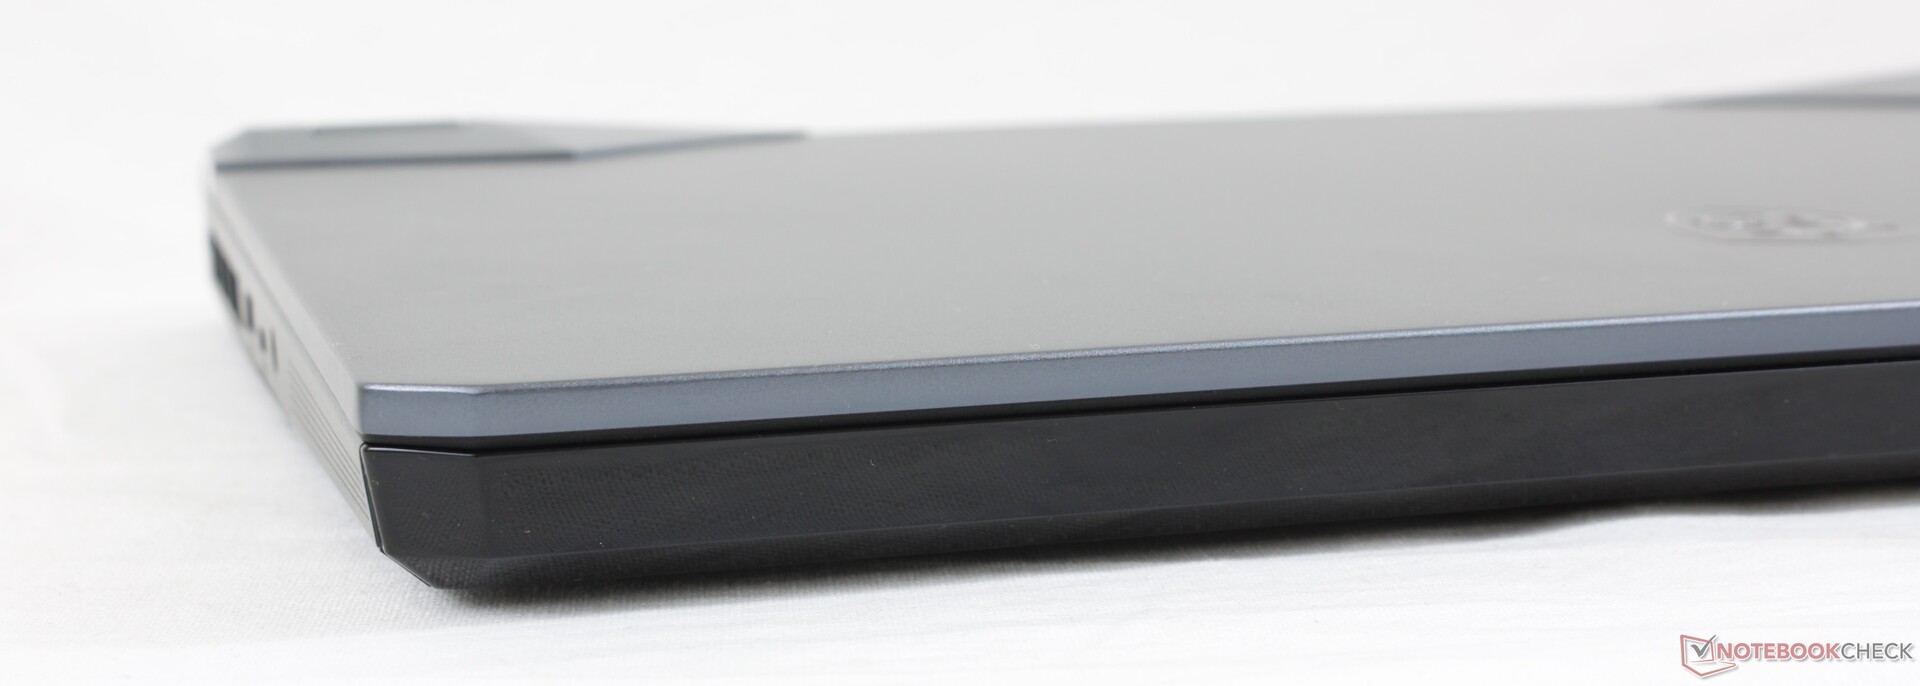
The visual design of the GE76 can be best described as a leaner GT76. Gone are the tacky red accent marks on the GE75 in favor of matte gray metal surfaces. Rigidity is firm all around including the front corners of the lid which was a weak spot on the GE75, but owners should be careful not to open the display too much or risk stressing the hinges.
The most distinguishing visual feature of the new design is the glossy LED light bar that extends across the entire front edge of the base. It's mostly visual flare and so it doesn't serve any practical purposes. Users can always disable or customize the lighting via the SteelSeries Engine 3 software as needed.
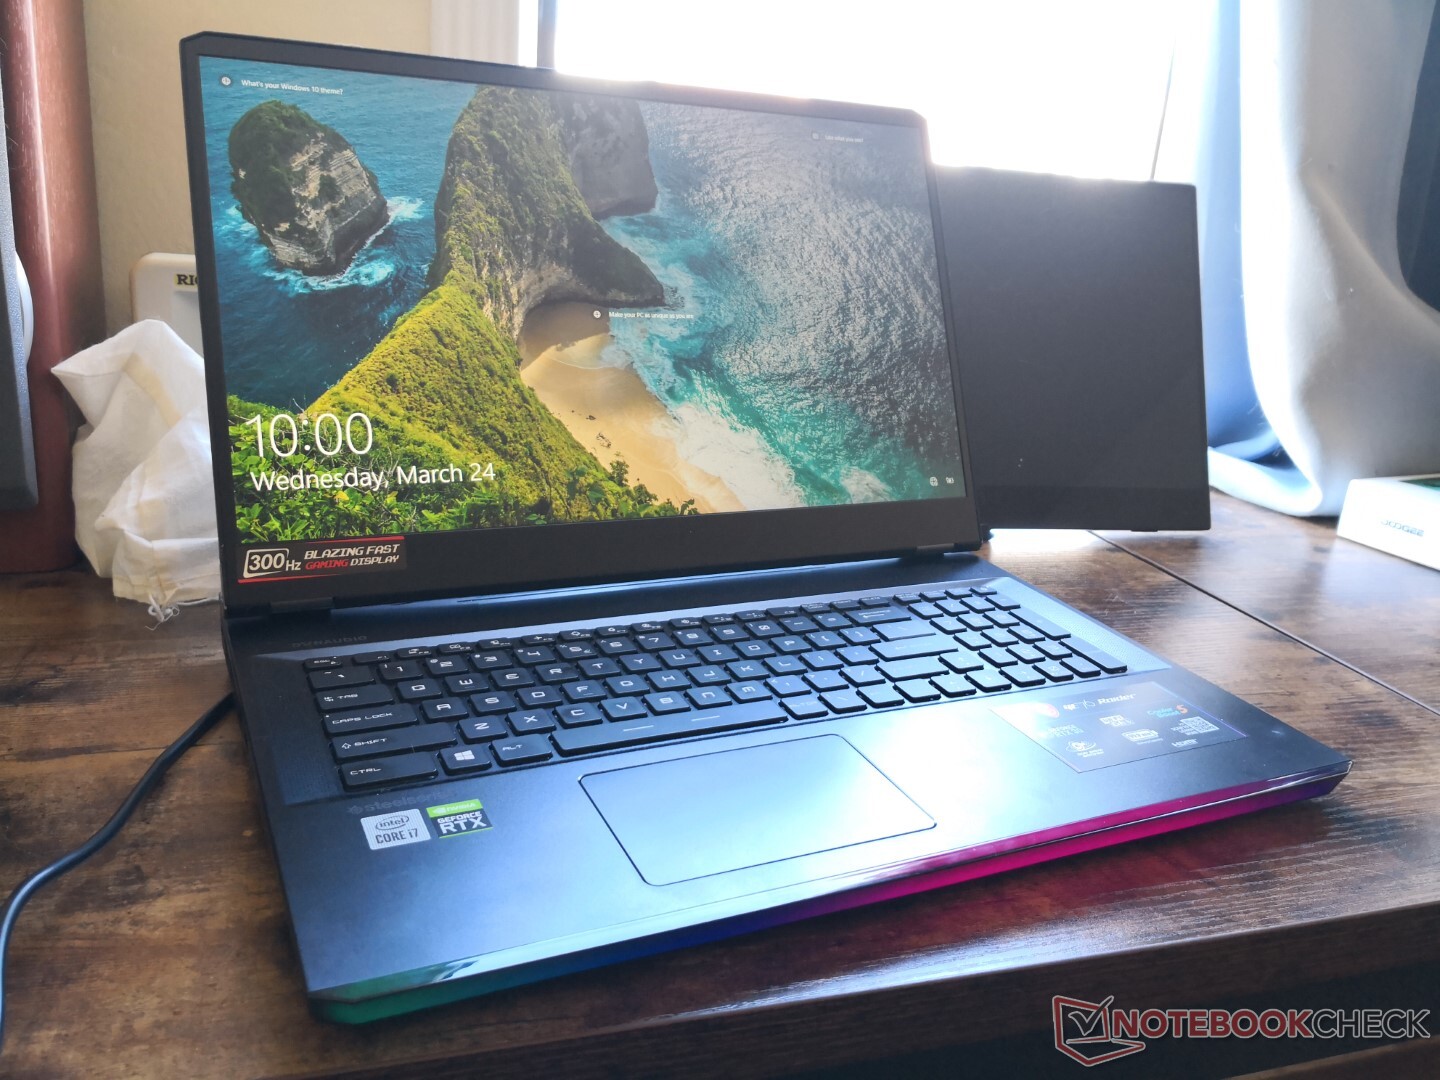
In terms of size and weight, the GE76 is a midway point between the ultra-thin GS series and ultra-thick GT series. It's worth noting that the system is nearly identical to the GE75 in all three dimensions even though the laptop itself is noticeably heavier by hundreds of grams. Thus, much of the weight gain can be attributed to all the internal changes designed to improve the cooling and battery life of the laptop.
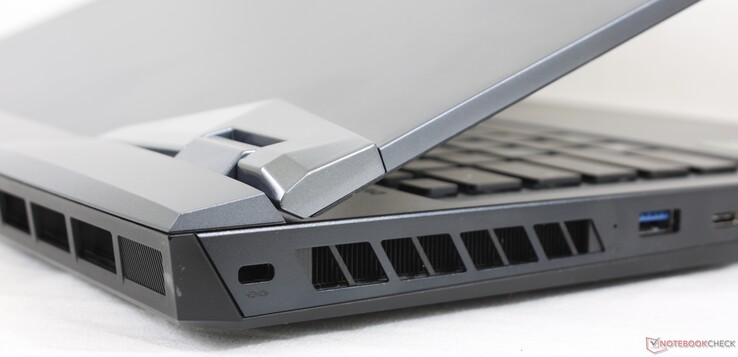
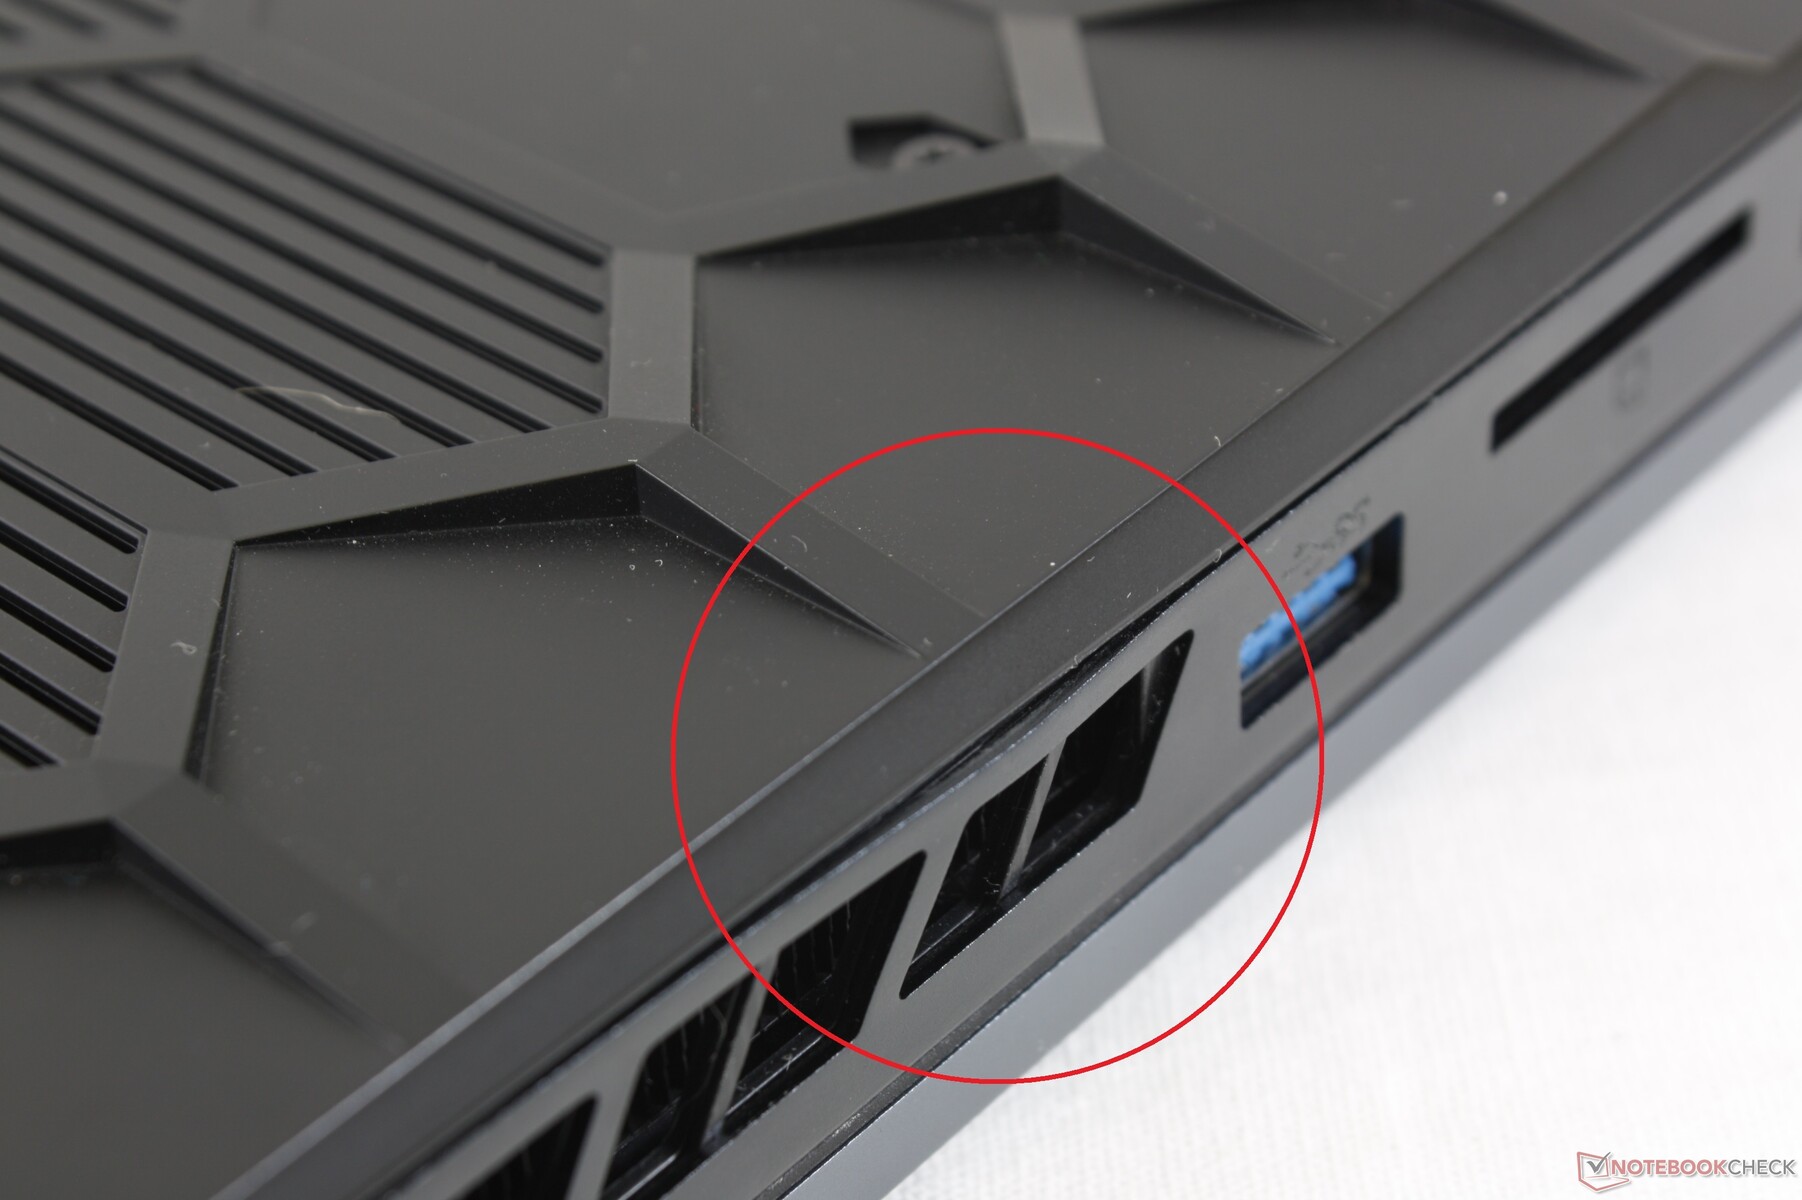
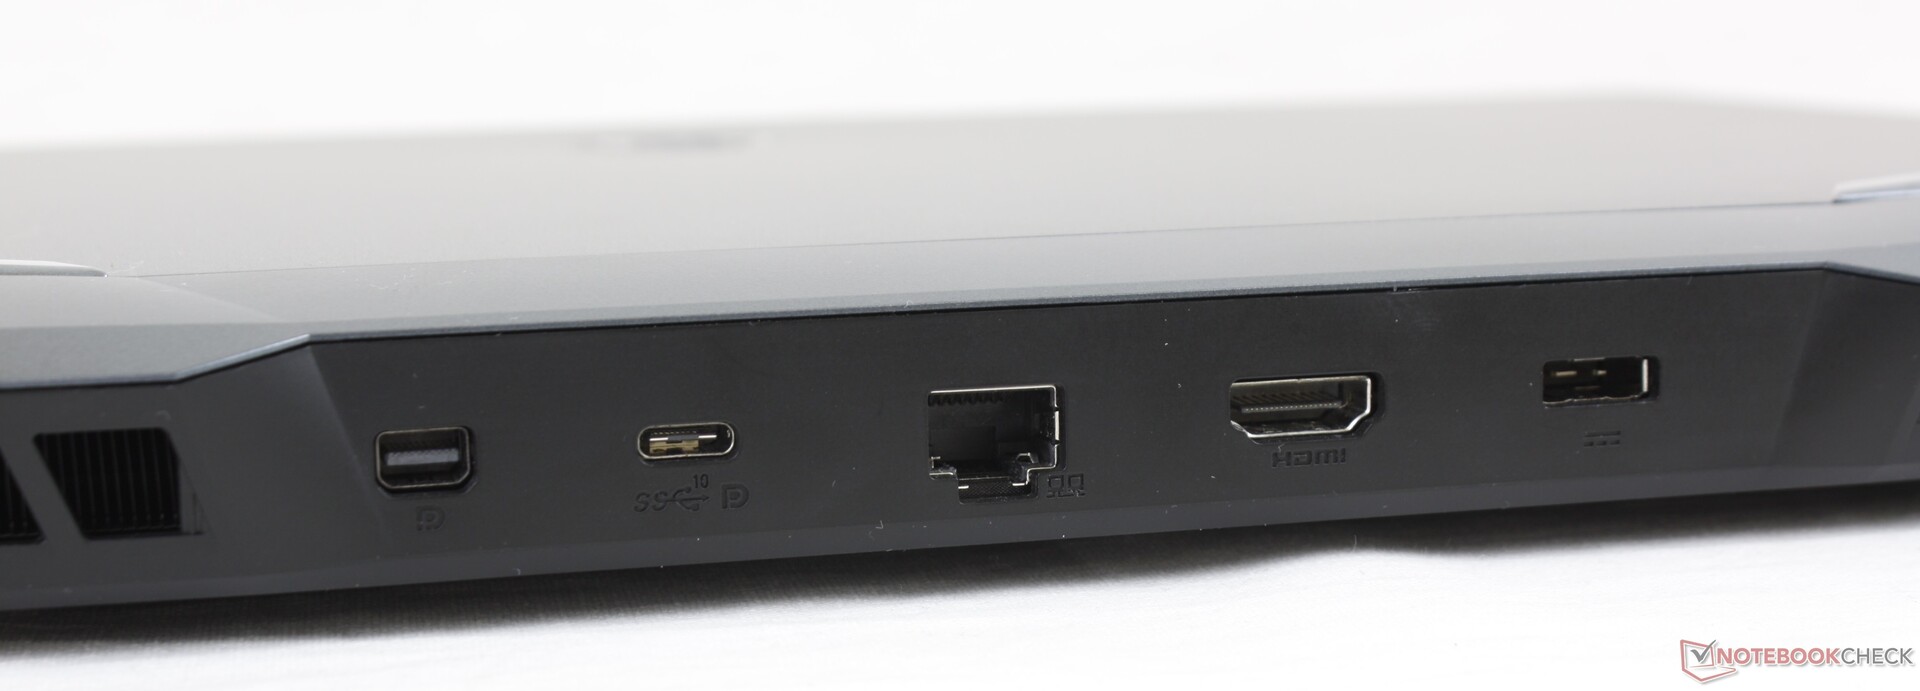
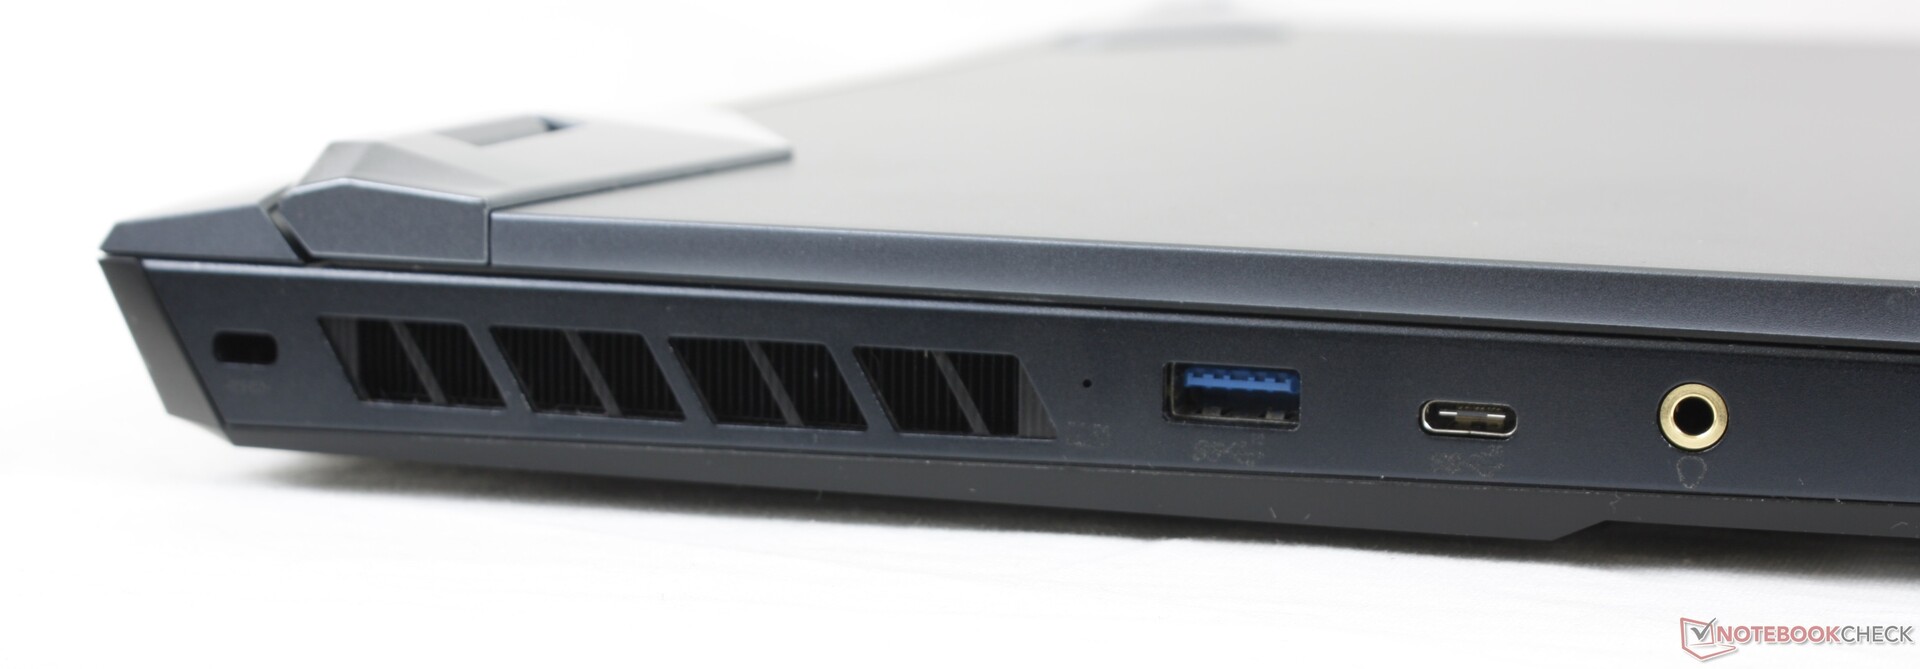
Connectivity
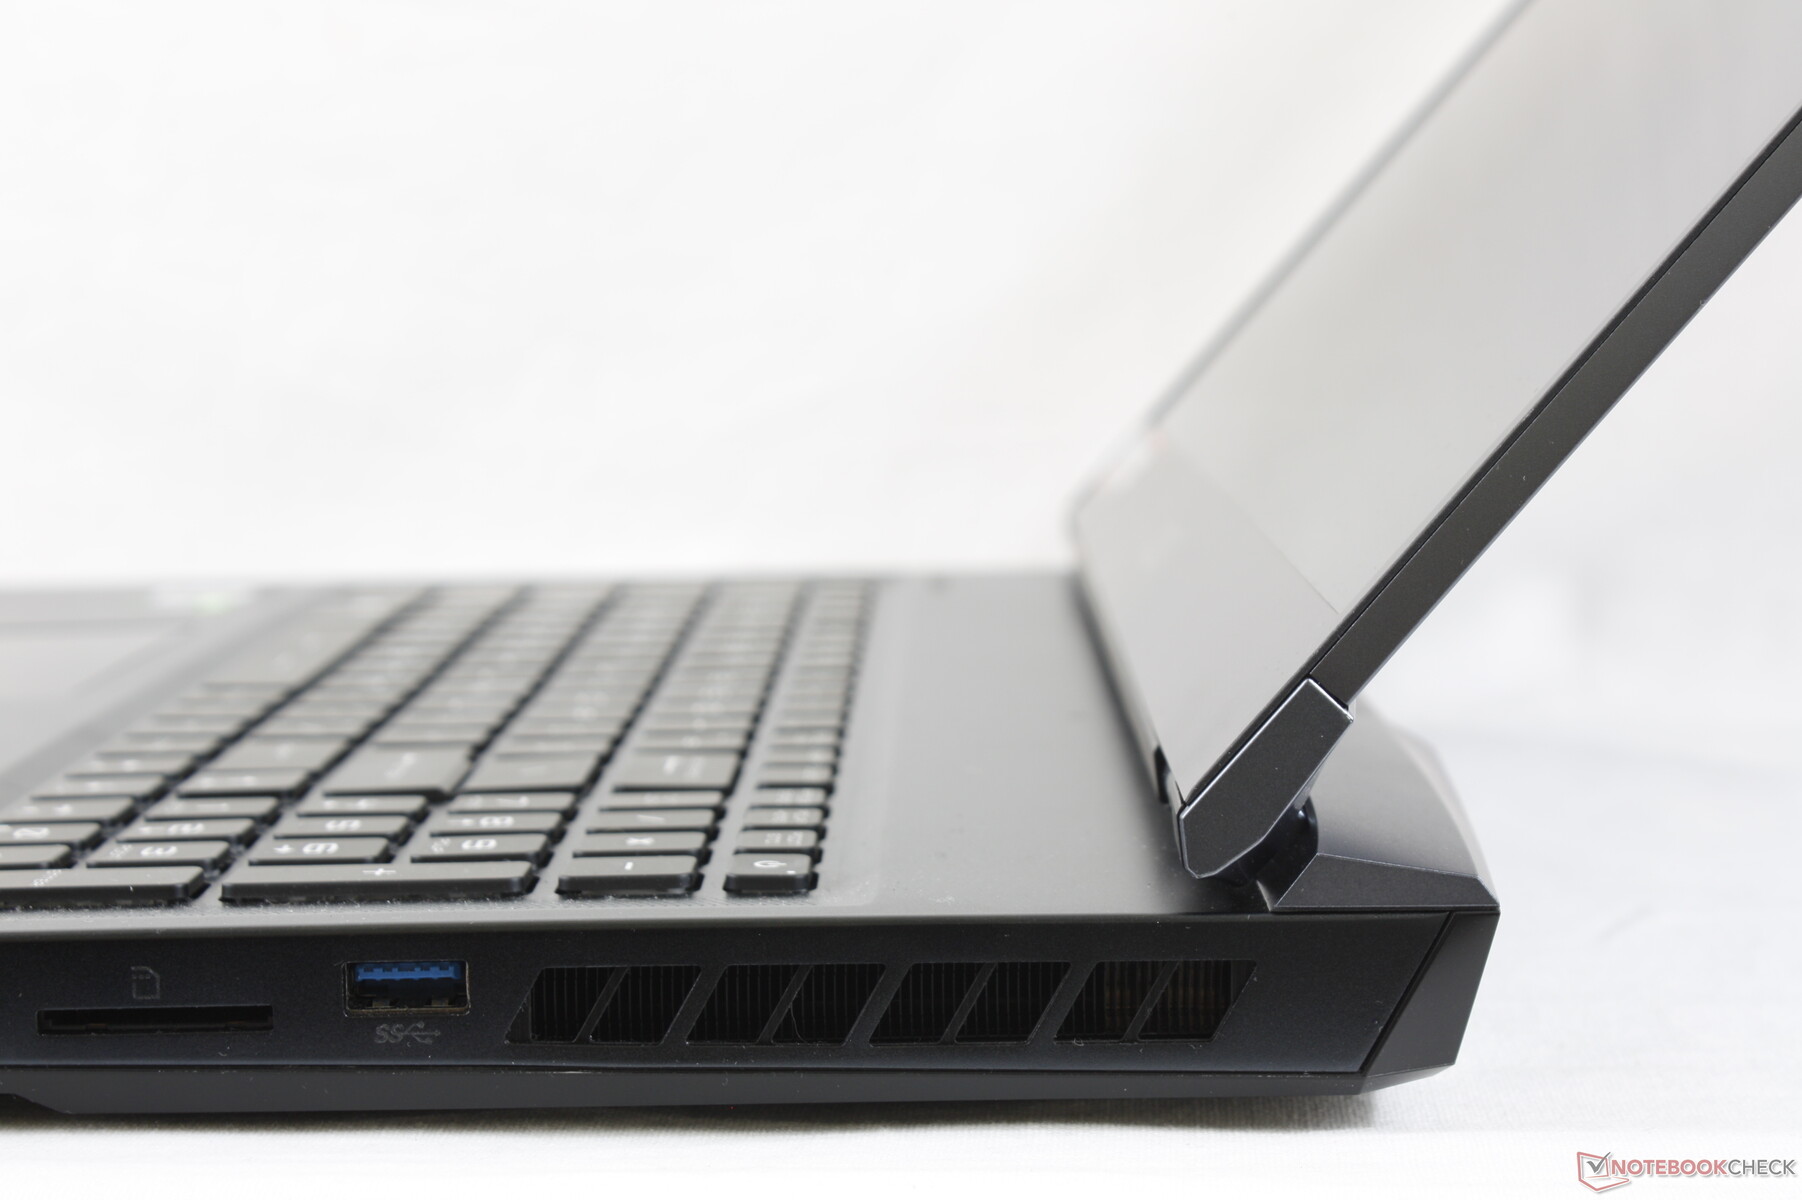
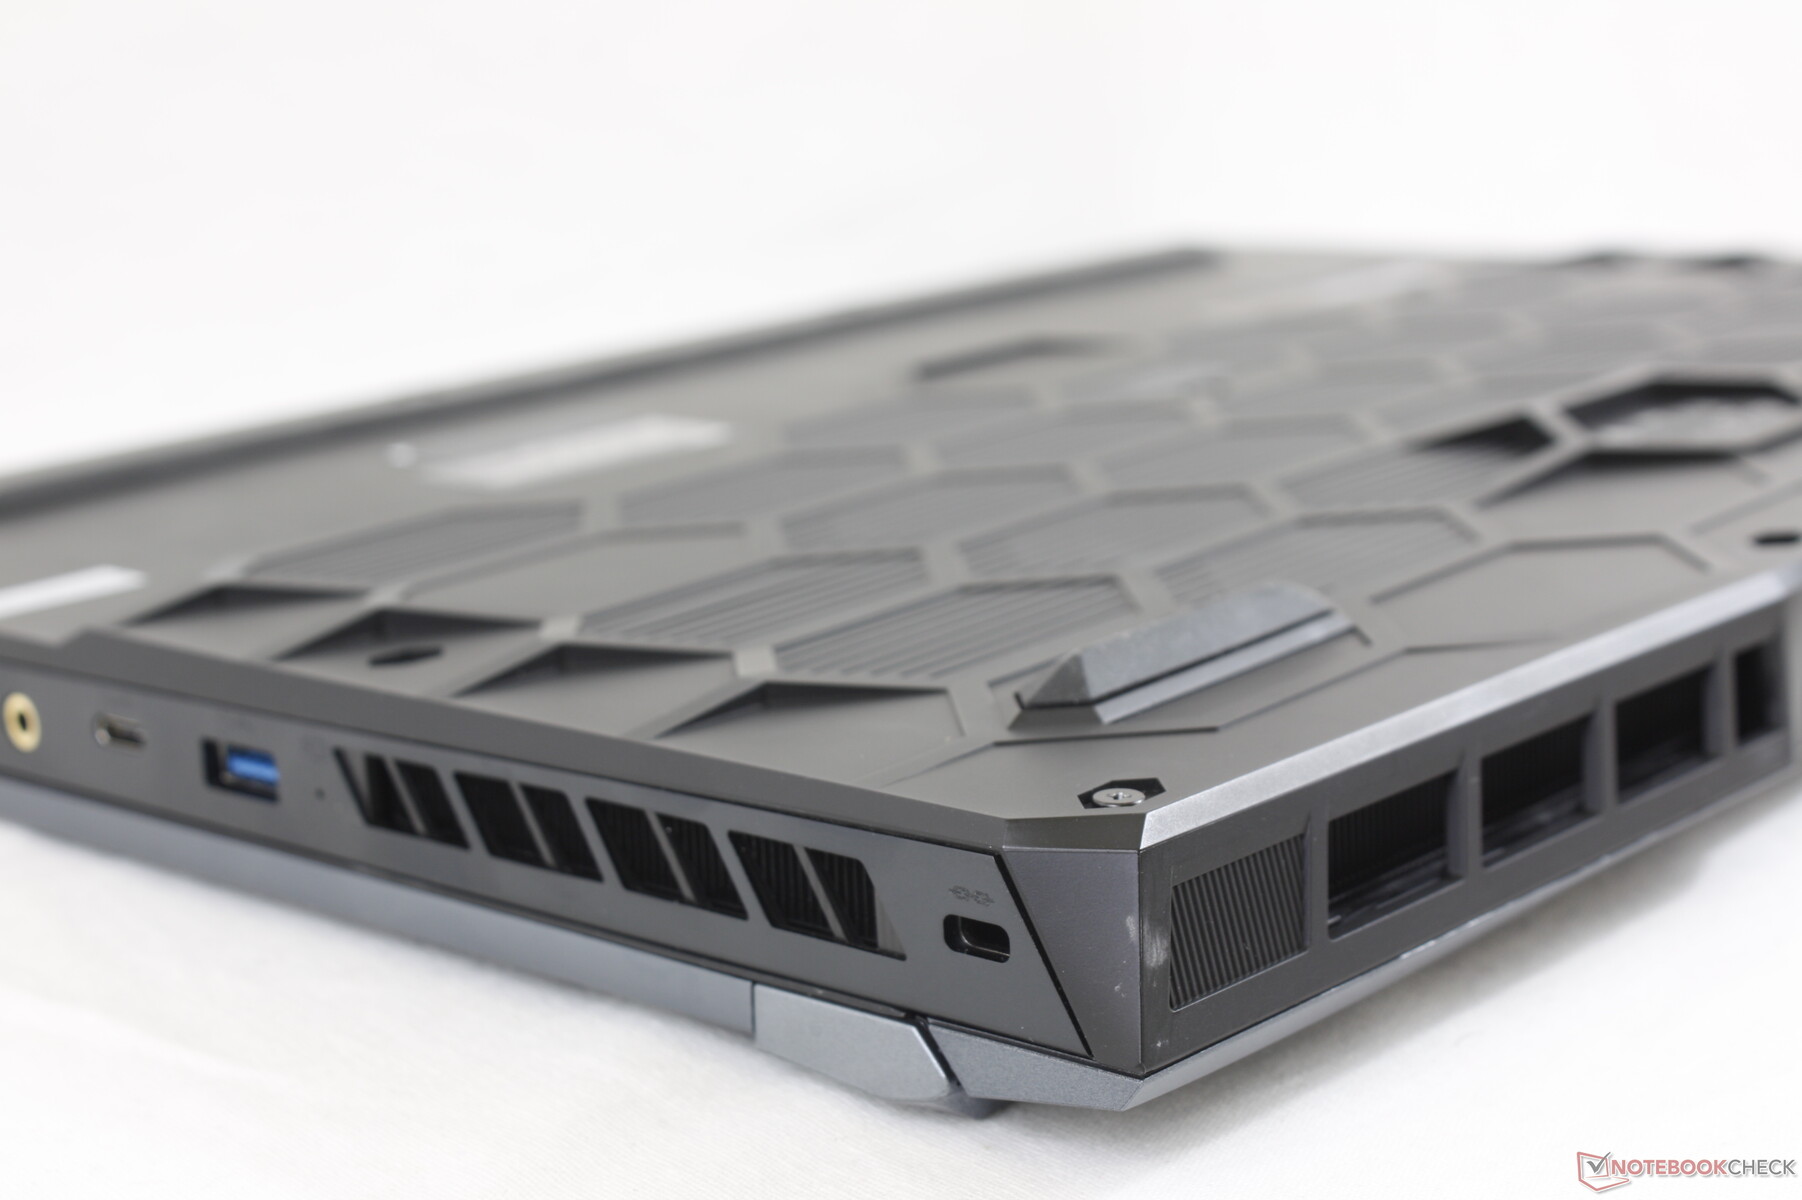
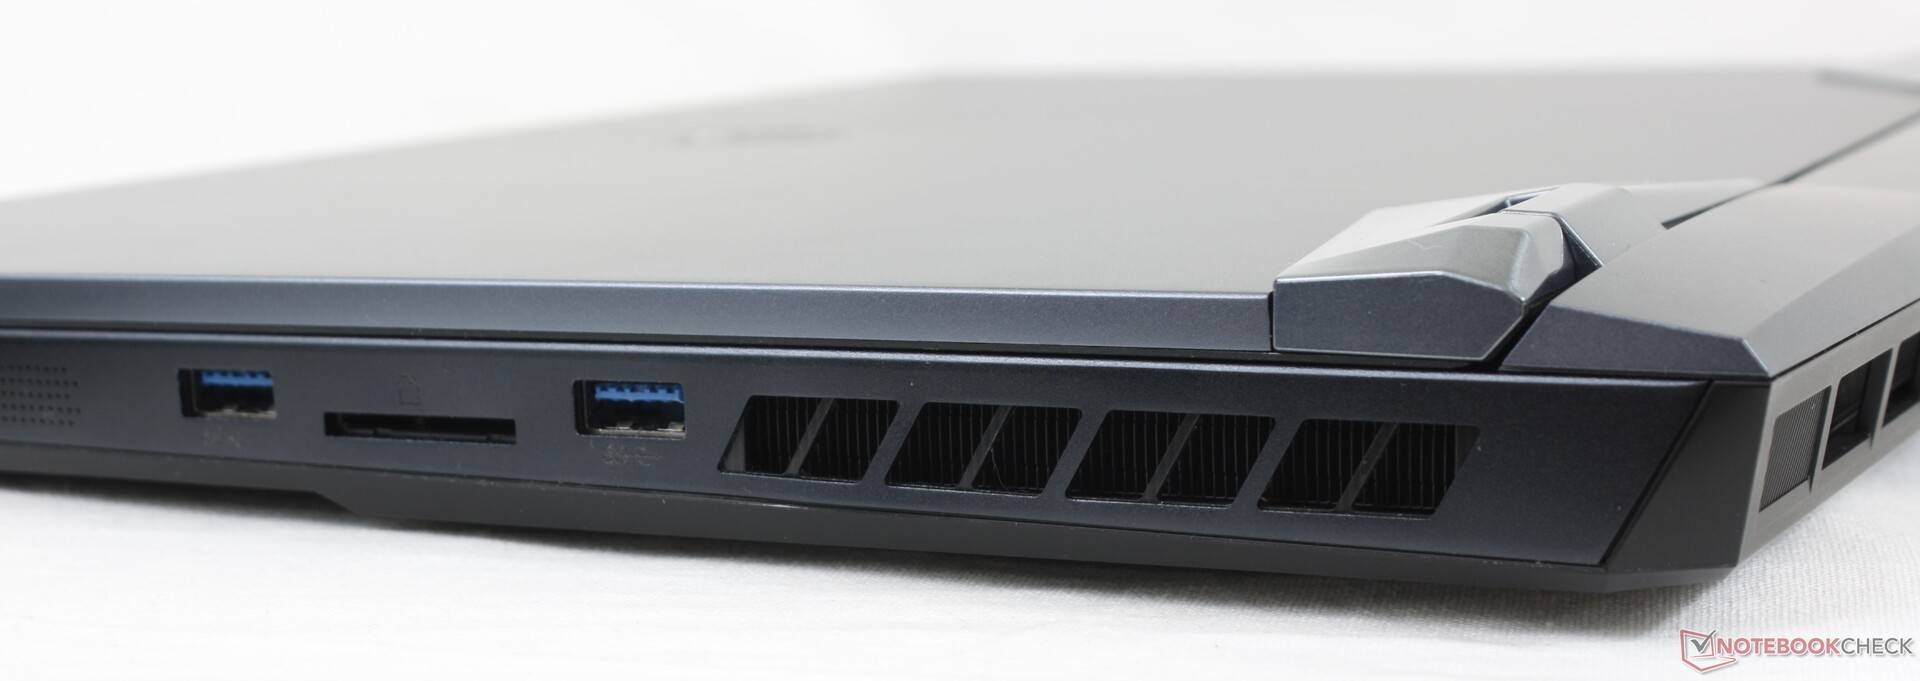
The GE76 addresses the tight port positioning of the GE75 by moving some of the ports to the rear edge of the chassis. It also adds an additional USB-C port albeit at the cost of a dedicated 3.5 mm microphone jack.
USB-C charging and Thunderbolt continue to be unsupported which is a shame for a gaming laptop in this price range. Competing models from Alienware and Razer support both features in comparison.
SD Card Reader
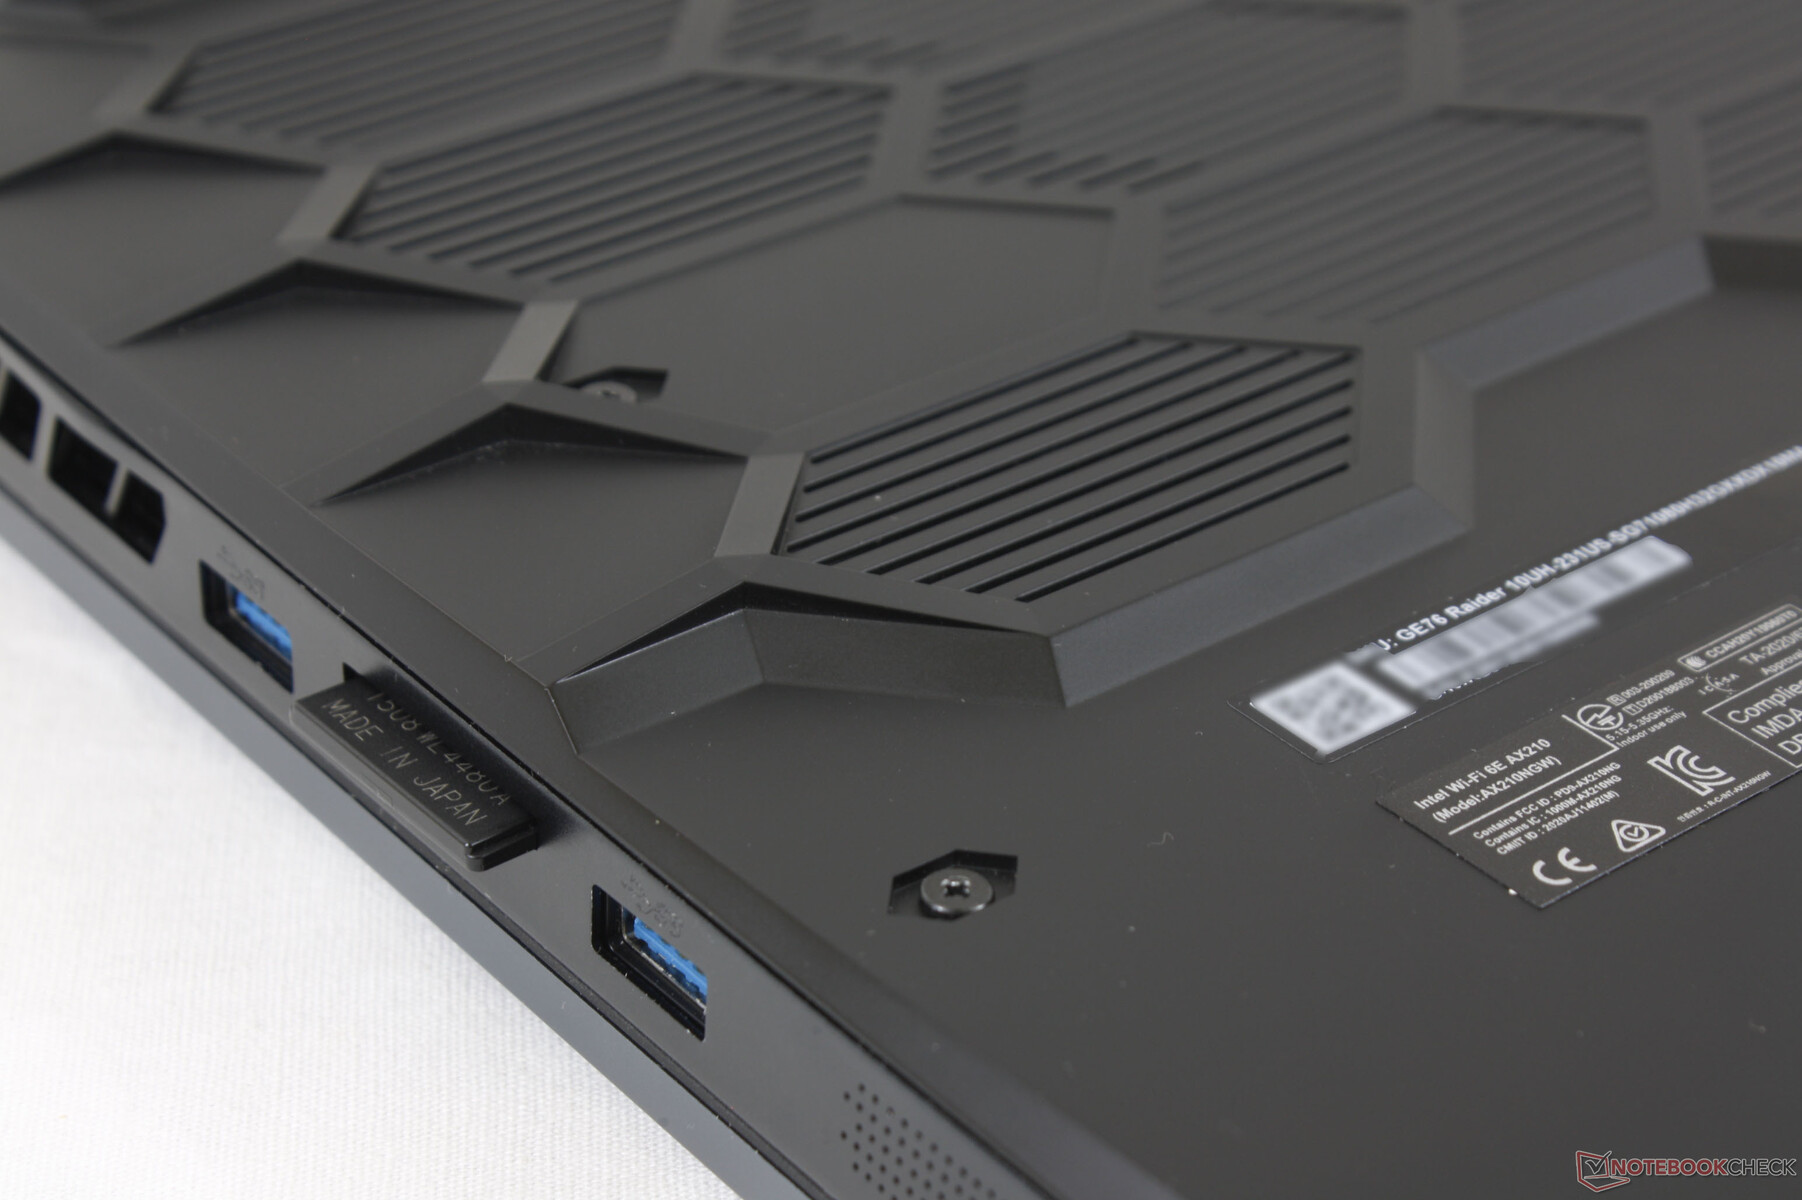
MSI has finally upped the transfer rates of its integrated SD card reader to be approximately 8x faster than the card reader on the older GE75. Content creators will certainly appreciate the higher bandwidth when transferring raw photos and movies to the laptop for editing.
| SD Card Reader | |
| average JPG Copy Test (av. of 3 runs) | |
| Alienware m17 R3 P45E (Toshiba Exceria Pro M501 UHS-II) | |
| MSI GE76 Raider 10UH (Toshiba Exceria Pro SDXC 64 GB UHS-II) | |
| MSI GT76 Titan DT 10SGS (Toshiba Exceria Pro M501 UHS-II) | |
| MSI GE75 8SG Raider (Toshiba Exceria Pro SDXC 64 GB UHS-II) | |
| Schenker XMG Core 17 Comet Lake (Toshiba Exceria Pro SDXC 64 GB UHS-II) | |
| maximum AS SSD Seq Read Test (1GB) | |
| Alienware m17 R3 P45E (Toshiba Exceria Pro M501 UHS-II) | |
| MSI GE76 Raider 10UH (Toshiba Exceria Pro SDXC 64 GB UHS-II) | |
| MSI GT76 Titan DT 10SGS (Toshiba Exceria Pro M501 UHS-II) | |
| MSI GE75 8SG Raider (Toshiba Exceria Pro SDXC 64 GB UHS-II) | |
| Schenker XMG Core 17 Comet Lake (Toshiba Exceria Pro SDXC 64 GB UHS-II) | |
Communication
The GE76 is one of the first laptops to support 6 GHz Wi-Fi 6E for even faster wireless transfers and lower latency. Our Netgear RAX200 test router, however, doesn't support the standard and so we can't yet test the benefits of Wi-Fi 6E as of this writing. Real-world transfer rates are where we expect them to be for a Wi-Fi 6 product even though they make take a couple of seconds longer than usual before reaching maximum.

Webcam


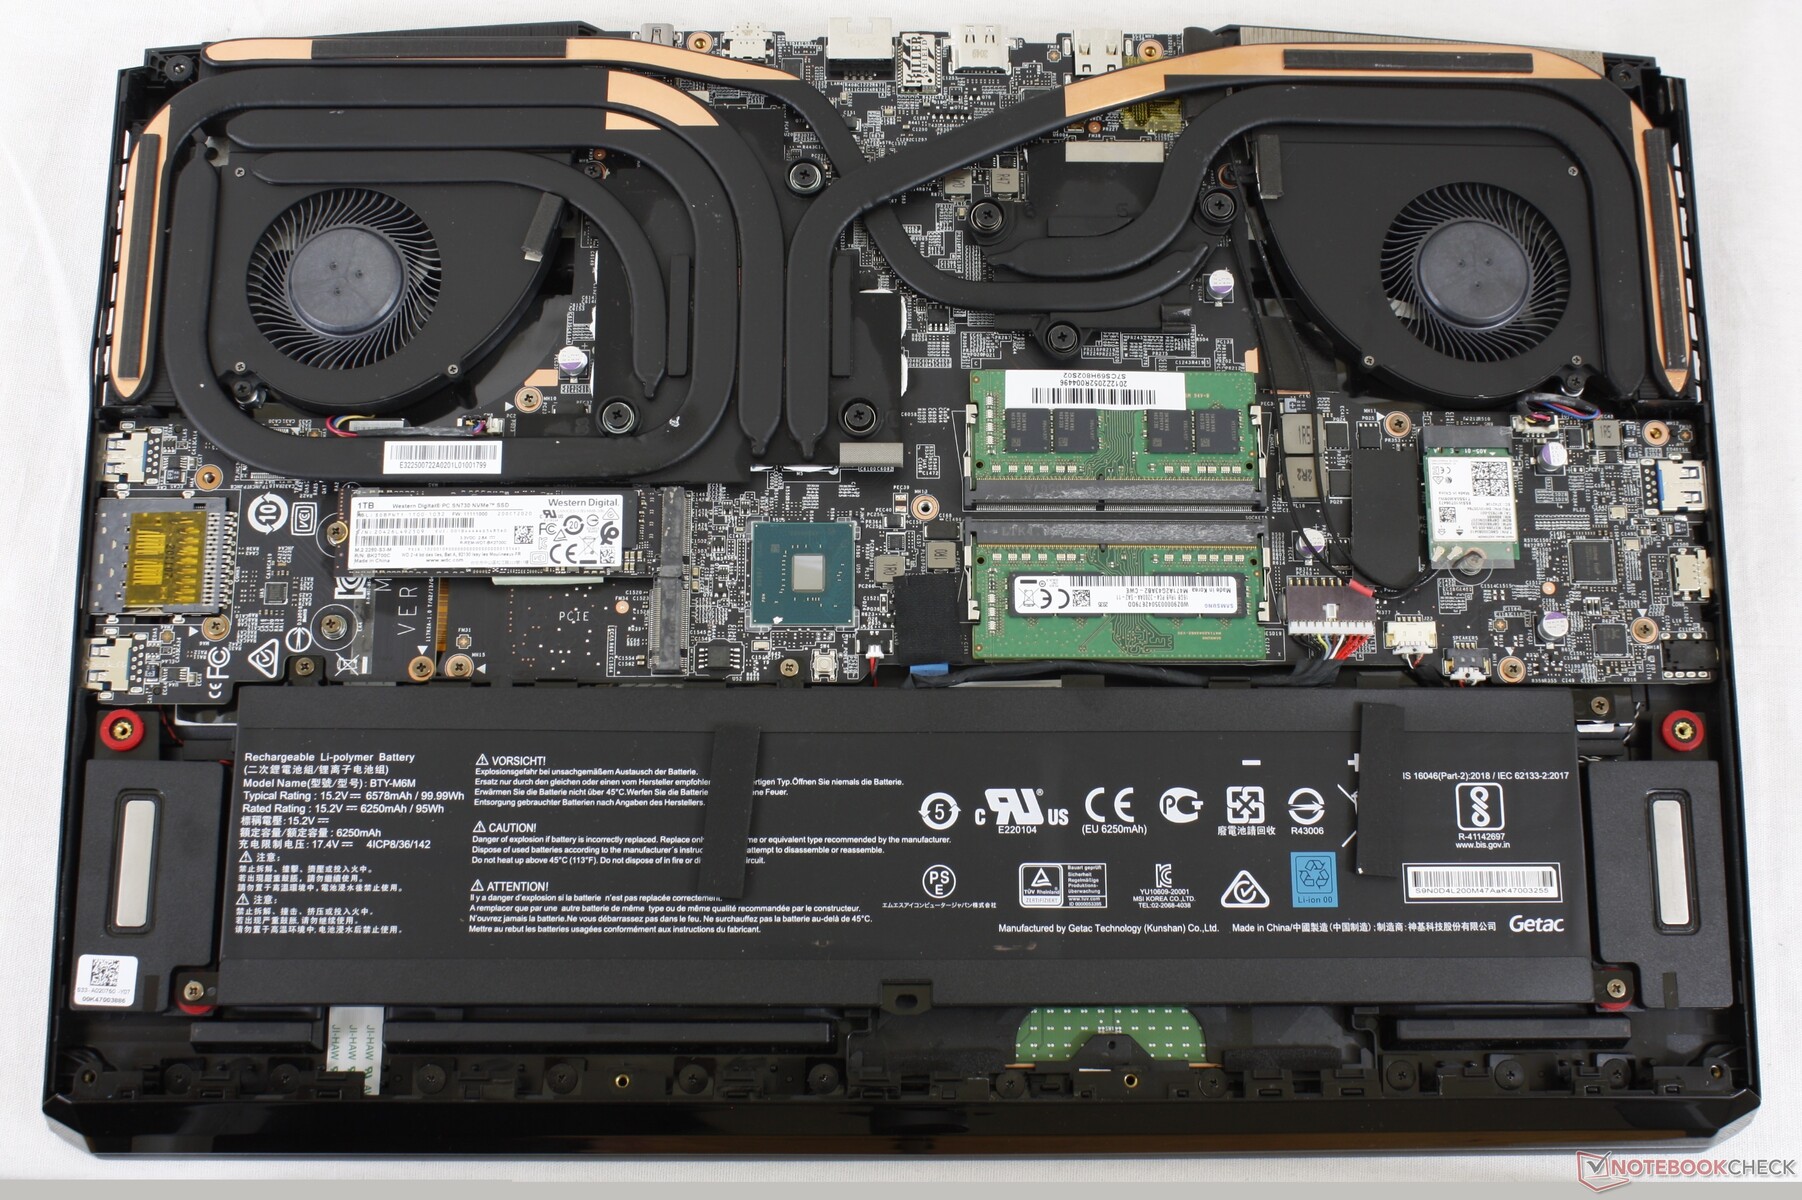
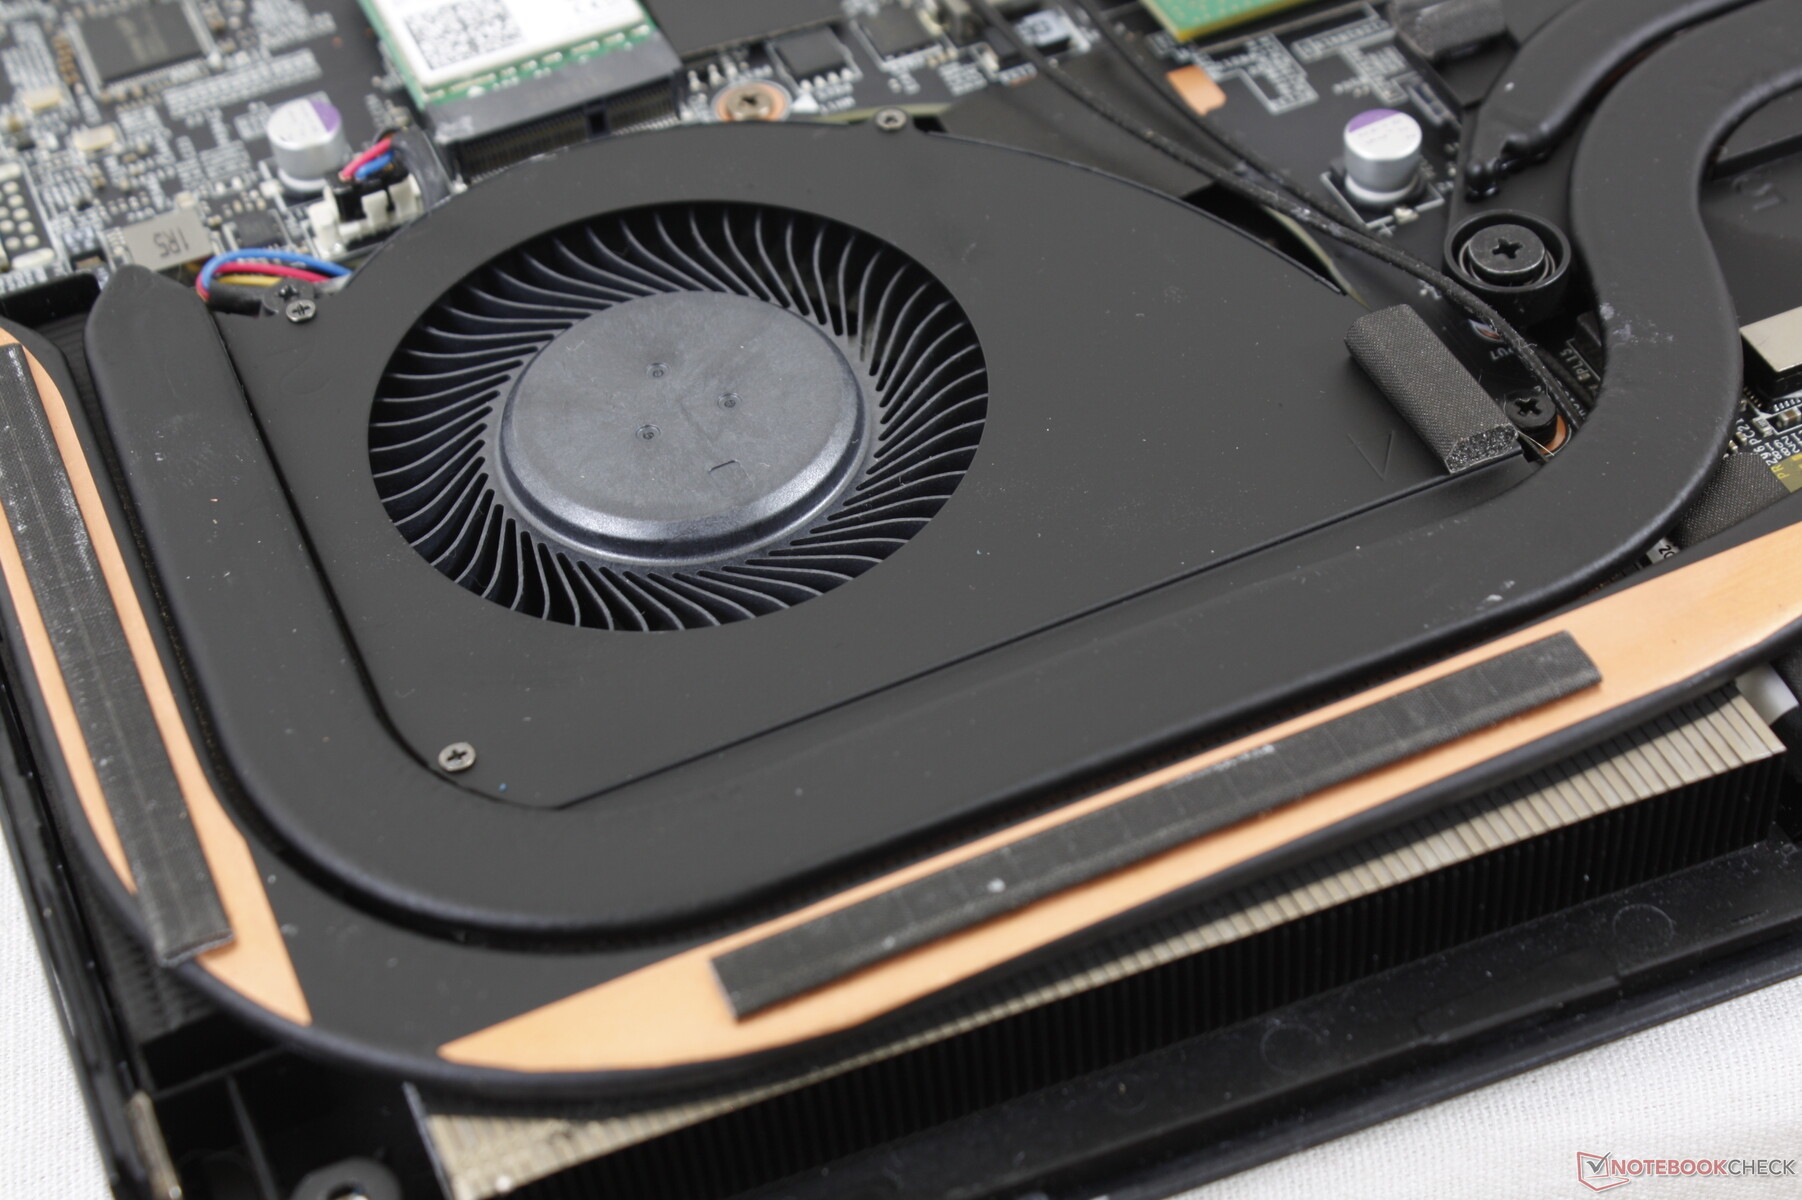
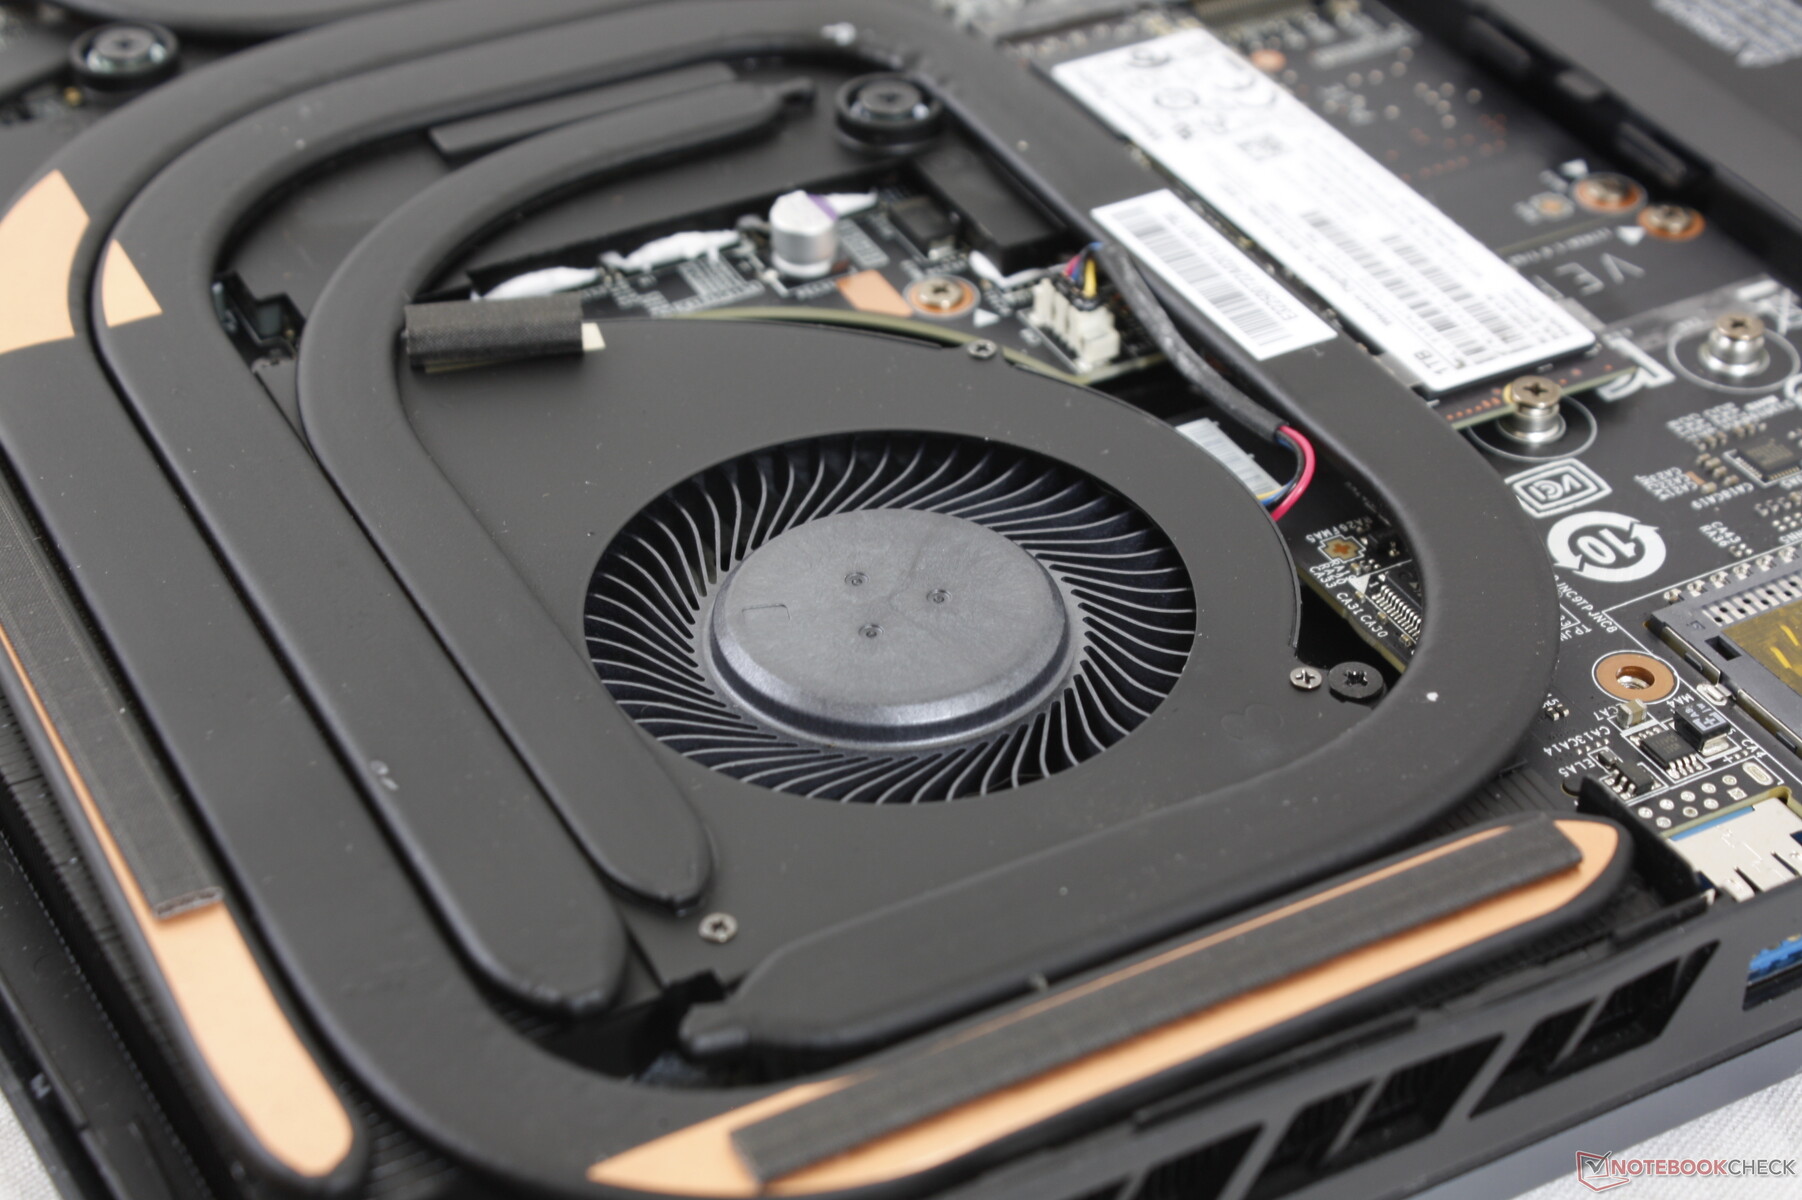
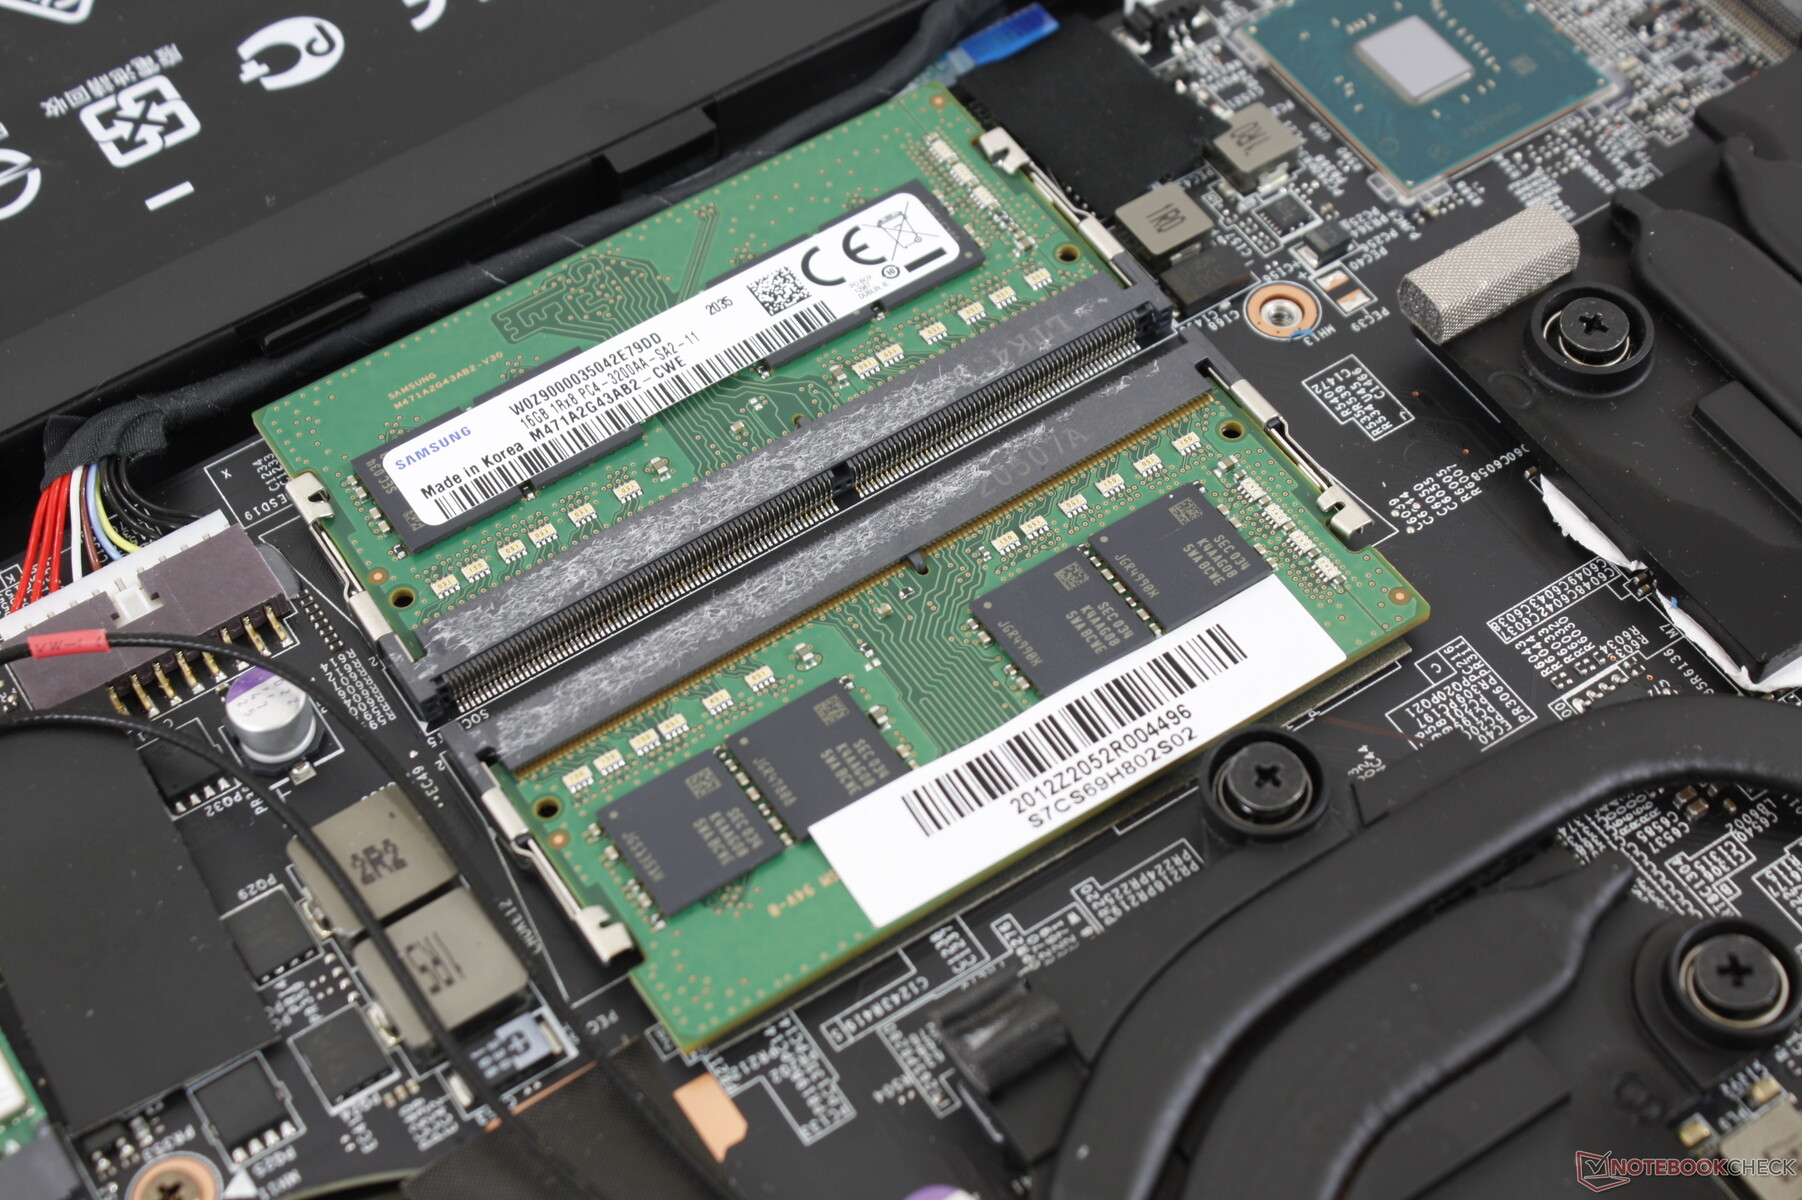
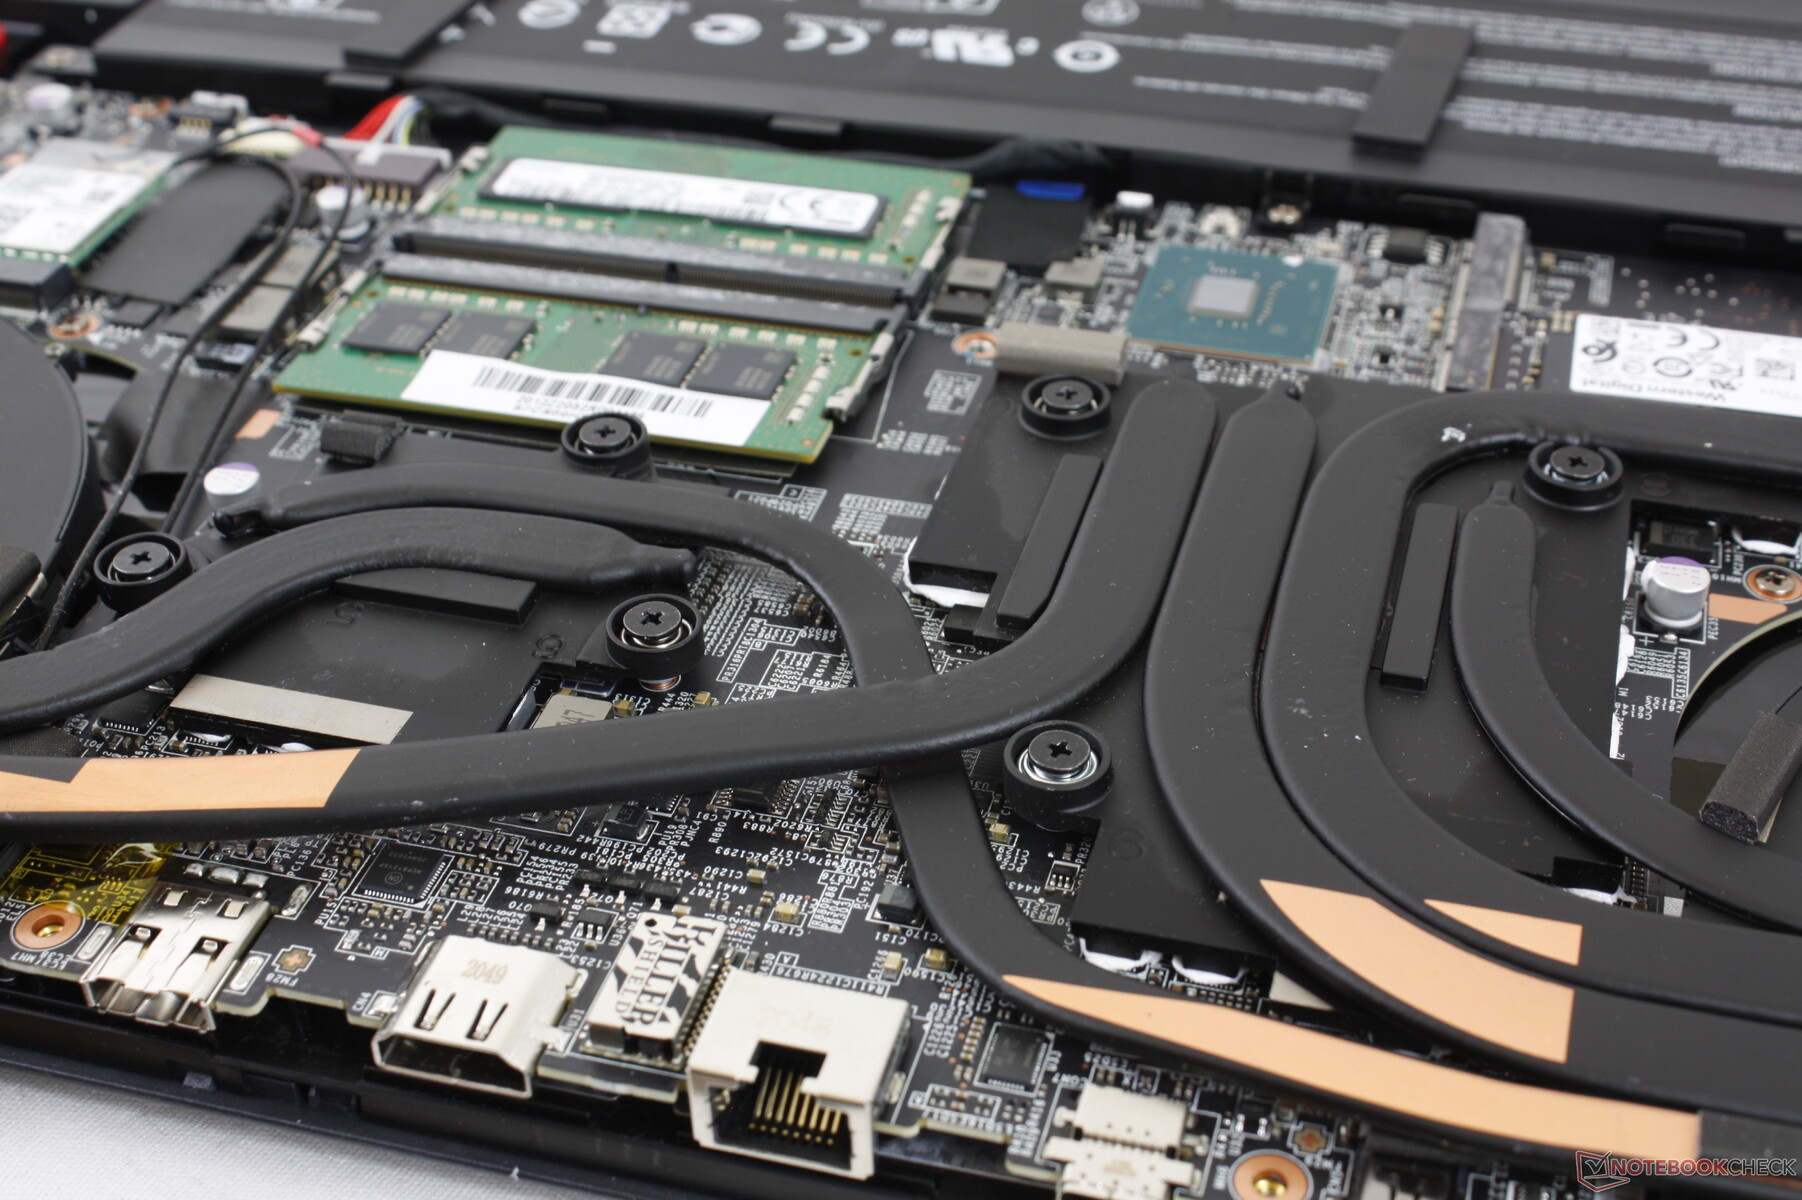
Maintenance
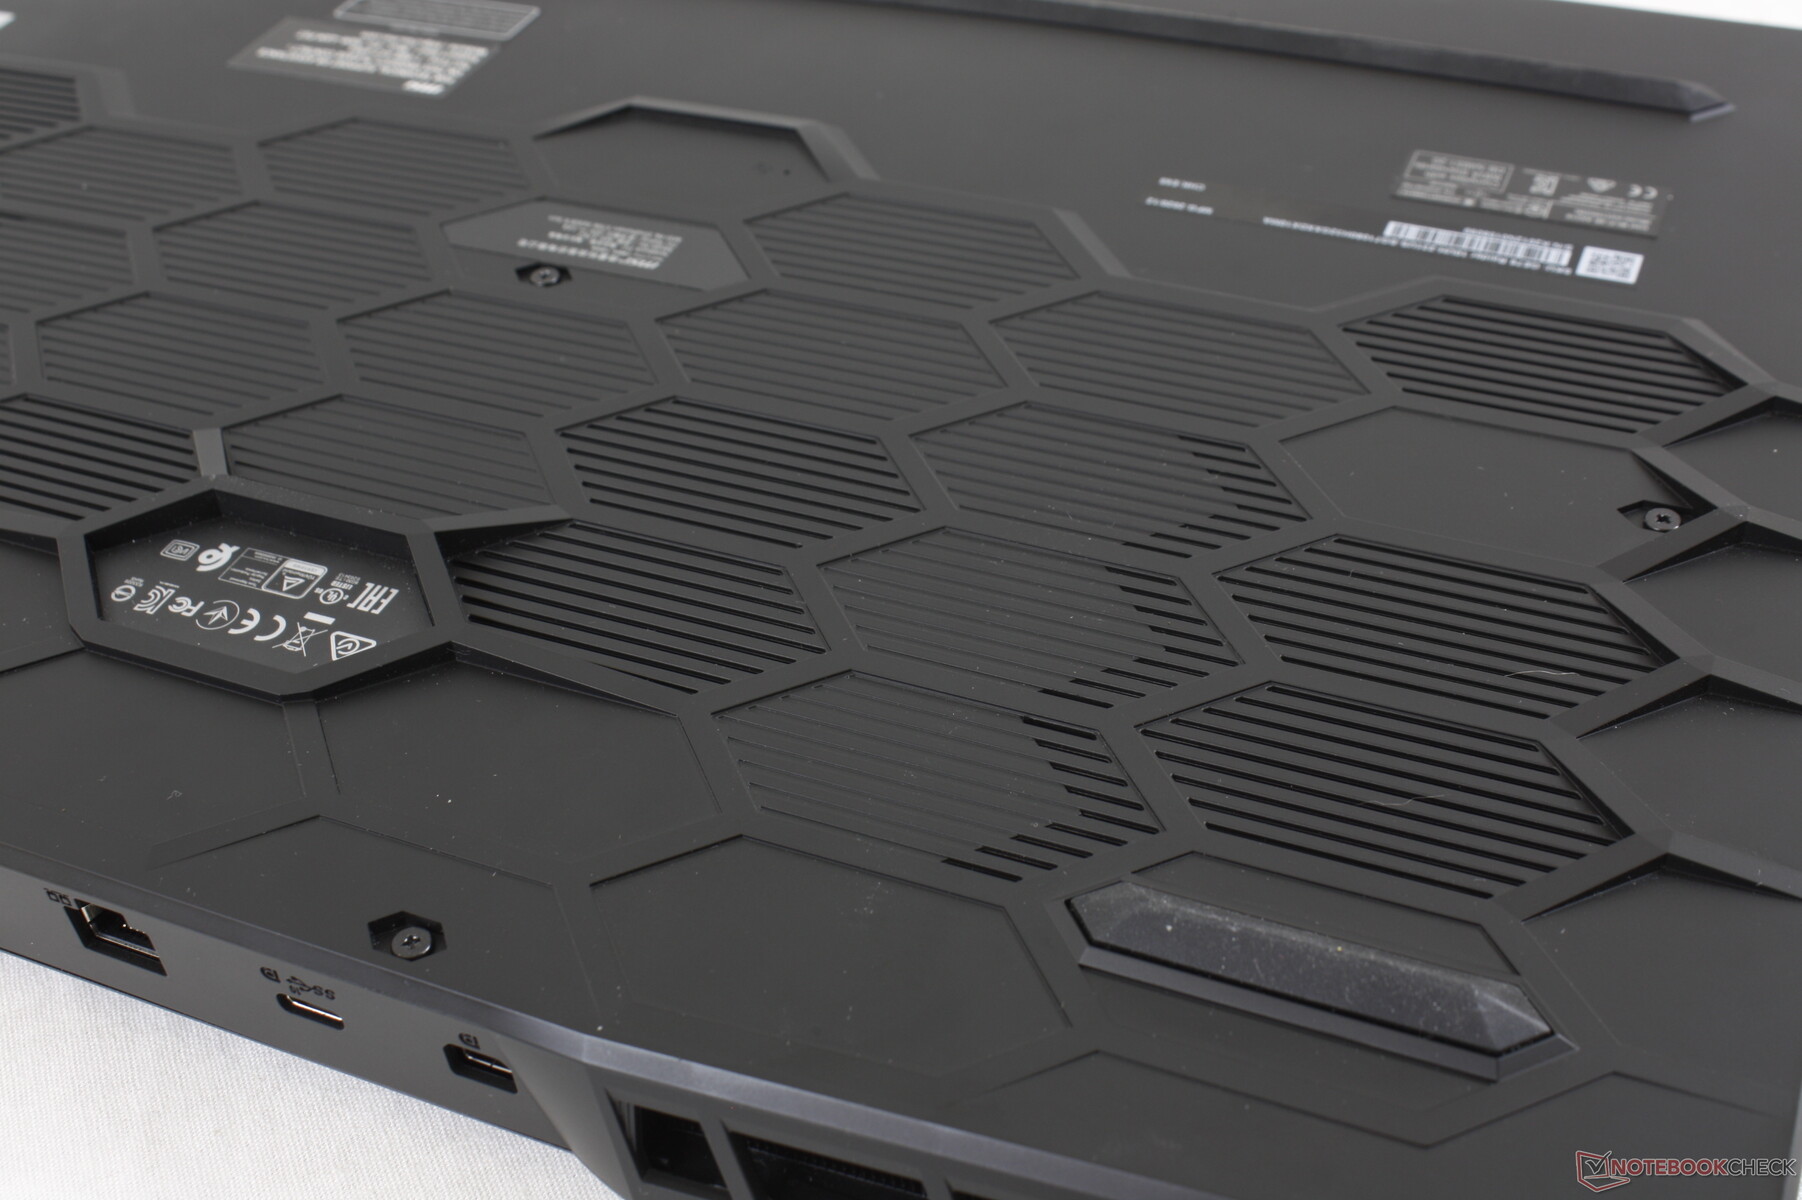
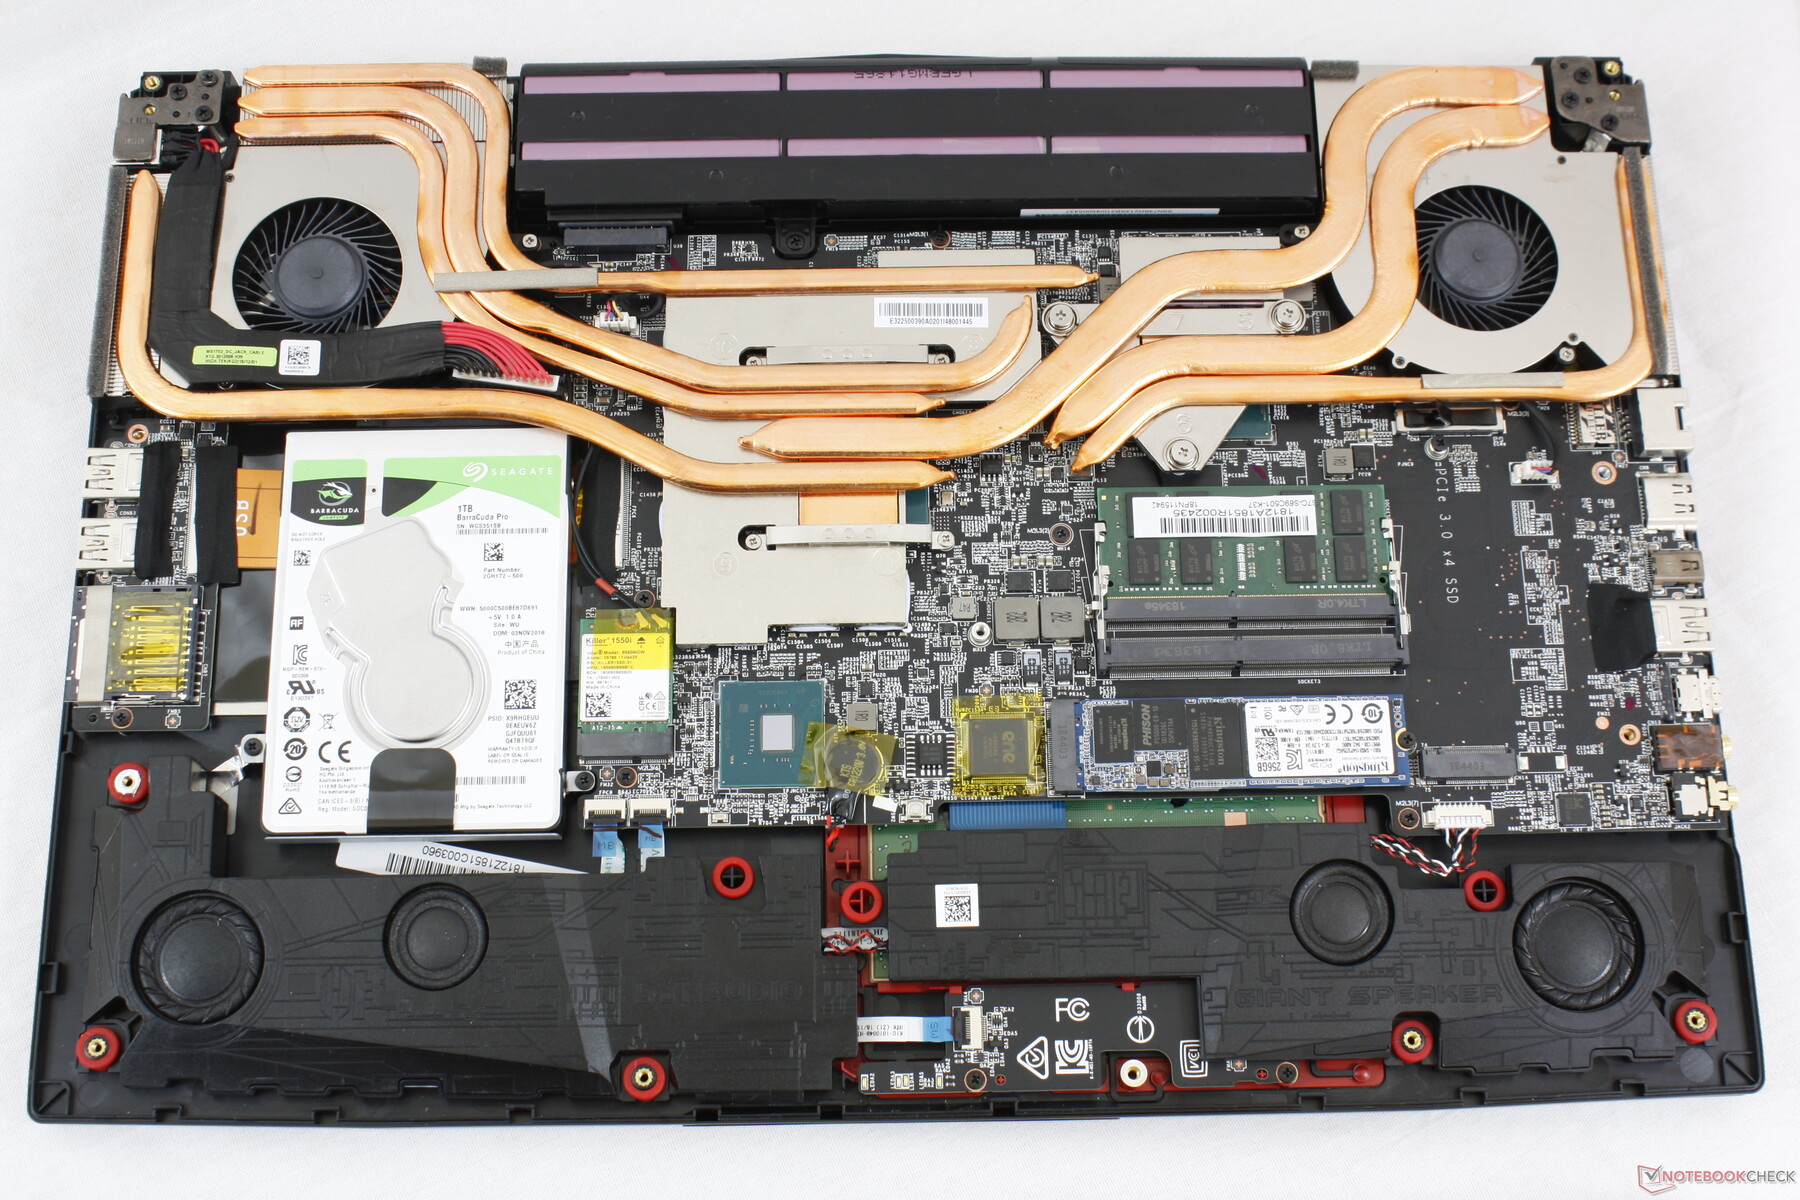
The bottom panel is secured by 13 Philips screws with one underneath a 'Factory Seal' sticker. Though servicing is relatively easy, the plate is slightly more difficult to snap back on than it is to remove. There are major changes from the GE75 as shown by the pictures below.
Accessories and Warranty
There are no extras in the box other than the AC adapter and warranty card. A velvet cleaning cloth would have been nice. Warranty is the usual one-year limited manufacturer protection.
Input Devices
Keyboard
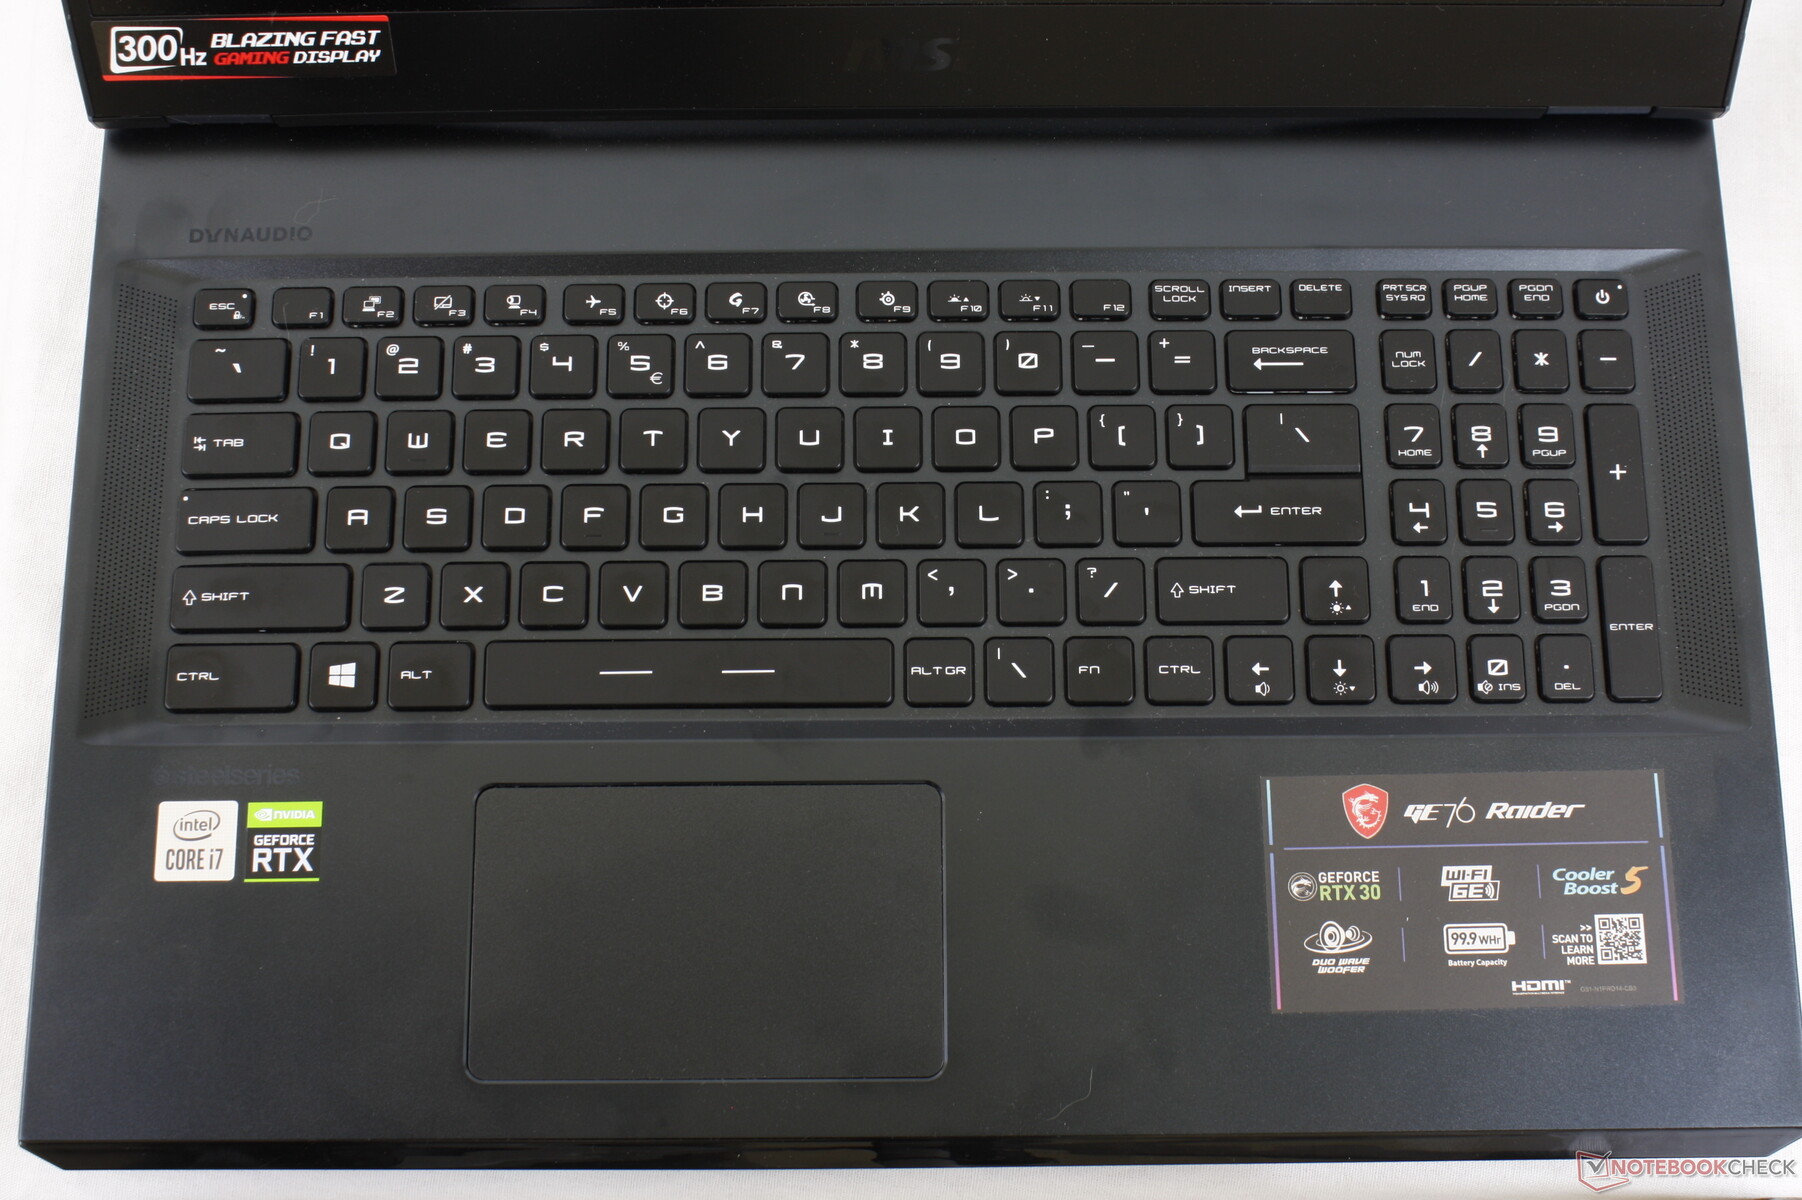
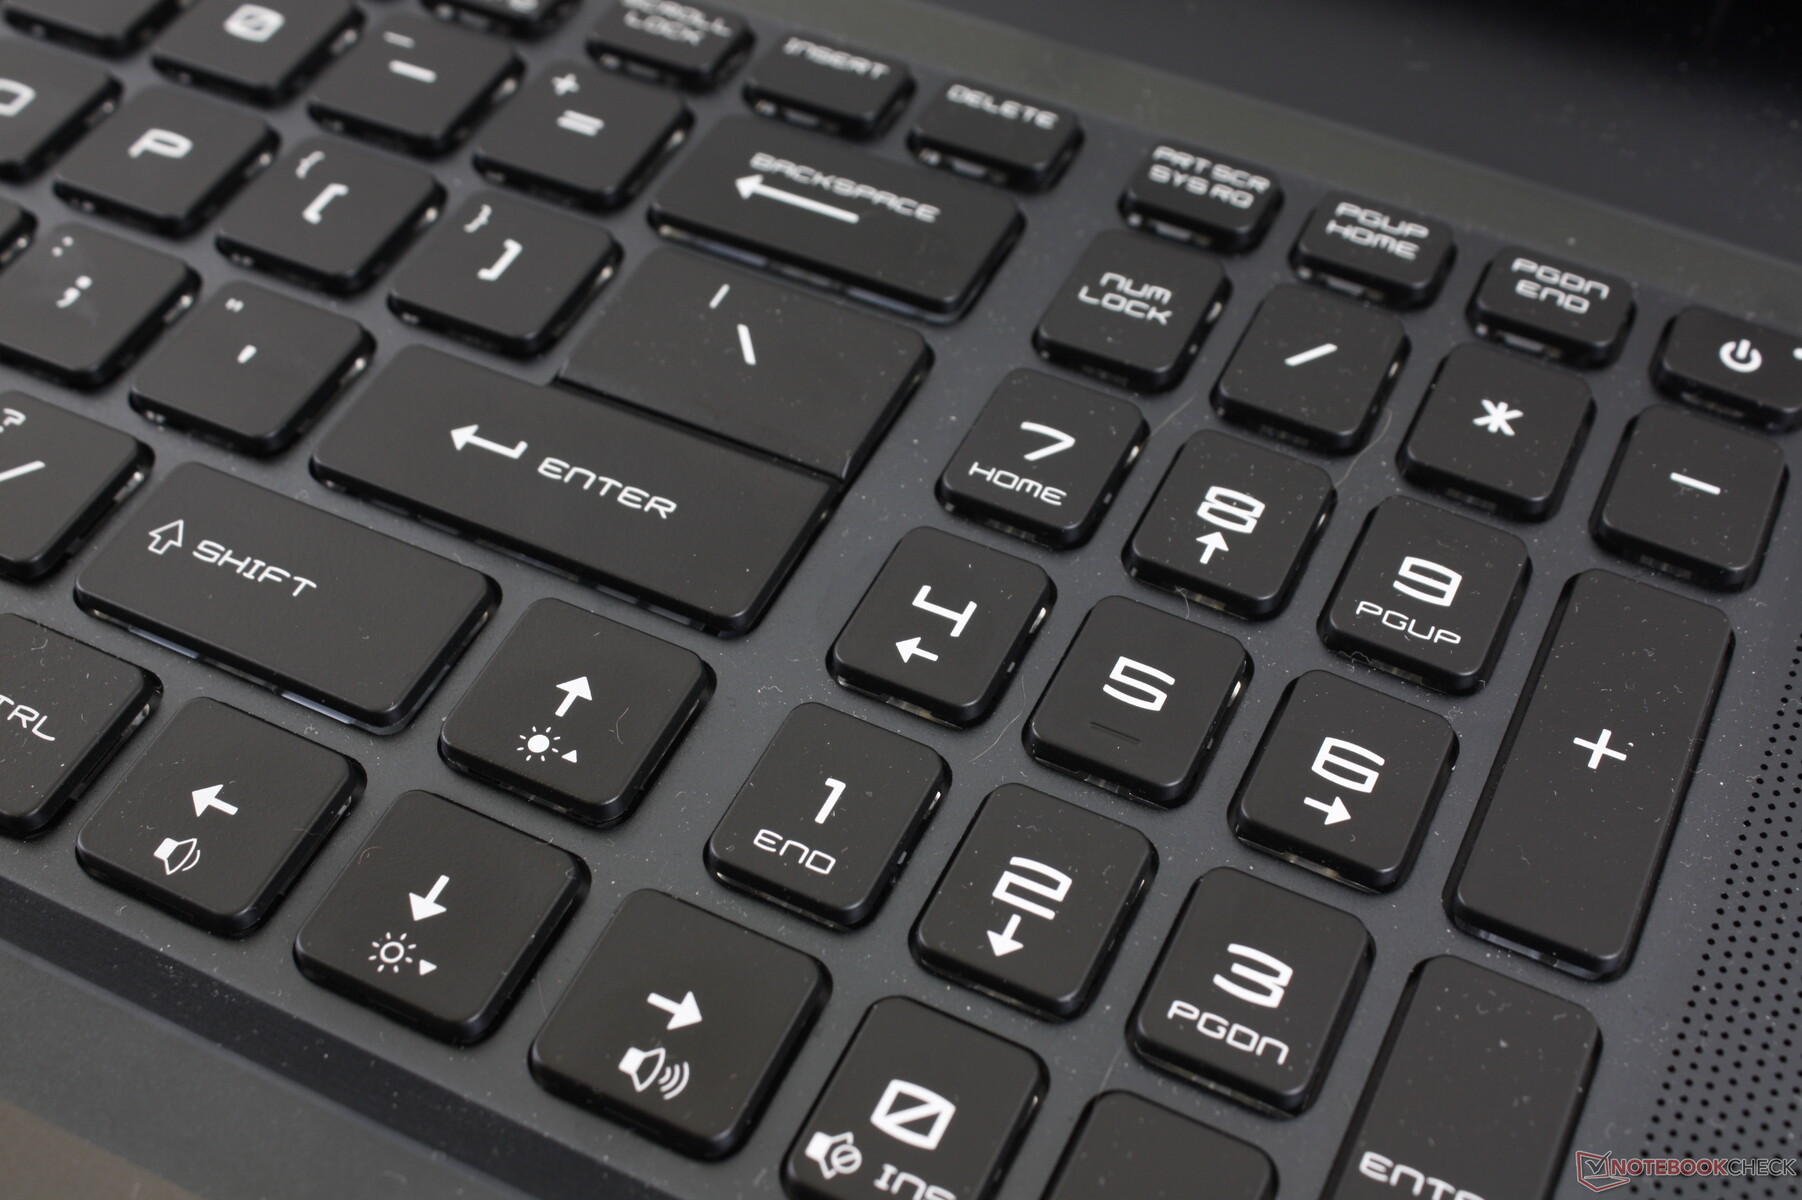
SteelSeries has redesigned the keyboard with seemingly deeper travel and crisper feedback than on last year's GE75. The typing experience feels better than on the GS66 or Stealth 15M which have shallower, more Ultrabook-like keys. The translucent edges around the keycaps are also now gone in favor of more standard-looking keys.
Touchpad
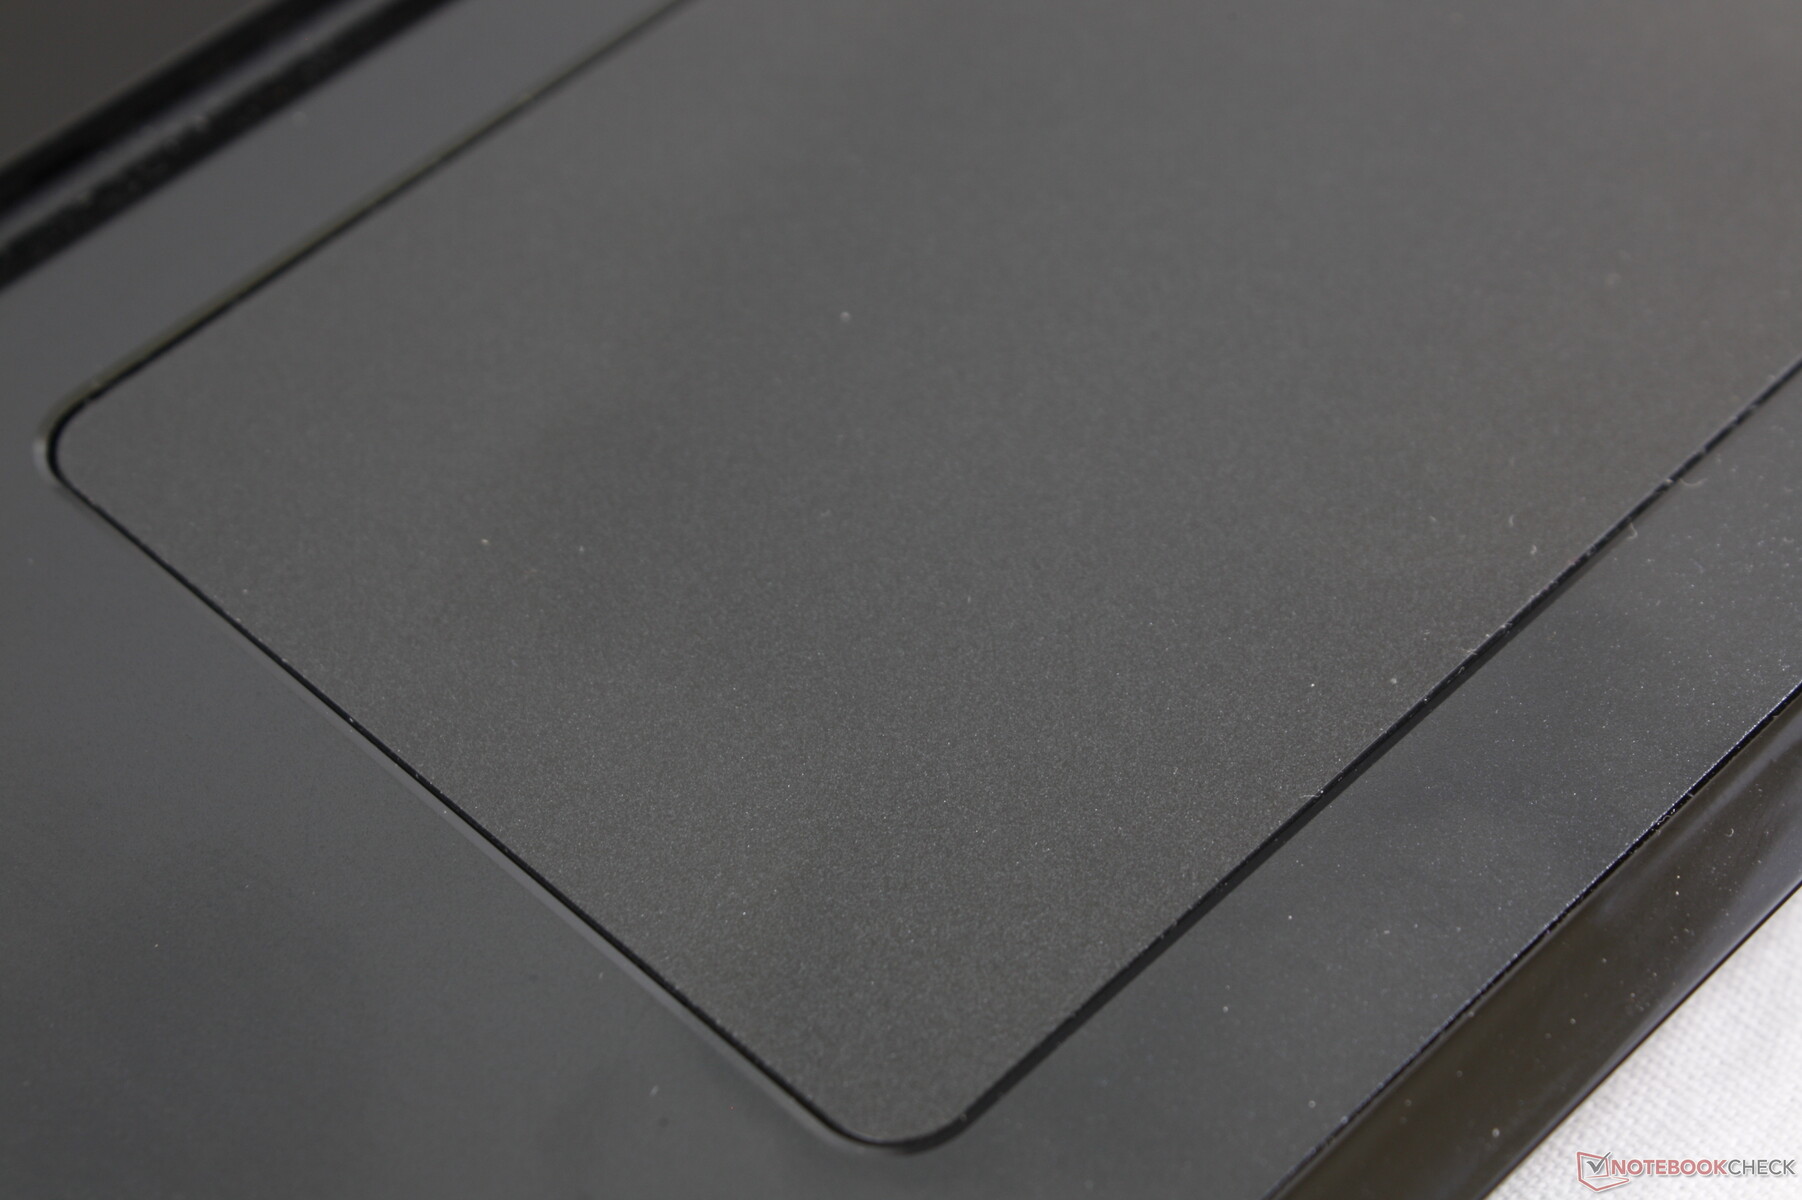
The clickpad is relatively small for a 17.3-inch laptop at just 10.5 x 6.5 cm. The clickpad on the Razer Blade Pro, for example, is much larger at 13 x 8 cm. Cursor control is otherwise smooth and with only a bit of sticking when gliding at slow speeds. Its integrated mouse clicks are very shallow with louder clatter and stiffer feedback than on the Razer.

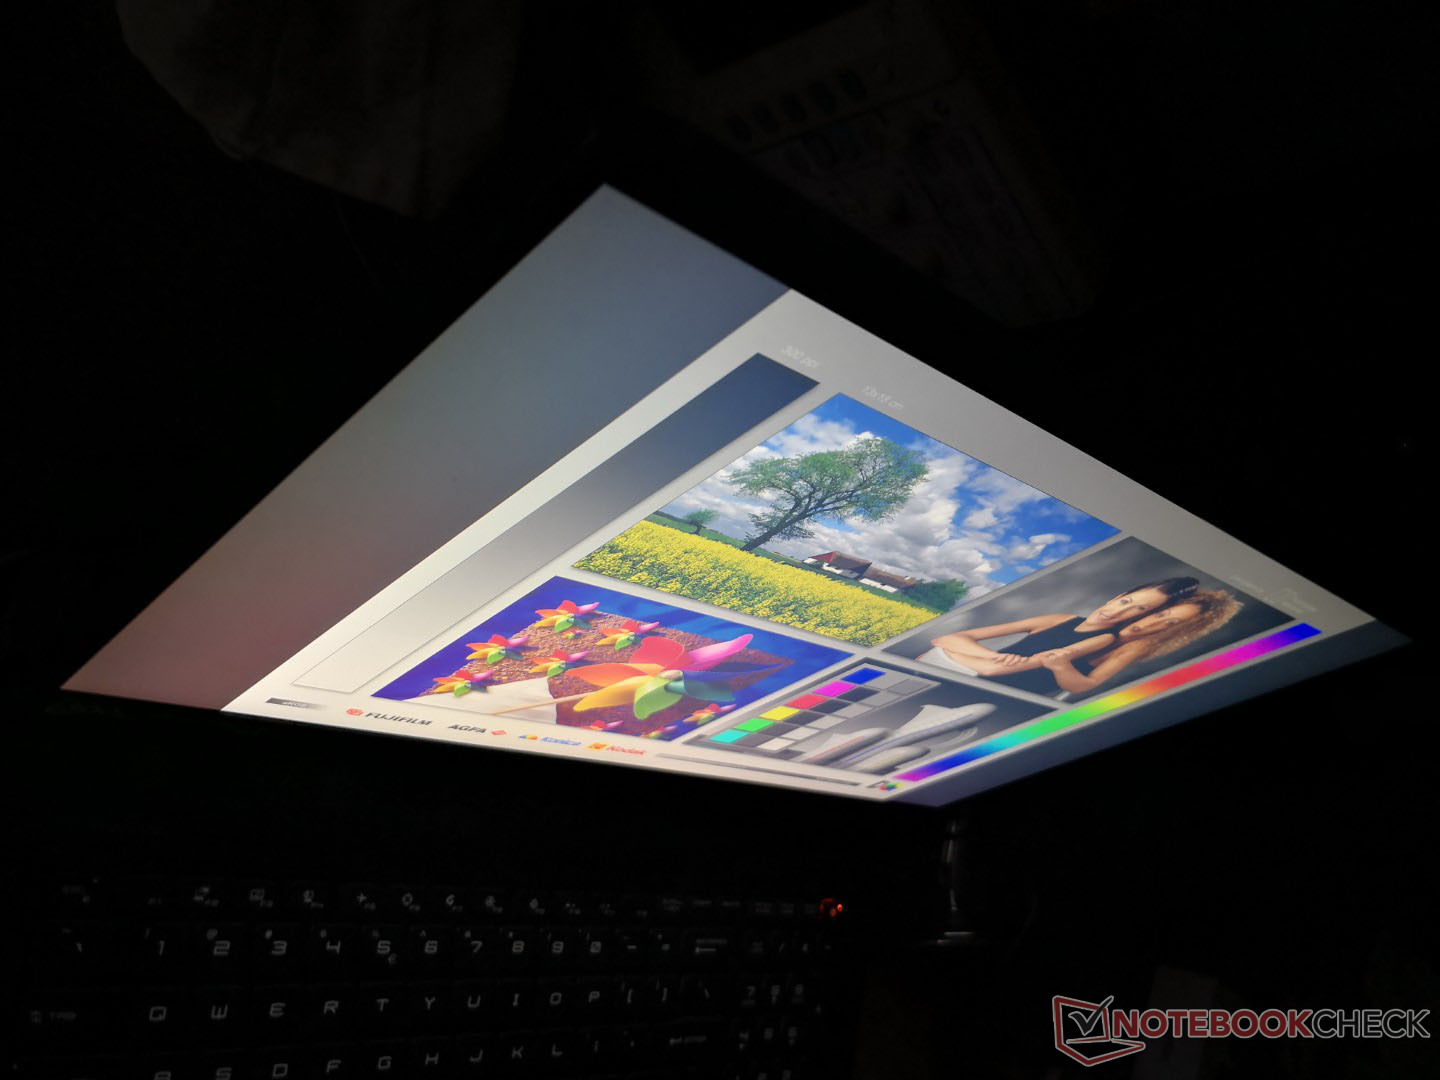
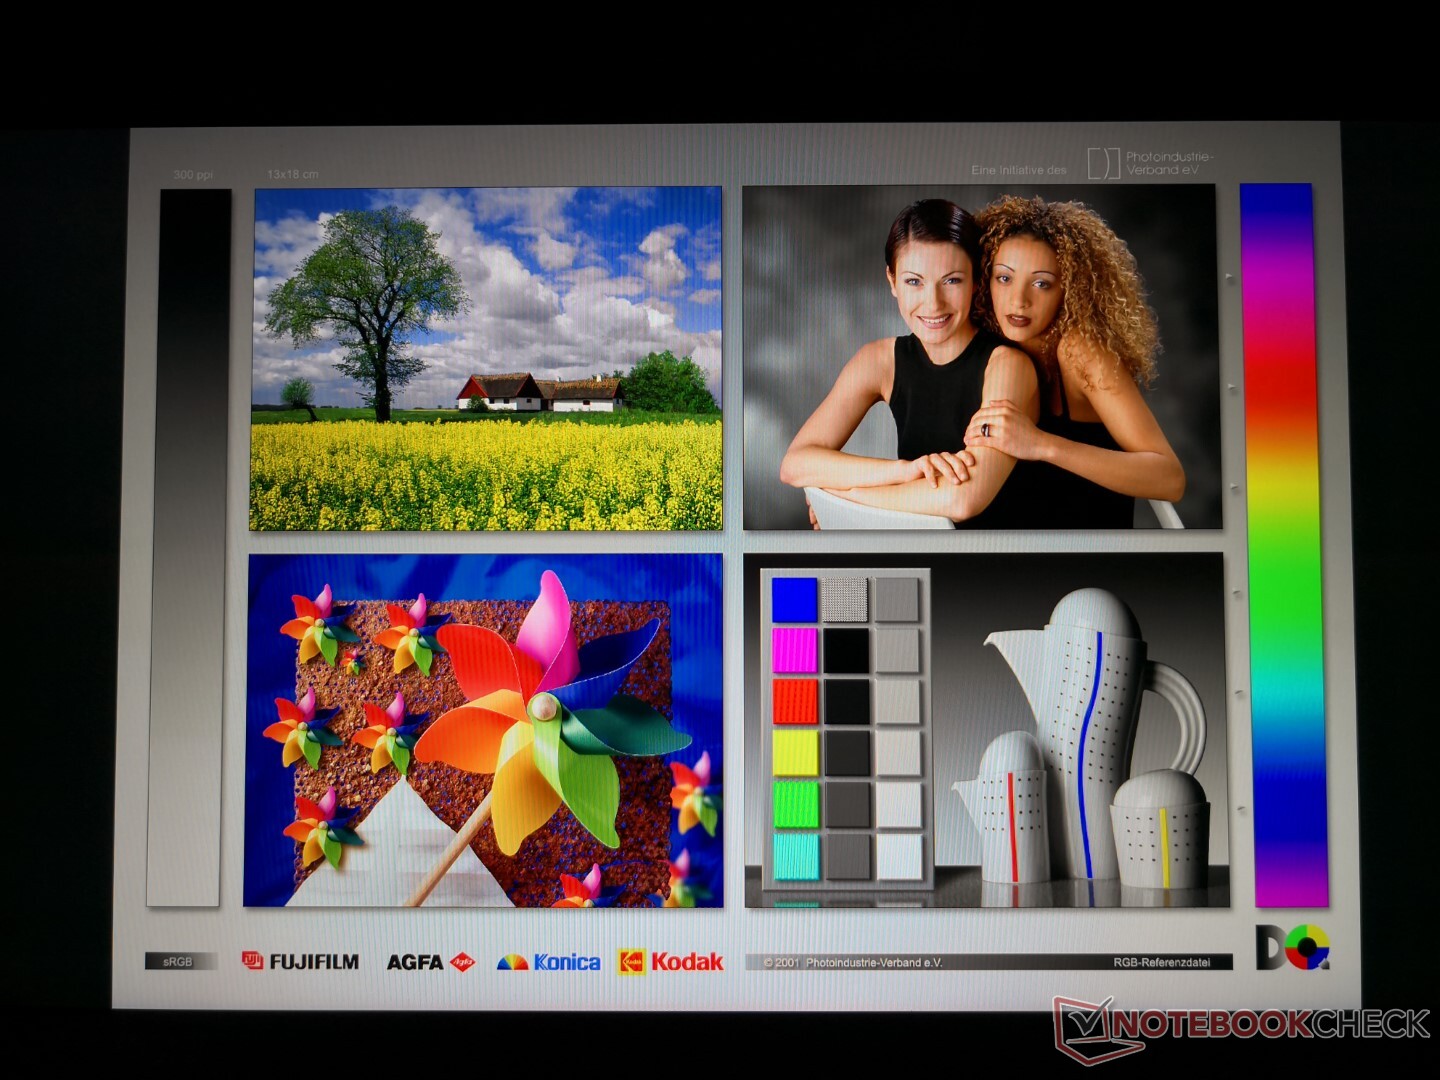
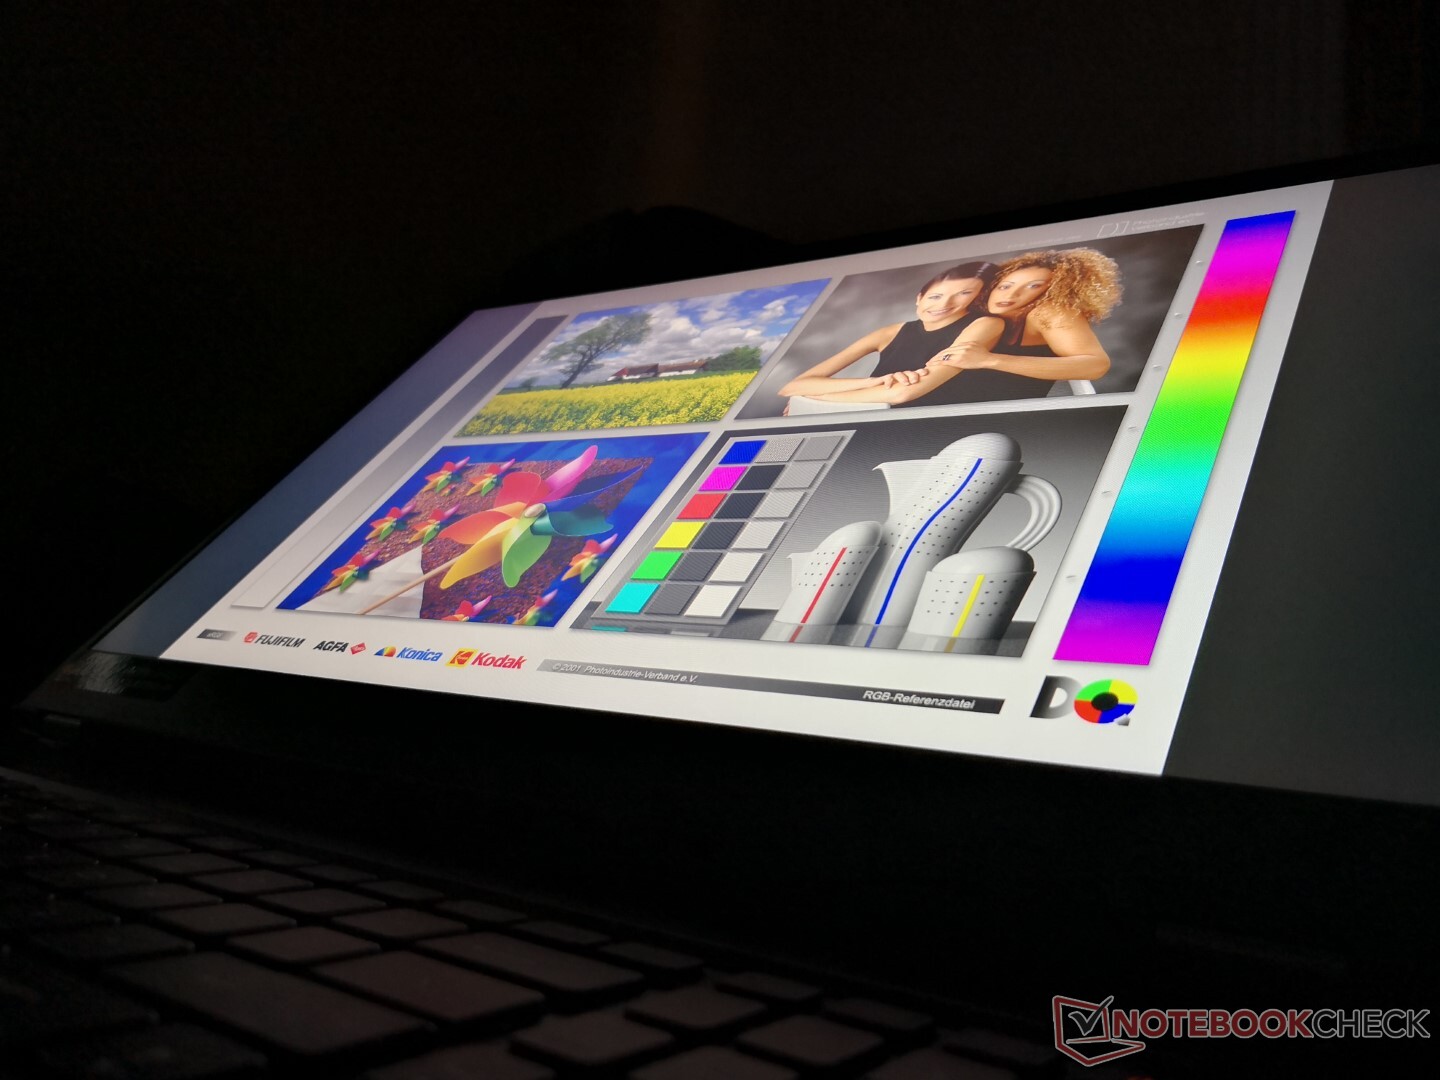
Display
MSI is using the same 300 Hz AU Optronics B173HAN05.1 IPS panel as found on the 2019 Asus Zephyrus S GX701GXR for similar characteristics between them. Its closest competitor is the 300 Hz Sharp LQ173M1JW02 panel as found on the Razer Blade Pro which has a slightly lower contrast ratio than our AUO panel. Maximum brightness and gamut are otherwise in line with most other high-end gaming laptops.
Interestingly, we're able to detect PWM only at the 100 percent brightness level unlike on most other laptops. The frequency is thankfully very high and so this shouldn't affect most users.


| |||||||||||||||||||||||||
Brightness Distribution: 87 %
Center on Battery: 324.6 cd/m²
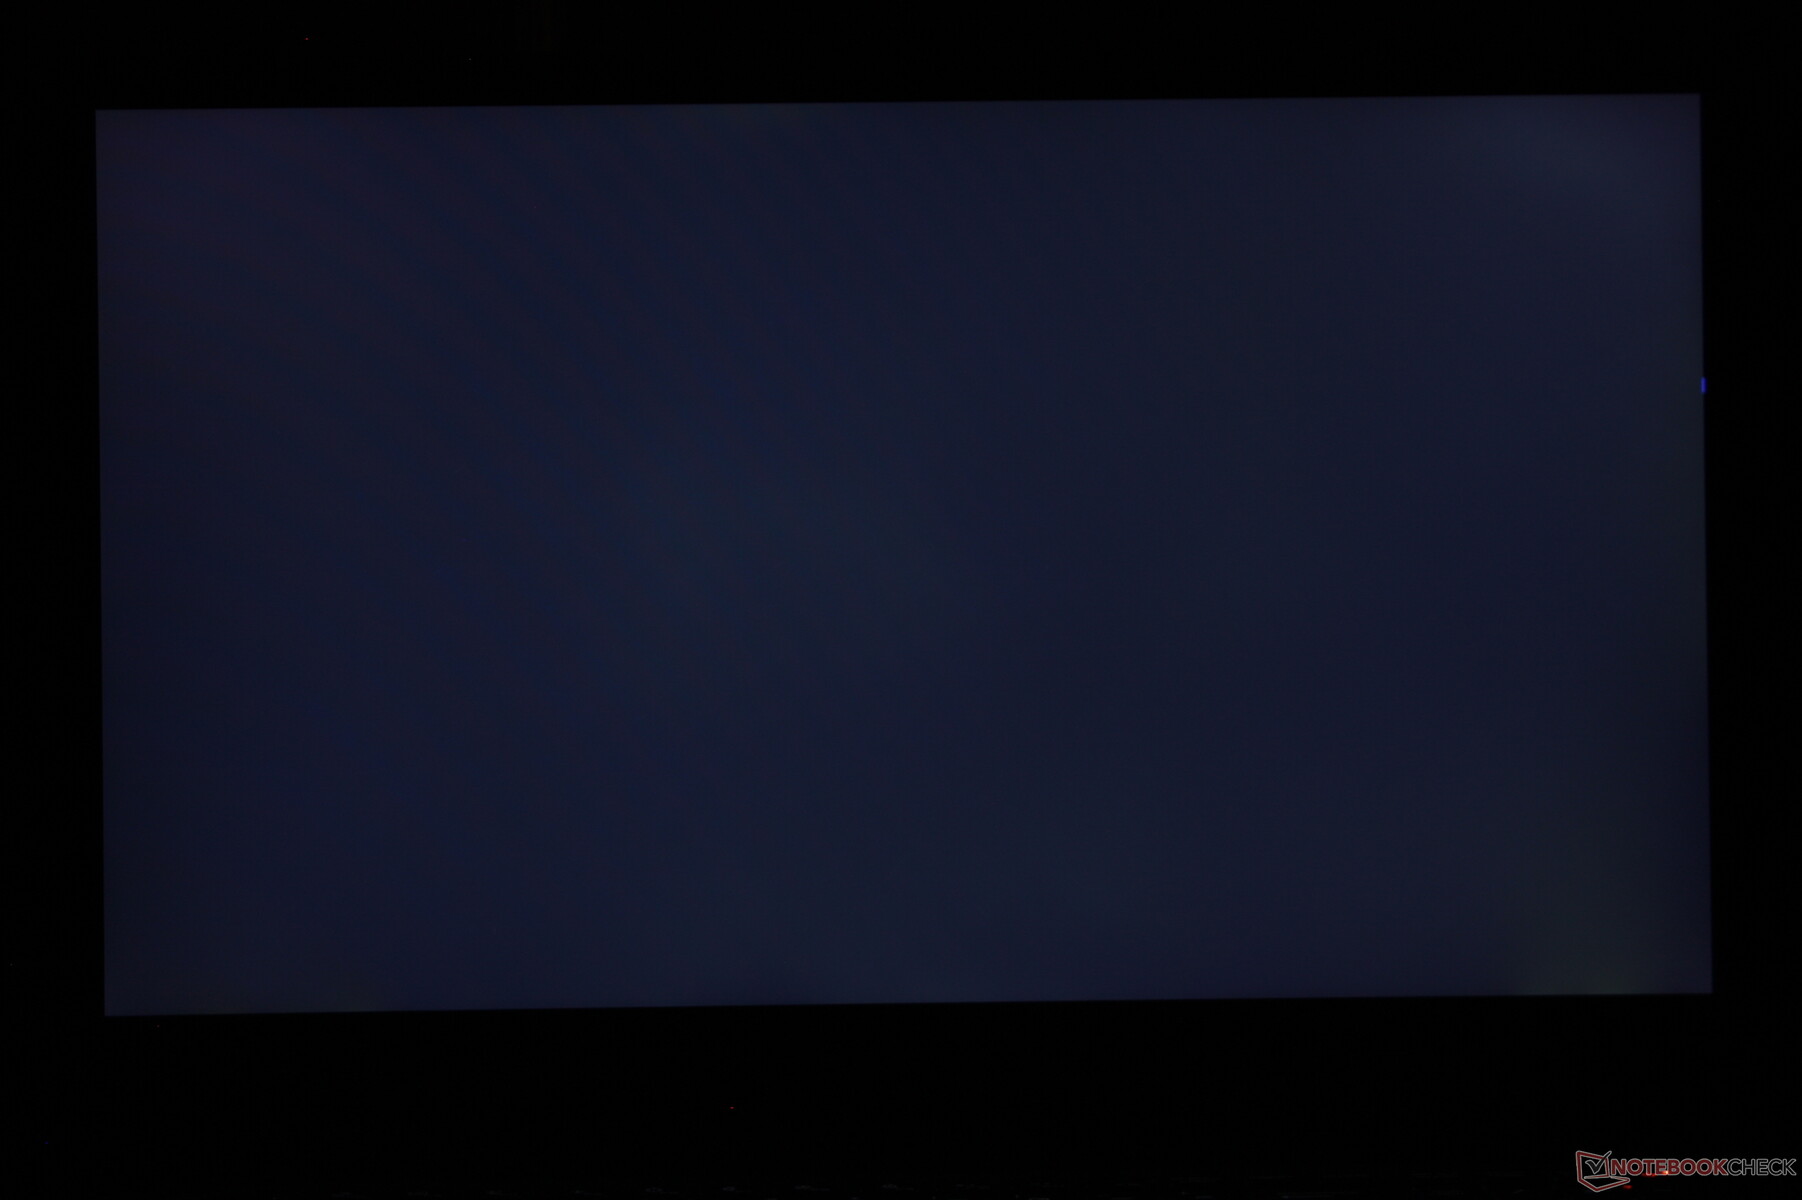
Contrast: 1159:1 (Black: 0.28 cd/m²)
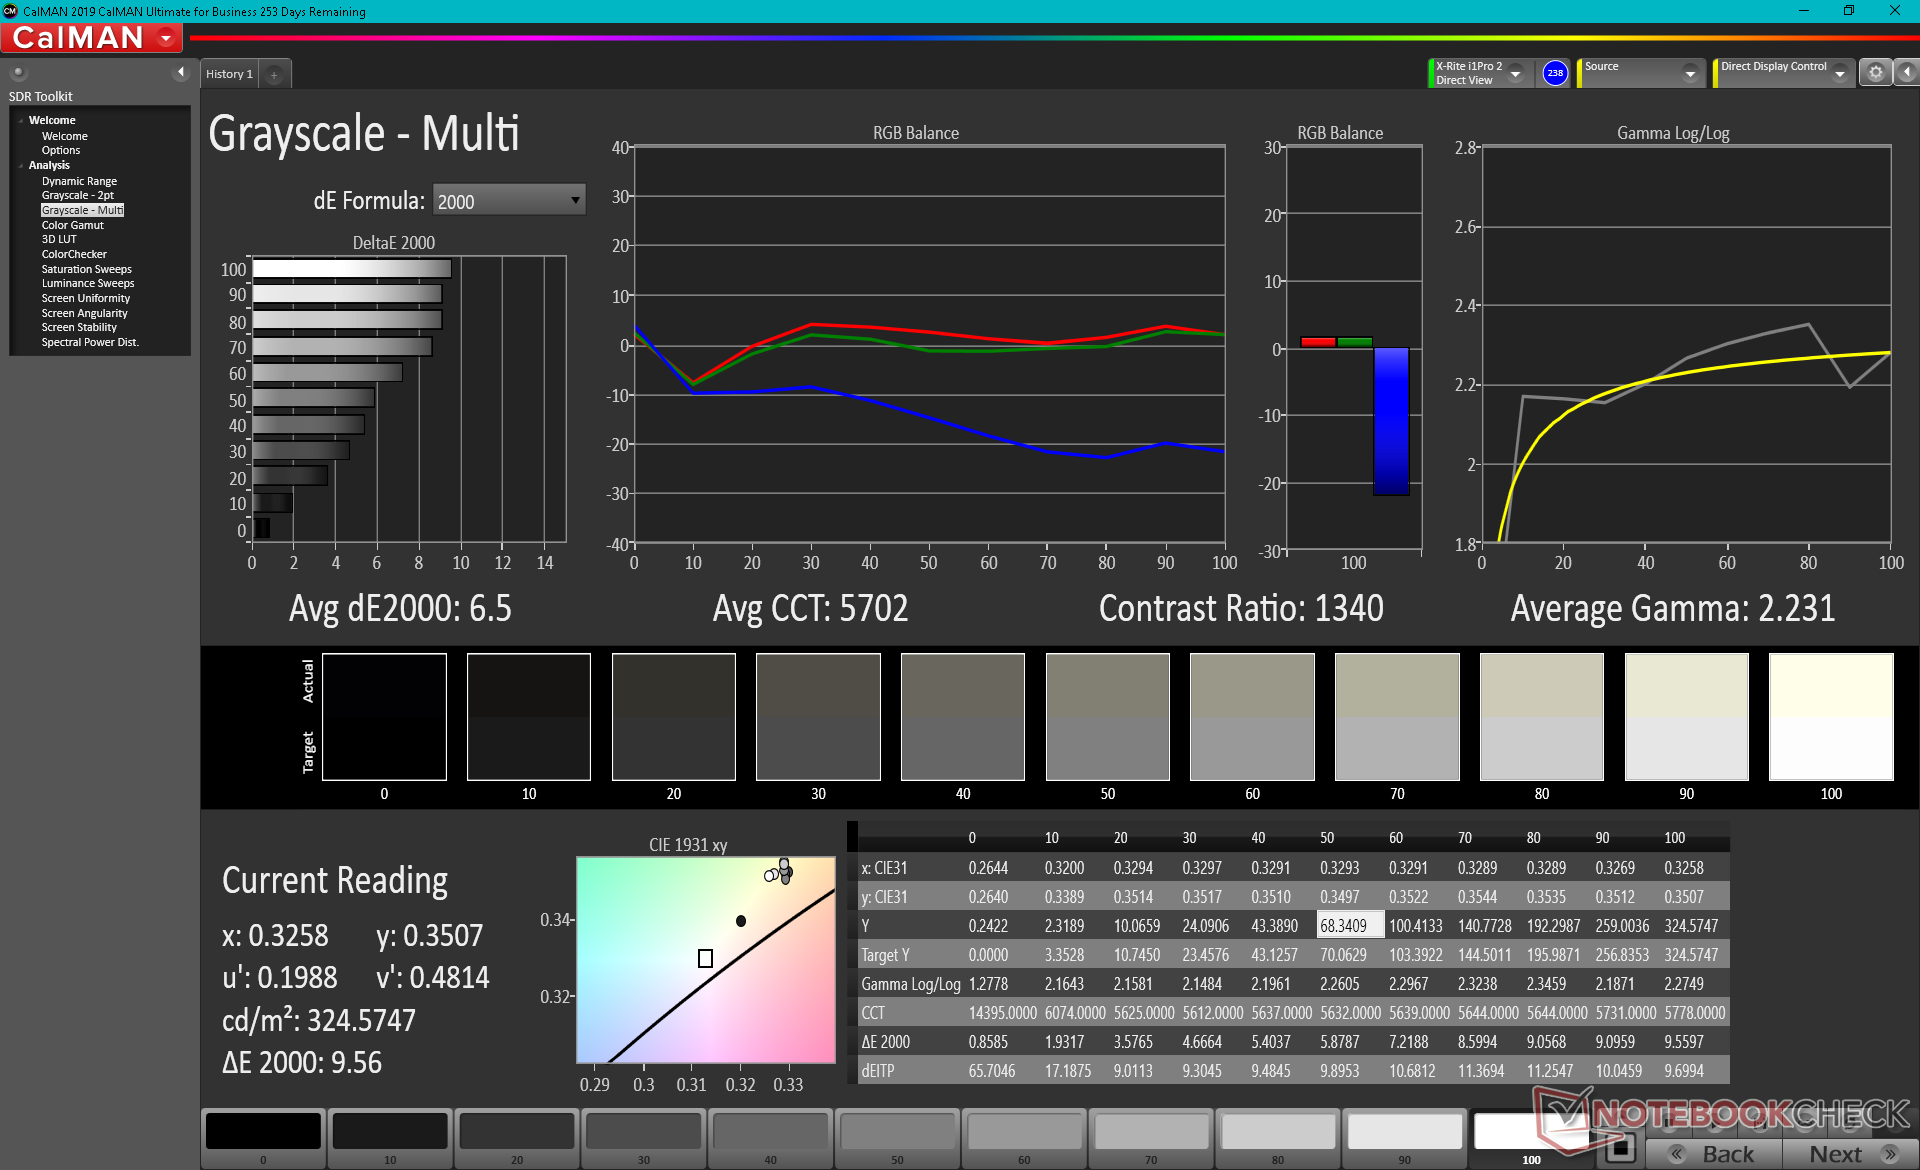
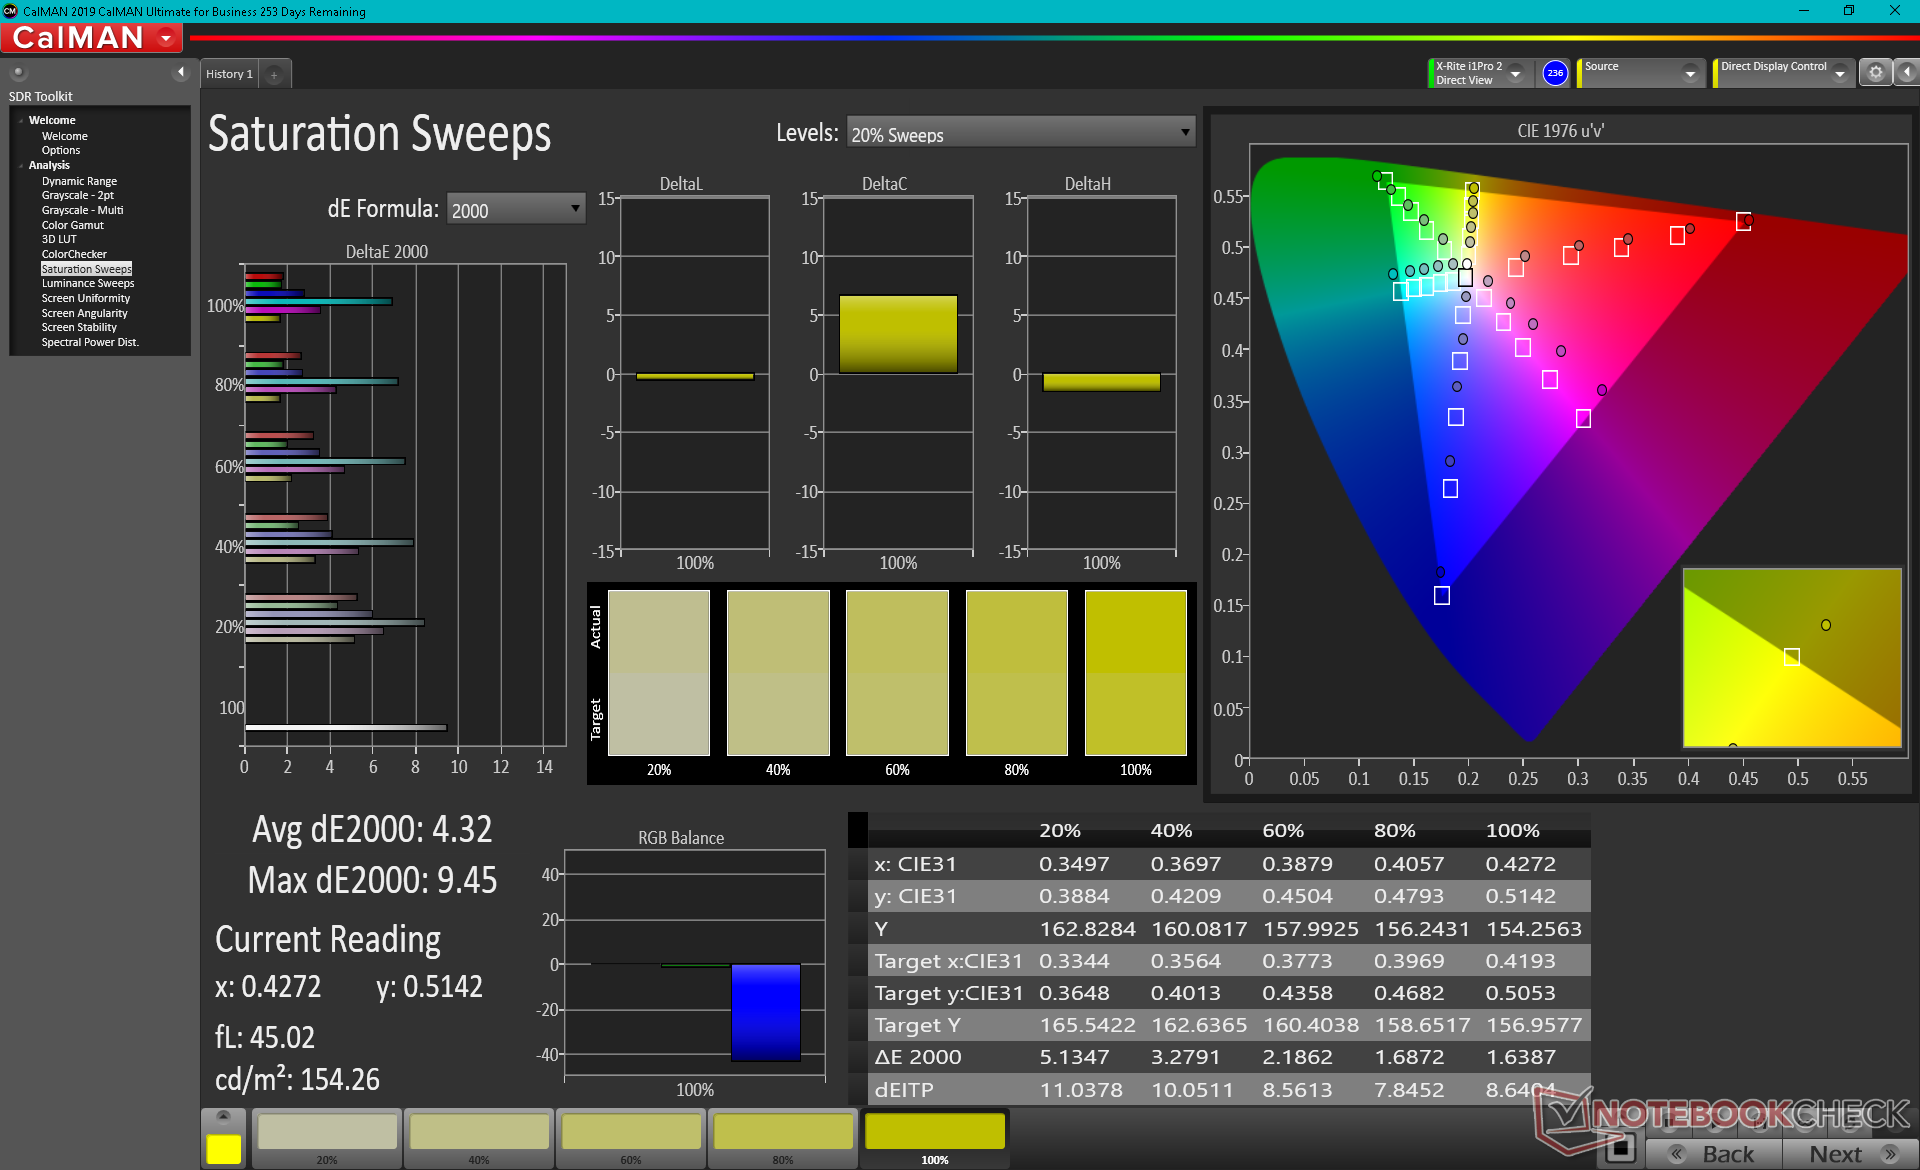
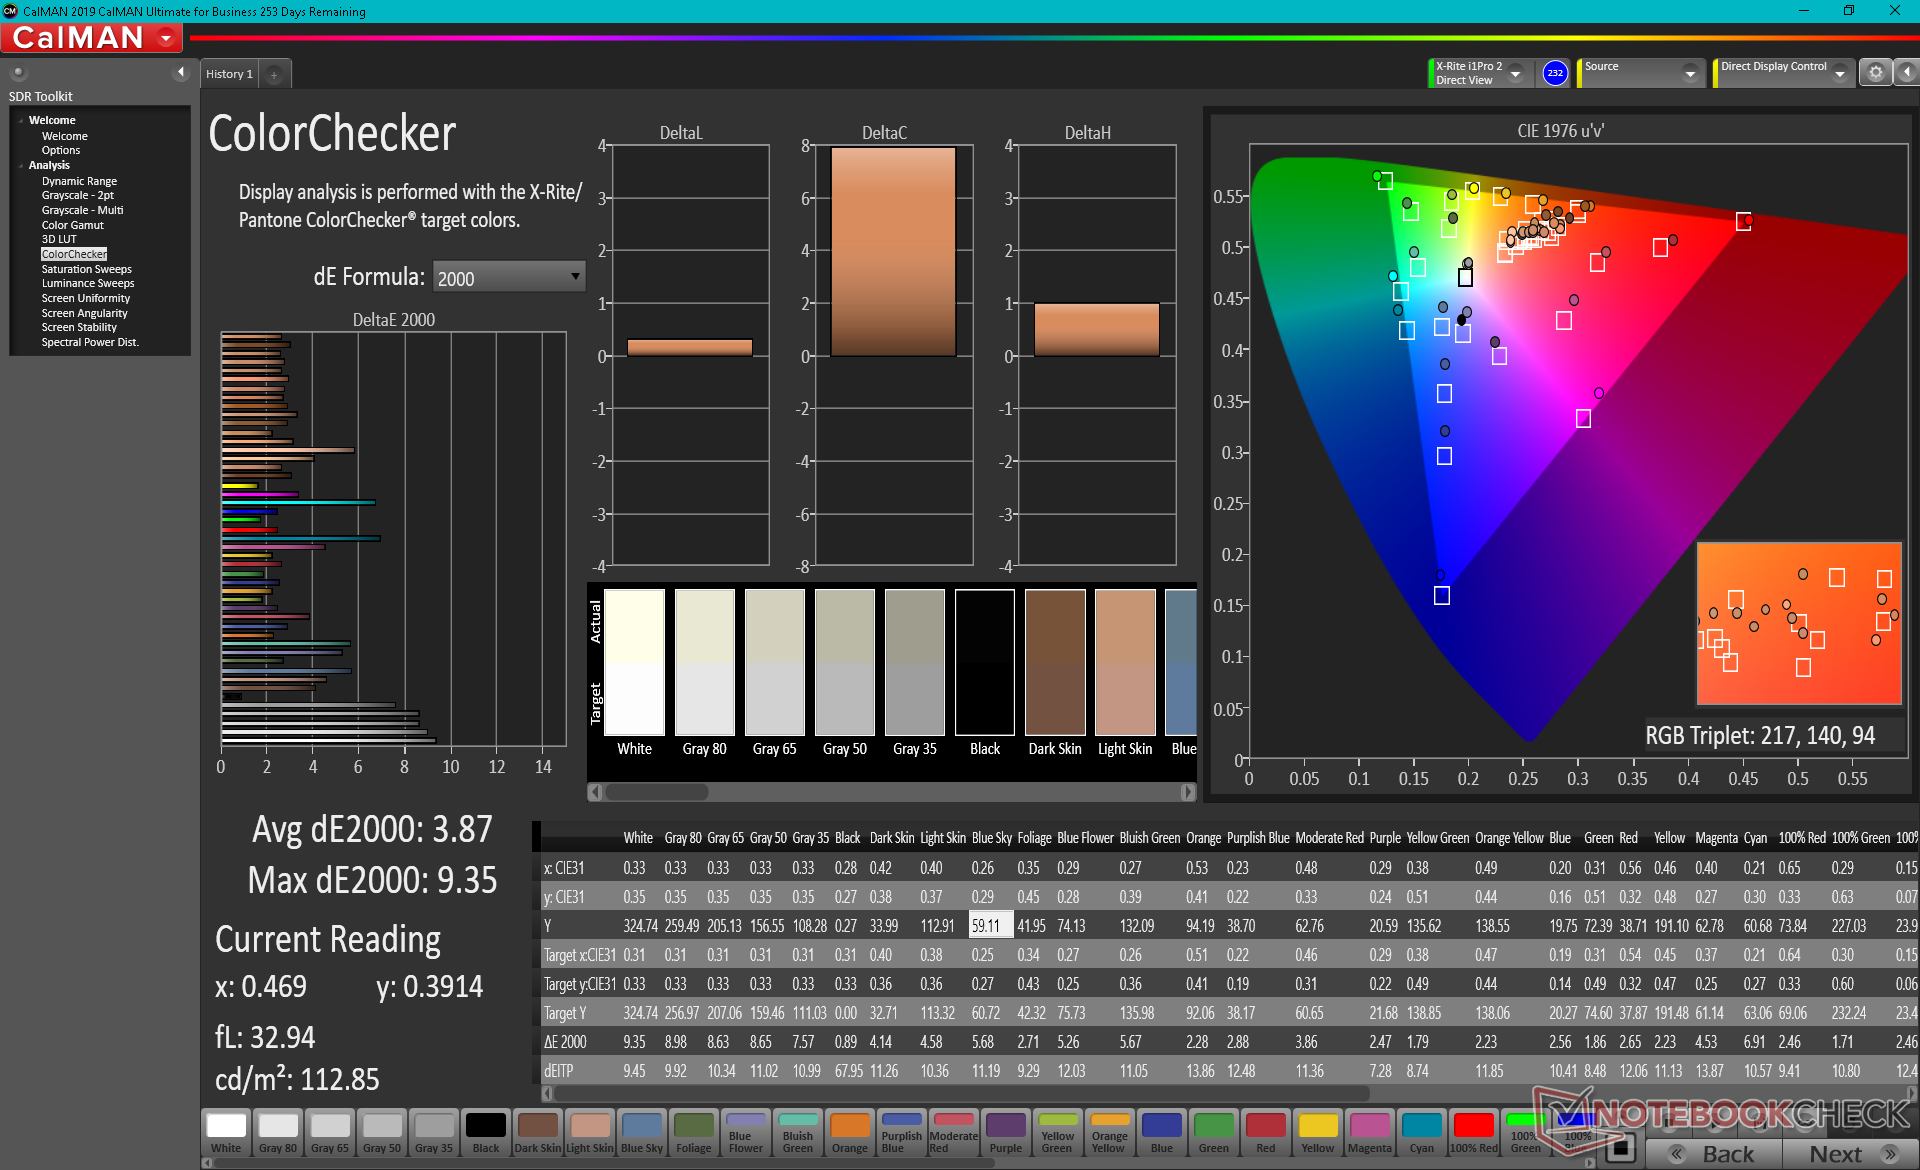
ΔE ColorChecker Calman: 3.87 | ∀{0.5-29.43 Ø4.77}
calibrated: 1.42
ΔE Greyscale Calman: 6.5 | ∀{0.09-98 Ø5}
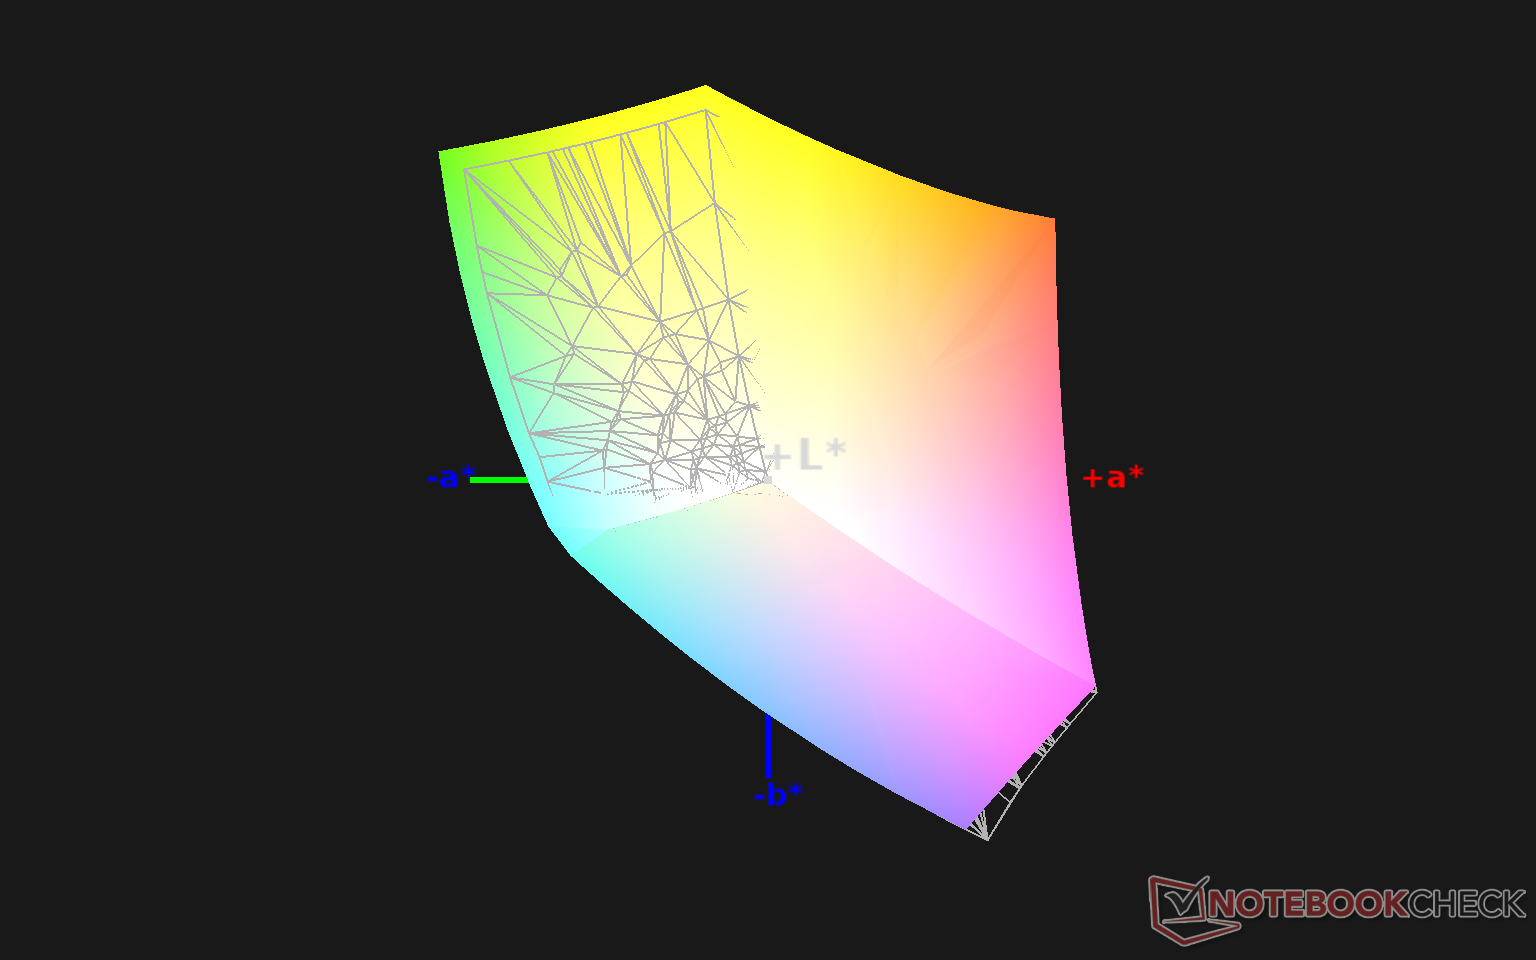
98% sRGB (Argyll 1.6.3 3D)
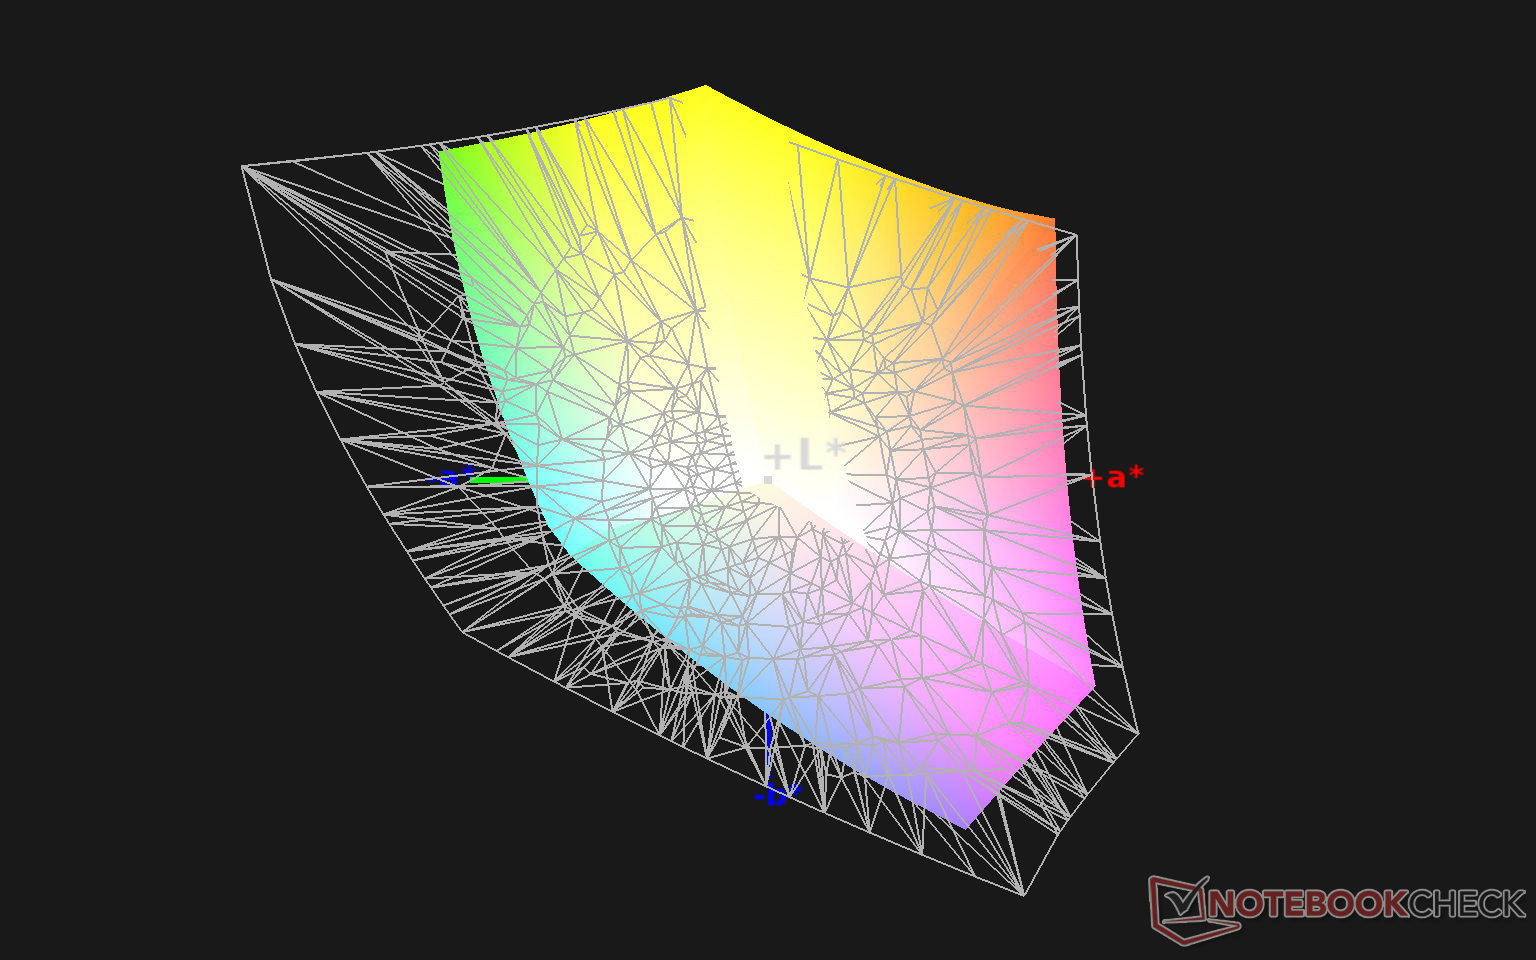
66.3% AdobeRGB 1998 (Argyll 1.6.3 3D)
73.9% AdobeRGB 1998 (Argyll 3D)
98.1% sRGB (Argyll 3D)
71.8% Display P3 (Argyll 3D)
Gamma: 2.23
CCT: 5702 K
| MSI GE76 Raider 10UH AU Optronics B173HAN05.1, IPS, 17.3", 1920x1080 | MSI GE75 8SG Raider CMN N173HCE-G33 (CMN175C), AHVA, 17.3", 1920x1080 | Asus Strix Scar 17 G732LXS LQ173M1JW03 (SHP14DC), IPS, 17.3", 1920x1080 | Alienware m17 R3 P45E AU Optronics B173HAN, IPS, 17.3", 1920x1080 | Schenker XMG Core 17 Comet Lake BOE HF NV173FHM-N44, IPS, 17.3", 1920x1080 | MSI GT76 Titan DT 10SGS AU Optronics B173ZAN03.3, IPS, 17.3", 3840x2160 | |
|---|---|---|---|---|---|---|
| Display | -13% | -1% | -2% | -8% | 15% | |
| Display P3 Coverage (%) | 71.8 | 60.6 -16% | 71 -1% | 69.2 -4% | 65.3 -9% | 82.5 15% |
| sRGB Coverage (%) | 98.1 | 91.2 -7% | 99 1% | 97.9 0% | 92.6 -6% | 98 0% |
| AdobeRGB 1998 Coverage (%) | 73.9 | 62.6 -15% | 71.6 -3% | 71.4 -3% | 66.5 -10% | 96.6 31% |
| Response Times | 35% | 44% | -11% | 7% | -15% | |
| Response Time Grey 50% / Grey 80% * (ms) | 20.4 ? | 8 ? 61% | 5.8 ? 72% | 16.8 ? 18% | 17.6 ? 14% | 23.2 ? -14% |
| Response Time Black / White * (ms) | 10 ? | 9.2 ? 8% | 8.4 ? 16% | 14 ? -40% | 10 ? -0% | 11.6 ? -16% |
| PWM Frequency (Hz) | 151500 | 26040 ? | 1000 ? | |||
| Screen | 9% | 1% | 19% | -3% | 1% | |
| Brightness middle (cd/m²) | 324.6 | 363 12% | 310 -4% | 338.3 4% | 315 -3% | 419.5 29% |
| Brightness (cd/m²) | 312 | 342 10% | 311 0% | 325 4% | 298 -4% | 413 32% |
| Brightness Distribution (%) | 87 | 86 -1% | 82 -6% | 91 5% | 88 1% | 93 7% |
| Black Level * (cd/m²) | 0.28 | 0.27 4% | 0.41 -46% | 0.27 4% | 0.29 -4% | 0.4 -43% |
| Contrast (:1) | 1159 | 1344 16% | 756 -35% | 1253 8% | 1086 -6% | 1049 -9% |
| Colorchecker dE 2000 * | 3.87 | 2.29 41% | 2.41 38% | 1.88 51% | 4.3 -11% | 3.4 12% |
| Colorchecker dE 2000 max. * | 9.35 | 4.54 51% | 8.59 8% | 3.23 65% | 7.3 22% | 7.4 21% |
| Colorchecker dE 2000 calibrated * | 1.42 | 2.45 -73% | 1.13 20% | 1.32 7% | 2.29 -61% | 3.28 -131% |
| Greyscale dE 2000 * | 6.5 | 3.02 54% | 4.3 34% | 2.4 63% | 4.3 34% | 2 69% |
| Gamma | 2.23 99% | 2.38 92% | 2.149 102% | 2.39 92% | 2.084 106% | 2.14 103% |
| CCT | 5702 114% | 7048 92% | 7059 92% | 6572 99% | 7434 87% | 6858 95% |
| Color Space (Percent of AdobeRGB 1998) (%) | 66.3 | 58 -13% | 72 9% | 64.7 -2% | 66 0% | 84.6 28% |
| Color Space (Percent of sRGB) (%) | 98 | 91 -7% | 94 -4% | 97.8 0% | 92 -6% | 97.9 0% |
| Total Average (Program / Settings) | 10% /
8% | 15% /
6% | 2% /
11% | -1% /
-3% | 0% /
2% |
* ... smaller is better
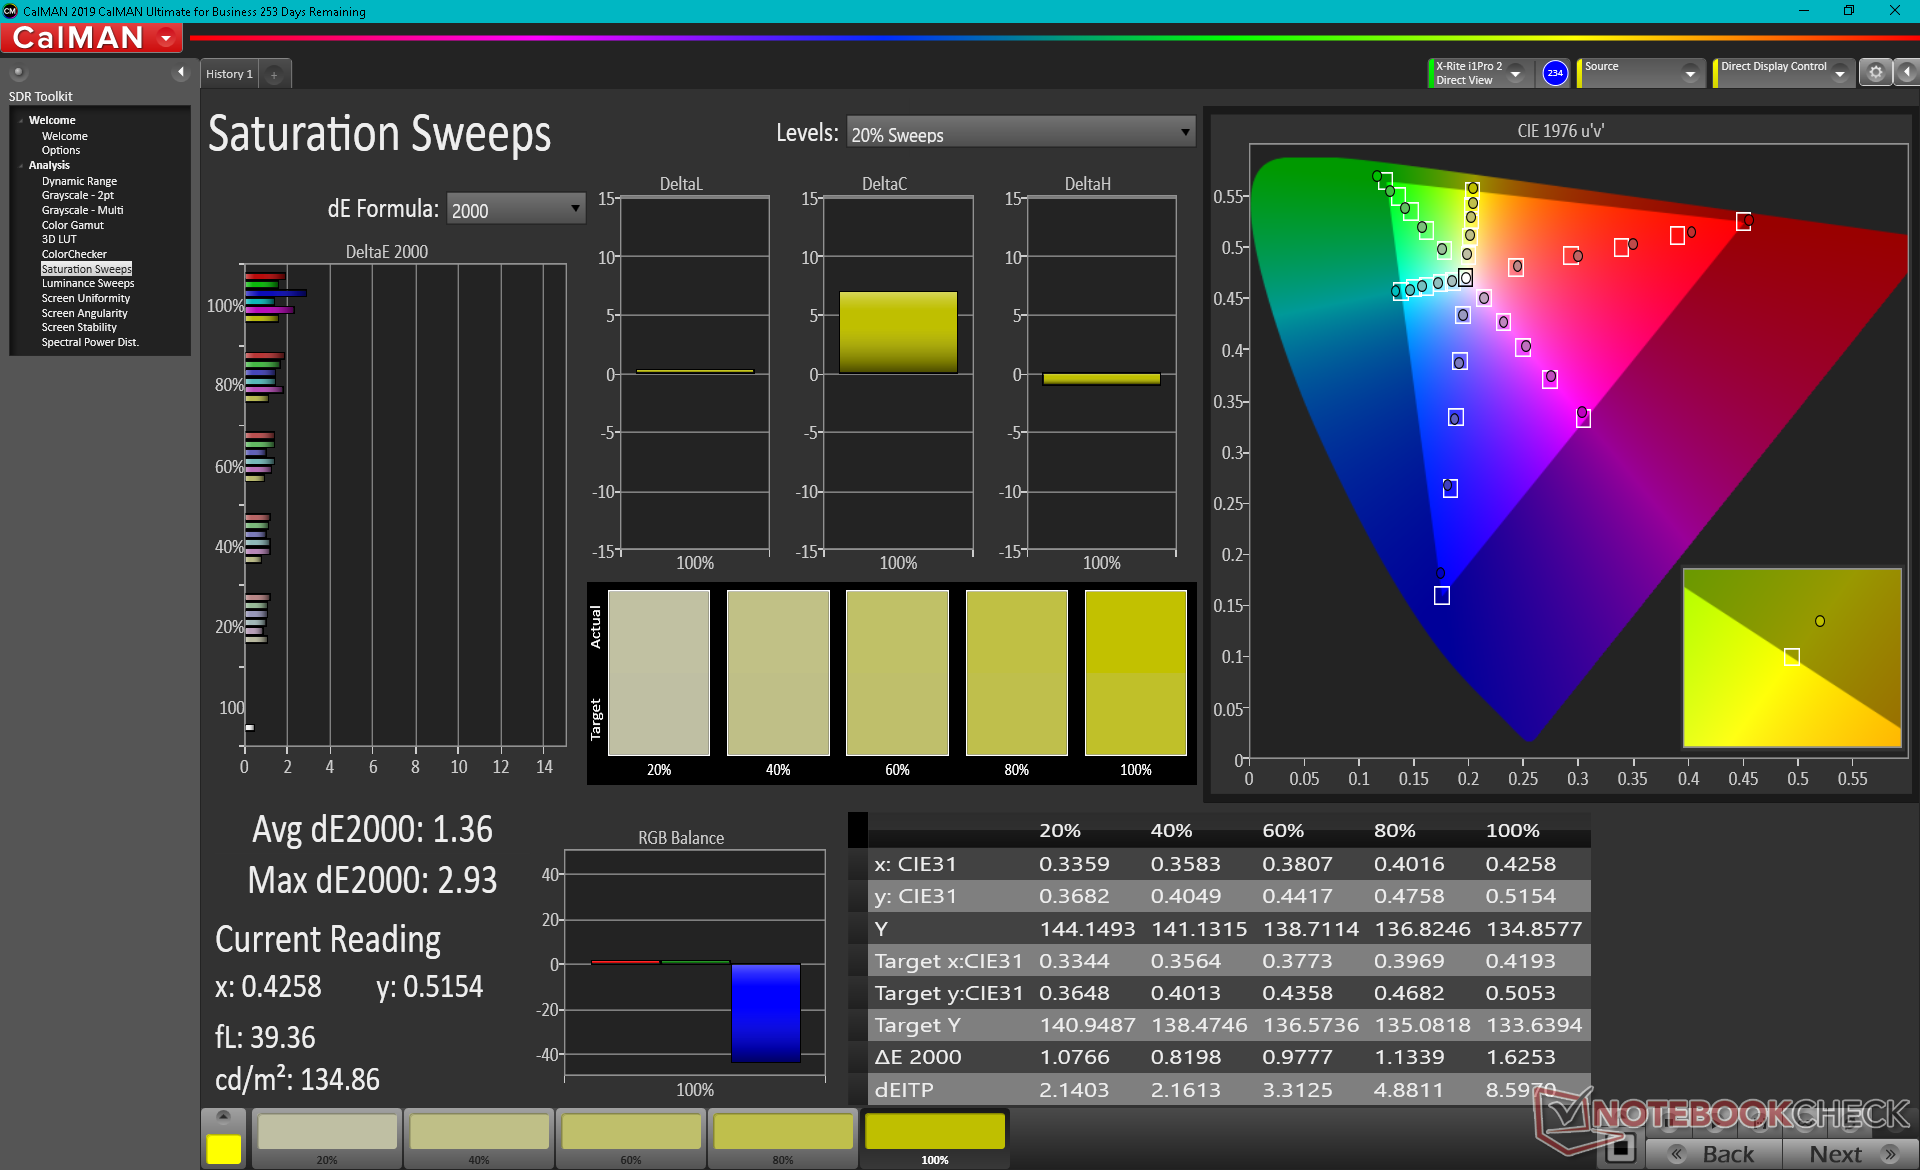
Color space covers all of sRGB and approximately 66 percent of AdobeRGB which is standard for high-end gaming laptops with fast refresh rates. Panels capable of both 300 Hz and full AdobeRGB or DCI-P3 coverage are not yet available in this screen size and so users will still have to sacrifice either one or the other. A few 4K panels offer wider color spaces like on the Razer Blade Pro 17, but such options are not available on the GE76 at the time of writing.
Less expensive GE76 SKUs with the 144 Hz panel cover only 60 percent of sRGB for noticeably inferior colors.
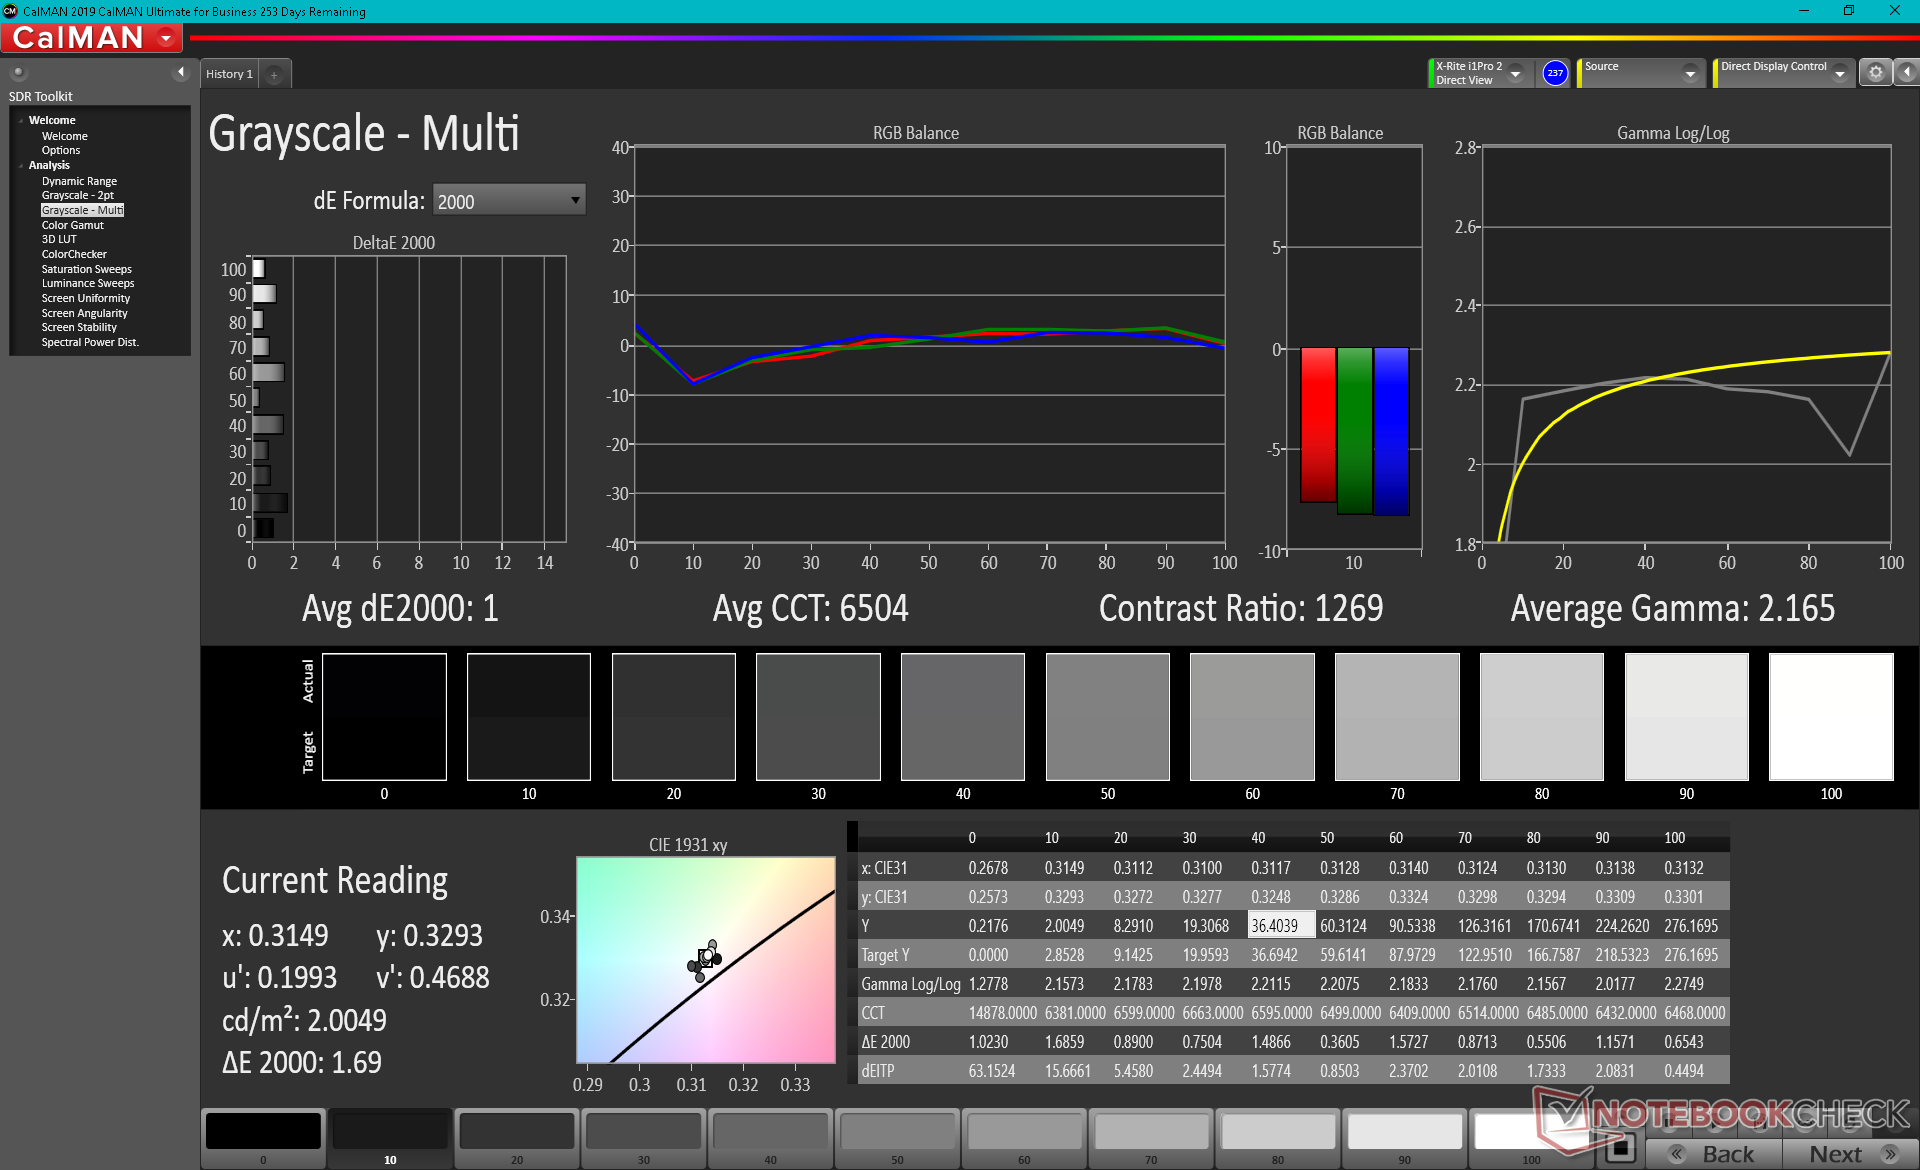
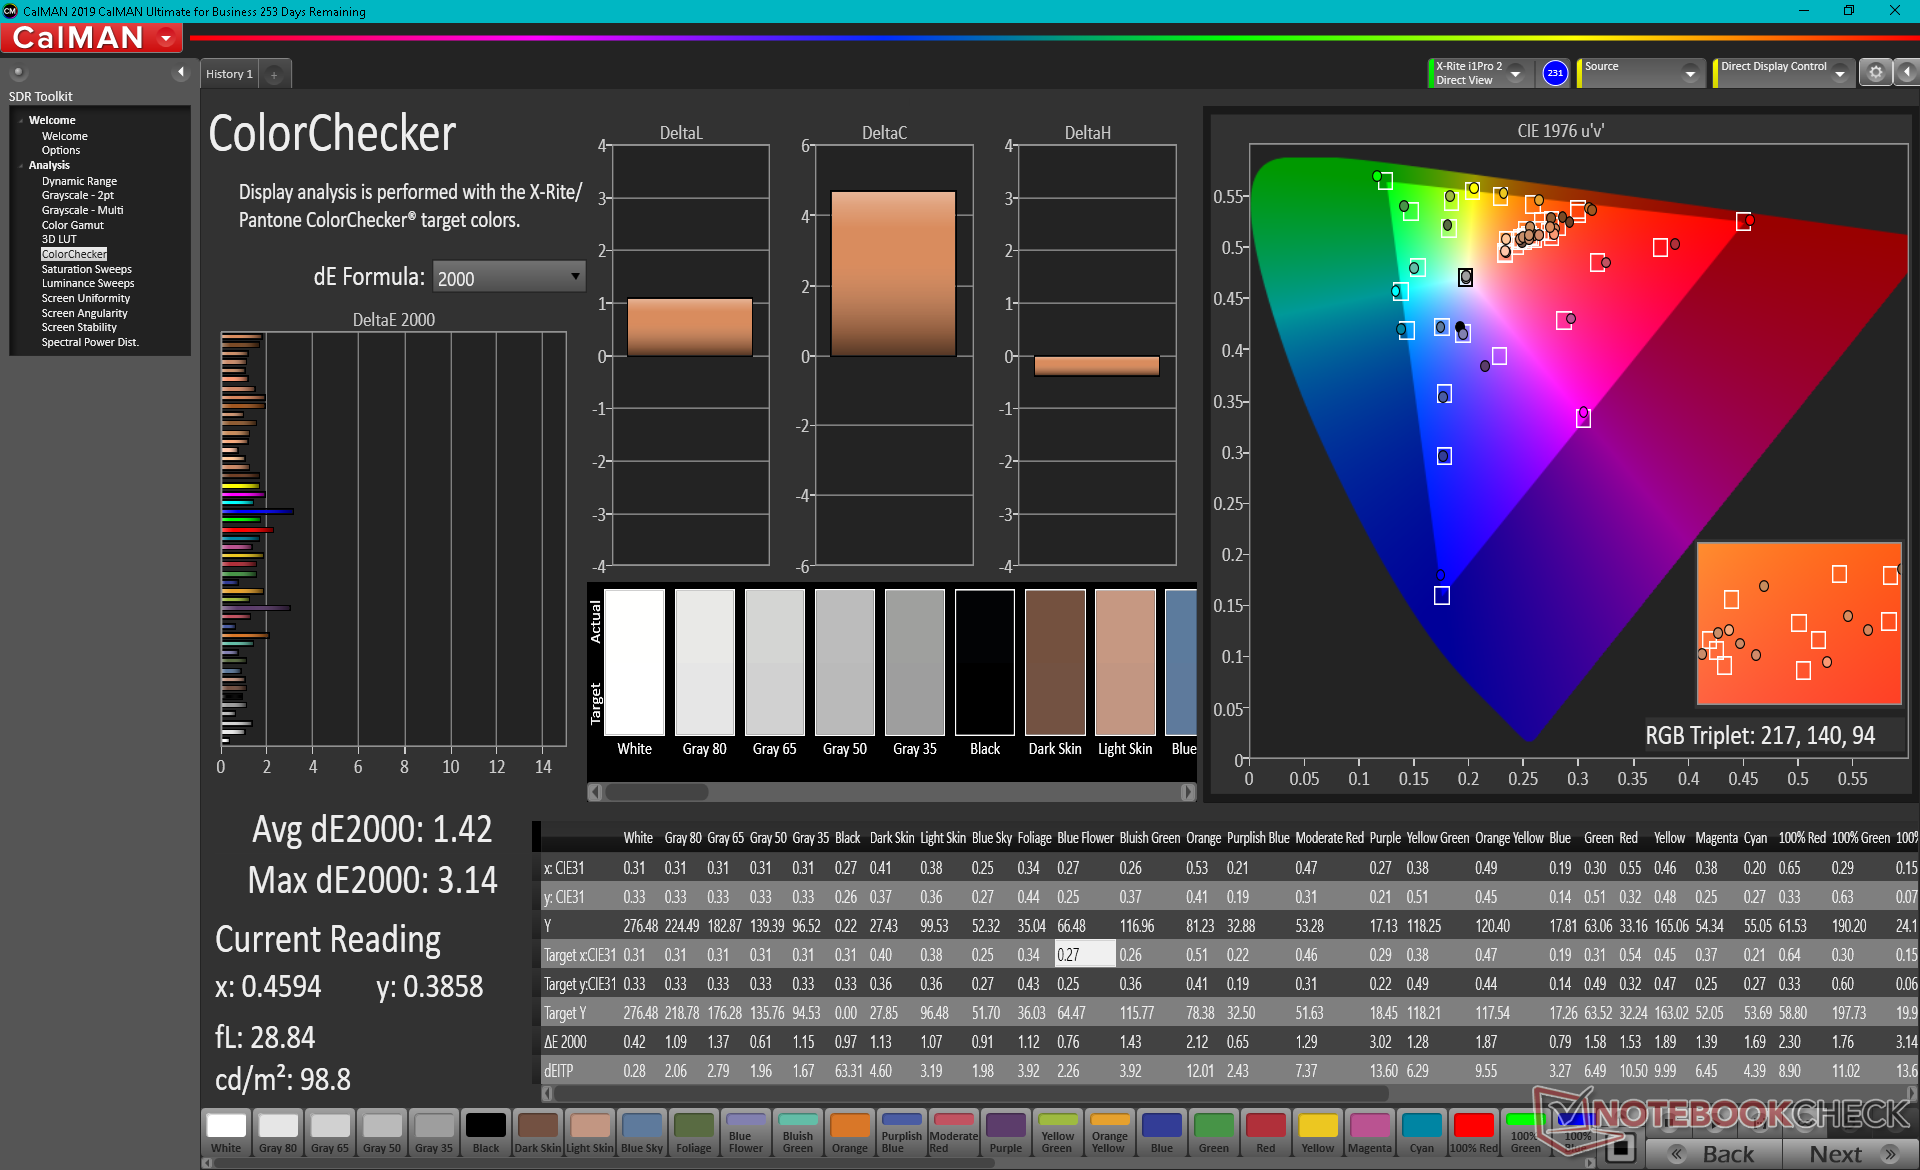
Grayscale is far too warm out of the box as shown by our X-Rite results below. Fortunately, this can be easily addressed via the MSI True Color software or with a colorimeter calibration. Average grayscale DeltaE would improve from 6.5 to just 1.0 and colors would subsequently improve across the board as well. We recommend adjusting the color temperature if necessary to get the most out of the display.
Display Response Times
| ↔ Response Time Black to White | ||
|---|---|---|
| 10 ms ... rise ↗ and fall ↘ combined | ↗ 5.2 ms rise | 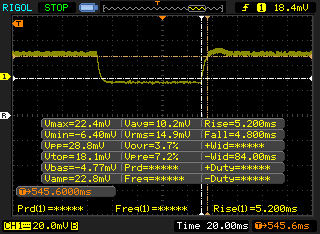 |
| ↘ 4.8 ms fall | ||
| The screen shows good response rates in our tests, but may be too slow for competitive gamers. In comparison, all tested devices range from 0.1 (minimum) to 240 (maximum) ms. » 26 % of all devices are better. This means that the measured response time is better than the average of all tested devices (20.2 ms). | ||
| ↔ Response Time 50% Grey to 80% Grey | ||
| 20.4 ms ... rise ↗ and fall ↘ combined | ↗ 9.2 ms rise | 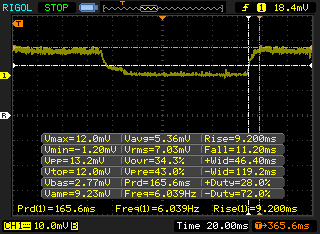 |
| ↘ 11.2 ms fall | ||
| The screen shows good response rates in our tests, but may be too slow for competitive gamers. In comparison, all tested devices range from 0.165 (minimum) to 636 (maximum) ms. » 32 % of all devices are better. This means that the measured response time is better than the average of all tested devices (31.6 ms). | ||
Screen Flickering / PWM (Pulse-Width Modulation)
| Screen flickering / PWM detected | 151500 Hz | 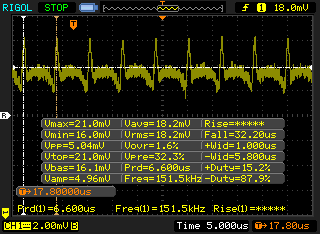 | |
The display backlight flickers at 151500 Hz (worst case, e.g., utilizing PWM) . The frequency of 151500 Hz is quite high, so most users sensitive to PWM should not notice any flickering. In comparison: 53 % of all tested devices do not use PWM to dim the display. If PWM was detected, an average of 8084 (minimum: 5 - maximum: 343500) Hz was measured. | |||
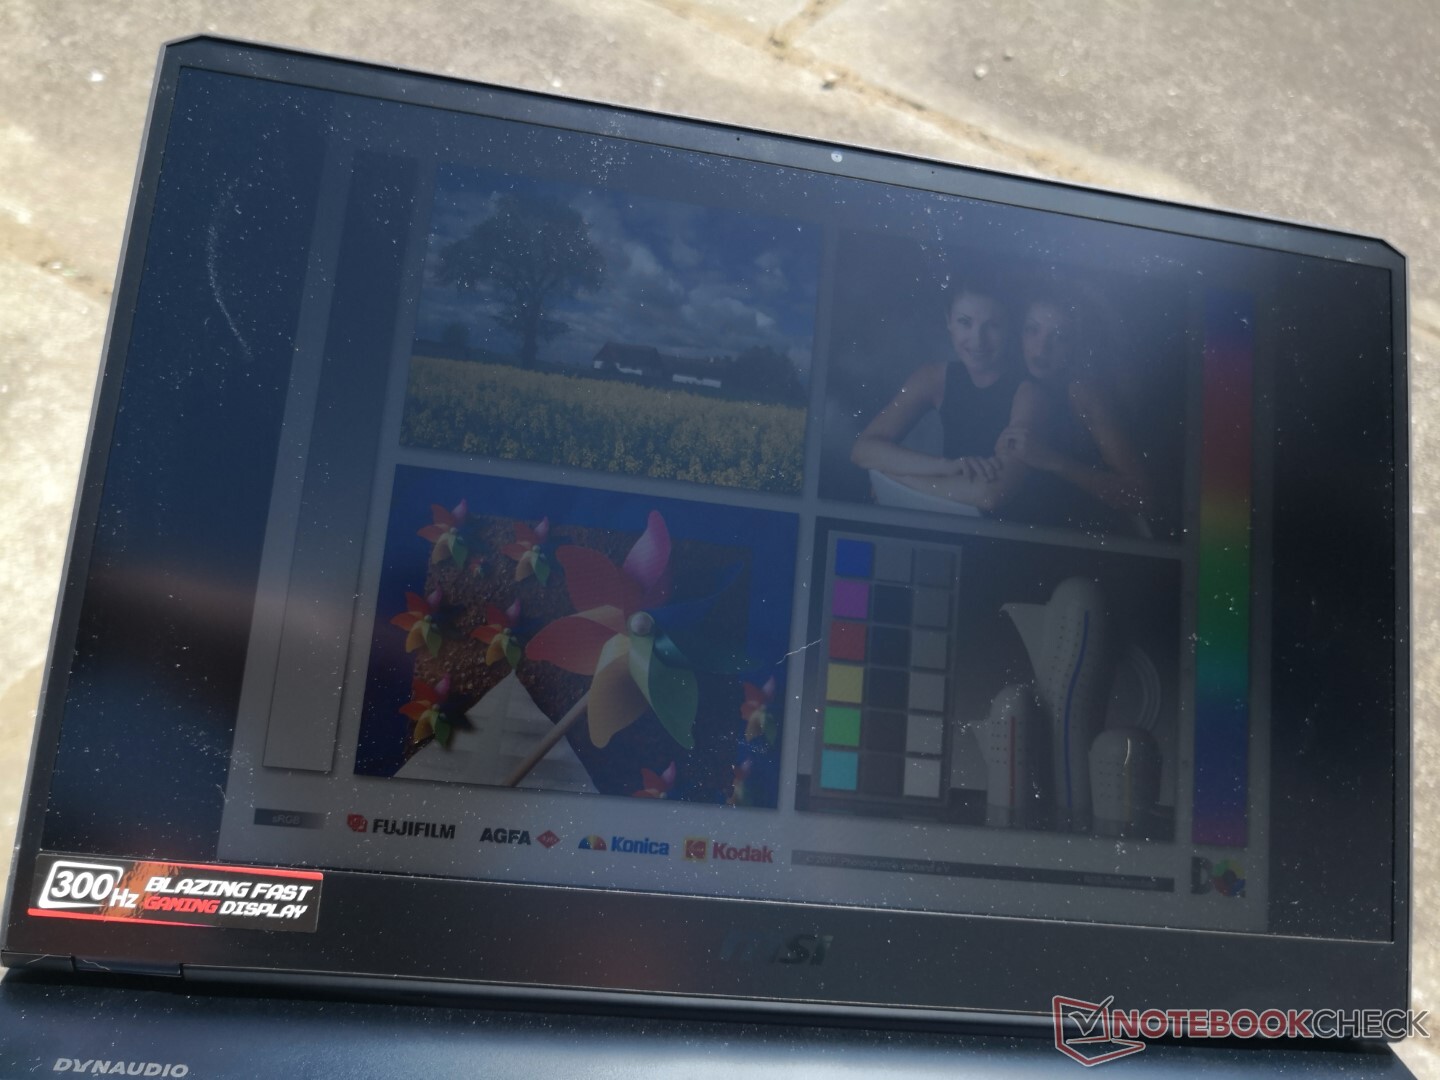
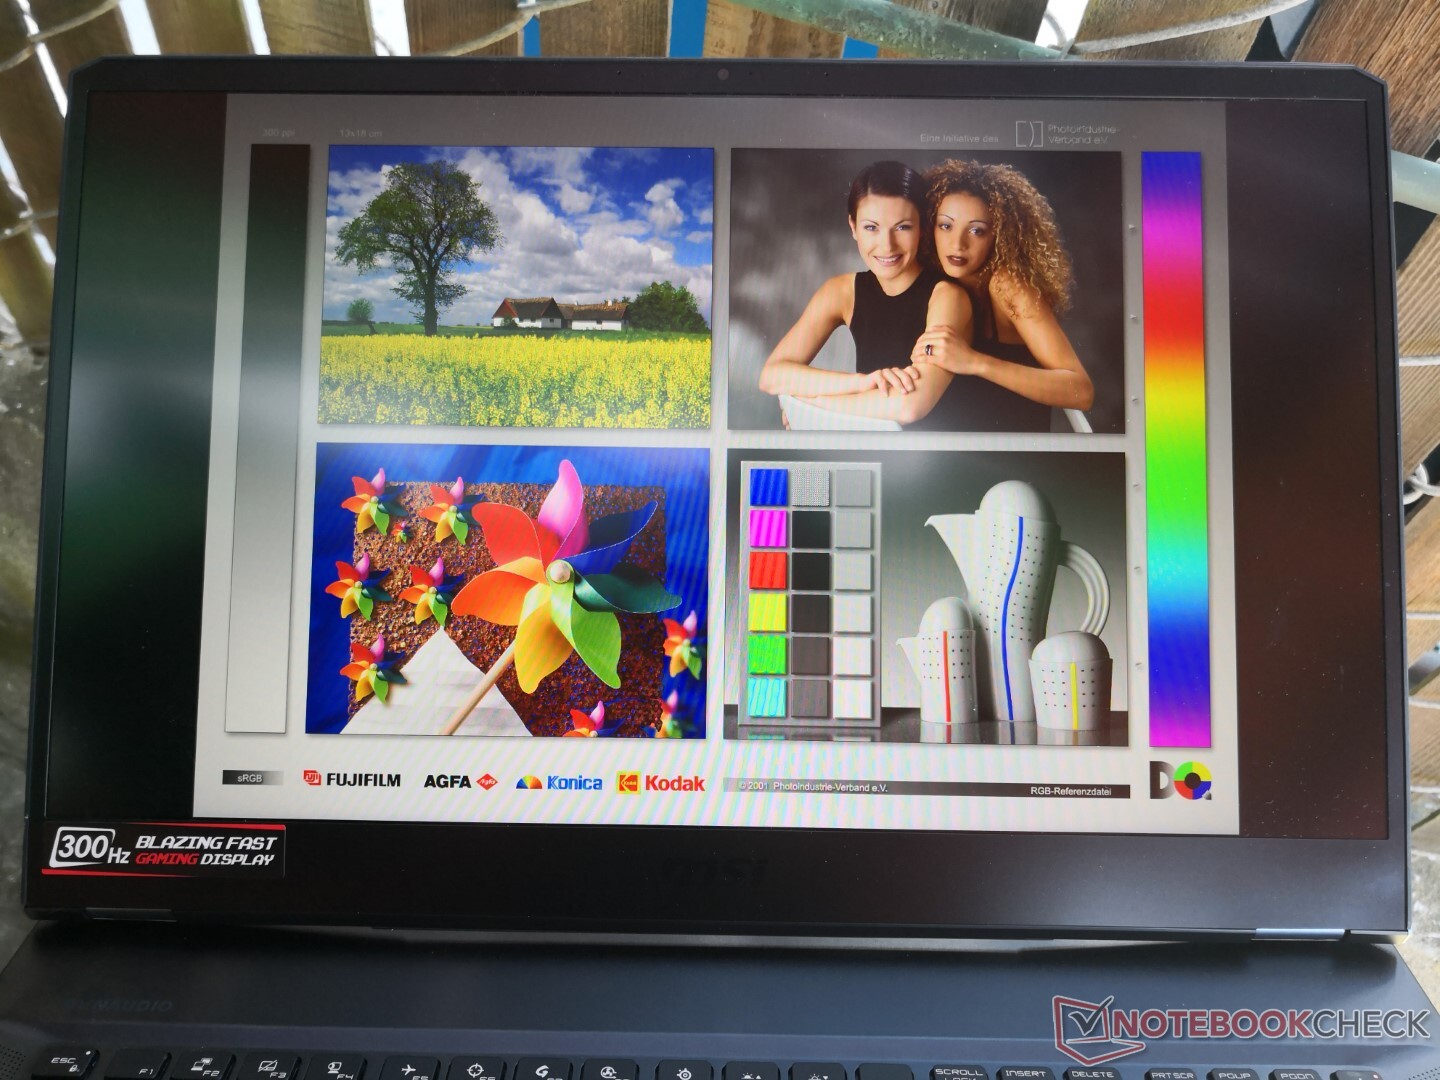
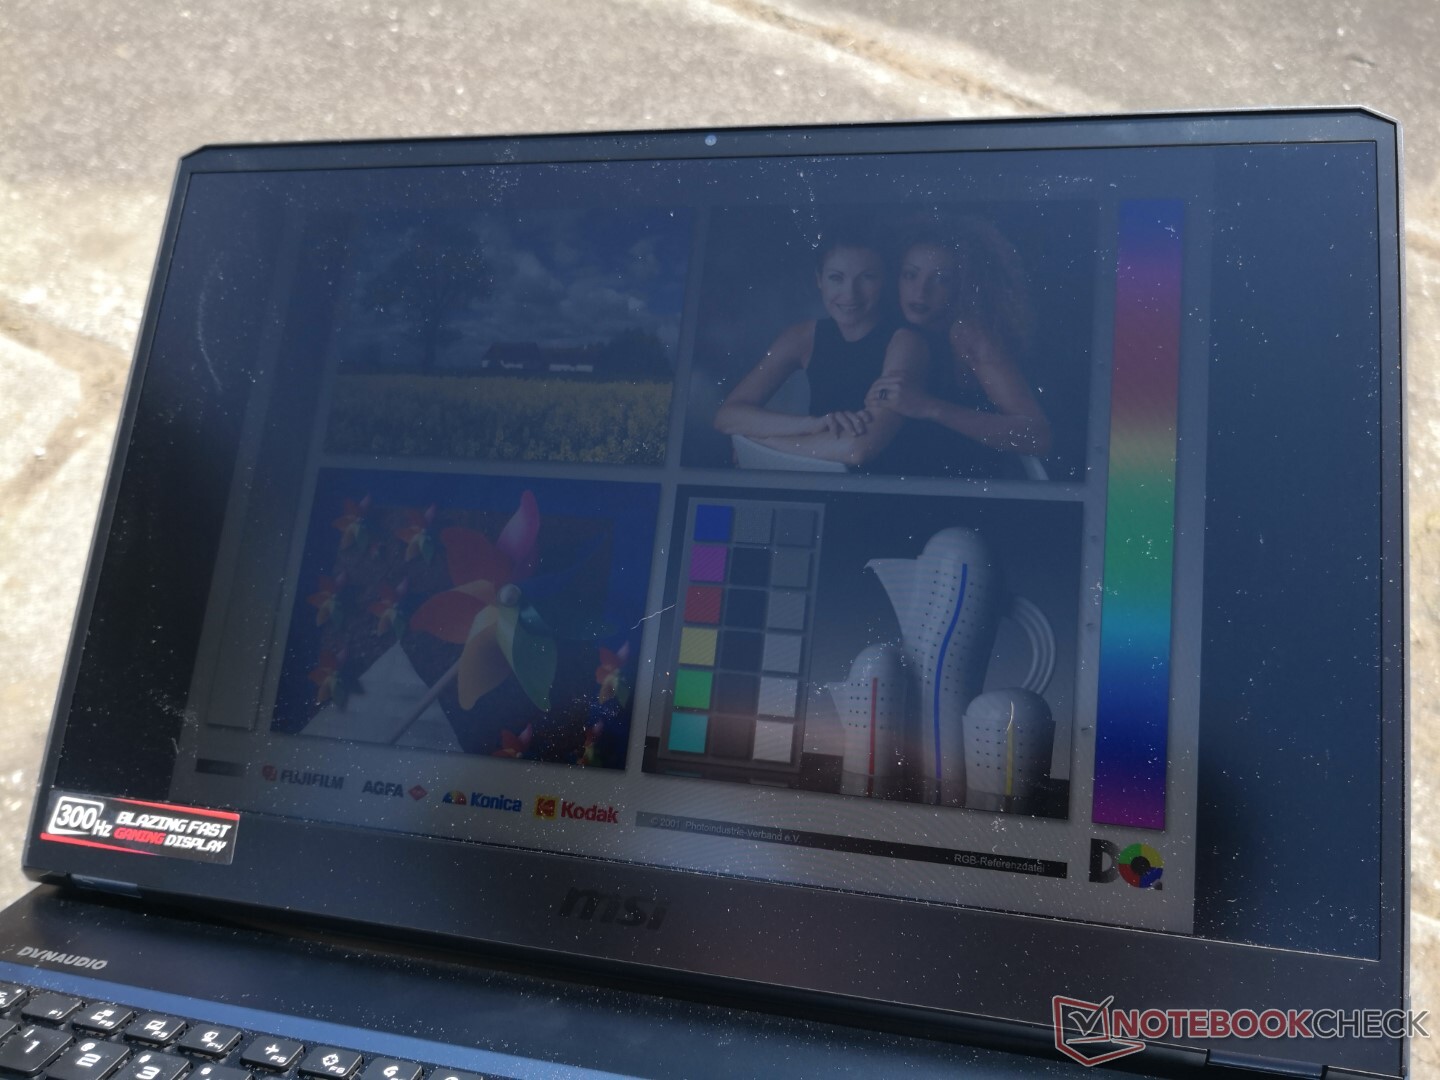
The displays on most 17.3-inch gaming laptops top out at just above 300 nits and the GE76 is no exception. You're going to want to avoid direct sunlight or else the screen will become too dim and washed out.
Performance
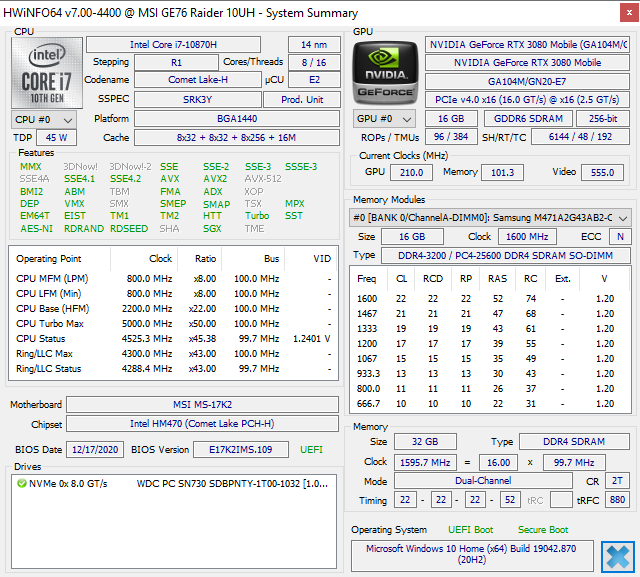
The GE76 comes only with hexa-core and octa-core Core i7 options. AMD options remain out of reach which is a shame considering how impressive the 7 nm Ryzen 7 4800H and Ryzen 7 5800H can be.
Both manual graphics switching and Optimus are available via the MSI Dragon Center software and the native 300 Hz refresh rate is compatible with either GPU. We recommend users become familiar with both Dragon Center and True Color as many MSI-specific features can be found in these applications.
Our unit was set to Extreme Performance mode prior to running any performance benchmarks below.
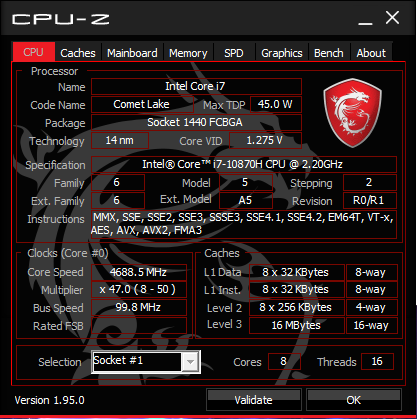
Processor
CPU performance is excellent at about 11 percent higher than the average laptop equipped with the same Core i7-10870H CPU to be on par with the more power-hungry Core i9-9980HK. Performance is even faster than most Core i7-10875H laptops due to the good CPU Turbo Boost sustainability of the GE76. Nonetheless, the chip still falls behind competing 7 nm AMD Zen 2 and Zen 3 alternatives like the Ryzen 7 4800H and Ryzen 7 5800H as found on some Asus laptops.
Cinebench R15: CPU Multi 64Bit | CPU Single 64Bit
Blender: v2.79 BMW27 CPU
7-Zip 18.03: 7z b 4 -mmt1 | 7z b 4
Geekbench 5.5: Single-Core | Multi-Core
HWBOT x265 Benchmark v2.2: 4k Preset
LibreOffice : 20 Documents To PDF
R Benchmark 2.5: Overall mean
| Cinebench R20 / CPU (Multi Core) | |
| MSI GT76 Titan DT 10SGS | |
| Schenker XMG Core 17 (Early 2021, RTX 3060, 5800H) | |
| Eluktronics RP-17 | |
| Alienware m17 R2 P41E | |
| MSI GE76 Raider 10UH | |
| Average Intel Core i7-10870H (3027 - 4020, n=12) | |
| Gigabyte Aero 17 HDR YC | |
| Average Intel Core i7-10875H (1986 - 4176, n=32) | |
| Acer Nitro 5 AN515-44-R5FT | |
| MSI GP76 Leopard 10UG | |
| Lenovo Legion Y740-17IRHg-81UJ001VGE | |
| Acer Aspire 5 A517-52G-79Z5 | |
| Cinebench R20 / CPU (Single Core) | |
| Acer Aspire 5 A517-52G-79Z5 | |
| Schenker XMG Core 17 (Early 2021, RTX 3060, 5800H) | |
| Gigabyte Aero 17 HDR YC | |
| MSI GT76 Titan DT 10SGS | |
| Average Intel Core i7-10875H (430 - 524, n=32) | |
| Eluktronics RP-17 | |
| Alienware m17 R2 P41E | |
| MSI GE76 Raider 10UH | |
| Average Intel Core i7-10870H (460 - 484, n=12) | |
| MSI GP76 Leopard 10UG | |
| Lenovo Legion Y740-17IRHg-81UJ001VGE | |
| Acer Nitro 5 AN515-44-R5FT | |
| Cinebench R15 / CPU Multi 64Bit | |
| MSI GT76 Titan DT 10SGS | |
| Schenker XMG Core 17 (Early 2021, RTX 3060, 5800H) | |
| Eluktronics RP-17 | |
| Gigabyte Aero 17 HDR YC | |
| Alienware m17 R2 P41E | |
| MSI GE76 Raider 10UH | |
| Average Intel Core i7-10870H (1336 - 1740, n=14) | |
| Average Intel Core i7-10875H (1003 - 1833, n=38) | |
| Acer Nitro 5 AN515-44-R5FT | |
| MSI GP76 Leopard 10UG | |
| Lenovo Legion Y740-17IRHg-81UJ001VGE | |
| Acer Aspire 5 A517-52G-79Z5 | |
| Cinebench R15 / CPU Single 64Bit | |
| Schenker XMG Core 17 (Early 2021, RTX 3060, 5800H) | |
| Acer Aspire 5 A517-52G-79Z5 | |
| Gigabyte Aero 17 HDR YC | |
| MSI GT76 Titan DT 10SGS | |
| Average Intel Core i7-10875H (190 - 220, n=37) | |
| Average Intel Core i7-10870H (196 - 204, n=11) | |
| MSI GP76 Leopard 10UG | |
| MSI GE76 Raider 10UH | |
| Alienware m17 R2 P41E | |
| Eluktronics RP-17 | |
| Acer Nitro 5 AN515-44-R5FT | |
| Lenovo Legion Y740-17IRHg-81UJ001VGE | |
| Blender / v2.79 BMW27 CPU | |
| Acer Aspire 5 A517-52G-79Z5 | |
| Lenovo Legion Y740-17IRHg-81UJ001VGE | |
| MSI GP76 Leopard 10UG | |
| Acer Nitro 5 AN515-44-R5FT | |
| Average Intel Core i7-10875H (259 - 535, n=30) | |
| Gigabyte Aero 17 HDR YC | |
| Average Intel Core i7-10870H (272 - 333, n=12) | |
| MSI GE76 Raider 10UH | |
| Schenker XMG Core 17 (Early 2021, RTX 3060, 5800H) | |
| Eluktronics RP-17 | |
| MSI GT76 Titan DT 10SGS | |
| 7-Zip 18.03 / 7z b 4 -mmt1 | |
| Gigabyte Aero 17 HDR YC | |
| Acer Aspire 5 A517-52G-79Z5 | |
| Average Intel Core i7-10875H (5071 - 5780, n=31) | |
| MSI GT76 Titan DT 10SGS | |
| Average Intel Core i7-10870H (5145 - 5429, n=12) | |
| Schenker XMG Core 17 (Early 2021, RTX 3060, 5800H) | |
| MSI GP76 Leopard 10UG | |
| MSI GE76 Raider 10UH | |
| Eluktronics RP-17 | |
| Lenovo Legion Y740-17IRHg-81UJ001VGE | |
| Acer Nitro 5 AN515-44-R5FT | |
| 7-Zip 18.03 / 7z b 4 | |
| MSI GT76 Titan DT 10SGS | |
| Schenker XMG Core 17 (Early 2021, RTX 3060, 5800H) | |
| Eluktronics RP-17 | |
| MSI GE76 Raider 10UH | |
| Gigabyte Aero 17 HDR YC | |
| Average Intel Core i7-10870H (39581 - 46708, n=12) | |
| Average Intel Core i7-10875H (29844 - 49562, n=31) | |
| Acer Nitro 5 AN515-44-R5FT | |
| MSI GP76 Leopard 10UG | |
| Lenovo Legion Y740-17IRHg-81UJ001VGE | |
| Acer Aspire 5 A517-52G-79Z5 | |
| Geekbench 5.5 / Single-Core | |
| Acer Aspire 5 A517-52G-79Z5 | |
| Schenker XMG Core 17 (Early 2021, RTX 3060, 5800H) | |
| Gigabyte Aero 17 HDR YC | |
| MSI GT76 Titan DT 10SGS | |
| MSI GP76 Leopard 10UG | |
| Average Intel Core i7-10875H (1233 - 1371, n=29) | |
| Average Intel Core i7-10870H (1191 - 1295, n=12) | |
| MSI GE76 Raider 10UH | |
| Eluktronics RP-17 | |
| Lenovo Legion Y740-17IRHg-81UJ001VGE | |
| Acer Nitro 5 AN515-44-R5FT | |
| Geekbench 5.5 / Multi-Core | |
| MSI GT76 Titan DT 10SGS | |
| Gigabyte Aero 17 HDR YC | |
| Schenker XMG Core 17 (Early 2021, RTX 3060, 5800H) | |
| Eluktronics RP-17 | |
| MSI GE76 Raider 10UH | |
| Average Intel Core i7-10875H (5715 - 8620, n=29) | |
| Average Intel Core i7-10870H (6403 - 7882, n=12) | |
| MSI GP76 Leopard 10UG | |
| Lenovo Legion Y740-17IRHg-81UJ001VGE | |
| Acer Nitro 5 AN515-44-R5FT | |
| Acer Aspire 5 A517-52G-79Z5 | |
| HWBOT x265 Benchmark v2.2 / 4k Preset | |
| MSI GT76 Titan DT 10SGS | |
| Schenker XMG Core 17 (Early 2021, RTX 3060, 5800H) | |
| MSI GE76 Raider 10UH | |
| Eluktronics RP-17 | |
| Average Intel Core i7-10870H (10.7 - 13.5, n=12) | |
| Gigabyte Aero 17 HDR YC | |
| Average Intel Core i7-10875H (7.27 - 14.1, n=27) | |
| MSI GP76 Leopard 10UG | |
| Lenovo Legion Y740-17IRHg-81UJ001VGE | |
| Acer Nitro 5 AN515-44-R5FT | |
| Acer Aspire 5 A517-52G-79Z5 | |
| LibreOffice / 20 Documents To PDF | |
| Acer Nitro 5 AN515-44-R5FT | |
| Eluktronics RP-17 | |
| Average Intel Core i7-10870H (46 - 64.4, n=12) | |
| Acer Aspire 5 A517-52G-79Z5 | |
| Gigabyte Aero 17 HDR YC | |
| Schenker XMG Core 17 (Early 2021, RTX 3060, 5800H) | |
| MSI GP76 Leopard 10UG | |
| Average Intel Core i7-10875H (30.2 - 84.3, n=30) | |
| MSI GE76 Raider 10UH | |
| MSI GT76 Titan DT 10SGS | |
| R Benchmark 2.5 / Overall mean | |
| Lenovo Legion Y740-17IRHg-81UJ001VGE | |
| Acer Nitro 5 AN515-44-R5FT | |
| MSI GP76 Leopard 10UG | |
| Average Intel Core i7-10870H (0.573 - 0.614, n=12) | |
| MSI GE76 Raider 10UH | |
| Eluktronics RP-17 | |
| Average Intel Core i7-10875H (0.546 - 0.662, n=29) | |
| MSI GT76 Titan DT 10SGS | |
| Acer Aspire 5 A517-52G-79Z5 | |
| Gigabyte Aero 17 HDR YC | |
| Schenker XMG Core 17 (Early 2021, RTX 3060, 5800H) | |
* ... smaller is better
System Performance
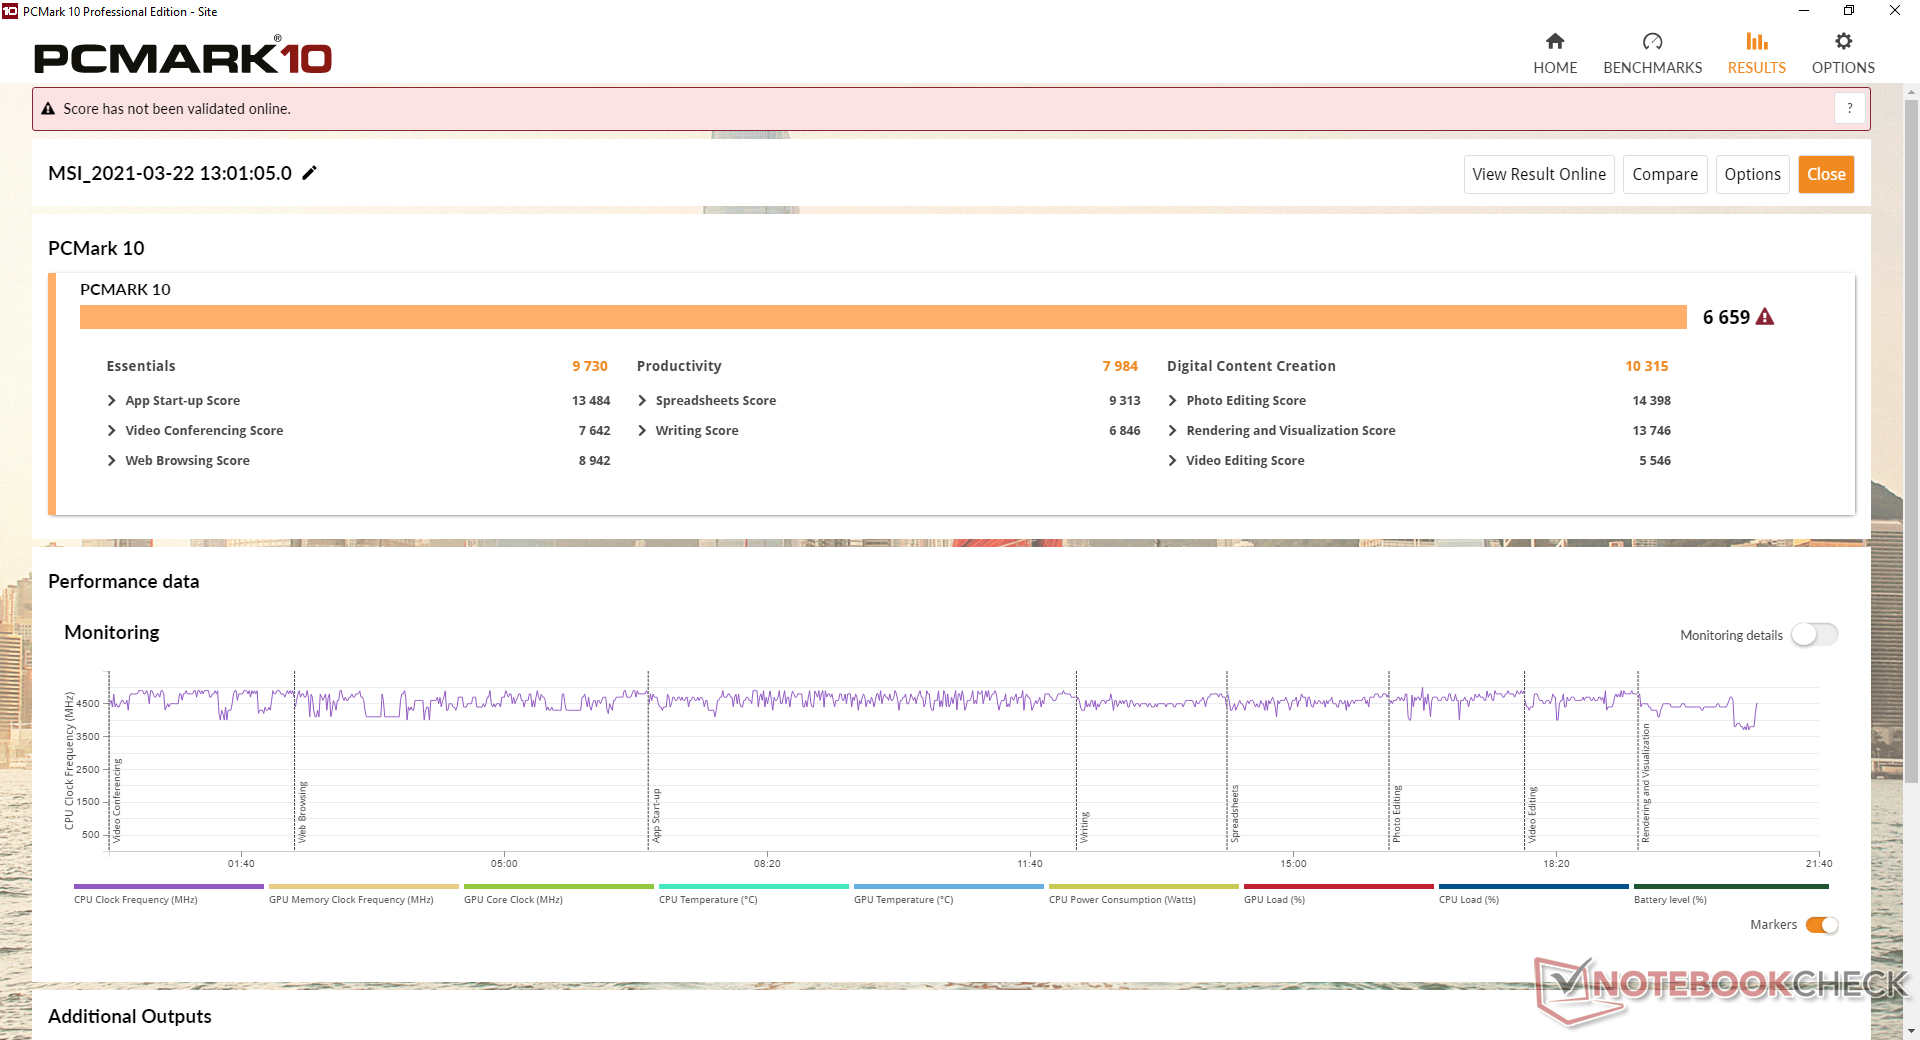
PCMark 10 scores are consistently higher than the older GE75 while being just below our massive GT76 unit with RAID 0 SSDs.
It's worth mentioning that we experienced a couple of bugs during our time with the GE76 test unit. Firstly, screen brightness would always be stuck on maximum when switching to the integrated GPU. Secondly, the battery would sometimes recharge abnormally slow or not at all when plugged into an outlet. Updating the Intel graphics driver and reconnecting the AC adapter appear to fix their respective problems, but they're an annoyance nonetheless.
| PCMark 8 | |
| Home Score Accelerated v2 | |
| Alienware m17 R3 P45E | |
| MSI GE75 8SG Raider | |
| MSI GT76 Titan DT 10SGS | |
| Schenker XMG Core 17 Comet Lake | |
| Work Score Accelerated v2 | |
| Alienware m17 R3 P45E | |
| Schenker XMG Core 17 Comet Lake | |
| MSI GE75 8SG Raider | |
| MSI GT76 Titan DT 10SGS | |
| PCMark 10 Score | 6659 points | |
Help | ||
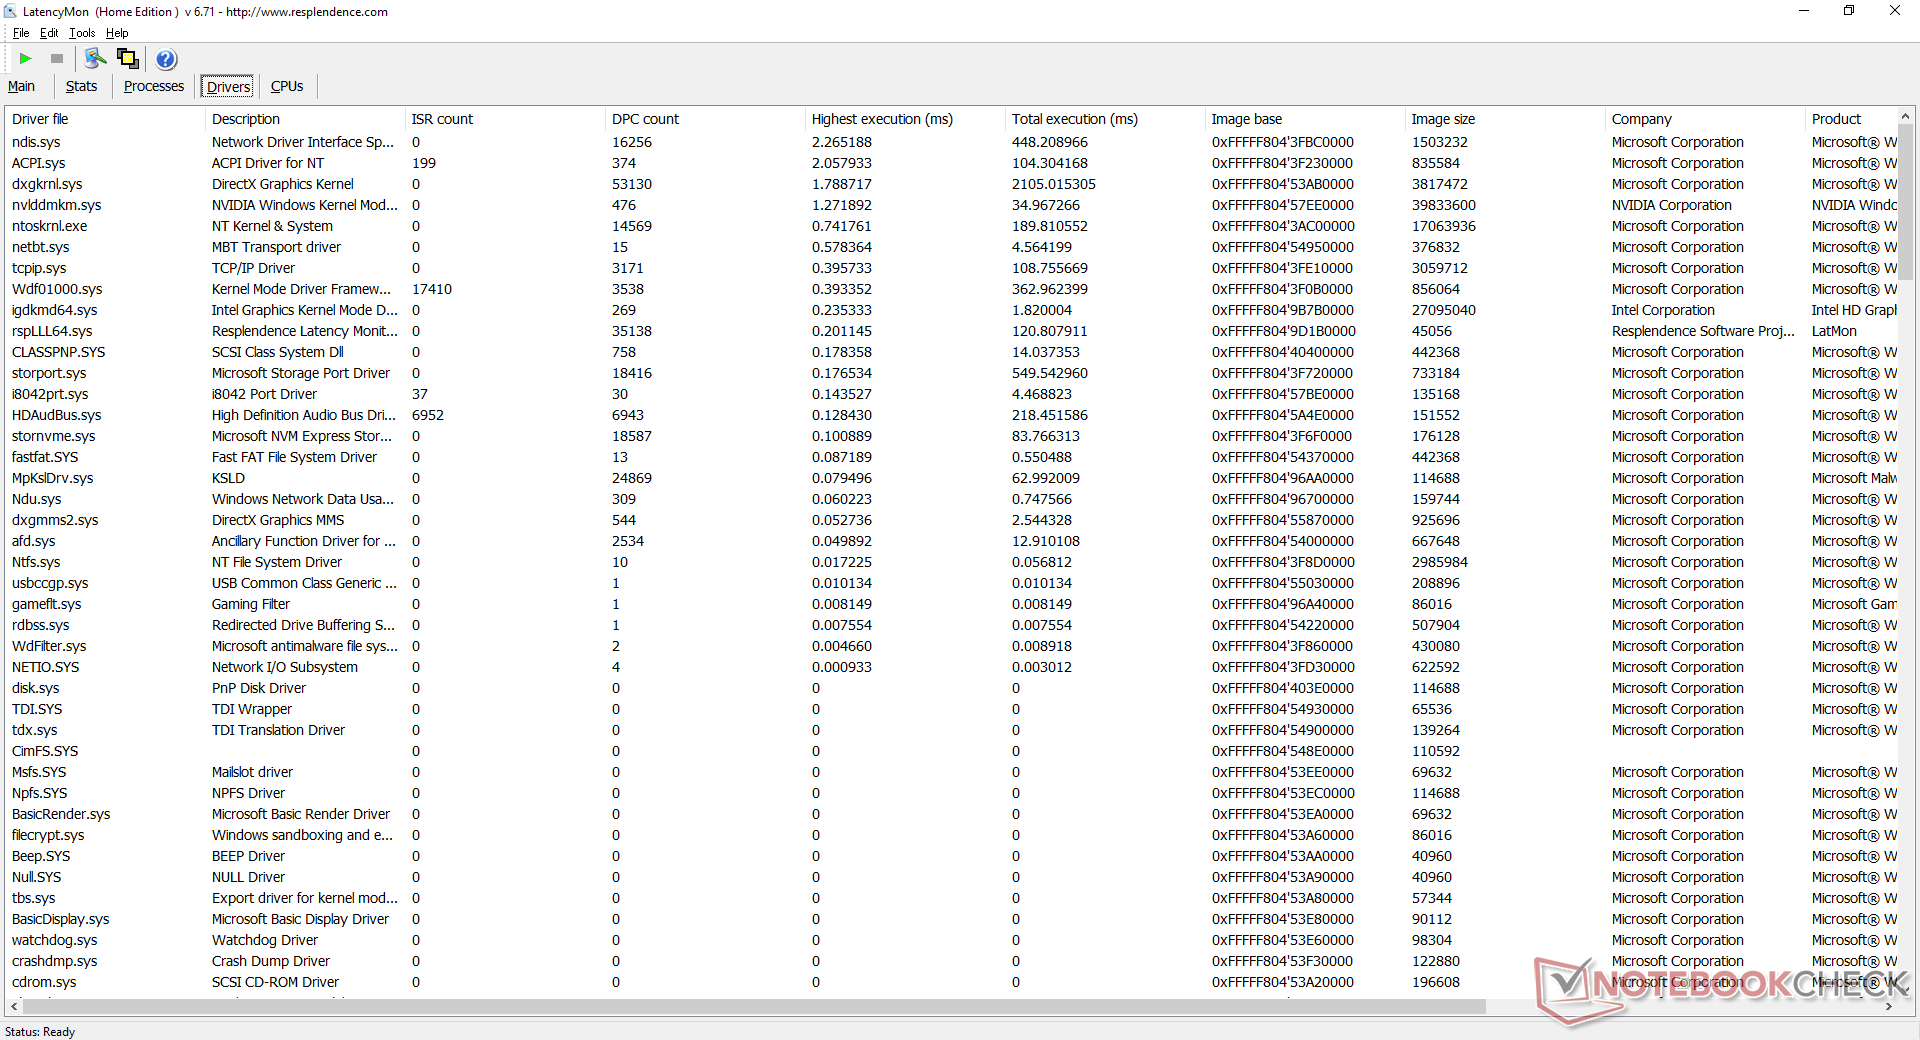
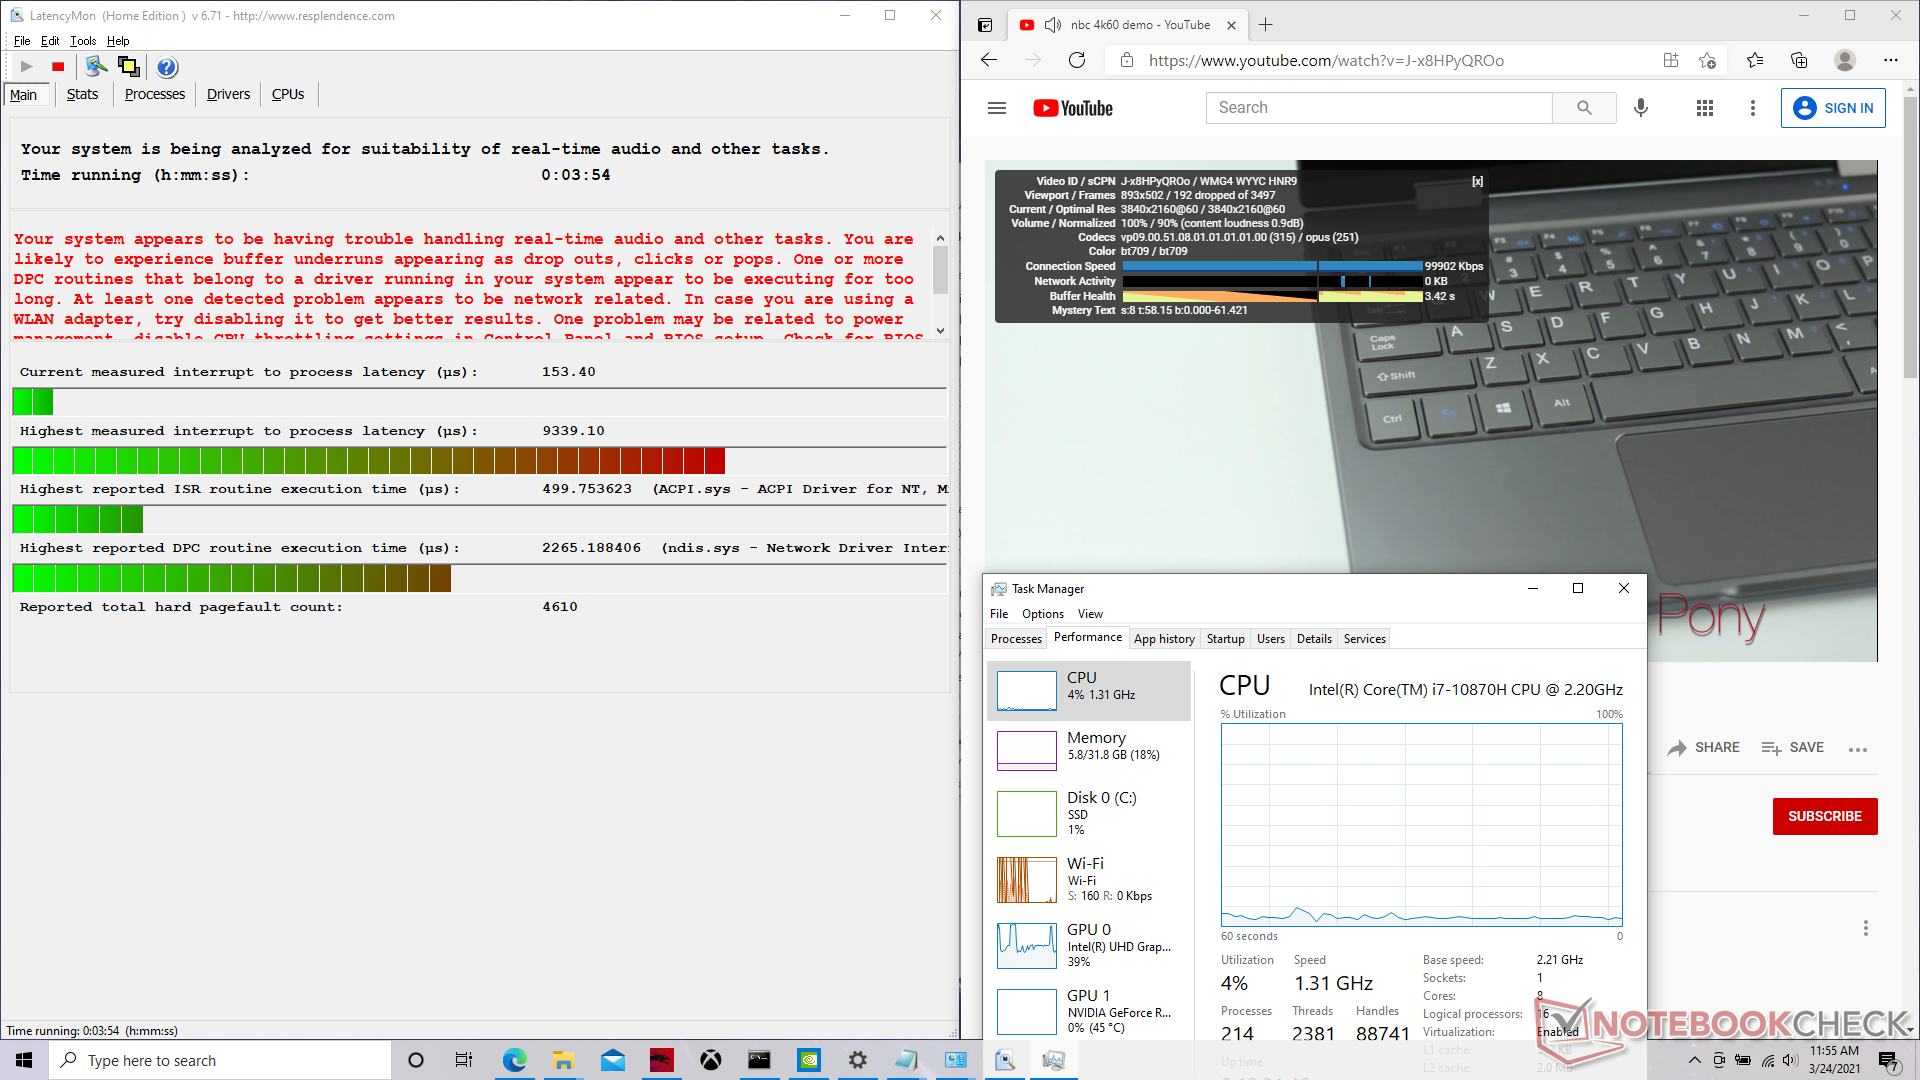
DPC Latency
The system suffers from major DPC latency issues and frame drops when playing 4K video content at 60 FPS on the iGPU. Switching to the Nvidia GPU or updating the Intel graphics driver addresses the frame skipping problem, but seeing skipped frames on such a powerful gaming laptop is no less disappointing.
| DPC Latencies / LatencyMon - interrupt to process latency (max), Web, Youtube, Prime95 | |
| MSI GT76 Titan DT 10SGS | |
| MSI GE76 Raider 10UH | |
| Asus Strix Scar 17 G732LXS | |
| Schenker XMG Core 17 Comet Lake | |
| Alienware m17 R3 P45E | |
* ... smaller is better
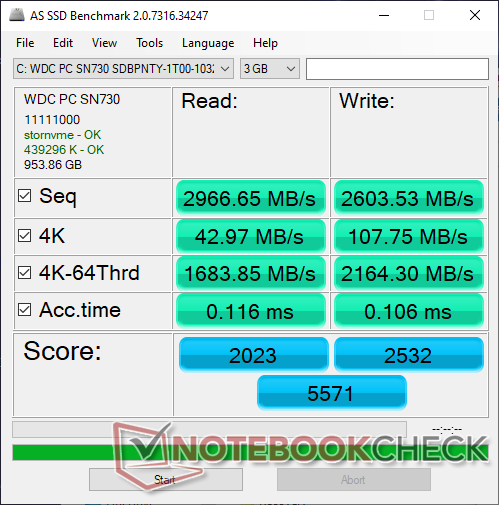
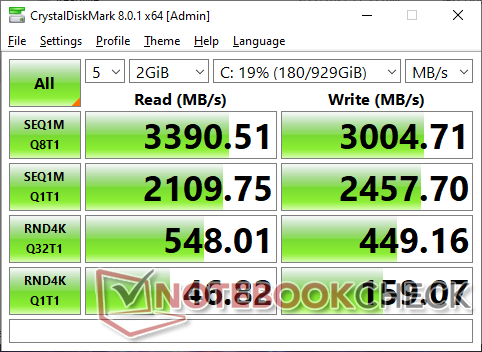
Storage Devices
Our test unit comes with a 1 TB Western Digital SN730 for read speeds topping 3300 MB/s. However, expect drives from other manufacturers depending on the retailer as usual. RAID is supported should users want to take advantage of the two internal M.2 slots.
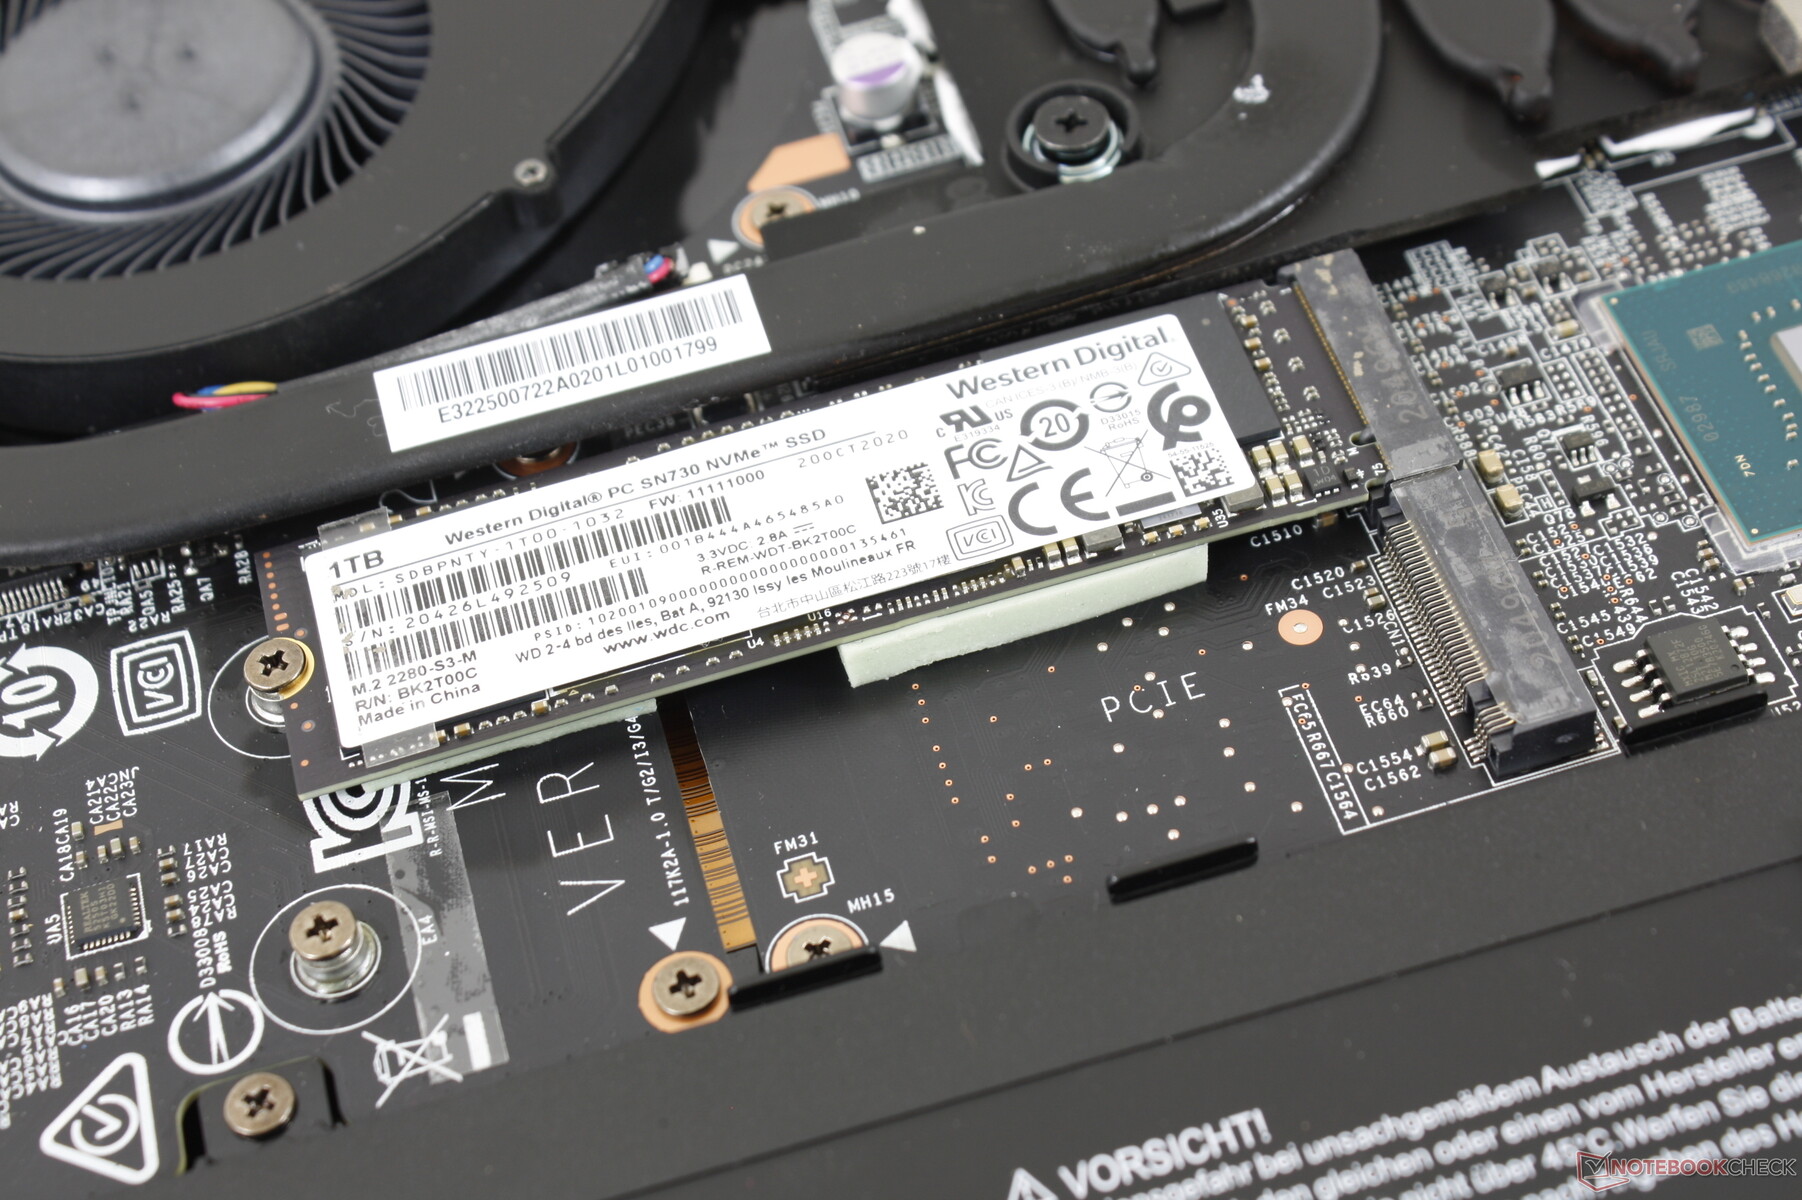
| MSI GE76 Raider 10UH WDC PC SN730 SDBPNTY-1T00 | Asus Strix Scar 17 G732LXS 2x Intel SSD 660p 1TB SSDPEKNW010T8 (RAID 0) | Alienware m17 R3 P45E 2x Micron 2200S 512 GB (RAID 0) | Schenker XMG Core 17 Comet Lake Samsung SSD 970 EVO Plus 1TB | MSI GT76 Titan DT 10SGS 2x WDC PC SN730 SDBPNTY-1T00 (RAID 0) | |
|---|---|---|---|---|---|
| AS SSD | -17% | -36% | 17% | -1% | |
| Seq Read (MB/s) | 2967 | 2450 -17% | 2060 -31% | 2937 -1% | 2406 -19% |
| Seq Write (MB/s) | 2604 | 1436 -45% | 2297 -12% | 2858 10% | 2867 10% |
| 4K Read (MB/s) | 42.97 | 49.48 15% | 35.39 -18% | 50.3 17% | 41.51 -3% |
| 4K Write (MB/s) | 107.8 | 119.4 11% | 63.1 -41% | 130.6 21% | 108.8 1% |
| 4K-64 Read (MB/s) | 1684 | 1032 -39% | 1337 -21% | 1710 2% | 1525 -9% |
| 4K-64 Write (MB/s) | 2164 | 1229 -43% | 1307 -40% | 2355 9% | 1424 -34% |
| Access Time Read * (ms) | 0.116 | 0.145 -25% | 0.057 51% | 0.037 68% | 0.041 65% |
| Access Time Write * (ms) | 0.106 | 0.036 66% | 0.411 -288% | 0.028 74% | 0.102 4% |
| Score Read (Points) | 2023 | 1327 -34% | 1578 -22% | 2054 2% | 1807 -11% |
| Score Write (Points) | 2532 | 1492 -41% | 1600 -37% | 2771 9% | 1819 -28% |
| Score Total (Points) | 5571 | 3456 -38% | 3997 -28% | 5873 5% | 4573 -18% |
| Copy ISO MB/s (MB/s) | 2106 | 1728 -18% | 2225 6% | 2605 24% | |
| Copy Program MB/s (MB/s) | 687 | 727 6% | 779 13% | 651 -5% | |
| Copy Game MB/s (MB/s) | 1590 | 1585 0% | 1590 0% | 1709 7% | |
| CrystalDiskMark 5.2 / 6 | -9% | -10% | 17% | 1% | |
| Write 4K (MB/s) | 157.1 | 125.8 -20% | 68 -57% | 169.5 8% | 116.4 -26% |
| Read 4K (MB/s) | 46.3 | 52.9 14% | 42.04 -9% | 51.5 11% | 43.85 -5% |
| Write Seq (MB/s) | 2396 | 1795 -25% | 2221 -7% | 3009 26% | 2927 22% |
| Read Seq (MB/s) | 2245 | 2315 3% | 2202 -2% | 2959 32% | 1997 -11% |
| Write 4K Q32T1 (MB/s) | 436.1 | 407.1 -7% | 494.5 13% | 536 23% | 467.6 7% |
| Read 4K Q32T1 (MB/s) | 524 | 411.9 -21% | 540 3% | 621 19% | 538 3% |
| Write Seq Q32T1 (MB/s) | 3086 | 2844 -8% | 2623 -15% | 3339 8% | 3362 9% |
| Read Seq Q32T1 (MB/s) | 3363 | 3130 -7% | 3159 -6% | 3561 6% | 3558 6% |
| Total Average (Program / Settings) | -13% /
-14% | -23% /
-26% | 17% /
17% | 0% /
-1% |
* ... smaller is better

Disk Throttling: DiskSpd Read Loop, Queue Depth 8
GPU Performance
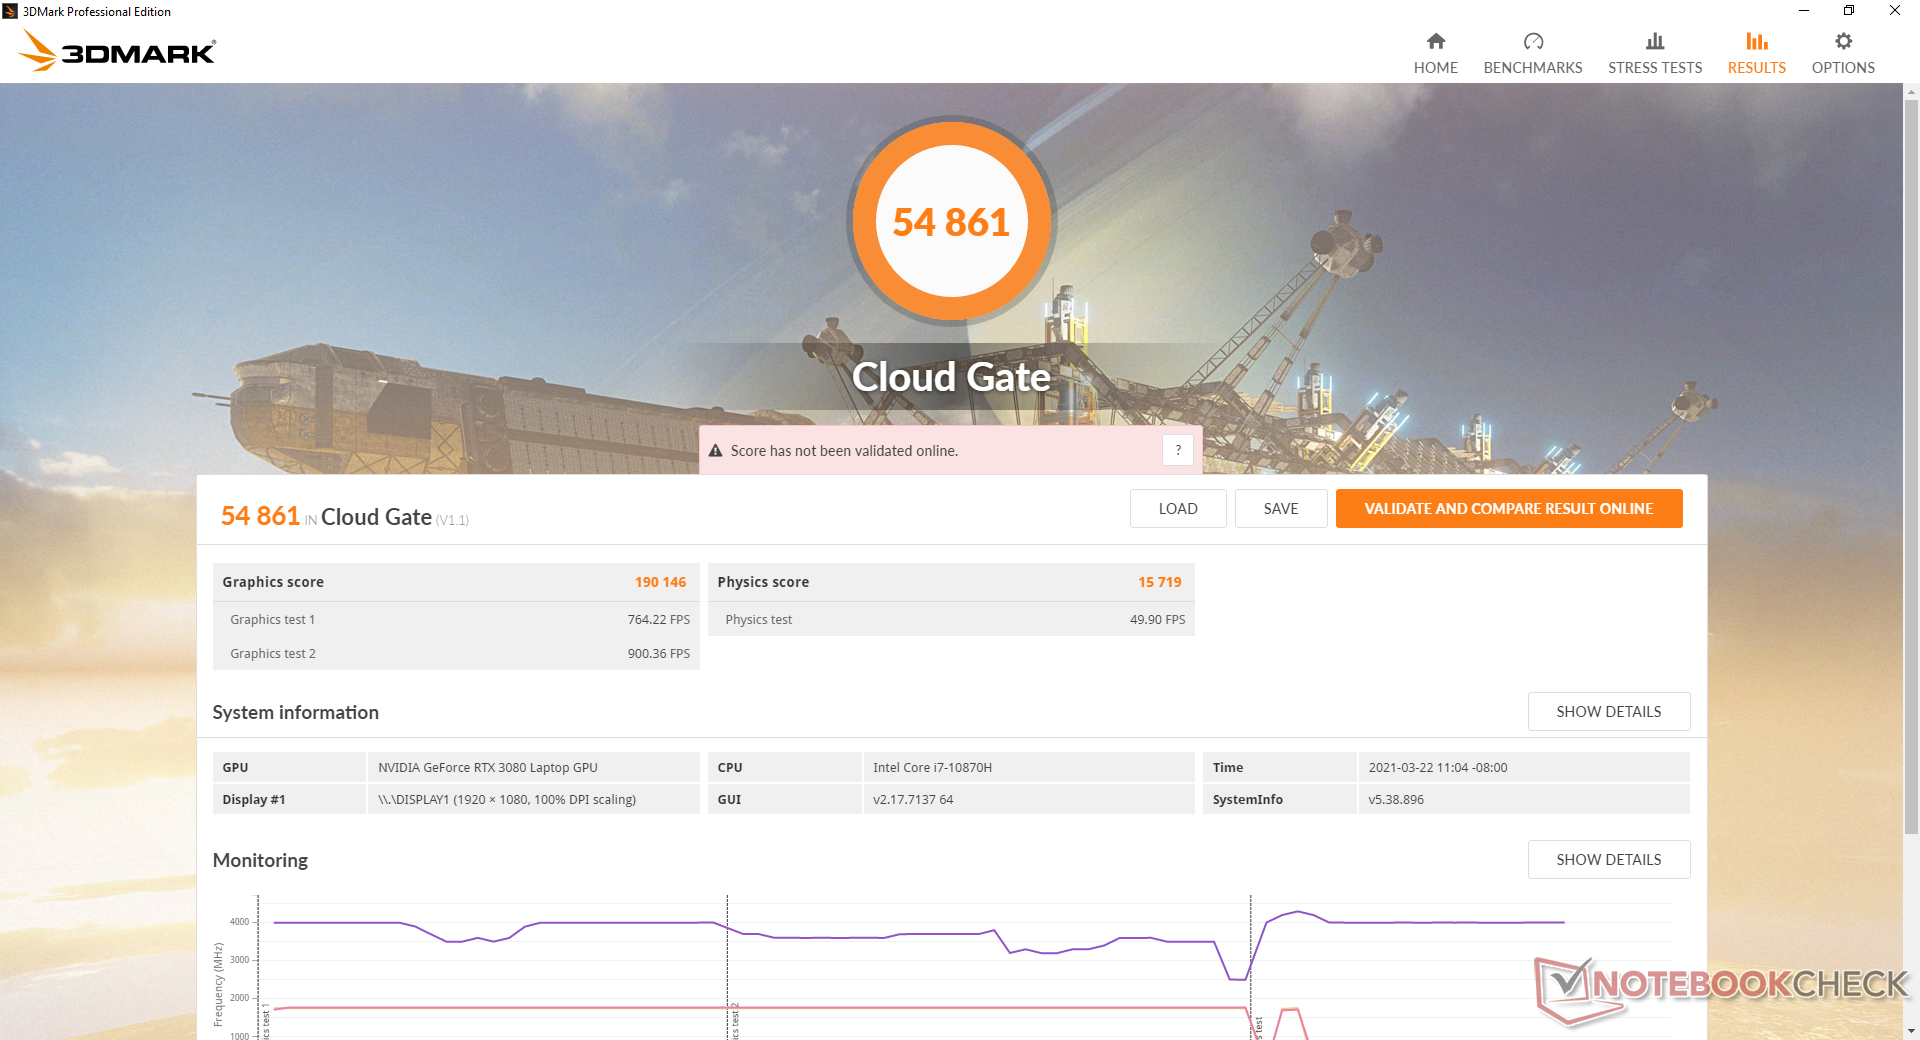
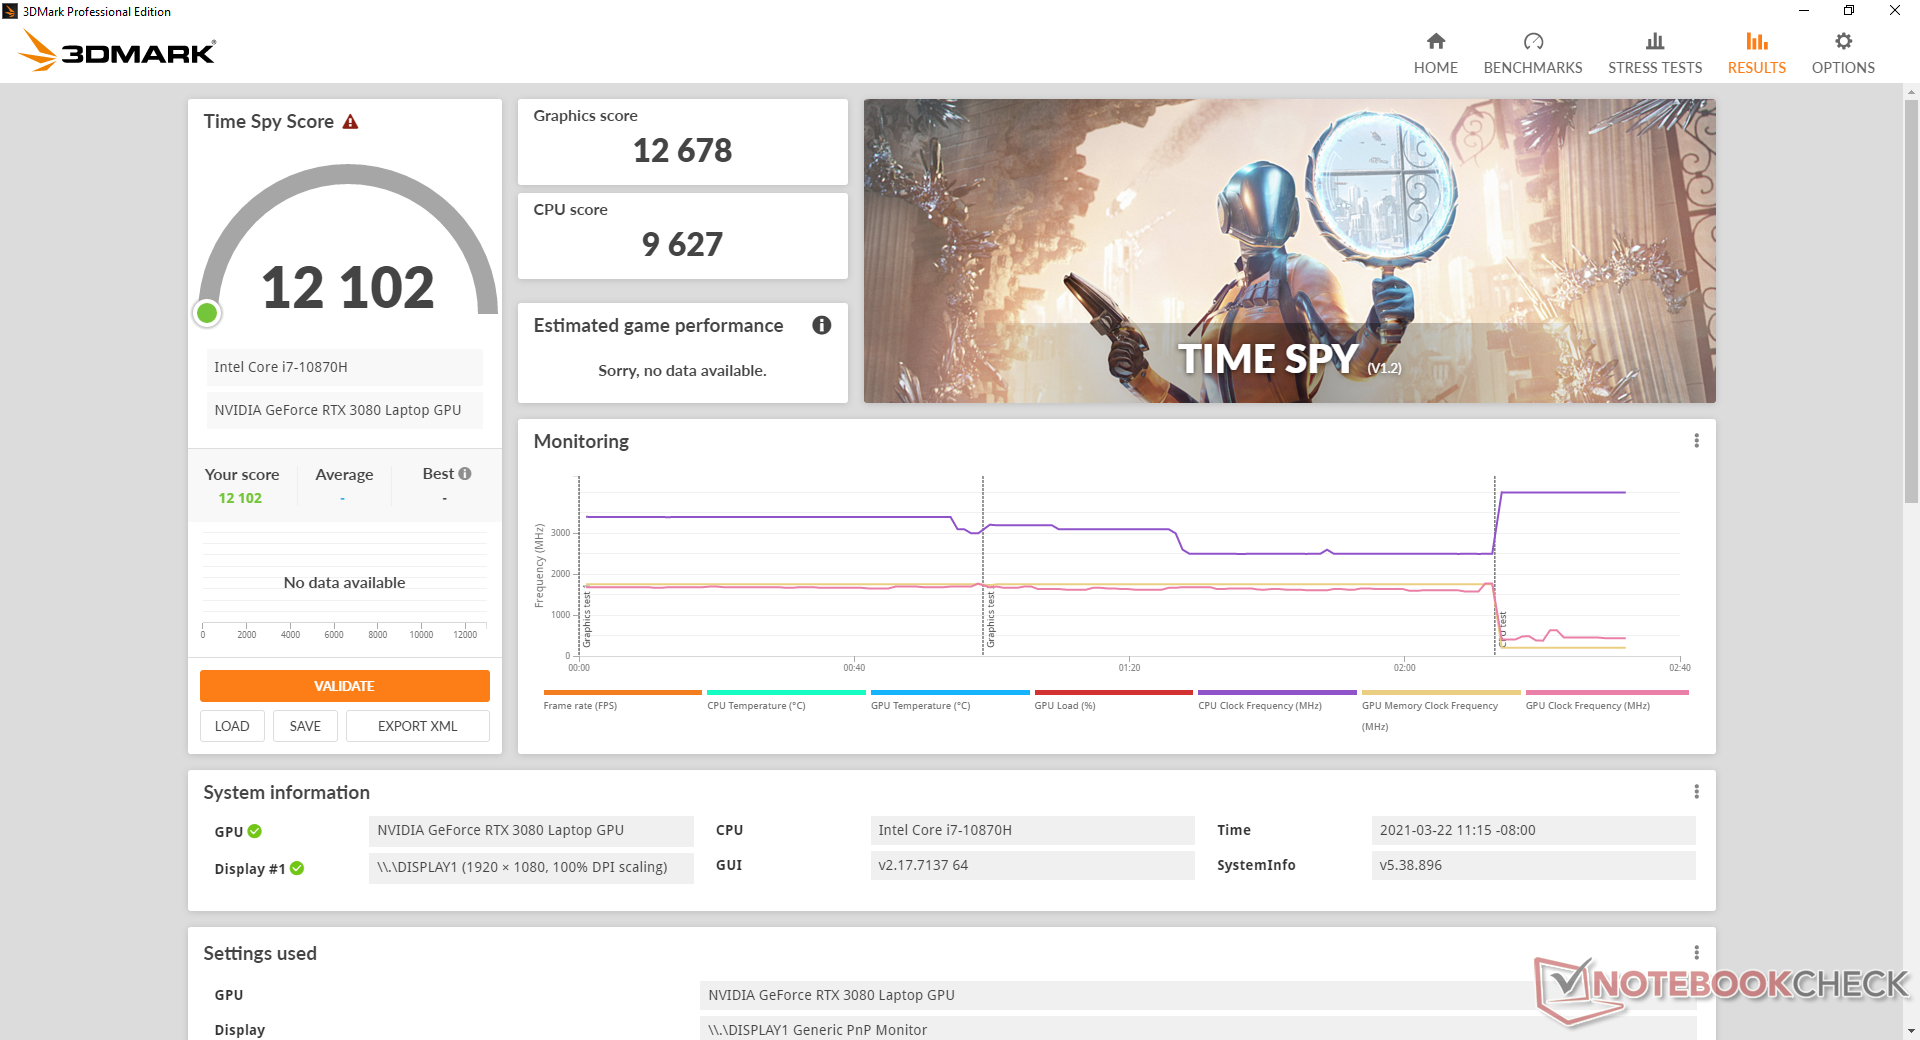
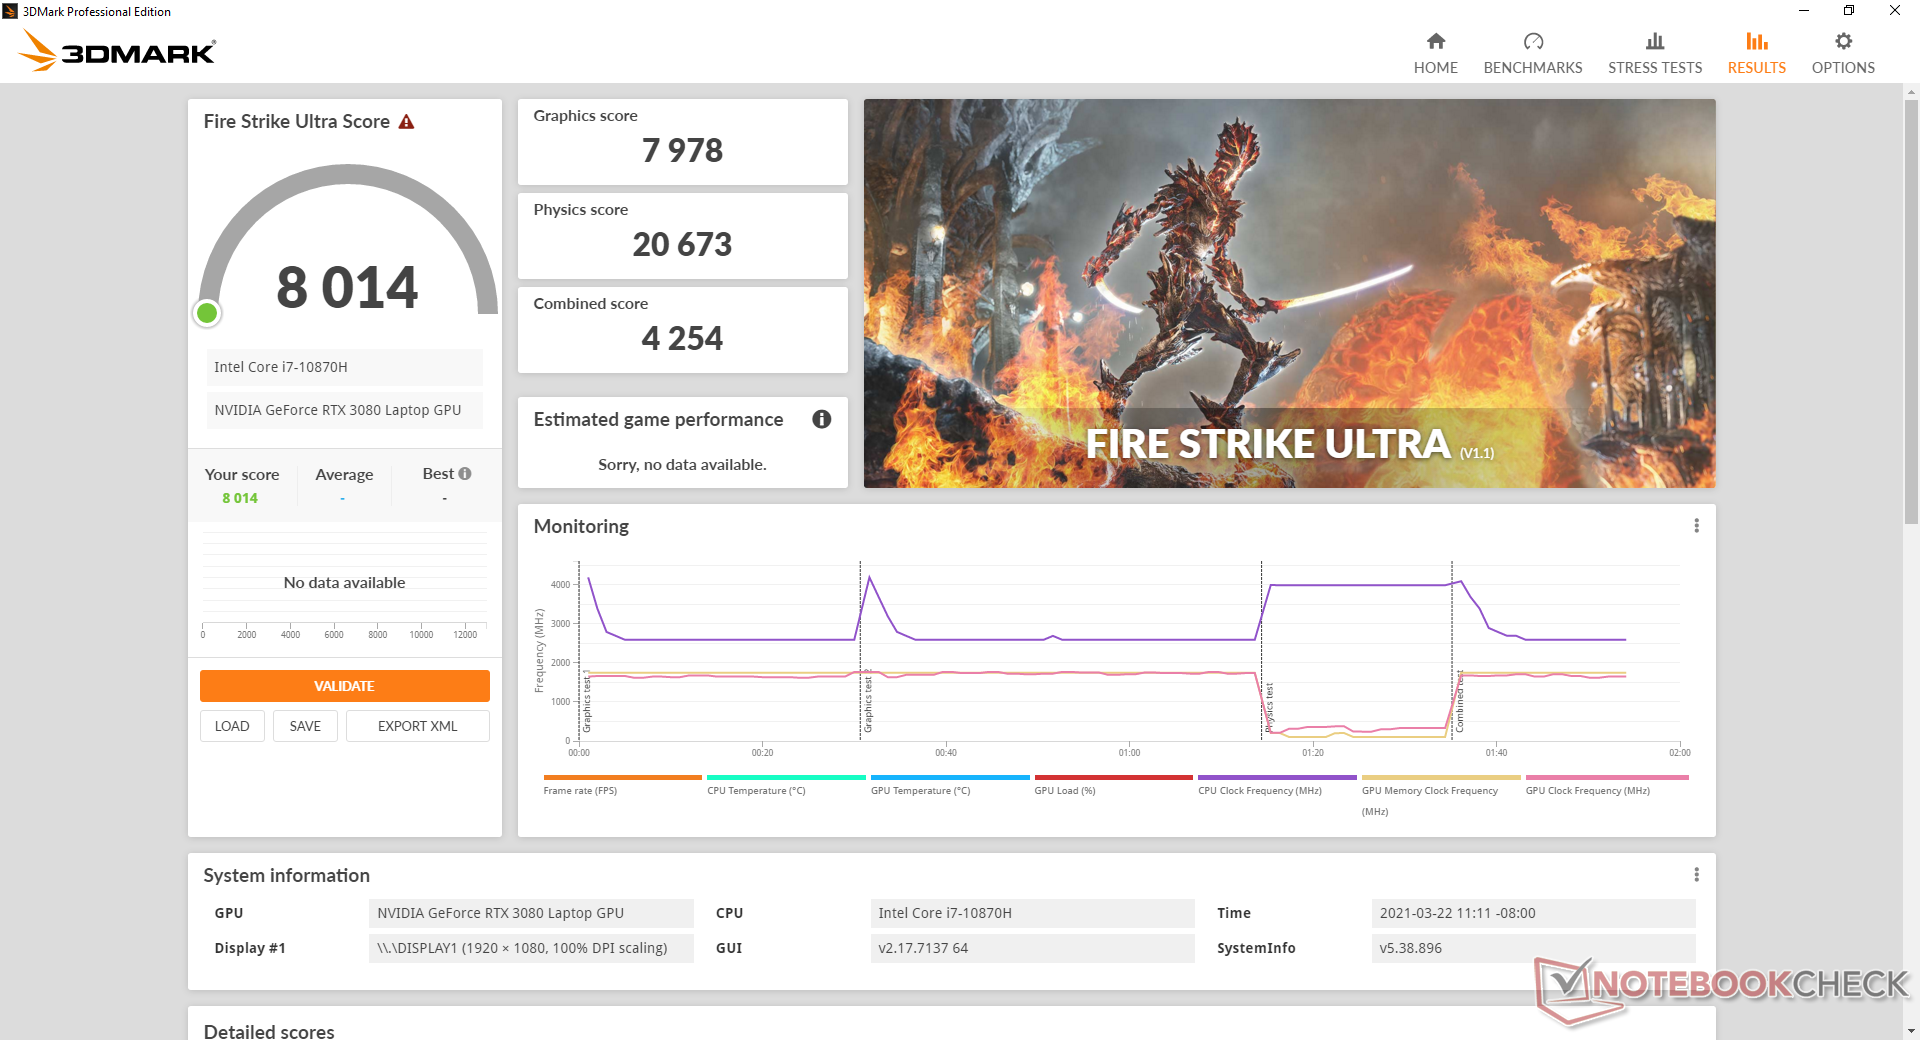
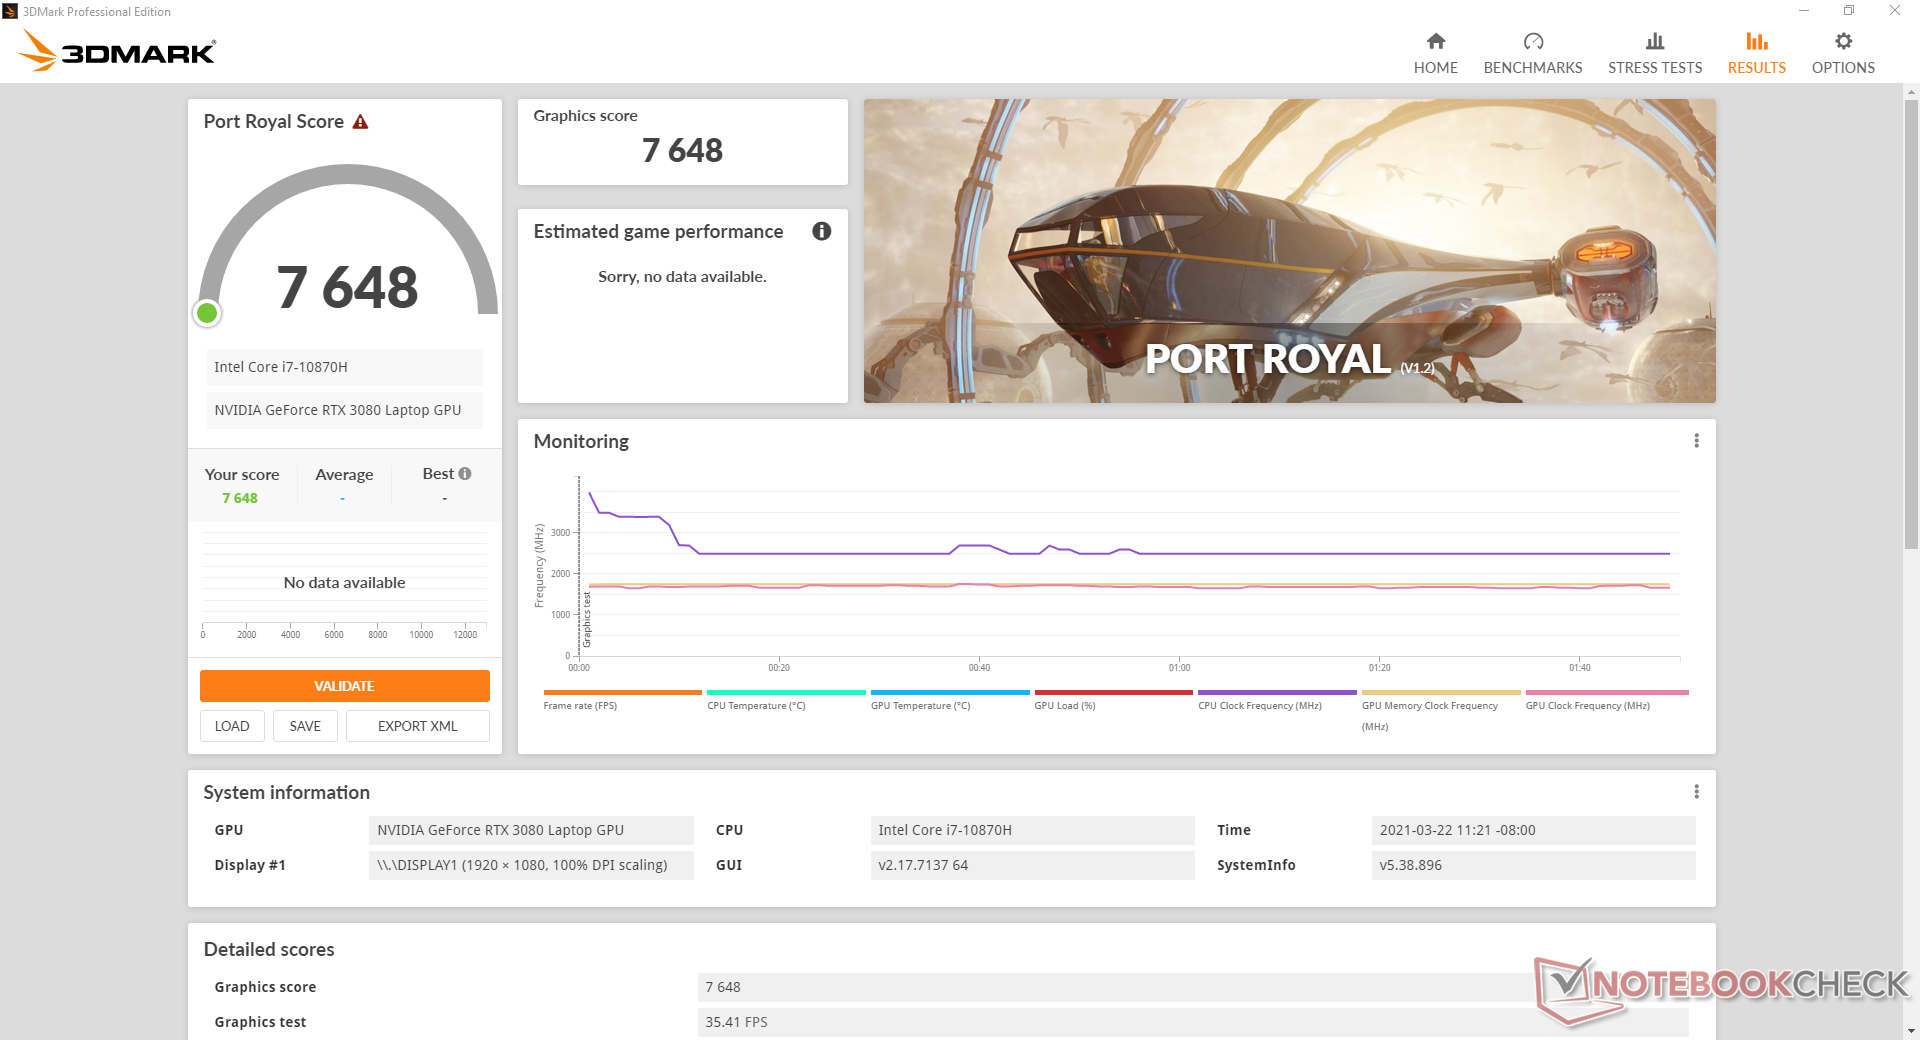
Of the 8 laptops we've tested thus far with the mobile GeForce RTX 3080 GPU, our MSI GE76 is one of the the fastest by 15 to 20 percent over the average. Even so, this only puts the laptop about 10 to 20 percent faster than the mobile RTX 3070 in the much cheaper MSI GP76. Overall performance is about 17 percent faster than the mobile RTX 2080 in last year's GE75, but this gap may widen to 27 percent when running games in 4K to suggest that the mobile GeForce RTX 30 series is at its best when aiming for very high native resolutions.
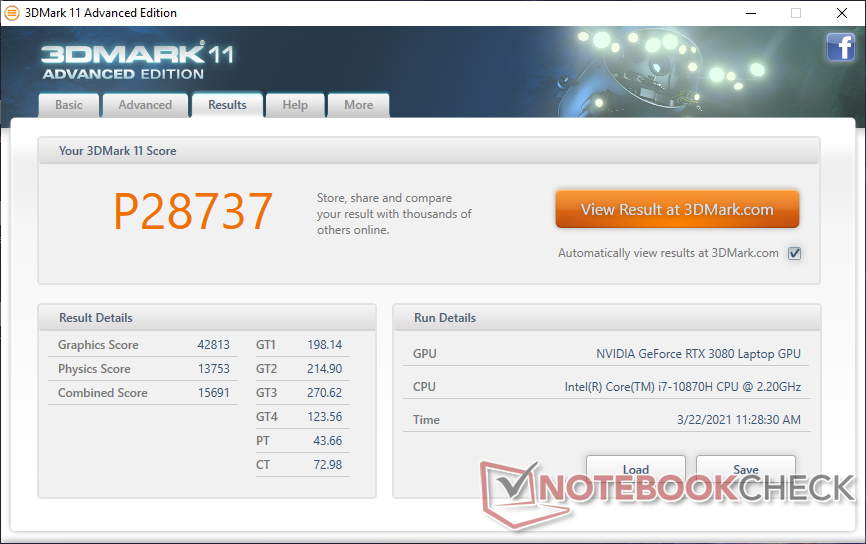
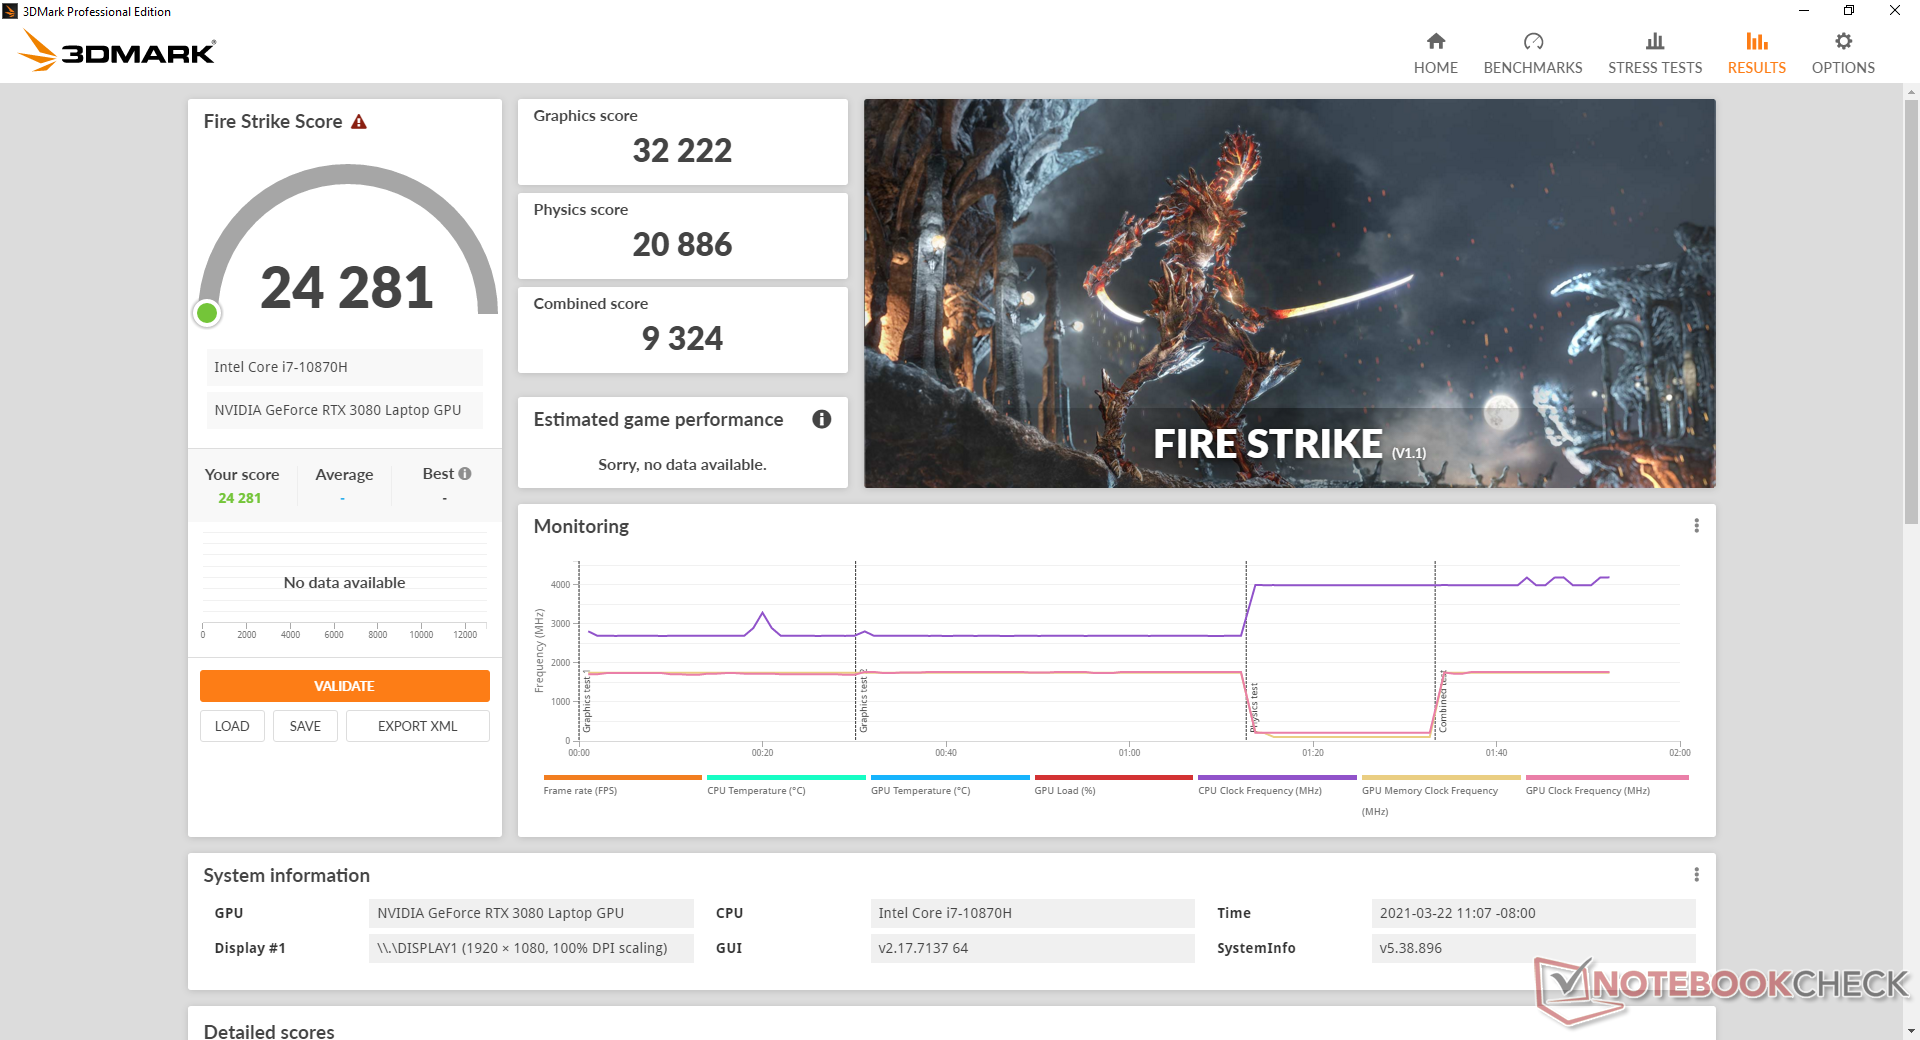
| 3DMark 11 Performance | 28737 points | |
| 3DMark Cloud Gate Standard Score | 54861 points | |
| 3DMark Fire Strike Score | 24281 points | |
| 3DMark Time Spy Score | 12102 points | |
Help | ||
| low | med. | high | ultra | |
|---|---|---|---|---|
| GTA V (2015) | 181 | 176 | 162 | 95.1 |
| The Witcher 3 (2015) | 370.2 | 301.3 | 231.2 | 120 |
| Dota 2 Reborn (2015) | 150 | 137 | 134 | 126 |
| Final Fantasy XV Benchmark (2018) | 169 | 152 | 115 | |
| X-Plane 11.11 (2018) | 111 | 104 | 82.3 | |
| Far Cry 5 (2018) | 143 | 133 | 126 | 117 |
| Strange Brigade (2018) | 409 | 306 | 248 | 219 |
Emissions
System Noise
Fan noise is highly dependent on the chosen power profile. When on Silent mode, the fans will indeed idle at 0 RPM during low loads like browsing or streaming with the occasional slight uptick to 2400 RPM or 26.1 dB(A). The twin fans pulse somewhat frequently during use, but the RPM spikes are never extreme enough to be bothersome.
Running higher loads like Witcher 3 on Extreme Performance mode causes the fans to stabilize at just 37 dB(A) to be relatively quiet for a gaming laptop where >40 dB(A) is much more common. When both the CPU and GPU more stressed more heavily, however, fan noise can reach up to 52.3 dB(A).
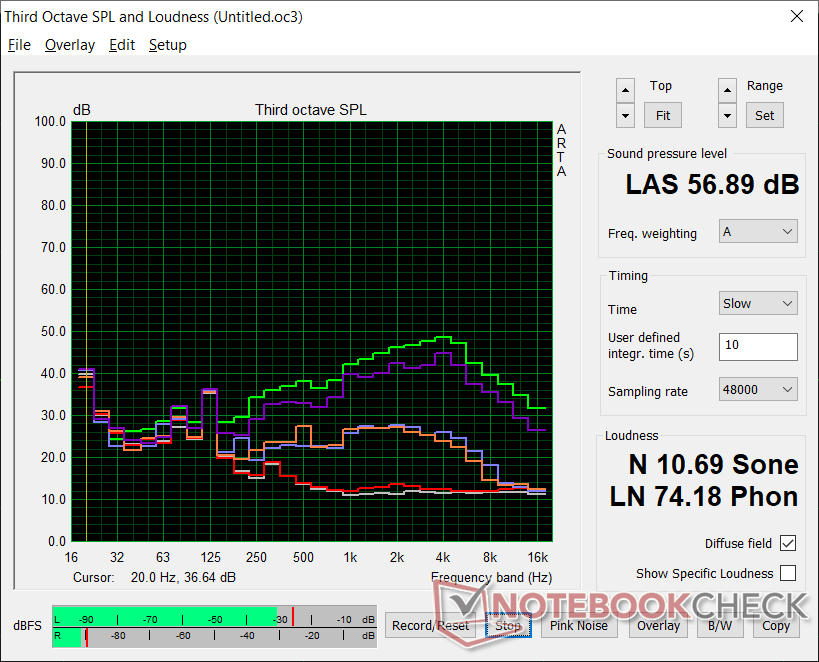
Enabling Cooler Boost mode (a.k.a. maximum fan noise mode) will set the fans to a flat 56.9 dB(A). Such a feature isn't necessary in most cases as core temperatures are already respectable even without Cooler Boost as shown by our Stress Test section below.
| MSI GE76 Raider 10UH GeForce RTX 3080 Laptop GPU, i7-10870H, WDC PC SN730 SDBPNTY-1T00 | MSI GE75 8SG Raider GeForce RTX 2080 Mobile, i7-8750H, Kingston RBUSNS8154P3512GJ | Asus Strix Scar 17 G732LXS GeForce RTX 2080 Super Mobile, i9-10980HK, 2x Intel SSD 660p 1TB SSDPEKNW010T8 (RAID 0) | Alienware m17 R3 P45E GeForce RTX 2080 Super Mobile, i9-10980HK, 2x Micron 2200S 512 GB (RAID 0) | Schenker XMG Core 17 Comet Lake GeForce GTX 1650 Ti Mobile, i7-10750H, Samsung SSD 970 EVO Plus 1TB | MSI GT76 Titan DT 10SGS GeForce RTX 2080 Super Mobile, i9-10900K, 2x WDC PC SN730 SDBPNTY-1T00 (RAID 0) | |
|---|---|---|---|---|---|---|
| Noise | -26% | -32% | -16% | -11% | -13% | |
| off / environment * (dB) | 25.3 | 30 -19% | 25 1% | 26.5 -5% | 25 1% | 26.4 -4% |
| Idle Minimum * (dB) | 26.1 | 30 -15% | 33 -26% | 27.8 -7% | 25 4% | 27.5 -5% |
| Idle Average * (dB) | 26.1 | 34 -30% | 38 -46% | 27.8 -7% | 31 -19% | 27.5 -5% |
| Idle Maximum * (dB) | 26.1 | 37 -42% | 45 -72% | 27.8 -7% | 32 -23% | 29.8 -14% |
| Load Average * (dB) | 37.2 | 52 -40% | 54 -45% | 52.1 -40% | 48 -29% | 30.9 17% |
| Witcher 3 ultra * (dB) | 36.8 | 53 -44% | 50 -36% | 51.8 -41% | 44 -20% | 60.7 -65% |
| Load Maximum * (dB) | 56.9 | 54 5% | 55 3% | 59.1 -4% | 51 10% | 66.6 -17% |
* ... smaller is better
Noise level
| Idle |
| 26.1 / 26.1 / 26.1 dB(A) |
| Load |
| 37.2 / 56.9 dB(A) |
 | ||
30 dB silent 40 dB(A) audible 50 dB(A) loud |
||
min: | ||
Temperature
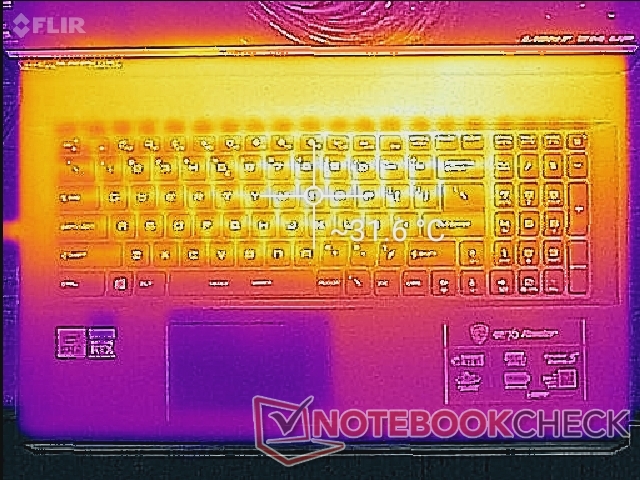
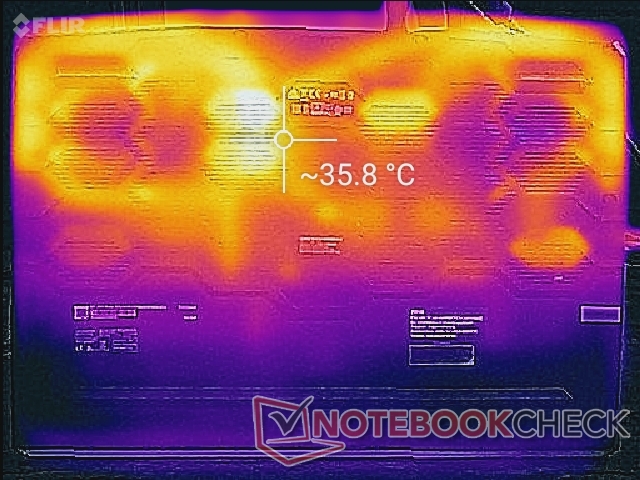
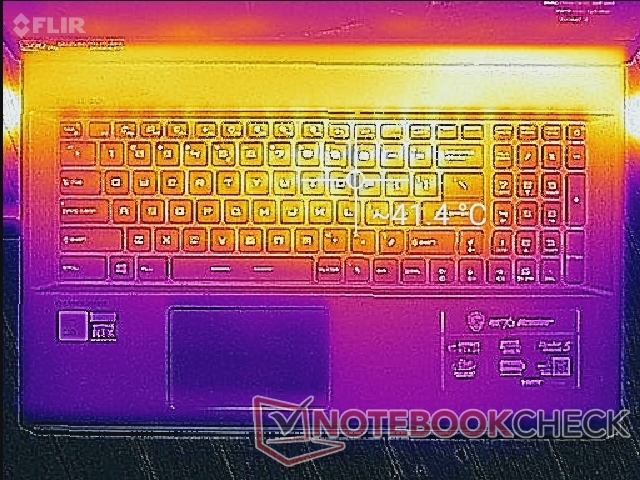
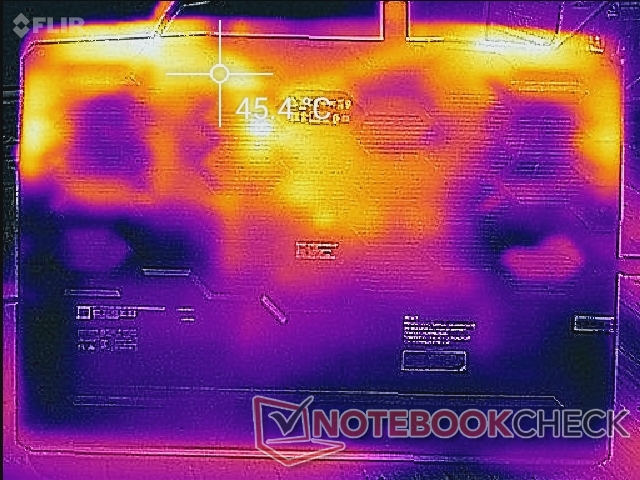
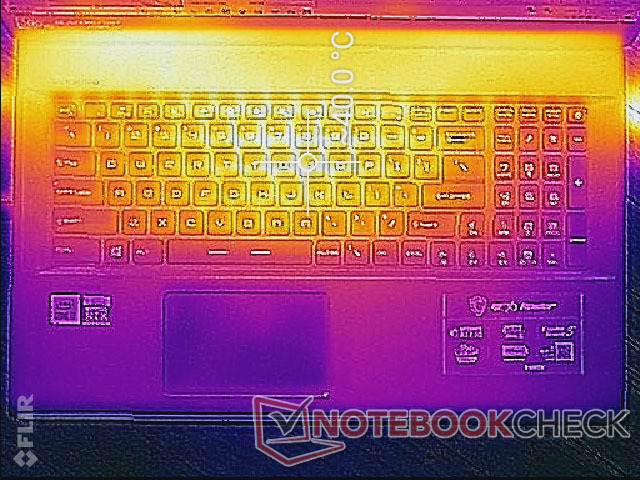
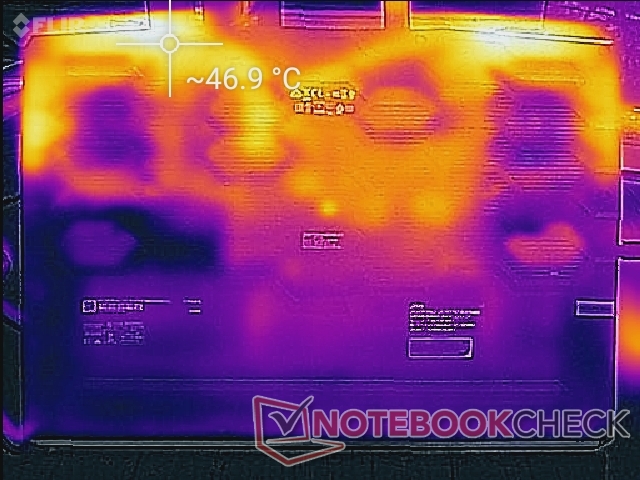
Surface temperatures when under load are cooler than what we recorded on the older GE75. When running Witcher 3, for example, the top and bottom hot spots of the GE75 top out at 49 C and 50 C, respectively, compared to just 42 C and 46 C on the GE76. The locations of the hot spots haven't changed by all that much gen-to-gen meaning the palm rests and keyboard center are still the coolest and warmest spots, respectively.
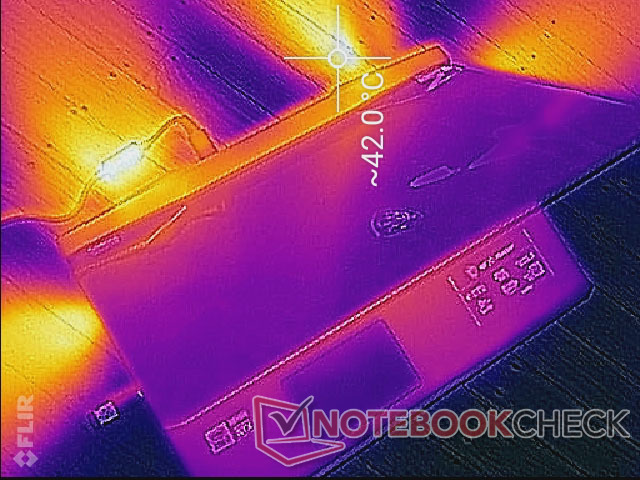
(±) The maximum temperature on the upper side is 41 °C / 106 F, compared to the average of 40.4 °C / 105 F, ranging from 21.2 to 68.8 °C for the class Gaming.
(-) The bottom heats up to a maximum of 48.8 °C / 120 F, compared to the average of 43.3 °C / 110 F
(+) In idle usage, the average temperature for the upper side is 27.3 °C / 81 F, compared to the device average of 33.9 °C / 93 F.
(±) Playing The Witcher 3, the average temperature for the upper side is 33.5 °C / 92 F, compared to the device average of 33.9 °C / 93 F.
(+) The palmrests and touchpad are cooler than skin temperature with a maximum of 27 °C / 80.6 F and are therefore cool to the touch.
(±) The average temperature of the palmrest area of similar devices was 28.8 °C / 83.8 F (+1.8 °C / 3.2 F).
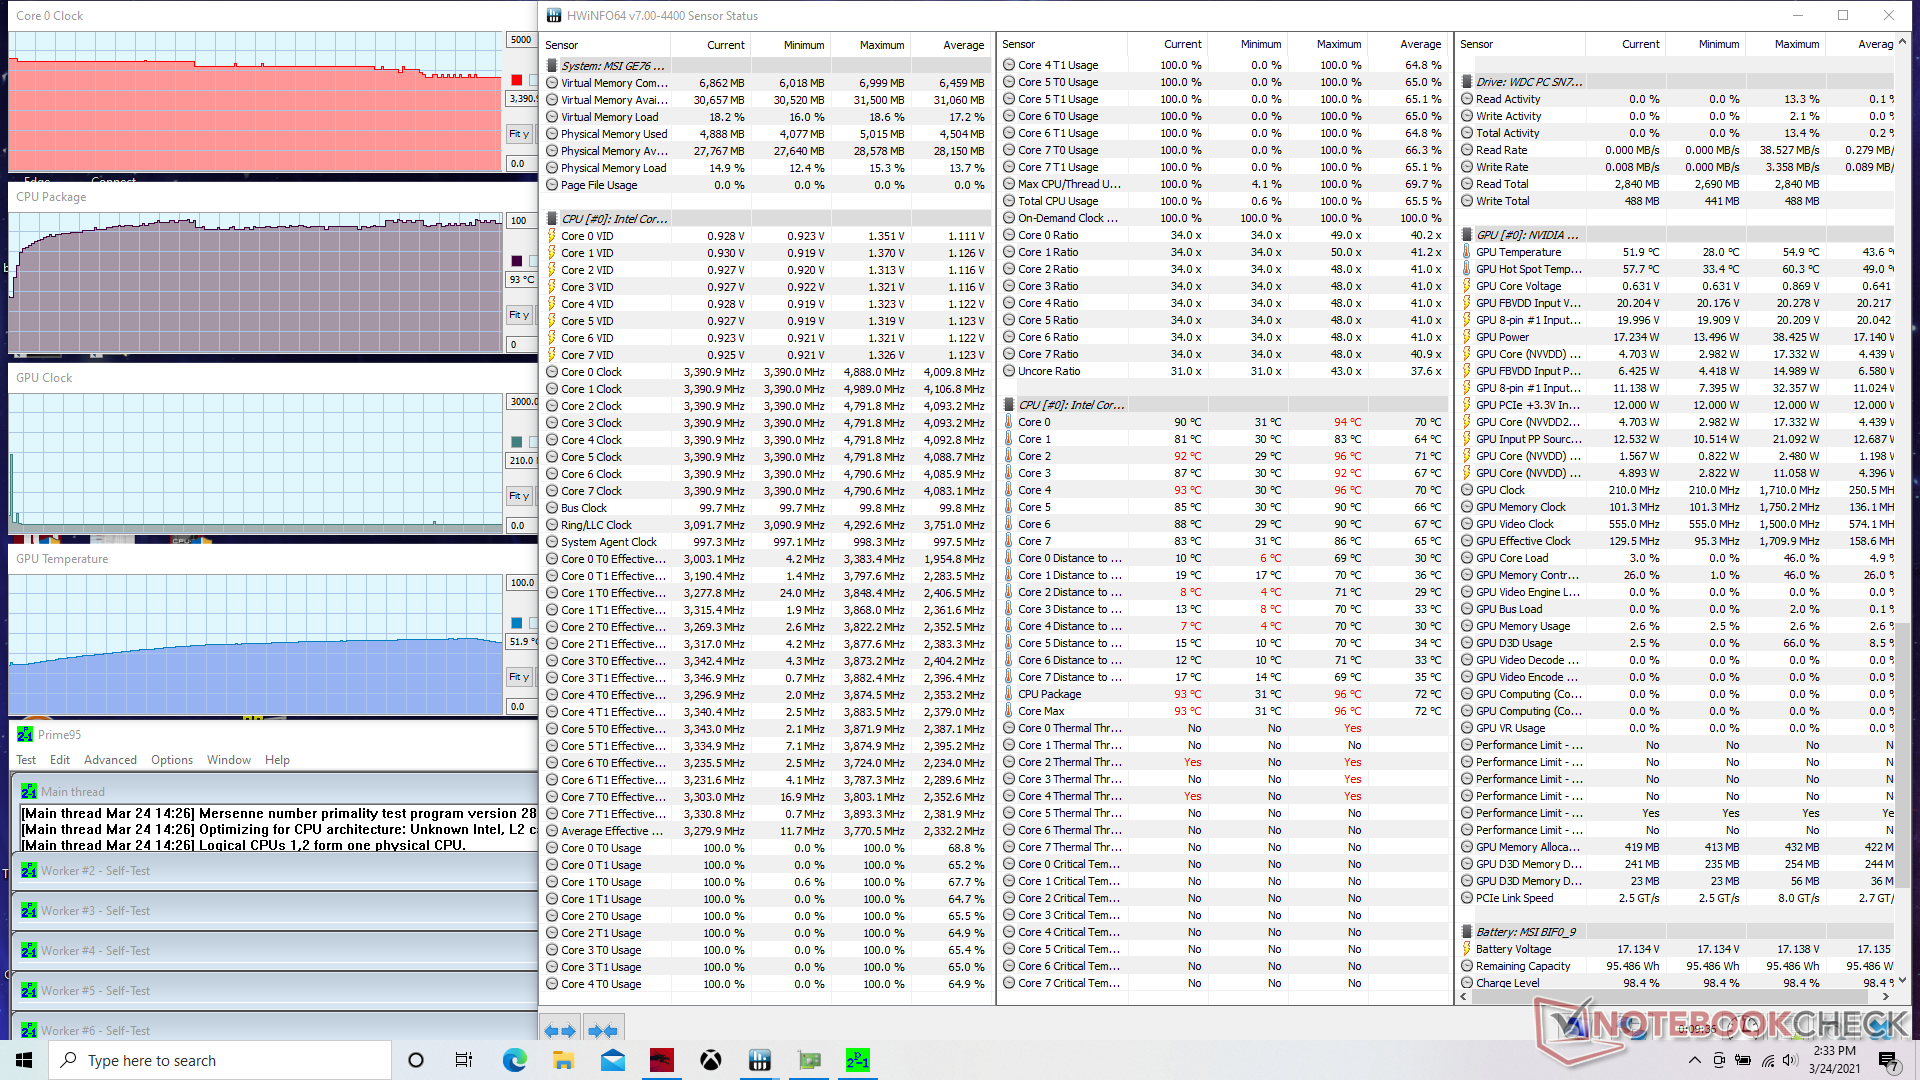
Stress Test
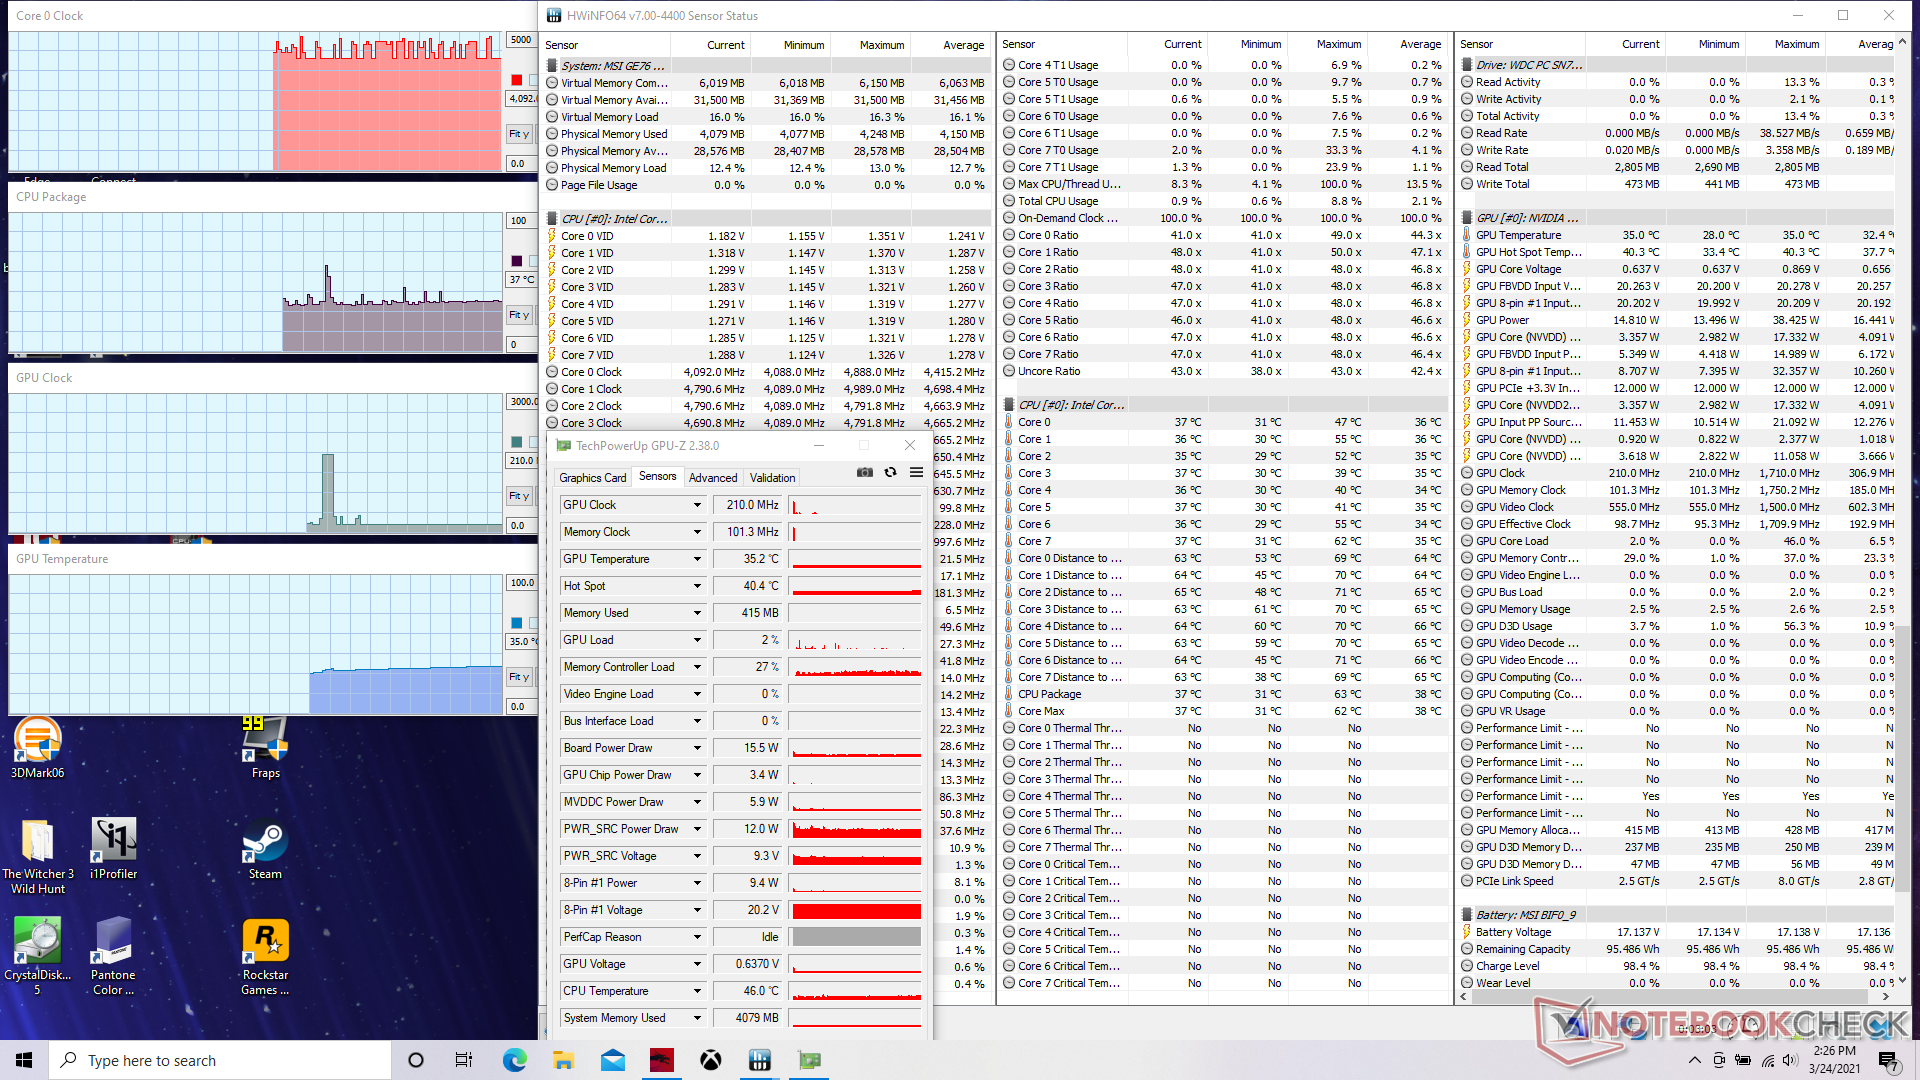
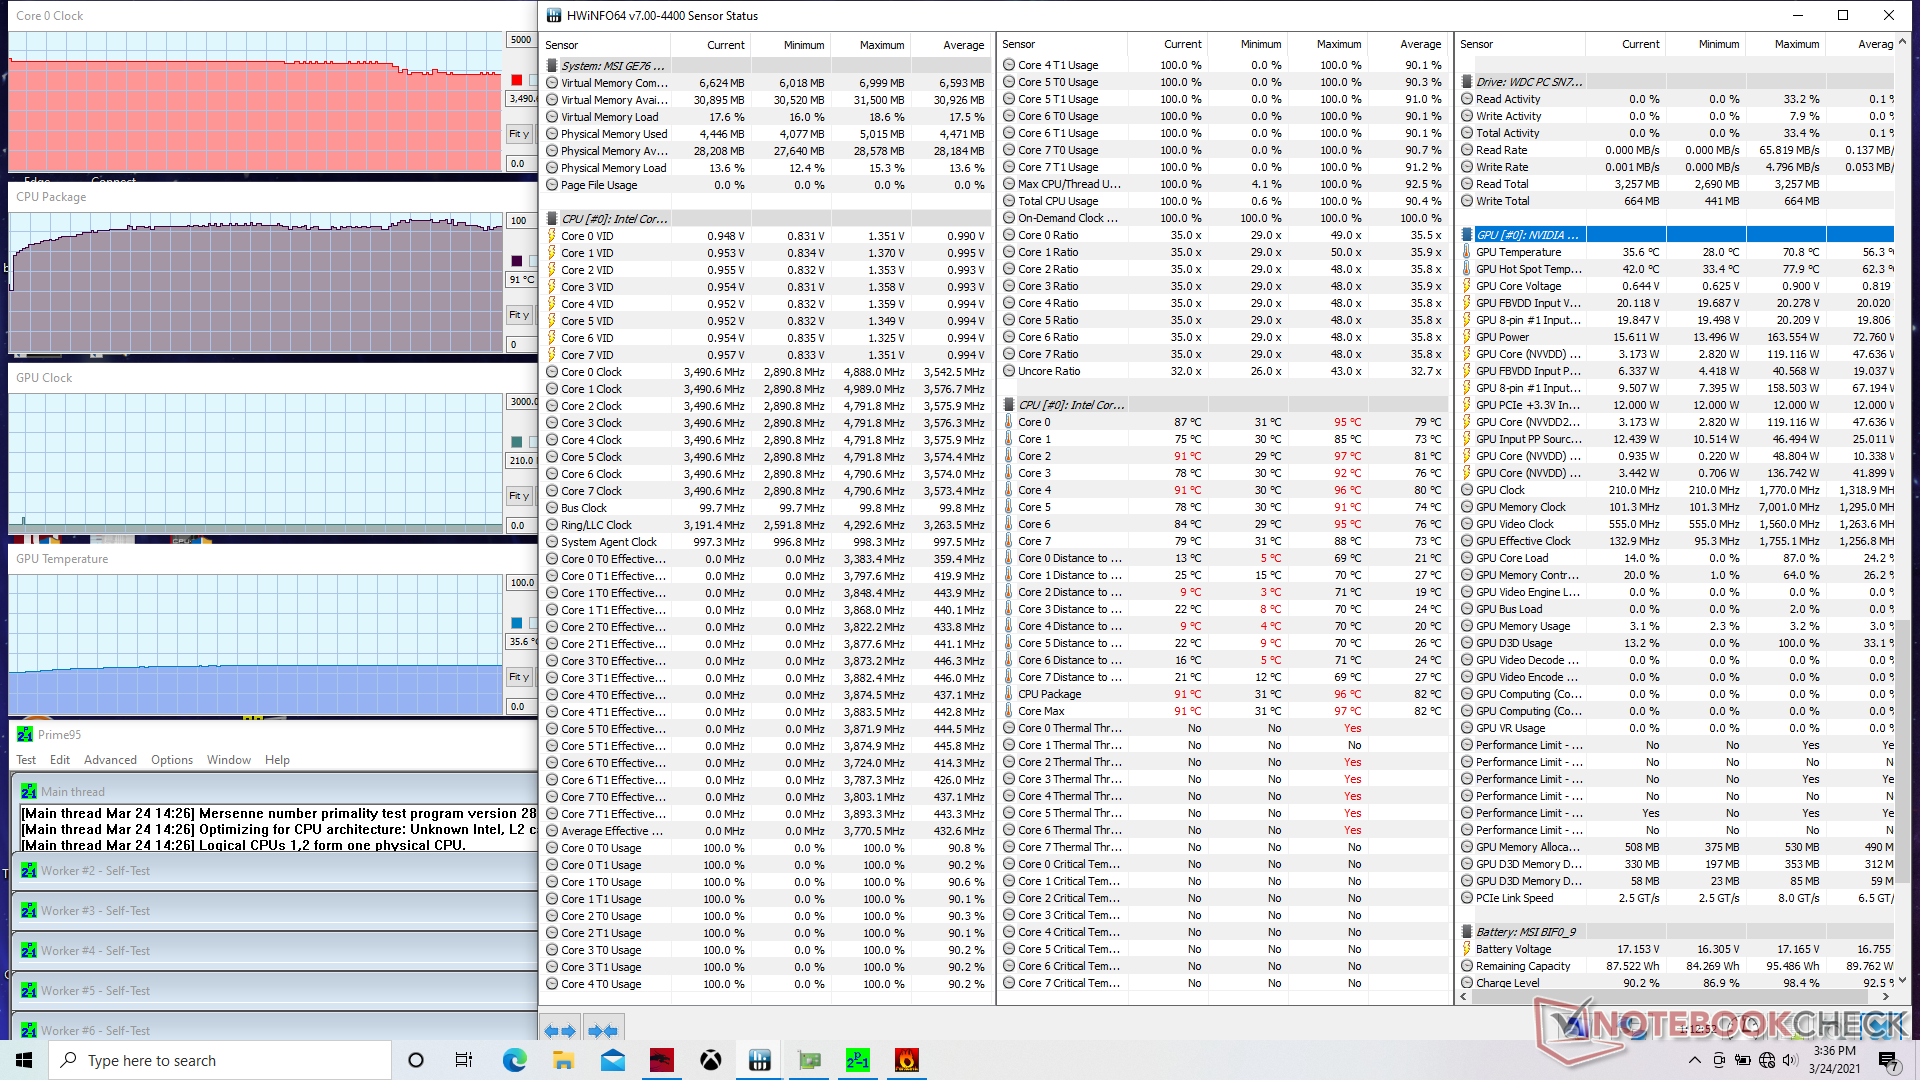
When running Prime95 with Cooler Boost off, clock rates would boost to 4 GHz for only a minute or so until hitting a core temperature of 95 C. Clock rates would then steadily drop before stabilizing at 3.4 GHz and at a core temperature of 93 C. If Cooler Boost is active, the CPU is able to maintain its 4 GHz Turbo Boost for a minute or two longer before clock rates begin to fall to the same 3.4 GHz range.
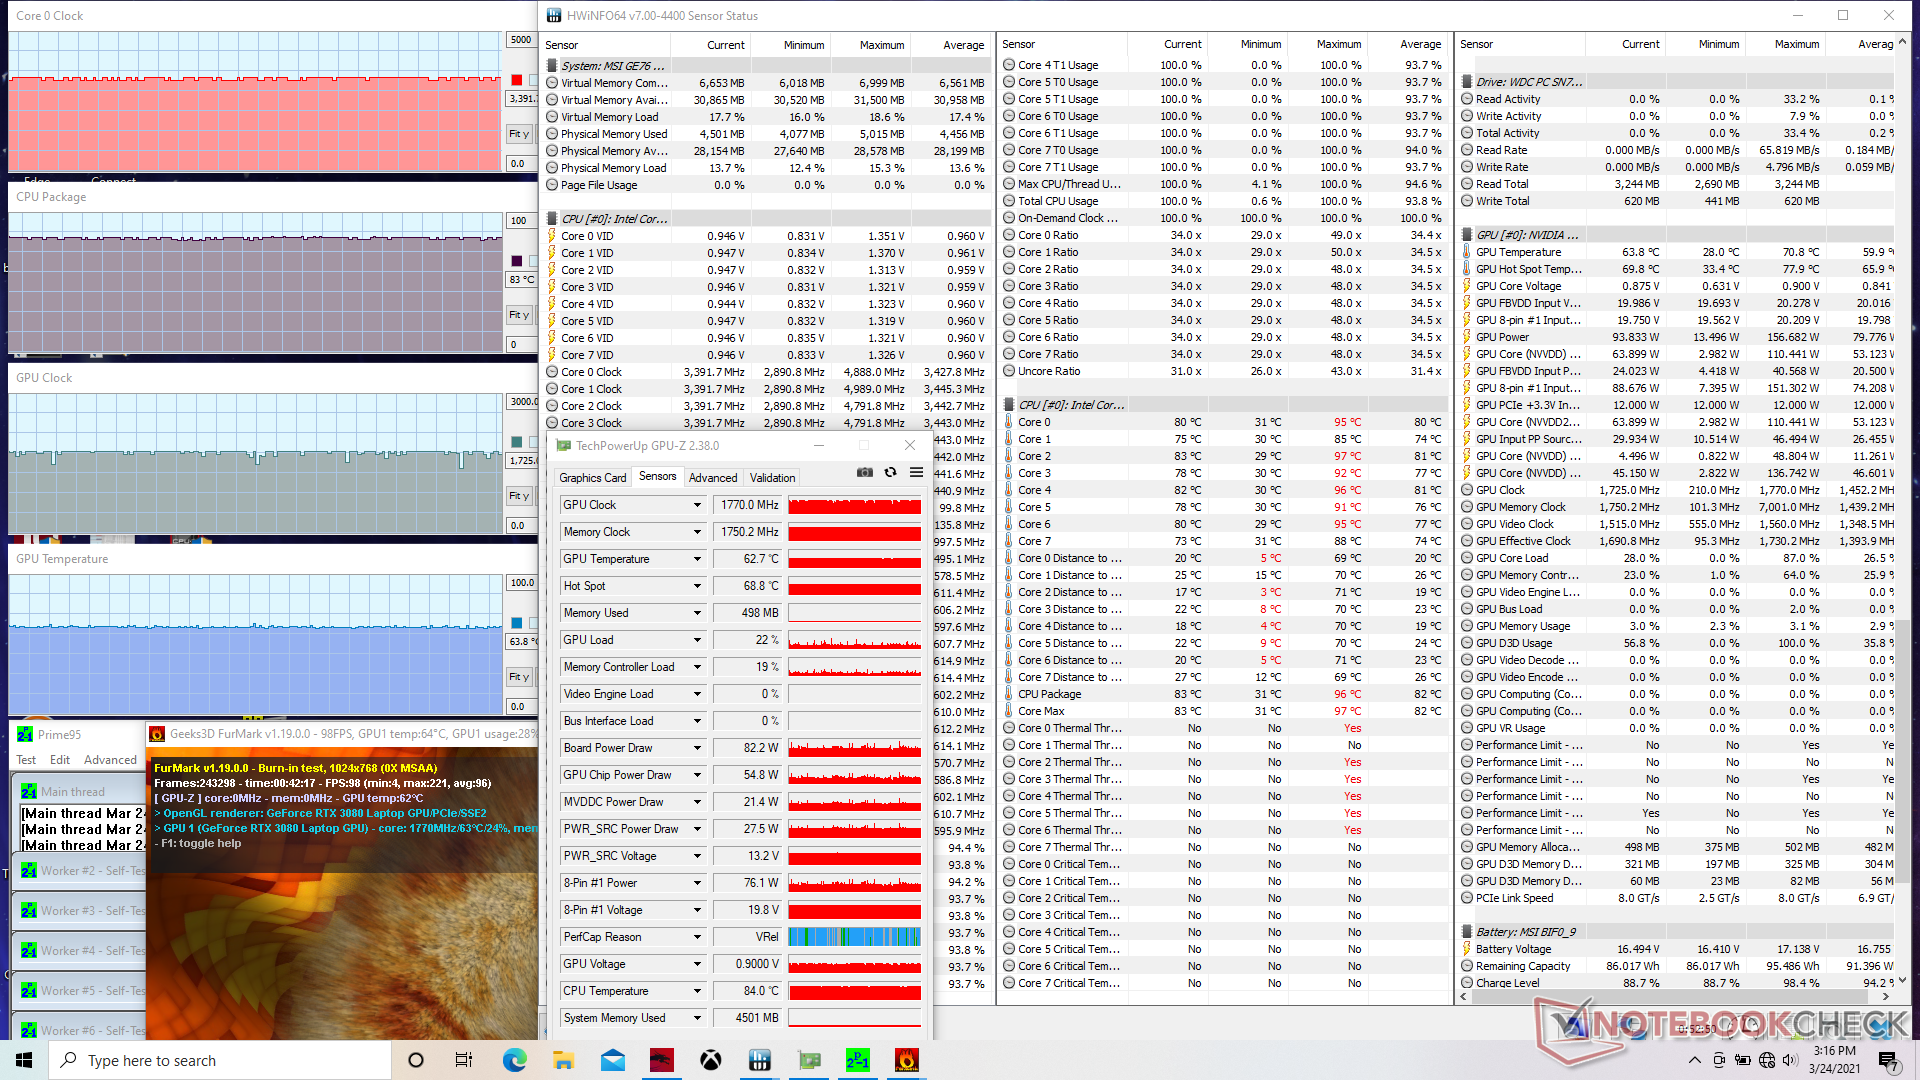
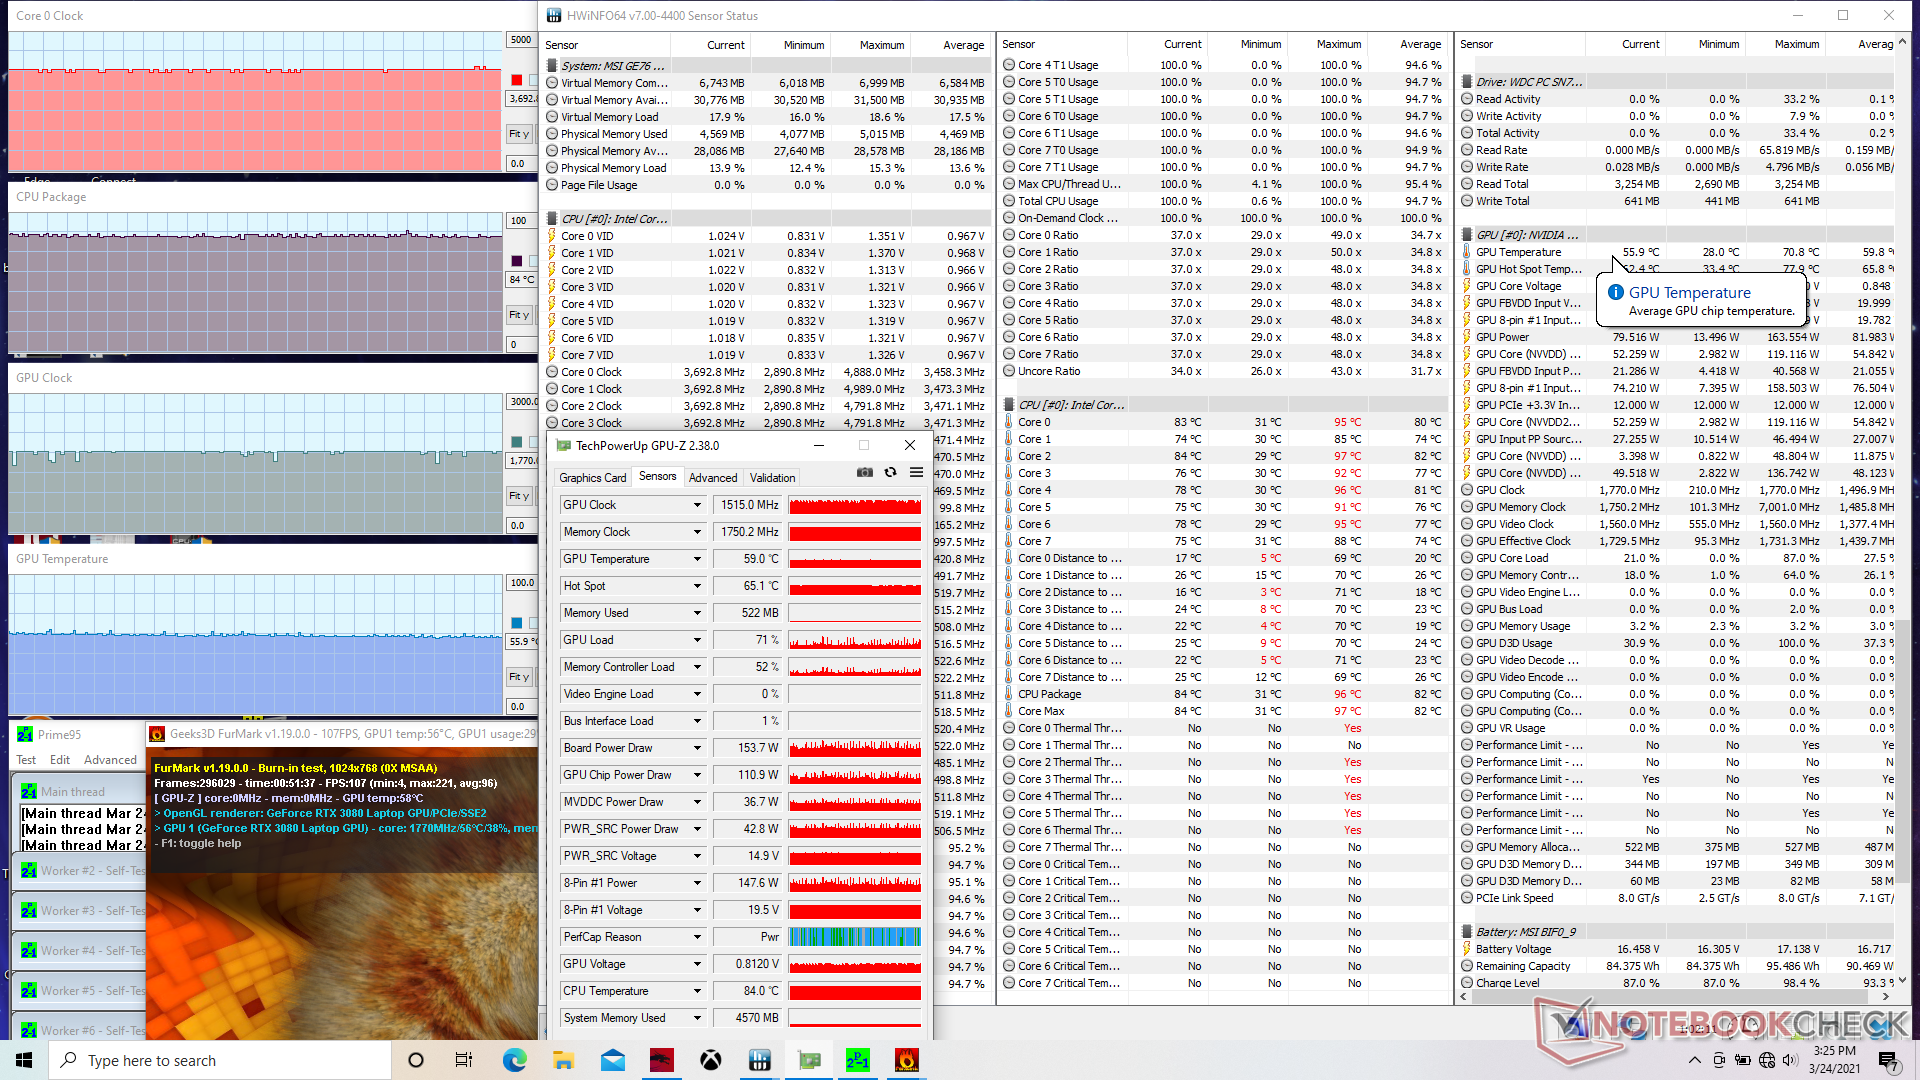
When running Prime95 and FurMark simultaneously, the CPU and GPU would stabilize at 83 C and 63 C, respectively. If Cooler Boost is enabled, GPU temperature would drop even further to 56 C while CPU clock rates would rise slightly higher.
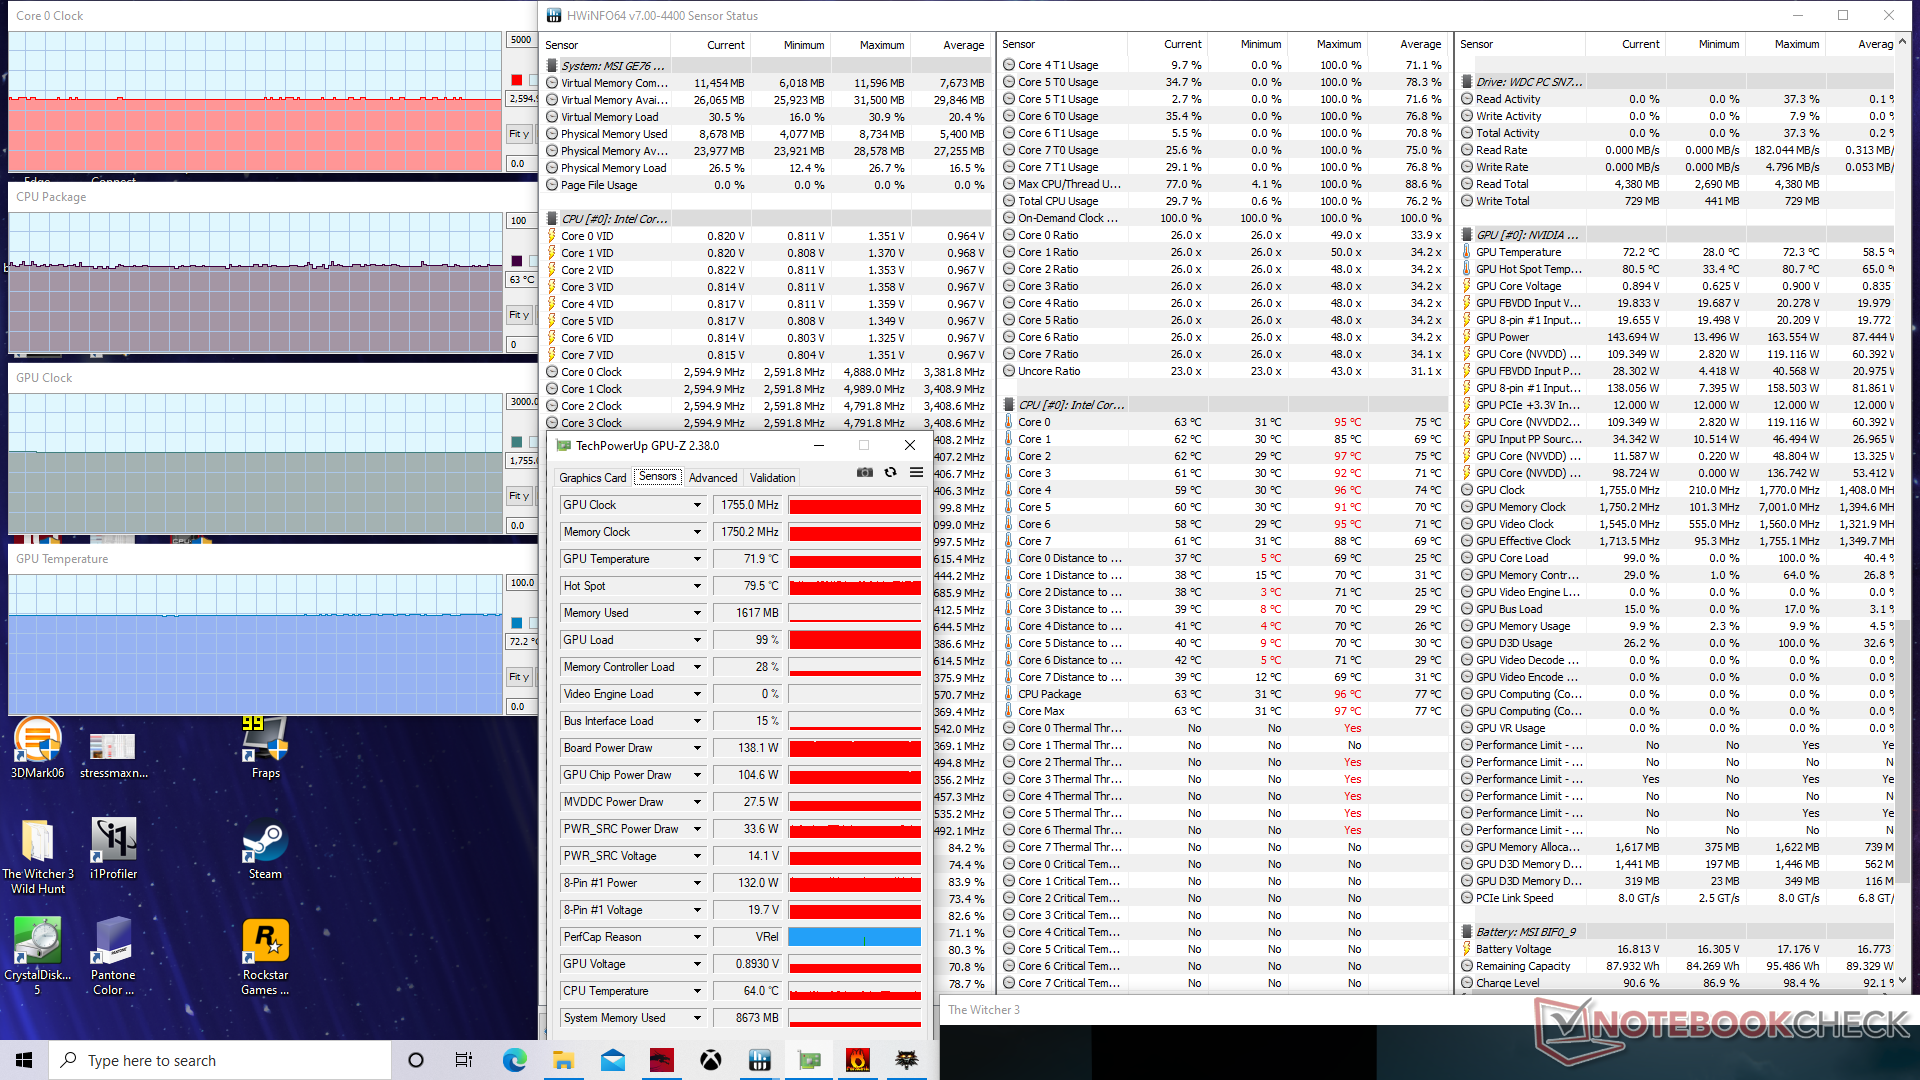
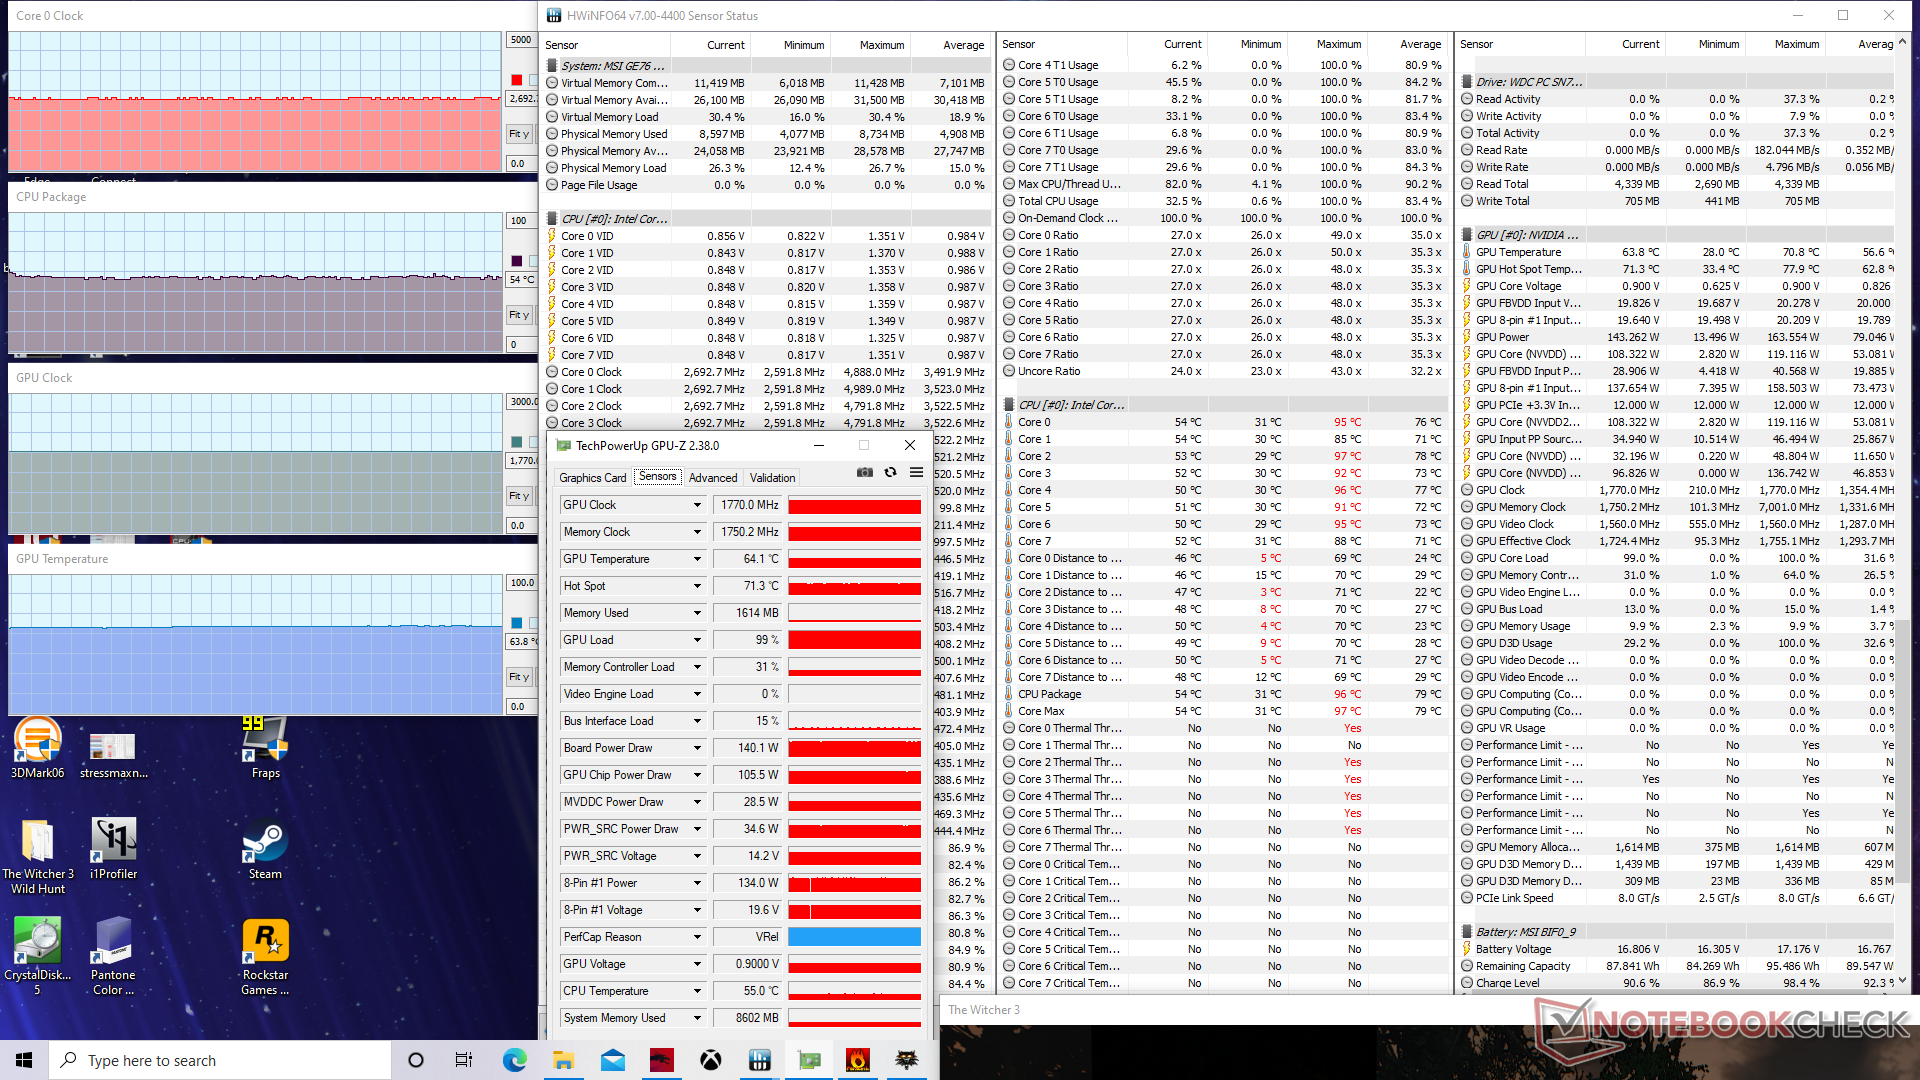
Running Witcher 3 to represent real-world gaming loads shows no significant gains in clock rates or performance from enabling Cooler Boost. Core temperature are noticeably cooler, however. Total GPU board draw would also reach 140 W here compared to 154 W when running FurMark.
Running on battery power will limit performance. A Fire Strike run on batteries would return Physics and Graphics scores of 11464 and 15622 points, respectively, compared to 20886 and 32222 points when on mains.
| CPU Clock (GHz) | GPU Clock (MHz) | Average CPU Temperature (°C) | Average GPU Temperature (°C) | |
| System Idle | -- | -- | 37 | 35 |
| Prime95 Stress (Cooler Boost off) | 3.4 | -- | 93 | 52 |
| Prime95 Stress (Cooler Boost on) | 3.5 | -- | 91 | 36 |
| Prime95 + FurMark Stress (Cooler Boost off) | 3.3 - 3.4 | 1515 - 1770 | 83 | 63 |
| Prime95 + FurMark Stress (Cooler Boost on) | 3.7 | 1515 - 1770 | 84 | 56 |
| Witcher 3 Stress (Cooler Boost off) | 2.6 | 1755 | 63 | 72 |
| Witcher 3 Stress (Cooler Boost on) | 2.6 - 2.7 | 1770 | 54 | 64 |
Speakers


MSI GE76 Raider 10UH audio analysis
(+) | speakers can play relatively loud (85.6 dB)
Bass 100 - 315 Hz
(-) | nearly no bass - on average 15.6% lower than median
(±) | linearity of bass is average (10.7% delta to prev. frequency)
Mids 400 - 2000 Hz
(+) | balanced mids - only 3.6% away from median
(+) | mids are linear (2.7% delta to prev. frequency)
Highs 2 - 16 kHz
(+) | balanced highs - only 3.7% away from median
(+) | highs are linear (5.4% delta to prev. frequency)
Overall 100 - 16.000 Hz
(+) | overall sound is linear (12.3% difference to median)
Compared to same class
» 13% of all tested devices in this class were better, 4% similar, 82% worse
» The best had a delta of 6%, average was 18%, worst was 132%
Compared to all devices tested
» 10% of all tested devices were better, 2% similar, 88% worse
» The best had a delta of 4%, average was 24%, worst was 134%
Apple MacBook 12 (Early 2016) 1.1 GHz audio analysis
(+) | speakers can play relatively loud (83.6 dB)
Bass 100 - 315 Hz
(±) | reduced bass - on average 11.3% lower than median
(±) | linearity of bass is average (14.2% delta to prev. frequency)
Mids 400 - 2000 Hz
(+) | balanced mids - only 2.4% away from median
(+) | mids are linear (5.5% delta to prev. frequency)
Highs 2 - 16 kHz
(+) | balanced highs - only 2% away from median
(+) | highs are linear (4.5% delta to prev. frequency)
Overall 100 - 16.000 Hz
(+) | overall sound is linear (10.2% difference to median)
Compared to same class
» 7% of all tested devices in this class were better, 2% similar, 91% worse
» The best had a delta of 5%, average was 18%, worst was 53%
Compared to all devices tested
» 4% of all tested devices were better, 1% similar, 94% worse
» The best had a delta of 4%, average was 24%, worst was 134%
Energy Management
Power Consumption
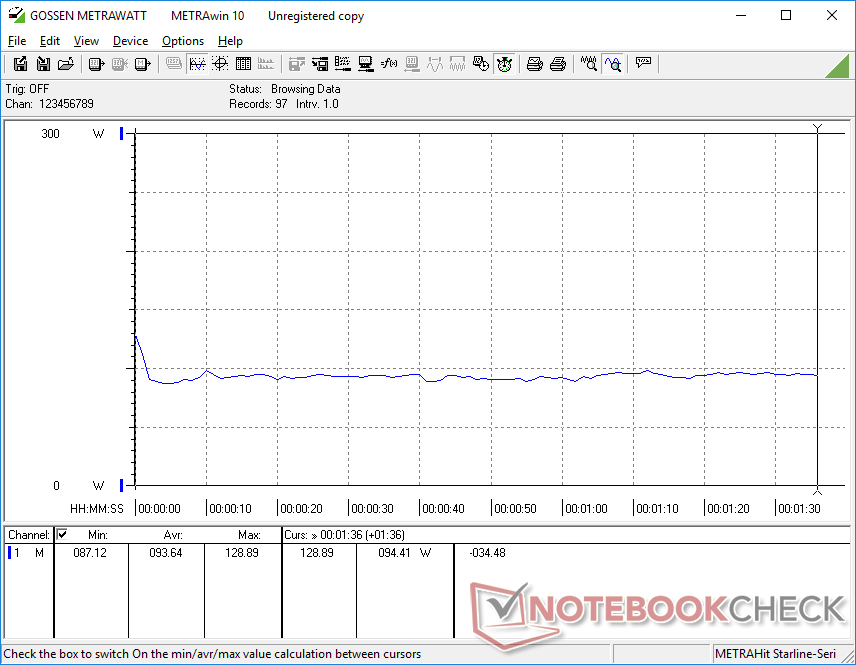
Idling on desktop draws between 15 W if on Power Saver mode with the iGPU active and 32 W if on Extreme Performance mode with the Nvidia GPU active. Because of the brightness issues we mentioned earlier, however, the 15 W minimum could have been even lower.
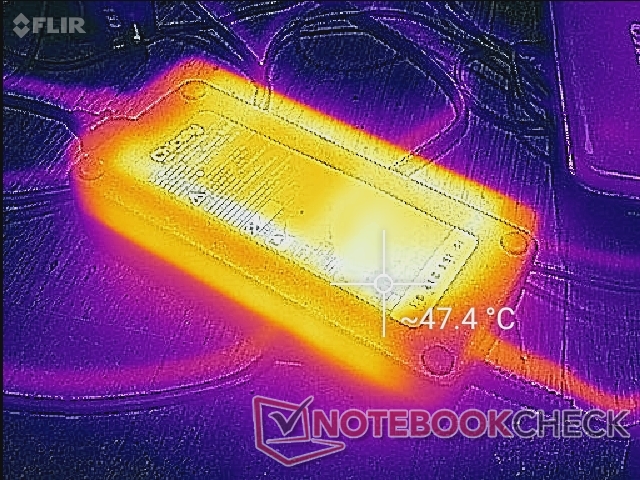
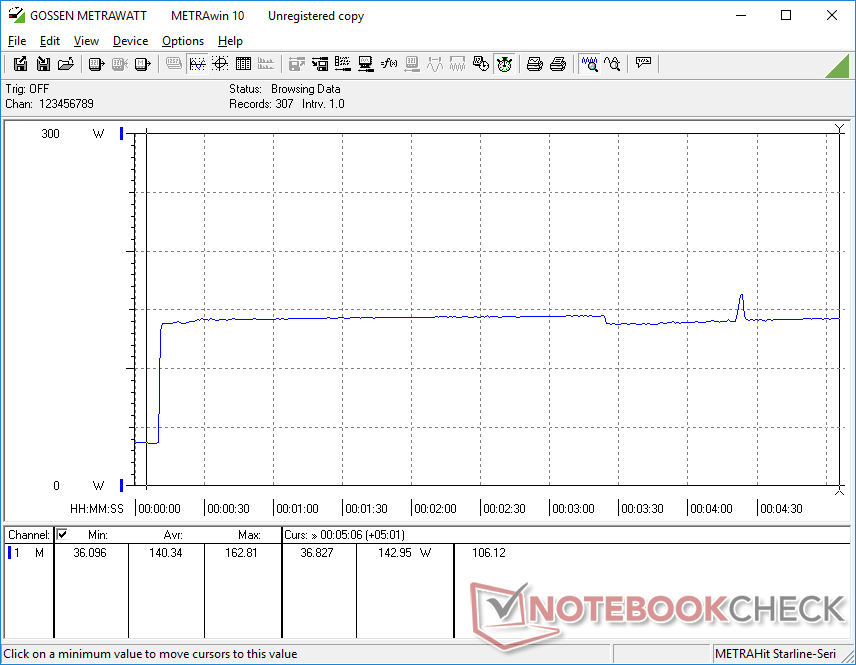
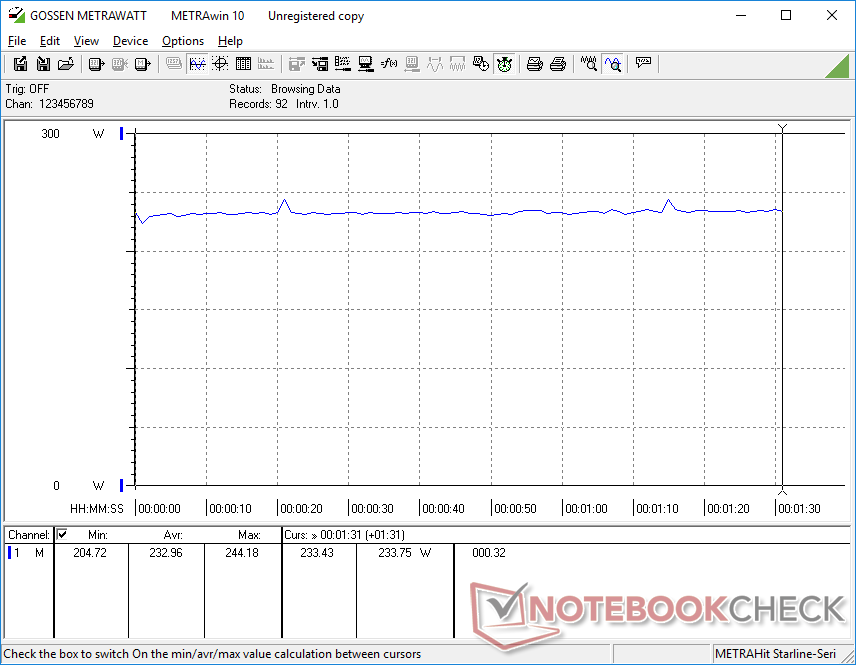
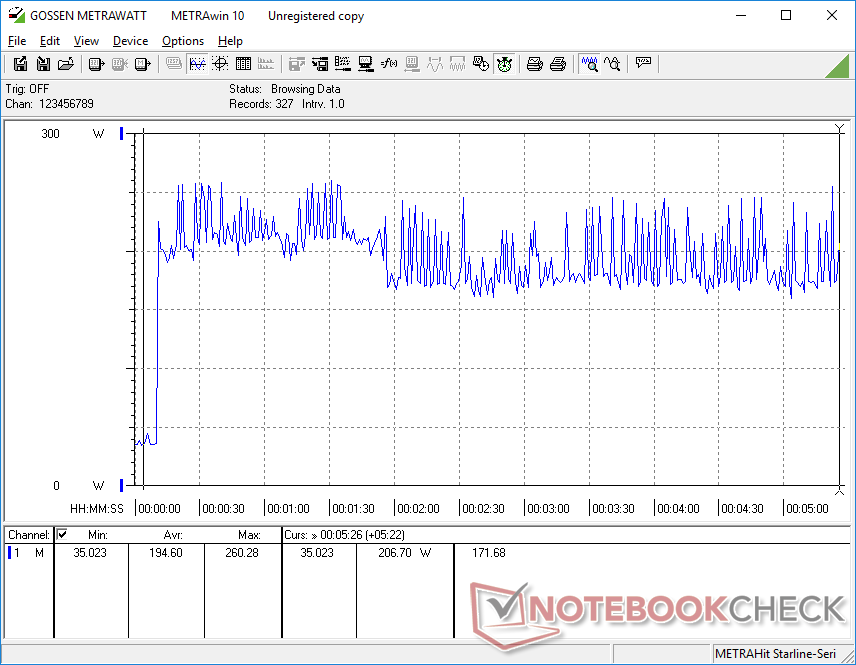
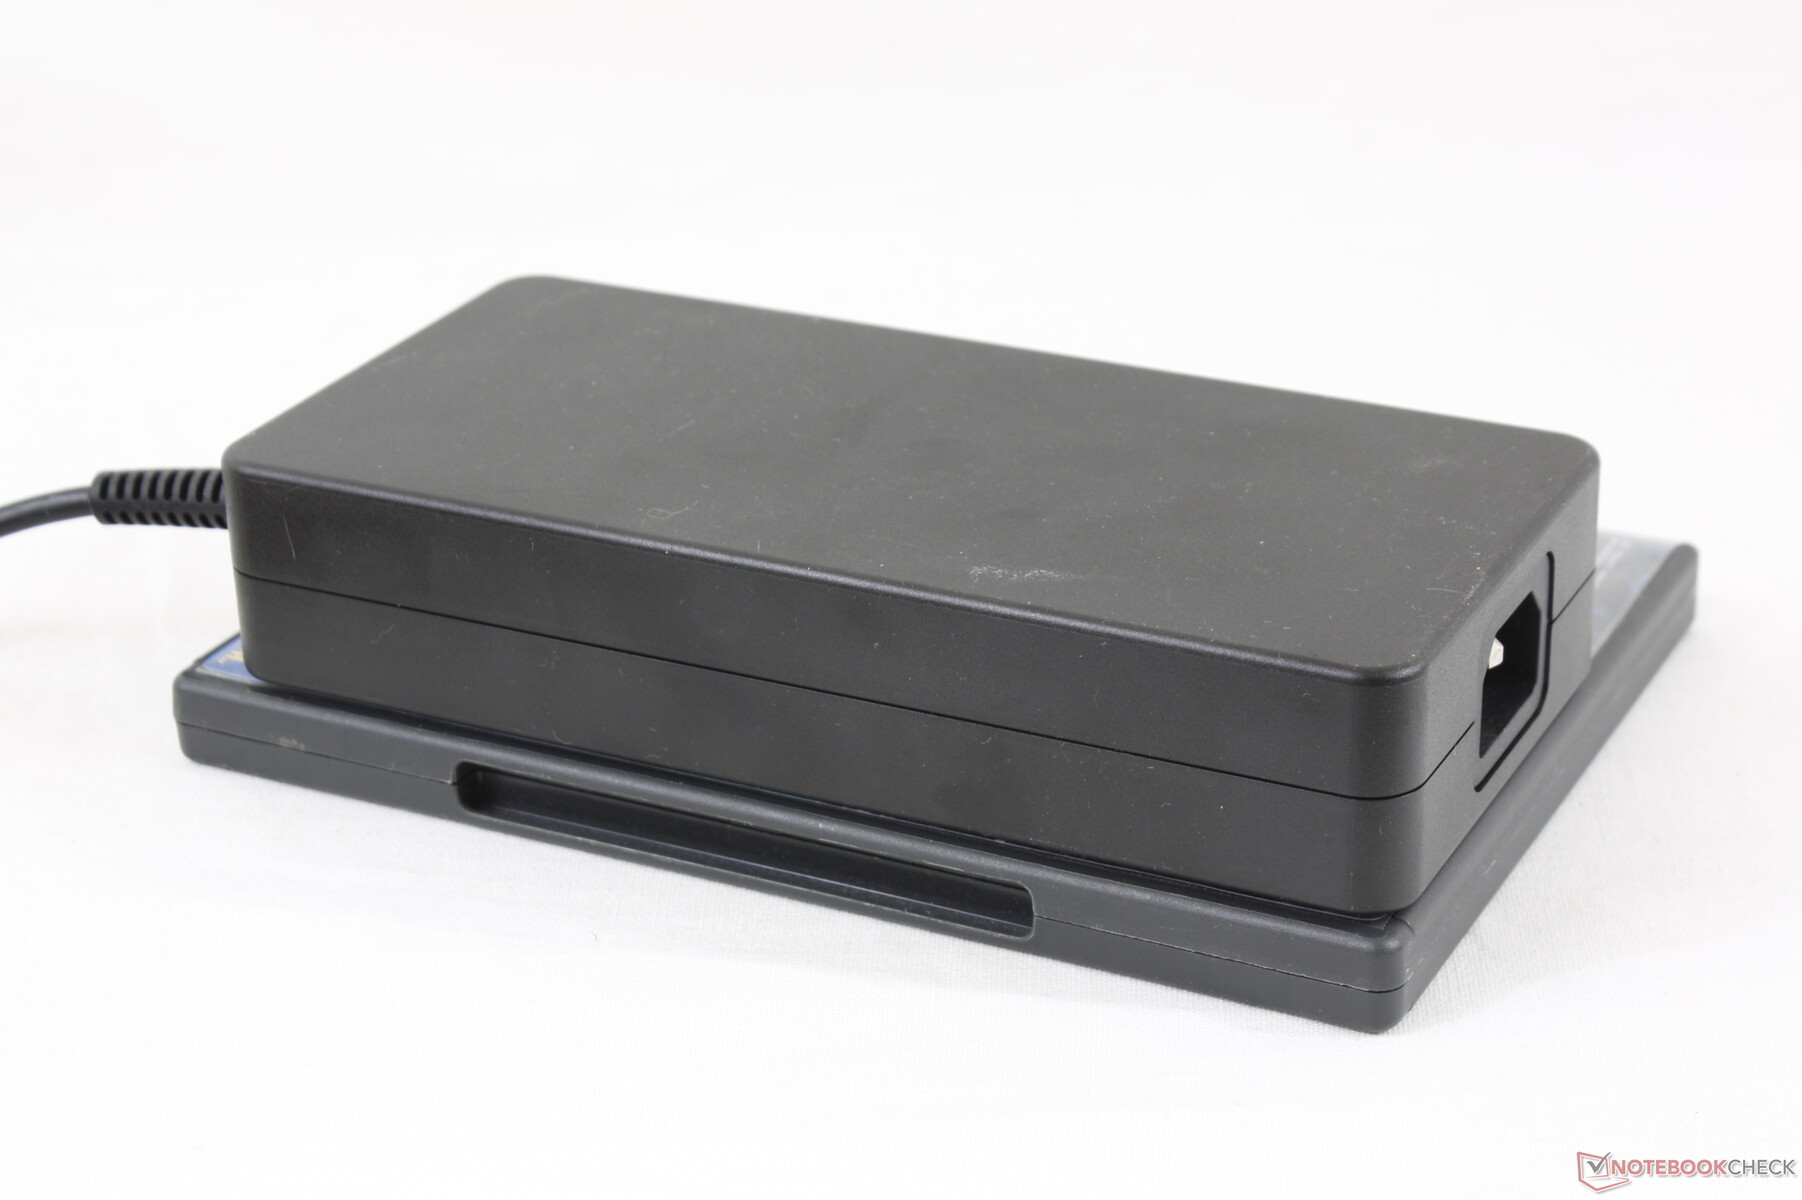
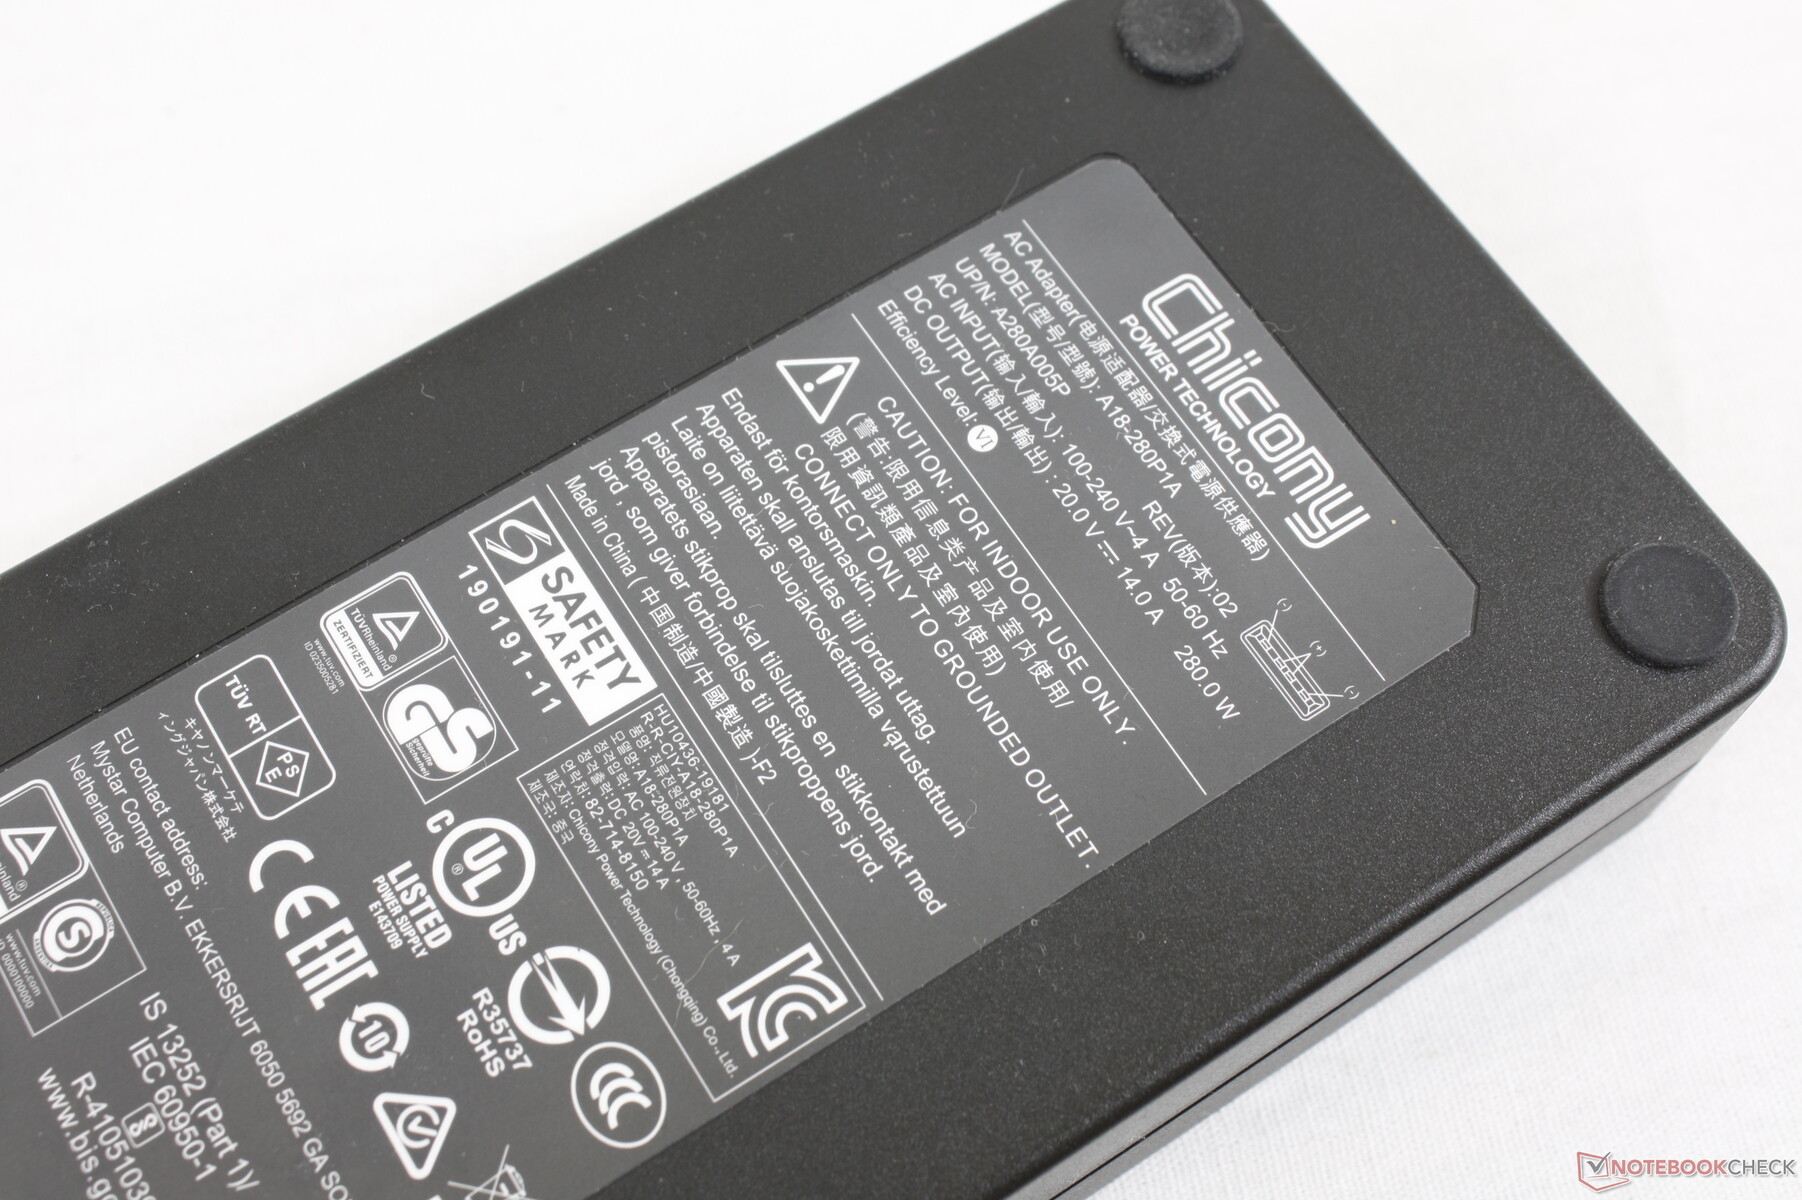
Running Witcher 3 consumes about 13 percent more power than the older RTX 2080-powered GE75 which is a fair increase considering the 20 to 30 percent faster graphics performance. At most, we're able to draw up to 260.3 W from the large (~18 x 8.5 x 3.5 cm) 280 W AC adapter when running both Prime95 and FurMark simultaneously. Lesser RTX 3070/3060 SKUs come with a smaller 230 W AC adapter instead.
| Off / Standby | |
| Idle | |
| Load |
|
Key:
min: | |
| MSI GE76 Raider 10UH i7-10870H, GeForce RTX 3080 Laptop GPU, WDC PC SN730 SDBPNTY-1T00, IPS, 1920x1080, 17.3" | MSI GE75 8SG Raider i7-8750H, GeForce RTX 2080 Mobile, Kingston RBUSNS8154P3512GJ, AHVA, 1920x1080, 17.3" | Asus Strix Scar 17 G732LXS i9-10980HK, GeForce RTX 2080 Super Mobile, 2x Intel SSD 660p 1TB SSDPEKNW010T8 (RAID 0), IPS, 1920x1080, 17.3" | Schenker XMG Core 17 Comet Lake i7-10750H, GeForce GTX 1650 Ti Mobile, Samsung SSD 970 EVO Plus 1TB, IPS, 1920x1080, 17.3" | MSI GT76 Titan DT 10SGS i9-10900K, GeForce RTX 2080 Super Mobile, 2x WDC PC SN730 SDBPNTY-1T00 (RAID 0), IPS, 3840x2160, 17.3" | |
|---|---|---|---|---|---|
| Power Consumption | 26% | -15% | 30% | -50% | |
| Idle Minimum * (Watt) | 15.5 | 7 55% | 16 -3% | 12 23% | 25.9 -67% |
| Idle Average * (Watt) | 31.3 | 15 52% | 25 20% | 15 52% | 38 -21% |
| Idle Maximum * (Watt) | 31.7 | 22 31% | 35 -10% | 24 24% | 53.2 -68% |
| Load Average * (Watt) | 93.6 | 92 2% | 177 -89% | 105 -12% | 123.8 -32% |
| Witcher 3 ultra * (Watt) | 233 | 207 11% | 227 3% | 93 60% | 312.5 -34% |
| Load Maximum * (Watt) | 260.3 | 254 2% | 280 -8% | 168 35% | 459.8 -77% |
* ... smaller is better
Battery Life
MSI has increased the battery capacity from 65 Wh on the GE75 to 99 Wh on the GE76 which is the legal upper limit for Li-ion batteries on commercial airplanes. WLAN runtimes are subsequently ~90 minutes longer than on the GE75 when set to the Balanced mode with the iGPU active. Display brightness would be stuck on maximum as described earlier, however, meaning runtimes would have been even longer had the brightness controls actually worked.
Charging from empty to full capacity takes about 2 to 2.5 hours. Keep in mind that the battery will drain slowly when running extreme loads like Prime95 and FurMark even when plugged into the outlet.
| MSI GE76 Raider 10UH i7-10870H, GeForce RTX 3080 Laptop GPU, 99.9 Wh | MSI GE75 8SG Raider i7-8750H, GeForce RTX 2080 Mobile, 65 Wh | Asus Strix Scar 17 G732LXS i9-10980HK, GeForce RTX 2080 Super Mobile, 66 Wh | Alienware m17 R3 P45E i9-10980HK, GeForce RTX 2080 Super Mobile, 86 Wh | Schenker XMG Core 17 Comet Lake i7-10750H, GeForce GTX 1650 Ti Mobile, 62.3 Wh | MSI GT76 Titan DT 10SGS i9-10900K, GeForce RTX 2080 Super Mobile, 90 Wh | |
|---|---|---|---|---|---|---|
| Battery runtime | -26% | 1% | -54% | -19% | -62% | |
| Reader / Idle (h) | 8.2 | 7.8 -5% | 10 22% | 3.7 -55% | ||
| WiFi v1.3 (h) | 6.3 | 4.7 -25% | 5.9 -6% | 3.2 -49% | 5.1 -19% | 2.4 -62% |
| Load (h) | 1.7 | 0.9 -47% | 1.5 -12% | 0.7 -59% | ||
| Witcher 3 ultra (h) | 0.8 |
Pros
Cons
Verdict
The GE76 comes with all the improvements MSI needed to bring it up to par or even surpass the latest models from Asus, Dell, and others in some important aspects. More specifically, the new design runs cooler, quieter, and faster than expected when compared to laptops with similar specifications. Its Core i7-10870H CPU is 10 to 15 percent faster than the average Core i7-10870H/10875H and the same can be said for its RTX 3080 graphics. GPU temperatures top out at just 64 C to 72 C compared to 80 C or 78 C on the Asus Zephyrus Duo 15 SE or Alienware m17, respectively.
The MSI GE76 squeezes more power out of both the Core i7 CPU and GeForce RTX 30 GPU than any other gaming laptop for its size class at the moment. Its main drawback comes down to weight which shouldn't be a huge surprise for anyone in the market for a 17.3-inch gaming laptop.
No laptop can run cooler, quieter, and faster without giving up some other feature. In this case, the GE76 is noticeably heavier than its immediate GE75 predecessor by about 400 grams to be less portable overall. It's a denser design that performance hunters and most gamers will likely appreciate nonetheless.
For future models, we'd like to see a larger clickpad, better webcam, larger NumPad, and some 4K display options as all SKUs are limited to 1080p as of this writing. Users not bothered by any of these setbacks will find the GE76 to be one of the more solid no-frills 17.3-inch GeForce RTX 30 gaming laptops currently in the market.

Price and availability
MSI GE76 Raider 10UH
- 03/26/2021 v7 (old)
Allen Ngo
Price comparison
