 Deutsch
 English
 Español
 Français
 Italiano
 Nederlands
 Polski
 Português
 Русский
 Türkçe
 Svenska
 Chinese
 Magyar
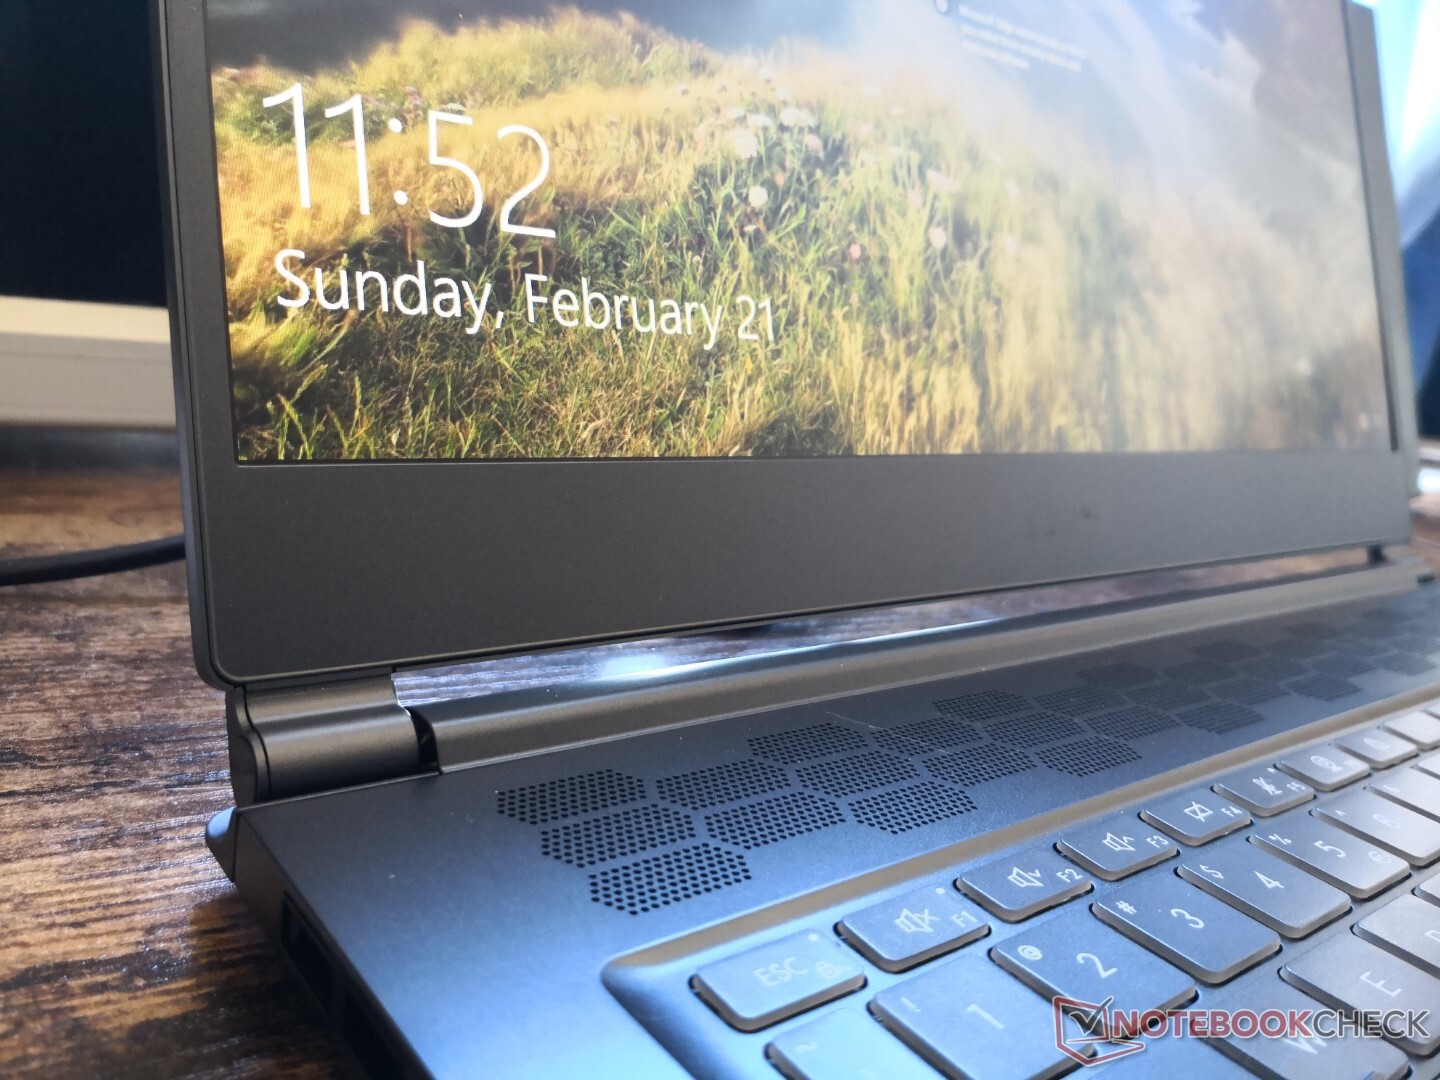
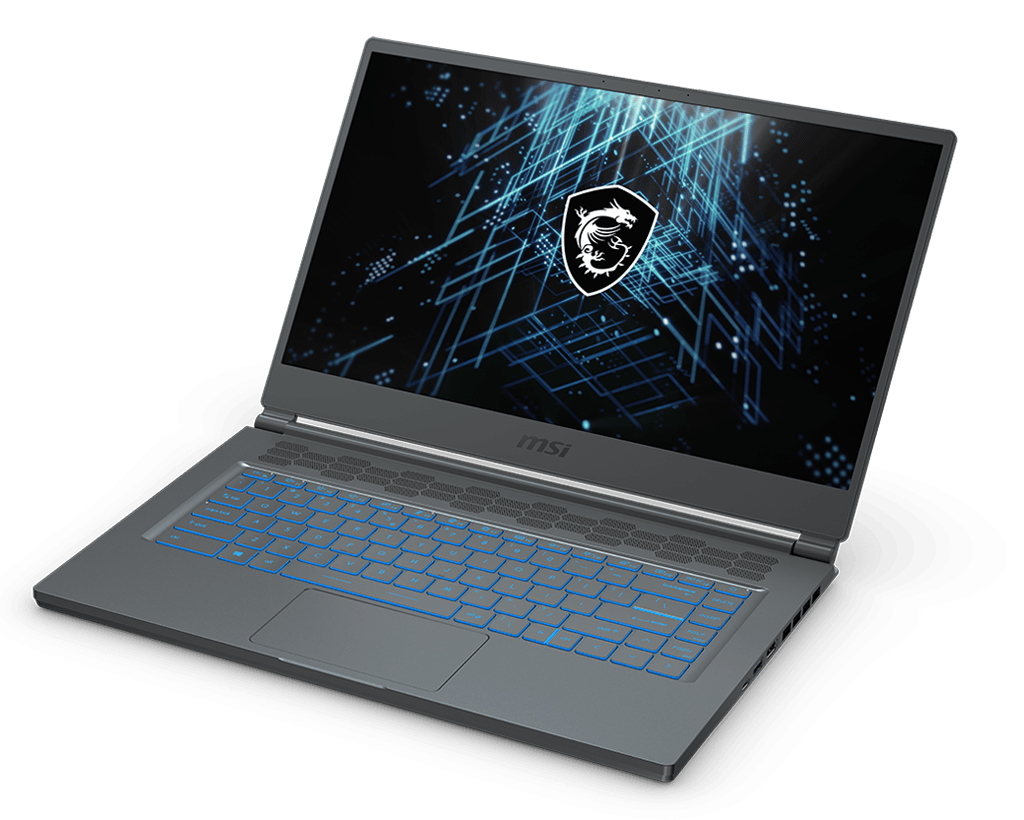
MSI Stealth 15M GeForce RTX Laptop Review: Faster Graphics than the Dell XPS 15, HP Spectre x360, or Asus ZenBook
(March 3, 2021 update: MSI has clarified with us that the Stealth 15M is "a balanced solution for users who are looking for an ultra-portable gaming experience" and that it is not a content creation or business laptop. It is therefore not in the same category as the prestige, Creator, Summit, or Modern models. Our original unedited review is below.)
Not to be confused with the 15.6-inch MSI GS66 Stealth, the 15.6-inch MSI Stealth 15M is a completely different model designed for content creators, office, or professional use. It's in the same category as the existing MSI Prestige, Creator, Summit, or Modern series of laptops but with important specification differences.
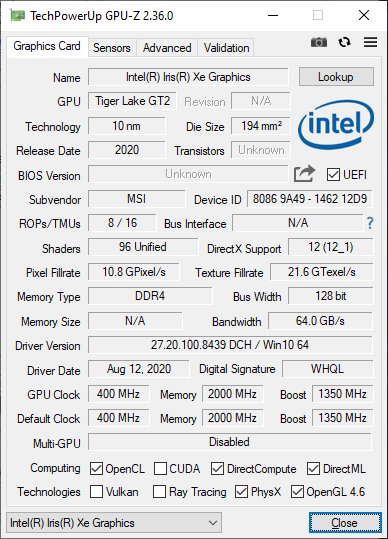
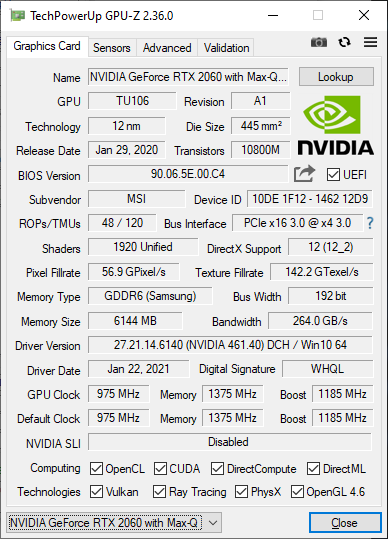
The distinguishing feature of the Stealth 15M is its fast GeForce RTX 2060 Max-Q or RTX 3060 graphics paired with an 11th gen Core U-series CPU. Most other laptops in this category are limited to Geforce GTX or MX graphics only and come with Core H-series CPUs instead like the Dell XPS 15, HP Spectre x360 15, or Asus ZenBook 15. The MSI system will therefore offer significantly faster graphics performance than most of its immediate competitors — at least on paper. Its closest competitor is the 2020 HP Envy 15 which comes with the same RTX 2060 Max-Q GPU but an even faster Core H processor.
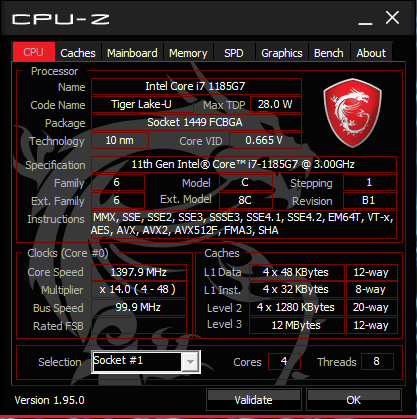
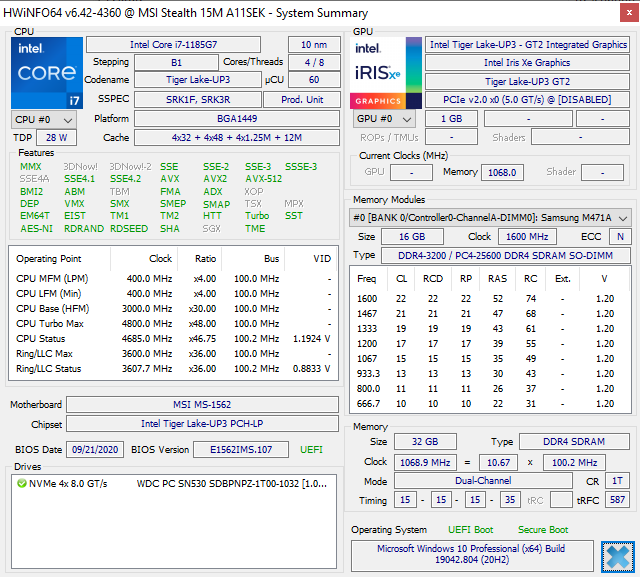
Our configuration in review is equipped with the Tiger Lake Core i7-1185G7 CPU, 32 GB of RAM, GeForce RTX 2060 Max-Q GPU, 60 Hz FHD display, and 1 TB NVMe SSD for approximately $1500 USD at retail. The updated configurations set to launch in March 2021 will come with the Core i7-11375H CPU, 144 Hz display, and GeForce RTX 3060 GPU instead. All options thus far have a fixed 1080p resolution display.
More MSI reviews:
potential competitors in comparison
Rating | Date | Model | Weight | Height | Size | Resolution | Best Price |
|---|---|---|---|---|---|---|---|
| 82.4 % | 02/2021 | MSI Stealth 15M A11SEK i7-1185G7, GeForce RTX 2060 Max-Q | 1.7 kg | 16.15 mm | 15.60" | 1920x1080 | |
| 85 % | 01/2020 | HP Spectre X360 15-5ZV31AV i7-10510U, GeForce MX250 | 2.1 kg | 19.3 mm | 15.60" | 3840x2160 | |
| 90.1 % | 06/2020 | Dell XPS 15 9500 Core i7 4K UHD i7-10875H, GeForce GTX 1650 Ti Mobile | 2 kg | 18 mm | 15.60" | 3840x2400 | |
| 86.6 % | 02/2021 | Lenovo ThinkPad T15p-20TN0006GE i7-10750H, GeForce GTX 1050 Mobile | 2.2 kg | 22.7 mm | 15.60" | 3840x2160 | |
| 87 % | 12/2020 | Asus ZenBook UX535-M01440 i7-10750H, GeForce GTX 1650 Ti Max-Q | 2 kg | 20 mm | 15.60" | 3840x2160 | |
| 85.2 % | 11/2019 | MSI Prestige 15 A10SC i7-10710U, GeForce GTX 1650 Max-Q | 1.7 kg | 16 mm | 15.60" | 3840x2160 |
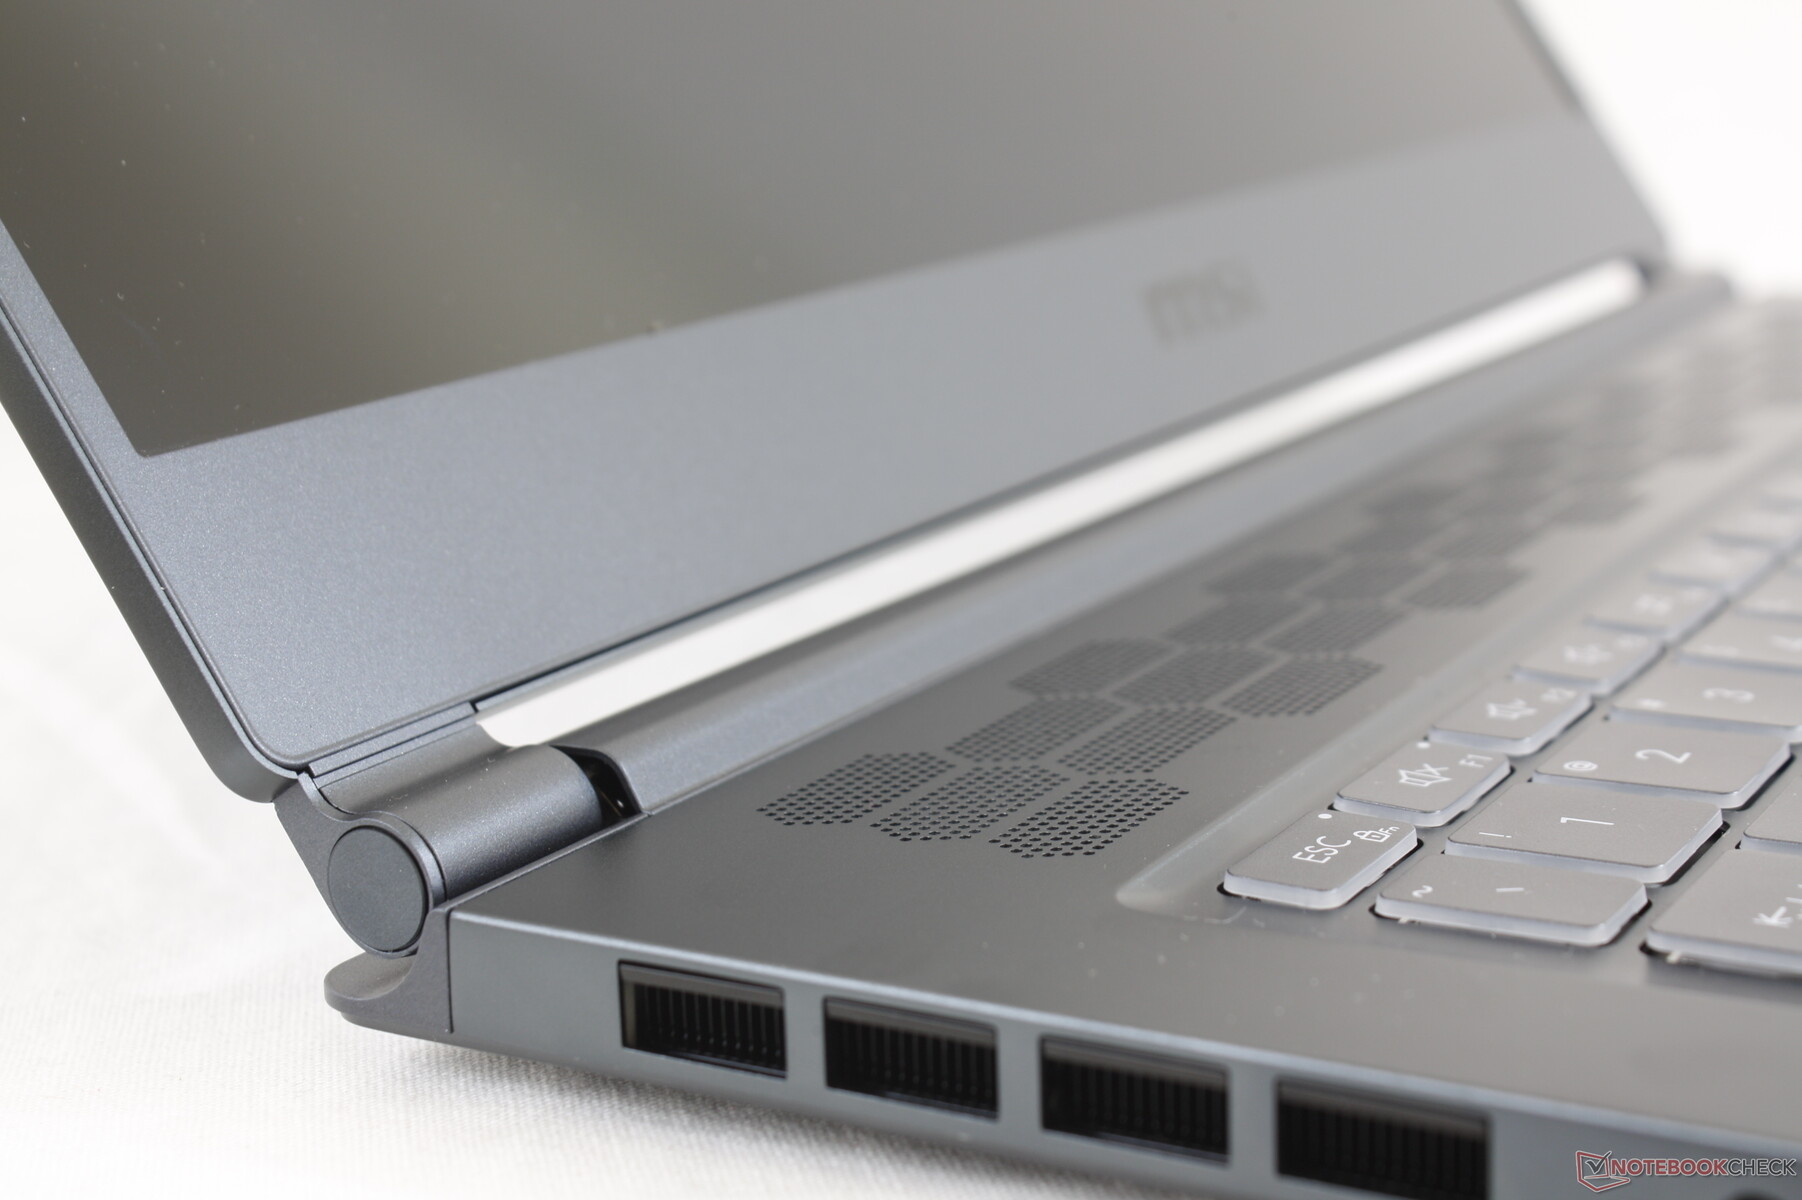
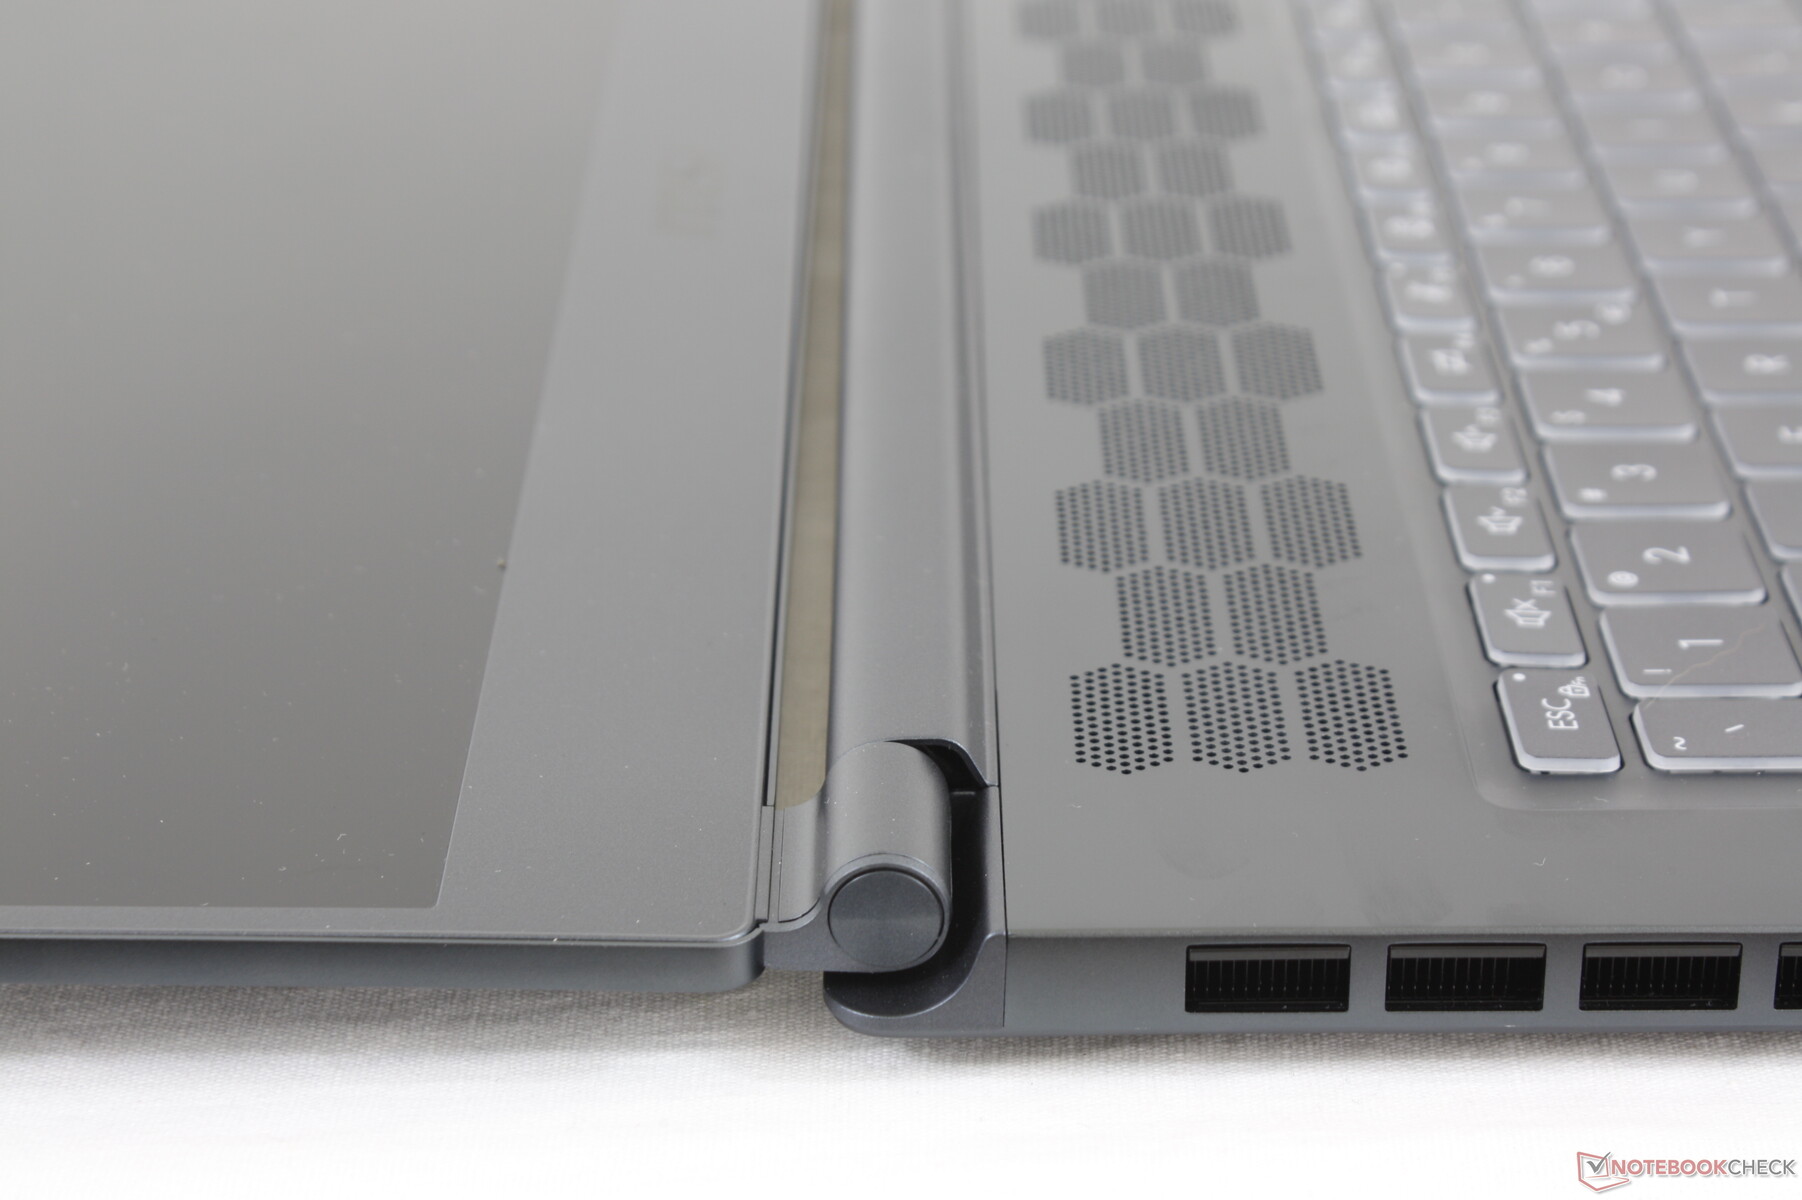
Case
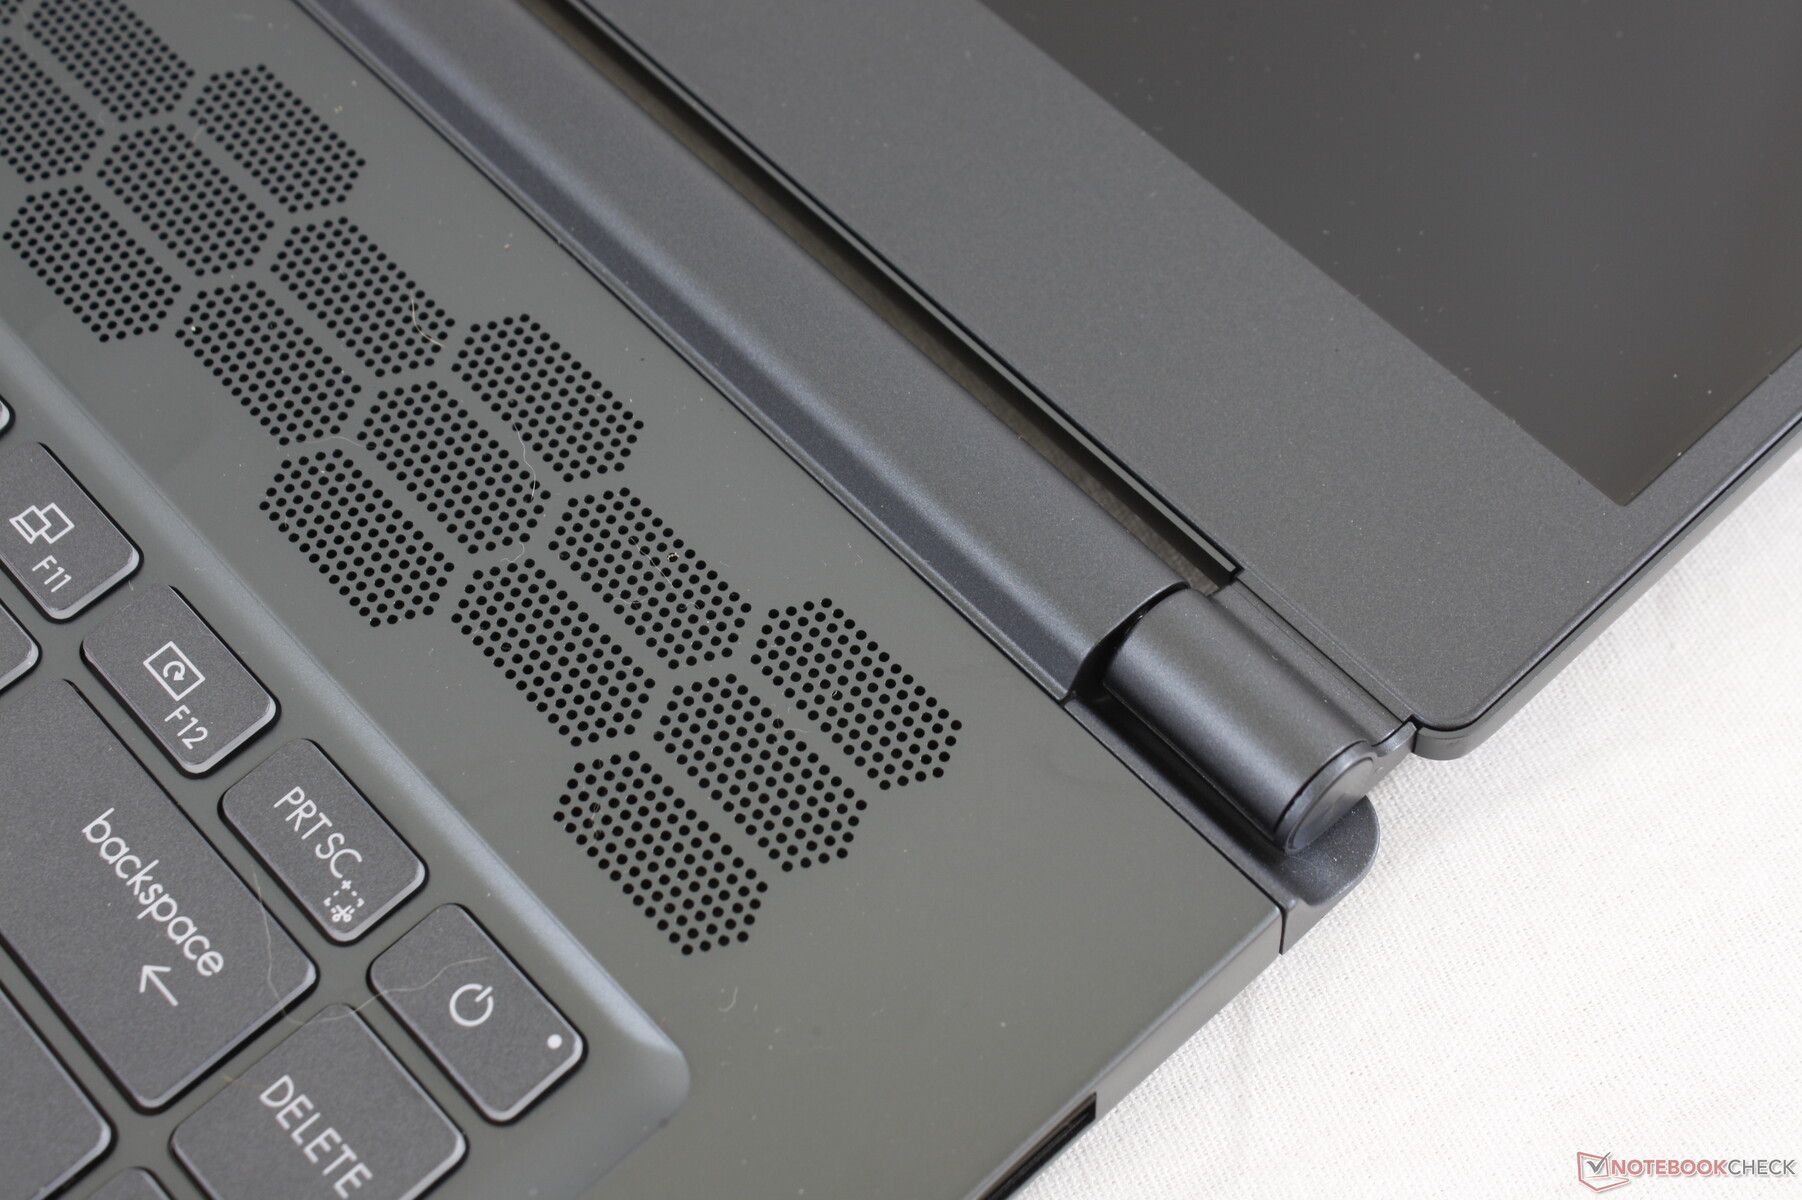
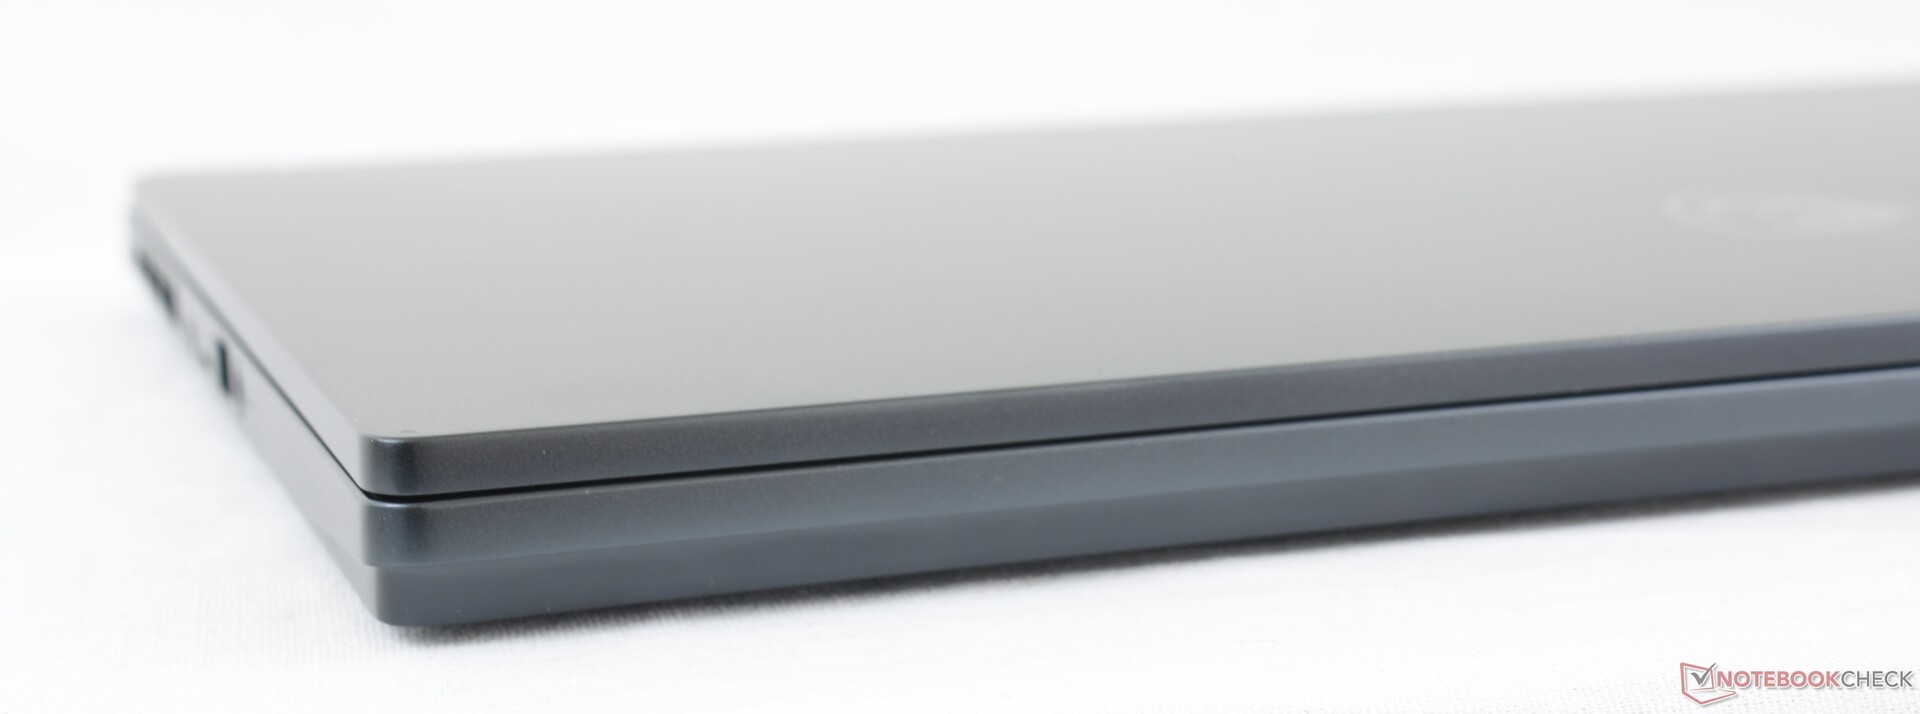
Chassis design is different from the Modern, Creator, and Prestige models. Even so, the Stealth 15M uses similar metal chassis materials for a similar look and feel. This also means that it suffers from the same advantages and disadvantages for better or worse. Its slim and sleek design is arguably attractive, but the base and lid are very prone to flexing when compared to the XPS 15, Envy 15, Spectre x360 15, and most other flagship 15.6-inch multimedia laptops for that matter. We don't have much faith in the weak hinges lasting for more than a couple of years, either.
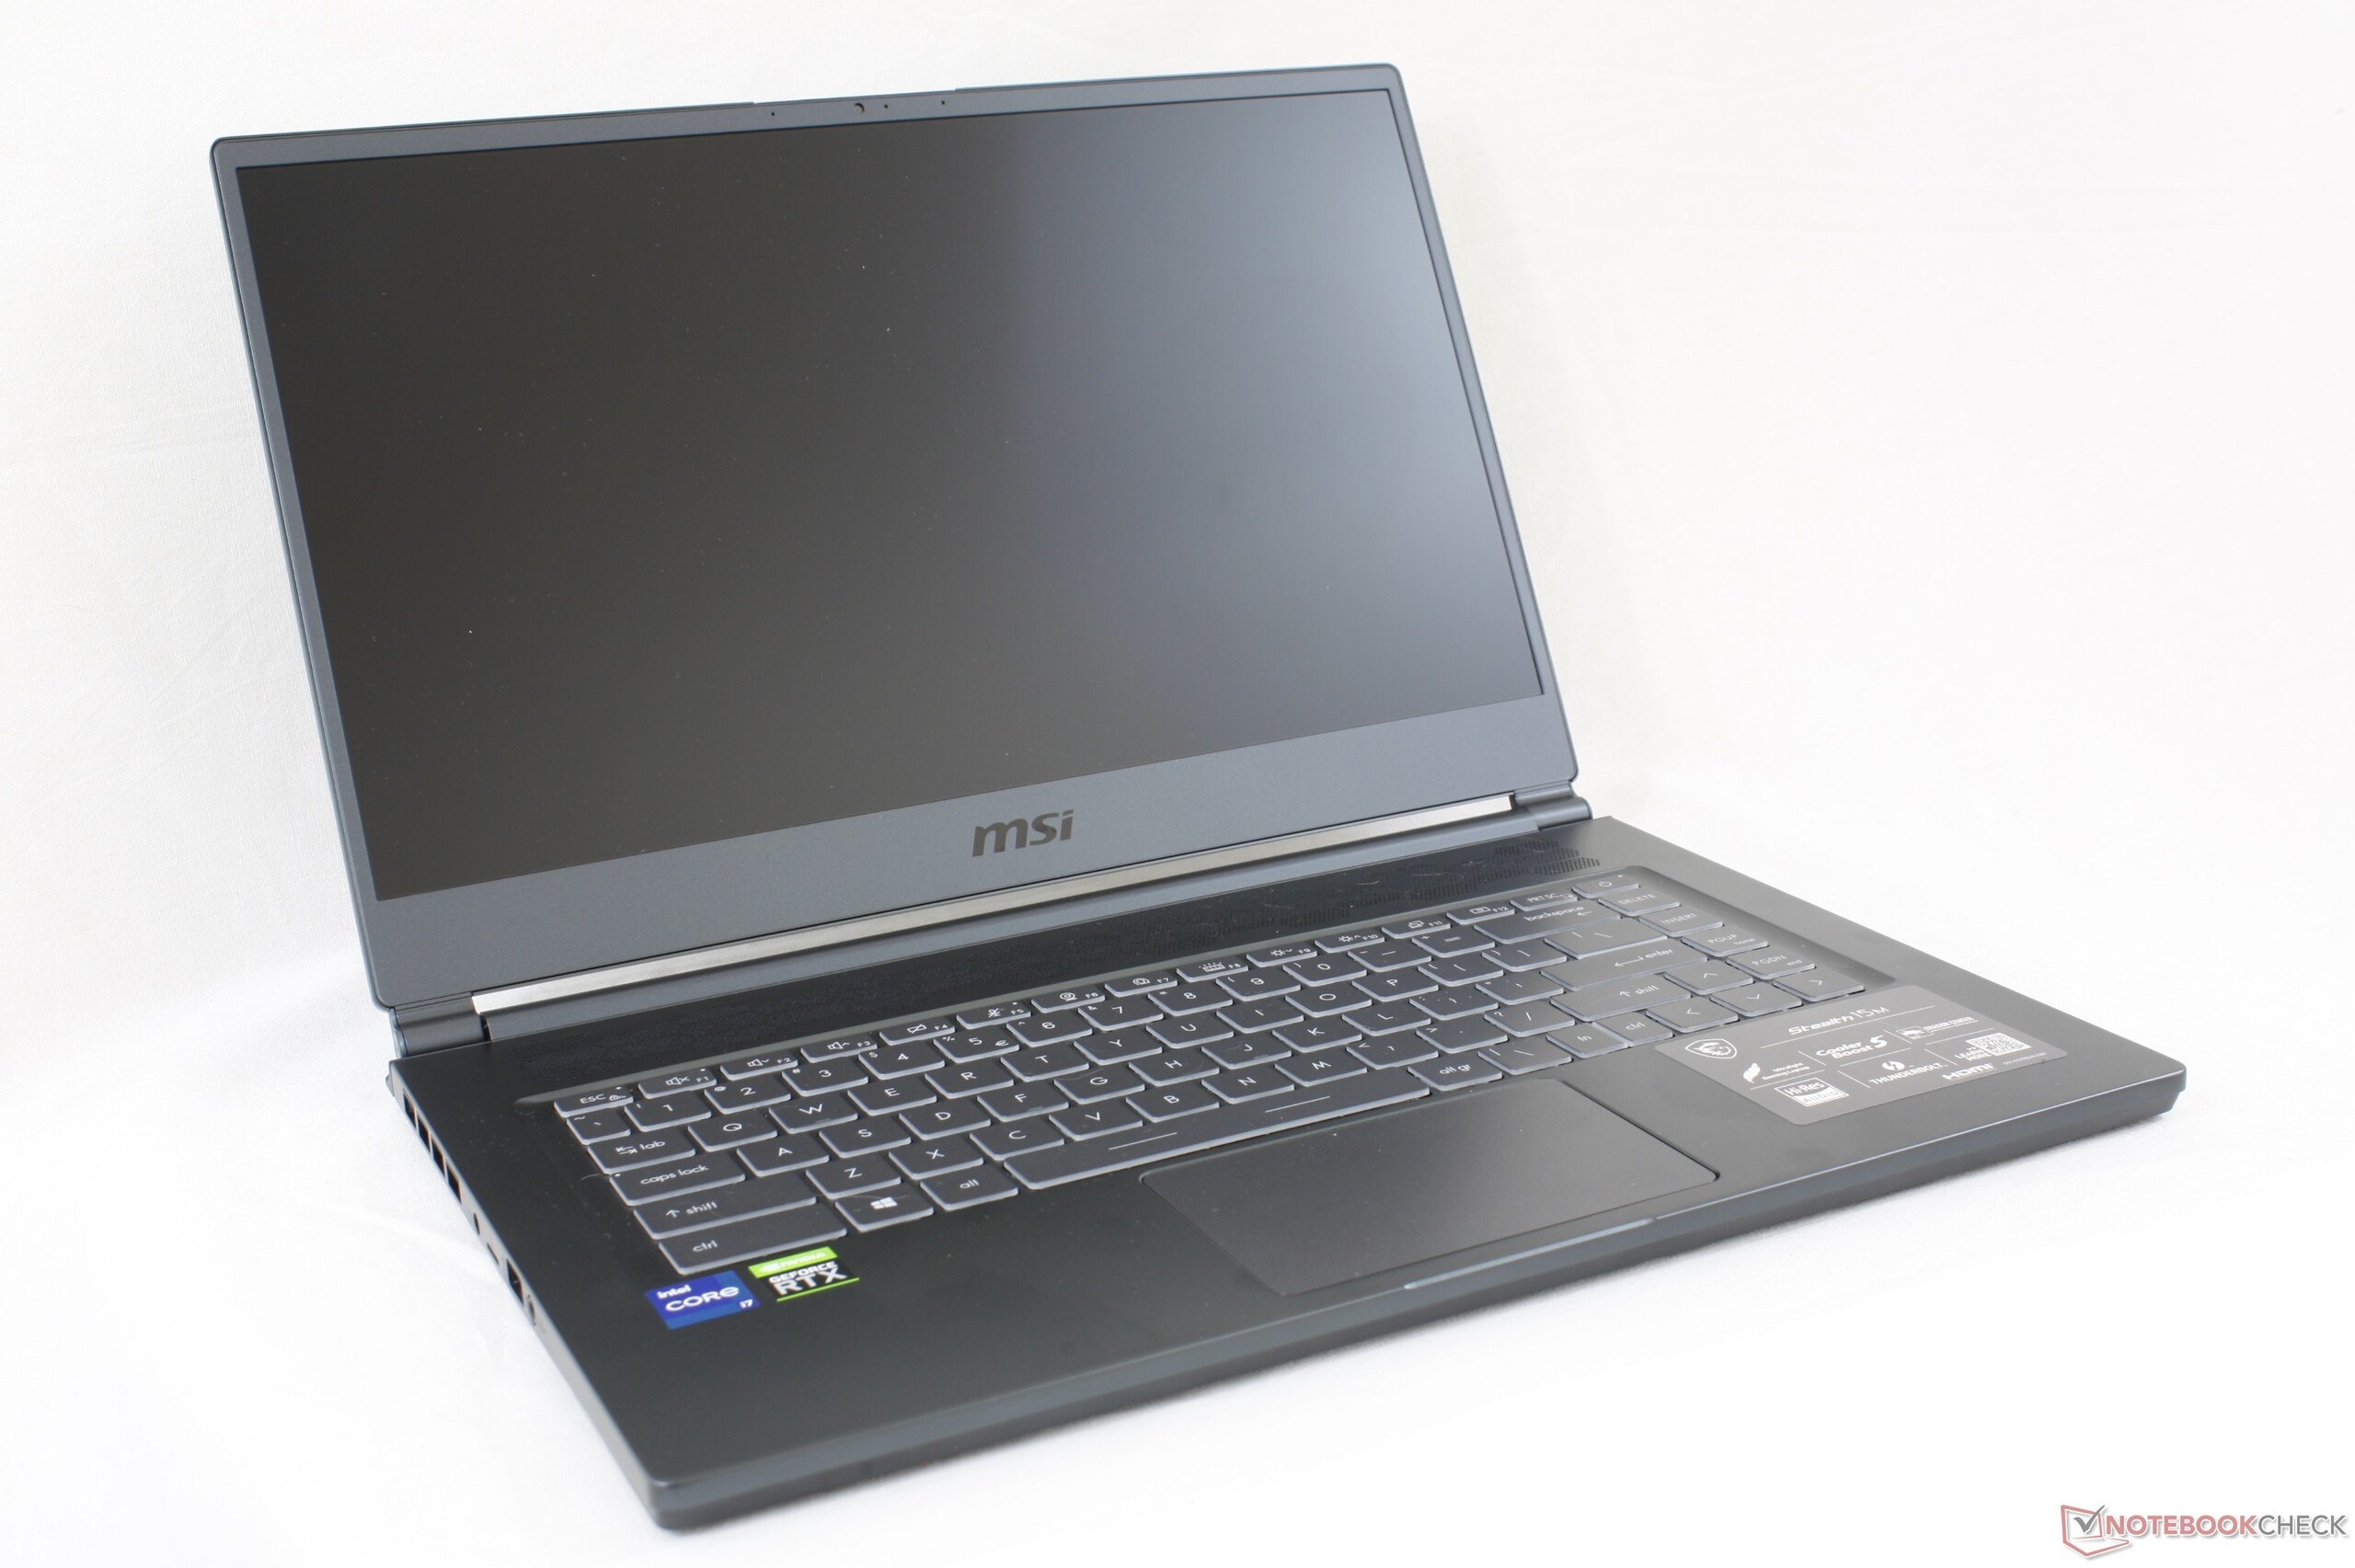
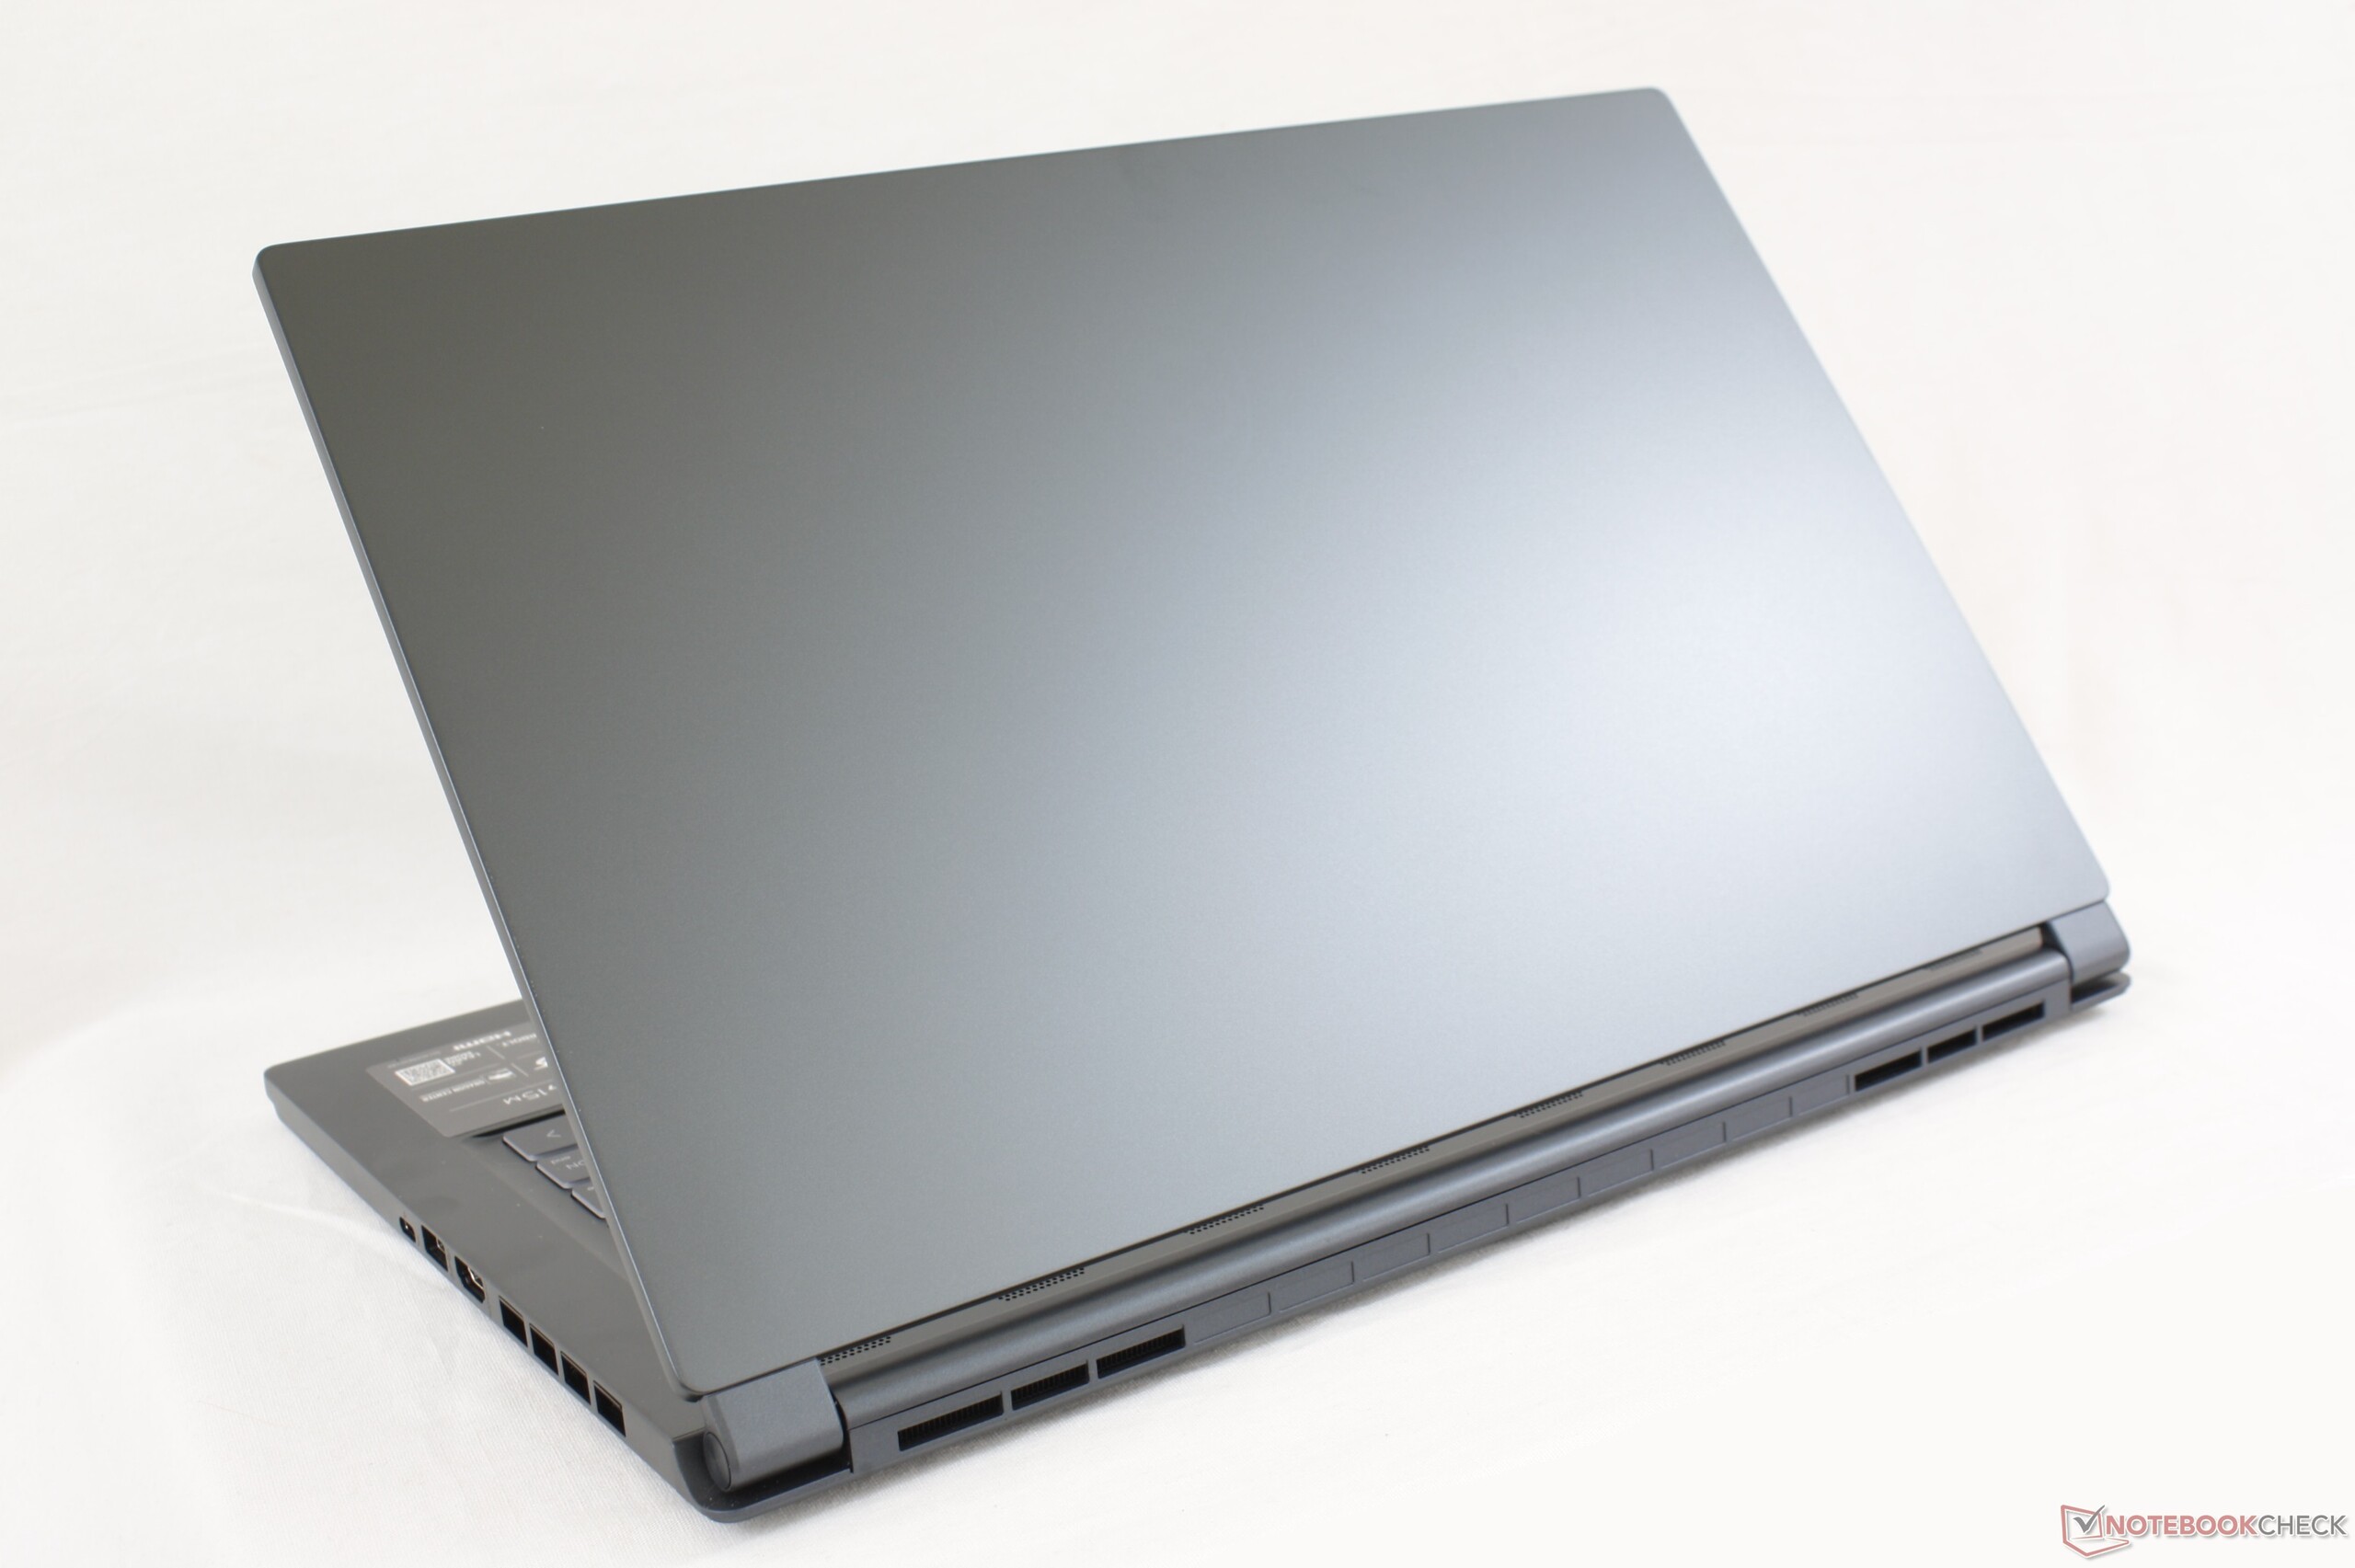
The low weight is an important characteristic of the Stealth 15M as the system is roughly 300 g lighter than many of its 15.6-inch competitors including the XPS 15. What makes the weight difference more remarkable is that the MSI also comes with significantly faster graphics options than any of these heavier alternatives. It's a lot of power for not a lot of weight.
Overall dimensions of the MSI are larger than on both the XPS 15 and Prestige 15 due to the thicker chin bezel.
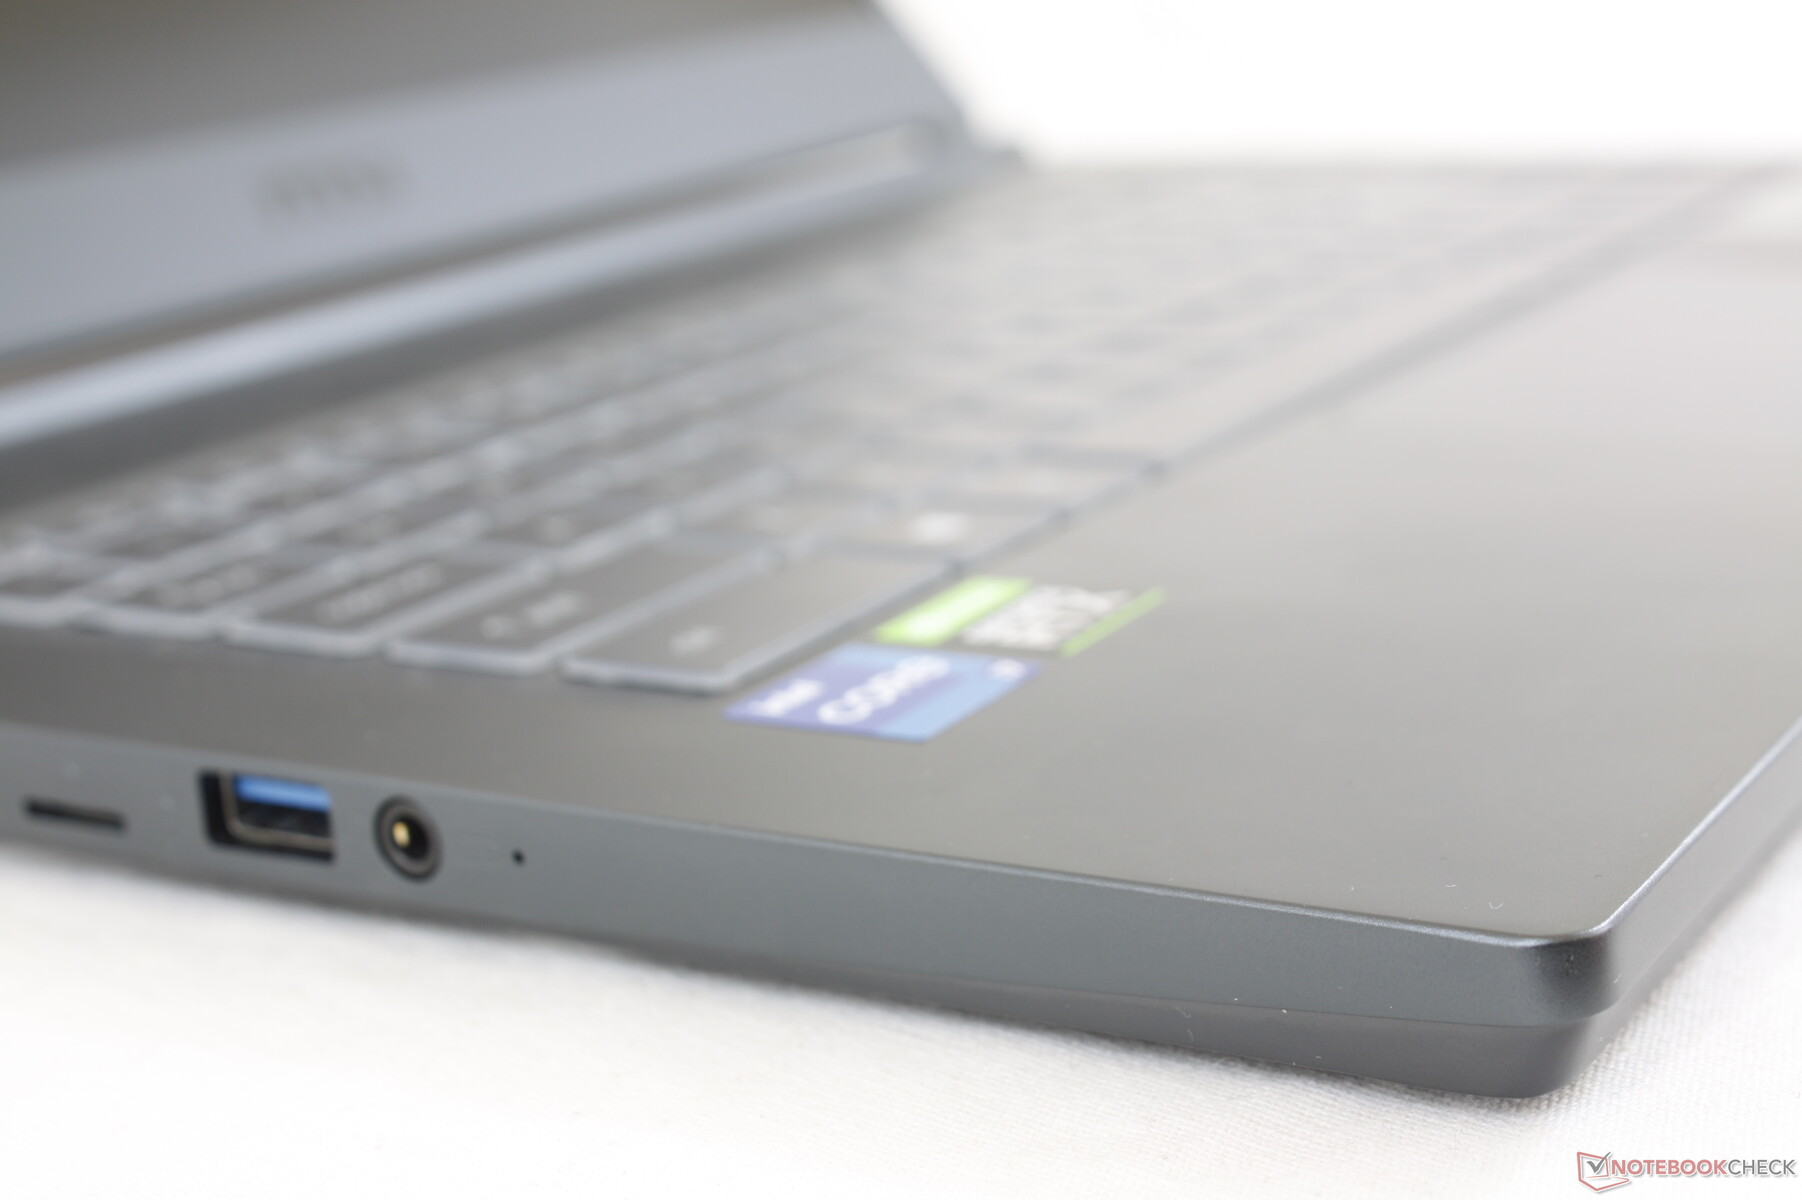
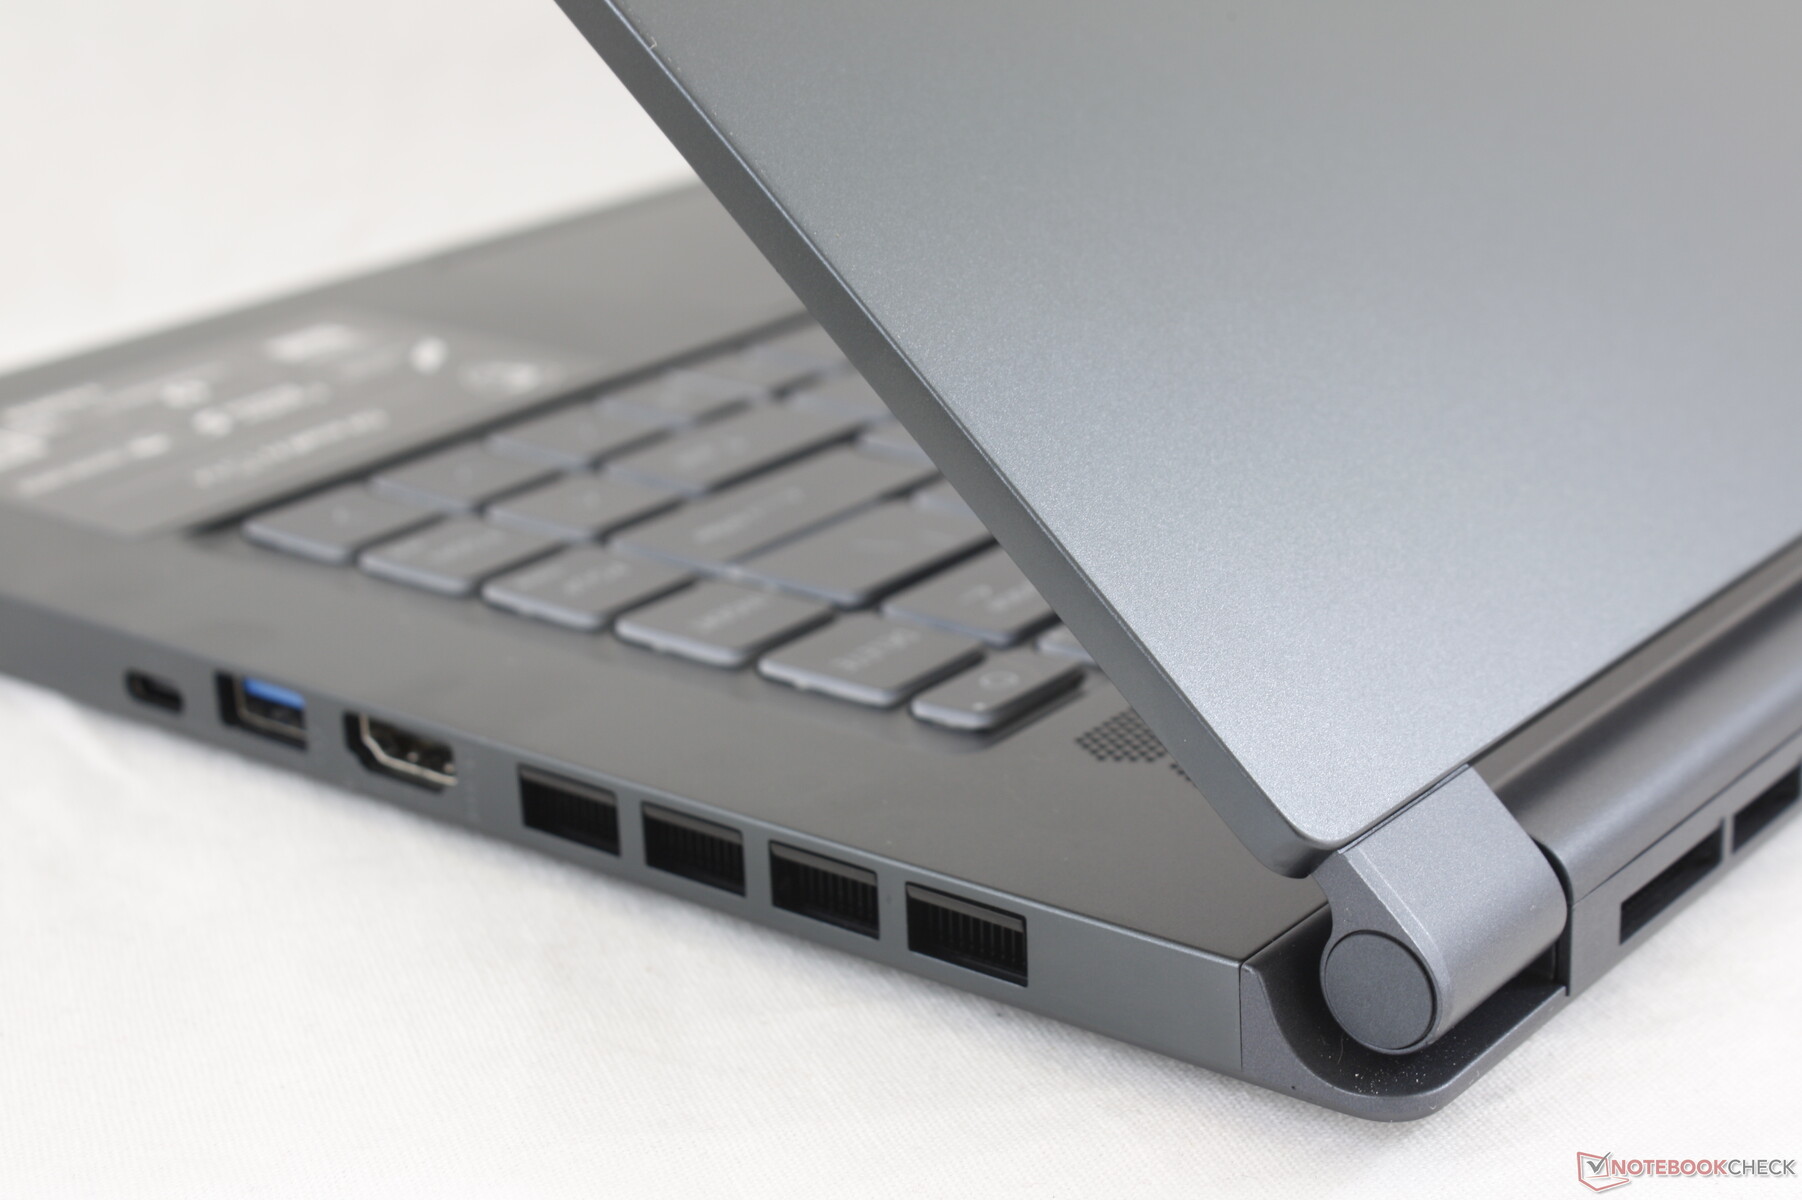
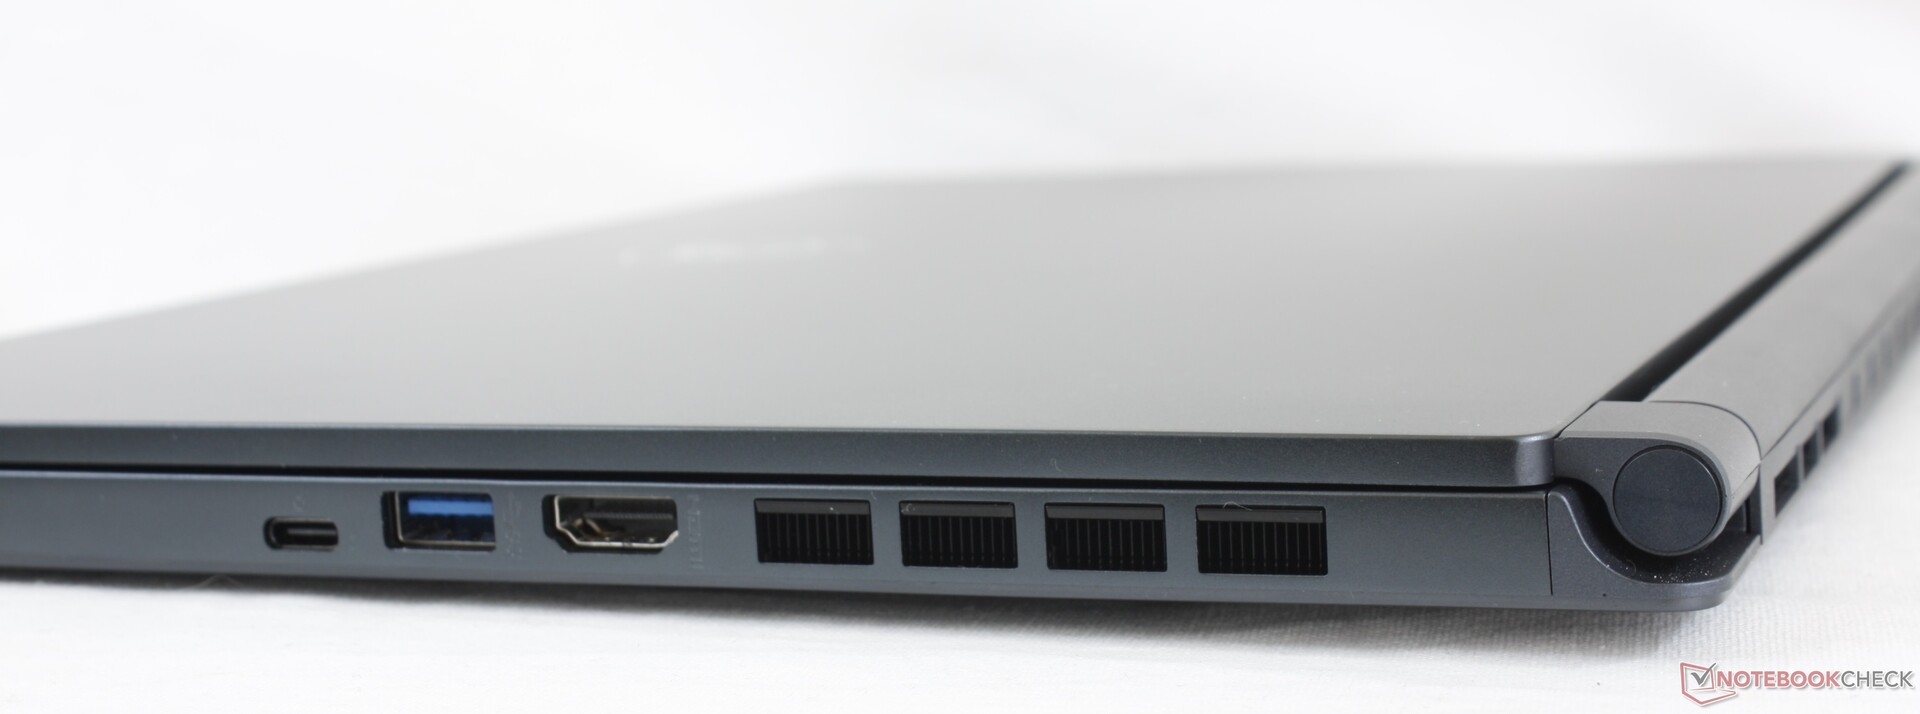
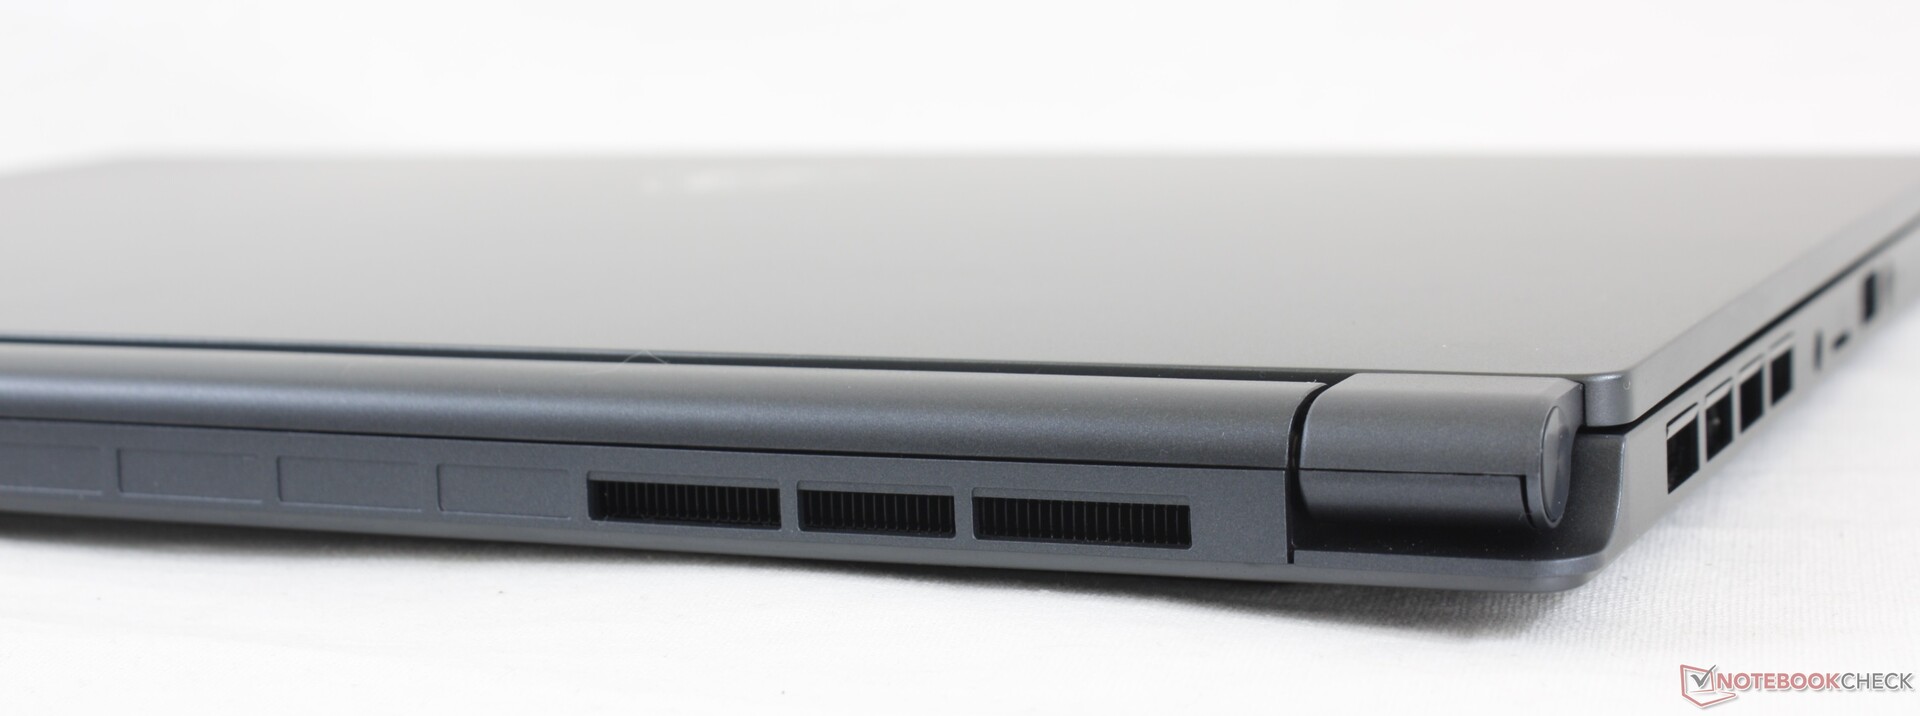
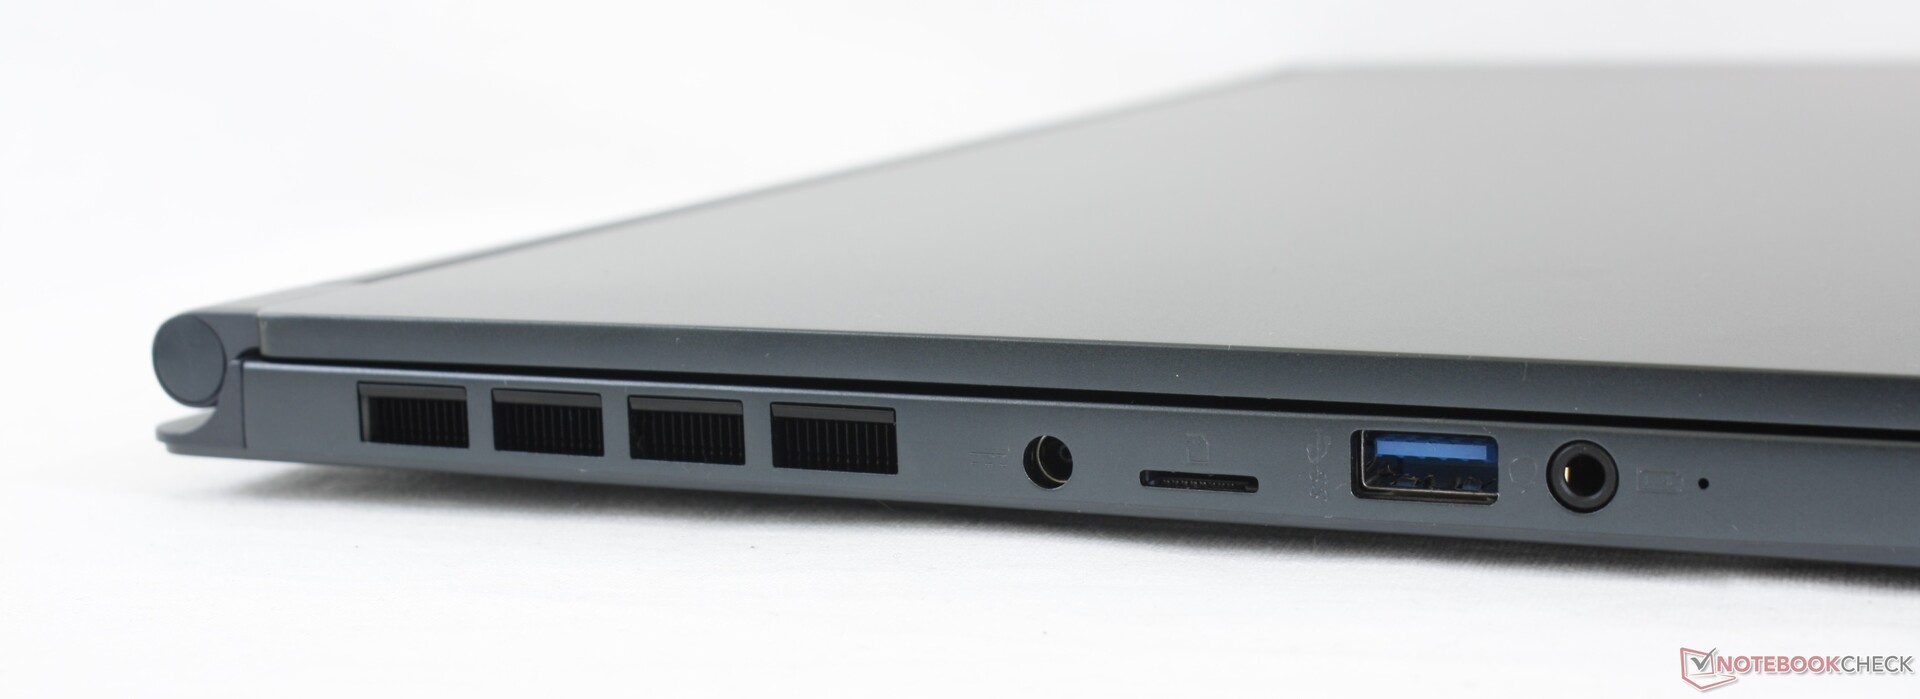
Connectivity
Port options are similar to the Prestige 15 but with a proprietary barrel charger port in place of one of the USB-C ports. MSI likely couldn't rely completely on USB-C charging here due to the higher power demands of the GeForce RTX 2060 Max-Q when compared to the GTX 1650 Max-Q of the Prestige model. The ports here are tightly packed along the left and right edges.
SD Card Reader
The spring-loaded MicroSD reader offers very fast transfer rates of about 200 MB/s. Moving 1 GB of pictures from our UHS-II test card to desktop takes about 6 seconds.
| SD Card Reader | |
| average JPG Copy Test (av. of 3 runs) | |
| Dell XPS 15 9500 Core i7 4K UHD (Toshiba Exceria Pro SDXC 64 GB UHS-II) | |
| MSI Stealth 15M A11SEK (Toshiba Exceria Pro M501 microSDXC 32GB) | |
| HP Spectre X360 15-5ZV31AV (Toshiba Exceria Pro M501 UHS-II) | |
| MSI Prestige 15 A10SC (Toshiba Exceria Pro M501 UHS-II) | |
| Lenovo ThinkPad T15p-20TN0006GE (Toshiba Exceria Pro SDXC 64 GB UHS-II) | |
| Asus ZenBook UX535-M01440 (Toshiba Exceria Pro M501 microSDXC 64GB) | |
| maximum AS SSD Seq Read Test (1GB) | |
| MSI Stealth 15M A11SEK (Toshiba Exceria Pro M501 microSDXC 32GB) | |
| Dell XPS 15 9500 Core i7 4K UHD (Toshiba Exceria Pro SDXC 64 GB UHS-II) | |
| MSI Prestige 15 A10SC (Toshiba Exceria Pro M501 UHS-II) | |
| HP Spectre X360 15-5ZV31AV (Toshiba Exceria Pro M501 UHS-II) | |
| Lenovo ThinkPad T15p-20TN0006GE (Toshiba Exceria Pro SDXC 64 GB UHS-II) | |
| Asus ZenBook UX535-M01440 (Toshiba Exceria Pro M501 microSDXC 64GB) | |
Communication
An Intel AX201 come standard for Wi-Fi 6 and Bluetooth 5.1 connectivity. We experienced no issues when paired to our Netgear RAX200 test router, though transmit rates are much slower than expected.
Webcam


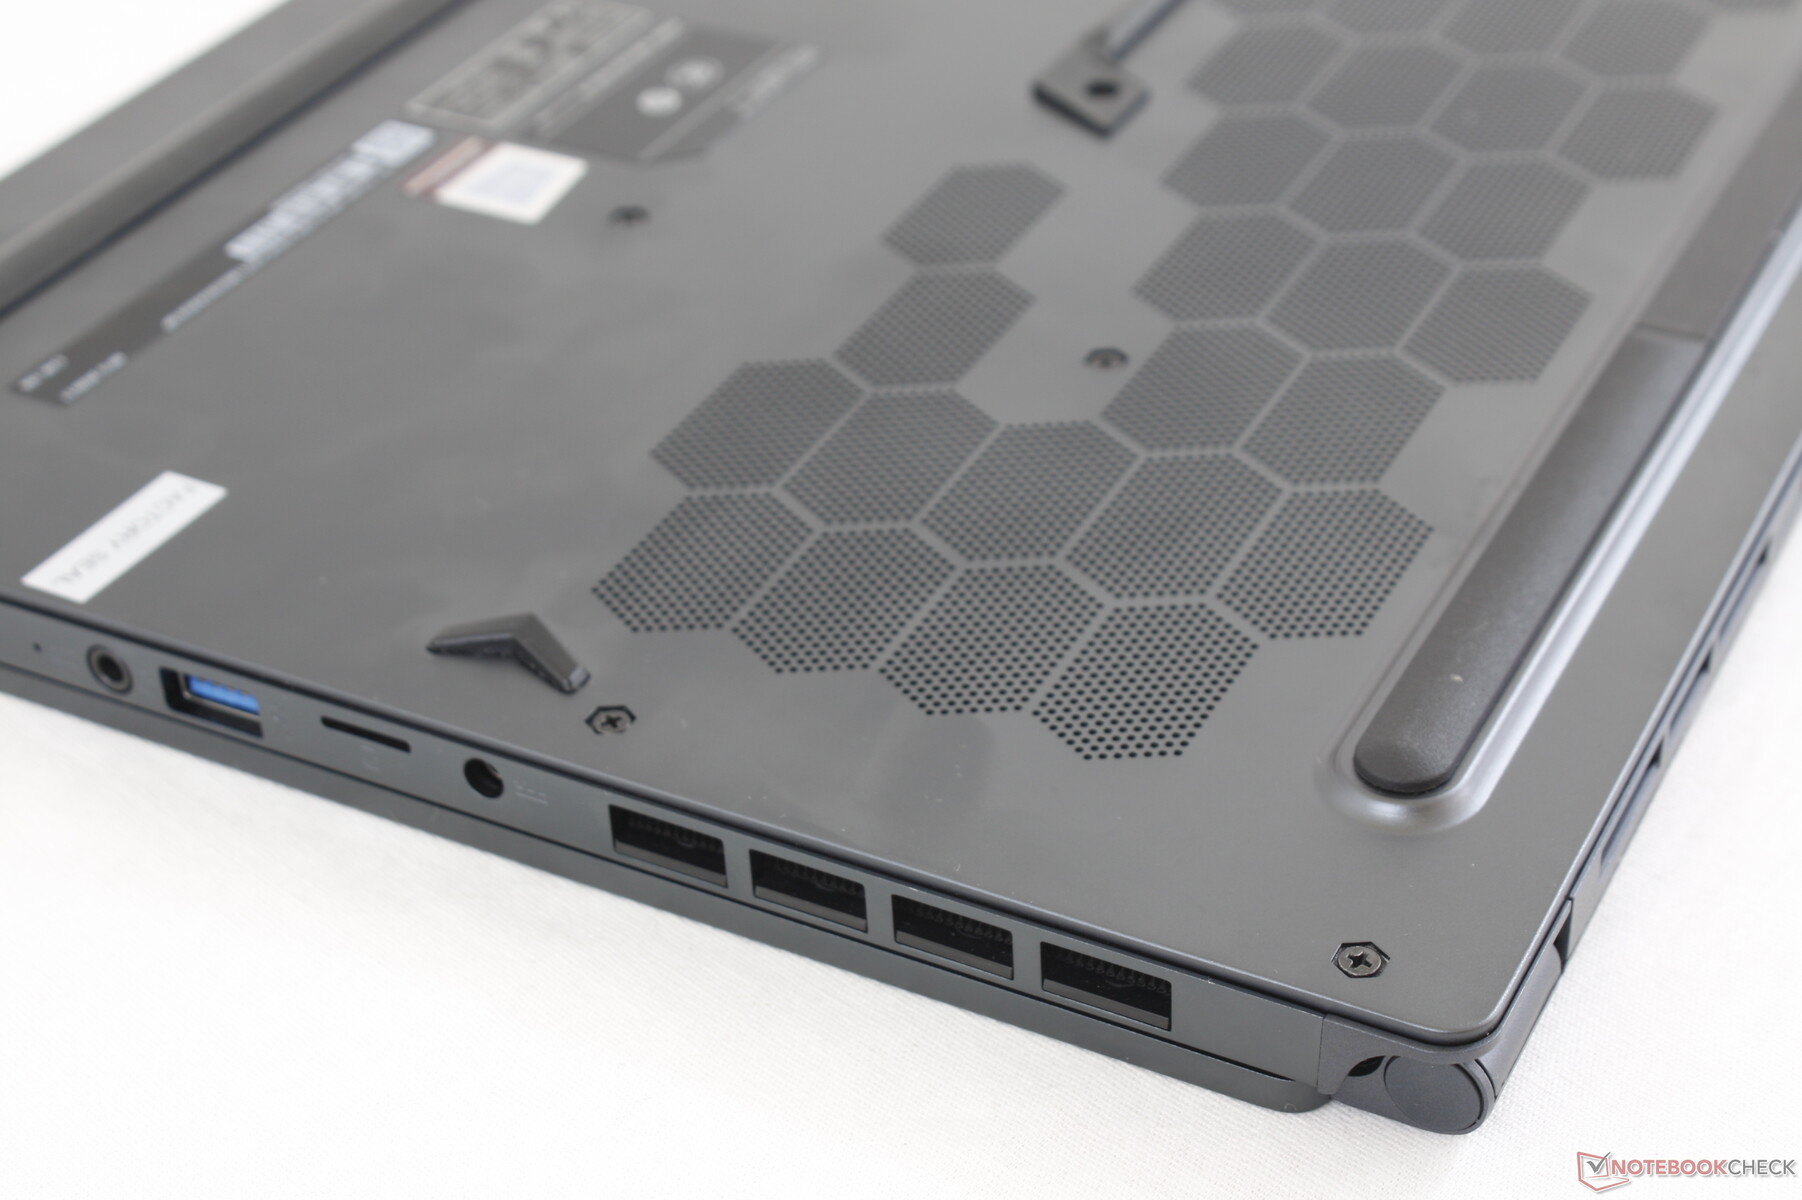
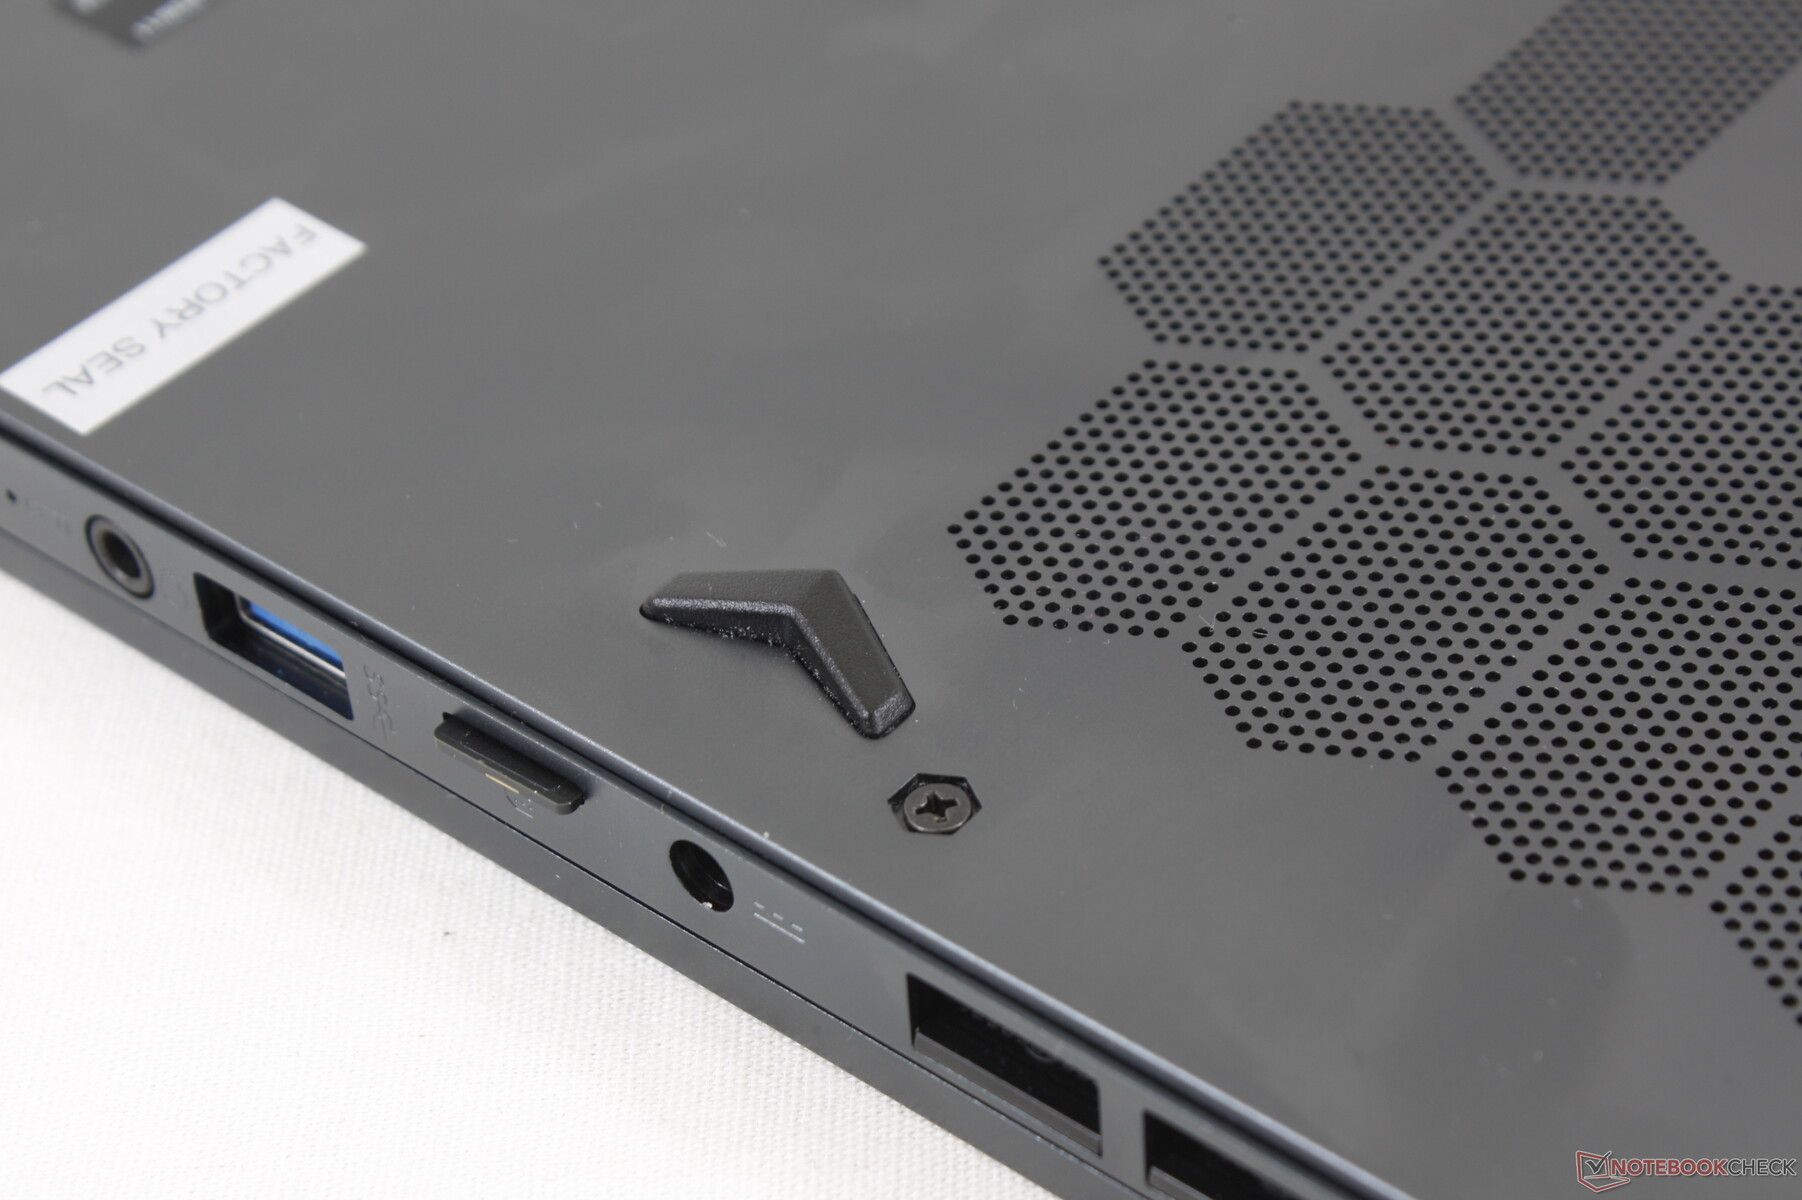
Maintenance
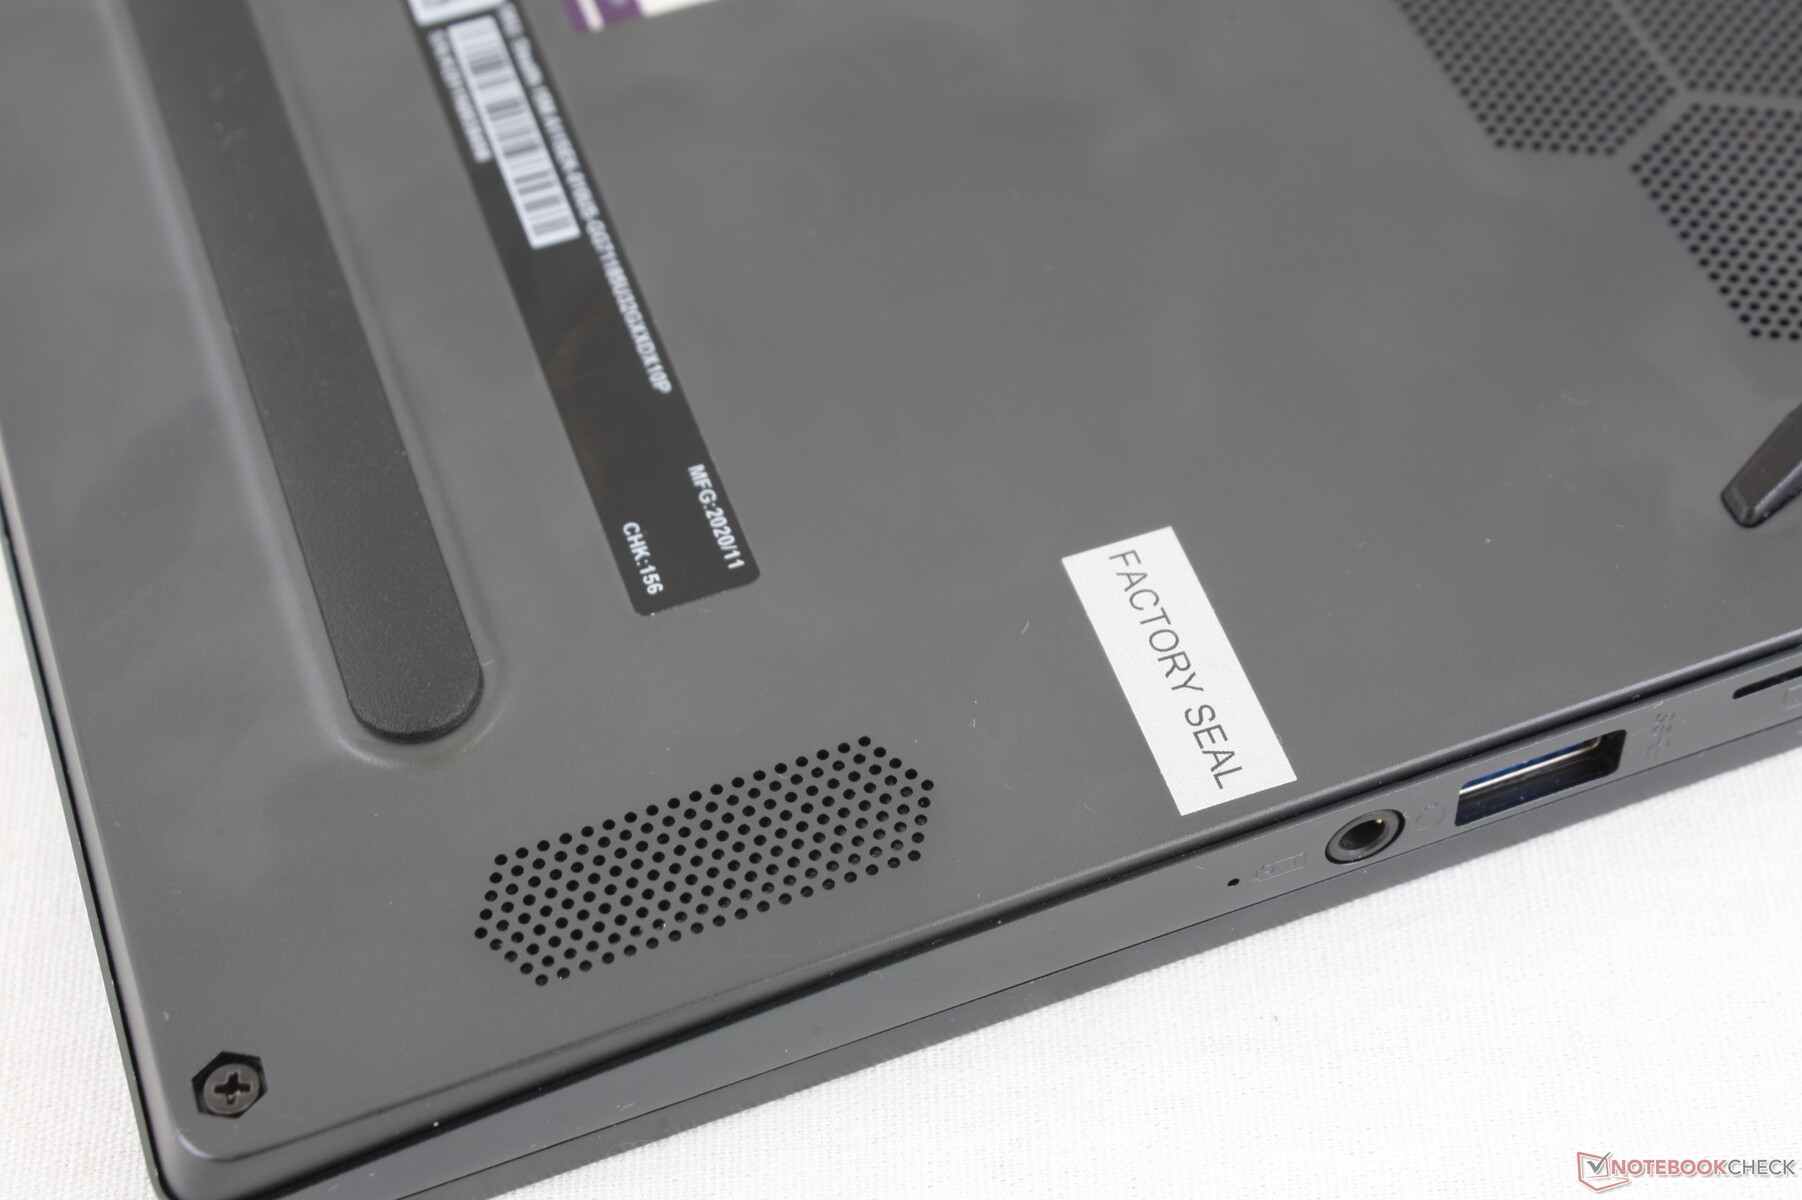
Despite our cries, MSI continues to discourage end-user upgrades with a 'factory seal' sticker over one of the screws on the bottom plate. Claiming warranty or retail returns can be difficult because sellers can use the broken seal against you.
Accessories and Warranty
The retail box includes a USB-A to RJ-45 adapter alongside the paperwork and Ac adapter. There is no velvet cleaning cloth unlike in the retail box for tghe GS66.
A two-year manufacturer warranty comes standard.
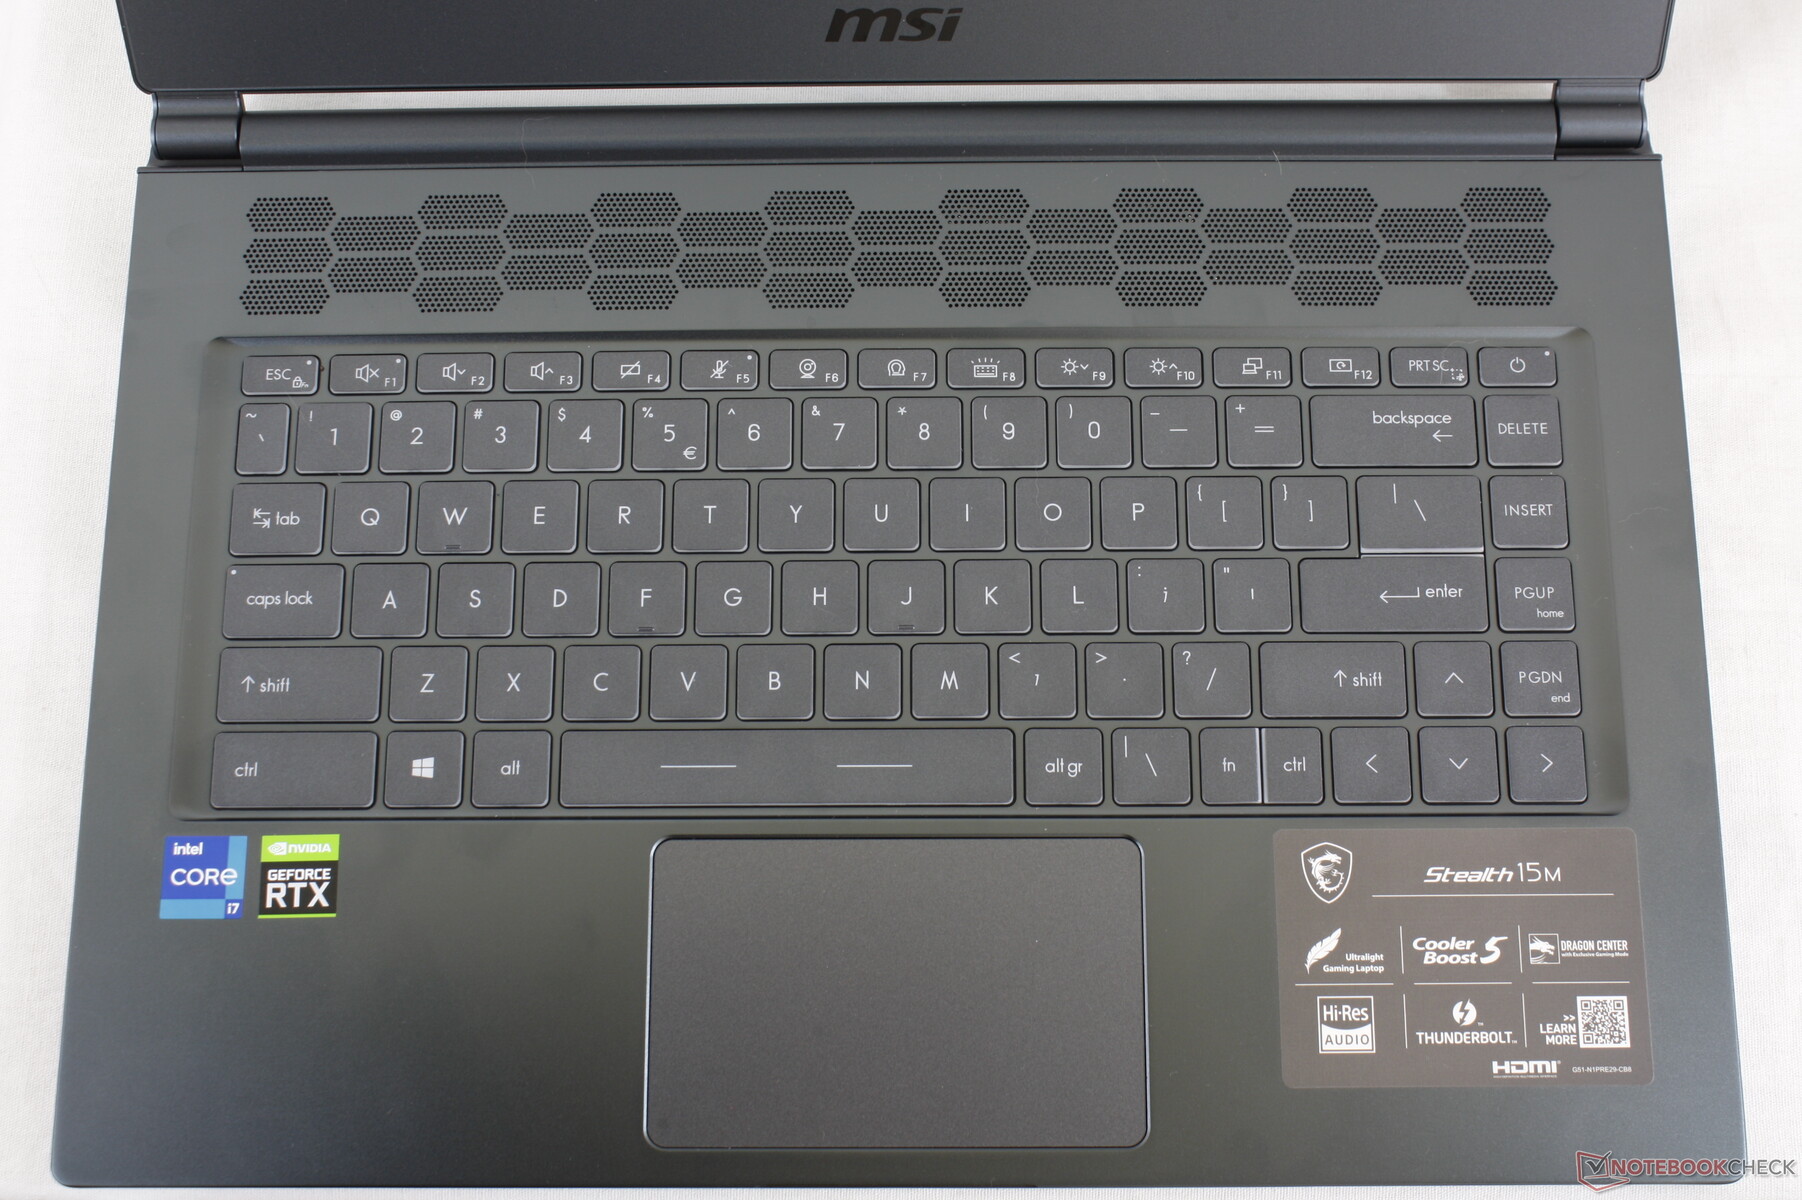
Input Devices
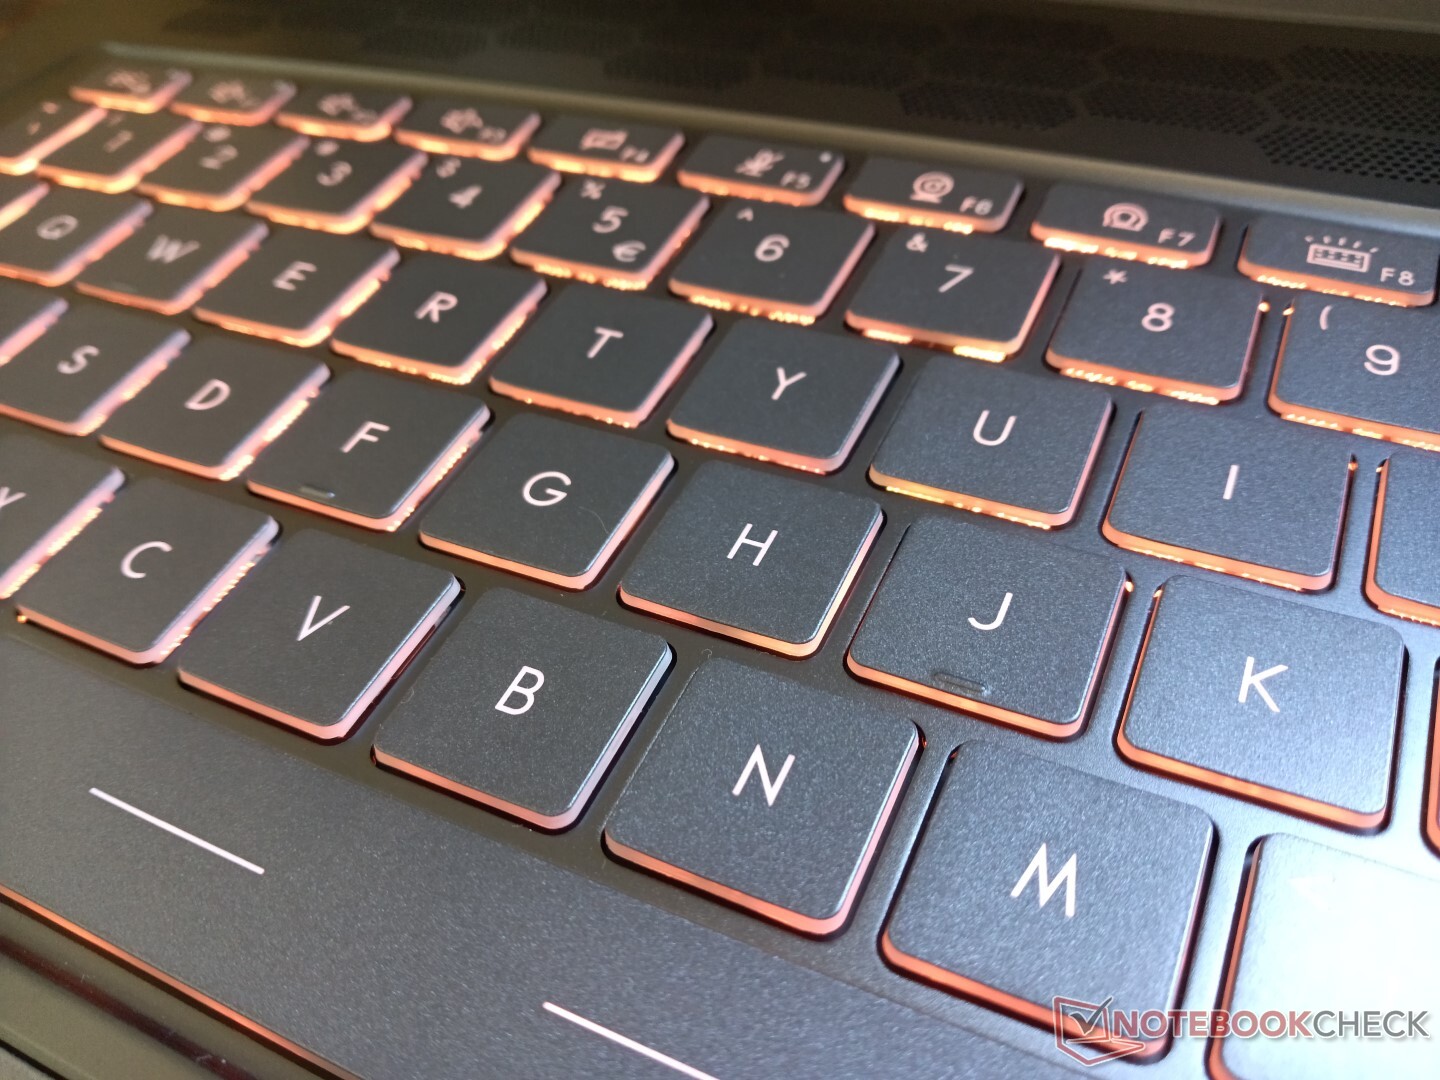
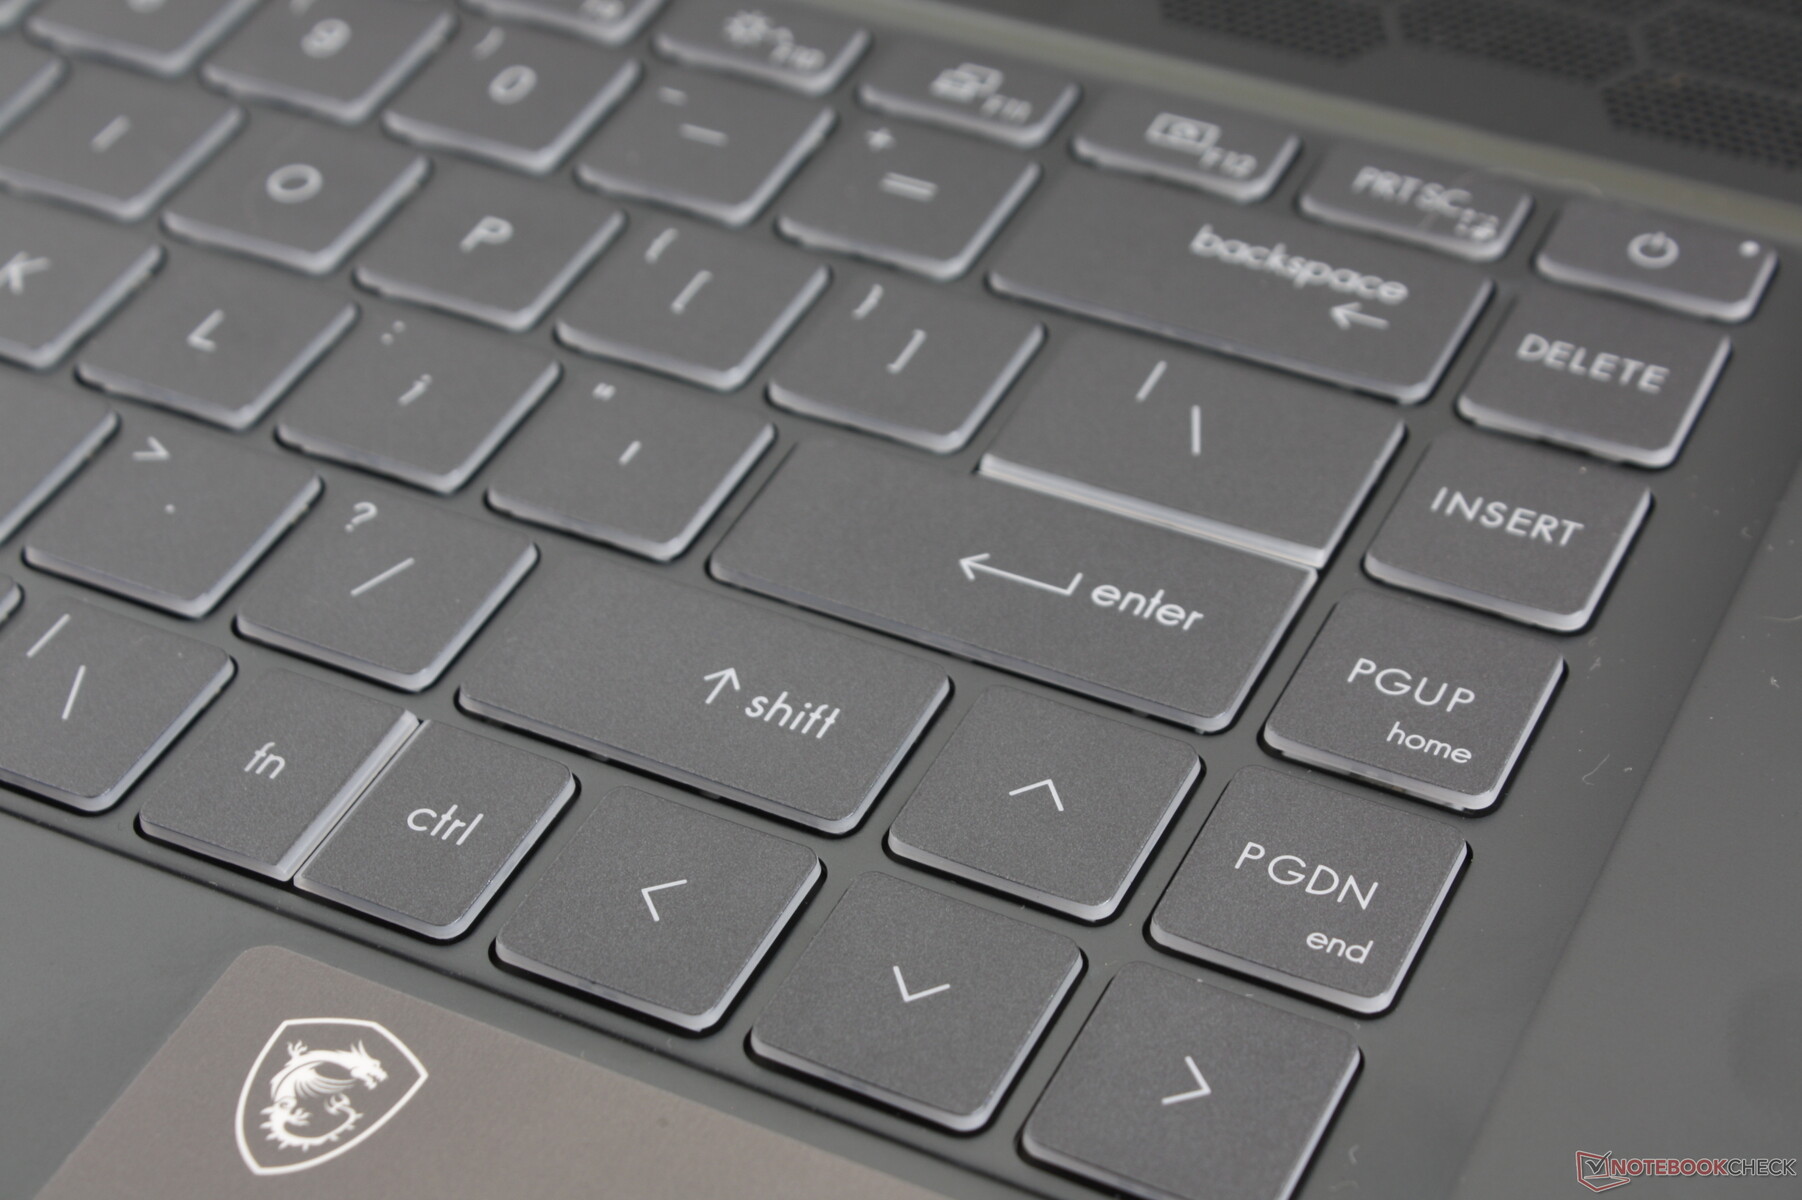
Keyboard
Keyboard feedback and layout are identical to what you'll find on the Prestige 15 save for the split FN/Ctrl keys near the bottom right. Thus, our existing comments on the Prestige keyboard apply here including the light and shallow keys relative to the firmer keys of the HP Spectre or Lenovo ThinkPad keys. Users accustomed to typing on an Asus ZenBook or VivoBook will find a familiar typing experience on the Stealth 15M.
Unlike the MSI Prestige, Modern, or Creator, the keyboard backlight here is compatible with RGB colors via MSI Mystic Light. Options are limited to single-zone only in contrast to the per-key RGB settings on the GS66 series.
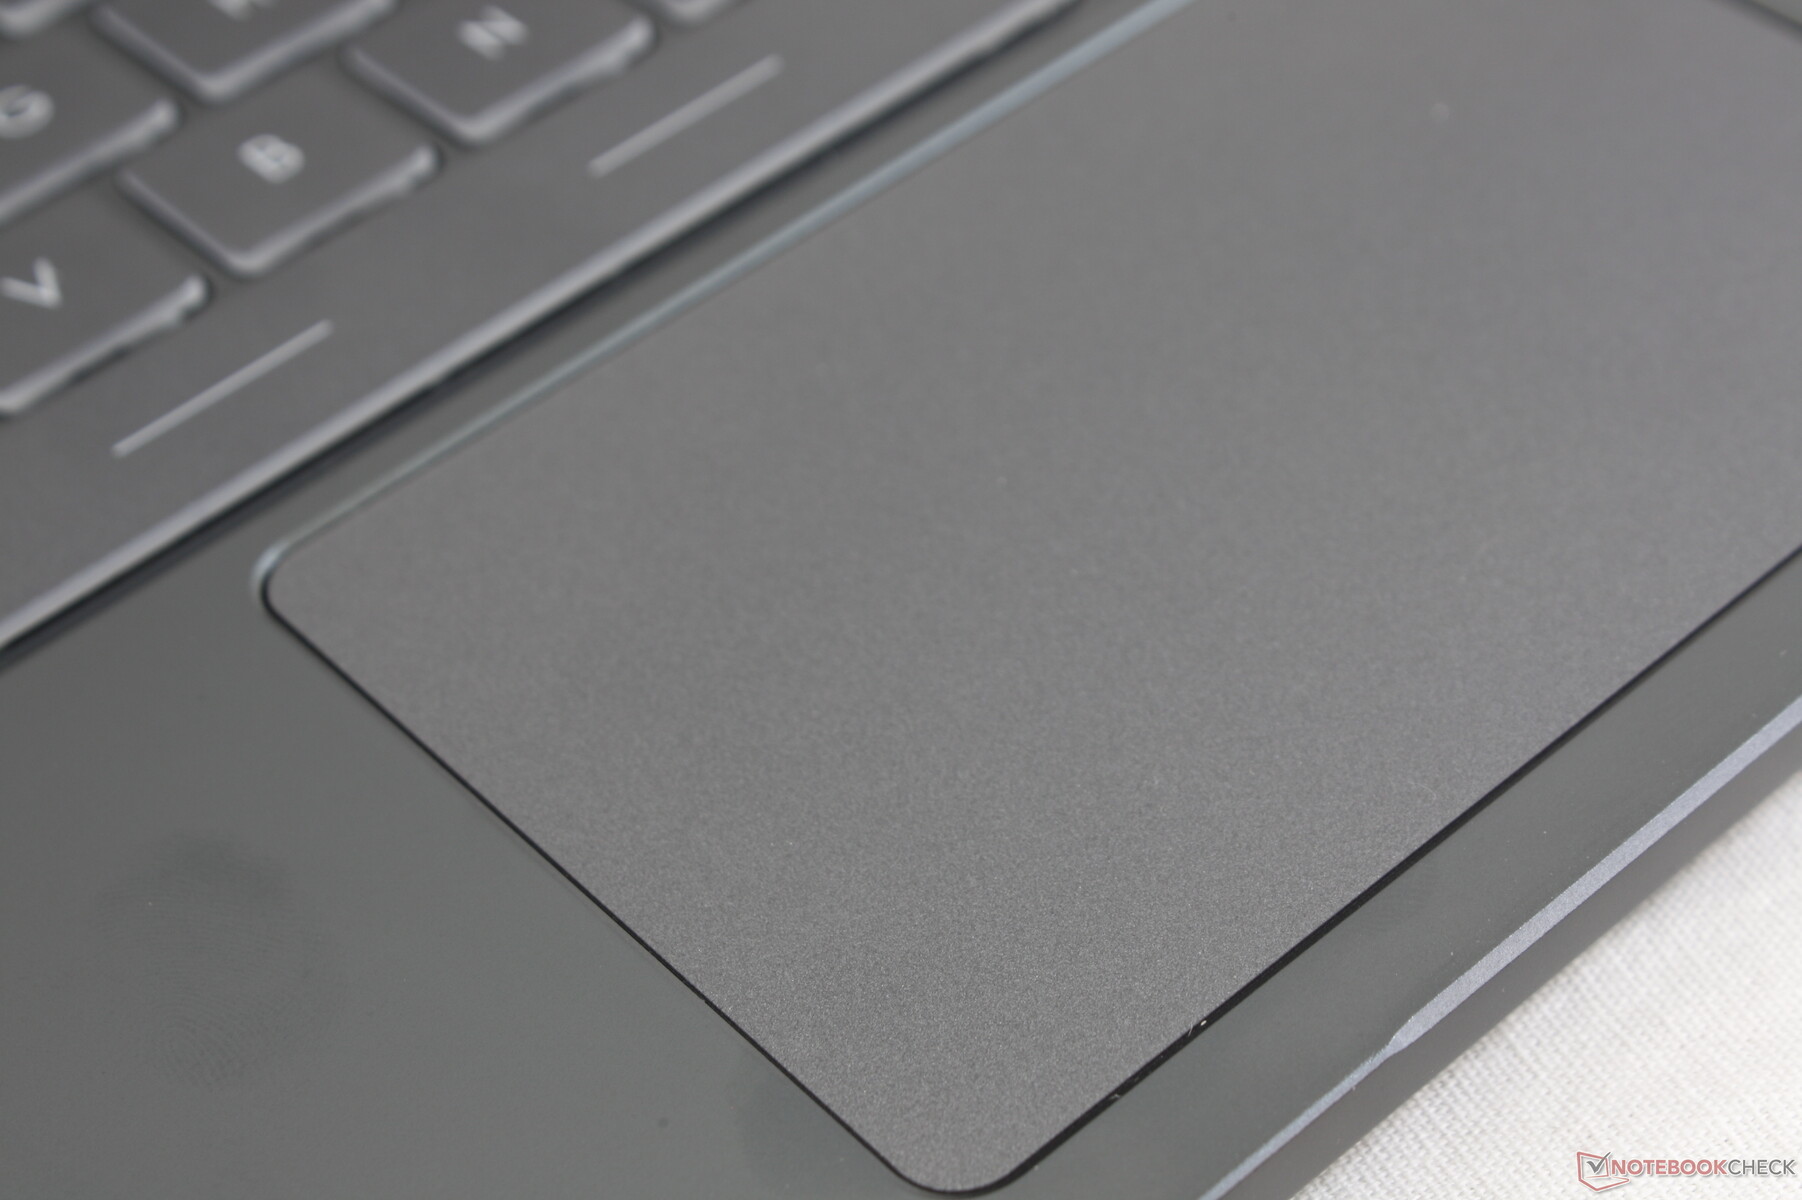
Touchpad
The clickpad (10.5 x 6.5 cm) is smaller than the one on the XPS 15 (15.1 x 9 cm) or HP Spectre x360 15 (12 x 6 cm). Cursor control is smooth with almost no sticking even if gliding very slowly across the surface. Its integrated clickpad buttons, however, are spongy and difficult to use for long periods. An external mouse is highly recommended if you need to do a lot of clicking.
Display
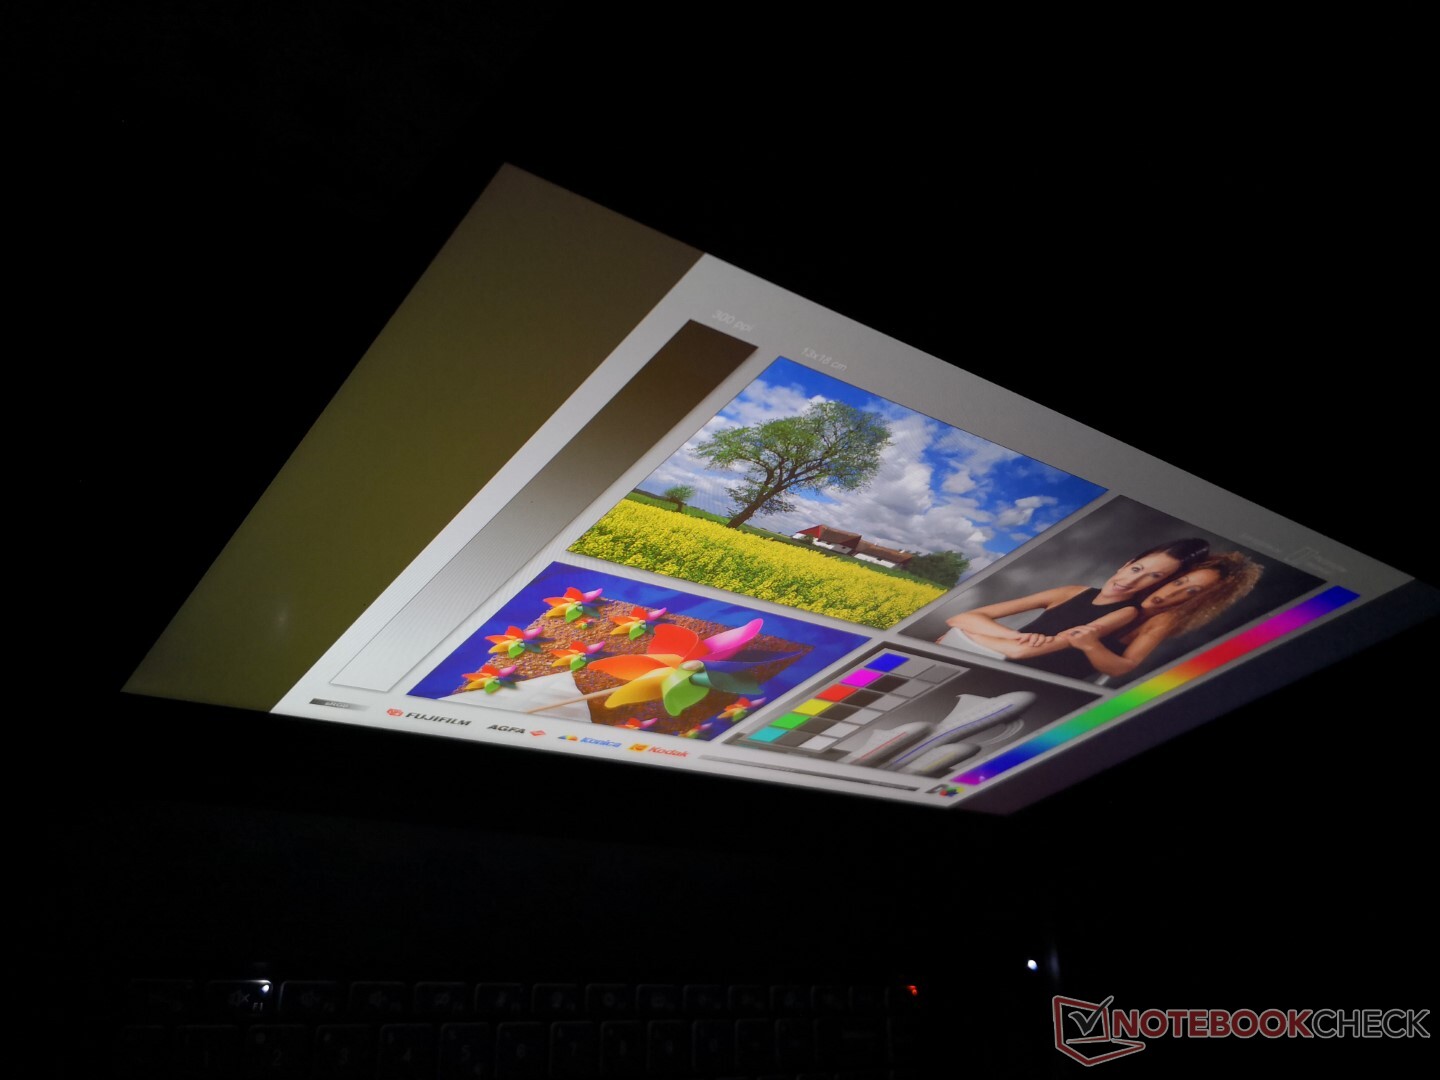
The Stealth 15M comes with the same 60 Hz Chi Mei N156HCE-EN1 IPS panel as found on the Lenovo ThinkPad P52, Yoga 720-15IKB, Asus ZenBook Pro UX550, and even MSI's own Modern 15. Innate characteristics like the decent contrast ratio, color space, black-white response times, and overall visual quality are therefore quite similar between these systems especially with the Modern 15.
A notable disadvantage of the display is its mediocre maximum brightness of only 279 nits. Though serviceable for indoor conditions, this is much lower than most other 15.6-inch multimedia laptops in the same price range as shown by the table below.


| |||||||||||||||||||||||||
Brightness Distribution: 82 %
Center on Battery: 279 cd/m²
Contrast: 872:1 (Black: 0.32 cd/m²)
ΔE Color 1.72 | 0.5-29.43 Ø5, calibrated: 1.39
ΔE Greyscale 2.9 | 0.57-98 Ø5.3
93.2% sRGB (Argyll 1.6.3 3D)
59% AdobeRGB 1998 (Argyll 1.6.3 3D)
64.1% AdobeRGB 1998 (Argyll 2.2.0 3D)
93.4% sRGB (Argyll 2.2.0 3D)
62% Display P3 (Argyll 2.2.0 3D)
Gamma: 2.3
| MSI Stealth 15M A11SEK Chi Mei N156HCE-EN1, IPS, 15.60, 1920x1080 | Dell XPS 15 9500 Core i7 4K UHD Sharp LQ156R1, IPS, 15.60, 3840x2400 | Lenovo ThinkPad T15p-20TN0006GE MNF601EA1-1, IPS LED, 15.60, 3840x2160 | Asus ZenBook UX535-M01440 BOE0866, IPS, 15.60, 3840x2160 | MSI Prestige 15 A10SC Sharp LQ156D1JW42, IPS, 15.60, 3840x2160 | HP Envy 15-ep0098nr Samsung SDC4145, AMOLED, 15.60, 3840x2160 | |
|---|---|---|---|---|---|---|
| Display | 36% | 33% | 9% | 29% | 35% | |
| Display P3 Coverage | 62 | 89.7 45% | 86.8 40% | 68.8 11% | 82 32% | 88.5 43% |
| sRGB Coverage | 93.4 | 100 7% | 99.3 6% | 99.5 7% | 98.3 5% | 100 7% |
| AdobeRGB 1998 Coverage | 64.1 | 99.8 56% | 98.5 54% | 70.1 9% | 96.2 50% | 99.9 56% |
| Response Times | -4% | 27% | 31% | -13% | 30% | |
| Response Time Grey 50% / Grey 80% * | 47.6 ? | 54 ? -13% | 41.6 ? 13% | 34 ? 29% | 60 ? -26% | 0.8 ? 98% |
| Response Time Black / White * | 35.2 ? | 33.2 ? 6% | 21.2 ? 40% | 24 ? 32% | 41.2 ? -17% | 2.7 ? 92% |
| PWM Frequency | 25000 ? | 26040 ? 4% | 242.7 ? -99% | |||
| Screen | -6% | 54% | 12% | -5% | -36% | |
| Brightness middle | 279 | 557.9 100% | 595 113% | 402 44% | 464.5 66% | 374.3 34% |
| Brightness | 252 | 541 115% | 594 136% | 375 49% | 451 79% | 379 50% |
| Brightness Distribution | 82 | 91 11% | 94 15% | 84 2% | 92 12% | 91 11% |
| Black Level * | 0.32 | 0.39 -22% | 0.32 -0% | 0.35 -9% | 0.5 -56% | |
| Contrast | 872 | 1431 64% | 1859 113% | 1149 32% | 929 7% | |
| Colorchecker dE 2000 * | 1.72 | 4.54 -164% | 1.2 30% | 2.47 -44% | 3.36 -95% | 5.47 -218% |
| Colorchecker dE 2000 max. * | 5.62 | 7.92 -41% | 2.5 56% | 4.32 23% | 7.06 -26% | 8.22 -46% |
| Colorchecker dE 2000 calibrated * | 1.39 | 3.82 -175% | 1 28% | 2.36 -70% | 3.42 -146% | 4.61 -232% |
| Greyscale dE 2000 * | 2.9 | 3.2 -10% | 1.4 52% | 2.26 22% | 1.3 55% | 2.3 21% |
| Gamma | 2.3 96% | 1.99 111% | 2.1 105% | 2.49 88% | 2.14 103% | 2.09 105% |
| CCT | 6700 97% | 6451 101% | 6492 100% | 6285 103% | 6596 99% | 6340 103% |
| Color Space (Percent of AdobeRGB 1998) | 59 | 89.5 52% | 85.3 45% | 99 68% | 84.8 44% | 87.8 49% |
| Color Space (Percent of sRGB) | 93.2 | 100 7% | 99.2 6% | 98.3 5% | 100 7% | |
| Total Average (Program / Settings) | 9% /
2% | 38% /
47% | 17% /
14% | 4% /
-0% | 10% /
-8% |
* ... smaller is better
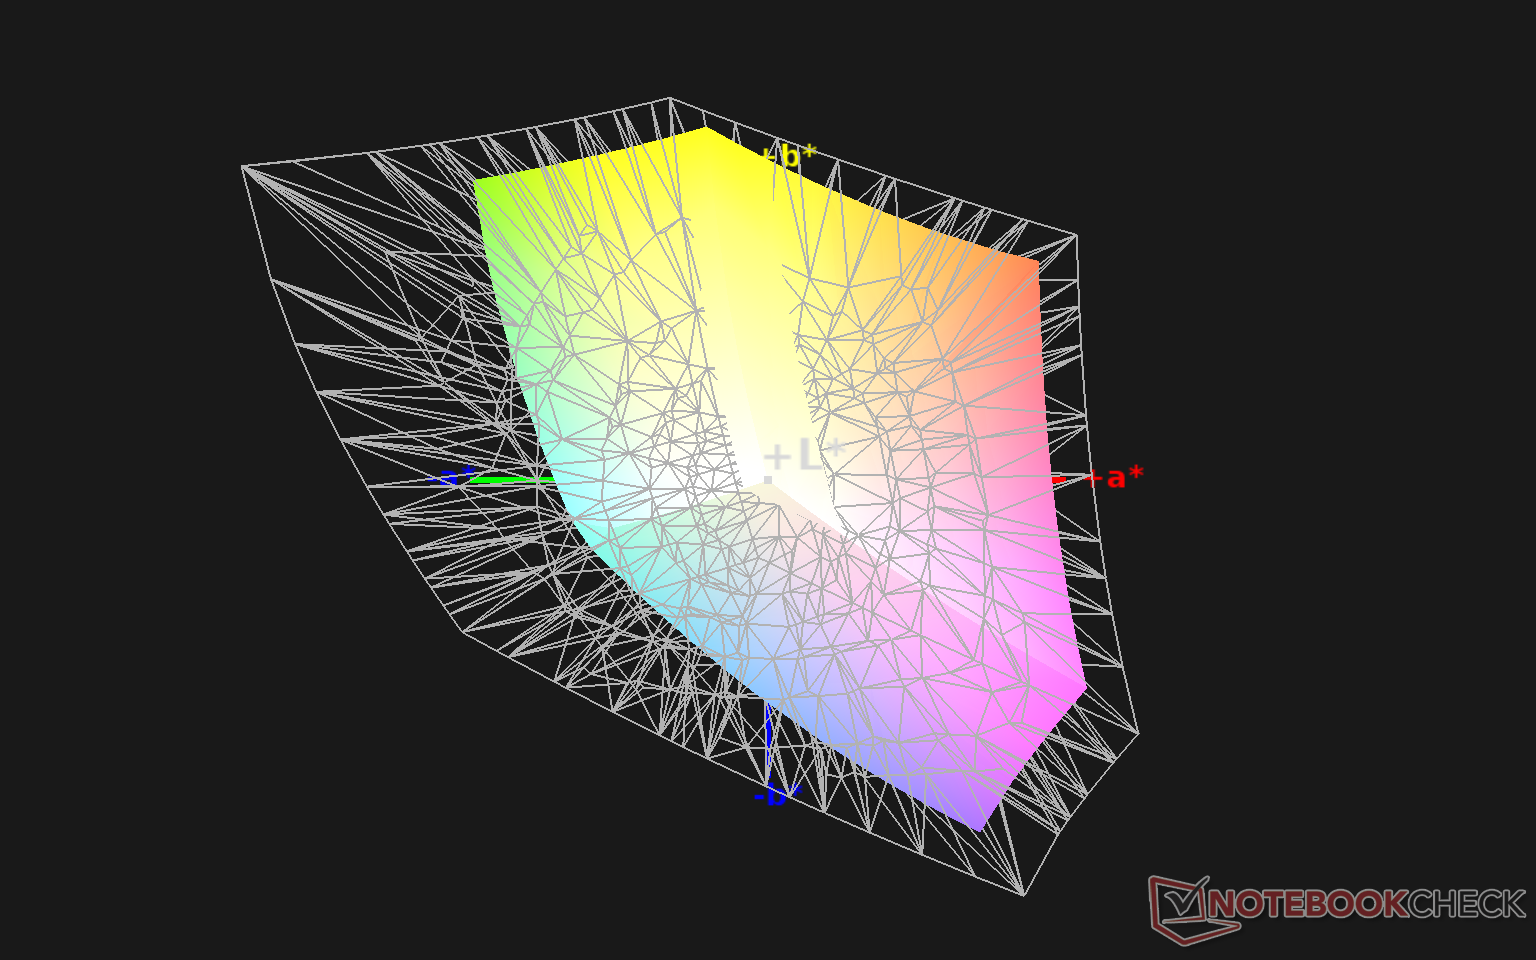
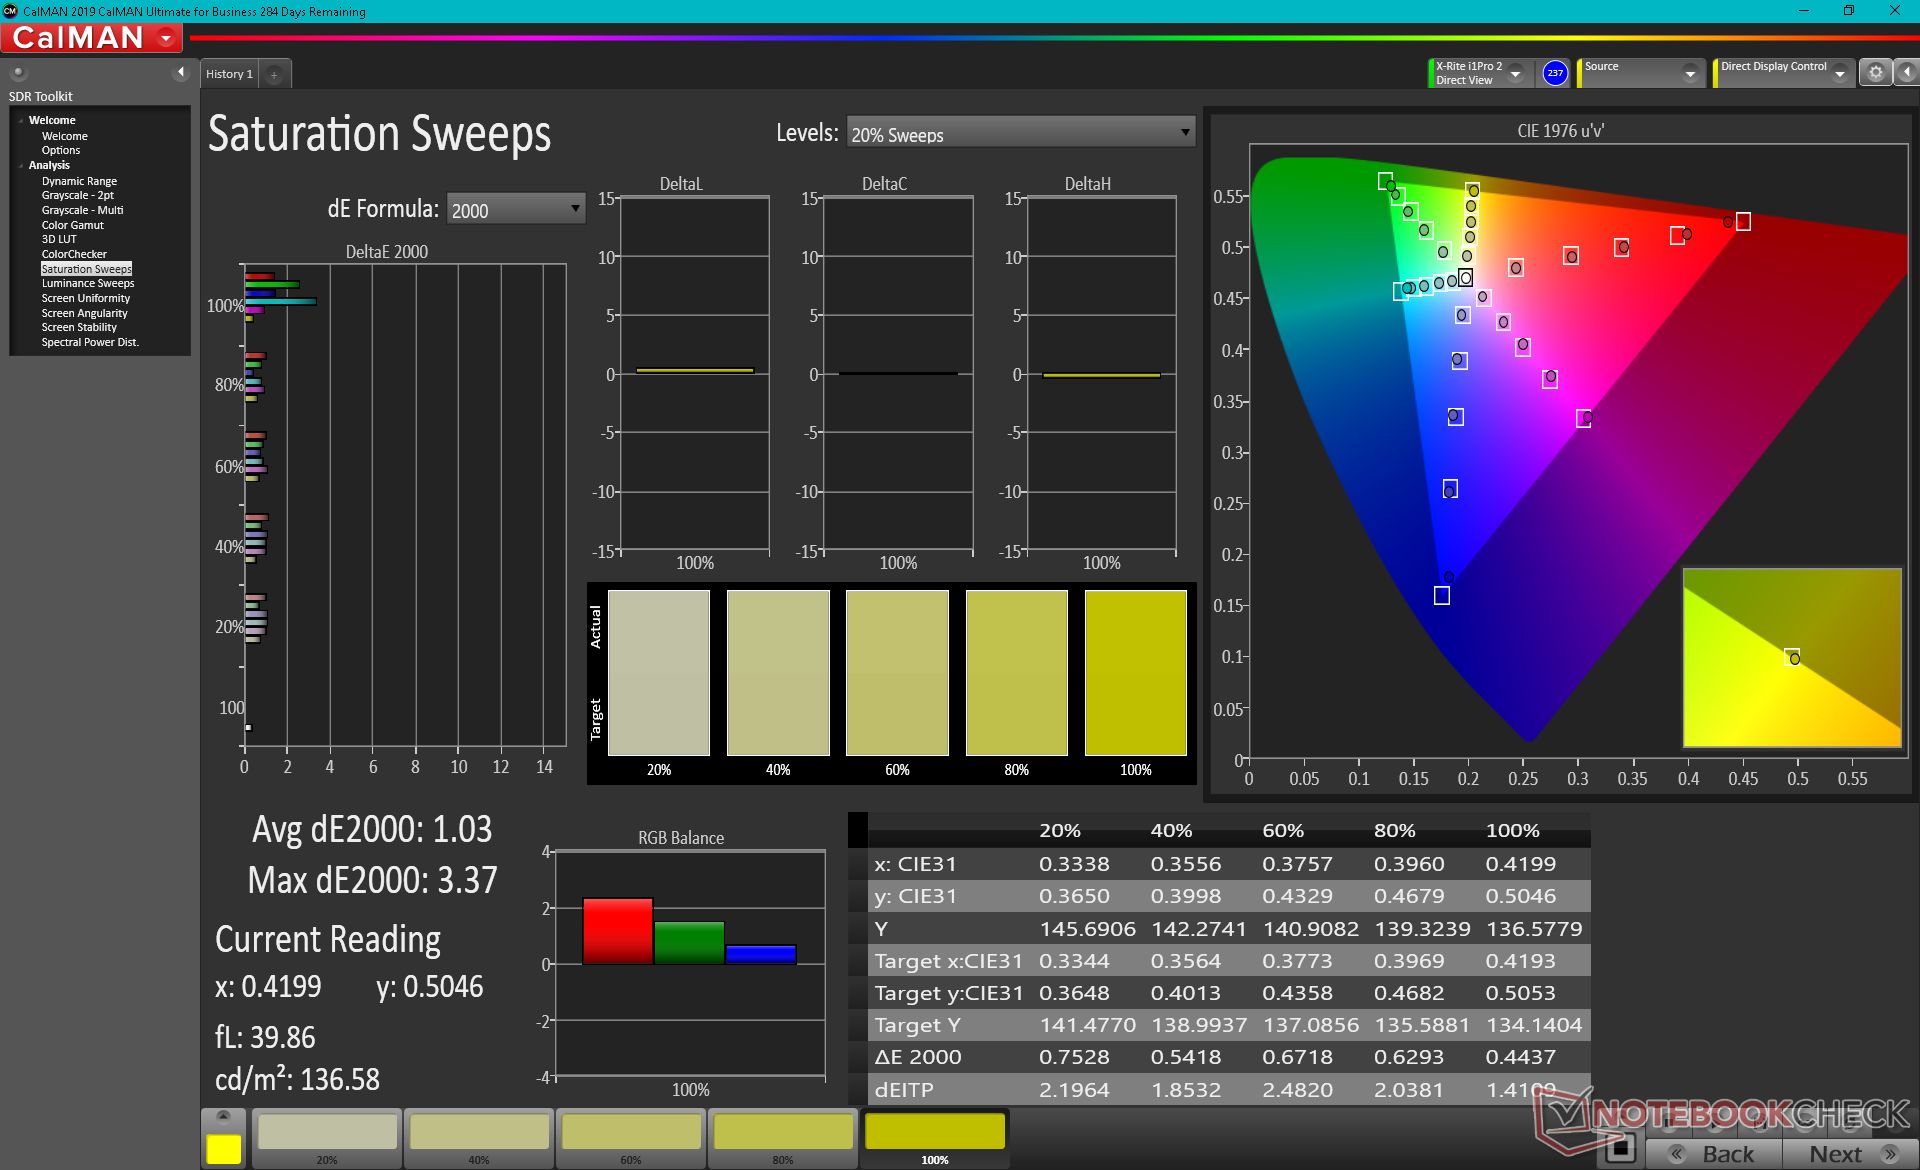
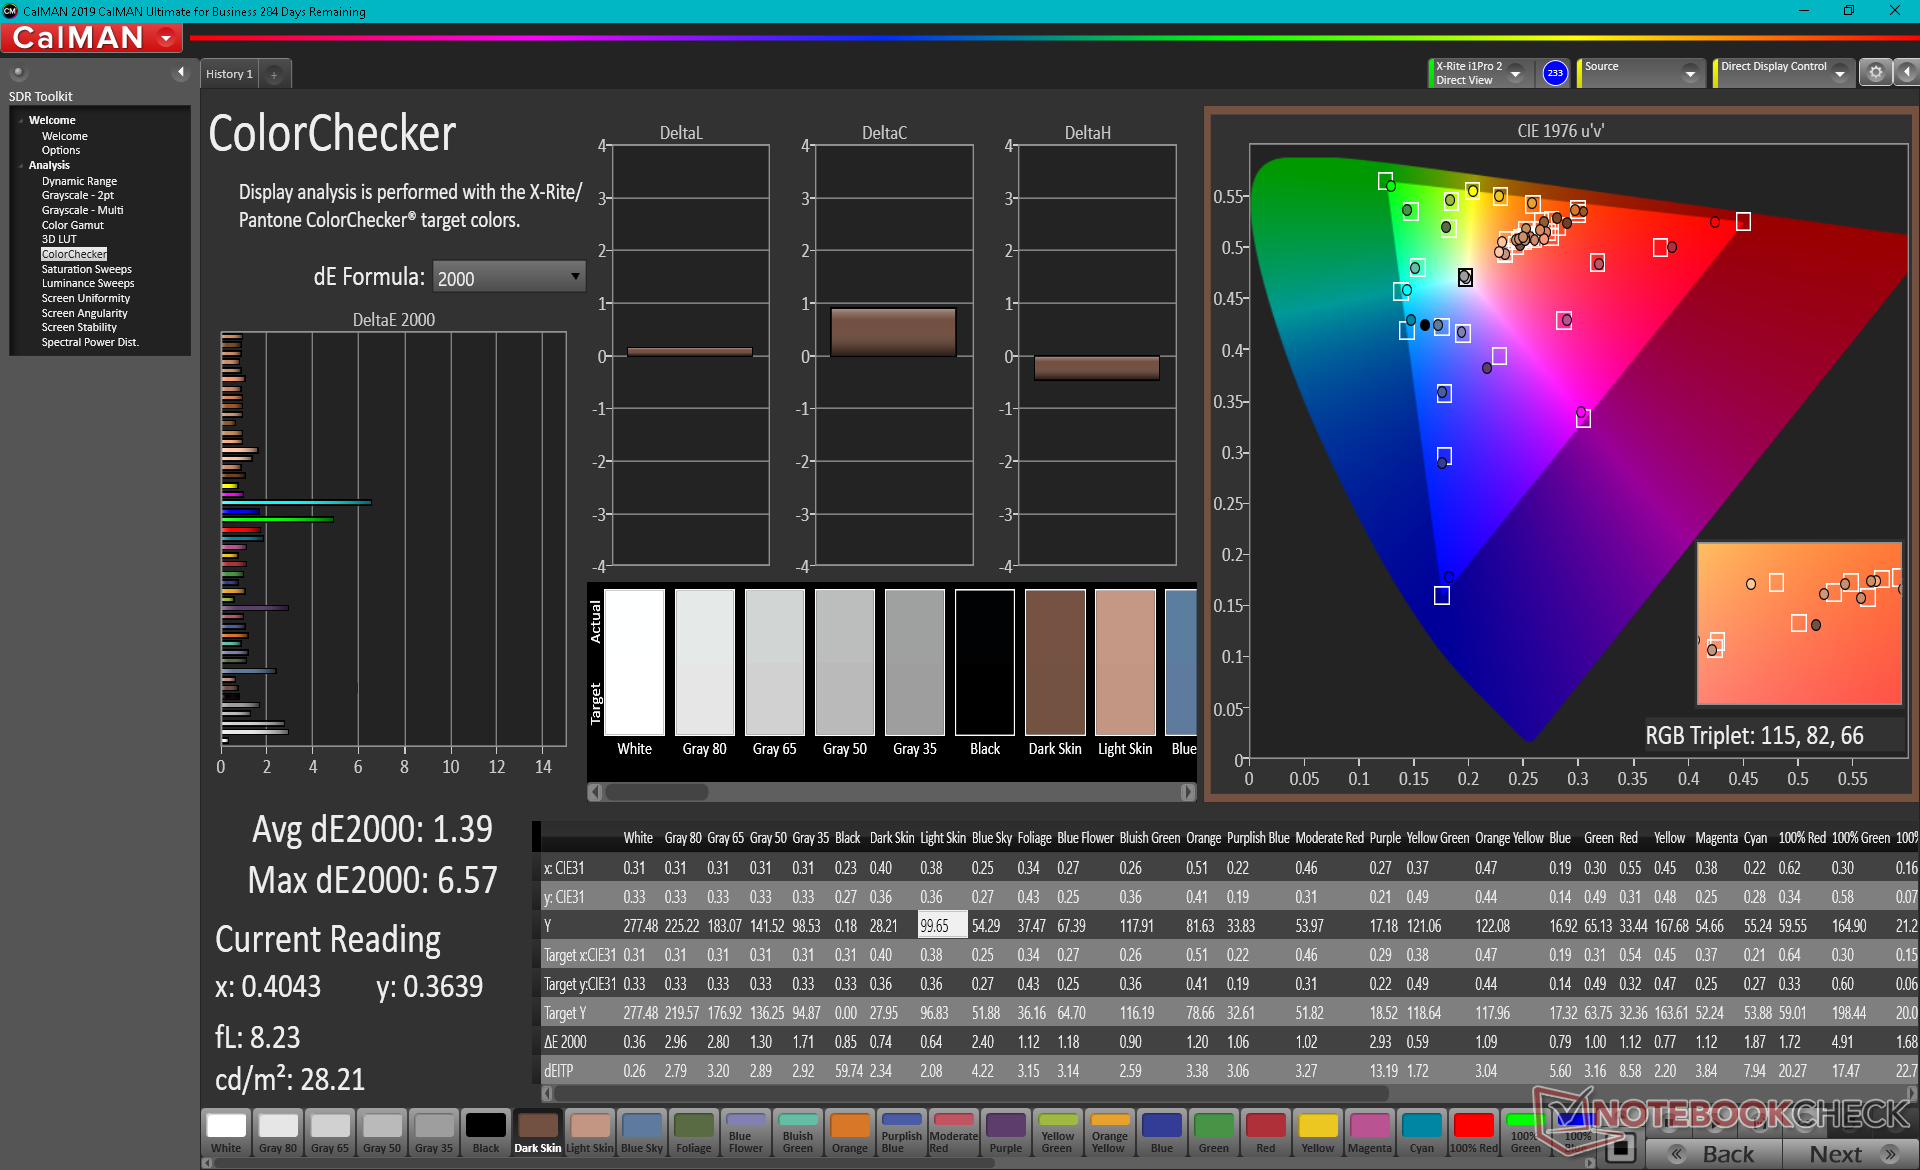
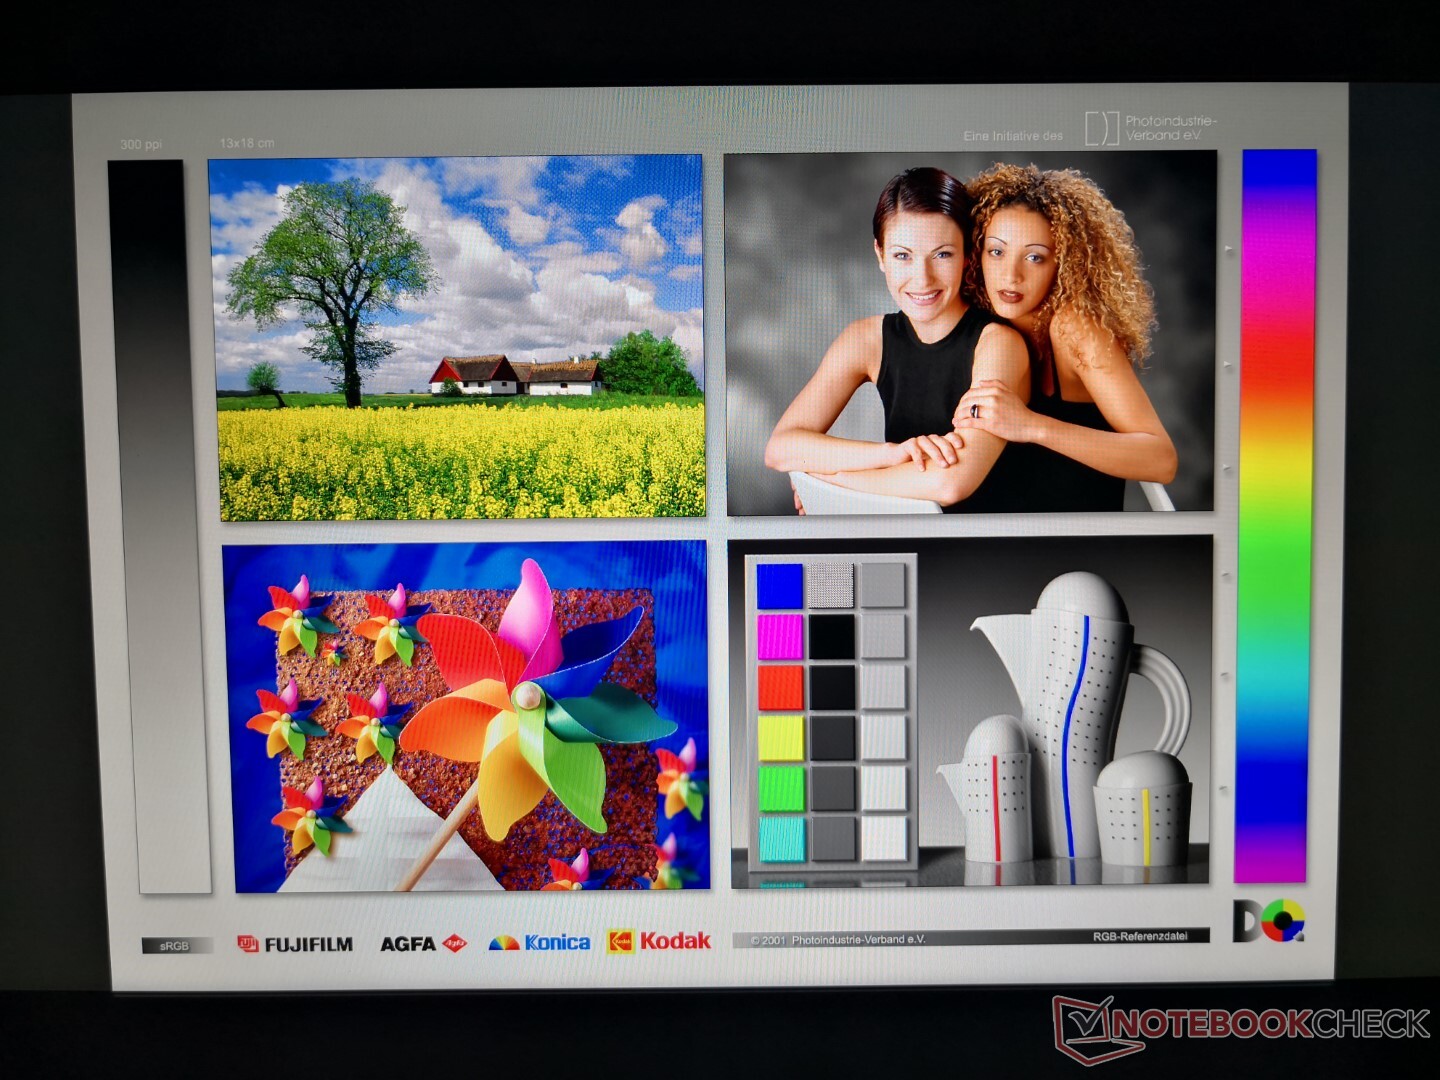
The panel covers almost all of sRGB and approximately 60 percent of AdobeRGB which is standard on most flagship Ultrabooks with 1080p displays. Other laptops with 4K display options like MSI's own Prestige 15 usually offer deeper colors by targeting AdobeRGB instead.
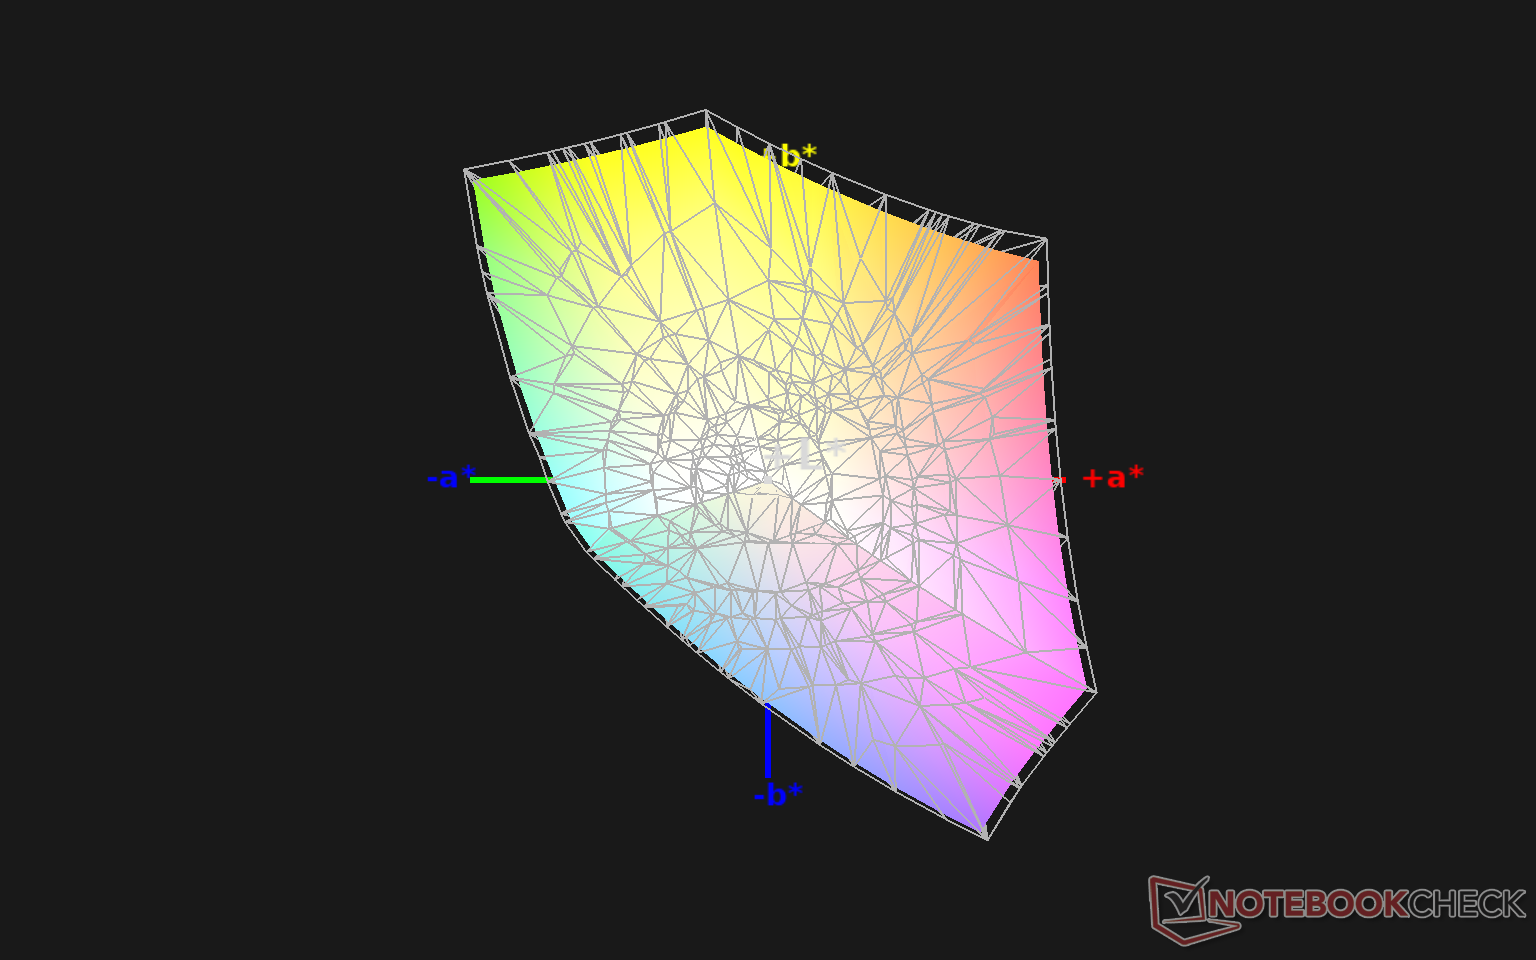
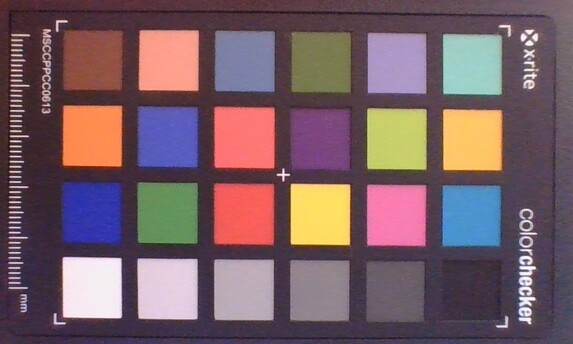
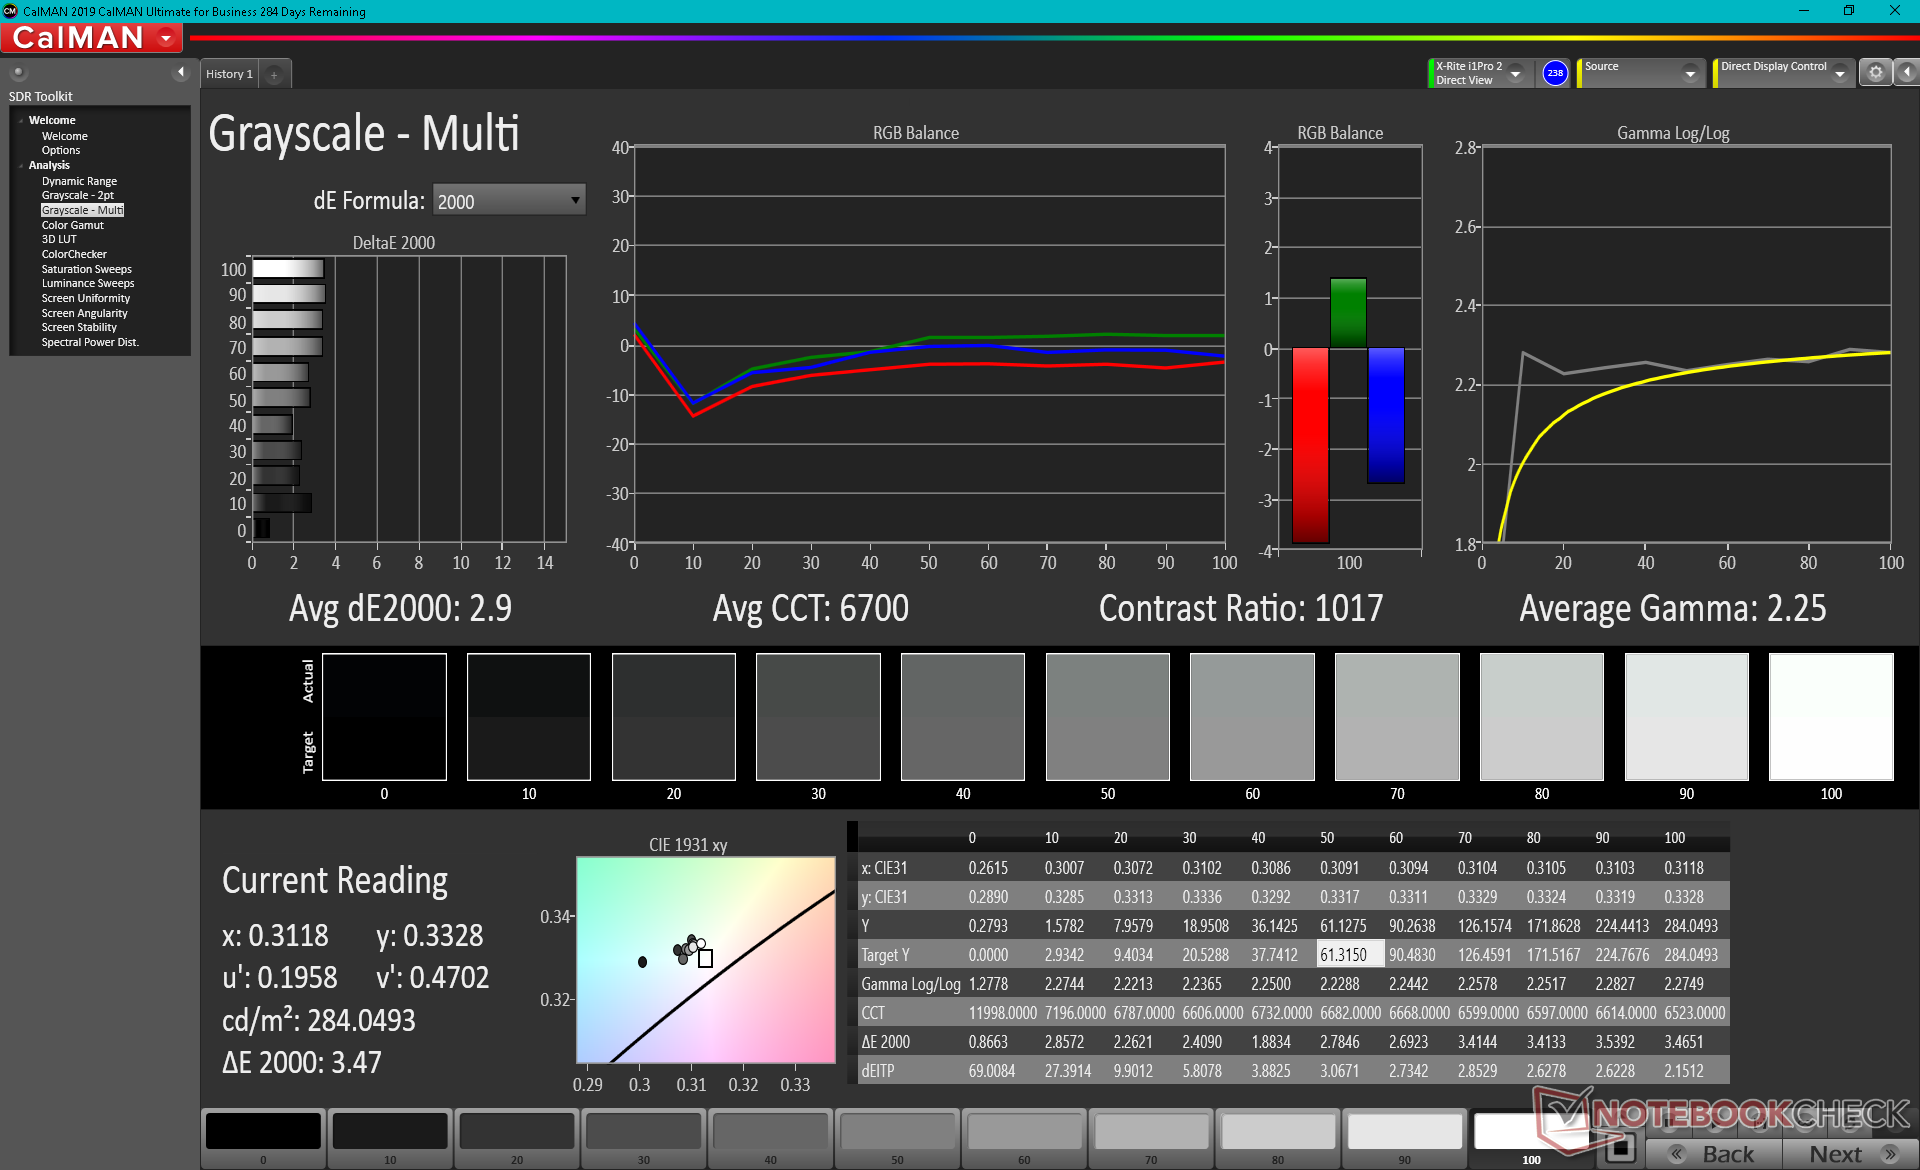
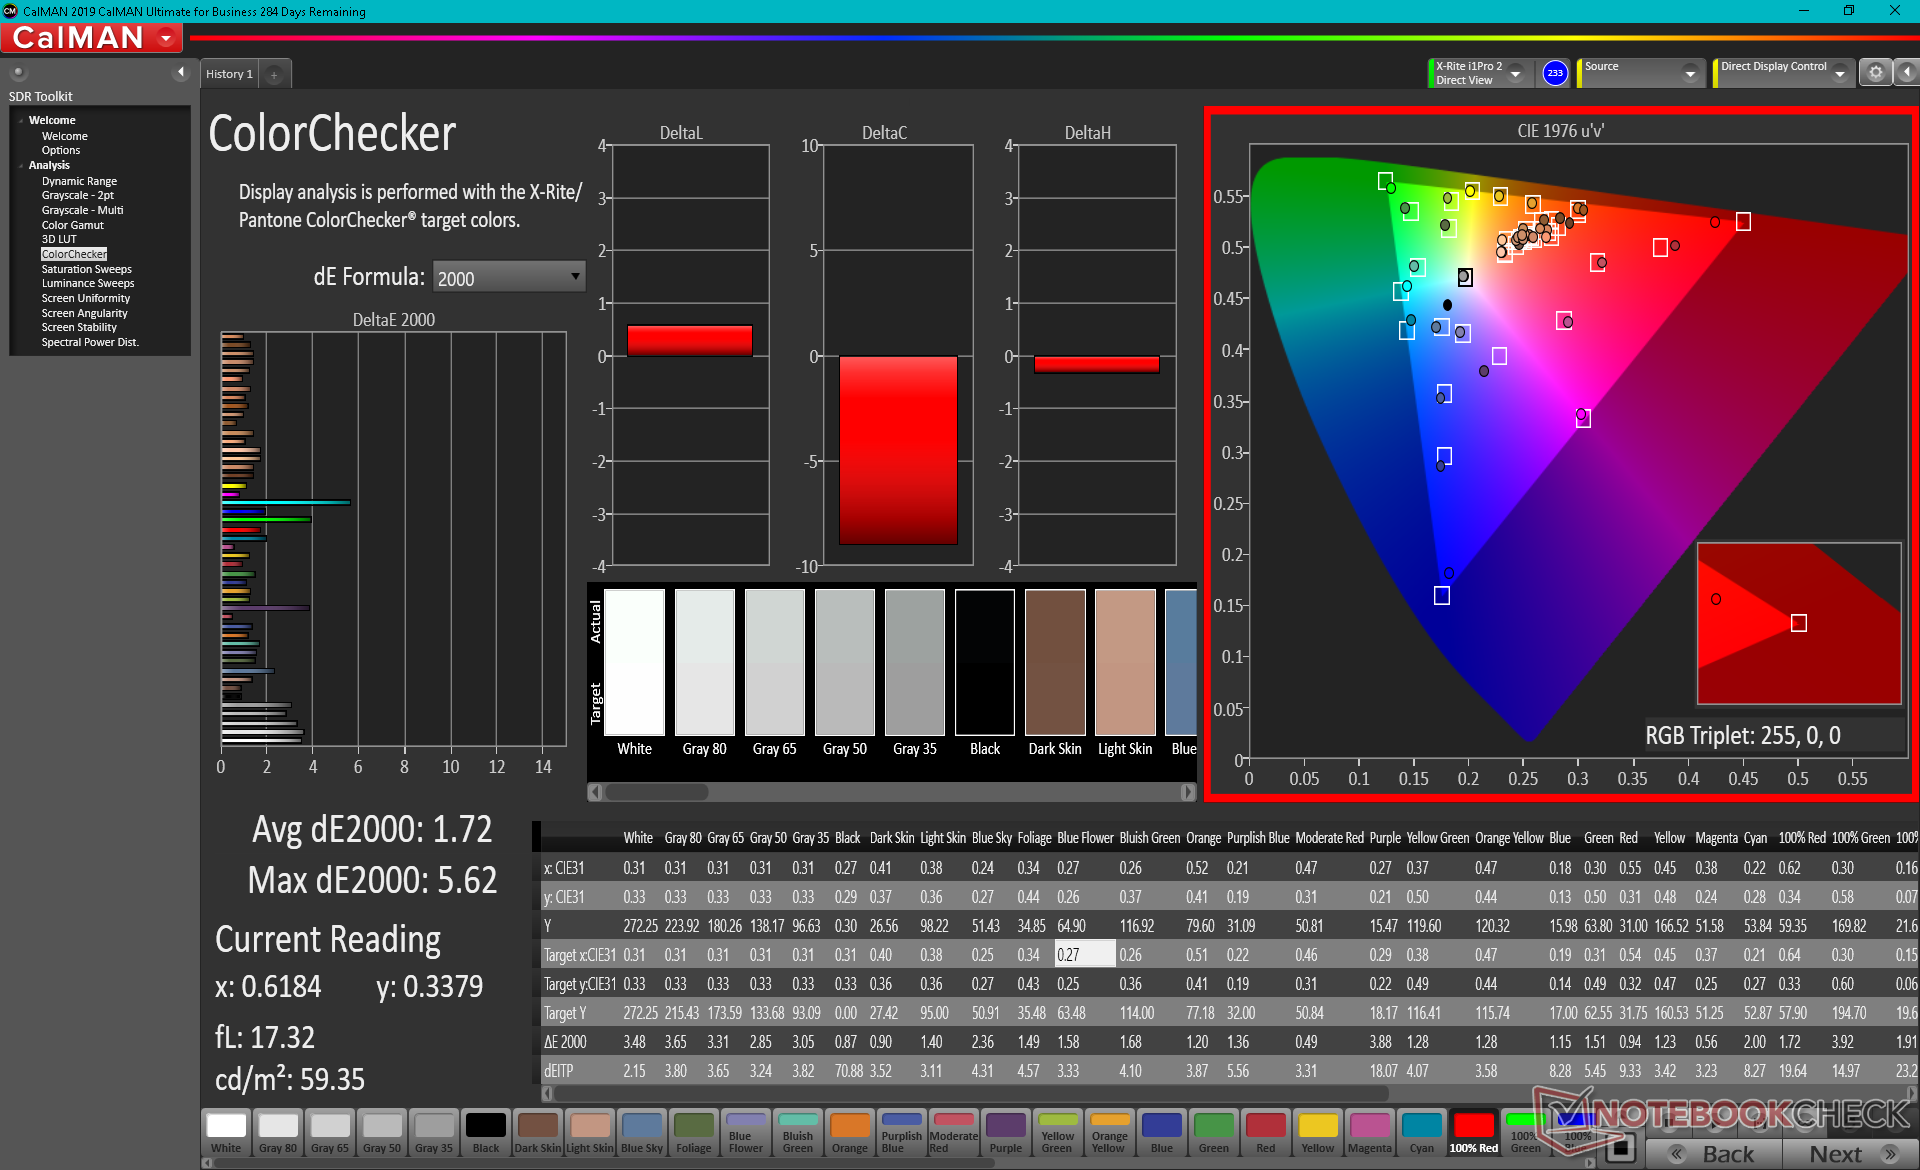
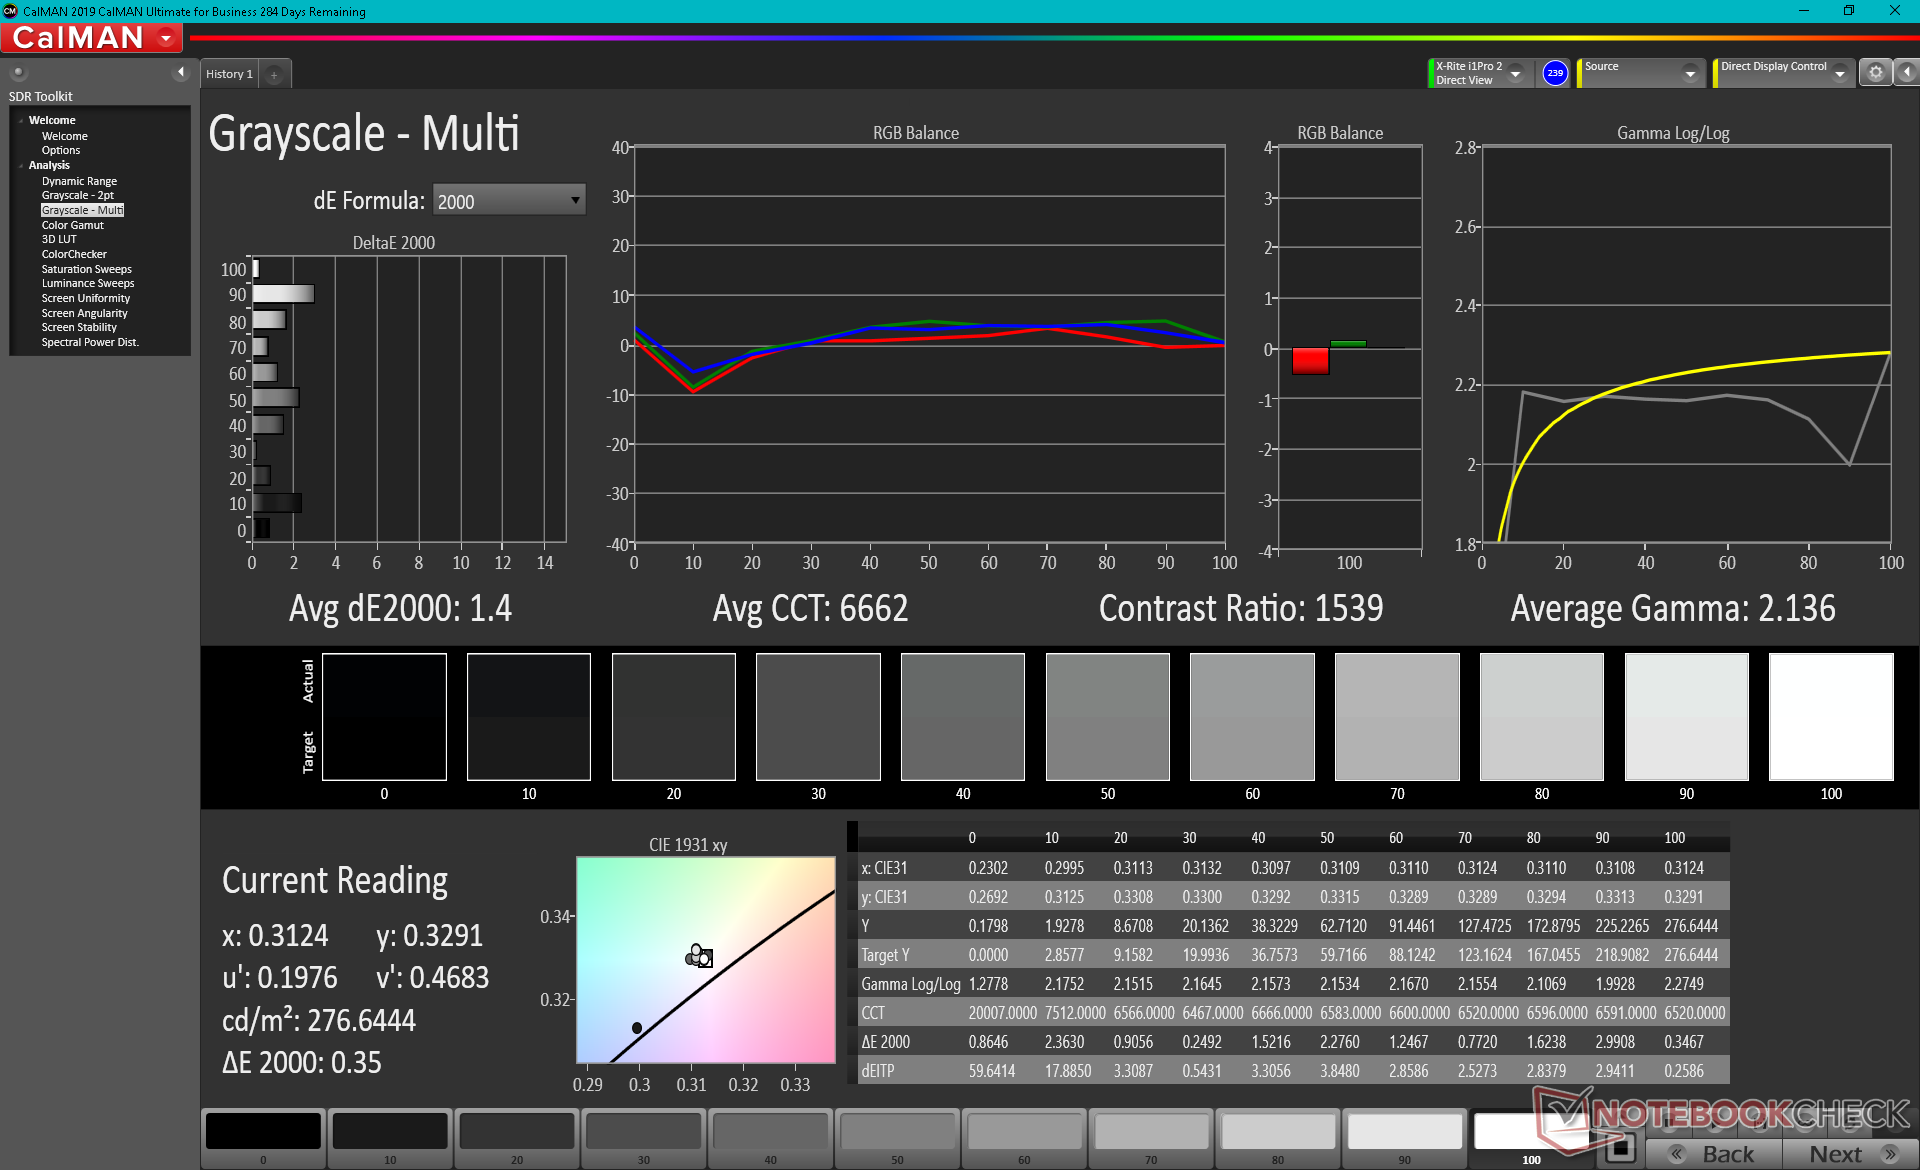
The system is well-calibrated out of the box with average grayscale and ColorChecker deltaE values of just 2.9 and 1.72, respectively. Calibrating the display even further with our X-Rite colorimeter would improve the averages just marginally. Interestingly, teal and green colors are represented more inaccurately than all other colors by wide margins even after calibration.
Display Response Times
| ↔ Response Time Black to White | ||
|---|---|---|
| 35.2 ms ... rise ↗ and fall ↘ combined | ↗ 22 ms rise | 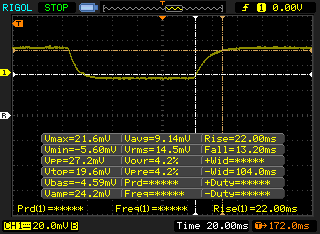 |
| ↘ 13.2 ms fall | ||
| The screen shows slow response rates in our tests and will be unsatisfactory for gamers. In comparison, all tested devices range from 0.1 (minimum) to 240 (maximum) ms. » 92 % of all devices are better. This means that the measured response time is worse than the average of all tested devices (21.5 ms). | ||
| ↔ Response Time 50% Grey to 80% Grey | ||
| 47.6 ms ... rise ↗ and fall ↘ combined | ↗ 25.2 ms rise | 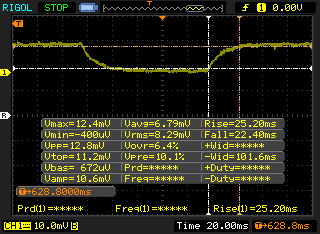 |
| ↘ 22.4 ms fall | ||
| The screen shows slow response rates in our tests and will be unsatisfactory for gamers. In comparison, all tested devices range from 0.2 (minimum) to 636 (maximum) ms. » 79 % of all devices are better. This means that the measured response time is worse than the average of all tested devices (33.7 ms). | ||
Screen Flickering / PWM (Pulse-Width Modulation)
| Screen flickering / PWM detected | 25000 Hz | ≤ 25 % brightness setting | 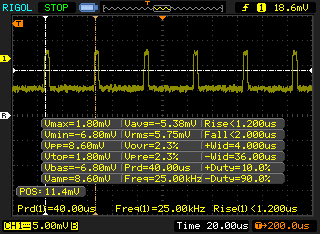 |
The display backlight flickers at 25000 Hz (worst case, e.g., utilizing PWM) Flickering detected at a brightness setting of 25 % and below. There should be no flickering or PWM above this brightness setting. The frequency of 25000 Hz is quite high, so most users sensitive to PWM should not notice any flickering. In comparison: 53 % of all tested devices do not use PWM to dim the display. If PWM was detected, an average of 17898 (minimum: 5 - maximum: 3846000) Hz was measured. | |||
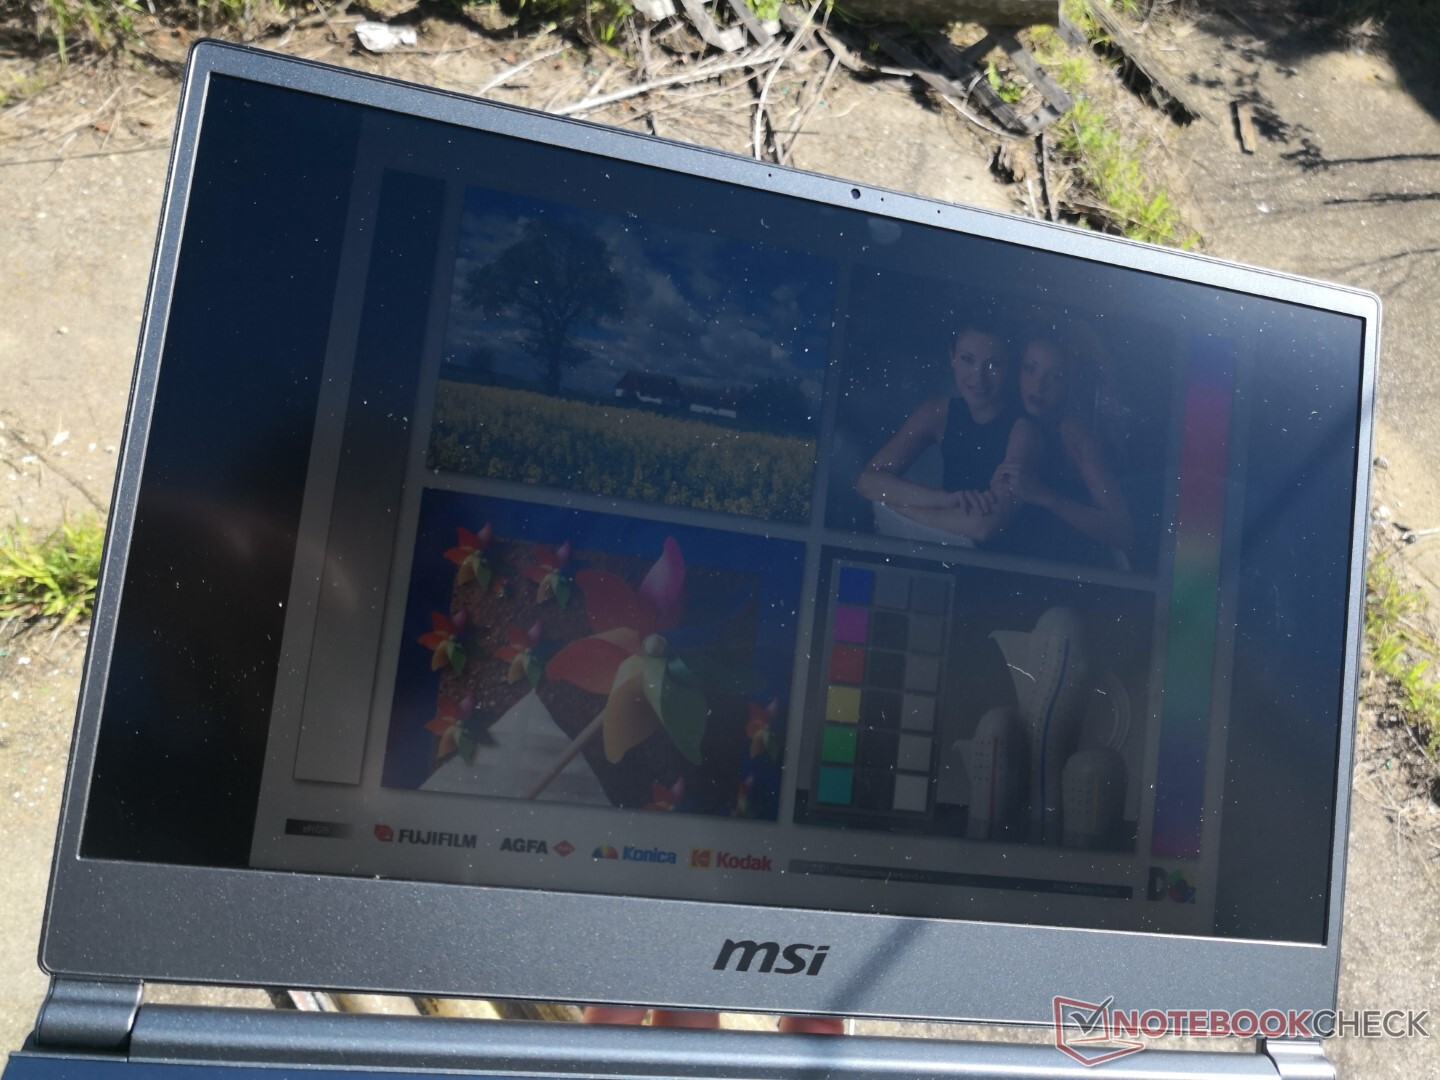
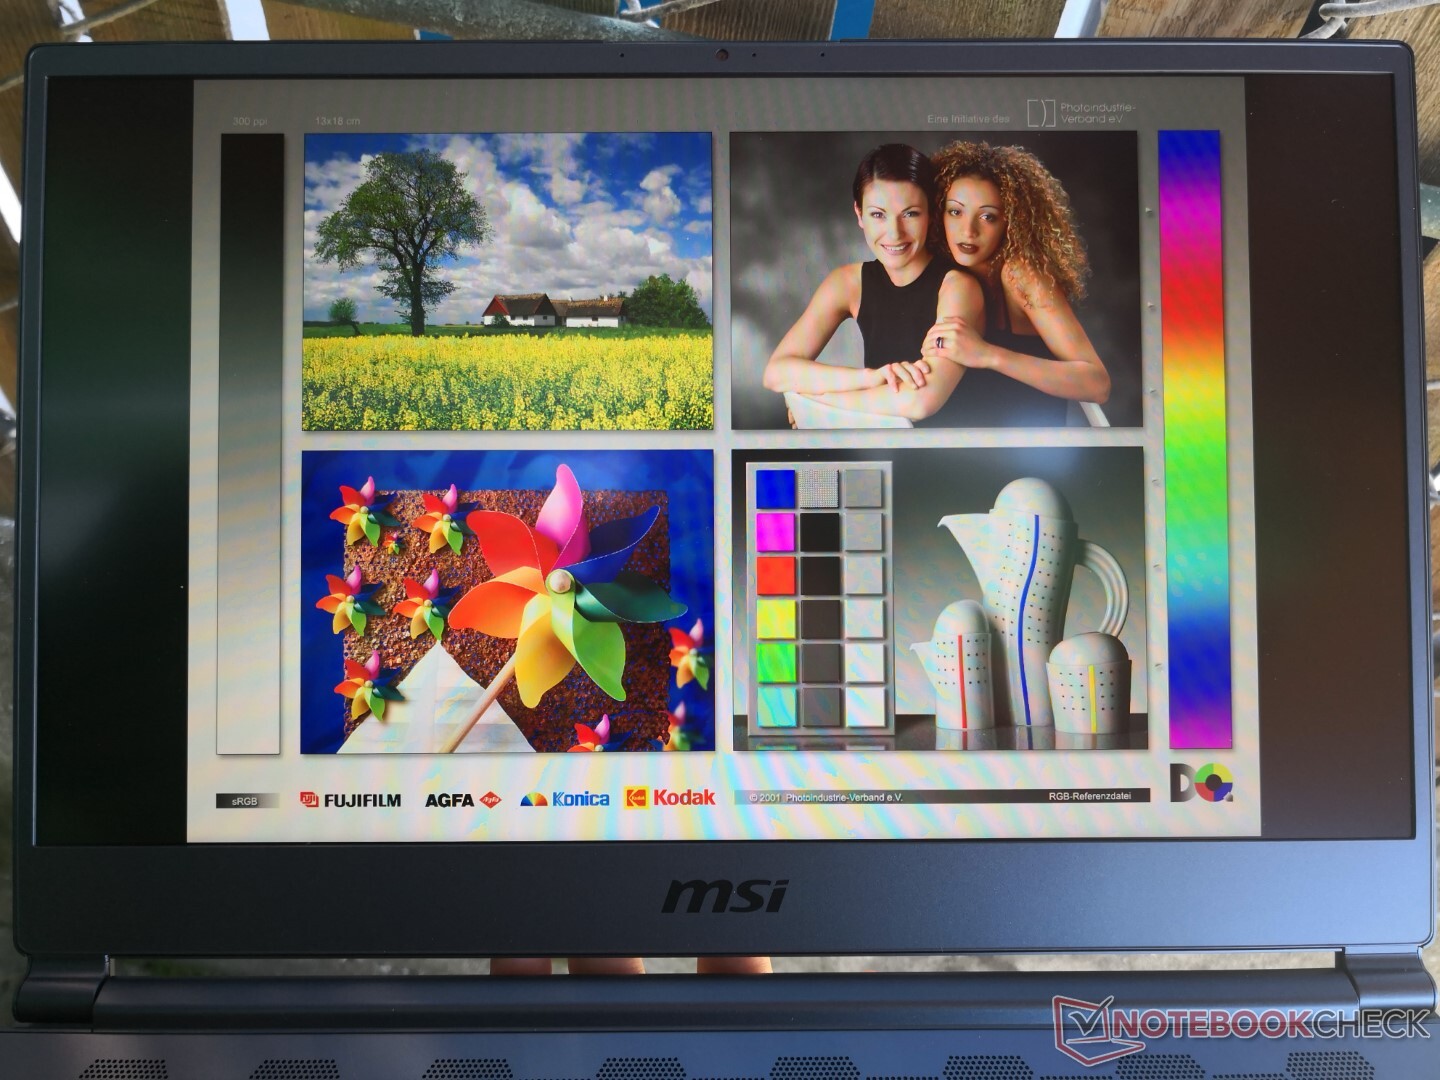
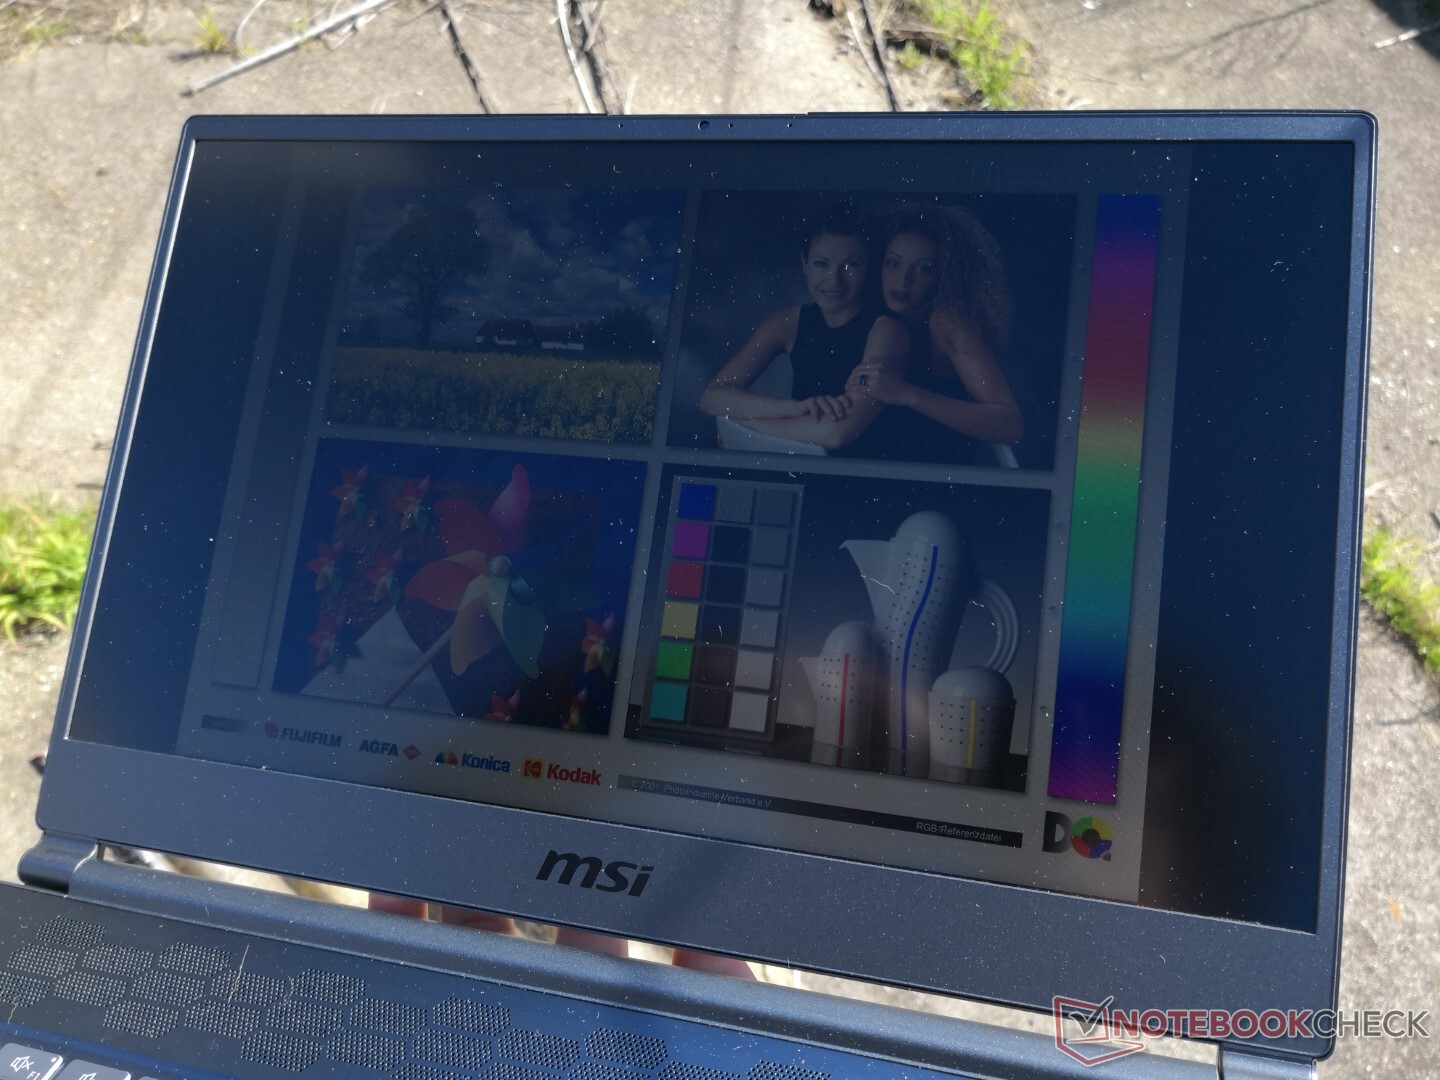
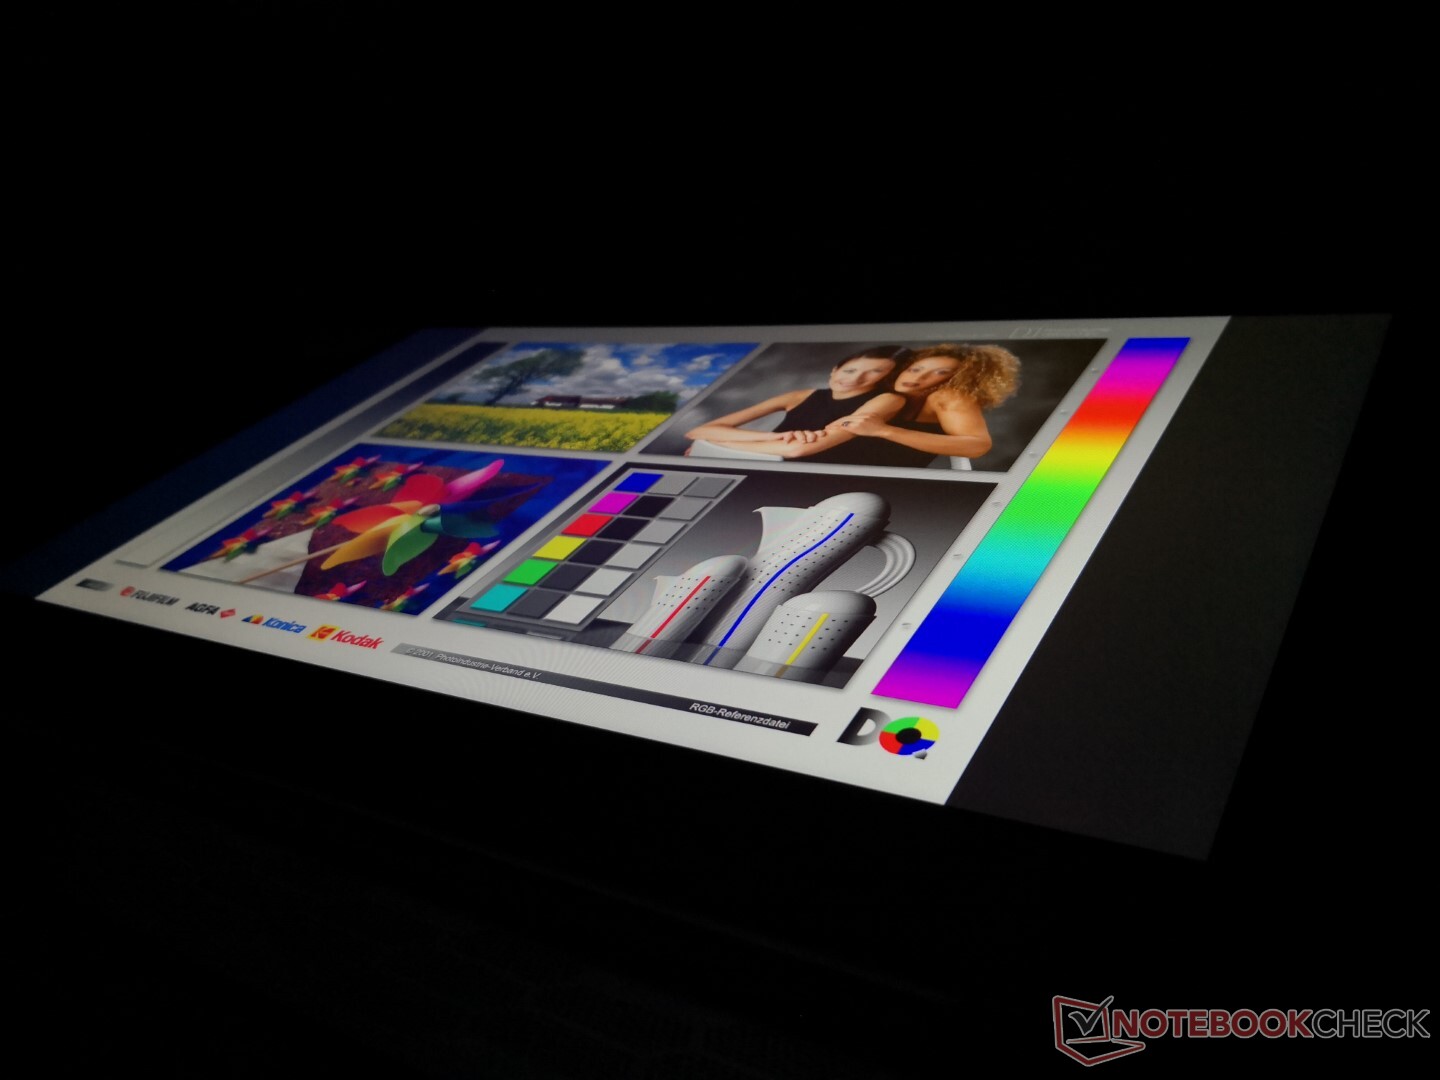
Outdoor visibility is merely average due to the relatively dim maximum brightness level. This is unfortunate because the lightweight chassis design might actually encourage owners to use the Stealth 15M outdoors more often.
Performance
The MSI system is unique in that users have the option to pair the GeForce RTX 2060 Max-Q GPU with a Core U series CPU instead of the more common Core H series. The latest configurations come with even faster processors including the 11th gen Core i7-11375H and Nvidia Ampere GeForce RTX 3060 to replace the older 10th gen CPUs and Turing GPUs.
Our unit was set to Extreme Performance mode via MSI Dragon Center prior to running any performance benchmarks.
Processor
Of the dozen or so laptops we've tested thus far with the same Core i7-1185G7 CPU, our Stealth 15M is one of the fastest with CineBench xT scores that are 12 to 16 percent higher than the average. Its excellent performance can be attributed to the good Turbo Boost sustainability of the CPU as shown by our graph below. The Summit E15 equipped with the same CPU, for example, would run about 15 percent slower than our Stealth 15M after accounting for any performance throttling on both systems. Single-thread performance is even more impressive with CineBench scores outperforming even the Core i7-10875H.
Overall multi-thread performance is still about 23 to 27 percent slower than the more power-hungry octa-core Core i7-10875H or hexa-core Core i7-10750H as found on most high-performance laptops.
Cinebench R15: CPU Multi 64Bit | CPU Single 64Bit
Blender: v2.79 BMW27 CPU
7-Zip 18.03: 7z b 4 -mmt1 | 7z b 4
Geekbench 5.5: Single-Core | Multi-Core
HWBOT x265 Benchmark v2.2: 4k Preset
LibreOffice : 20 Documents To PDF
R Benchmark 2.5: Overall mean
Cinebench R15: CPU Multi 64Bit | CPU Single 64Bit
Blender: v2.79 BMW27 CPU
7-Zip 18.03: 7z b 4 -mmt1 | 7z b 4
Geekbench 5.5: Single-Core | Multi-Core
HWBOT x265 Benchmark v2.2: 4k Preset
LibreOffice : 20 Documents To PDF
R Benchmark 2.5: Overall mean
* ... smaller is better
System Performance
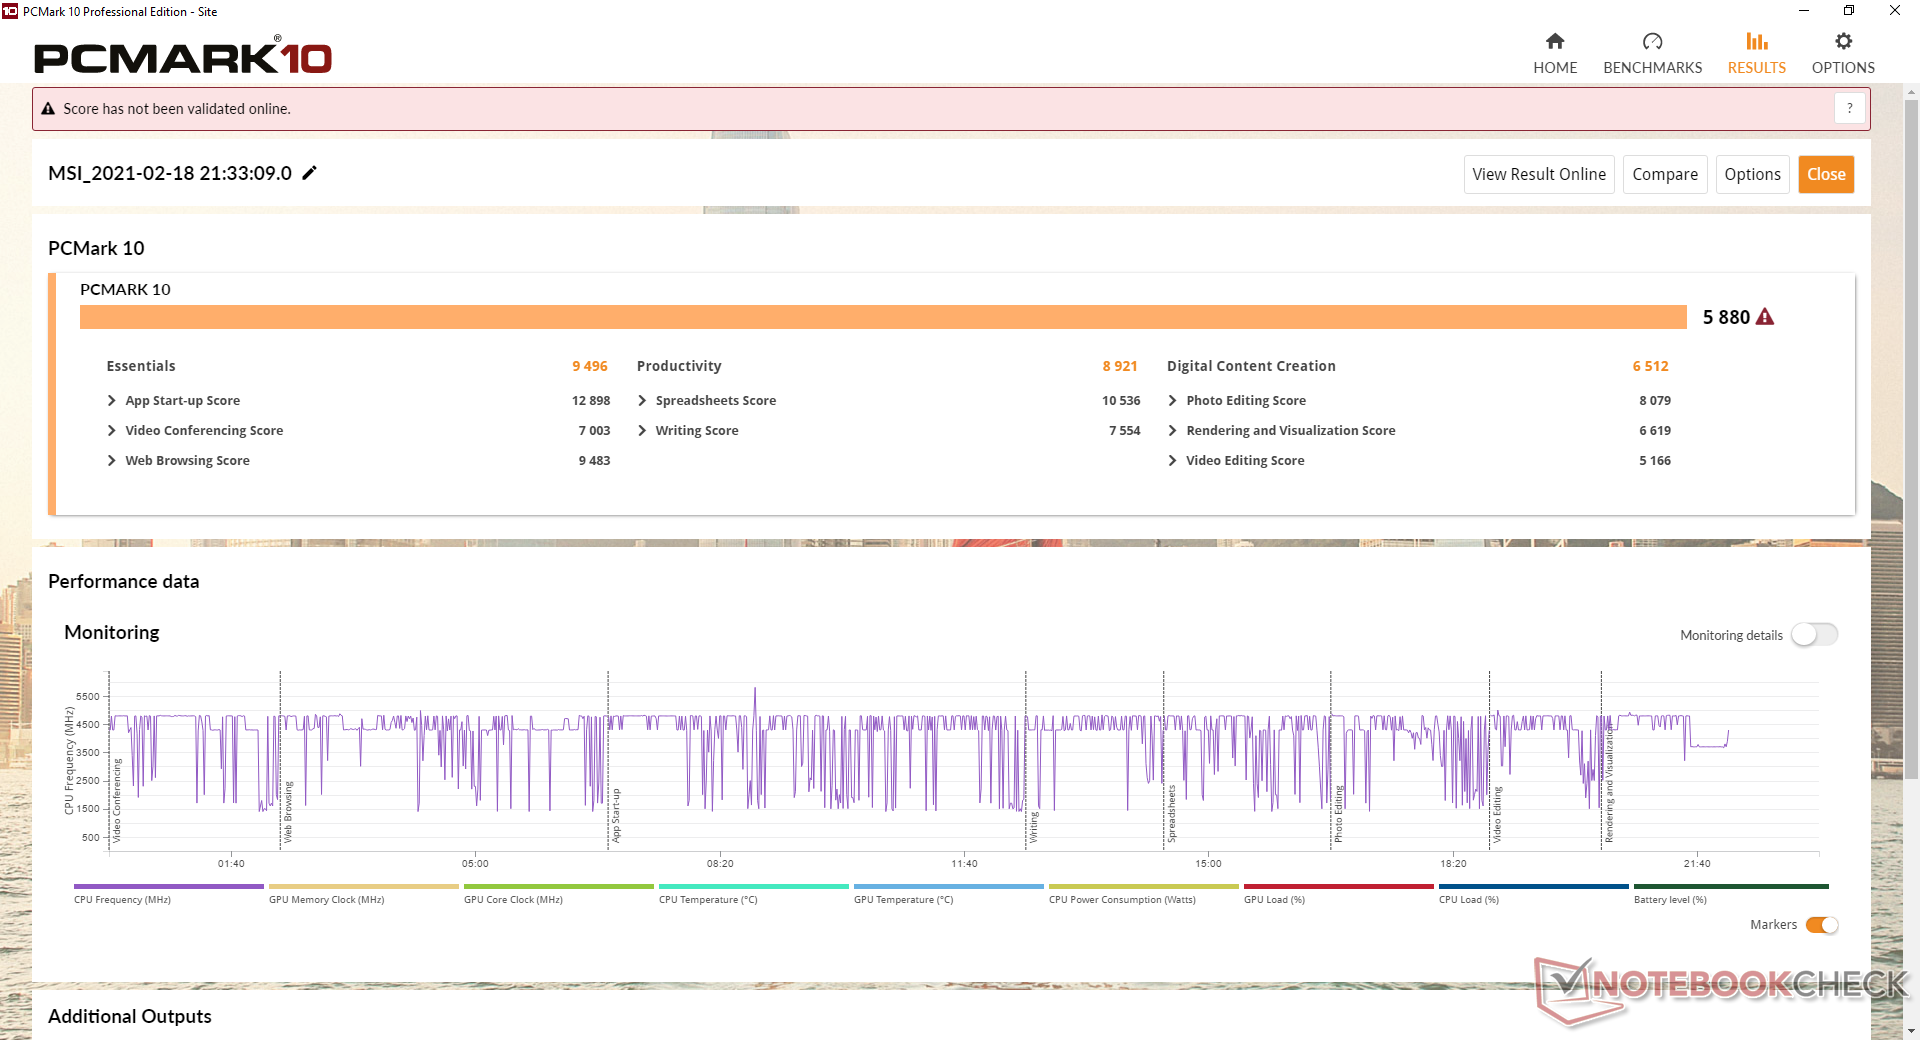
PCMark benchmarks are higher than most other Core H-series multimedia laptops due to the faster GeForce RTX GPU and high performance-per-watt from the CPU.
We didn't experience any software issues during our time with the test unit. Owners should become familiar with the MSI Dragon Center software as it is a control center for most of the system's settings.
| PCMark 10 Score | 5880 points | |
Help | ||
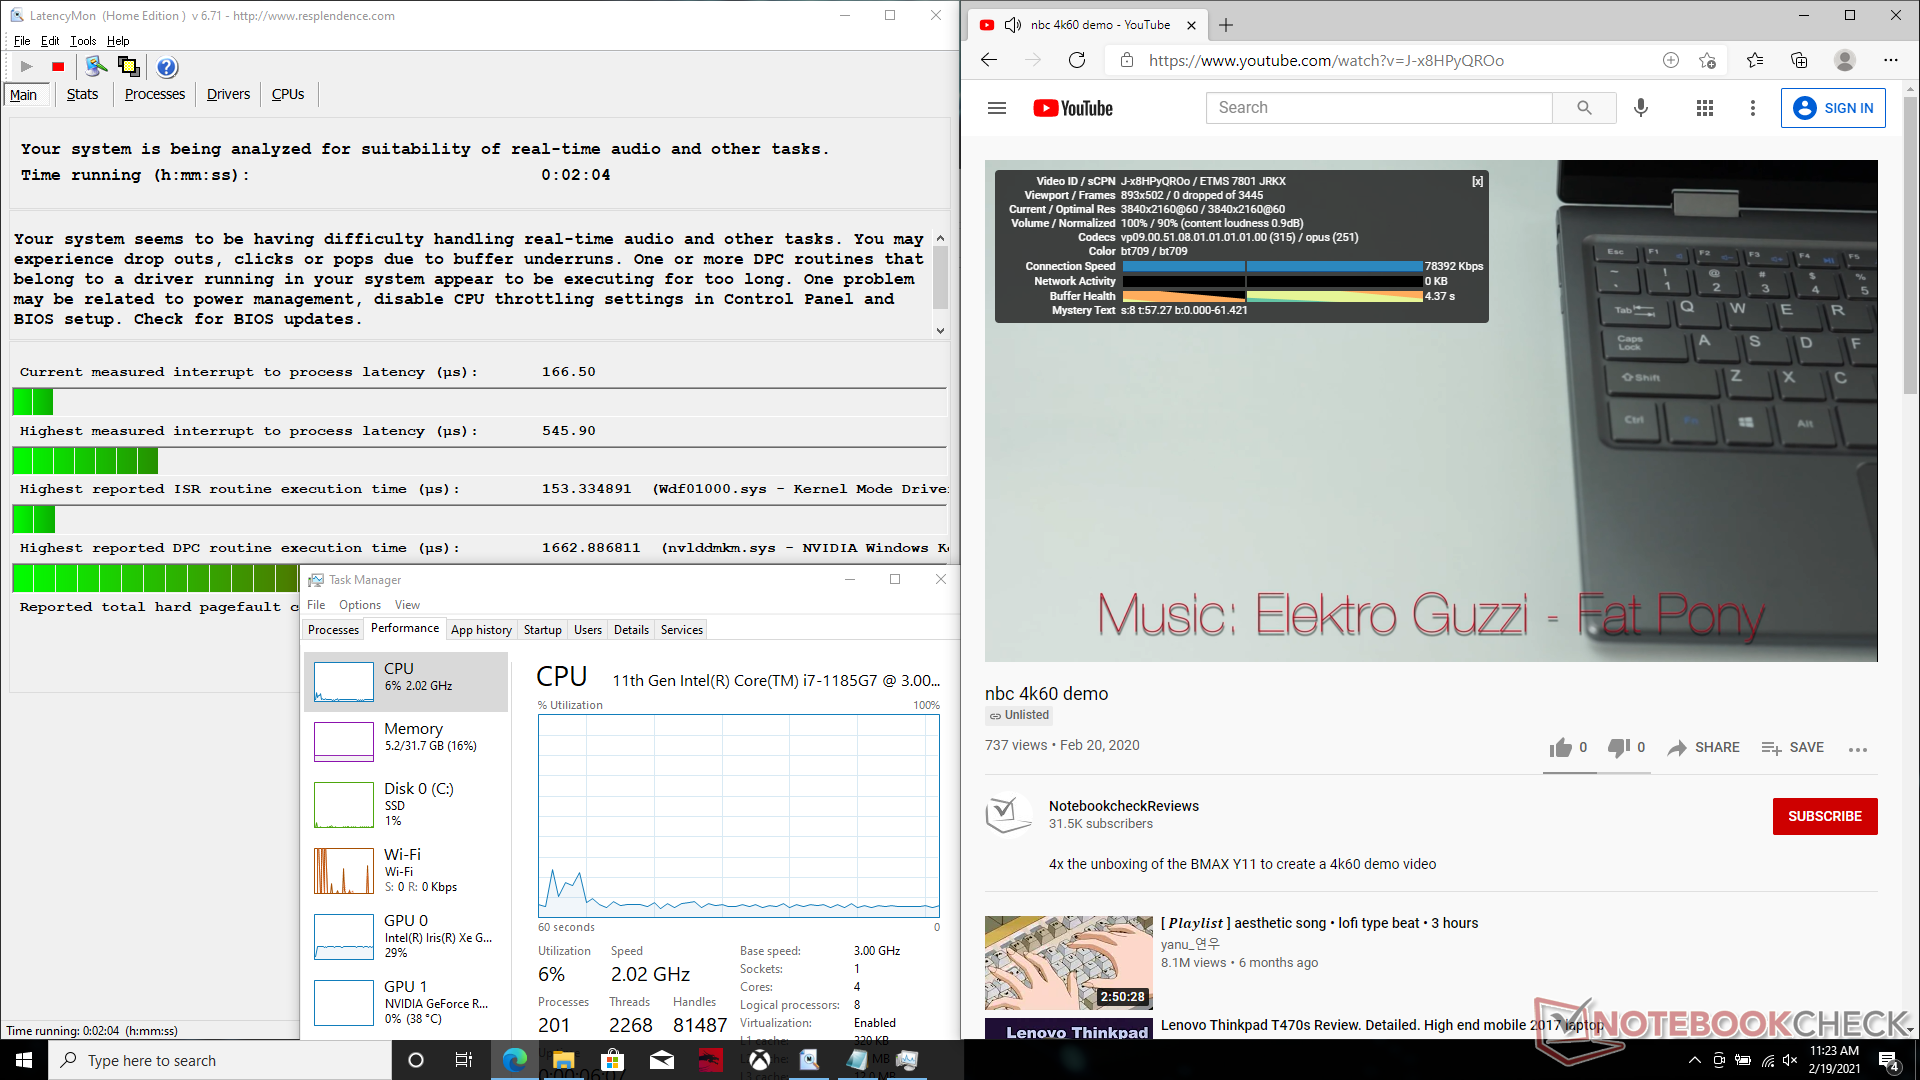
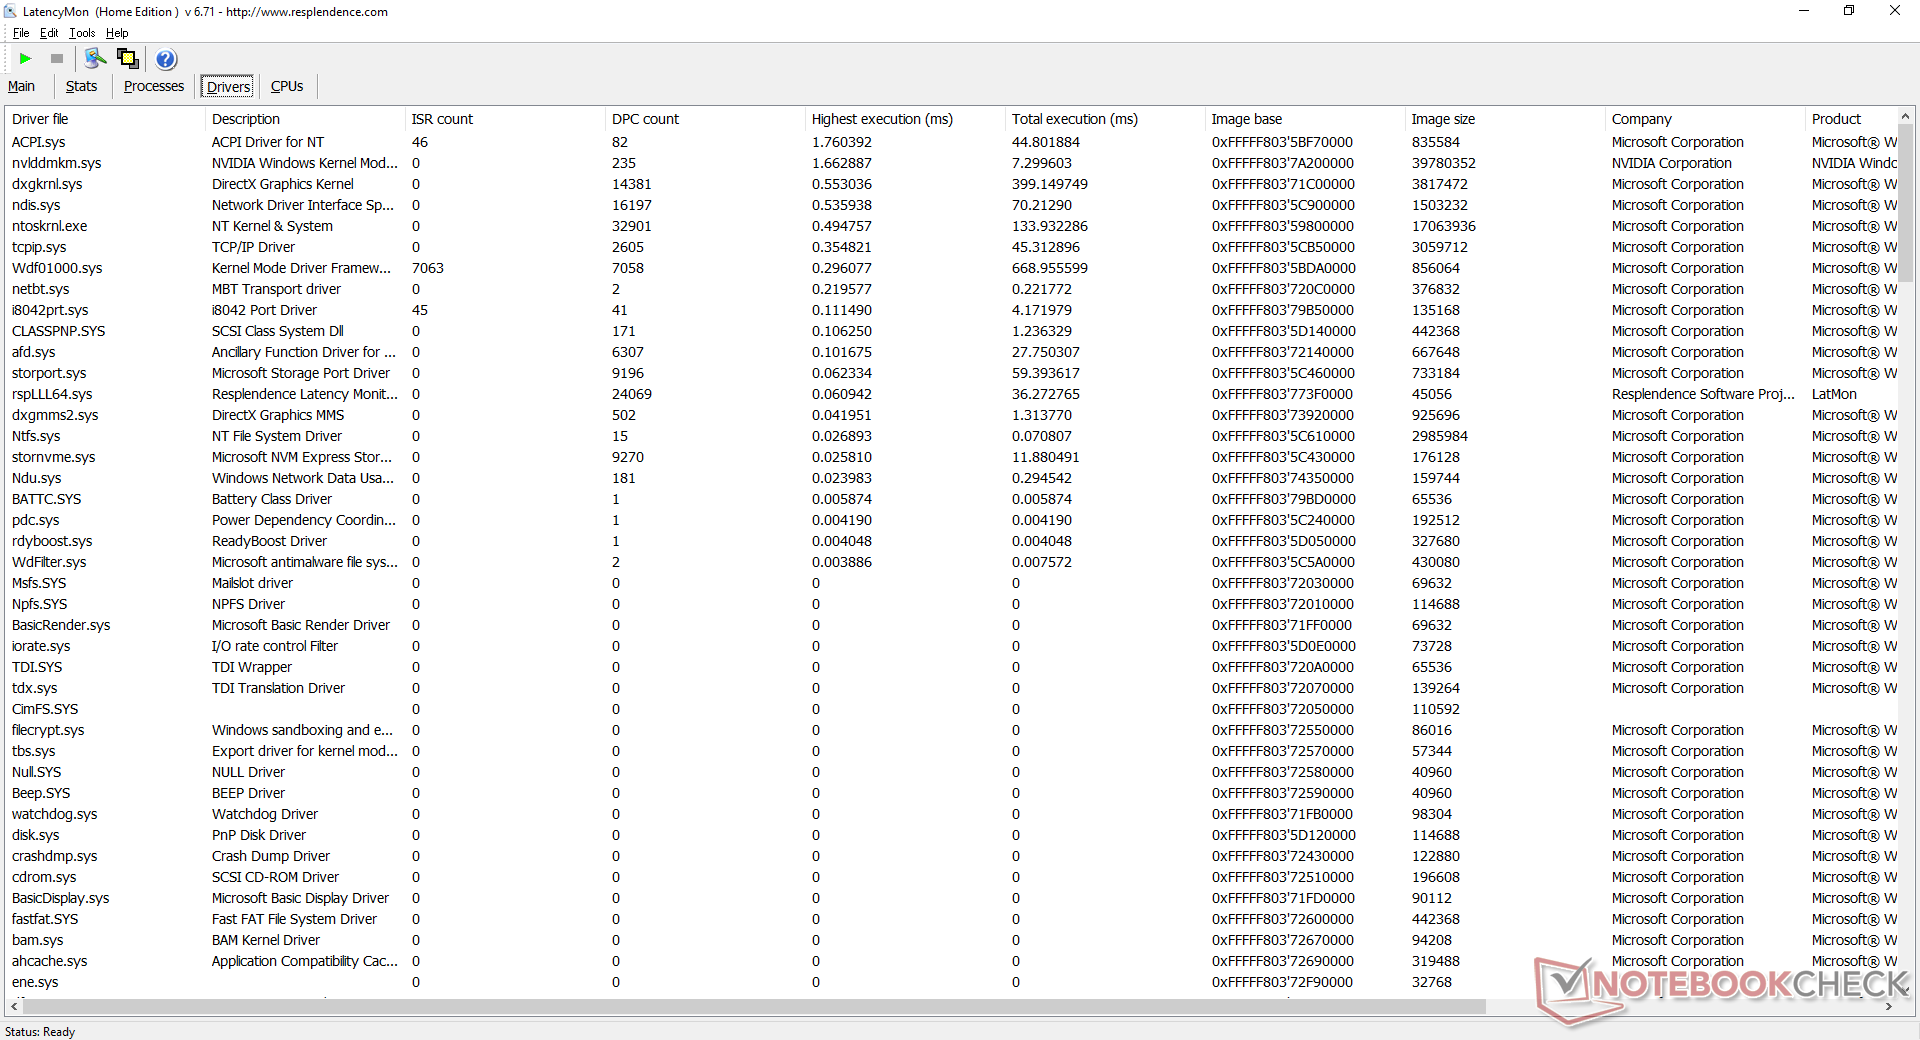
DPC Latency
LatencyMon reveals DPC latency issues related to nvlddmkm.sys when opening multiple browser tabs on our homepage. 4K video playback at 60 FPS is otherwise smooth and with no dropped frames.
| DPC Latencies / LatencyMon - interrupt to process latency (max), Web, Youtube, Prime95 | |
| Dell XPS 15 9500 Core i7 4K UHD | |
| Lenovo ThinkPad T15p-20TN0006GE | |
| Asus ZenBook UX535-M01440 | |
| MSI Stealth 15M A11SEK | |
* ... smaller is better
Storage Devices
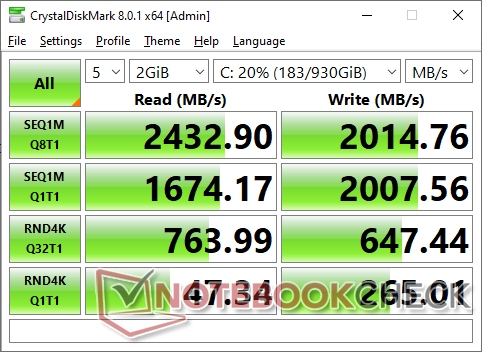
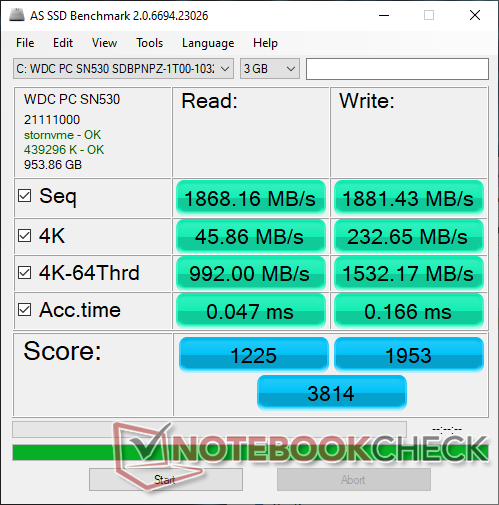
Internal storage options are limited to just a single M.2 PCIe 3.0 x4 slot. Our test unit comes with a 1 TB WD SN530 which is a mid-range NVMe SSD in contrast to the higher-end SN750 series. Sequential read and write rates are still very good at about 2400 MB/s and 2000 MB/s, respectively, compared to >3000 MB/s on more expensive drives.
| MSI Stealth 15M A11SEK WDC PC SN530 SDBPNPZ-1T00 | HP Spectre X360 15-5ZV31AV Intel SSD 660p 2TB SSDPEKNW020T8 | Dell XPS 15 9500 Core i7 4K UHD SK Hynix PC611 512GB | Asus ZenBook UX535-M01440 WDC PC SN730 SDBPNTY-1T00 | MSI Prestige 15 A10SC Samsung SSD PM981 MZVLB1T0HALR | |
|---|---|---|---|---|---|
| AS SSD | -26% | -16% | -11% | 4% | |
| Seq Read | 1868 | 1220 -35% | 2072 11% | 1886 1% | 1274 -32% |
| Seq Write | 1881 | 1152 -39% | 1486 -21% | 1221 -35% | 1395 -26% |
| 4K Read | 45.86 | 52.3 14% | 47.41 3% | 41.16 -10% | 50.3 10% |
| 4K Write | 232.6 | 146.6 -37% | 117.6 -49% | 101.2 -56% | 119.8 -48% |
| 4K-64 Read | 992 | 652 -34% | 967 -3% | 1022 3% | 1599 61% |
| 4K-64 Write | 1532 | 847 -45% | 715 -53% | 1618 6% | 1455 -5% |
| Access Time Read * | 0.047 | 0.077 -64% | 0.057 -21% | 0.058 -23% | 0.044 6% |
| Access Time Write * | 0.166 | 0.106 36% | 0.096 42% | 0.037 78% | 0.092 45% |
| Score Read | 1225 | 826 -33% | 1222 0% | 1252 2% | 1777 45% |
| Score Write | 1953 | 1109 -43% | 981 -50% | 1841 -6% | 1714 -12% |
| Score Total | 3814 | 2371 -38% | 2809 -26% | 3706 -3% | 4411 16% |
| Copy ISO MB/s | 2320 | 2070 -11% | 1999 -14% | 1611 -31% | 2830 22% |
| Copy Program MB/s | 681 | 571 -16% | 627 -8% | 509 -25% | 609 -11% |
| Copy Game MB/s | 1588 | 1219 -23% | 1001 -37% | 677 -57% | 1424 -10% |
| CrystalDiskMark 5.2 / 6 | -20% | -9% | -10% | -30% | |
| Write 4K | 262.6 | 151.5 -42% | 123.3 -53% | 110 -58% | 150.8 -43% |
| Read 4K | 45.41 | 59.3 31% | 41.85 -8% | 43.44 -4% | 47.3 4% |
| Write Seq | 2001 | 1424 -29% | 2054 3% | 1957 -2% | 981 -51% |
| Read Seq | 1659 | 1609 -3% | 1617 -3% | 1615 -3% | 976 -41% |
| Write 4K Q32T1 | 648 | 393.6 -39% | 413 -36% | 341.6 -47% | 442.7 -32% |
| Read 4K Q32T1 | 767 | 369.4 -52% | 377.5 -51% | 364.3 -53% | 499.7 -35% |
| Write Seq Q32T1 | 2002 | 1946 -3% | 2705 35% | 3081 54% | 1706 -15% |
| Read Seq Q32T1 | 2415 | 1934 -20% | 3442 43% | 3251 35% | 1758 -27% |
| Total Average (Program / Settings) | -23% /
-24% | -13% /
-13% | -11% /
-11% | -13% /
-8% |
* ... smaller is better

Disk Throttling: DiskSpd Read Loop, Queue Depth 8
GPU Performance
Graphics performance is on par with many gaming laptops to easily outclass nearly all other ultra-thin 15.6-inch multimedia laptops. Upgrading to the GeForce RTX 3060 configuration would bring even greater performance advantages, but we can't estimate the increase at the moment as we've yet to test the RTX 3060 SKU.
See our dedicated page on the GeForce RTX 2060 Max-Q for more technical information and benchmark comparisons.
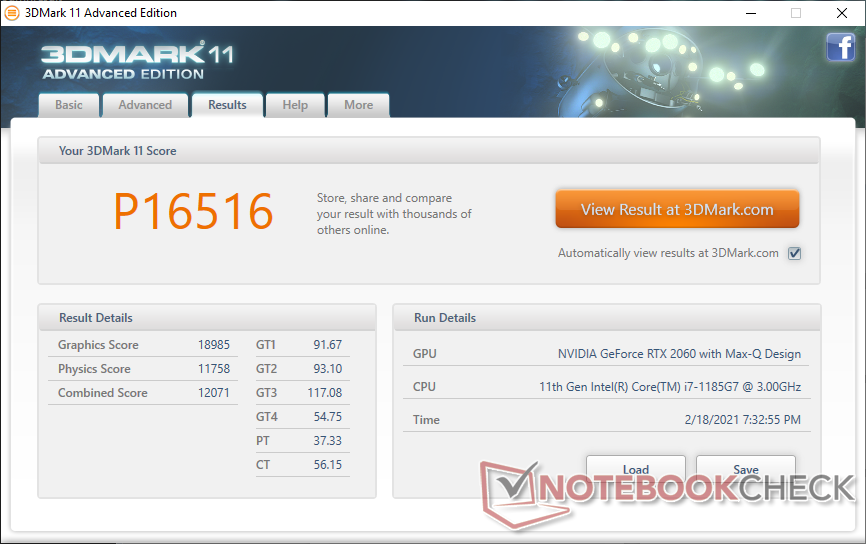
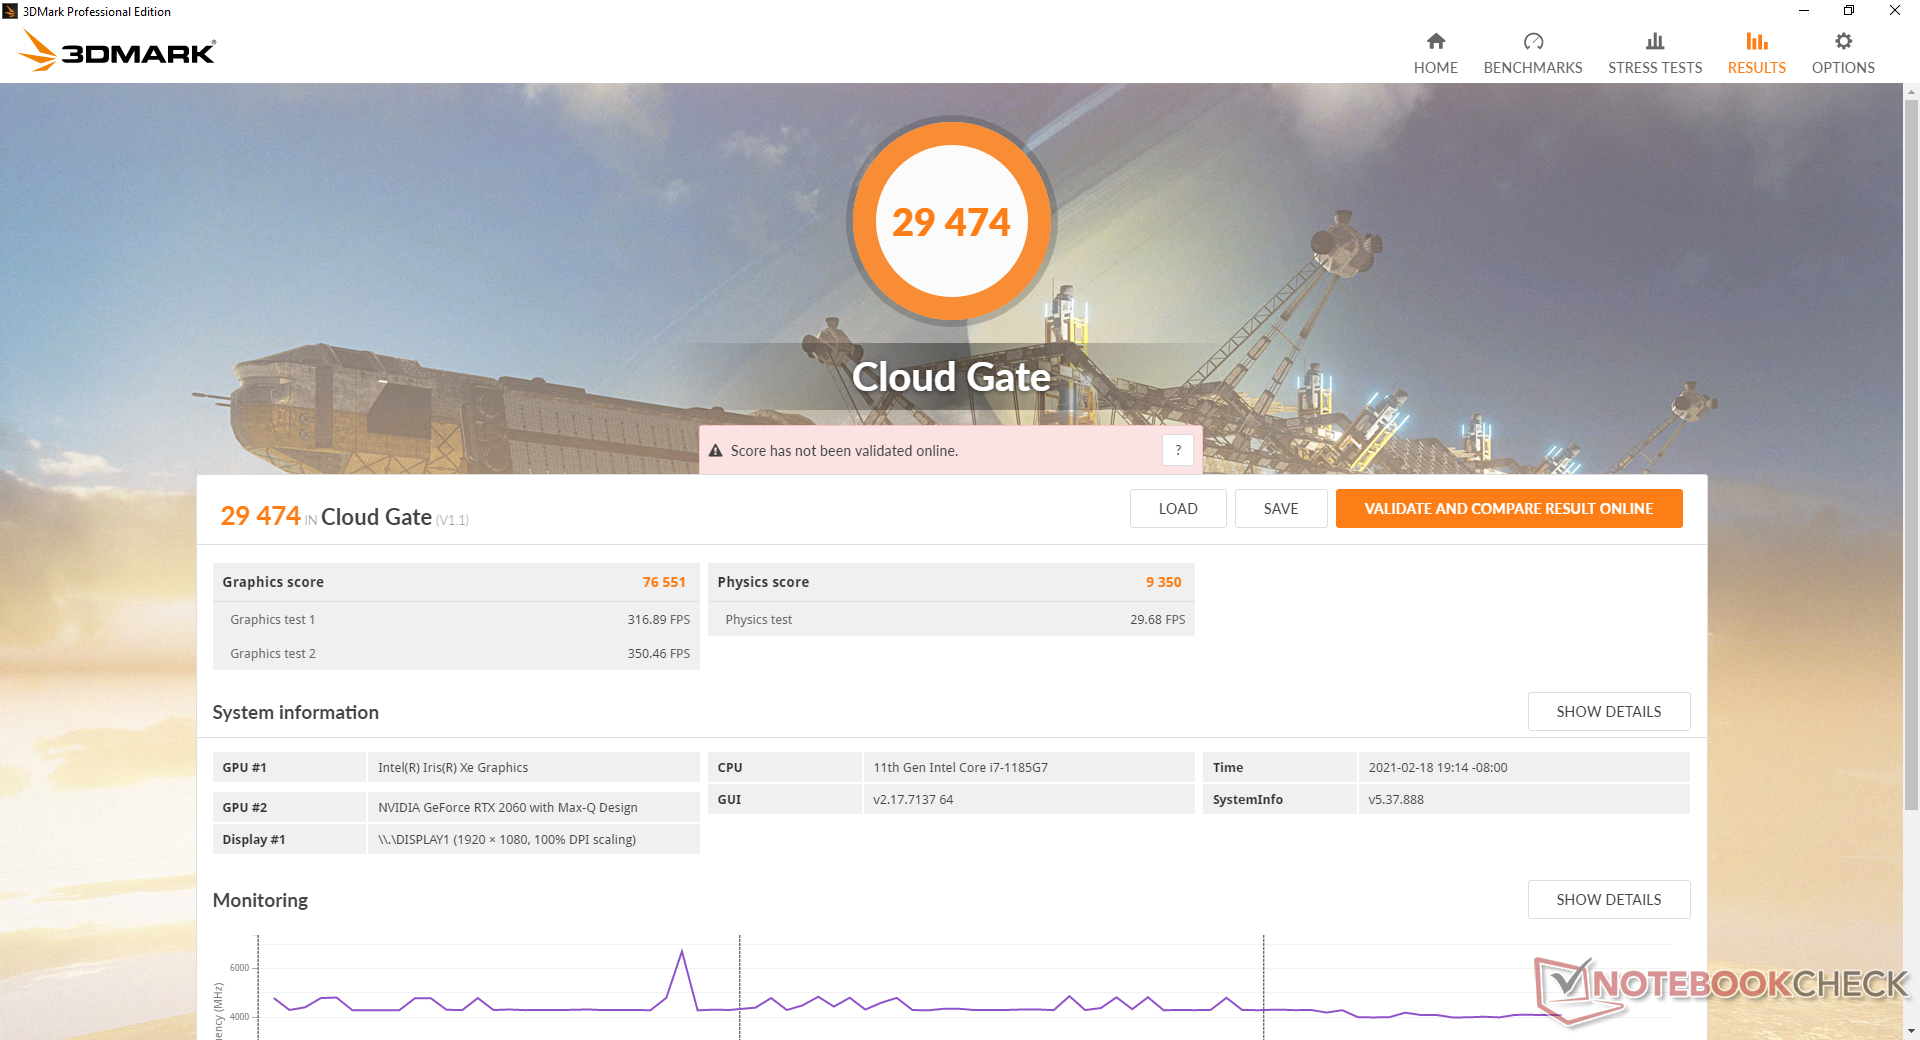
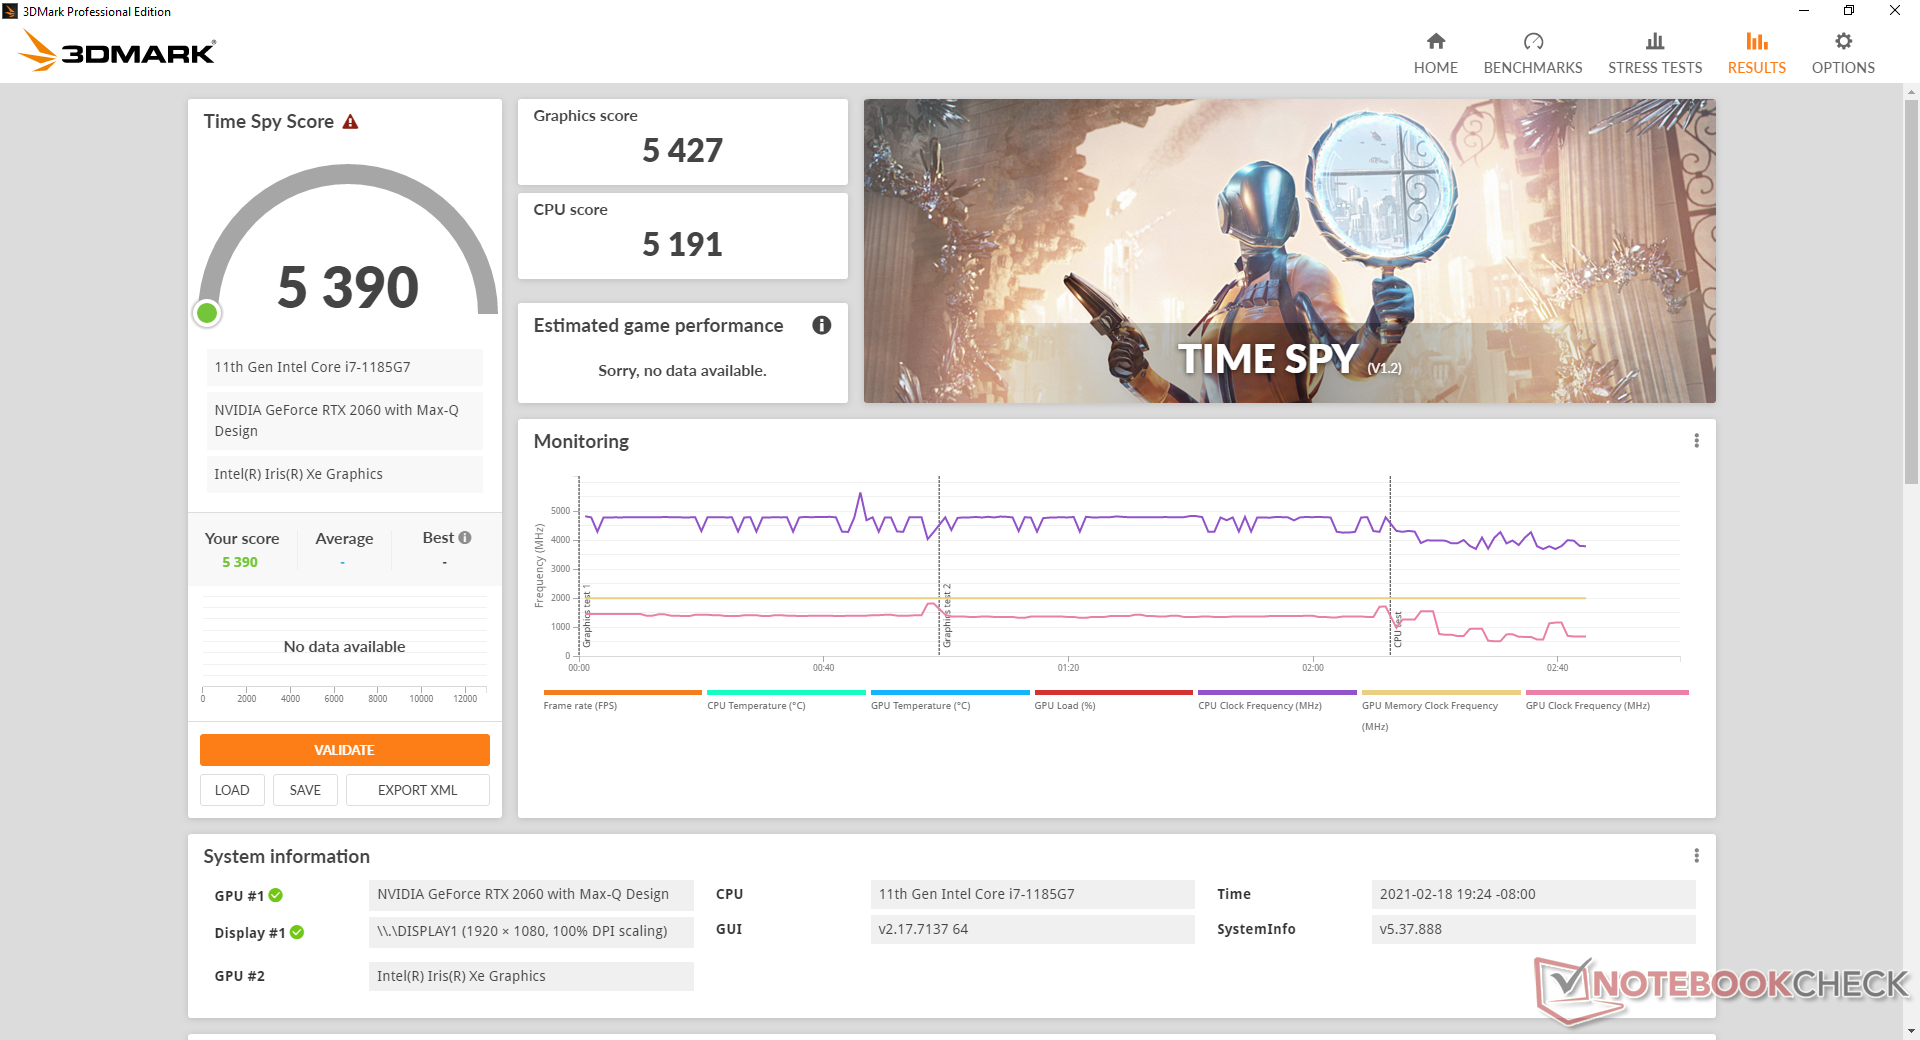
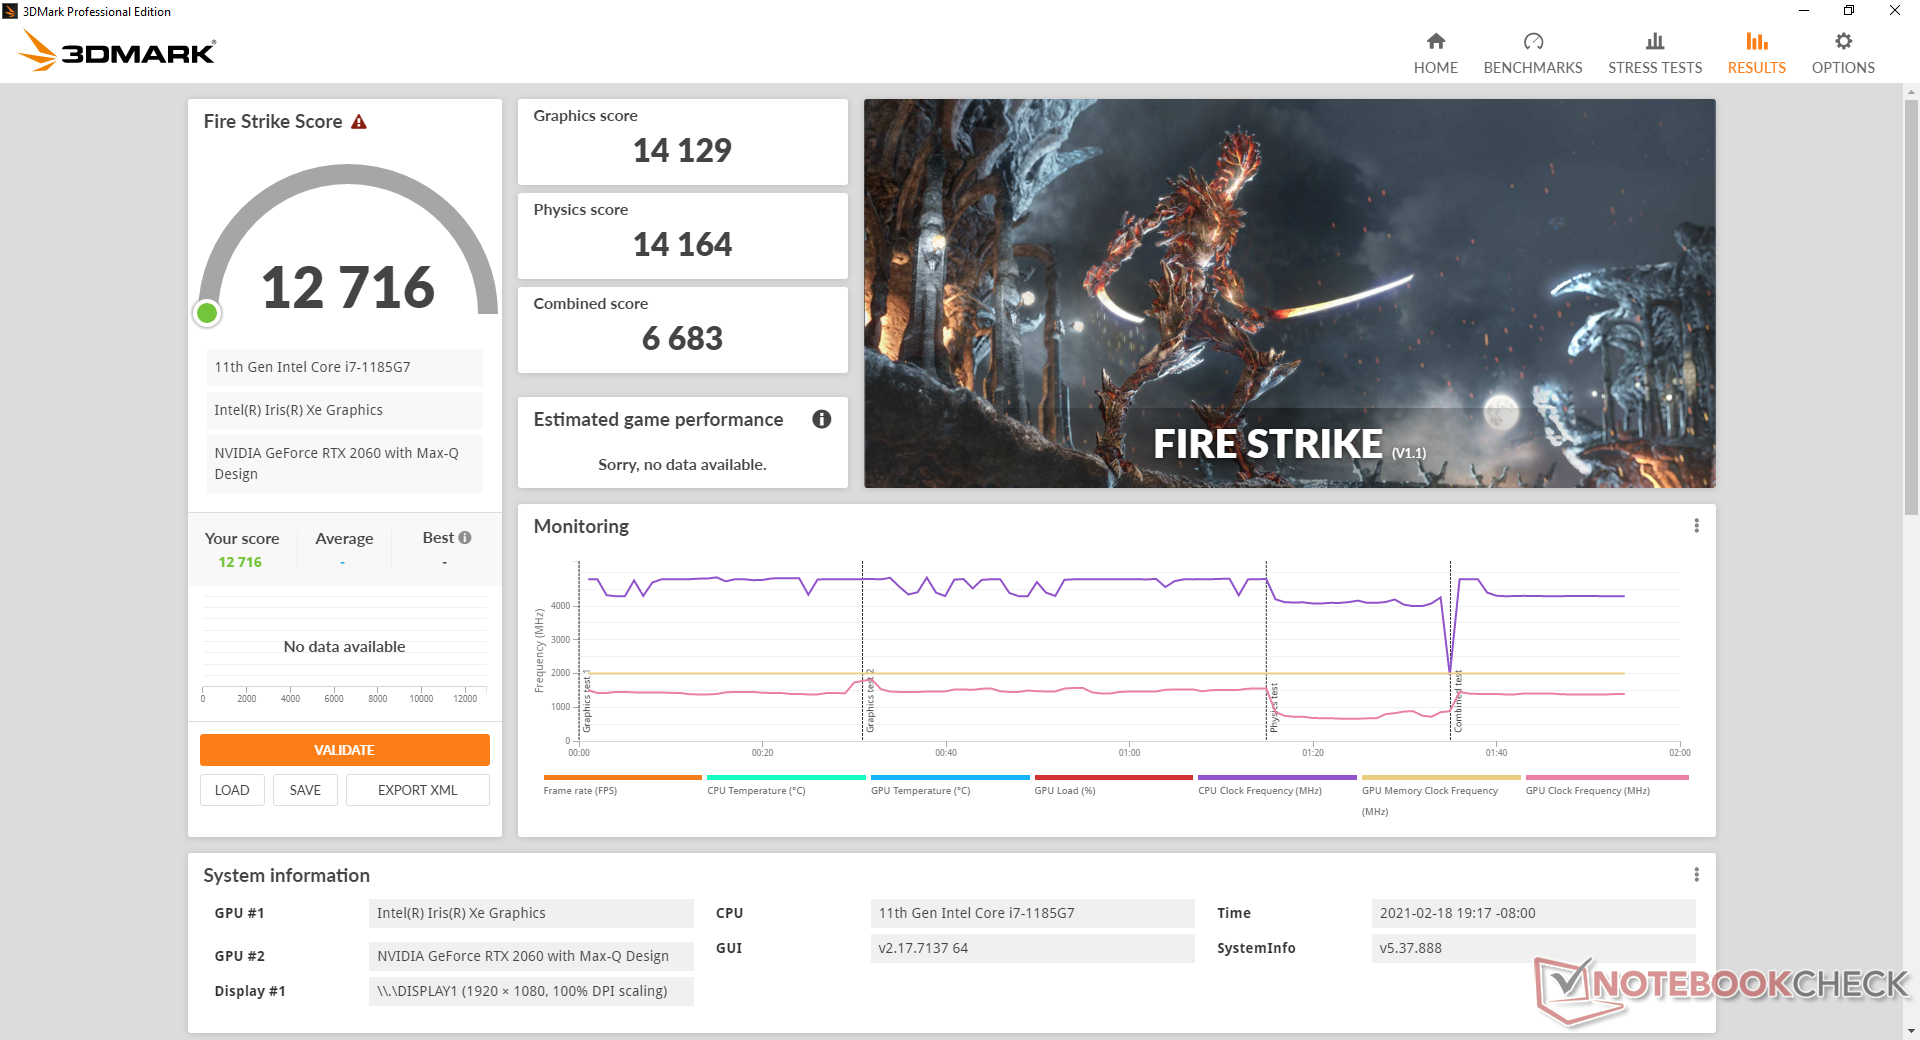
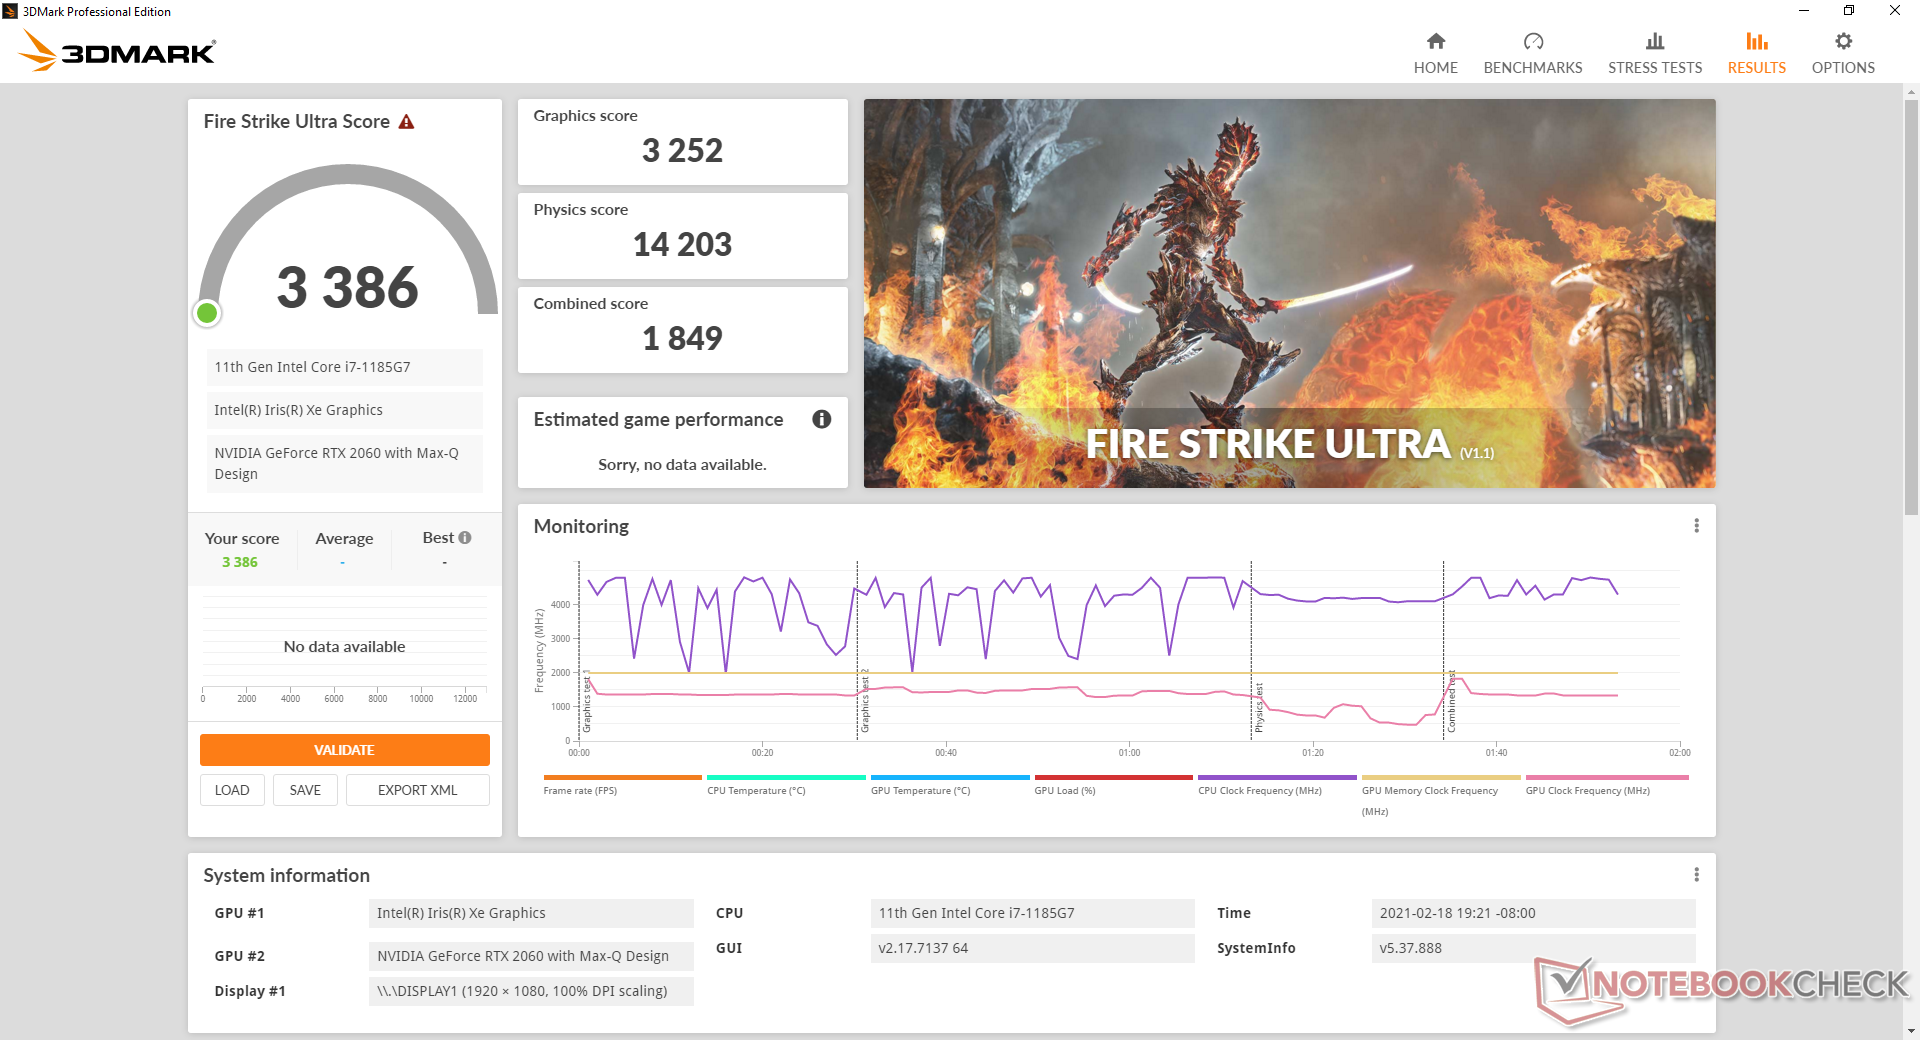
| 3DMark 11 Performance | 16516 points | |
| 3DMark Cloud Gate Standard Score | 29474 points | |
| 3DMark Fire Strike Score | 12716 points | |
| 3DMark Time Spy Score | 5390 points | |
Help | ||
| GTA V | |
| 1920x1080 Lowest Settings possible | |
| MSI Stealth 15M A11SEK | |
| Average NVIDIA GeForce RTX 2060 Max-Q () | |
| Lenovo Yoga Slim 7-14ARE | |
| Acer Swift 3 SF314-42-R27B | |
| 1366x768 Normal/Off AF:4x | |
| MSI RTX 2060 Gaming Z 6G | |
| MSI Stealth 15M A11SEK | |
| Average NVIDIA GeForce RTX 2060 Max-Q () | |
| Acer Swift 3 SF314-42-R27B | |
| 1920x1080 Highest Settings possible AA:4xMSAA + FX AF:16x | |
| MSI RTX 2060 Gaming Z 6G | |
| MSI Stealth 15M A11SEK | |
| Average NVIDIA GeForce RTX 2060 Max-Q () | |
| Lenovo Yoga Slim 7-14ARE | |
| Acer Swift 3 SF314-42-R27B | |
| Strange Brigade | |
| 1280x720 lowest AF:1 | |
| MSI Stealth 15M A11SEK | |
| Average NVIDIA GeForce RTX 2060 Max-Q () | |
| Lenovo Yoga Slim 7-14ARE | |
| 1920x1080 medium AA:medium AF:4 | |
| MSI Stealth 15M A11SEK | |
| Average NVIDIA GeForce RTX 2060 Max-Q () | |
| Lenovo Yoga Slim 7-14ARE | |
| 1920x1080 high AA:high AF:8 | |
| MSI Stealth 15M A11SEK | |
| Average NVIDIA GeForce RTX 2060 Max-Q () | |
| Lenovo Yoga Slim 7-14ARE | |
| 1920x1080 ultra AA:ultra AF:16 | |
| MSI Stealth 15M A11SEK | |
| Average NVIDIA GeForce RTX 2060 Max-Q () | |
| Lenovo Yoga Slim 7-14ARE | |
| low | med. | high | ultra | |
| GTA V (2015) | 173 | 164 | 119 | 68.2 |
| The Witcher 3 (2015) | 235.1 | 139.9 | 88.9 | 51.2 |
| Dota 2 Reborn (2015) | 144 | 130 | 119 | 116 |
| Final Fantasy XV Benchmark (2018) | 126 | 74.1 | 55.7 | |
| X-Plane 11.11 (2018) | 102 | 90 | 75.6 | |
| Strange Brigade (2018) | 276 | 130 | 106 | 93.1 |
Emissions
System Noise
Fan noise is always present when connected to an AC outlet at 32 dB(A) against a background of 28 dB(A) even if the system is set to Silent mode via Dragon Center. It's not until the AC adapter is disconnected will the fans truly idle for a silent experience. We would love to see this changed on future revisions as "Silent" mode should behave the same no matter if the AC adapter is connected or not.
When gaming, fan noise can range from 41 to 46 dB(A) depending on the CPU load. For example, fan noise is stable at 41 dB(A) when running Witcher 3 but it is louder when running 3DMark 06 even though Witcher 3 can be more GPU intensive. This range is similar to what we recorded on the Dell XPS 15 while being quieter than the Envy 15.
Enabling Cooler Boost mode will bump fan noise to its maximum of 56 dB(A) no matter the onscreen load. This mode is generally not needed ore recommended in most cases including gaming as it offers almost no performance boost — only cooler temperatures.
We can notice no coil whine from our test unit.
| MSI Stealth 15M A11SEK GeForce RTX 2060 Max-Q, i7-1185G7, WDC PC SN530 SDBPNPZ-1T00 | Dell XPS 15 9500 Core i7 4K UHD GeForce GTX 1650 Ti Mobile, i7-10875H, SK Hynix PC611 512GB | Lenovo ThinkPad T15p-20TN0006GE GeForce GTX 1050 Mobile, i7-10750H, WDC PC SN730 SDBQNTY-512GB | Asus ZenBook UX535-M01440 GeForce GTX 1650 Ti Max-Q, i7-10750H, WDC PC SN730 SDBPNTY-1T00 | MSI Prestige 15 A10SC GeForce GTX 1650 Max-Q, i7-10710U, Samsung SSD PM981 MZVLB1T0HALR | HP Envy 15-ep0098nr GeForce RTX 2060 Max-Q, i7-10750H, Intel Optane Memory H10 with Solid State Storage 32GB + 512GB HBRPEKNX0202A(L/H) | |
|---|---|---|---|---|---|---|
| Noise | 7% | 7% | 17% | 11% | -4% | |
| off / environment * | 27.5 | 28.4 -3% | 29.3 -7% | 24.6 11% | 29.3 -7% | 26.4 4% |
| Idle Minimum * | 32.3 | 28.4 12% | 29.3 9% | 24.6 24% | 30.1 7% | 32.2 -0% |
| Idle Average * | 32.3 | 28.4 12% | 29.3 9% | 24.6 24% | 30.2 7% | 32.2 -0% |
| Idle Maximum * | 33.7 | 28.4 16% | 30.6 9% | 24.6 27% | 30.2 10% | 32.2 4% |
| Load Average * | 46.3 | 46 1% | 42.7 8% | 41.3 11% | 31.5 32% | 48.3 -4% |
| Witcher 3 ultra * | 41.3 | 42 -2% | 42.7 -3% | 42 -2% | 37 10% | 53.7 -30% |
| Load Maximum * | 56.2 | 47.1 16% | 42.7 24% | 41.4 26% | 47 16% | 58.8 -5% |
* ... smaller is better
Noise Level
| Idle |
| 32.3 / 32.3 / 33.7 dB(A) |
| Load |
| 46.3 / 56.2 dB(A) |
 | ||
30 dB silent 40 dB(A) audible 50 dB(A) loud |
||
min: | ||
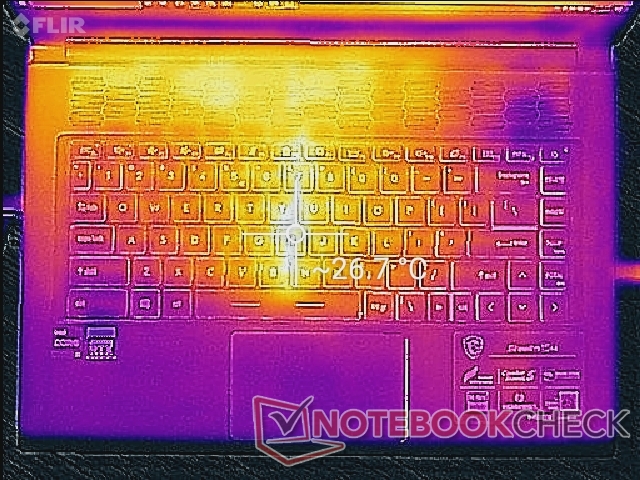
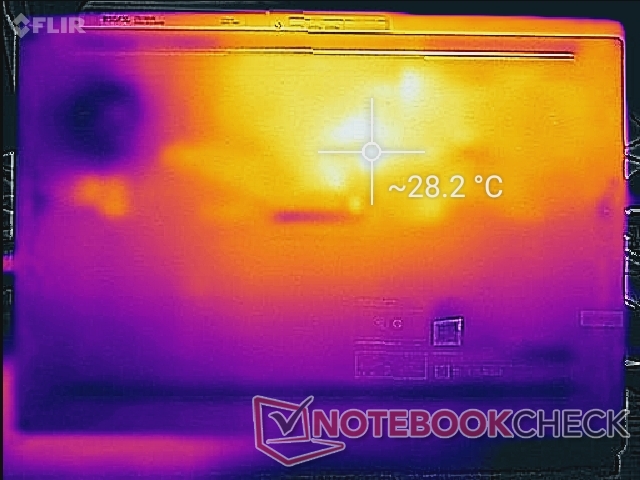
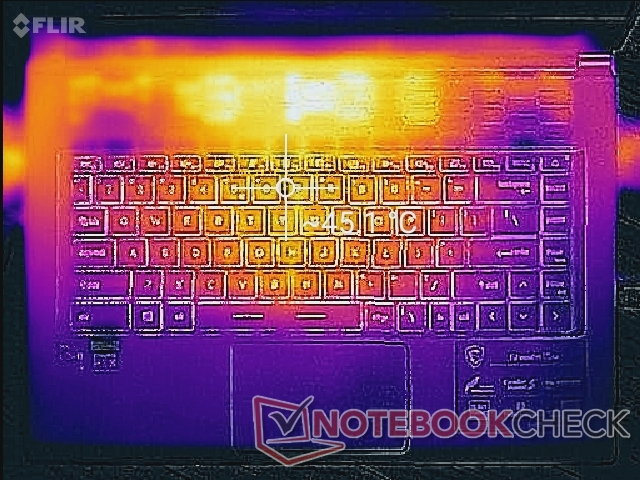
Temperature
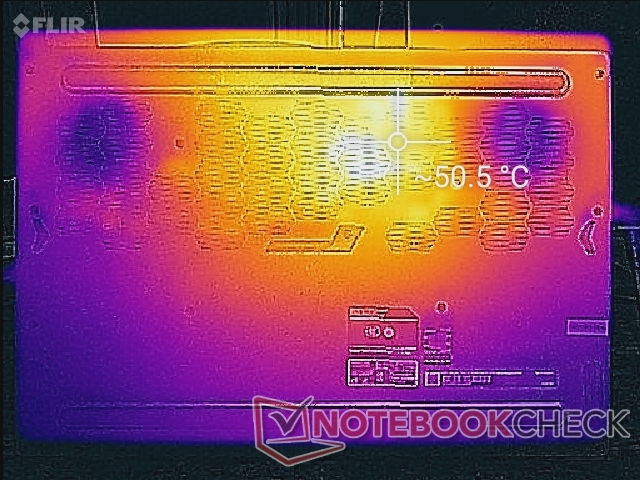
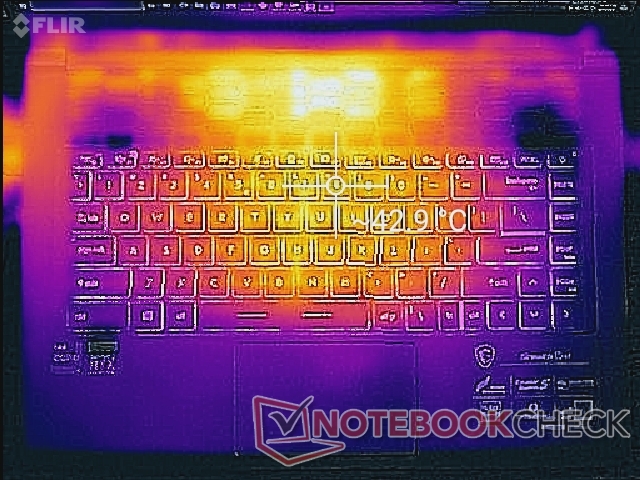
Surface temperature development is largely symmetrical. The hot spot on the keyboard center can be as warm as 43 C to 45 C when running demanding loads like games to be similar to what we observed on the GS66 but still cooler than on both the XPS 15 and Lenovo ThinkPad T15p. Thus, the MSI is able to offer faster graphics performance than its competitors without necessarily running any warmer.


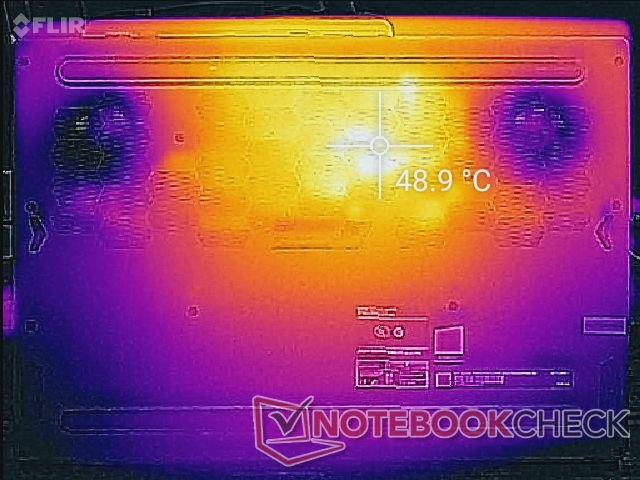
(-) The maximum temperature on the upper side is 47.2 °C / 117 F, compared to the average of 36.9 °C / 98 F, ranging from 21.1 to 71 °C for the class Multimedia.
(-) The bottom heats up to a maximum of 47.4 °C / 117 F, compared to the average of 39.1 °C / 102 F
(+) In idle usage, the average temperature for the upper side is 22.6 °C / 73 F, compared to the device average of 31.2 °C / 88 F.
(±) Playing The Witcher 3, the average temperature for the upper side is 34.4 °C / 94 F, compared to the device average of 31.2 °C / 88 F.
(+) The palmrests and touchpad are cooler than skin temperature with a maximum of 26.8 °C / 80.2 F and are therefore cool to the touch.
(±) The average temperature of the palmrest area of similar devices was 28.8 °C / 83.8 F (+2 °C / 3.6 F).
Stress Test
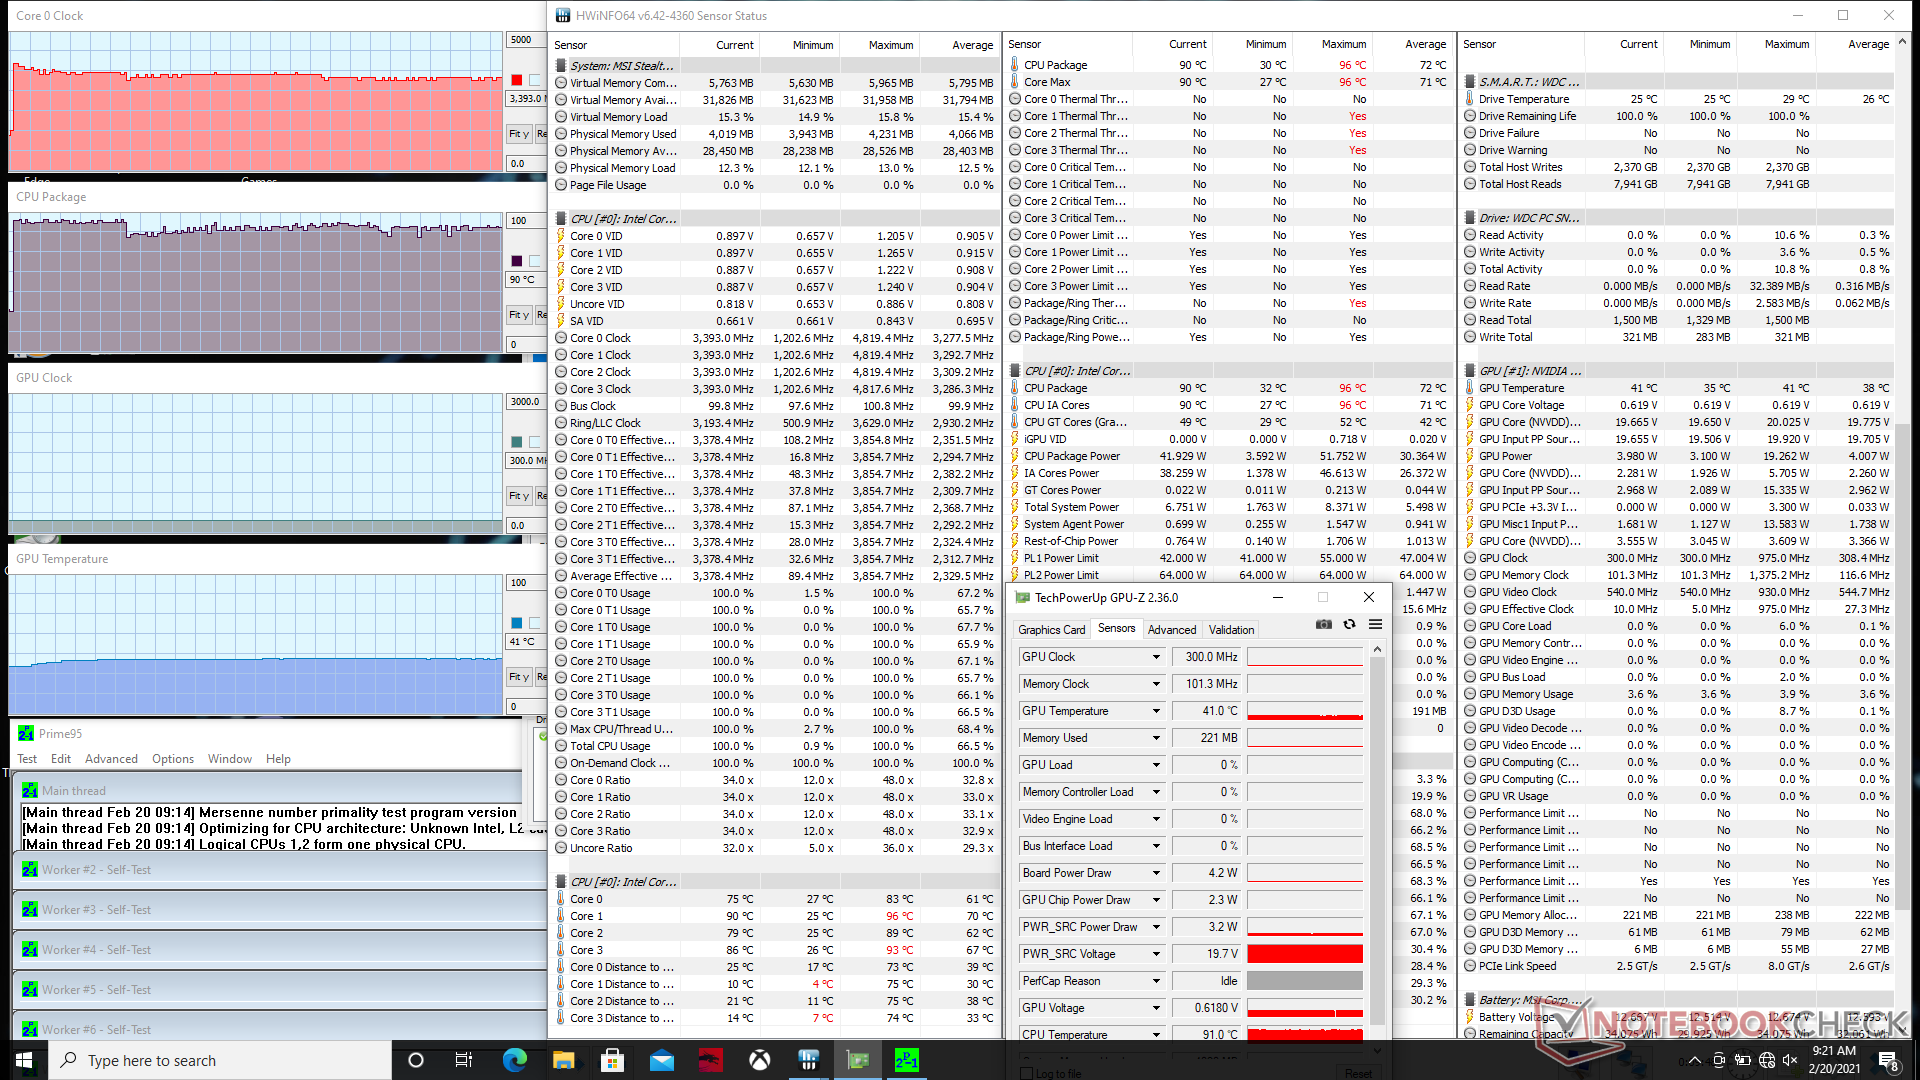
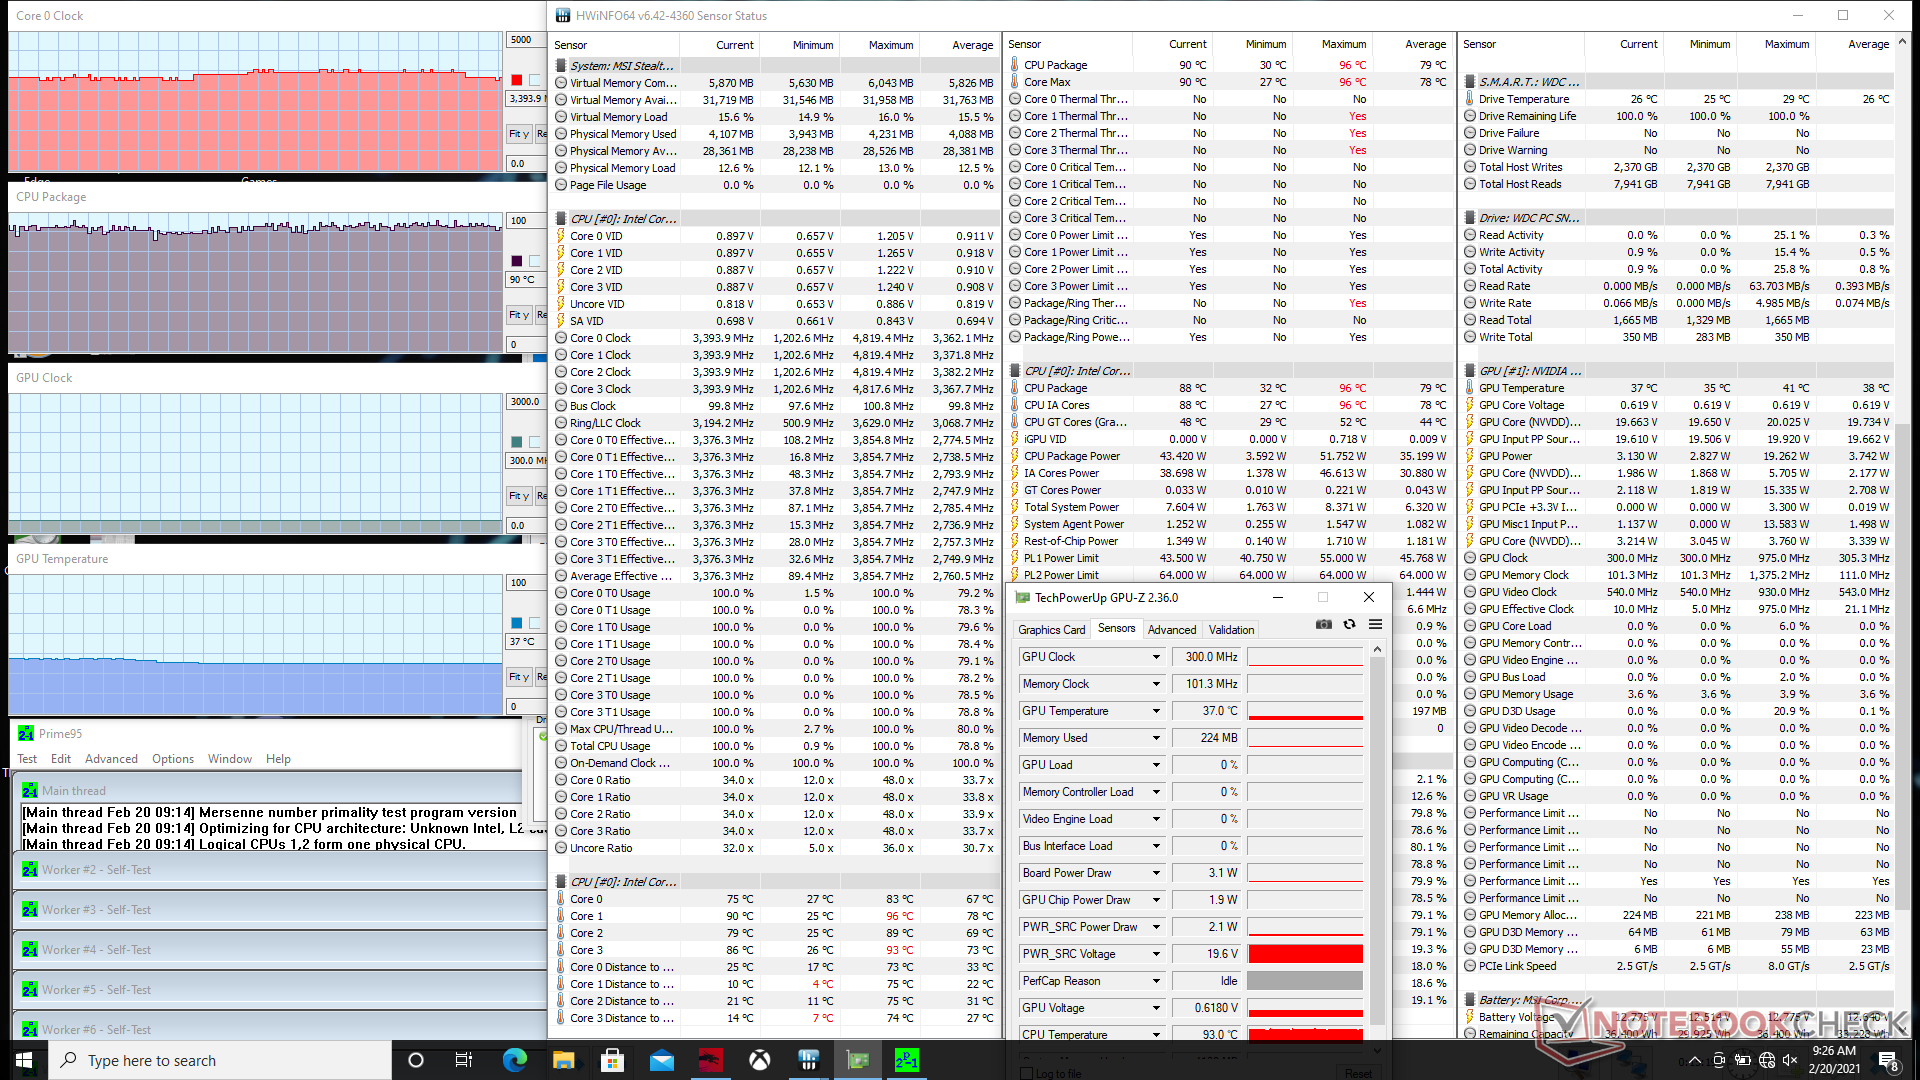
When stressed with Prime95, CPU clock rates would boost to 3.9 GHz for the first couple of seconds before falling to 3.5 GHz. The processor would eventually stabilize at the 3.3 to 3.4 GHz range and at a 90 C core temperature. Enabling Cooler Boost would make almost difference.
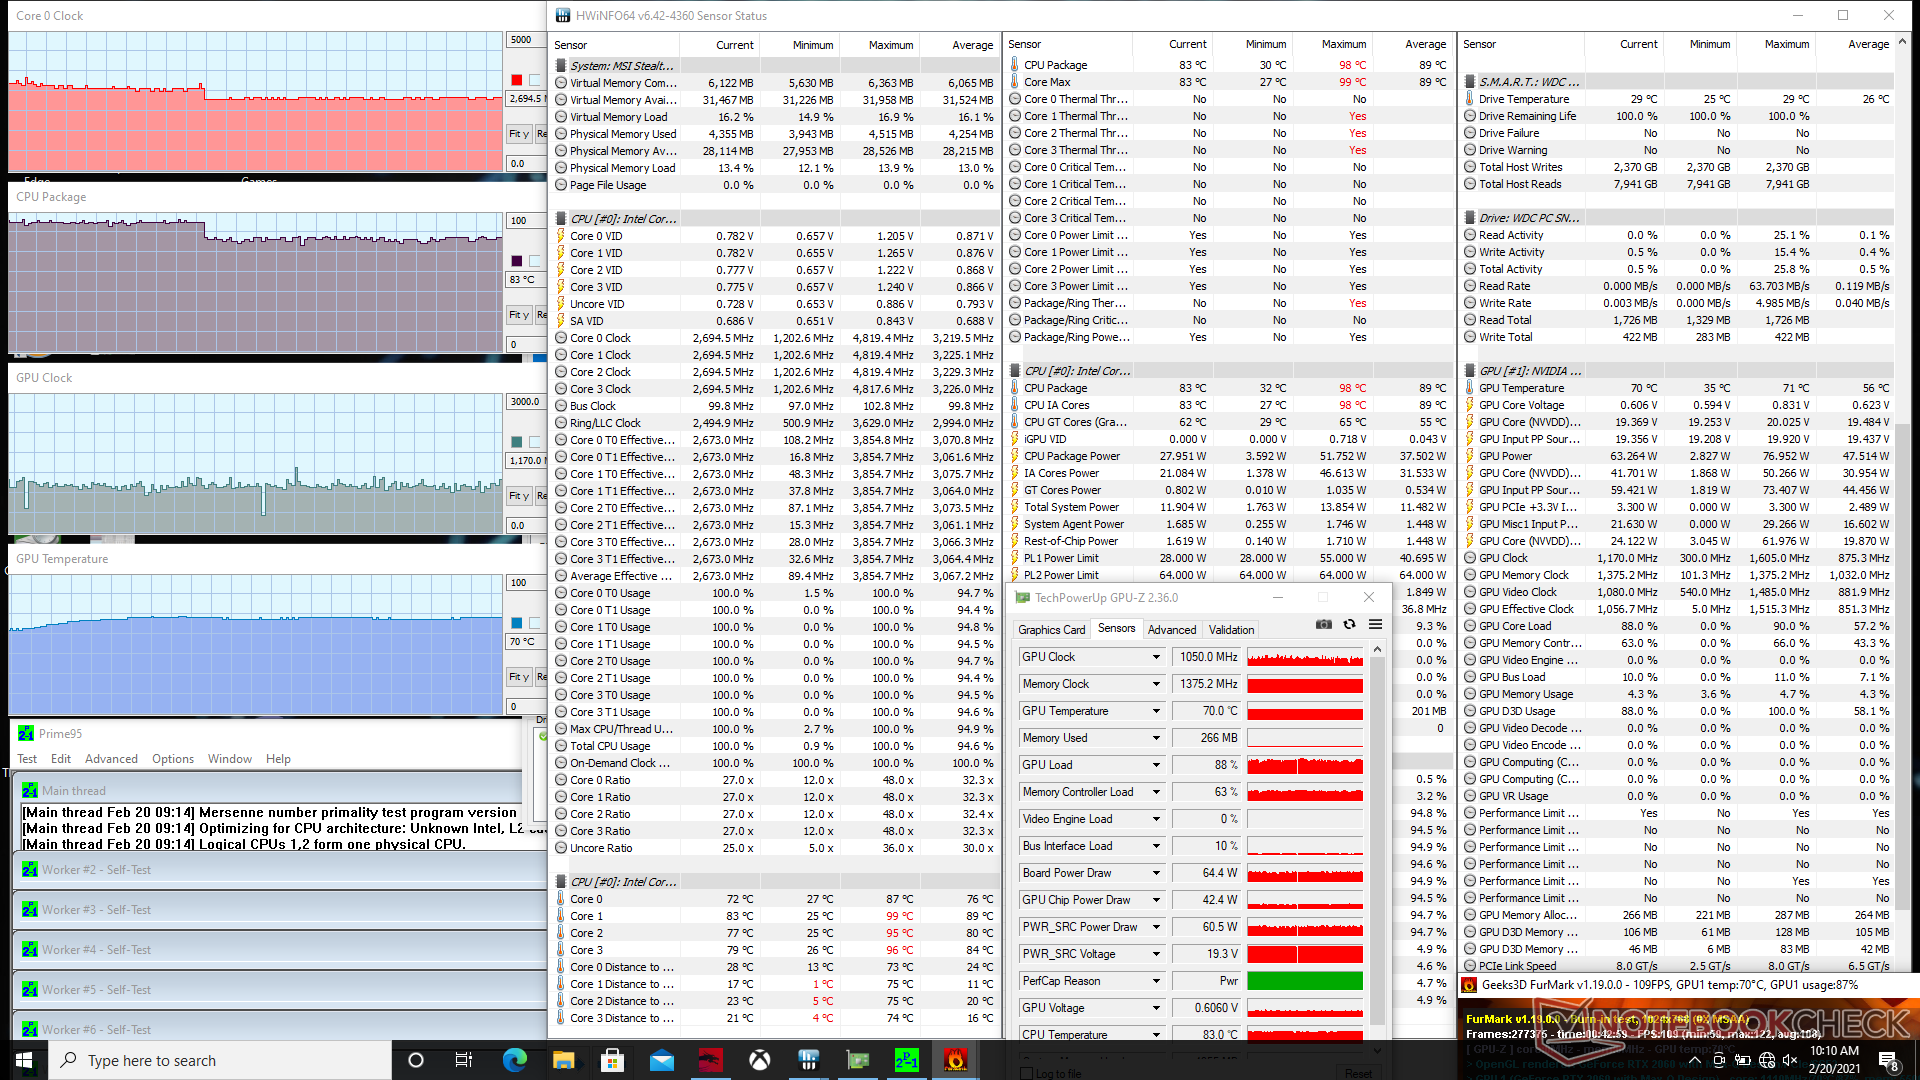
When stressed with both Prime95 and FurMark simultaneously, CPU and GPU temperatures would stabilize at 83 C and 70 C, respectively. Interestingly, enabling Cooler Boost would boost CPU clock rates from 2.6 GHz to 3.3 GHz while increasing core temperature to 92 C. Conversely, GPU temperature would fall from 70 C to 63 C.
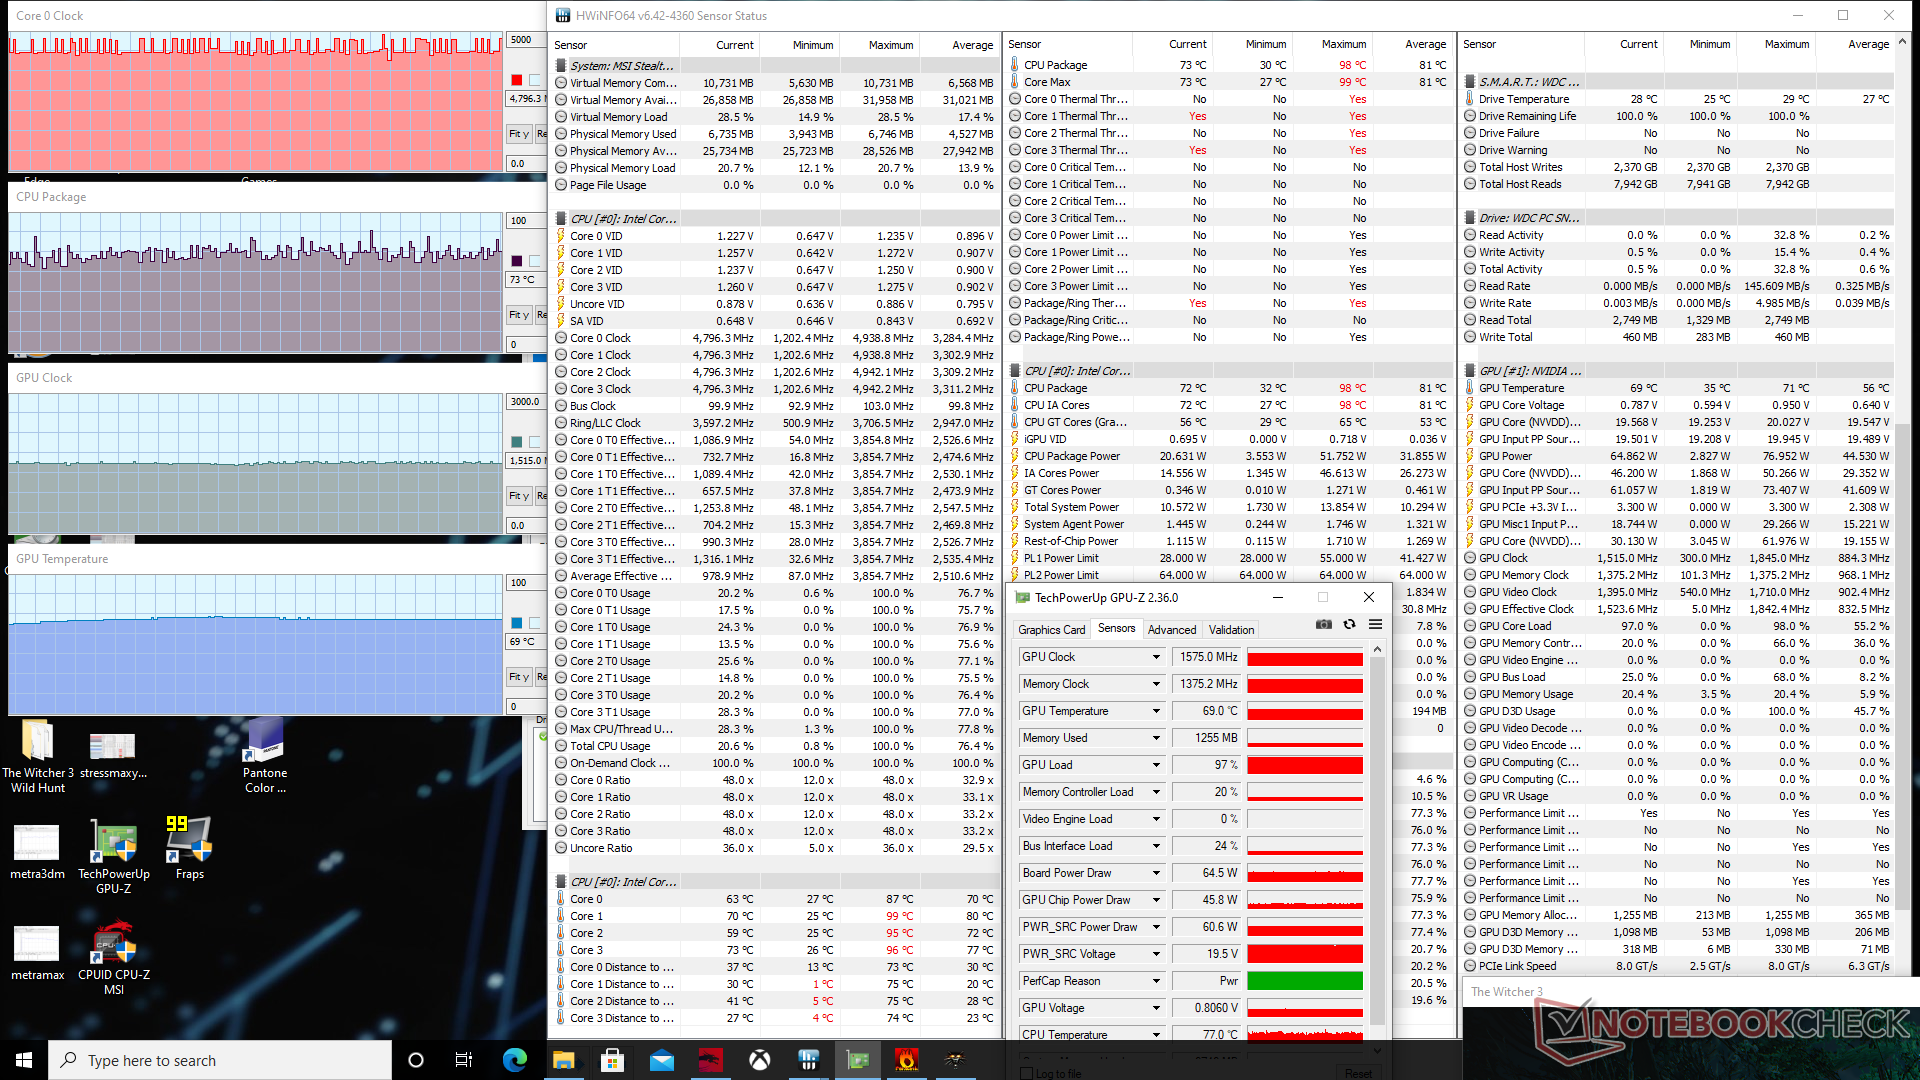
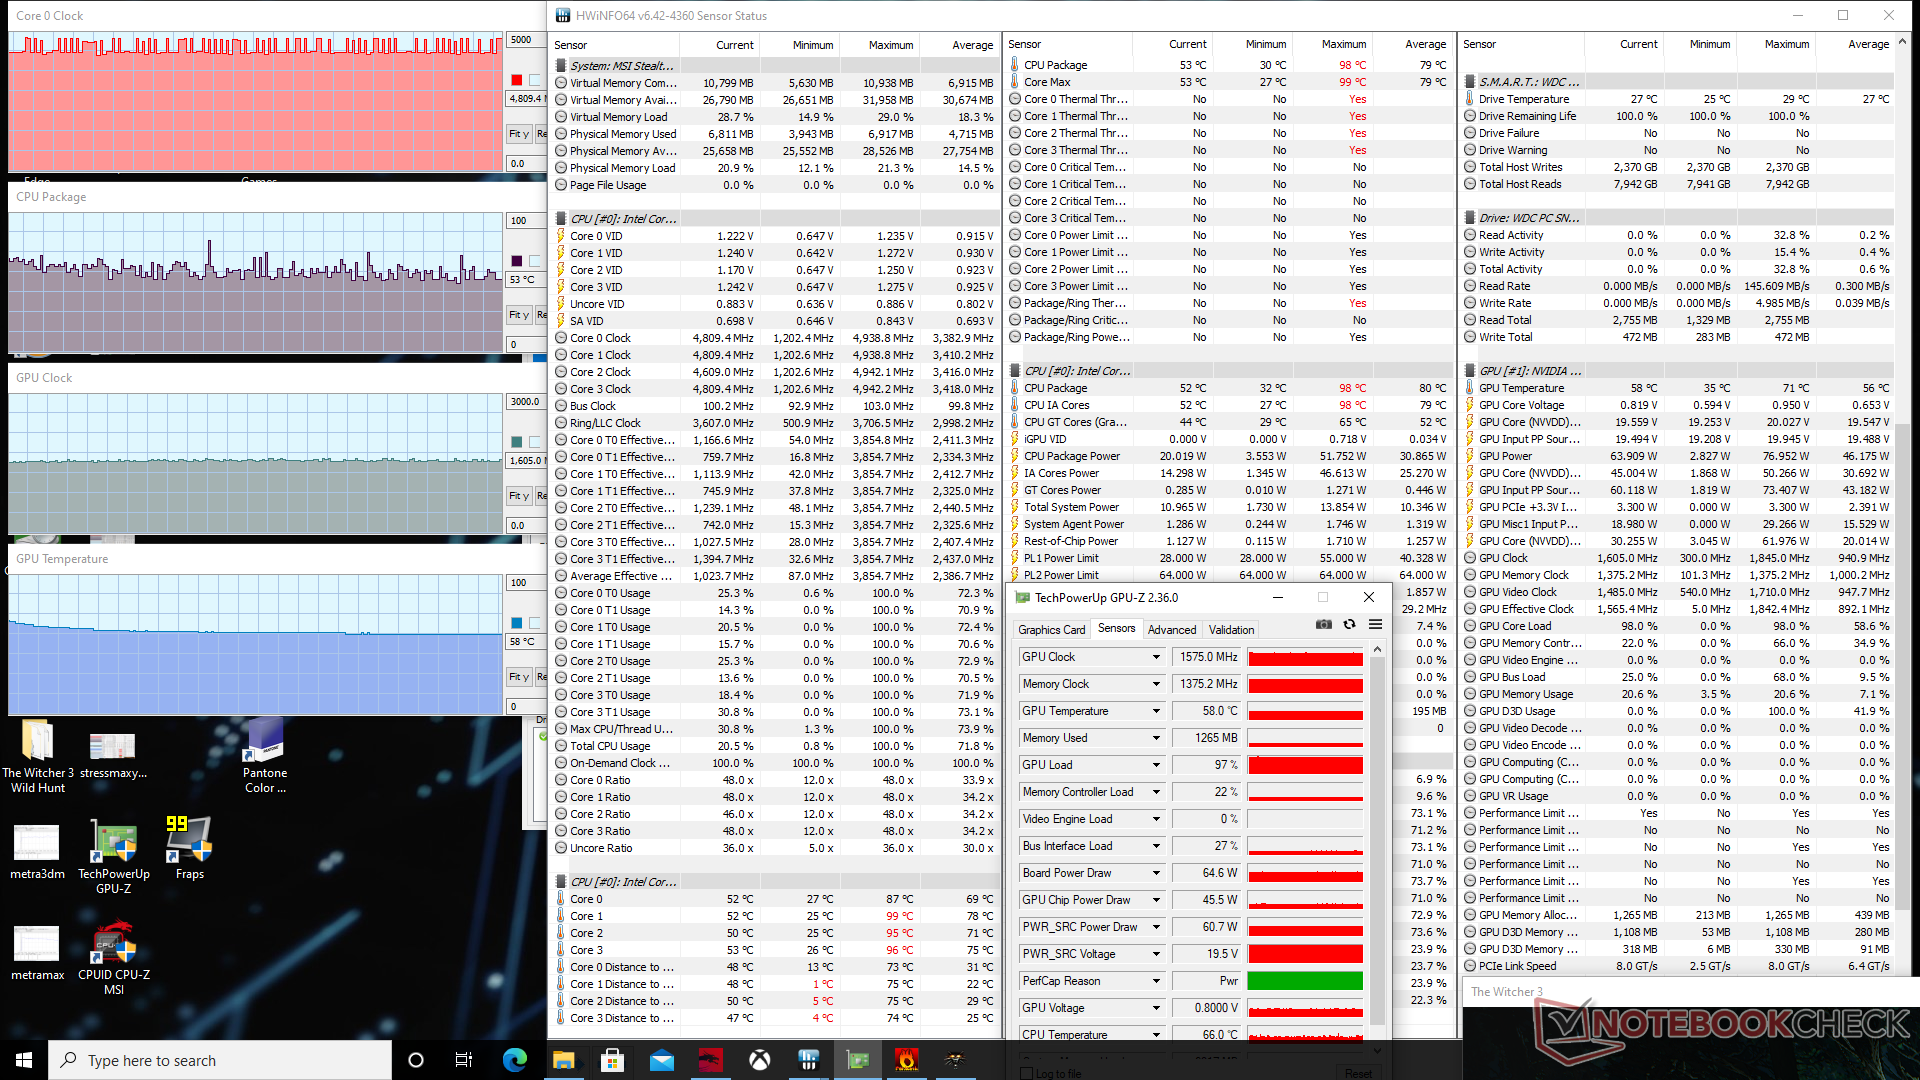
Running Witcher 3 causes CPU and GPU temperatures to stabilize at 73 C and 69 C, respectively. Enabling Turbo Boost would lower their core temperatures significantly to just 53 C and and 58 C. Clock rates, however, remain essentially unchanged. GPU board power draw remains stable at just under 65 W.
Running on batteries will limit performance. A Fire Strike run on battery power would return Physics and Graphics scores of 12781 and 4423 points, respectively, compared to 14164 and 14129 points when on mains.

| CPU Clock (GHz) | GPU Clock (MHz) | Average CPU Temperature (°C) | Average GPU Temperature (°C) | |
| System Idle | -- | -- | 32 | 35 |
| Prime95 Stress (Turbo off) | 3.3 - 3.4 | -- | 90 | 41 |
| Prime95 Stress (Turbo on) | 3.3 - 3.6 | -- | 90 | 37 |
| Prime95 + FurMark Stress (Turbo off) | 2.6 - 2.7 | 1050 | 83 | 70 |
| Prime95 + FurMark Stress (Turbo on) | 3.3 - 3.5 | 1125 | 92 | 63 |
| Witcher 3 Stress (Turbo off) | 4.4 - 4.8 | 1575 | 73 | 69 |
| Witcher 3 Stress (Turbo on) | 4.4 - 4.8 | 1575 | 53 | 58 |
Speakers


MSI Stealth 15M A11SEK audio analysis
(+) | speakers can play relatively loud (82.3 dB)
Bass 100 - 315 Hz
(-) | nearly no bass - on average 18.9% lower than median
(±) | linearity of bass is average (9.8% delta to prev. frequency)
Mids 400 - 2000 Hz
(+) | balanced mids - only 4.6% away from median
(+) | mids are linear (4.4% delta to prev. frequency)
Highs 2 - 16 kHz
(+) | balanced highs - only 3.2% away from median
(+) | highs are linear (3.7% delta to prev. frequency)
Overall 100 - 16.000 Hz
(±) | linearity of overall sound is average (17.6% difference to median)
Compared to same class
» 45% of all tested devices in this class were better, 8% similar, 48% worse
» The best had a delta of 5%, average was 18%, worst was 45%
Compared to all devices tested
» 29% of all tested devices were better, 8% similar, 63% worse
» The best had a delta of 4%, average was 25%, worst was 134%
Apple MacBook 12 (Early 2016) 1.1 GHz audio analysis
(+) | speakers can play relatively loud (83.6 dB)
Bass 100 - 315 Hz
(±) | reduced bass - on average 11.3% lower than median
(±) | linearity of bass is average (14.2% delta to prev. frequency)
Mids 400 - 2000 Hz
(+) | balanced mids - only 2.4% away from median
(+) | mids are linear (5.5% delta to prev. frequency)
Highs 2 - 16 kHz
(+) | balanced highs - only 2% away from median
(+) | highs are linear (4.5% delta to prev. frequency)
Overall 100 - 16.000 Hz
(+) | overall sound is linear (10.2% difference to median)
Compared to same class
» 5% of all tested devices in this class were better, 2% similar, 93% worse
» The best had a delta of 5%, average was 19%, worst was 53%
Compared to all devices tested
» 3% of all tested devices were better, 1% similar, 96% worse
» The best had a delta of 4%, average was 25%, worst was 134%
Energy Management
Power Consumption
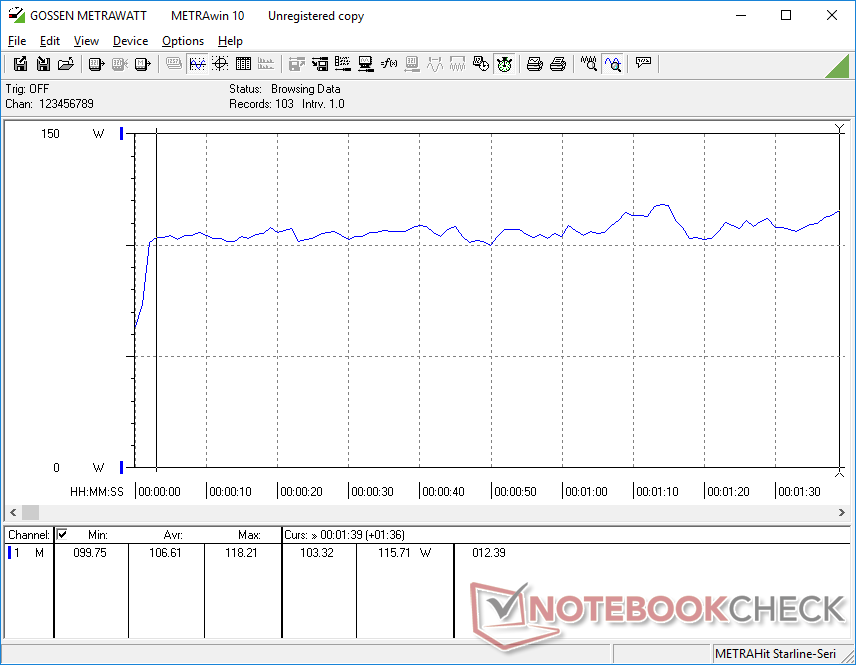
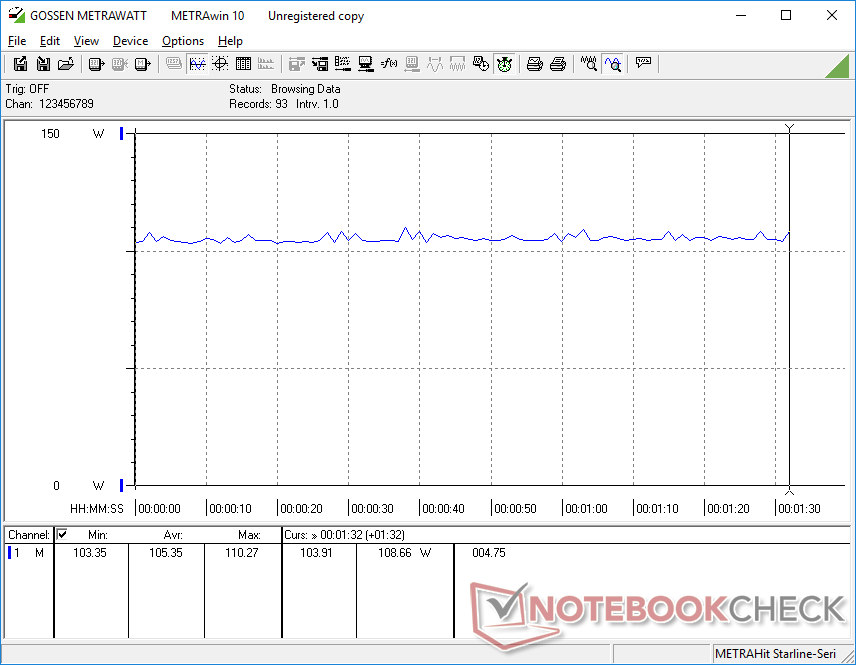
Idling on desktop consumes just 7 W when on the lowest brightness setting and power saver profile and 18 W when on maximum brightness and the high performance profile. Running Witcher 3 consumes about 105 W to be much higher than most Core U-series Ultrabooks and even some entry-level gaming laptops like the Lenovo Legion 5 due to our GeForce RTX GPU. MSI owners are getting about 70 percent higher graphics performance than the Dell XPS 15 9500 for a 13 percent increase in power consumption.
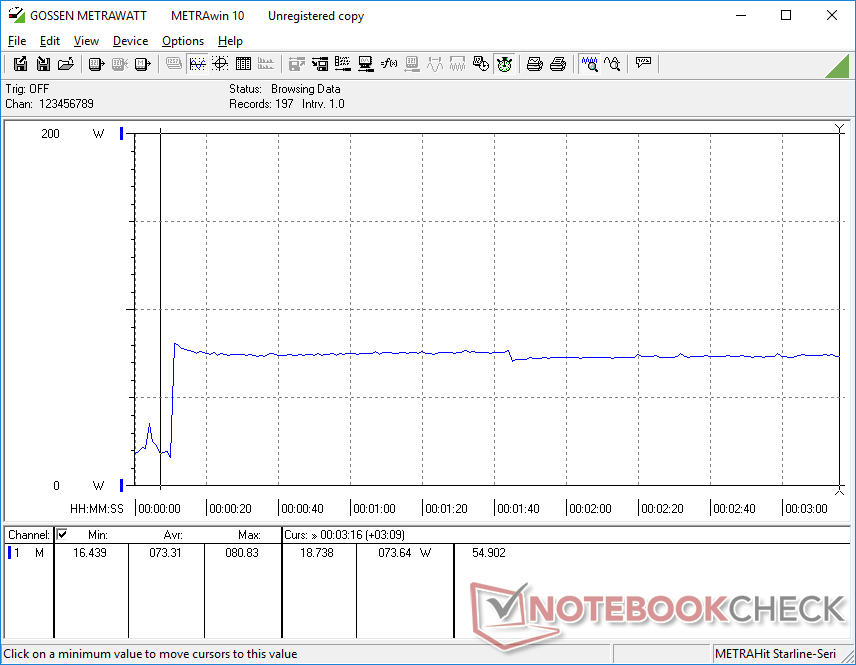
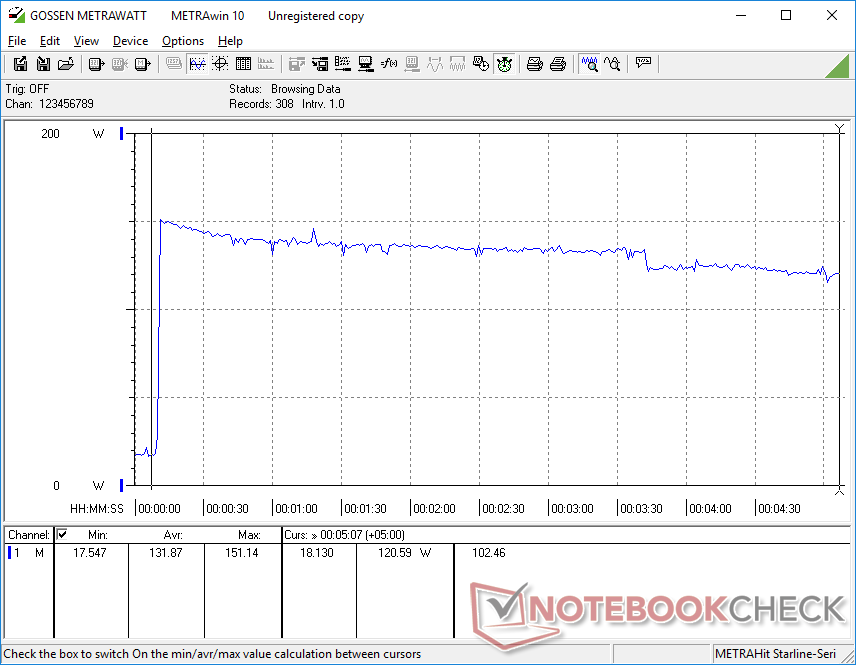
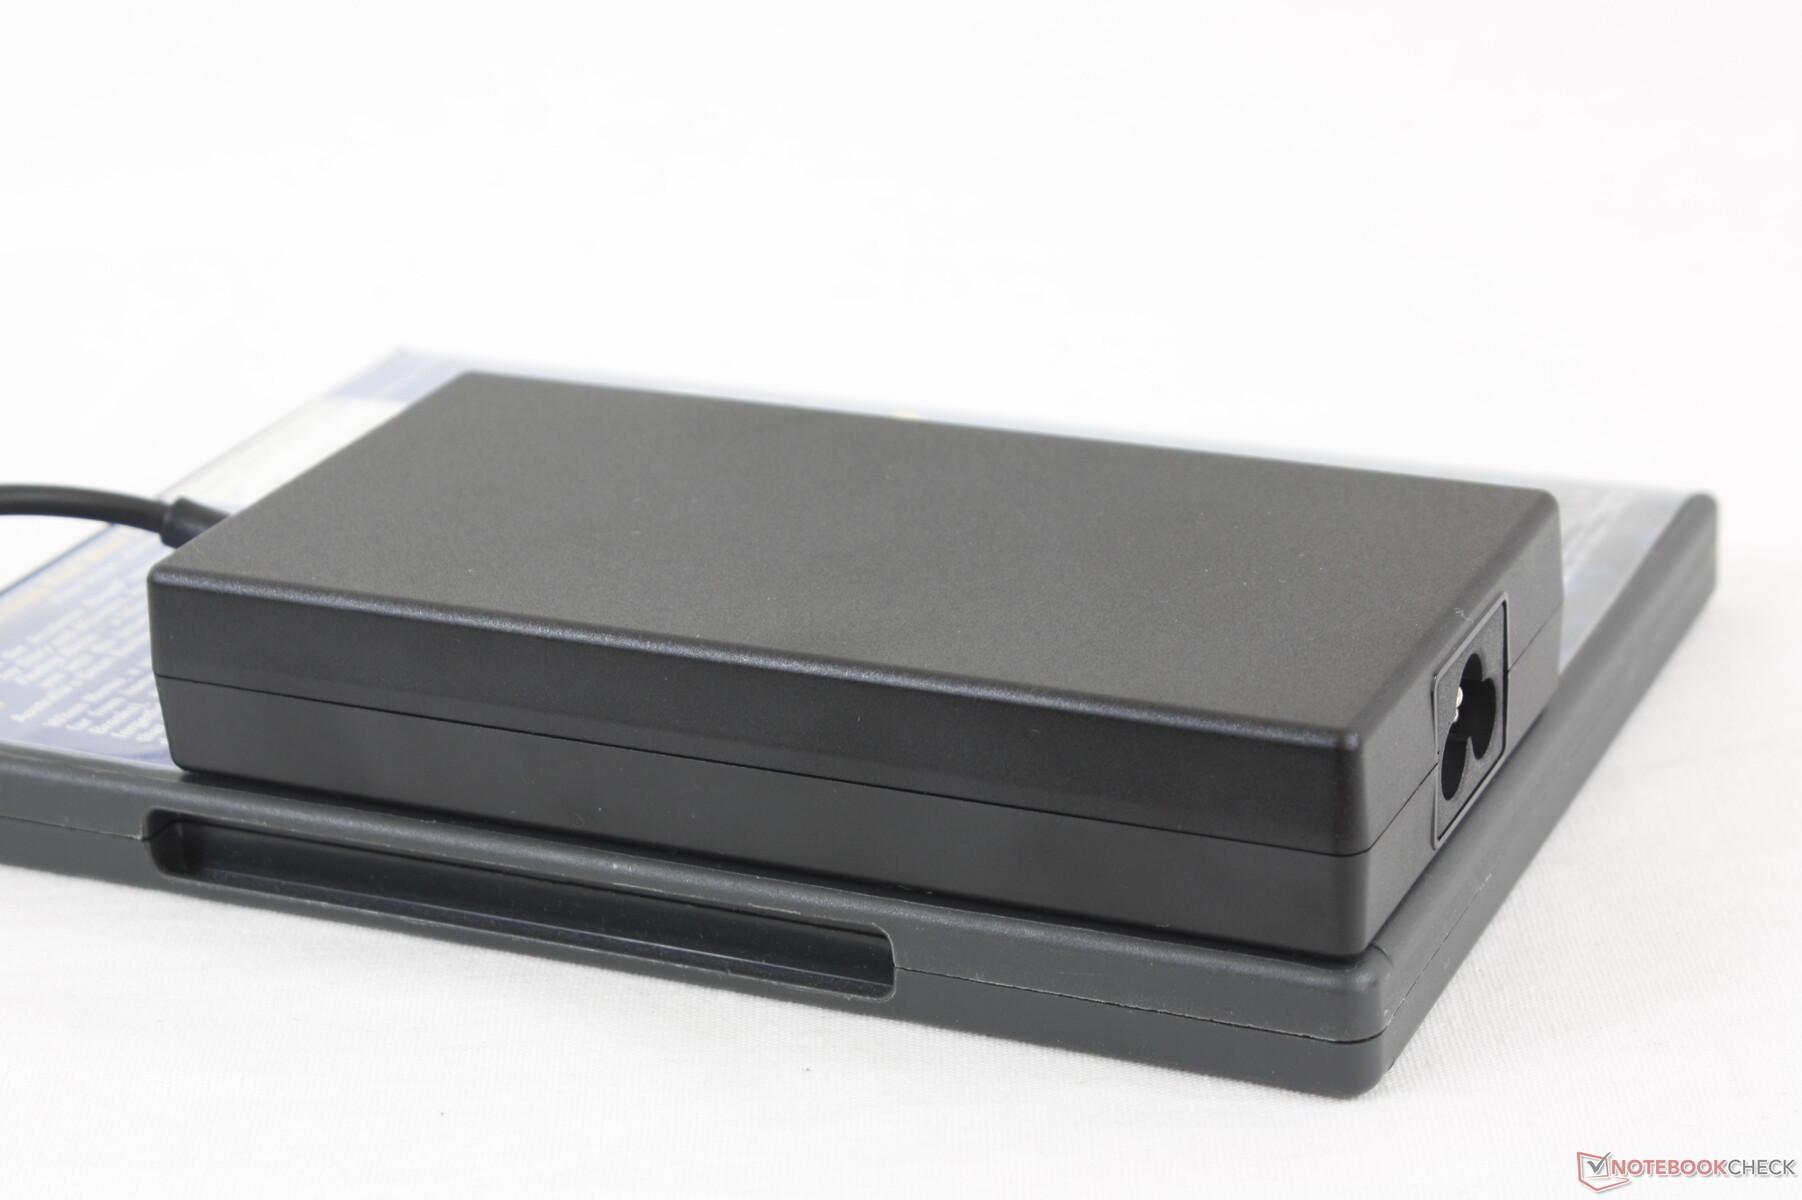
We're able to measure a maximum consumption of 151 W from the small-medium (13.6 x 6.8 x 1.9 cm) 150 W AC adapter when running Prime95 and FurMark simultaneously. This rate eventually falls and stabilizes at around 120 W as shown by our graph below due to thermal limitations.
| Off / Standby | |
| Idle | |
| Load |
|
| MSI Stealth 15M A11SEK i7-1185G7, GeForce RTX 2060 Max-Q, WDC PC SN530 SDBPNPZ-1T00, IPS, 1920x1080, 15.60 | Dell XPS 15 9500 Core i7 4K UHD i7-10875H, GeForce GTX 1650 Ti Mobile, SK Hynix PC611 512GB, IPS, 3840x2400, 15.60 | Lenovo ThinkPad T15p-20TN0006GE i7-10750H, GeForce GTX 1050 Mobile, WDC PC SN730 SDBQNTY-512GB, IPS LED, 3840x2160, 15.60 | Asus ZenBook UX535-M01440 i7-10750H, GeForce GTX 1650 Ti Max-Q, WDC PC SN730 SDBPNTY-1T00, IPS, 3840x2160, 15.60 | HP Envy 15-ep0098nr i7-10750H, GeForce RTX 2060 Max-Q, Intel Optane Memory H10 with Solid State Storage 32GB + 512GB HBRPEKNX0202A(L/H), AMOLED, 3840x2160, 15.60 | |
|---|---|---|---|---|---|
| Power Consumption | -1% | 7% | 23% | -21% | |
| Idle Minimum * | 7.3 | 5.7 22% | 6 18% | 4.4 40% | 9.2 -26% |
| Idle Average * | 10.1 | 13.5 -34% | 12.8 -27% | 9.8 3% | 14.5 -44% |
| Idle Maximum * | 17.6 | 19.6 -11% | 16.1 9% | 14.5 18% | 18 -2% |
| Load Average * | 106.6 | 114.1 -7% | 95.6 10% | 83 22% | 110.9 -4% |
| Witcher 3 ultra * | 105.4 | 93 12% | 84 20% | 67 36% | 125.5 -19% |
| Load Maximum * | 151.2 | 135.2 11% | 131.1 13% | 123 19% | 194.6 -29% |
* ... smaller is better
Battery Life
Runtimes are average at just over 6 hours of real-world WLAN use from the small 52 Wh internal battery. The competing XPS 15 can last for almost 3 hours longer when under similar testing conditions. Charging from empty to full, however, is relatively quick at just 1 to 1.5 hours. Generic USB-C adapters can also be used to recharge the system albeit at a slower rate.
| MSI Stealth 15M A11SEK i7-1185G7, GeForce RTX 2060 Max-Q, 52 Wh | Dell XPS 15 9500 Core i7 4K UHD i7-10875H, GeForce GTX 1650 Ti Mobile, 86 Wh | Lenovo ThinkPad T15p-20TN0006GE i7-10750H, GeForce GTX 1050 Mobile, 68 Wh | Asus ZenBook UX535-M01440 i7-10750H, GeForce GTX 1650 Ti Max-Q, 96 Wh | MSI Prestige 15 A10SC i7-10710U, GeForce GTX 1650 Max-Q, 82 Wh | HP Envy 15-ep0098nr i7-10750H, GeForce RTX 2060 Max-Q, 83 Wh | |
|---|---|---|---|---|---|---|
| Battery Runtime | 89% | 11% | 77% | 71% | 34% | |
| Reader / Idle | 627 | 1382 120% | 1097 75% | 1147 83% | 900 44% | |
| WiFi v1.3 | 378 | 546 44% | 436 15% | 608 61% | 456 21% | 361 -4% |
| Load | 60 | 121 102% | 64 7% | 117 95% | 125 108% | 97 62% |
Pros
Cons
Verdict
The Stealth 15M has a few things going for it when compared to other ultra-thin 15.6-inch Ultrabooks. Its GeForce RTX options instantly propel the system to one of the fastest in its category when it comes to graphics. It also manages to be lighter than its competitors despite the higher GPU performance. Temperatures and fan noise when under load aren't all that warmer or louder, either.
Super light and super fast. The Stealth 15M can outperform most multimedia laptops in its size class, but it's also more fragile and prone to damage over time.
The biggest drawbacks to the system are hard to ignore. In particular, the chassis or skeleton is much more prone to warping, bending, and creaking than the skeletons of the XPS 15, Spectre, ZenBook, or Yoga laptops which all cost about the same as our MSI. This includes the hinges as well which are very weak on the MSI. It's a great looking laptop with gaming-level performance, but the flimsy build quality has us concerned about its longevity.
Price and availability
MSI Stealth 15M A11SEK
-
02/24/2021 v7
Allen Ngo


Pricecompare
