 Deutsch
 English
 Español
 Français
 Italiano
 Nederlands
 Polski
 Português
 Русский
 Türkçe
 Svenska
 Chinese
 Magyar
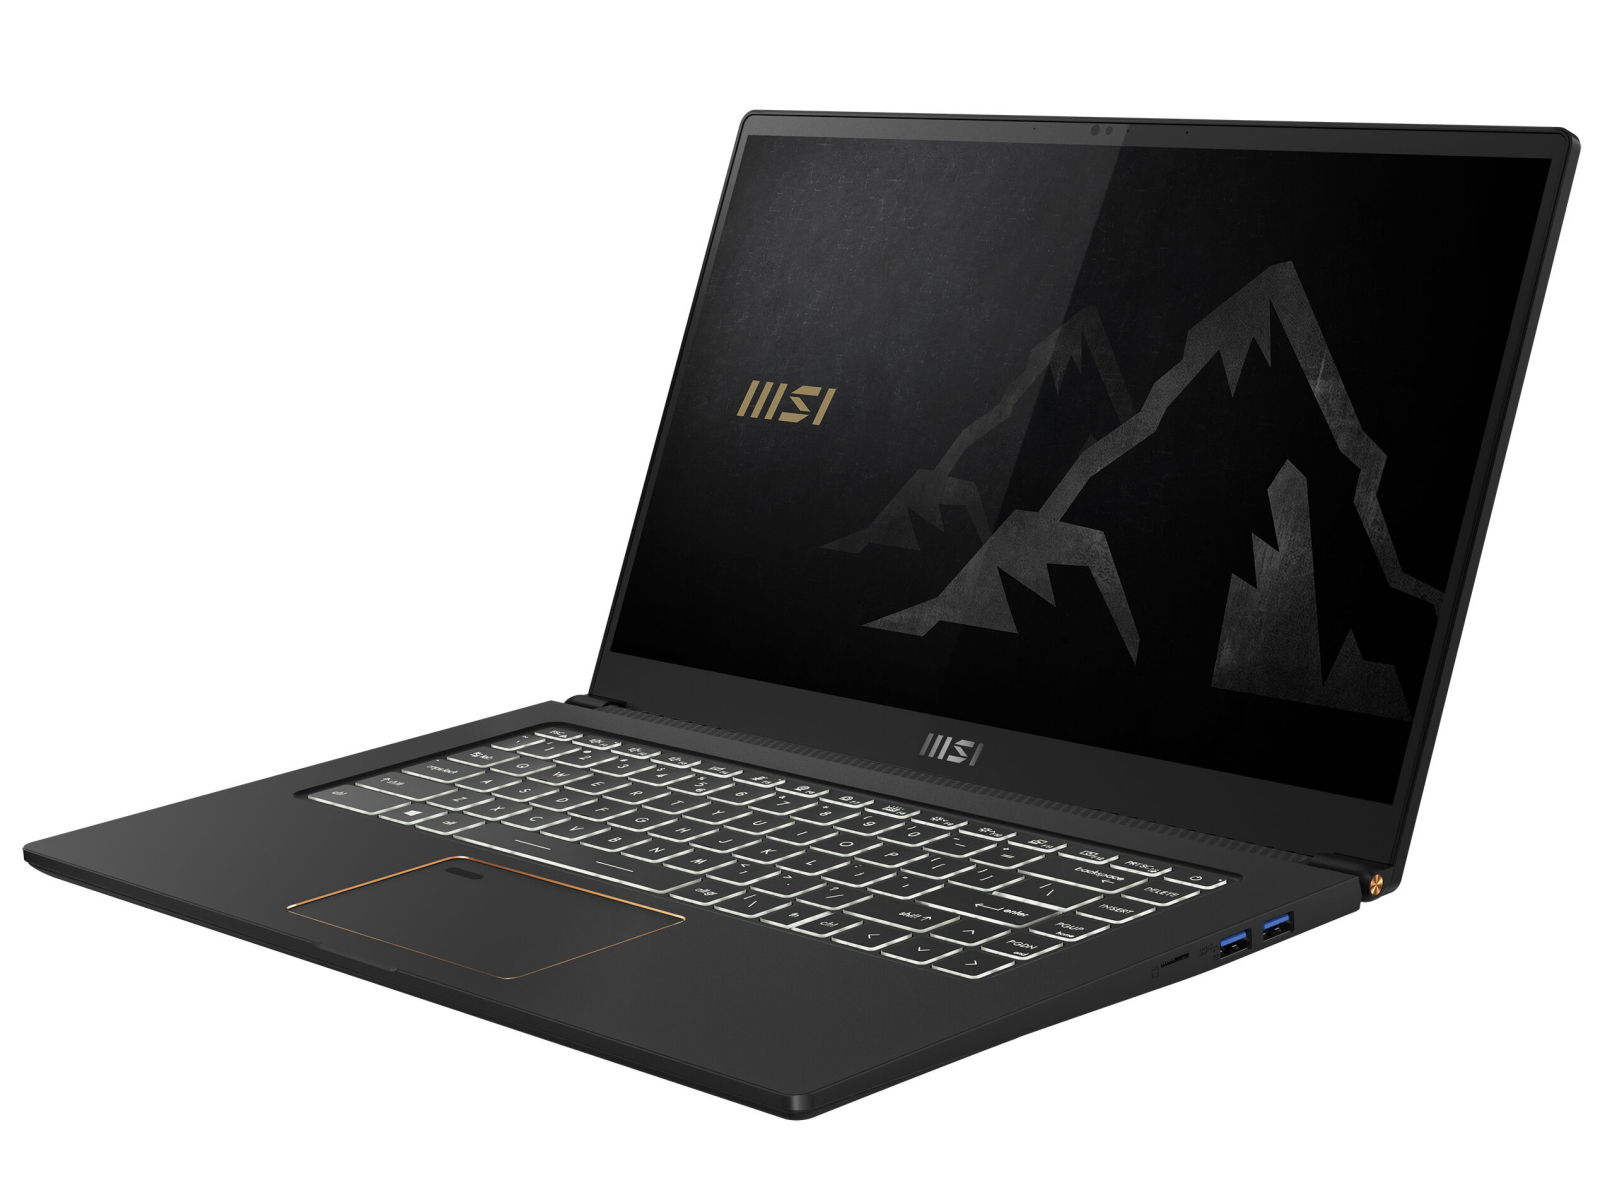
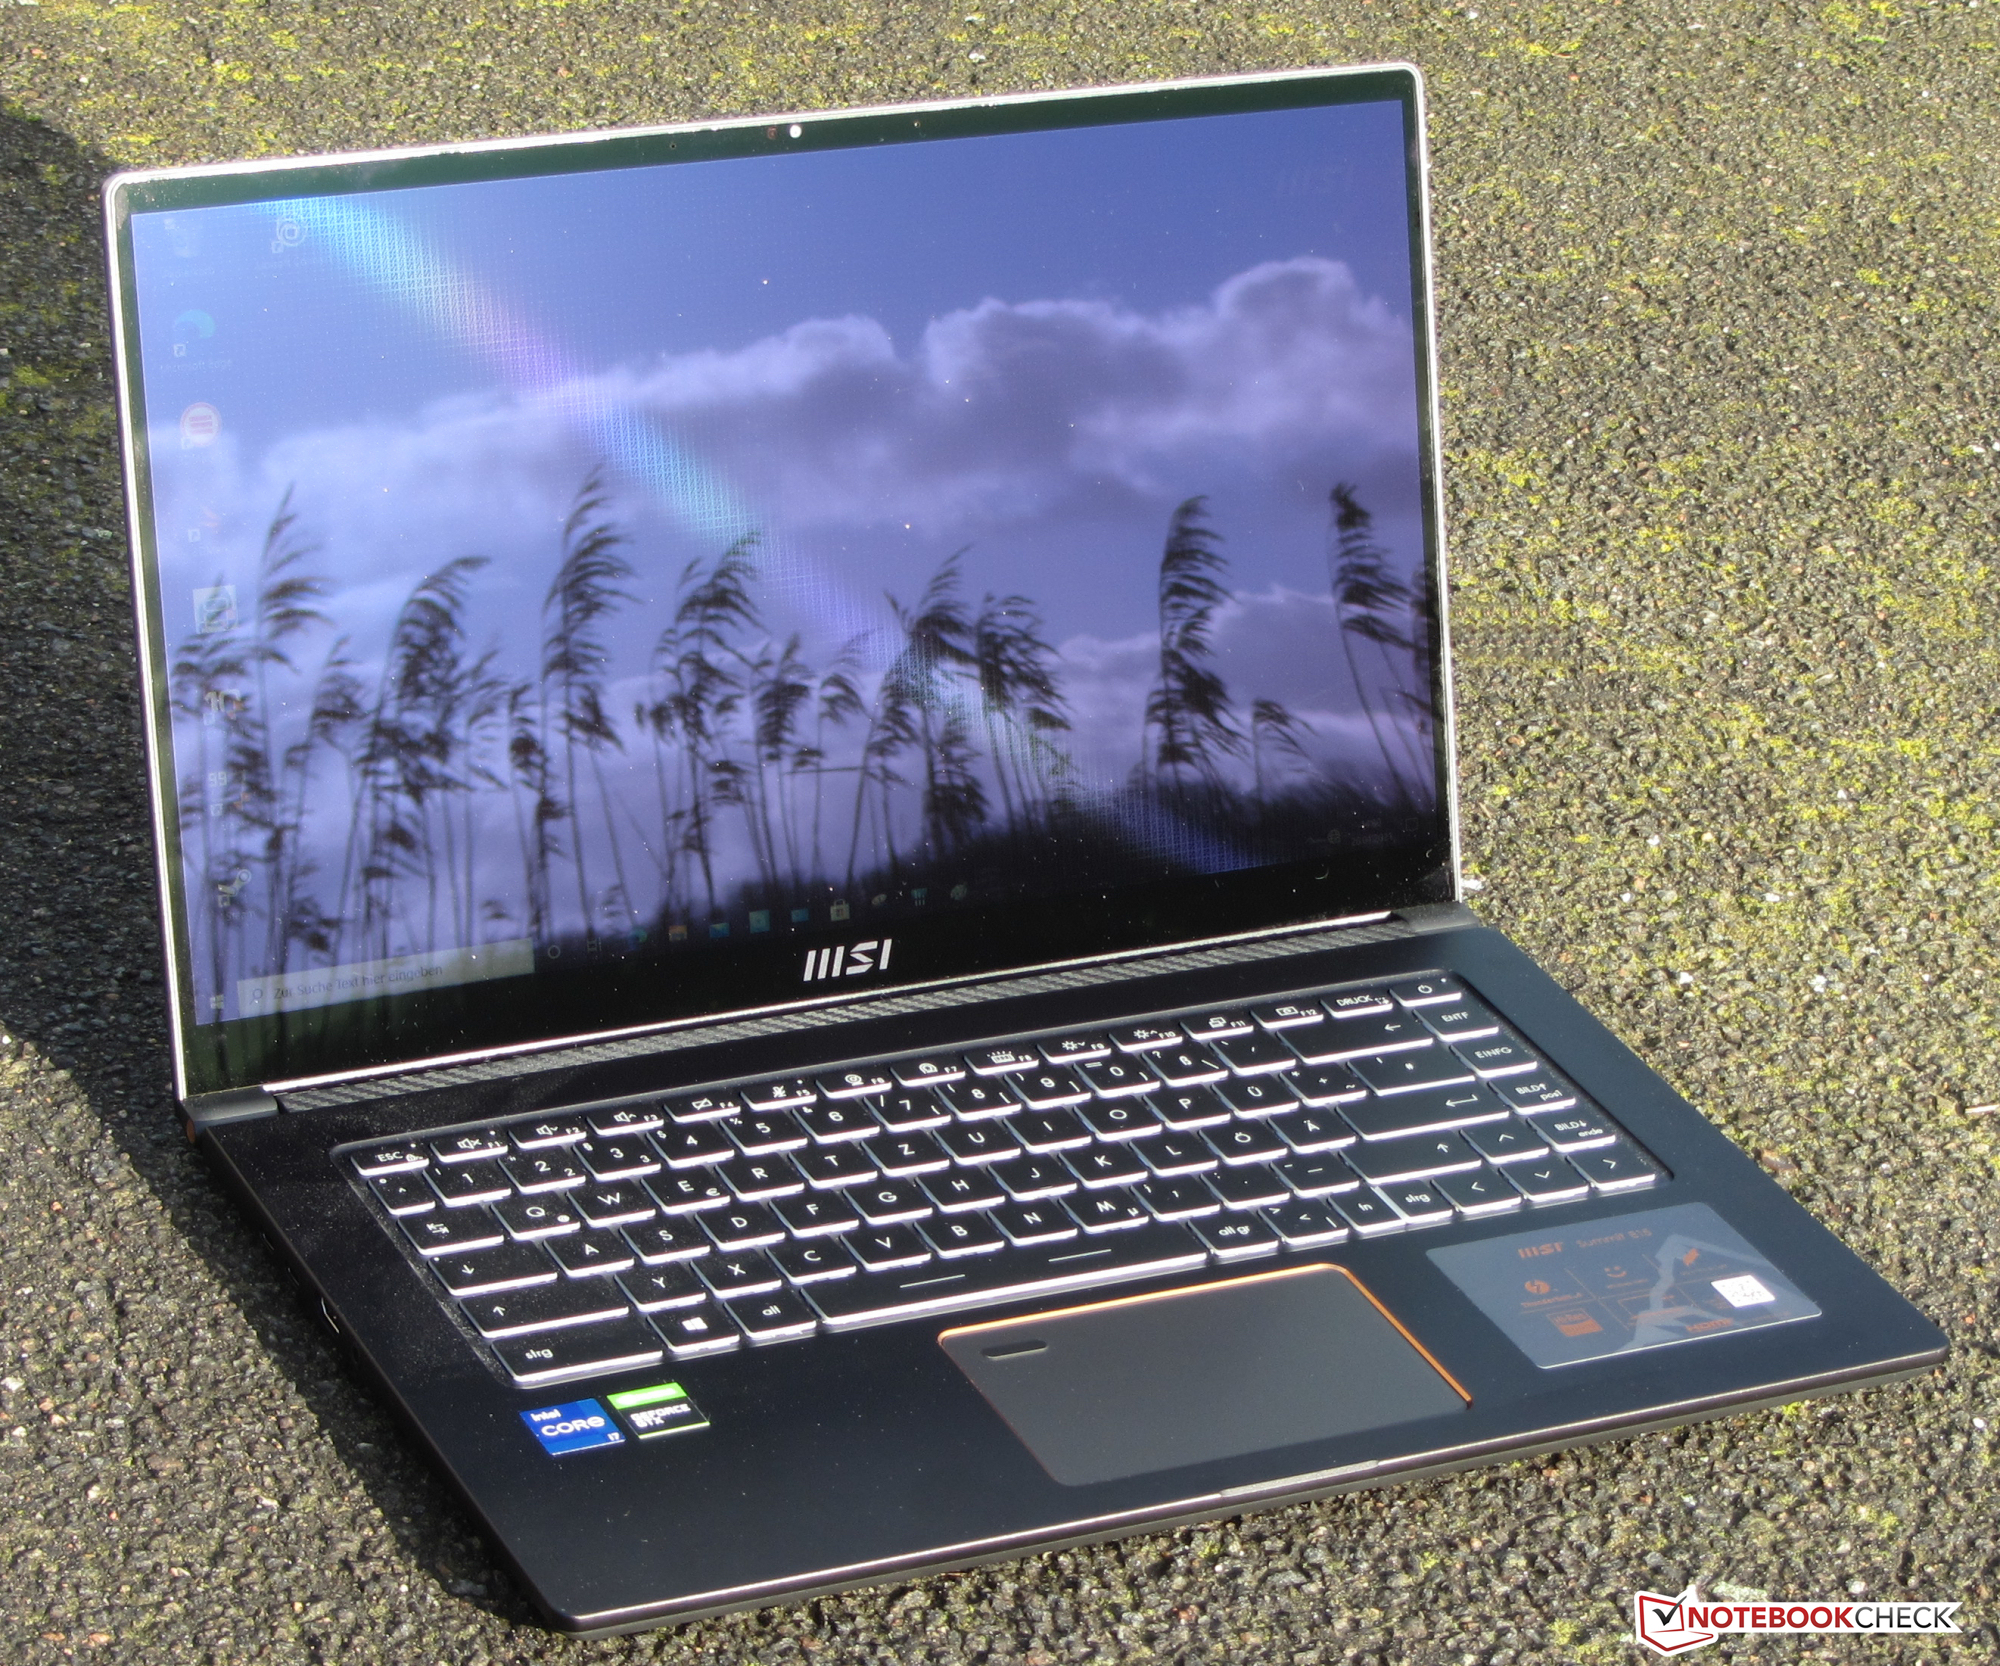
MSI Summit E15 laptop review: Advance into the premium business segment

With the Summit E15, MSI offers a 15.6-inch laptop in the business segment that is supposed to steal some customers from the established manufacturers in this segment. The test unit that was provided to us is run by a Core i7-1185G7 processor and GeForce GTX 1650 Ti-Max-Q graphics core. The competitors include devices such as the Lenovo ThinkPad X1 Extreme Gen3, the Dell XPS 15 9500, the Apple MacBook Pro 16 2019, and the Asus ZenBook Pro 15 UX535.
mögliche Konkurrenten im Vergleich
Rating | Date | Model | Weight | Height | Size | Resolution | Best Price |
|---|---|---|---|---|---|---|---|
| 83.7 % | 02/2021 | MSI Summit E15 A11SCST i7-1185G7, GeForce GTX 1650 Ti Max-Q | 1.8 kg | 16.9 mm | 15.60" | 1920x1080 | |
| 90.1 % | 01/2021 | Lenovo ThinkPad X1 Extreme Gen3-20TLS0UV00 i7-10750H, GeForce GTX 1650 Ti Max-Q | 1.7 kg | 18.7 mm | 15.60" | 1920x1080 | |
| 90.1 % | 06/2020 | Dell XPS 15 9500 Core i7 4K UHD i7-10875H, GeForce GTX 1650 Ti Mobile | 2 kg | 18 mm | 15.60" | 3840x2400 | |
| 89.7 % | 12/2019 | Apple MacBook Pro 16 2019 i9 5500M i9-9880H, Radeon Pro 5500M | 2 kg | 16.2 mm | 16.00" | 3072x1920 | |
| 87 % | 12/2020 | Asus ZenBook UX535-M01440 i7-10750H, GeForce GTX 1650 Ti Max-Q | 2 kg | 20 mm | 15.60" | 3840x2160 |
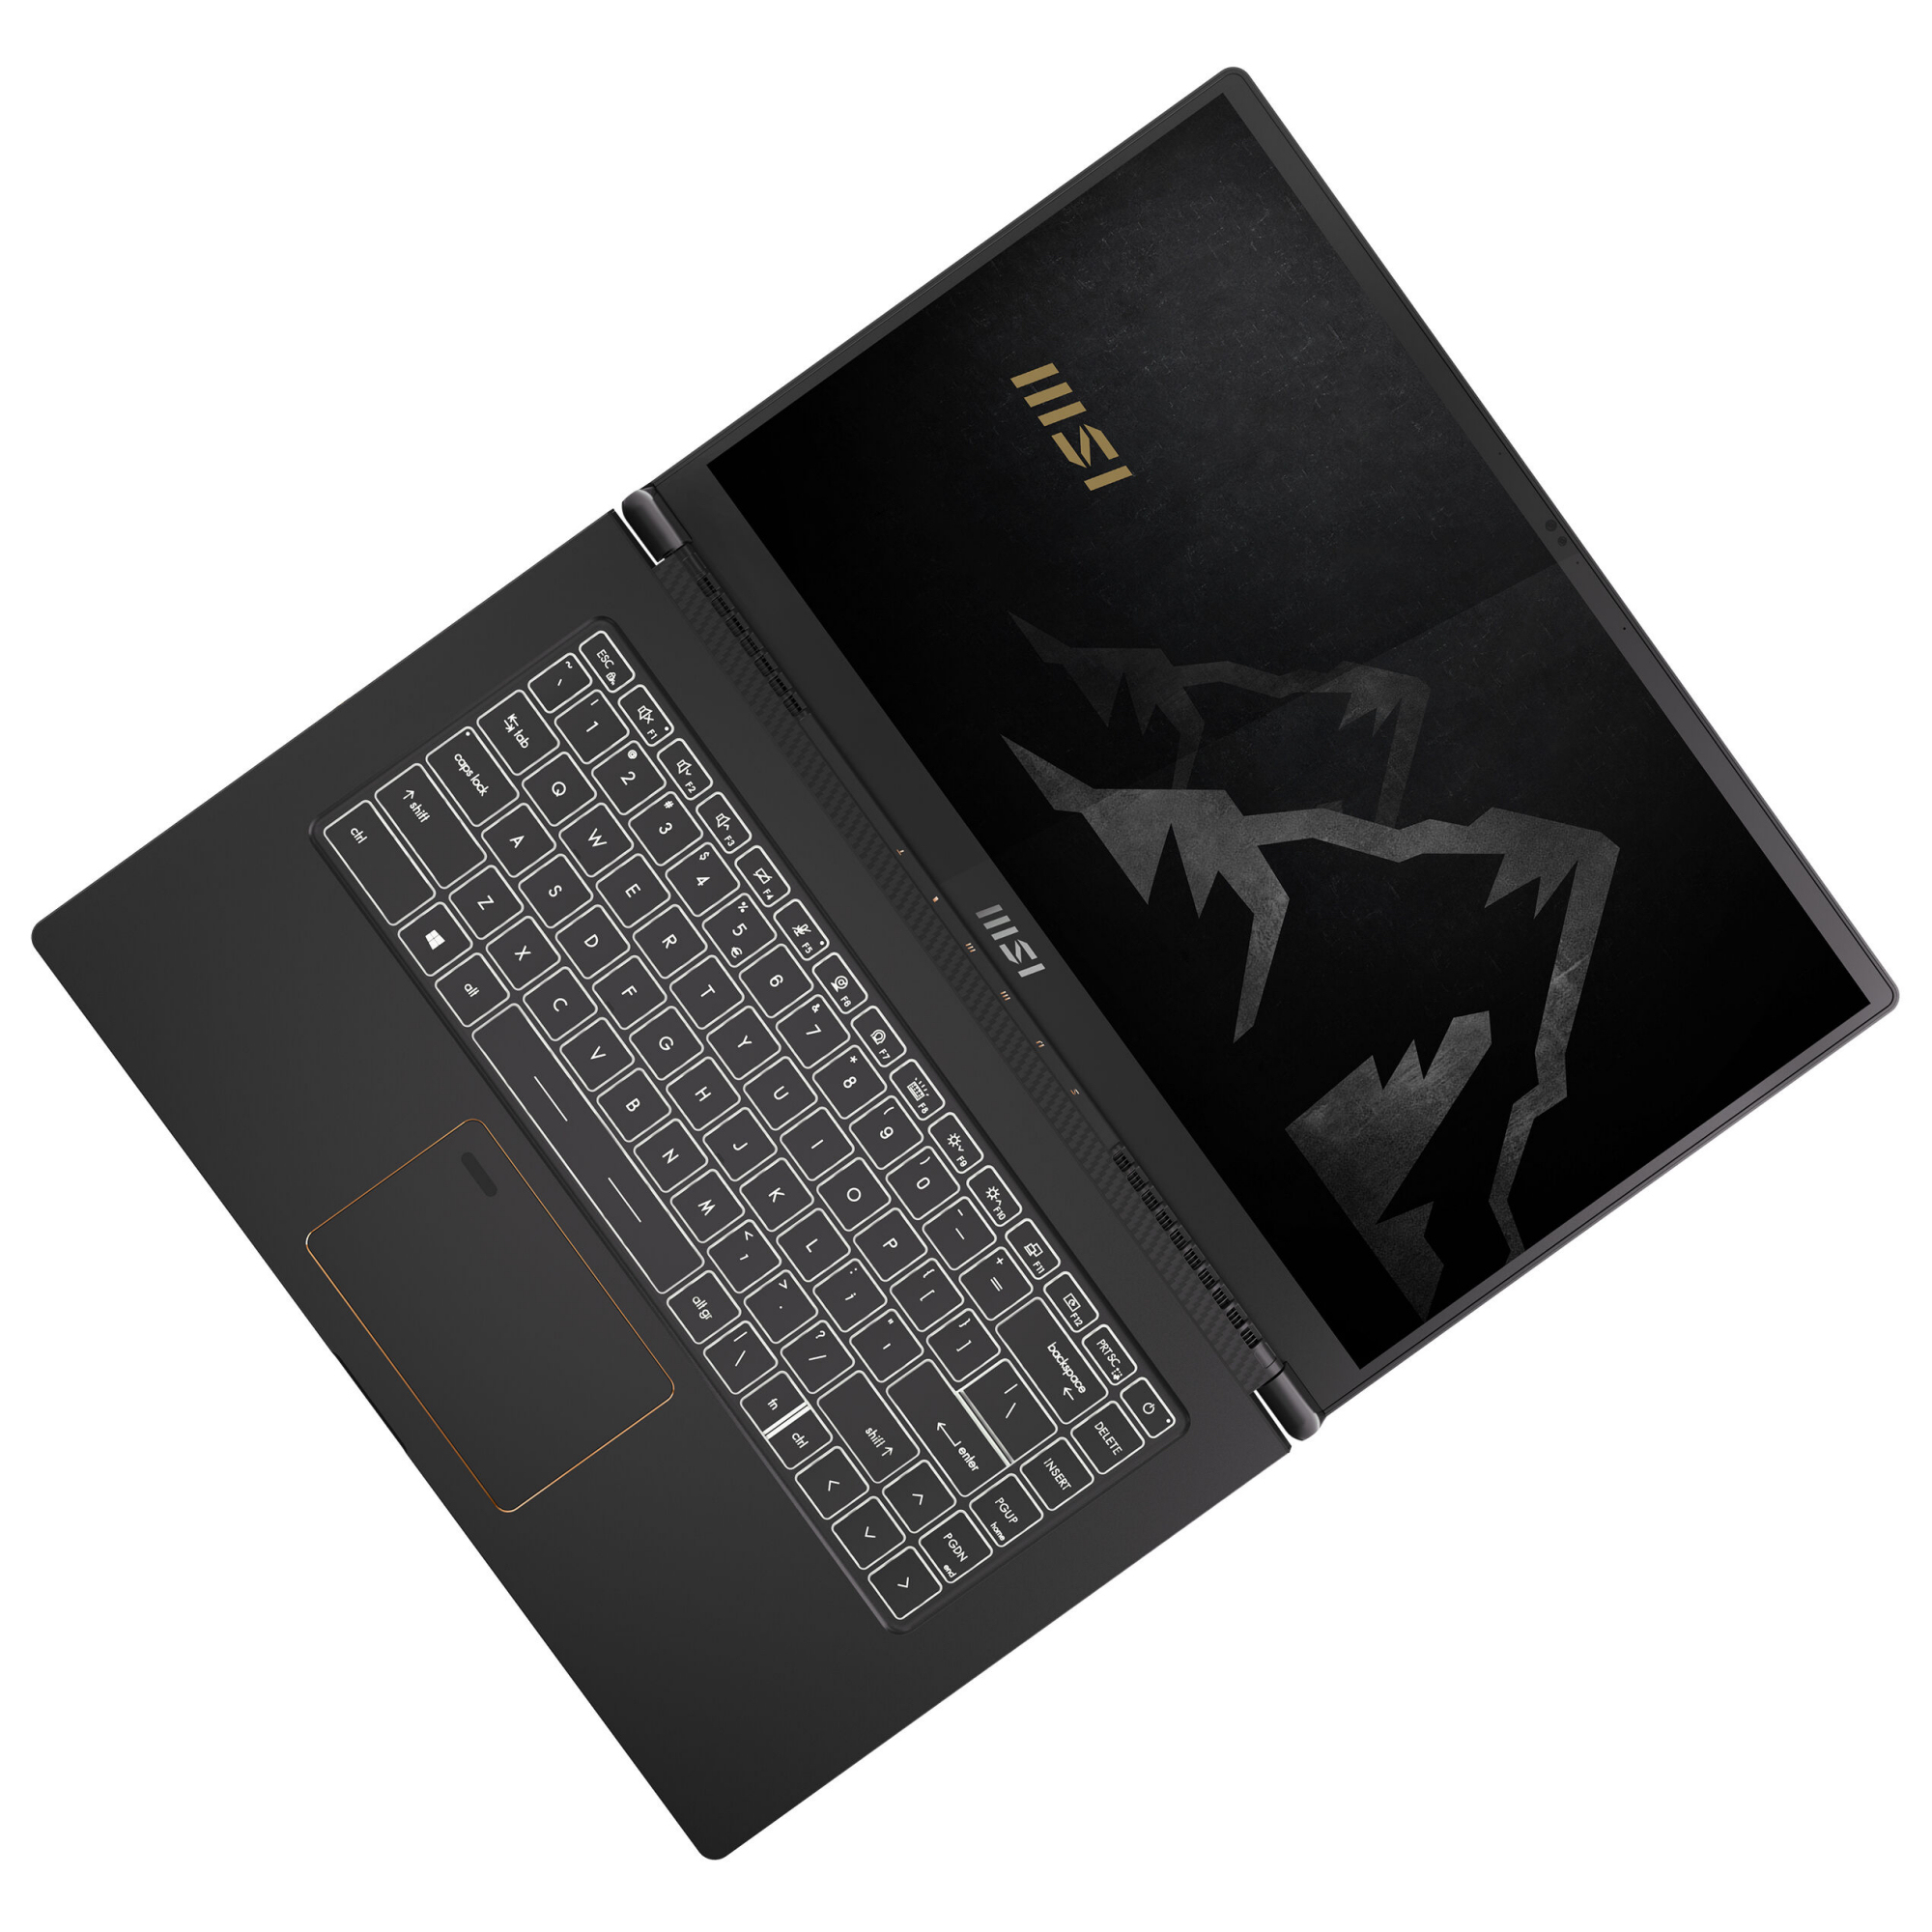
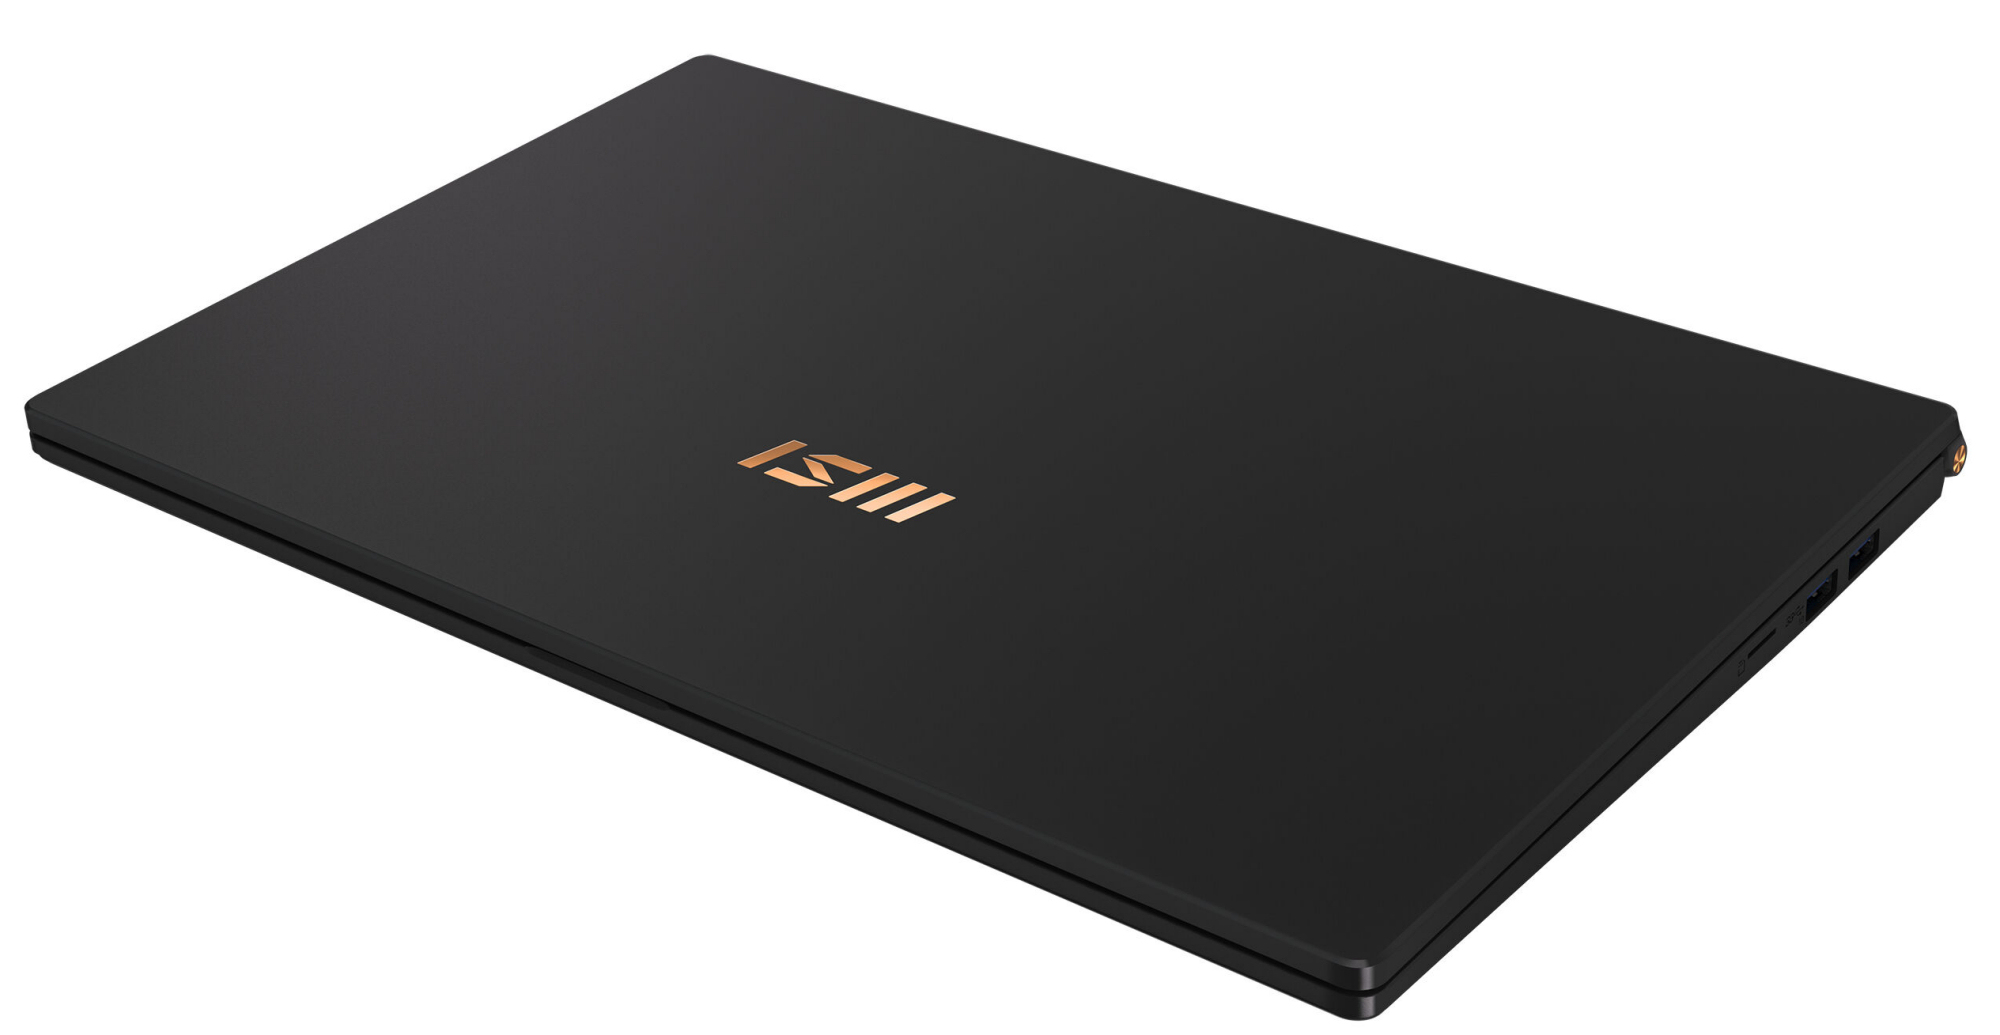
Case - The Summit E15 with a metal case
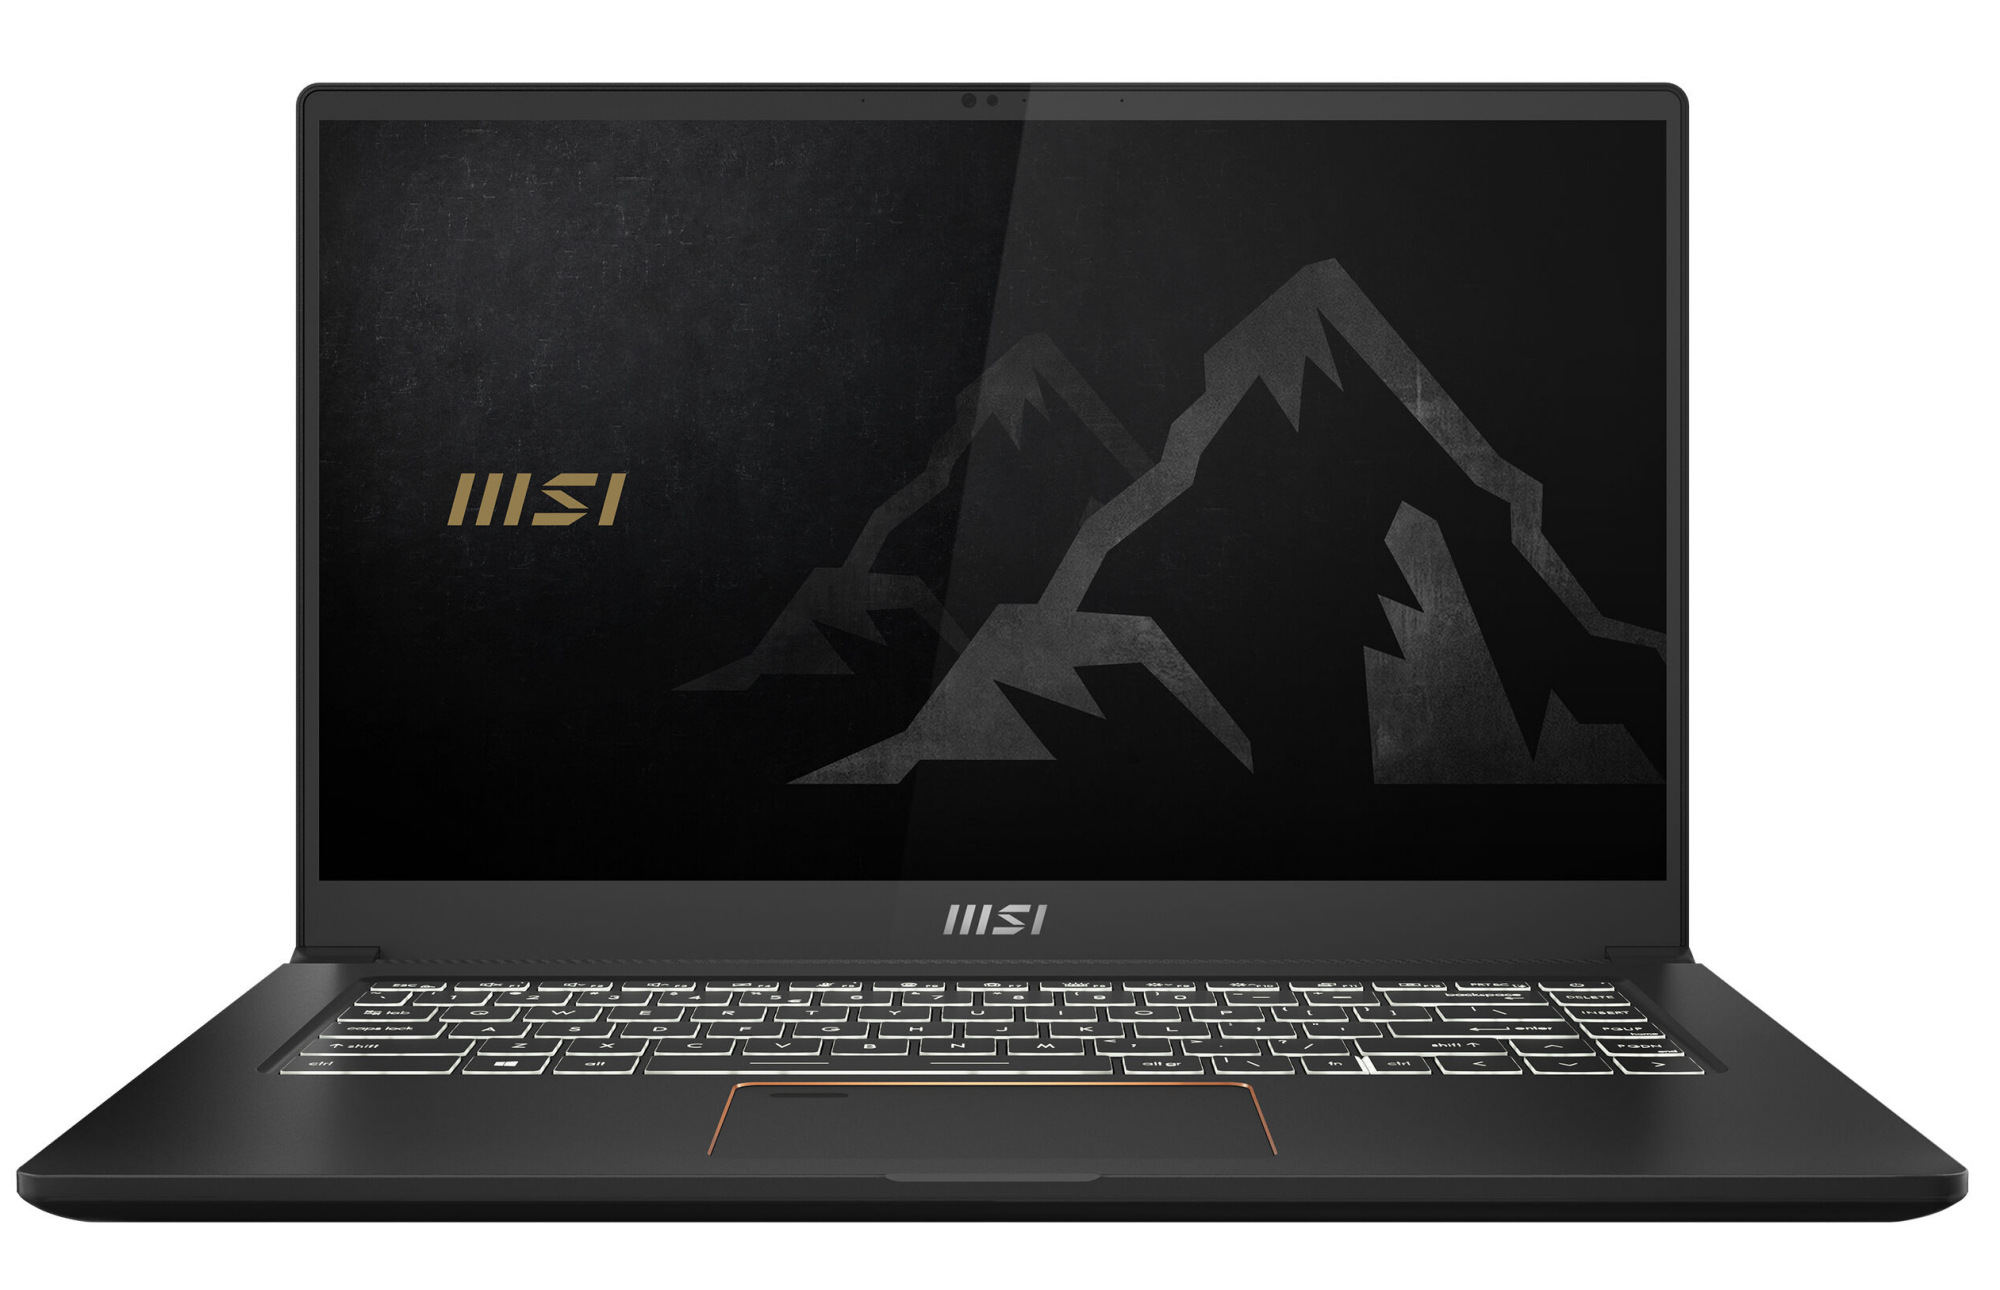
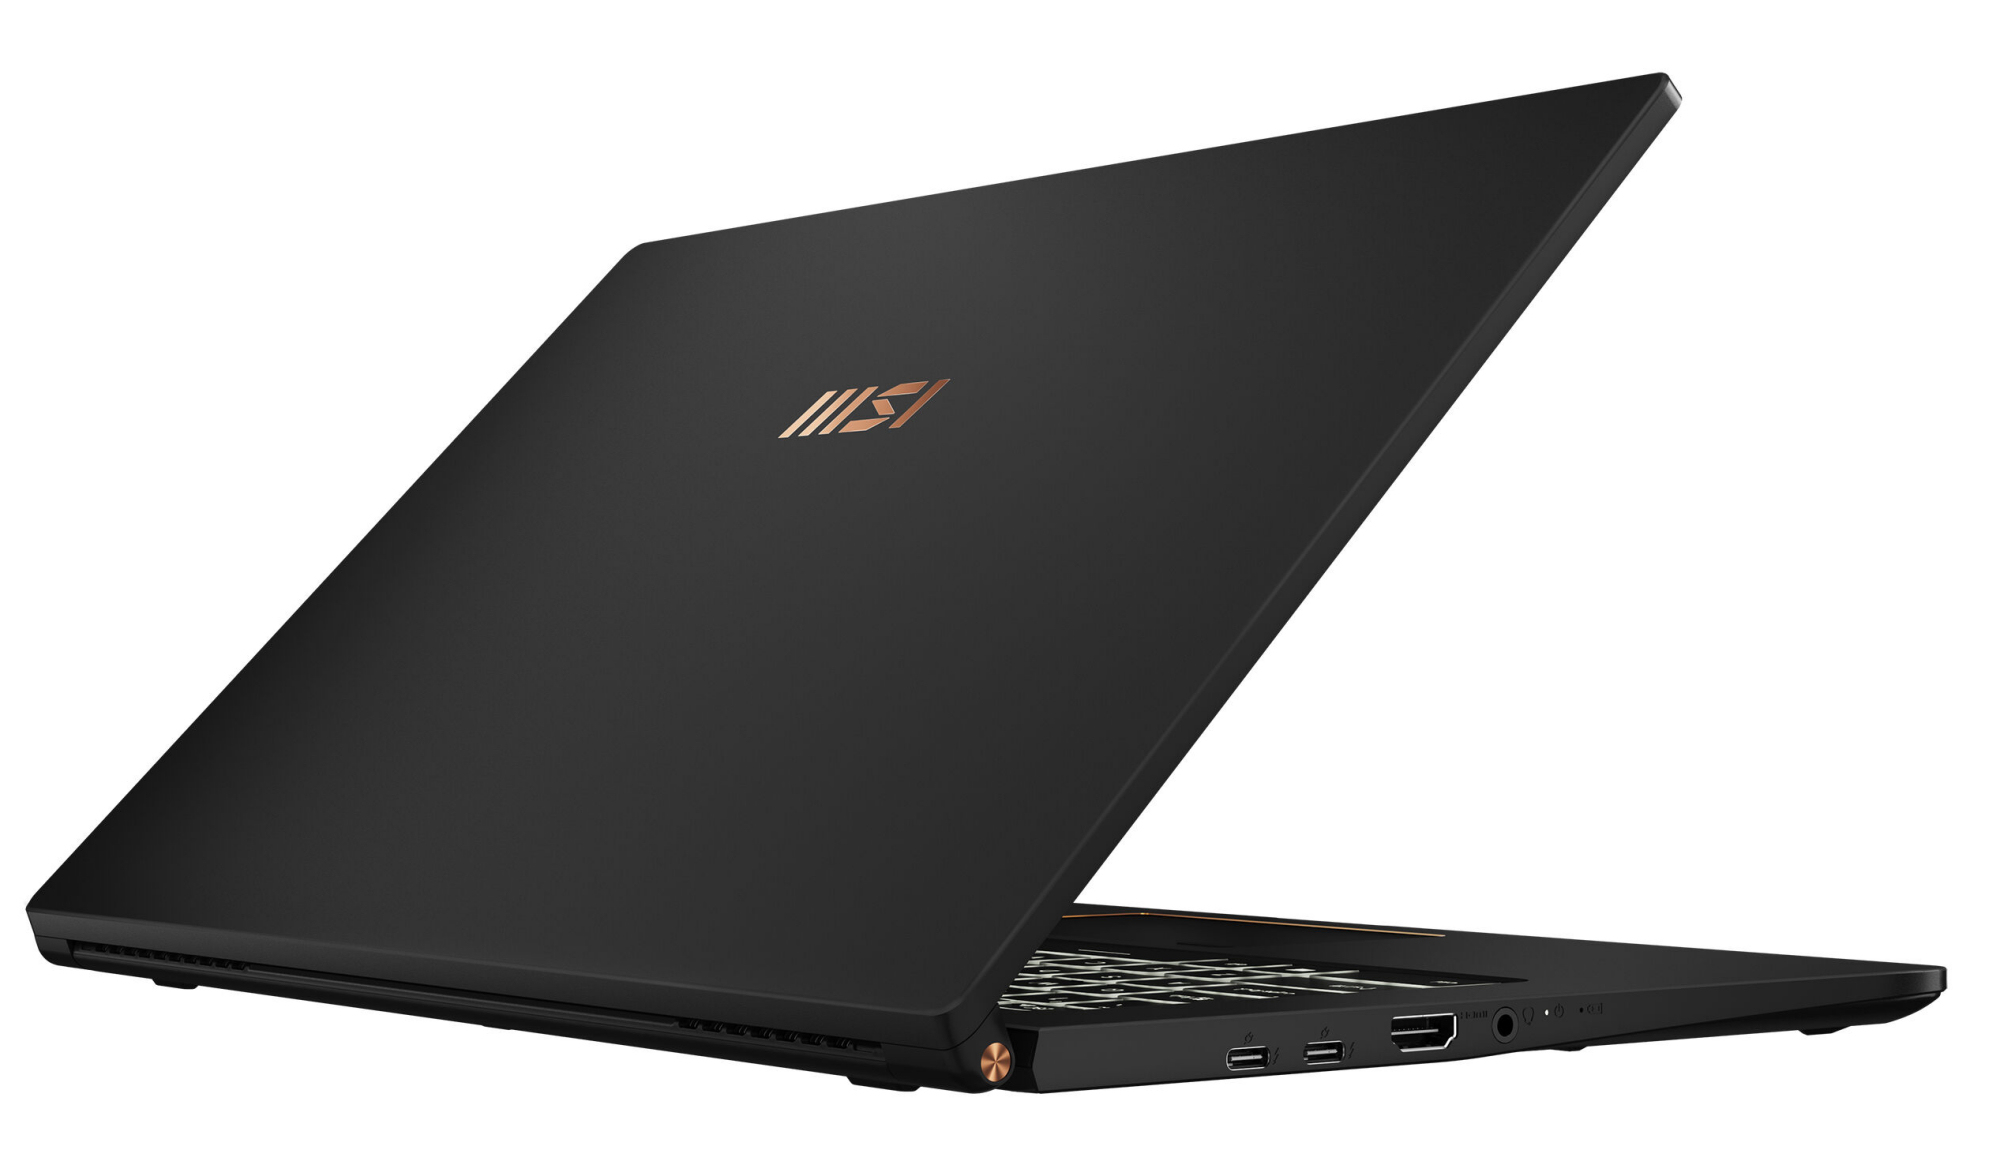
MSI wraps the hardware of the Summit in a slim, black metal case that has a smooth, matte surface. The milled edge around the ClickPad, the hinge covers on the sides, and the MSI Logo on the back, which are all kept in copper color, offer some design accents. The battery is built-in. There is no maintenance flap, and you can only access the hardware after removing the bottom cover.
The 15.6-inch laptop does not show any faults in the workmanship. The gap clearances are even and there are no noticeable material protrusions. However, the stability could be better, since the lid and particularly the base unit can be warped significantly, and they lack in stiffness. The hinges hold the lid tightly in place, even though you can open the lid using a single hand. The maximum opening angle is 180 degrees.
The Dell XPS 15 is the most compact device in our comparison field, and the ThinkPad X1 Extreme is the lightest. The E15 is positioned in the between the two: while it weighs less than the XPS it is more compact than the ThinkPad.
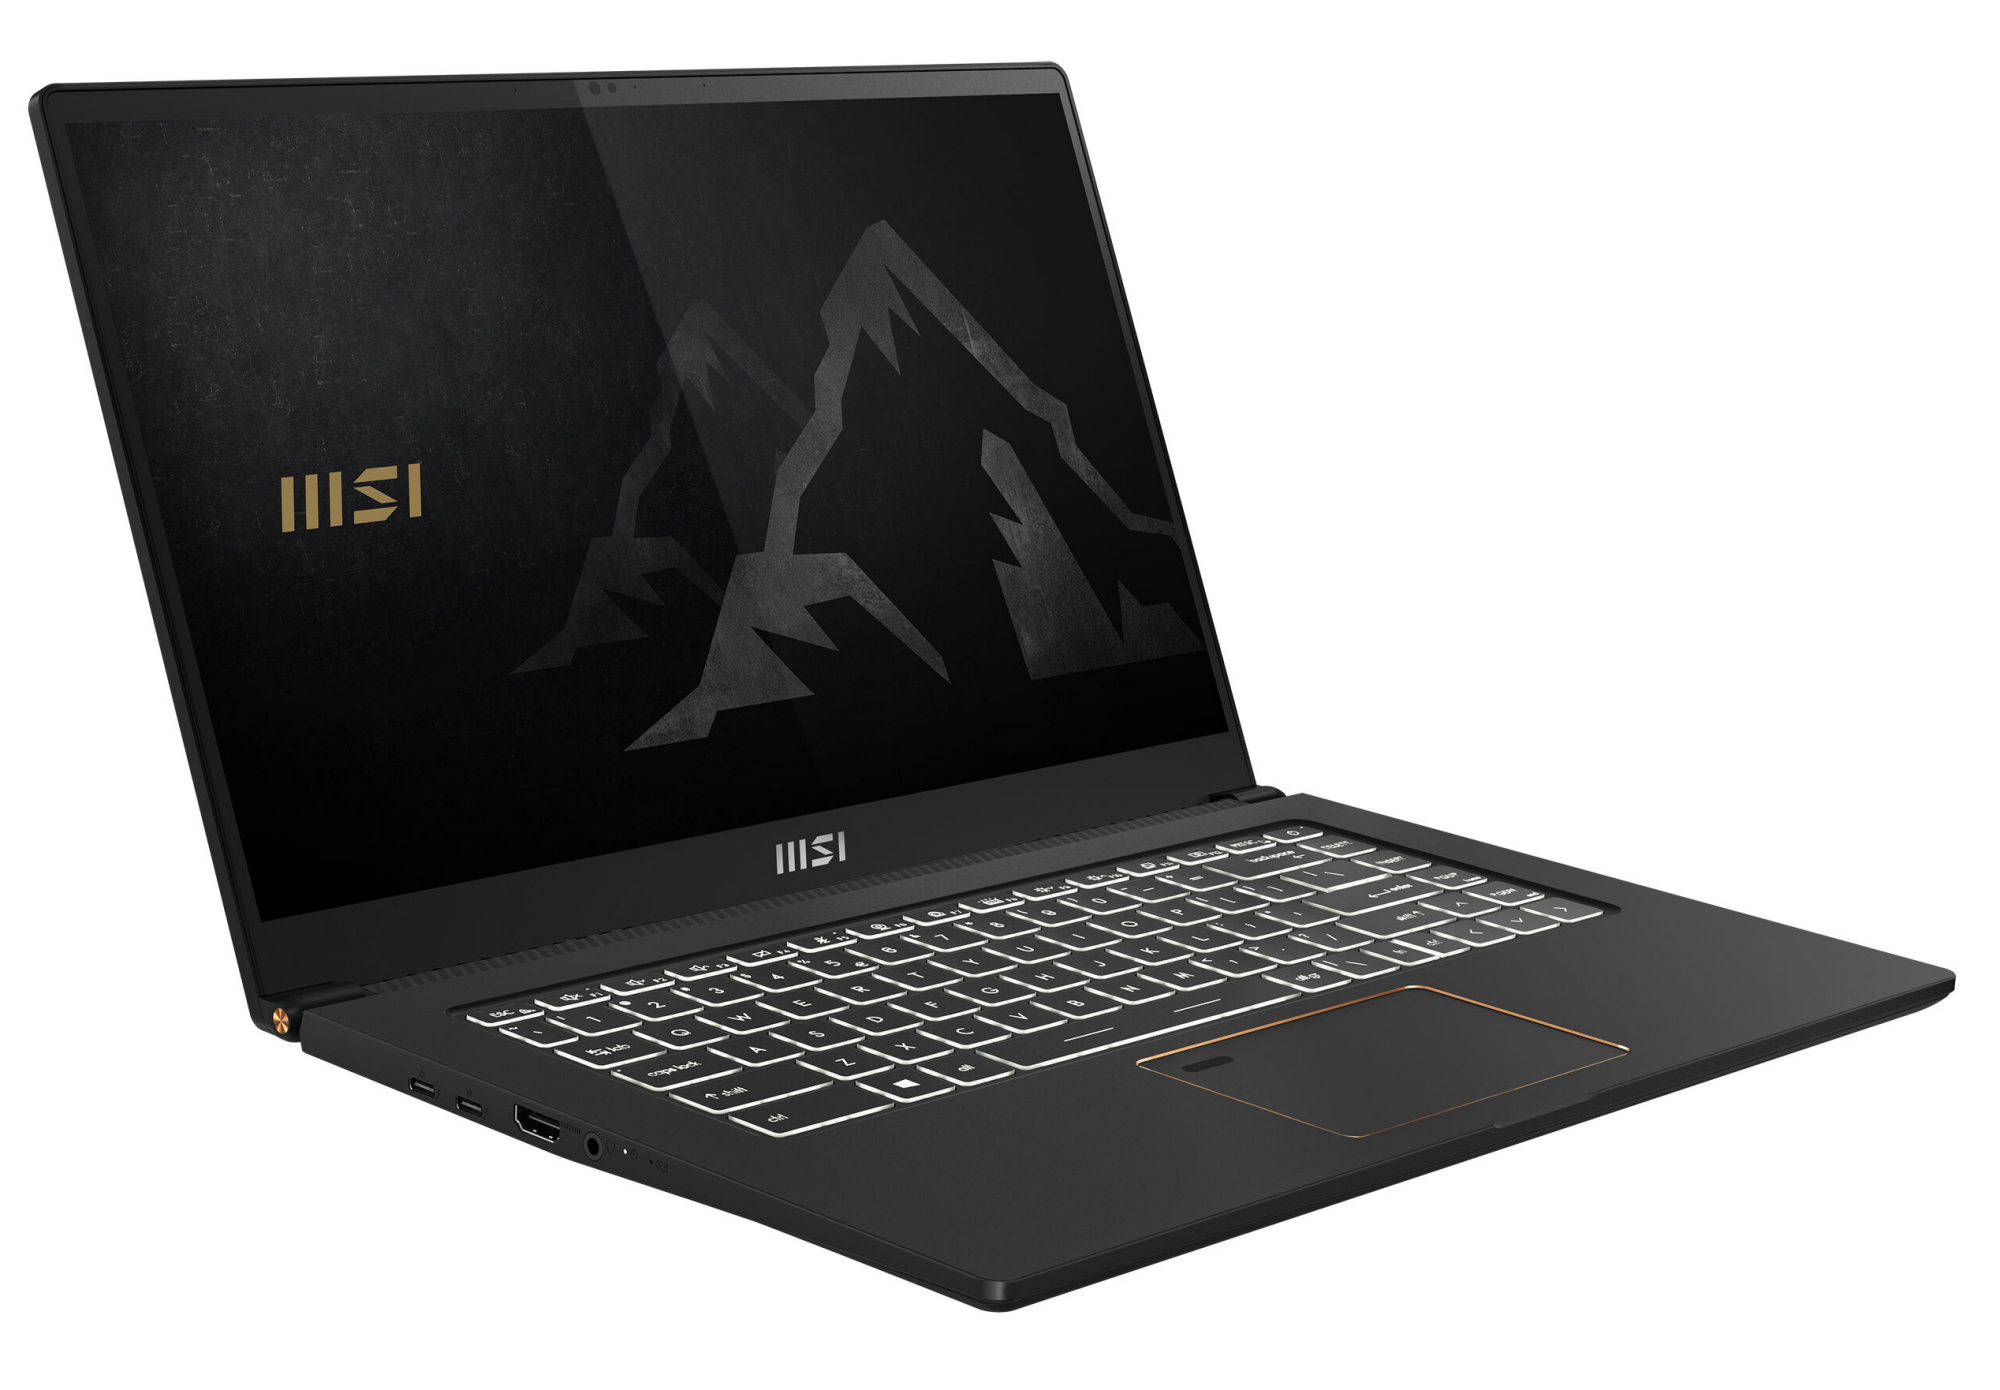
Connections - Thunderbolt 4 included
MSI has equipped the E15 with two USB Type-A (USB 3.2 Gen 2) and two USB Type-C (USB 4/Thunderbolt 4) ports. The latter support power delivery and DisplayPort via USB-C, so you can connect accessories such as a docking station or external GPU to the second USB-C port, while the power supply is also connected. In total, the 15.6-inch laptop offers three video ports (2x DP, 1x HDMI). They are accompanied by an audio combo port as well as a microSD storage card reader.


Communication
The Intel AX201 WLAN chip supports the 802.11 a/b/g/n/ac/ax standards and also offers Bluetooth 5 functionality. The data rates measured under optimal conditions (no additional WLAN devices close by and close distance between the laptop and the Server PC) turn out very good. The laptop does not offer an Ethernet connection, so if that's what you need, you have to use a USB adapter. There is also no 5G LTE modem, not even as an option.
Webcam
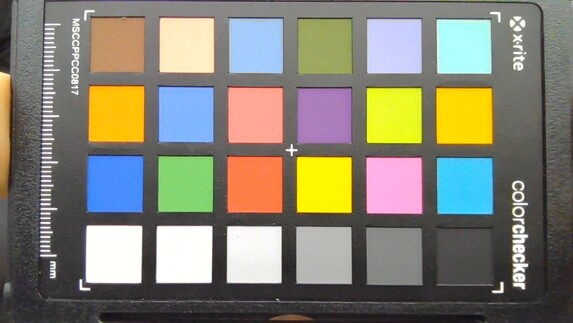
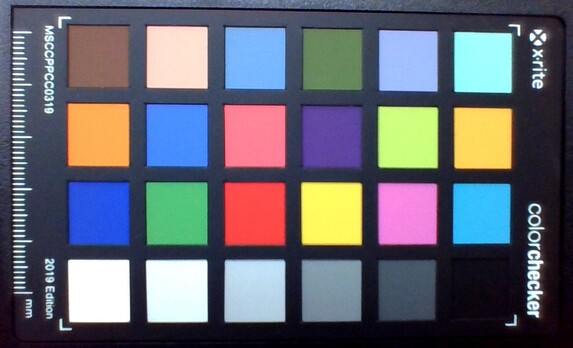
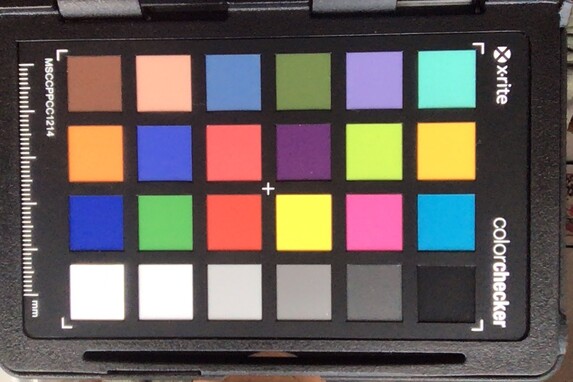
In terms of quality, the webcam (0.9 MP, max. 1280 x 720 pixels) is unable to distinguish itself from the competitors. In addition, it lacks color accuracy, missing the target of Delta-E smaller than 3 with a deviation of almost 15.


Security
The Summit brings a fingerprint reader that is integrated into the ClickPad, offering biometric access for security. Alternatively you can also get access via Windows Hello. In addition, there is a Trusted Platform Module (2.0). There is no slot for a Kensington lock.
Accessories
There are no additional accessories included besides the usual documentation (warranty information, quick-start manual).
Maintenance
You can access the hardware after removing the bottom of the case. To do that, you first have to remove all the screws from the case bottom, before you can loosen it using a flat prying tool.

Warranty
MSI offers a 2-year warranty for the 15.6-inch laptop. You can purchase a warranty extension for one or two years for 120 Euros (~$146) or 250 Euros (~$303) respectively.
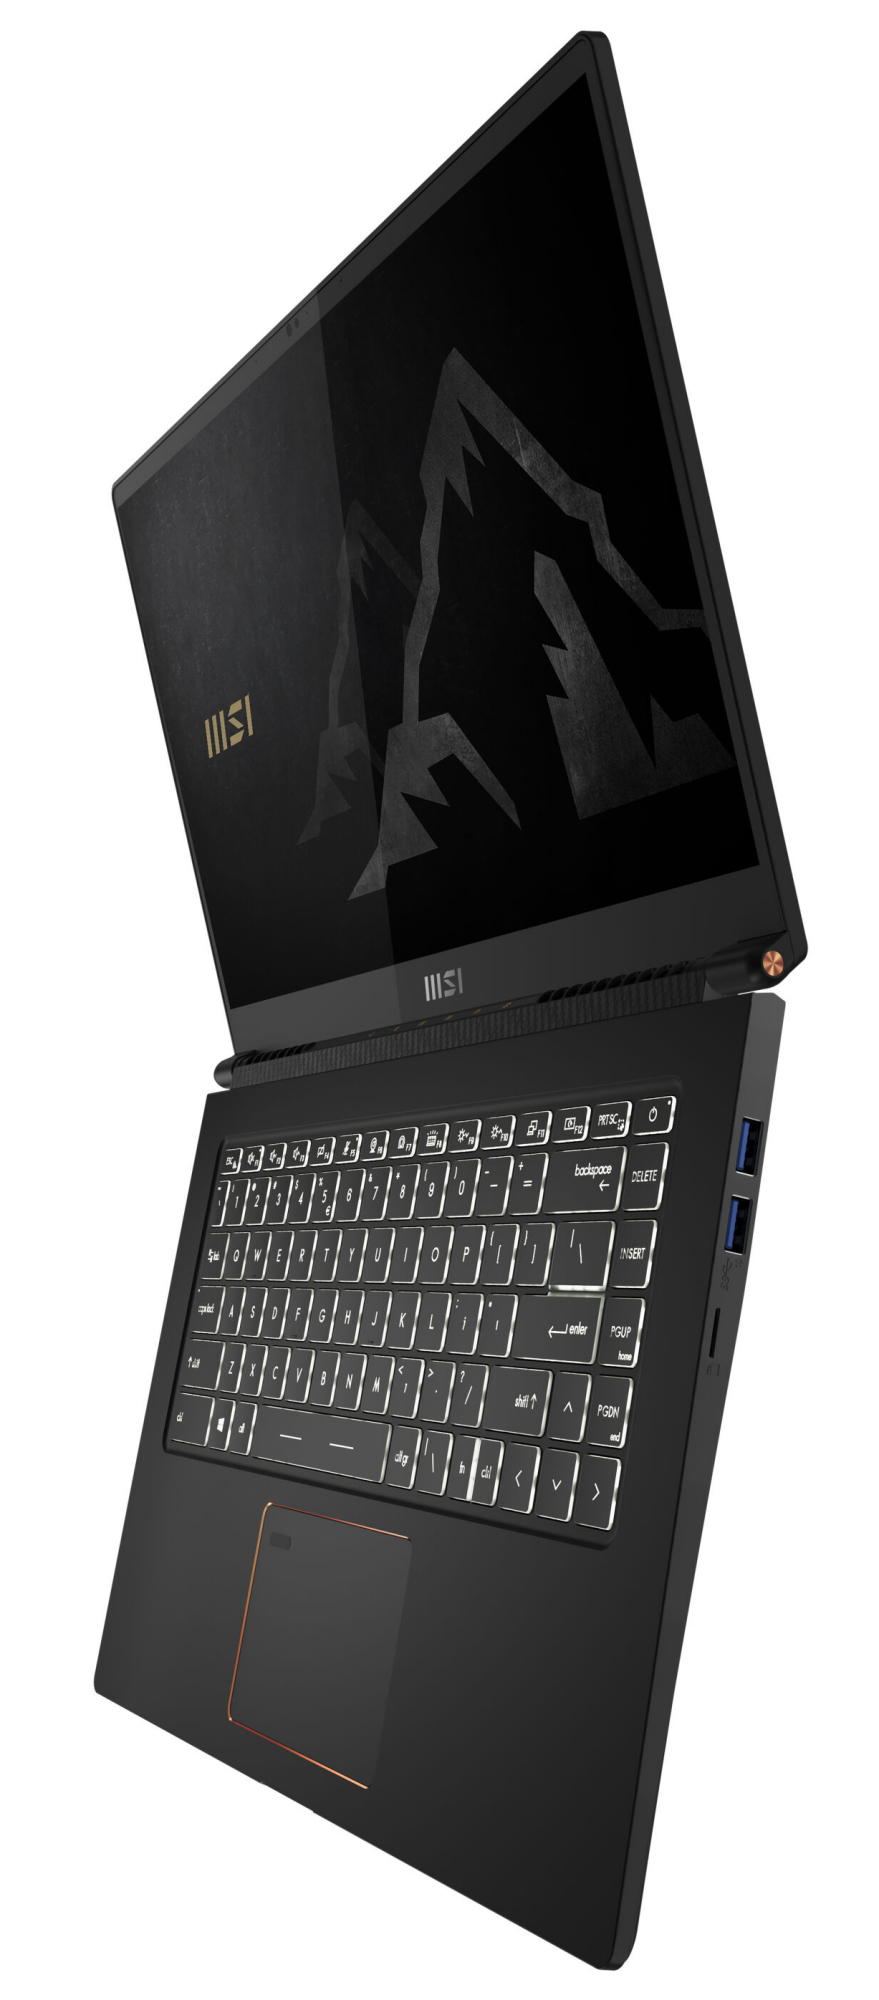
Input Devices - The MSI laptop offers keyboard illumination
Keyboard
MSI has equipped the 15.6-inch laptop with an illuminated chiclet keyboard. There is no number block. The size of the main keys is 16 x 16 mm (~0.63 x 0.63 in) and the distance between the keys, about 3 mm (~0.11 in). The smooth, flat keys offer a short stroke and clear pressure point. The resistance of the keys could have been more crisp in our opinion. The keyboard does not yield while typing. The three-step illumination is controlled via a function key. Overall, MSA delivers a keyboard suitable for everyday tasks.
Touchpad
The smooth surface of the multitouch-capable ClickPad (~10.5 x 6.5 cm, ~4.1 x 2.6 in) makes sliding the fingers easy. The pad also responds to input in the corners. It has a short stroke and clear pressure point.

Touchscreen
The touchscreen supports 10 touch points and responds to input promptly. It did not give us any trouble.
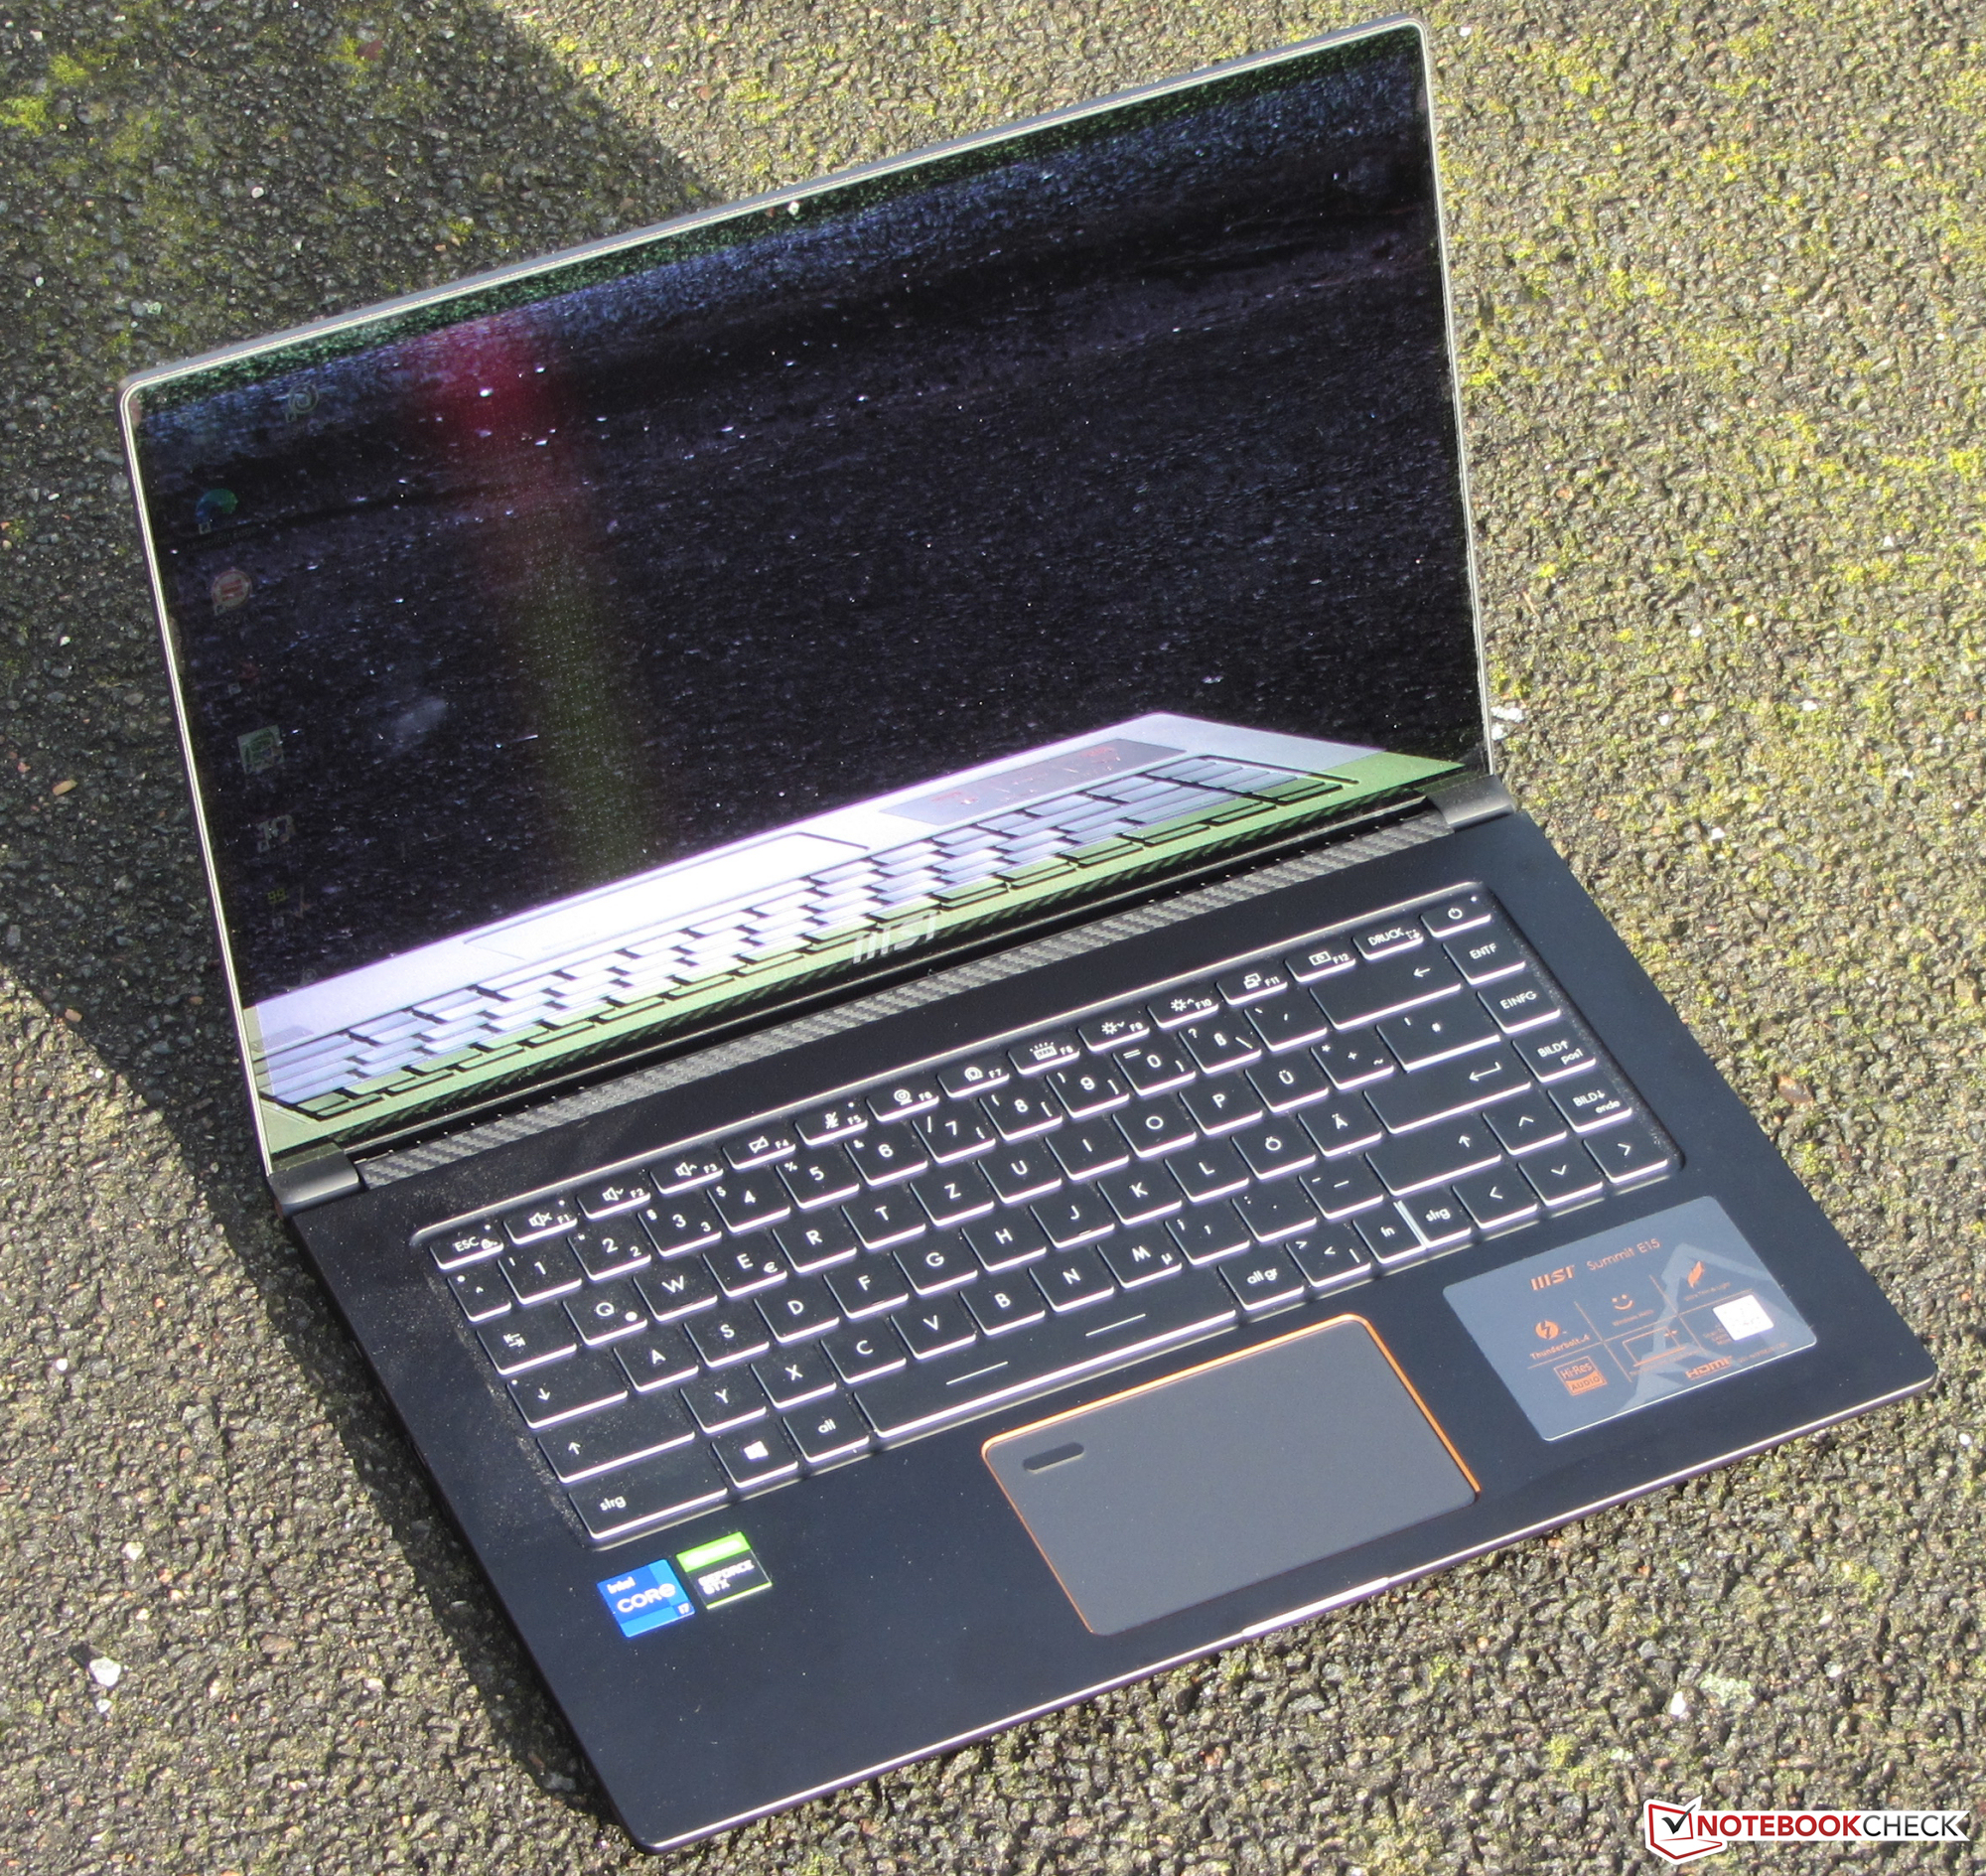
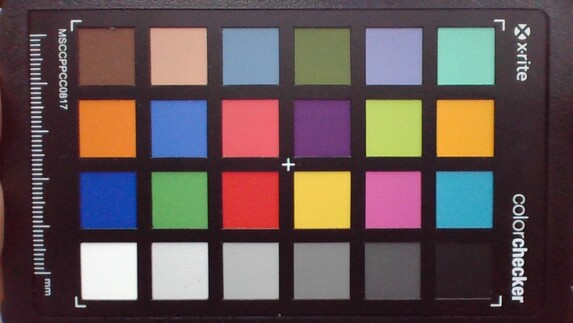
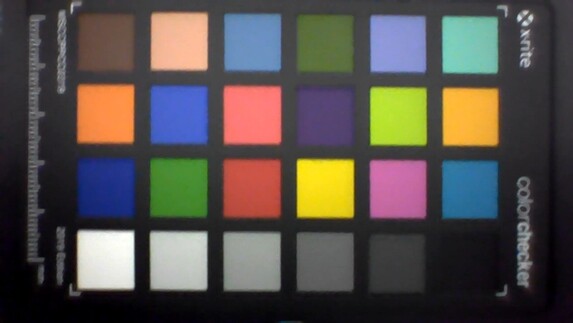
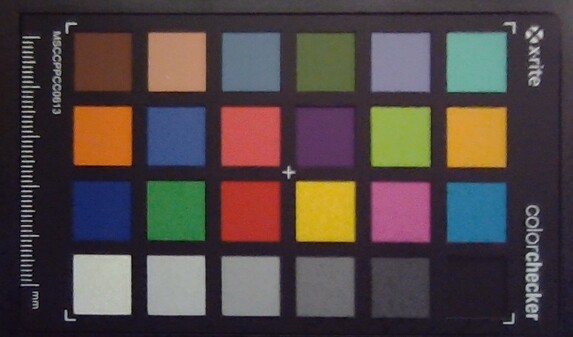
Display - Touchscreen with a reflective surface
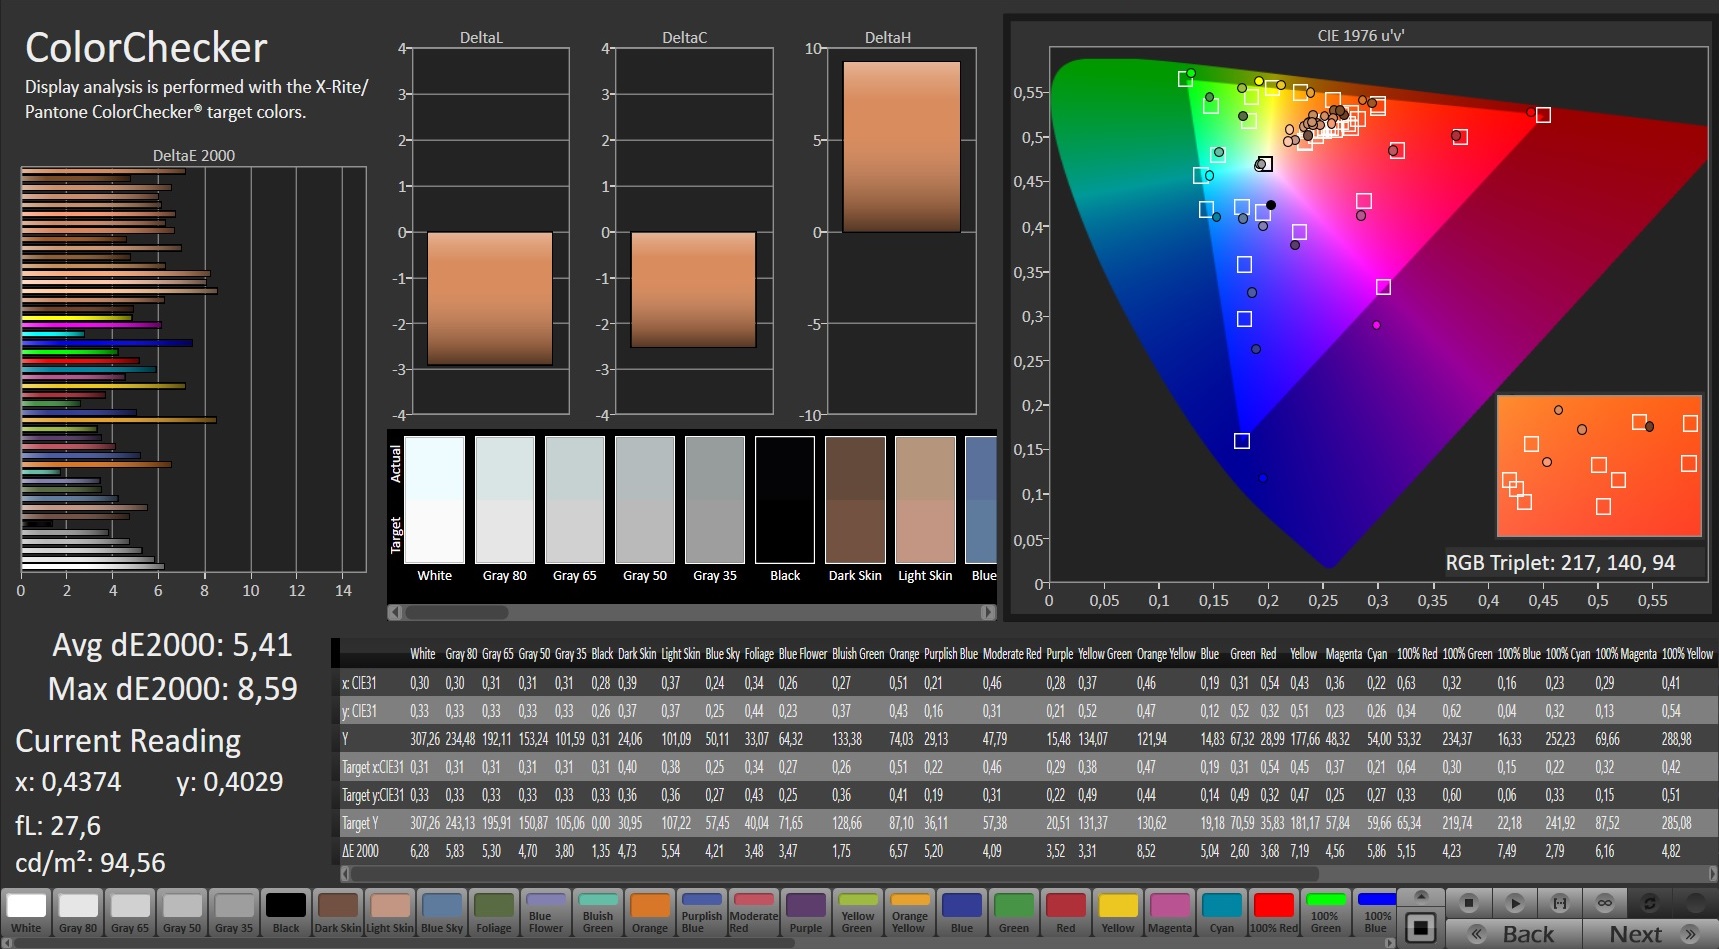
The reflective 15.6-inch touchscreen display has a native resolution of 1920 x 1080 pixels. While the contrast (1355:1) meets the required target (> 1000:1), the brightness turns out too low (280.3 cd/m²). A 2000-Euro (~$2427) laptop should offer more. We consider values higher than 300 cd/m² to be good. The competitors are able to offer significantly brighter screens. Alternatively, MSI offers a 4k display (without touchscreen) for the Summit.
| |||||||||||||||||||||||||
Brightness Distribution: 90 %
Center on Battery: 298 cd/m²
Contrast: 1355:1 (Black: 0.22 cd/m²)
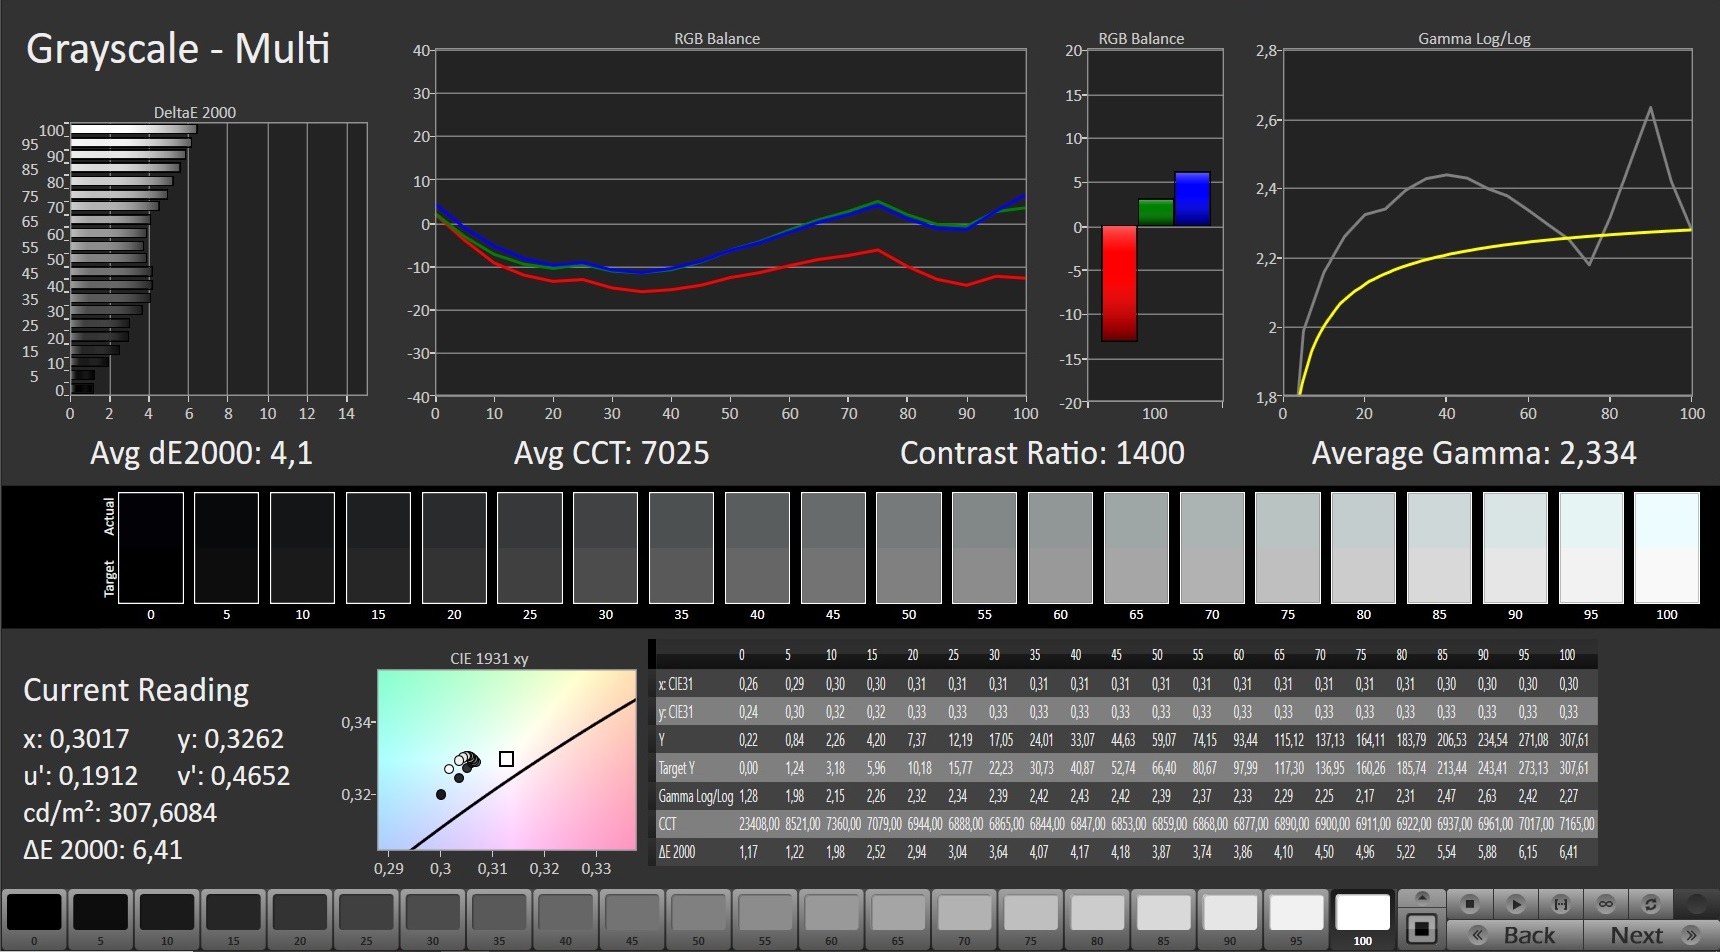
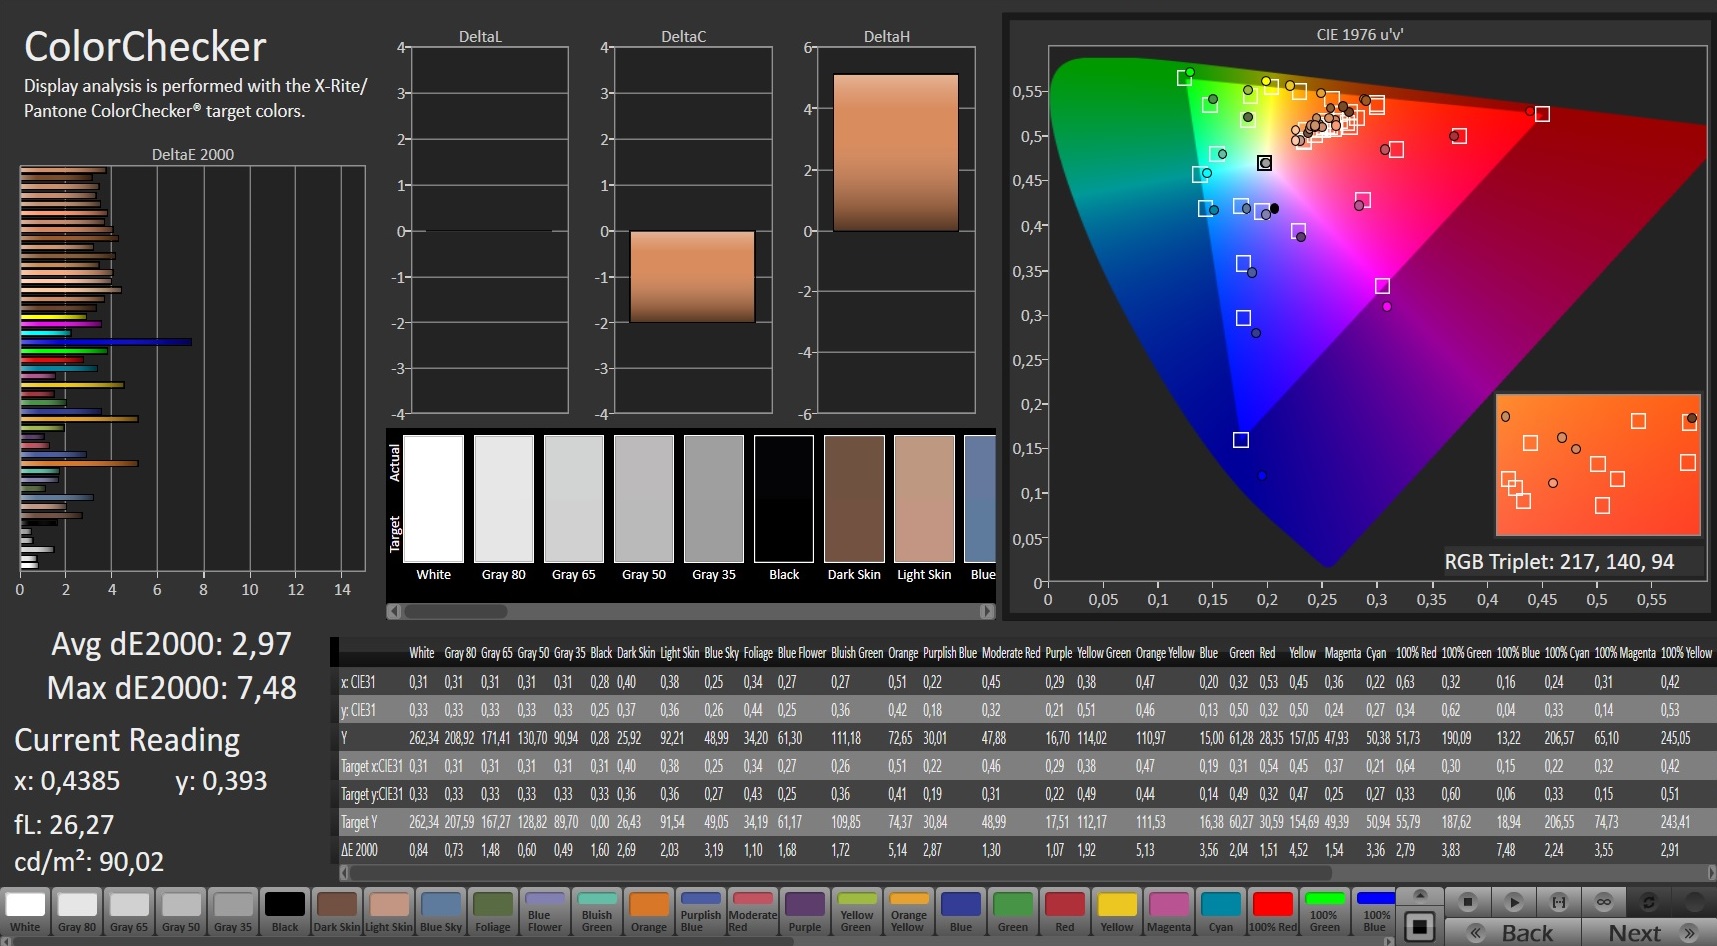
ΔE Color 5.41 | 0.5-29.43 Ø5, calibrated: 2.97
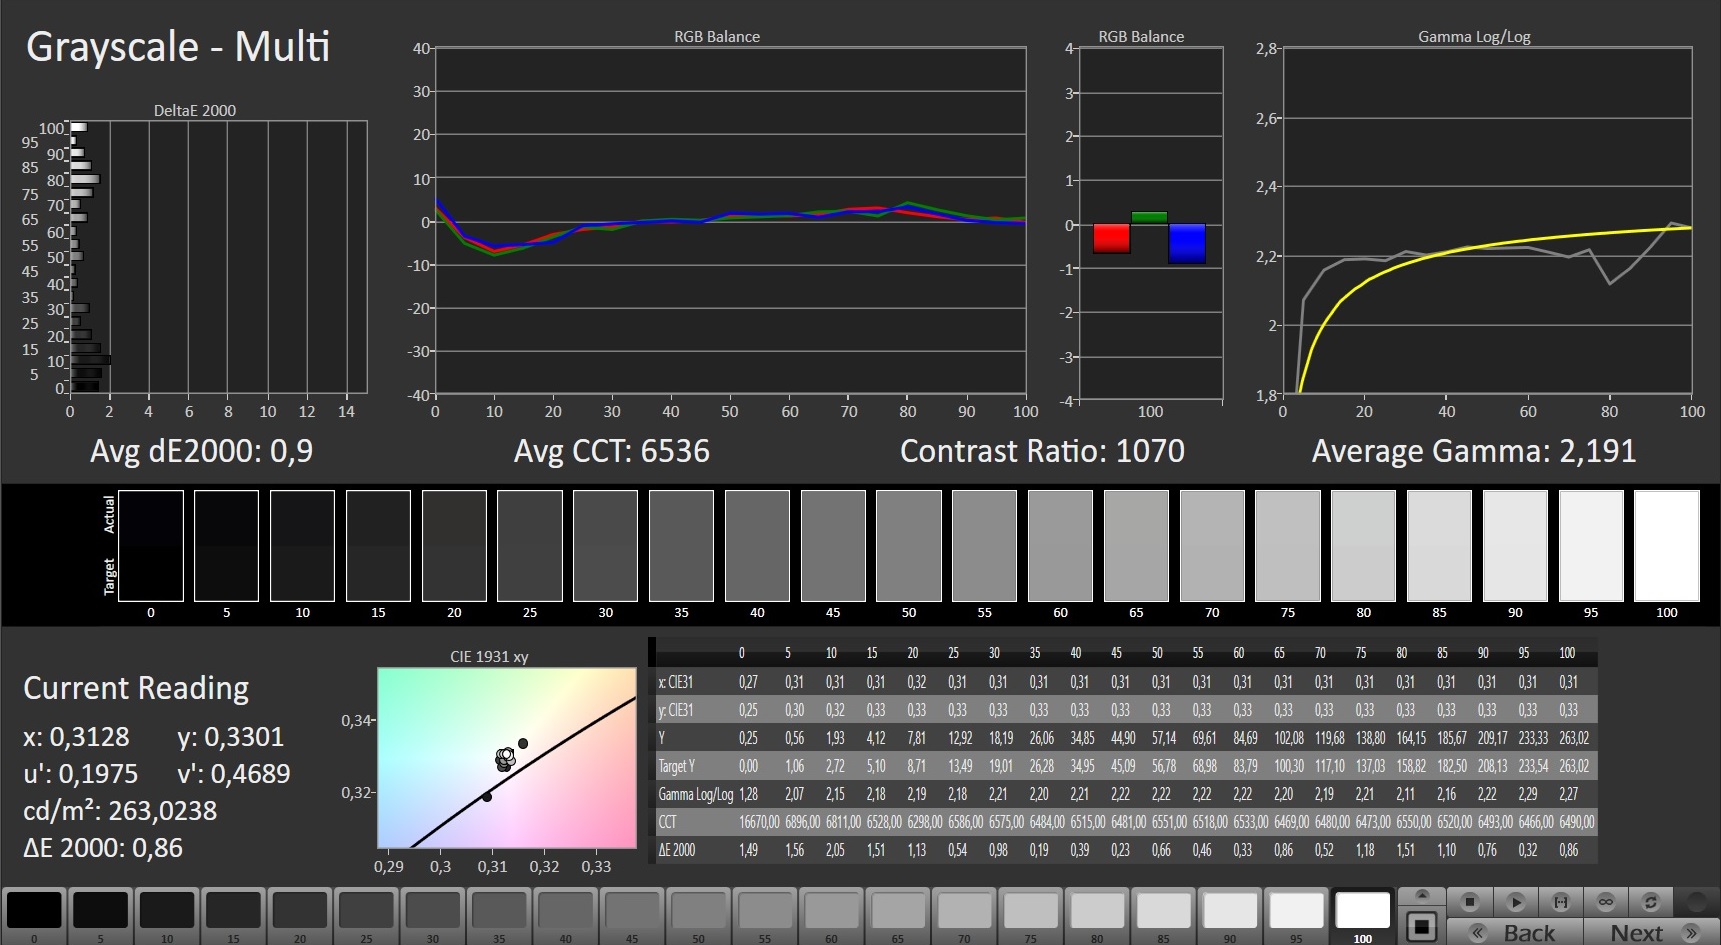
ΔE Greyscale 4.1 | 0.57-98 Ø5.3
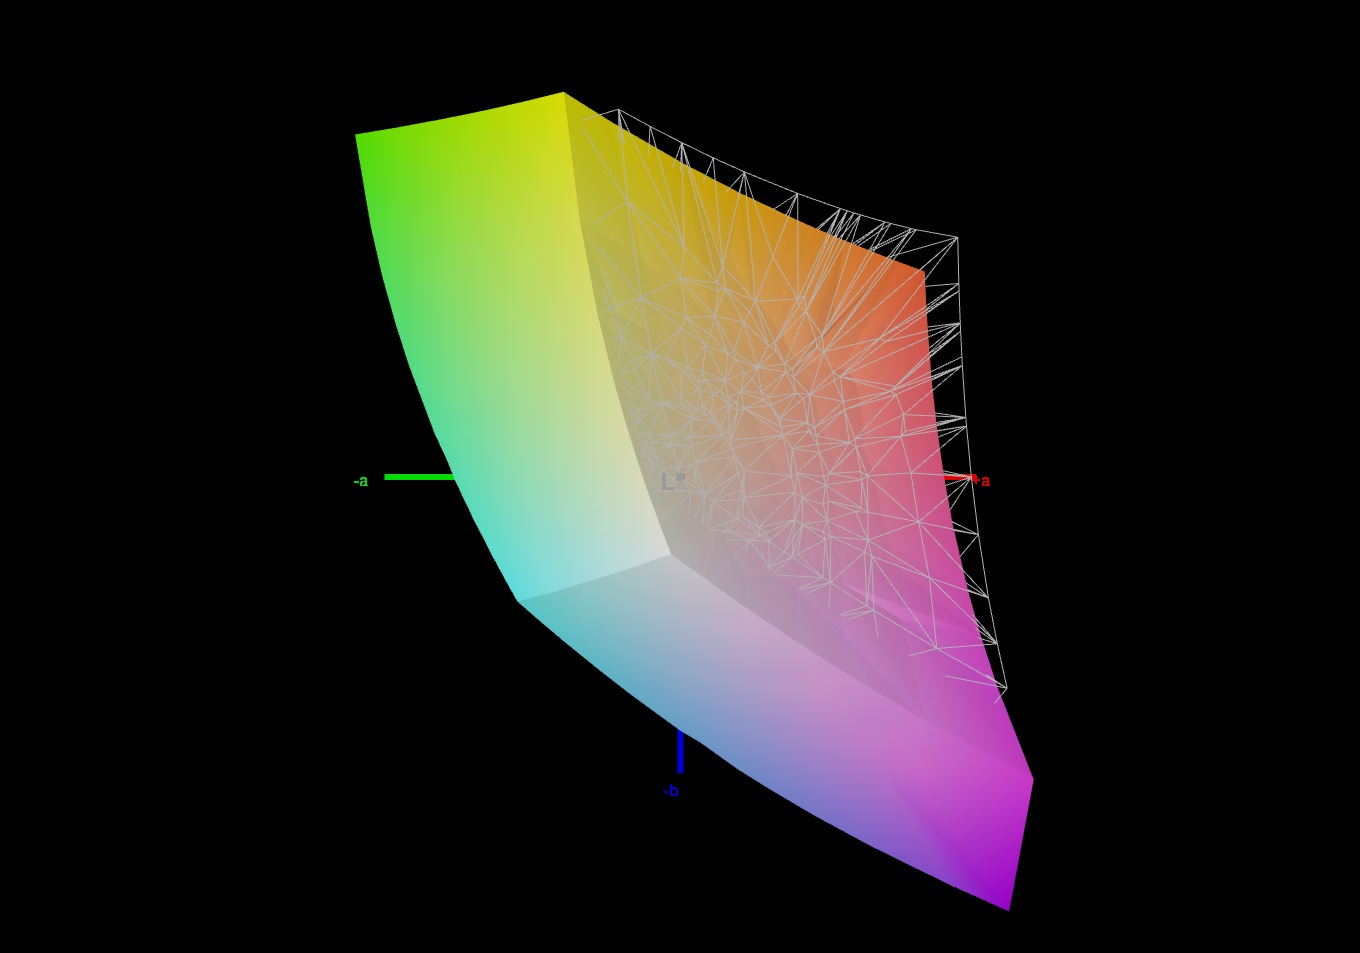
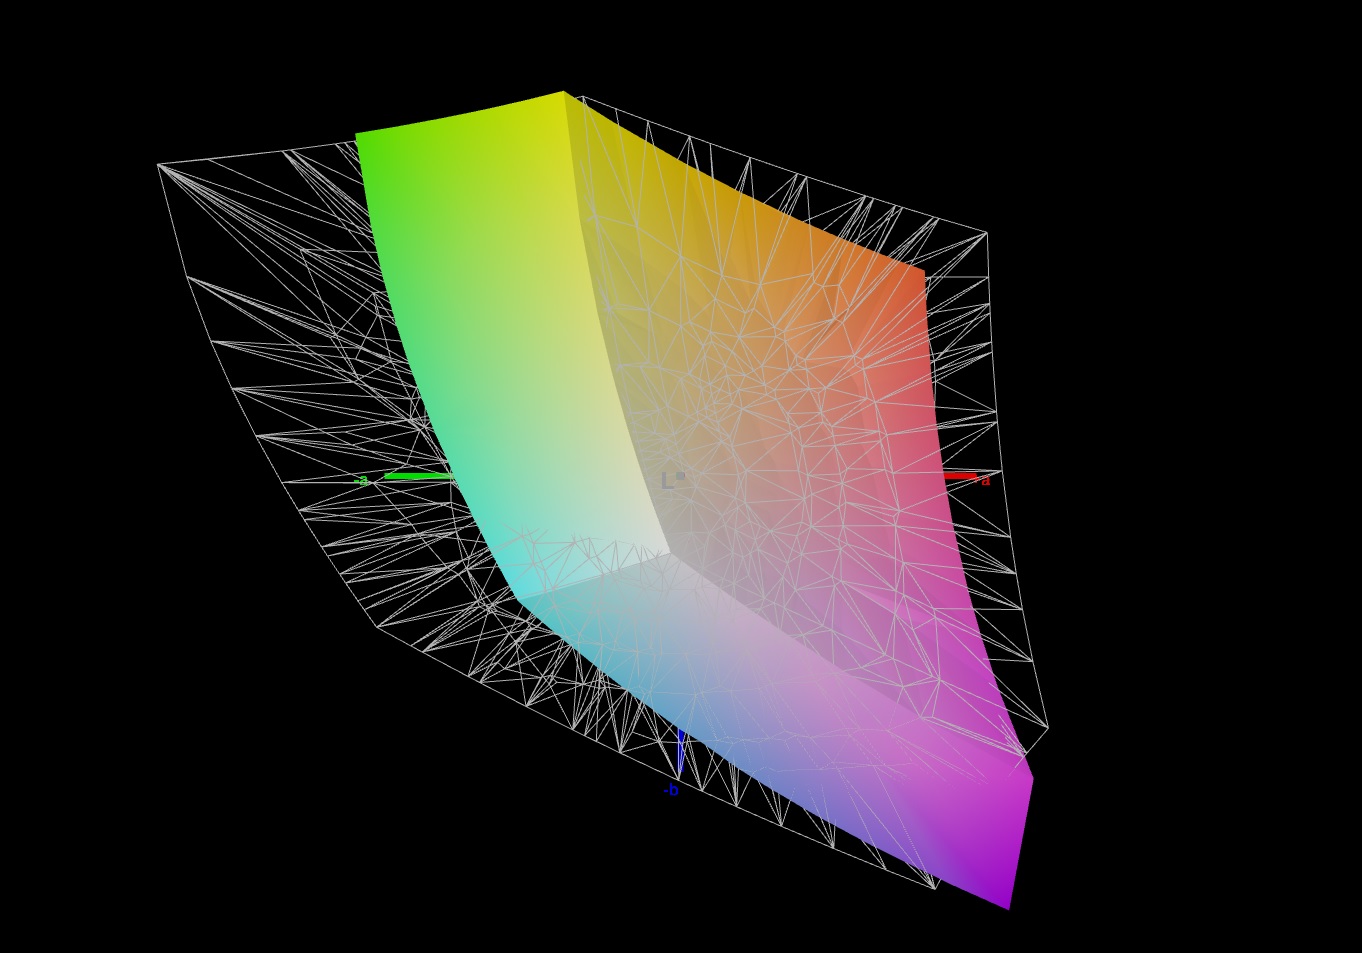
90% sRGB (Argyll 1.6.3 3D)
65% AdobeRGB 1998 (Argyll 1.6.3 3D)
65.3% AdobeRGB 1998 (Argyll 2.2.0 3D)
89.3% sRGB (Argyll 2.2.0 3D)
64.5% Display P3 (Argyll 2.2.0 3D)
Gamma: 2.334
| MSI Summit E15 A11SCST AU Optronics B156HAB03.1, IPS, 1920x1080, 15.60 | Lenovo ThinkPad X1 Extreme Gen3-20TLS0UV00 N156HCE-GN1, IPS, 1920x1080, 15.60 | Dell XPS 15 9500 Core i7 4K UHD Sharp LQ156R1, IPS, 3840x2400, 15.60 | Apple MacBook Pro 16 2019 i9 5500M APPA044, IPS, 3072x1920, 16.00 | Asus ZenBook UX535-M01440 BOE0866, IPS, 3840x2160, 15.60 | |
|---|---|---|---|---|---|
| Display | -3% | 35% | 8% | ||
| Display P3 Coverage | 64.5 | 61 -5% | 89.7 39% | 68.8 7% | |
| sRGB Coverage | 89.3 | 89.9 1% | 100 12% | 99.5 11% | |
| AdobeRGB 1998 Coverage | 65.3 | 62.2 -5% | 99.8 53% | 70.1 7% | |
| Response Times | 25% | -17% | -17% | 22% | |
| Response Time Grey 50% / Grey 80% * | 43.2 ? | 33.6 ? 22% | 54 ? -25% | 52.4 ? -21% | 34 ? 21% |
| Response Time Black / White * | 30.8 ? | 22.4 ? 27% | 33.2 ? -8% | 34.9 ? -13% | 24 ? 22% |
| PWM Frequency | 26040 ? | 131700 | |||
| Screen | 25% | 16% | 31% | 21% | |
| Brightness middle | 298 | 518 74% | 557.9 87% | 519 74% | 402 35% |
| Brightness | 280 | 513 83% | 541 93% | 477 70% | 375 34% |
| Brightness Distribution | 90 | 88 -2% | 91 1% | 86 -4% | 84 -7% |
| Black Level * | 0.22 | 0.38 -73% | 0.39 -77% | 0.39 -77% | 0.35 -59% |
| Contrast | 1355 | 1363 1% | 1431 6% | 1331 -2% | 1149 -15% |
| Colorchecker dE 2000 * | 5.41 | 2.1 61% | 4.54 16% | 2.28 58% | 2.47 54% |
| Colorchecker dE 2000 max. * | 8.59 | 4.5 48% | 7.92 8% | 6.54 24% | 4.32 50% |
| Colorchecker dE 2000 calibrated * | 2.97 | 1.3 56% | 3.82 -29% | 0.86 71% | 2.36 21% |
| Greyscale dE 2000 * | 4.1 | 2.7 34% | 3.2 22% | 0.9 78% | 2.26 45% |
| Gamma | 2.334 94% | 2.35 94% | 1.99 111% | 2145 0% | 2.49 88% |
| CCT | 7025 93% | 7042 92% | 6451 101% | 6572 99% | 6285 103% |
| Color Space (Percent of AdobeRGB 1998) | 65 | 57.7 -11% | 89.5 38% | 78 20% | 99 52% |
| Color Space (Percent of sRGB) | 90 | 90.4 0% | 100 11% | ||
| Total Average (Program / Settings) | 16% /
19% | 11% /
15% | 7% /
23% | 17% /
19% |
* ... smaller is better
In the state of delivery, the display offers a decent color reproduction. However, at a deviation of 5.4, the target (Delta-E < 3) is not met. A calibration brings some improvement. The color deviation drops to a little less than 3, and the grayscale is reproduced more balanced. The AdobeRGB (65%) and sRGB (90%) color spaces are not covered completely.


Display Response Times
| ↔ Response Time Black to White | ||
|---|---|---|
| 30.8 ms ... rise ↗ and fall ↘ combined | ↗ 17.2 ms rise | 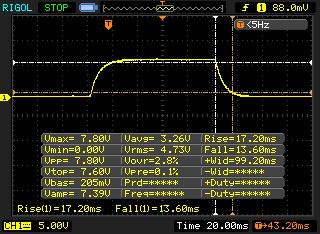 |
| ↘ 13.6 ms fall | ||
| The screen shows slow response rates in our tests and will be unsatisfactory for gamers. In comparison, all tested devices range from 0.1 (minimum) to 240 (maximum) ms. » 81 % of all devices are better. This means that the measured response time is worse than the average of all tested devices (21.5 ms). | ||
| ↔ Response Time 50% Grey to 80% Grey | ||
| 43.2 ms ... rise ↗ and fall ↘ combined | ↗ 21.2 ms rise |  |
| ↘ 22 ms fall | ||
| The screen shows slow response rates in our tests and will be unsatisfactory for gamers. In comparison, all tested devices range from 0.2 (minimum) to 636 (maximum) ms. » 68 % of all devices are better. This means that the measured response time is worse than the average of all tested devices (33.7 ms). | ||
Screen Flickering / PWM (Pulse-Width Modulation)
| Screen flickering / PWM not detected |  | ||
In comparison: 53 % of all tested devices do not use PWM to dim the display. If PWM was detected, an average of 17900 (minimum: 5 - maximum: 3846000) Hz was measured. | |||
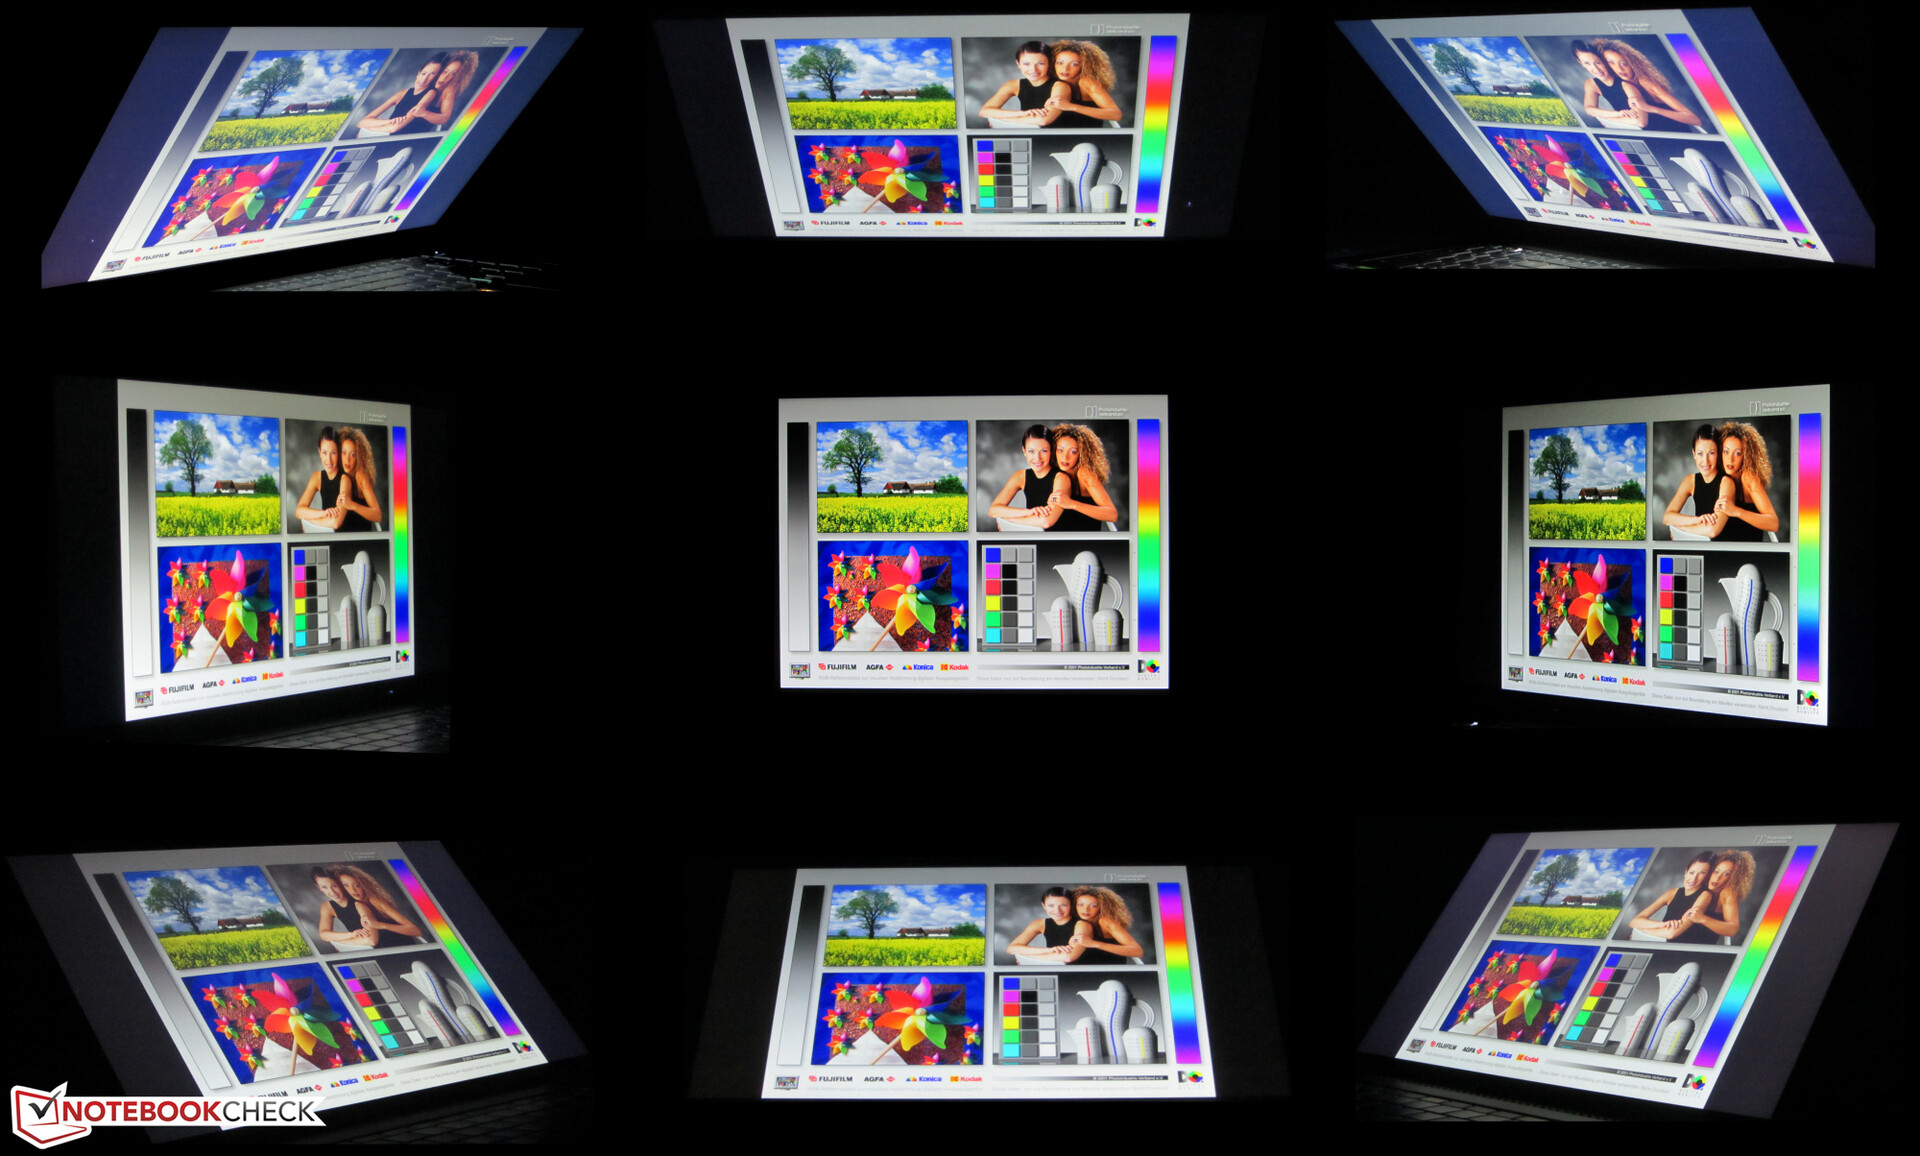
The IPS panel offers stable viewing angles and can be read from any position. Outdoors, the combination of the reflective display surface and the low brightness prevents reading the contents most of the time.

Performance - MSI combines Tiger Lake and Turing
With the Summit E15, MSI offers a 15.6-inch business laptop that strikes a good figure in all the usual application areas.
Test Conditions
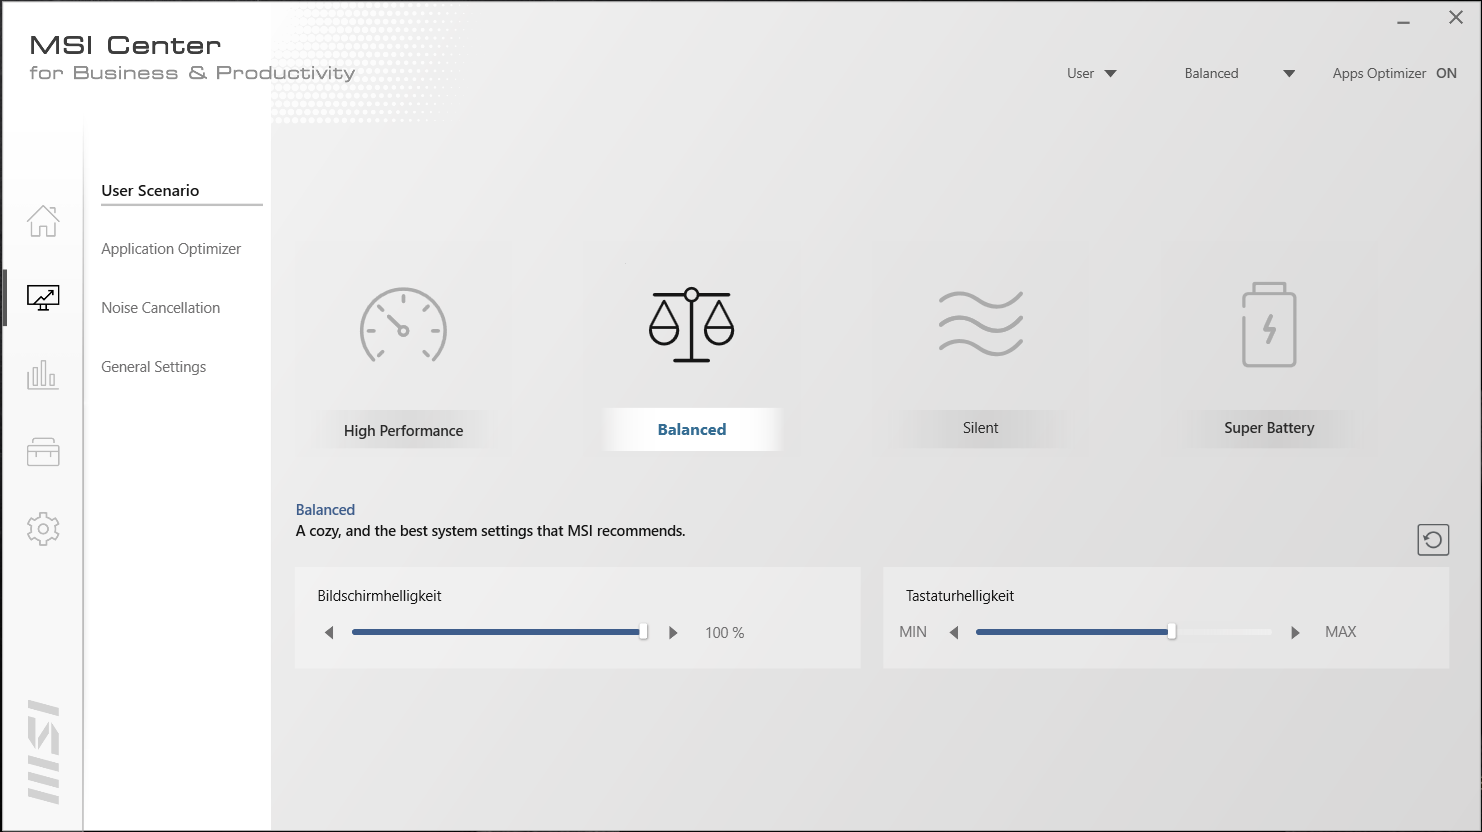
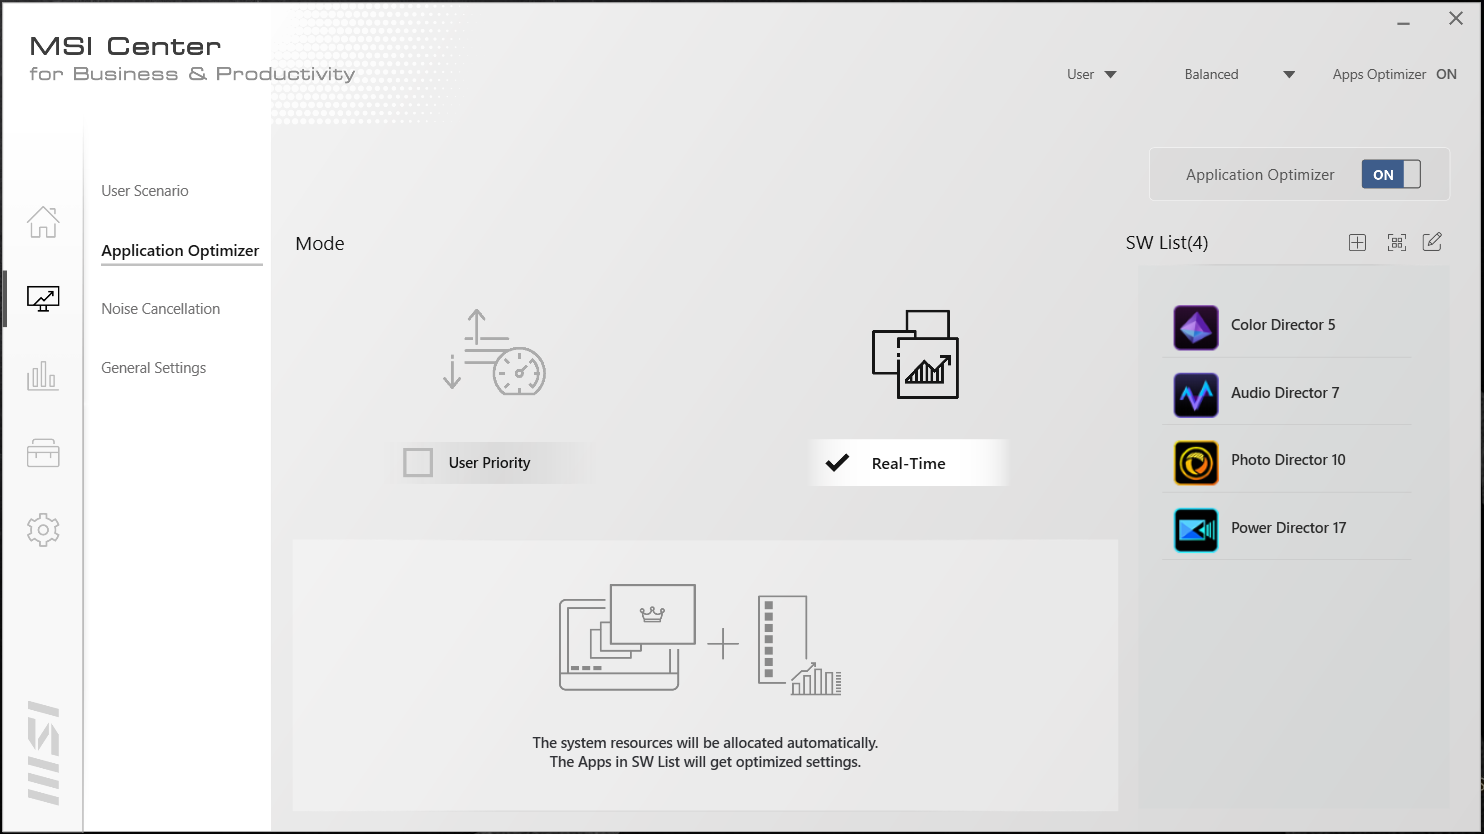
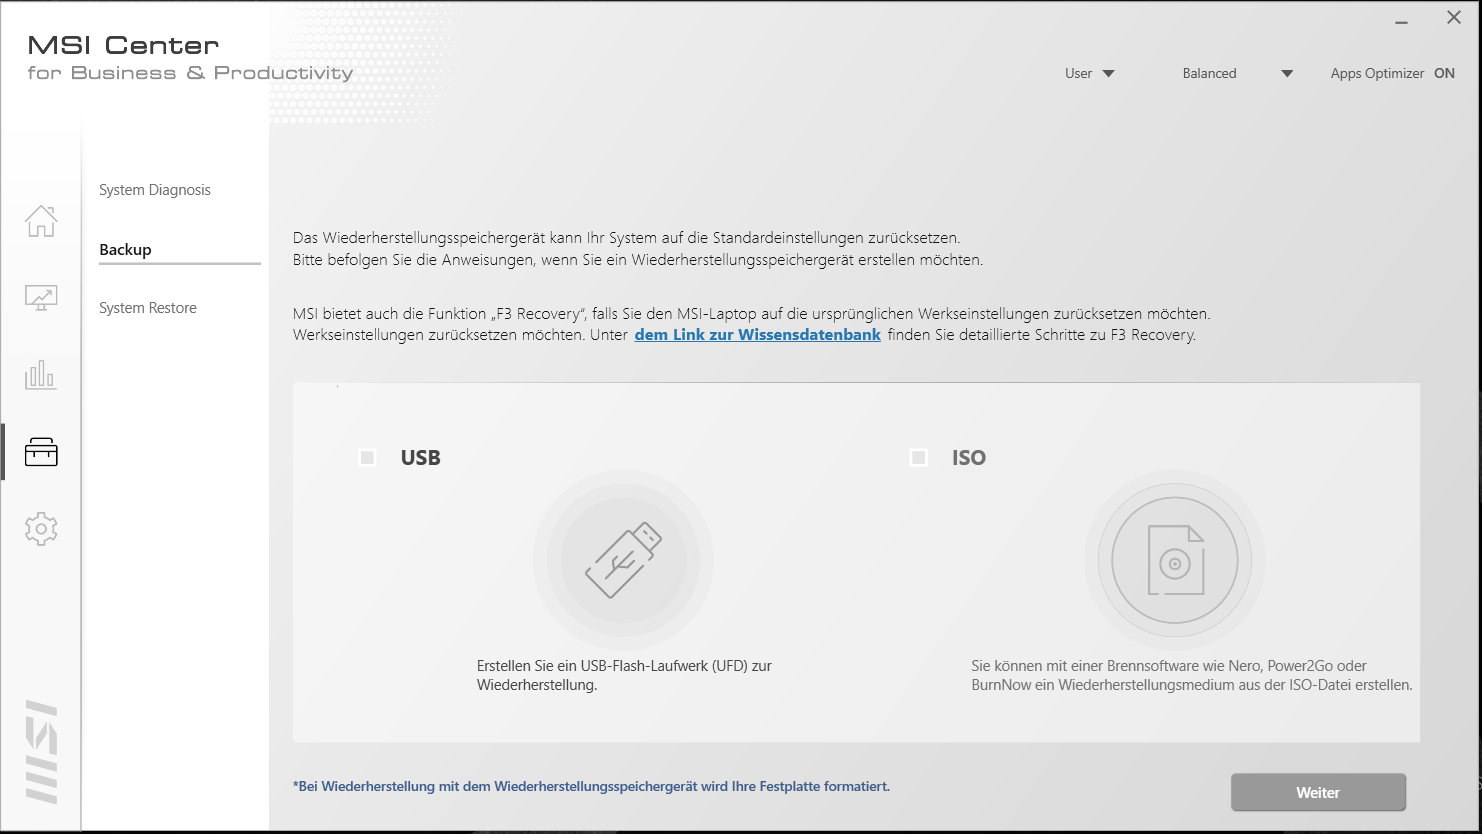
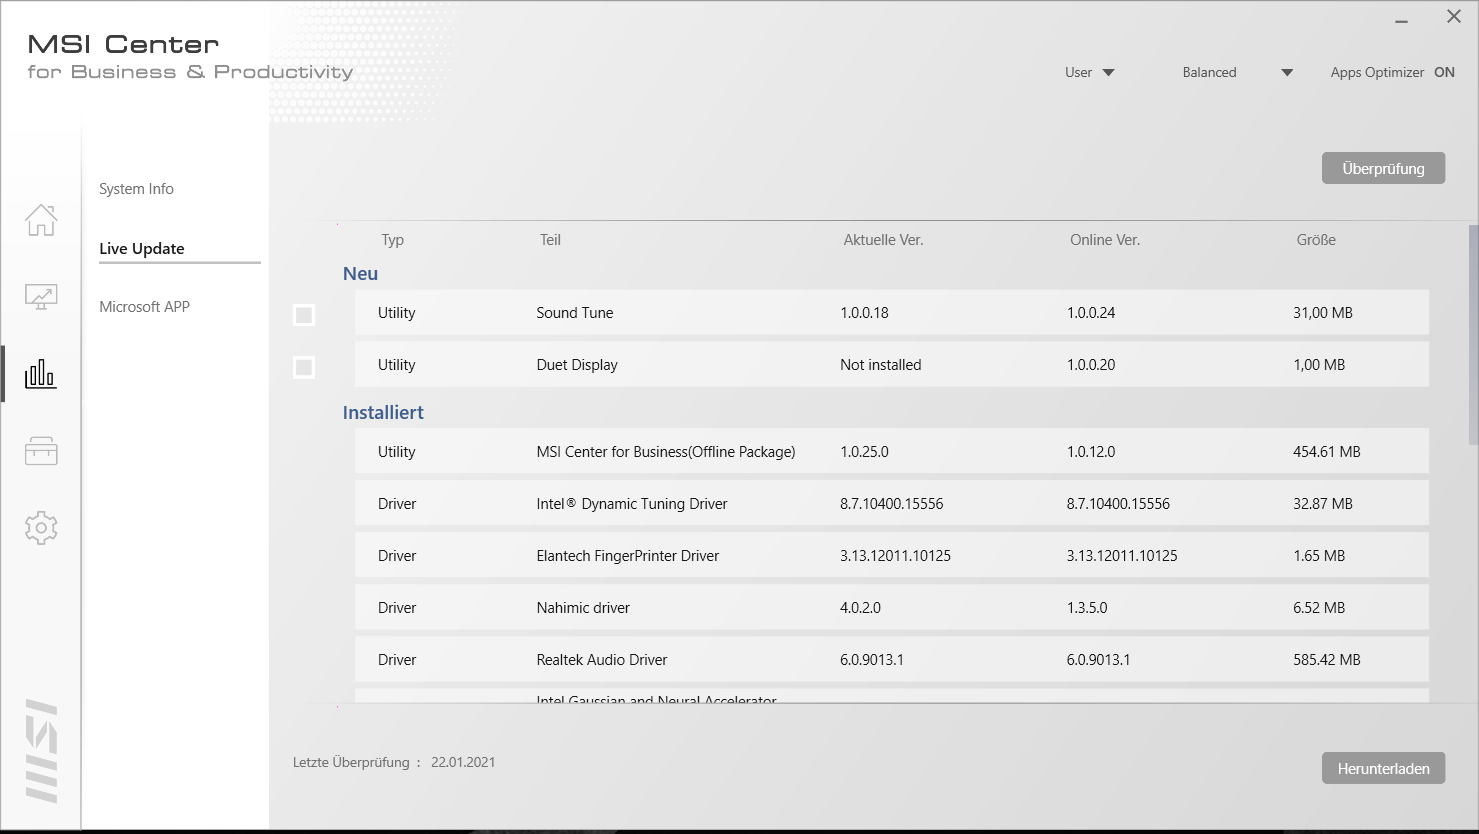
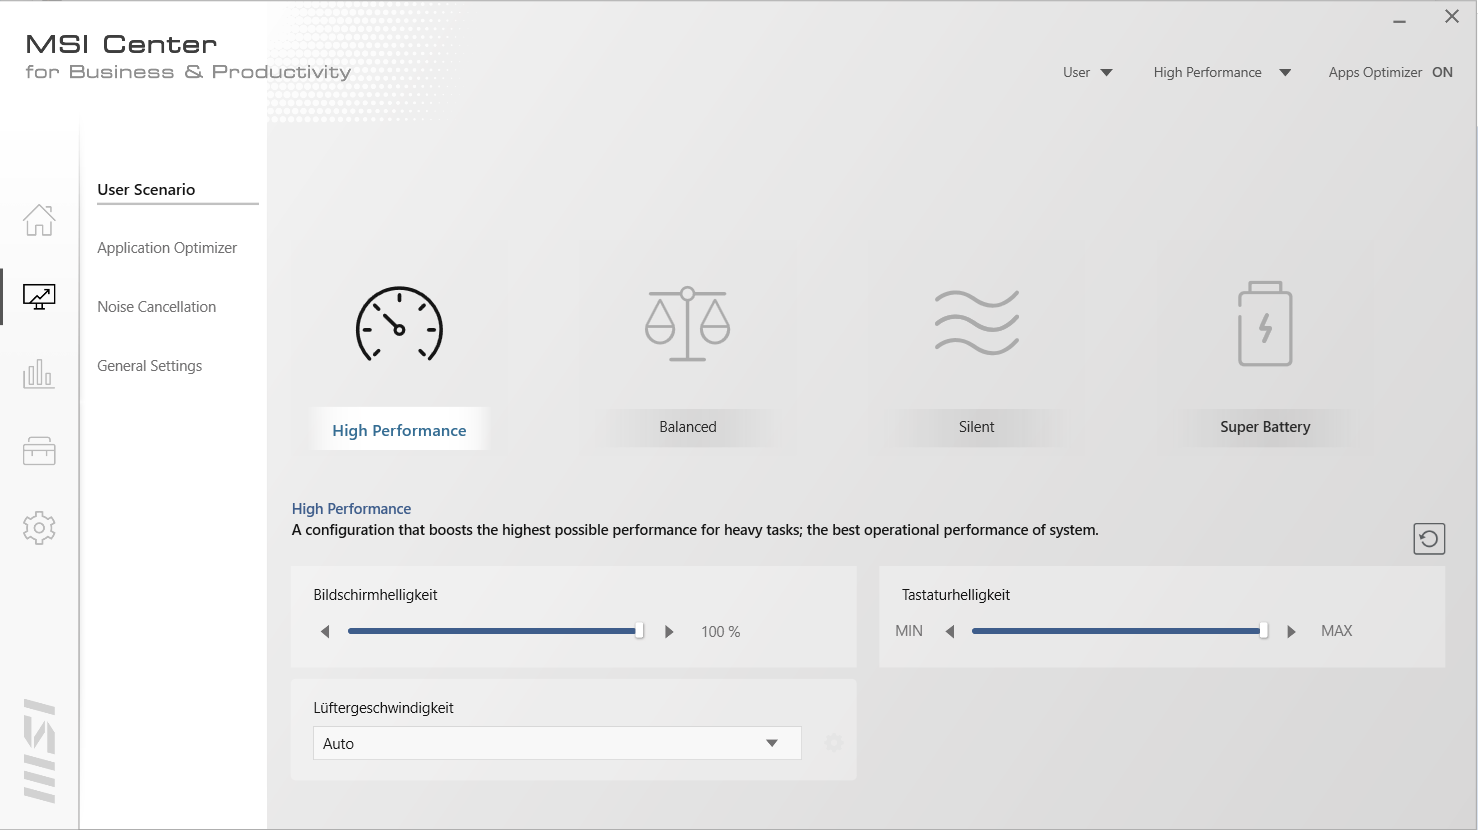
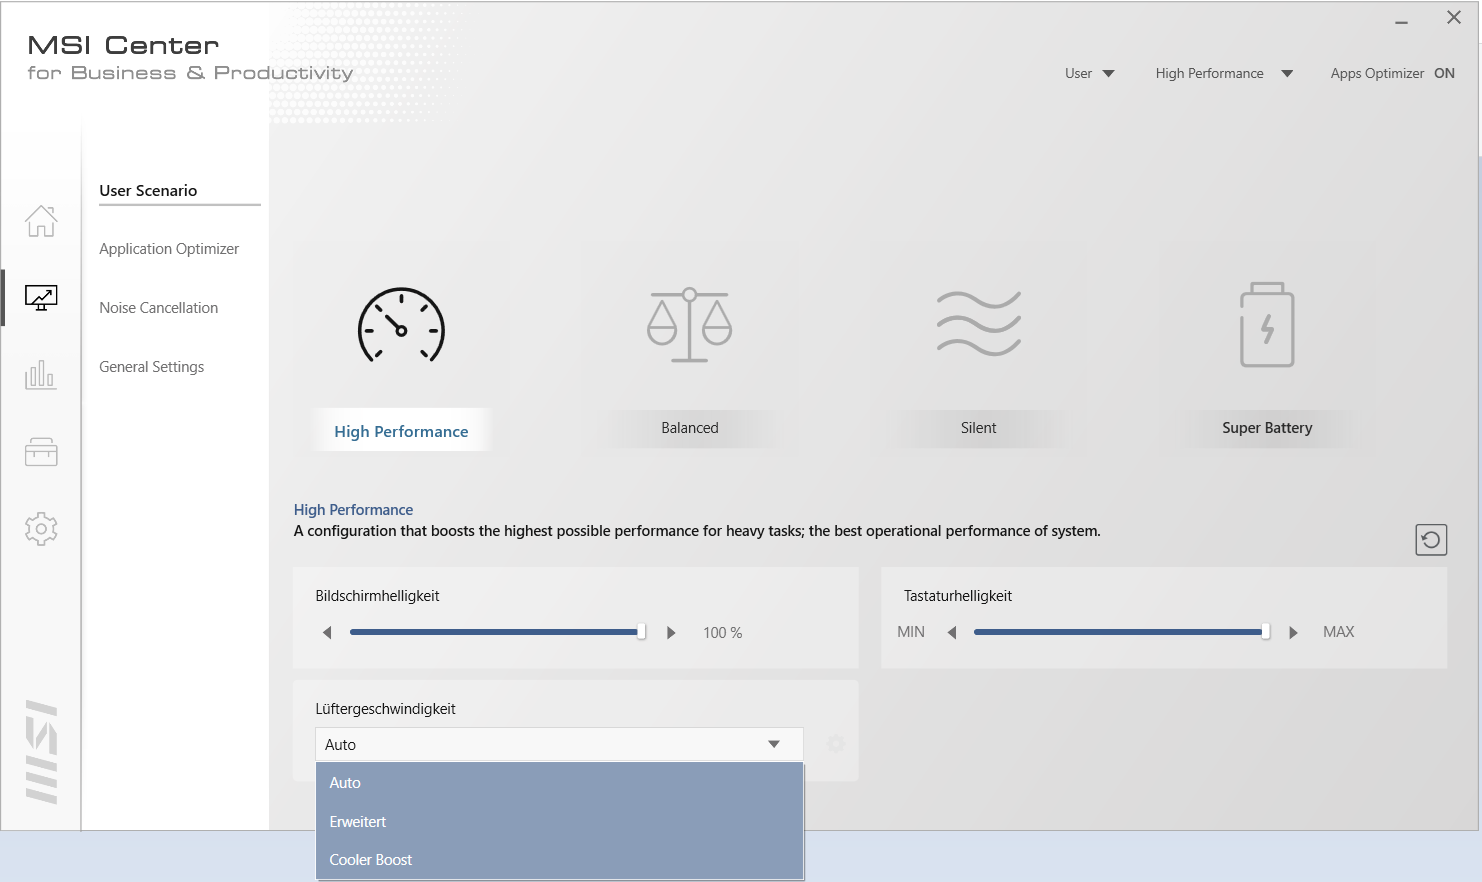
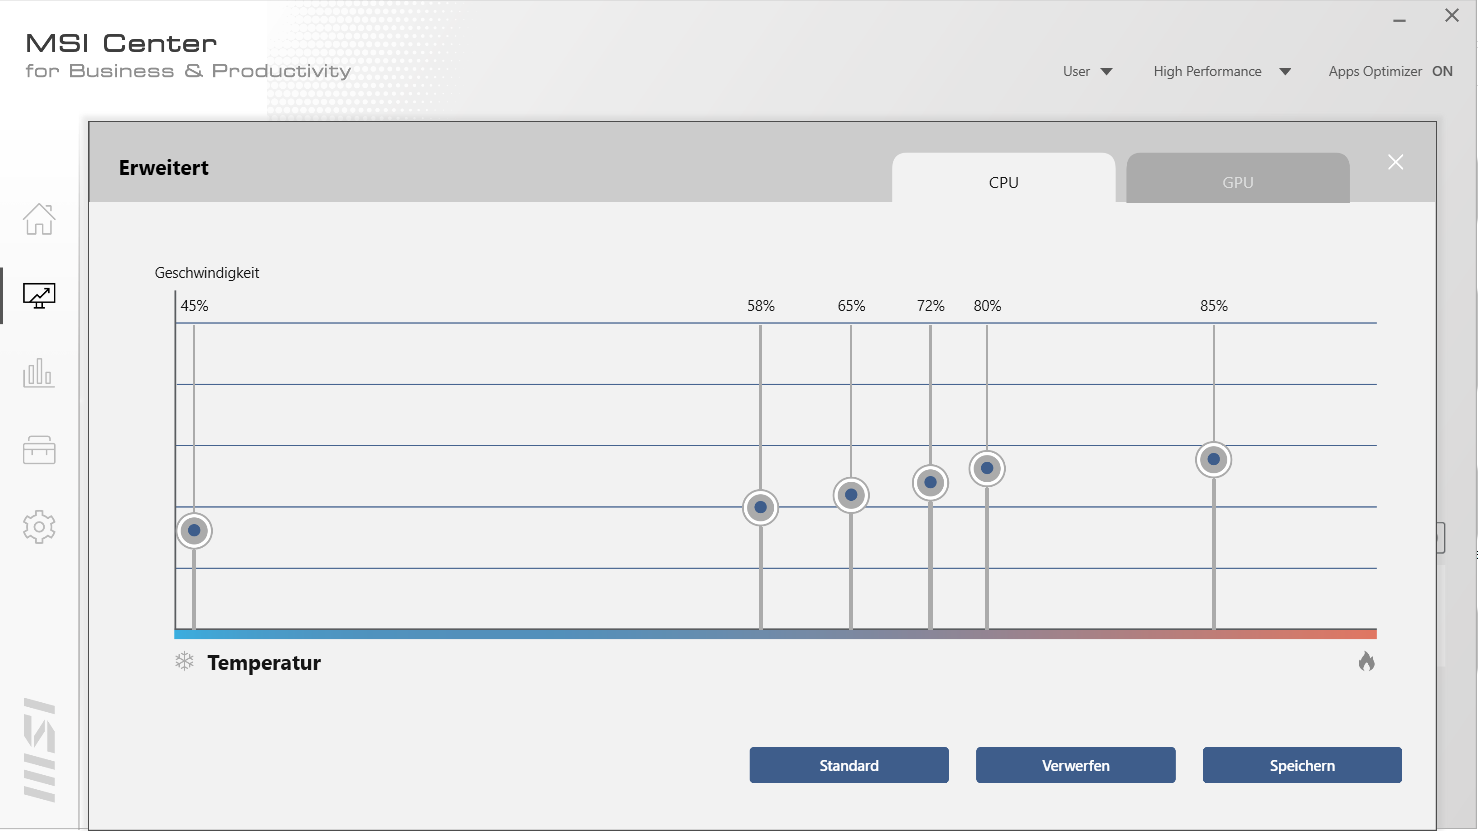
The preinstalled MSI Center for Business & Productivity offers for example the option to specify a power profile. You can quickly change between profiles using the "F7" key. We used the "Balanced" profile for our tests. In addition, we also ran several benchmarks with the "High Performance" profile activated. You can find the results in the comparison charts. When the "High Performance" profile is activated, you can also influence the fan control. We used both the automatic fan control as well as the "Cooler Boost" option (fans run at maximum speeds).
Processor
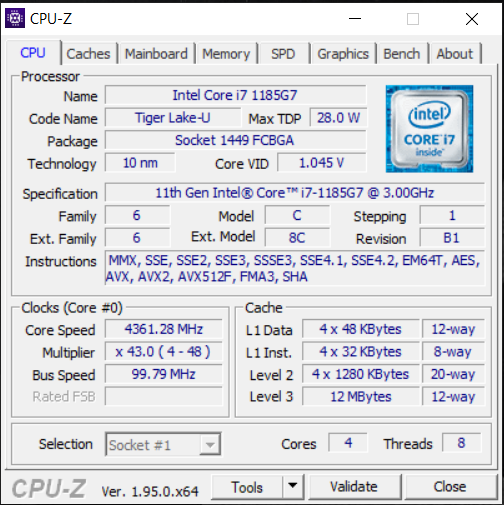
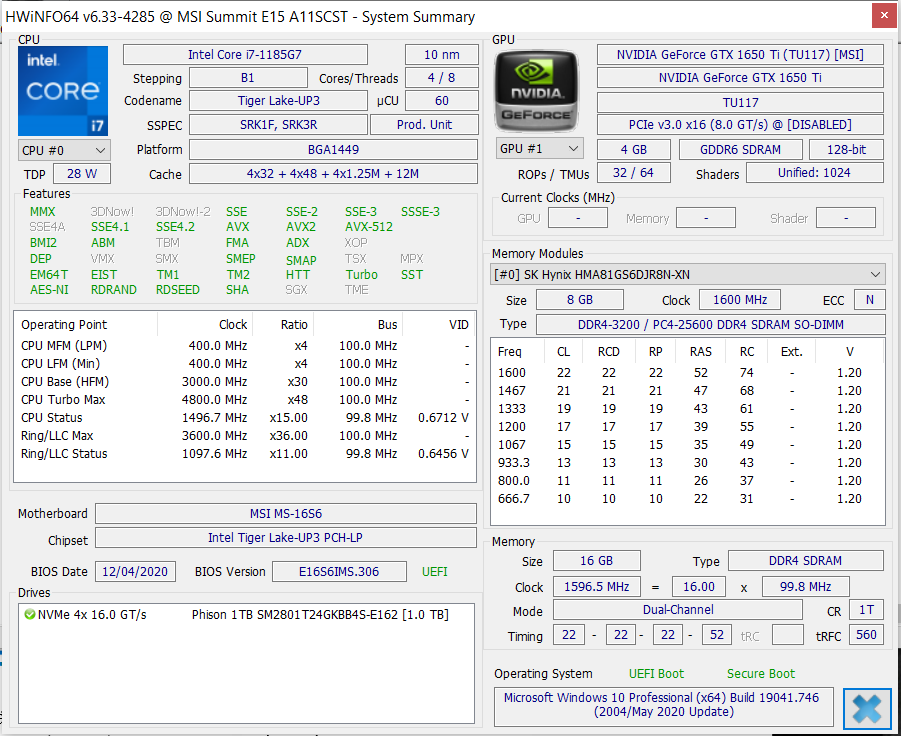
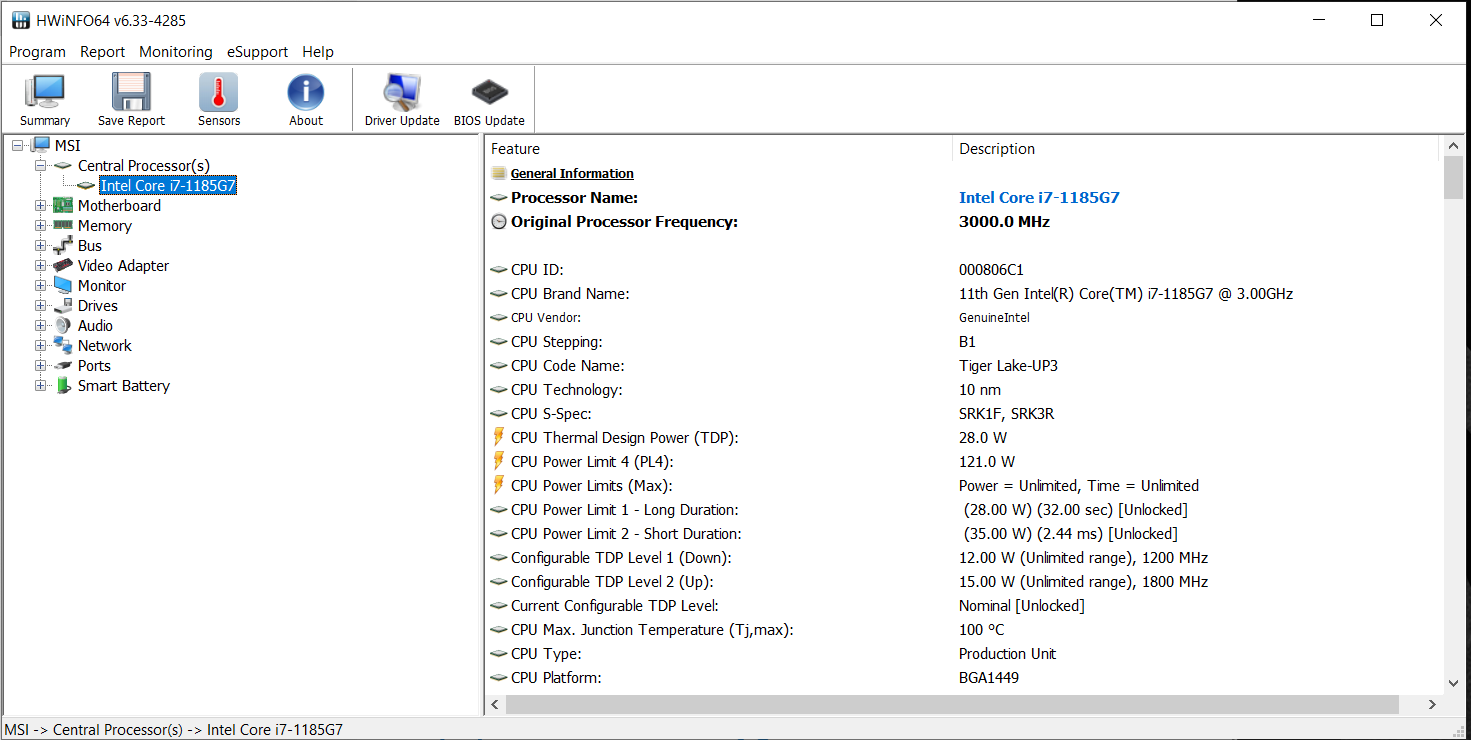
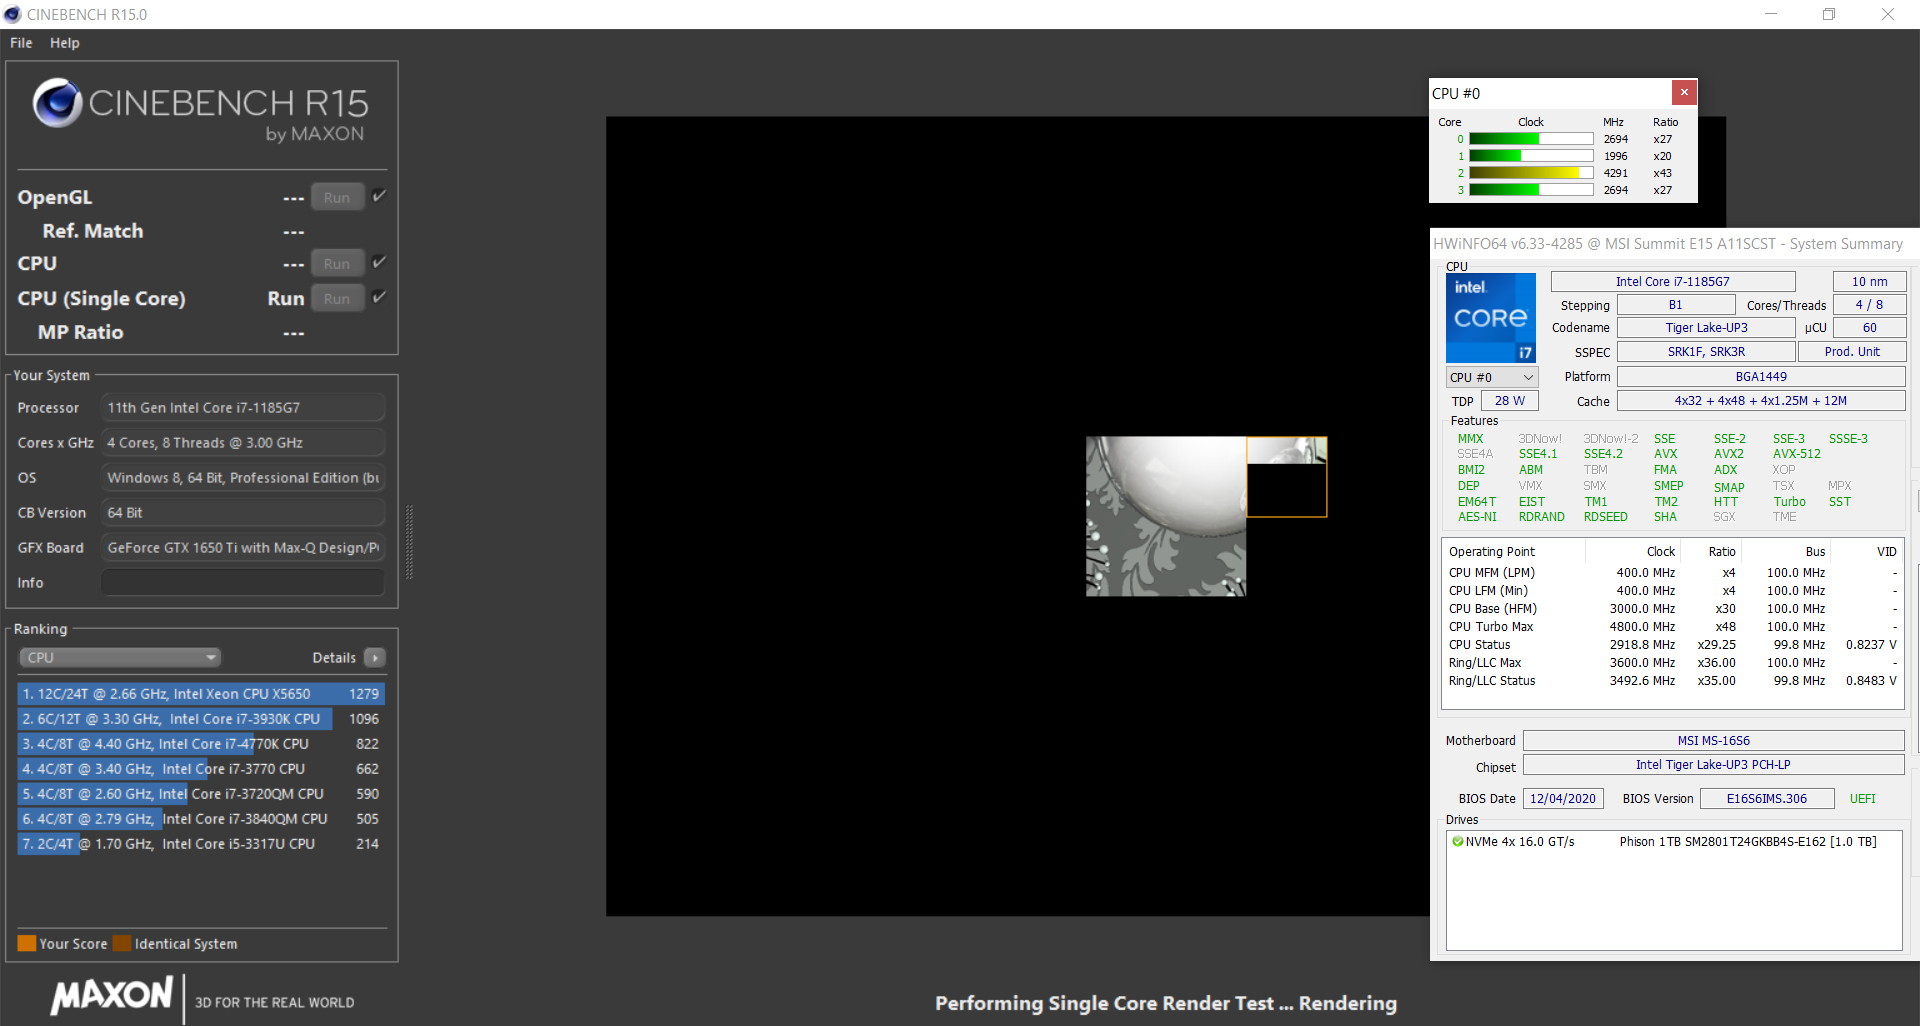
MSI has equipped the 15.6-inch laptop with a Core i7-1185G7 quad-core processor (Tiger Lake). This ULV CPU runs at a basic clock speed of 3 GHz. Via Turbo, this can be increased up to 4.3 GHz (all four cores) and up to 4.8 GHz (single core). Hyperthreading (two threads per core) is supported.
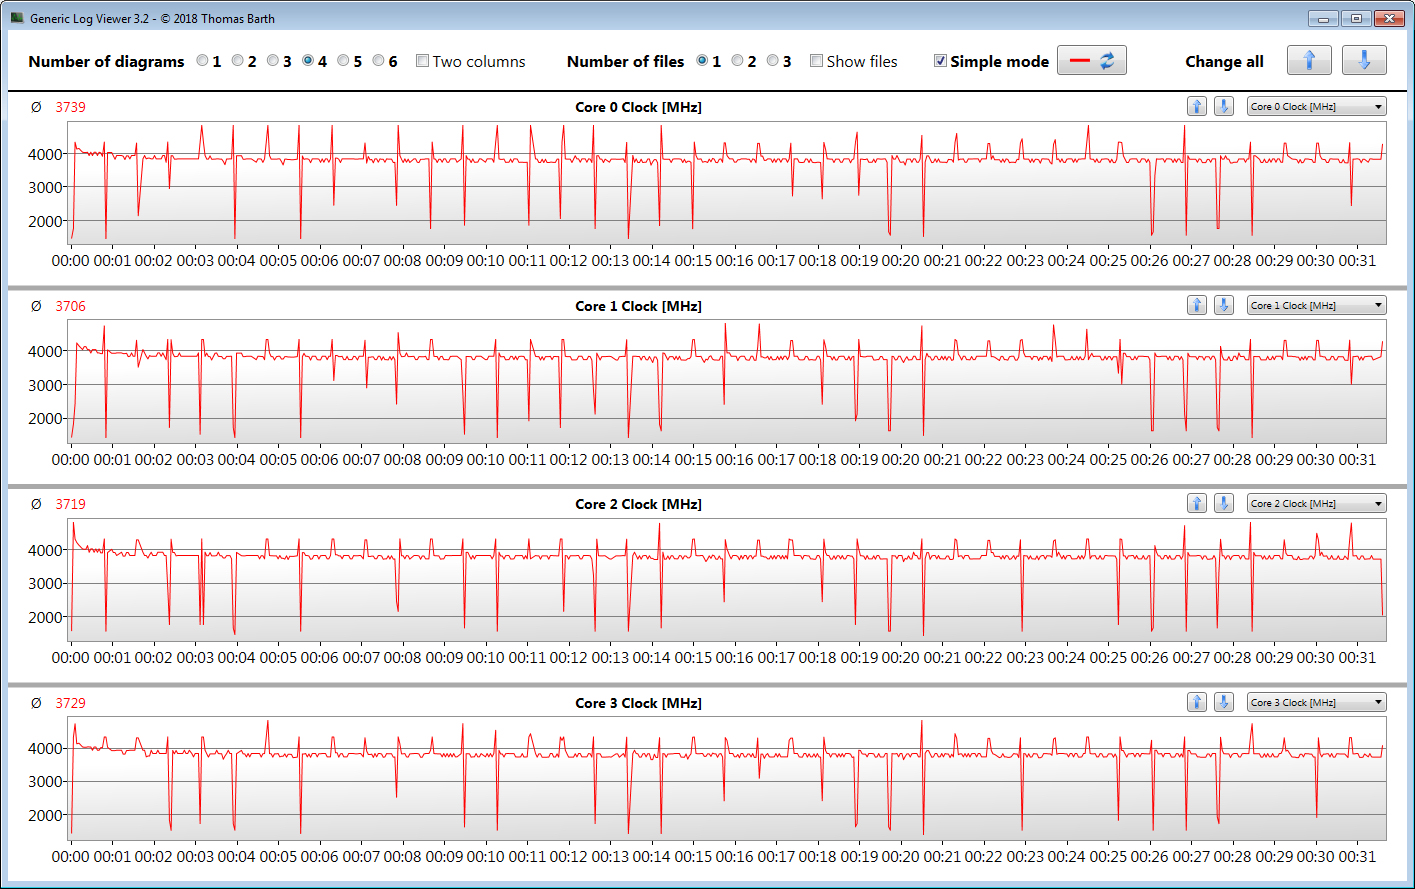
For a short period of time, the multi-thread tests of the Cinebench benchmarks run at 3 to 4.3 GHz. The single-thread tests run at 2 to 4.8 GHz. In battery operation, the clock speeds are significantly lower.
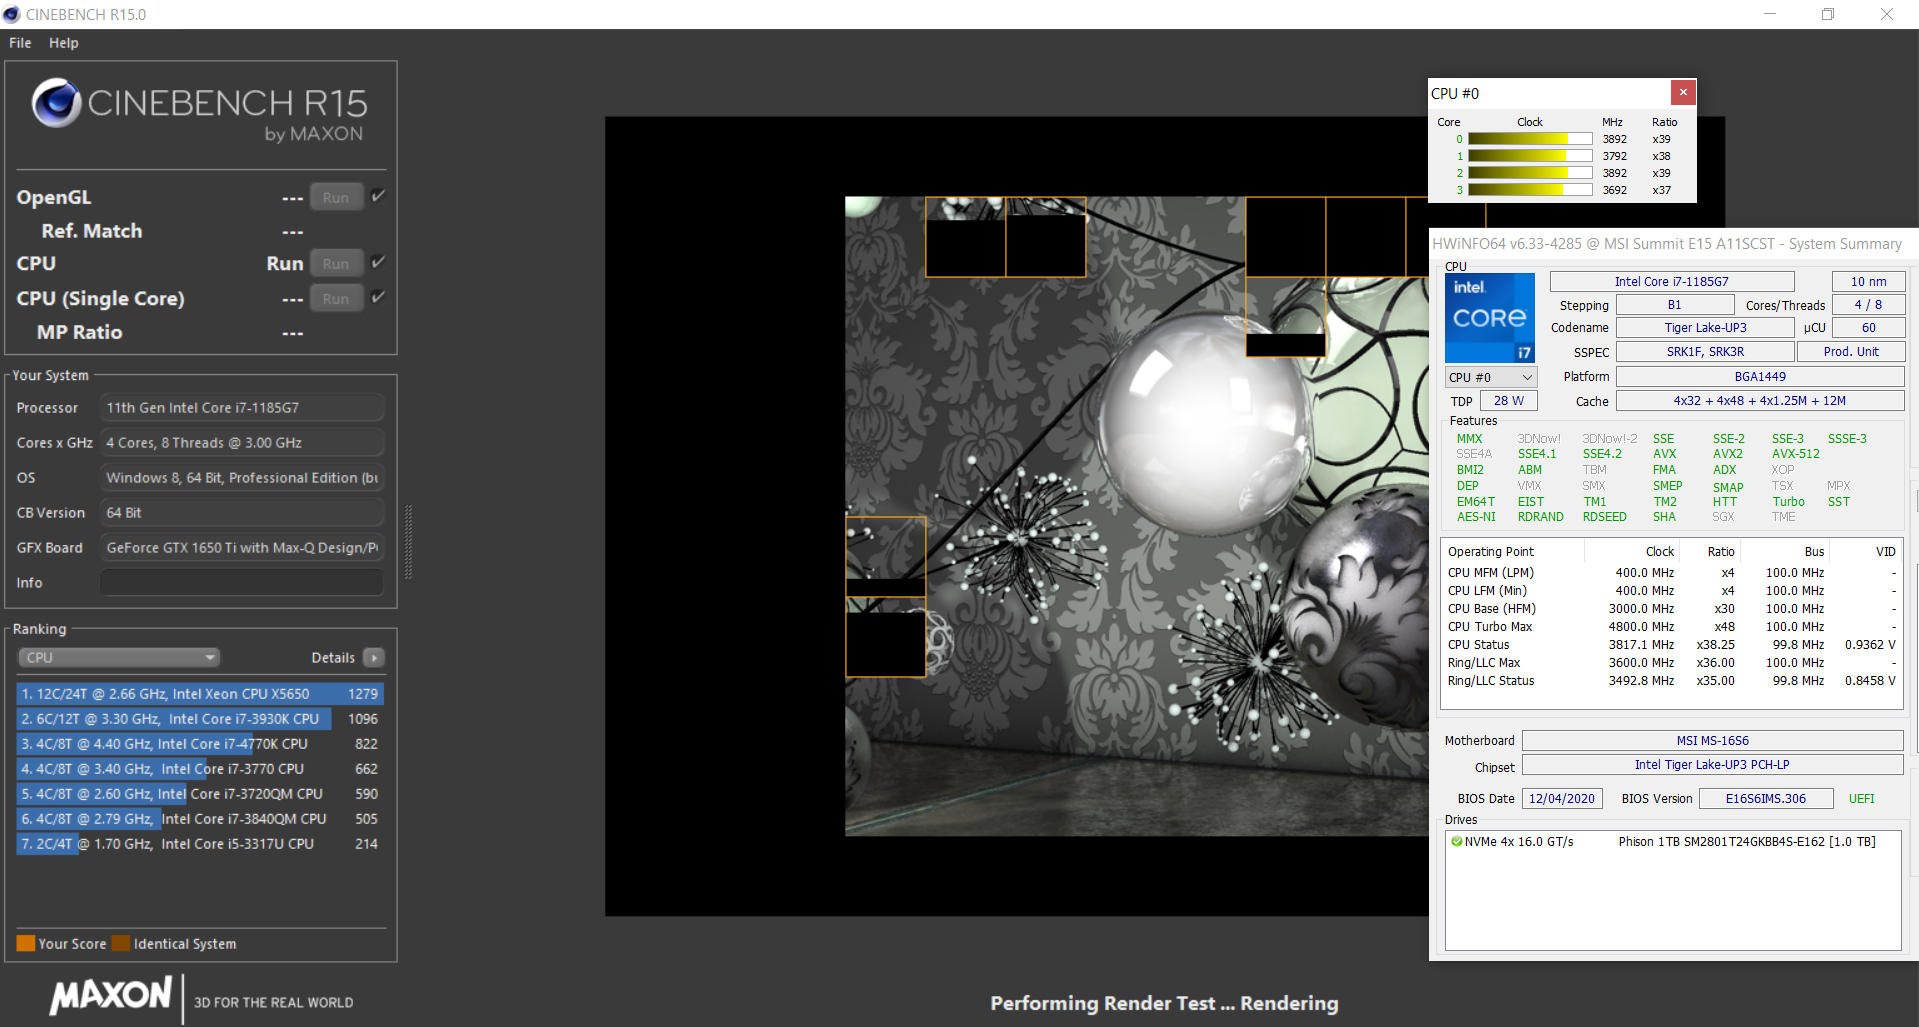
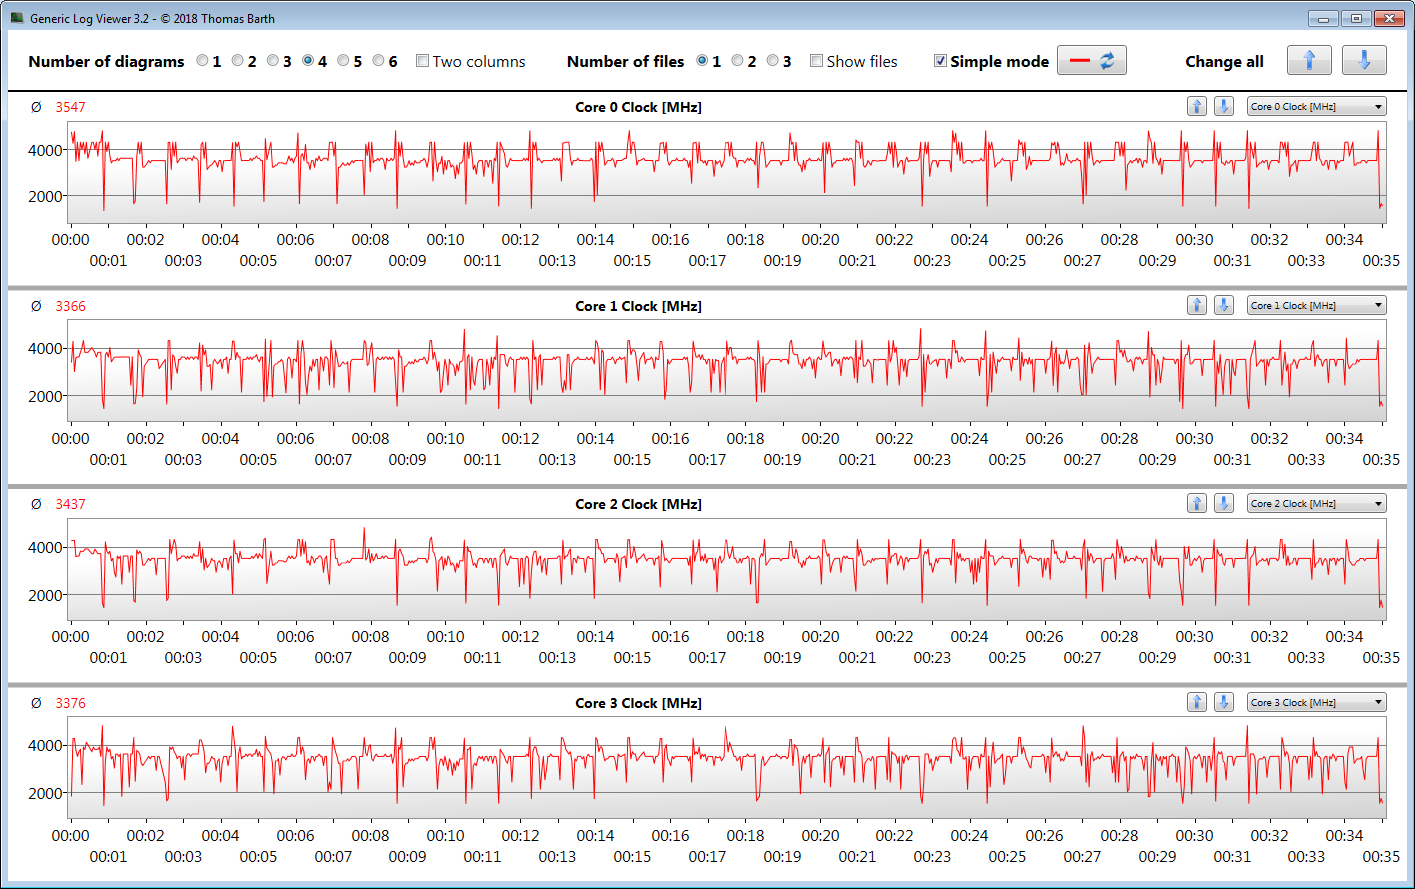
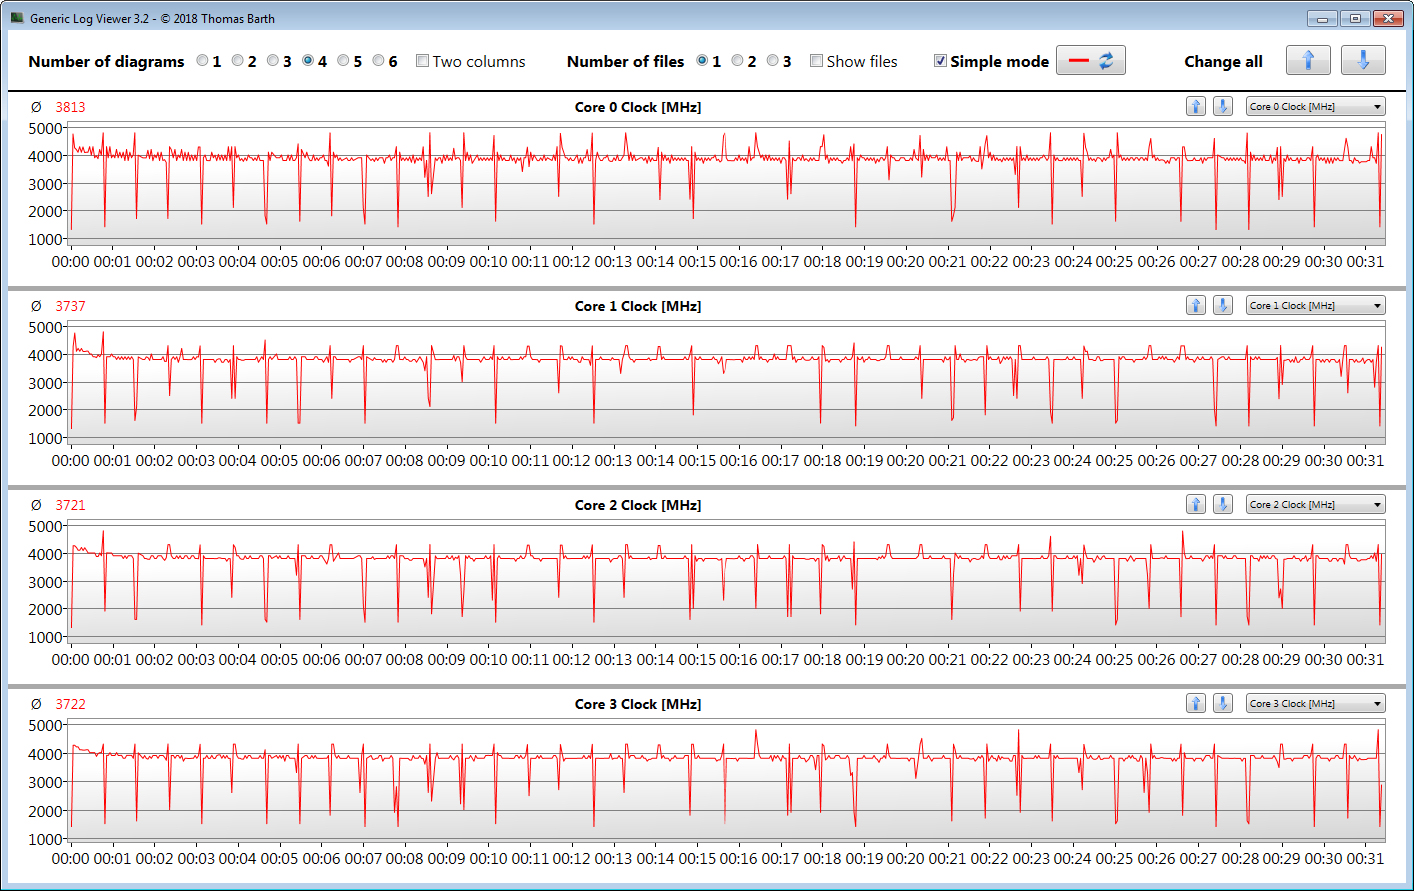
We evaluate whether the CPU Turbo is also used constantly in mains operation by running the multi-thread test of the Cinebench-R15 benchmarks in a constant loop for at least 30 minutes. The Turbo is used. After the first run of the loop, the clock speeds drop slightly. The "High Performance" profile allows running the Turbo constantly at higher clock speeds. Activating the "Cooler Boost" option will bring a minimal increase of the computing performance.
| Cinebench R15 | |
| CPU Single 64Bit | |
| Average of class Multimedia (142.6 - 308, n=99, last 2 years) | |
| Average Intel Core i7-1185G7 (168 - 230, n=27) | |
| Lenovo ThinkPad X1 Extreme Gen3-20TLS0UV00 | |
| MSI Summit E15 A11SCST (High Performance, Cooler Boost) | |
| Dell XPS 15 9500 Core i7 4K UHD | |
| Asus ZenBook UX535-M01440 | |
| MSI Summit E15 A11SCST | |
| Apple MacBook Pro 16 2019 i9 5500M (macOS 10.15.1) | |
| Apple MacBook Pro 16 2019 i9 5500M | |
| HP EliteBook 855 G7-23Y52EA | |
| CPU Multi 64Bit | |
| Average of class Multimedia (785 - 4703, n=106, last 2 years) | |
| Apple MacBook Pro 16 2019 i9 5500M (macOS 10.15.1) | |
| Apple MacBook Pro 16 2019 i9 5500M (Win 10) | |
| Dell XPS 15 9500 Core i7 4K UHD | |
| Asus ZenBook UX535-M01440 | |
| Lenovo ThinkPad X1 Extreme Gen3-20TLS0UV00 | |
| HP EliteBook 855 G7-23Y52EA | |
| MSI Summit E15 A11SCST (High Performance, Cooler Boost) | |
| MSI Summit E15 A11SCST (High Performance) | |
| MSI Summit E15 A11SCST | |
| Average Intel Core i7-1185G7 (617 - 1066, n=32) | |
| Blender - v2.79 BMW27 CPU | |
| Average Intel Core i7-1185G7 (478 - 745, n=28) | |
| MSI Summit E15 A11SCST | |
| MSI Summit E15 A11SCST (High Performance) | |
| MSI Summit E15 A11SCST (High Performance, Cooler Boost) | |
| HP EliteBook 855 G7-23Y52EA | |
| Asus ZenBook UX535-M01440 | |
| Lenovo ThinkPad X1 Extreme Gen3-20TLS0UV00 | |
| Dell XPS 15 9500 Core i7 4K UHD | |
| Apple MacBook Pro 16 2019 i9 5500M | |
| Average of class Multimedia (107 - 662, n=95, last 2 years) | |
| 7-Zip 18.03 | |
| 7z b 4 -mmt1 | |
| Average of class Multimedia (3398 - 7163, n=90, last 2 years) | |
| Lenovo ThinkPad X1 Extreme Gen3-20TLS0UV00 | |
| Dell XPS 15 9500 Core i7 4K UHD | |
| Asus ZenBook UX535-M01440 | |
| MSI Summit E15 A11SCST (High Performance, Cooler Boost) | |
| MSI Summit E15 A11SCST (High Performance) | |
| MSI Summit E15 A11SCST | |
| Average Intel Core i7-1185G7 (3678 - 5507, n=27) | |
| Apple MacBook Pro 16 2019 i9 5500M | |
| HP EliteBook 855 G7-23Y52EA | |
| 7z b 4 | |
| Average of class Multimedia (20166 - 119900, n=90, last 2 years) | |
| Apple MacBook Pro 16 2019 i9 5500M | |
| Dell XPS 15 9500 Core i7 4K UHD | |
| Lenovo ThinkPad X1 Extreme Gen3-20TLS0UV00 | |
| Asus ZenBook UX535-M01440 | |
| HP EliteBook 855 G7-23Y52EA | |
| MSI Summit E15 A11SCST (High Performance, Cooler Boost) | |
| MSI Summit E15 A11SCST (High Performance) | |
| MSI Summit E15 A11SCST | |
| Average Intel Core i7-1185G7 (18812 - 27693, n=27) | |
| Cinebench R20 | |
| CPU (Single Core) | |
| Average of class Multimedia (341 - 812, n=97, last 2 years) | |
| MSI Summit E15 A11SCST (High Performance, Cooler Boost) | |
| MSI Summit E15 A11SCST | |
| MSI Summit E15 A11SCST (High Performance) | |
| Average Intel Core i7-1185G7 (489 - 593, n=28) | |
| Dell XPS 15 9500 Core i7 4K UHD | |
| Lenovo ThinkPad X1 Extreme Gen3-20TLS0UV00 | |
| Asus ZenBook UX535-M01440 | |
| HP EliteBook 855 G7-23Y52EA | |
| Apple MacBook Pro 16 2019 i9 5500M | |
| Apple MacBook Pro 16 2019 i9 5500M (Win 10) | |
| CPU (Multi Core) | |
| Average of class Multimedia (1783 - 11768, n=97, last 2 years) | |
| Apple MacBook Pro 16 2019 i9 5500M | |
| Apple MacBook Pro 16 2019 i9 5500M (Win 10) | |
| Dell XPS 15 9500 Core i7 4K UHD | |
| Asus ZenBook UX535-M01440 | |
| Lenovo ThinkPad X1 Extreme Gen3-20TLS0UV00 | |
| HP EliteBook 855 G7-23Y52EA | |
| MSI Summit E15 A11SCST (High Performance, Cooler Boost) | |
| MSI Summit E15 A11SCST (High Performance) | |
| MSI Summit E15 A11SCST | |
| Average Intel Core i7-1185G7 (1425 - 2493, n=28) | |
| Geekbench 5.5 | |
| Single-Core | |
| Average of class Multimedia (926 - 2342, n=100, last 2 years) | |
| MSI Summit E15 A11SCST (High Performance, Cooler Boost) | |
| Average Intel Core i7-1185G7 (1398 - 1626, n=21) | |
| MSI Summit E15 A11SCST (High Performance) | |
| MSI Summit E15 A11SCST | |
| Dell XPS 15 9500 Core i7 4K UHD | |
| Lenovo ThinkPad X1 Extreme Gen3-20TLS0UV00 | |
| Asus ZenBook UX535-M01440 | |
| Apple MacBook Pro 16 2019 i9 5500M (Win 10) | |
| HP EliteBook 855 G7-23Y52EA | |
| Multi-Core | |
| Average of class Multimedia (3828 - 23059, n=100, last 2 years) | |
| Dell XPS 15 9500 Core i7 4K UHD | |
| Apple MacBook Pro 16 2019 i9 5500M (Win 10) | |
| Asus ZenBook UX535-M01440 | |
| Lenovo ThinkPad X1 Extreme Gen3-20TLS0UV00 | |
| Average Intel Core i7-1185G7 (4620 - 5944, n=21) | |
| MSI Summit E15 A11SCST (High Performance, Cooler Boost) | |
| MSI Summit E15 A11SCST (High Performance) | |
| MSI Summit E15 A11SCST | |
| HP EliteBook 855 G7-23Y52EA | |
| HWBOT x265 Benchmark v2.2 - 4k Preset | |
| Average of class Multimedia (4.99 - 30.5, n=88, last 2 years) | |
| Apple MacBook Pro 16 2019 i9 5500M | |
| Dell XPS 15 9500 Core i7 4K UHD | |
| Asus ZenBook UX535-M01440 | |
| Lenovo ThinkPad X1 Extreme Gen3-20TLS0UV00 | |
| HP EliteBook 855 G7-23Y52EA | |
| MSI Summit E15 A11SCST (High Performance, Cooler Boost) | |
| MSI Summit E15 A11SCST (High Performance) | |
| MSI Summit E15 A11SCST | |
| Average Intel Core i7-1185G7 (5.02 - 8.13, n=27) | |
| LibreOffice - 20 Documents To PDF | |
| Asus ZenBook UX535-M01440 | |
| HP EliteBook 855 G7-23Y52EA | |
| MSI Summit E15 A11SCST | |
| Apple MacBook Pro 16 2019 i9 5500M (Win 10) | |
| Apple MacBook Pro 16 2019 i9 5500M (mac OS Big Sur) | |
| MSI Summit E15 A11SCST (High Performance) | |
| Dell XPS 15 9500 Core i7 4K UHD | |
| Average Intel Core i7-1185G7 (41.3 - 61.7, n=26) | |
| MSI Summit E15 A11SCST (High Performance, Cooler Boost) | |
| Lenovo ThinkPad X1 Extreme Gen3-20TLS0UV00 | |
| Average of class Multimedia (6.7 - 84.9, n=92, last 2 years) | |
| R Benchmark 2.5 - Overall mean | |
| Apple MacBook Pro 16 2019 i9 5500M (macOS) | |
| Apple MacBook Pro 16 2019 i9 5500M (Win 10) | |
| HP EliteBook 855 G7-23Y52EA | |
| MSI Summit E15 A11SCST | |
| Asus ZenBook UX535-M01440 | |
| Lenovo ThinkPad X1 Extreme Gen3-20TLS0UV00 | |
| Average Intel Core i7-1185G7 (0.55 - 0.615, n=27) | |
| MSI Summit E15 A11SCST (High Performance) | |
| Dell XPS 15 9500 Core i7 4K UHD | |
| MSI Summit E15 A11SCST (High Performance, Cooler Boost) | |
| Average of class Multimedia (0.3826 - 0.723, n=90, last 2 years) | |
* ... smaller is better
System Performance
Everything in the system runs smoothly and we did not encounter any problems. The processor offers more than sufficient computing performance for office and Internet applications. The dedicated graphics core allows using computer games to a limited extent. This is also accompanied by good PC-Mark results.
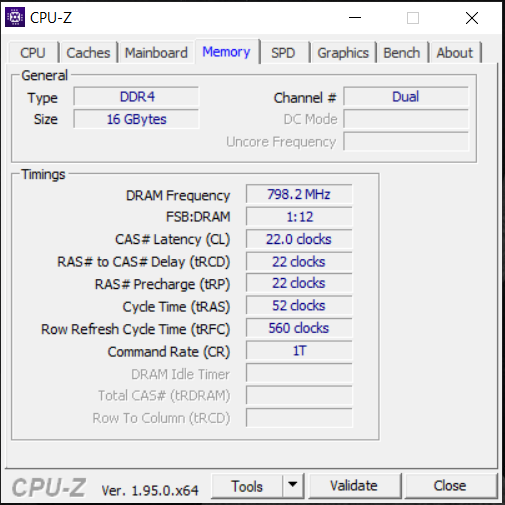
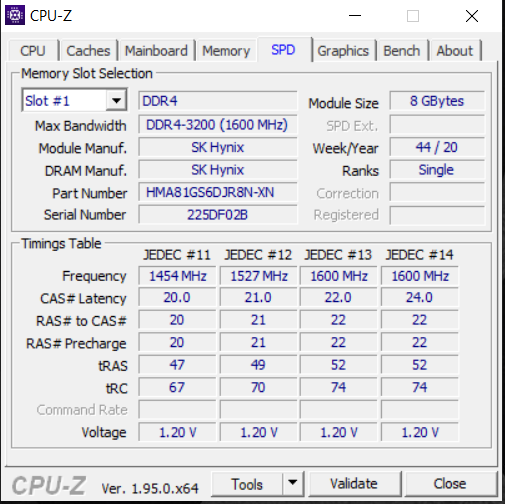
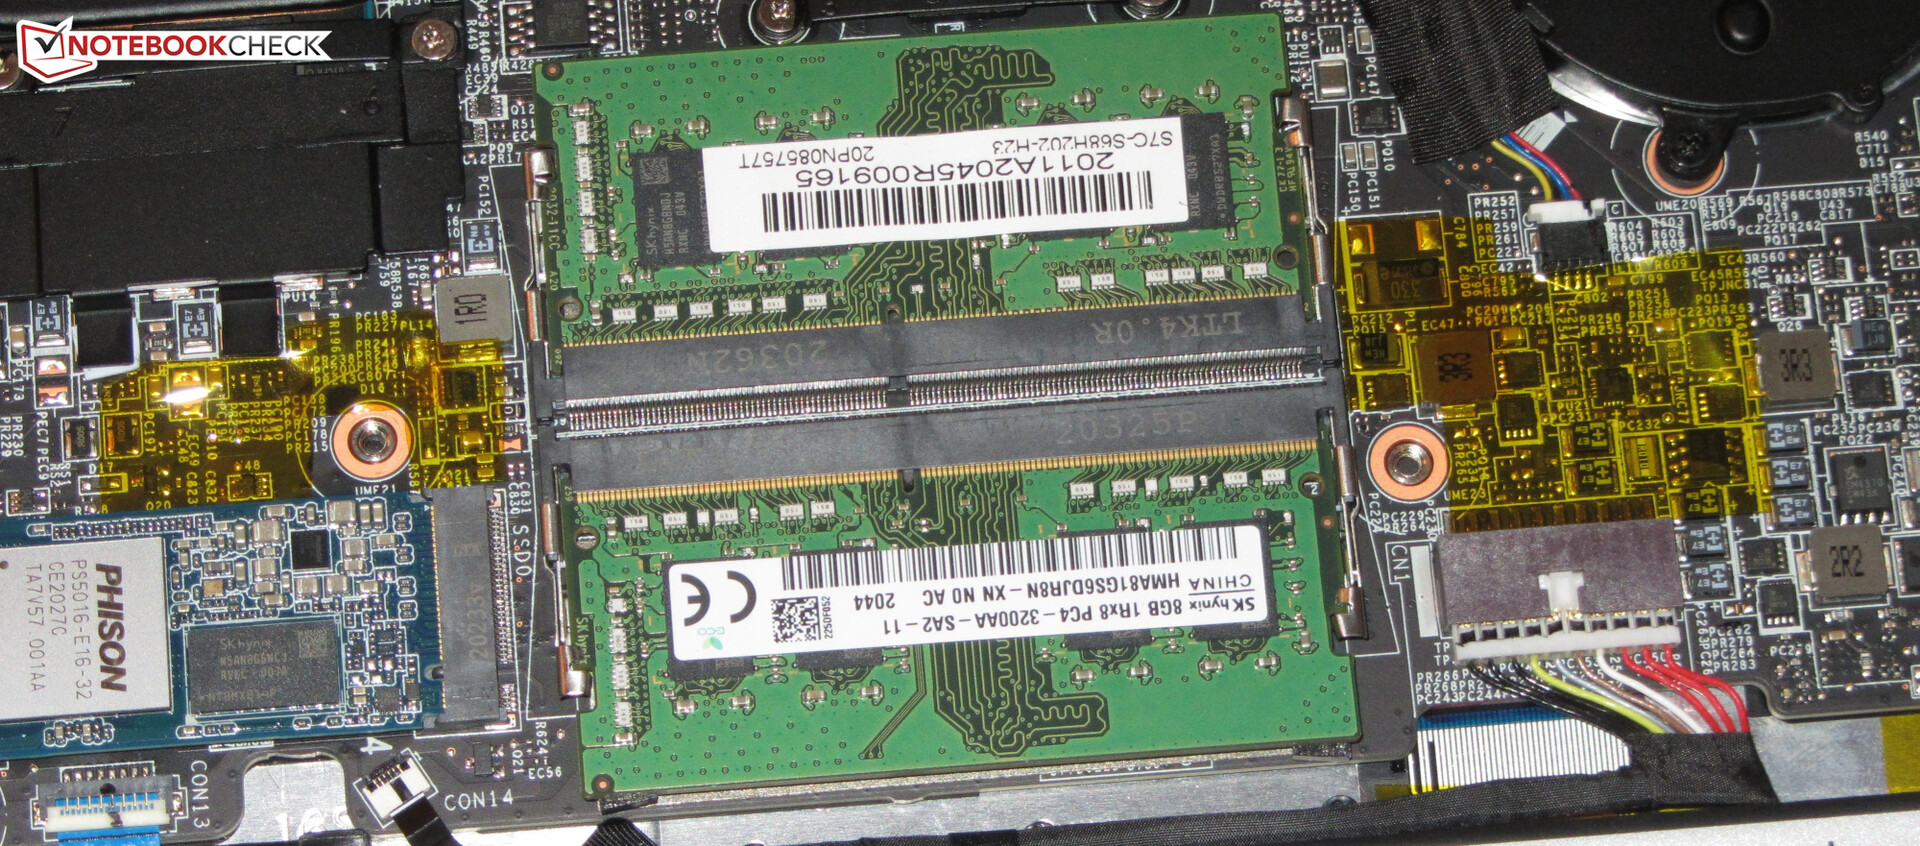
The working memory (DDR4-3200) of the MSI laptop runs in dual-channel mode. Each of the two working memory slots is occupied by an 8-GB module. It is possible to expand the storage up to 64 GB.
| PCMark 8 Home Score Accelerated v2 | 4168 points | |
| PCMark 8 Creative Score Accelerated v2 | 4976 points | |
| PCMark 8 Work Score Accelerated v2 | 5567 points | |
| PCMark 10 Score | 5288 points | |
Help | ||
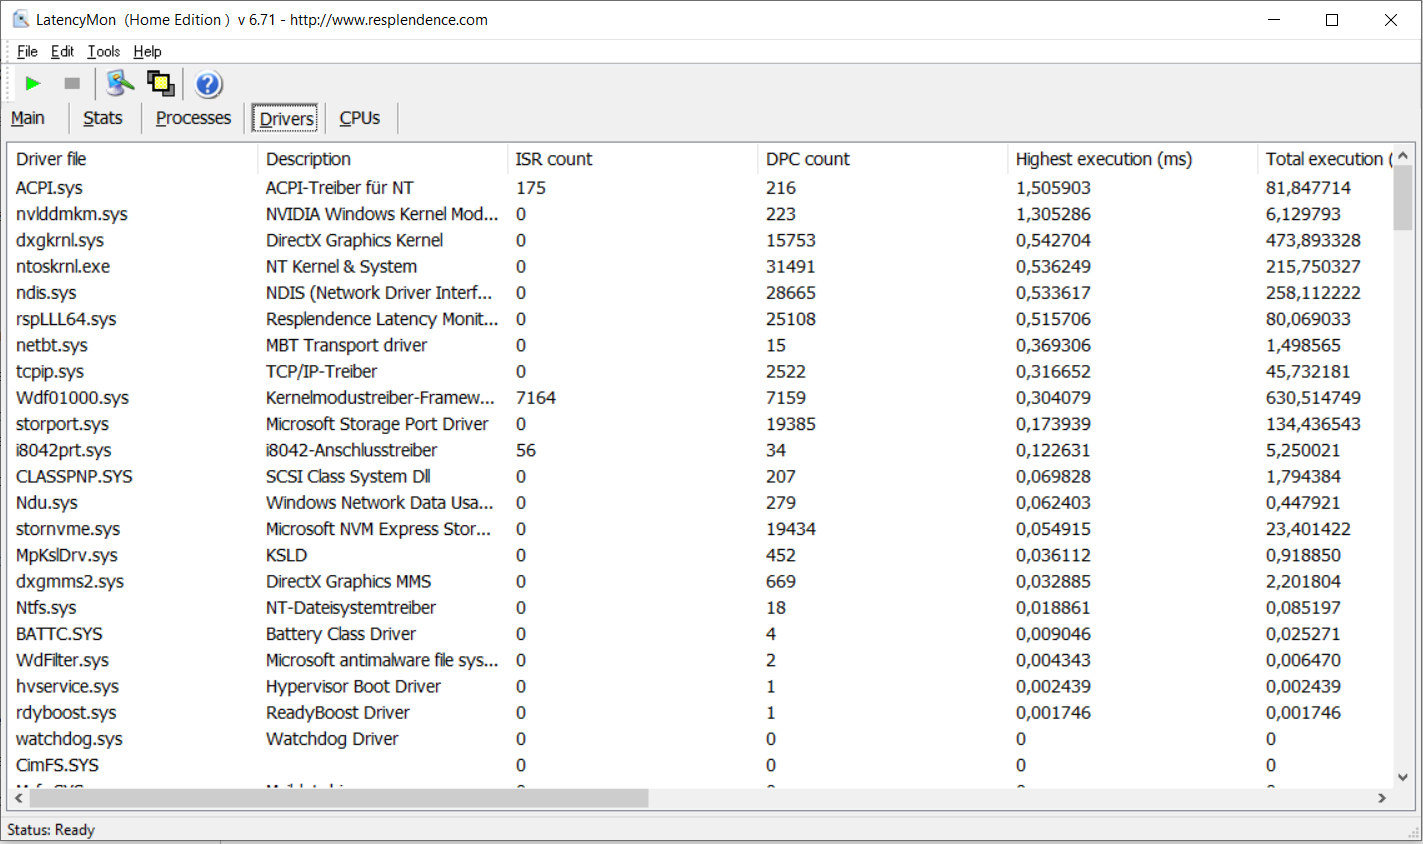
DPC Latencies
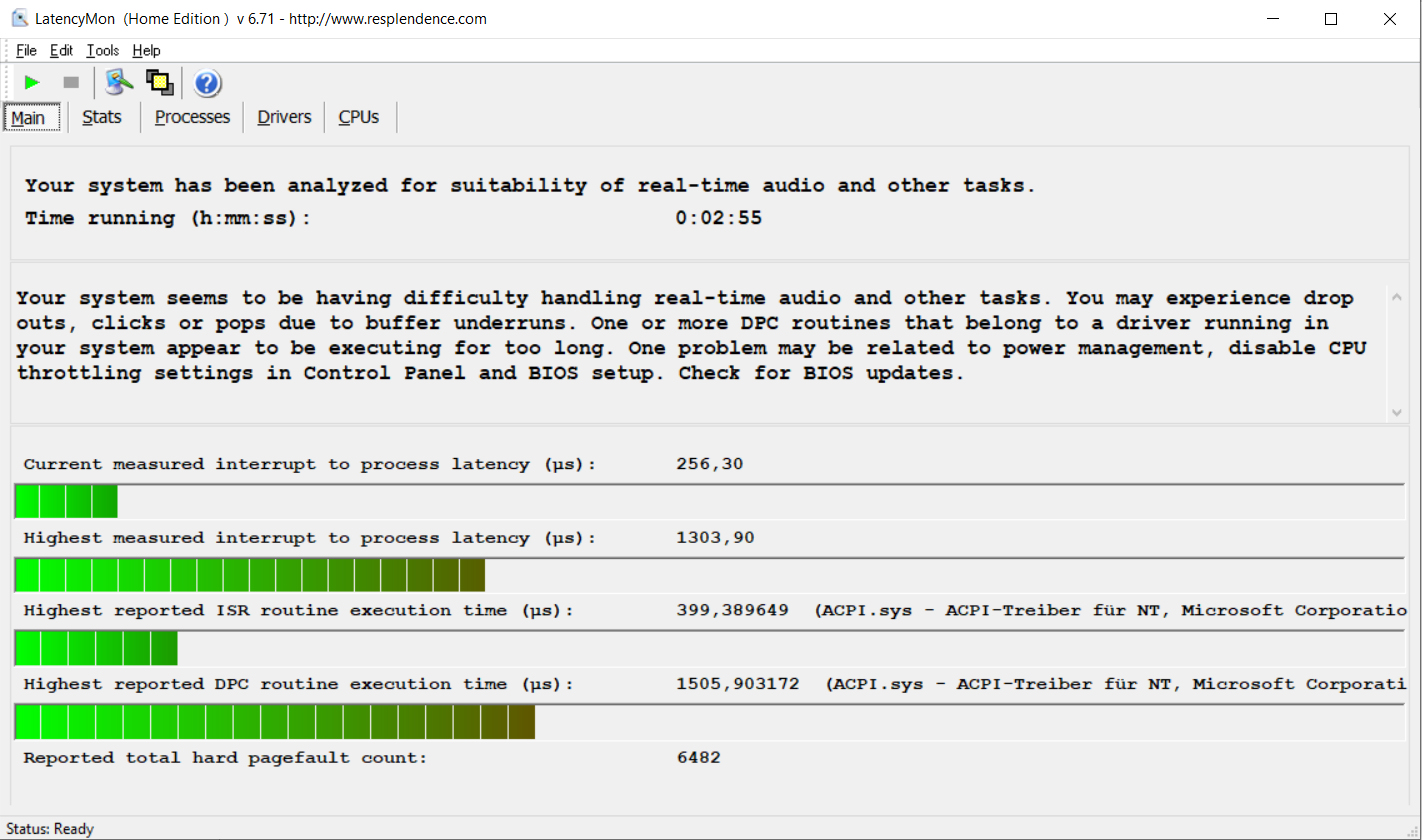
In our standardized Latency Monitor test (web surfing, 4K video reproduction, Prime95 high load) we were able to observe some conspicuous occurrences in the DPC latencies. The system does not appear to be suited for real-time video and audio processing.
| DPC Latencies / LatencyMon - interrupt to process latency (max), Web, Youtube, Prime95 | |
| Dell XPS 15 9500 Core i7 4K UHD | |
| MSI Summit E15 A11SCST | |
| HP EliteBook 855 G7-23Y52EA | |
| Asus ZenBook UX535-M01440 | |
| Lenovo ThinkPad X1 Extreme Gen3-20TLS0UV00 | |
* ... smaller is better
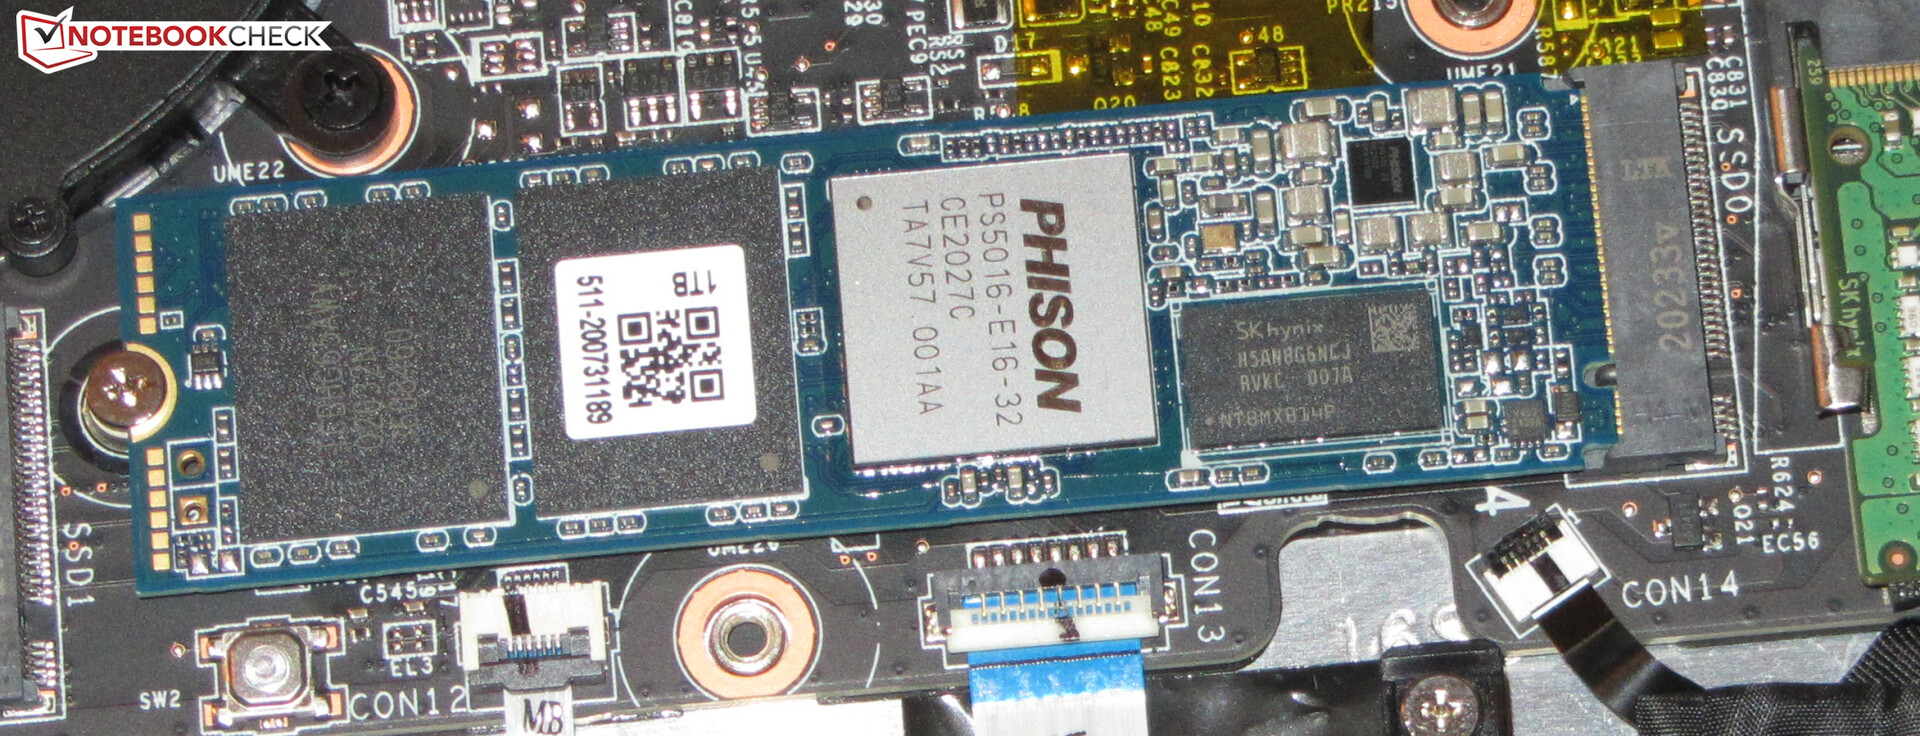
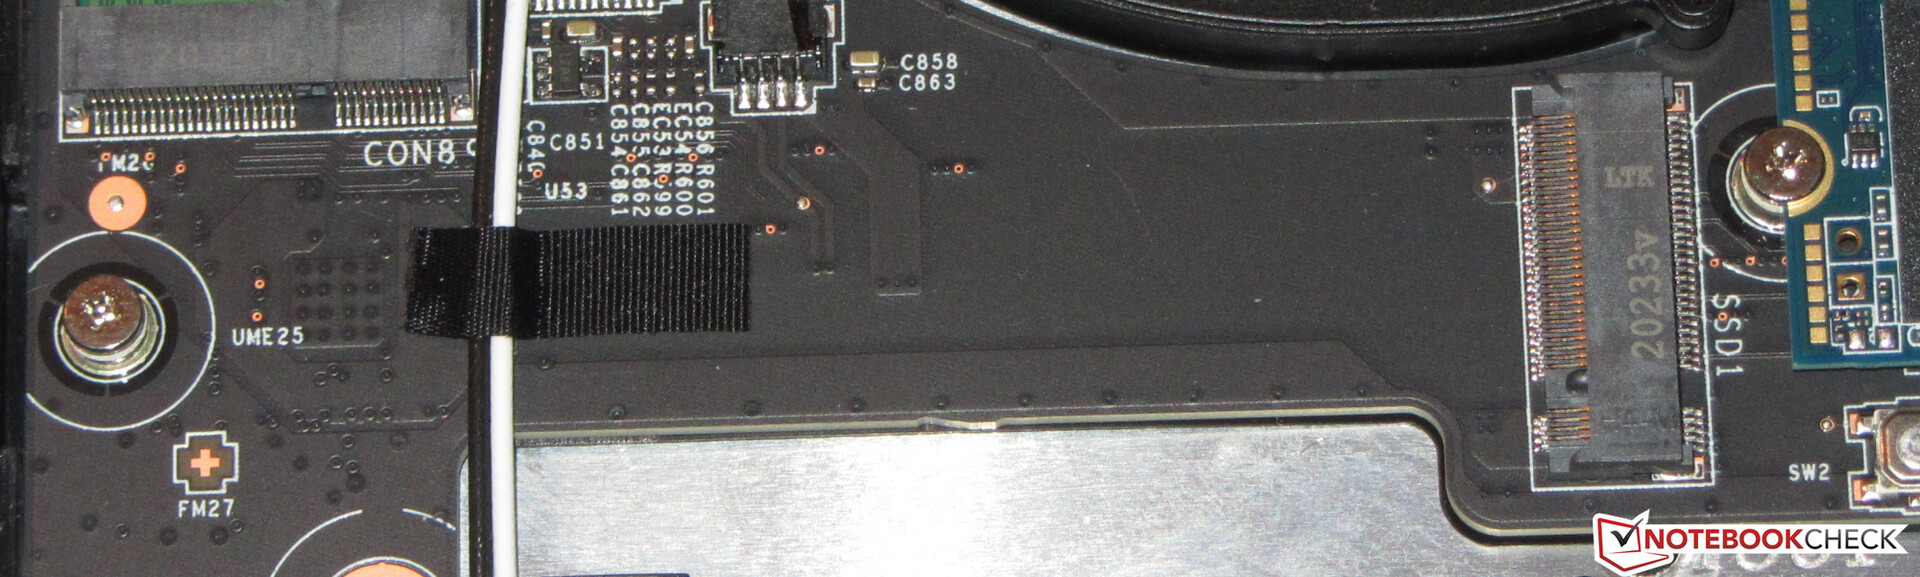
Storage Solution
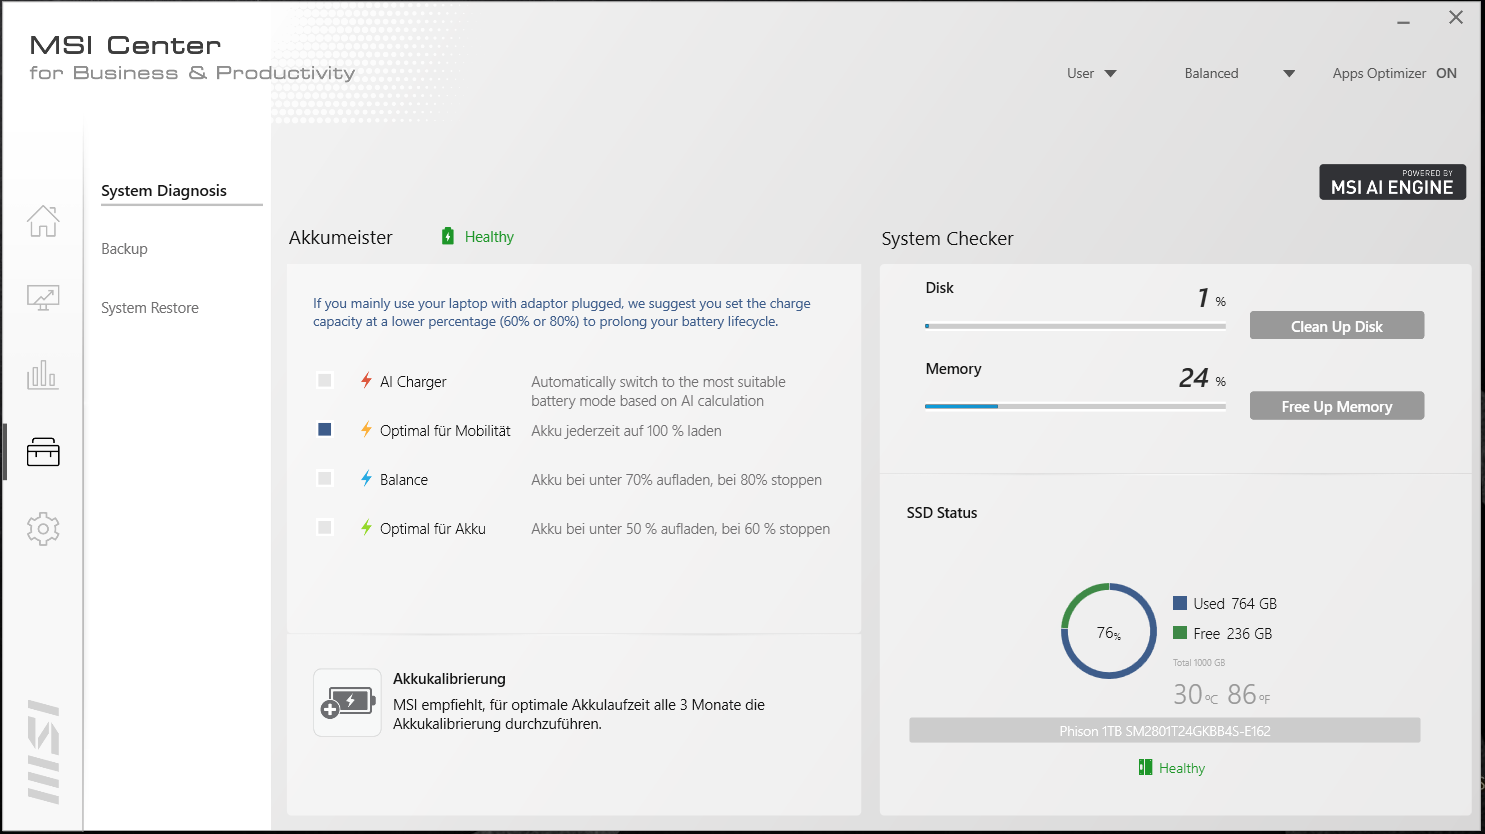
A Phison 1-TB NVMe SSD (M.2-2280) connected via PCI Express 4, which delivers excellent transfer rates, serves as the system drive. It is possible to add a second NVMe SSD (M.2-2280), but the second M.2 slot "only" supports PCI Express 3.

| MSI Summit E15 A11SCST Phison 1TB SM2801T24GKBB4S-E162 | Lenovo ThinkPad X1 Extreme Gen3-20TLS0UV00 Toshiba XG6 KXG6AZNV1T02 | Dell XPS 15 9500 Core i7 4K UHD SK Hynix PC611 512GB | Apple MacBook Pro 16 2019 i9 5500M Apple SSD AP1024 7171 | Asus ZenBook UX535-M01440 WDC PC SN730 SDBPNTY-1T00 | HP EliteBook 855 G7-23Y52EA SK hynix BC511 HFM256GDJTNI-82A0 | |
|---|---|---|---|---|---|---|
| CrystalDiskMark 5.2 / 6 | -10% | -22% | -27% | -24% | -47% | |
| Write 4K | 242.9 | 159.5 -34% | 123.3 -49% | 55.5 -77% | 110 -55% | 72 -70% |
| Read 4K | 54.6 | 53.1 -3% | 41.85 -23% | 16.21 -70% | 43.44 -20% | 34.01 -38% |
| Write Seq | 2420 | 1723 -29% | 2054 -15% | 1959 -19% | 1957 -19% | |
| Read Seq | 2300 | 2164 -6% | 1617 -30% | 1763 -23% | 1615 -30% | |
| Write 4K Q32T1 | 392.7 | 469.2 19% | 413 5% | 398.5 1% | 341.6 -13% | 390.2 -1% |
| Read 4K Q32T1 | 667 | 543 -19% | 377.5 -43% | 648 -3% | 364.3 -45% | 347.7 -48% |
| Write Seq Q32T1 | 2424 | 3055 26% | 2705 12% | 2727 13% | 3081 27% | 793 -67% |
| Read Seq Q32T1 | 4944 | 3296 -33% | 3442 -30% | 3242 -34% | 3251 -34% | 2143 -57% |
| AS SSD | -10% | -51% | -48% | -27% | -64% | |
| Seq Read | 3597 | 2553 -29% | 2072 -42% | 2531 -30% | 1886 -48% | 1633 -55% |
| Seq Write | 2101 | 974 -54% | 1486 -29% | 2289 9% | 1221 -42% | 649 -69% |
| 4K Read | 62.5 | 49.69 -20% | 47.41 -24% | 15.85 -75% | 41.16 -34% | 39.59 -37% |
| 4K Write | 208.9 | 139.5 -33% | 117.6 -44% | 39.88 -81% | 101.2 -52% | 101.9 -51% |
| 4K-64 Read | 1145 | 1462 28% | 967 -16% | 1267 11% | 1022 -11% | 591 -48% |
| 4K-64 Write | 1482 | 1474 -1% | 715 -52% | 1749 18% | 1618 9% | 342.3 -77% |
| Access Time Read * | 0.05 | 0.063 -26% | 0.057 -14% | 0.122 -144% | 0.058 -16% | 0.085 -70% |
| Access Time Write * | 0.019 | 0.031 -63% | 0.096 -405% | 0.095 -400% | 0.037 -95% | 0.036 -89% |
| Score Read | 1567 | 1767 13% | 1222 -22% | 1536 -2% | 1252 -20% | 794 -49% |
| Score Write | 1901 | 1711 -10% | 981 -48% | 2018 6% | 1841 -3% | 509 -73% |
| Score Total | 4207 | 4308 2% | 2809 -33% | 4317 3% | 3706 -12% | 1671 -60% |
| Copy ISO MB/s | 2209 | 2094 -5% | 1999 -10% | 1995 -10% | 1611 -27% | 1088 -51% |
| Copy Program MB/s | 455.2 | 657 44% | 627 38% | 584 28% | 509 12% | 72.6 -84% |
| Copy Game MB/s | 1225 | 1447 18% | 1001 -18% | 1135 -7% | 677 -45% | 238.4 -81% |
| Total Average (Program / Settings) | -10% /
-10% | -37% /
-41% | -38% /
-40% | -26% /
-26% | -56% /
-59% |
* ... smaller is better
Constant Performance Reads: DiskSpd Read Loop, Queue Depth 8
Graphics Card
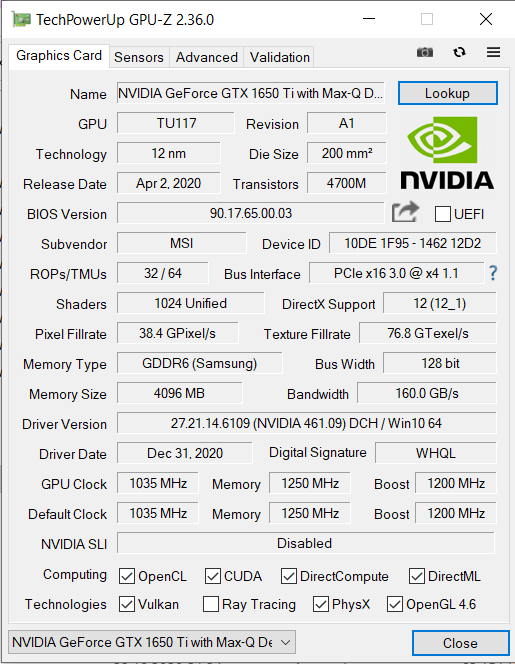
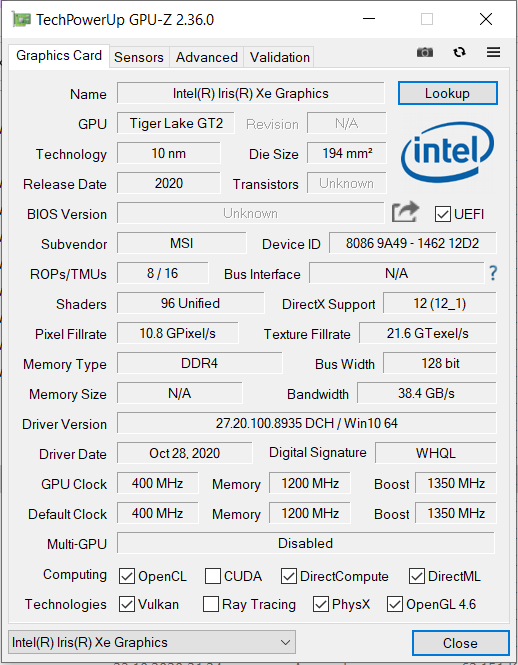
The dedicated GeForce GTX 1650 Ti-Max-Q graphics core belongs to the upper GPU midrange. This trimmed-for-efficiency version of the regular GTX 1650 Ti is designed for slim and light laptops. The GPU is accompanied by fast GDDR6 storage (4096 MB). The integrated Intel Iris Xe Graphics G7-96EU GPU is active and the laptop uses Nvidia's Optimus switching graphics solution.
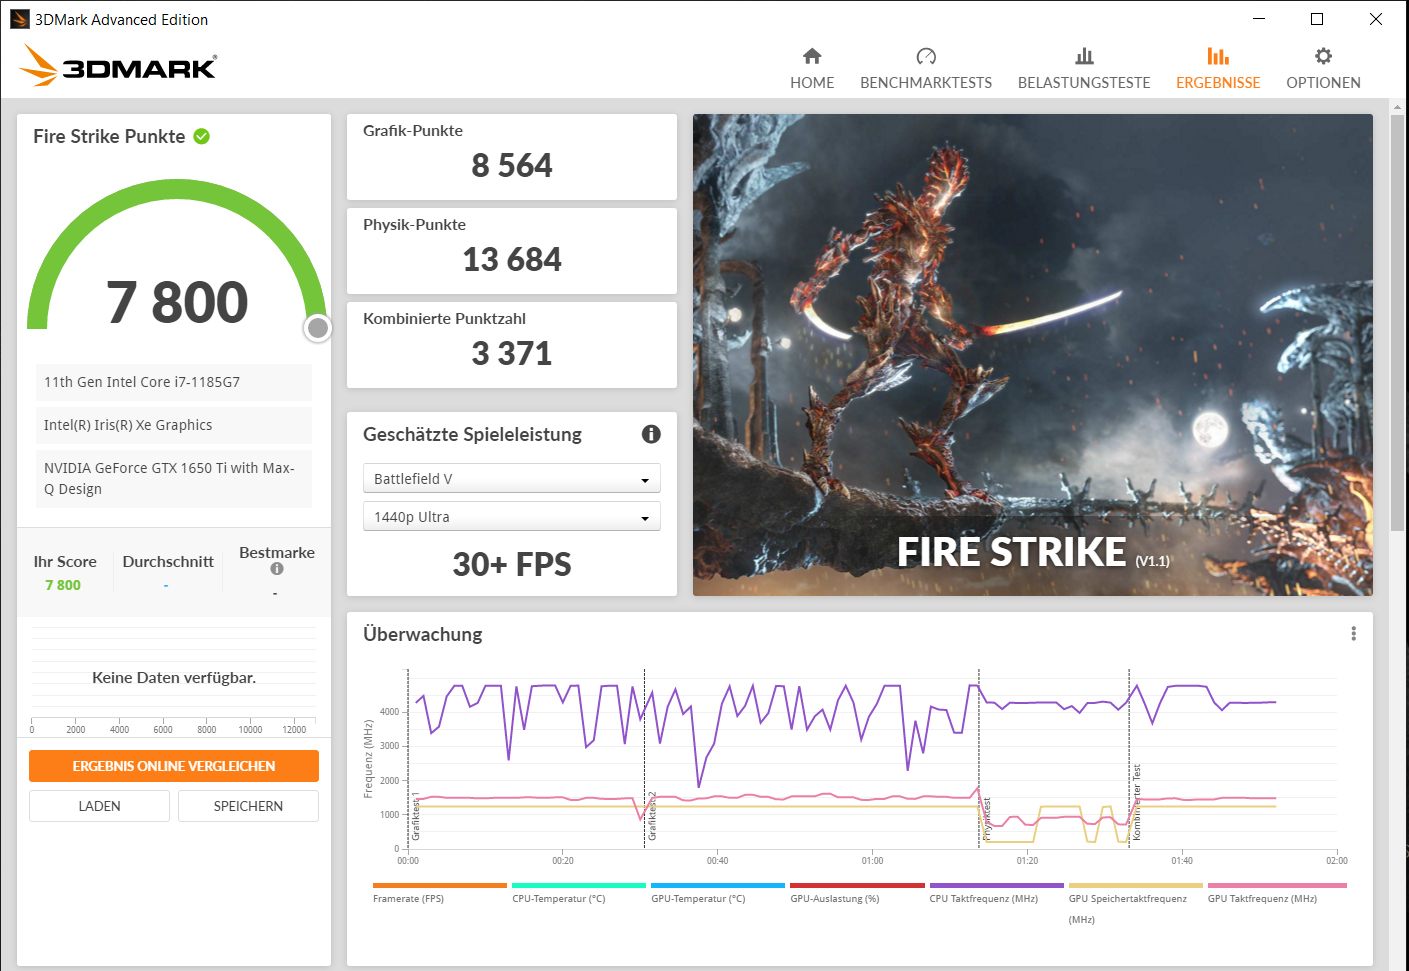
The 3D-Mark results range at a normal level for the GPU used here. The ThinkPad X1 Extreme, which is also equipped with the GeForce 1650 Ti-Max-Q graphics core, does slightly better. The "High Performance" profile only brings a minimal increase of the graphics performance, if the fans also run at maximum speeds (Cooler Boost) at the same time.
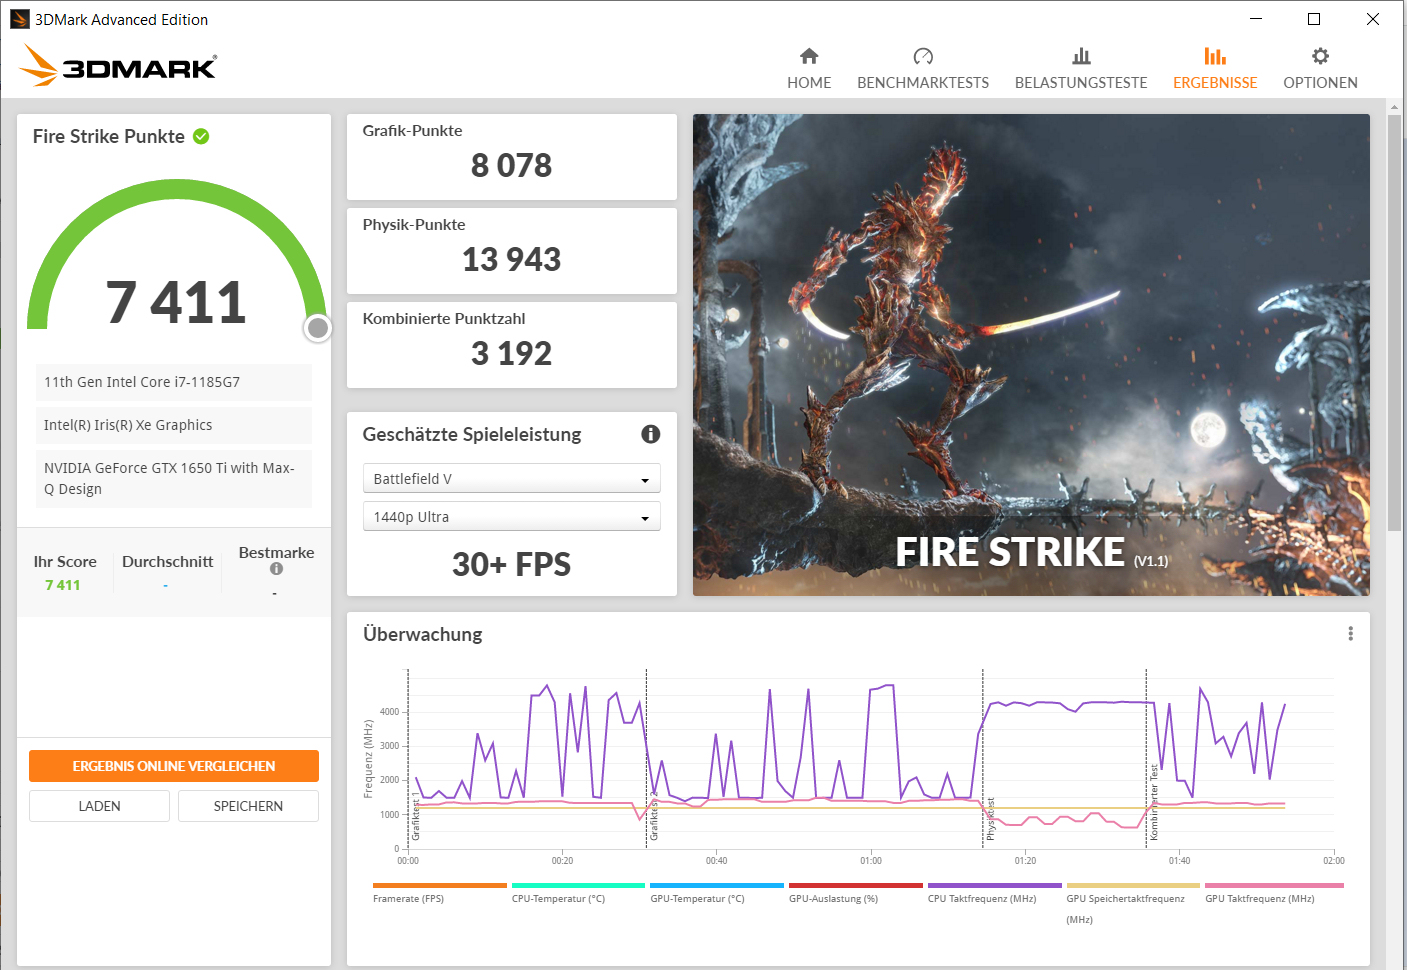
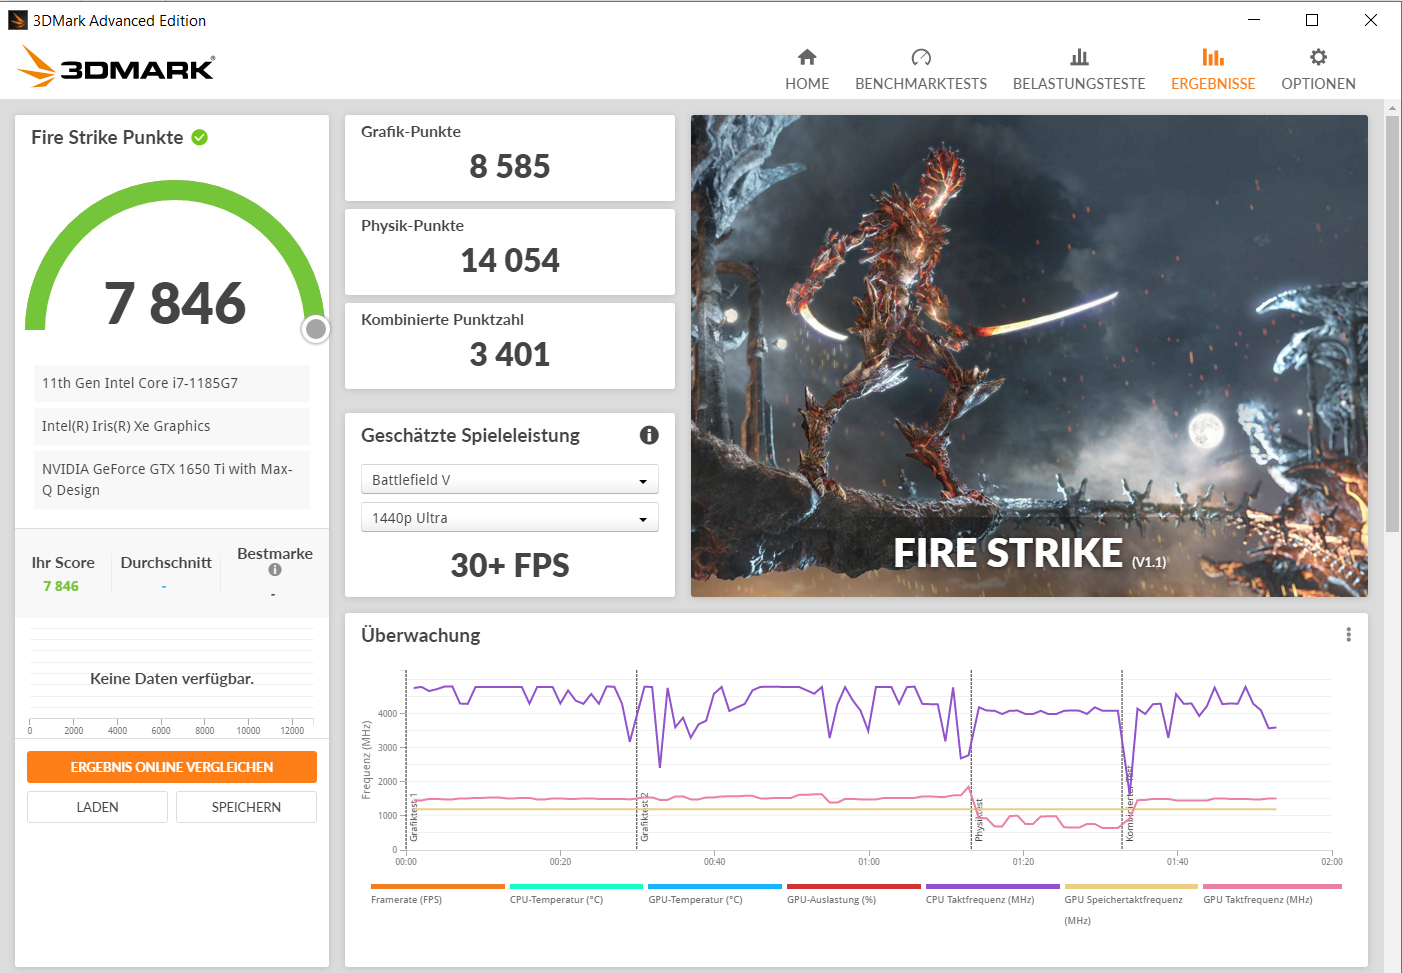
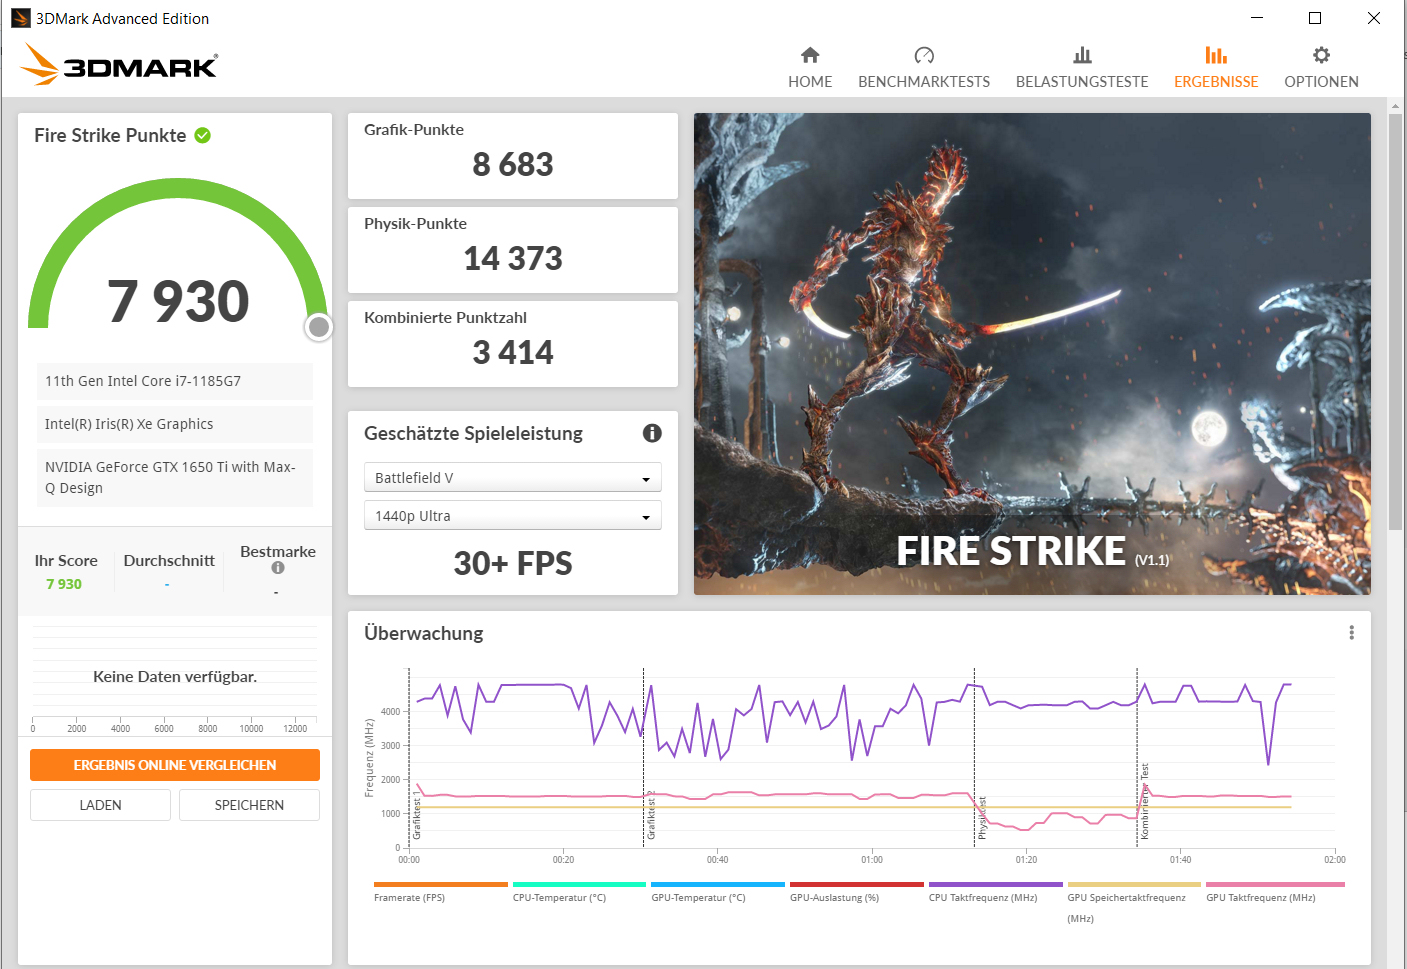
| 3DMark 11 Performance | 11572 points | |
| 3DMark Cloud Gate Standard Score | 25005 points | |
| 3DMark Fire Strike Score | 7800 points | |
| 3DMark Time Spy Score | 3330 points | |
Help | ||
| 3DMark | |
| 1920x1080 Fire Strike Graphics | |
| Average of class Multimedia (1835 - 46022, n=90, last 2 years) | |
| Apple MacBook Pro 16 2019 i9 5500M | |
| Dell XPS 15 9500 Core i7 4K UHD | |
| Lenovo ThinkPad X1 Extreme Gen3-20TLS0UV00 | |
| MSI Summit E15 A11SCST (High Performance, Cooler Boost) | |
| MSI Summit E15 A11SCST (High Performance) | |
| MSI Summit E15 A11SCST | |
| Average NVIDIA GeForce GTX 1650 Ti Max-Q (8024 - 9573, n=11) | |
| Asus ZenBook UX535-M01440 | |
| HP EliteBook 855 G7-23Y52EA | |
| 2560x1440 Time Spy Graphics | |
| Average of class Multimedia (622 - 17620, n=90, last 2 years) | |
| Dell XPS 15 9500 Core i7 4K UHD | |
| Apple MacBook Pro 16 2019 i9 5500M | |
| Lenovo ThinkPad X1 Extreme Gen3-20TLS0UV00 | |
| MSI Summit E15 A11SCST | |
| Average NVIDIA GeForce GTX 1650 Ti Max-Q (2886 - 3526, n=9) | |
| Asus ZenBook UX535-M01440 | |
| HP EliteBook 855 G7-23Y52EA | |
Gaming Performance
The Summit E15 brings all the games that we have in our database smoothly to the screen. In general, you can choose the Full-HD resolution and medium to high quality settings. Games with only moderate demands on the hardware allow for more. CPU-heavy games benefit from the "High Performance" profile.
While the ThinkPad X1 Extreme, which is equipped with the same GPU, is faring only slightly better than the Summitt E15 in the 3D Mark benchmarks, the advantage turns out significantly higher in parts in the gaming practice. The ThinkPad is able to profit from its two additional CPU cores here.
| The Witcher 3 - 1920x1080 High Graphics & Postprocessing (Nvidia HairWorks Off) | |
| Average of class Multimedia (11.2 - 290, n=92, last 2 years) | |
| Apple MacBook Pro 16 2019 i9 5500M | |
| Lenovo ThinkPad X1 Extreme Gen3-20TLS0UV00 | |
| Dell XPS 15 9500 Core i7 4K UHD | |
| Average NVIDIA GeForce GTX 1650 Ti Max-Q (47.9 - 66, n=10) | |
| Asus ZenBook UX535-M01440 | |
| MSI Summit E15 A11SCST | |
| MSI Summit E15 A11SCST (High Performance) | |
| HP EliteBook 855 G7-23Y52EA | |
| Dota 2 Reborn - 1920x1080 ultra (3/3) best looking | |
| Dell XPS 15 9500 Core i7 4K UHD | |
| MSI Summit E15 A11SCST (High Performance) | |
| MSI Summit E15 A11SCST (High Performance, Cooler Boost) | |
| Apple MacBook Pro 16 2019 i9 5500M | |
| MSI Summit E15 A11SCST | |
| Asus ZenBook UX535-M01440 | |
| Average NVIDIA GeForce GTX 1650 Ti Max-Q (101 - 110, n=11) | |
| Average of class Multimedia (26.3 - 171.6, n=90, last 2 years) | |
| Lenovo ThinkPad X1 Extreme Gen3-20TLS0UV00 | |
| HP EliteBook 855 G7-23Y52EA | |
| X-Plane 11.11 - 1920x1080 high (fps_test=3) | |
| MSI Summit E15 A11SCST (High Performance, Cooler Boost) | |
| MSI Summit E15 A11SCST (High Performance) | |
| Average of class Multimedia (23 - 131.1, n=95, last 2 years) | |
| Asus ZenBook UX535-M01440 | |
| MSI Summit E15 A11SCST | |
| Average NVIDIA GeForce GTX 1650 Ti Max-Q (60.5 - 72.3, n=11) | |
| Dell XPS 15 9500 Core i7 4K UHD | |
| Lenovo ThinkPad X1 Extreme Gen3-20TLS0UV00 | |
| HP EliteBook 855 G7-23Y52EA | |
| Far Cry 5 - 1920x1080 Ultra Preset AA:T | |
| Average of class Multimedia (18 - 145, n=59, last 2 years) | |
| Lenovo ThinkPad X1 Extreme Gen3-20TLS0UV00 | |
| Apple MacBook Pro 16 2019 i9 5500M | |
| MSI Summit E15 A11SCST (High Performance) | |
| Average NVIDIA GeForce GTX 1650 Ti Max-Q (39 - 56, n=4) | |
| MSI Summit E15 A11SCST | |
| Shadow of the Tomb Raider - 1920x1080 High Preset AA:SM | |
| Average of class Multimedia (38 - 146, n=12, last 2 years) | |
| Dell XPS 15 9500 Core i7 4K UHD | |
| Apple MacBook Pro 16 2019 i9 5500M | |
| Average NVIDIA GeForce GTX 1650 Ti Max-Q (40 - 55, n=5) | |
| Asus ZenBook UX535-M01440 | |
| MSI Summit E15 A11SCST | |
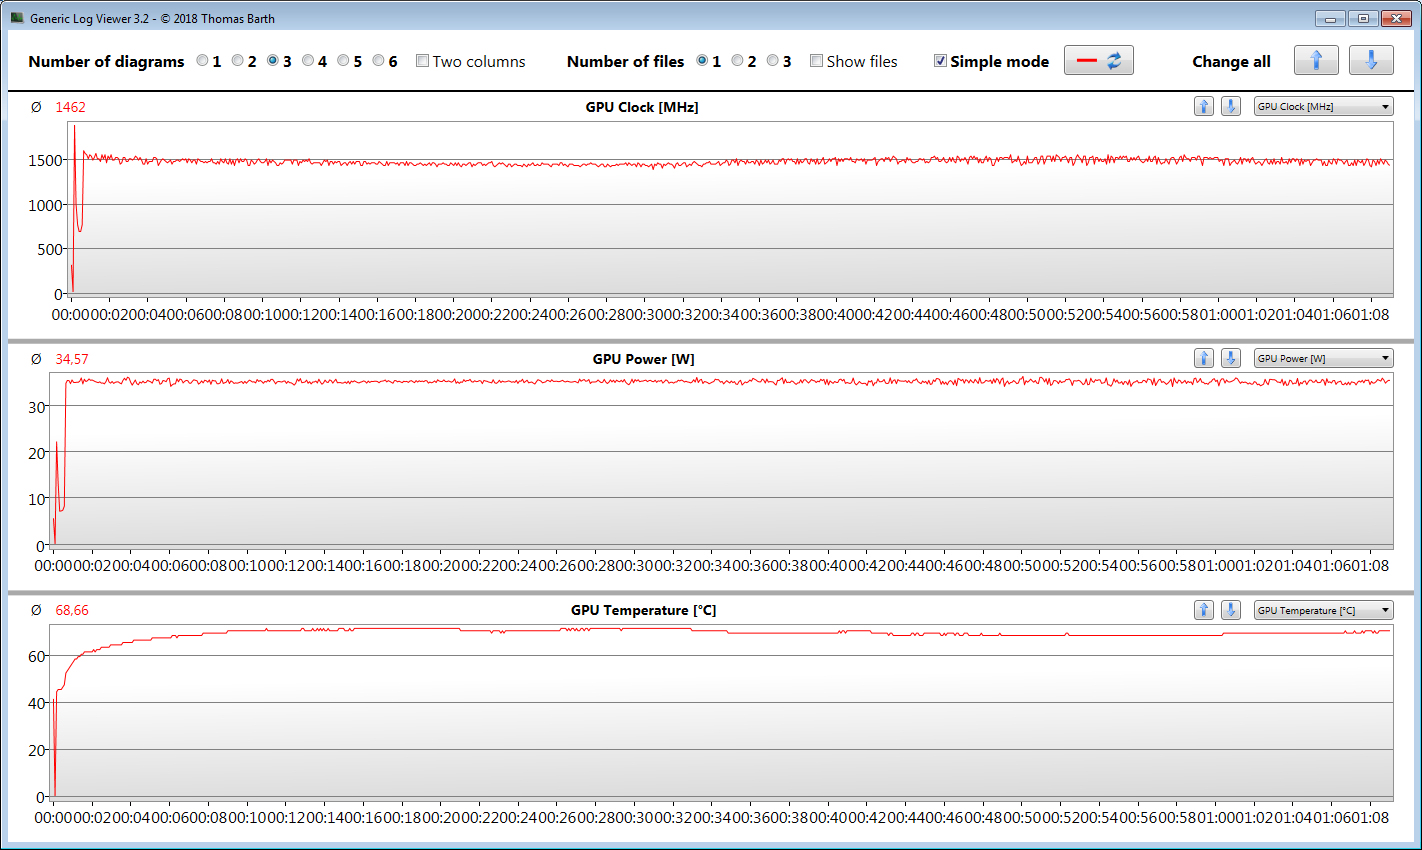
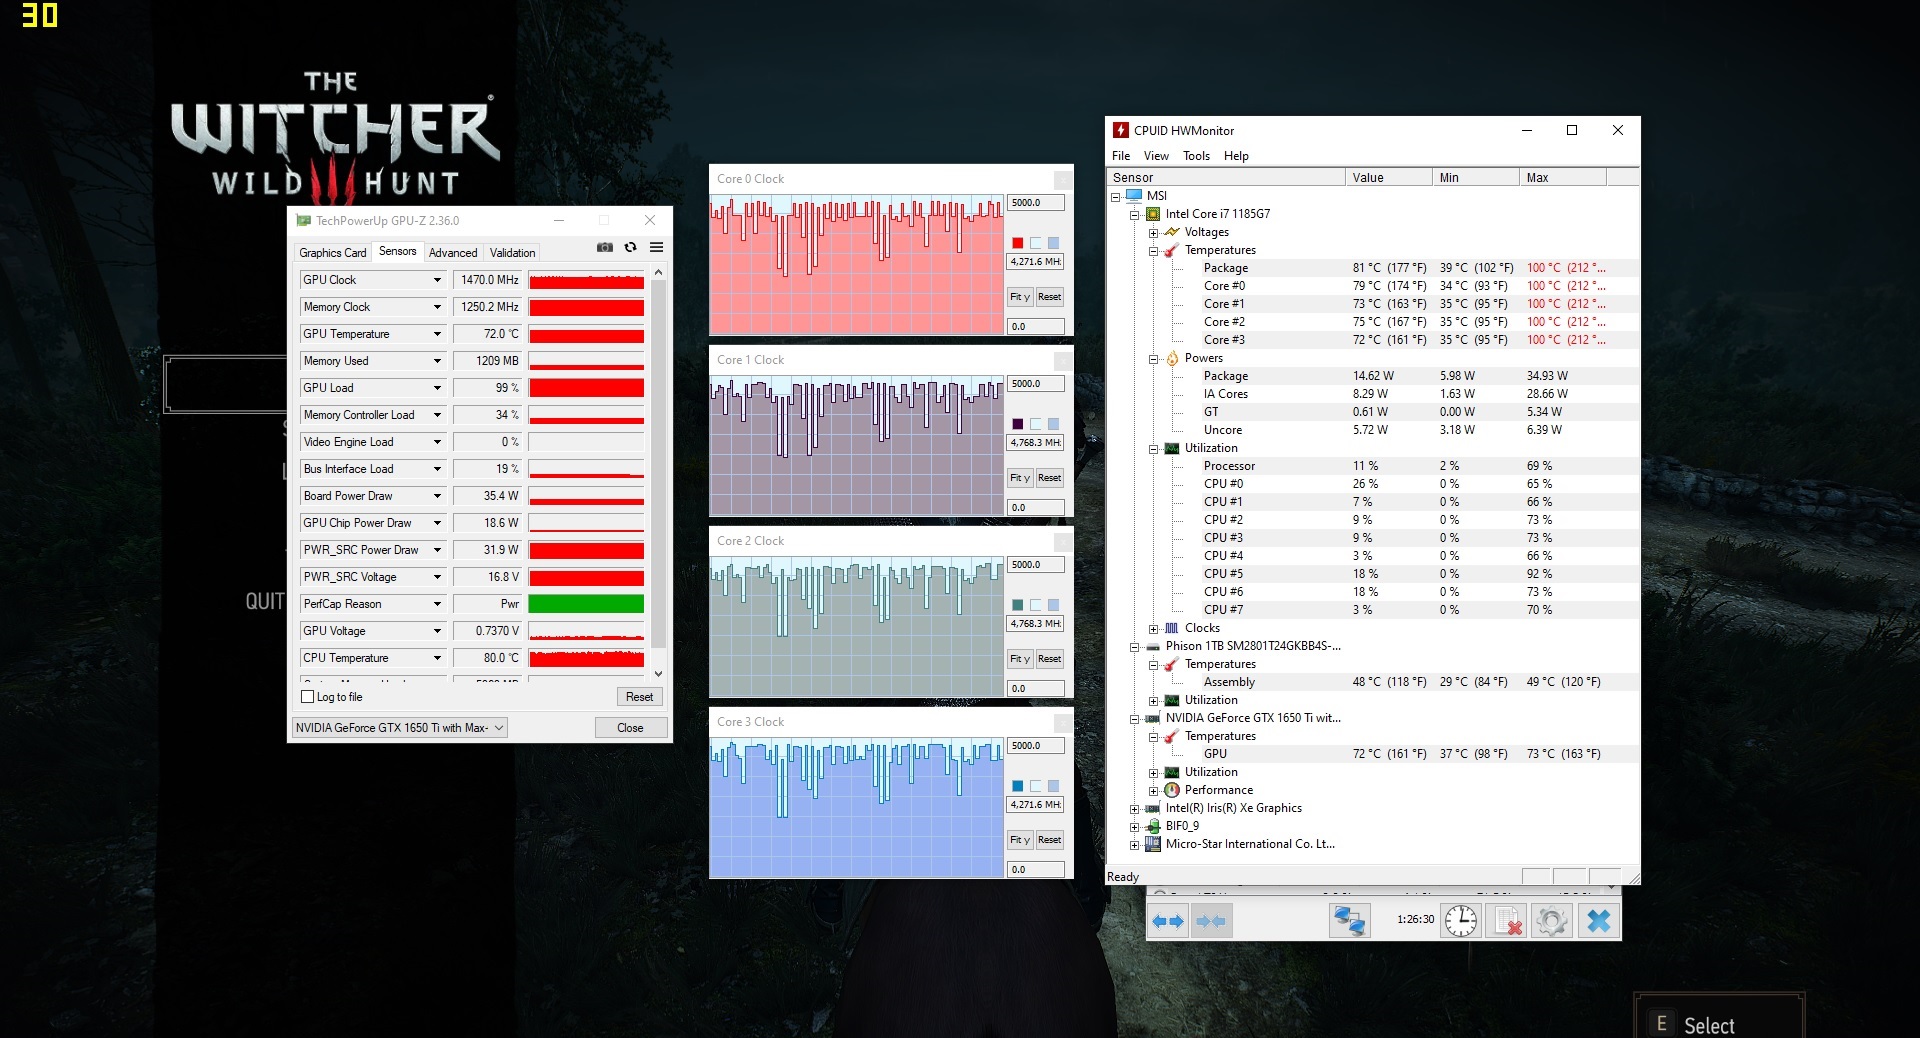
In order to evaluate whether the frame rates also remain fairly constant over a longer time period, we run the game "The Witcher 3" for about 60 minutes at Full-HD resolution and maximum quality settings without moving the gaming character. We do not notice a drop in the frame rates.
| low | med. | high | ultra | |
| The Witcher 3 (2015) | 153.2 | 92 | 54.9 | 32.5 |
| Dota 2 Reborn (2015) | 137 | 119 | 111 | 107 |
| X-Plane 11.11 (2018) | 91.2 | 79.2 | 66.7 | |
| Far Cry 5 (2018) | 102 | 56 | 51 | 47 |
| Shadow of the Tomb Raider (2018) | 106 | 56 | 40 | 34 |
| Death Stranding (2020) | 85.6 | 53.6 | 50.7 | 49.5 |
| Horizon Zero Dawn (2020) | 80 | 42 | 35 | 32 |
| Serious Sam 4 (2020) | 94.8 | 47.5 | 36.8 | 20.9 |
| Watch Dogs Legion (2020) | 70 | 43 | 37 | 11 |
| Assassin´s Creed Valhalla (2020) | 63 | 38 | 24 | 5 |
| Yakuza Like a Dragon (2020) | 97.5 | 42.5 | 40.5 | 35.7 |
| Immortals Fenyx Rising (2020) | 70 | 45 | 37 | 28 |
Emissions - The MSI laptop gets hot under load
Noise Emissions
Across the whole load range, the noise development remains on a normal level for the hardware used here. In idle operation, the fans run constantly at low speeds, but they are not very noisy. Under load, we register a maximum noise level of 44 dB(A) (stress test) and 41 dB(A) (The Witcher 3 test). The noise level of the laptop can be reduced by using the "Silent" profile.
Noise Level
| Idle |
| 28 / 29 / 32 dB(A) |
| Load |
| 43 / 44 dB(A) |
 | ||
30 dB silent 40 dB(A) audible 50 dB(A) loud |
||
min: | ||
| MSI Summit E15 A11SCST i7-1185G7, GeForce GTX 1650 Ti Max-Q | Lenovo ThinkPad X1 Extreme Gen3-20TLS0UV00 i7-10750H, GeForce GTX 1650 Ti Max-Q | Dell XPS 15 9500 Core i7 4K UHD i7-10875H, GeForce GTX 1650 Ti Mobile | Apple MacBook Pro 16 2019 i9 5500M i9-9880H, Radeon Pro 5500M | Asus ZenBook UX535-M01440 i7-10750H, GeForce GTX 1650 Ti Max-Q | Average NVIDIA GeForce GTX 1650 Ti Max-Q | Average of class Multimedia | |
|---|---|---|---|---|---|---|---|
| Noise | -2% | -3% | -6% | 8% | 3% | 7% | |
| off / environment * | 24 | 29.5 -23% | 28.4 -18% | 29.8 -24% | 24.6 -3% | 26.1 ? -9% | 24.1 ? -0% |
| Idle Minimum * | 28 | 29.5 -5% | 28.4 -1% | 29.9 -7% | 24.6 12% | 26.6 ? 5% | 24.5 ? 12% |
| Idle Average * | 29 | 29.5 -2% | 28.4 2% | 29.9 -3% | 24.6 15% | 26.7 ? 8% | 25 ? 14% |
| Idle Maximum * | 32 | 29.9 7% | 28.4 11% | 29.9 7% | 24.6 23% | 28 ? 12% | 26.5 ? 17% |
| Load Average * | 43 | 44.2 -3% | 46 -7% | 43 -0% | 41.3 4% | 41.3 ? 4% | 39.8 ? 7% |
| Witcher 3 ultra * | 41 | 36.1 12% | 42 -2% | 45.4 -11% | 42 -2% | ||
| Load Maximum * | 44 | 44.2 -0% | 47.1 -7% | 46.1 -5% | 41.4 6% | 44.7 ? -2% | 47.4 ? -8% |
* ... smaller is better
Temperature
The CPU and GPU run through our stress test (Prime95 and Furmark running for at least one hour) at 2.4 GHz and 1125 MHz respectively. The stress test represents an extreme scenario. We use this test to evaluate whether the system remains stable at full load.
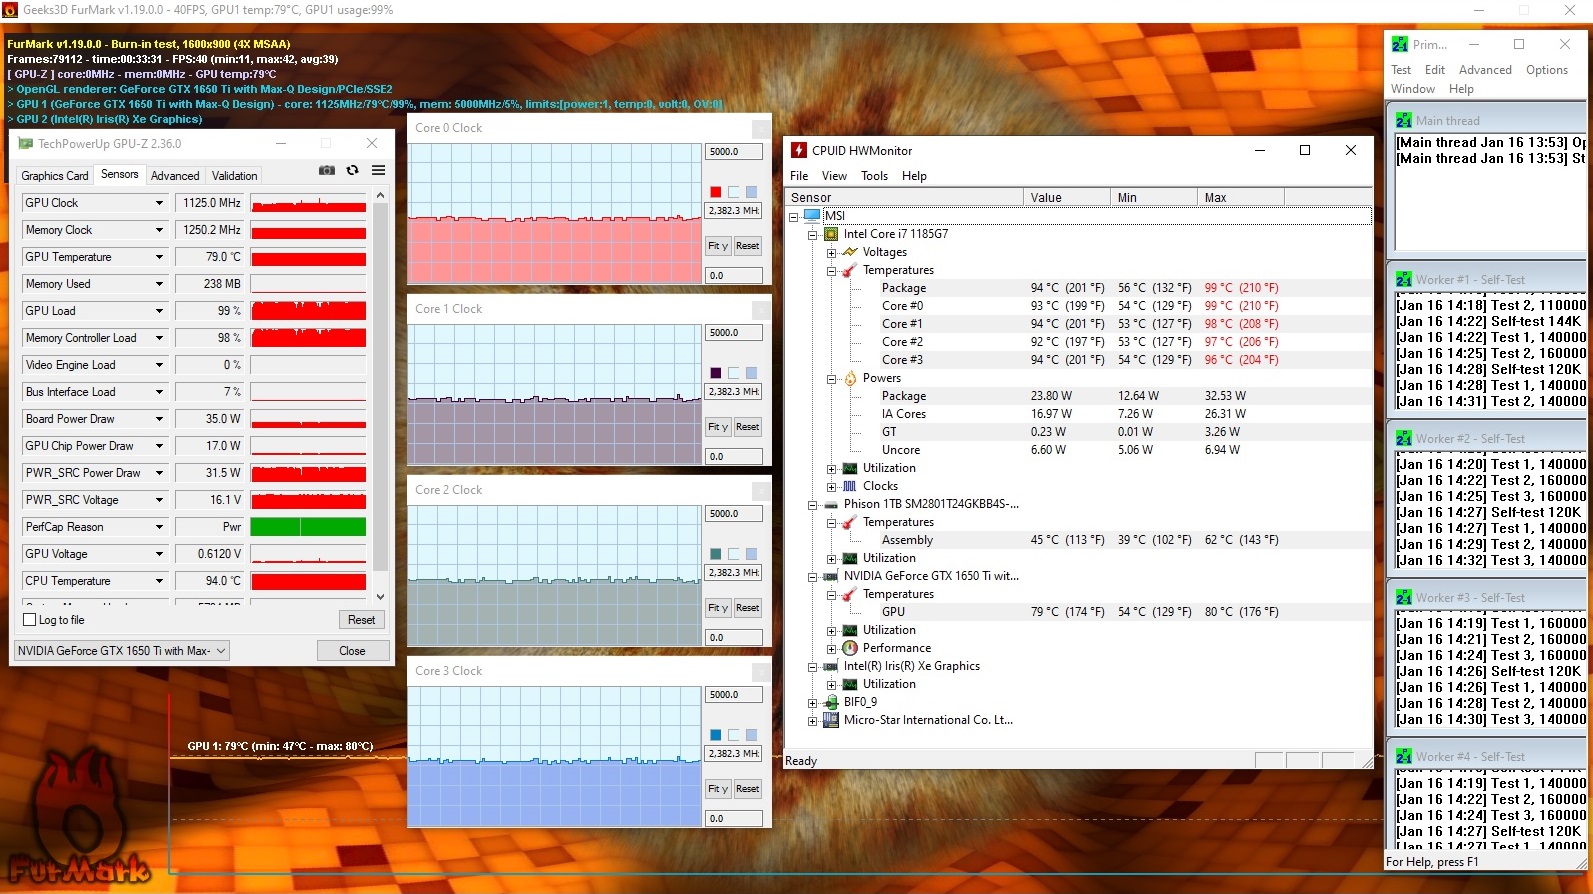
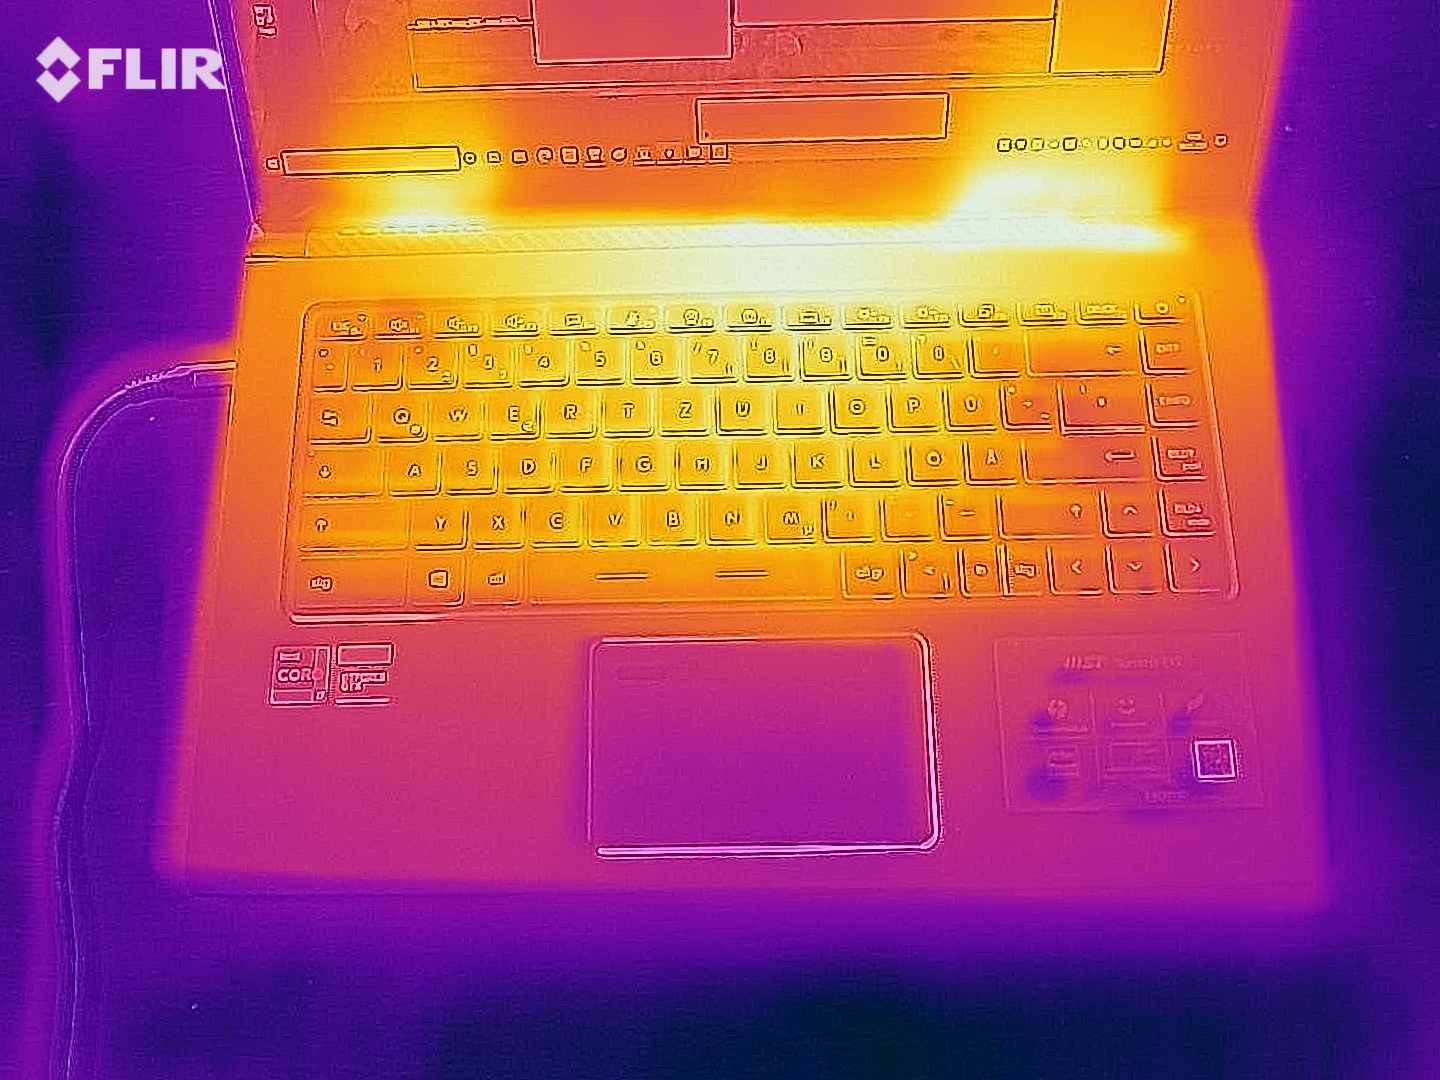
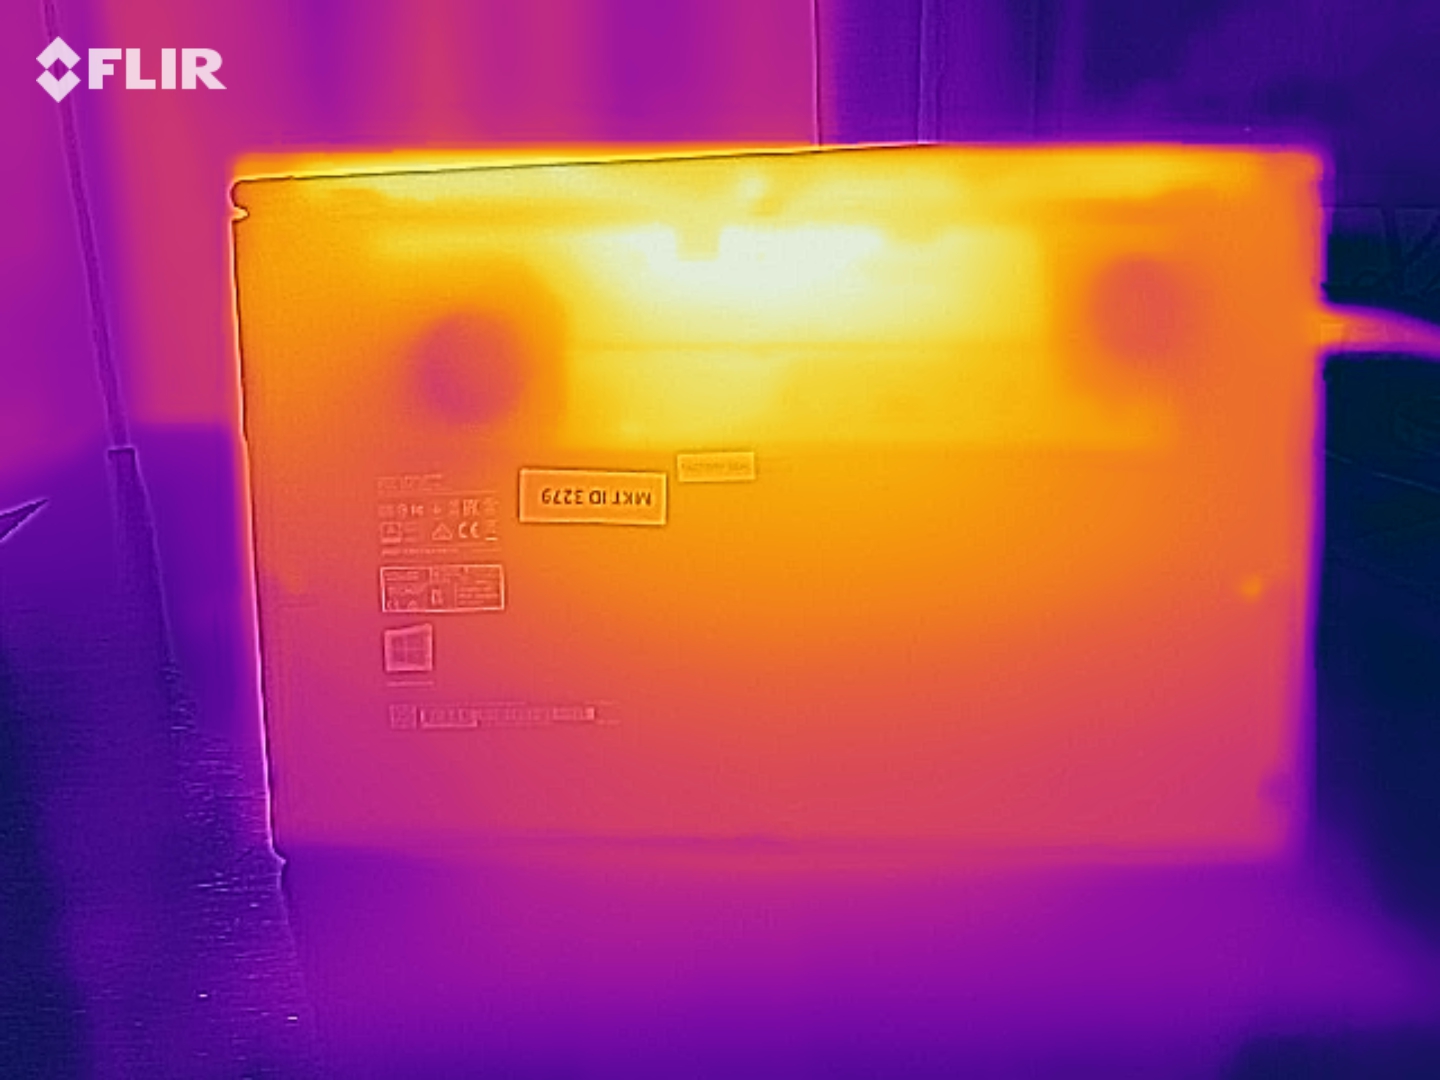
The Summit warms up noticeably under load. During the stress test, we register temperatures between 55 and 60 ºC (131-140 ºF) at several measurement points. The heat development turns out slightly lower when running our "The Witcher 3" test. In neither case should you run the laptop on your thighs. In everyday operation, the temperatures remain within the green range.
(-) The maximum temperature on the upper side is 56 °C / 133 F, compared to the average of 36.9 °C / 98 F, ranging from 21.1 to 71 °C for the class Multimedia.
(-) The bottom heats up to a maximum of 60 °C / 140 F, compared to the average of 39.1 °C / 102 F
(+) In idle usage, the average temperature for the upper side is 25 °C / 77 F, compared to the device average of 31.2 °C / 88 F.
(-) Playing The Witcher 3, the average temperature for the upper side is 41 °C / 106 F, compared to the device average of 31.2 °C / 88 F.
(±) The palmrests and touchpad can get very hot to the touch with a maximum of 36 °C / 96.8 F.
(-) The average temperature of the palmrest area of similar devices was 28.8 °C / 83.8 F (-7.2 °C / -13 F).
| MSI Summit E15 A11SCST i7-1185G7, GeForce GTX 1650 Ti Max-Q | Lenovo ThinkPad X1 Extreme Gen3-20TLS0UV00 i7-10750H, GeForce GTX 1650 Ti Max-Q | Dell XPS 15 9500 Core i7 4K UHD i7-10875H, GeForce GTX 1650 Ti Mobile | Apple MacBook Pro 16 2019 i9 5500M i9-9880H, Radeon Pro 5500M | Asus ZenBook UX535-M01440 i7-10750H, GeForce GTX 1650 Ti Max-Q | Average NVIDIA GeForce GTX 1650 Ti Max-Q | Average of class Multimedia | |
|---|---|---|---|---|---|---|---|
| Heat | 13% | -2% | 18% | 12% | 3% | 7% | |
| Maximum Upper Side * | 56 | 48.8 13% | 44 21% | 42 25% | 37.8 32% | 45.8 ? 18% | 43.9 ? 22% |
| Maximum Bottom * | 60 | 51.1 15% | 48.8 19% | 38 37% | 44.2 26% | 50.2 ? 16% | 46.3 ? 23% |
| Idle Upper Side * | 26 | 23.3 10% | 33 -27% | 25 4% | 28.1 -8% | 28.2 ? -8% | 28.5 ? -10% |
| Idle Bottom * | 27 | 23.1 14% | 32.4 -20% | 25 7% | 27.7 -3% | 30.5 ? -13% | 29.3 ? -9% |
* ... smaller is better
Speakers
The stereo speakers are placed in the front area of the case bottom. While they produce a decent sound, it contains hardly any bass. For an improved sound experience, you have to use headphones or external speakers.
MSI Summit E15 A11SCST audio analysis
(±) | speaker loudness is average but good (80 dB)
Bass 100 - 315 Hz
(-) | nearly no bass - on average 23% lower than median
(±) | linearity of bass is average (12.1% delta to prev. frequency)
Mids 400 - 2000 Hz
(+) | balanced mids - only 3.3% away from median
(+) | mids are linear (5% delta to prev. frequency)
Highs 2 - 16 kHz
(+) | balanced highs - only 1.3% away from median
(+) | highs are linear (2.5% delta to prev. frequency)
Overall 100 - 16.000 Hz
(±) | linearity of overall sound is average (16.3% difference to median)
Compared to same class
» 34% of all tested devices in this class were better, 8% similar, 57% worse
» The best had a delta of 5%, average was 18%, worst was 45%
Compared to all devices tested
» 22% of all tested devices were better, 5% similar, 73% worse
» The best had a delta of 4%, average was 25%, worst was 134%
Power Management - The MSI Summit delivers a good battery life
Power Consumption
During idle operation, we measure a maximum power consumption of 16 watts, which turns out slightly too high. Under load, the consumption increases up to 90 watts (stress test) and 69 watts on average ("The Witcher 3" test). The USB Type-C charger is rated at 90 watts.
| Off / Standby | |
| Idle | |
| Load |
|
| MSI Summit E15 A11SCST i7-1185G7, GeForce GTX 1650 Ti Max-Q | Lenovo ThinkPad X1 Extreme Gen3-20TLS0UV00 i7-10750H, GeForce GTX 1650 Ti Max-Q | Dell XPS 15 9500 Core i7 4K UHD i7-10875H, GeForce GTX 1650 Ti Mobile | Apple MacBook Pro 16 2019 i9 5500M i9-9880H, Radeon Pro 5500M | Asus ZenBook UX535-M01440 i7-10750H, GeForce GTX 1650 Ti Max-Q | Average NVIDIA GeForce GTX 1650 Ti Max-Q | Average of class Multimedia | |
|---|---|---|---|---|---|---|---|
| Power Consumption | -7% | -29% | -10% | 1% | -13% | -12% | |
| Idle Minimum * | 6 | 5 17% | 5.7 5% | 3.7 38% | 4.4 27% | 7.23 ? -21% | 7.29 ? -22% |
| Idle Average * | 10 | 9 10% | 13.5 -35% | 12.1 -21% | 9.8 2% | 12.6 ? -26% | 11.8 ? -18% |
| Idle Maximum * | 16 | 12.2 24% | 19.6 -23% | 17 -6% | 14.5 9% | 16.3 ? -2% | 14.6 ? 9% |
| Load Average * | 84 | 94.4 -12% | 114.1 -36% | 91.5 -9% | 83 1% | 80.6 ? 4% | 77.7 ? 7% |
| Witcher 3 ultra * | 69 | 89 -29% | 93 -35% | 103 -49% | 67 3% | ||
| Load Maximum * | 90 | 133.9 -49% | 135.2 -50% | 102.3 -14% | 123 -37% | 107.7 ? -20% | 121 ? -34% |
* ... smaller is better
Battery Life
In our WLAN test (loading websites via a script) and video test (short movie Big Buck Bunny running in a loop; H.264 coding, FHD), the MSI laptop achieves a battery life of 9:03 h and 10:04 h respectively. The power-saving functions of the laptop are deactivated and the display brightness is reduced to about 150 cd/m². While running the video test, the communication modules are also turned off.

| MSI Summit E15 A11SCST i7-1185G7, GeForce GTX 1650 Ti Max-Q, 80.25 Wh | Lenovo ThinkPad X1 Extreme Gen3-20TLS0UV00 i7-10750H, GeForce GTX 1650 Ti Max-Q, 80 Wh | Dell XPS 15 9500 Core i7 4K UHD i7-10875H, GeForce GTX 1650 Ti Mobile, 86 Wh | Apple MacBook Pro 16 2019 i9 5500M i9-9880H, Radeon Pro 5500M, 99.8 Wh | Asus ZenBook UX535-M01440 i7-10750H, GeForce GTX 1650 Ti Max-Q, 96 Wh | Average of class Multimedia | |
|---|---|---|---|---|---|---|
| Battery Runtime | 9% | 10% | -6% | 8% | -2% | |
| Reader / Idle | 1168 | 1382 18% | 1097 -6% | 933 ? -20% | ||
| H.264 | 604 | 731 21% | 580 -4% | 714 18% | 710 ? 18% | |
| WiFi v1.3 | 543 | 693 28% | 546 1% | 718 32% | 608 12% | 572 ? 5% |
| Load | 108 | 83 -23% | 121 12% | 58 -46% | 117 8% | 97.7 ? -10% |
| Witcher 3 ultra | 54 | 81.8 ? |
Pros
Cons
Verdict
With the Summit E15, MSI offers a 15.6-inch business notebook whose hardware is housed in an elegant, slim, black metal case. A Core i7-1185G7 processor, GeForce GTX 1650 Ti-Max-Q GPU, 16 GB of working memory (dual-channel mode; max. 64 GB), and 1-TB NVMe SSD prepare the laptop for the usual usage scenarios. A positive point: there is space for a second NVMe SSD.
With the Summit E15, MSI delivers a 15.6-inch business notebook with the most current technologies. However, it still does not come close to the established competitors such as the Dell XPS 15 and the Lenovo ThinkPad X1 Extreme.
The built-in 80-Wh battery ensures a battery life of 9 to 10 h in practice. The laptop is recharged via a USB-C charger that can be connected to either of the USB Type-C ports (USB 4.0/Thunderbolt 4), so you can also connect an external GPU or docking station while the charger is plugged in.
While the touchscreen (FHD, IPS) offers stable viewing angles, a decent color reproduction, good contrast, and decent color space coverage, the maximum brightness turns out too low. Overall, the display of a 2000-Euro (~$2427) laptop should offer more. In addition, a reflective touchscreen is out of place in a business notebook, since it has a negative effect on the ergonomics. The illuminated keyboard turned out to be suitable for everyday tasks.
MSI still seems to have to work on the cooling system and power consumption. Although there is "only" a ULV processor in the E15, the laptop gets significantly warmer than the competitors that are equipped with 45-Watt CPUs. In addition, MSI gets less battery life from the 80-Wh battery than Lenovo gets from the 80-Wh battery of the ThinkPad X1 Extreme - even though that has a more power-hungry processor onboard.
Price and Availability
The MSI Summit E15 (Core i7-1185G7, GeForce GTX 1650 Ti Max-Q, 16 GB of RAM, 1 TB SSD) is currently available for about $1900 at Amazon.com, at BestBuy.com, and at newegg.com.
MSI Summit E15 A11SCST
-
01/27/2021 v7
Sascha Mölck


Pricecompare

