 Deutsch
 English
 Español
 Français
 Italiano
 Nederlands
 Polski
 Português
 Русский
 Türkçe
 Svenska
 Chinese
 Magyar
Asus ZenBook Pro 15 UX535 laptop review: It could still be a little more Zen
The ZenBook Pro series is Asus's high-end subnotebook series. The Asus ZenBook Pro 15 UX580GE, which is already two years old, is the direct predecessor with a ScreenPad. The Pro Duo models that feature an even larger second display were released a year ago. Asus is now taking a step back again in terms of the ScreenPad size; otherwise, there's a new CPU-GPU combination. Since there's a lack of competition with the same unique selling point (ScreenPad), we make do with the multimedia laptops listed below, which otherwise have a similar hardware configuration. Apart from that, we also include the ZenBook 15 UX534 sibling model in our comparison.
Possible competitors in comparison
Rating | Date | Model | Weight | Height | Size | Resolution | Best Price |
|---|---|---|---|---|---|---|---|
| 87 % | 12/2020 | Asus ZenBook UX535-M01440 i7-10750H, GeForce GTX 1650 Ti Max-Q | 2 kg | 20 mm | 15.60" | 3840x2160 | |
| 85.2 % | 03/2020 | Asus ZenBook 15 UX534FTC-A8190T i7-10510U, GeForce GTX 1650 Max-Q | 1.6 kg | 18.9 mm | 15.60" | 1920x1080 | |
| 90.1 % | 06/2020 | Dell XPS 15 9500 Core i7 4K UHD i7-10875H, GeForce GTX 1650 Ti Mobile | 2 kg | 18 mm | 15.60" | 3840x2400 | |
| 87.1 % | 02/2020 | Lenovo ThinkPad X1 Extreme 2019 20QV000WGE i7-9750H, GeForce GTX 1650 Mobile | 1.7 kg | 18.7 mm | 15.60" | 3840x2160 | |
| 79.8 % | 06/2020 | Acer Nitro 5 AN515-44-R5FT R5 4600H, GeForce GTX 1650 Ti Mobile | 2.2 kg | 24 mm | 15.60" | 1920x1080 | |
| 87.8 % | 06/2018 | Asus ZenBook Pro 15 UX580GE i9-8950HK, GeForce GTX 1050 Ti Mobile | 1.9 kg | 18.9 mm | 15.60" | 3840x2160 |
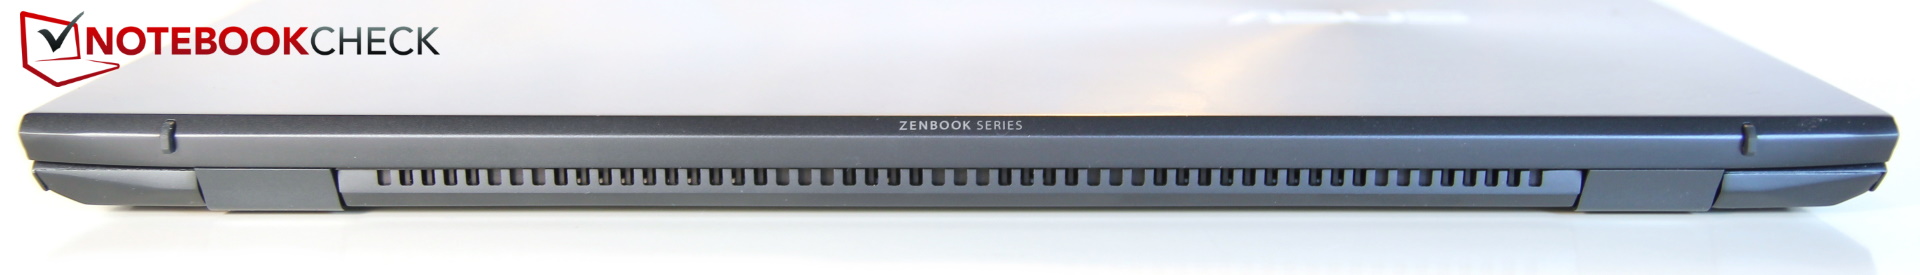
Case - Revised aluminum unibody
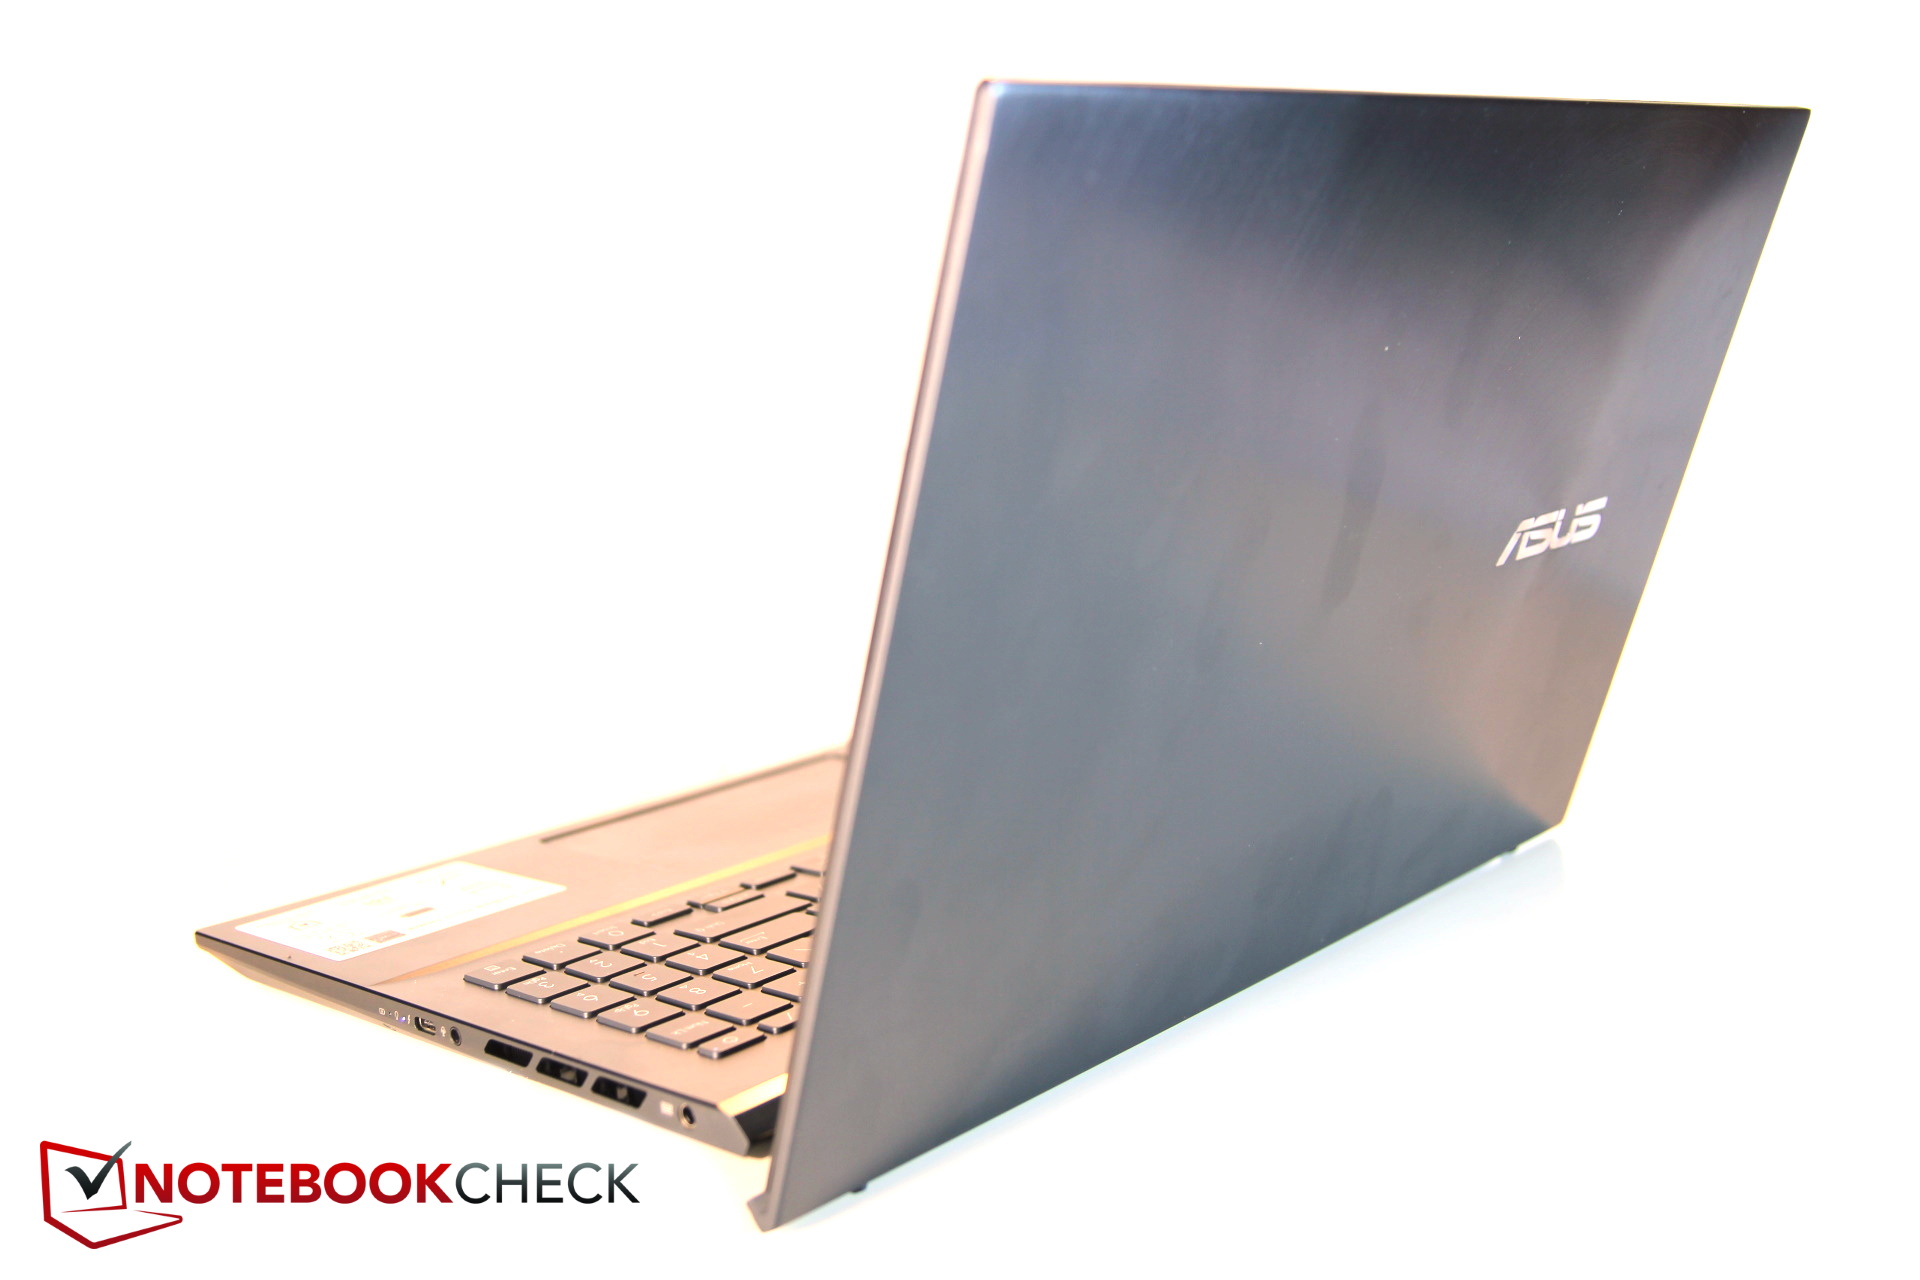
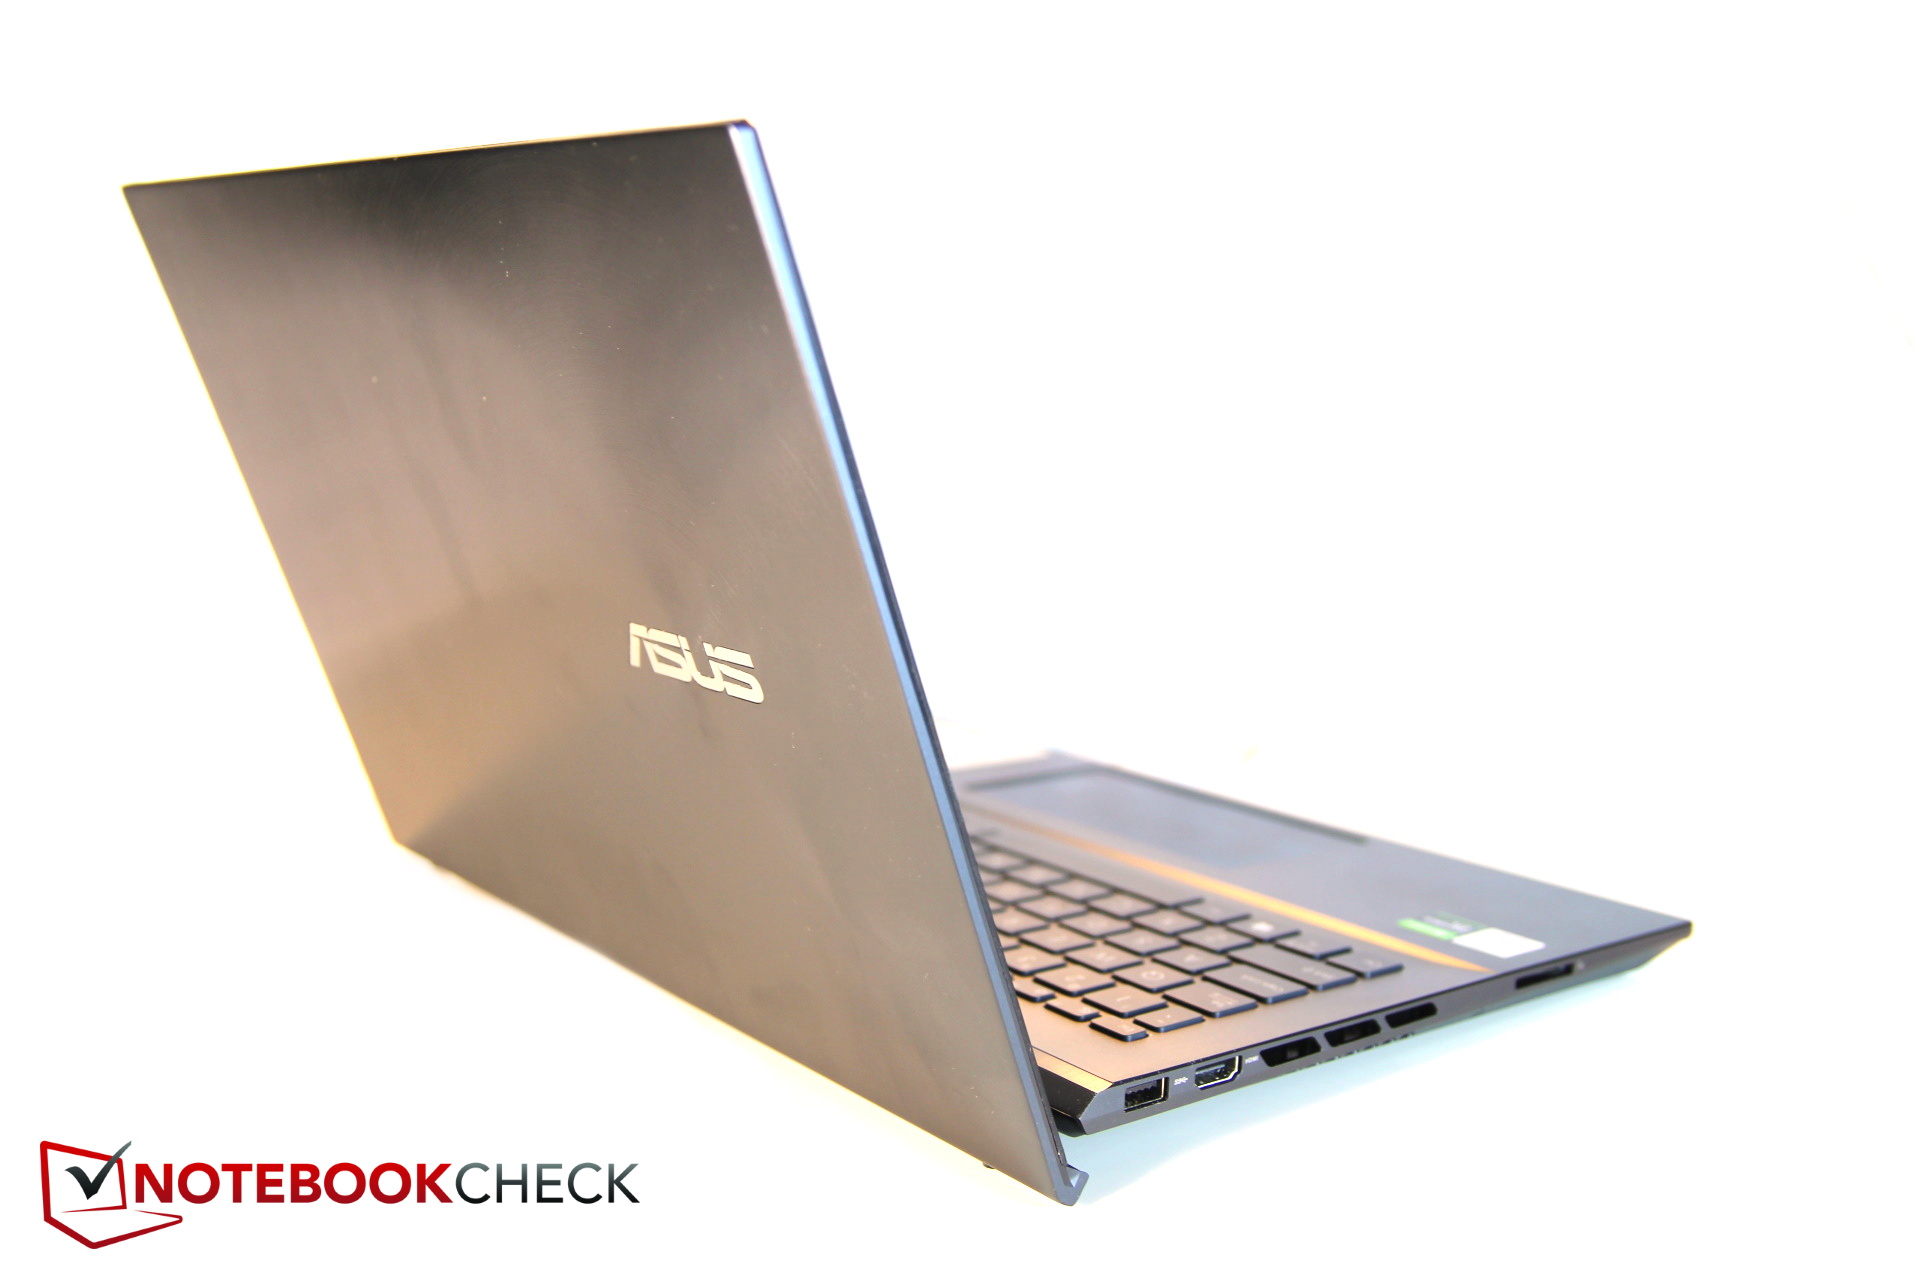
The dark case of the UX535 is made almost entirely of metal and has been completely redesigned. It's similar to that of its sibling model, but it has more ventilation slots and other connections. The display's frame also manages to completely do without plastic, and the NanoEdge panel is made entirely of glass and is set directly into the aluminum frame. The base and display lid are, therefore, very stable and resistant to torsion. Bending the base requires a lot of effort, and this only leads to minimal crackling and creaking noises. Workmanship is generally at a high level; we didn't find any noticeable gaps.

The design pleases with its noble simplicity. With its sandblasted round structures, the dark aluminum surface almost looks like a classy record. The delicate, sand-colored "ZenBook Series" lettering in the center of the hinge is also nice. An asymmetrically placed silver ASUS logo decorates the top. However, fingerprints and grease stains remain clearly visible on the surface.
On the inside, the palm rests are slightly higher than the keyboard, which has a kind of bevel at its lower edge, making it more deeply embedded.


The ZenBook isn't really light due to its stable metal case; the ThinkPad X1 Extreme or even its own sibling model are much lighter. However, the rest of the competition is similarly heavy. In contrast to its predecessor, the 15-inch laptop has shrunk a bit.
Except for the sibling model as well as the Dell XPS 15, all competitors are a bit larger, so the UX535 places itself in the middle.
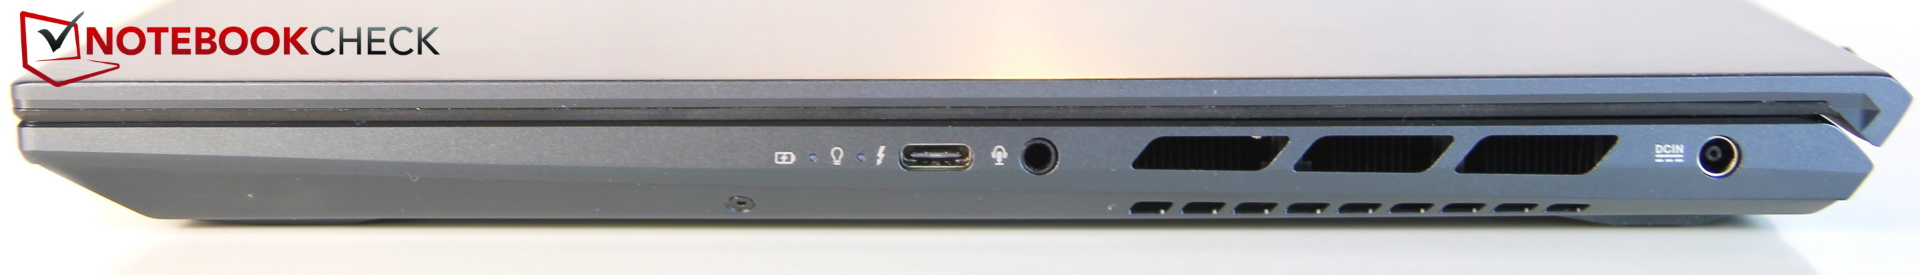
Connectivity - Stingy ZenBook subnotebook
The ZenBook is sparsely equipped for a 15-inch device. It only provides two USB ports, one of them Type-C with Thunderbolt 3 and charging function. We find this to be clearly too little! At least there's a full-fledged SD reader. A LAN port is absent once again. In spite of the few ports, they are still positioned quite close together; especially the HDMI and the USB-A port are very close to each other.
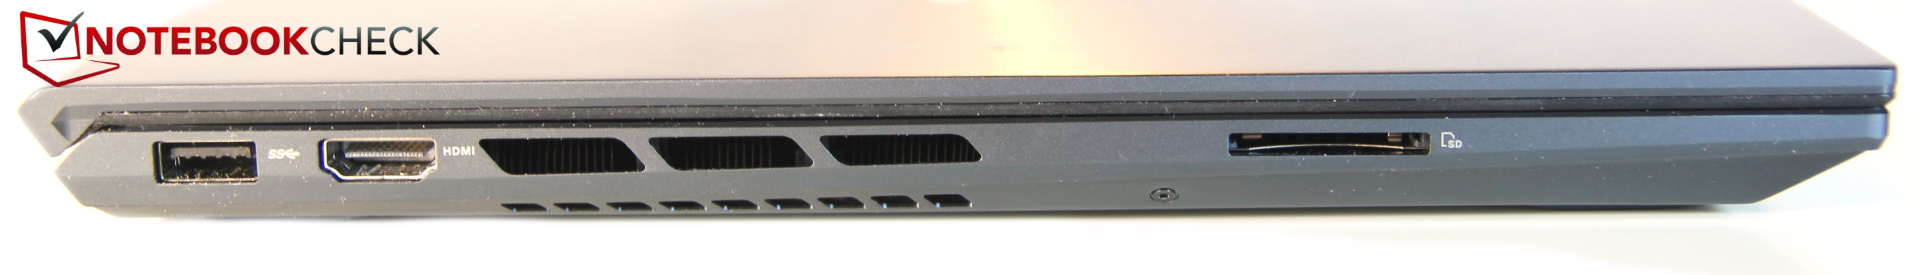
SD card reader
The performance of the card reader corresponds to the class average but nothing more. In combination with our 64 GB Toshiba Exceria Pro UHS-II SDXC, the competition is sometimes much faster.
| SD Card Reader | |
| average JPG Copy Test (av. of 3 runs) | |
| Dell XPS 15 9500 Core i7 4K UHD (Toshiba Exceria Pro SDXC 64 GB UHS-II) | |
| Lenovo ThinkPad X1 Extreme 2019 20QV000WGE (Toshiba Exceria Pro SDXC 64 GB UHS-II) | |
| Average of class Multimedia (17.6 - 205, n=65, last 2 years) | |
| Asus ZenBook UX535-M01440 (Toshiba Exceria Pro M501 microSDXC 64GB) | |
| Asus ZenBook Pro 15 UX580GE (Toshiba Exceria Pro M501 UHS-II) | |
| maximum AS SSD Seq Read Test (1GB) | |
| Lenovo ThinkPad X1 Extreme 2019 20QV000WGE (Toshiba Exceria Pro SDXC 64 GB UHS-II) | |
| Dell XPS 15 9500 Core i7 4K UHD (Toshiba Exceria Pro SDXC 64 GB UHS-II) | |
| Average of class Multimedia (16.8 - 266, n=61, last 2 years) | |
| Asus ZenBook UX535-M01440 (Toshiba Exceria Pro M501 microSDXC 64GB) | |
Communication
A connection for a LAN cable isn't available, so you have to resort to WLAN if you don't have an adapter. While the transmission performance is very good, the reception performance is a bit below the expectations of the AX201 module. Nevertheless, the values are significantly better than the multimedia class average.
Webcam
You can use the infrared webcam to log in via Windows Hello, but the images provided by the 720p camera are still only average.


Security
Besides the aforementioned infrared camera for logging in via Windows Hello, TPM 2.0 is also on board; otherwise, there is neither a fingerprint scanner nor a Kensington slot or any other security features.
Accessories
Asus doesn't include any accessories; at least a USB LAN adapter would have been welcome.
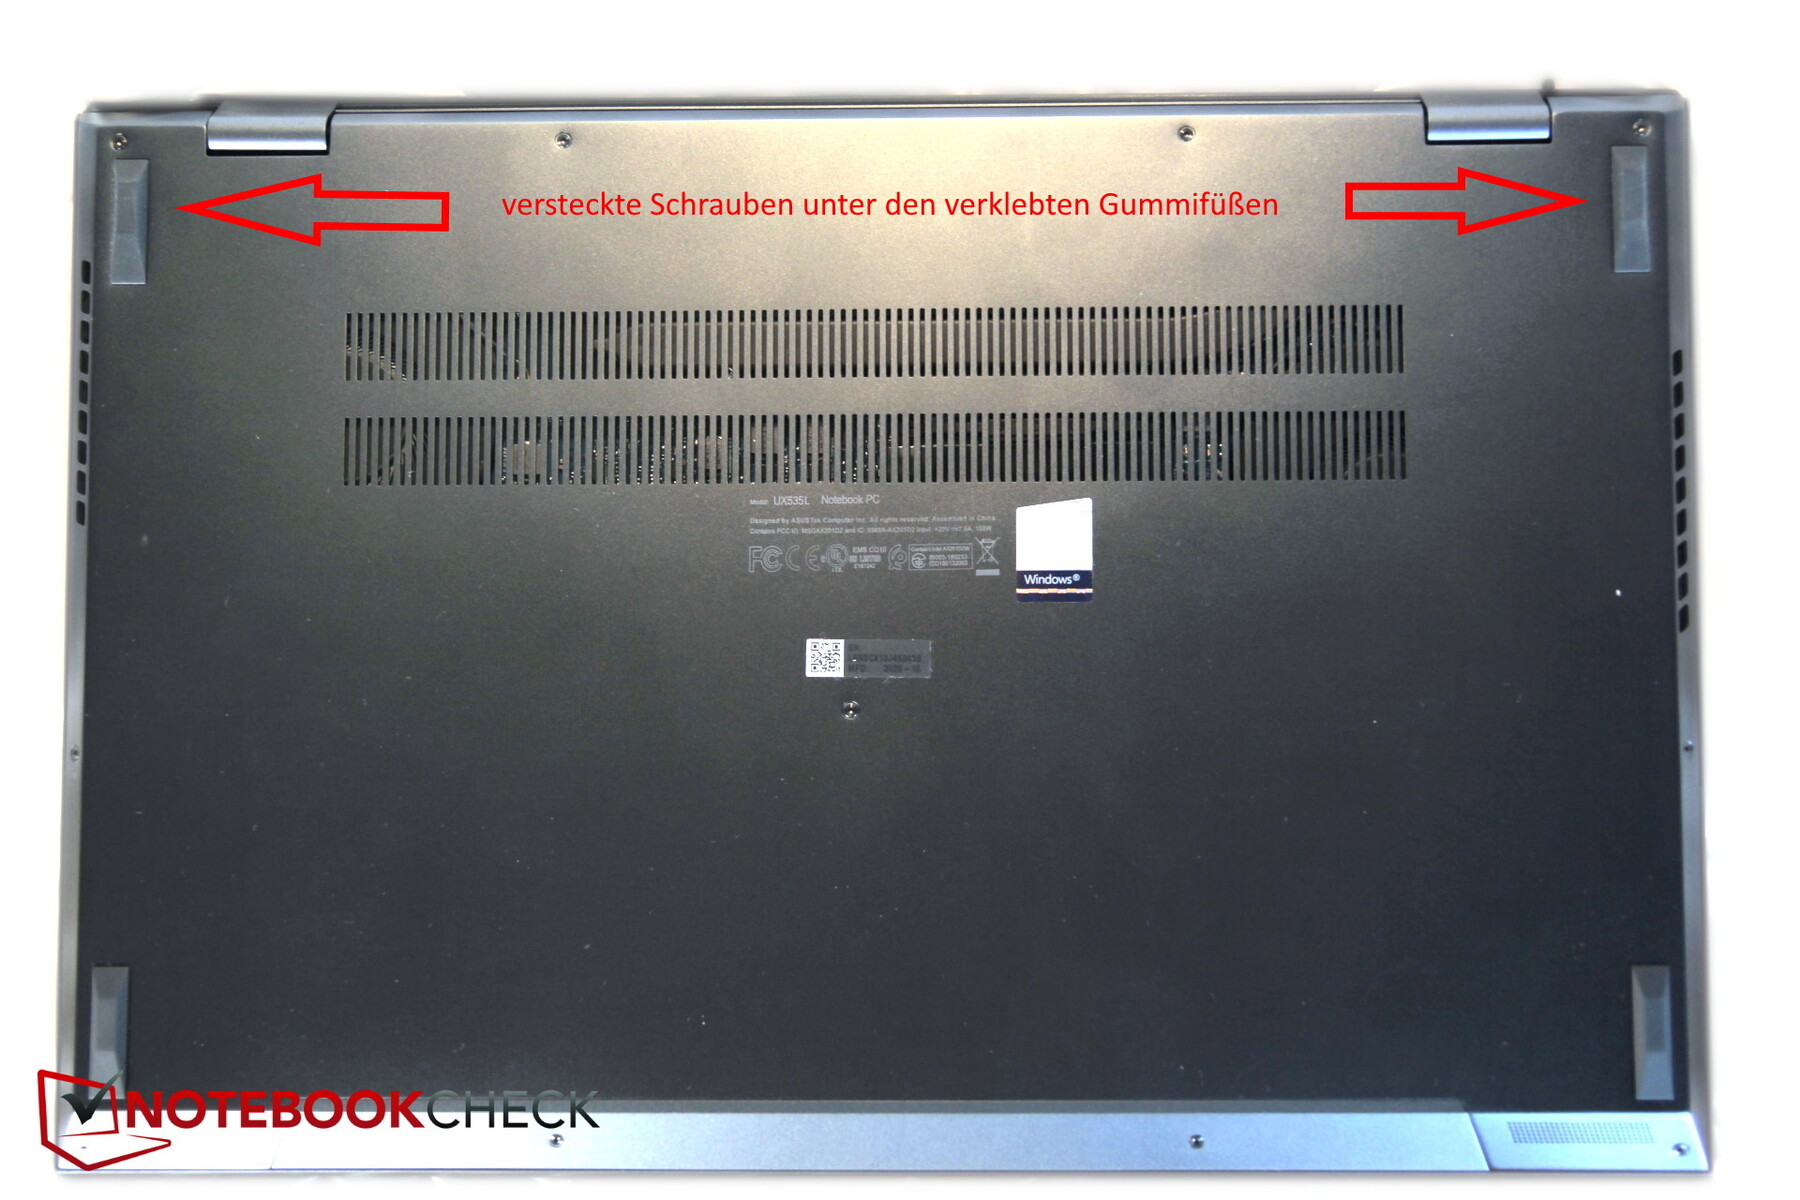
Maintenance
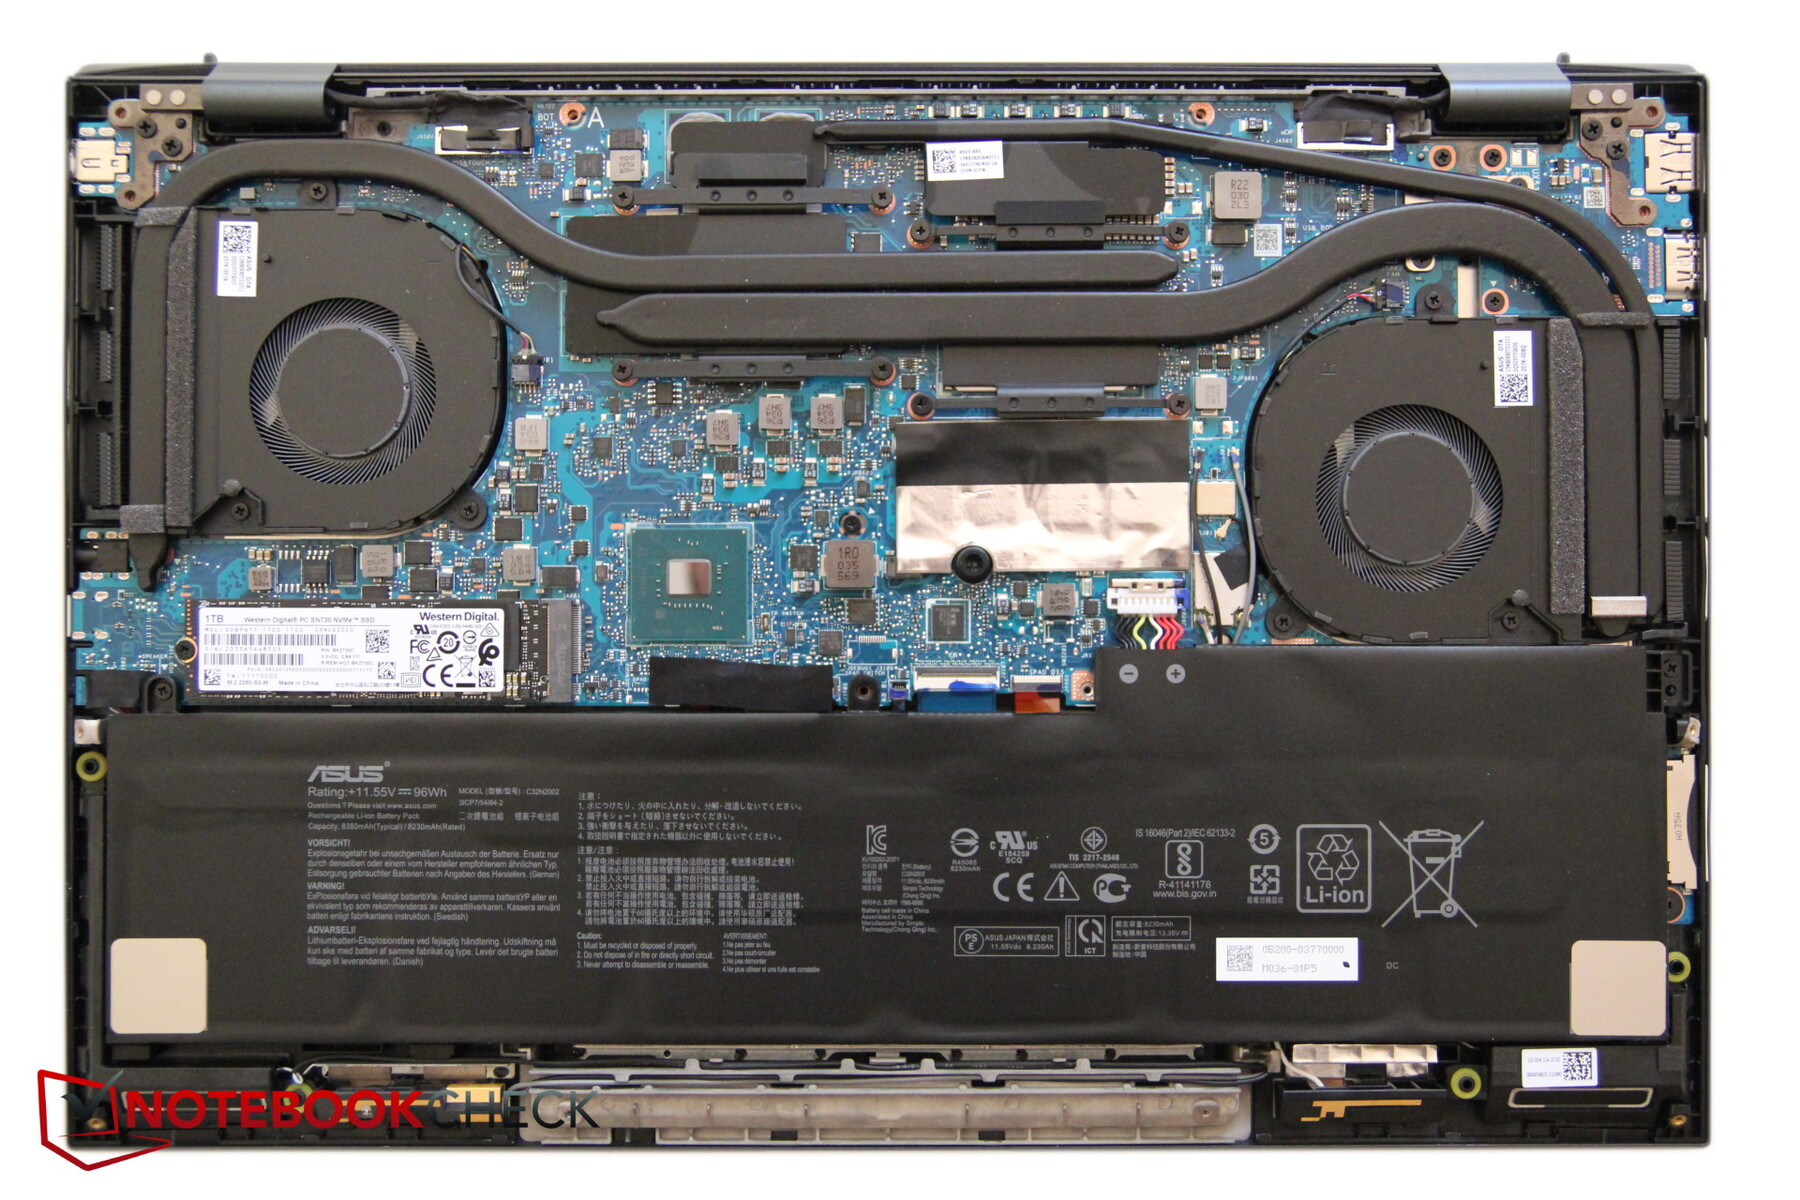
There's no maintenance hatch, and the removable bottom cover is secured by 11 Torx screws. These have three different lengths, so you should take note of which screw belongs to which position. Unfortunately, Asus still hides two screws under the rear rubber feet, the latter are glued to the chassis, making it unnecessarily difficult for the customer to open the ZenBook. The hidden screws also have a different profile. If you dare, you will then have access to the battery, the fan and the SSD.


Warranty
Asus grants a 24-month warranty.
Input devices - Display integrated into the touchpad
Keyboard

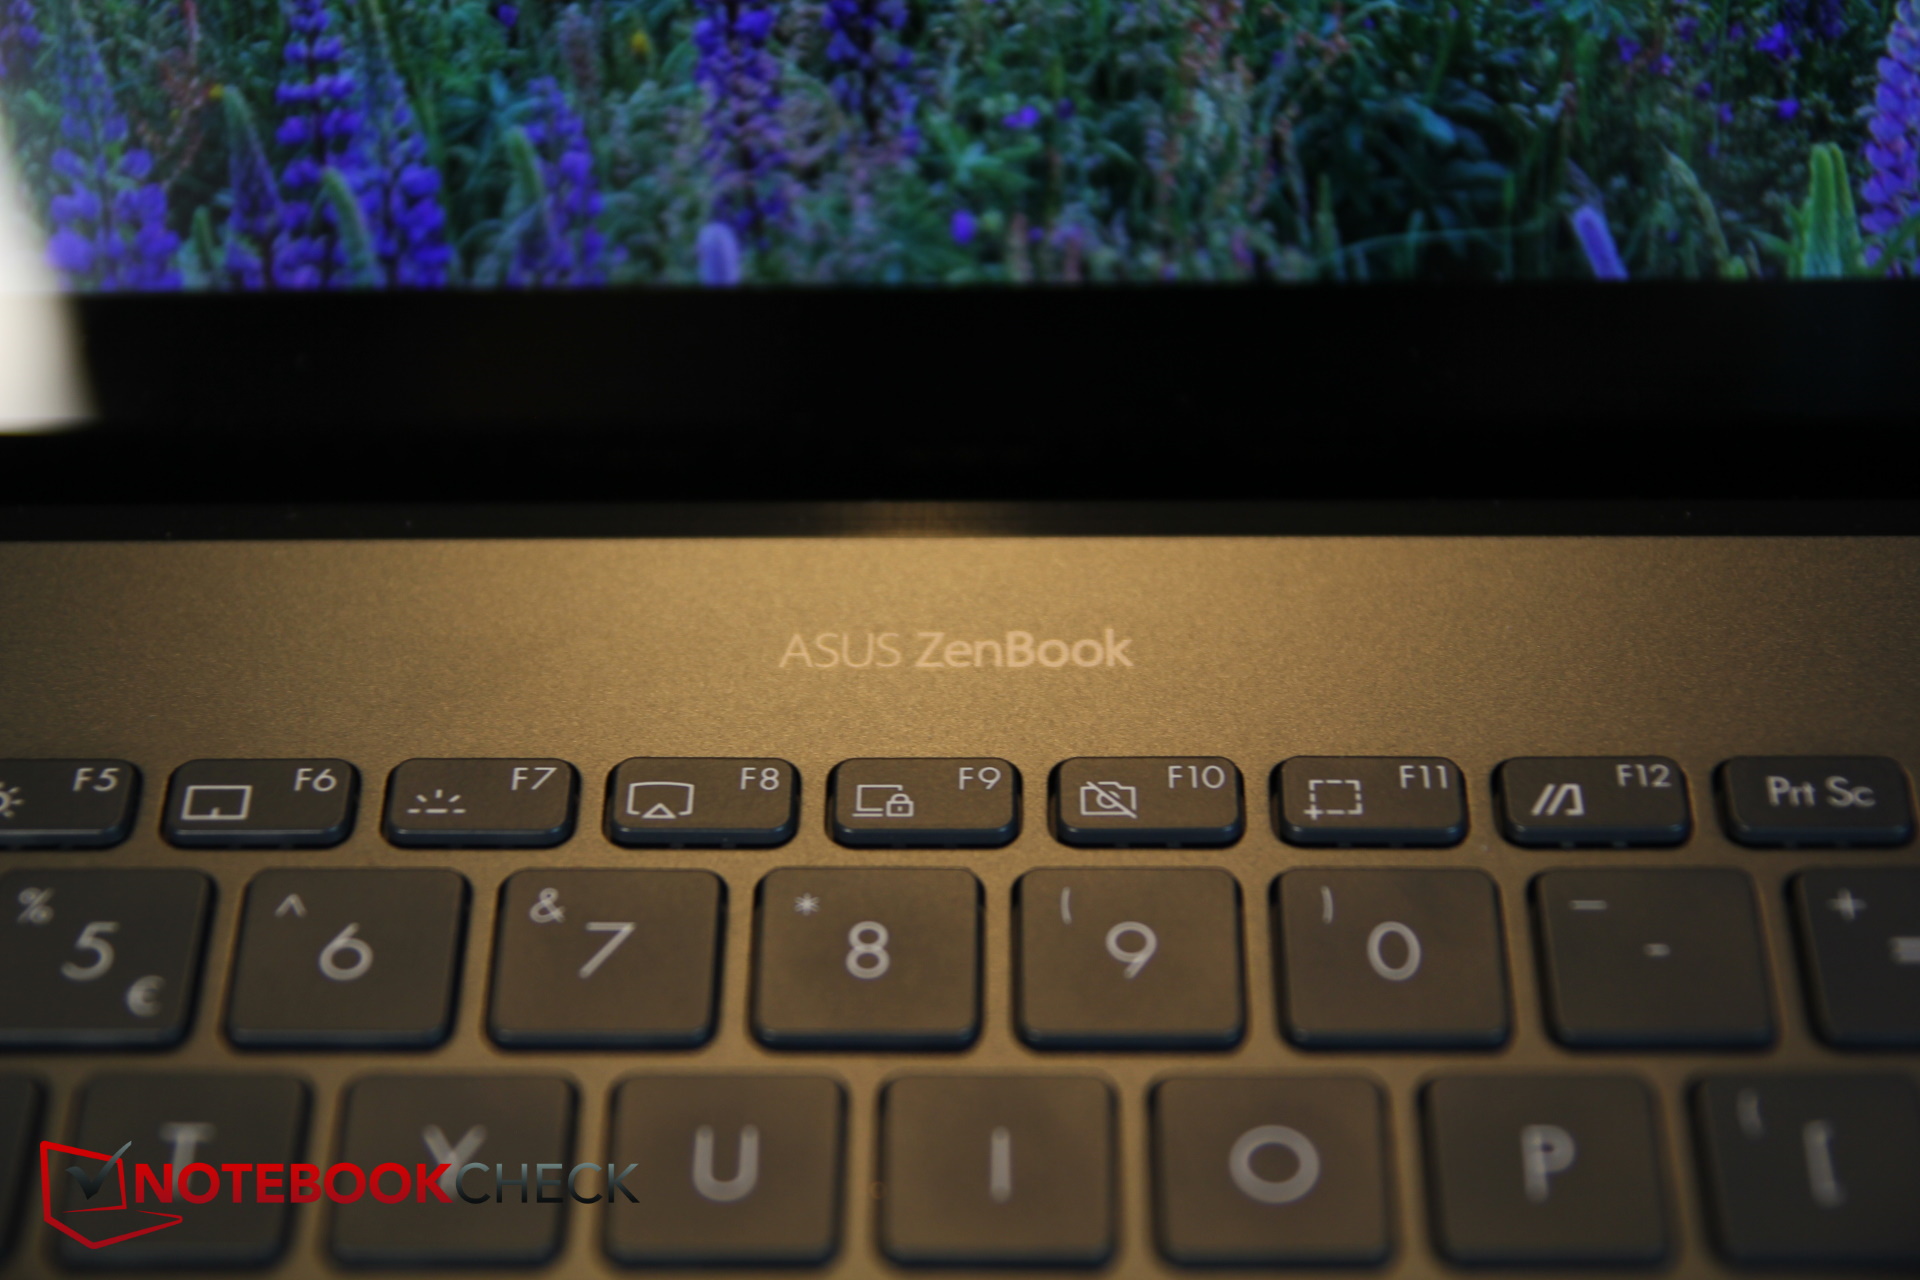
The so-called ErgoLift hinge lifts the keyboard towards the display, which is supposed to provide a more ergonomic typing experience, but this also leads to potential scratches on the table. The keyboard's layout looks very tidy; the labels are clear, and the three-stage backlighting is helpful in the dark. The keys' surfaces feel a bit roughened, which initially takes some getting used to, since fingers don't glide away quite as smoothly on them.
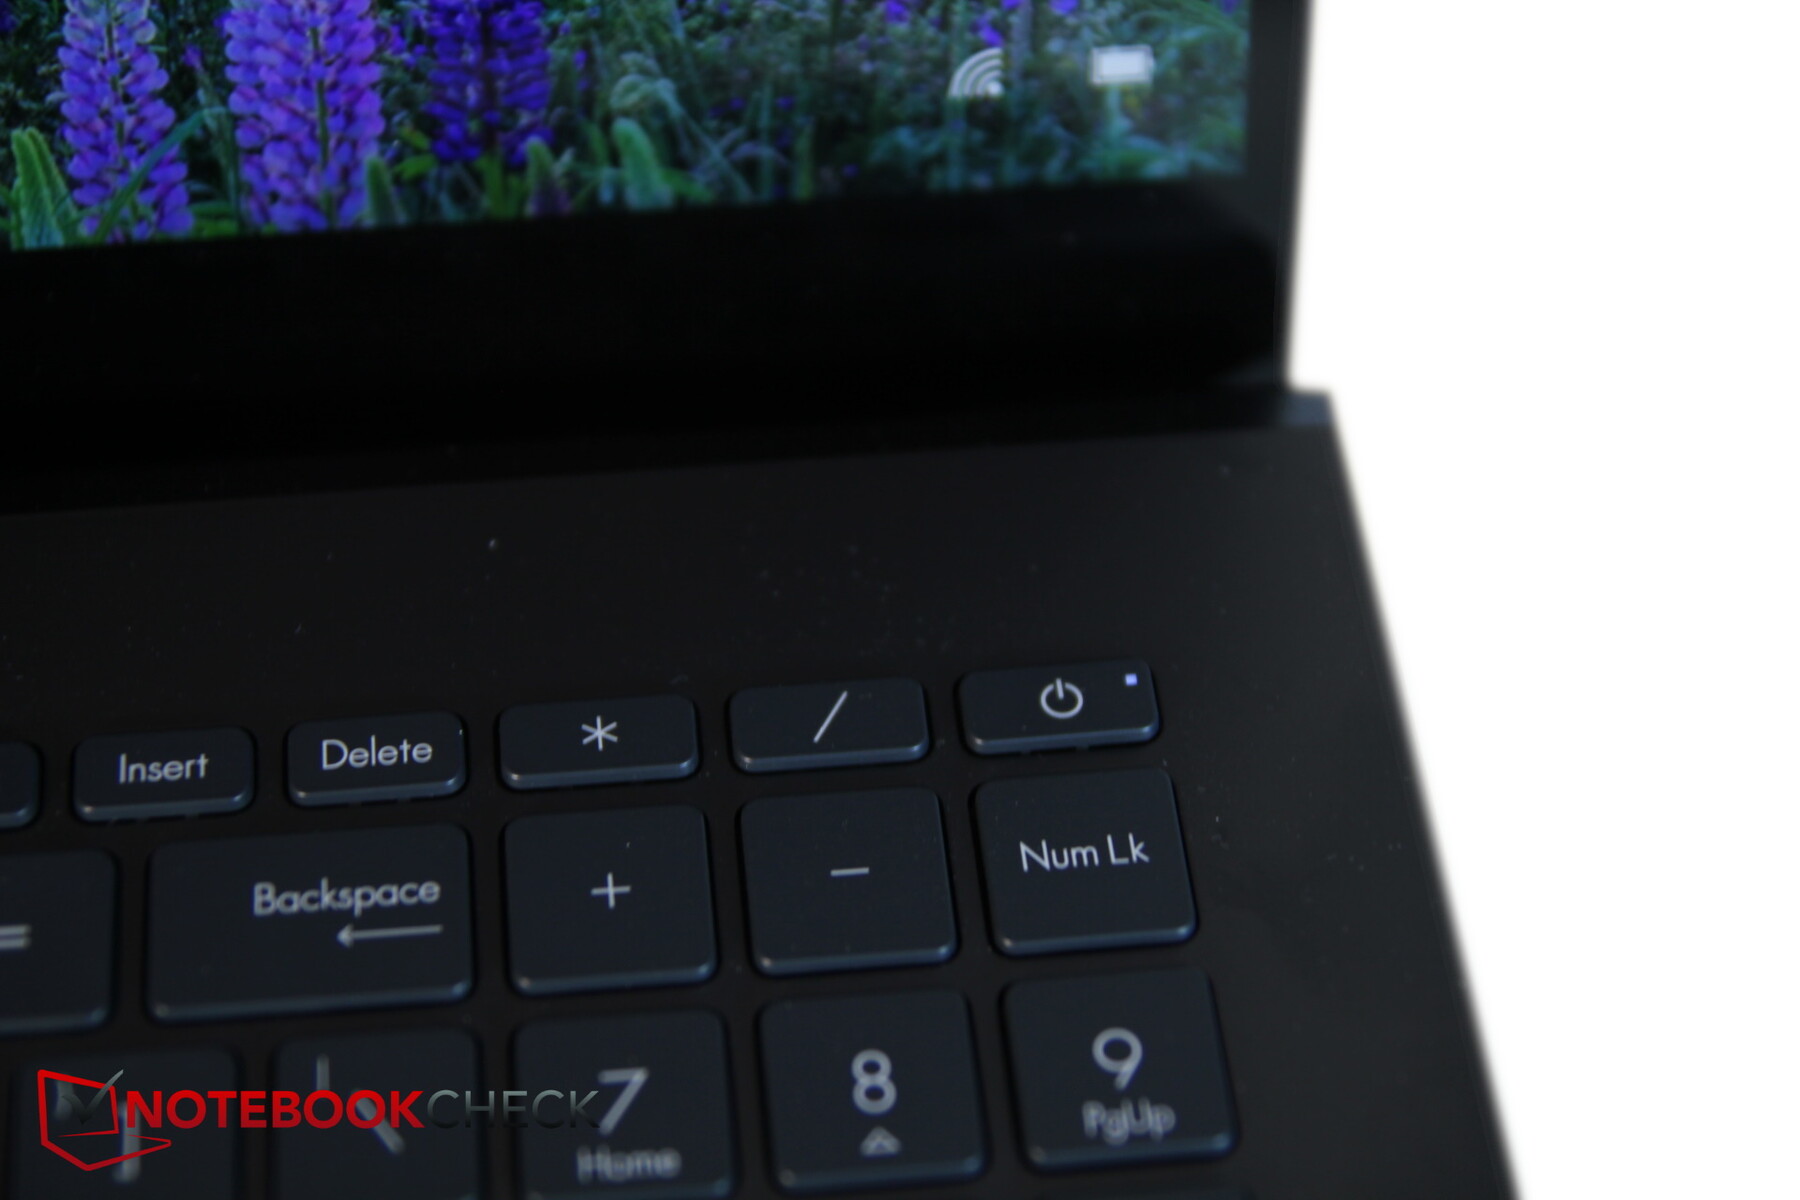
The arrow keys are half the usual height. The power button is integrated as a key in the upper right corner, but mistakes rarely occur because important functions like home, end, etc., are not located nearby as usual but on the arrow keys instead.
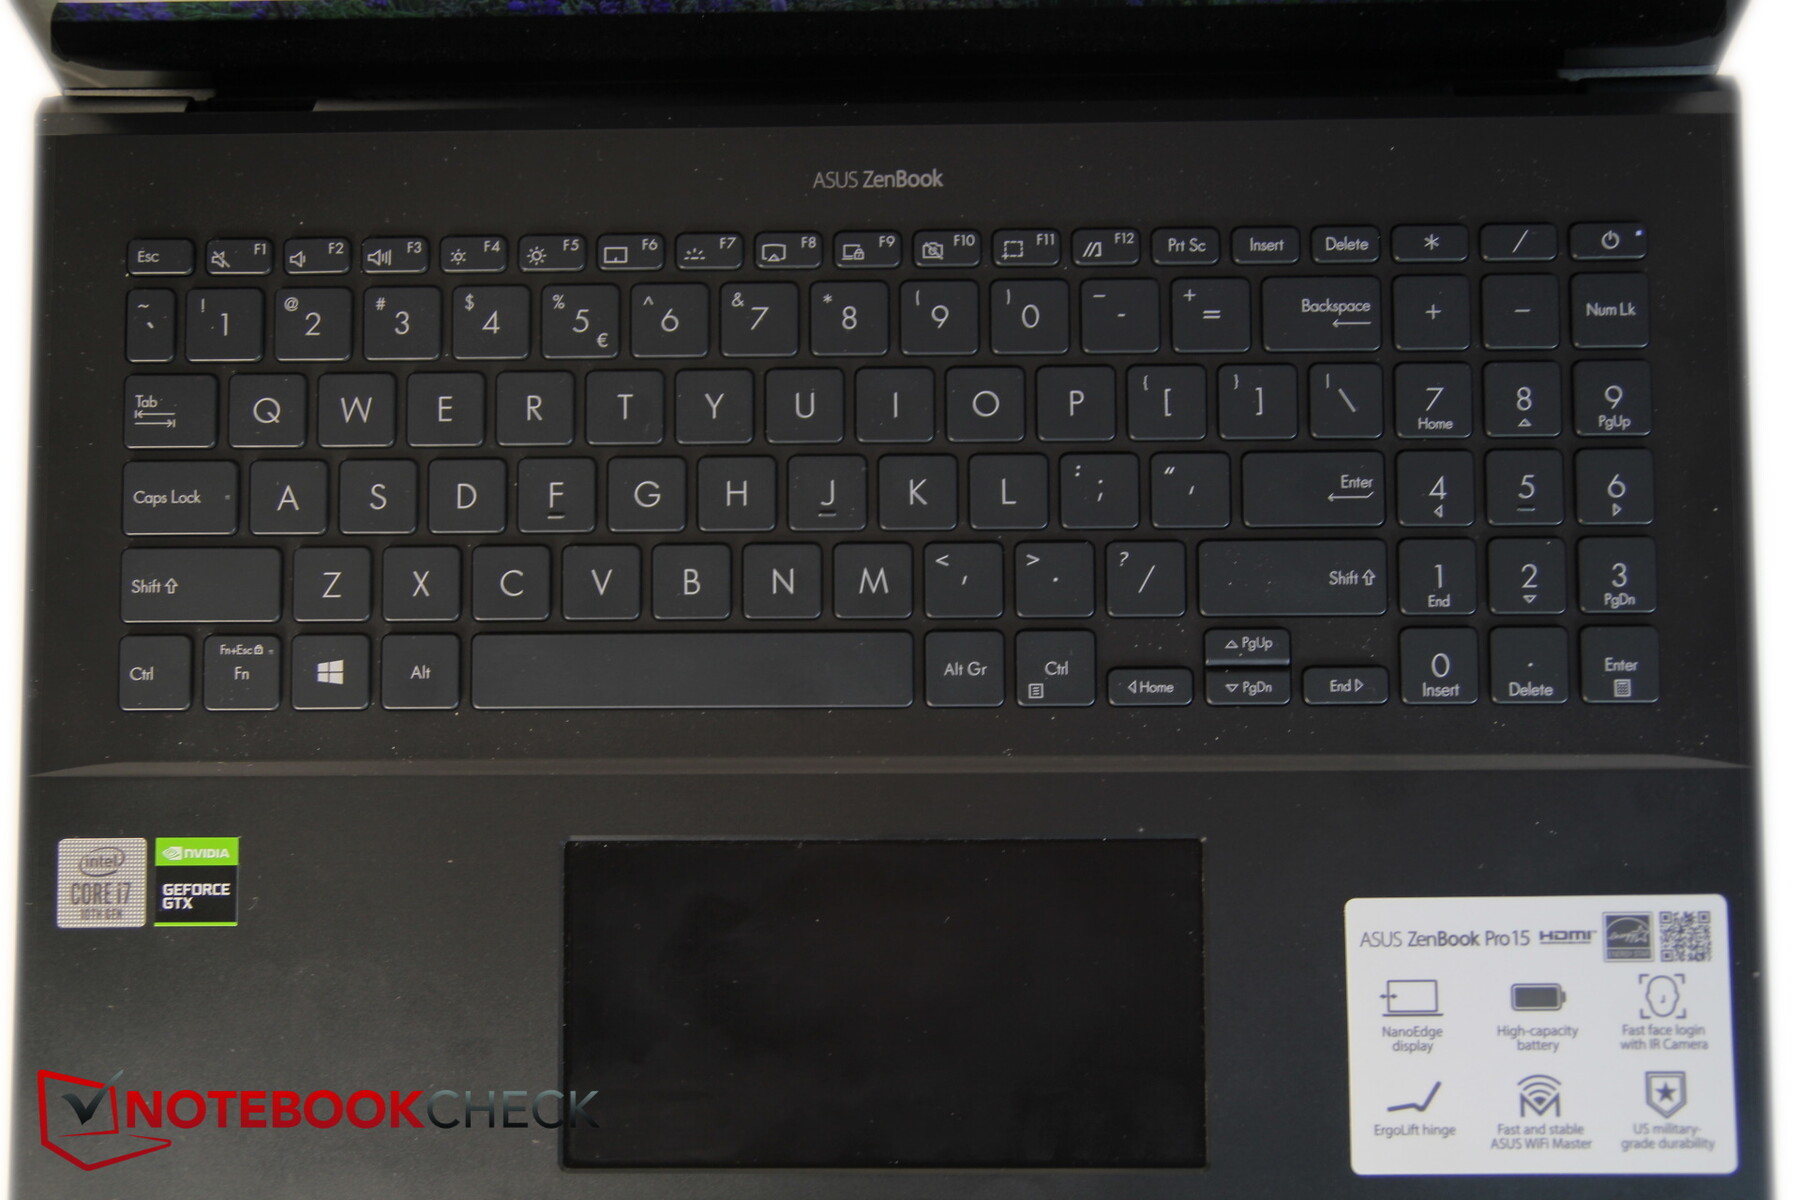

The keys themselves have a medium travel and emit a clear feedback, so that typing is easy on the whole. The typing volume is okay, but there are definitely quieter models.
Touchpad
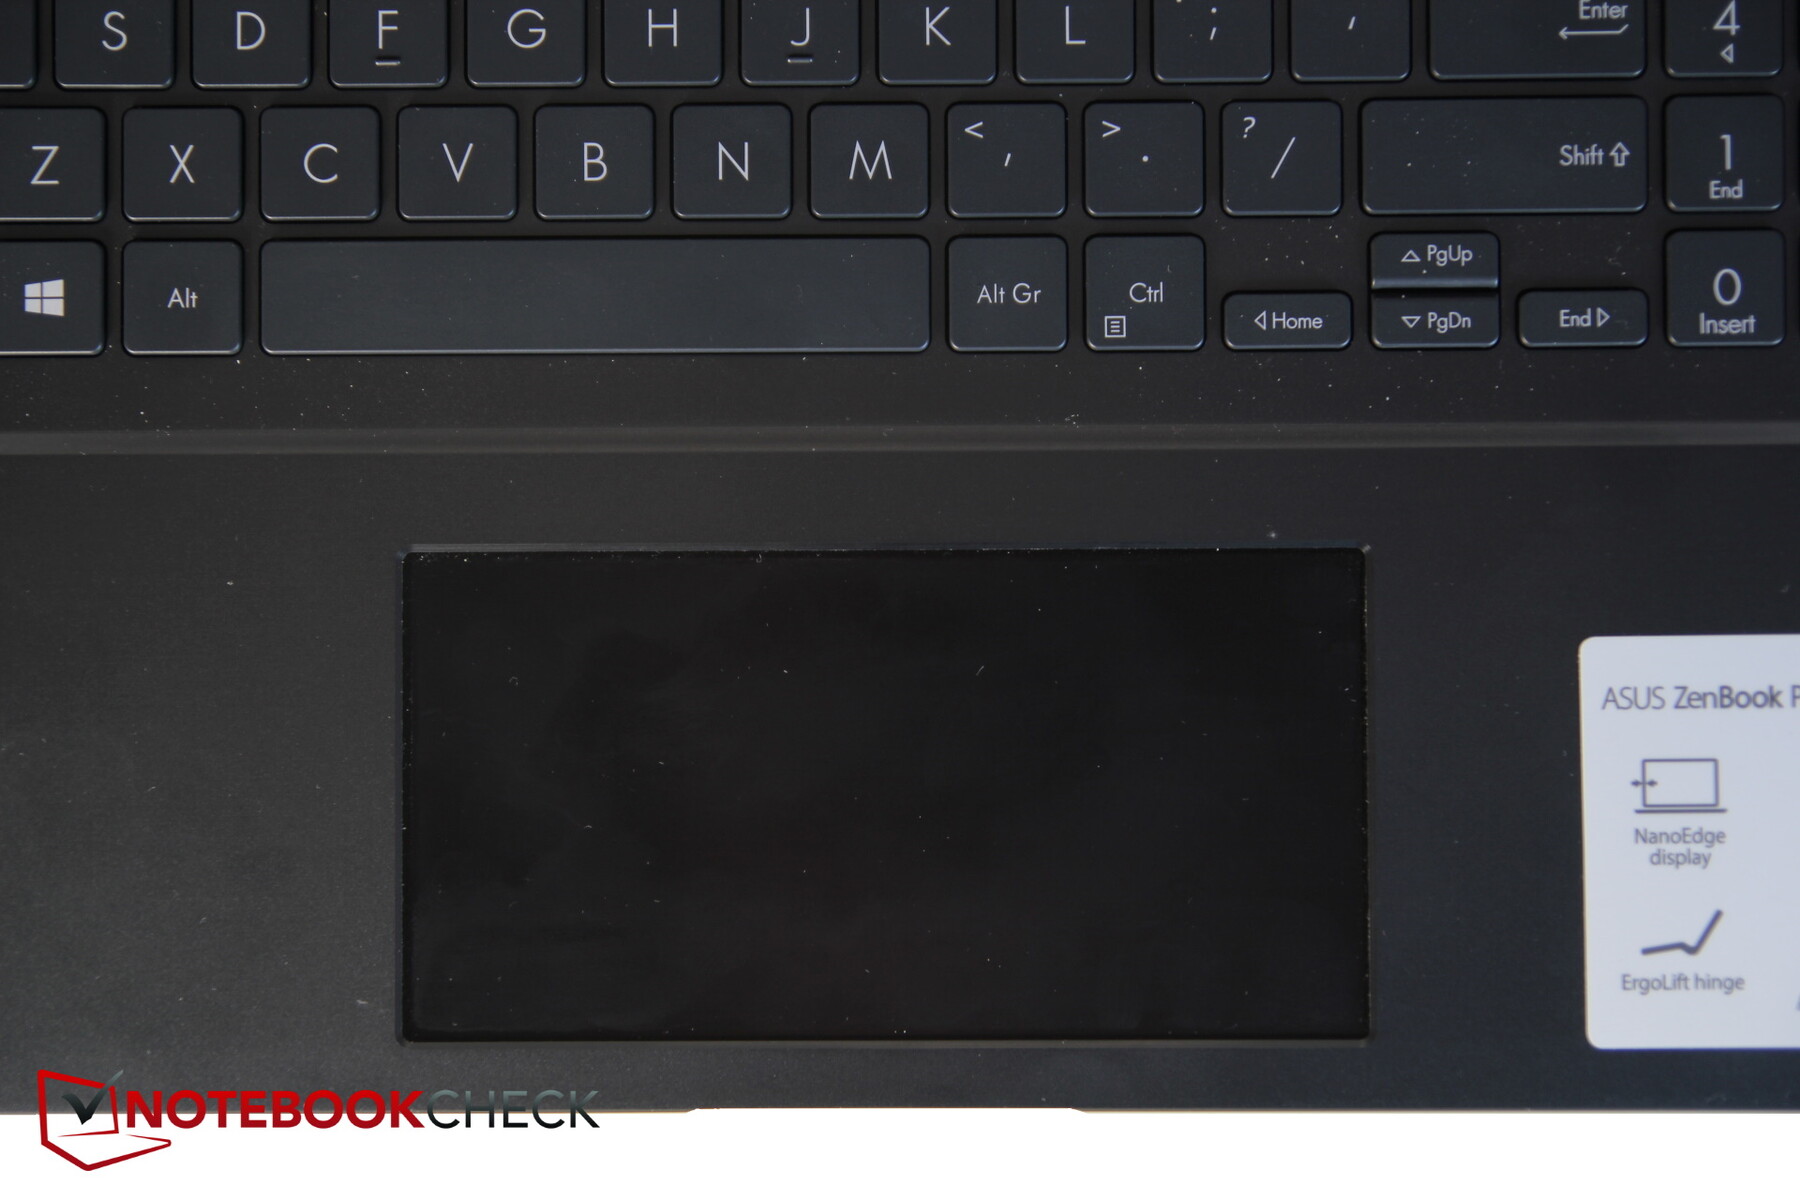
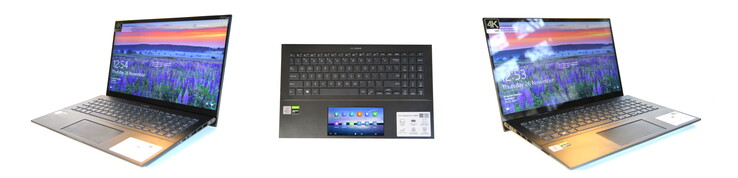
The touchpad is also a second display with useful and configurable functions as well. The pad itself is very wide (approx. 13 x 6.5 cm) and has a glass surface with very good gliding properties. Fingers glide smoothly even when they're moved very slowly. The integrated mouse buttons are triggered reliably.
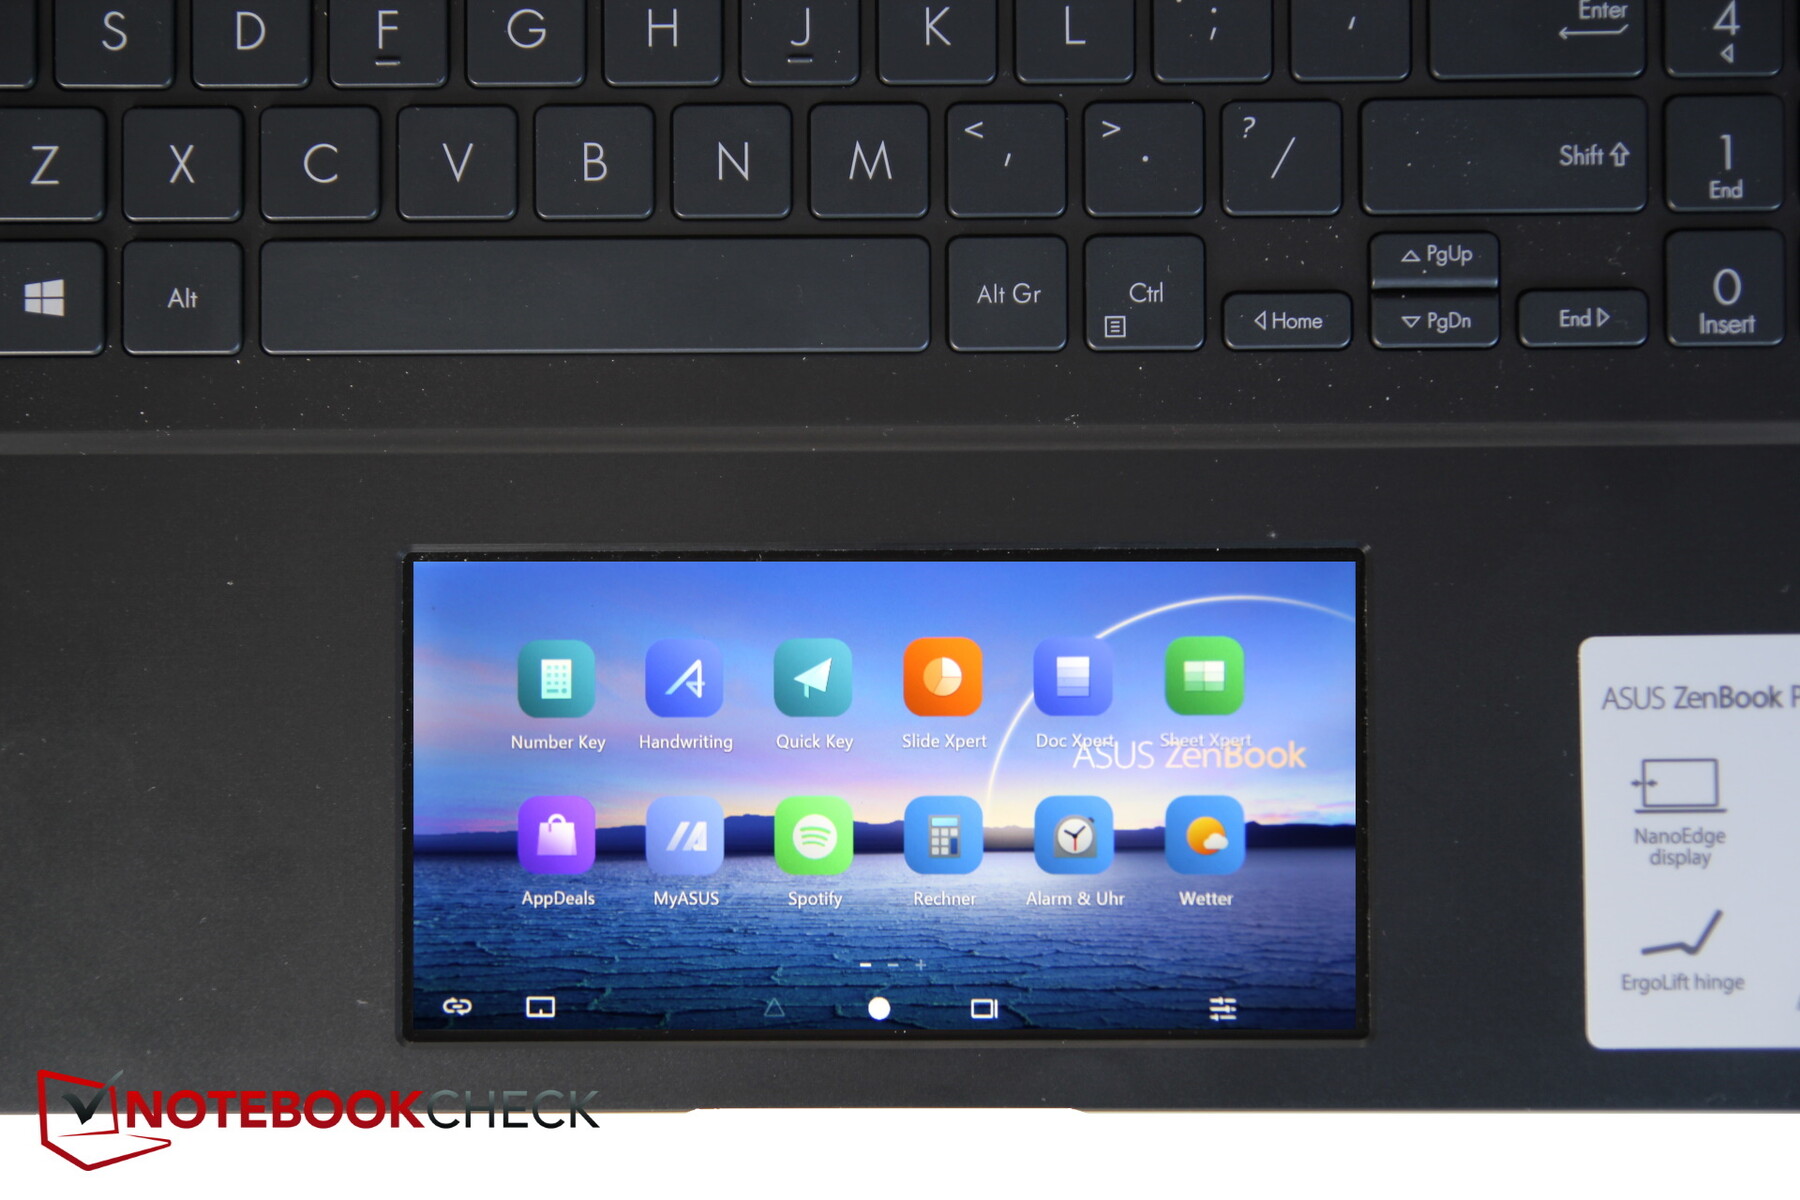
If you don't know any better, you might think that the gliding zone is a normal touchpad, because the background remains dark as usual when the touchpad is deactivated. But you can turn the display on with F6 and benefit from a second display as a result. However, this causes the touchpad function to be lost. So you should also have a mouse at hand, and the touchpad can still be shown in display mode.
The display is still quite grainy and not uniformly bright due to the matte surface. But unlike its predecessor, the interface has now been revised. You don't have to move a cursor anymore, and the display can be operated like a completely normal touchscreen.
The display contains shortcuts to start the most frequently used apps, but you can also drag apps completely into the ScreenPad, making it an extended display for the main screen. Asus also works together with third-party manufacturers so that their software can offer special functions in combination with the ScreenPad. Consequently, users benefit from additional control options via the ScreenPad when using some video and audio editors. All in all, we find the pad to be very successful and would like to see this function integrated by more manufacturers so that more developers can adapt their software to it as well.

Touchscreen
The ZenBook Pro is full of handling possibilities, because the display can also be controlled using touch gestures. Typing on the screen is very precise and proved to be easy in the test.
Display - 4K with touch


The display comes from BOE. It's an IPS touchscreen panel with 4K resolution. The average brightness is quite good at 375 nits, but its distribution isn't excessively even at 84%. The center of the screen is much brighter than the edges at over 400 nits.
The pixel grid is clear, and screen bleeding is so minimal that it actually isn't noticeable even in dark settings.
| |||||||||||||||||||||||||
Brightness Distribution: 84 %
Center on Battery: 397 cd/m²
Contrast: 1149:1 (Black: 0.35 cd/m²)
ΔE Color 2.47 | 0.5-29.43 Ø5, calibrated: 2.36
ΔE Greyscale 2.26 | 0.57-98 Ø5.3
99% AdobeRGB 1998 (Argyll 1.6.3 3D)
70.1% AdobeRGB 1998 (Argyll 2.2.0 3D)
99.5% sRGB (Argyll 2.2.0 3D)
68.8% Display P3 (Argyll 2.2.0 3D)
Gamma: 2.49
| Asus ZenBook UX535-M01440 BOE0866, IPS, 3840x2160, 15.60 | Asus ZenBook 15 UX534FTC-A8190T BOE CQ NV156FHM-N63, IPS, 1920x1080, 15.60 | Dell XPS 15 9500 Core i7 4K UHD Sharp LQ156R1, IPS, 3840x2400, 15.60 | Lenovo ThinkPad X1 Extreme 2019 20QV000WGE NE156QUM-N66, IPS, 3840x2160, 15.60 | Acer Nitro 5 AN515-44-R5FT Panda LM156LF-2F01 (NCP004D), IPS, 1920x1080, 15.60 | Asus ZenBook Pro 15 UX580GE AU Optronics B156ZAN03.1, IPS, 3840x2160, 15.60 | |
|---|---|---|---|---|---|---|
| Display | -10% | 24% | 19% | -39% | 22% | |
| Display P3 Coverage | 68.8 | 65 -6% | 89.7 30% | 82 19% | 41.16 -40% | 85.9 25% |
| sRGB Coverage | 99.5 | 86.2 -13% | 100 1% | 99.1 0% | 61.8 -38% | 100 1% |
| AdobeRGB 1998 Coverage | 70.1 | 62.9 -10% | 99.8 42% | 96.9 38% | 42.56 -39% | 99.1 41% |
| Response Times | -33% | -49% | -32% | -23% | -12% | |
| Response Time Grey 50% / Grey 80% * | 34 ? | 45 ? -32% | 54 ? -59% | 46.4 ? -36% | 40.8 ? -20% | 44 ? -29% |
| Response Time Black / White * | 24 ? | 32 ? -33% | 33.2 ? -38% | 30.4 ? -27% | 30 ? -25% | 22.8 ? 5% |
| PWM Frequency | ||||||
| Screen | -31% | -18% | -35% | -55% | -30% | |
| Brightness middle | 402 | 299 -26% | 557.9 39% | 464 15% | 287 -29% | 357.6 -11% |
| Brightness | 375 | 280 -25% | 541 44% | 448 19% | 271 -28% | 350 -7% |
| Brightness Distribution | 84 | 89 6% | 91 8% | 90 7% | 88 5% | 85 1% |
| Black Level * | 0.35 | 0.21 40% | 0.39 -11% | 0.36 -3% | 0.25 29% | 0.35 -0% |
| Contrast | 1149 | 1424 24% | 1431 25% | 1289 12% | 1148 0% | 1022 -11% |
| Colorchecker dE 2000 * | 2.47 | 4.76 -93% | 4.54 -84% | 4.2 -70% | 4.77 -93% | 4.12 -67% |
| Colorchecker dE 2000 max. * | 4.32 | 9 -108% | 7.92 -83% | 11.4 -164% | 17.15 -297% | 9.91 -129% |
| Colorchecker dE 2000 calibrated * | 2.36 | 3.82 -62% | 0.8 66% | 3.73 -58% | 4.23 -79% | |
| Greyscale dE 2000 * | 2.26 | 3.53 -56% | 3.2 -42% | 7.2 -219% | 2.7 -19% | 1.8 20% |
| Gamma | 2.49 88% | 2.3 96% | 1.99 111% | 2.17 101% | 2.115 104% | 2.17 101% |
| CCT | 6285 103% | 7228 90% | 6451 101% | 6345 102% | 7187 90% | 6613 98% |
| Color Space (Percent of AdobeRGB 1998) | 99 | 56 -43% | 89.5 -10% | 85.2 -14% | 43 -57% | 87.5 -12% |
| Color Space (Percent of sRGB) | 86 | 100 | 99 | 61 | 100 | |
| Total Average (Program / Settings) | -25% /
-27% | -14% /
-13% | -16% /
-24% | -39% /
-47% | -7% /
-17% |
* ... smaller is better
The black level is also only average at best, but the 4K displays found in competitors that are even more expensive can't do any better. In return, the Dell and Lenovo devices have slightly better contrast overall, but 1,149:1 is also adequate. All in all, the display is better than that of the predecessor, but some competitors do it even better.
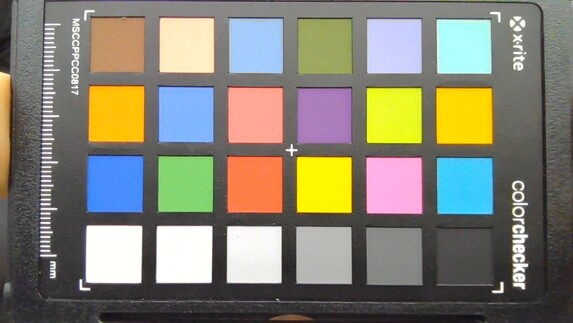
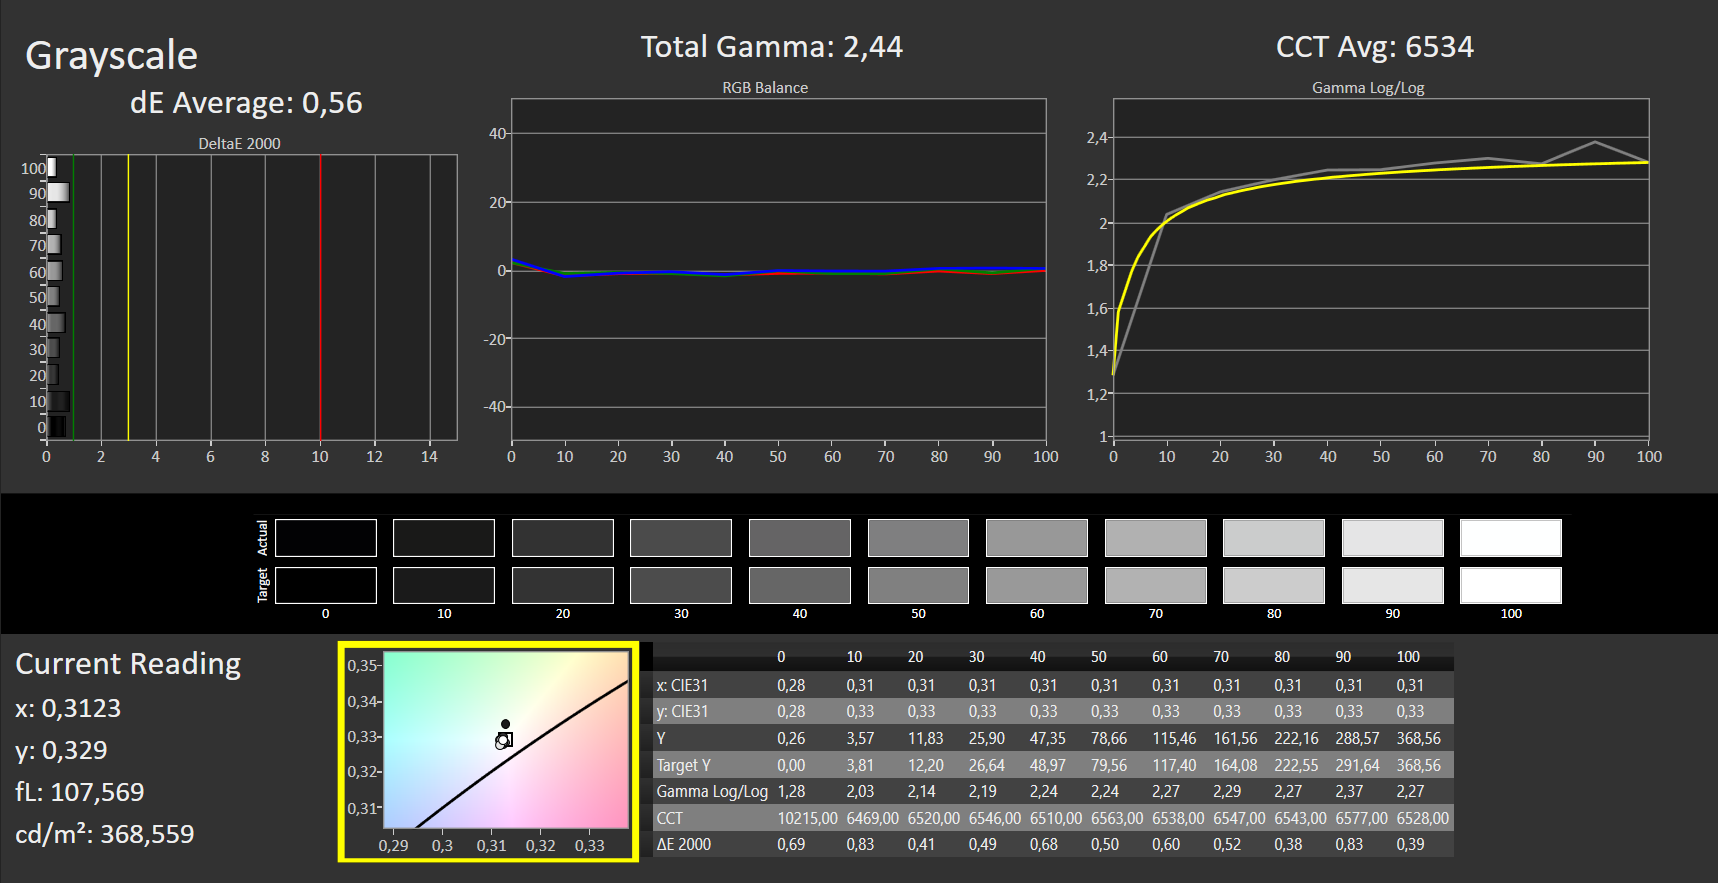
The display is already well calibrated out of the box, and the color deviations are only minimal.


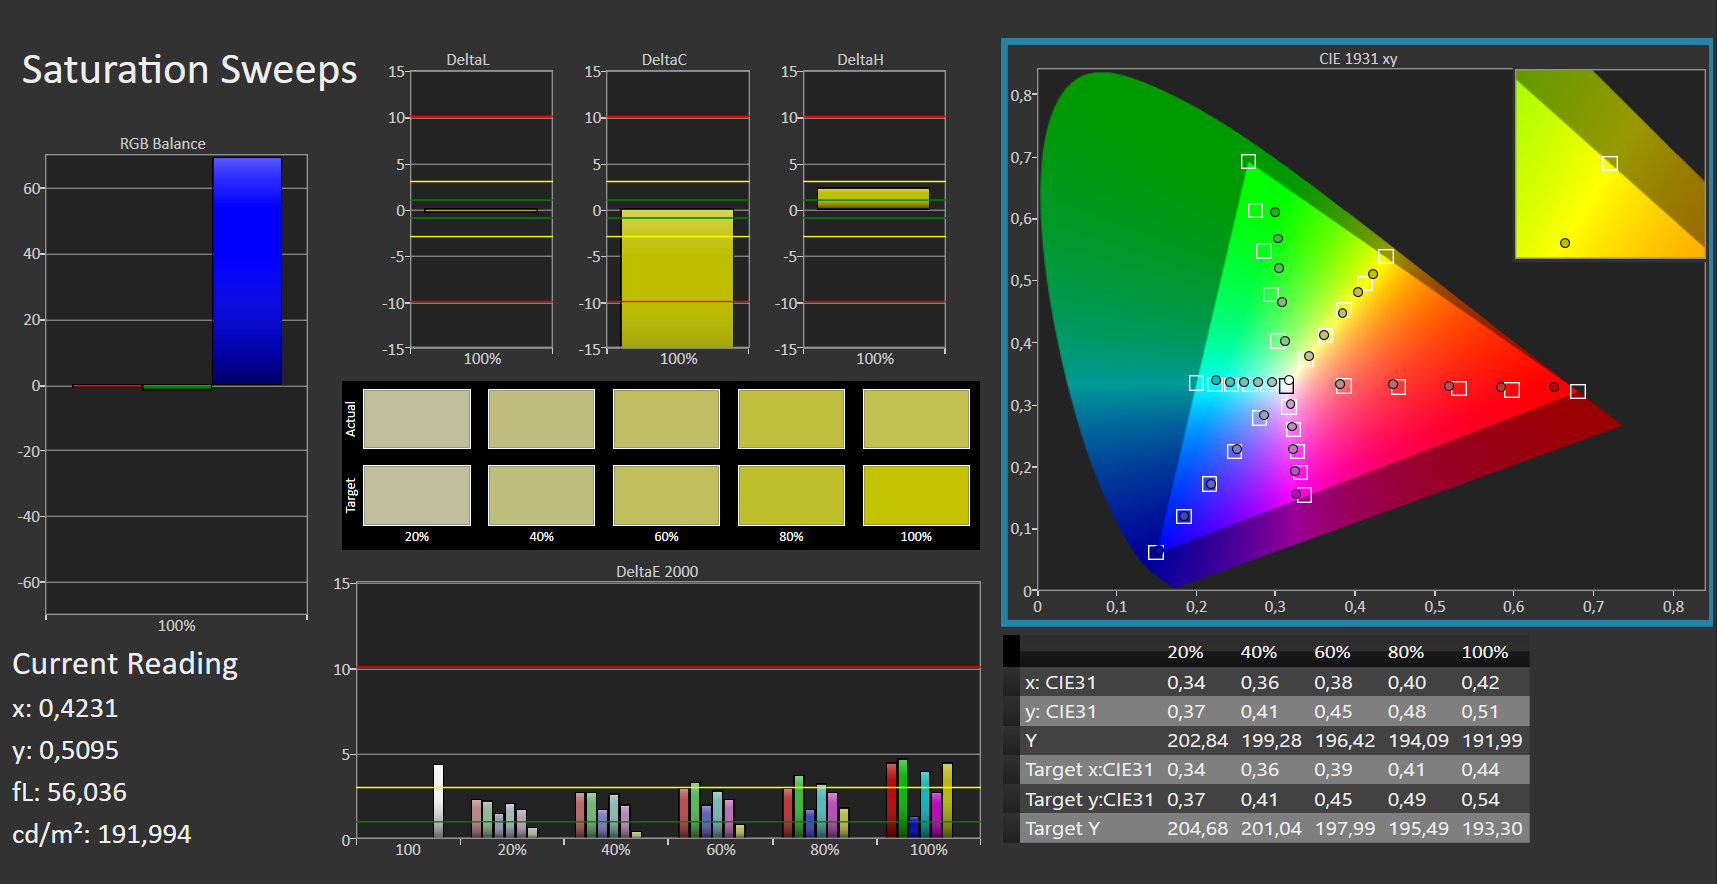


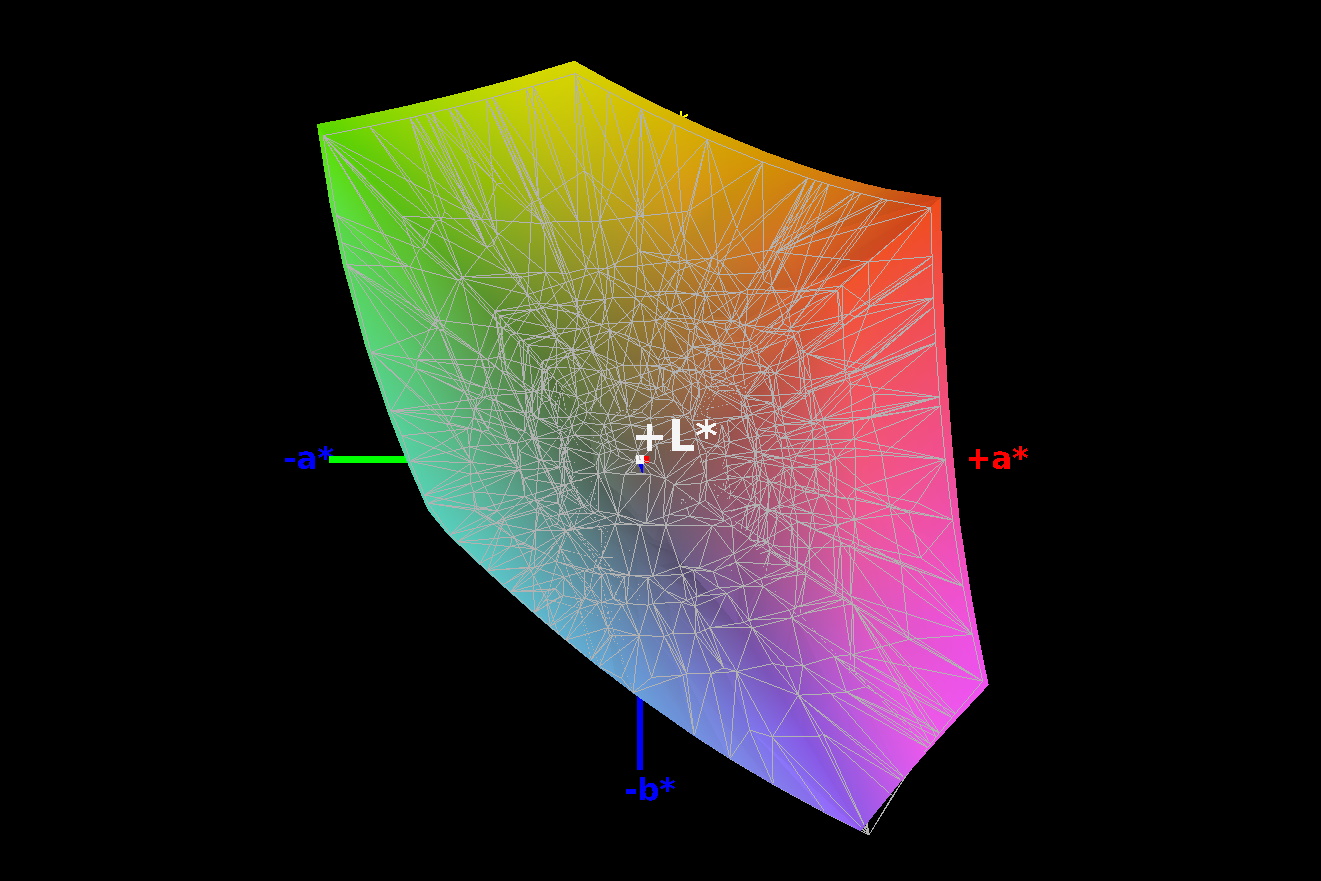
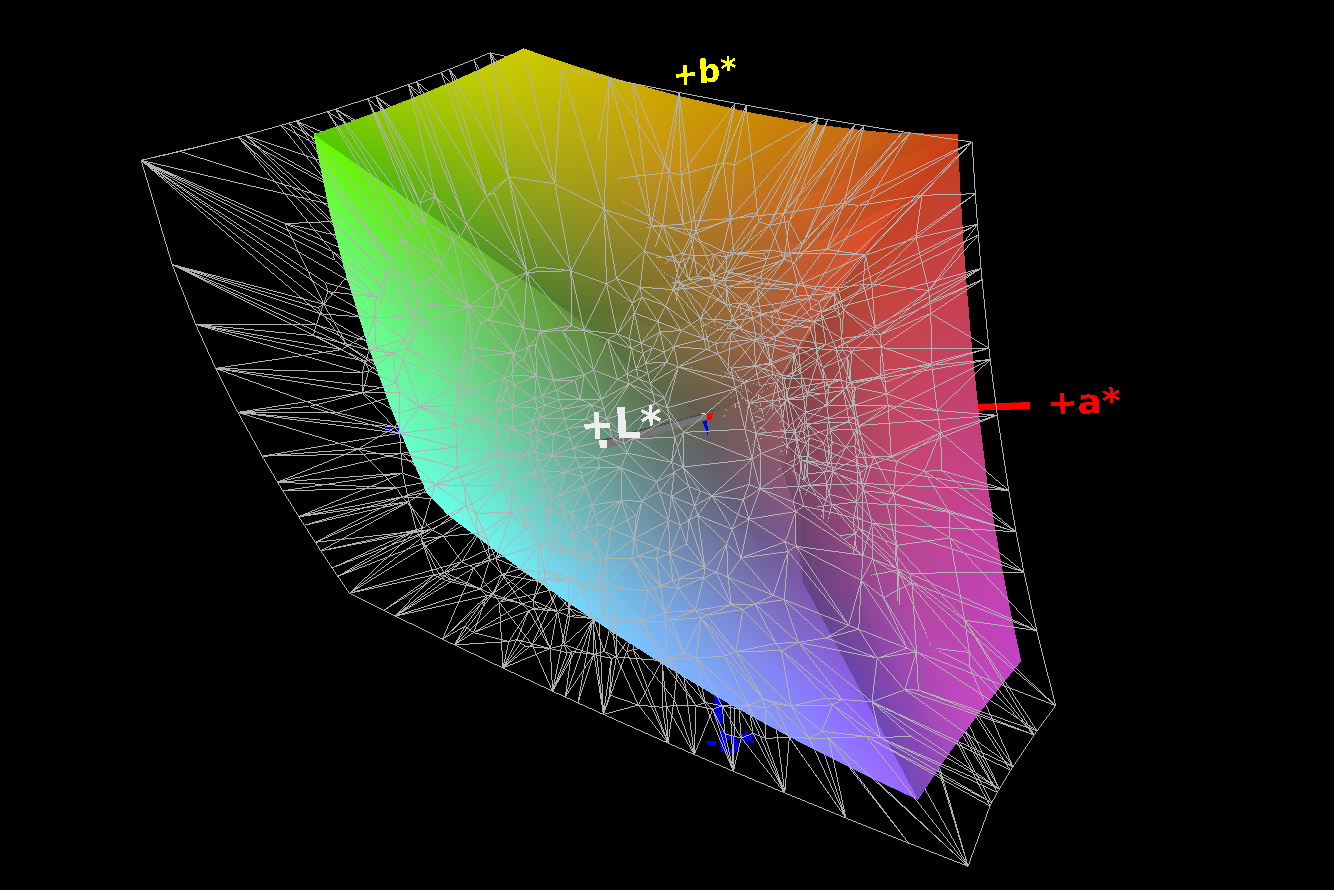
The monitor is also suitable for professional applications; in our test, the display covers the sRGB color space completely and the AdobeRGB one to 64%.

Outdoors, you should find a place in the shade because of the reflective surface, but due to the good brightness, most details can still be recognized when looking directly at the display. However, you should avoid oblique viewing angles or sunlight.
Display Response Times
| ↔ Response Time Black to White | ||
|---|---|---|
| 24 ms ... rise ↗ and fall ↘ combined | ↗ 13 ms rise | 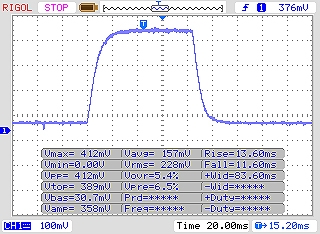 |
| ↘ 11 ms fall | ||
| The screen shows good response rates in our tests, but may be too slow for competitive gamers. In comparison, all tested devices range from 0.1 (minimum) to 240 (maximum) ms. » 48 % of all devices are better. This means that the measured response time is worse than the average of all tested devices (21.5 ms). | ||
| ↔ Response Time 50% Grey to 80% Grey | ||
| 34 ms ... rise ↗ and fall ↘ combined | ↗ 16 ms rise | 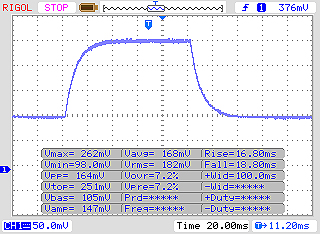 |
| ↘ 18 ms fall | ||
| The screen shows slow response rates in our tests and will be unsatisfactory for gamers. In comparison, all tested devices range from 0.2 (minimum) to 636 (maximum) ms. » 40 % of all devices are better. This means that the measured response time is similar to the average of all tested devices (33.8 ms). | ||
Screen Flickering / PWM (Pulse-Width Modulation)
| Screen flickering / PWM not detected | 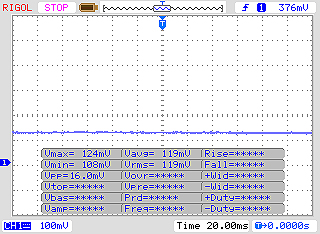 | ||
In comparison: 53 % of all tested devices do not use PWM to dim the display. If PWM was detected, an average of 17942 (minimum: 5 - maximum: 3846000) Hz was measured. | |||
The viewing-angle stability of the 4K panel is quite good; even when viewed from extreme angles, only little brightness is lost, and the screen contents are still clearly visible.

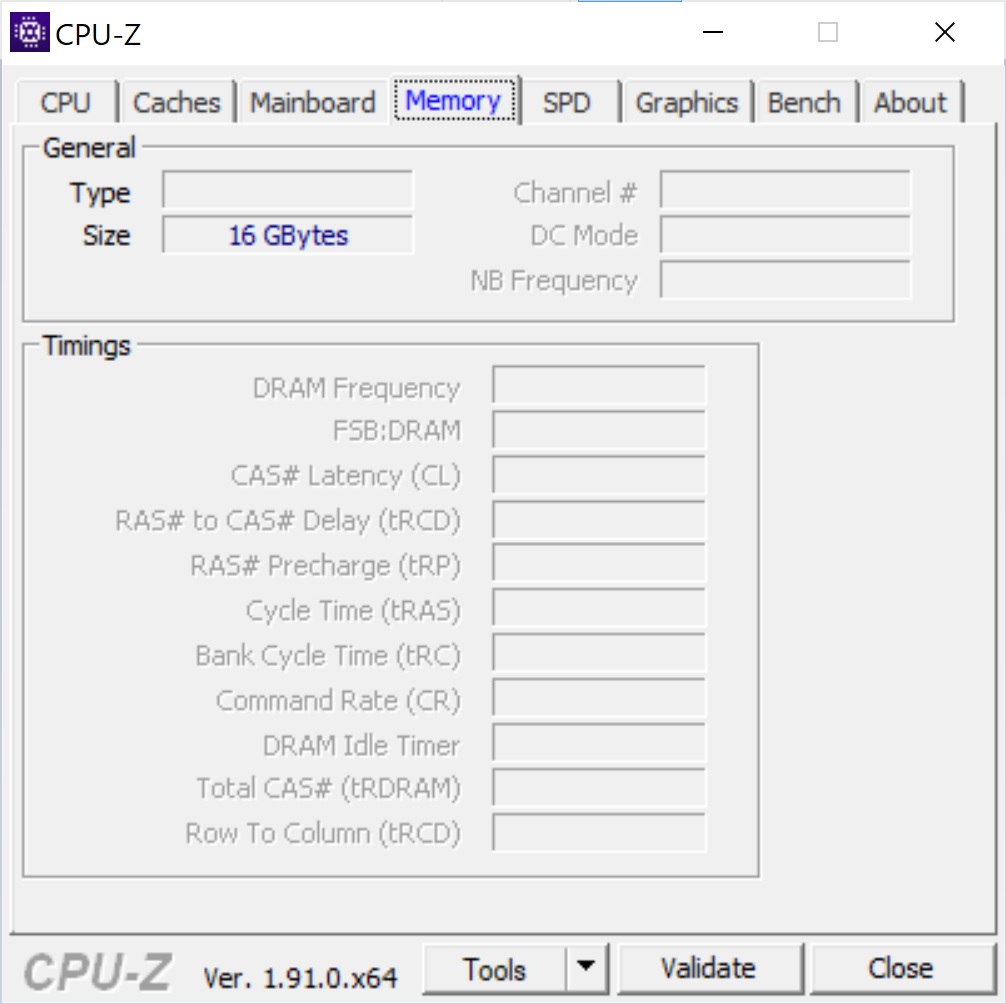
Performance - No performance stability
Its Intel Core i7 of the Comet Lake series, the GTX 1650 Ti Max-Q, the 16 GB of RAM, and the 1 TB SSD qualify the ZenBook as a perfect multimedia all-rounder, and thanks to the good color-space coverage of the display, the laptop is also aimed at content creators, namely creatives and professional photo and image-editors. The built-in ScreenPad provides additional control options during editing and further emphasizes the potential target group.


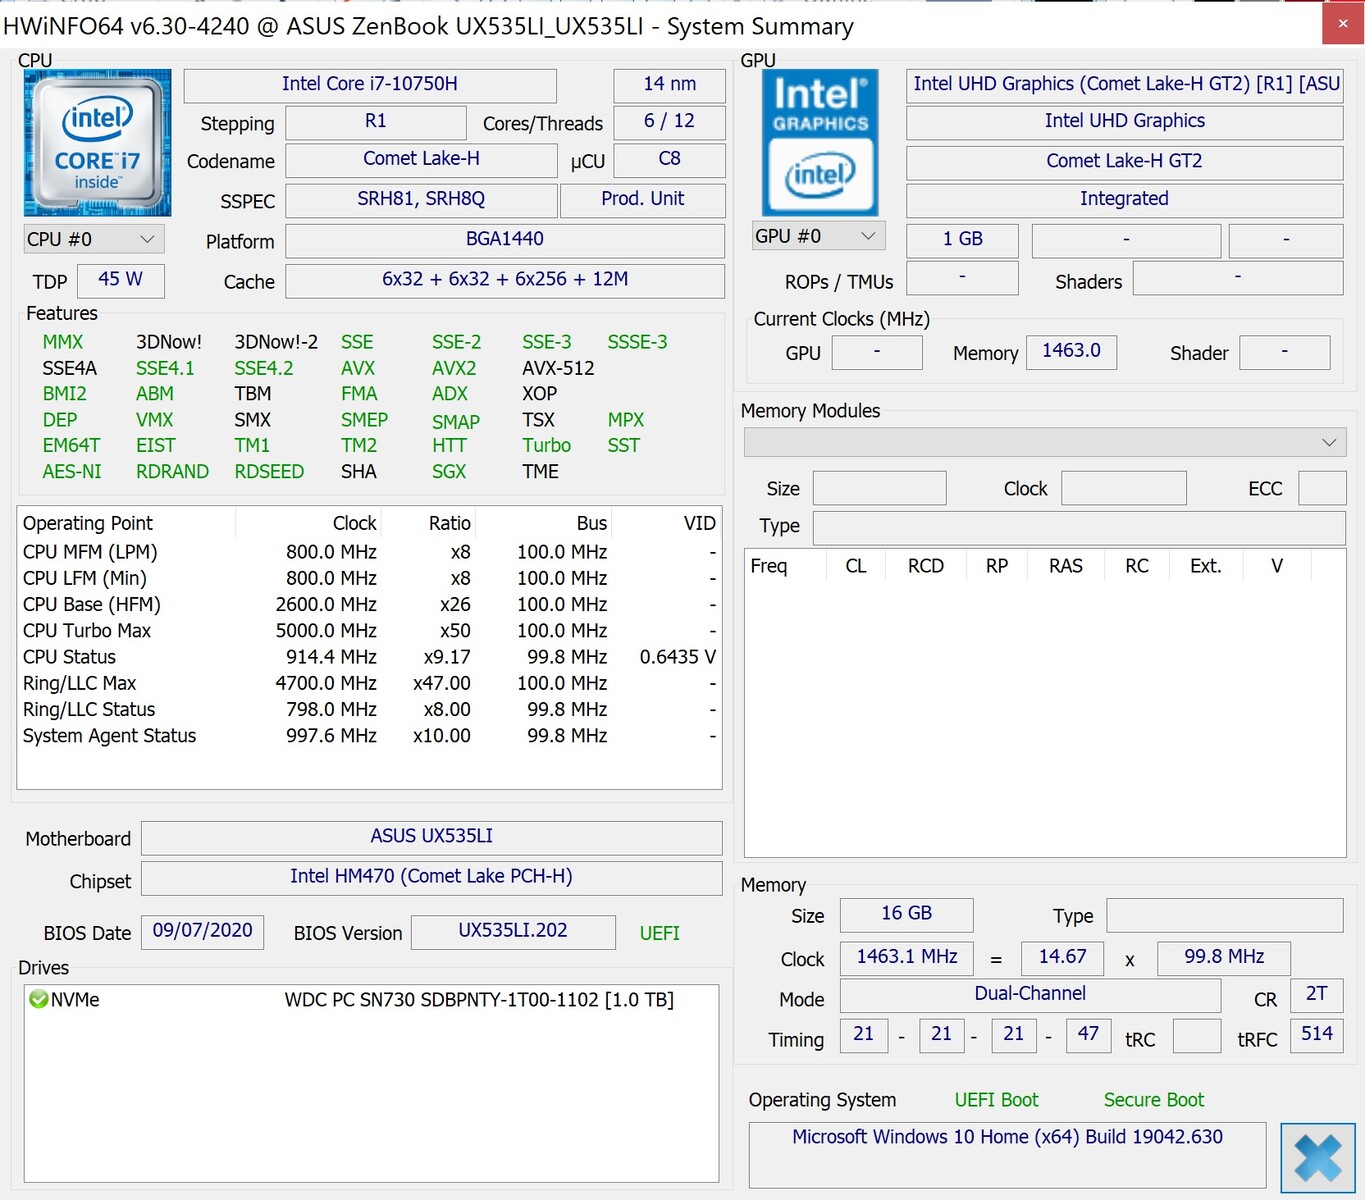
Processor
Asus uses an Intel Core i7-10750H from the Comet Lake series. The CPU has six cores with clock speeds ranging from 2.6 to 5 GHz, and it can also process 12 threads simultaneously. The maximum boost clock speed for all cores running simultaneously is 4.3 GHz.
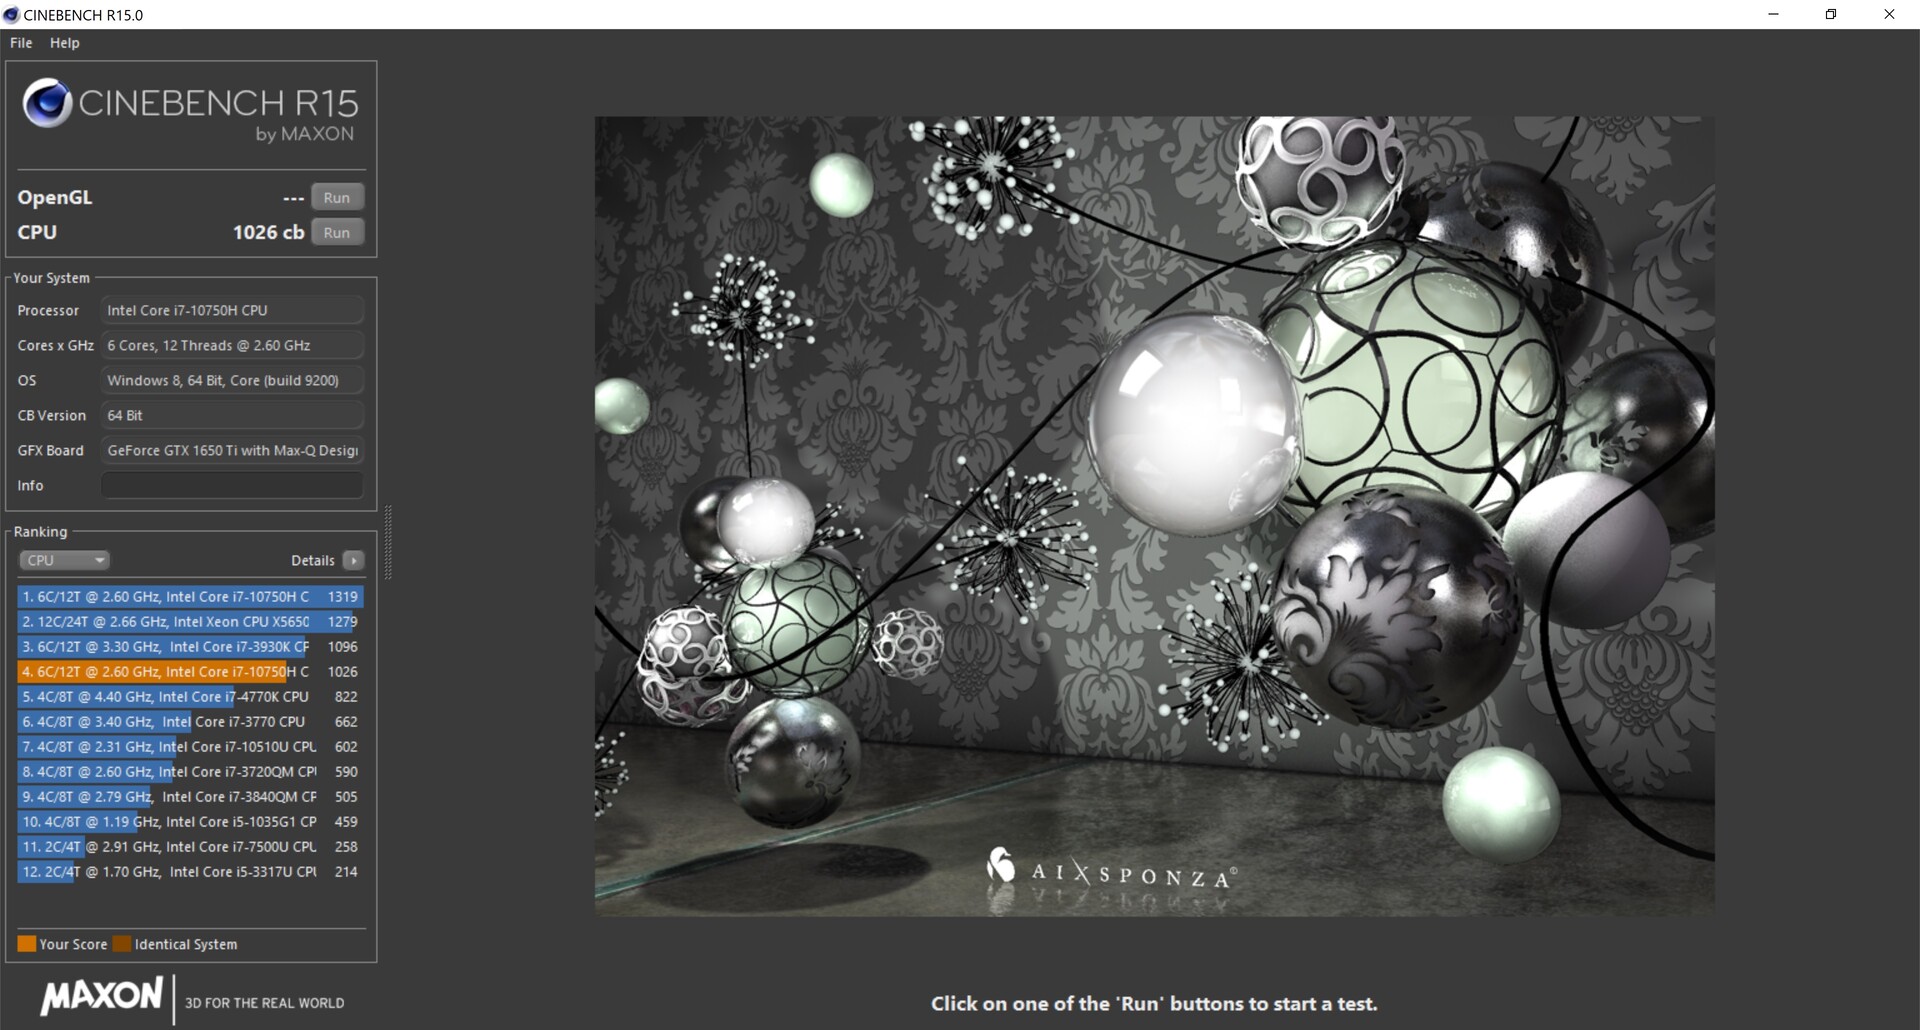
Our 30-minute Cinebench R15 loop reveals a strong performance fluctuation for the ZenBook that is many times higher than on the competition. The initial value is very high under little load; naturally, this value drops after the first two to three passes. However, performance never really stabilizes, but it fluctuates strongly until the end instead. Performance differences of over 10% can occur between two runs.
But on average, the CPU performs as it should. The Ryzen in the Acer Nitro is stronger, but the sibling model with a weaker CPU is significantly slower; the predecessor is about 38% behind.
On battery power, there's a performance loss of about 20%.

Cinebench R15: CPU Single 64Bit | CPU Multi 64Bit
Blender: v2.79 BMW27 CPU
7-Zip 18.03: 7z b 4 -mmt1 | 7z b 4
Geekbench 5.5: Single-Core | Multi-Core
HWBOT x265 Benchmark v2.2: 4k Preset
LibreOffice : 20 Documents To PDF
R Benchmark 2.5: Overall mean
| Cinebench R20 / CPU (Single Core) | |
| Average of class Multimedia (341 - 812, n=96, last 2 years) | |
| Dell XPS 15 9500 Core i7 4K UHD | |
| Average Intel Core i7-10750H (431 - 504, n=43) | |
| Asus ZenBook UX535-M01440 | |
| Asus ZenBook 15 UX534FTC-A8190T | |
| Acer Nitro 5 AN515-44-R5FT | |
| Cinebench R20 / CPU (Multi Core) | |
| Average of class Multimedia (1783 - 11768, n=96, last 2 years) | |
| Dell XPS 15 9500 Core i7 4K UHD | |
| Acer Nitro 5 AN515-44-R5FT | |
| Asus ZenBook UX535-M01440 | |
| Average Intel Core i7-10750H (1749 - 3325, n=43) | |
| Asus ZenBook 15 UX534FTC-A8190T | |
| Cinebench R15 / CPU Single 64Bit | |
| Average of class Multimedia (142.6 - 308, n=98, last 2 years) | |
| Dell XPS 15 9500 Core i7 4K UHD | |
| Asus ZenBook UX535-M01440 | |
| Average Intel Core i7-10750H (184 - 213, n=45) | |
| Asus ZenBook Pro 15 UX580GE | |
| Lenovo ThinkPad X1 Extreme 2019 20QV000WGE | |
| Asus ZenBook 15 UX534FTC-A8190T | |
| Acer Nitro 5 AN515-44-R5FT | |
| Cinebench R15 / CPU Multi 64Bit | |
| Average of class Multimedia (785 - 4703, n=105, last 2 years) | |
| Acer Nitro 5 AN515-44-R5FT | |
| Dell XPS 15 9500 Core i7 4K UHD | |
| Asus ZenBook UX535-M01440 | |
| Average Intel Core i7-10750H (804 - 1418, n=50) | |
| Asus ZenBook Pro 15 UX580GE | |
| Lenovo ThinkPad X1 Extreme 2019 20QV000WGE | |
| Asus ZenBook 15 UX534FTC-A8190T | |
| Blender / v2.79 BMW27 CPU | |
| Lenovo ThinkPad X1 Extreme 2019 20QV000WGE | |
| Asus ZenBook UX535-M01440 | |
| Average Intel Core i7-10750H (322 - 587, n=43) | |
| Dell XPS 15 9500 Core i7 4K UHD | |
| Acer Nitro 5 AN515-44-R5FT | |
| Average of class Multimedia (107 - 662, n=94, last 2 years) | |
| 7-Zip 18.03 / 7z b 4 -mmt1 | |
| Average of class Multimedia (3398 - 7163, n=89, last 2 years) | |
| Dell XPS 15 9500 Core i7 4K UHD | |
| Asus ZenBook UX535-M01440 | |
| Average Intel Core i7-10750H (4504 - 5470, n=43) | |
| Lenovo ThinkPad X1 Extreme 2019 20QV000WGE | |
| Acer Nitro 5 AN515-44-R5FT | |
| 7-Zip 18.03 / 7z b 4 | |
| Average of class Multimedia (20166 - 119900, n=89, last 2 years) | |
| Acer Nitro 5 AN515-44-R5FT | |
| Dell XPS 15 9500 Core i7 4K UHD | |
| Average Intel Core i7-10750H (26040 - 37345, n=43) | |
| Asus ZenBook UX535-M01440 | |
| Lenovo ThinkPad X1 Extreme 2019 20QV000WGE | |
| Geekbench 5.5 / Single-Core | |
| Average of class Multimedia (926 - 2342, n=99, last 2 years) | |
| Dell XPS 15 9500 Core i7 4K UHD | |
| Asus ZenBook UX535-M01440 | |
| Average Intel Core i7-10750H (1114 - 1333, n=43) | |
| Asus ZenBook 15 UX534FTC-A8190T | |
| Acer Nitro 5 AN515-44-R5FT | |
| Geekbench 5.5 / Multi-Core | |
| Average of class Multimedia (3828 - 23059, n=99, last 2 years) | |
| Dell XPS 15 9500 Core i7 4K UHD | |
| Average Intel Core i7-10750H (4443 - 6674, n=43) | |
| Asus ZenBook UX535-M01440 | |
| Acer Nitro 5 AN515-44-R5FT | |
| Asus ZenBook 15 UX534FTC-A8190T | |
| HWBOT x265 Benchmark v2.2 / 4k Preset | |
| Average of class Multimedia (4.99 - 30.5, n=87, last 2 years) | |
| Dell XPS 15 9500 Core i7 4K UHD | |
| Asus ZenBook UX535-M01440 | |
| Average Intel Core i7-10750H (5.54 - 11.6, n=43) | |
| Acer Nitro 5 AN515-44-R5FT | |
| Lenovo ThinkPad X1 Extreme 2019 20QV000WGE | |
| LibreOffice / 20 Documents To PDF | |
| Asus ZenBook UX535-M01440 | |
| Acer Nitro 5 AN515-44-R5FT | |
| Average Intel Core i7-10750H (43.1 - 99.2, n=43) | |
| Dell XPS 15 9500 Core i7 4K UHD | |
| Average of class Multimedia (6.7 - 84.9, n=91, last 2 years) | |
| R Benchmark 2.5 / Overall mean | |
| Acer Nitro 5 AN515-44-R5FT | |
| Average Intel Core i7-10750H (0.578 - 0.708, n=42) | |
| Asus ZenBook UX535-M01440 | |
| Dell XPS 15 9500 Core i7 4K UHD | |
| Average of class Multimedia (0.3826 - 0.723, n=89, last 2 years) | |
* ... smaller is better
System performance
The UX535 performs as expected and without surprises in the PCMark benchmarks. Of all things, the two-year-old predecessor is often just ahead of the current model. Subjectively, the vast majority of tasks are completed smoothly, and there are no issues.


| PCMark 8 Home Score Accelerated v2 | 3357 points | |
| PCMark 8 Work Score Accelerated v2 | 4272 points | |
| PCMark 10 Score | 4887 points | |
Help | ||
DPC latencies
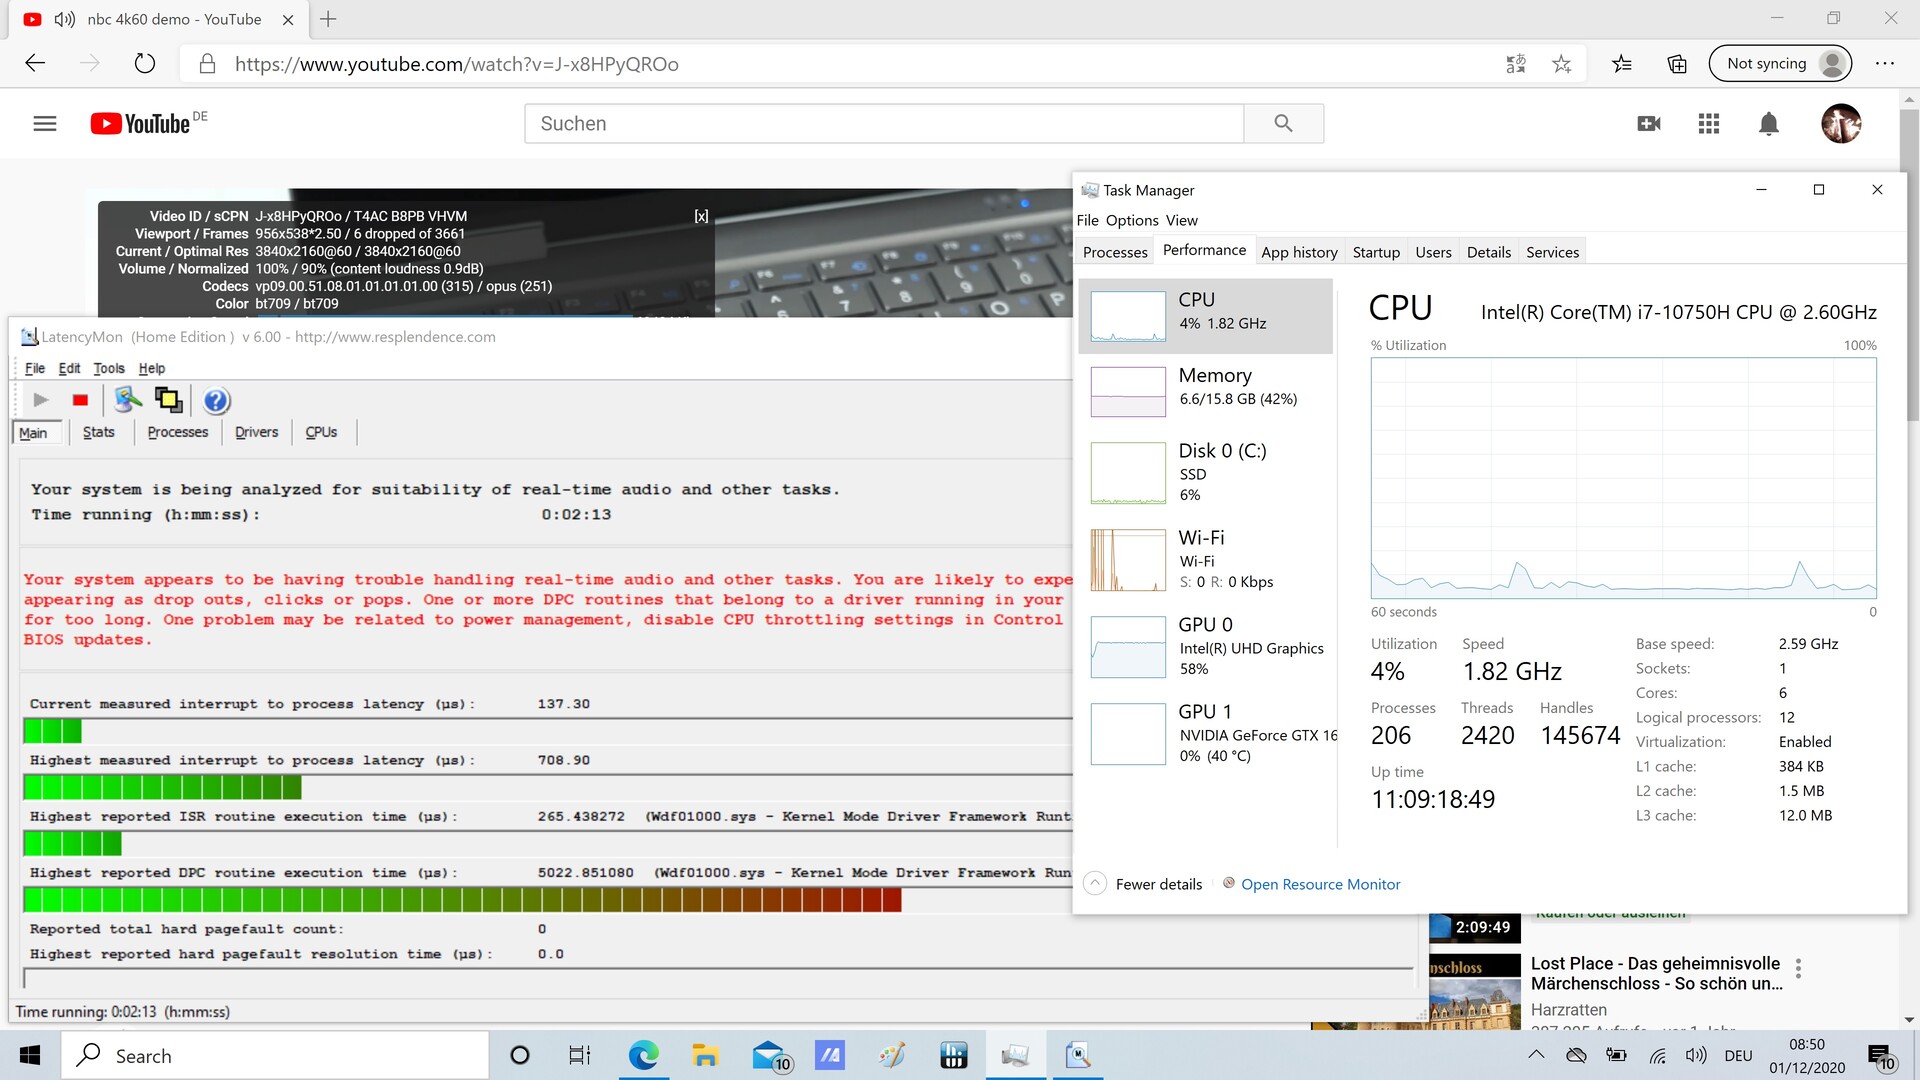
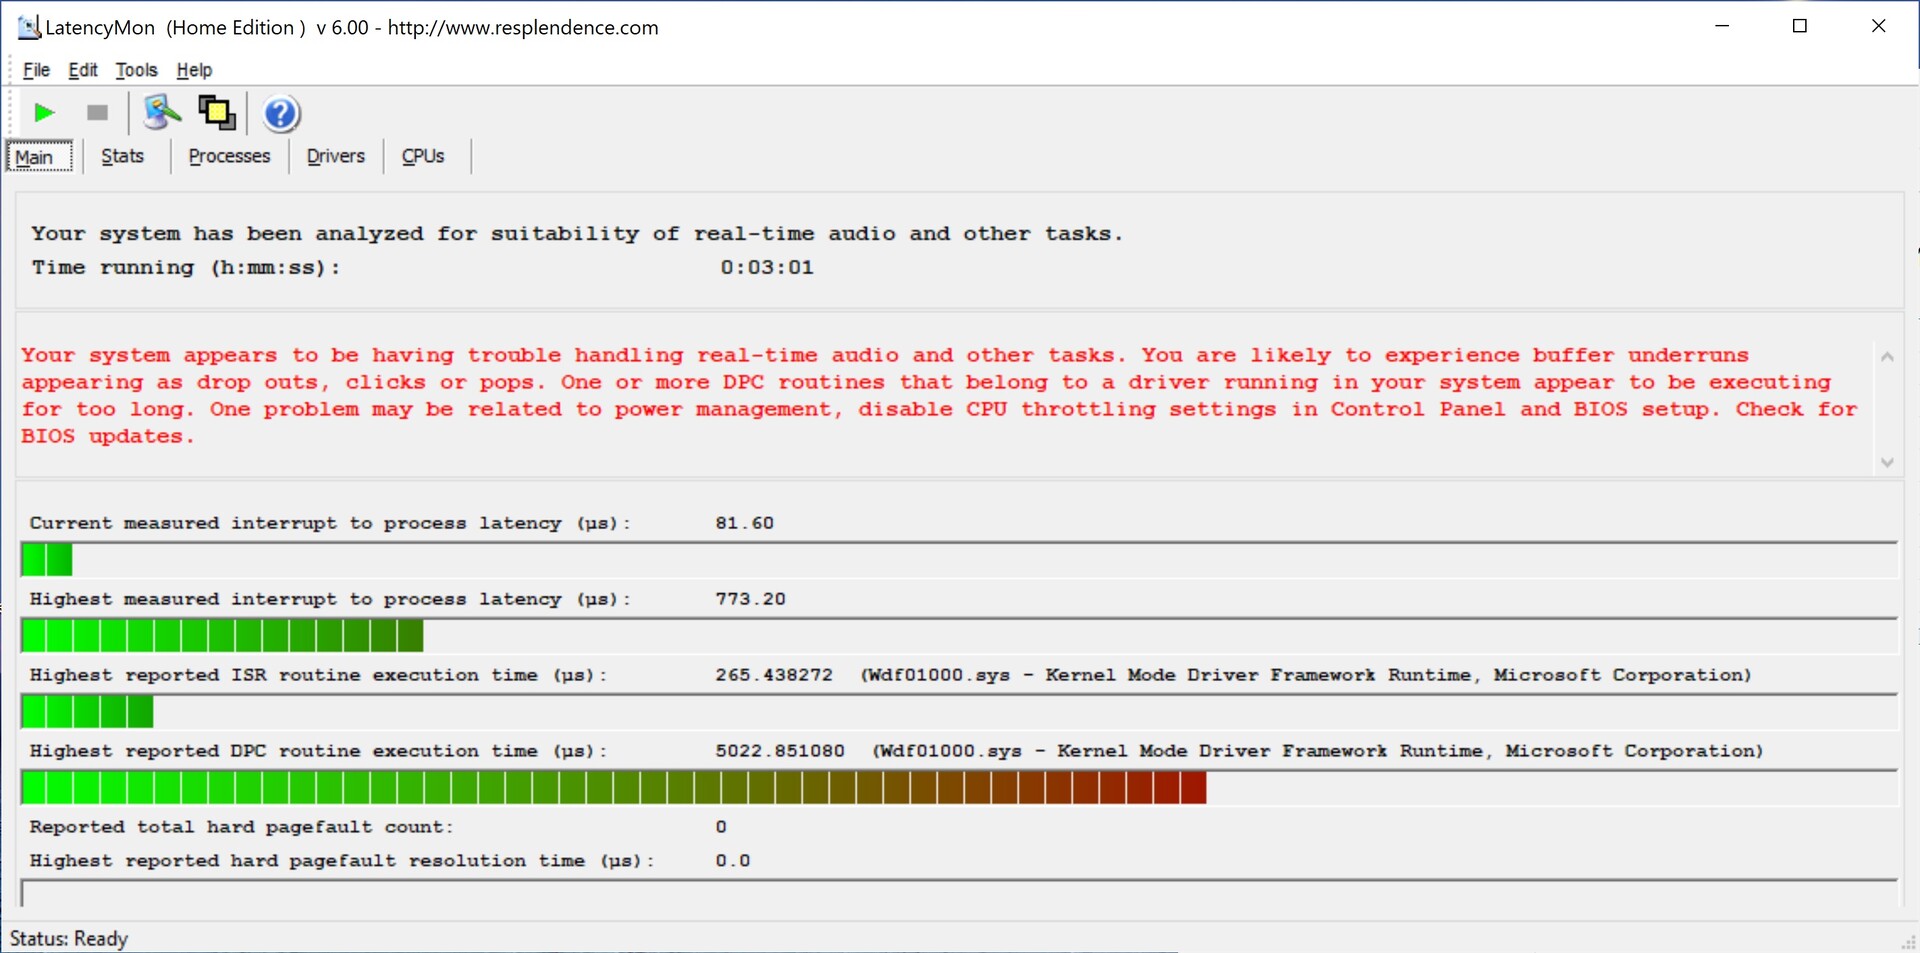
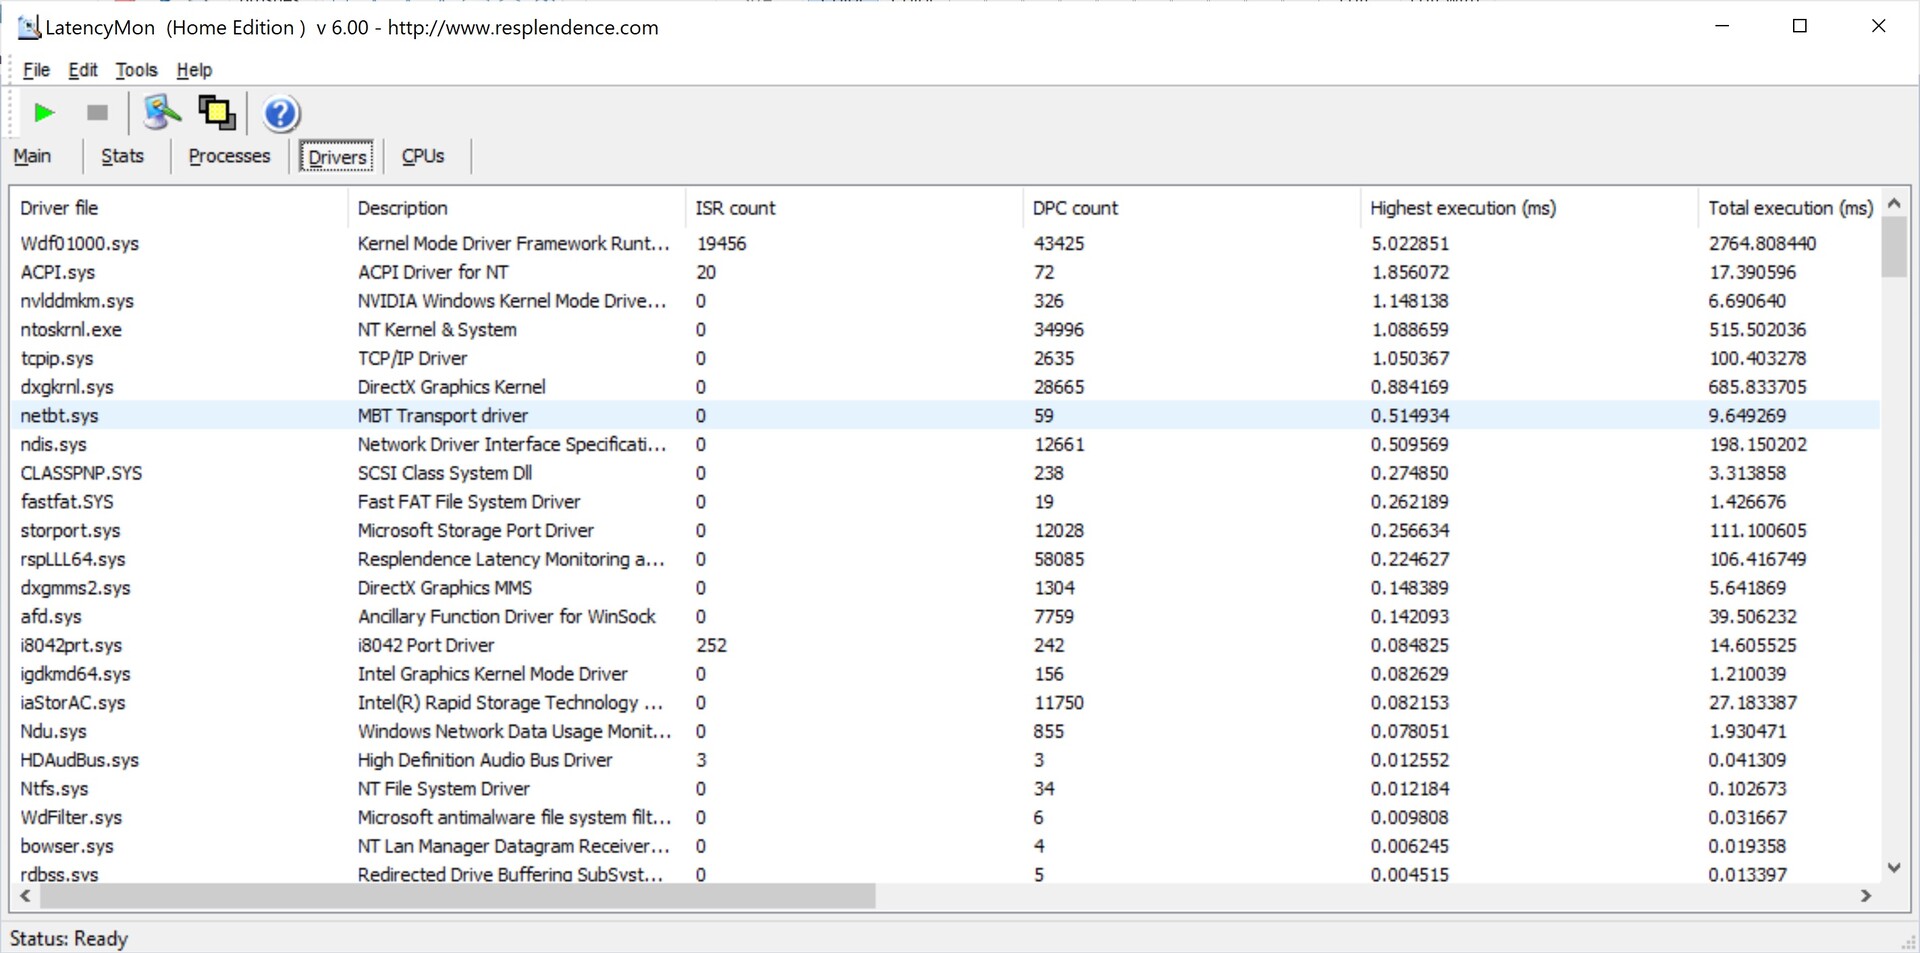
Just by simply opening the browser, the ZenBook already shows latency problems. The LatencyMon tool detects even higher latencies in combination with our 4K/60 Hz YouTube video. Once again, the Kernel Mode Driver Framework Runtimes causes the most problems, but it's also accompanied by the ACPI driver and an Nvidia driver. There were six dropped frames during YouTube playback.
| DPC Latencies / LatencyMon - interrupt to process latency (max), Web, Youtube, Prime95 | |
| Dell XPS 15 9500 Core i7 4K UHD | |
| Acer Nitro 5 AN515-44-R5FT | |
| Asus ZenBook UX535-M01440 | |
* ... smaller is better
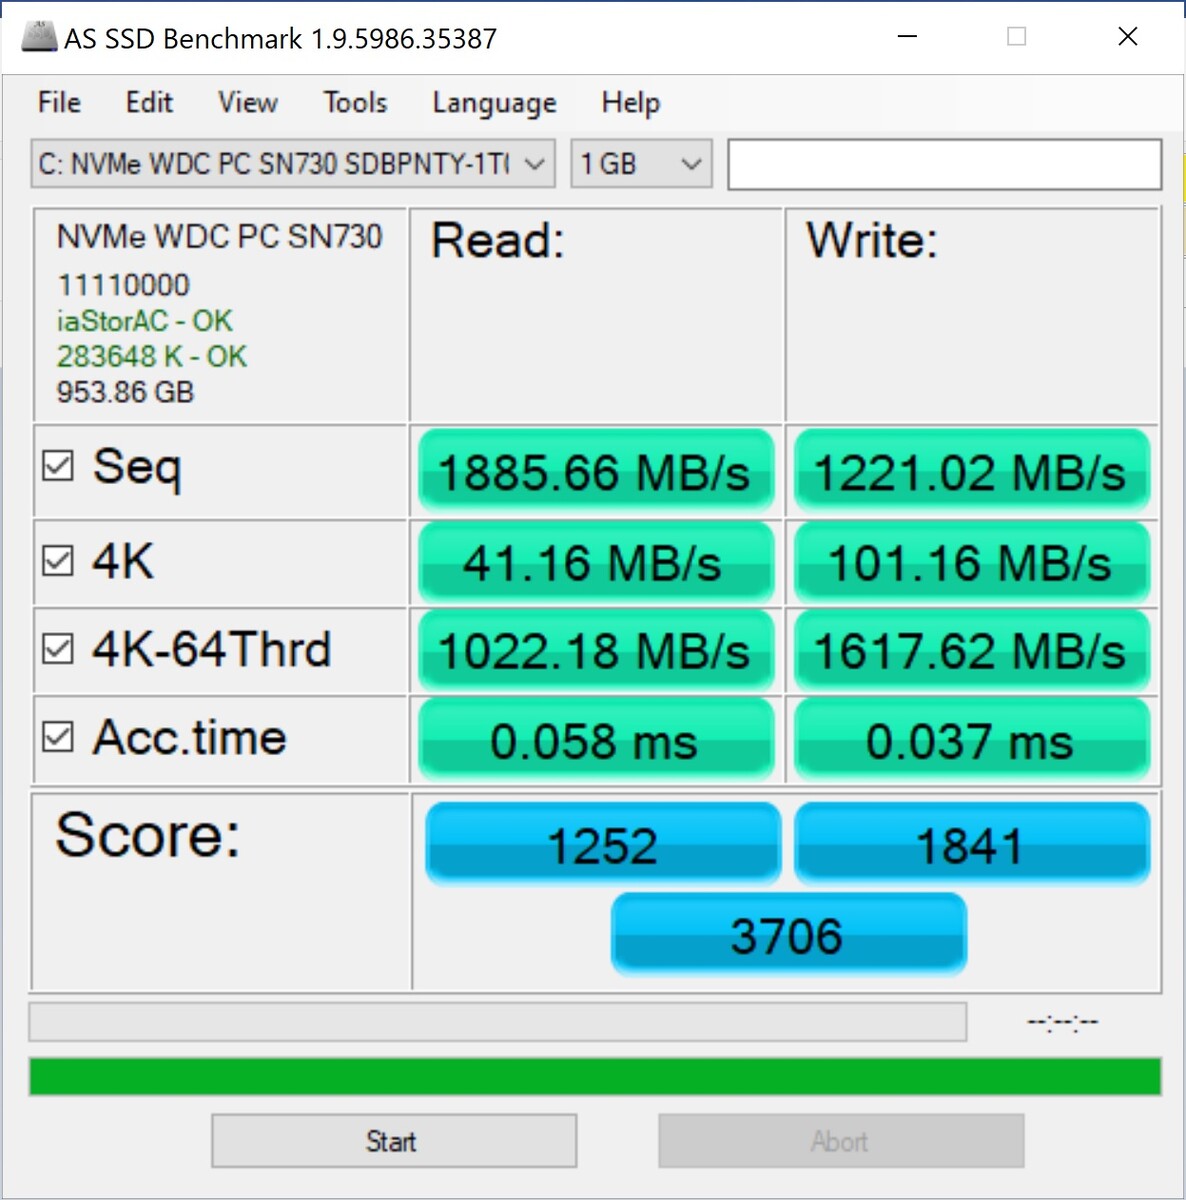
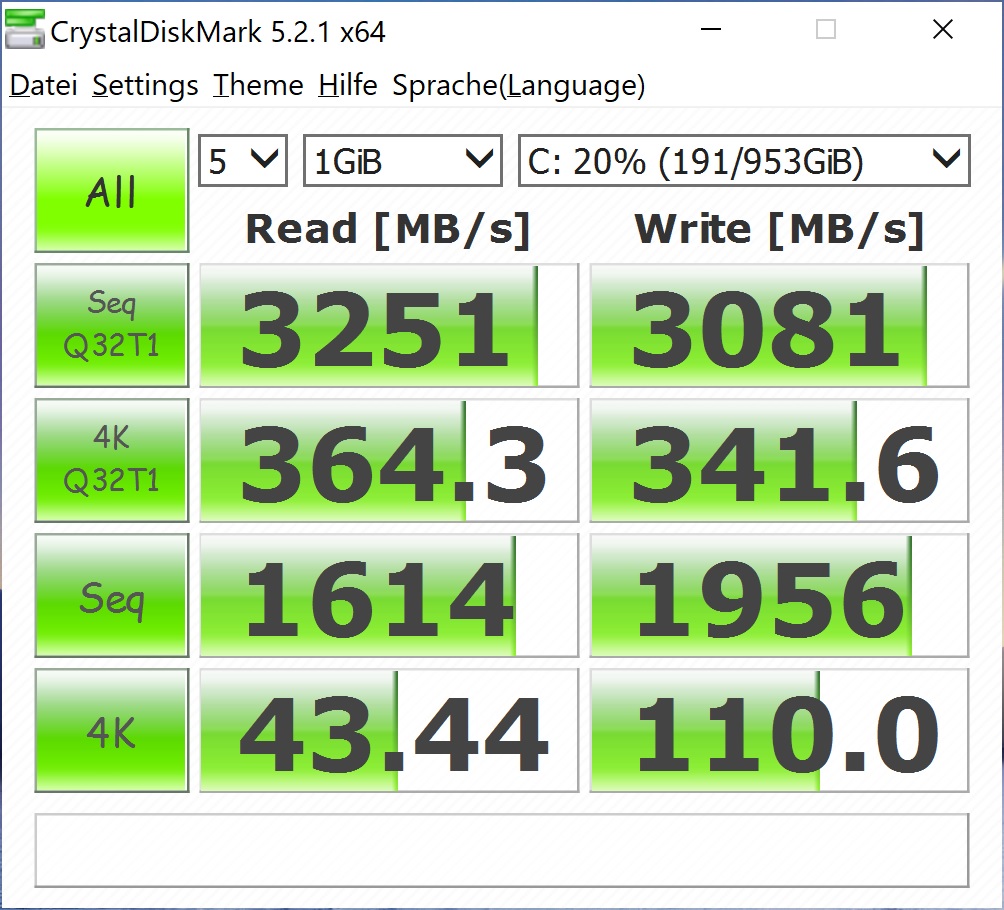
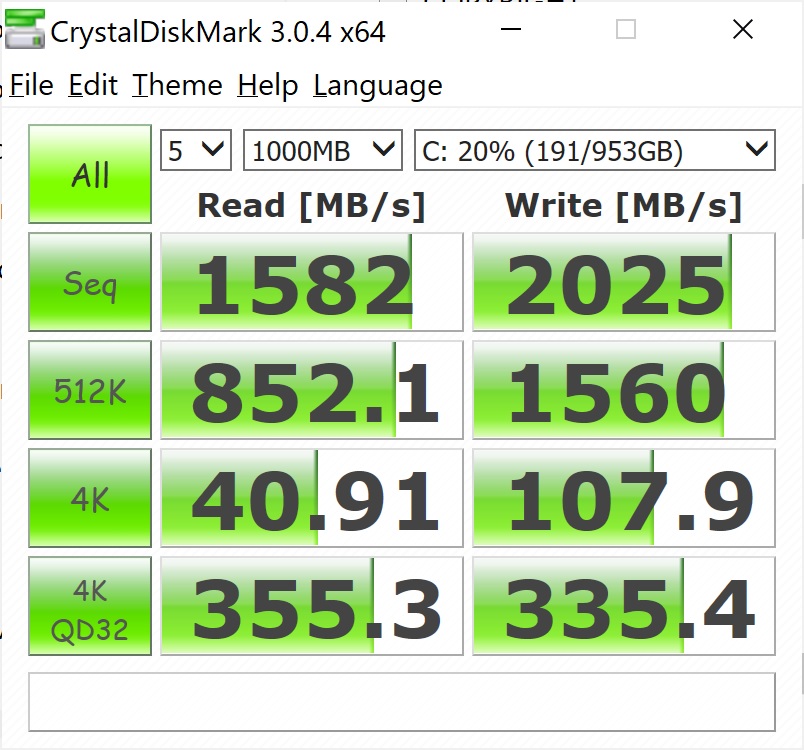
Storage
The mass storage device is an SSD from Western Digital with a generous 1 TB capacity. It's ranked 12th in our SSD/HDD Benchmarks article, so it's a quite fast model. The test values confirm this, but the drive is still not quite as fast as the Samsung PM981 found in the sibling model or in the Lenovo ThinkPad X1.

| Asus ZenBook UX535-M01440 WDC PC SN730 SDBPNTY-1T00 | Asus ZenBook 15 UX534FTC-A8190T Samsung SSD PM981 MZVLB1T0HALR | Dell XPS 15 9500 Core i7 4K UHD SK Hynix PC611 512GB | Lenovo ThinkPad X1 Extreme 2019 20QV000WGE Samsung SSD PM981 MZVLB512HAJQ | Acer Nitro 5 AN515-44-R5FT SK Hynix BC511 HFM512GDJTNI | Asus ZenBook Pro 15 UX580GE Samsung SSD PM961 1TB M.2 PCIe 3.0 x4 NVMe (MZVLW1T0) | Average WDC PC SN730 SDBPNTY-1T00 | |
|---|---|---|---|---|---|---|---|
| CrystalDiskMark 5.2 / 6 | 12% | 4% | 14% | -17% | -5% | 17% | |
| Write 4K | 110 | 138.1 26% | 123.3 12% | 148.1 35% | 94.7 -14% | 125 14% | 139.9 ? 27% |
| Read 4K | 43.44 | 45.89 6% | 41.85 -4% | 47.31 9% | 38.91 -10% | 44.68 3% | 44.5 ? 2% |
| Write Seq | 1957 | 2147 10% | 2054 5% | 1414 -28% | 1056 -46% | 1059 -46% | 2346 ? 20% |
| Read Seq | 1615 | 2188 35% | 1617 0% | 1320 -18% | 1183 -27% | 772 -52% | 2102 ? 30% |
| Write 4K Q32T1 | 341.6 | 427.8 25% | 413 21% | 493.6 44% | 445.3 30% | 507 48% | 442 ? 29% |
| Read 4K Q32T1 | 364.3 | 404 11% | 377.5 4% | 594 63% | 477.7 31% | 614 69% | 460 ? 26% |
| Write Seq Q32T1 | 3081 | 2396 -22% | 2705 -12% | 2970 -4% | 1063 -65% | 1763 -43% | 3049 ? -1% |
| Read Seq Q32T1 | 3251 | 3454 6% | 3442 6% | 3472 7% | 2154 -34% | 2171 -33% | 3285 ? 1% |
| AS SSD | 20% | -10% | 29% | -16% | 6% | 20% | |
| Seq Read | 1886 | 2643 40% | 2072 10% | 2352 25% | 1504 -20% | 2099 11% | 2606 ? 38% |
| Seq Write | 1221 | 1533 26% | 1486 22% | 2106 72% | 1064 -13% | 1729 42% | 1935 ? 58% |
| 4K Read | 41.16 | 49.12 19% | 47.41 15% | 55 34% | 51.5 25% | 37.78 -8% | 42.9 ? 4% |
| 4K Write | 101.2 | 134.7 33% | 117.6 16% | 138.1 36% | 123.2 22% | 100.9 0% | 129.1 ? 28% |
| 4K-64 Read | 1022 | 1028 1% | 967 -5% | 1265 24% | 703 -31% | 1431 40% | 1361 ? 33% |
| 4K-64 Write | 1618 | 1353 -16% | 715 -56% | 1952 21% | 730 -55% | 1273 -21% | 1920 ? 19% |
| Access Time Read * | 0.058 | 0.033 43% | 0.057 2% | 0.053 9% | 0.064 -10% | 0.04 31% | 0.0689 ? -19% |
| Access Time Write * | 0.037 | 0.028 24% | 0.096 -159% | 0.027 27% | 0.031 16% | 0.036 3% | 0.06215 ? -68% |
| Score Read | 1252 | 1342 7% | 1222 -2% | 1556 24% | 905 -28% | 1679 34% | 1664 ? 33% |
| Score Write | 1841 | 1641 -11% | 981 -47% | 2301 25% | 960 -48% | 1547 -16% | 2242 ? 22% |
| Score Total | 3706 | 3622 -2% | 2809 -24% | 4650 25% | 2321 -37% | 4065 10% | 4726 ? 28% |
| Copy ISO MB/s | 1611 | 2226 38% | 1999 24% | 1045 -35% | 2041 ? 27% | ||
| Copy Program MB/s | 509 | 506 -1% | 627 23% | 430.9 -15% | 552 ? 8% | ||
| Copy Game MB/s | 677 | 1230 82% | 1001 48% | 728 8% | 1183 ? 75% | ||
| Total Average (Program / Settings) | 16% /
17% | -3% /
-5% | 22% /
23% | -17% /
-17% | 1% /
2% | 19% /
19% |
* ... smaller is better

Continuous load read: DiskSpd Read Loop, Queue Depth 8
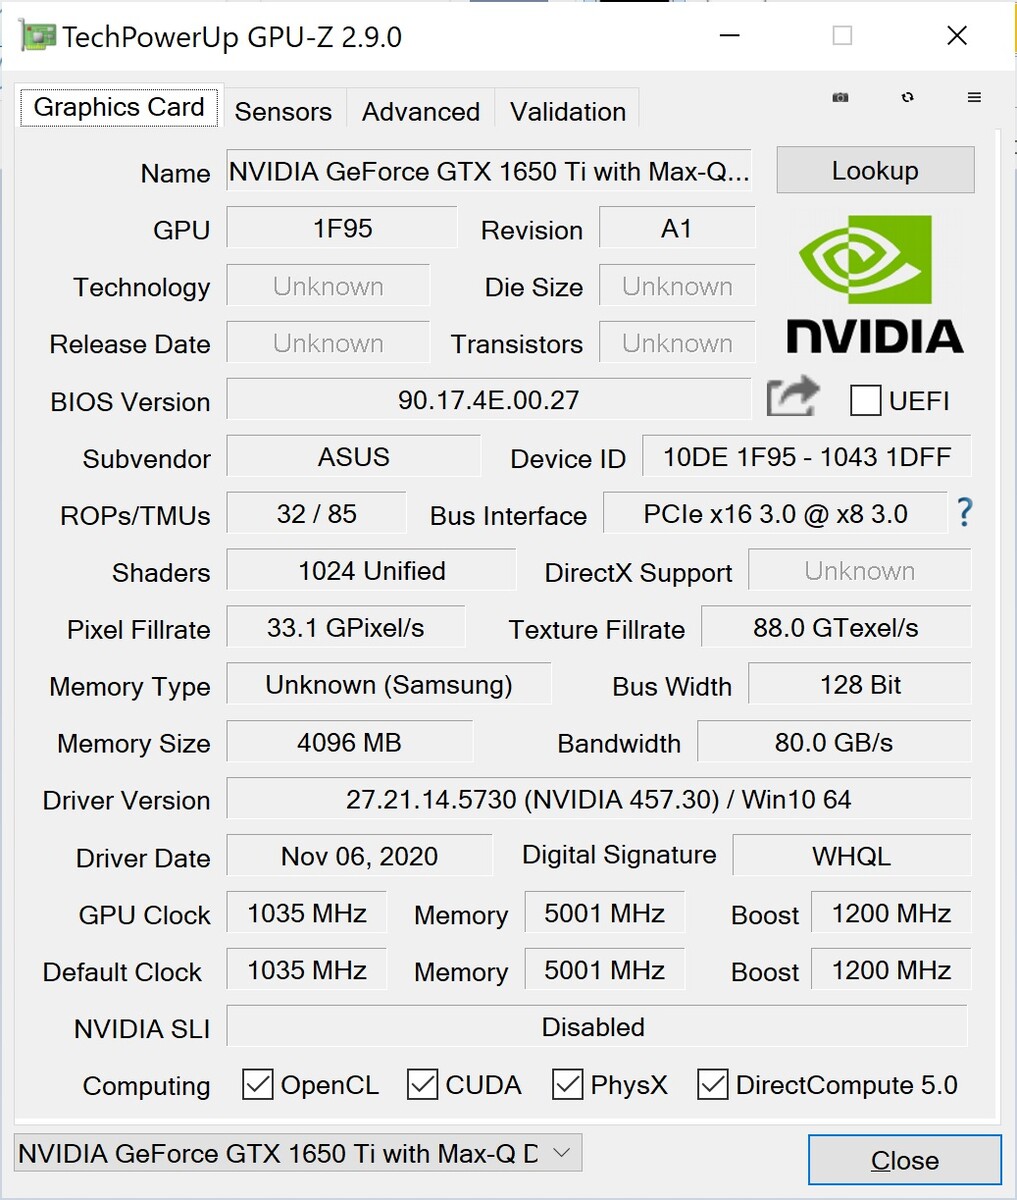
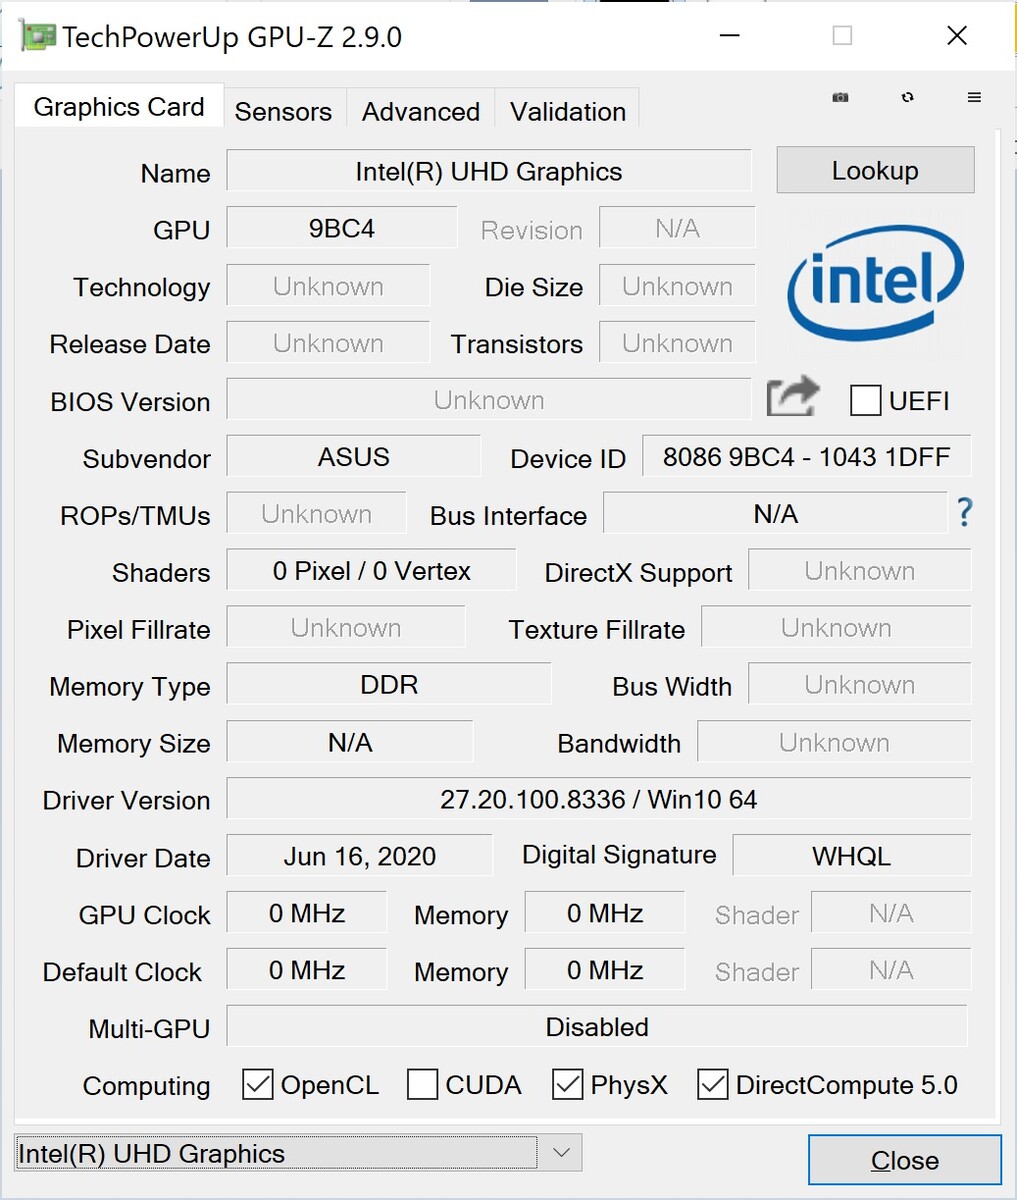
Graphics card
The laptop can switch between the energy-efficient but weak Intel UHD Graphics 630 iGPU and the dedicated Nvidia GeForce GTX 1650 Ti Max-Q graphics card. The latter is an entry-level gaming card. The Max-Q design is a bit more power-efficient but also slower than the normal version.
In the 3DMarks, it remains slightly below an average 1650 Ti Max-Q (3 to 11%). However, the same GPU is about 3% slower in the sibling model.
A whole 35% of the 3D performance is lost on battery power as our repeated 3DMark 11 run reveals.
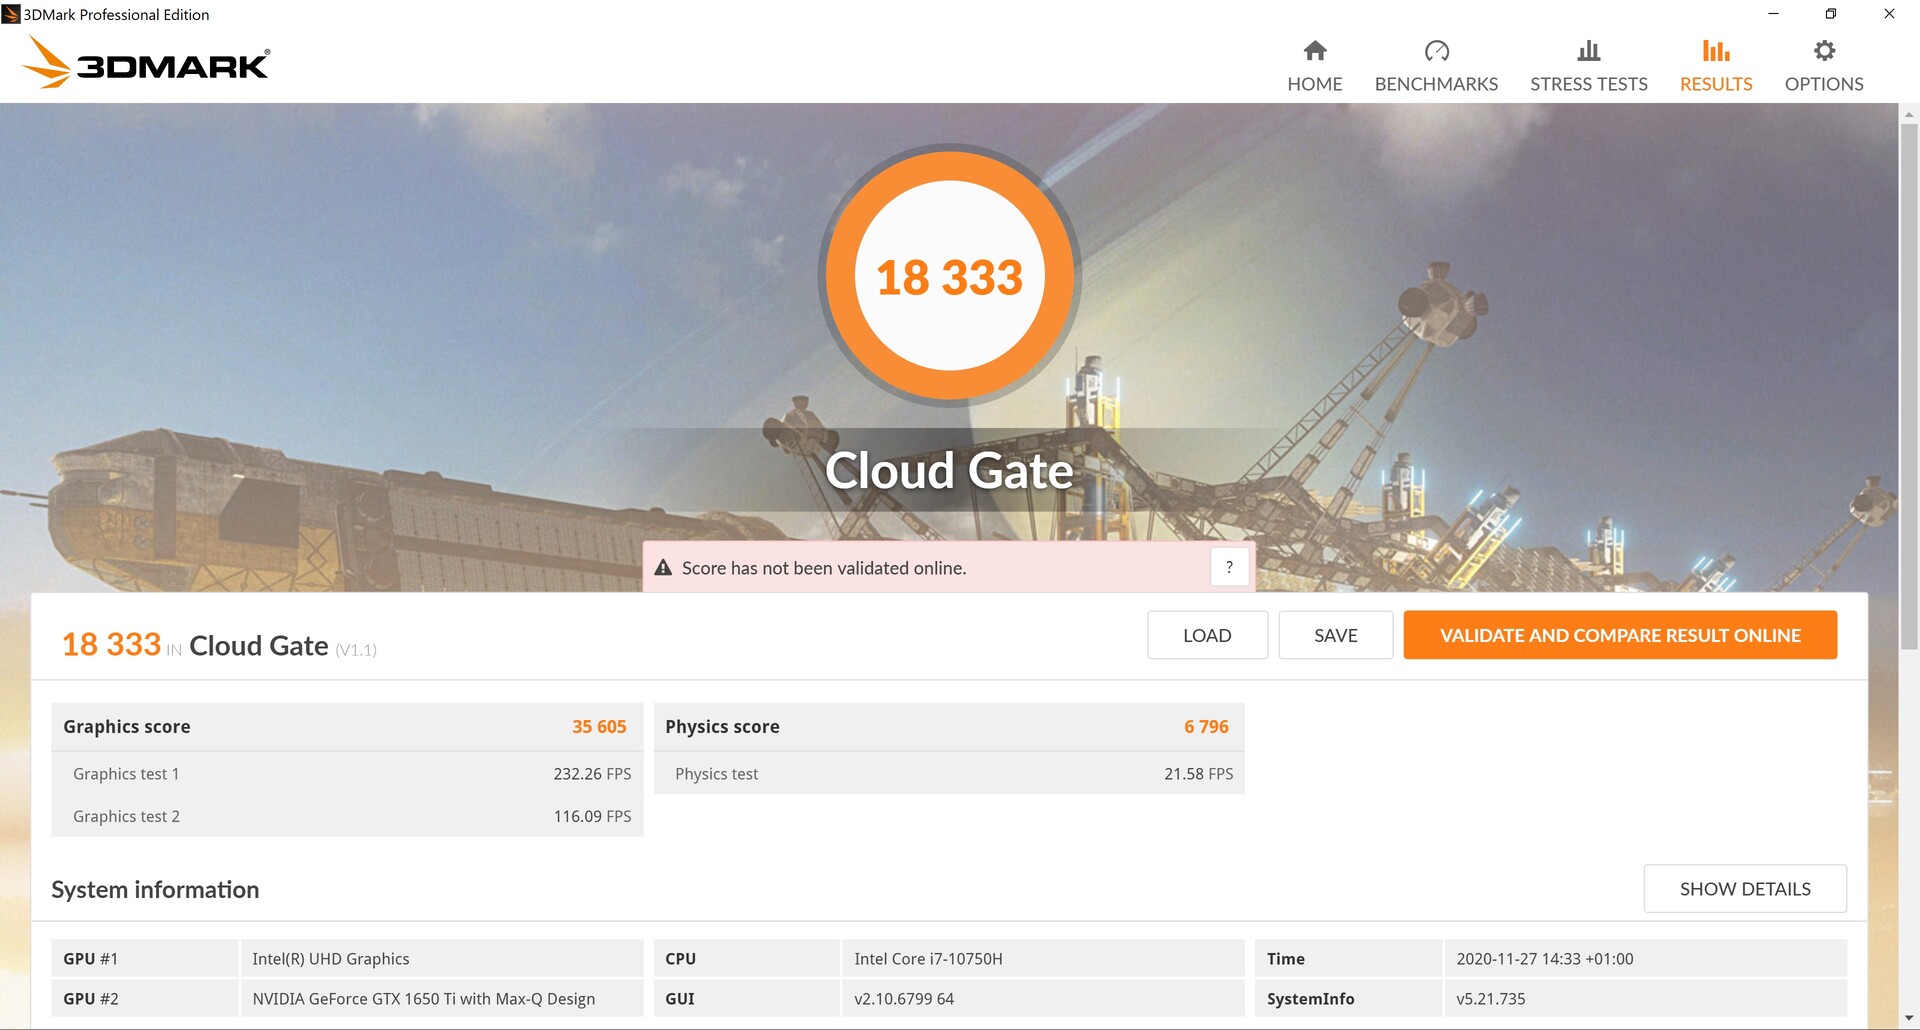

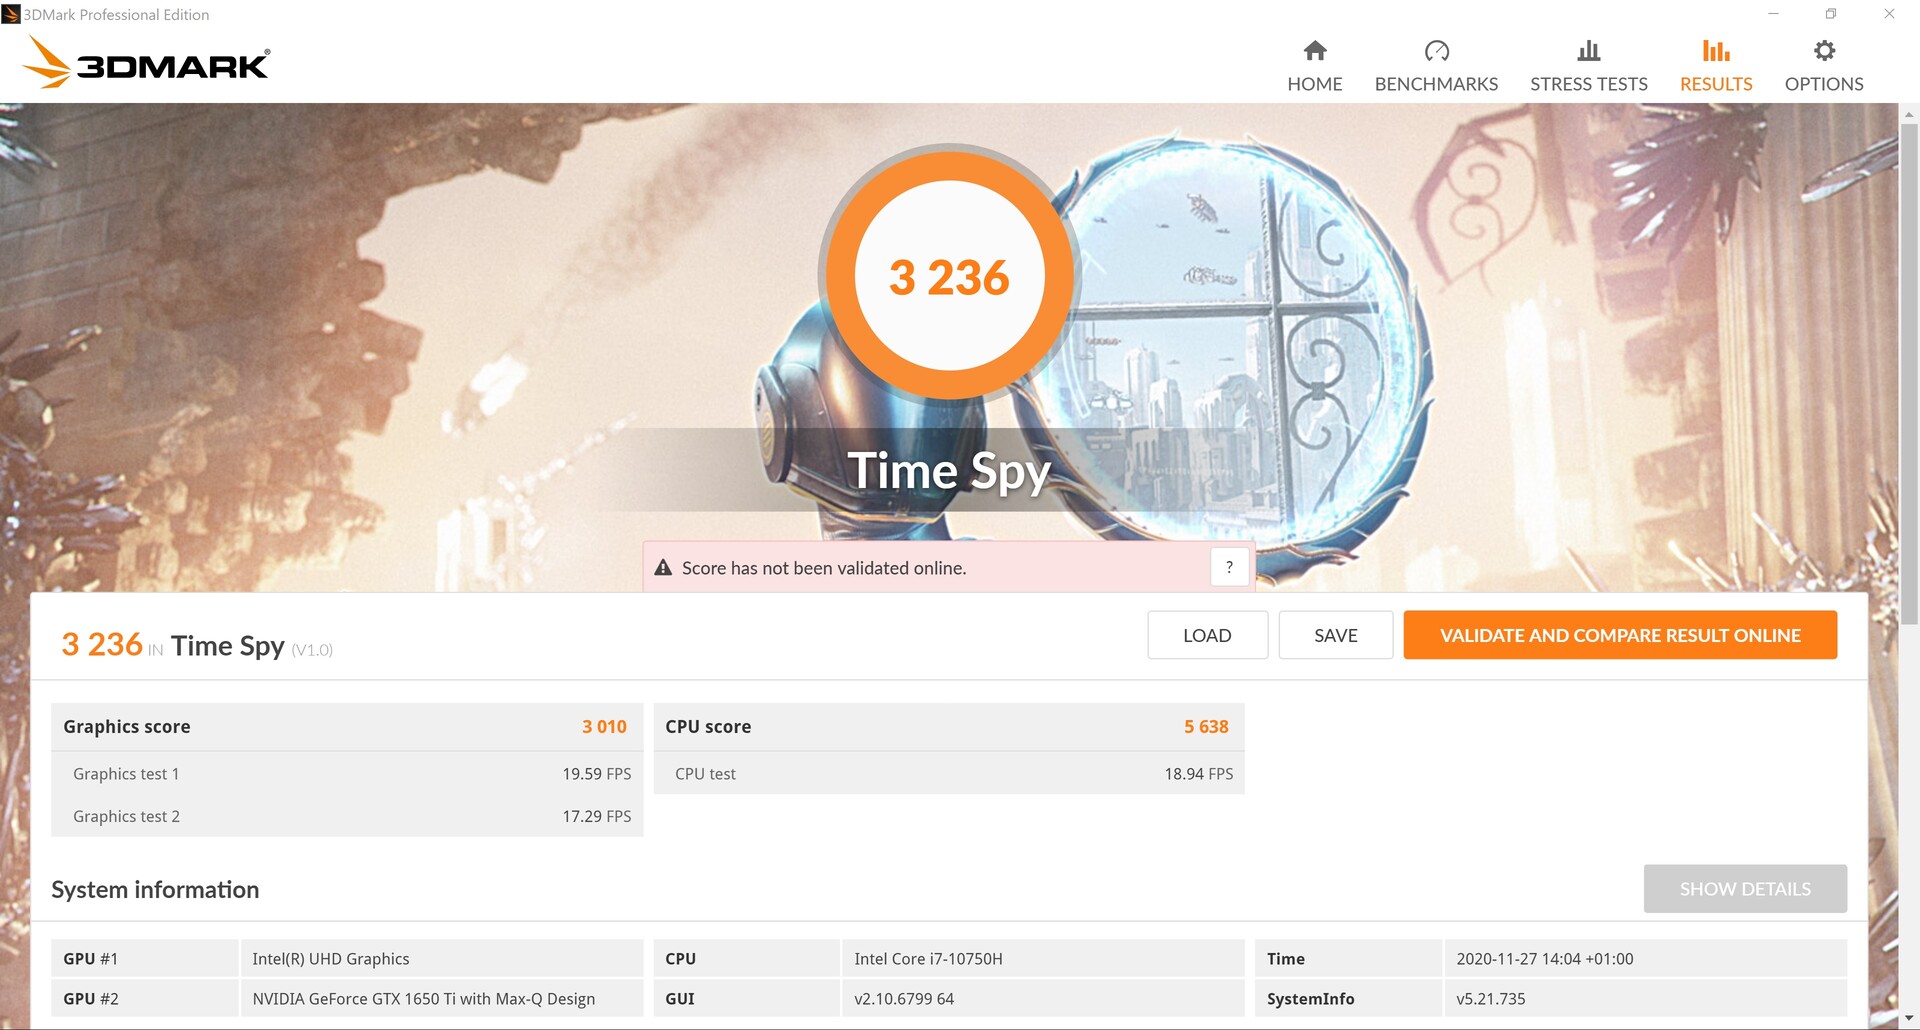


| 3DMark 11 Performance | 10610 points | |
| 3DMark Cloud Gate Standard Score | 18333 points | |
| 3DMark Fire Strike Score | 7432 points | |
| 3DMark Time Spy Score | 3236 points | |
Help | ||
Gaming performance
Even though the GTX 1650 Ti Max-Q is more of an entry-level card for gaming, most titles can be played at Full HD and often even at high details. But the GPU is overwhelmed by the ZenBook's native 4K resolution.
All in all, the GPU also performs at the expected level, but most competitors without a Max-Q design are about 20 to 25% faster, which can be a big advantage. The predecessor is about 20 to 30% slower with its GTX 1050 Ti.
| Rise of the Tomb Raider | |
| 1024x768 Lowest Preset | |
| Asus ZenBook UX535-M01440 | |
| Lenovo ThinkPad X1 Extreme 2019 20QV000WGE | |
| Average NVIDIA GeForce GTX 1650 Ti Max-Q (89.7 - 163.4, n=2) | |
| 1366x768 Medium Preset AF:2x | |
| Asus ZenBook UX535-M01440 | |
| Lenovo ThinkPad X1 Extreme 2019 20QV000WGE | |
| Average NVIDIA GeForce GTX 1650 Ti Max-Q (84.7 - 107.4, n=2) | |
| Asus ZenBook Pro 15 UX580GE | |
| 1920x1080 High Preset AA:FX AF:4x | |
| Asus ZenBook UX535-M01440 | |
| Average NVIDIA GeForce GTX 1650 Ti Max-Q (58.1 - 60.5, n=2) | |
| Lenovo ThinkPad X1 Extreme 2019 20QV000WGE | |
| Asus ZenBook Pro 15 UX580GE | |
| 1920x1080 Very High Preset AA:FX AF:16x | |
| Average NVIDIA GeForce GTX 1650 Ti Max-Q (48.9 - 49.1, n=2) | |
| Asus ZenBook UX535-M01440 | |
| Lenovo ThinkPad X1 Extreme 2019 20QV000WGE | |
| Asus ZenBook Pro 15 UX580GE | |
Unlike in the Cinebench loop, our one-hour The Witcher 3 loop shows very constant frame rates.
| low | med. | high | ultra | 4K | |
| The Witcher 3 (2015) | 167.9 | 100.3 | 55 | 30.7 | 16.8 |
| Dota 2 Reborn (2015) | 144 | 127 | 112 | 106 | |
| Rise of the Tomb Raider (2016) | 163.4 | 107.4 | 60.5 | 48.9 | 19.9 |
| X-Plane 11.11 (2018) | 86.6 | 79.4 | 67.5 | ||
| Shadow of the Tomb Raider (2018) | 115 | 55 | 46 | 40 | 15 |
Emissions - Cool ZenBook Pro 15 UX535
Noise emissions
In idle usage, the fans are mostly at rest. They then turn up to an audible maximum of 42 dB(A) under load. The sibling model and the Lenovo laptop remain quieter here, but the devices from Dell and Acer as well as the predecessor are louder. Overall, the UX535 places itself in the middle in terms of volume.
Noise Level
| Idle |
| 24.6 / 24.6 / 24.6 dB(A) |
| Load |
| 41.3 / 41.4 dB(A) |
 | ||
30 dB silent 40 dB(A) audible 50 dB(A) loud |
||
min: | ||
| Asus ZenBook UX535-M01440 GeForce GTX 1650 Ti Max-Q, i7-10750H, WDC PC SN730 SDBPNTY-1T00 | Asus ZenBook 15 UX534FTC-A8190T GeForce GTX 1650 Max-Q, i7-10510U, Samsung SSD PM981 MZVLB1T0HALR | Dell XPS 15 9500 Core i7 4K UHD GeForce GTX 1650 Ti Mobile, i7-10875H, SK Hynix PC611 512GB | Lenovo ThinkPad X1 Extreme 2019 20QV000WGE GeForce GTX 1650 Mobile, i7-9750H, Samsung SSD PM981 MZVLB512HAJQ | Acer Nitro 5 AN515-44-R5FT GeForce GTX 1650 Ti Mobile, R5 4600H, SK Hynix BC511 HFM512GDJTNI | Asus ZenBook Pro 15 UX580GE GeForce GTX 1050 Ti Mobile, i9-8950HK, Samsung SSD PM961 1TB M.2 PCIe 3.0 x4 NVMe (MZVLW1T0) | |
|---|---|---|---|---|---|---|
| Noise | -8% | -12% | -4% | -22% | -13% | |
| off / environment * | 24.6 | 30.3 -23% | 28.4 -15% | 28.5 -16% | 30 -22% | 28 -14% |
| Idle Minimum * | 24.6 | 30.3 -23% | 28.4 -15% | 28.5 -16% | 30 -22% | 28.6 -16% |
| Idle Average * | 24.6 | 30.3 -23% | 28.4 -15% | 28.5 -16% | 32 -30% | 29.9 -22% |
| Idle Maximum * | 24.6 | 30.9 -26% | 28.4 -15% | 28.5 -16% | 34 -38% | 30.5 -24% |
| Load Average * | 41.3 | 31.3 24% | 46 -11% | 36.3 12% | 46 -11% | 42.5 -3% |
| Witcher 3 ultra * | 42 | 38.1 9% | 42 -0% | 36.3 14% | 47 -12% | 44.8 -7% |
| Load Maximum * | 41.4 | 38.2 8% | 47.1 -14% | 36.3 12% | 49 -18% | 44.8 -8% |
* ... smaller is better
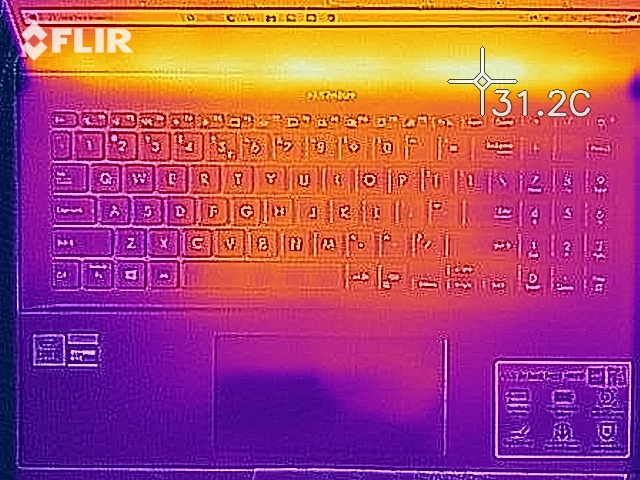
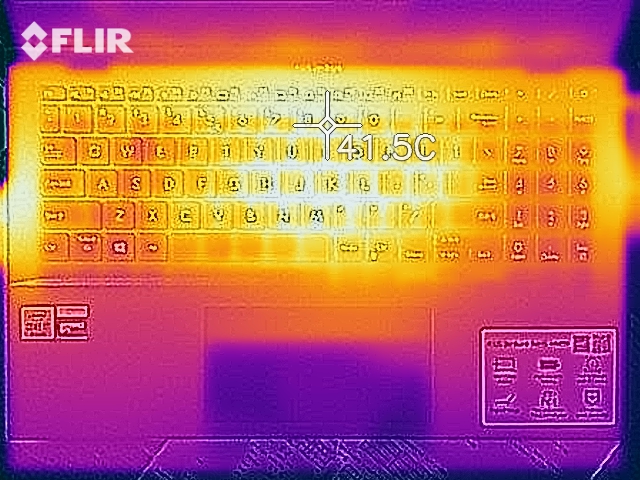
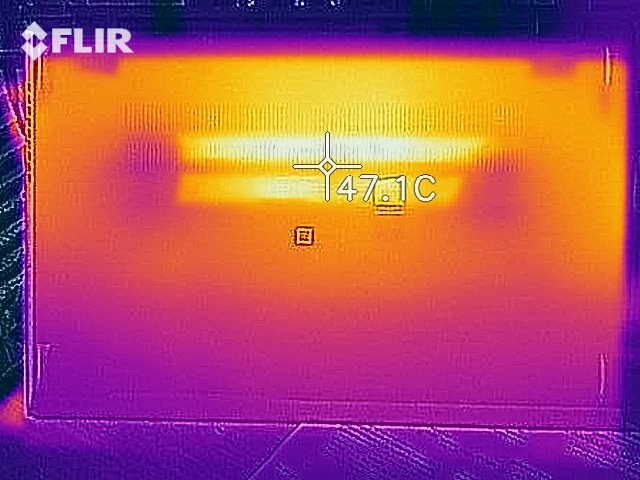
Temperature
Everything remains cool in idle usage, and the same applies to the palm rests in every situation, even under stress. A maximum of 44 °C (~111 °F) is reached under heavy load, and the heat hotspot is located on the bottom side in the center towards the display. This is also a pretty good value in view of the surrounding cooler temperatures; except for the sibling model, all competitors get hotter under load and sometimes in a significant way.
(+) The maximum temperature on the upper side is 37.8 °C / 100 F, compared to the average of 36.9 °C / 98 F, ranging from 21.1 to 71 °C for the class Multimedia.
(±) The bottom heats up to a maximum of 44.2 °C / 112 F, compared to the average of 39.1 °C / 102 F
(+) In idle usage, the average temperature for the upper side is 25.8 °C / 78 F, compared to the device average of 31.2 °C / 88 F.
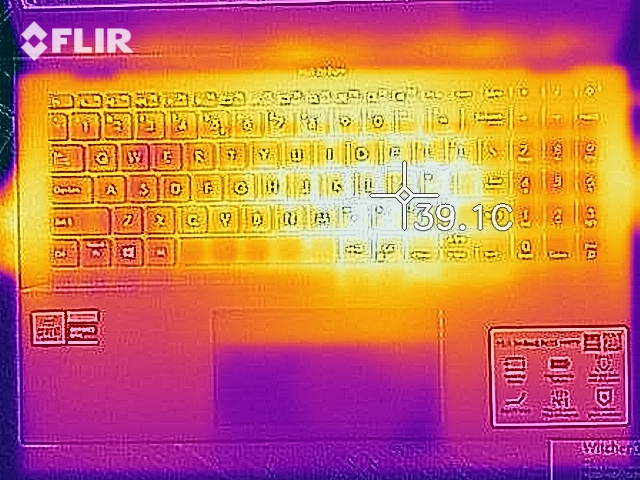
(+) Playing The Witcher 3, the average temperature for the upper side is 31.7 °C / 89 F, compared to the device average of 31.2 °C / 88 F.
(+) The palmrests and touchpad are cooler than skin temperature with a maximum of 29.6 °C / 85.3 F and are therefore cool to the touch.
(±) The average temperature of the palmrest area of similar devices was 28.8 °C / 83.8 F (-0.8 °C / -1.5 F).
| Asus ZenBook UX535-M01440 GeForce GTX 1650 Ti Max-Q, i7-10750H, WDC PC SN730 SDBPNTY-1T00 | Asus ZenBook 15 UX534FTC-A8190T GeForce GTX 1650 Max-Q, i7-10510U, Samsung SSD PM981 MZVLB1T0HALR | Dell XPS 15 9500 Core i7 4K UHD GeForce GTX 1650 Ti Mobile, i7-10875H, SK Hynix PC611 512GB | Lenovo ThinkPad X1 Extreme 2019 20QV000WGE GeForce GTX 1650 Mobile, i7-9750H, Samsung SSD PM981 MZVLB512HAJQ | Acer Nitro 5 AN515-44-R5FT GeForce GTX 1650 Ti Mobile, R5 4600H, SK Hynix BC511 HFM512GDJTNI | Asus ZenBook Pro 15 UX580GE GeForce GTX 1050 Ti Mobile, i9-8950HK, Samsung SSD PM961 1TB M.2 PCIe 3.0 x4 NVMe (MZVLW1T0) | |
|---|---|---|---|---|---|---|
| Heat | 4% | -15% | -5% | -11% | -18% | |
| Maximum Upper Side * | 37.8 | 41.4 -10% | 44 -16% | 46.8 -24% | 49 -30% | 42.4 -12% |
| Maximum Bottom * | 44.2 | 40.3 9% | 48.8 -10% | 52.4 -19% | 50 -13% | 50.8 -15% |
| Idle Upper Side * | 28.1 | 25.7 9% | 33 -17% | 24.7 12% | 28 -0% | 33 -17% |
| Idle Bottom * | 27.7 | 25.8 7% | 32.4 -17% | 25 10% | 28 -1% | 35.2 -27% |
* ... smaller is better
The six CPU cores start the stress test at 4.2 GHz, which is close to the maximum Turbo clock speed for all cores running at the same time. However, the clock rate drops very early on; after one hour, it's still at 3.4 GHz but not consistently; in fact, performance oscillates between 3 and 3.6 GHz. The temperatures exceed 80 °C (~176 °F) very quickly. Afterwards, the clock rates are lowered. After one hour, the temperature rises to almost 90 °C (~194 °F).
The graphics card's clock speed also drops from the original 1.53 GHz to 960 MHz. This clock rate is by no means constant either, since it often fluctuates between it and a value that's up to 400 MHz higher. The temperature here is still a comfortable 77 °C (~171 °F).
The system recovers quite quickly, and a new 3DMark 11 run revealed no performance loss.


Speakers
The stereo speakers are, as is so often the case, not the greatest. At least the mids are quite well tuned, so that the sound is still alright. But the palm rests vibrate a bit when the volume is loud. However, the highs and naturally the basses in particular are, to put it mildly, improvable. The same applies to the maximum volume. Connecting external audio devices is advisable; the combined audio jack in addition to the HDMI and USB ports are available for this.
Asus ZenBook UX535-M01440 audio analysis
(±) | speaker loudness is average but good (74 dB)
Bass 100 - 315 Hz
(-) | nearly no bass - on average 18.7% lower than median
(±) | linearity of bass is average (13.6% delta to prev. frequency)
Mids 400 - 2000 Hz
(+) | balanced mids - only 1.8% away from median
(+) | mids are linear (4.5% delta to prev. frequency)
Highs 2 - 16 kHz
(±) | higher highs - on average 5.6% higher than median
(±) | linearity of highs is average (7.3% delta to prev. frequency)
Overall 100 - 16.000 Hz
(±) | linearity of overall sound is average (18% difference to median)
Compared to same class
» 47% of all tested devices in this class were better, 9% similar, 44% worse
» The best had a delta of 5%, average was 18%, worst was 45%
Compared to all devices tested
» 32% of all tested devices were better, 8% similar, 60% worse
» The best had a delta of 4%, average was 25%, worst was 134%
Apple MacBook 12 (Early 2016) 1.1 GHz audio analysis
(+) | speakers can play relatively loud (83.6 dB)
Bass 100 - 315 Hz
(±) | reduced bass - on average 11.3% lower than median
(±) | linearity of bass is average (14.2% delta to prev. frequency)
Mids 400 - 2000 Hz
(+) | balanced mids - only 2.4% away from median
(+) | mids are linear (5.5% delta to prev. frequency)
Highs 2 - 16 kHz
(+) | balanced highs - only 2% away from median
(+) | highs are linear (4.5% delta to prev. frequency)
Overall 100 - 16.000 Hz
(+) | overall sound is linear (10.2% difference to median)
Compared to same class
» 5% of all tested devices in this class were better, 2% similar, 93% worse
» The best had a delta of 5%, average was 19%, worst was 53%
Compared to all devices tested
» 3% of all tested devices were better, 1% similar, 96% worse
» The best had a delta of 4%, average was 25%, worst was 134%
Energy management - Large battery, good runtimes
Energy consumption
Compared to the competition with 4K displays, consumption is quite low: The 4K competitors consume about 30% more, but they also don't have a GPU in the more energy-efficient Max-Q design. But especially the ThinkPad X1 Extreme consumes more while gaming but doesn't necessarily perform better. The Full HD counterparts have an advantage when it comes to consumption: The sibling model, also with Max-Q but with a more energy-efficient Full HD display instead of a 4K display, draws around 23% less power from the socket, but it has a weaker processor. The predecessor even consumed more on average but offered less power.
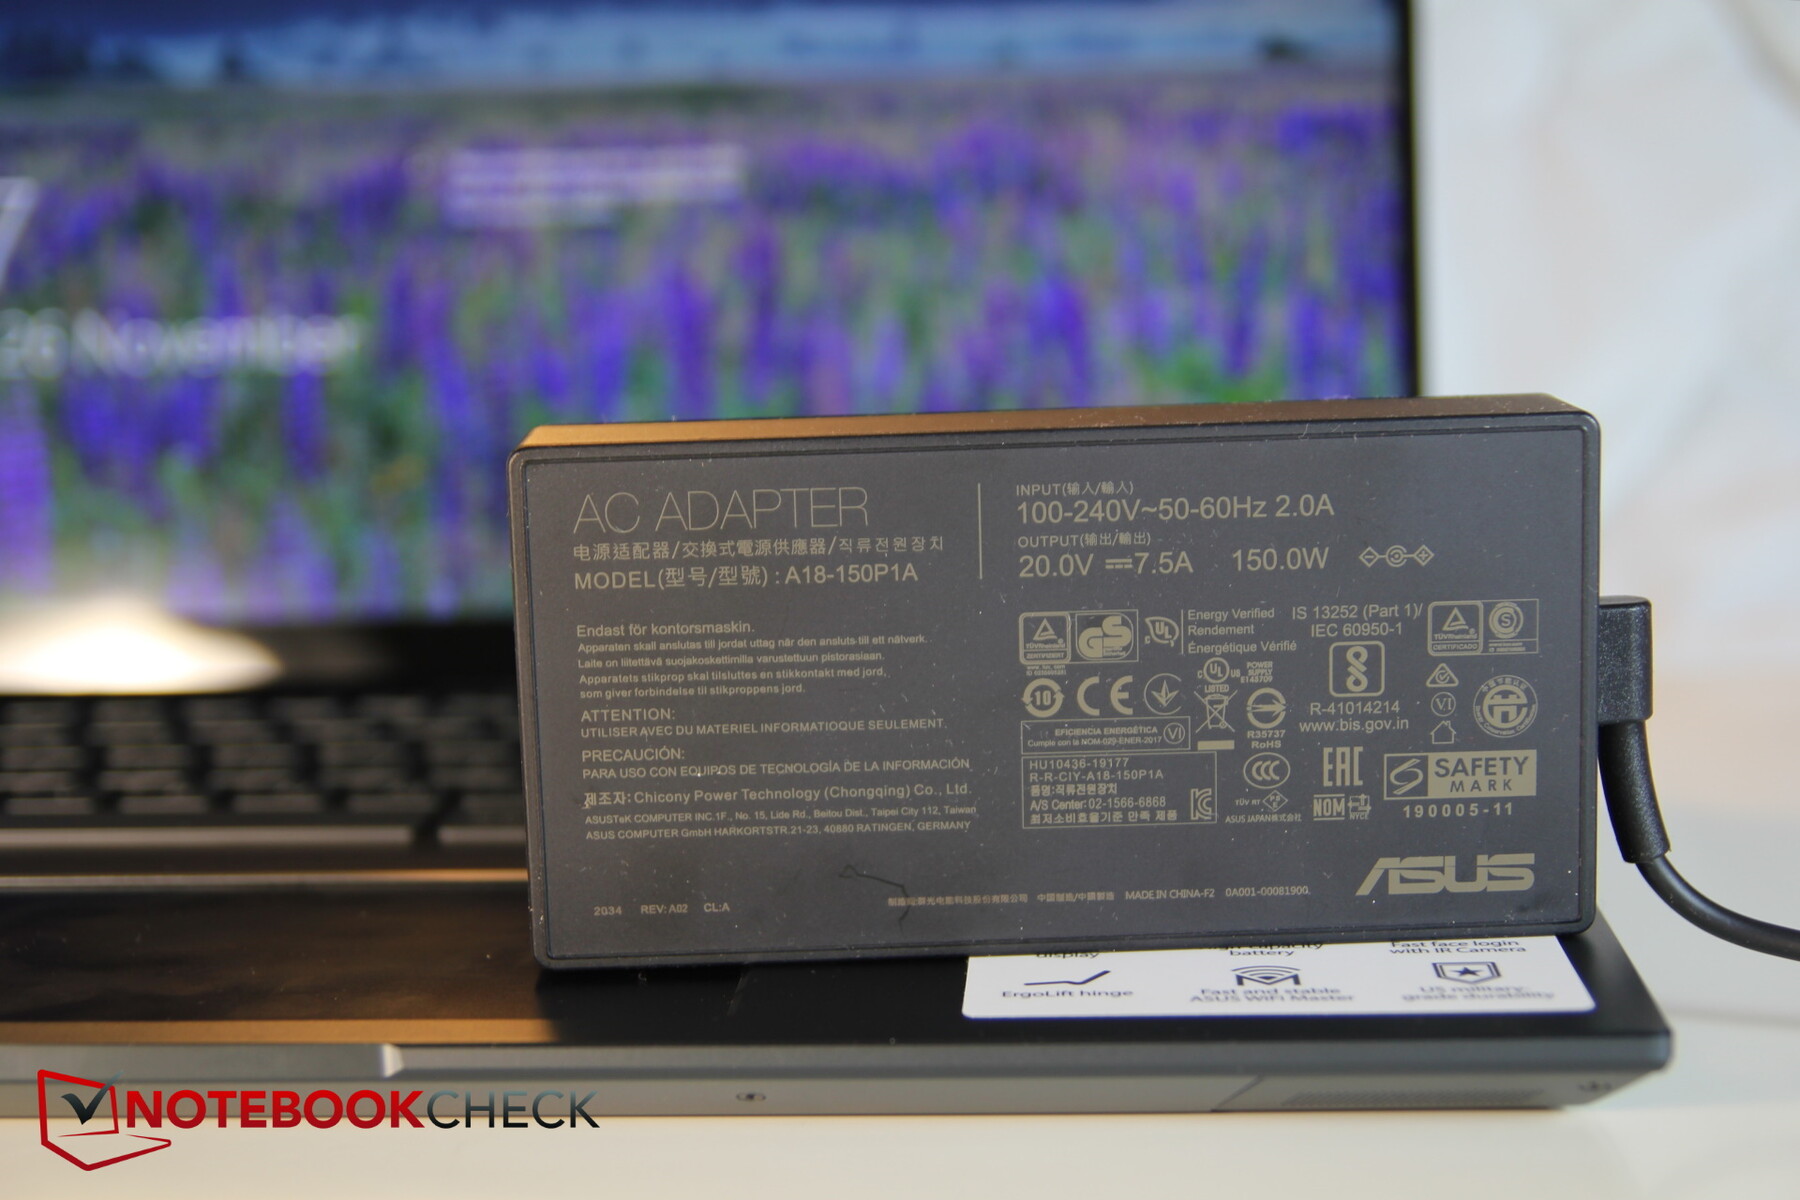
The 150-watt power adapter has a generous capacity and even easily absorbs the temporary load peaks of 123 watts; the laptop consumes about 83 watts under average load.
| Off / Standby | |
| Idle | |
| Load |
|
| Asus ZenBook UX535-M01440 i7-10750H, GeForce GTX 1650 Ti Max-Q, WDC PC SN730 SDBPNTY-1T00, IPS, 3840x2160, 15.60 | Asus ZenBook 15 UX534FTC-A8190T i7-10510U, GeForce GTX 1650 Max-Q, Samsung SSD PM981 MZVLB1T0HALR, IPS, 1920x1080, 15.60 | Dell XPS 15 9500 Core i7 4K UHD i7-10875H, GeForce GTX 1650 Ti Mobile, SK Hynix PC611 512GB, IPS, 3840x2400, 15.60 | Lenovo ThinkPad X1 Extreme 2019 20QV000WGE i7-9750H, GeForce GTX 1650 Mobile, Samsung SSD PM981 MZVLB512HAJQ, IPS, 3840x2160, 15.60 | Acer Nitro 5 AN515-44-R5FT R5 4600H, GeForce GTX 1650 Ti Mobile, SK Hynix BC511 HFM512GDJTNI, IPS, 1920x1080, 15.60 | Asus ZenBook Pro 15 UX580GE i9-8950HK, GeForce GTX 1050 Ti Mobile, Samsung SSD PM961 1TB M.2 PCIe 3.0 x4 NVMe (MZVLW1T0), IPS, 3840x2160, 15.60 | Average NVIDIA GeForce GTX 1650 Ti Max-Q | Average of class Multimedia | |
|---|---|---|---|---|---|---|---|---|
| Power Consumption | 23% | -32% | -39% | 2% | -62% | -18% | -15% | |
| Idle Minimum * | 4.4 | 2.8 36% | 5.7 -30% | 8.5 -93% | 5 -14% | 11.7 -166% | 7.23 ? -64% | 7.27 ? -65% |
| Idle Average * | 9.8 | 7.7 21% | 13.5 -38% | 14.7 -50% | 8 18% | 18.5 -89% | 12.6 ? -29% | 11.7 ? -19% |
| Idle Maximum * | 14.5 | 9.4 35% | 19.6 -35% | 19.4 -34% | 13 10% | 22.8 -57% | 16.3 ? -12% | 14.5 ? -0% |
| Load Average * | 83 | 57 31% | 114.1 -37% | 89.6 -8% | 69 17% | 97.5 -17% | 80.6 ? 3% | 77.3 ? 7% |
| Witcher 3 ultra * | 67 | 62 7% | 93 -39% | 96.1 -43% | 78 -16% | 102.9 -54% | ||
| Load Maximum * | 123 | 116 6% | 135.2 -10% | 129.8 -6% | 124 -1% | 111.1 10% | 107.7 ? 12% | 119.6 ? 3% |
* ... smaller is better
Battery life
The Asus ZenBook has a fairly large battery (96 Wh) and achieves good runtimes as a result; average multimedia laptops last 46% less. Interestingly, the Dell XPS 15 shows a similarly long endurance, although its battery only has 80 Wh, the CPU is nominally a bit better, and the GPU doesn't have a Max-Q design. The sibling model with a 70 Wh battery and weaker hardware lasts 23% longer, but the rest of the competition scores significantly worse. The predecessor is even outperformed by 30%.
Almost 12 hours in the video test and over 10 hours in the WLAN test are overall very good values; the ZenBook lasts almost two hours under full load.
| Asus ZenBook UX535-M01440 i7-10750H, GeForce GTX 1650 Ti Max-Q, 96 Wh | Asus ZenBook 15 UX534FTC-A8190T i7-10510U, GeForce GTX 1650 Max-Q, 71 Wh | Dell XPS 15 9500 Core i7 4K UHD i7-10875H, GeForce GTX 1650 Ti Mobile, 86 Wh | Lenovo ThinkPad X1 Extreme 2019 20QV000WGE i7-9750H, GeForce GTX 1650 Mobile, 80 Wh | Acer Nitro 5 AN515-44-R5FT R5 4600H, GeForce GTX 1650 Ti Mobile, 57.48 Wh | Asus ZenBook Pro 15 UX580GE i9-8950HK, GeForce GTX 1050 Ti Mobile, 71 Wh | Average of class Multimedia | |
|---|---|---|---|---|---|---|---|
| Battery Runtime | 23% | 6% | -50% | -23% | -32% | -10% | |
| Reader / Idle | 1097 | 1629 48% | 1382 26% | 828 -25% | 842 -23% | 933 ? -15% | |
| H.264 | 714 | 714 0% | 284 -60% | 698 ? -2% | |||
| WiFi v1.3 | 608 | 743 22% | 546 -10% | 285 -53% | 520 -14% | 375 -38% | 568 ? -7% |
| Load | 117 | 142 21% | 121 3% | 72 -38% | 82 -30% | 76 -35% | 97.6 ? -17% |
Pros
Cons
Verdict - ScreenPad is a unique feature, Ryzen could be an enhancement

The ZenBook Pro 15 UX535 has a high-quality feel to it and is able to convince with many plus points such as the color-accurate 4K display with its narrow bezels, the good battery life as well as its moderate consumption and its cooling. The ScreenPad integrated into the touchpad is a real eye-catcher and offers useful additional controls for content creators.
Actually, there are no real negative points, but there are certainly things that bother us a bit. The fact that you first have to remove glued rubber feet in order to get to hidden screws for maintenance purposes is one such point. Another somewhat annoying aspect is the significant loss of performance on battery power; this limits the mobility of the target group, which has a quite strong affinity for performance. But especially for this target group, the ZenBook should offer a little more Zen - a Ryzen processor would suit the ZenBook well, and even the lack of performance stability would be a thing of the past then. Asus is wasting potential here.
The Asus ZenBook Pro 15 UX535 is a high-quality manufactured laptop for creative users that convinces with many advantages and only a few minor annoyances. The ScreenPad is a useful feature, and a high-performance Ryzen processor would also benefit the ZenBook.
Asus ZenBook UX535-M01440
-
12/02/2020 v7
Christian Hintze
More articles related to this device
Asus ZenBook UX535-M01440 (ZenBook UX535 Series)Related Articles

Pricecompare

