 Deutsch
 English
 Español
 Français
 Italiano
 Nederlands
 Polski
 Português
 Русский
 Türkçe
 Svenska
 Chinese
 Magyar
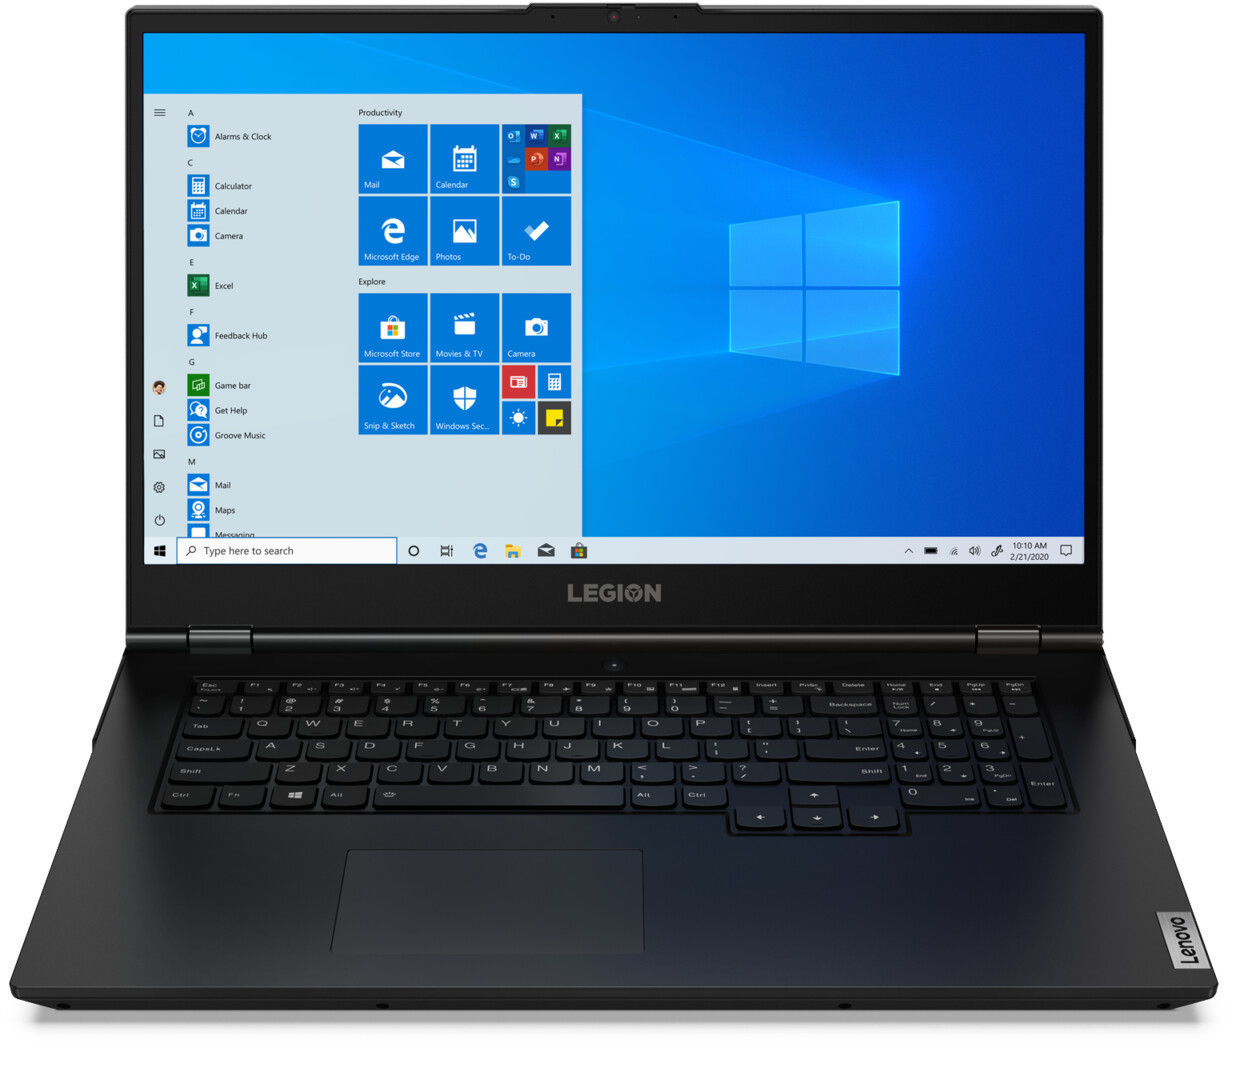
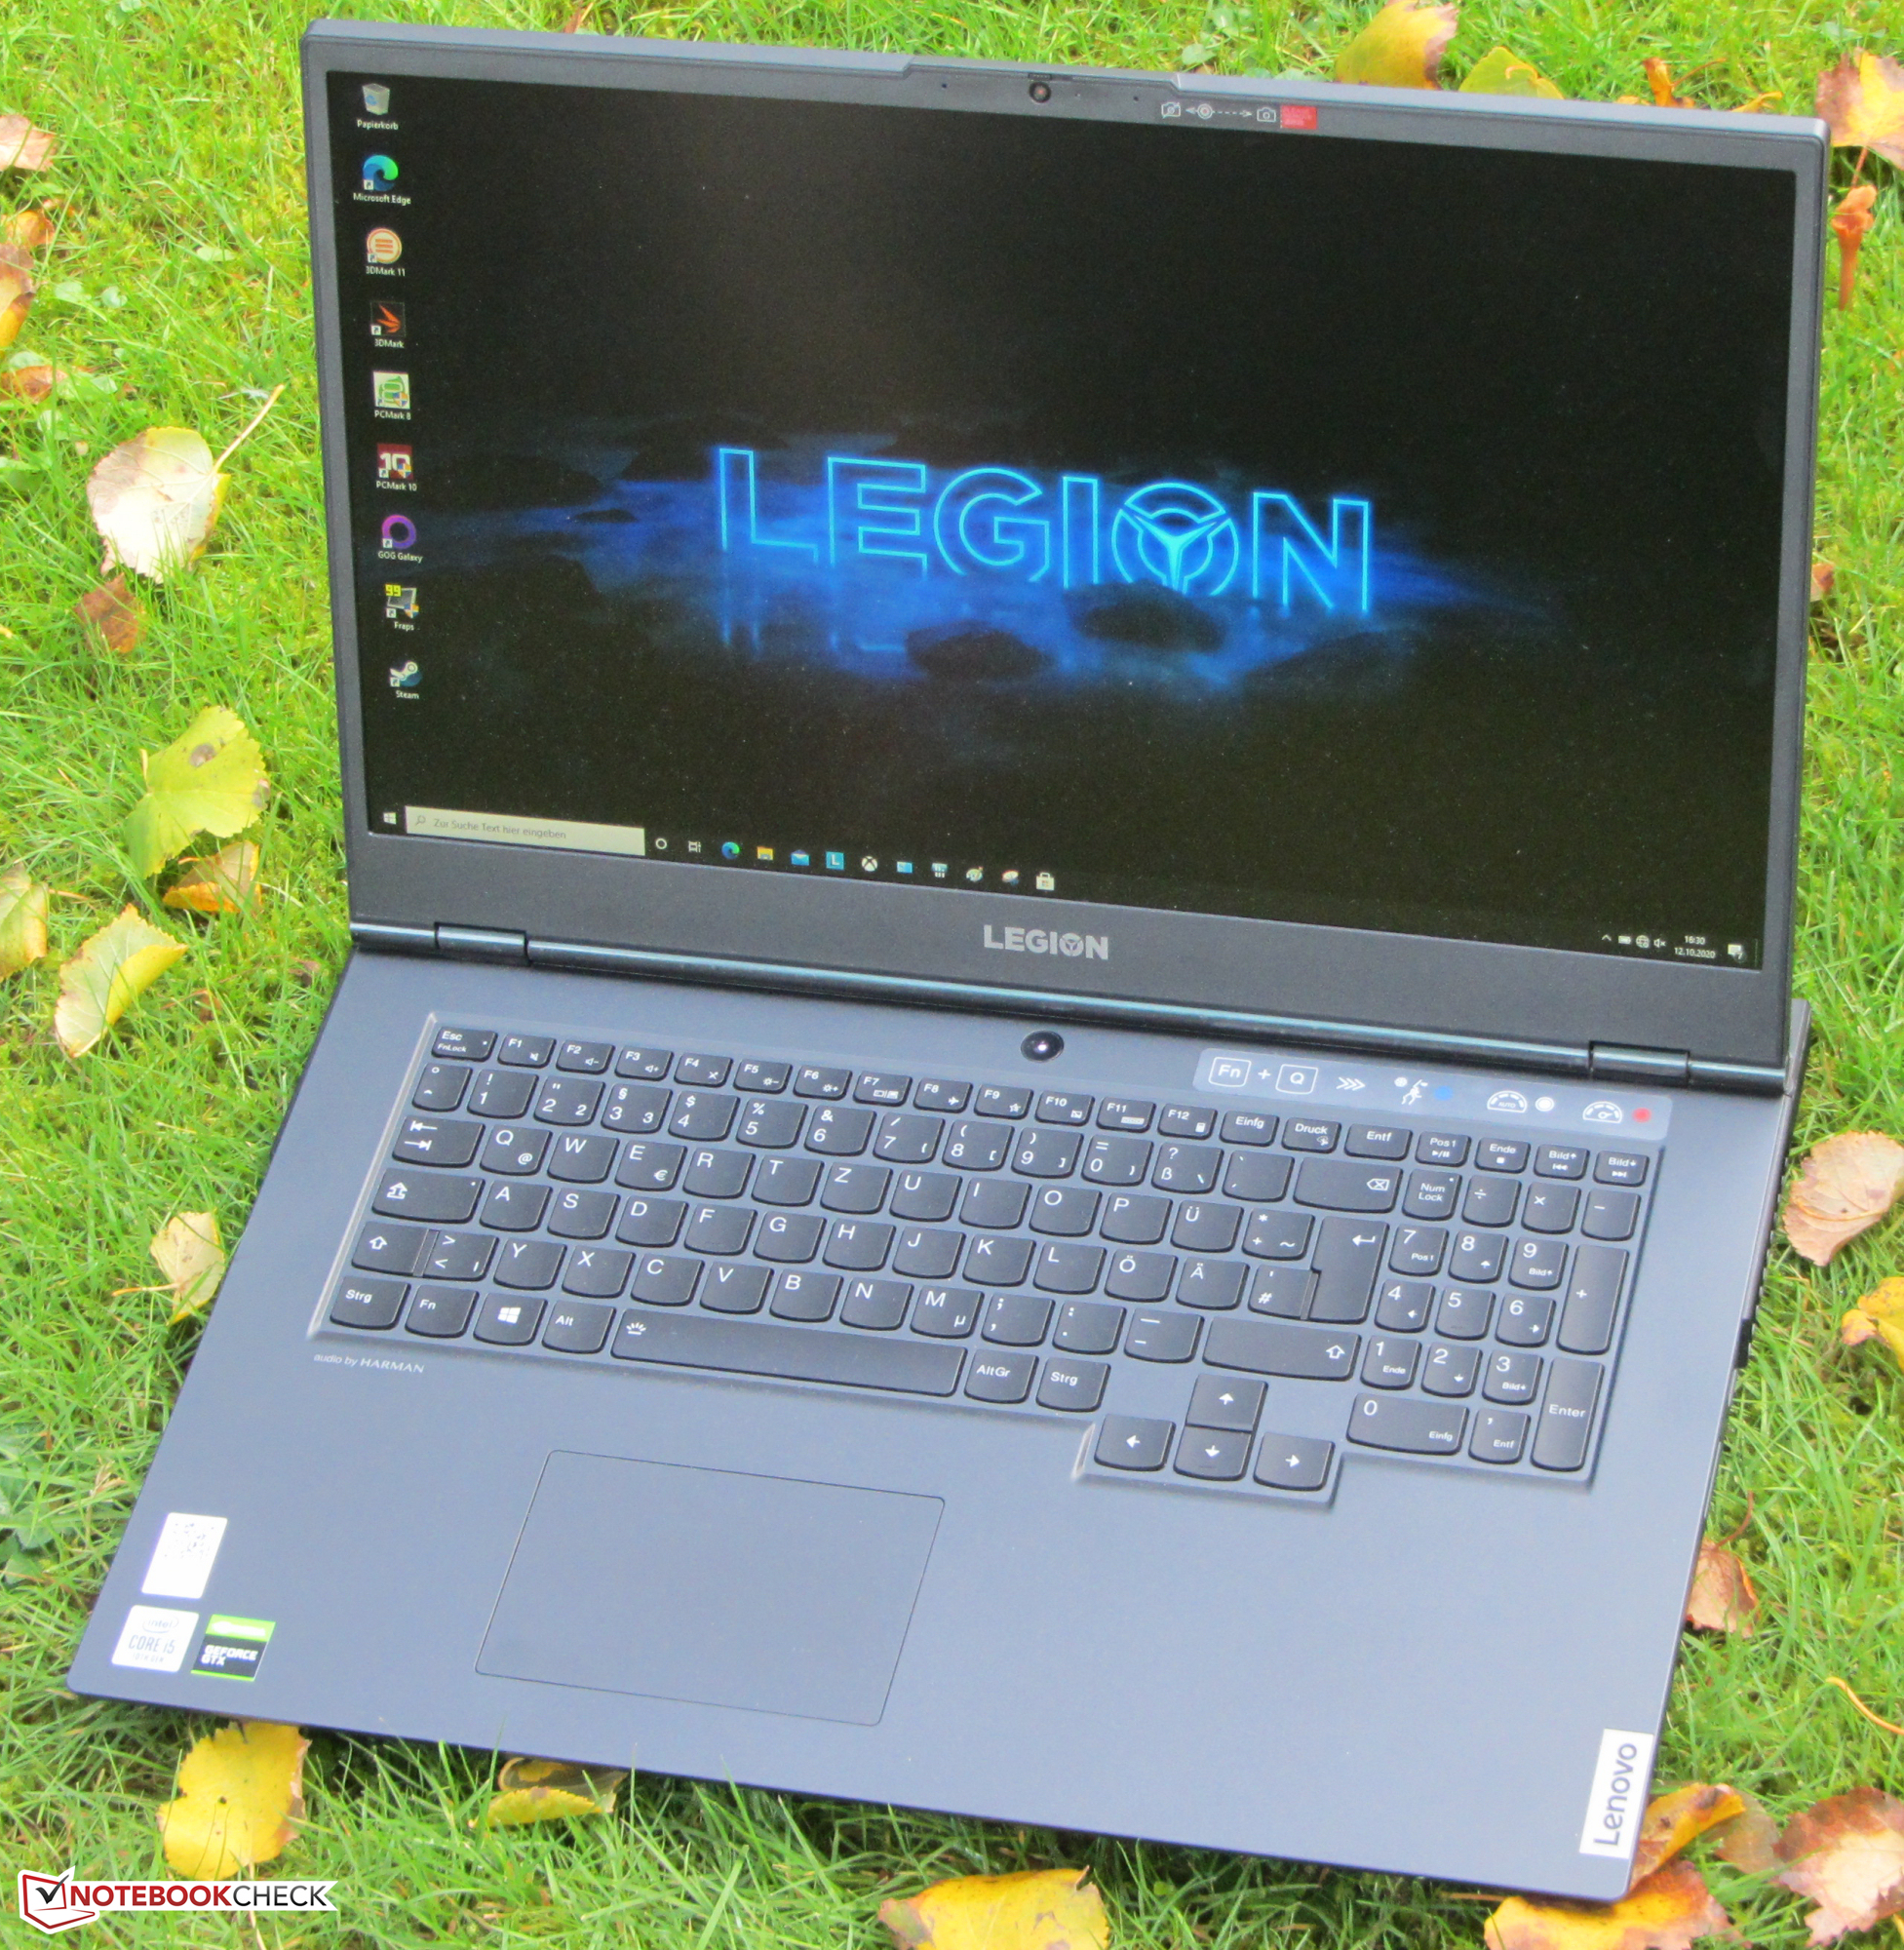
Lenovo Legion 5 17IMH Laptop Review: The battery just won't die

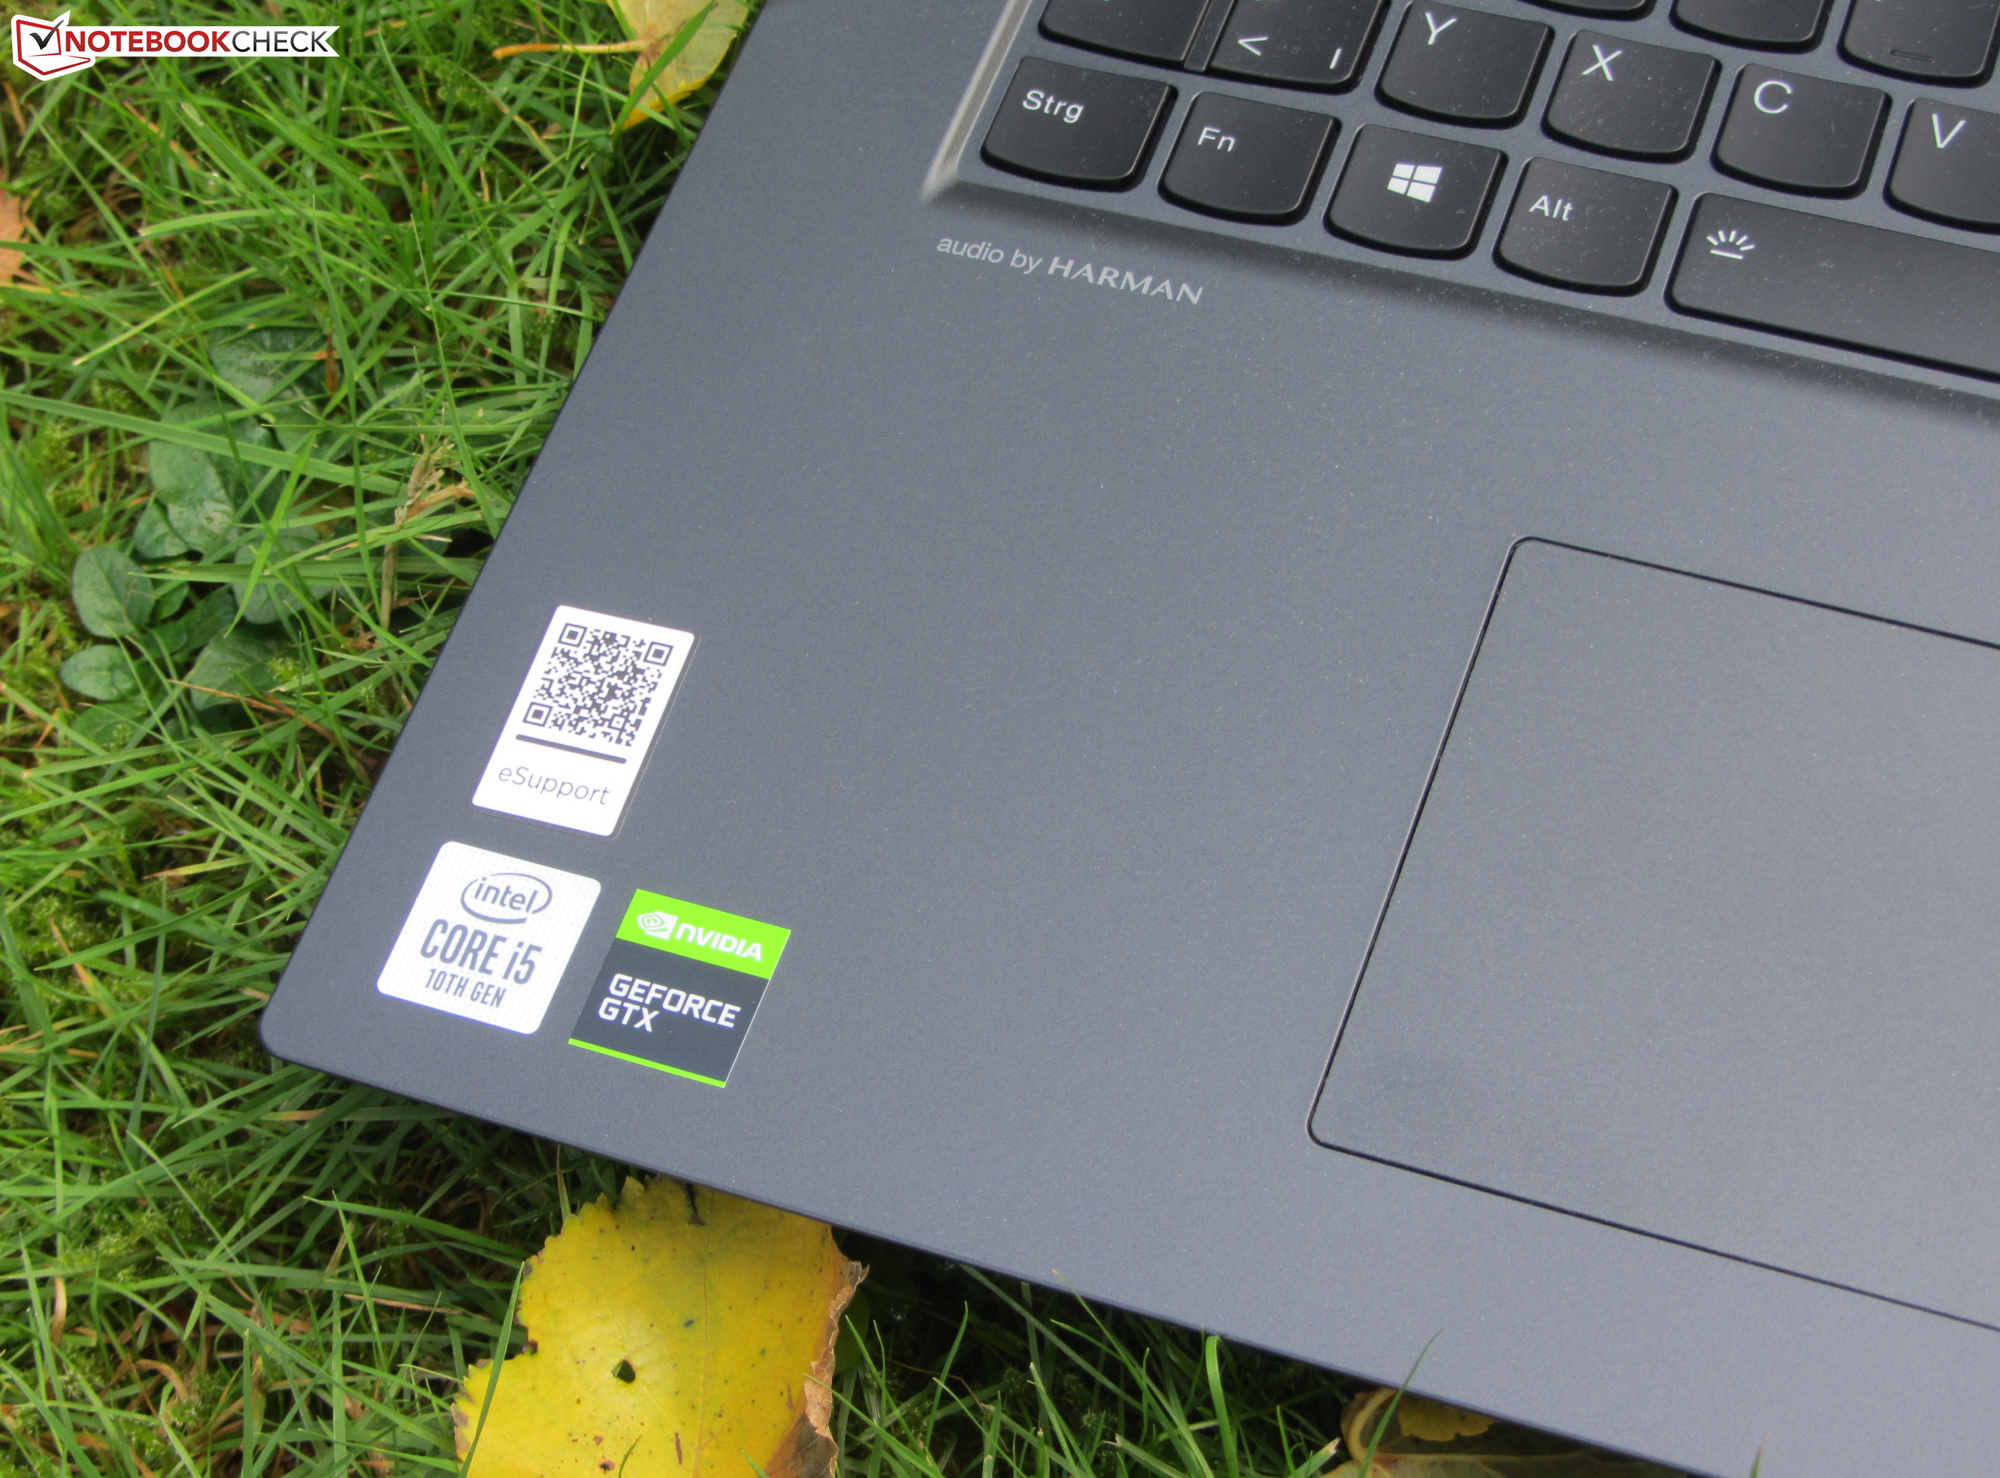
The Lenovo Legion 5 17IMH05 (Legion 5i) is one of the gaming notebooks in the 17.3-inch format. The equipment configuration that was made available to us represents one of the currently more affordable models of the series. At a price of just below 1000 Euros (~$1172), you get a Core i5-10300H processor and a GeForce GTX-1650 graphics core accompanied by 8 GB of working memory and 512-GB NVMe SSD. Competitors of the notebook include devices such as the MSI GF75 Thin 10SCXR, the Asus TUF A17 FA706IU, and the HP Pavilion Gaming 17.
Rating | Date | Model | Weight | Height | Size | Resolution | Best Price |
|---|---|---|---|---|---|---|---|
| 81.9 % | 10/2020 | Lenovo Legion 5 17IMH05 i5-10300H, GeForce GTX 1650 Mobile | 2.9 kg | 26.2 mm | 17.30" | 1920x1080 | |
| 78.5 % | 04/2020 | MSI GF75 Thin 10SCXR i5-10300H, GeForce GTX 1650 Mobile | 2.2 kg | 23.1 mm | 17.30" | 1920x1080 | |
| 82.9 % | 05/2020 | Asus TUF A17 FA706IU-AS76 R7 4800H, GeForce GTX 1660 Ti Mobile | 2.6 kg | 26 mm | 17.30" | 1920x1080 | |
| 81.6 % | 07/2019 | HP Pavilion Gaming 17-cd0085cl i7-9750H, GeForce GTX 1660 Ti Max-Q | 2.8 kg | 25 mm | 17.30" | 1920x1080 |
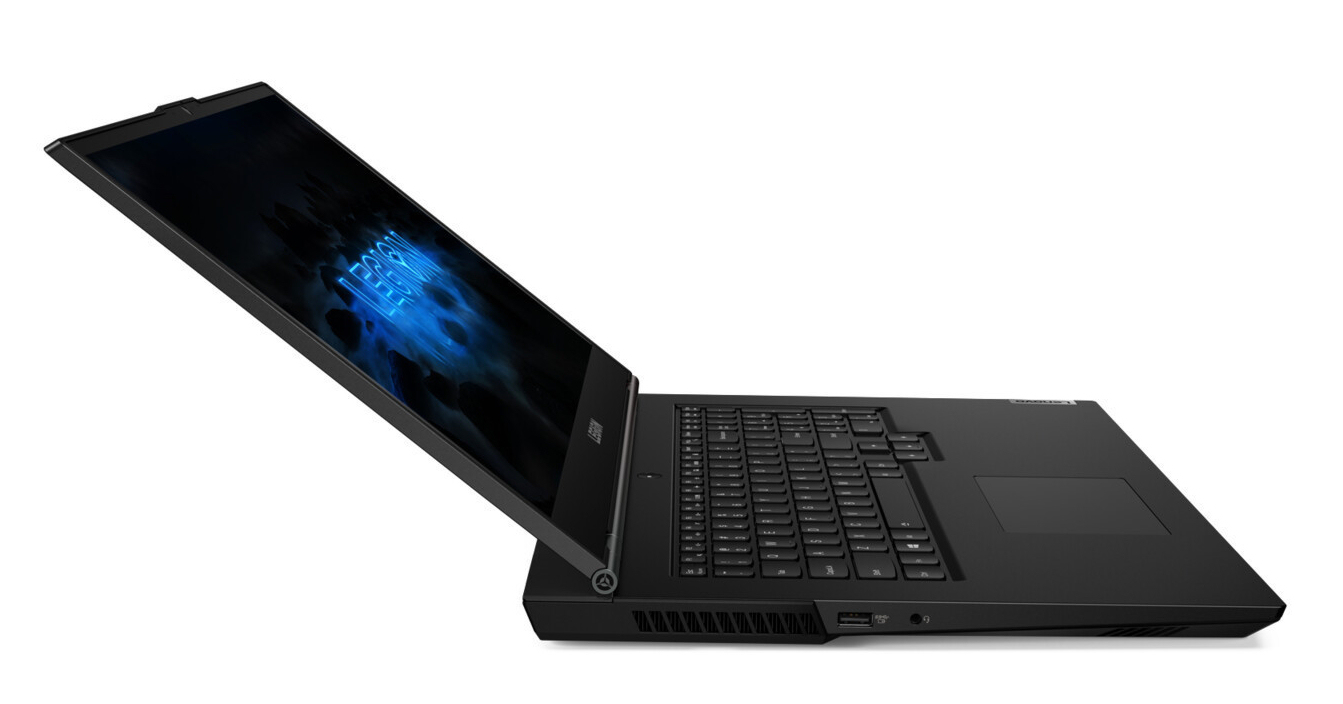
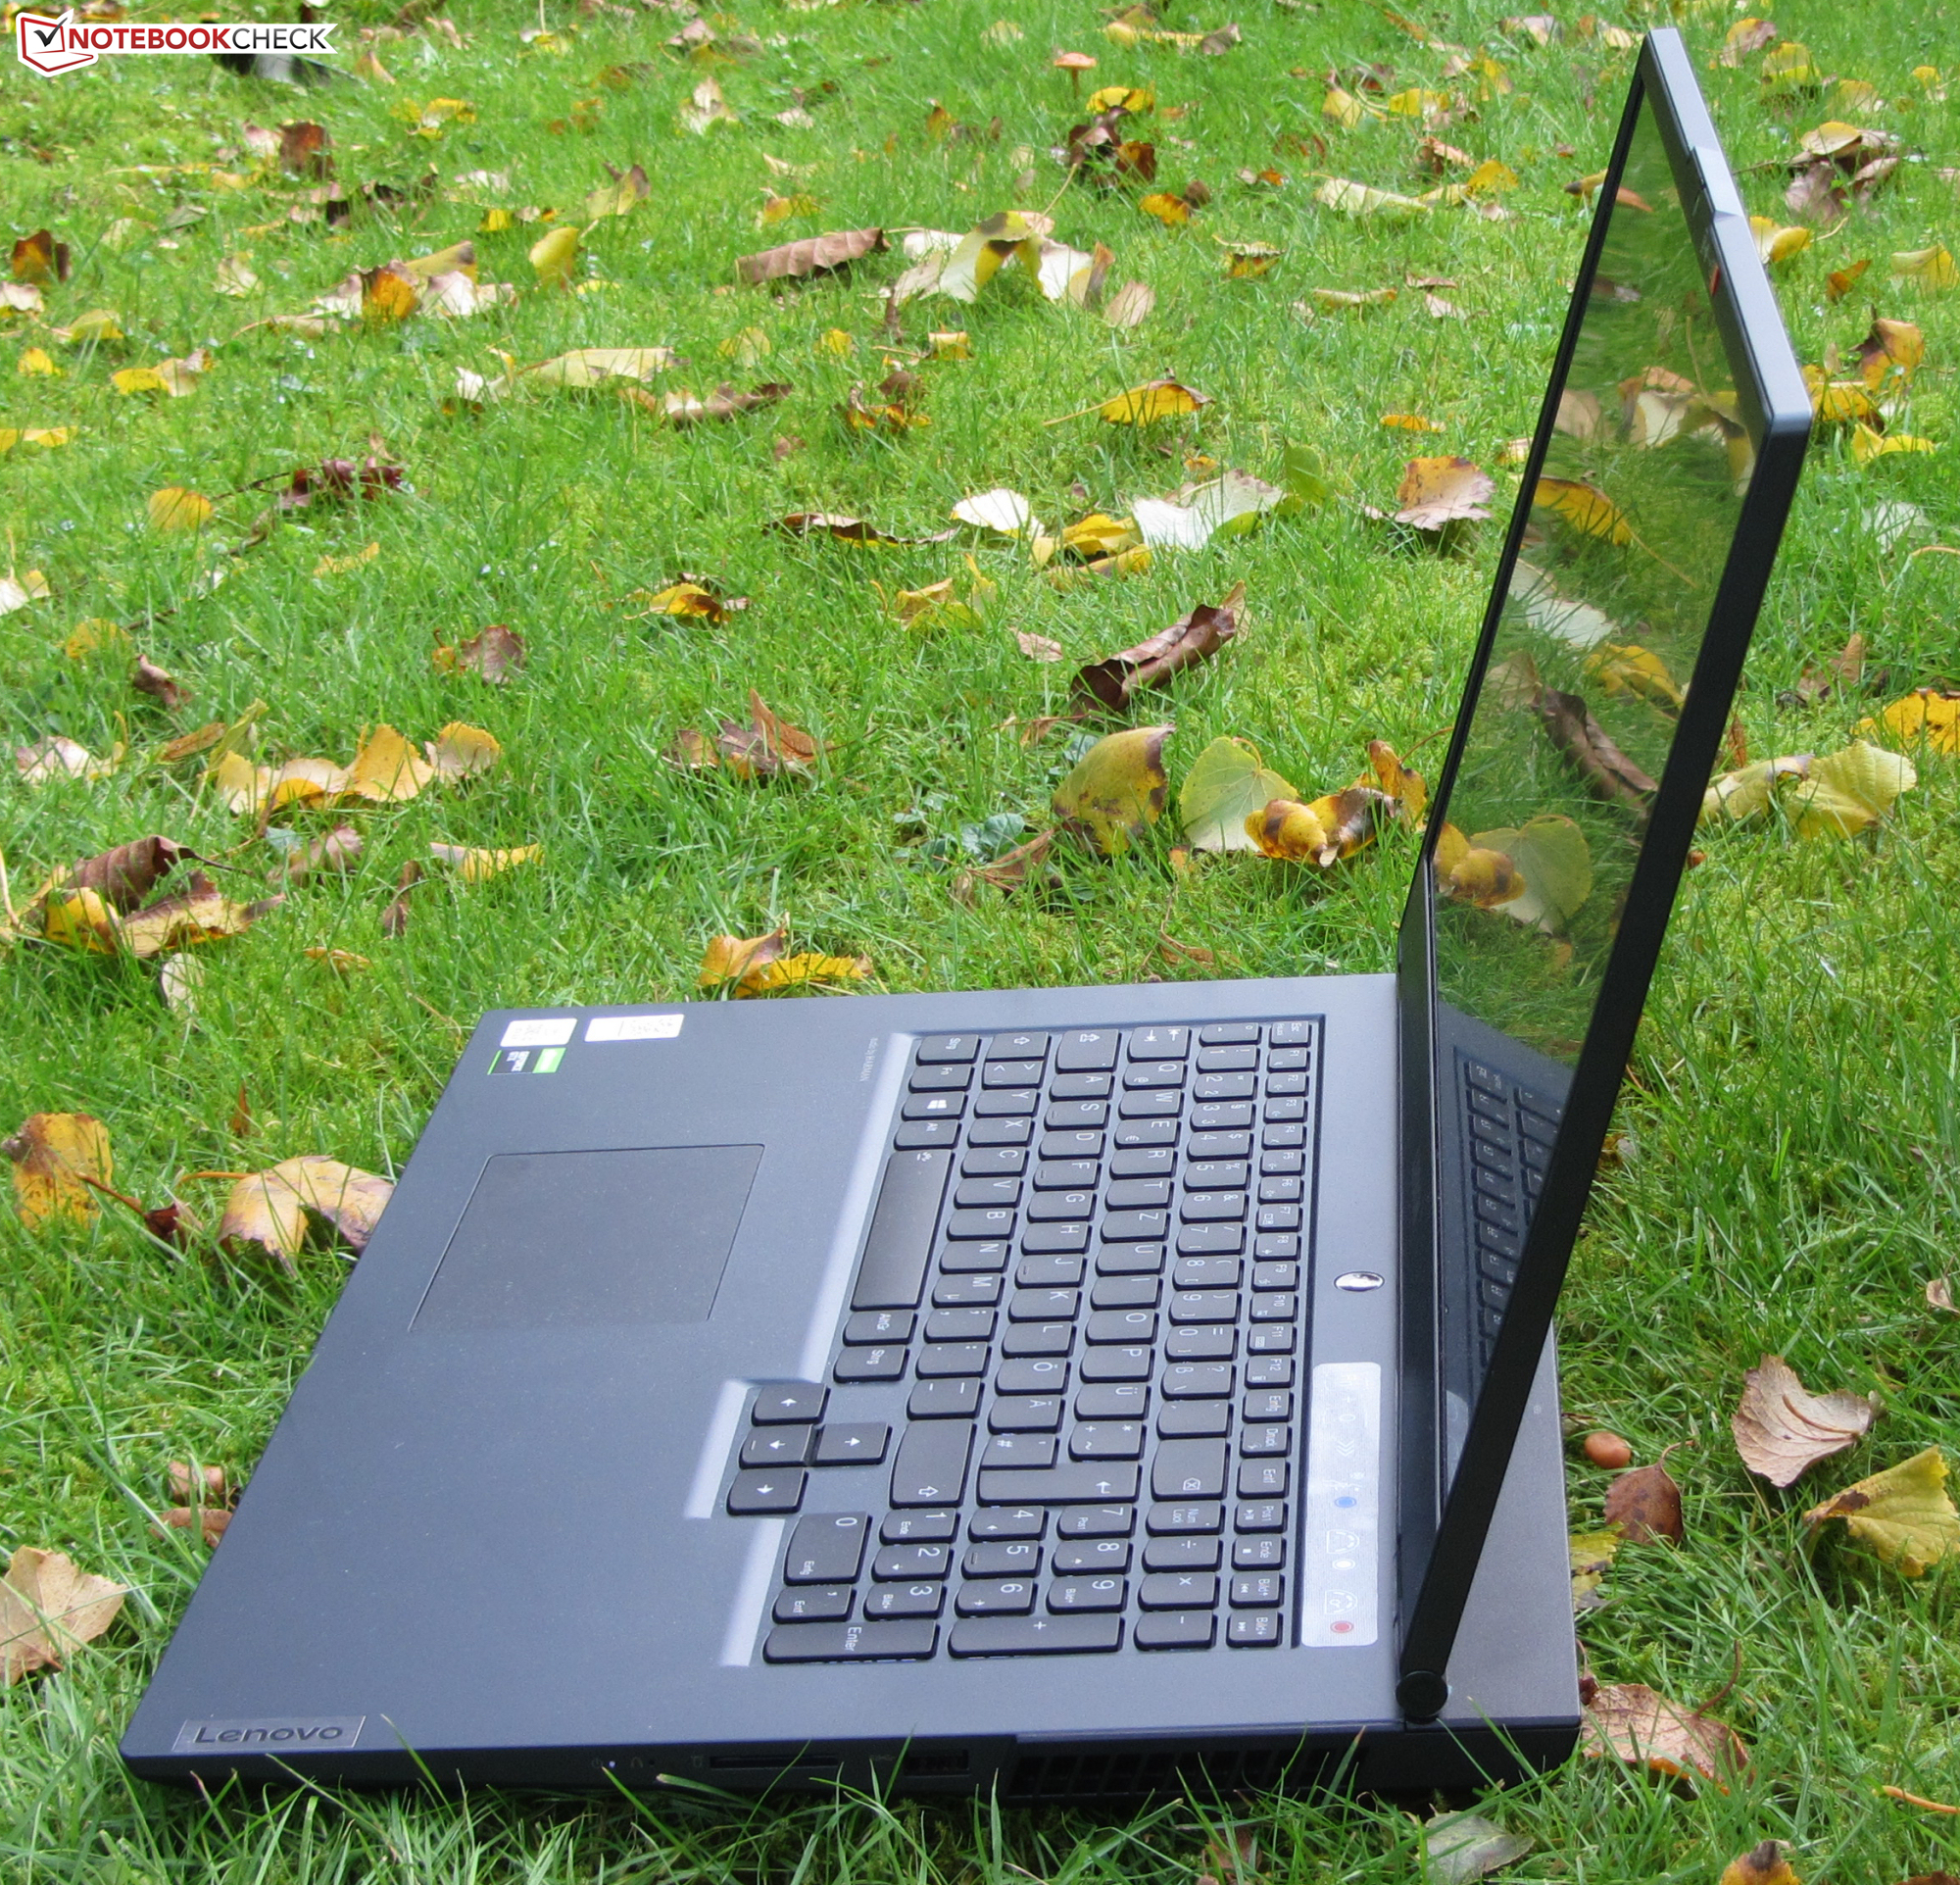
Case - A plastic case for the Legion 5
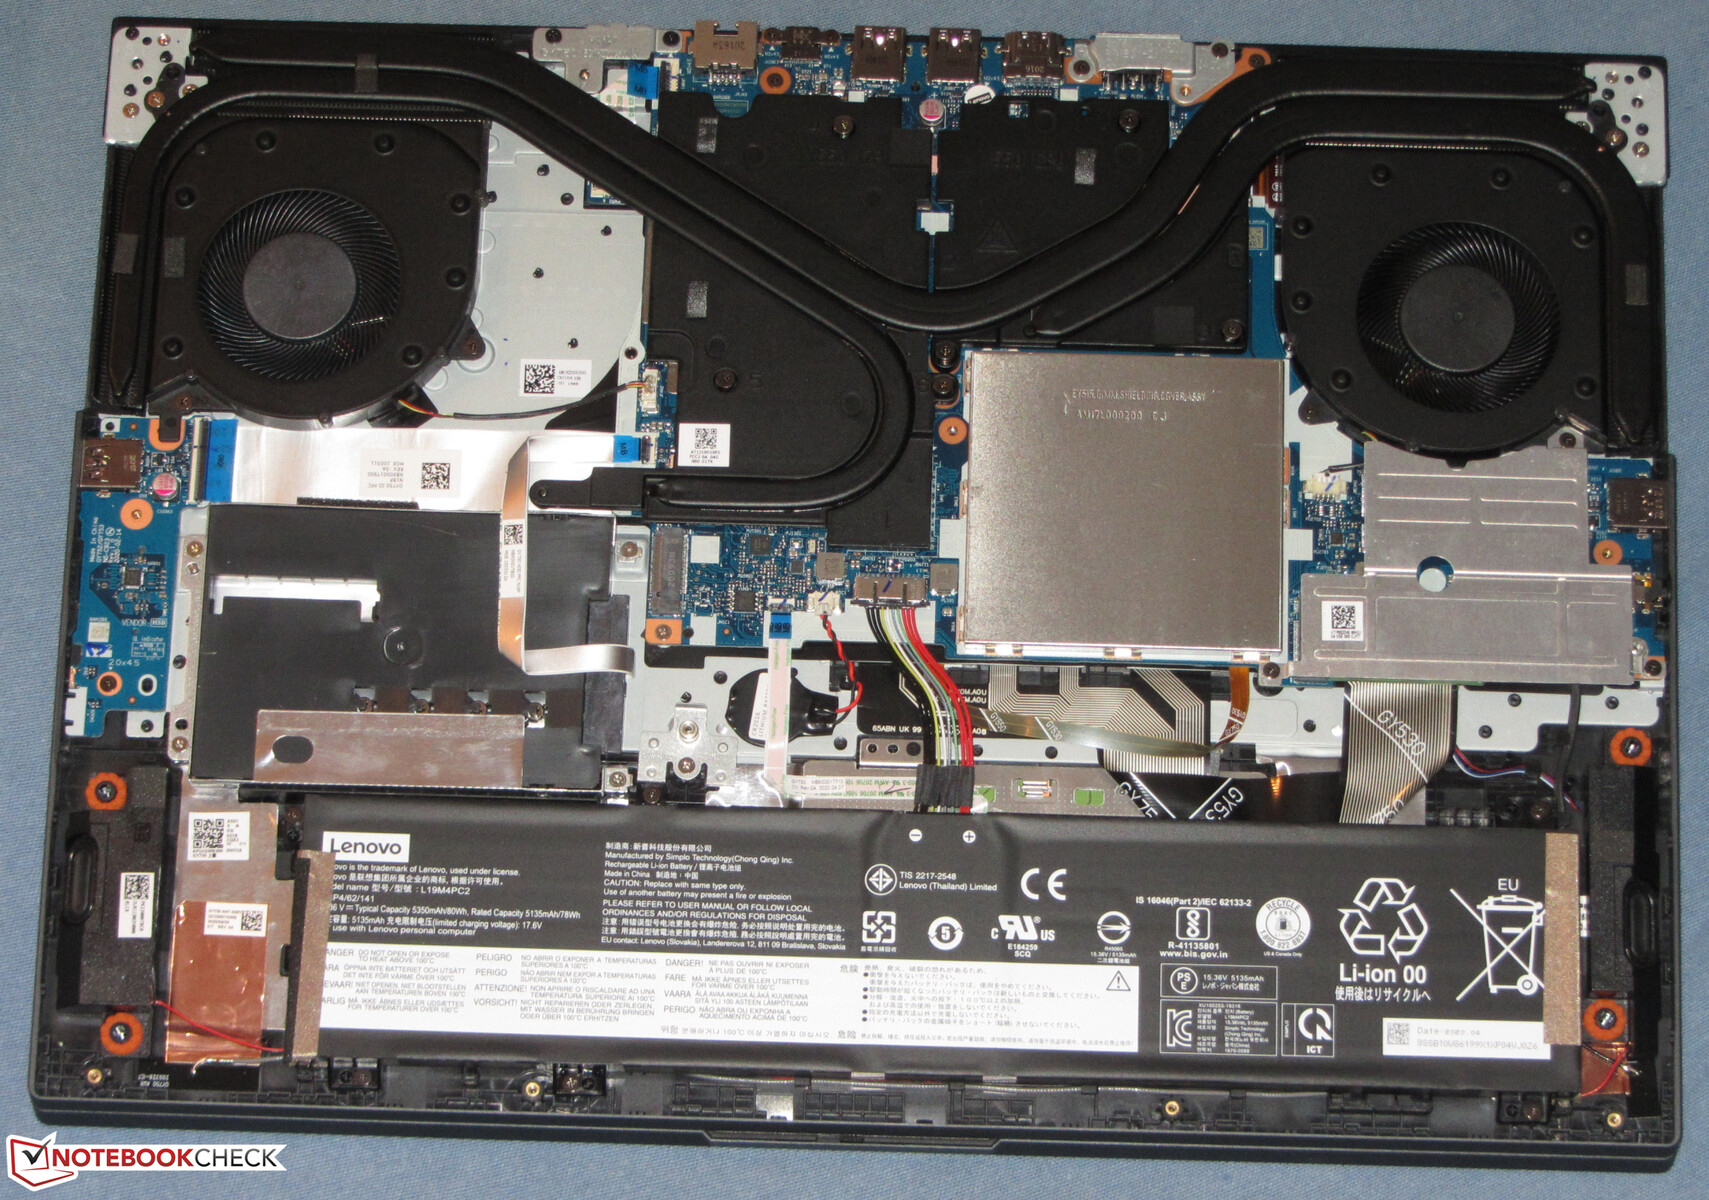
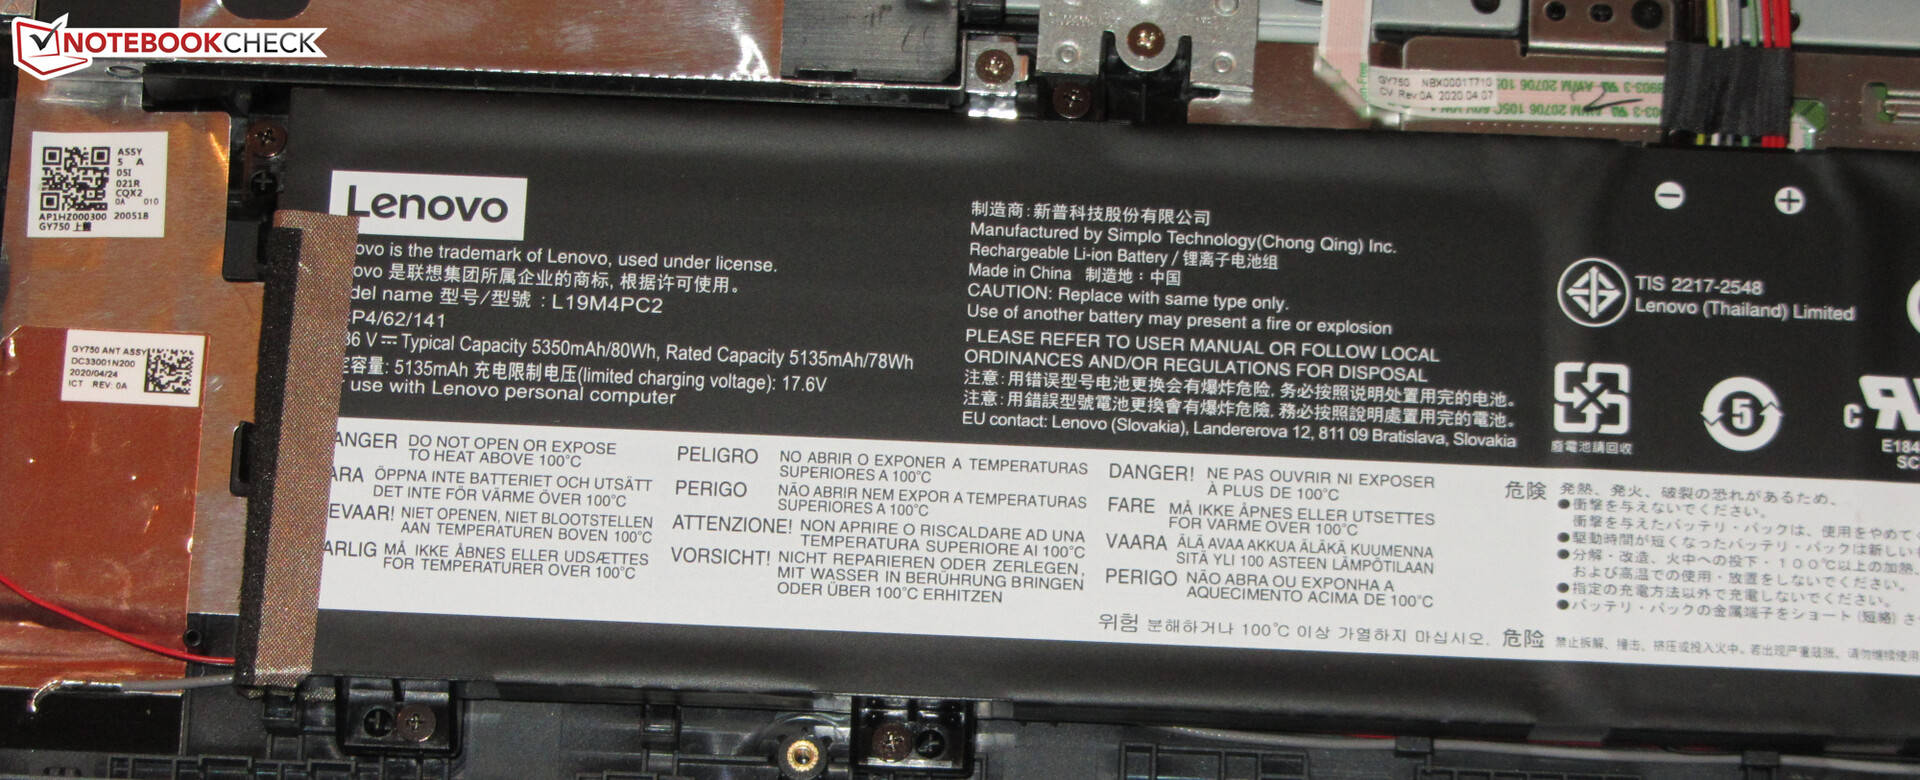
You will look in vain for high-quality case materials in the Legion 5, since Lenovo uses matte-black plastic. The top of the base unit is covered with a rubberized surface. What immediately stands out is the positioning of the lid, which is not flush with the back of the notebook but shifted toward the front by about 25 mm (~1 in). The battery is built in. There is no maintenance flap, so in order to access the insides, you have to remove the bottom of the case.
There is no reason for complaints about the workmanship. The clearances are right and we do not notice any sharp edges. While the base unit can be warped slightly, this remains within limits. The same goes for the lid. Pressure on the back of the lid leads to changes in the display image in some places. The hinges hold the lid tightly in place, with a maximum opening angle of about 170 degrees. It is possible to open the lid with one hand.

The Legion 5i represents the largest and heaviest laptop within our comparison field.
Equipment - The Lenovo Laptop comes without Thunderbolt 3
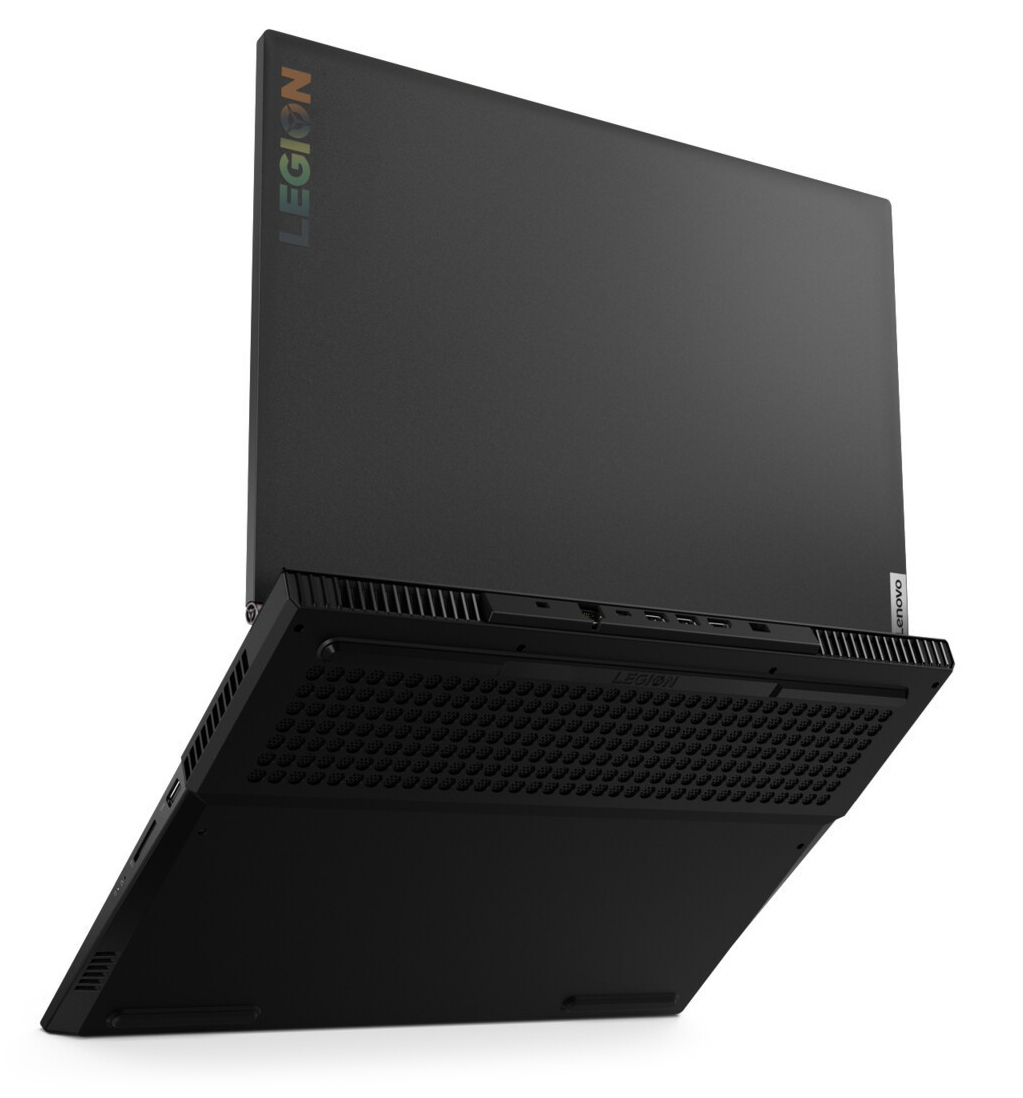
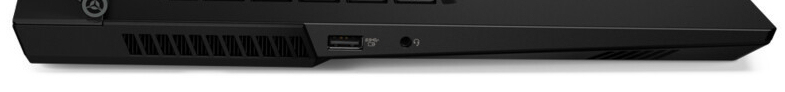
The Lenovo computer offers five USB ports (4x Type-A, 1x Type-C) that all operate in the USB 3.2 Gen-1 standard. The Type-C port also supports the DisplayPort-via-USB-C function (but you need to purchase a separate adapter). So together with the HDMI port, the Legion offers two video connections. In addition, there is a Gigabit Ethernet connection and an audio combo port.


SD Card Reader
In contrast to its 15.6-inch sibling model, our current test unit includes an SD storage card reader. Inserted storage cards stick out by a whole 16 mm (~0.6 in). With transfer rates of 88 MB/s (copying large data blocks) and 80 MB/s (transferring 250 jpg files of about 5 MB each), the reader is among the faster representatives of its kind. We test storage card readers using a reference card (Toshiba Exceria Pro SDXC 64 GB UHS-II).
| SD Card Reader | |
| average JPG Copy Test (av. of 3 runs) | |
| Average of class Gaming (19 - 202, n=100, last 2 years) | |
| Lenovo Legion 5 17IMH05 (Toshiba Exceria Pro SDXC 64 GB UHS-II) | |
| HP Pavilion Gaming 17-cd0085cl (Toshiba Exceria Pro SDXC 64 GB UHS-II) | |
| maximum AS SSD Seq Read Test (1GB) | |
| Average of class Gaming (25.8 - 269, n=94, last 2 years) | |
| Lenovo Legion 5 17IMH05 (Toshiba Exceria Pro SDXC 64 GB UHS-II) | |
| HP Pavilion Gaming 17-cd0085cl (Toshiba Exceria Pro SDXC 64 GB UHS-II) | |
Communication
The Intel WLAN chip (AX201) supports the 802.11a/b/g/n/ac/ax standards. The transfer rates measured under optimal conditions (no other WLAN devices in close proximity, close distance between notebook and server PC) turn out excellent. Wired network connections are handled by a representative of Realtek's familiar RTL8168/8111 family, which does its job without any complications.
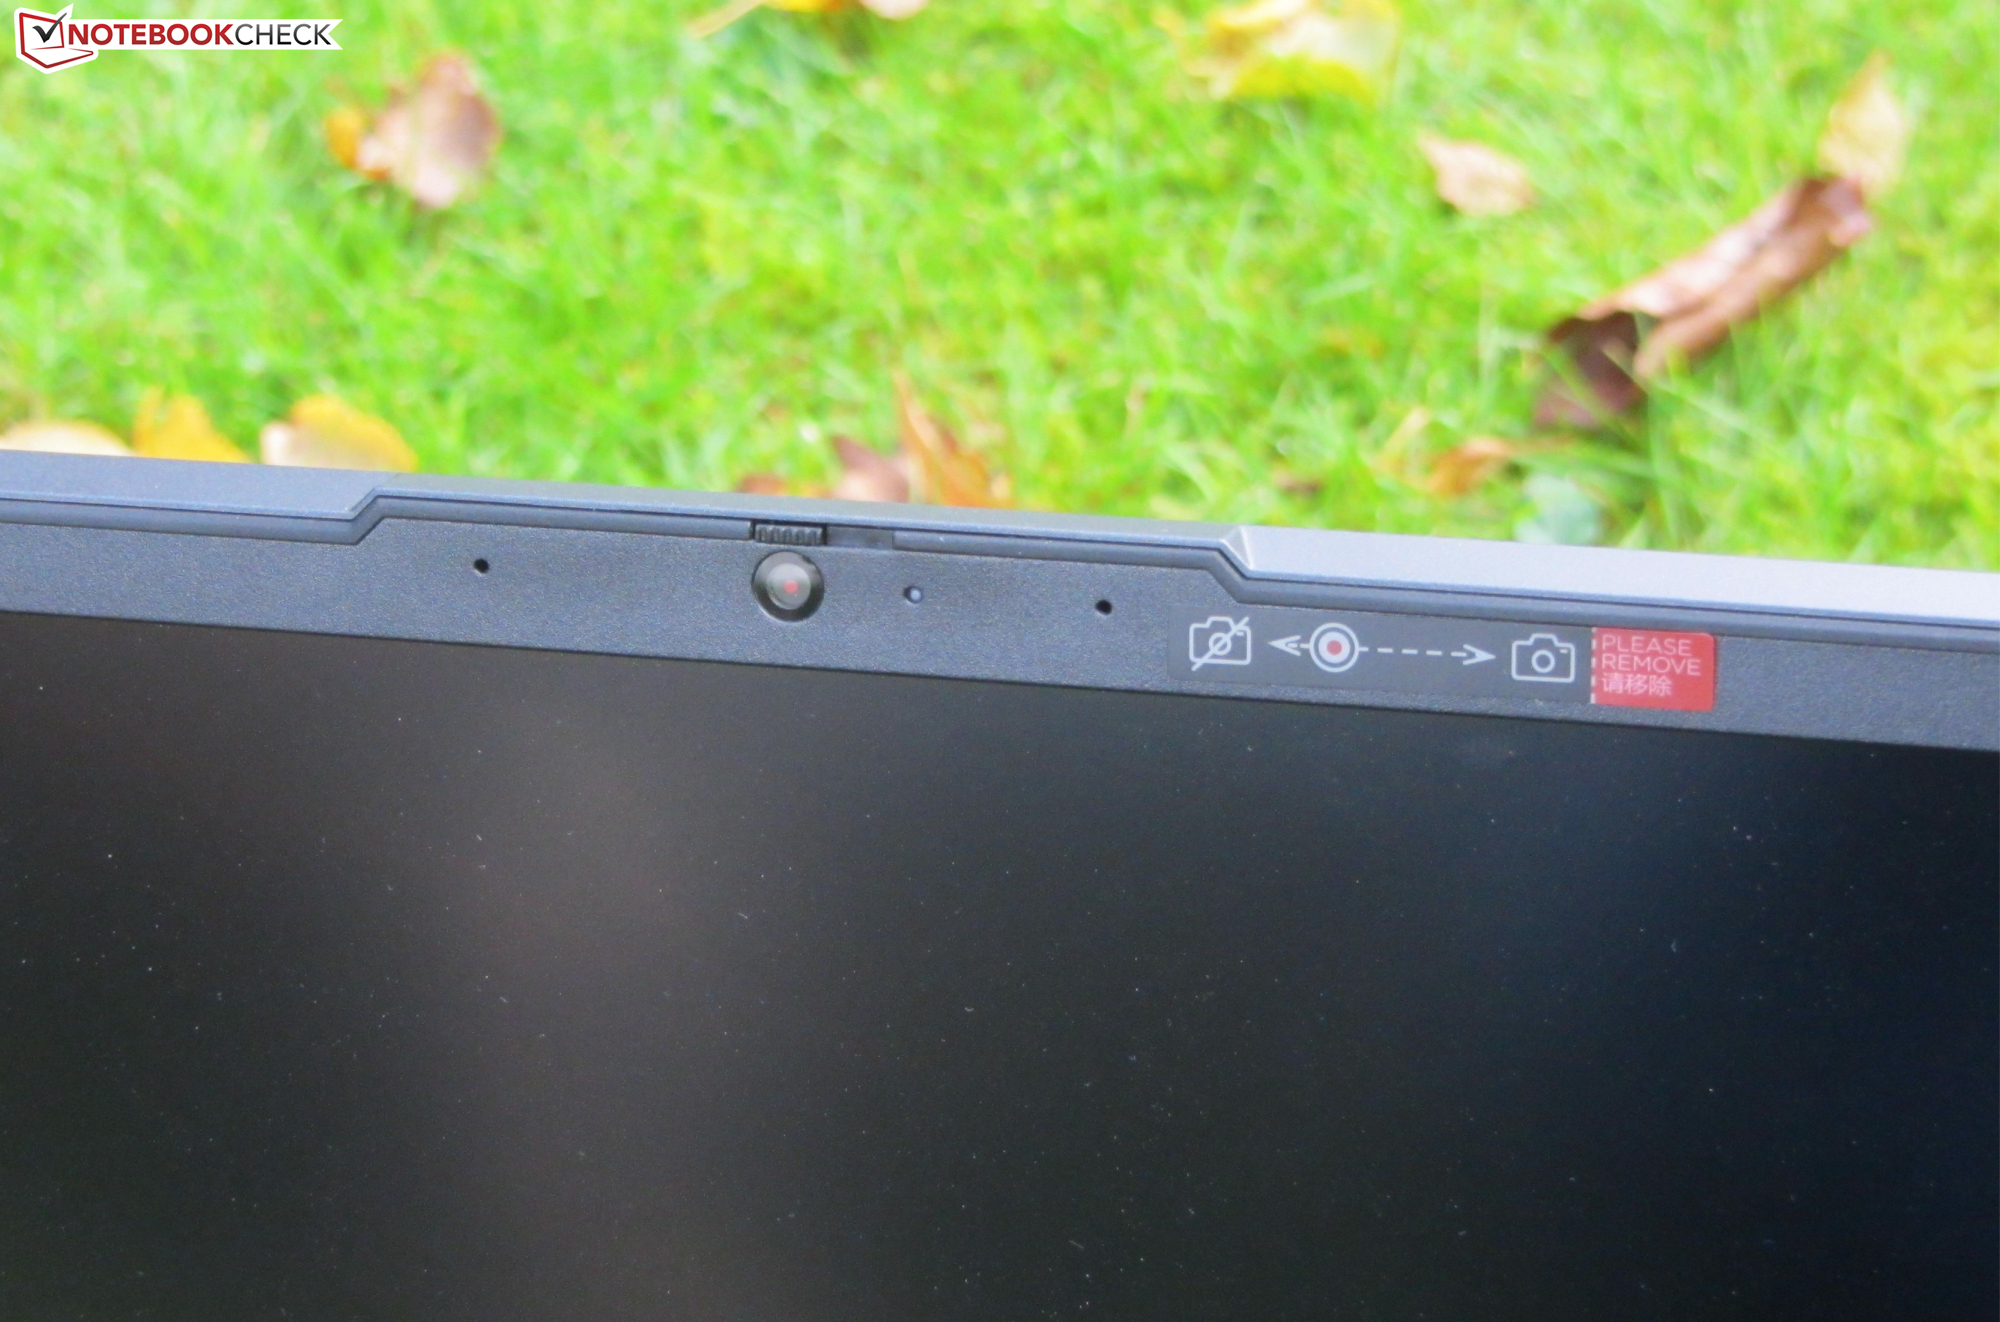
Webcam
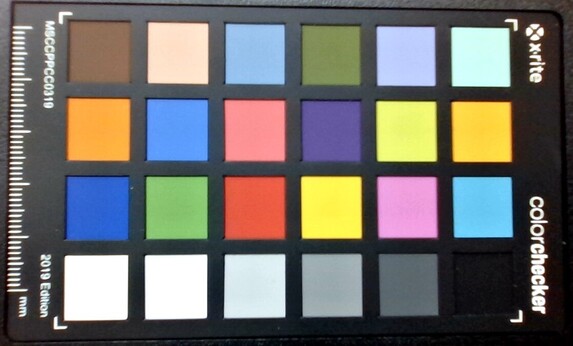
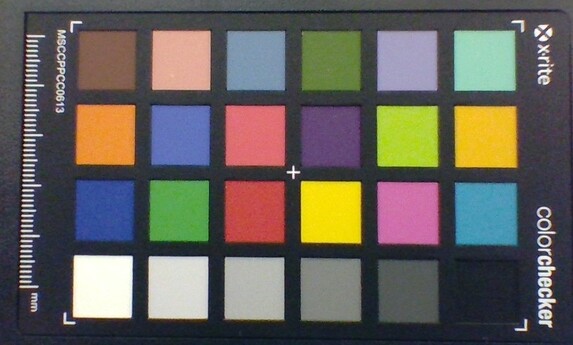
The webcam (0.9 MP, max. 1280 x 720 pixels) does not produce convincing images - just as the cameras from the competitors. In addition, color accuracy is lacking. With a deviation of almost 16, the target of Delta-E smaller than 3 is clearly missed.


Accessories
The notebook includes the usual documents such as quick start instructions and warranty information.
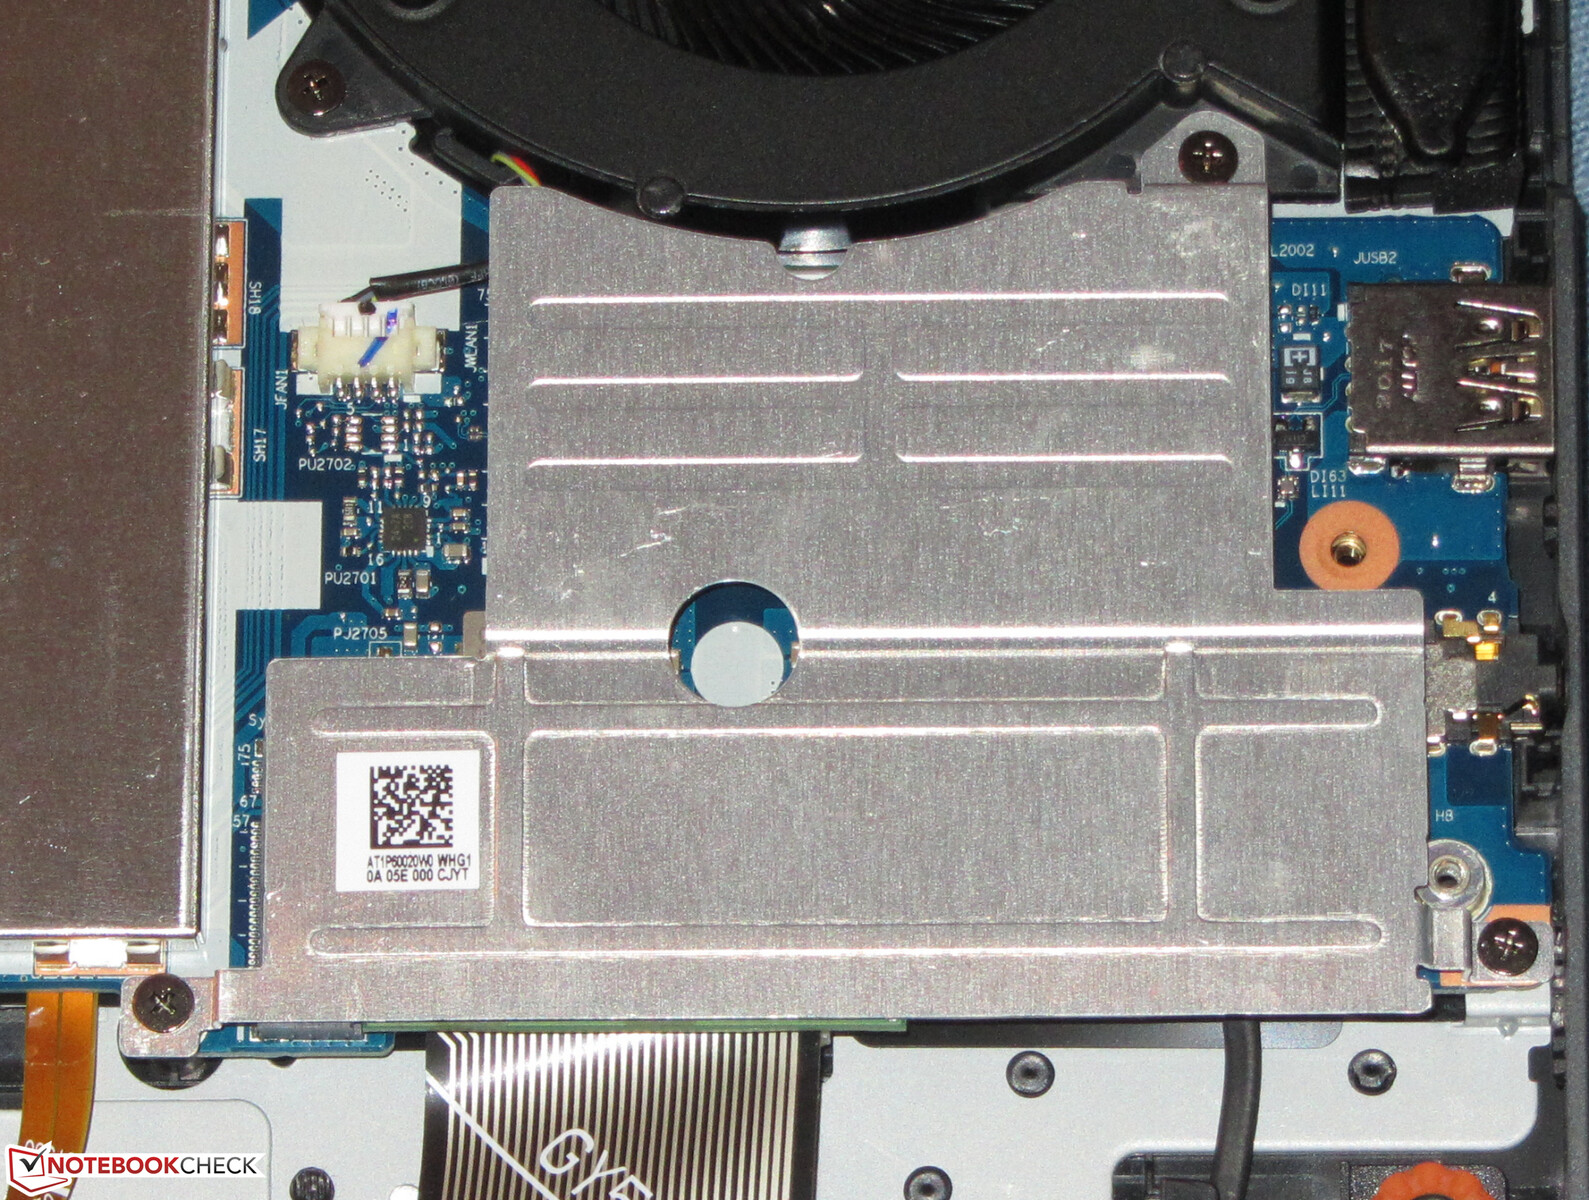
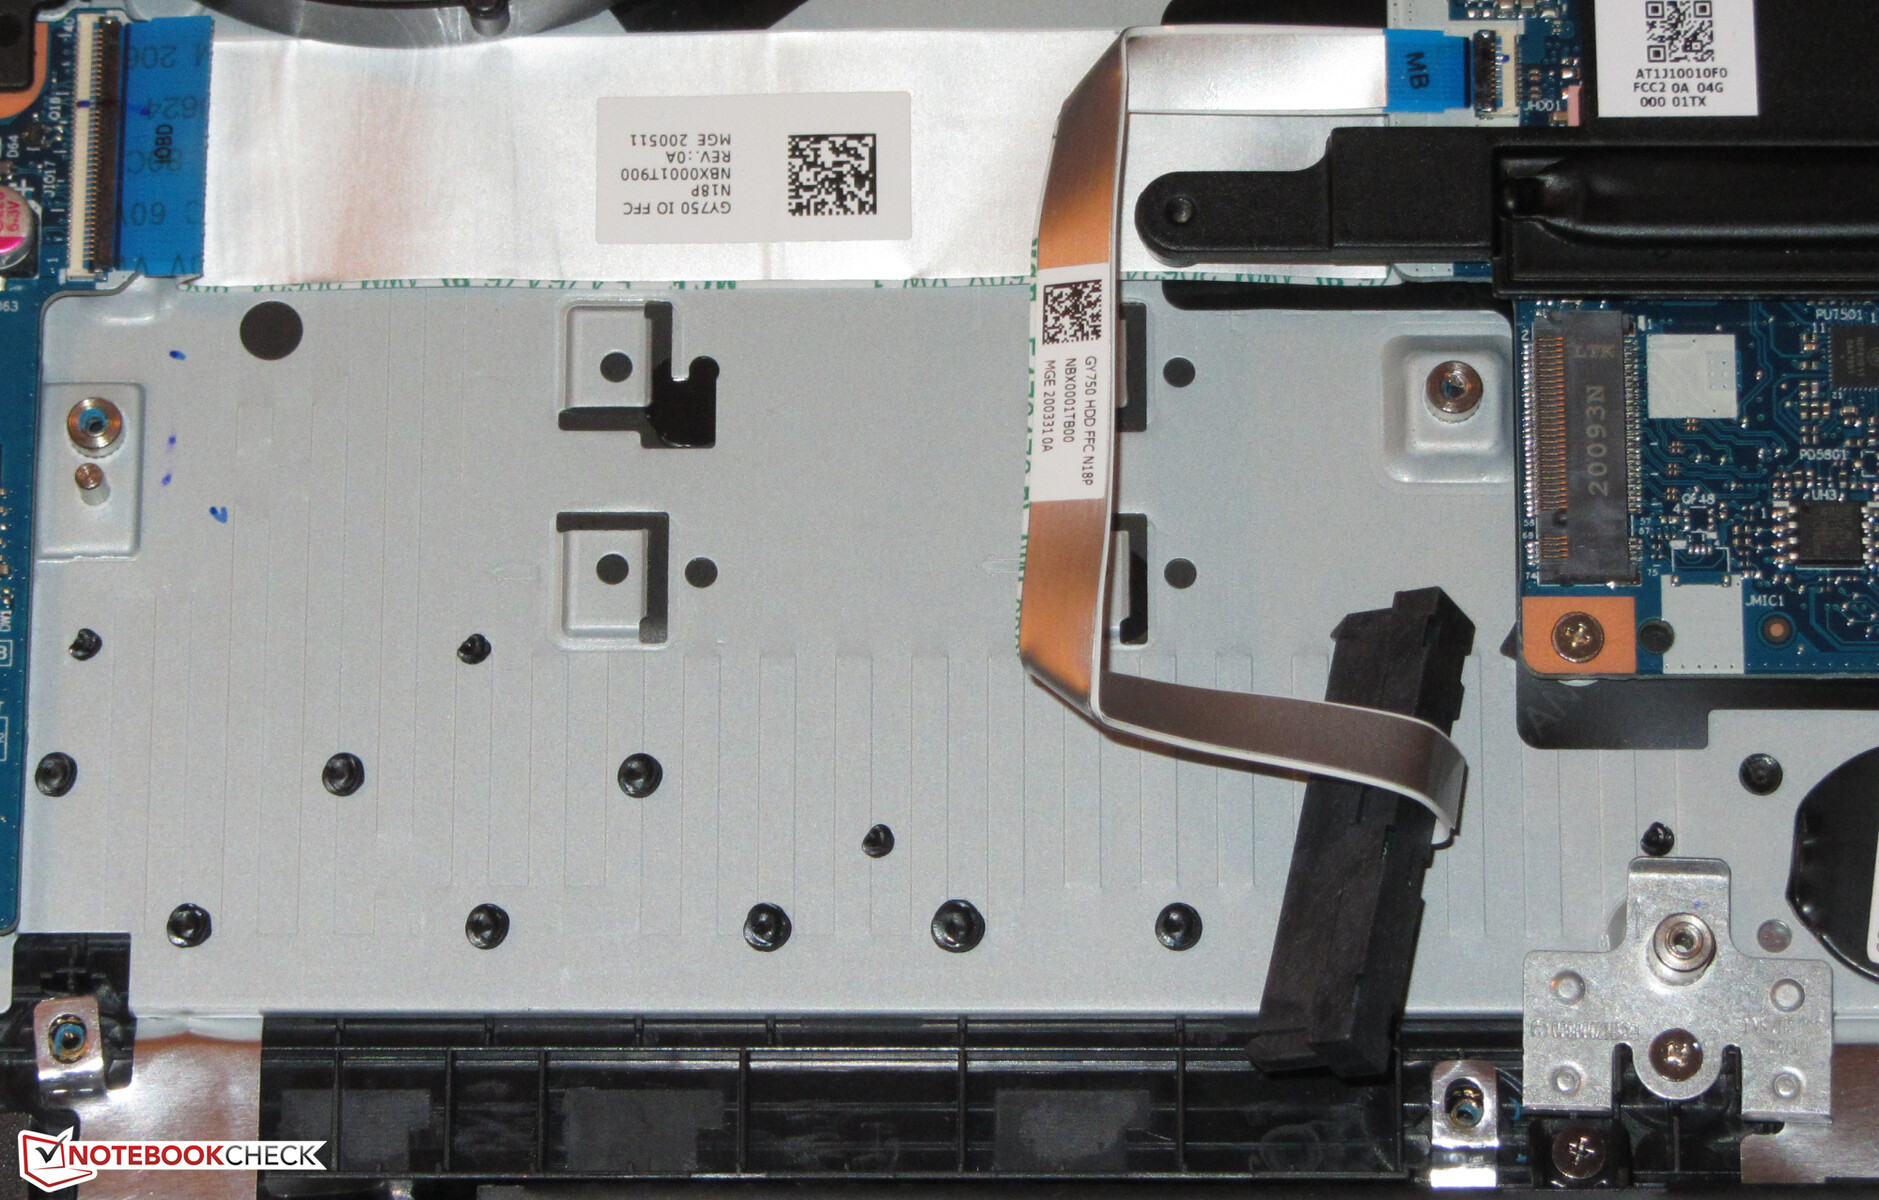
Maintenance
In order to access the insides, you have to remove the bottom of the case. First all the screws on the bottom have to be removed, before you can lift off the bottom of the case using a flat spatula or prying tool. Because of the way it is built, this turns out to be more difficult in the back section of the base unit than in the front area, and you have to proceed carefully and with a delicate touch.
Warranty
Lenovo offers a two-year warranty for the 17.3-inch laptop. The duration and services can be expanded, with a three-year on-site warranty costing about 55 Euros (~$64), for example.
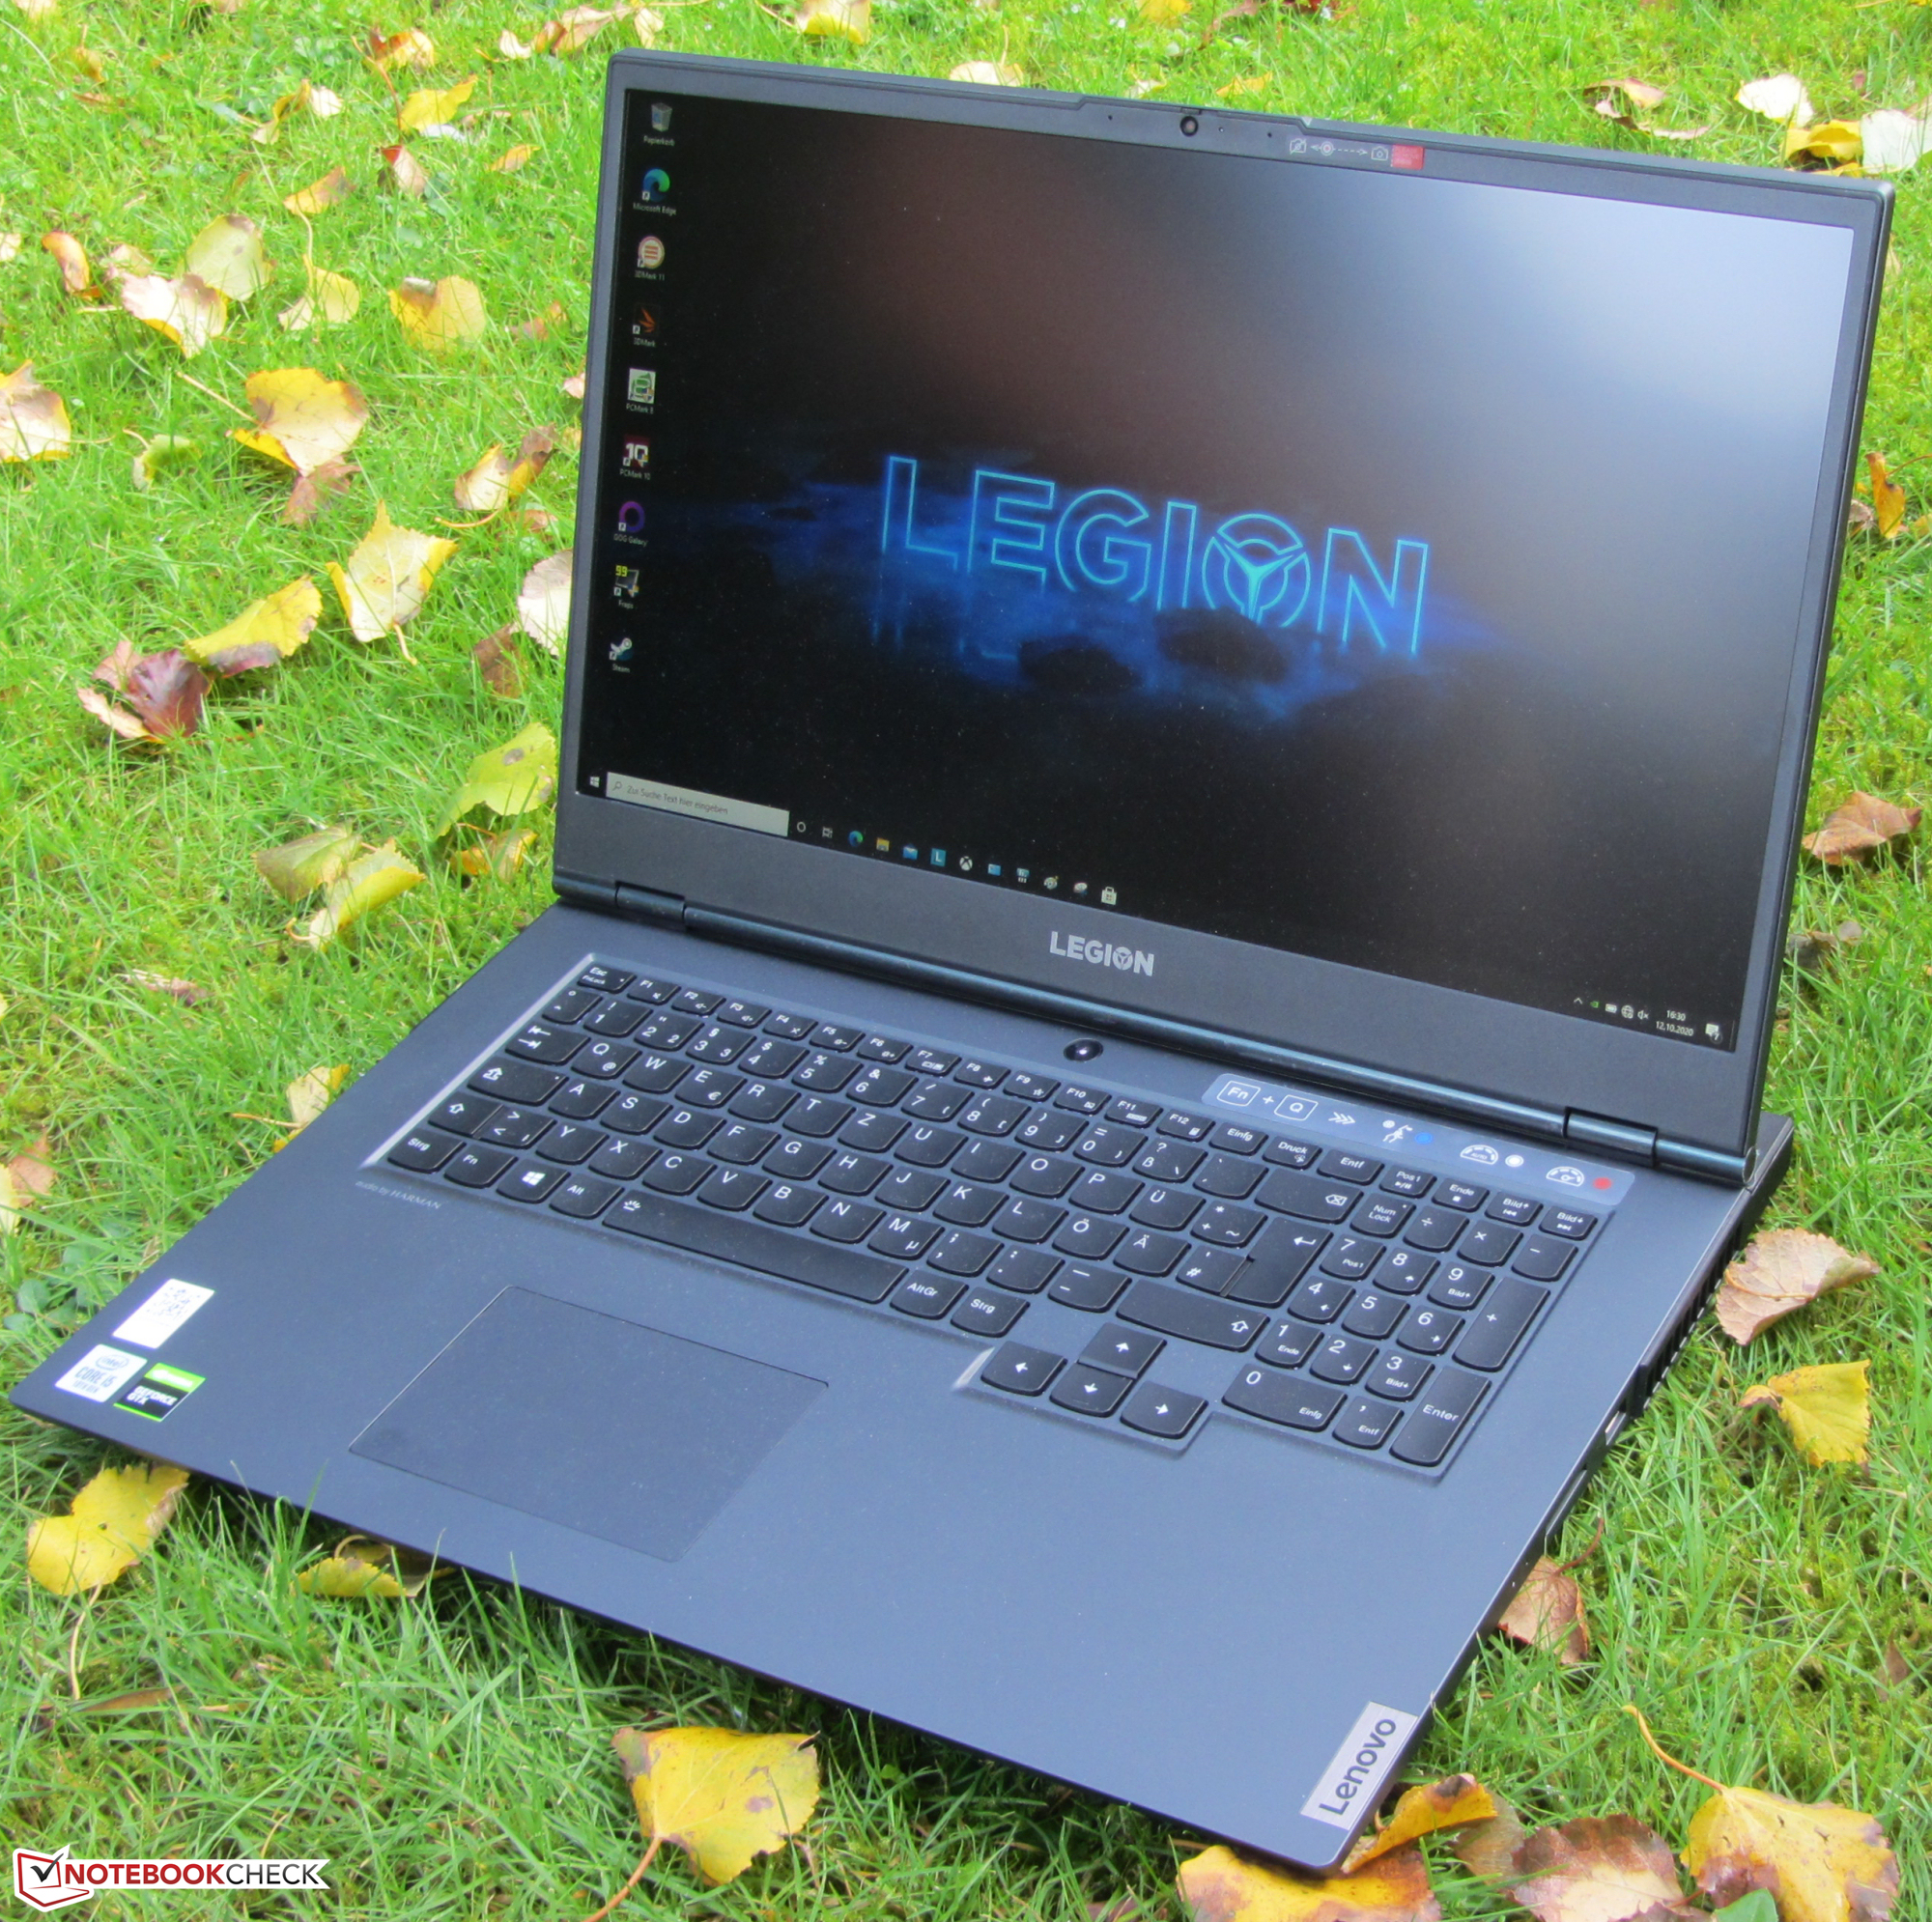
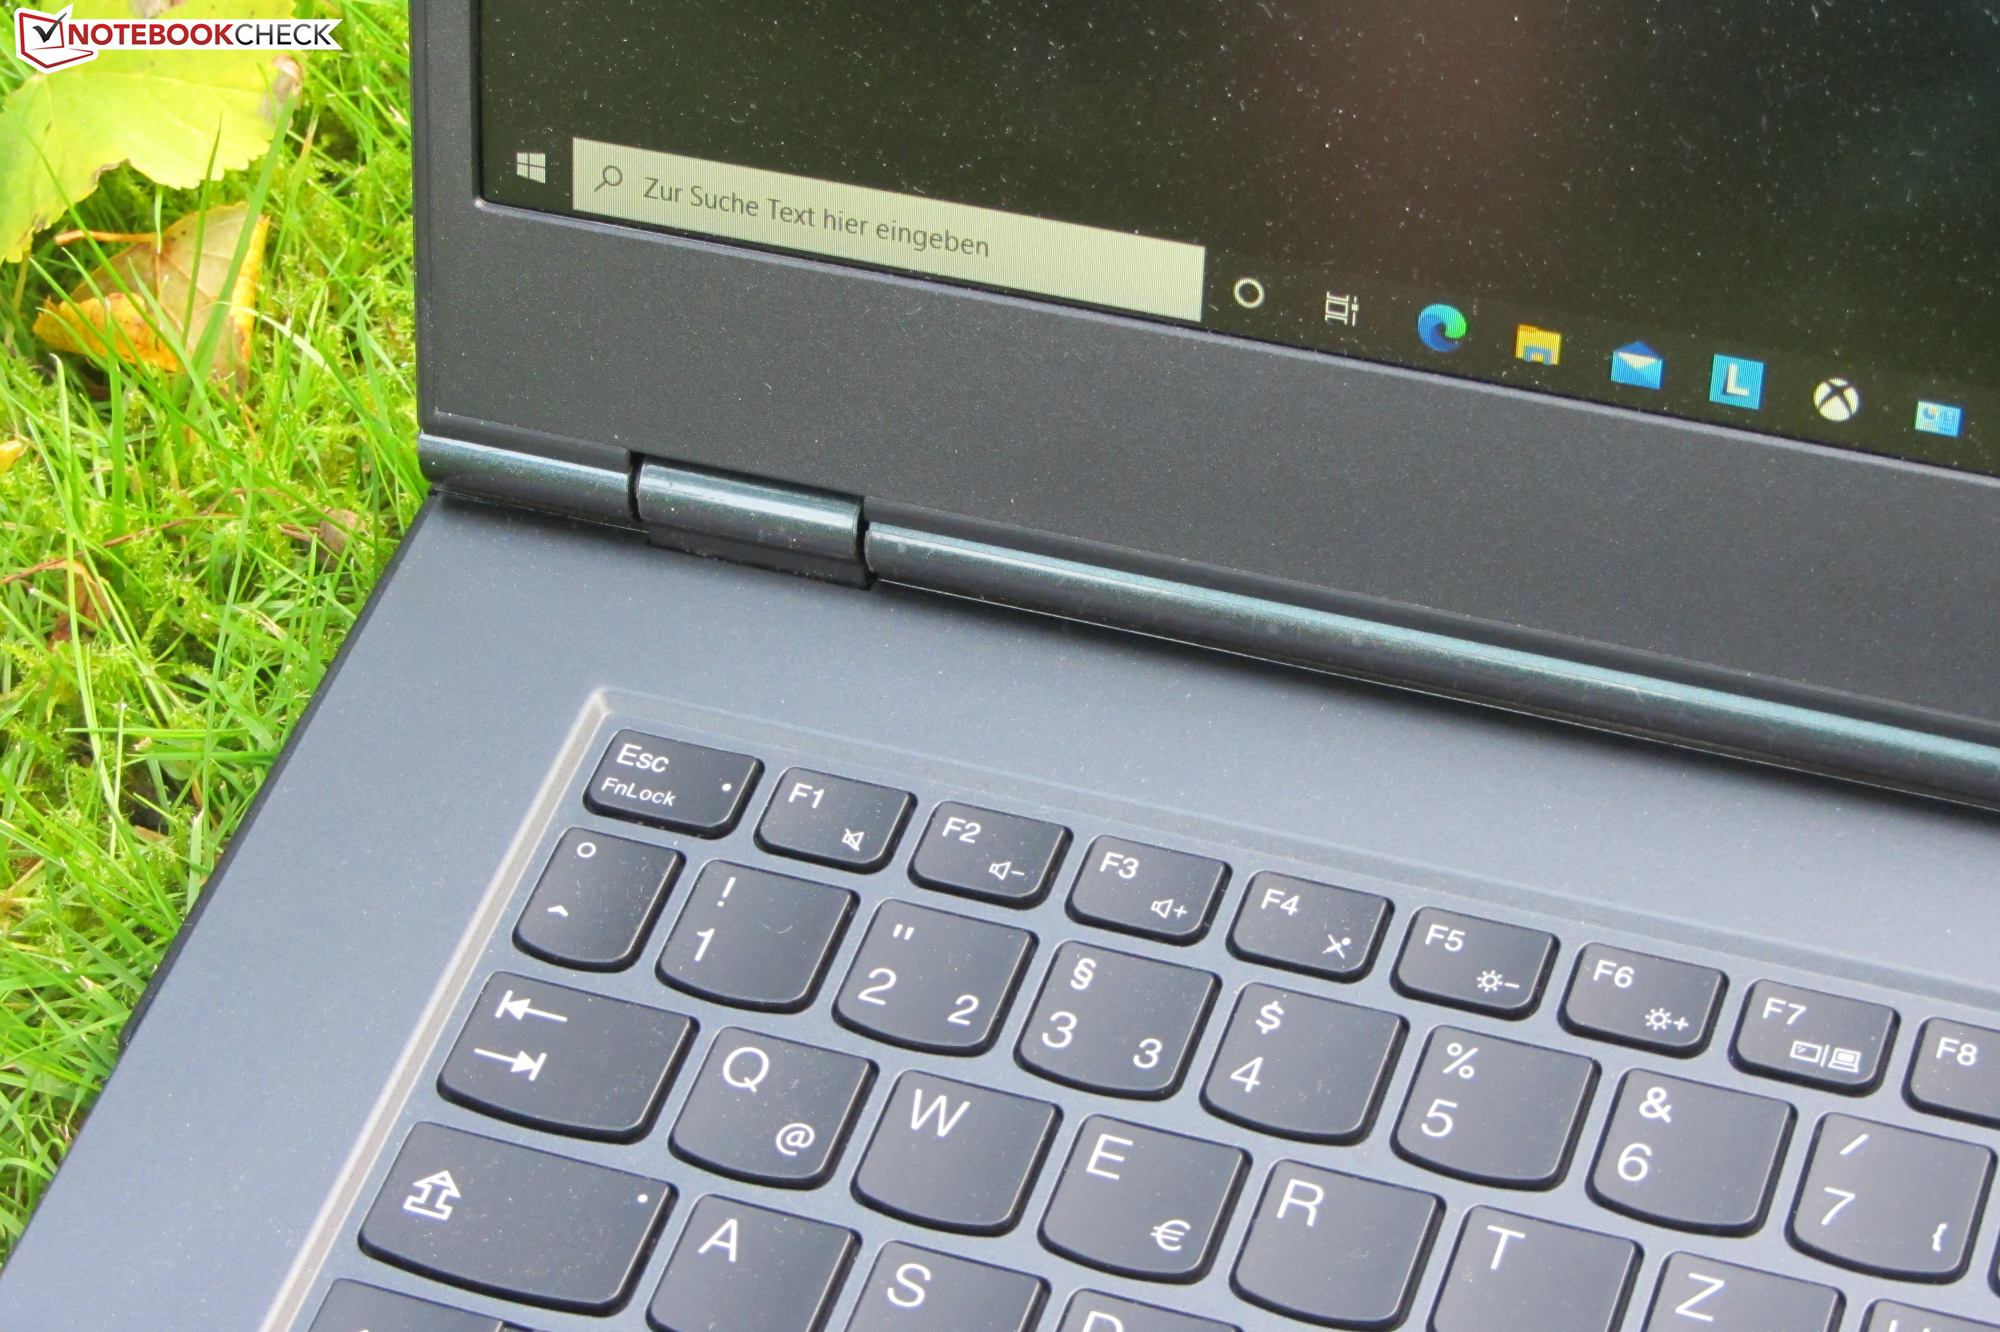
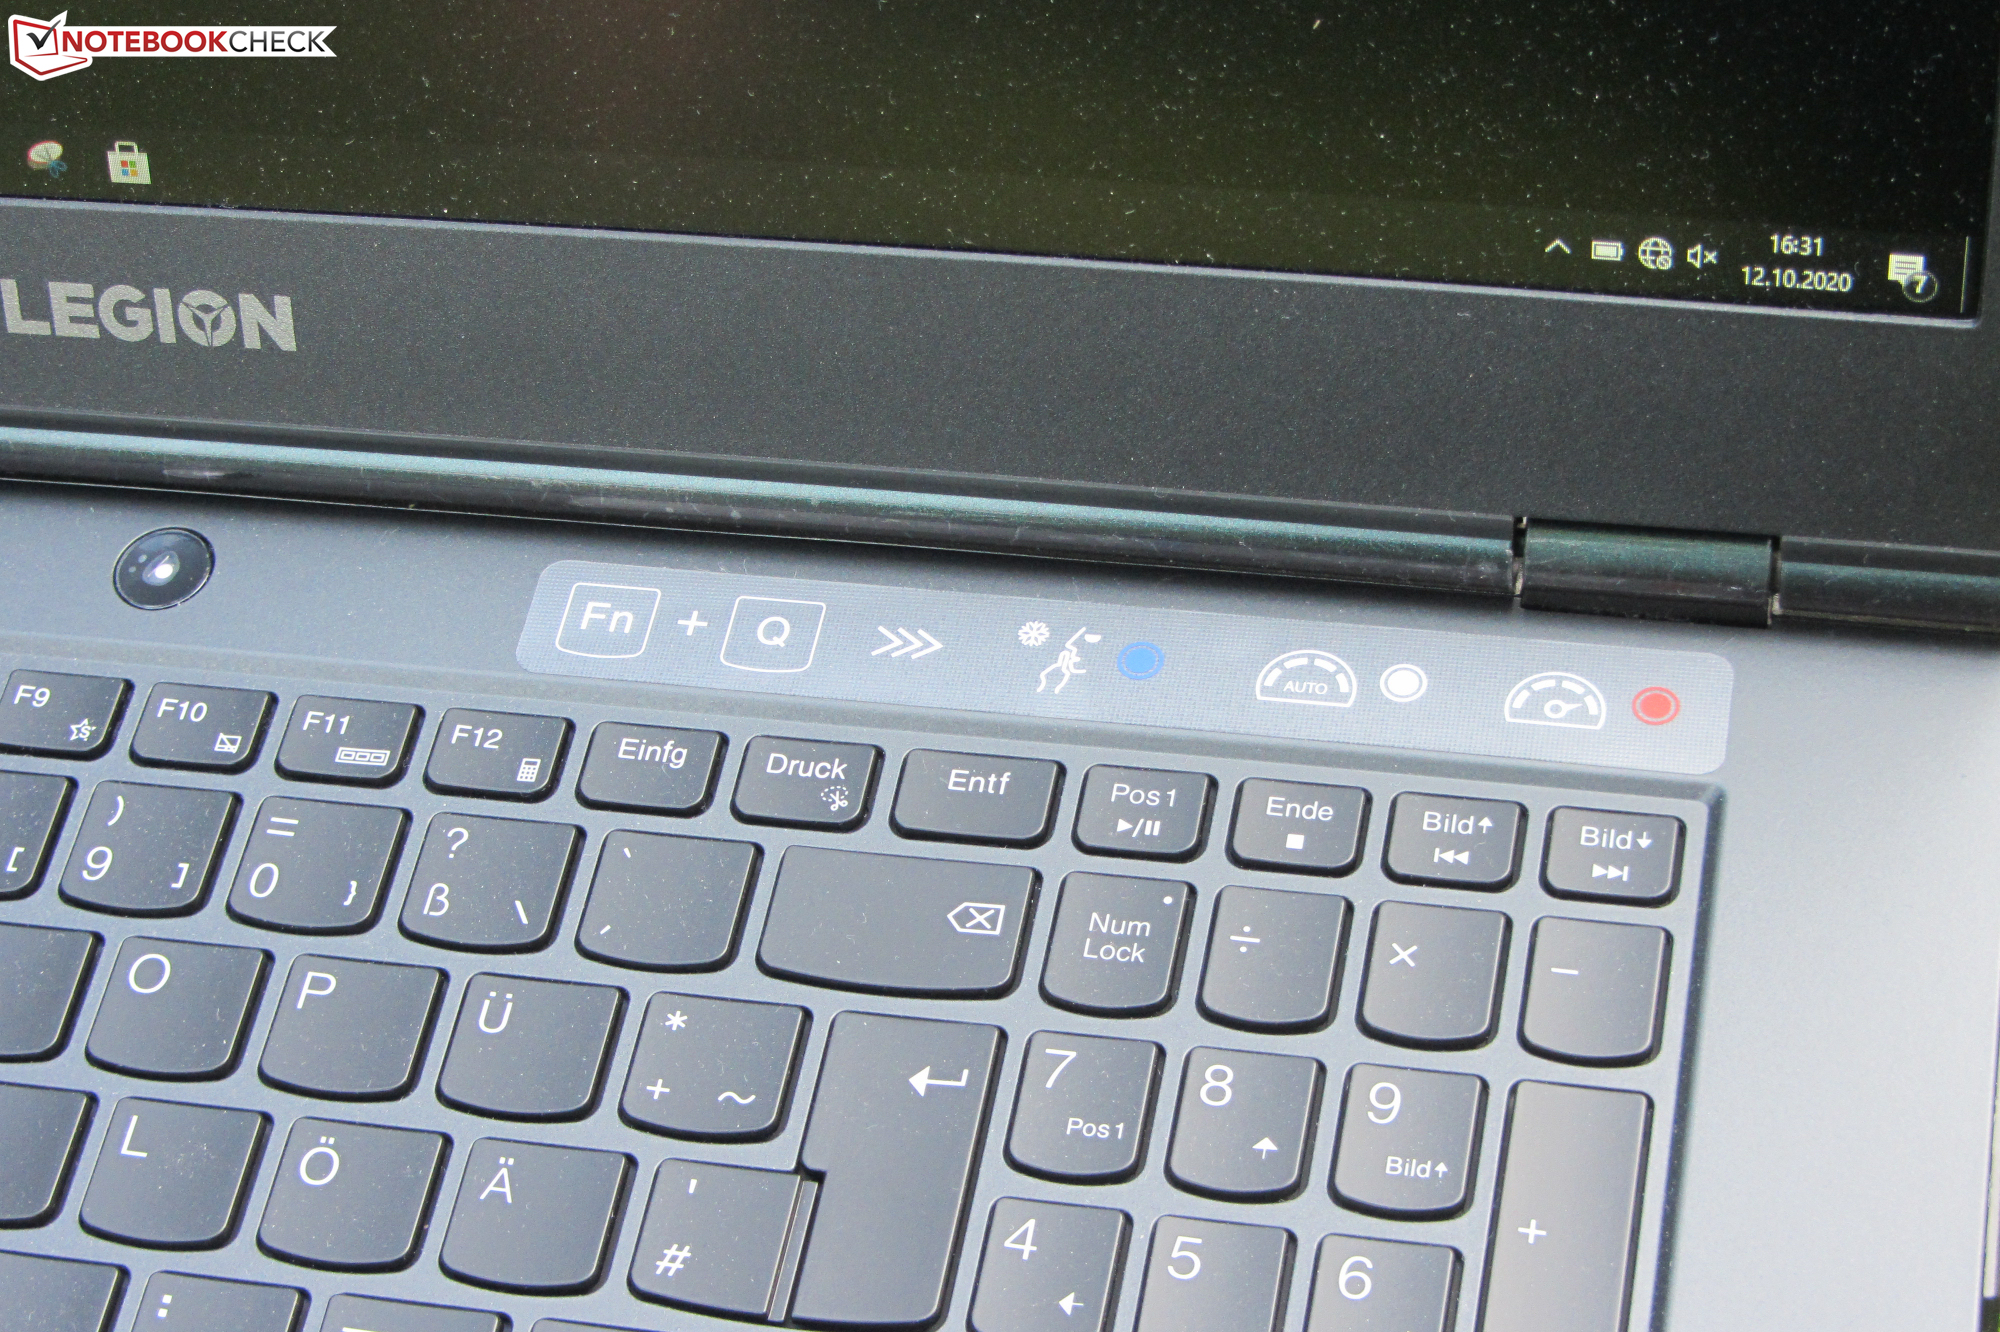
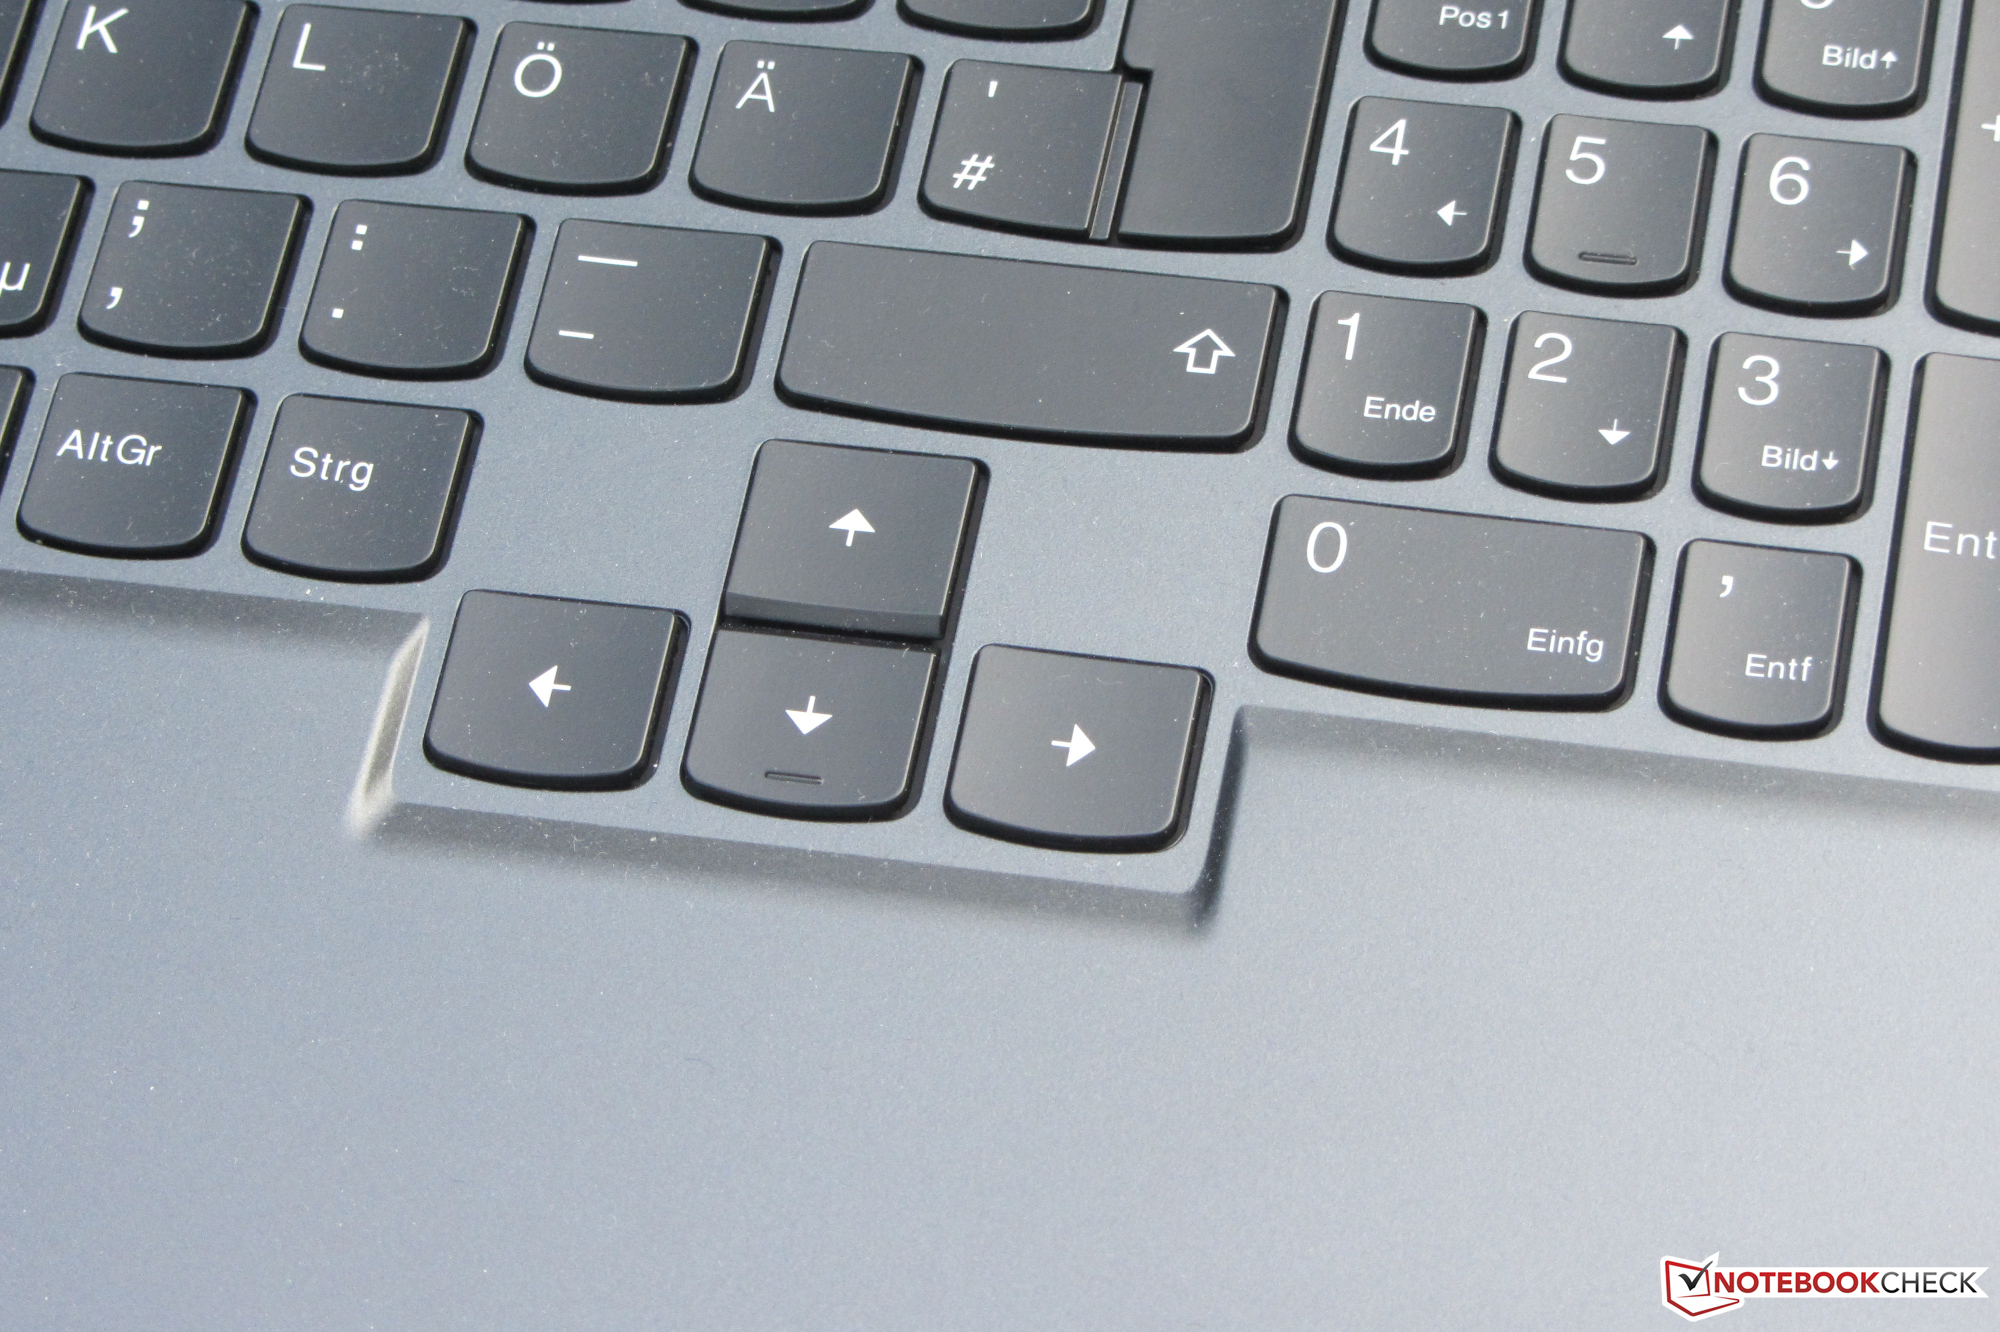
Input Devices - There is no RGB illumination
Keyboard
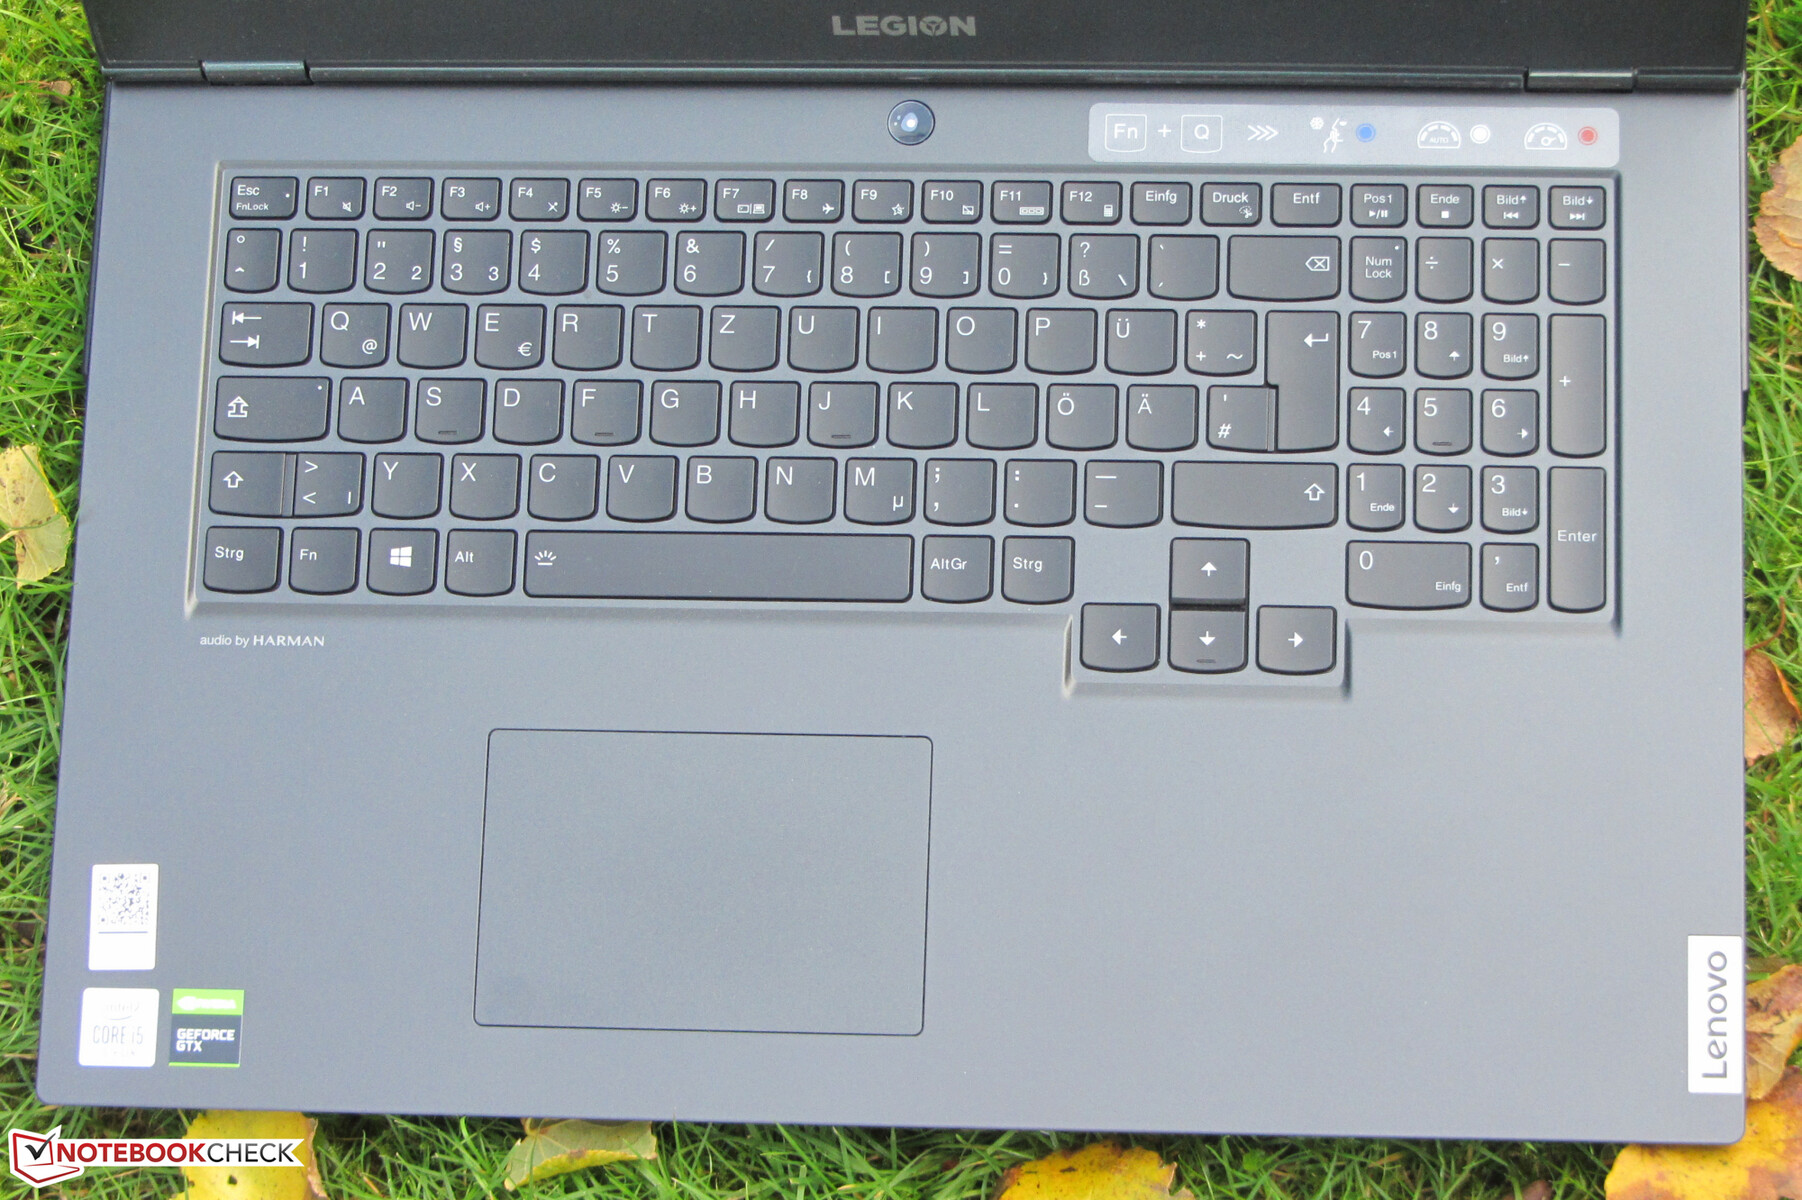
The Legion is equipped with an illuminated chiclet keyboard. The concave keys offer a short stroke and clear pressure point. While typing, the keyboard has some give in the right area of the main keys, but this did not turn out to be too much of a hindrance. The keyboard illumination (two brightness levels) is controlled by a function key. Overall, Lenovo is delivering a keyboard suitable for everyday tasks here.
Touchpad
The multitouch capable ClickPad has a footprint of about 10.5 x 7 cm (~4.1 x 2.8 in), so it does not lack space for using gesture controls. The pad also responds to inputs in the corners, and the smooth surface does not prevent fingers from sliding easily. The pad offers a short stroke and clearly audible and noticeable pressure point.
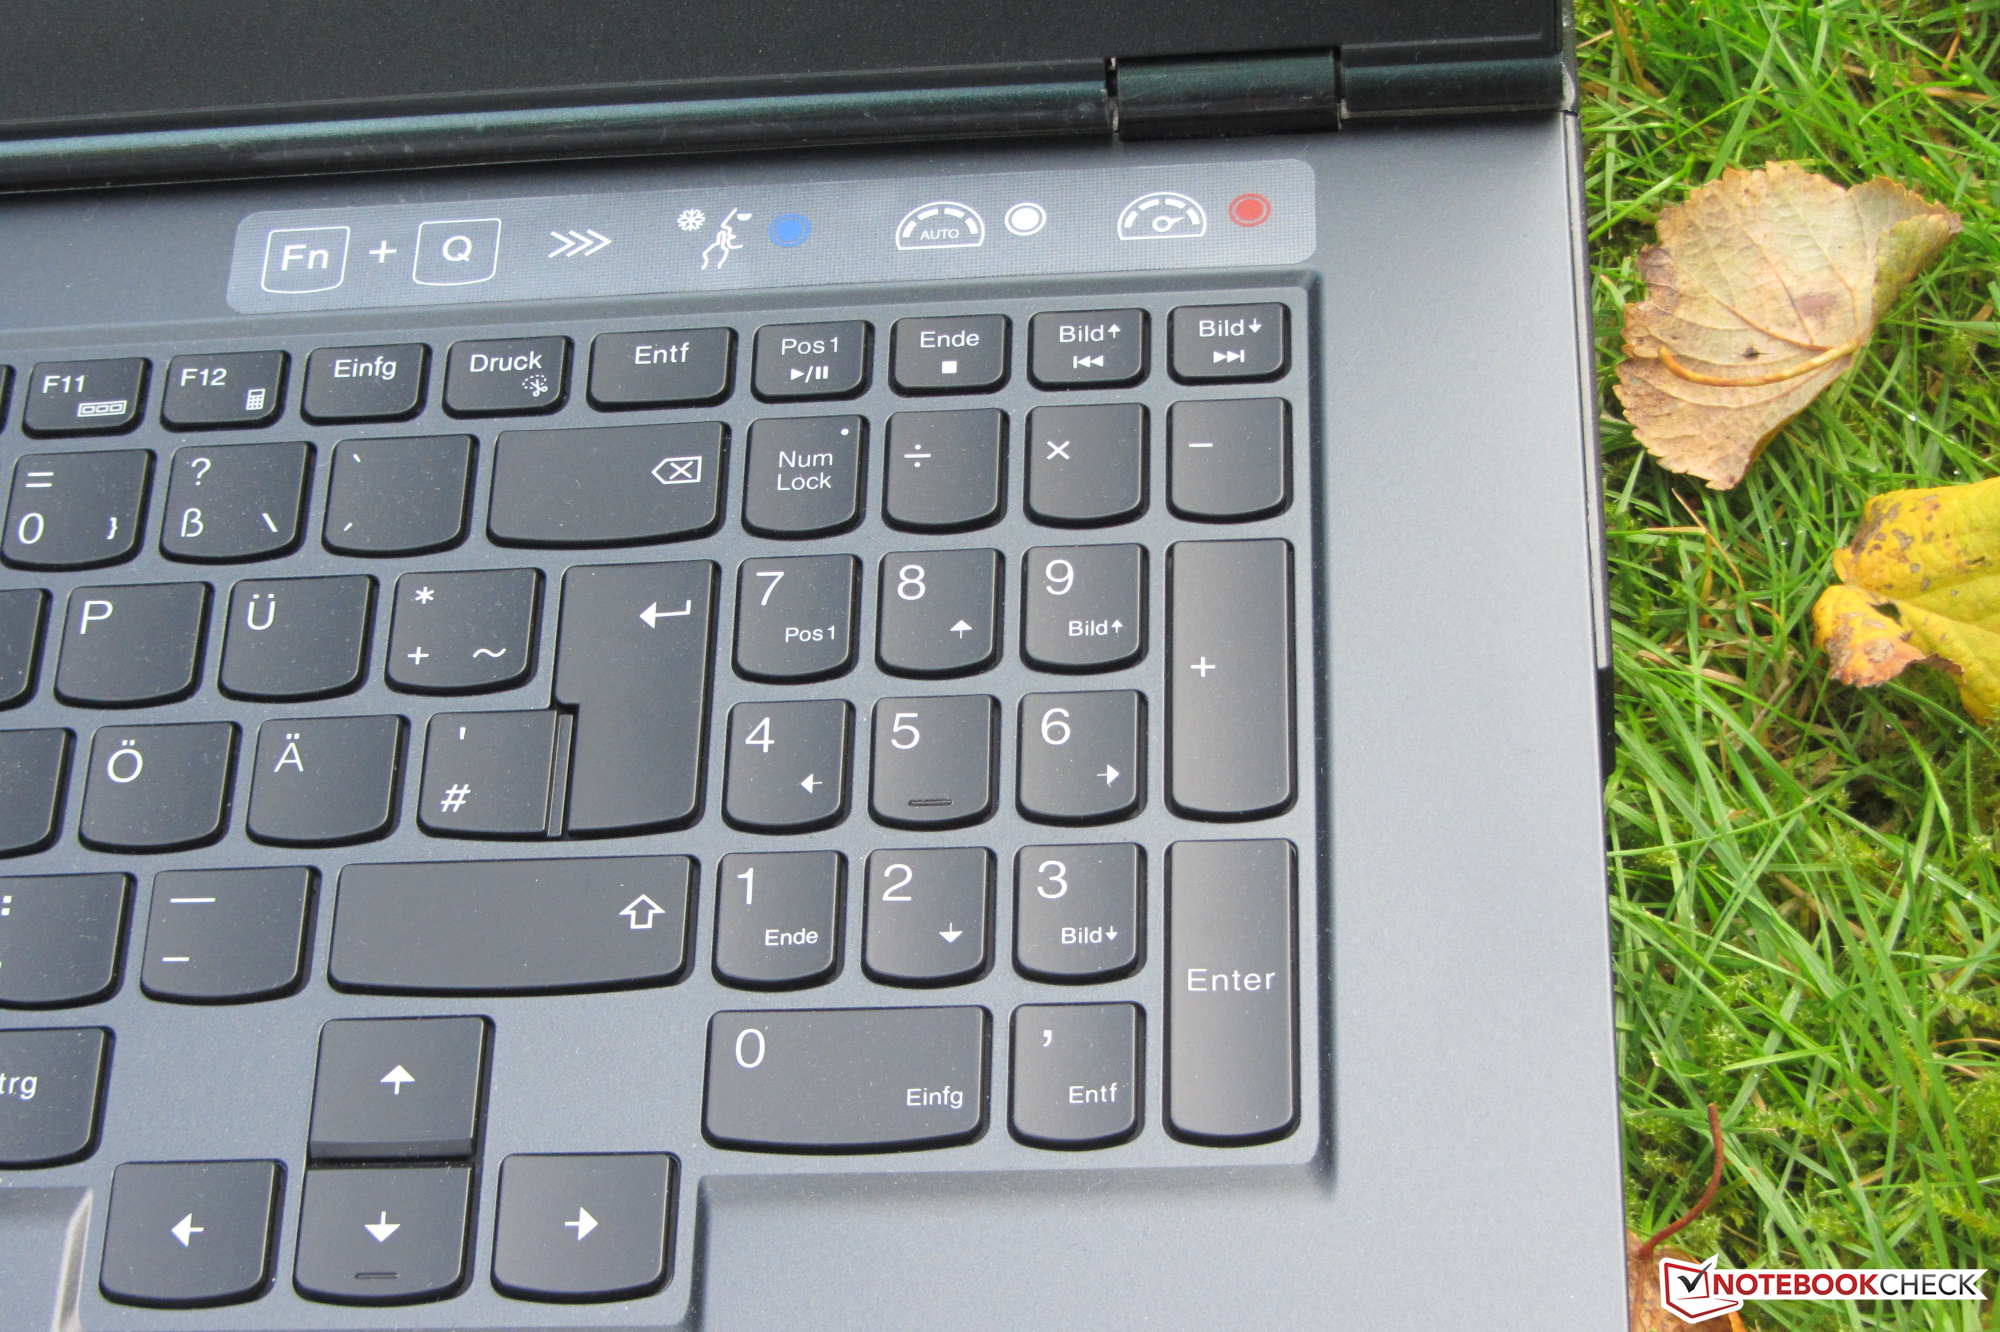
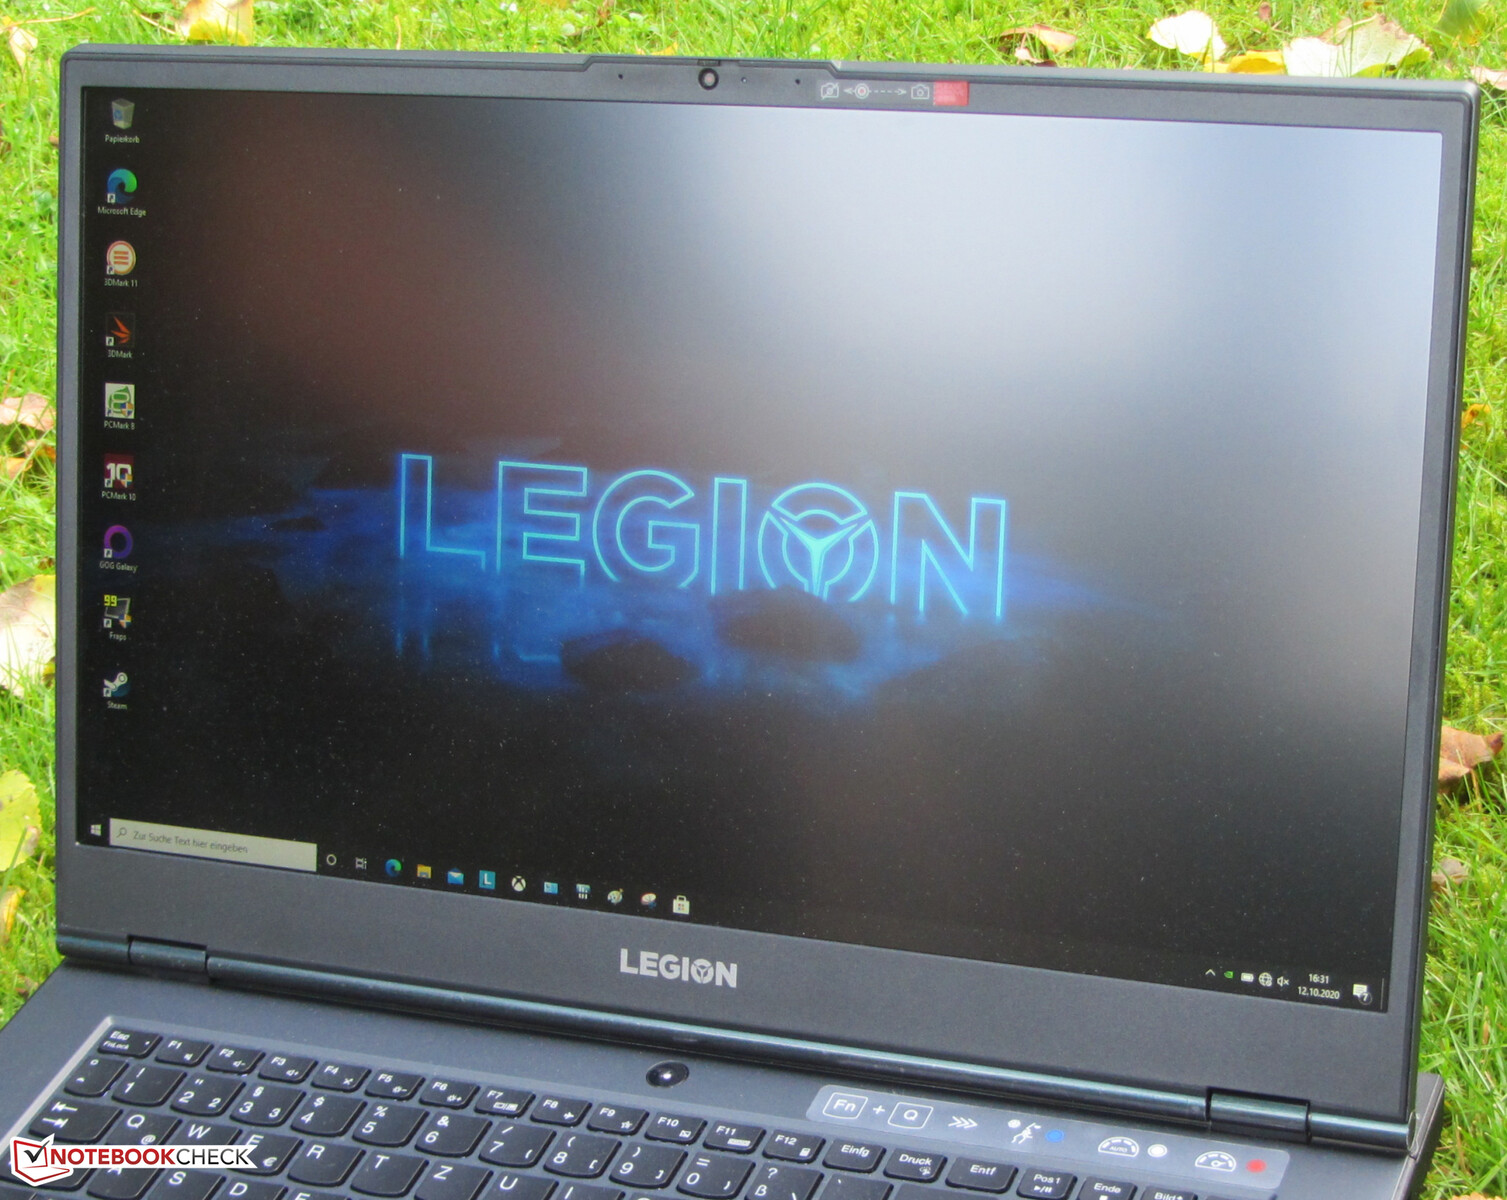
Display - IPS onboard
The matte 17.3-inch display of the Legion offers a native resolution of 1920 x 1080 pixels. The brightness (304 cd/m²) and contrast (1304:1) turn out good. While the response times are decent, they don't inspire enthusiasm, and the alternatively available 144-Hz display recommends itself in this regard.
| |||||||||||||||||||||||||
Brightness Distribution: 89 %
Center on Battery: 326 cd/m²
Contrast: 1304:1 (Black: 0.25 cd/m²)
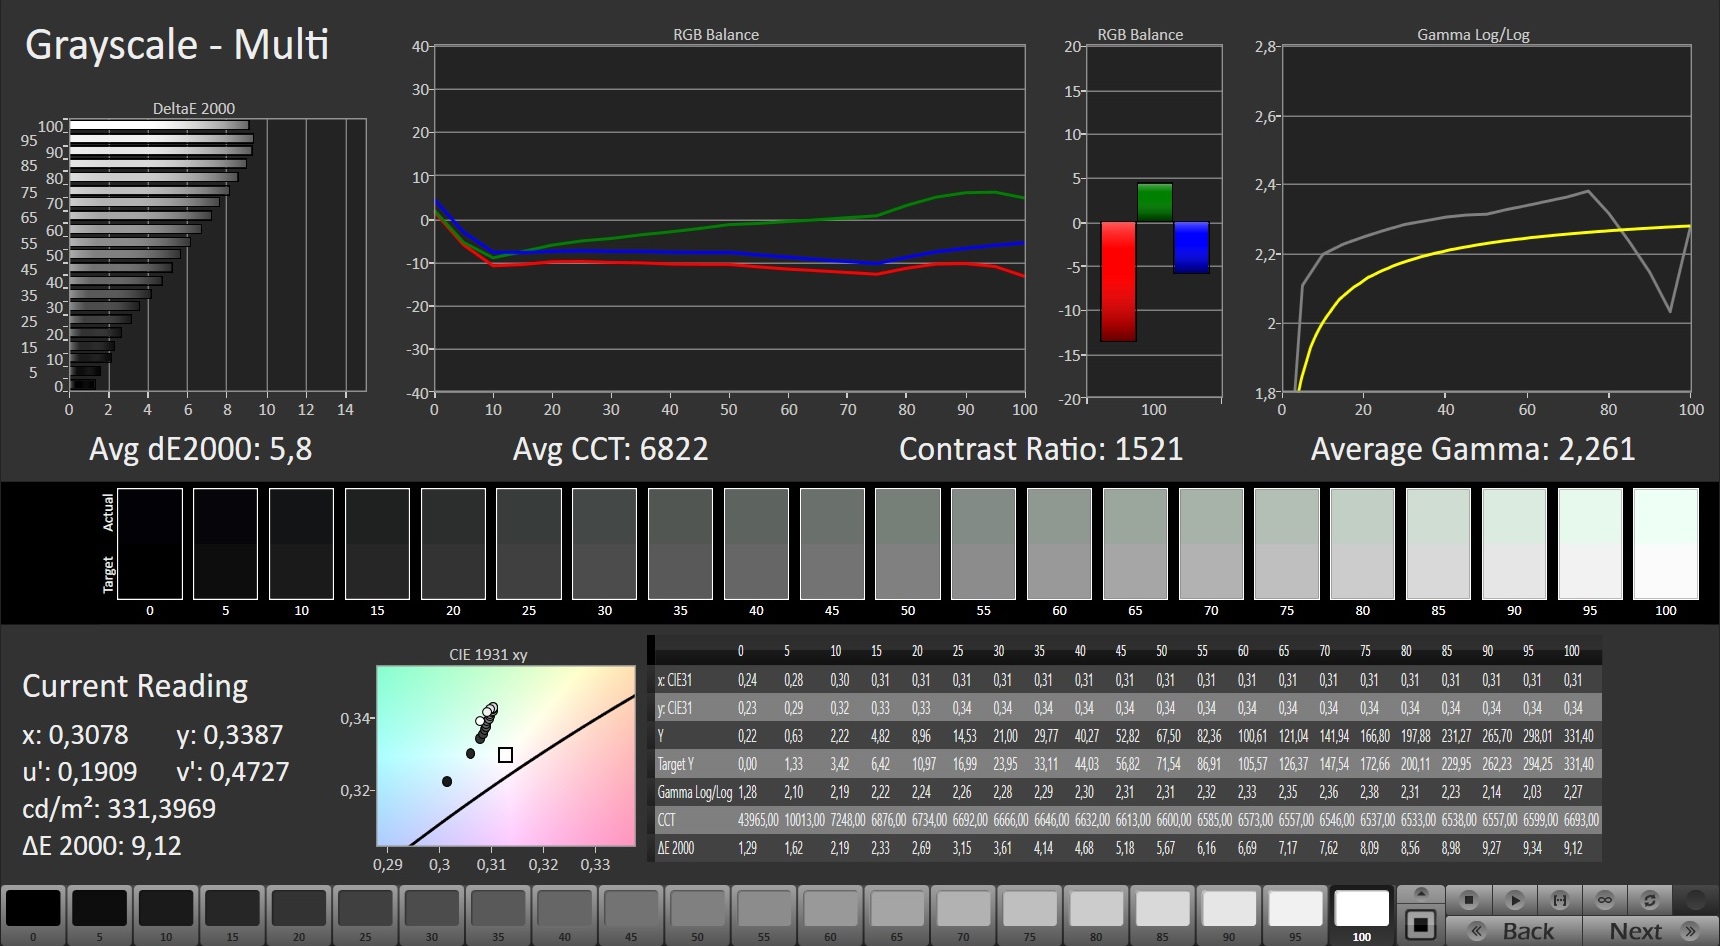
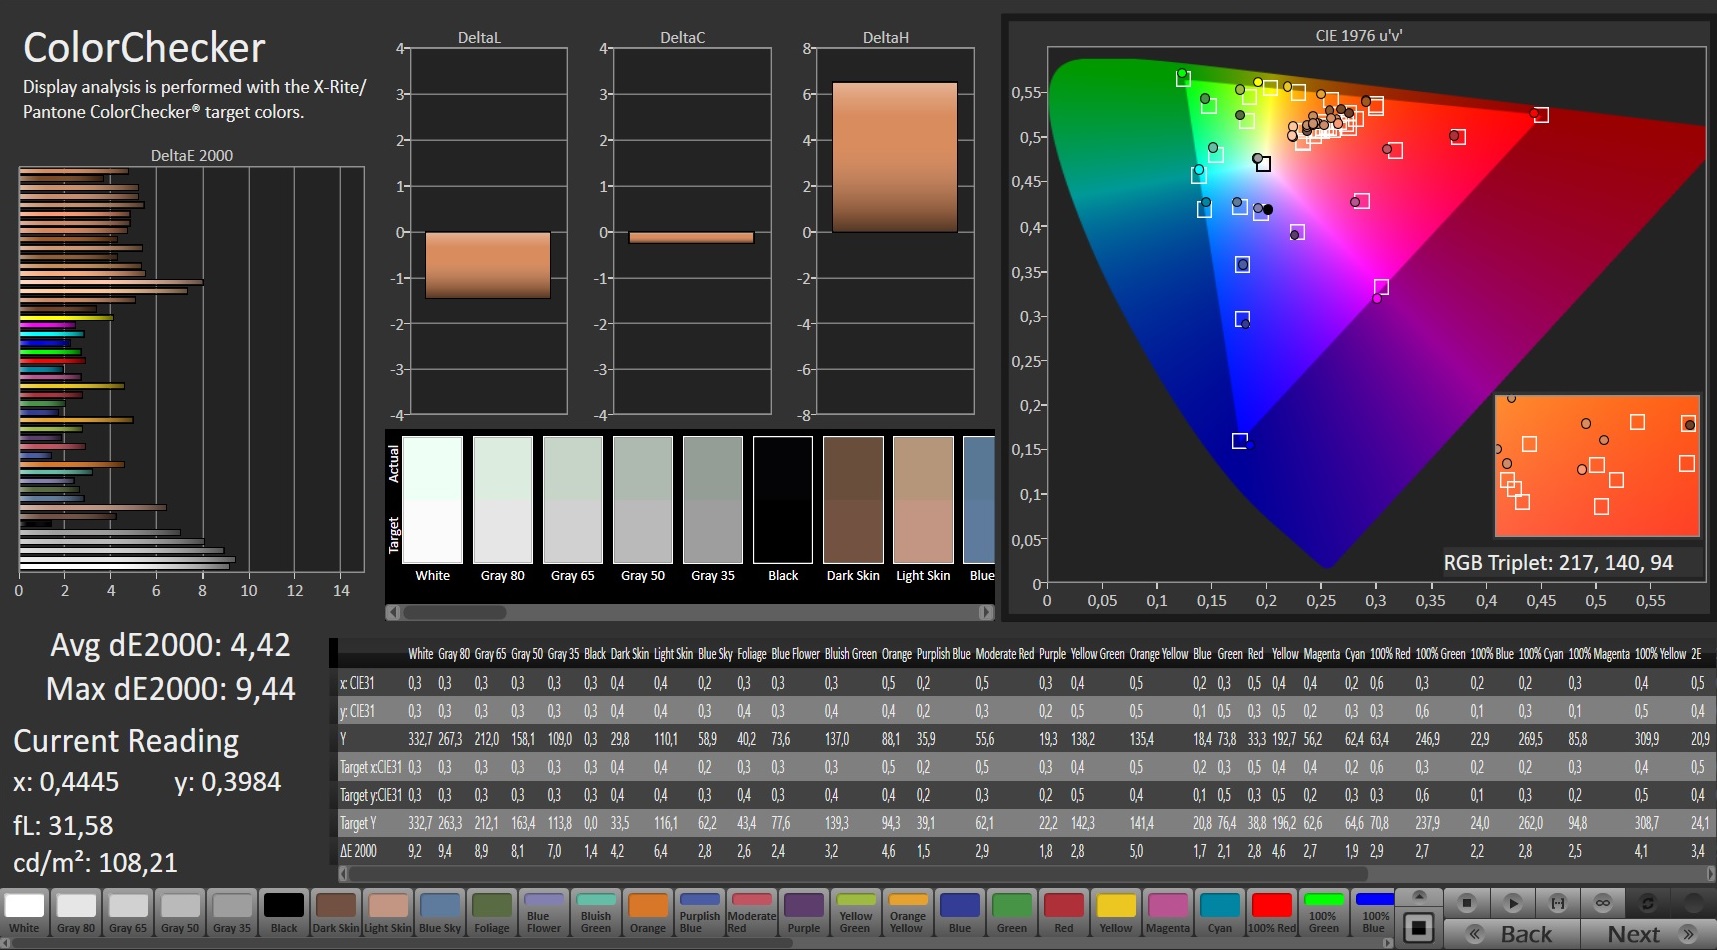
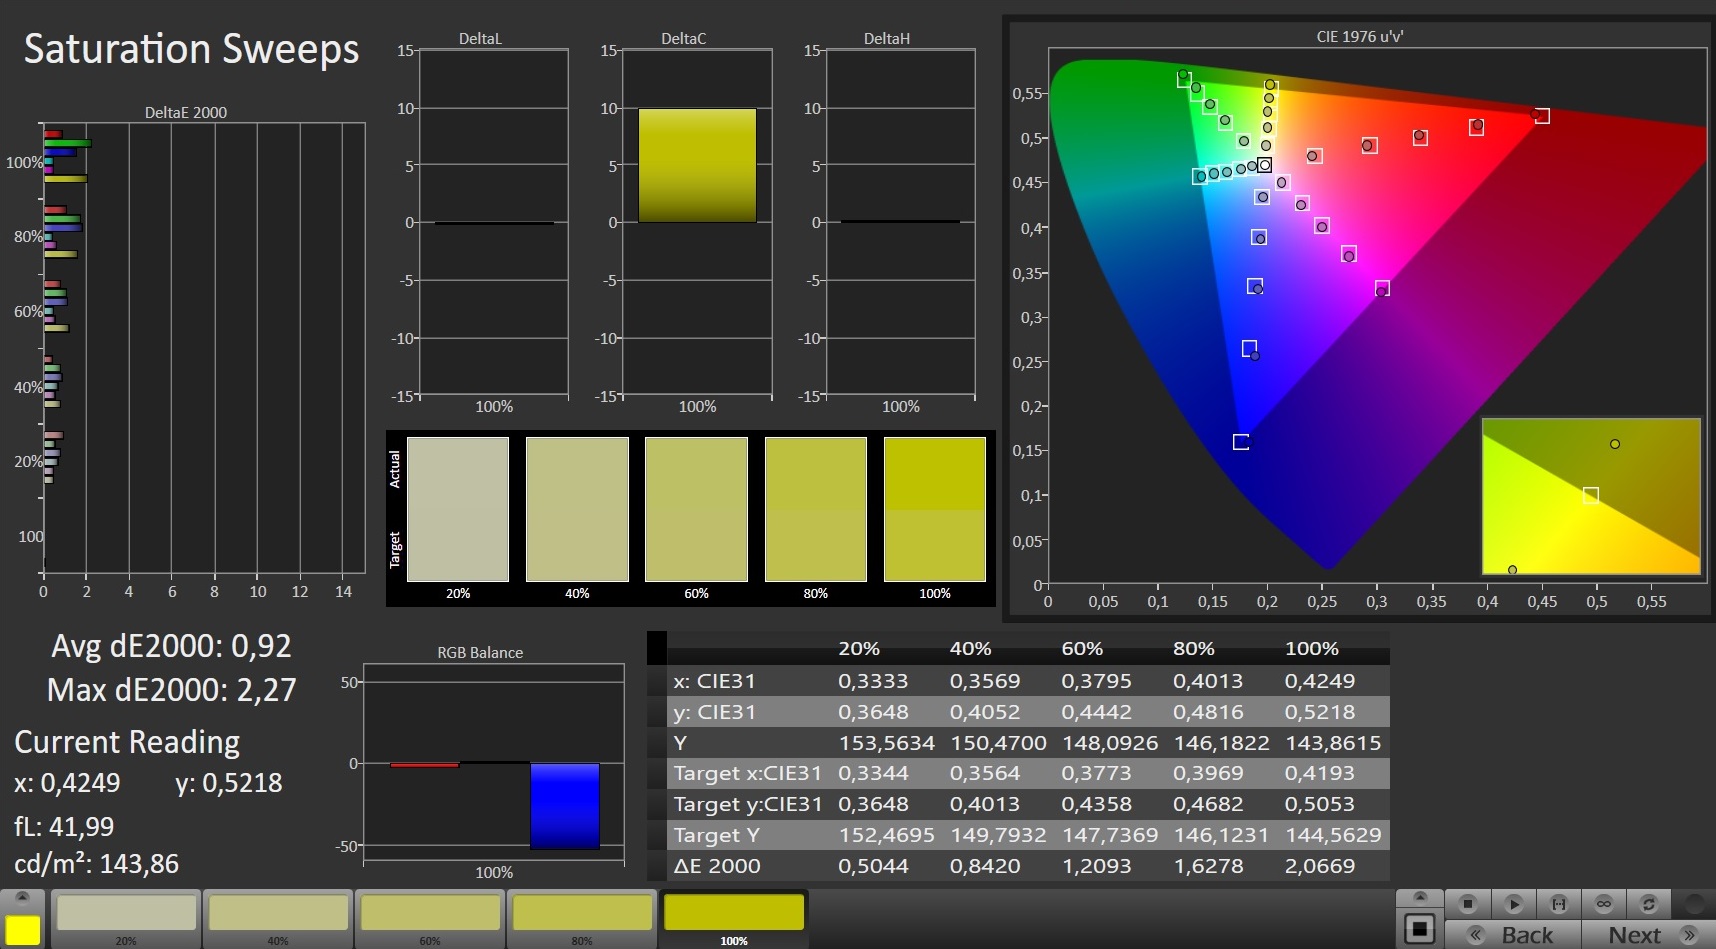
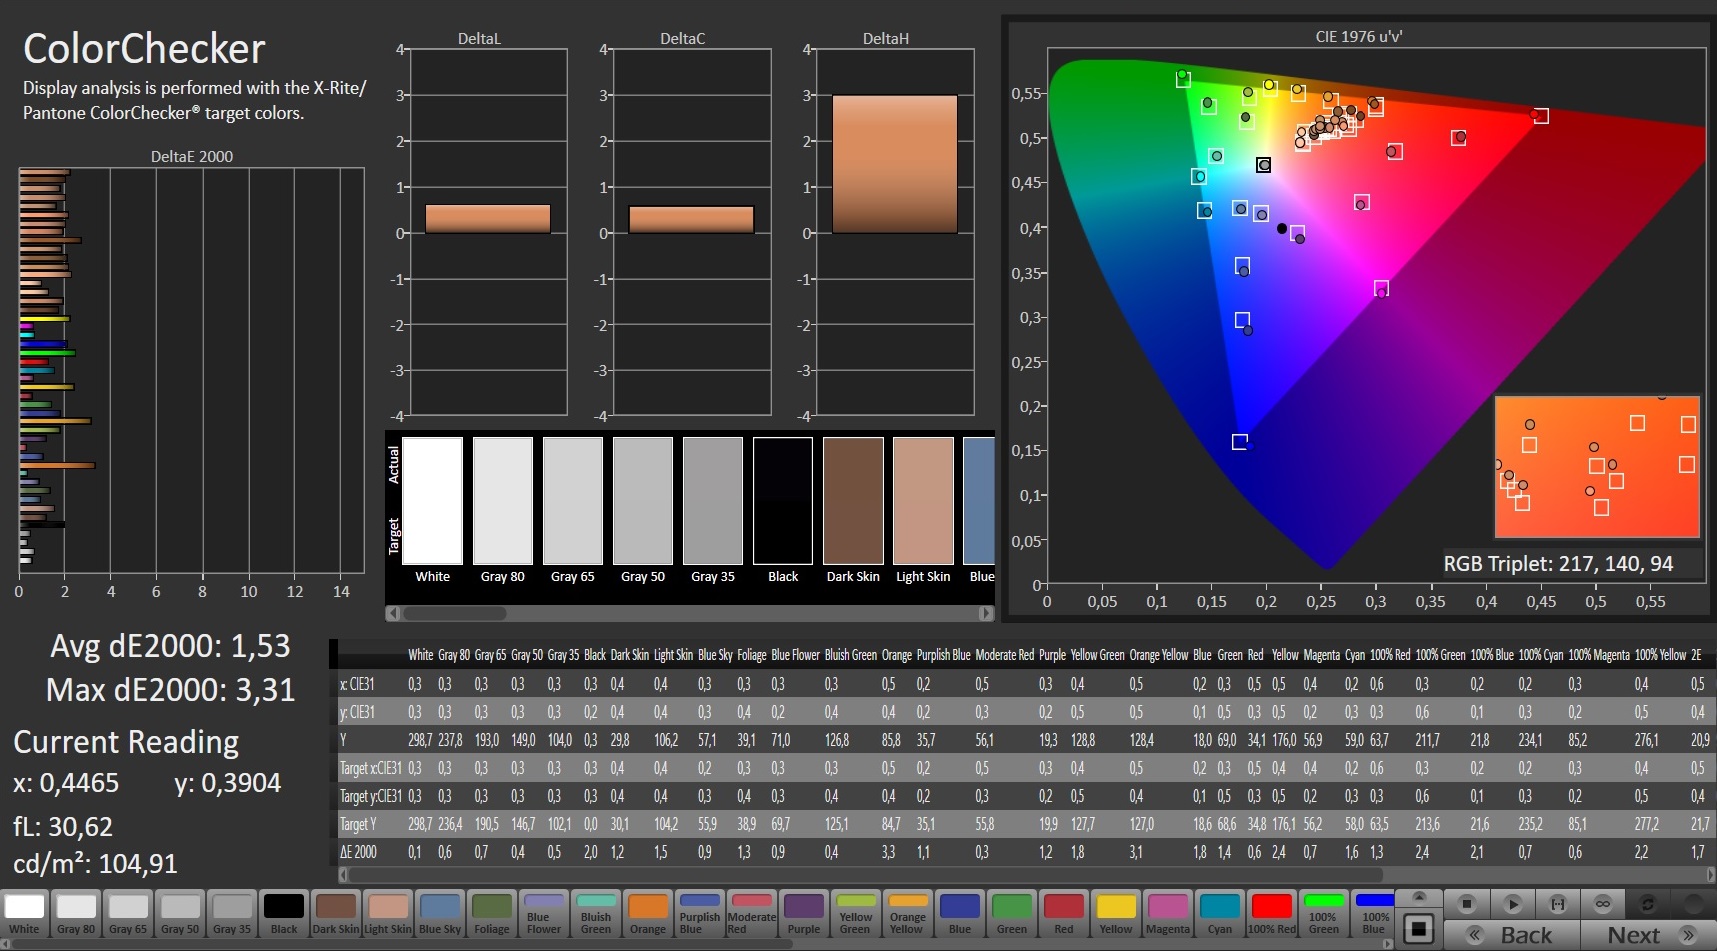
ΔE Color 4.42 | 0.5-29.43 Ø5, calibrated: 1.53
ΔE Greyscale 5.8 | 0.57-98 Ø5.3
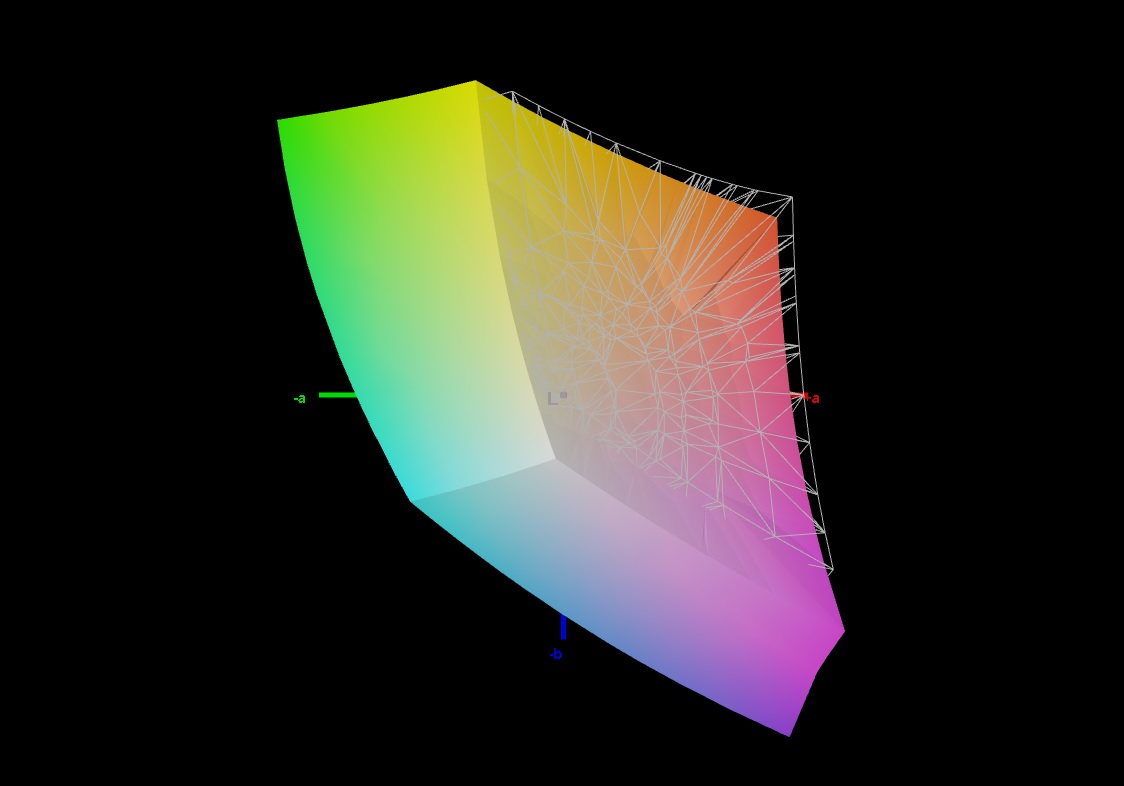
93% sRGB (Argyll 1.6.3 3D)
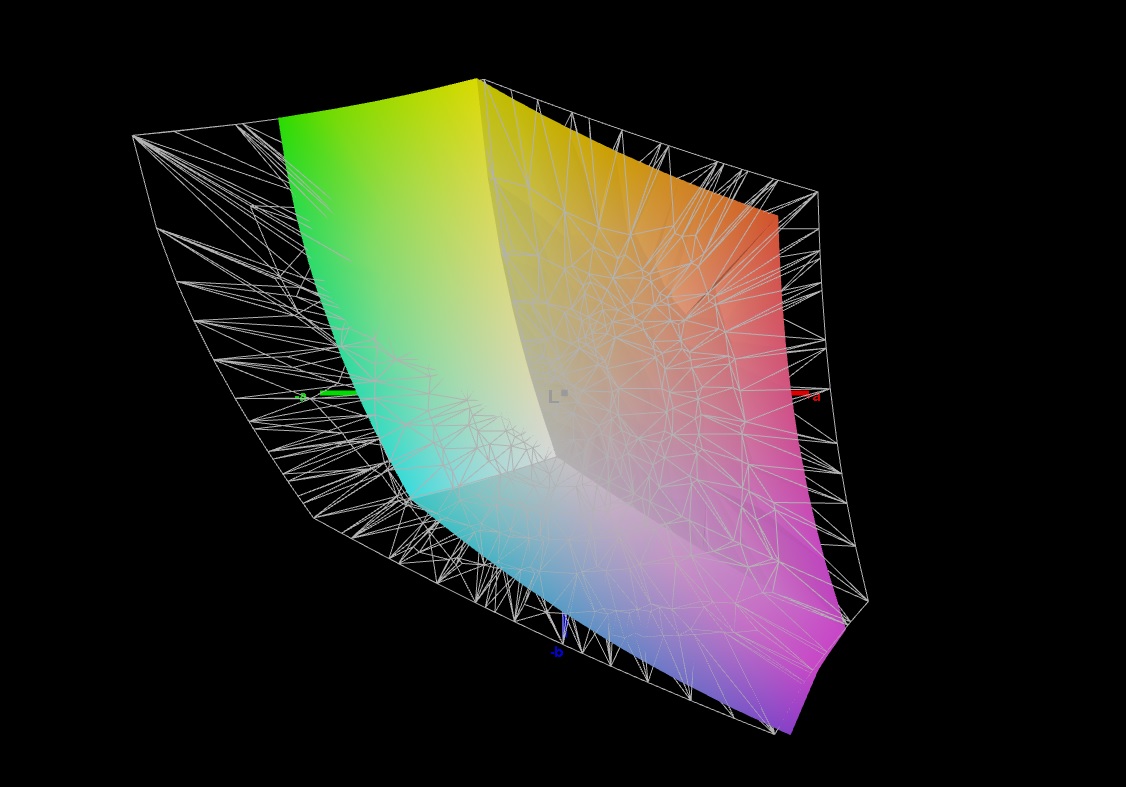
71% AdobeRGB 1998 (Argyll 1.6.3 3D)
71.2% AdobeRGB 1998 (Argyll 2.2.0 3D)
97.1% sRGB (Argyll 2.2.0 3D)
69.4% Display P3 (Argyll 2.2.0 3D)
Gamma: 2.261
| Lenovo Legion 5 17IMH05 AU Optronics B173HAN04.3, IPS, 1920x1080, 17.30 | MSI GF75 Thin 10SCXR AU Optronics B173HAN04.7, IPS, 1920x1080, 17.30 | Asus TUF A17 FA706IU-AS76 BOE NV173FHM-NX1, IPS, 1920x1080, 17.30 | HP Pavilion Gaming 17-cd0085cl BOE0825, IPS, 1920x1080, 17.30 | |
|---|---|---|---|---|
| Display | -42% | -41% | -9% | |
| Display P3 Coverage | 69.4 | 39.46 -43% | 40.55 -42% | 63.3 -9% |
| sRGB Coverage | 97.1 | 58.4 -40% | 59.7 -39% | 90.2 -7% |
| AdobeRGB 1998 Coverage | 71.2 | 40.77 -43% | 41.89 -41% | 64.3 -10% |
| Response Times | 9% | 37% | 24% | |
| Response Time Grey 50% / Grey 80% * | 38.4 ? | 34 ? 11% | 22.4 ? 42% | 31.6 ? 18% |
| Response Time Black / White * | 28 ? | 26.4 ? 6% | 19.2 ? 31% | 19.6 ? 30% |
| PWM Frequency | ||||
| Screen | -40% | -37% | -13% | |
| Brightness middle | 326 | 251.2 -23% | 264.8 -19% | 299.6 -8% |
| Brightness | 304 | 242 -20% | 253 -17% | 285 -6% |
| Brightness Distribution | 89 | 92 3% | 90 1% | 86 -3% |
| Black Level * | 0.25 | 0.34 -36% | 0.31 -24% | 0.33 -32% |
| Contrast | 1304 | 739 -43% | 854 -35% | 908 -30% |
| Colorchecker dE 2000 * | 4.42 | 4.5 -2% | 4.73 -7% | 3.68 17% |
| Colorchecker dE 2000 max. * | 9.44 | 20 -112% | 18.89 -100% | 8.05 15% |
| Colorchecker dE 2000 calibrated * | 1.53 | 3.91 -156% | 4.64 -203% | 3.15 -106% |
| Greyscale dE 2000 * | 5.8 | 4 31% | 1.4 76% | 3.8 34% |
| Gamma | 2.261 97% | 2.25 98% | 2.16 102% | 2.12 104% |
| CCT | 6822 95% | 5882 111% | 6641 98% | 7240 90% |
| Color Space (Percent of AdobeRGB 1998) | 71 | 37.3 -47% | 38.4 -46% | 58.1 -18% |
| Color Space (Percent of sRGB) | 93 | 58.1 -38% | 59.3 -36% | 89.8 -3% |
| Total Average (Program / Settings) | -24% /
-35% | -14% /
-29% | 1% /
-7% |
* ... smaller is better
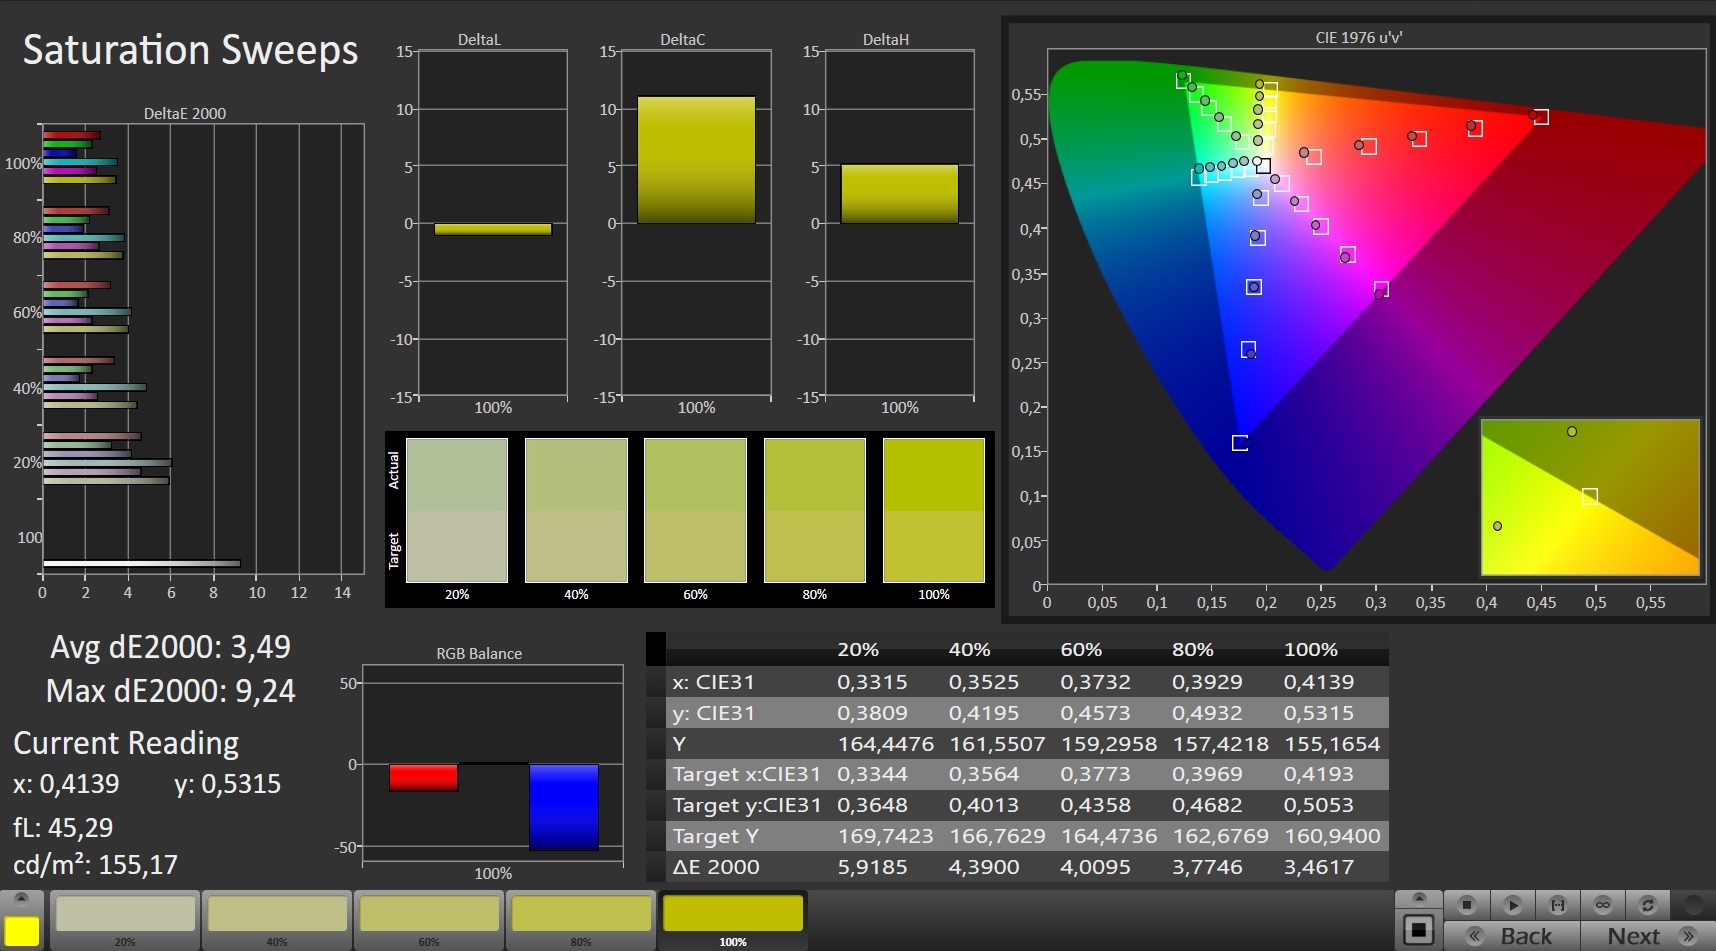
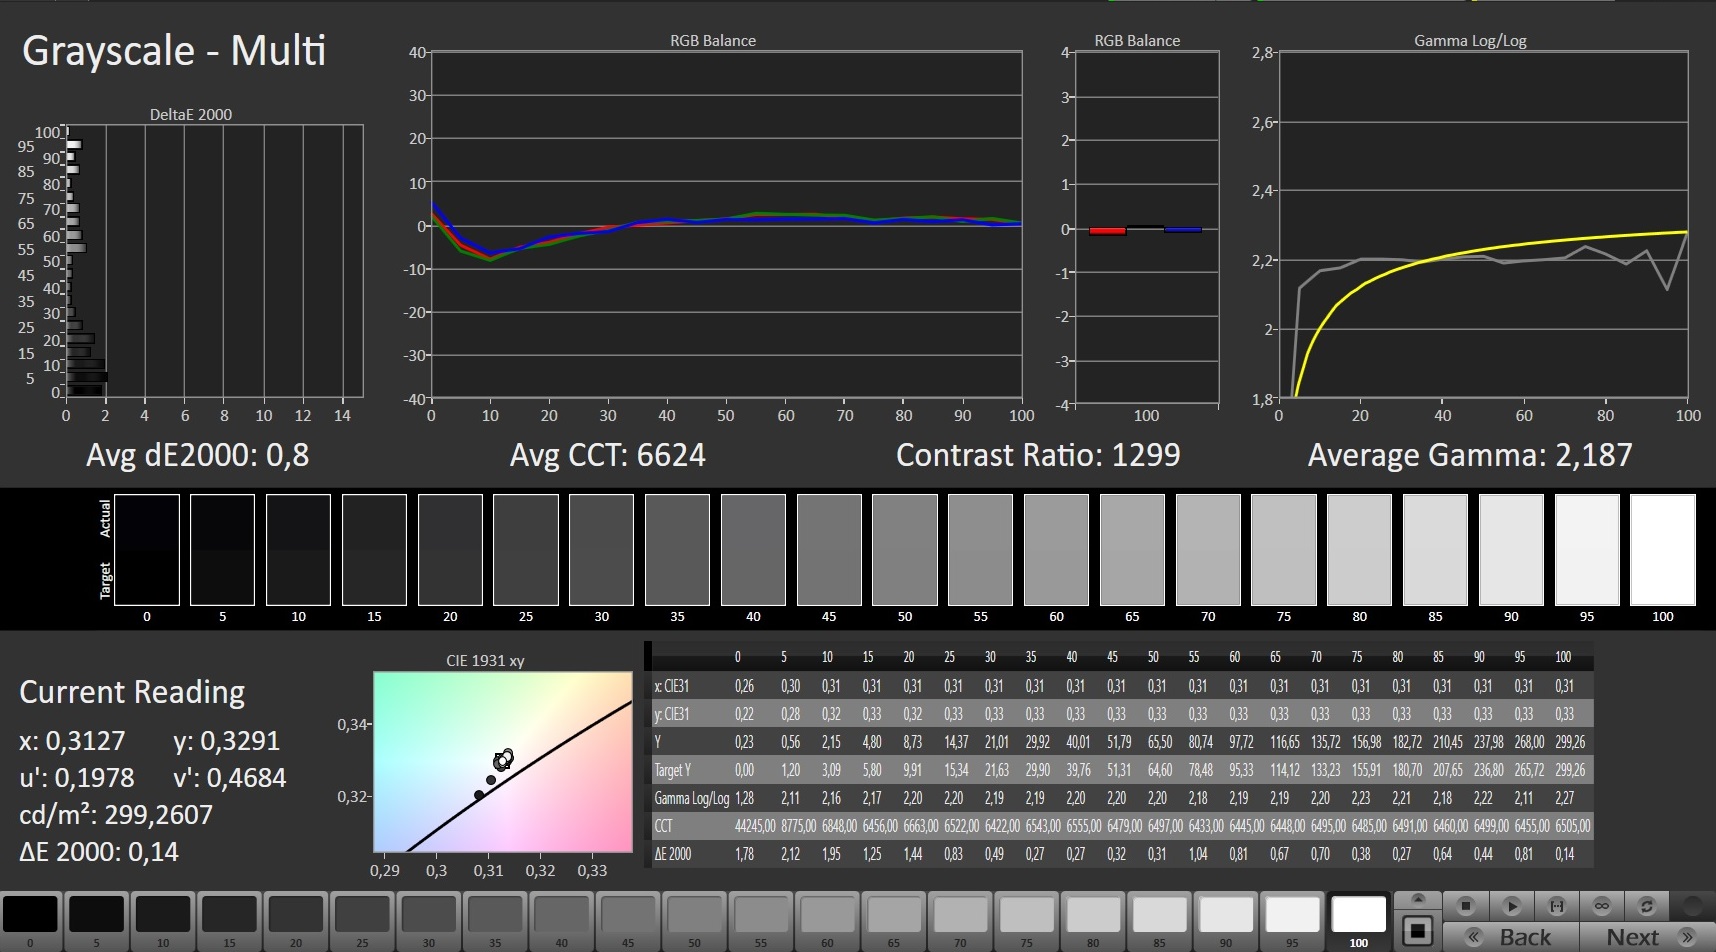
In the state of delivery, the display shows a decent color reproduction. However, with a Delta-E 2000 color deviation of 4.4, the target of Delta-E < 3 is missed. The display does not suffer from a blue tint. A calibration will improve the color reproduction with the color deviation dropping to 1.53 and the grayscale reproduction becoming more balanced. The AdobeRGB (71%) and sRGB (93%) color spaces are not covered completely.
Display Response Times
| ↔ Response Time Black to White | ||
|---|---|---|
| 28 ms ... rise ↗ and fall ↘ combined | ↗ 15.6 ms rise | 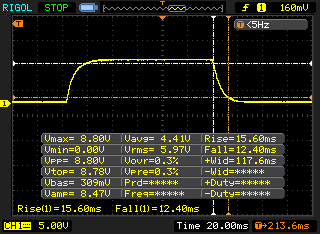 |
| ↘ 12.4 ms fall | ||
| The screen shows relatively slow response rates in our tests and may be too slow for gamers. In comparison, all tested devices range from 0.1 (minimum) to 240 (maximum) ms. » 67 % of all devices are better. This means that the measured response time is worse than the average of all tested devices (21.5 ms). | ||
| ↔ Response Time 50% Grey to 80% Grey | ||
| 38.4 ms ... rise ↗ and fall ↘ combined | ↗ 19.6 ms rise | 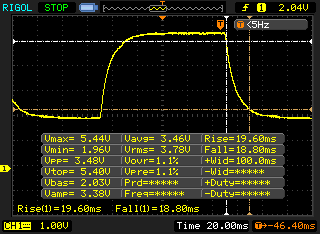 |
| ↘ 18.8 ms fall | ||
| The screen shows slow response rates in our tests and will be unsatisfactory for gamers. In comparison, all tested devices range from 0.2 (minimum) to 636 (maximum) ms. » 52 % of all devices are better. This means that the measured response time is worse than the average of all tested devices (33.7 ms). | ||
Screen Flickering / PWM (Pulse-Width Modulation)
| Screen flickering / PWM not detected | 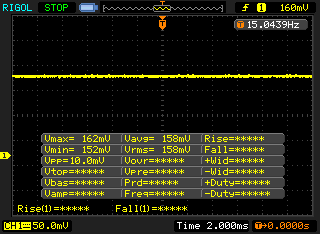 | ||
In comparison: 53 % of all tested devices do not use PWM to dim the display. If PWM was detected, an average of 17900 (minimum: 5 - maximum: 3846000) Hz was measured. | |||
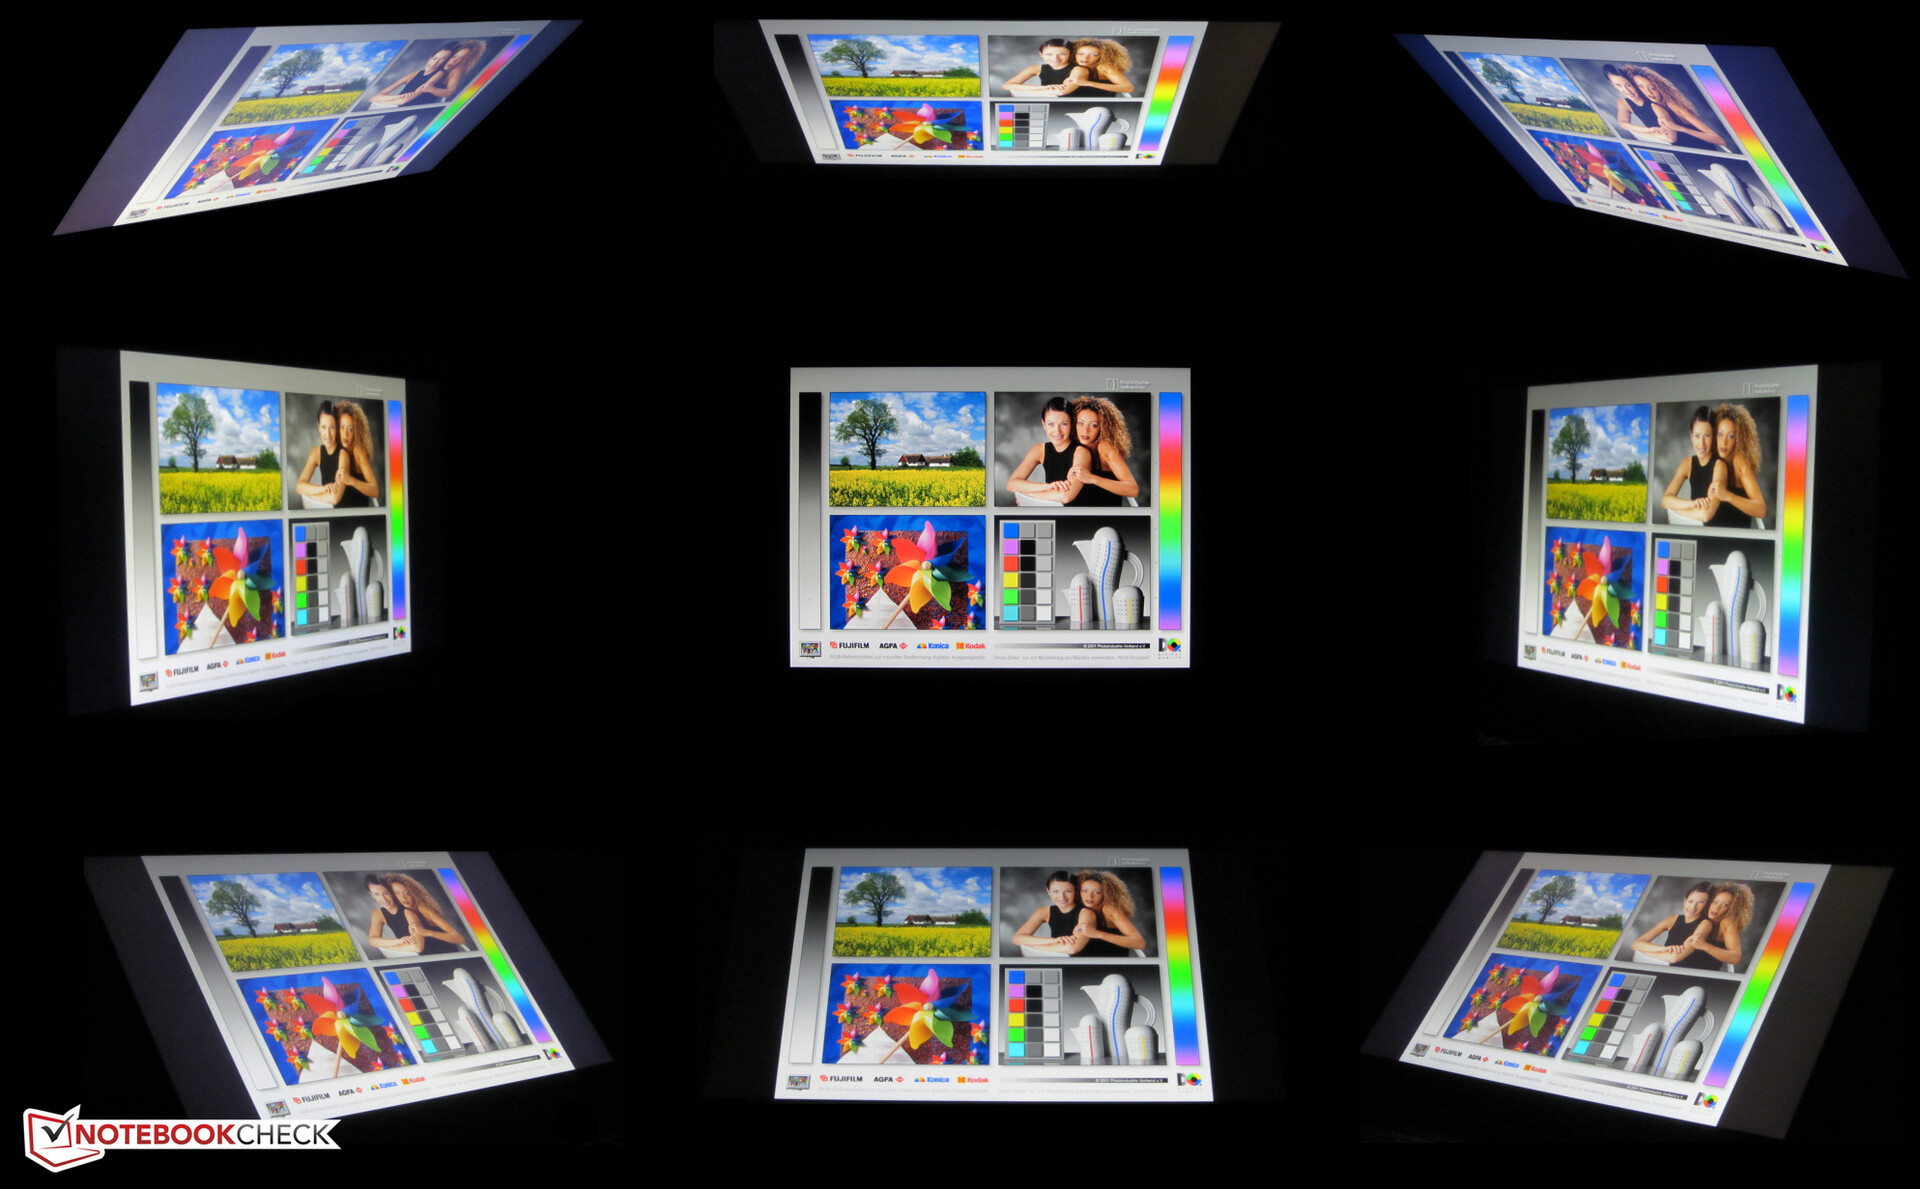
Lenovo has equipped the Legion with an IPS panel with stable viewing angles, allowing the display to be read from any viewing angle. Outdoors, the display contents can be read if the sunlight is not too bright.
Performance - The hardware runs at full power
The 17.3-inch Legion 5 17IMH05 gaming notebook is able to bring all the current games to the screen smoothly. While our test unit costs barely 1000 Euros (~$1172), other equipment variants are also available.
Test Conditions
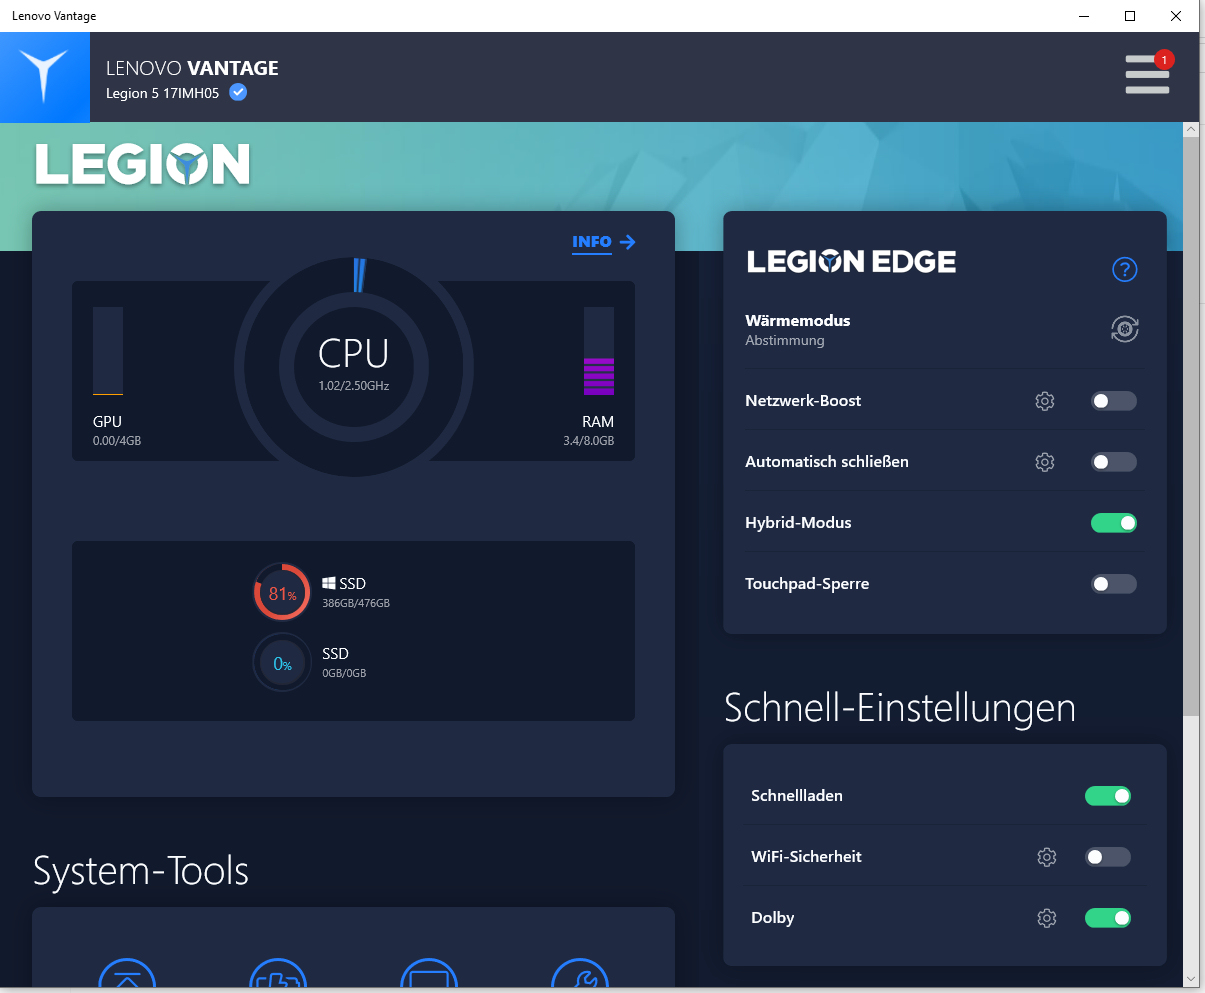
The preinstalled Lenovo Vantage software allows you to specify the temperature mode with the three options "Performance mode," "Balanced mode," and "Quiet mode" being available. We used the "Balanced mode" for running our tests, since it is active by default.
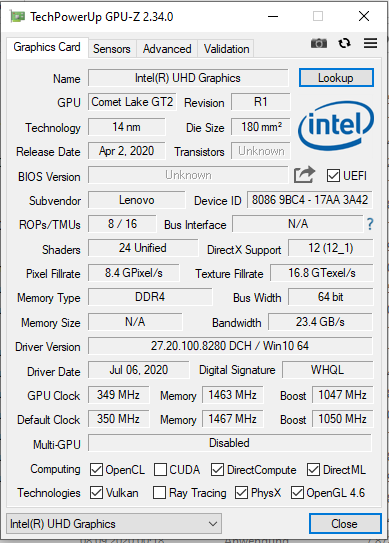
The integrated UHD Graphics-630 GPU can be turned on or off with the Lenovo Vantage software ("Hybrid mode"). We ran our tests with an active iGPU - which also means that the switching graphics solution (Optimus) was activated.
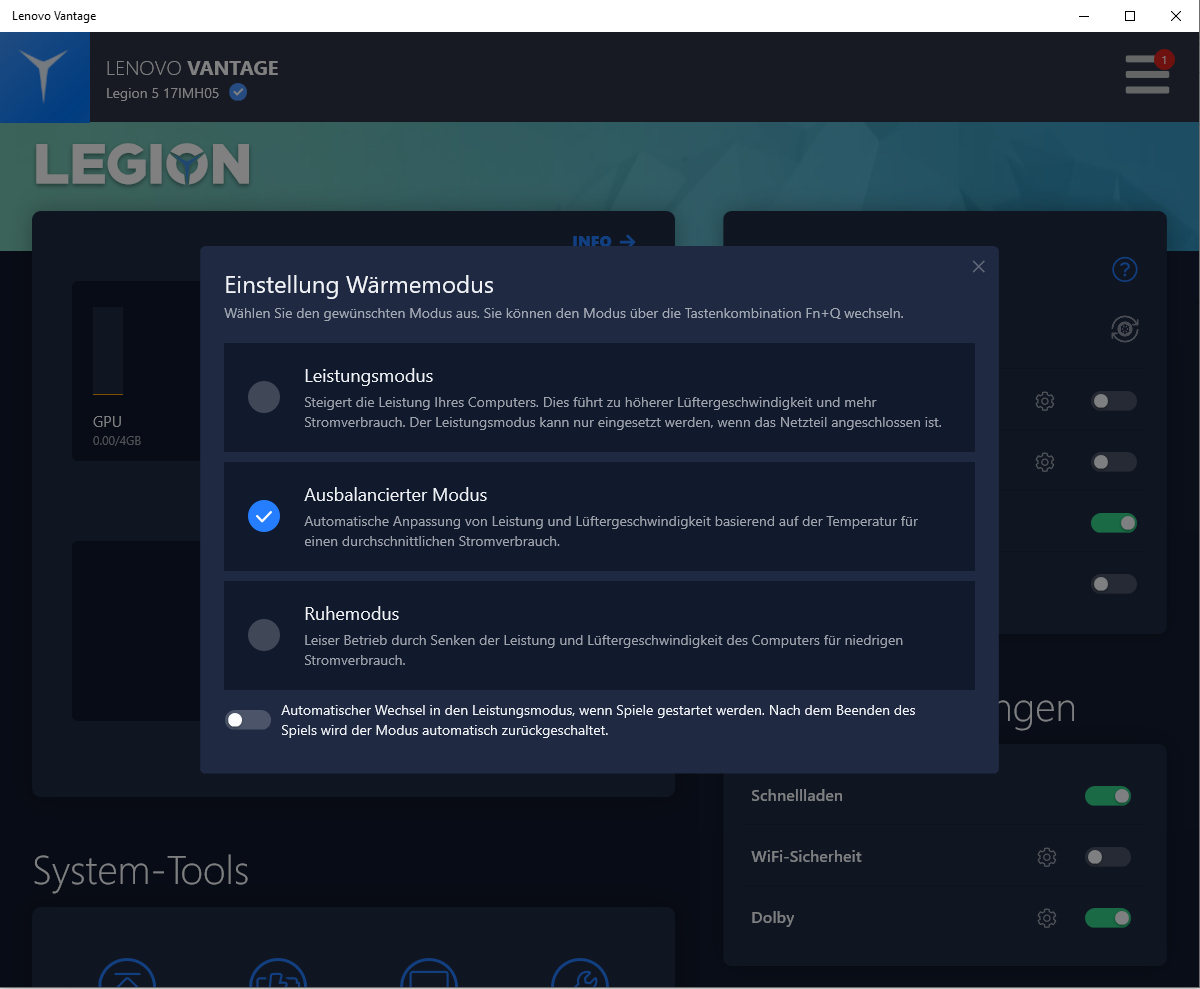
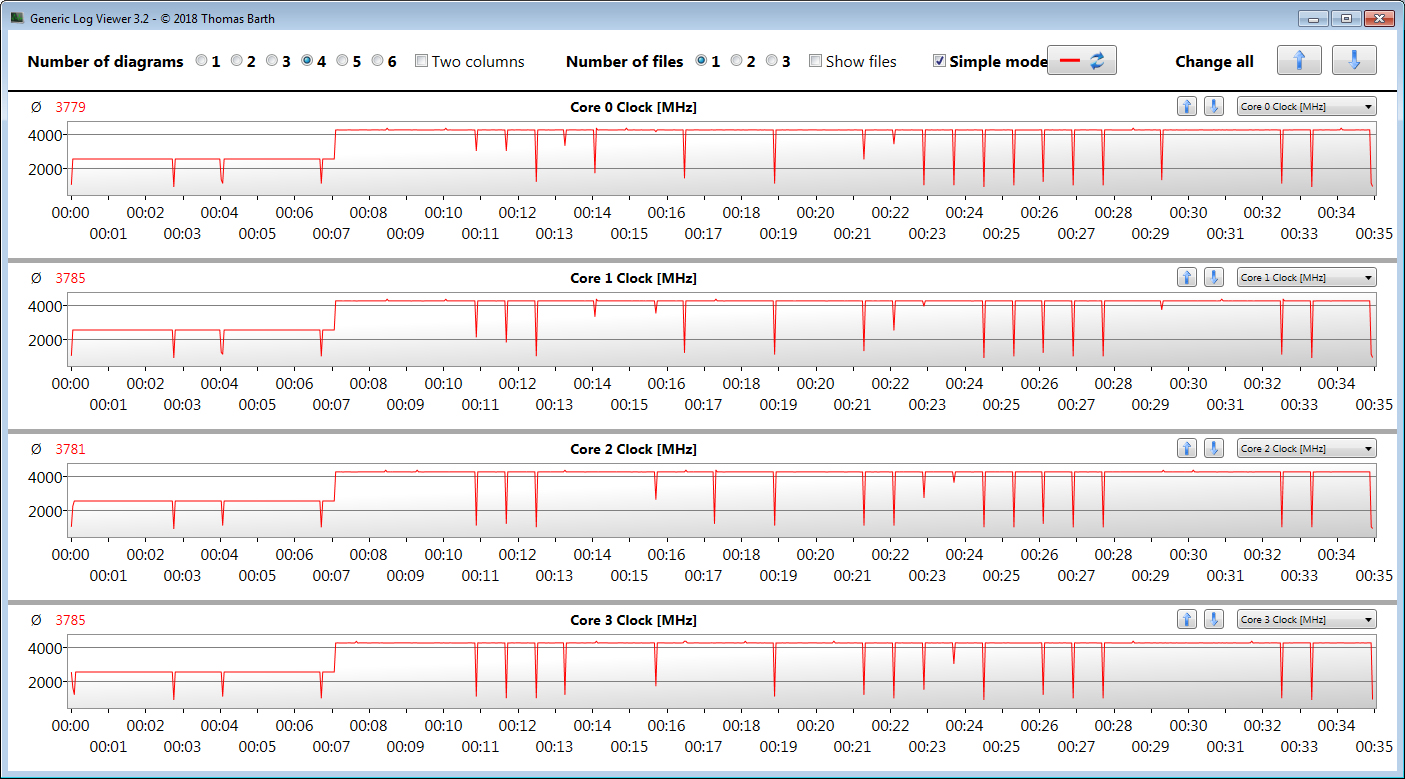
Balanced vs. Performance vs. Quiet Mode
The three temperature modes only influence the performance development of the processor. They have no effect on the GPU. If the Balanced mode is active, the CPU Turbo is only used after several minutes of sustained load. The same goes for the Quiet mode, but there the Turbo is not used fully. Only with the Performance mode activated, the Turbo is used immediately at full power.
So what is the effect of the Balanced mode? In the first minutes of a computer game, the frame rates may remain below the capabilities of the hardware, which depends on the CPU load of the game. Applications that only demand brief spurts of computing performance will not be able to use the Turbo. This is confirmed by the results in the various CPU benchmarks, the CB15 loop test, and the Witcher-3 test.
In our opinion, the Quiet mode represents the first choice for everyday operation. The fans run rarely or not at all, allowing for concentrated work. The CPU performance is more than sufficient for everyday usage scenarios.
Note: We ran the CPU and PC-Mark benchmarks in Performance mode as well as Balanced mode, and you can find the results in the comparison charts.
Processor
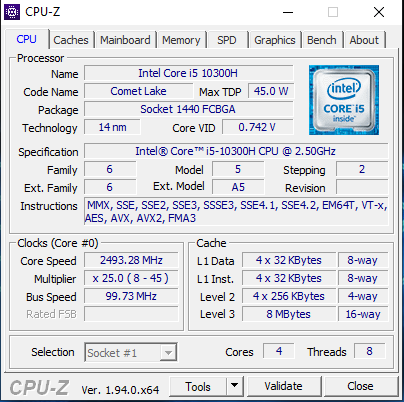
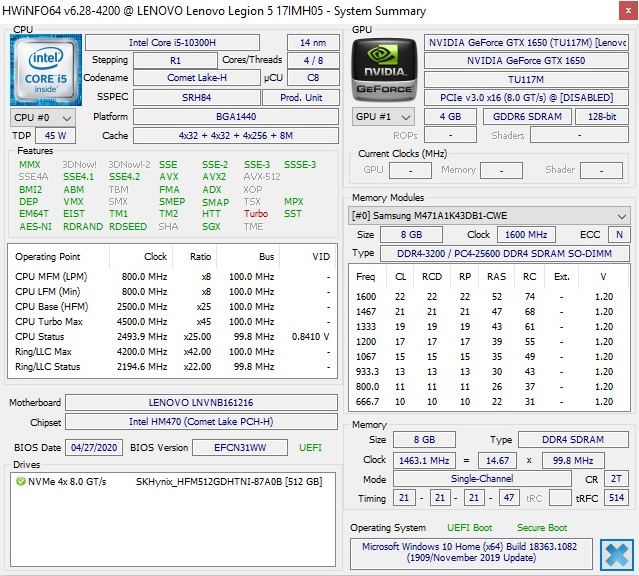
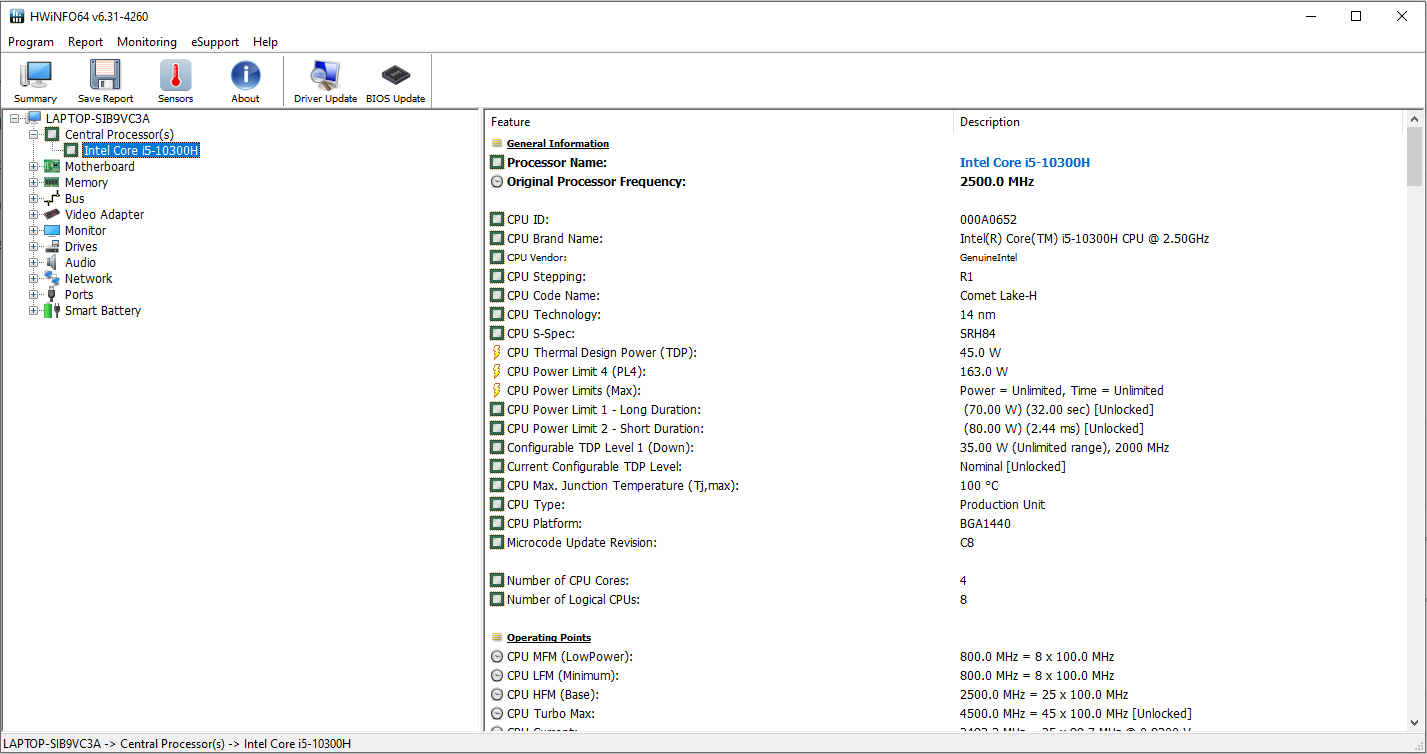
The Legion is run by a Core i5-10300H quad-core processor (Comet Lake), which runs at a basic core speed of 2.5 GHz. Via Turbo, the clock speed can be increased up to 4.2 GHz (four cores) and 4.5 GHz (single core). Hyper threading (running two threads per core) is supported.
The processor runs through the CPU tests of the Cinebench benchmarks at 4.2 GHz (multi-thread) and 4.2 to 4.5 GHz (single-thread). In battery operation, the clock speeds remain at 2.5 GHz (single and multi-thread).
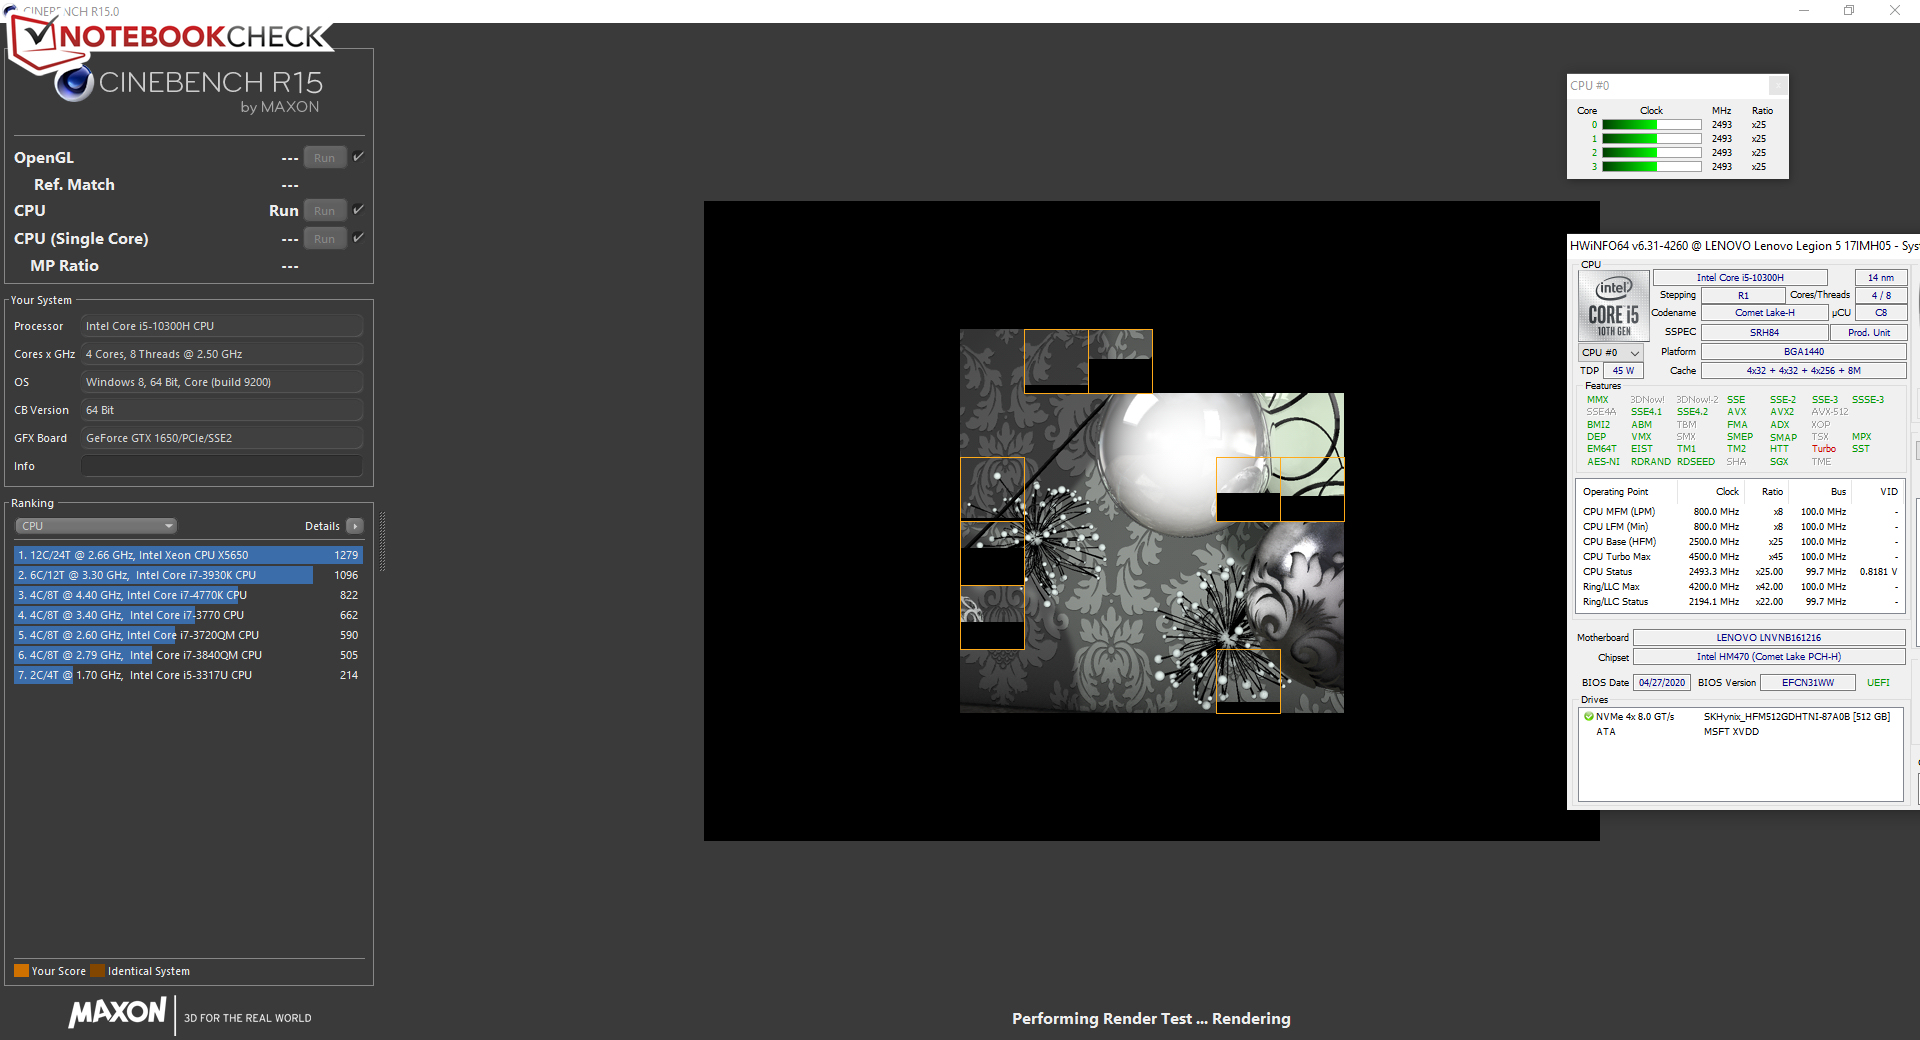
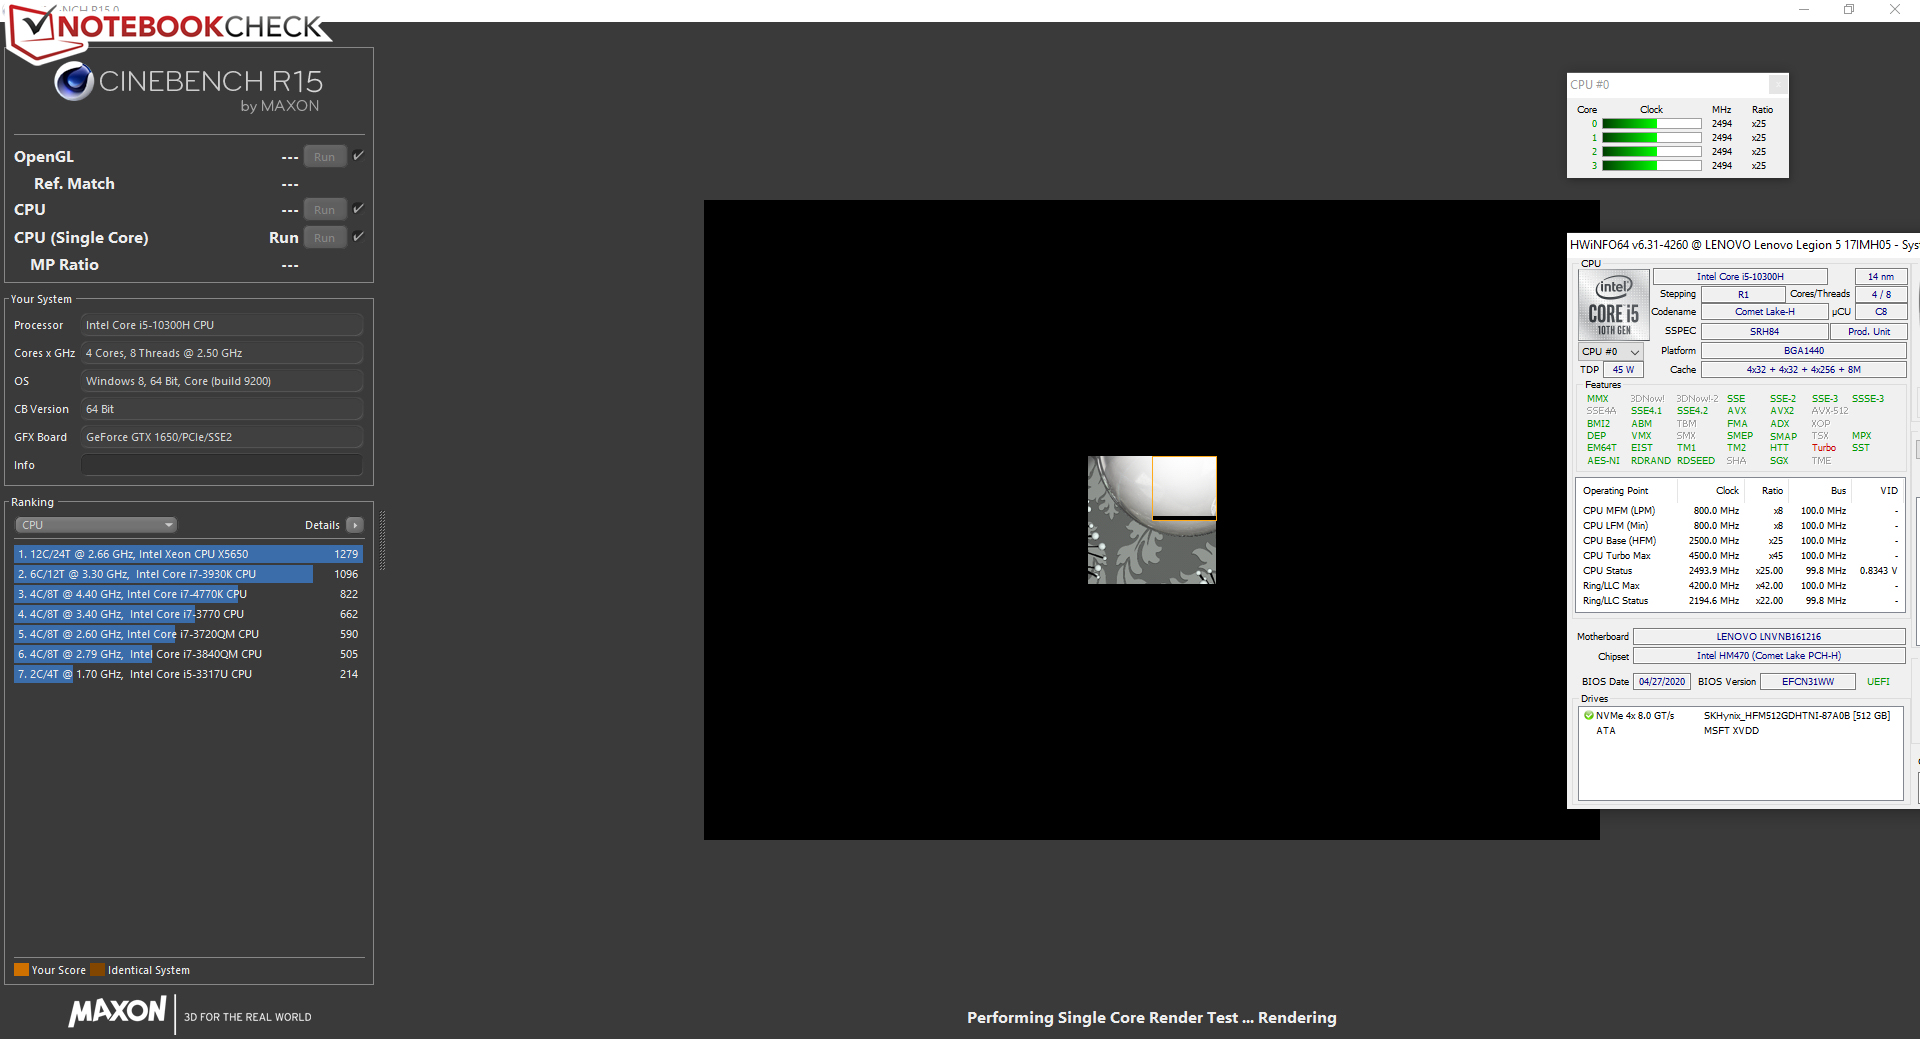
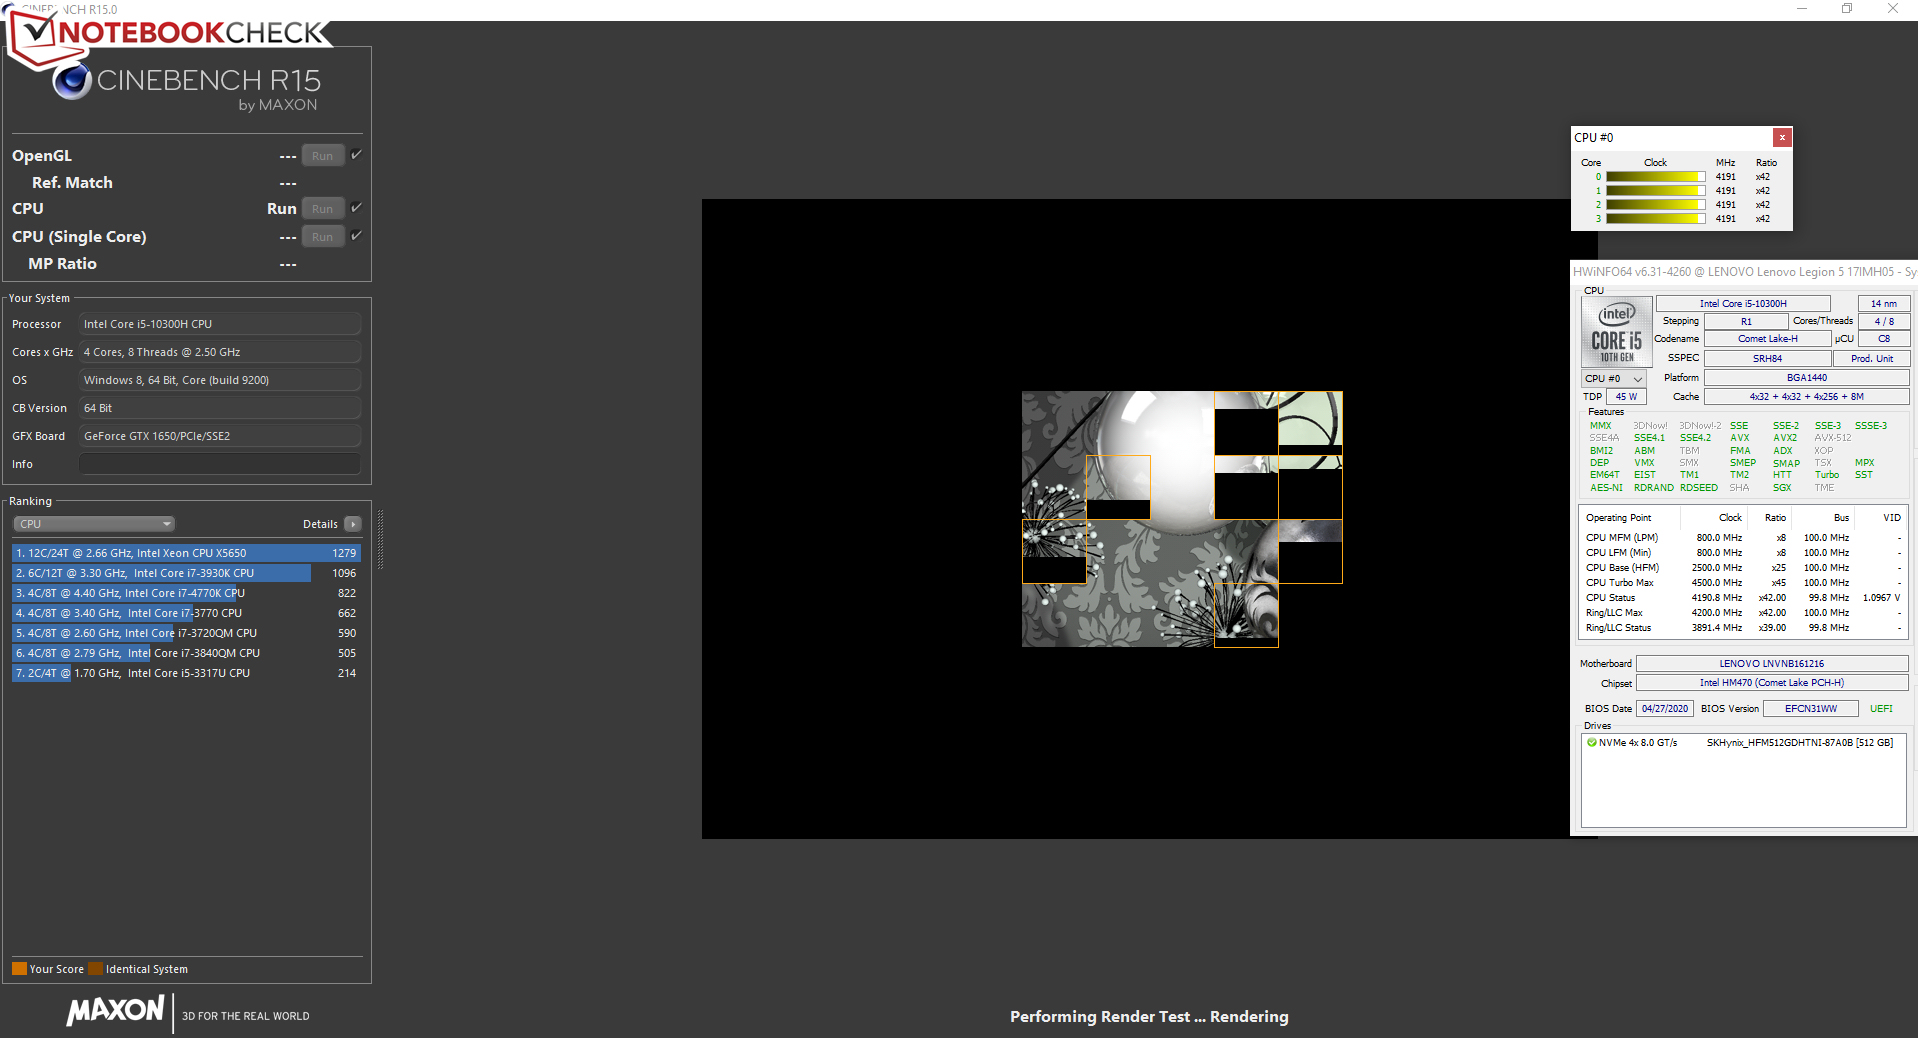
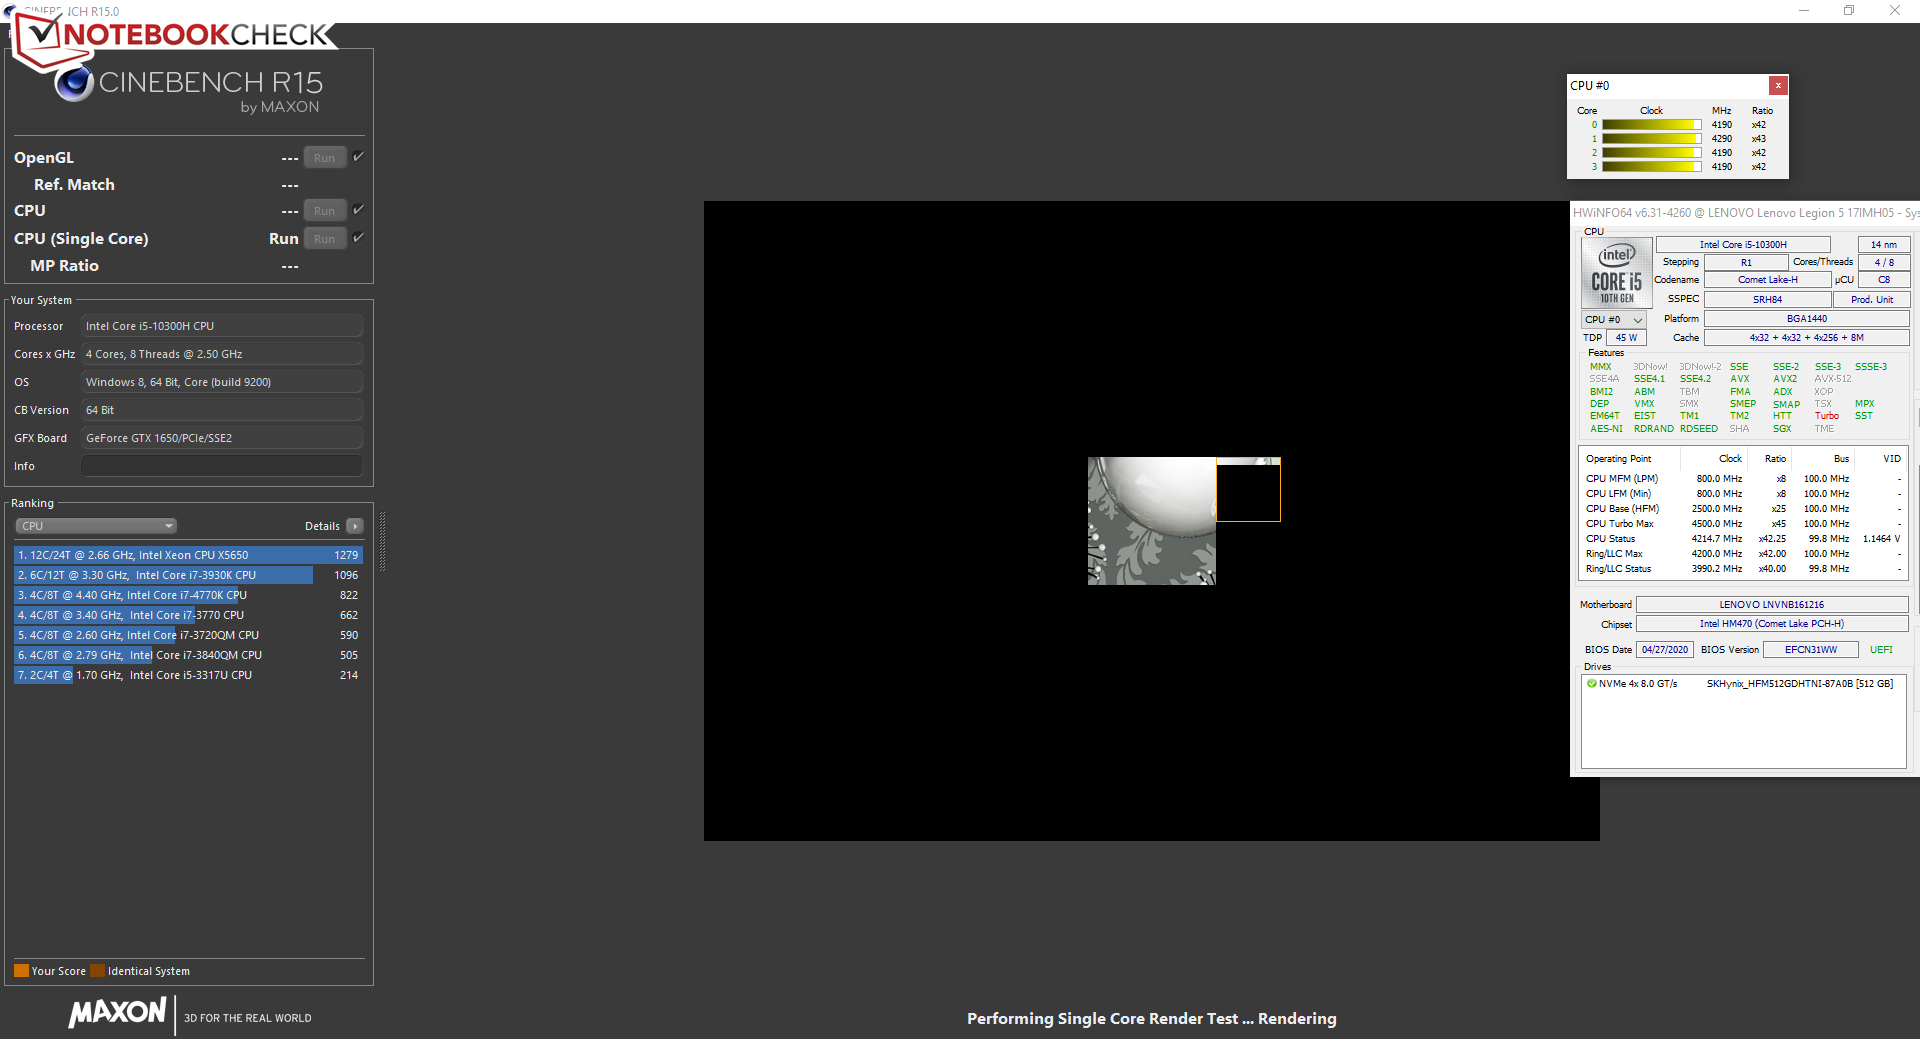
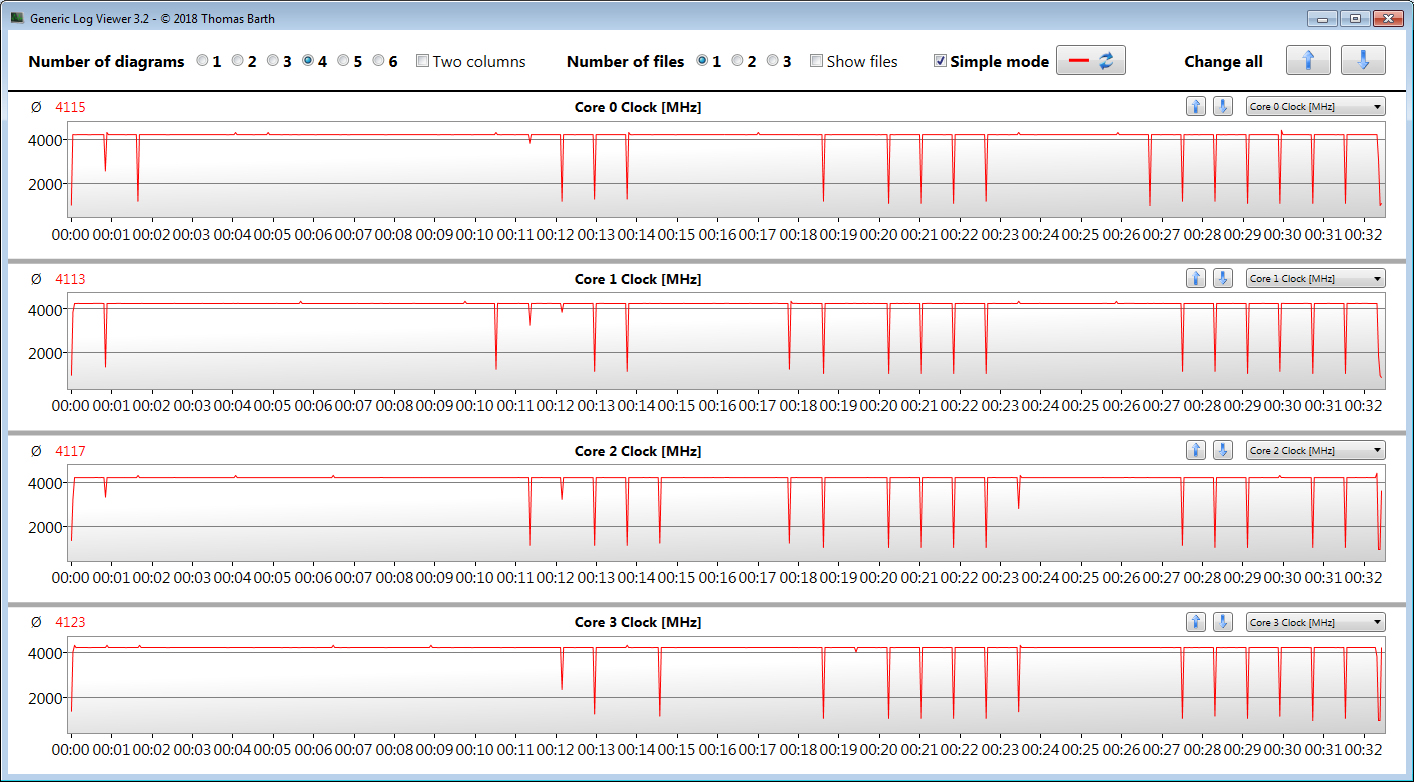
We evaluate whether the CPU Turbo is also used constantly in mains operation by running the multi-thread test of the Cinebench R15 benchmark for at least 30 minutes in a constant loop. While the Turbo is only used after the sixth run, it then runs at full speed. If the Performance mode is activated in the Lenovo Vantage software, the Turbo is used immediately.
| Cinebench R15 | |
| CPU Single 64Bit | |
| Average of class Gaming (79.2 - 318, n=234, last 2 years) | |
| HP Pavilion Gaming 17-cd0085cl | |
| Asus TUF A17 FA706IU-AS76 | |
| Lenovo Legion 5 17IMH05 (Leistungsmodus) | |
| MSI GF75 Thin 10SCXR | |
| Average Intel Core i5-10300H (108 - 194, n=17) | |
| Lenovo Legion 5 17IMH05 | |
| CPU Multi 64Bit | |
| Average of class Gaming (400 - 5663, n=235, last 2 years) | |
| Asus TUF A17 FA706IU-AS76 | |
| HP Pavilion Gaming 17-cd0085cl | |
| Lenovo Legion 5 17IMH05 (Leistungsmodus) | |
| MSI GF75 Thin 10SCXR | |
| Average Intel Core i5-10300H (536 - 921, n=17) | |
| Lenovo Legion 5 17IMH05 | |
| Blender - v2.79 BMW27 CPU | |
| MSI GF75 Thin 10SCXR | |
| Lenovo Legion 5 17IMH05 | |
| Average Intel Core i5-10300H (479 - 555, n=14) | |
| Lenovo Legion 5 17IMH05 (Leistungsmodus) | |
| Asus TUF A17 FA706IU-AS76 | |
| Average of class Gaming (87 - 1259, n=228, last 2 years) | |
| 7-Zip 18.03 | |
| 7z b 4 -mmt1 | |
| Average of class Gaming (2685 - 7581, n=229, last 2 years) | |
| Lenovo Legion 5 17IMH05 (Leistungsmodus) | |
| Asus TUF A17 FA706IU-AS76 | |
| Average Intel Core i5-10300H (2945 - 4956, n=14) | |
| MSI GF75 Thin 10SCXR | |
| Lenovo Legion 5 17IMH05 | |
| 7z b 4 | |
| Average of class Gaming (11386 - 140932, n=229, last 2 years) | |
| Asus TUF A17 FA706IU-AS76 | |
| Lenovo Legion 5 17IMH05 (Leistungsmodus) | |
| Average Intel Core i5-10300H (15146 - 24841, n=14) | |
| MSI GF75 Thin 10SCXR | |
| Lenovo Legion 5 17IMH05 | |
| Cinebench R20 | |
| CPU (Single Core) | |
| Average of class Gaming (169 - 855, n=230, last 2 years) | |
| Asus TUF A17 FA706IU-AS76 | |
| Lenovo Legion 5 17IMH05 (Leistungsmodus) | |
| Average Intel Core i5-10300H (312 - 470, n=15) | |
| MSI GF75 Thin 10SCXR | |
| Lenovo Legion 5 17IMH05 | |
| CPU (Multi Core) | |
| Average of class Gaming (930 - 13769, n=230, last 2 years) | |
| Asus TUF A17 FA706IU-AS76 | |
| Lenovo Legion 5 17IMH05 (Leistungsmodus ) | |
| Average Intel Core i5-10300H (1397 - 2240, n=15) | |
| MSI GF75 Thin 10SCXR | |
| Lenovo Legion 5 17IMH05 | |
| Geekbench 5.5 | |
| Single-Core | |
| Average of class Gaming (158 - 2210, n=234, last 2 years) | |
| Asus TUF A17 FA706IU-AS76 | |
| Lenovo Legion 5 17IMH05 (Leistungsmodus) | |
| Average Intel Core i5-10300H (703 - 1241, n=16) | |
| MSI GF75 Thin 10SCXR | |
| Lenovo Legion 5 17IMH05 | |
| Multi-Core | |
| Average of class Gaming (1946 - 22200, n=234, last 2 years) | |
| Asus TUF A17 FA706IU-AS76 | |
| Average Intel Core i5-10300H (2783 - 4728, n=16) | |
| Lenovo Legion 5 17IMH05 (Leistungsmodus) | |
| MSI GF75 Thin 10SCXR | |
| Lenovo Legion 5 17IMH05 | |
| HWBOT x265 Benchmark v2.2 - 4k Preset | |
| Average of class Gaming (3 - 37.6, n=232, last 2 years) | |
| Asus TUF A17 FA706IU-AS76 | |
| Lenovo Legion 5 17IMH05 (Leistungsmodus) | |
| Average Intel Core i5-10300H (6.13 - 7.78, n=14) | |
| MSI GF75 Thin 10SCXR | |
| Lenovo Legion 5 17IMH05 | |
| LibreOffice - 20 Documents To PDF | |
| Lenovo Legion 5 17IMH05 | |
| Asus TUF A17 FA706IU-AS76 | |
| MSI GF75 Thin 10SCXR | |
| Average Intel Core i5-10300H (23.9 - 94, n=14) | |
| Lenovo Legion 5 17IMH05 (Leistungsmodus) | |
| Average of class Gaming (32.8 - 332, n=226, last 2 years) | |
| R Benchmark 2.5 - Overall mean | |
| Lenovo Legion 5 17IMH05 | |
| Average Intel Core i5-10300H (0.625 - 1.088, n=14) | |
| MSI GF75 Thin 10SCXR | |
| Lenovo Legion 5 17IMH05 (Leistungsmodus) | |
| Asus TUF A17 FA706IU-AS76 | |
| Average of class Gaming (0.3609 - 4.47, n=229, last 2 years) | |
* ... smaller is better
System Performance
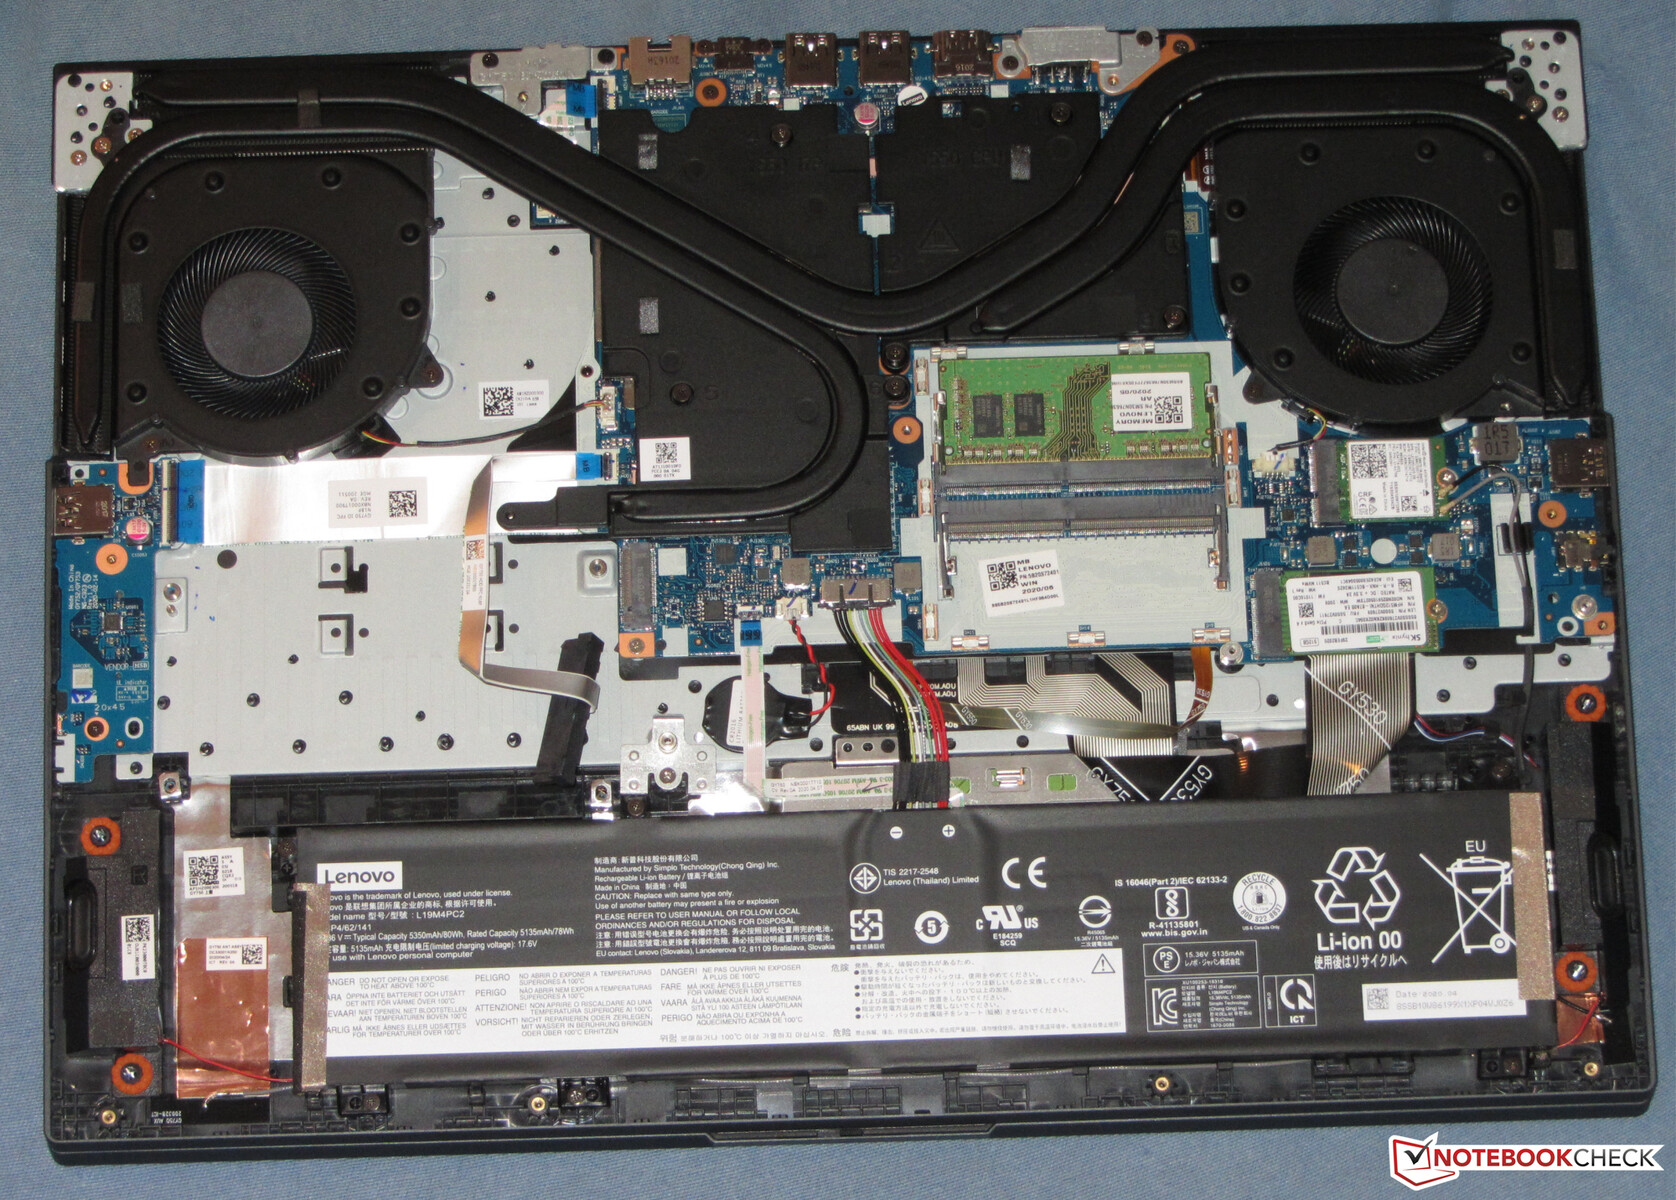
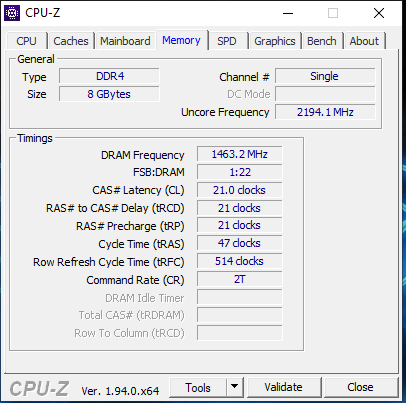
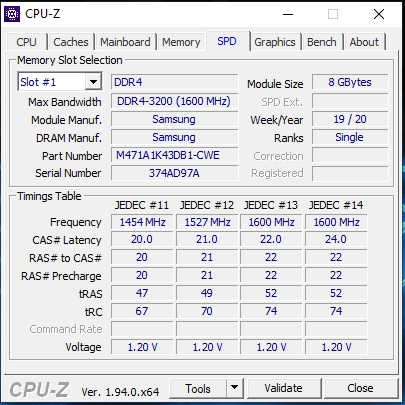
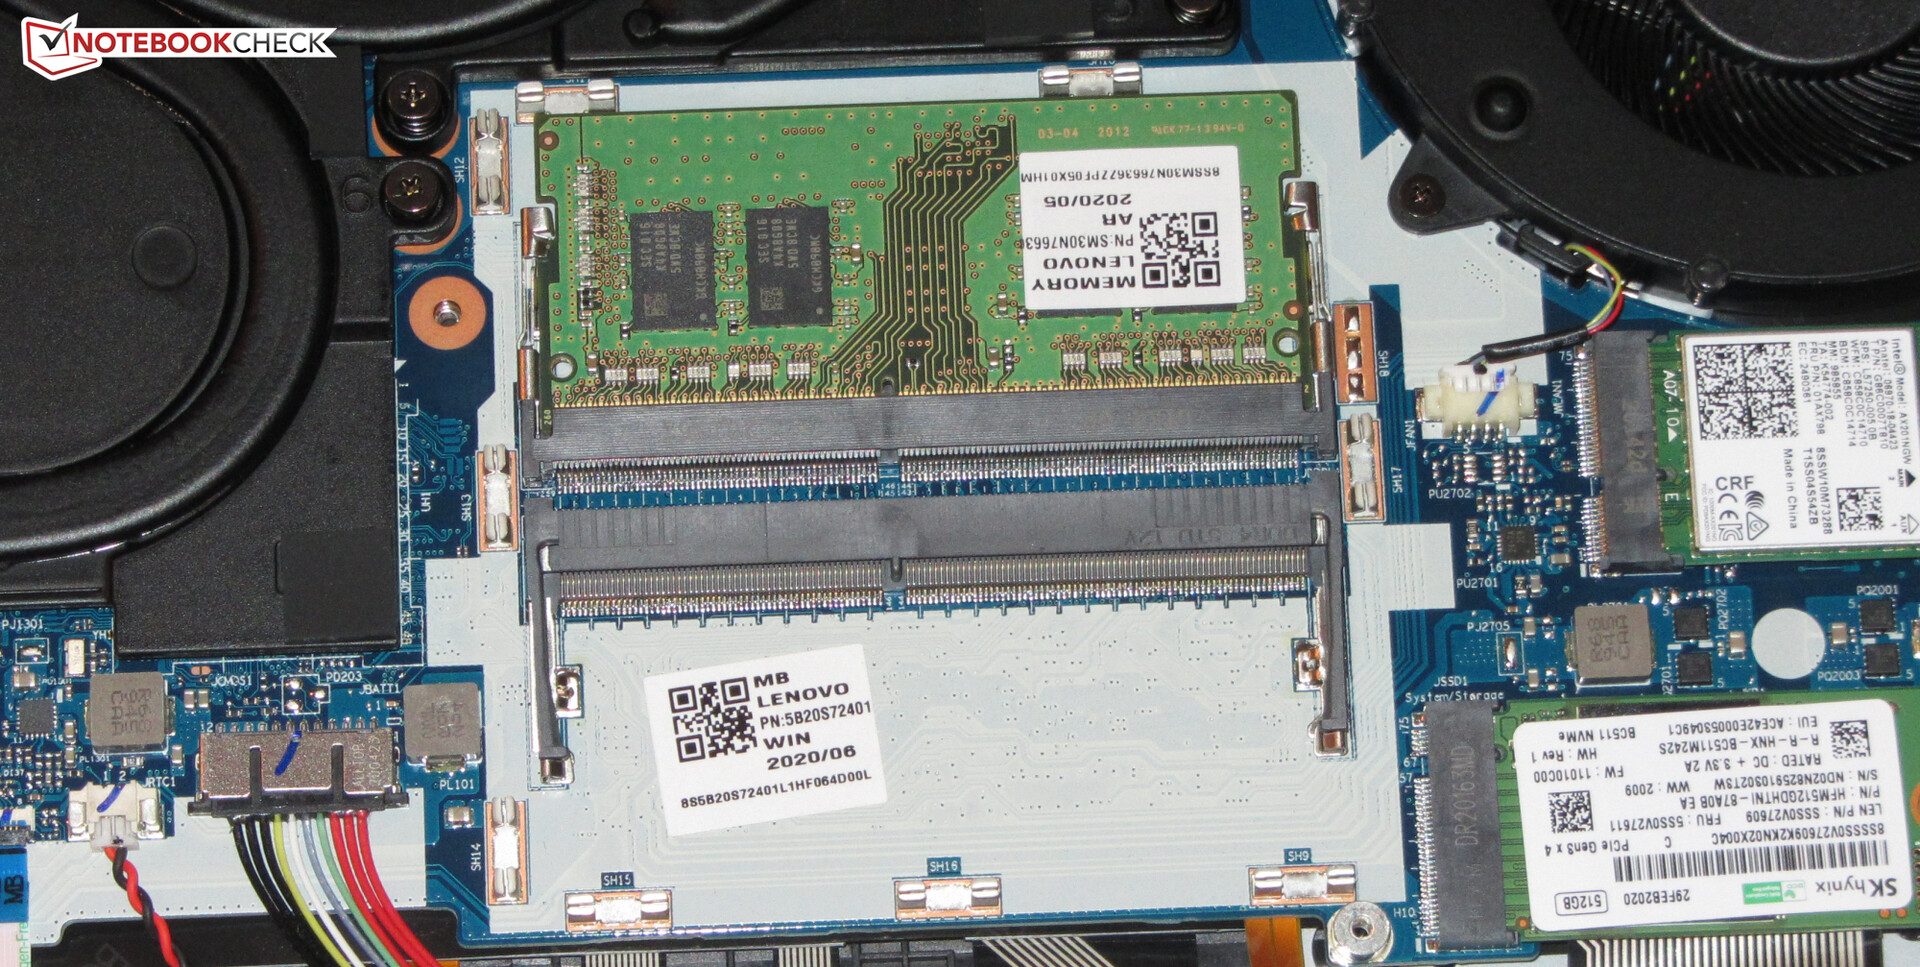
The system runs smoothly and is well-rounded. The Core i5 processor offers sufficient computing performance for all the usual application areas, and the dedicated graphics core allows using computer games. The overall performance could be slightly increased by activating the dual-channel mode. To do that, you would need to install a second working memory module into the notebook.
| PCMark 8 Home Score Accelerated v2 | 3181 points | |
| PCMark 8 Creative Score Accelerated v2 | 2954 points | |
| PCMark 8 Work Score Accelerated v2 | 4265 points | |
| PCMark 10 Score | 4077 points | |
Help | ||
| PCMark 10 - Score | |
| Average of class Gaming (5235 - 9852, n=200, last 2 years) | |
| Asus TUF A17 FA706IU-AS76 | |
| HP Pavilion Gaming 17-cd0085cl | |
| MSI GF75 Thin 10SCXR | |
| Average Intel Core i5-10300H, NVIDIA GeForce GTX 1650 Mobile (4077 - 5301, n=5) | |
| Lenovo Legion 5 17IMH05 (Leistungsmodus) | |
| Lenovo Legion 5 17IMH05 | |
| PCMark 8 | |
| Home Score Accelerated v2 | |
| Average of class Gaming (4166 - 6653, n=34, last 2 years) | |
| Asus TUF A17 FA706IU-AS76 | |
| HP Pavilion Gaming 17-cd0085cl | |
| MSI GF75 Thin 10SCXR | |
| Average Intel Core i5-10300H, NVIDIA GeForce GTX 1650 Mobile (3181 - 3971, n=5) | |
| Lenovo Legion 5 17IMH05 (Leistungsmodus) | |
| Lenovo Legion 5 17IMH05 | |
| Work Score Accelerated v2 | |
| Average of class Gaming (4622 - 7085, n=32, last 2 years) | |
| Asus TUF A17 FA706IU-AS76 | |
| MSI GF75 Thin 10SCXR | |
| HP Pavilion Gaming 17-cd0085cl | |
| Lenovo Legion 5 17IMH05 (Leistungsmodus) | |
| Average Intel Core i5-10300H, NVIDIA GeForce GTX 1650 Mobile (4265 - 5276, n=5) | |
| Lenovo Legion 5 17IMH05 | |
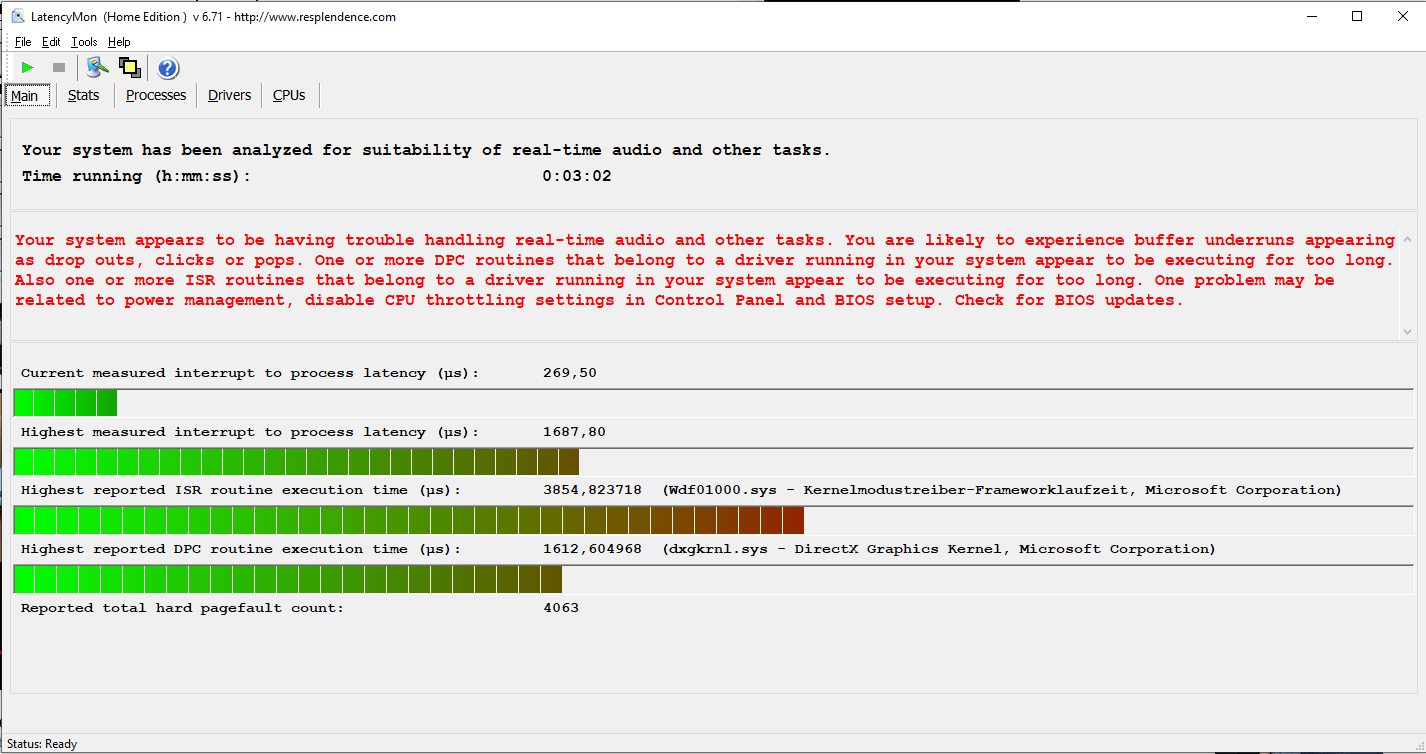
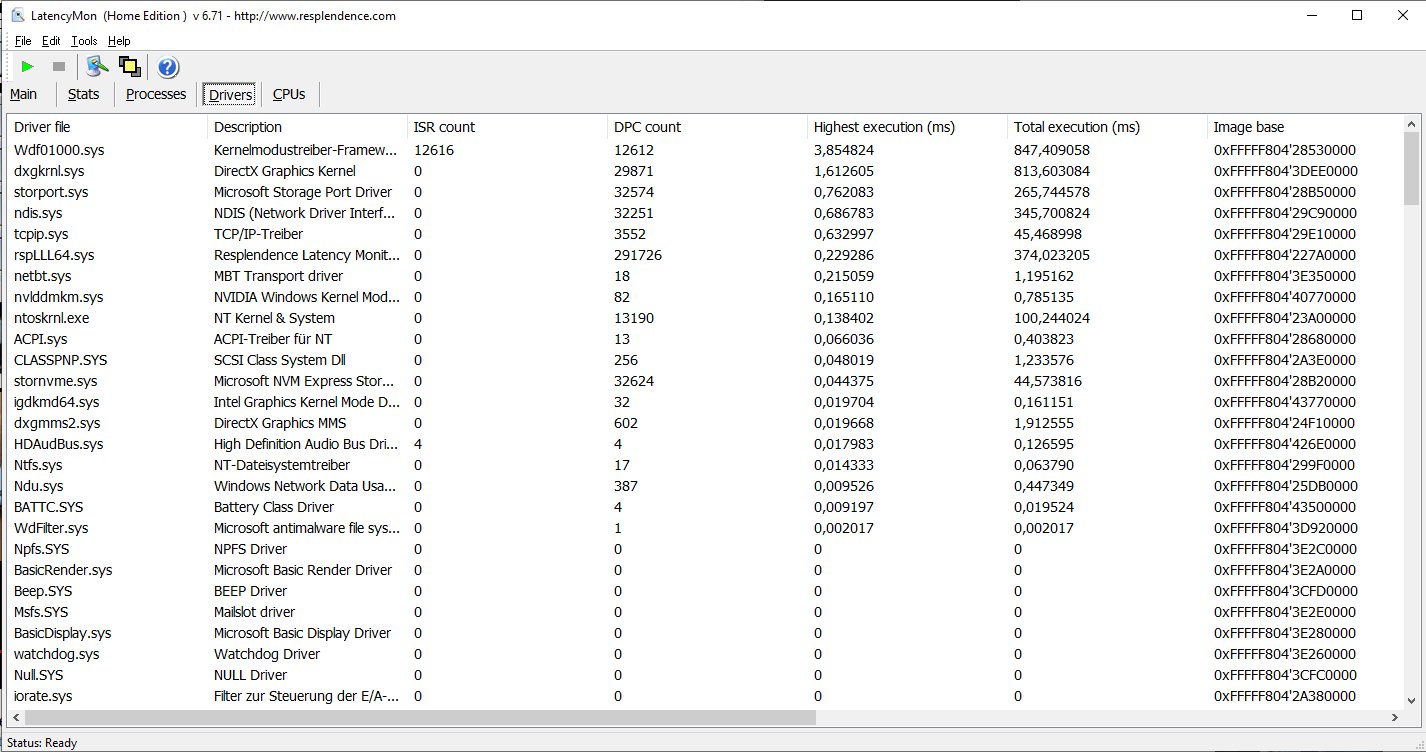
DPC Latencies
We were able to see some conspicuous behavior in the DPC latencies in our standardized Latency Monitor test (web surfing, 4k video reproduction, Prime95 high load). The system does not appear to be suited for real-time video and audio processing.
| DPC Latencies / LatencyMon - interrupt to process latency (max), Web, Youtube, Prime95 | |
| Asus TUF A17 FA706IU-AS76 | |
| MSI GF75 Thin 10SCXR | |
| Lenovo Legion 5 17IMH05 | |
* ... smaller is better
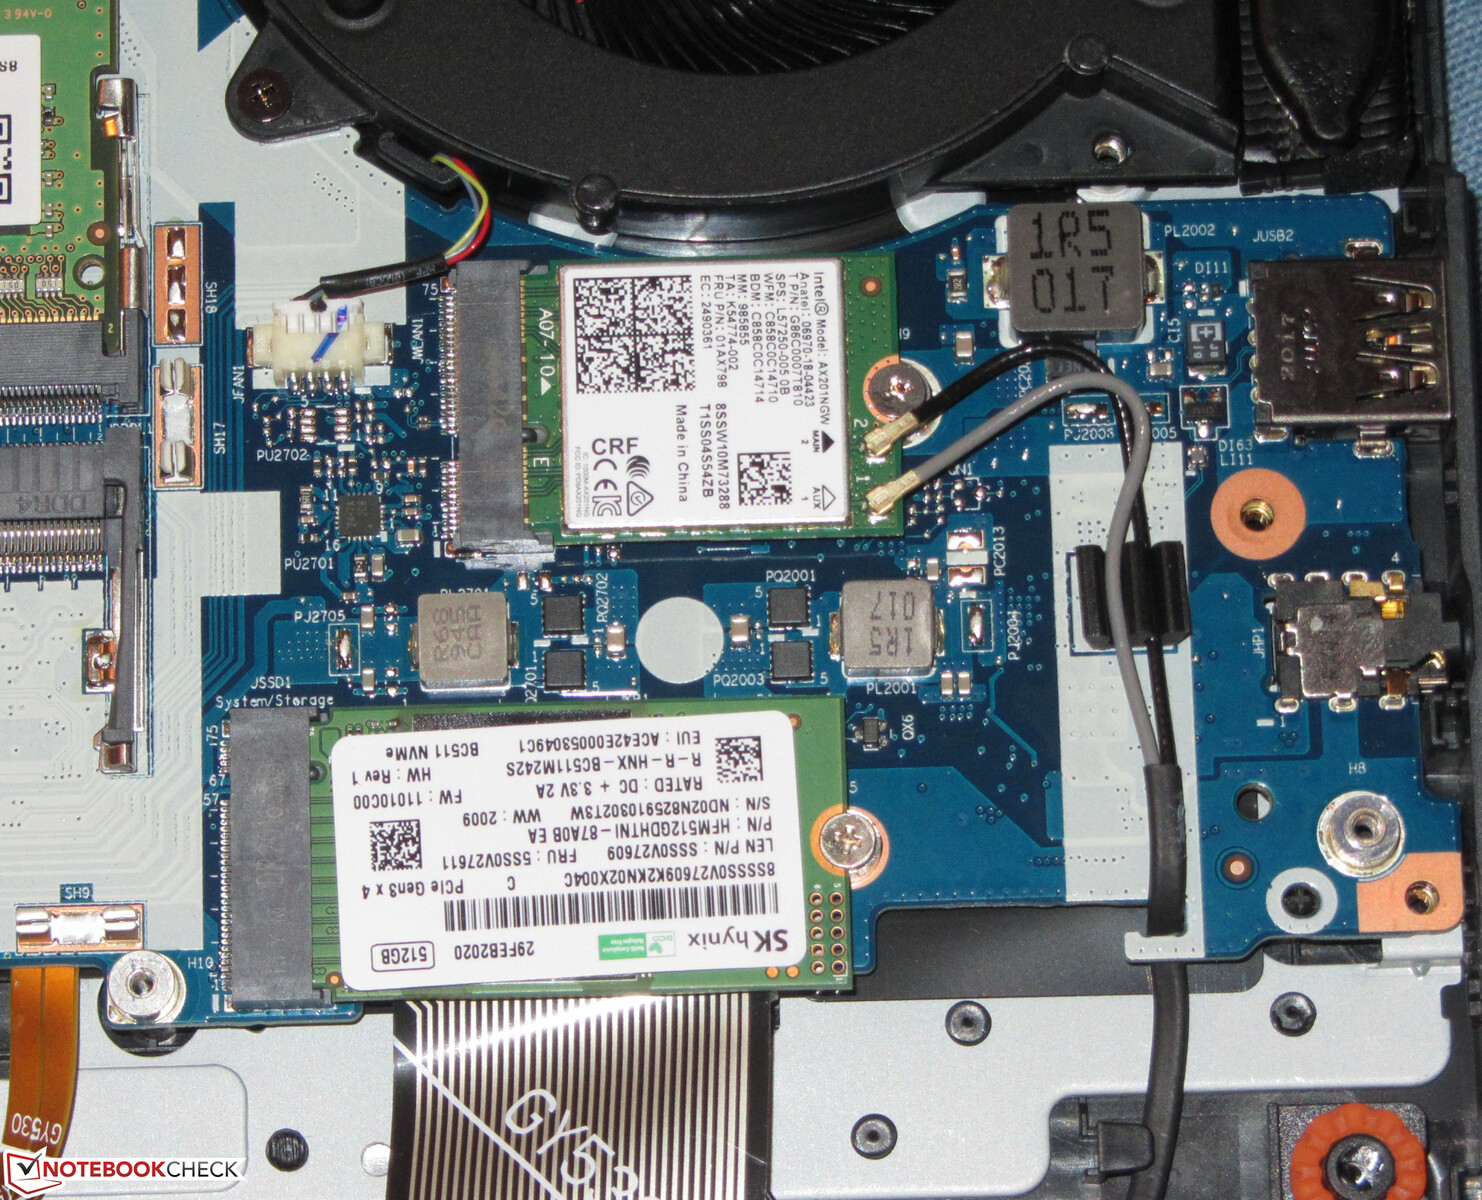
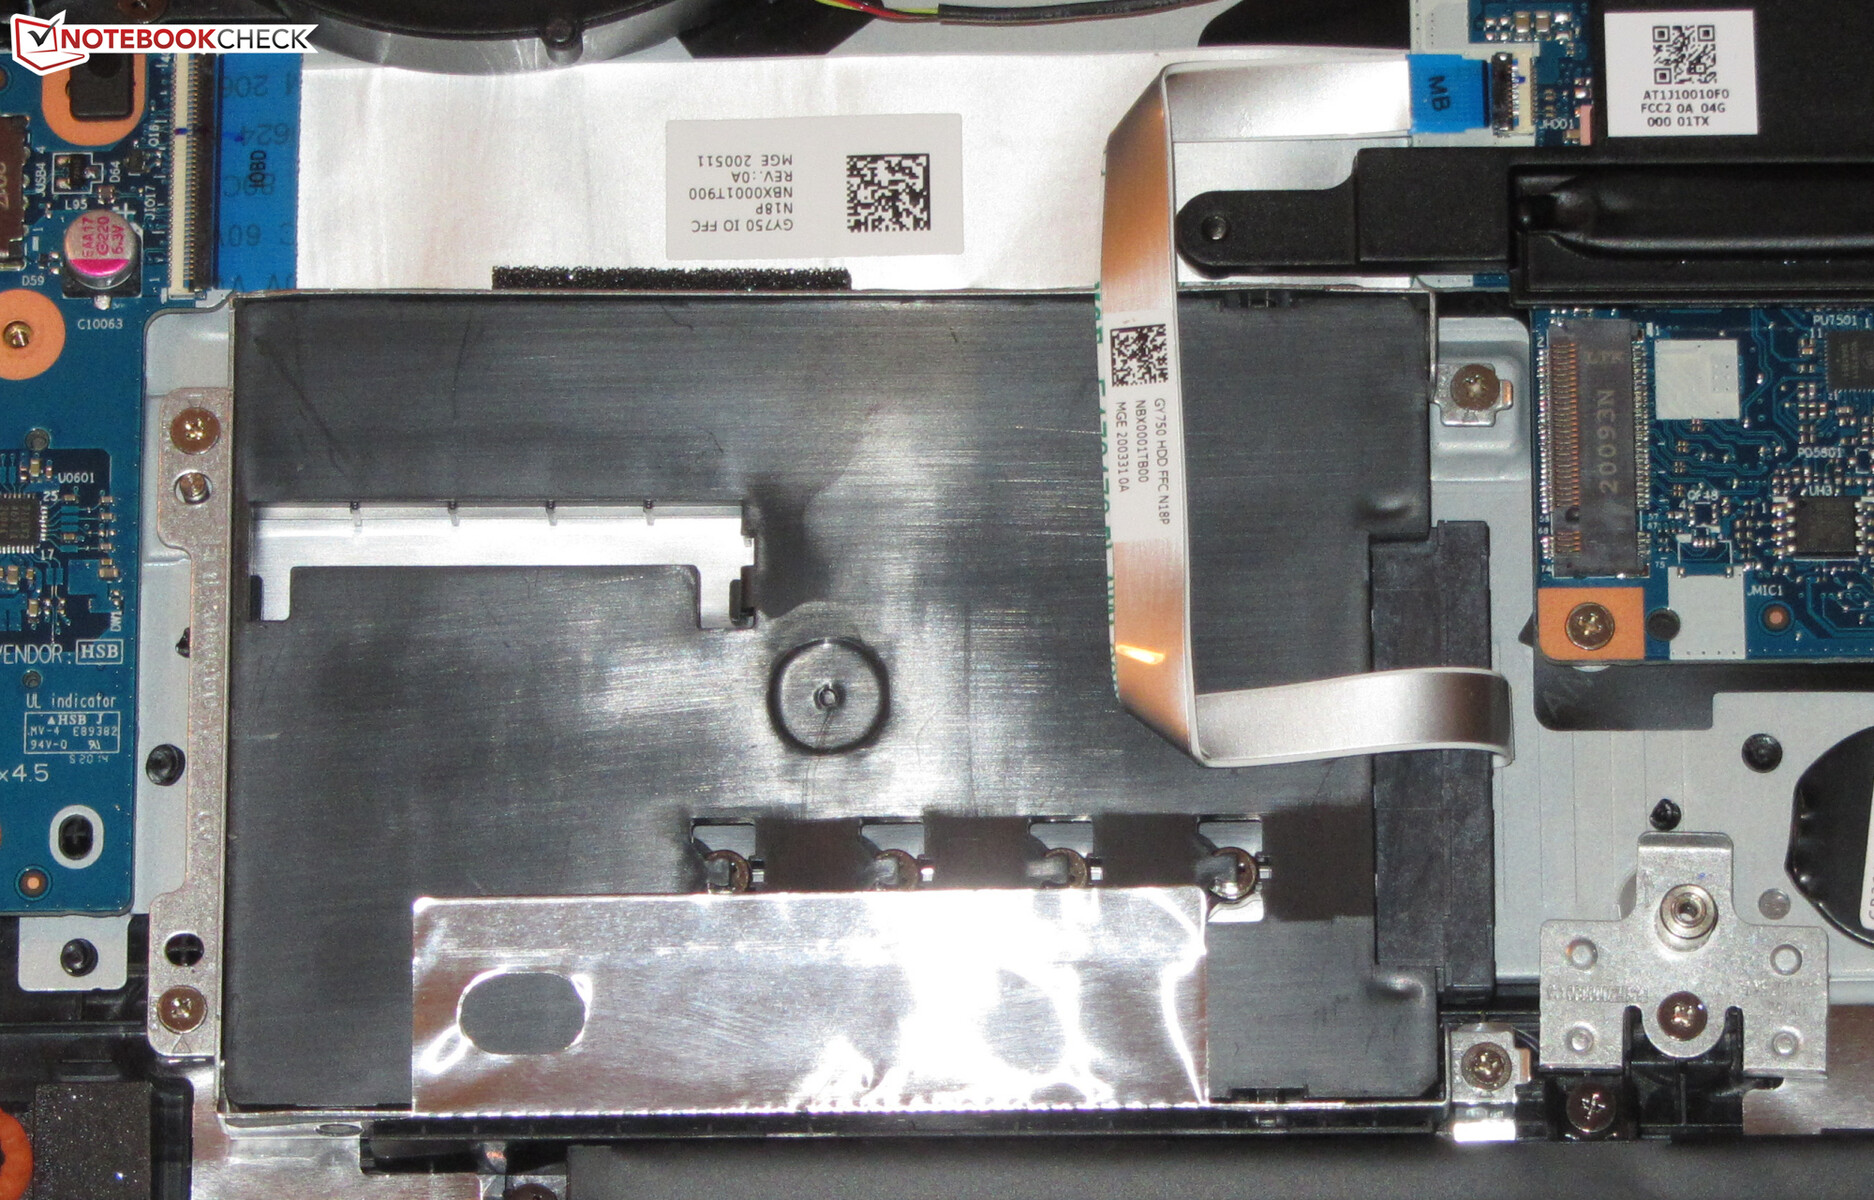
Storage Solution
An NVMe SSD (M.2-2242) from SK Hynix that offers 512 GB of storage space is used as the system drive. While the transfer rates turn out good, the SSD is not one of the top models.
The laptop storage can be expanded by a 2.5-inch storage medium (SATA slot and insertion frame available) or a second eNVMe SSD (M.2-2280, M.2-2242). However, you cannot insert both drives at the same time, since inserting a second NVMe SSD requires taking out the 2.5-inch drive frame.

| Lenovo Legion 5 17IMH05 SK hynix BC511 HFM512GDHTNI-87A0B | MSI GF75 Thin 10SCXR WDC PC SN530 SDBPNPZ-512G | Asus TUF A17 FA706IU-AS76 Intel SSD 660p 1TB SSDPEKNW010T8 | HP Pavilion Gaming 17-cd0085cl Samsung SSD PM981 MZVLB256HAHQ | Average SK hynix BC511 HFM512GDHTNI-87A0B | |
|---|---|---|---|---|---|
| CrystalDiskMark 5.2 / 6 | 13% | 28% | 27% | -4% | |
| Write 4K | 134.7 | 140.7 4% | 189.7 41% | 135.3 0% | 135.9 ? 1% |
| Read 4K | 44.84 | 43.18 -4% | 62.3 39% | 63.7 42% | 45.3 ? 1% |
| Write Seq | 1053 | 1829 74% | 1681 60% | 1337 27% | 1057 ? 0% |
| Read Seq | 1241 | 1095 -12% | 1608 30% | 1617 30% | 1144 ? -8% |
| Write 4K Q32T1 | 499.8 | 431.7 -14% | 468.6 -6% | 568 14% | 458 ? -8% |
| Read 4K Q32T1 | 518 | 527 2% | 541 4% | 645 25% | 425 ? -18% |
| Write Seq Q32T1 | 1022 | 1831 79% | 1770 73% | 1428 40% | 1040 ? 2% |
| Read Seq Q32T1 | 2263 | 1708 -25% | 1898 -16% | 3184 41% | 2274 ? 0% |
| AS SSD | -38% | -7% | 15% | 1% | |
| Seq Read | 1635 | 1007 -38% | 1320 -19% | 1709 5% | 1601 ? -2% |
| Seq Write | 913 | 1755 92% | 1539 69% | 1345 47% | 879 ? -4% |
| 4K Read | 46.18 | 39.88 -14% | 56.3 22% | 49.73 8% | 48.7 ? 5% |
| 4K Write | 101.7 | 111.6 10% | 158.5 56% | 108.2 6% | 114.9 ? 13% |
| 4K-64 Read | 773 | 751 -3% | 586 -24% | 731 -5% | 764 ? -1% |
| 4K-64 Write | 745 | 402.6 -46% | 820 10% | 1233 66% | 754 ? 1% |
| Access Time Read * | 0.05 | 0.084 -68% | 0.043 14% | 0.073 -46% | 0.0535 ? -7% |
| Access Time Write * | 0.037 | 0.151 -308% | 0.113 -205% | 0.034 8% | 0.034 ? 8% |
| Score Read | 983 | 892 -9% | 775 -21% | 951 -3% | 973 ? -1% |
| Score Write | 938 | 690 -26% | 1132 21% | 1476 57% | 957 ? 2% |
| Score Total | 2399 | 2085 -13% | 2333 -3% | 2909 21% | 2405 ? 0% |
| Total Average (Program / Settings) | -13% /
-17% | 11% /
8% | 21% /
20% | -2% /
-1% |
* ... smaller is better
Constant Performance Reads: DiskSpd Read Loop, Queue Depth 8
Graphics Card
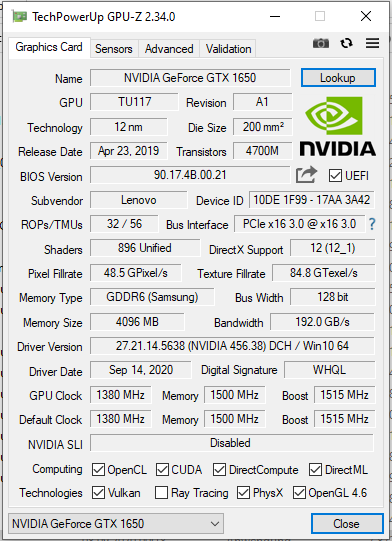
The GeForce-GTX-1650 graphics core (Turing) is a representative of the GPU mid-range. It is accompanied by 4096 GB of fast GDDR6 graphics storage. The results in the 3D-Mark benchmarks range at a normal level for this GPU. The UHD Graphics 630 GPU integrated into the processor is active, and the laptop uses Nvidia's Optimus switching graphics solution. The iGPU can be deactivated in the BIOS or in the Lenovo Vantage software.
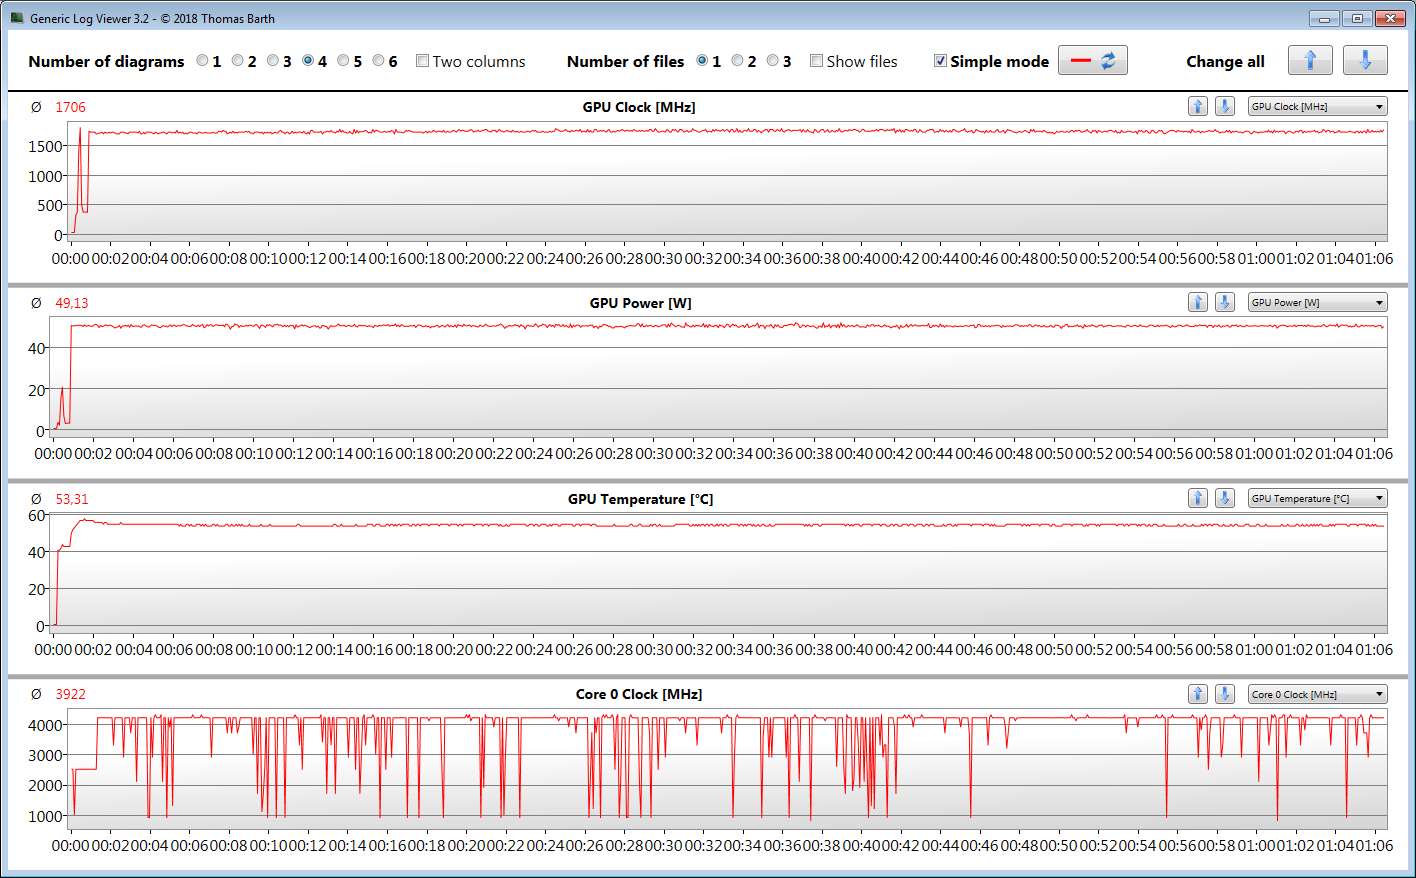
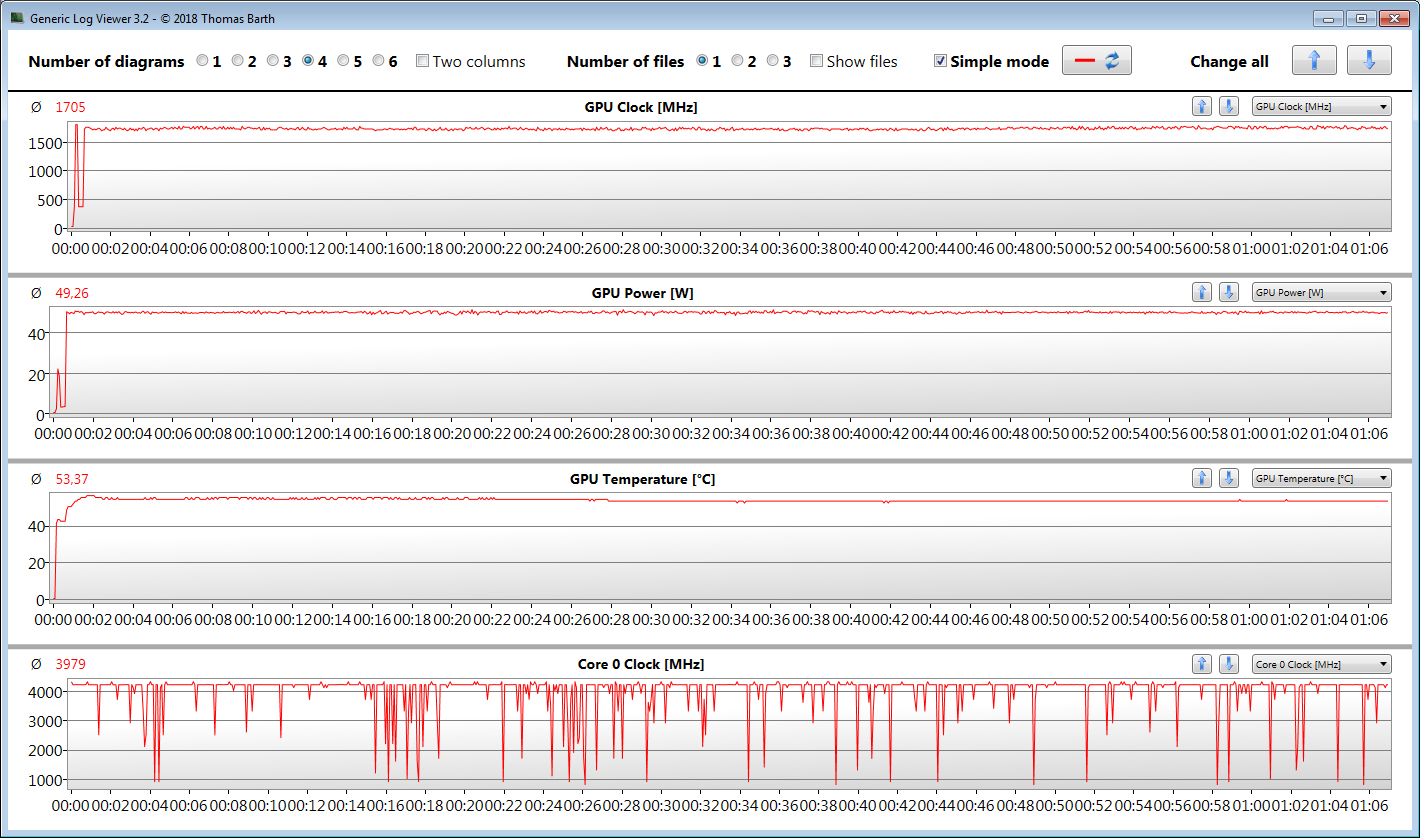
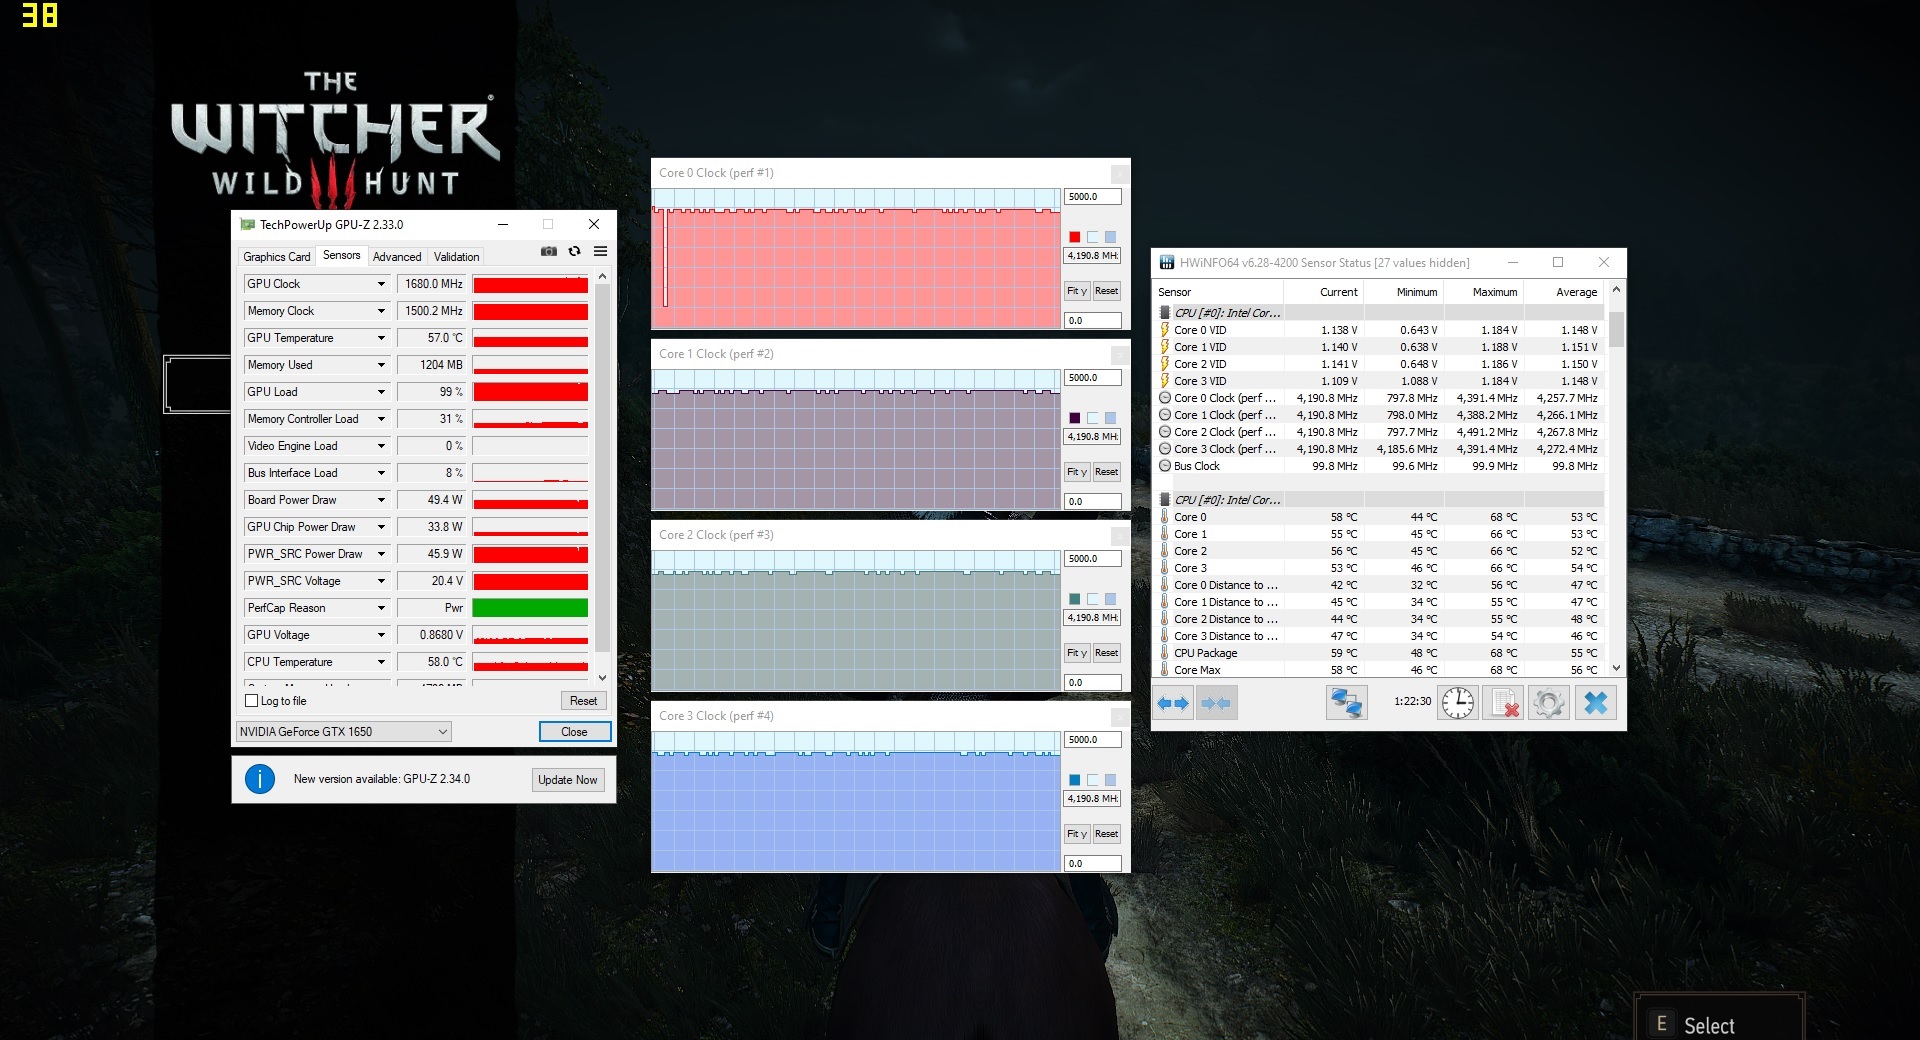
Nvidia envisions a clock speed range between 1380 MHz (basis) and 1515 MHz (boost) for this DirectX 12 GPU. Higher clock speeds can be reached if the GPU does not exceed a fixed temperature and/or power limit. For example, we register a maximum of 1797 MHz that can only be maintained briefly, though. Our "The Witcher 3" test runs at an average speed of 1706 MHz.
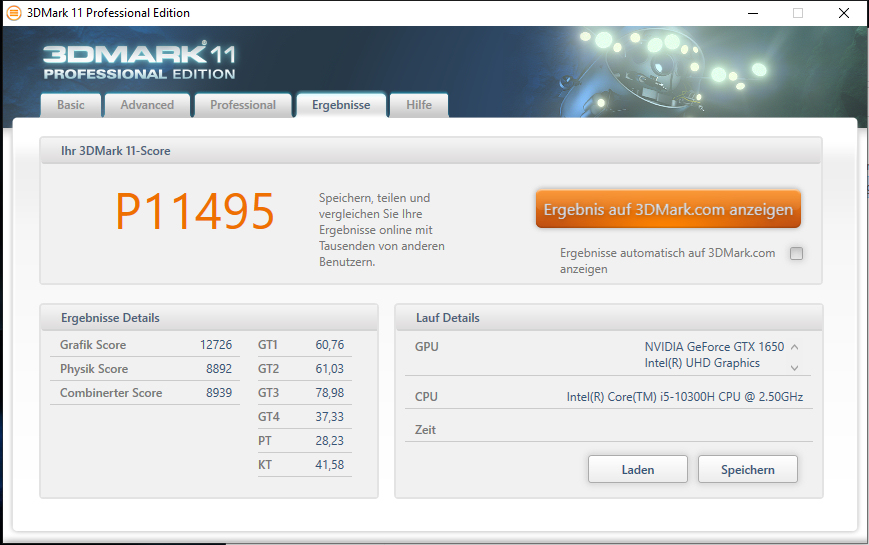
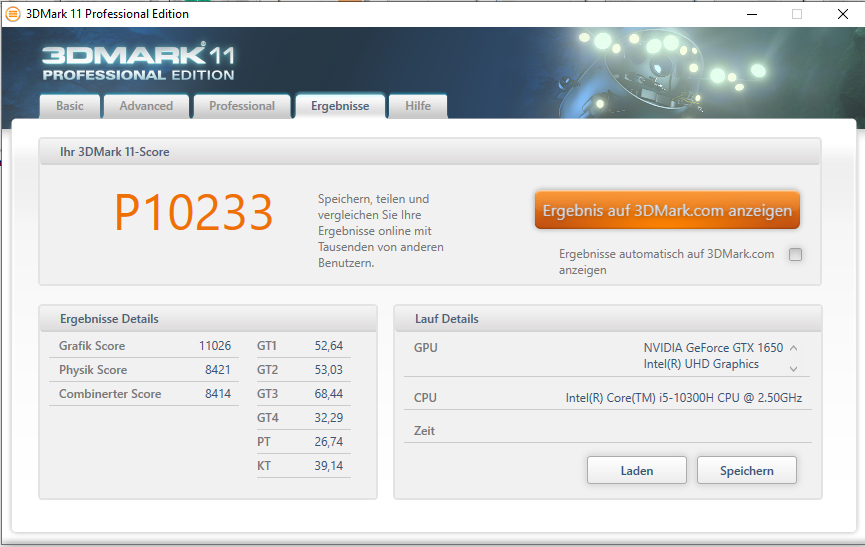
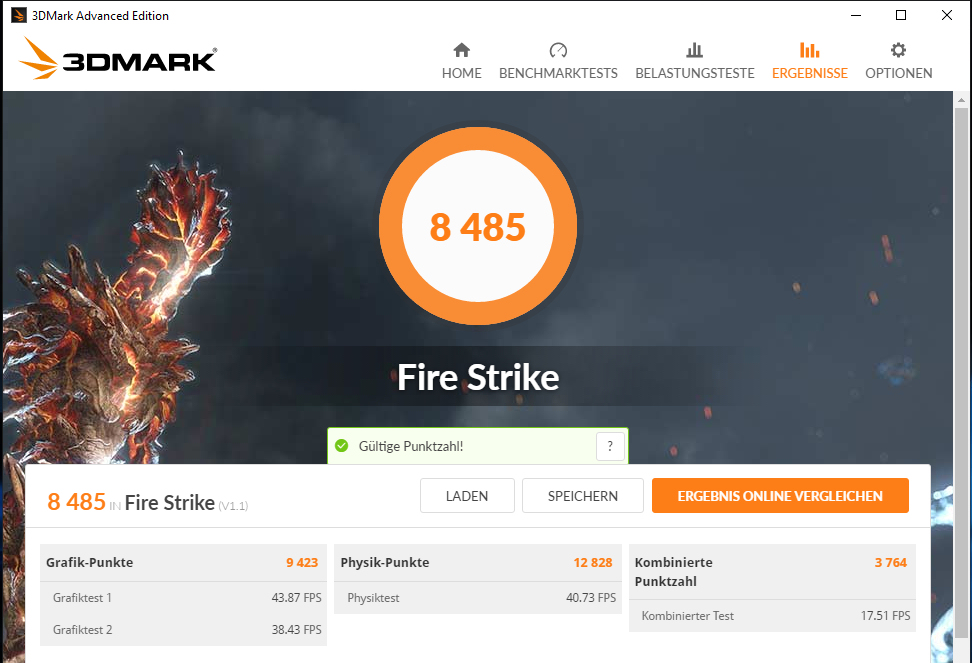
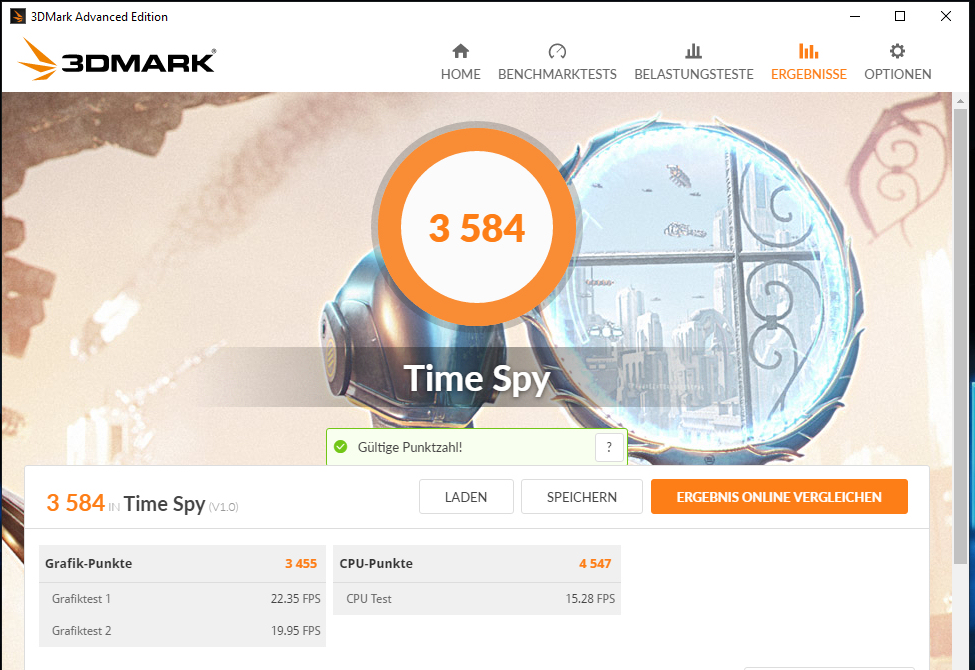
| 3DMark 11 Performance | 11495 points | |
| 3DMark Cloud Gate Standard Score | 26934 points | |
| 3DMark Fire Strike Score | 8485 points | |
| 3DMark Time Spy Score | 3584 points | |
Help | ||
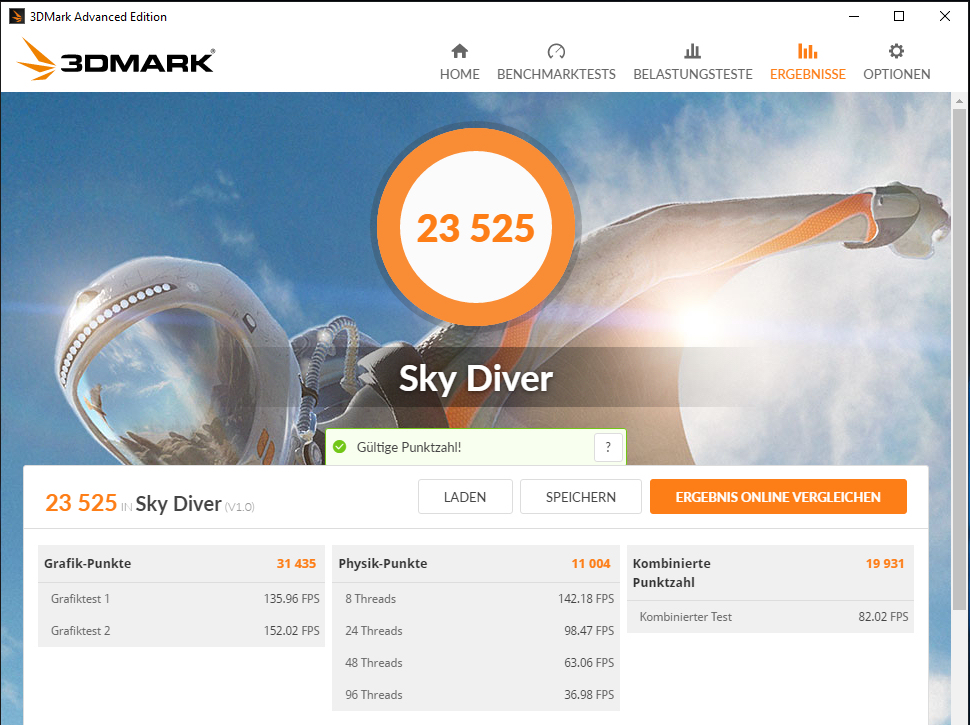
Gaming Performance
The CPU-GPU combination brings all the games in our database smoothly to the screen. Generally the Full-HD resolution and medium to high quality settings can be used, and in some case even more is possible.
The fact that the working memory runs in single-channel mode is responsible for some games (see comparison chart) only reaching significantly lower frame rates at low settings than other comparably-equipped laptops. A second working memory module (= active dual-channel mode) would remedy this.
| The Witcher 3 - 1920x1080 Ultra Graphics & Postprocessing (HBAO+) | |
| Average of class Gaming (8.61 - 216, n=226, last 2 years) | |
| Asus TUF A17 FA706IU-AS76 | |
| HP Pavilion Gaming 17-cd0085cl | |
| Lenovo Legion 5 17IMH05 | |
| Nexoc GH5 515IG | |
| MSI GF75 Thin 10SCXR | |
| Lenovo IdeaPad Gaming 3i 15IMH05 | |
| Average NVIDIA GeForce GTX 1650 Mobile (29.9 - 40.3, n=31) | |
| F1 2020 | |
| 1920x1080 Ultra High Preset AA:T AF:16x | |
| Average of class Gaming (12.4 - 305, n=6, last 2 years) | |
| Nexoc GH5 515IG | |
| Lenovo Legion 5 17IMH05 | |
| Average NVIDIA GeForce GTX 1650 Mobile (48.3 - 63, n=5) | |
| 1280x720 Ultra Low Preset | |
| Average of class Gaming (59.1 - 413, n=6, last 2 years) | |
| Nexoc GH5 515IG | |
| Average NVIDIA GeForce GTX 1650 Mobile (156 - 208, n=5) | |
| Lenovo Legion 5 17IMH05 | |
| Death Stranding | |
| 1920x1080 Very High Preset | |
| Average of class Gaming (14.3 - 163, n=9, last 2 years) | |
| Lenovo Legion 5 17IMH05 | |
| Average NVIDIA GeForce GTX 1650 Mobile (56.5 - 57.8, n=4) | |
| Nexoc GH5 515IG | |
| 1280x720 Low Preset | |
| Average of class Gaming (27.3 - 200, n=7, last 2 years) | |
| Average NVIDIA GeForce GTX 1650 Mobile (100.8 - 111, n=4) | |
| Nexoc GH5 515IG | |
| Lenovo Legion 5 17IMH05 | |
| Mafia Definitive Edition | |
| 1920x1080 High Preset | |
| Average of class Gaming (52.7 - 187.9, n=5, last 2 years) | |
| Average NVIDIA GeForce GTX 1650 Mobile (43.3 - 44.9, n=2) | |
| Lenovo Legion 5 17IMH05 | |
| 1280x720 Low Preset | |
| Average of class Gaming (219 - 280, n=2, last 2 years) | |
| Average NVIDIA GeForce GTX 1650 Mobile (66.2 - 103, n=2) | |
| Lenovo Legion 5 17IMH05 | |
In order to evaluate whether the frame rates also remain mostly constant over a longer time period, we run the game "The Witcher 3" for about 60 minutes in Full-HD resolution and at maximum quality settings. The gaming character is not moved. A drop in the frame rates is not noticeable.
| low | med. | high | ultra | |
| BioShock Infinite (2013) | 250.1 | 217.9 | 205.7 | 93.2 |
| The Witcher 3 (2015) | 172.7 | 117.3 | 69.5 | 40.3 |
| Shadow of the Tomb Raider (2018) | 83 | 62 | 52 | 45 |
| Doom Eternal (2020) | 139 | 84.3 | 69.2 | |
| F1 2020 (2020) | 156 | 100 | 80 | 57 |
| Death Stranding (2020) | 100.8 | 64 | 59.5 | 57.6 |
| Flight Simulator 2020 (2020) | 50.4 | 35.9 | 25.5 | 17.5 |
| Serious Sam 4 (2020) | 99.3 | 48.4 | 40.6 | 27.8 |
| Mafia Definitive Edition (2020) | 66.2 | 47.1 | 43.3 | |
| Star Wars Squadrons (2020) | 179.1 | 122.6 | 108.7 | 100 |
| FIFA 21 (2020) | 153.2 | 125.8 | 120.4 | 113.1 |
Emissions - The Lenovo computer warms only moderately
Noise Emissions
In idle operation, the fans remain mostly subdued, running only at low speeds or remaining silent. However, they tend to pulsate. Under load, the fans rev up significantly. We measure a maximum noise level of 51 dB(A) during the stress test and 46 dB(A) during our "The Witcher-3" test. It takes relatively long for the fans to start under load.
For an overall lower noise development, the Quiet mode has to be activated in the Lenovo Vantage software. However, this comes at the expense of the computing performance.
Noise Level
| Idle |
| 24 / 25 / 29 dB(A) |
| Load |
| 43 / 51 dB(A) |
 | ||
30 dB silent 40 dB(A) audible 50 dB(A) loud |
||
min: | ||
| Lenovo Legion 5 17IMH05 i5-10300H, GeForce GTX 1650 Mobile | MSI GF75 Thin 10SCXR i5-10300H, GeForce GTX 1650 Mobile | Asus TUF A17 FA706IU-AS76 R7 4800H, GeForce GTX 1660 Ti Mobile | HP Pavilion Gaming 17-cd0085cl i7-9750H, GeForce GTX 1660 Ti Max-Q | Average NVIDIA GeForce GTX 1650 Mobile | Average of class Gaming | |
|---|---|---|---|---|---|---|
| Noise | -9% | -12% | -1% | -7% | -5% | |
| off / environment * | 24 | 28.4 -18% | 28.7 -20% | 28.2 -18% | 27.6 ? -15% | 24.1 ? -0% |
| Idle Minimum * | 24 | 33 -38% | 28.7 -20% | 30.1 -25% | 28.1 ? -17% | 25.6 ? -7% |
| Idle Average * | 25 | 33 -32% | 30.5 -22% | 30.1 -20% | 28.8 ? -15% | 27.4 ? -10% |
| Idle Maximum * | 29 | 33.1 -14% | 32.5 -12% | 30.1 -4% | 31 ? -7% | 30.7 ? -6% |
| Load Average * | 43 | 37.7 12% | 42.5 1% | 34.2 20% | 41.7 ? 3% | 43.1 ? -0% |
| Witcher 3 ultra * | 46 | 39.2 15% | 50.1 -9% | 34.2 26% | ||
| Load Maximum * | 51 | 46 10% | 53.4 -5% | 43.8 14% | 46.4 ? 9% | 53.4 ? -5% |
* ... smaller is better
Temperature
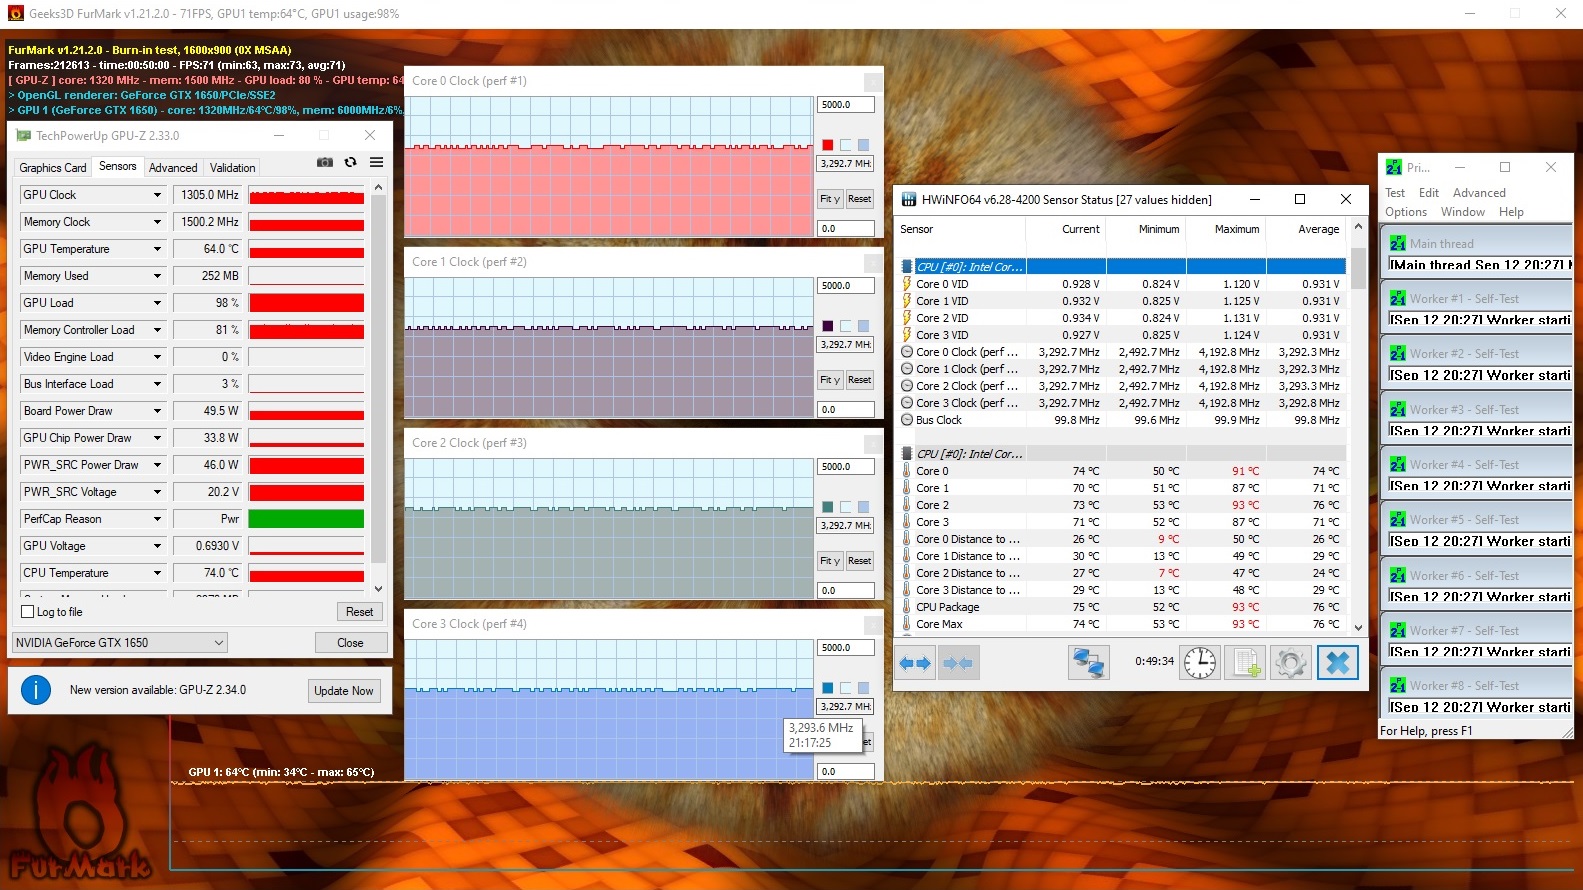
The processor and graphics core run through our stress test (Prime95 and FurMark running for at least one hour) at 3.3 GHz and 1305 MHz respectively. The stress test represents an extreme scenario that does not occur in everyday operation. We use this test to evaluate whether the system still remains stable under full load.
The laptop does not get overly hot. During the stress test we register temperatures below 50 °C (122 °F). The warming turns out significantly lower while running our "The Witcher-3" test. In everyday operation, the temperatures remain within the green range.
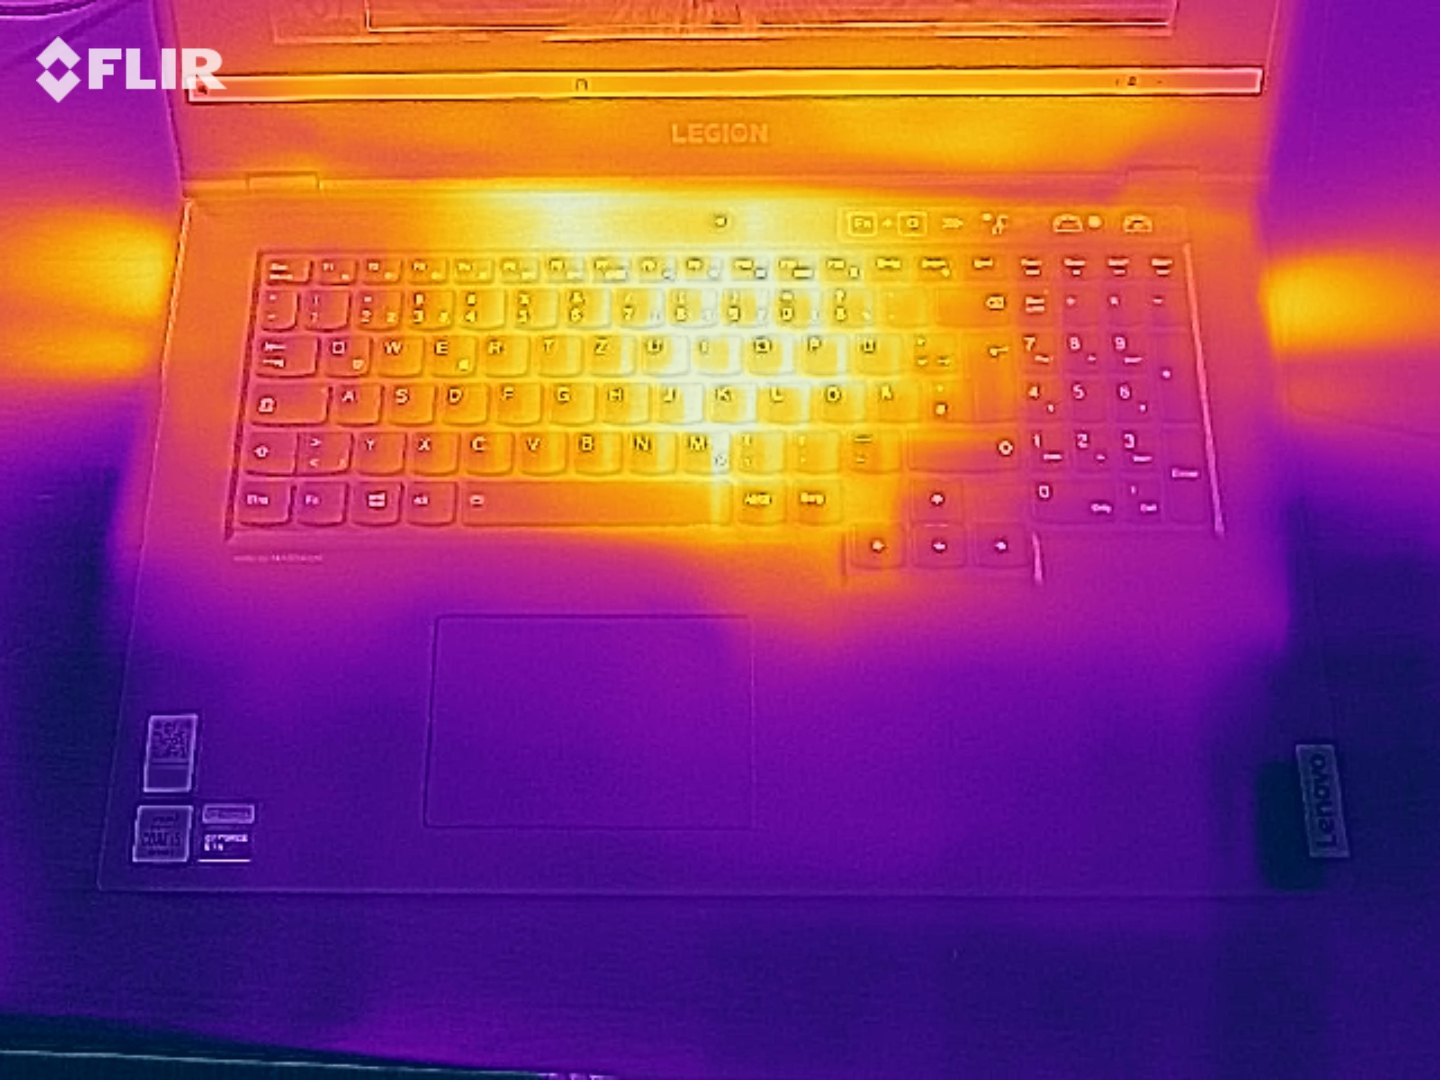
(-) The maximum temperature on the upper side is 47 °C / 117 F, compared to the average of 40.4 °C / 105 F, ranging from 21.2 to 68.8 °C for the class Gaming.
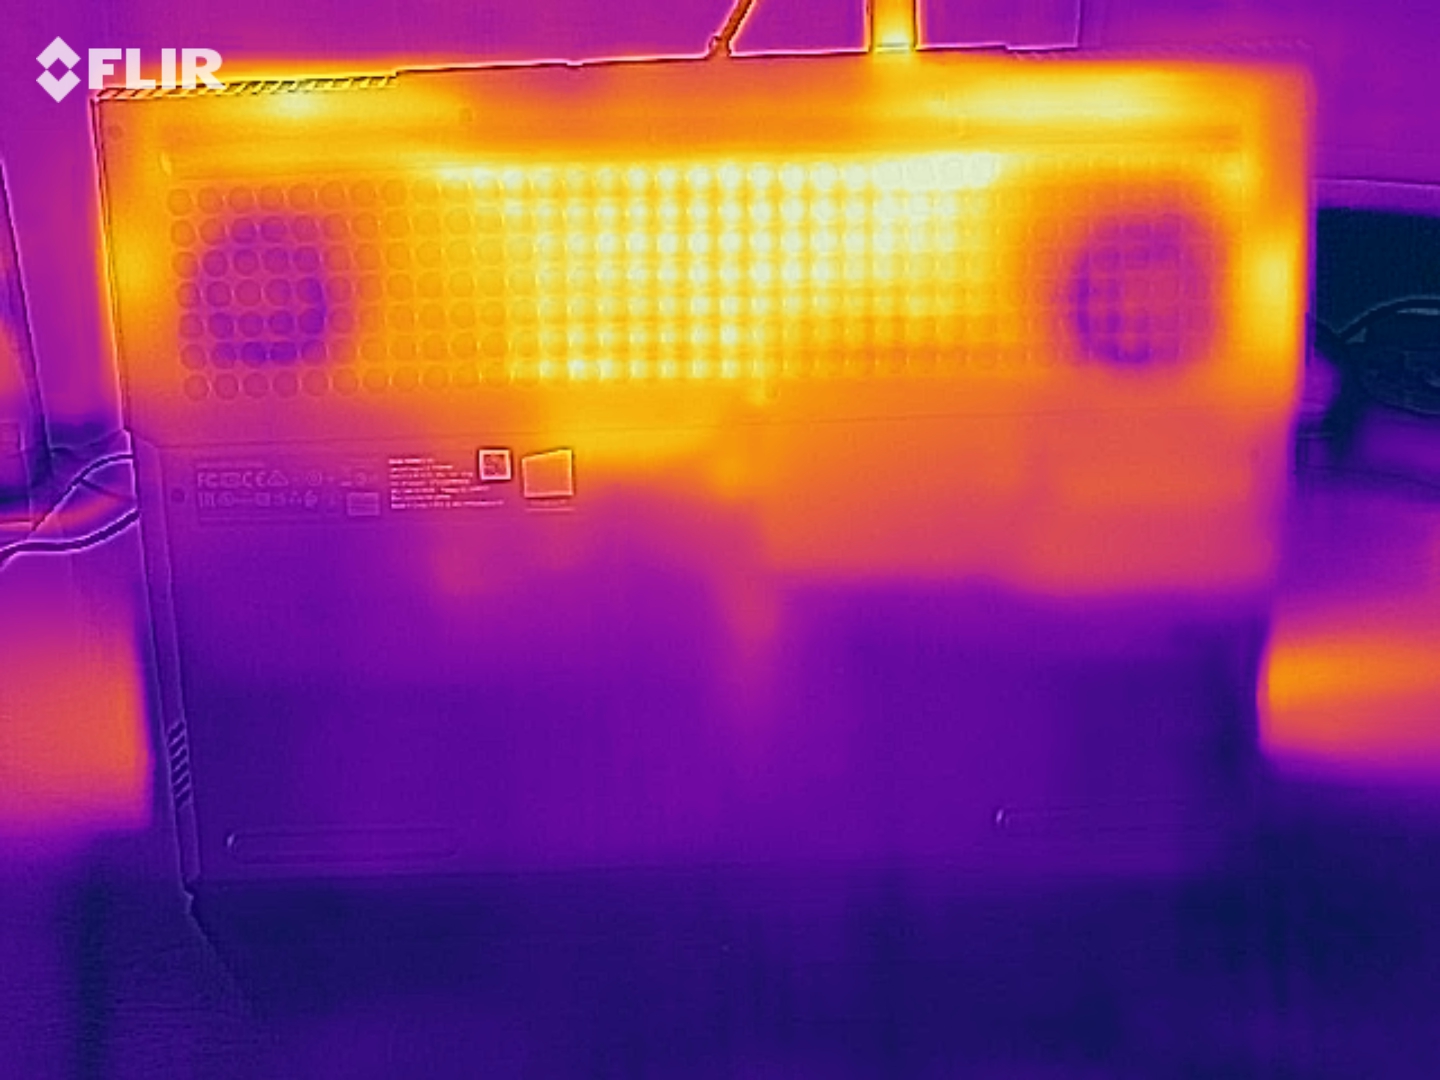
(±) The bottom heats up to a maximum of 44 °C / 111 F, compared to the average of 43.2 °C / 110 F
(+) In idle usage, the average temperature for the upper side is 29.7 °C / 85 F, compared to the device average of 33.8 °C / 93 F.
(±) Playing The Witcher 3, the average temperature for the upper side is 35.3 °C / 96 F, compared to the device average of 33.8 °C / 93 F.
(+) The palmrests and touchpad are cooler than skin temperature with a maximum of 28 °C / 82.4 F and are therefore cool to the touch.
(±) The average temperature of the palmrest area of similar devices was 28.9 °C / 84 F (+0.9 °C / 1.6 F).
| Lenovo Legion 5 17IMH05 i5-10300H, GeForce GTX 1650 Mobile | MSI GF75 Thin 10SCXR i5-10300H, GeForce GTX 1650 Mobile | Asus TUF A17 FA706IU-AS76 R7 4800H, GeForce GTX 1660 Ti Mobile | HP Pavilion Gaming 17-cd0085cl i7-9750H, GeForce GTX 1660 Ti Max-Q | Average NVIDIA GeForce GTX 1650 Mobile | Average of class Gaming | |
|---|---|---|---|---|---|---|
| Heat | -8% | -2% | -8% | 3% | -2% | |
| Maximum Upper Side * | 47 | 42 11% | 47.6 -1% | 42.6 9% | 46 ? 2% | 46 ? 2% |
| Maximum Bottom * | 44 | 53.4 -21% | 50.8 -15% | 49 -11% | 49.2 ? -12% | 49.5 ? -13% |
| Idle Upper Side * | 35 | 34.2 2% | 33 6% | 34 3% | 28.3 ? 19% | 31.4 ? 10% |
| Idle Bottom * | 30 | 37.4 -25% | 29 3% | 39.4 -31% | 28.9 ? 4% | 32.5 ? -8% |
* ... smaller is better
Speakers
The stereo speakers are placed in the frontal area of the case bottom. They produce an acceptable sound that hardly contains any bass. For a better sound experience, you need to use headphones or external speakers.
Lenovo Legion 5 17IMH05 audio analysis
(±) | speaker loudness is average but good (79 dB)
Bass 100 - 315 Hz
(-) | nearly no bass - on average 19.8% lower than median
(-) | bass is not linear (15.3% delta to prev. frequency)
Mids 400 - 2000 Hz
(+) | balanced mids - only 4.5% away from median
(+) | mids are linear (2.7% delta to prev. frequency)
Highs 2 - 16 kHz
(+) | balanced highs - only 4.7% away from median
(+) | highs are linear (4.3% delta to prev. frequency)
Overall 100 - 16.000 Hz
(±) | linearity of overall sound is average (18.8% difference to median)
Compared to same class
» 59% of all tested devices in this class were better, 8% similar, 33% worse
» The best had a delta of 6%, average was 18%, worst was 132%
Compared to all devices tested
» 38% of all tested devices were better, 8% similar, 54% worse
» The best had a delta of 4%, average was 25%, worst was 134%
Power Management - No lack in endurance
Power Consumption
Across all load ranges, the power consumption remains within a low or normal level for the built-in hardware. During our stress test, the value rises up to 169 watts. In gaming operation ("The Witcher-3" test), the consumption turns out lower at an average of 89 watts. The power supply is rated at 170 watts.
| Off / Standby | |
| Idle | |
| Load |
|
| Lenovo Legion 5 17IMH05 i5-10300H, GeForce GTX 1650 Mobile | MSI GF75 Thin 10SCXR i5-10300H, GeForce GTX 1650 Mobile | Asus TUF A17 FA706IU-AS76 R7 4800H, GeForce GTX 1660 Ti Mobile | HP Pavilion Gaming 17-cd0085cl i7-9750H, GeForce GTX 1660 Ti Max-Q | Average NVIDIA GeForce GTX 1650 Mobile | Average of class Gaming | |
|---|---|---|---|---|---|---|
| Power Consumption | -120% | -73% | -41% | -34% | -188% | |
| Idle Minimum * | 2 | 13 -550% | 7.4 -270% | 5.4 -170% | 4.96 ? -148% | 13.8 ? -590% |
| Idle Average * | 8 | 15.7 -96% | 10.5 -31% | 9.2 -15% | 8.61 ? -8% | 19.2 ? -140% |
| Idle Maximum * | 16 | 21 -31% | 17 -6% | 13 19% | 14.8 ? 7% | 27 ? -69% |
| Load Average * | 58 | 87 -50% | 103.7 -79% | 85.9 -48% | 81.7 ? -41% | 111.3 ? -92% |
| Witcher 3 ultra * | 89 | 96.4 -8% | 128.1 -44% | 107.9 -21% | ||
| Load Maximum * | 169 | 145.8 14% | 183.2 -8% | 182.2 -8% | 131.9 ? 22% | 251 ? -49% |
* ... smaller is better
Battery Life
The battery life turns out excellent, putting most office notebooks to shame. The 17.3-inch laptop lasts for 11:23 hours in our WLAN test (loading web sites using a script) and for 14:20 hours in our video test (short film "Big Buck Bunny" running in a loop; H.264 coding, FHD).
| Lenovo Legion 5 17IMH05 i5-10300H, GeForce GTX 1650 Mobile, 80 Wh | MSI GF75 Thin 10SCXR i5-10300H, GeForce GTX 1650 Mobile, 51 Wh | Asus TUF A17 FA706IU-AS76 R7 4800H, GeForce GTX 1660 Ti Mobile, 90 Wh | HP Pavilion Gaming 17-cd0085cl i7-9750H, GeForce GTX 1660 Ti Max-Q, 52.5 Wh | Average of class Gaming | |
|---|---|---|---|---|---|
| Battery Runtime | -55% | 1% | -48% | -45% | |
| Reader / Idle | 1399 | 463 -67% | 543 -61% | 695 -50% | 544 ? -61% |
| H.264 | 860 | 399 ? -54% | |||
| WiFi v1.3 | 683 | 283 -59% | 512 -25% | 339 -50% | 368 ? -46% |
| Load | 104 | 63 -39% | 196 88% | 59 -43% | 84.2 ? -19% |
Pros
Cons
Verdict
The Legion 5i has a Core i5-10300H processor (Comet Lake) and dedicated GeForce GTX-1650 graphics core onboard that in combination bring all the current computer games smoothly to the screen. The highest resolutions and quality settings are only possible to a limited extent. The Quiet mode is able to turn the gaming notebook into a quiet work horse that only bothers the user as little as possible with fan noise.
Officially, the Lenovo Legion 5 17IMH05 is considered a gaming notebook. However, the equipment variant tested here can be easily considered an all-rounder that strikes a good figure in various usage scenarios.
With 8 GB of working memory and a 512 GB NVMe SSD, the amount of available storage does not turn out very abundant. There are some expansion options, however. For example, you can or should install a second working memory module to activate dual-channel mode. In addition to the currently present SSD, there is also space inside for a 2.5-inch drive or a second NMVe SSD.
The Full-HD IPS display offers stable viewing angles, a matte surface, sufficient brightness and a good contrast, acceptable color reproduction, and a decent color space coverage. The built-in illuminated keyboard is suitable for everyday tasks, and the battery life is outstanding.
Lenovo Legion 5 17IMH05
-
10/17/2020 v7
Sascha Mölck


Pricecompare

