 Deutsch
 English
 Español
 Français
 Italiano
 Nederlands
 Polski
 Português
 Русский
 Türkçe
 Svenska
 Chinese
 Magyar
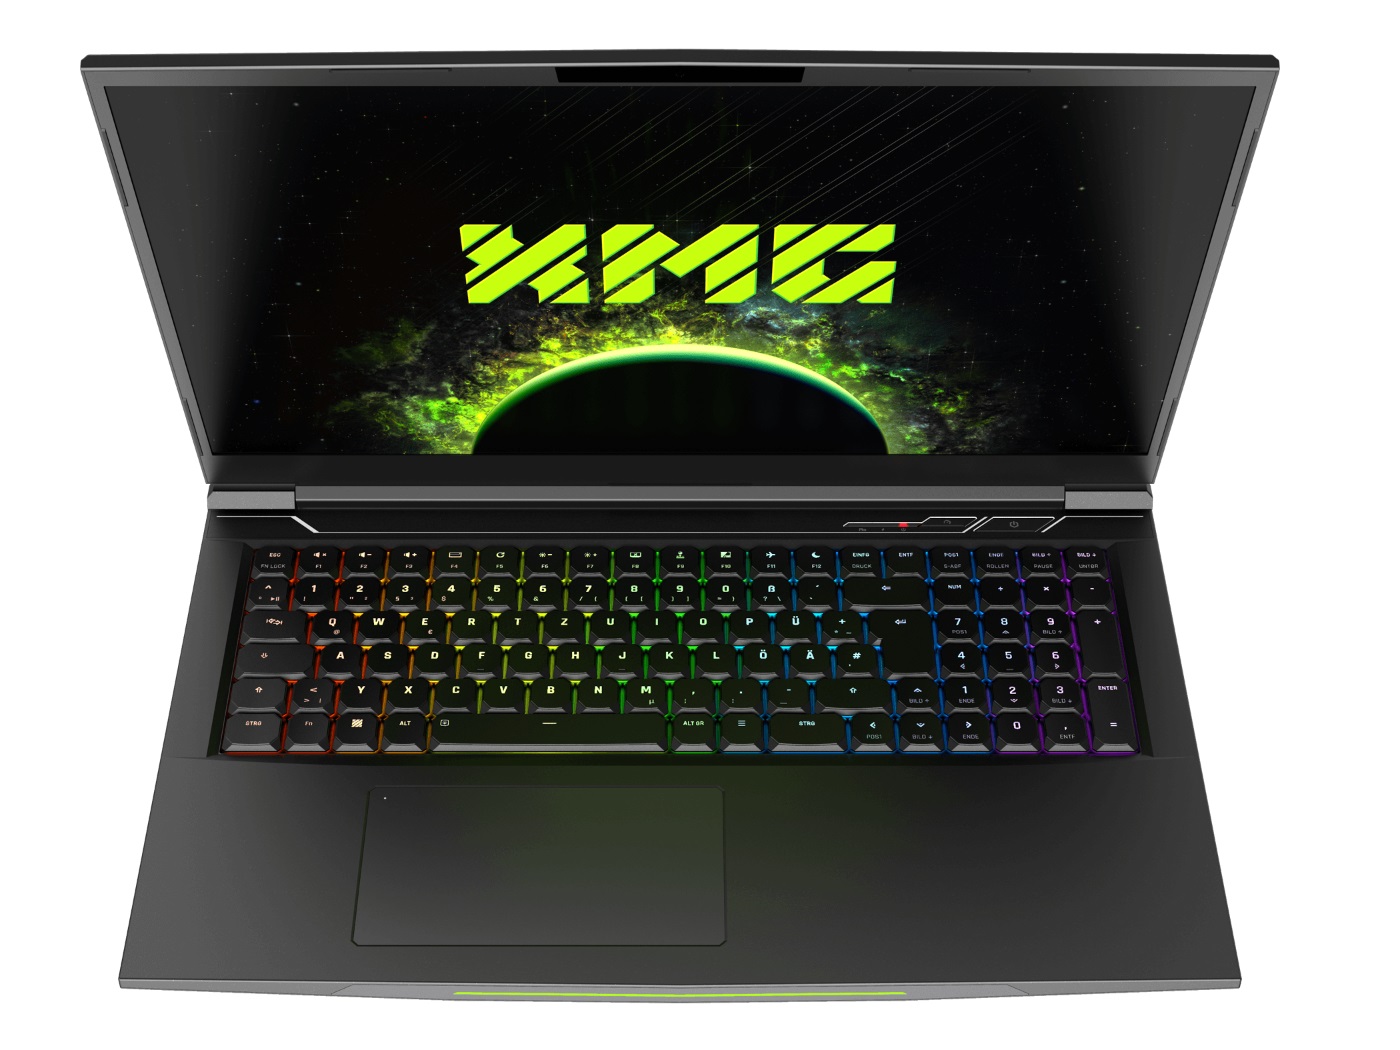
Schenker XMG Neo 17 (Tongfang GM7ZG7S) laptop review: El Dorado tuning

Even though the new version of the XMG Neo 17 will probably not be available for customers until the end of March, we were already able to examine a pre-sample in detail. Those who want to purchase the 17-incher will soon be able to choose from a variety of components on the manufacturer's homepage bestware.com - as is usual for Schenker.
Starting with the processor that comes from AMD's brand-new Cezanne generation. The Ryzen 7 5800H and Ryzen 9 5900HX are both octa-core models. Either a Full HD panel at 240 Hz or a WQHD display at 165 Hz handles image reproduction.
Of course, the graphics card is especially exciting for gamers. You are spoilt for choice here, because you can choose between a GeForce RTX 3060 laptop GPU (6 GB GDDR6), an RTX 3070 laptop GPU (8 GB GDDR6), and an RTX 3080 laptop GPU (16 GB GDDR6). In addition, there's a maximum of 64 GB of DDR4 RAM (2x SO-DIMM slots) and up to two PCIe SSDs (M.2 type 2280). In terms of price, the XMG Neo 17 starts at 1,749 Euros (~$2,122). For our test configuration with a Ryzen 7 5800H, an RTX 3070 laptop graphics unit, 16 GB of dual-channel RAM, and a 500 GB SSD, you would have to pay considerably more.
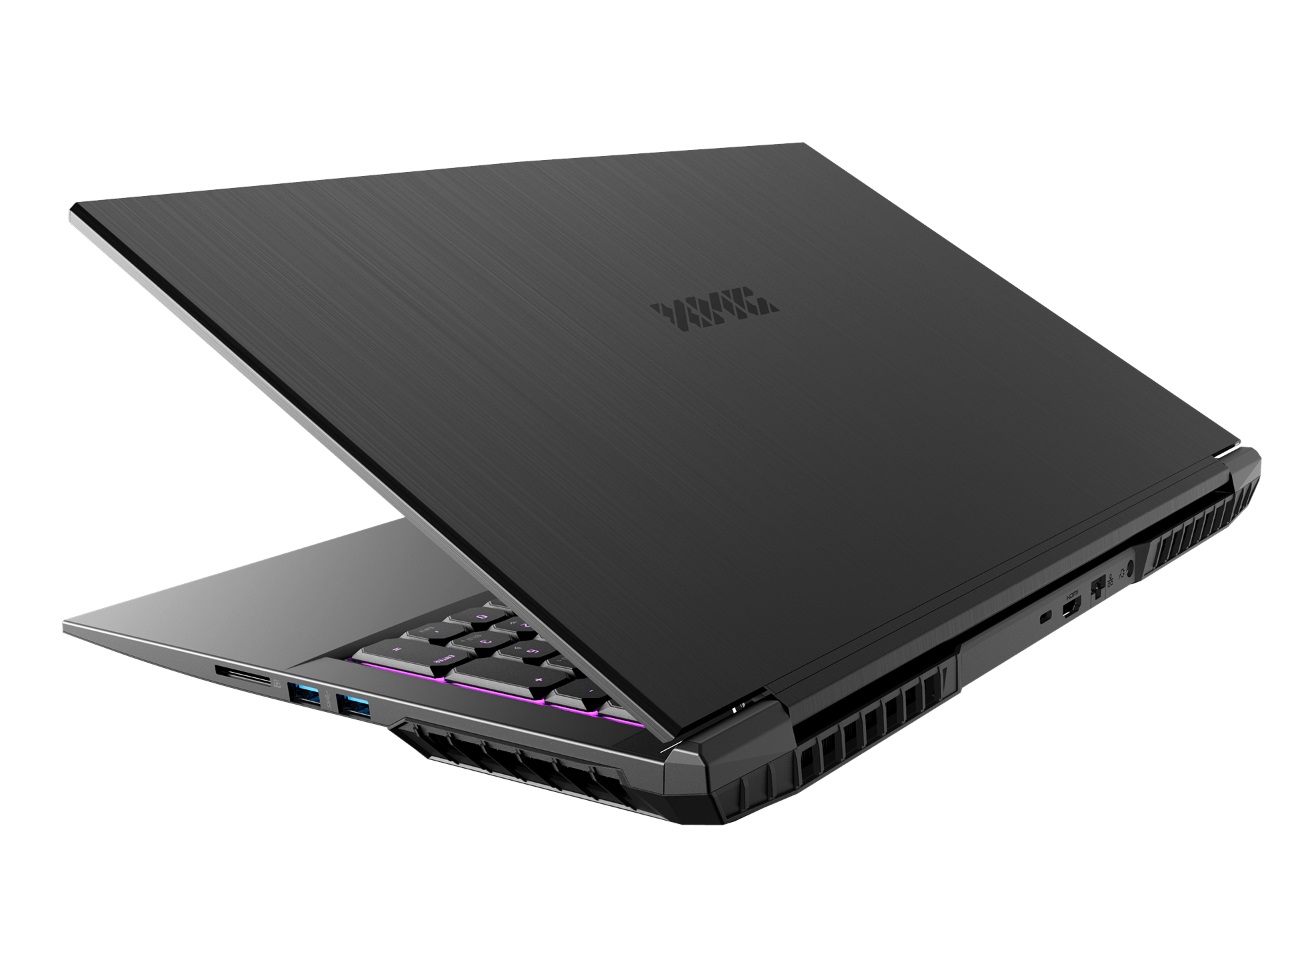
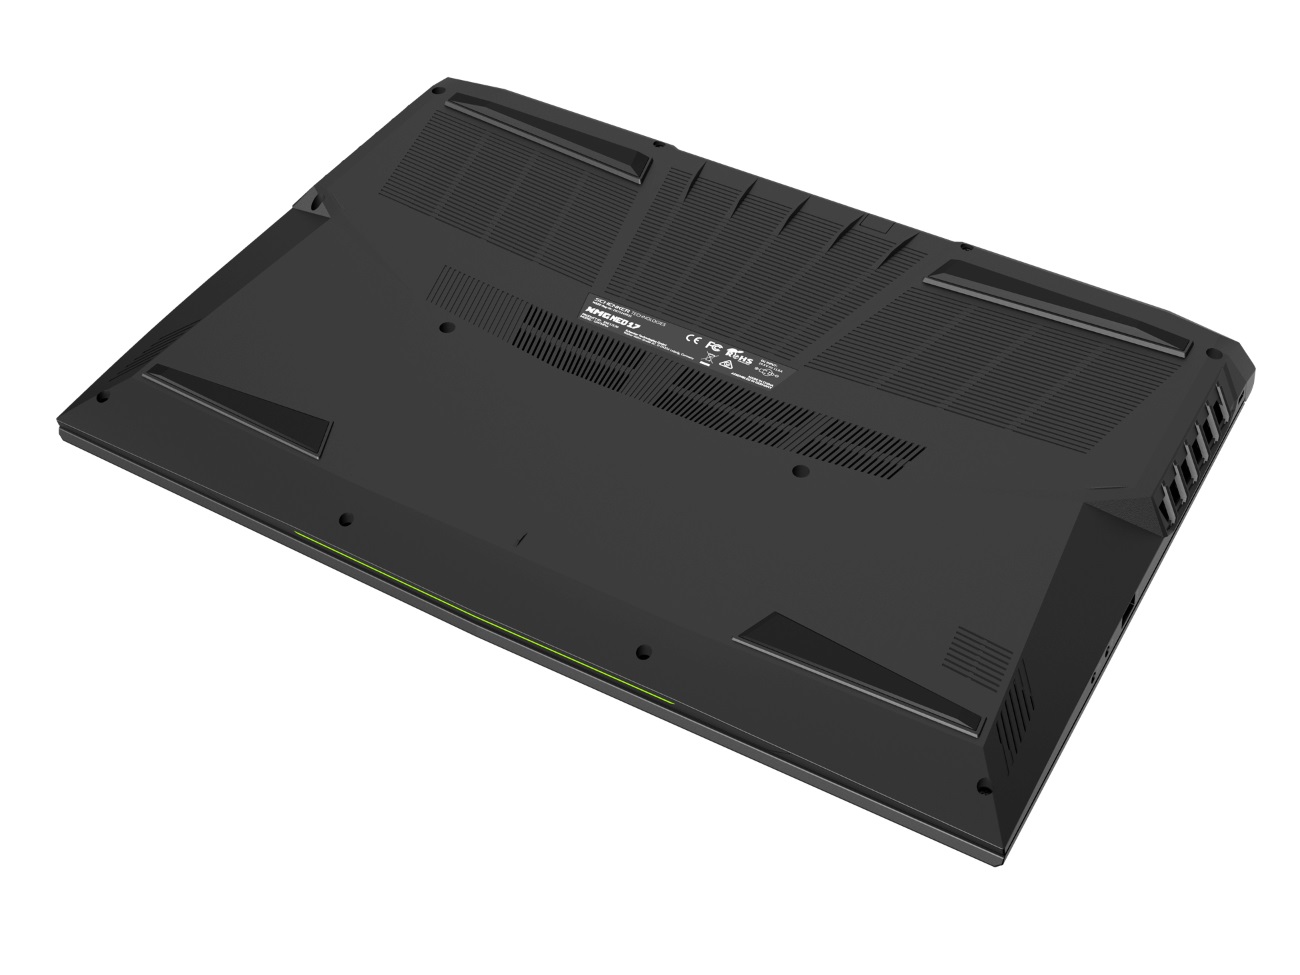
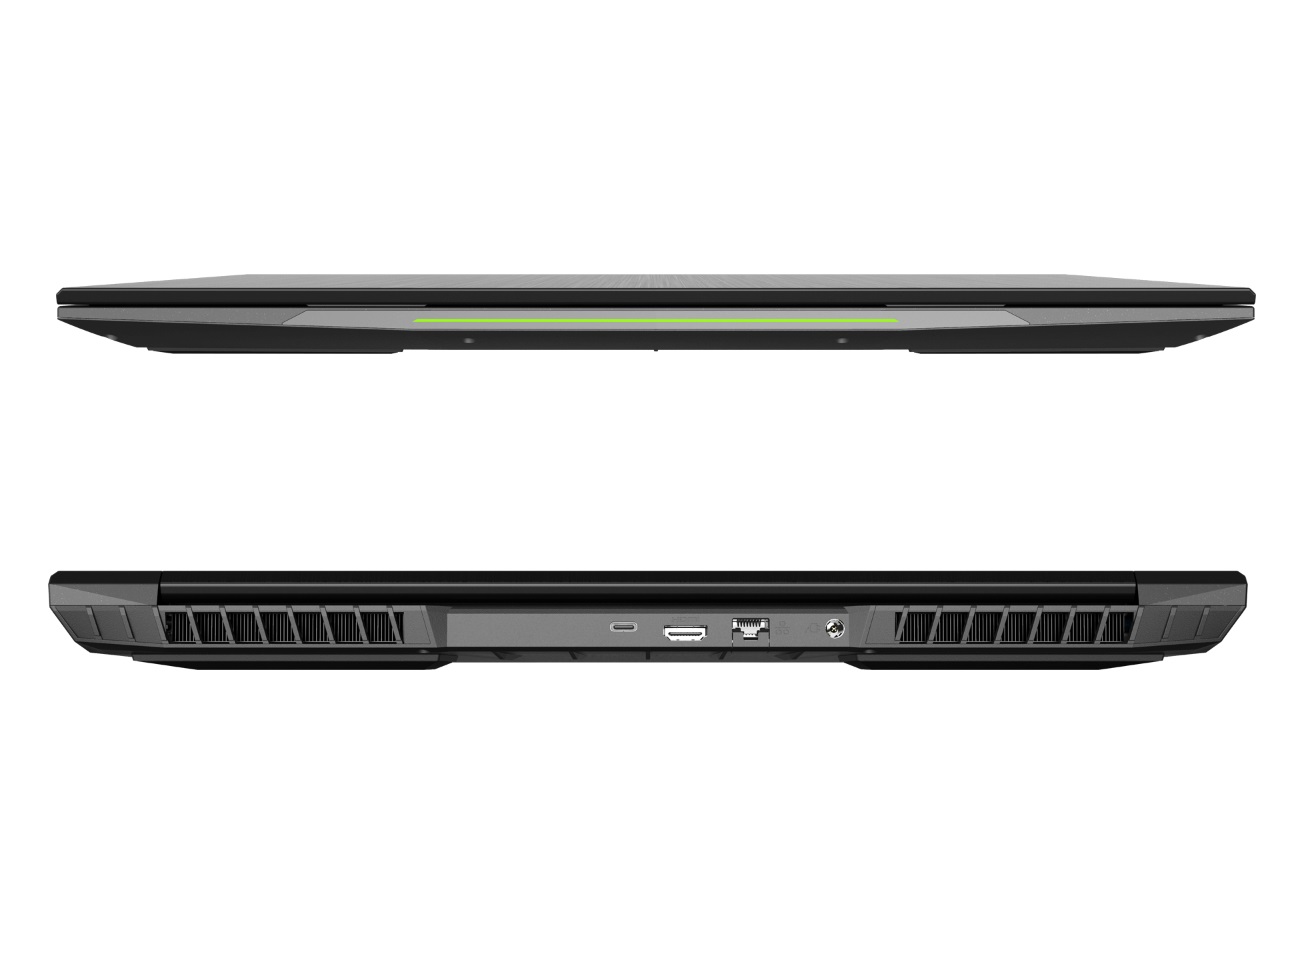
Since the case is mostly identical to the old model - with the exception of a few ports - this review doesn't include a new assessment of the chassis, the connectivity, and the input devices. You can find the relevant information in the review of the predecessor. A shame: Due to the AMD CPU, the device has to do without Thunderbolt.
Possible contenders in comparison
Rating | Date | Model | Weight | Height | Size | Resolution | Best Price |
|---|---|---|---|---|---|---|---|
| 85.1 % | 01/2021 | SCHENKER XMG Neo 17 (Early 2021, RTX 3070, 5800H) R7 5800H, GeForce RTX 3070 Laptop GPU | 2.5 kg | 27 mm | 17.30" | 2560x1440 | |
| 87.6 % | 01/2021 | Gigabyte Aero 17 HDR YC i9-10980HK, GeForce RTX 3080 Laptop GPU | 2.8 kg | 21.4 mm | 17.30" | 3840x2160 | |
| 82.4 % | 08/2020 | Asus Zephyrus S17 GX701LXS i7-10875H, GeForce RTX 2080 Super Max-Q | 2.6 kg | 18.7 mm | 17.30" | 1920x1080 | |
| 82.5 % | 07/2020 | MSI Creator 17 A10SGS i7-10875H, GeForce RTX 2080 Super Max-Q | 2.4 kg | 20 mm | 17.30" | 3840x2160 | |
| 86.5 % | 05/2020 | Aorus 17G XB i7-10875H, GeForce RTX 2070 Super Max-Q | 2.7 kg | 26 mm | 17.30" | 1920x1080 |
The XMG Neo 17's competitors include other 17-inch laptops with high-end GPUs and relatively slim builds such as the Gigabyte Aero 17 HDR YC (RTX 3080 laptop GPU), the Asus ROG Zephyrus S17 GX701LXS, the MSI Creator 17 A10SGS, and the Aorus 17G XB (RTX 2080 Super Max-Q in each model).

SD card reader
| SD Card Reader | |
| average JPG Copy Test (av. of 3 runs) | |
| Aorus 17G XB (Toshiba Exceria Pro SDXC 64 GB UHS-II) | |
| Gigabyte Aero 17 HDR YC (Toshiba Exceria Pro SDXC 64 GB UHS-II) | |
| Average of class Gaming (19 - 202, n=100, last 2 years) | |
| SCHENKER XMG Neo 17 (Early 2021, RTX 3070, 5800H) (Toshiba Exceria Pro SDXC 64 GB UHS-II) | |
| maximum AS SSD Seq Read Test (1GB) | |
| Aorus 17G XB (Toshiba Exceria Pro SDXC 64 GB UHS-II) | |
| Gigabyte Aero 17 HDR YC (Toshiba Exceria Pro SDXC 64 GB UHS-II) | |
| Average of class Gaming (26 - 269, n=93, last 2 years) | |
| SCHENKER XMG Neo 17 (Early 2021, RTX 3070, 5800H) (Toshiba Exceria Pro SDXC 64 GB UHS-II) | |
Communication
Webcam
 GeForce RTX 3070 Laptop GPU, R7 5800H, Samsung SSD 970 EVO Plus 500GB")
 GeForce RTX 3070 Laptop GPU, R7 5800H, Samsung SSD 970 EVO Plus 500GB")
Display
In contrast to 4K displays, which sometimes overtax the graphics card, 2560x1440 pixels don't bring current gaming laptops to their knees as quickly.
| |||||||||||||||||||||||||
Brightness Distribution: 88 %
Center on Battery: 410 cd/m²
Contrast: 1108:1 (Black: 0.37 cd/m²)
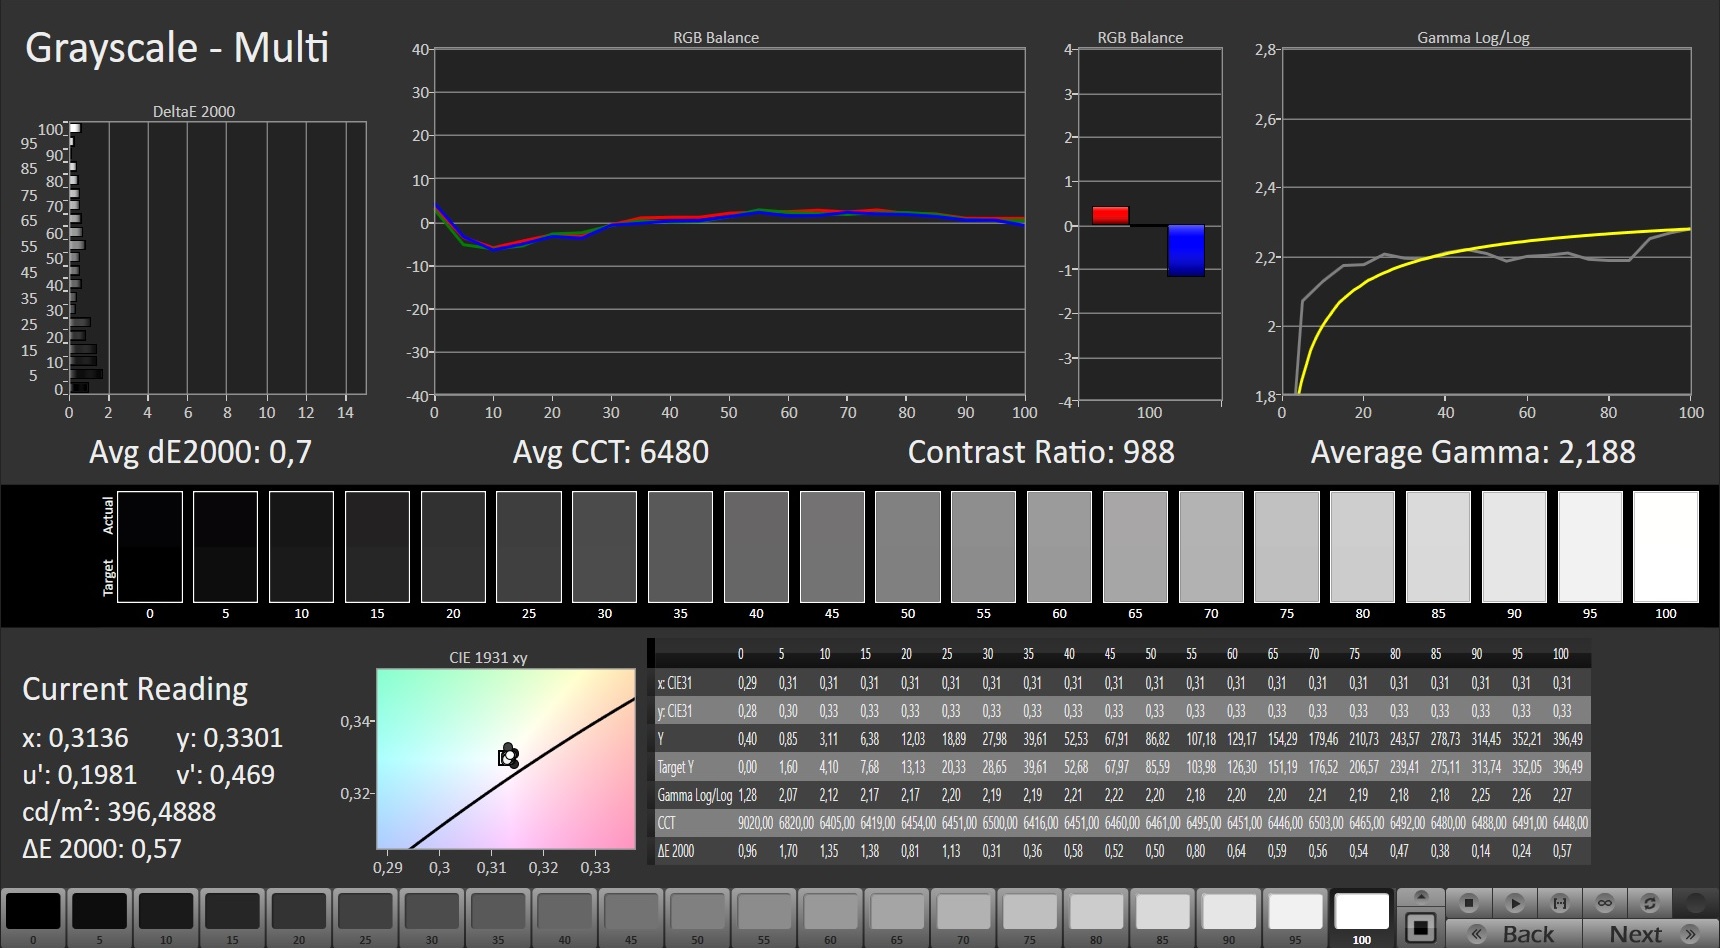
ΔE Color 2.55 | 0.5-29.43 Ø5, calibrated: 1.28
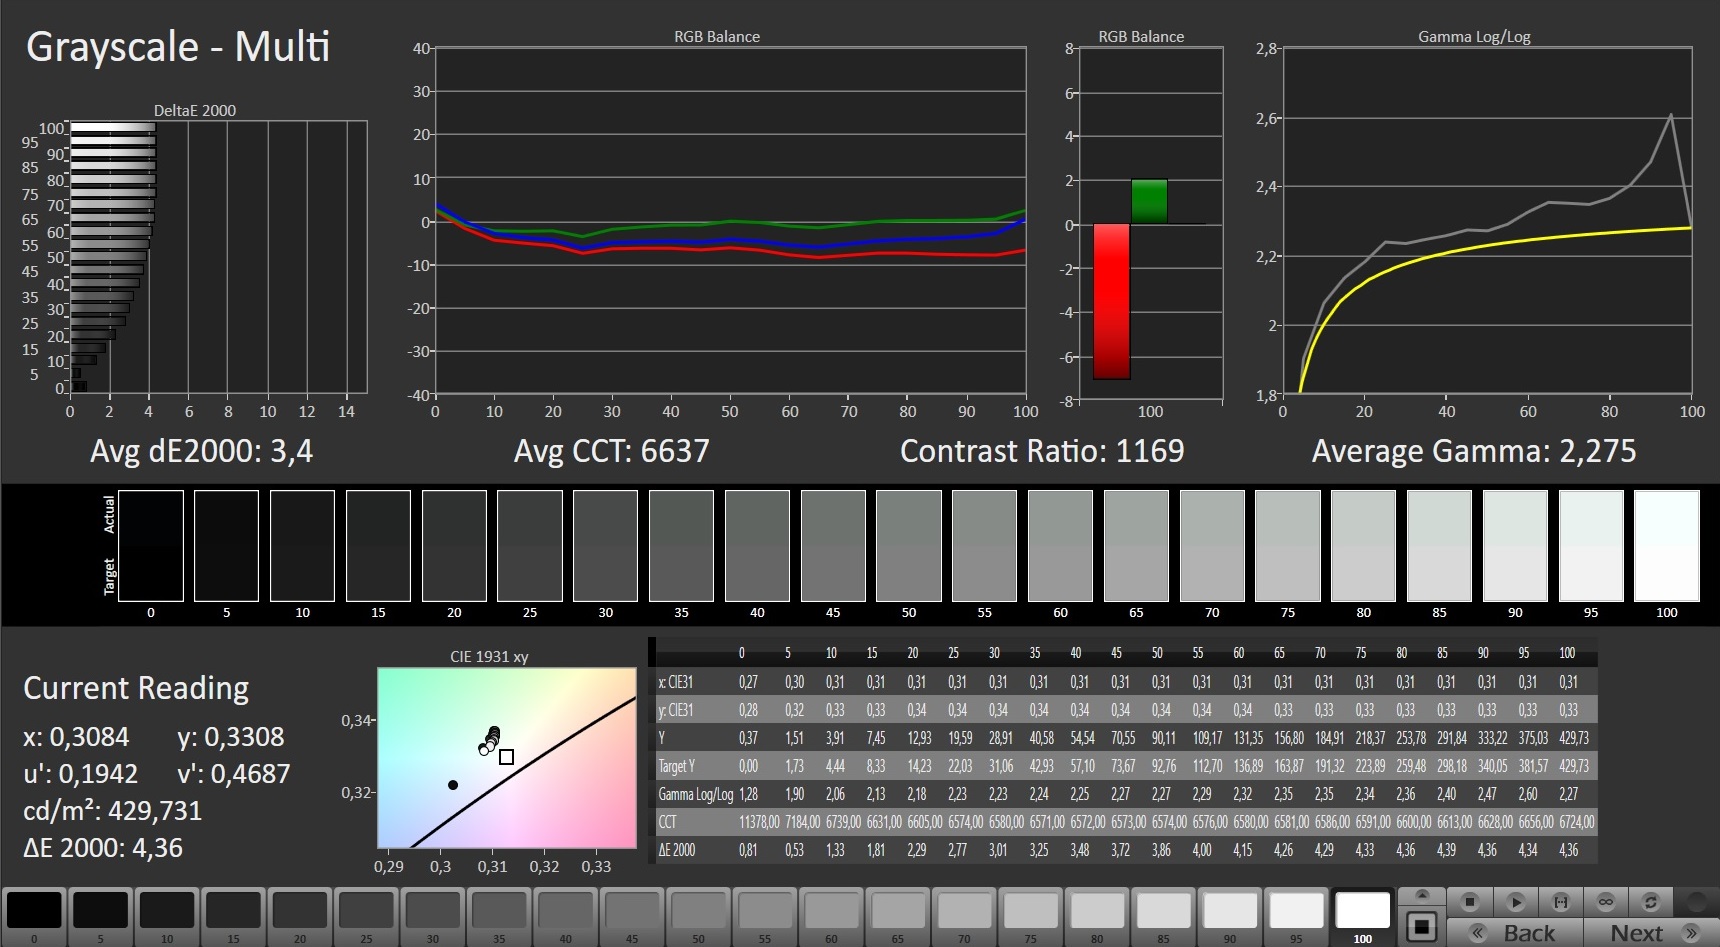
ΔE Greyscale 3.4 | 0.57-98 Ø5.3
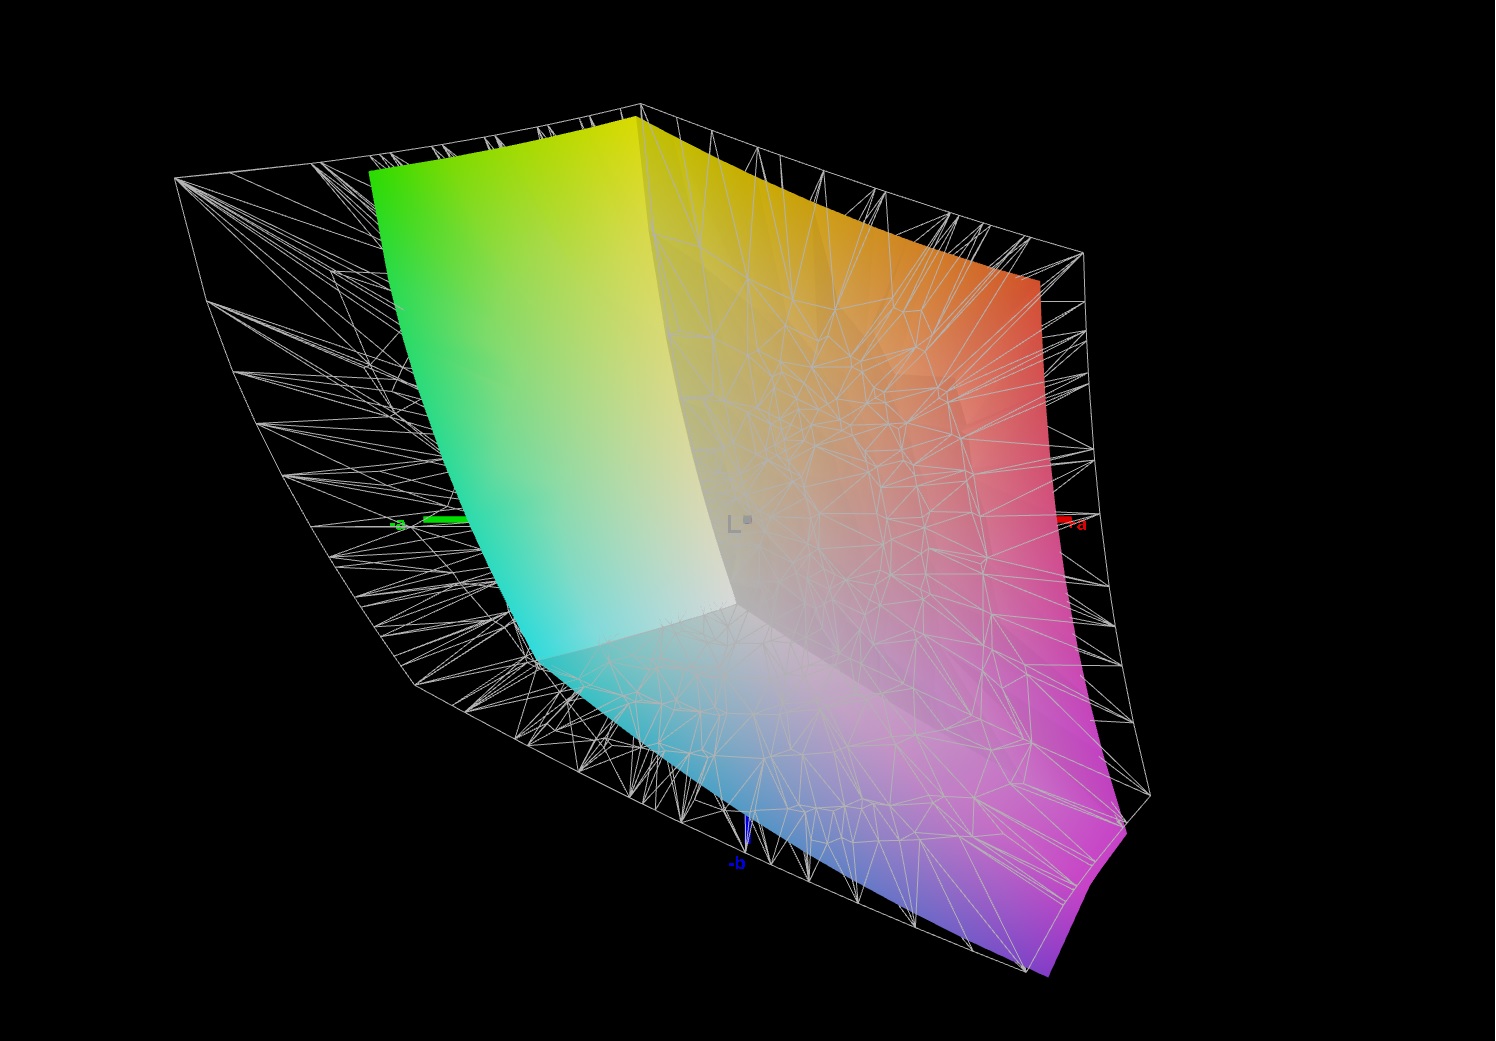
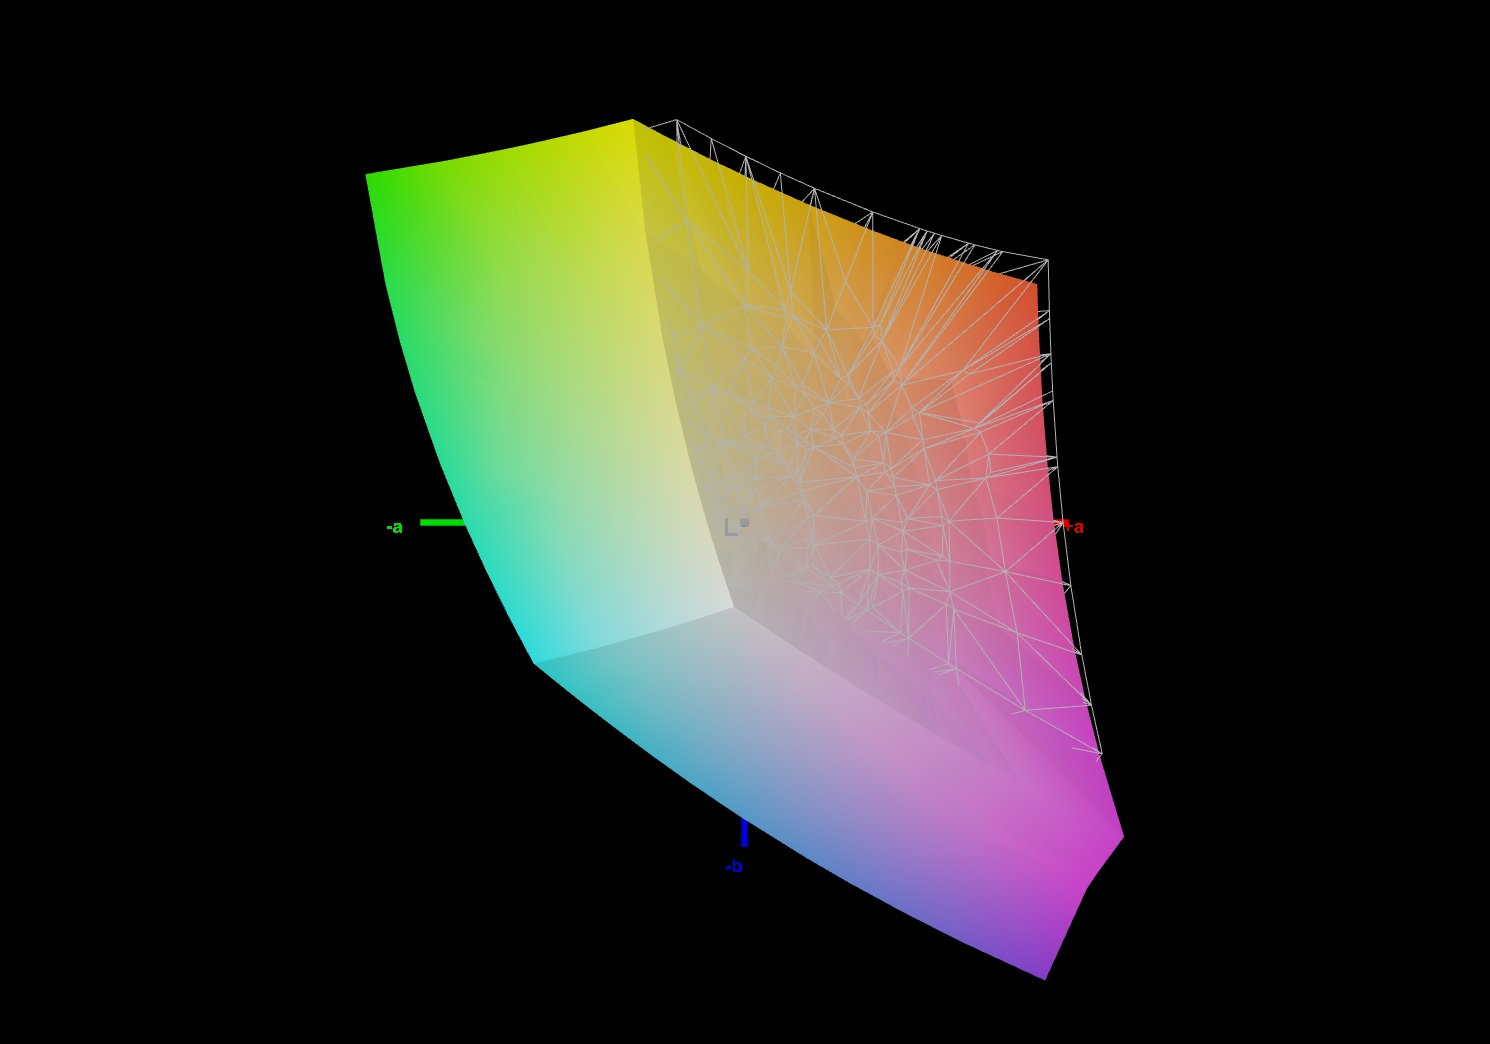
95% sRGB (Argyll 1.6.3 3D)
72% AdobeRGB 1998 (Argyll 1.6.3 3D)
71.8% AdobeRGB 1998 (Argyll 2.2.0 3D)
99.5% sRGB (Argyll 2.2.0 3D)
70.5% Display P3 (Argyll 2.2.0 3D)
Gamma: 2.275
| SCHENKER XMG Neo 17 (Early 2021, RTX 3070, 5800H) BOE NE173QHM-NY2 (BOE0977), IPS, 2560x1440, 17.30 | Gigabyte Aero 17 HDR YC AUO B173ZAN03.2 (AUO329B), IPS-Level, 3840x2160, 17.30 | Asus Zephyrus S17 GX701LXS Sharp SHP14DC, IPS, 1920x1080, 17.30 | MSI Creator 17 A10SGS B173ZAN05.0 (AUO278E), Mini-LED IPS-Level, 3840x2160, 17.30 | Aorus 17G XB AU Optronics B173HAN05.0 (AUO509D), IPS, 1920x1080, 17.30 | |
|---|---|---|---|---|---|
| Display | 21% | 2% | 10% | -0% | |
| Display P3 Coverage | 70.5 | 87.3 24% | 73.6 4% | 82 16% | 70.6 0% |
| sRGB Coverage | 99.5 | 100 1% | 99.7 0% | 97.5 -2% | 97.2 -2% |
| AdobeRGB 1998 Coverage | 71.8 | 99.9 39% | 73.7 3% | 84 17% | 72.8 1% |
| Response Times | -178% | 45% | 12% | -8% | |
| Response Time Grey 50% / Grey 80% * | 16.8 ? | 51.6 ? -207% | 5 ? 70% | 16 ? 5% | |
| Response Time Black / White * | 10 ? | 24.8 ? -148% | 8 ? 20% | 8.8 ? 12% | 12 ? -20% |
| PWM Frequency | 26600 ? | ||||
| Screen | 24% | 4% | 6% | 16% | |
| Brightness middle | 410 | 458 12% | 308 -25% | 996 143% | 293 -29% |
| Brightness | 381 | 446 17% | 310 -19% | 952 150% | 285 -25% |
| Brightness Distribution | 88 | 92 5% | 76 -14% | 93 6% | 95 8% |
| Black Level * | 0.37 | 0.37 -0% | 0.34 8% | 0.68 -84% | 0.24 35% |
| Contrast | 1108 | 1238 12% | 906 -18% | 1465 32% | 1221 10% |
| Colorchecker dE 2000 * | 2.55 | 1.52 40% | 1.49 42% | 4.21 -65% | 1.27 50% |
| Colorchecker dE 2000 max. * | 4.33 | 2.51 42% | 3.97 8% | 6.79 -57% | 2.24 48% |
| Colorchecker dE 2000 calibrated * | 1.28 | 0.66 48% | 0.99 23% | 2.03 -59% | 1.06 17% |
| Greyscale dE 2000 * | 3.4 | 1.9 44% | 2.3 32% | 4.1 -21% | 1.34 61% |
| Gamma | 2.275 97% | 2.145 103% | 2.193 100% | 2.207 100% | 2.38 92% |
| CCT | 6637 98% | 6534 99% | 6981 93% | 7491 87% | 6542 99% |
| Color Space (Percent of AdobeRGB 1998) | 72 | 100 39% | 74 3% | 84 17% | 73 1% |
| Color Space (Percent of sRGB) | 95 | 100 5% | 96 1% | 97 2% | 94 -1% |
| Total Average (Program / Settings) | -44% /
-2% | 17% /
9% | 9% /
7% | 3% /
10% |
* ... smaller is better
The WQHD panel installed in the test device comes from Sharp (LQ156M1JW03) and can boast good to very good measurements. Thanks to the quite high brightness of around 380 cd/m², the 17-incher can also be used decently in bright rooms or outdoors. The contrast (approx. 1,100:1) is also acceptable.

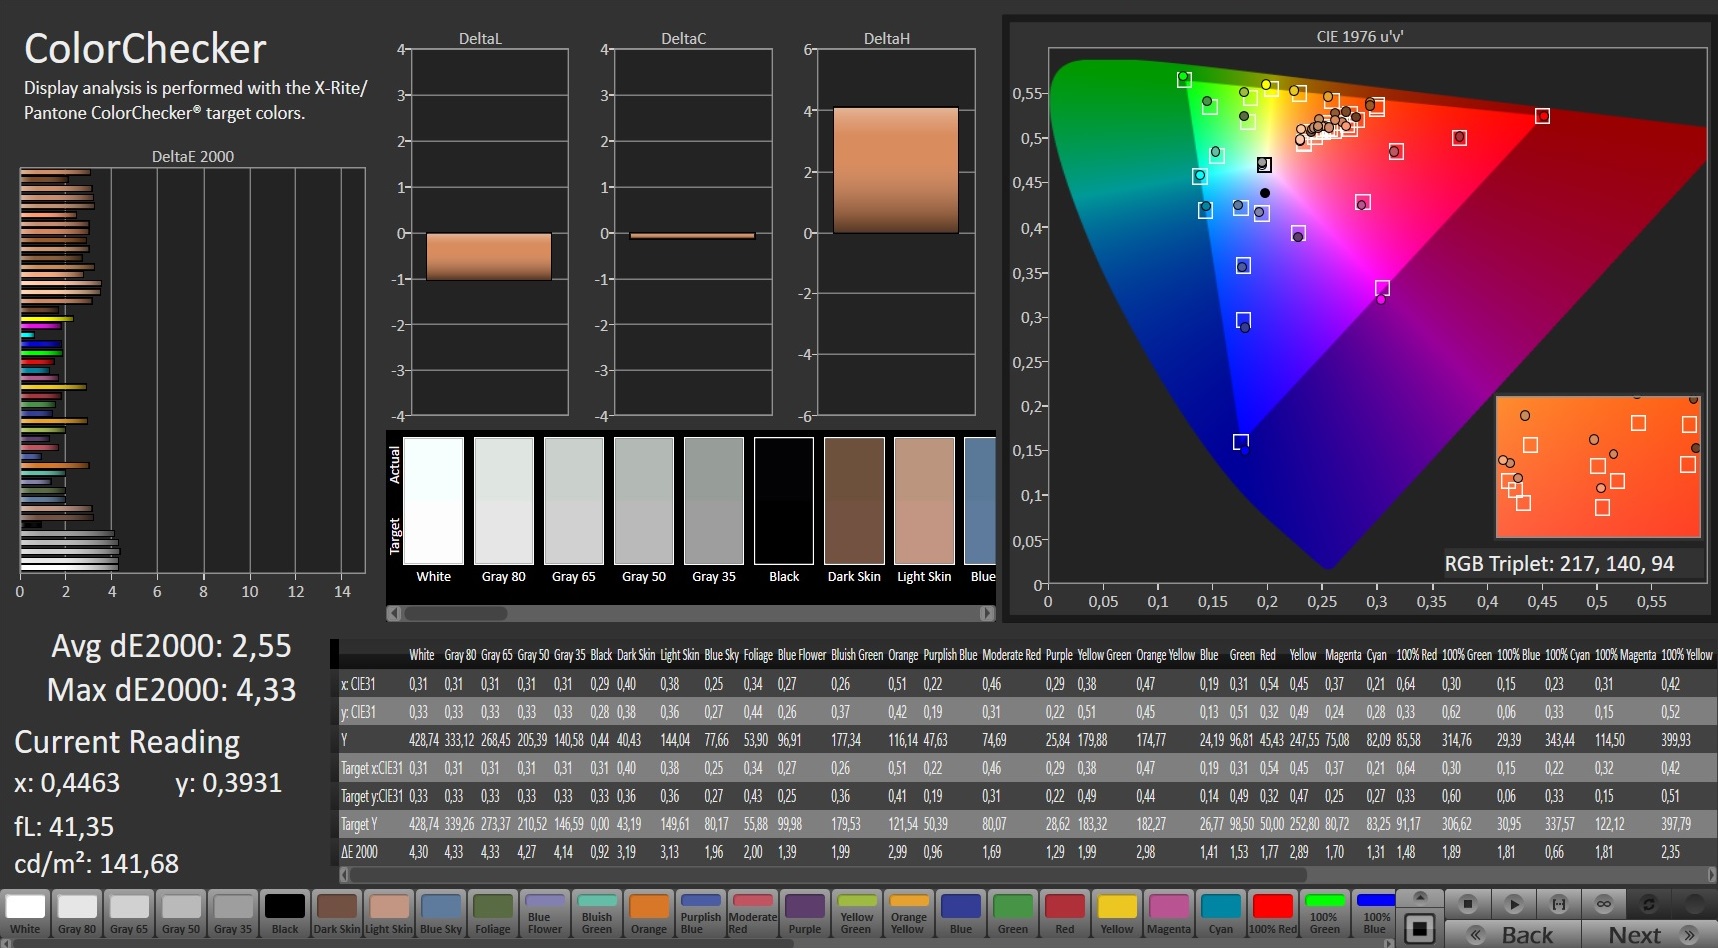
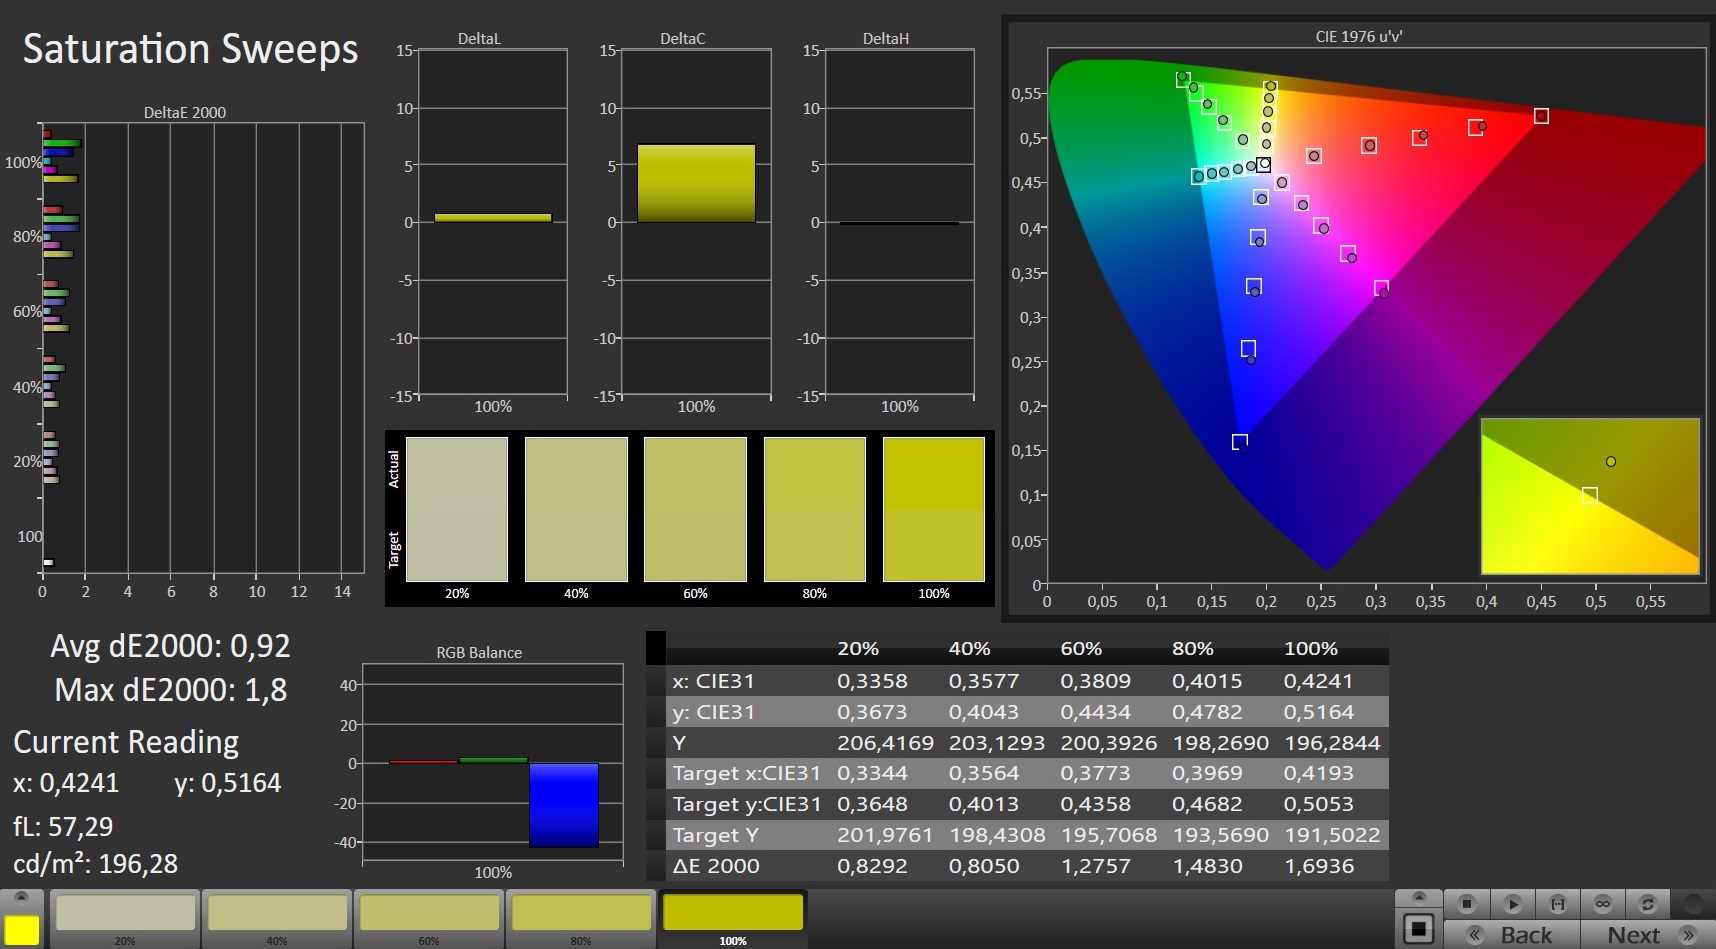
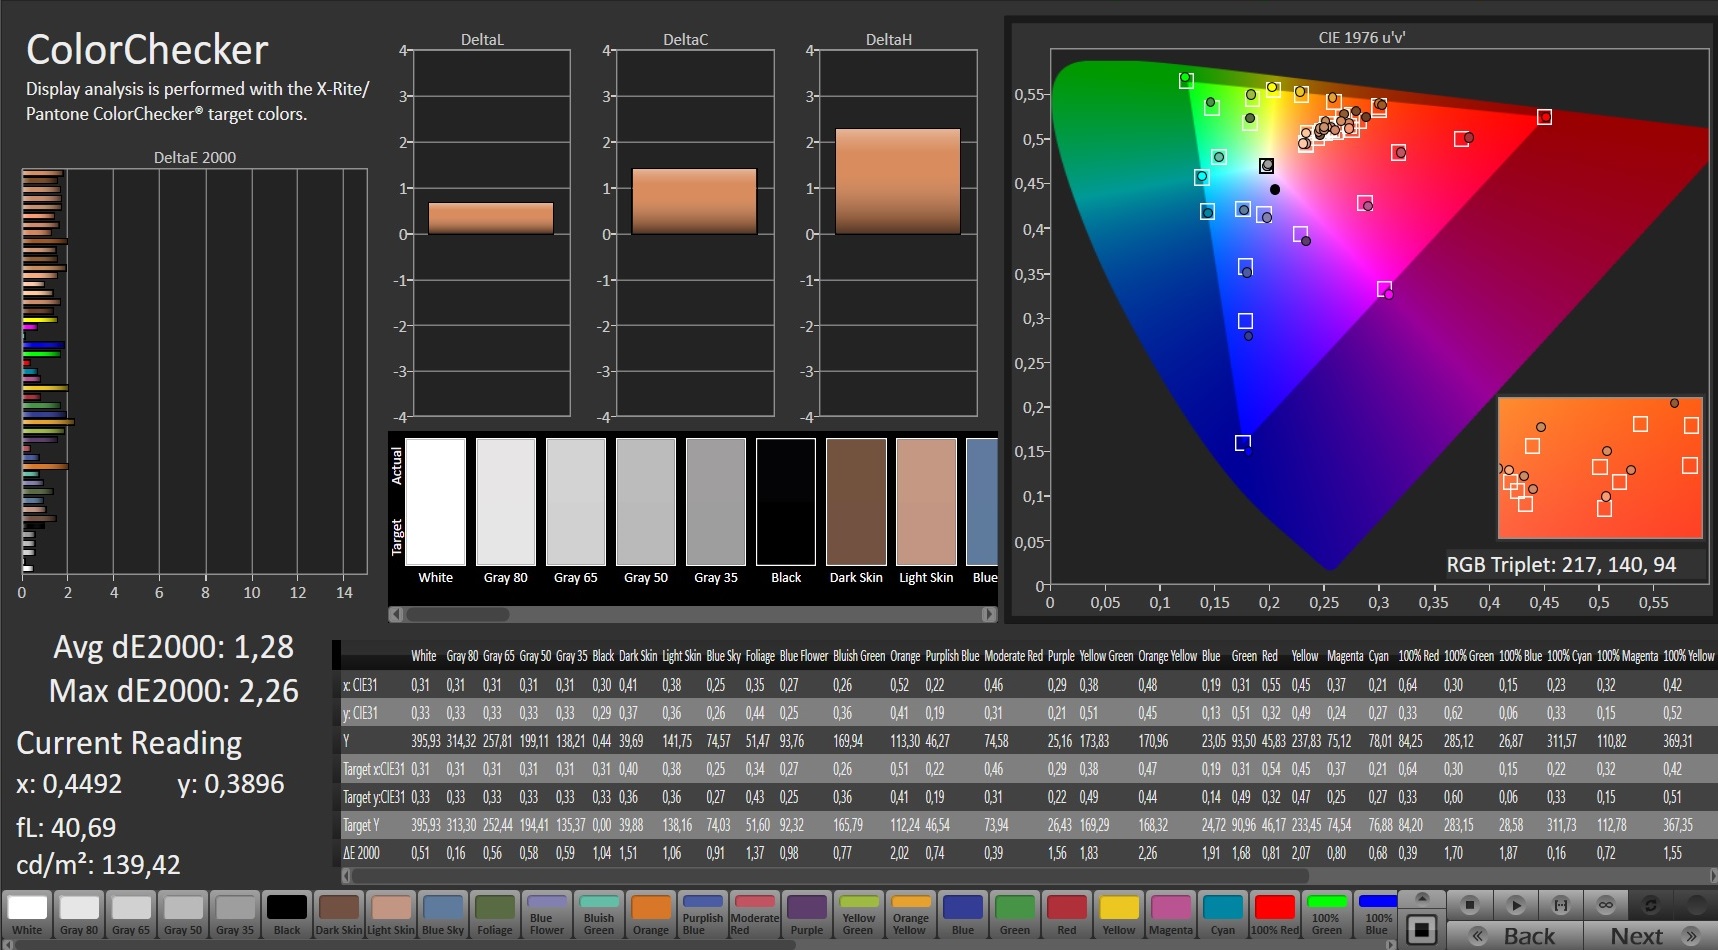
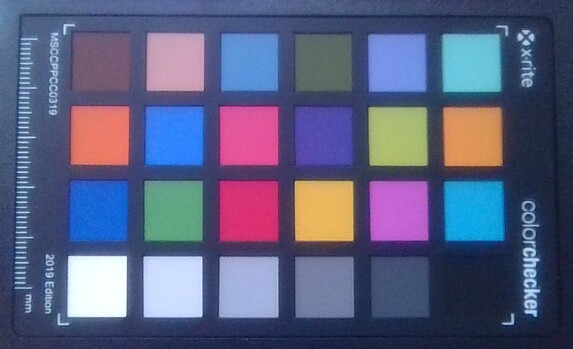
Those who do photo and video editing will also be pleased with the good color accuracy. In Calman's ColorChecker test, the 17-inch panel stayed below a Delta E 2000 value of 3 (= target range). Color-space coverage is also good: 95% of sRGB and 72% of AdobeRGB are respectable values for a gaming laptop.
Gamers will be particularly interested in the response time. The WQHD display doesn't show any flaws here either. Around 10 ms for black-to-white and 17 ms for gray-to-gray is above average. In short: The WQHD panel can be recommended to almost every user group.
Display Response Times
| ↔ Response Time Black to White | ||
|---|---|---|
| 10 ms ... rise ↗ and fall ↘ combined | ↗ 4 ms rise | 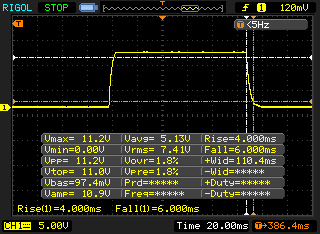 |
| ↘ 6 ms fall | ||
| The screen shows good response rates in our tests, but may be too slow for competitive gamers. In comparison, all tested devices range from 0.1 (minimum) to 240 (maximum) ms. » 22 % of all devices are better. This means that the measured response time is better than the average of all tested devices (21.5 ms). | ||
| ↔ Response Time 50% Grey to 80% Grey | ||
| 16.8 ms ... rise ↗ and fall ↘ combined | ↗ 8.4 ms rise | 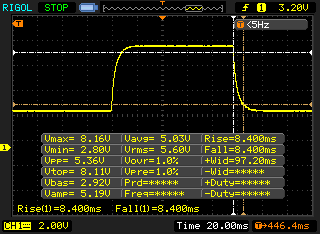 |
| ↘ 8.4 ms fall | ||
| The screen shows good response rates in our tests, but may be too slow for competitive gamers. In comparison, all tested devices range from 0.2 (minimum) to 636 (maximum) ms. » 26 % of all devices are better. This means that the measured response time is better than the average of all tested devices (33.7 ms). | ||
Screen Flickering / PWM (Pulse-Width Modulation)
| Screen flickering / PWM not detected | 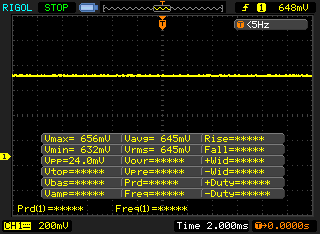 | ||
In comparison: 53 % of all tested devices do not use PWM to dim the display. If PWM was detected, an average of 17924 (minimum: 5 - maximum: 3846000) Hz was measured. | |||
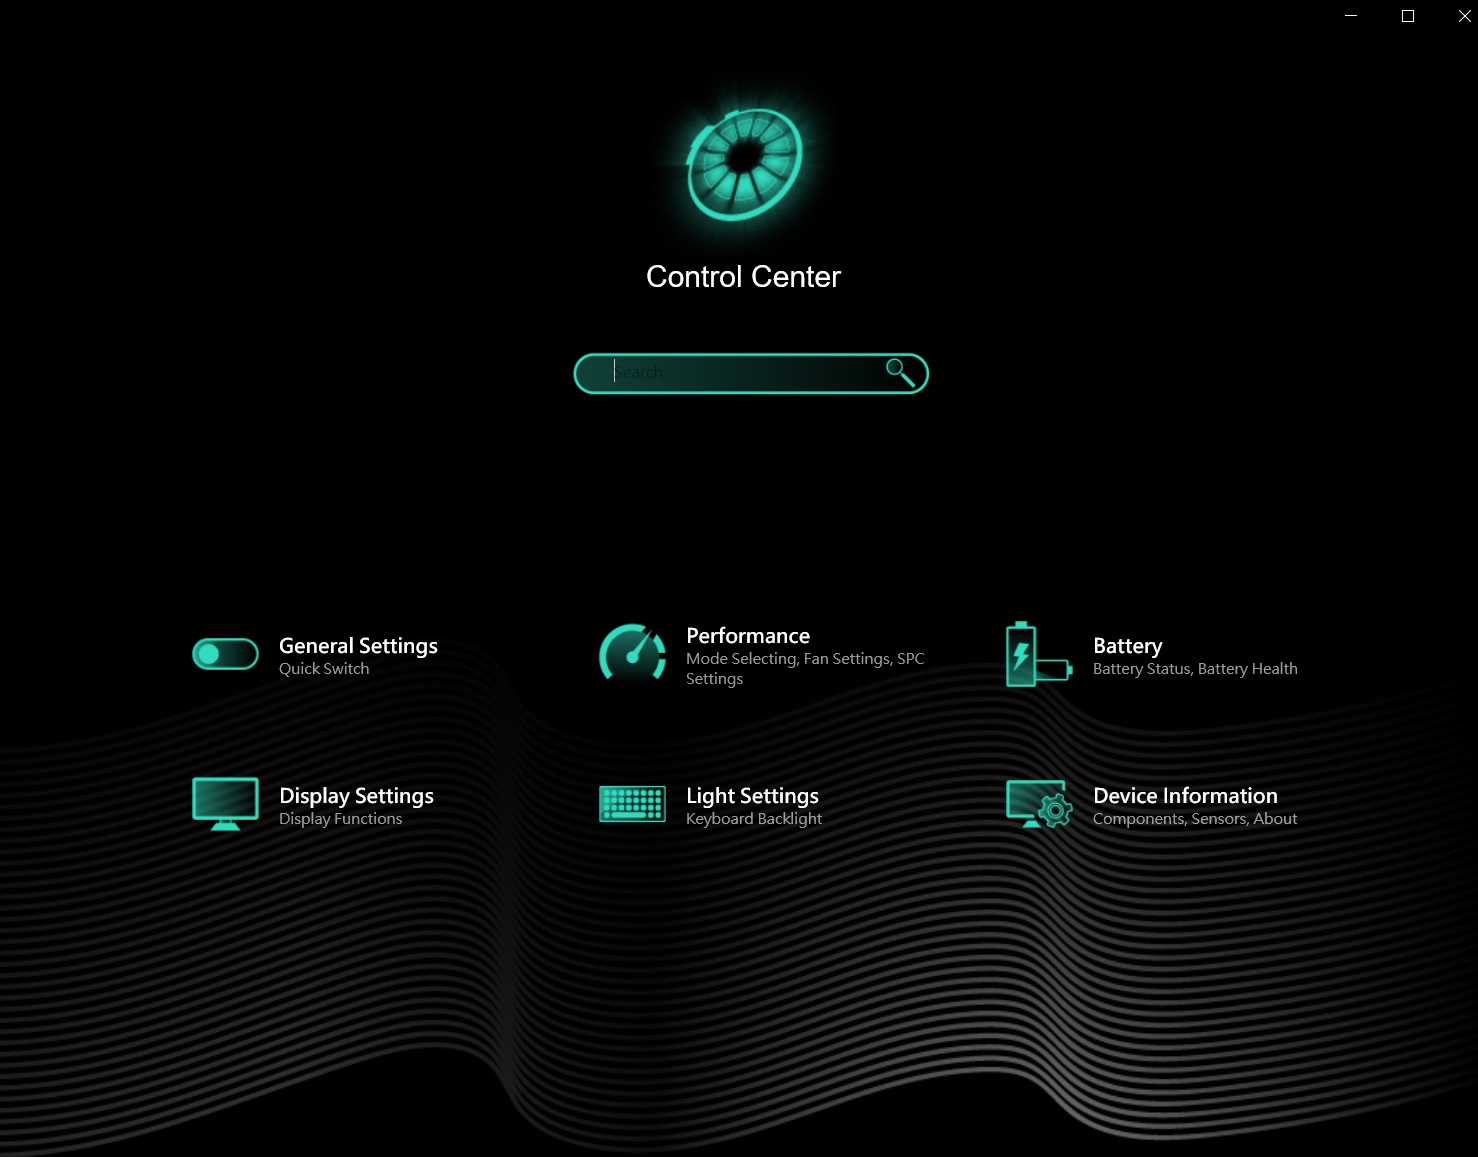
Test conditions
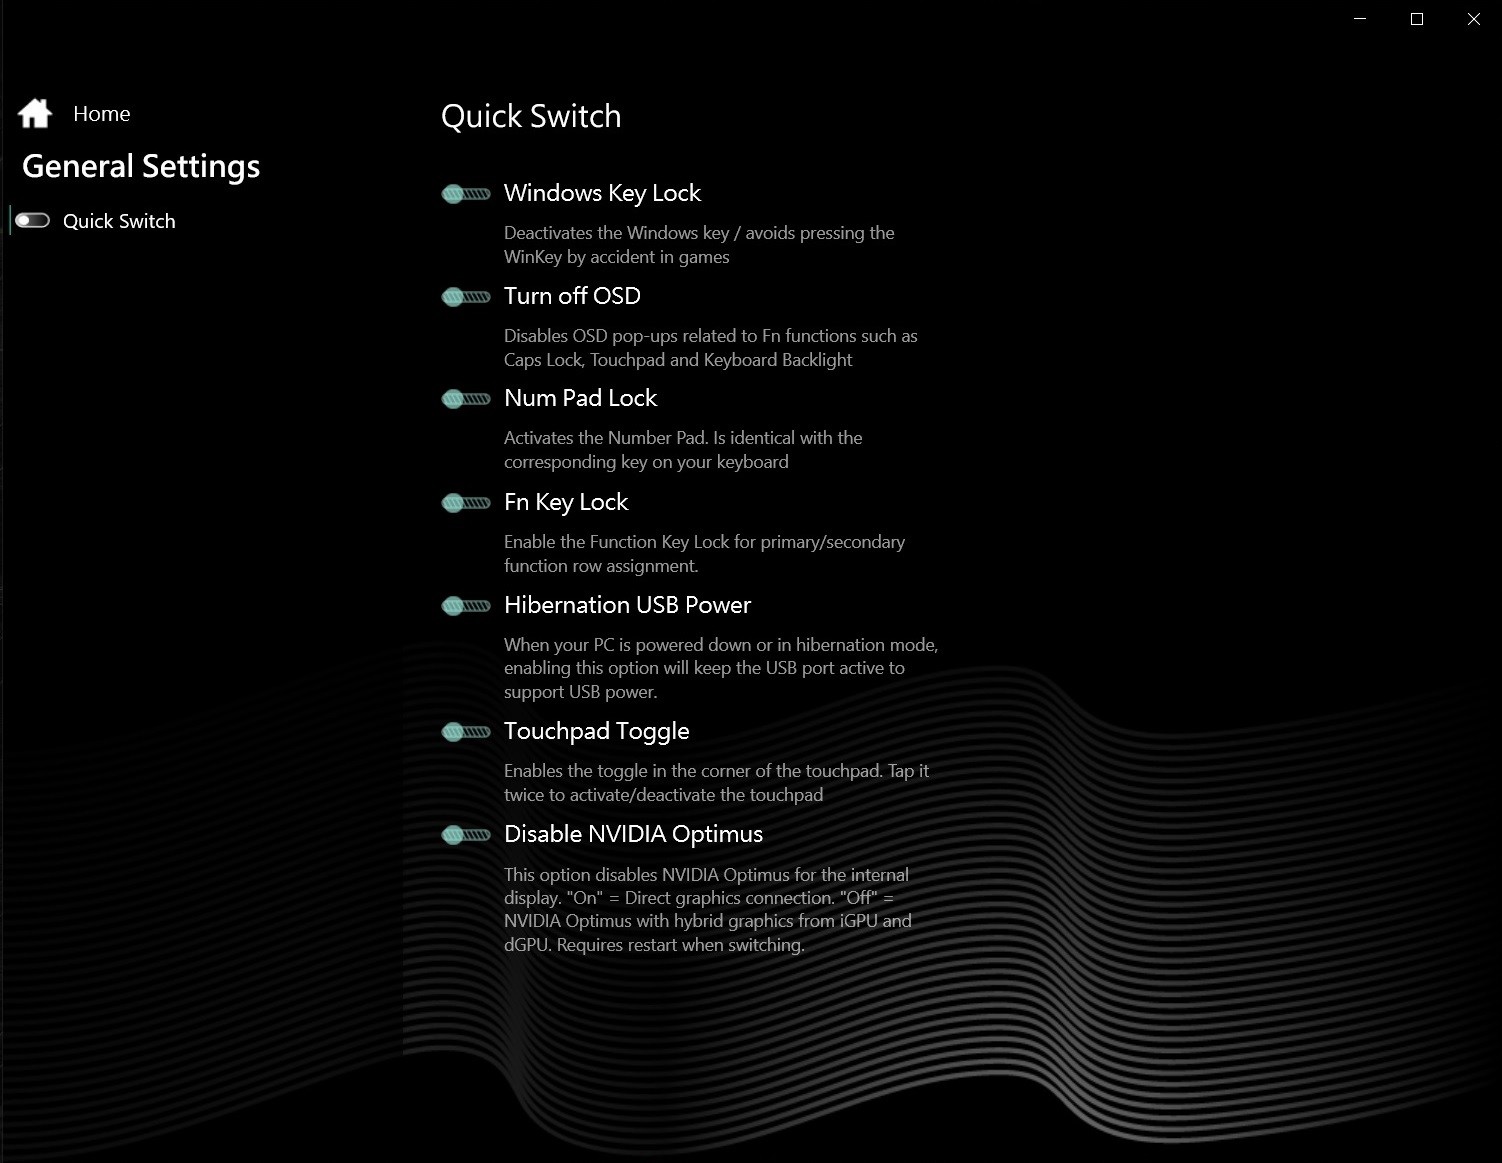
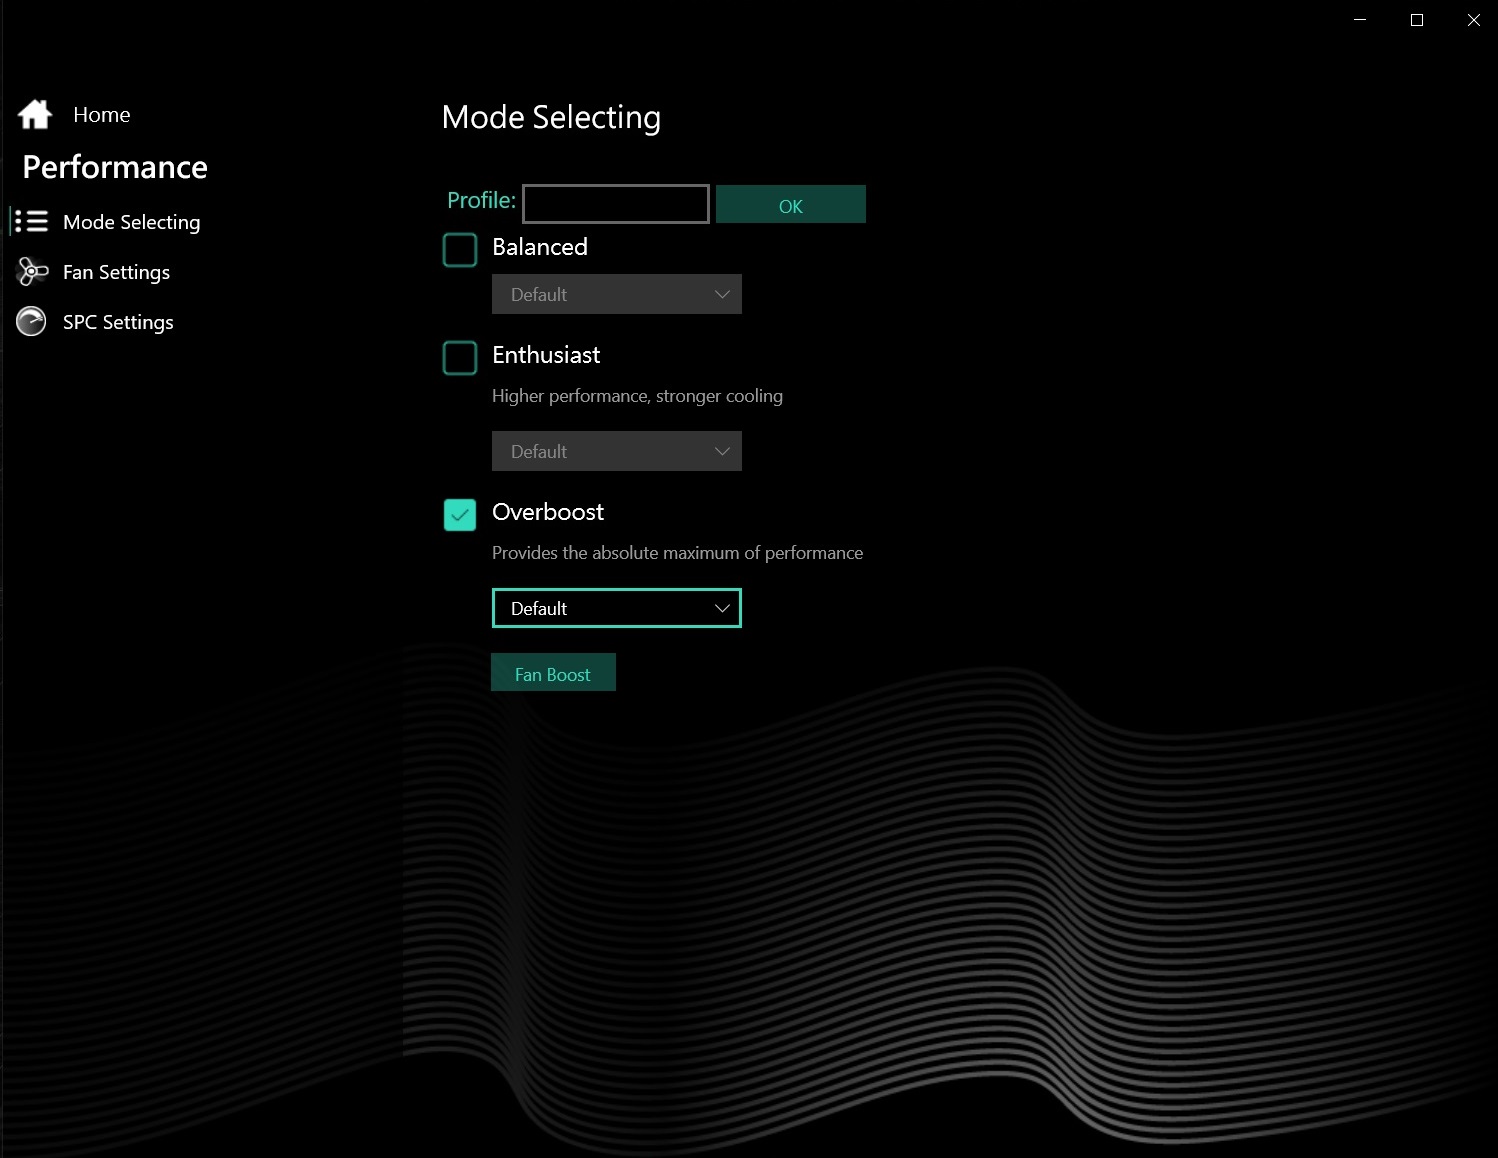
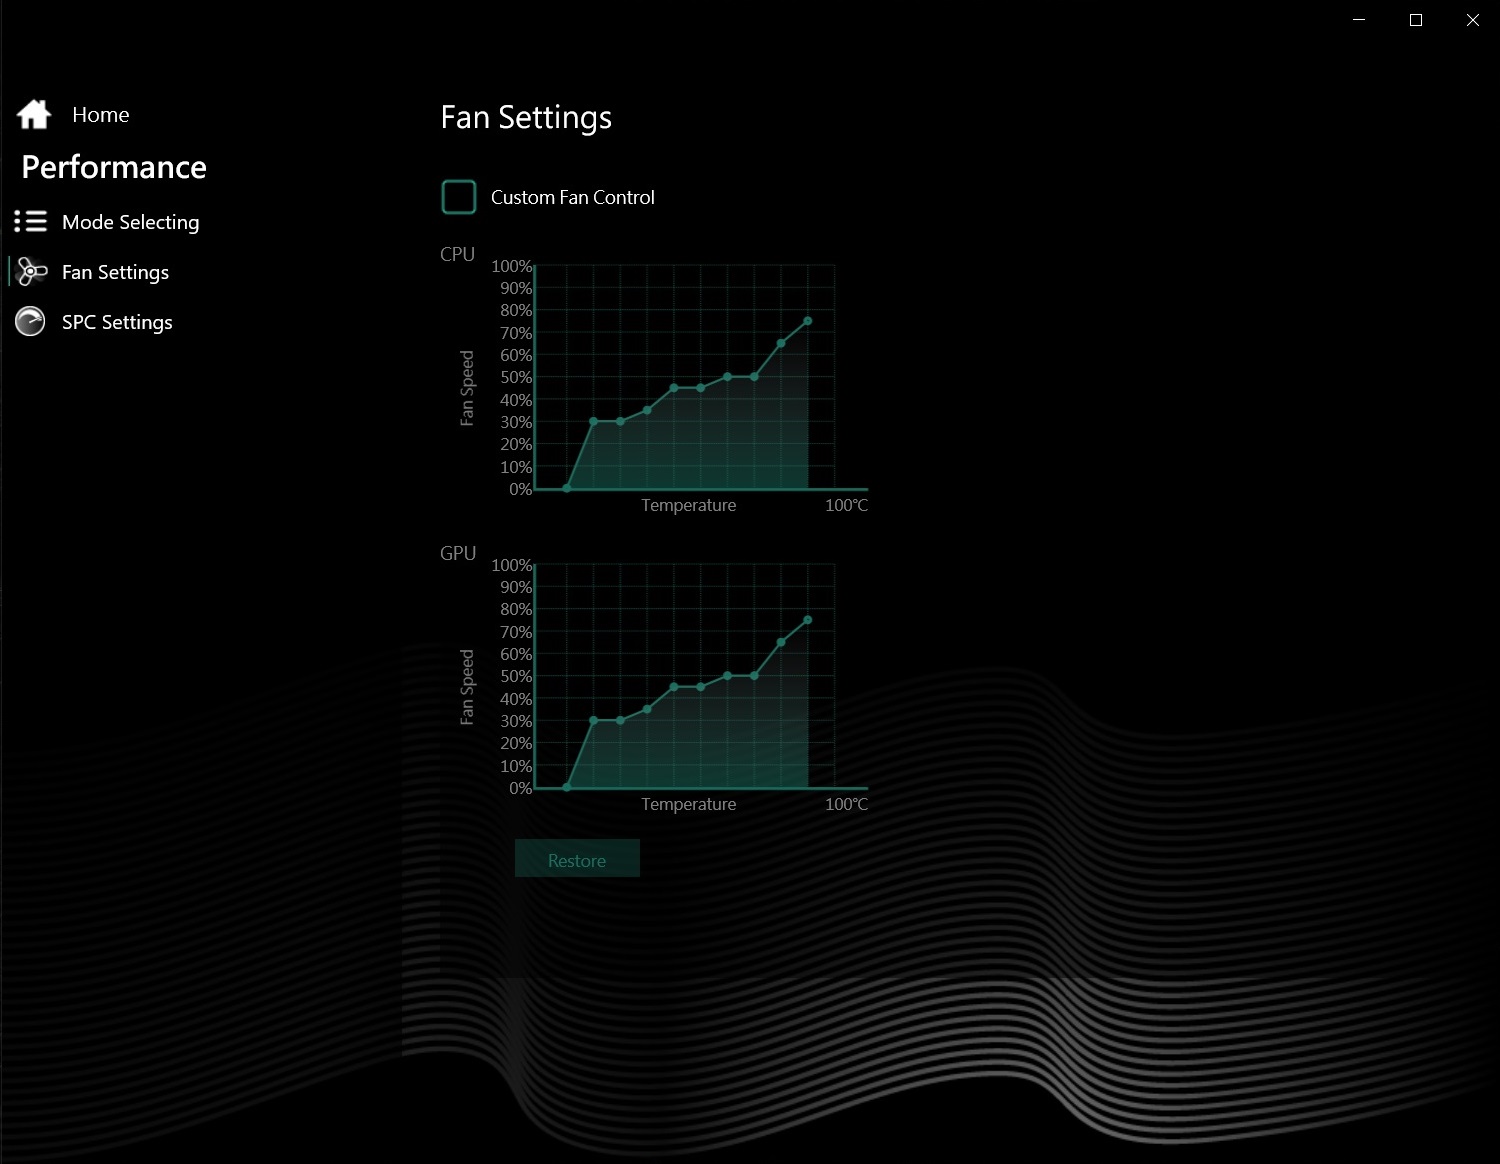
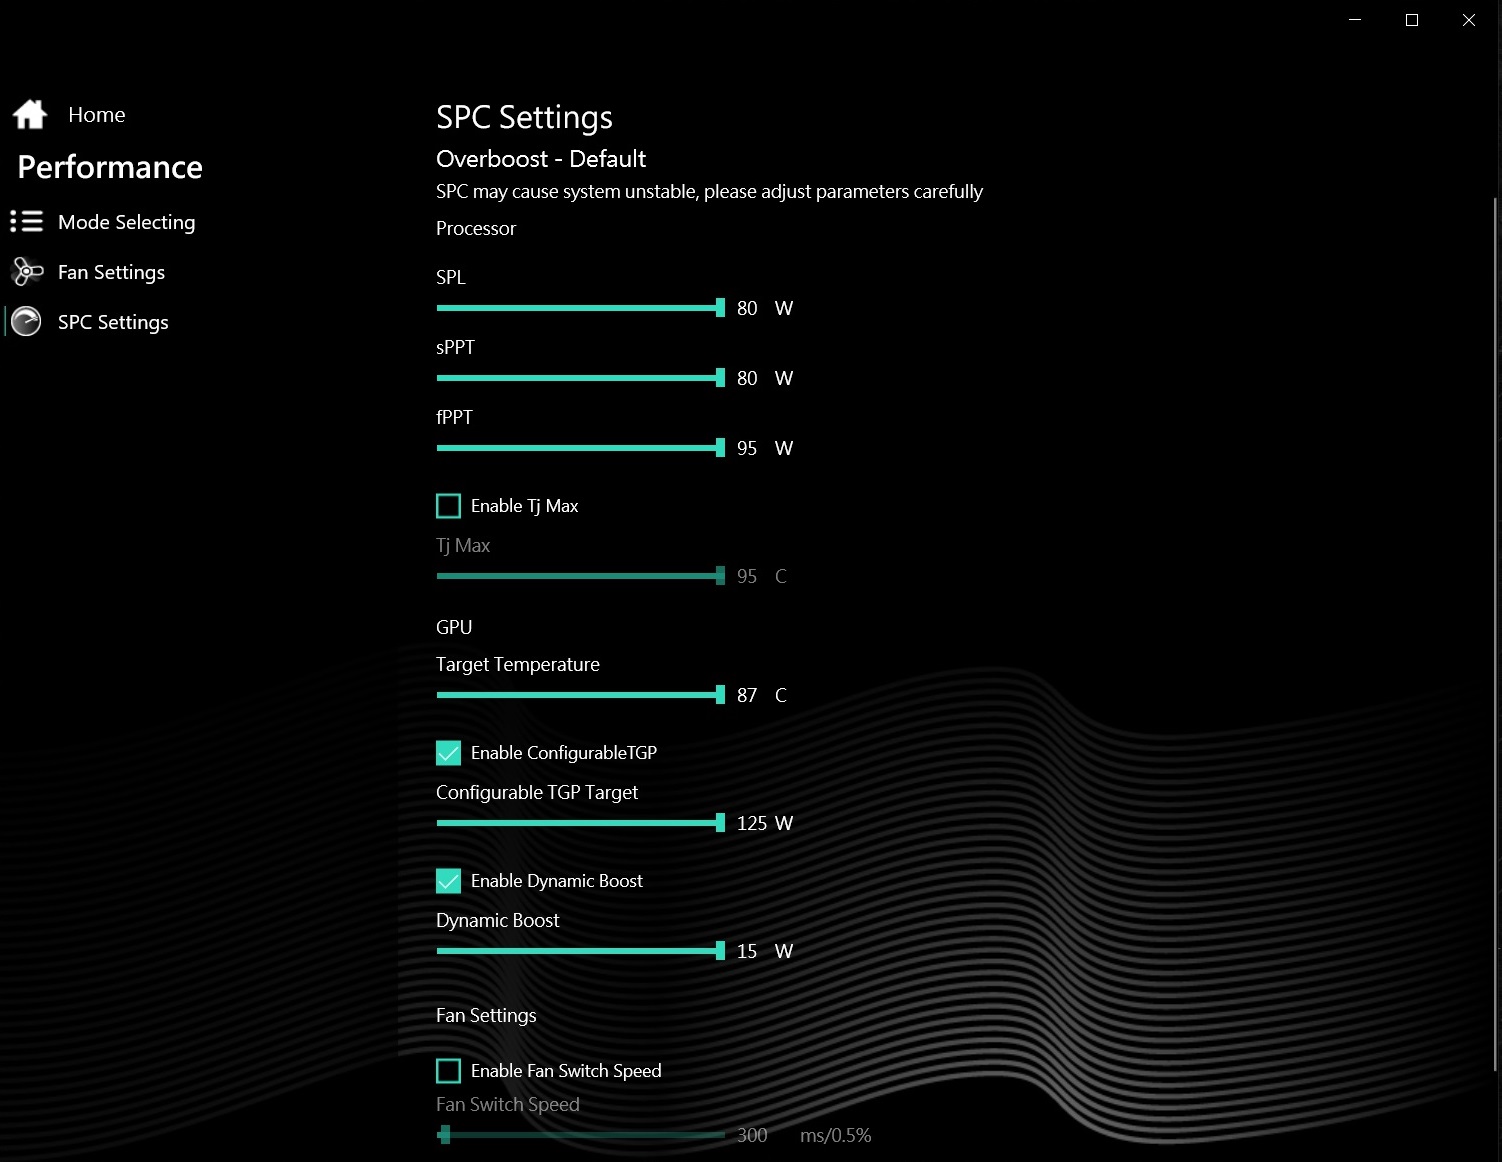
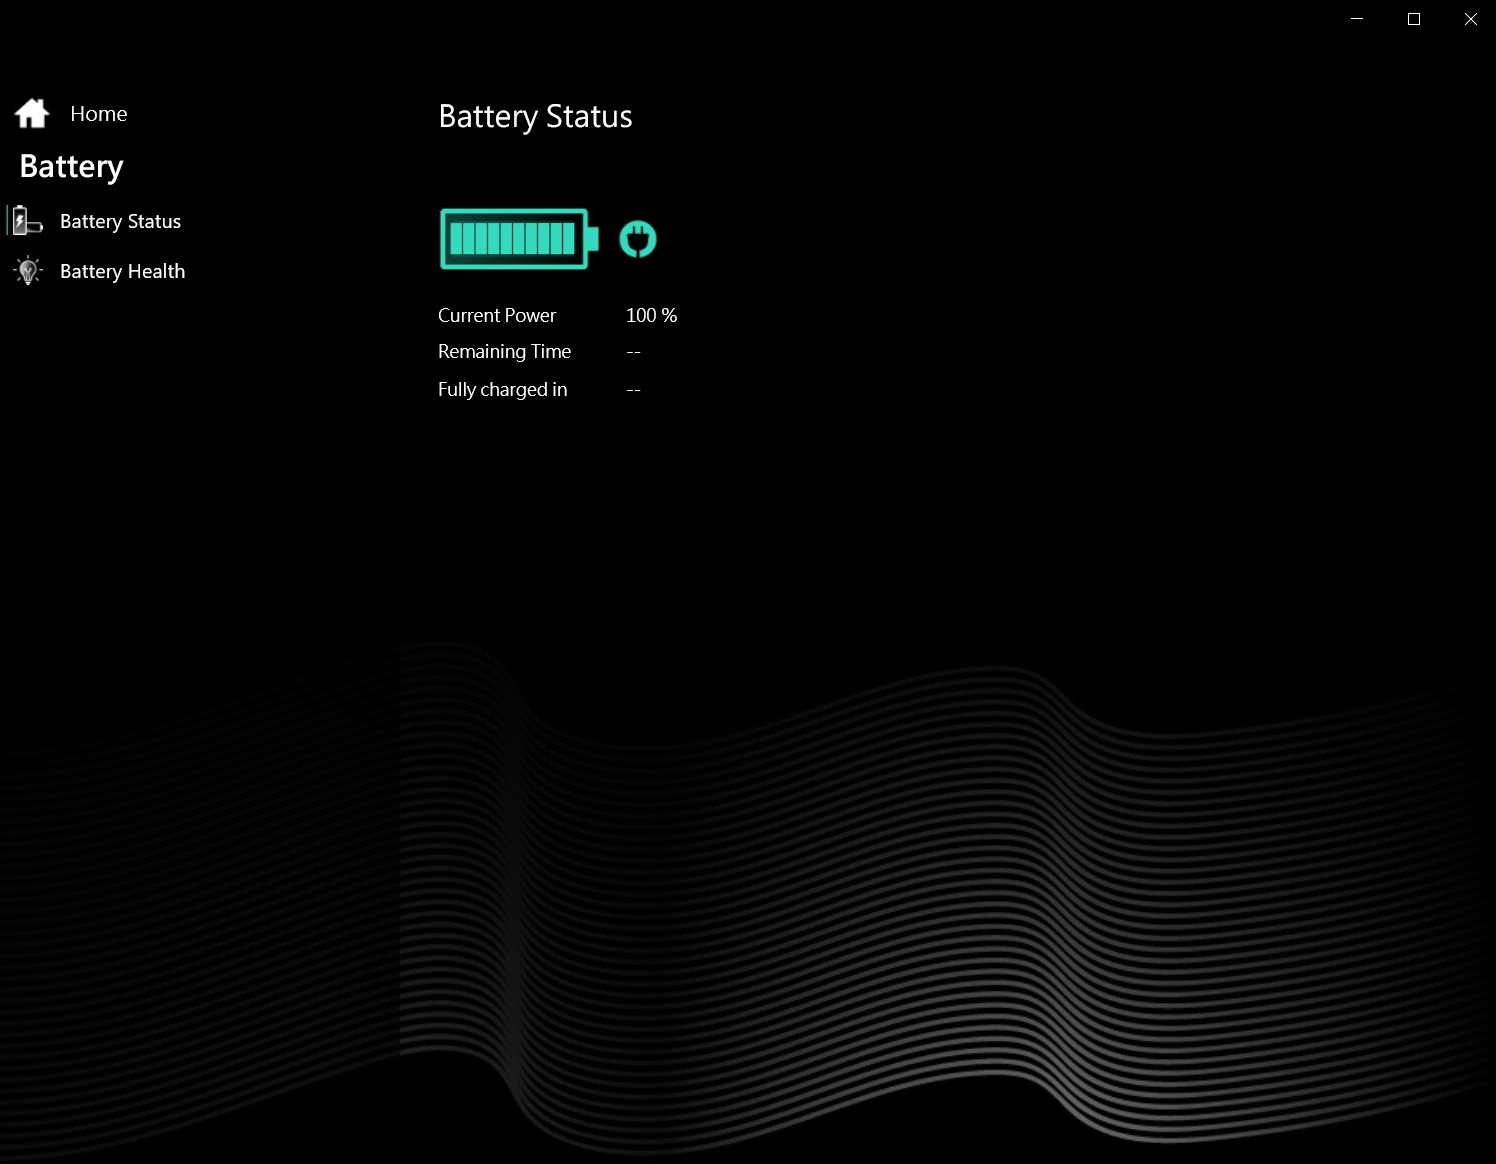
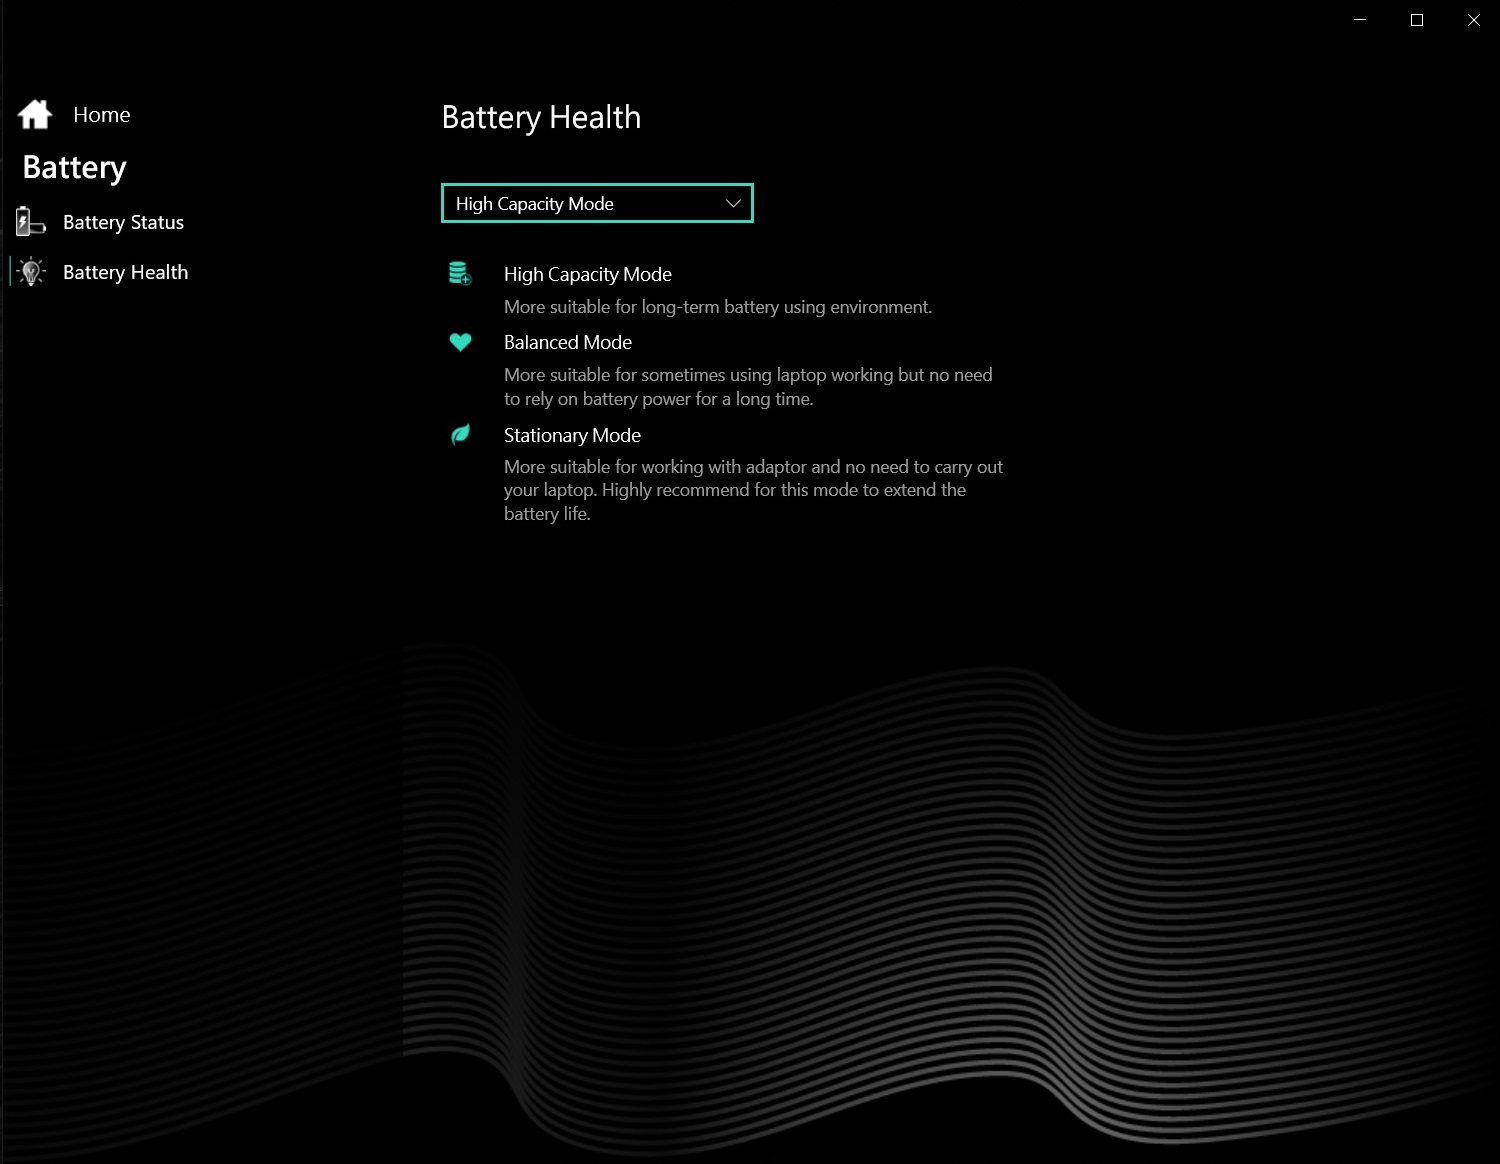
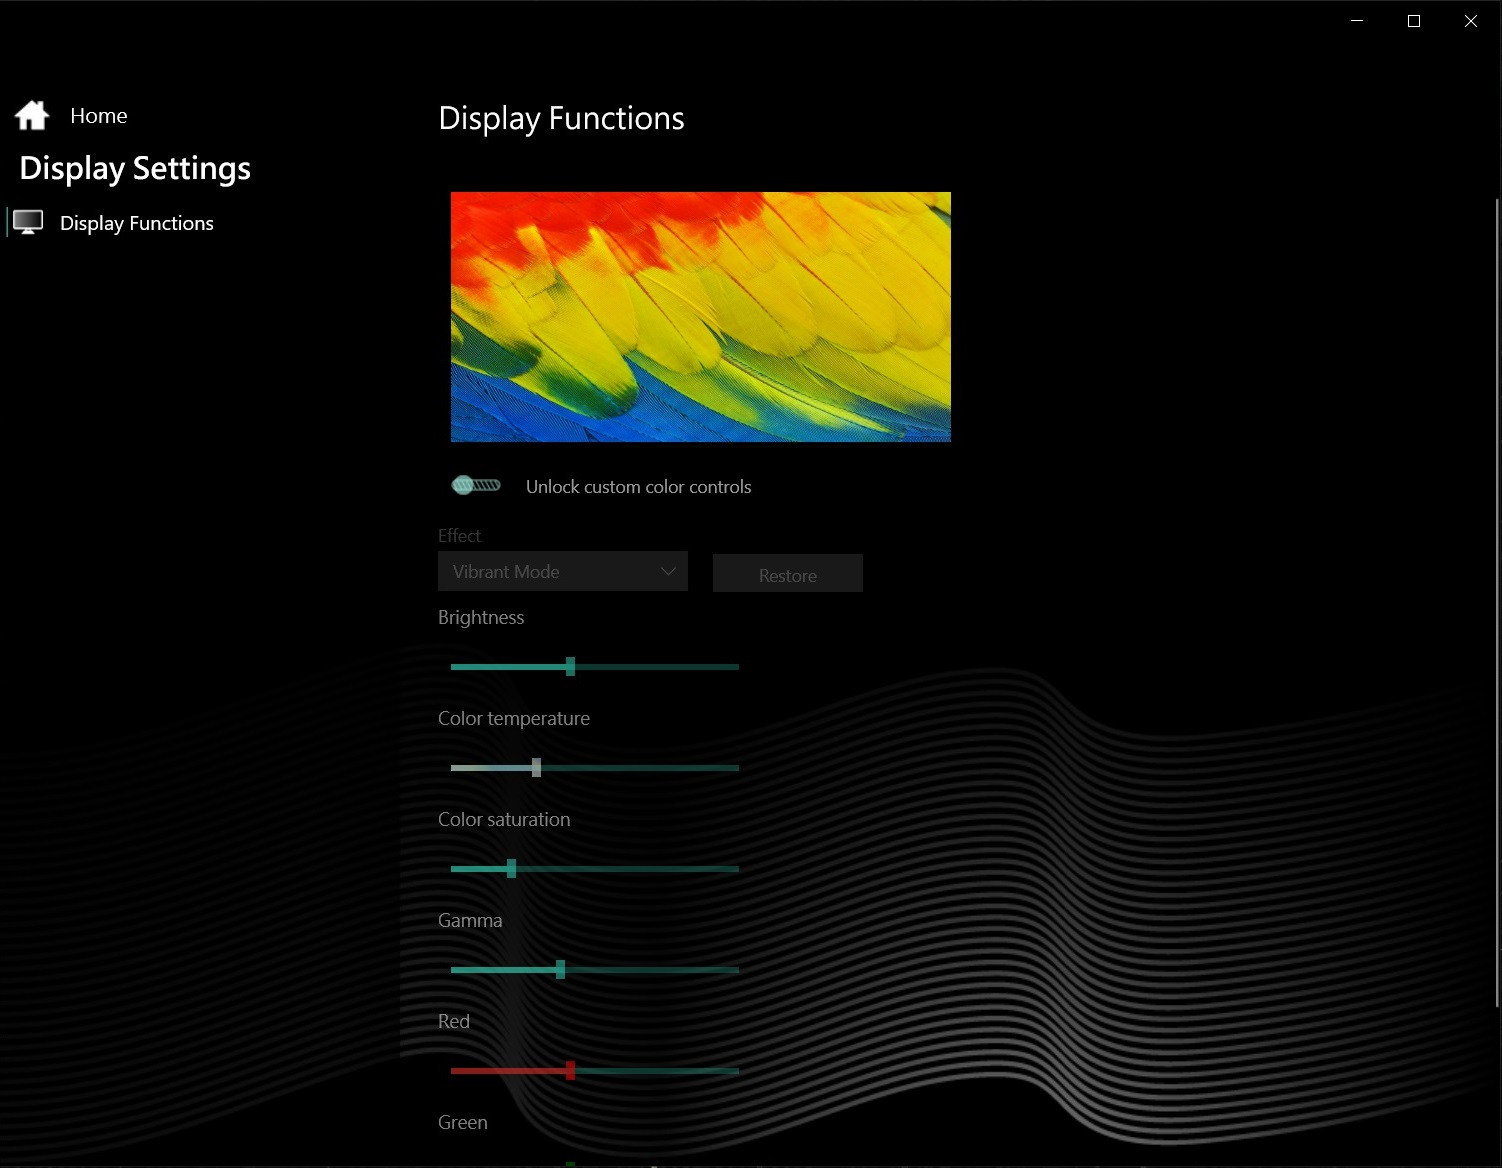
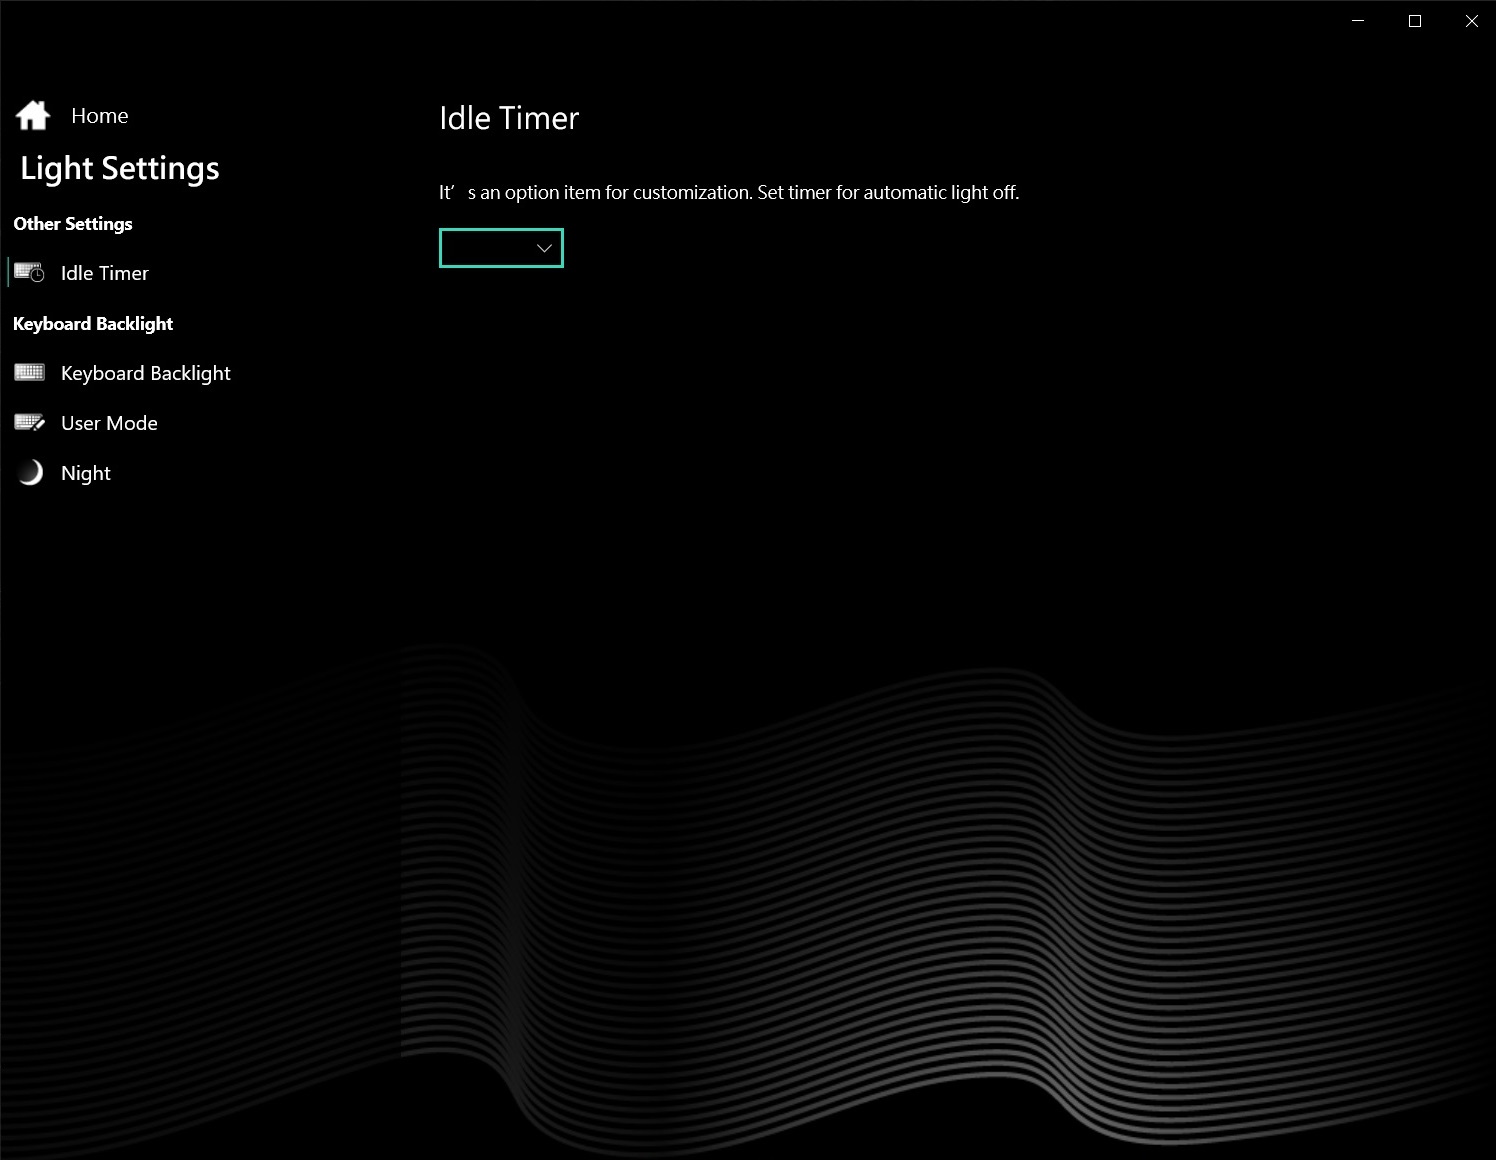
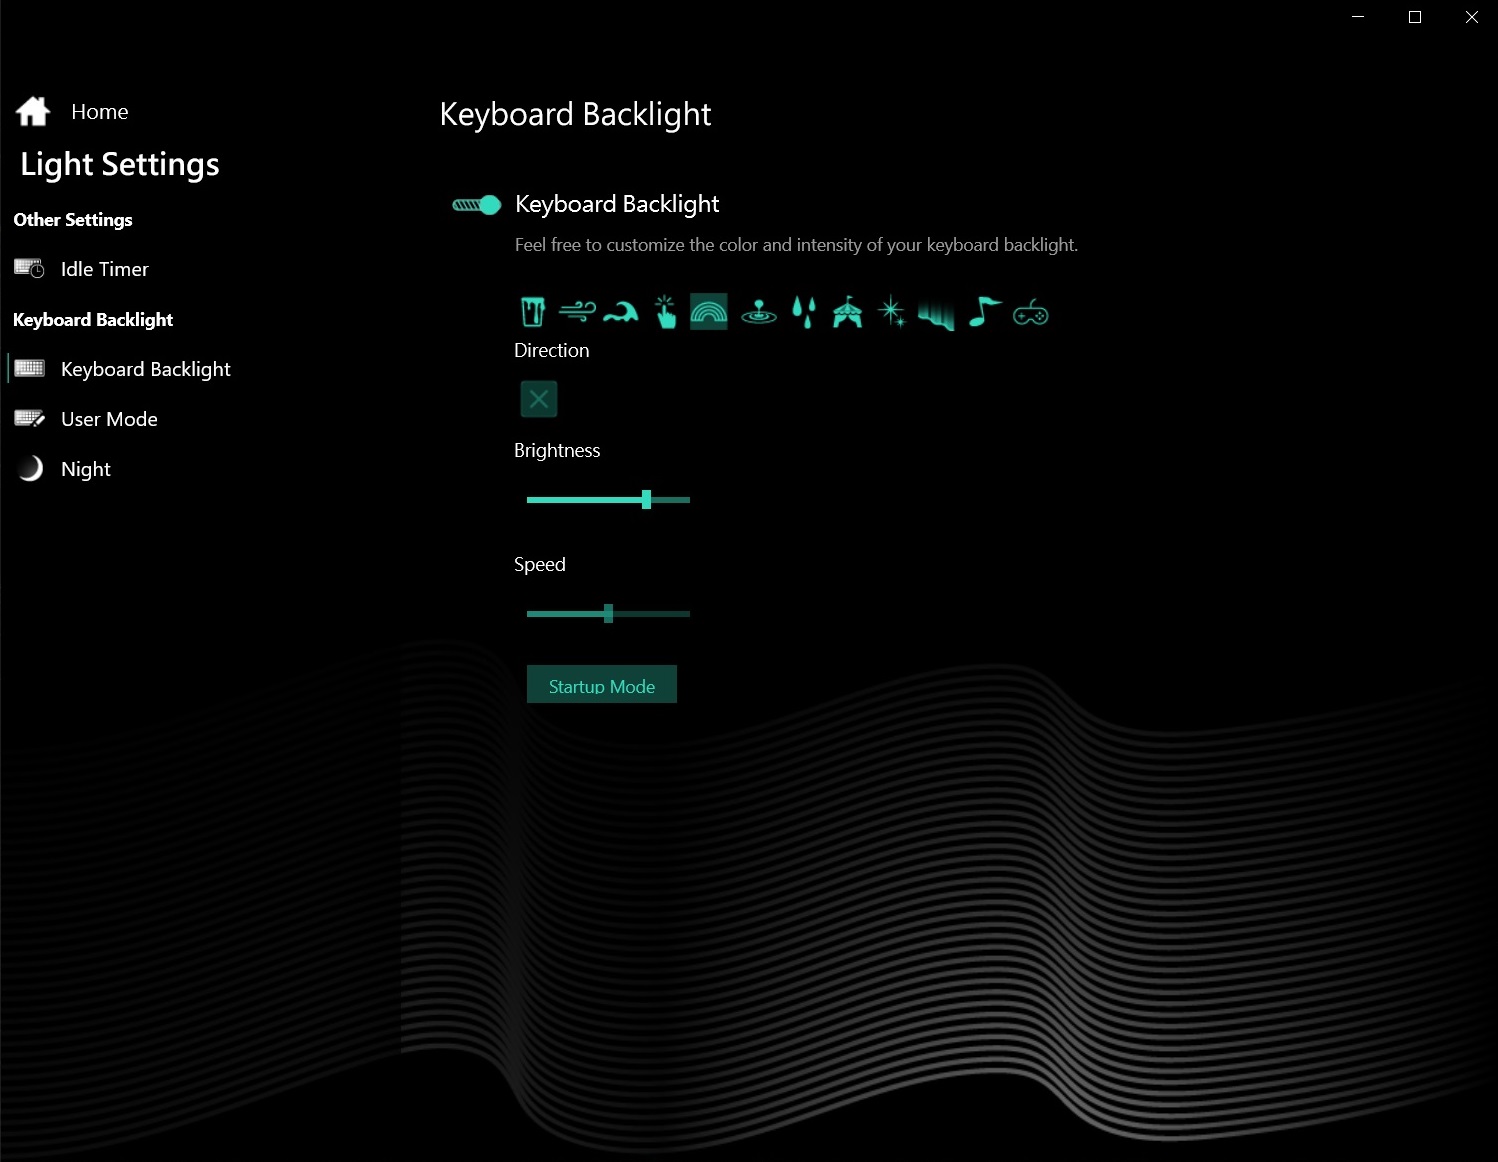
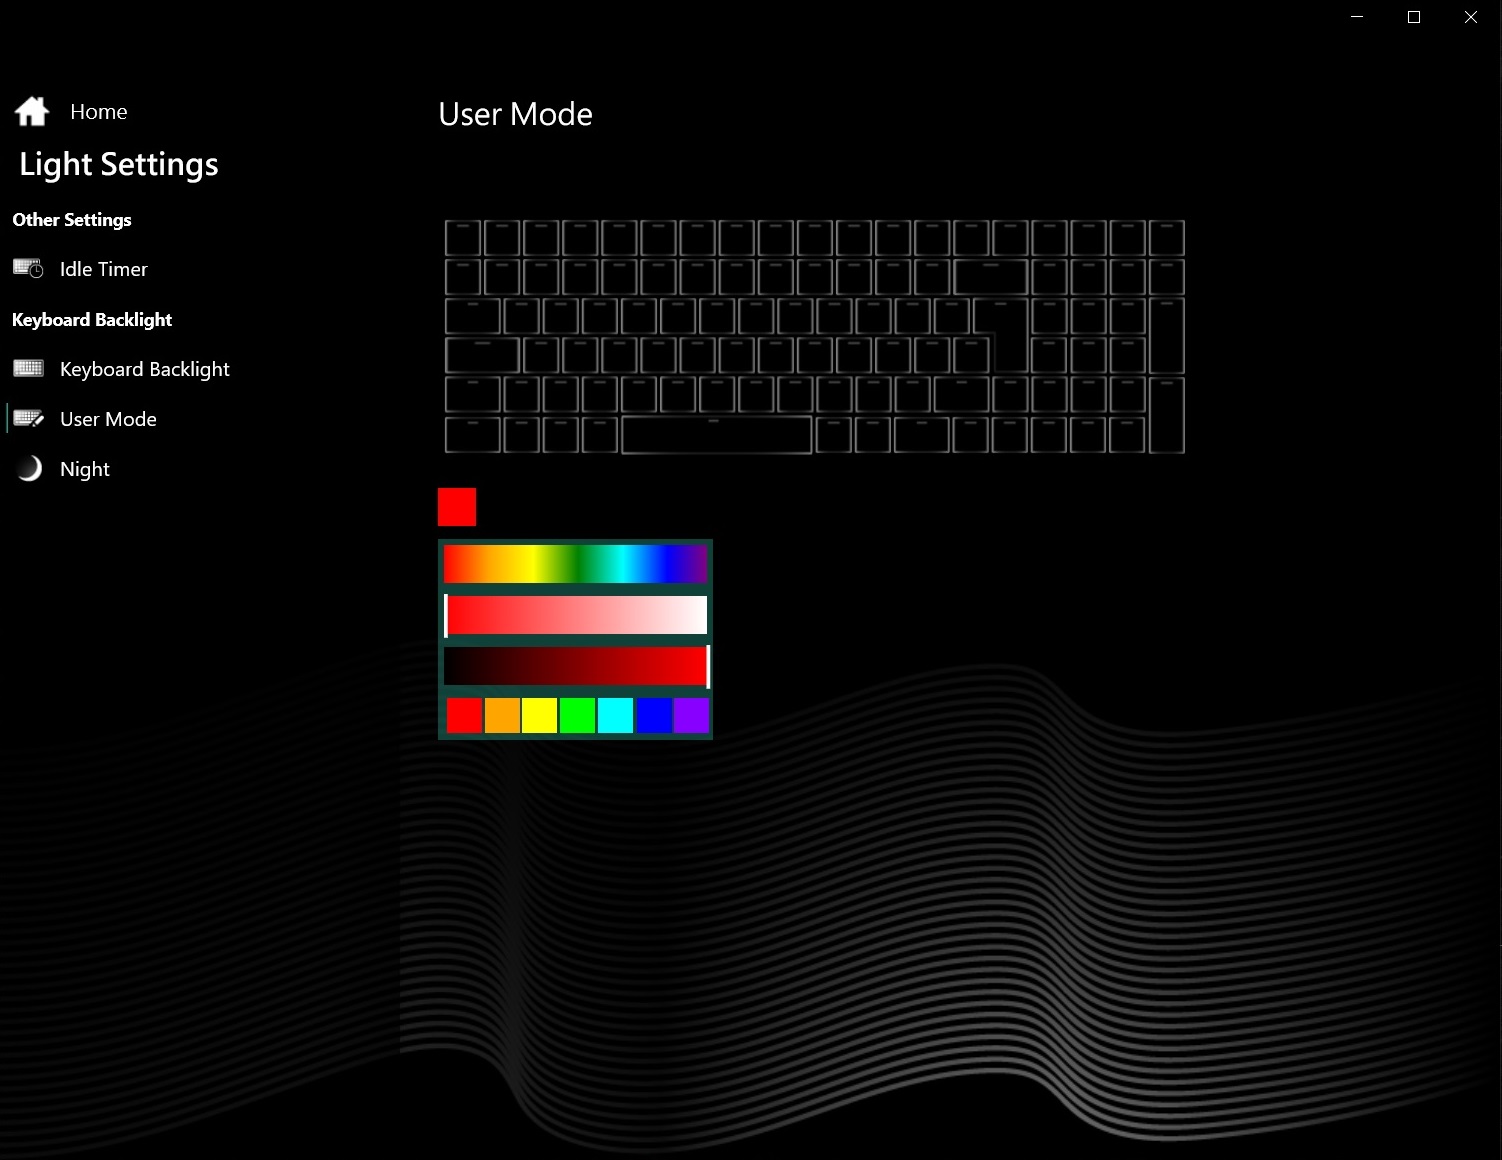
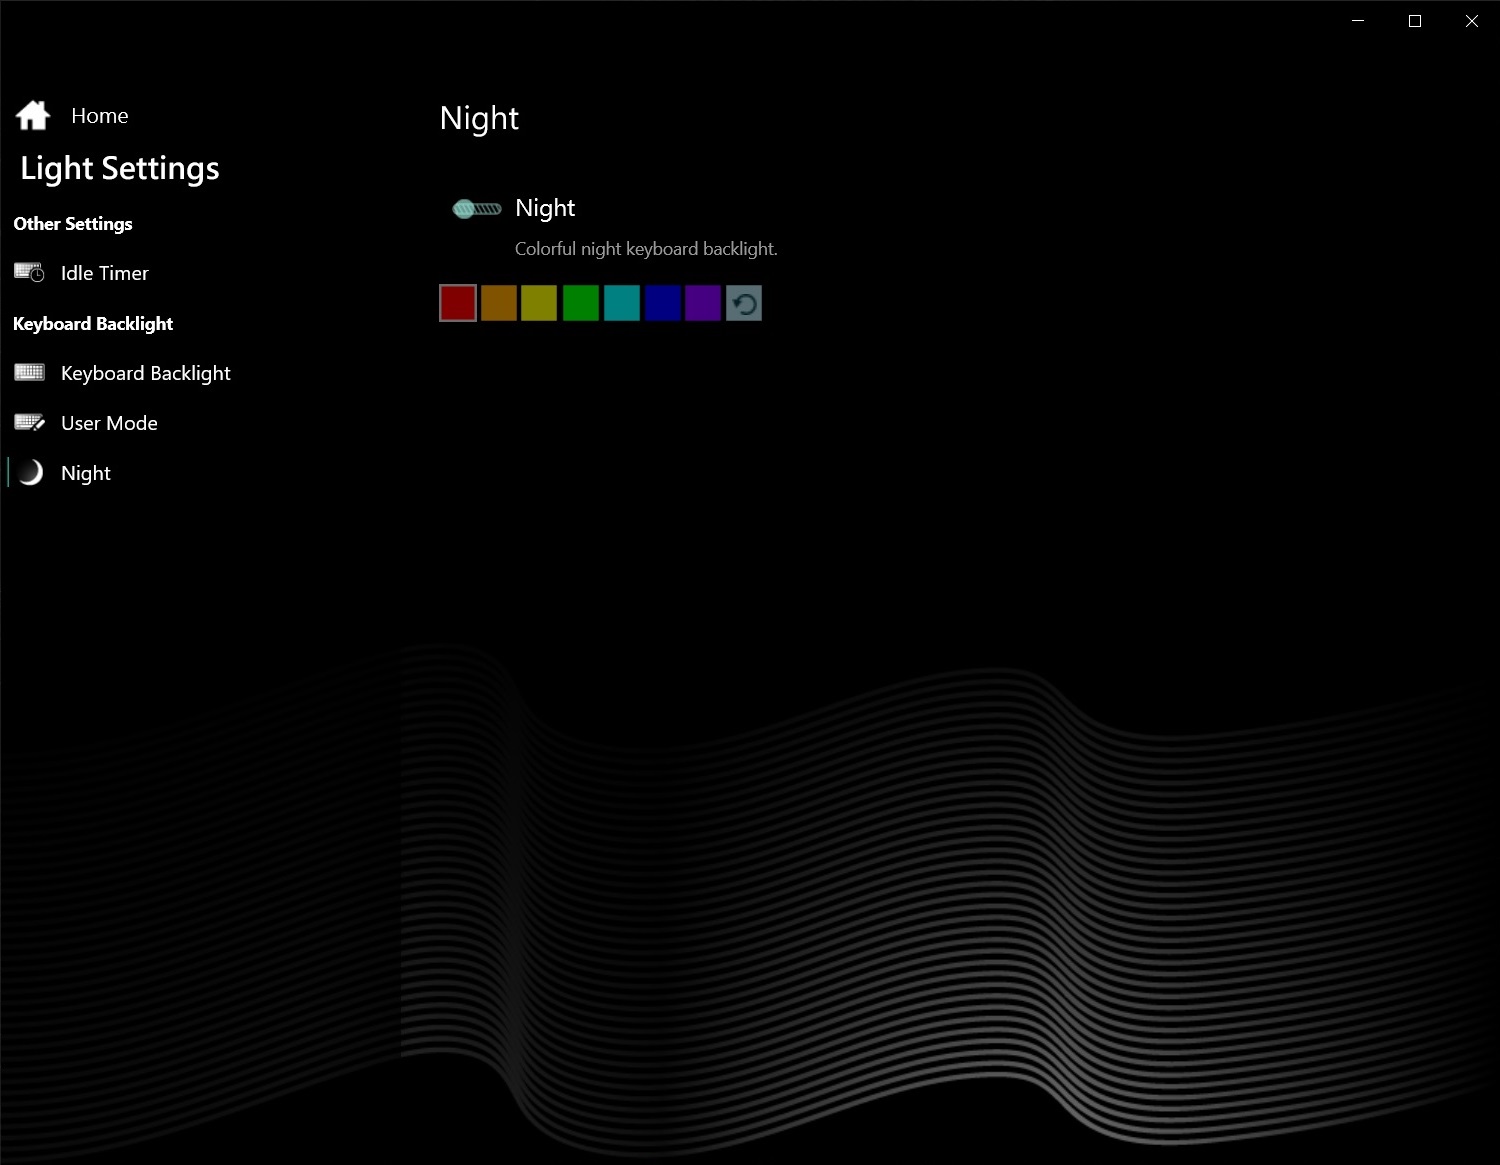
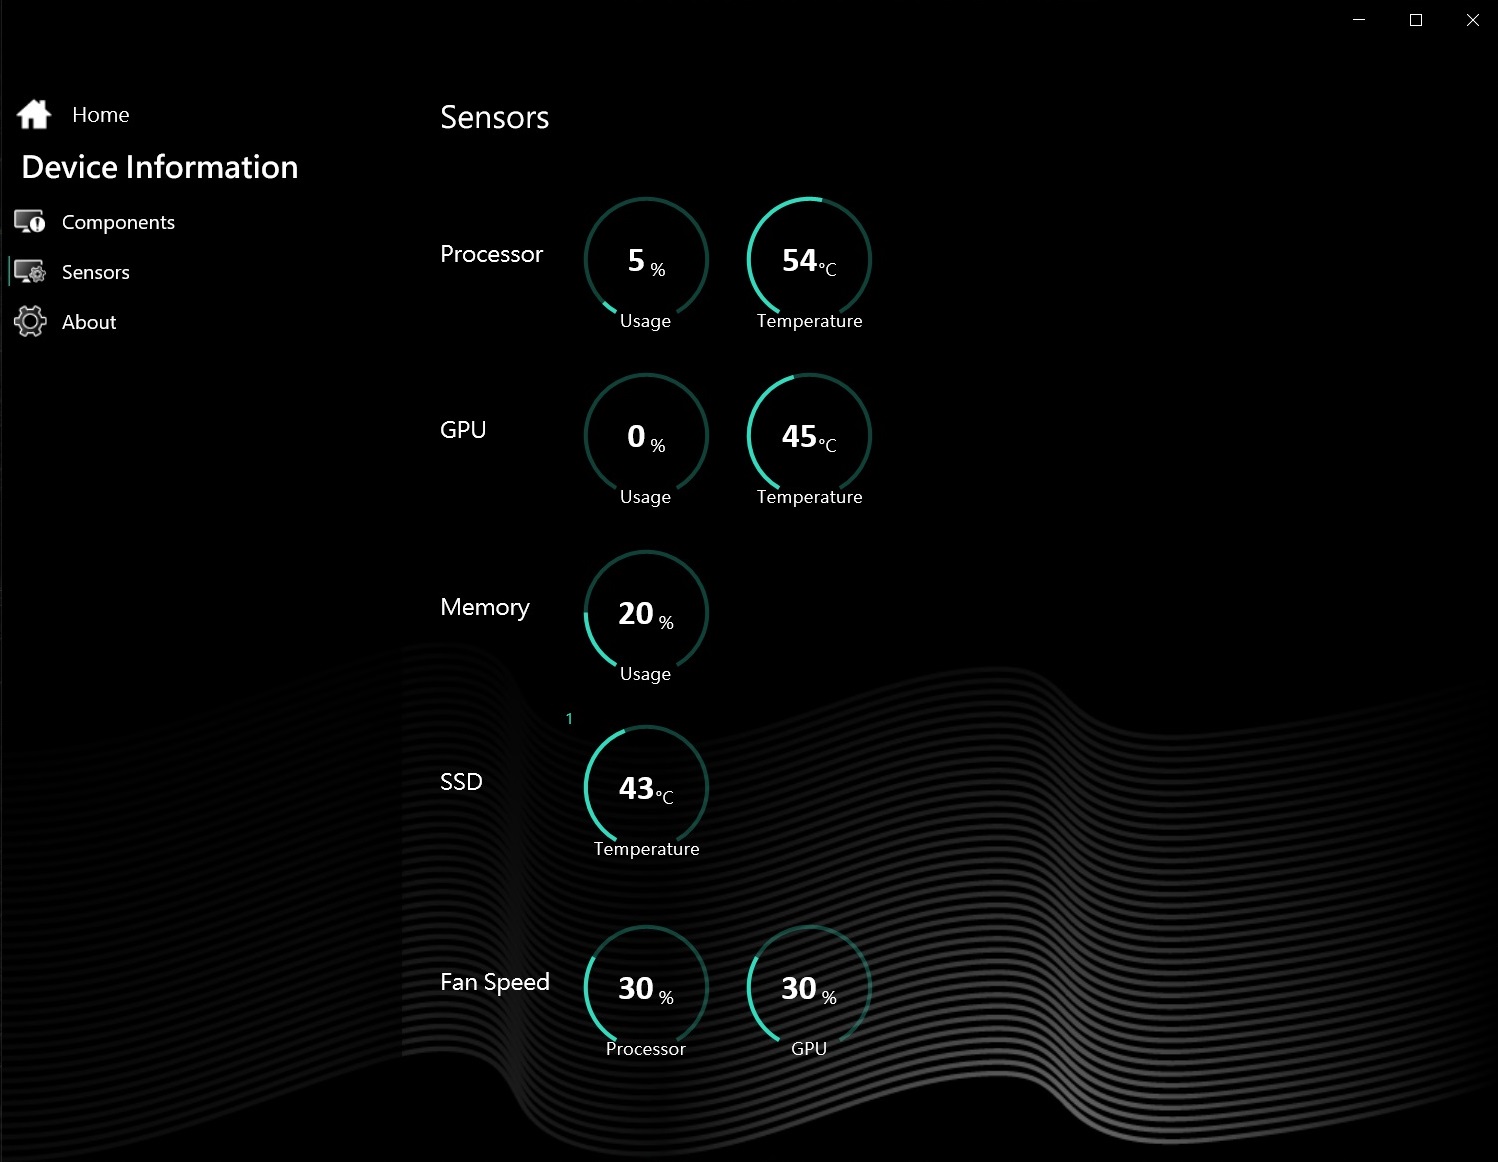
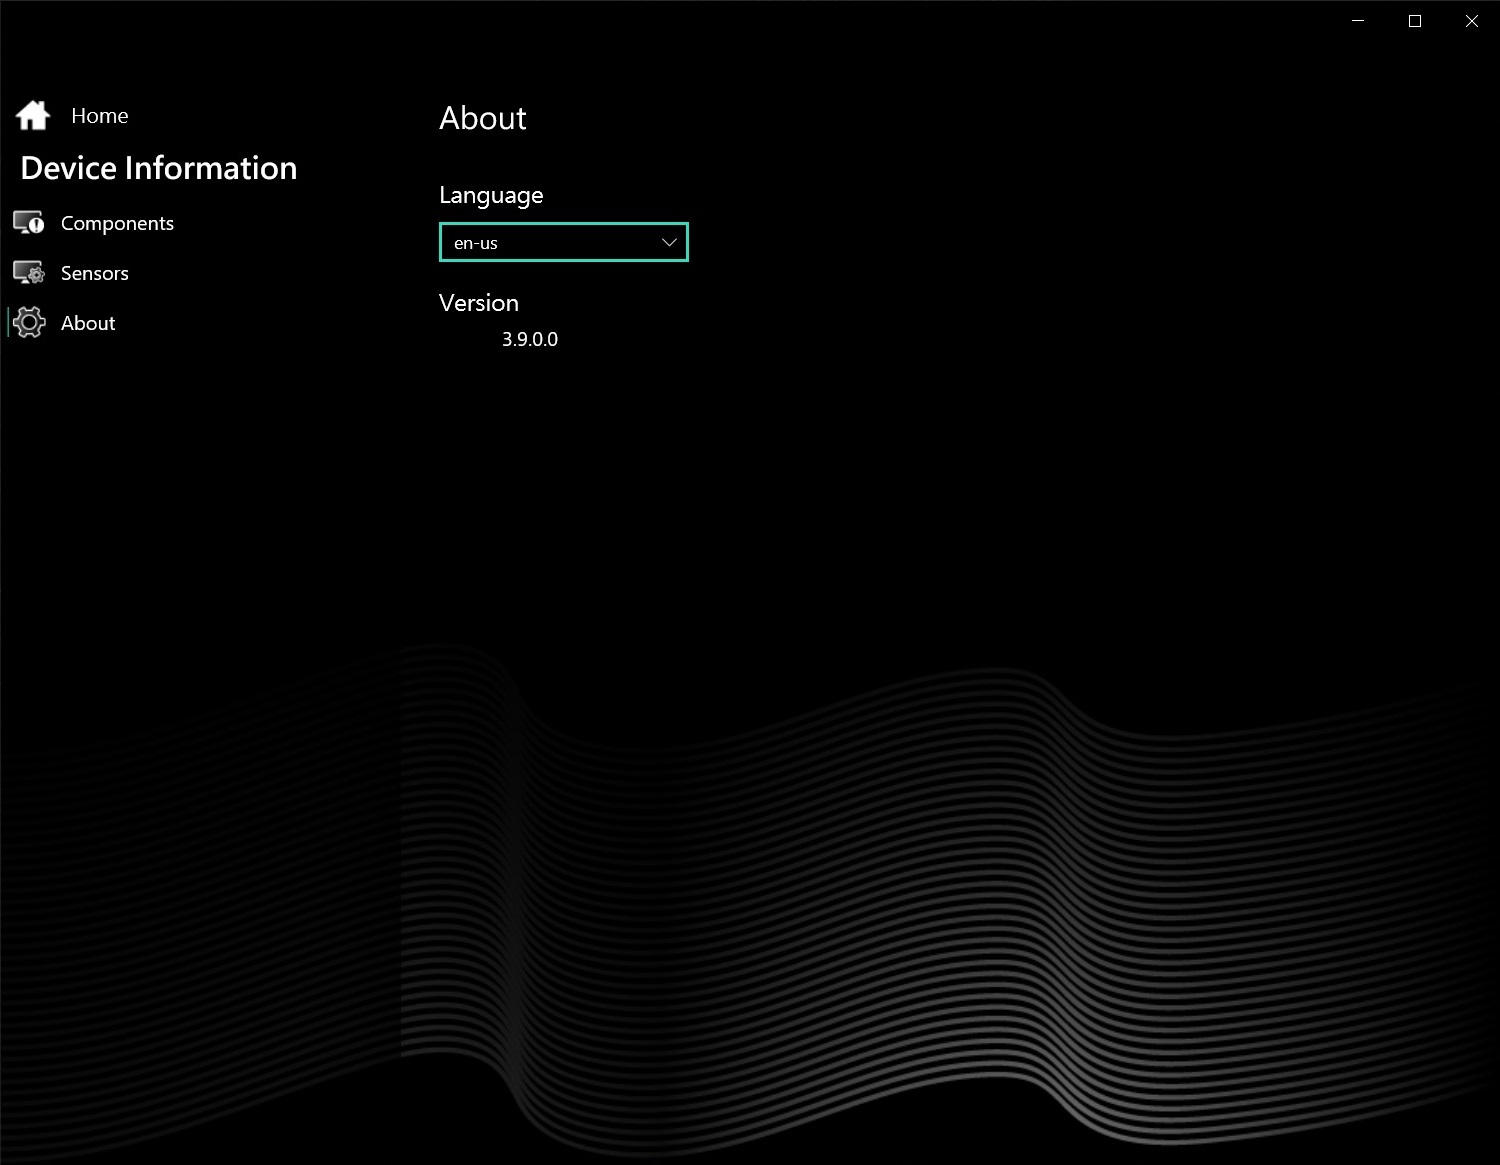
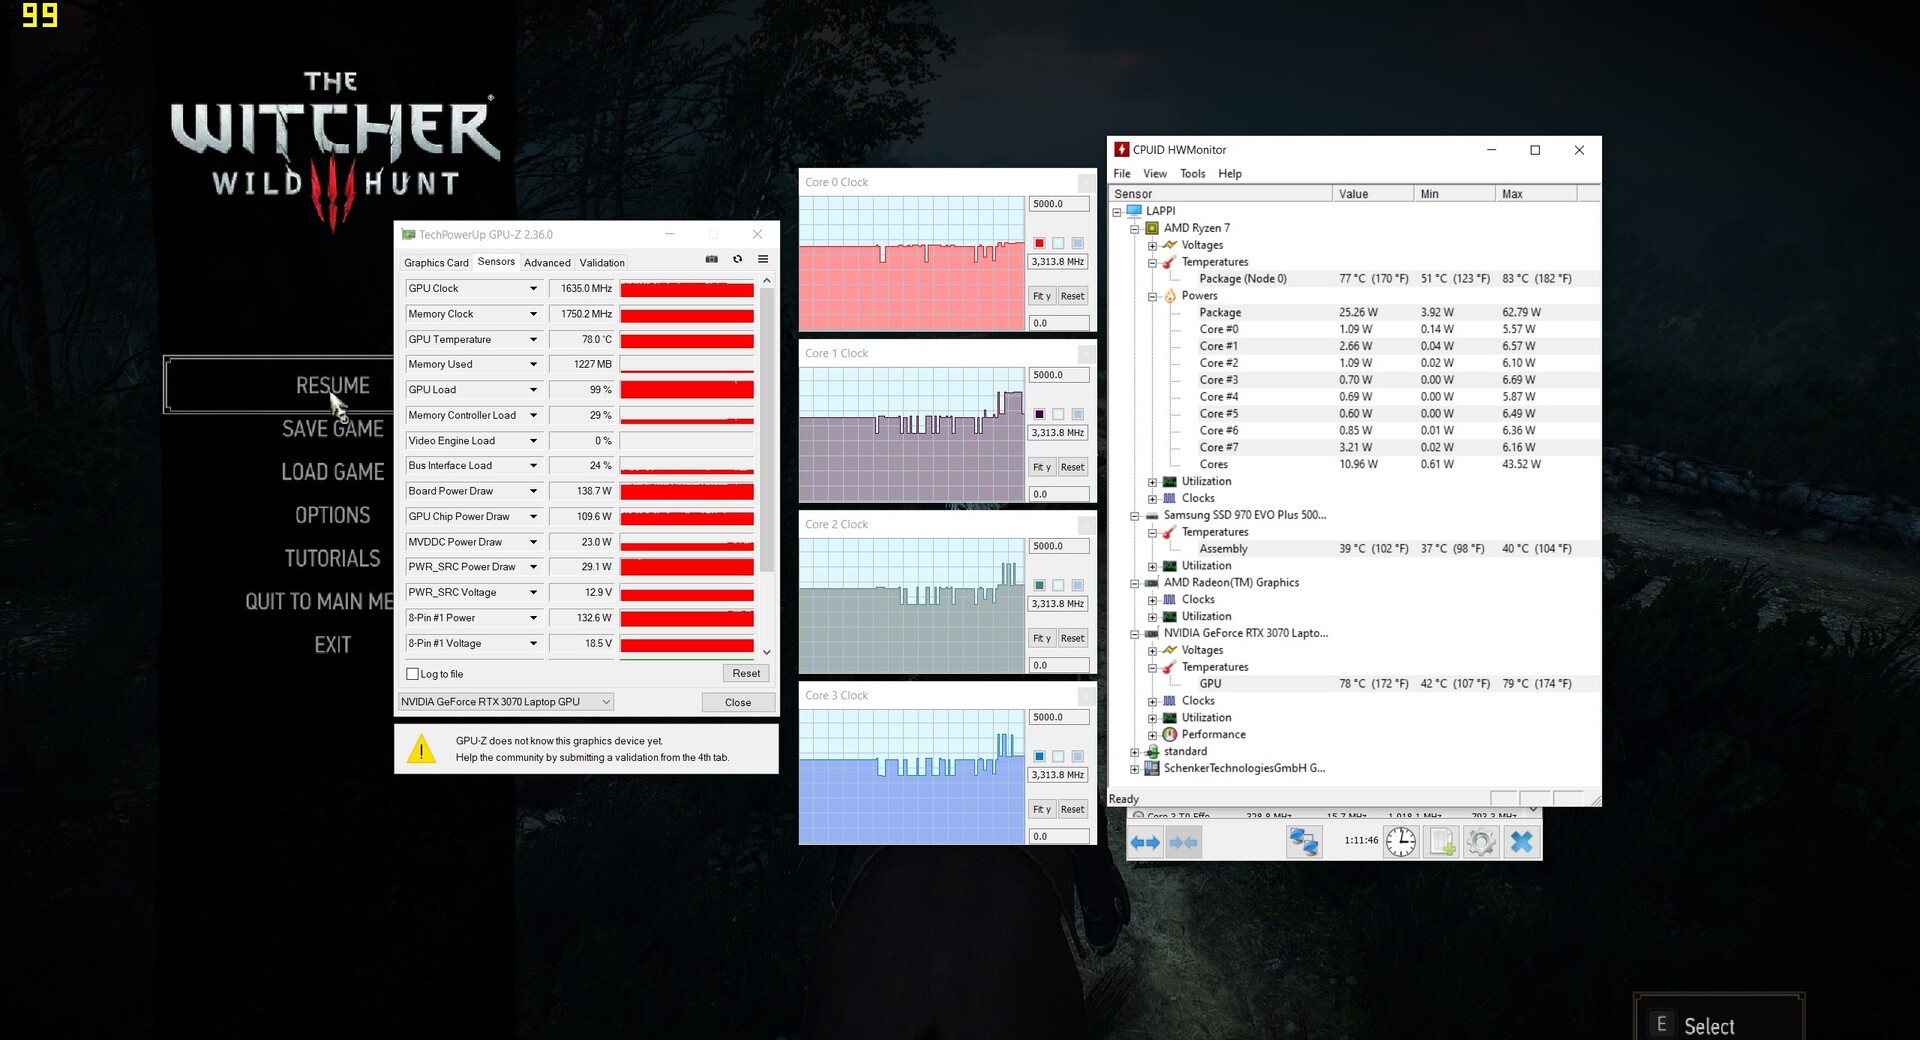
The Tongfang barebone used (GM7ZG7S) comes with a powerful tuning software. Within the preinstalled Control Center, buyers have the possibility to adjust a lot of system settings. Especially the performance tab should be mentioned here, since it offers several performance modes and fan settings as well as extremely detailed wattage and temperature options on top of that (see screenshots). While the Enthusiast mode was used for the idle tests (GPU at a 120-watt TDP), the Overboost mode was used for the 3D measurements, where the RTX 3070 laptop GPU is allowed to consume 140 watts (including Dynamic Boost).
Performance
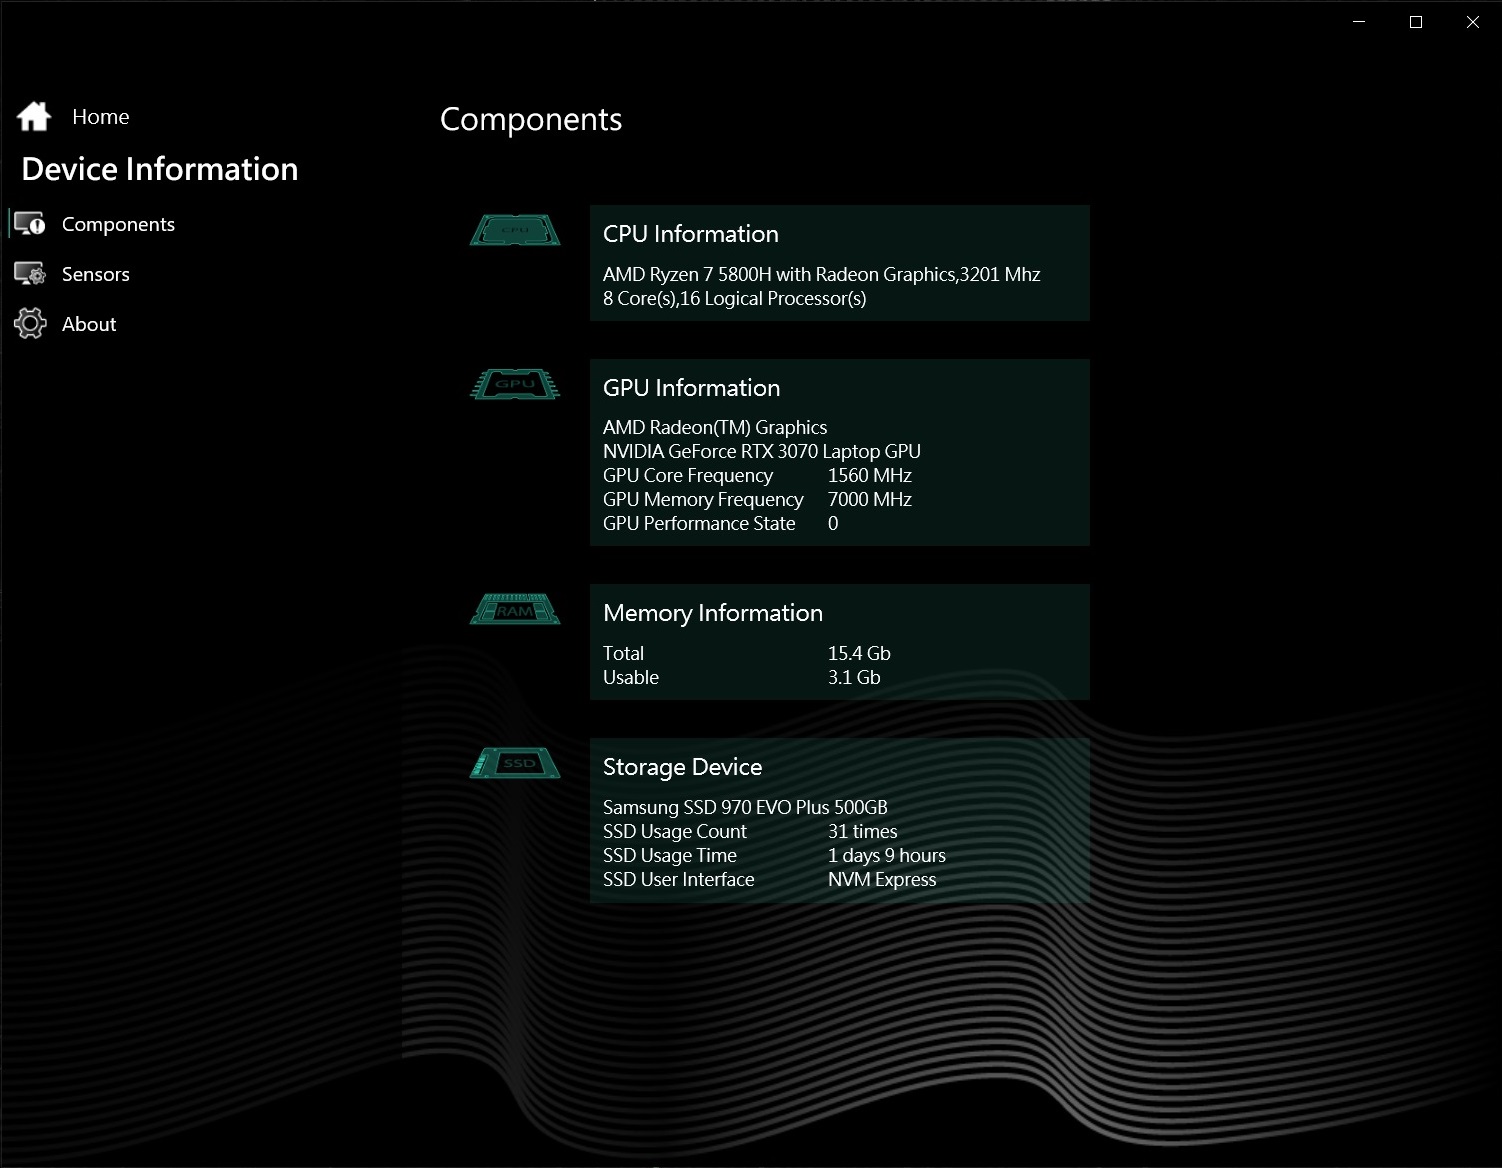
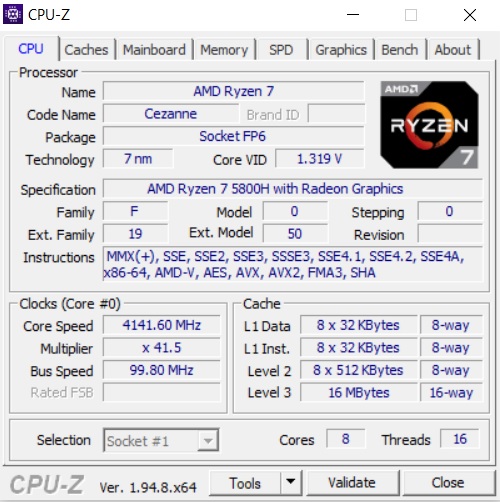
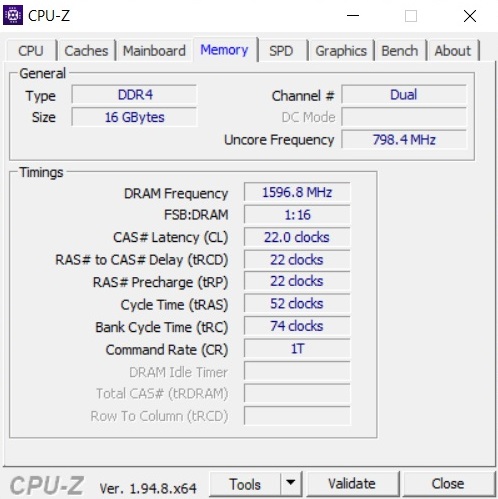
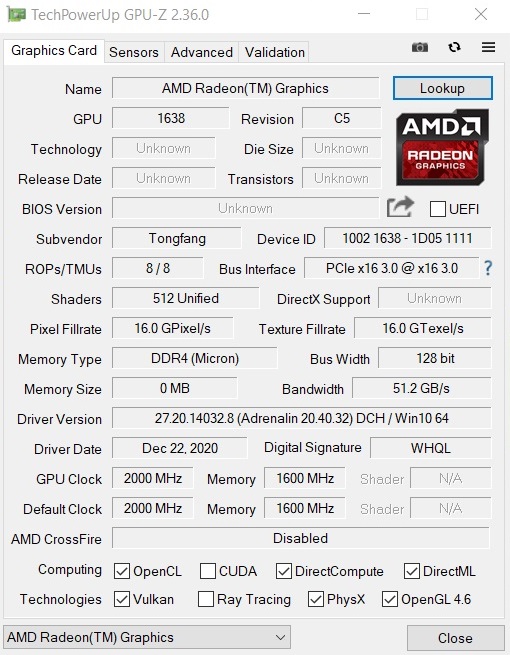
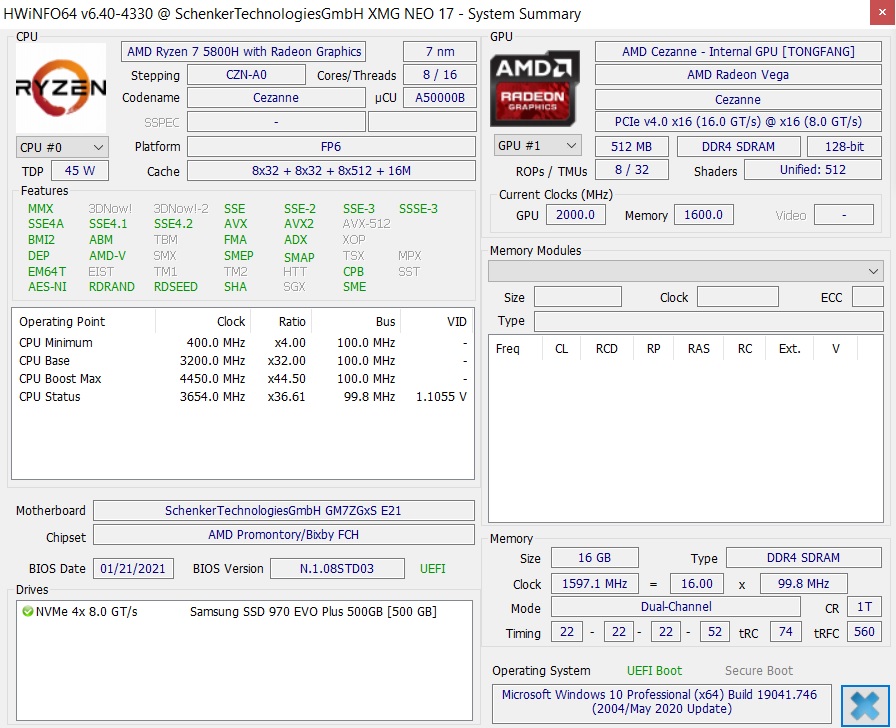
With the appropriate equipment (at least 16 GB of RAM, a large SSD), the XMG Neo 17 offers enough power and reserves for the upcoming years. You can see the hardware details of the test configuration in the screenshots below.


Processor
After Intel has been rather slow in terms of technology, AMD has meanwhile taken over the CPU performance crown again. With the Ryzen 5 5800H, gamers as well as other users get an enormous speed that gives Intel's competition a run for its money.
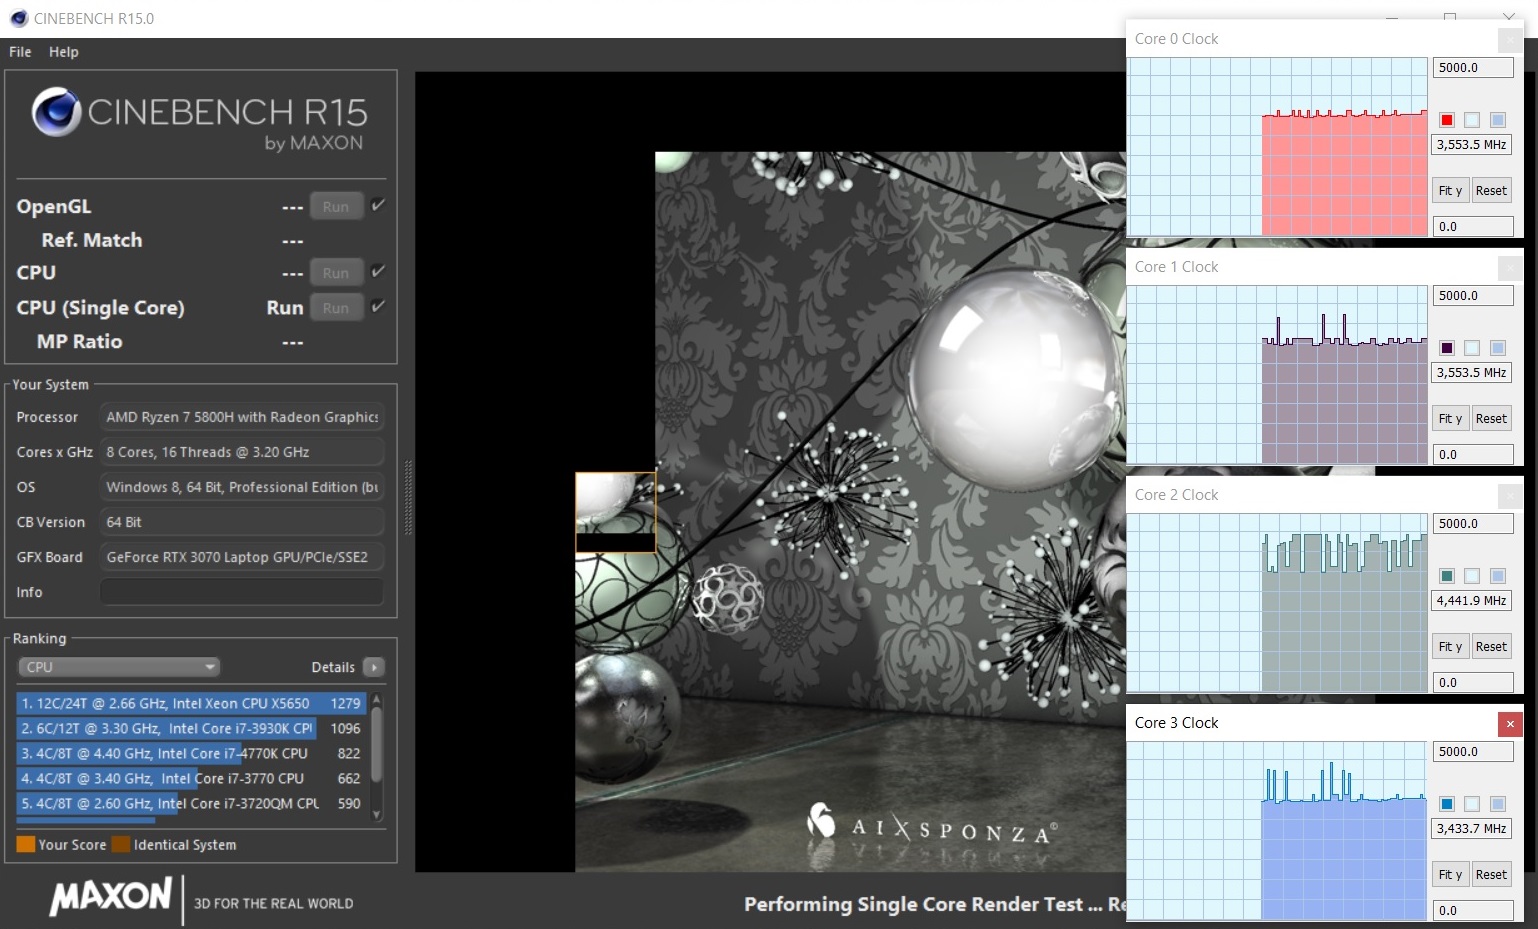
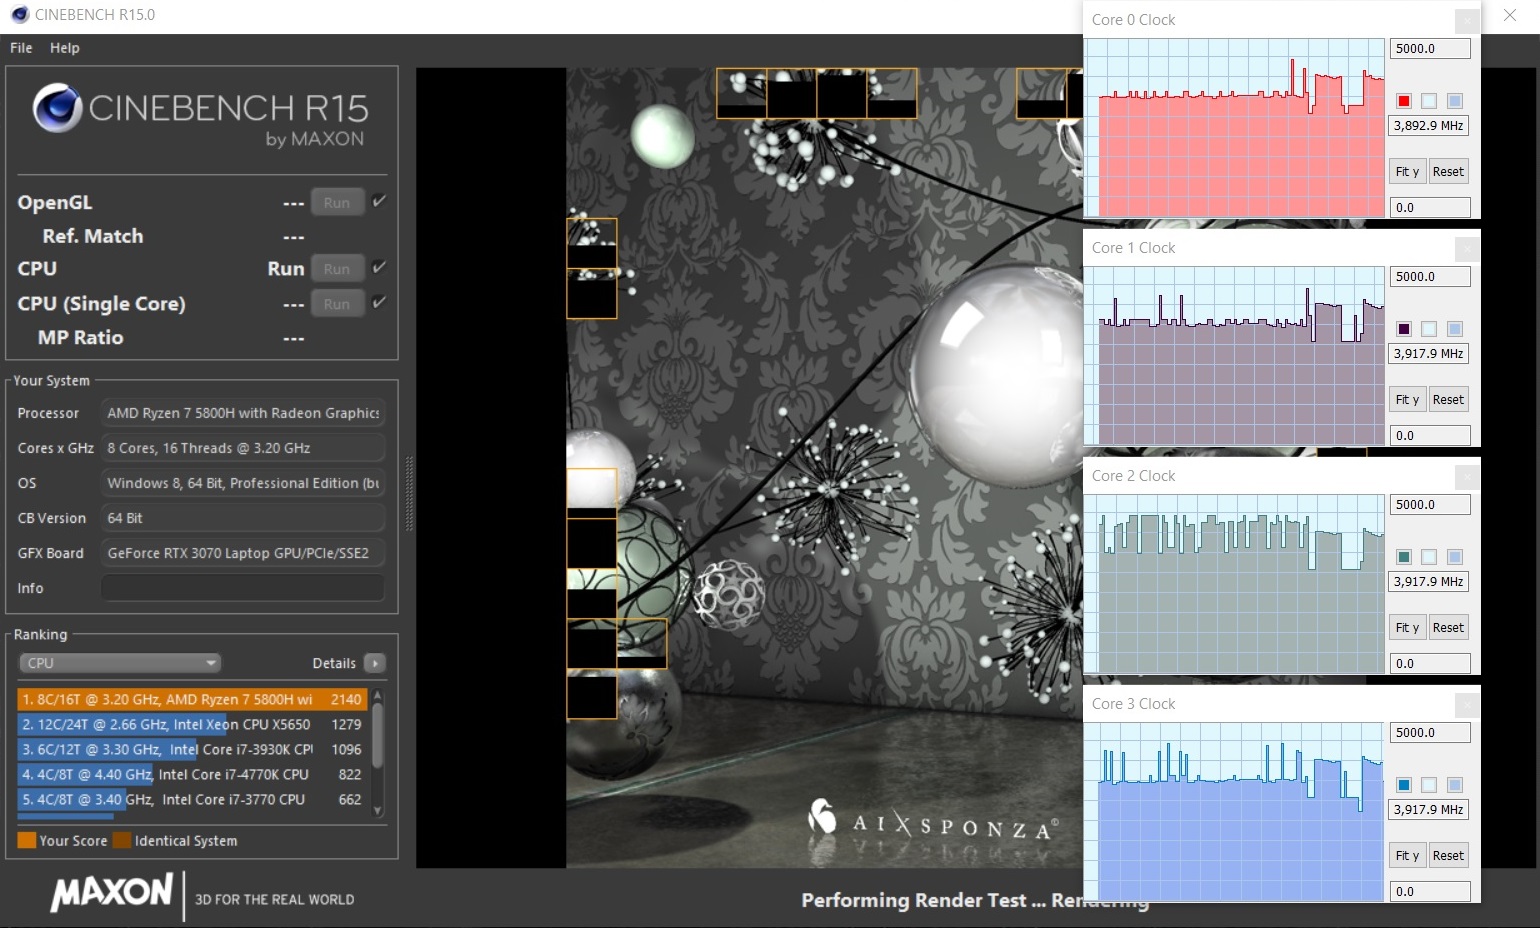
The octa-core chip, which has 16 MB of L3 cache and can process up to 16 threads in parallel via SMT, easily sprints past the comparison devices based on Intel processors in the Cinebench tests - regardless of whether a Core i7-10870H or a Core i9-10980HK is installed.
In addition, according to our Cinebench loop, performance hardly drops during prolonged load, which speaks for the cooling. After the first run, the 7 nm CPU reaches up to 4.4 GHz in single-core scenarios, whereas the clock speeds settle at around 3.9 GHz when all cores are loaded - a good value.
* ... smaller is better
System performance
As expected, the Neo 17 places itself at the top of the comparison field in PCMark 10. With 6,983 points, the lead ranges between 6% and 33%, whereby the everyday Windows experience feels very similar on all devices.
| PCMark 10 Score | 6983 points | |
Help | ||
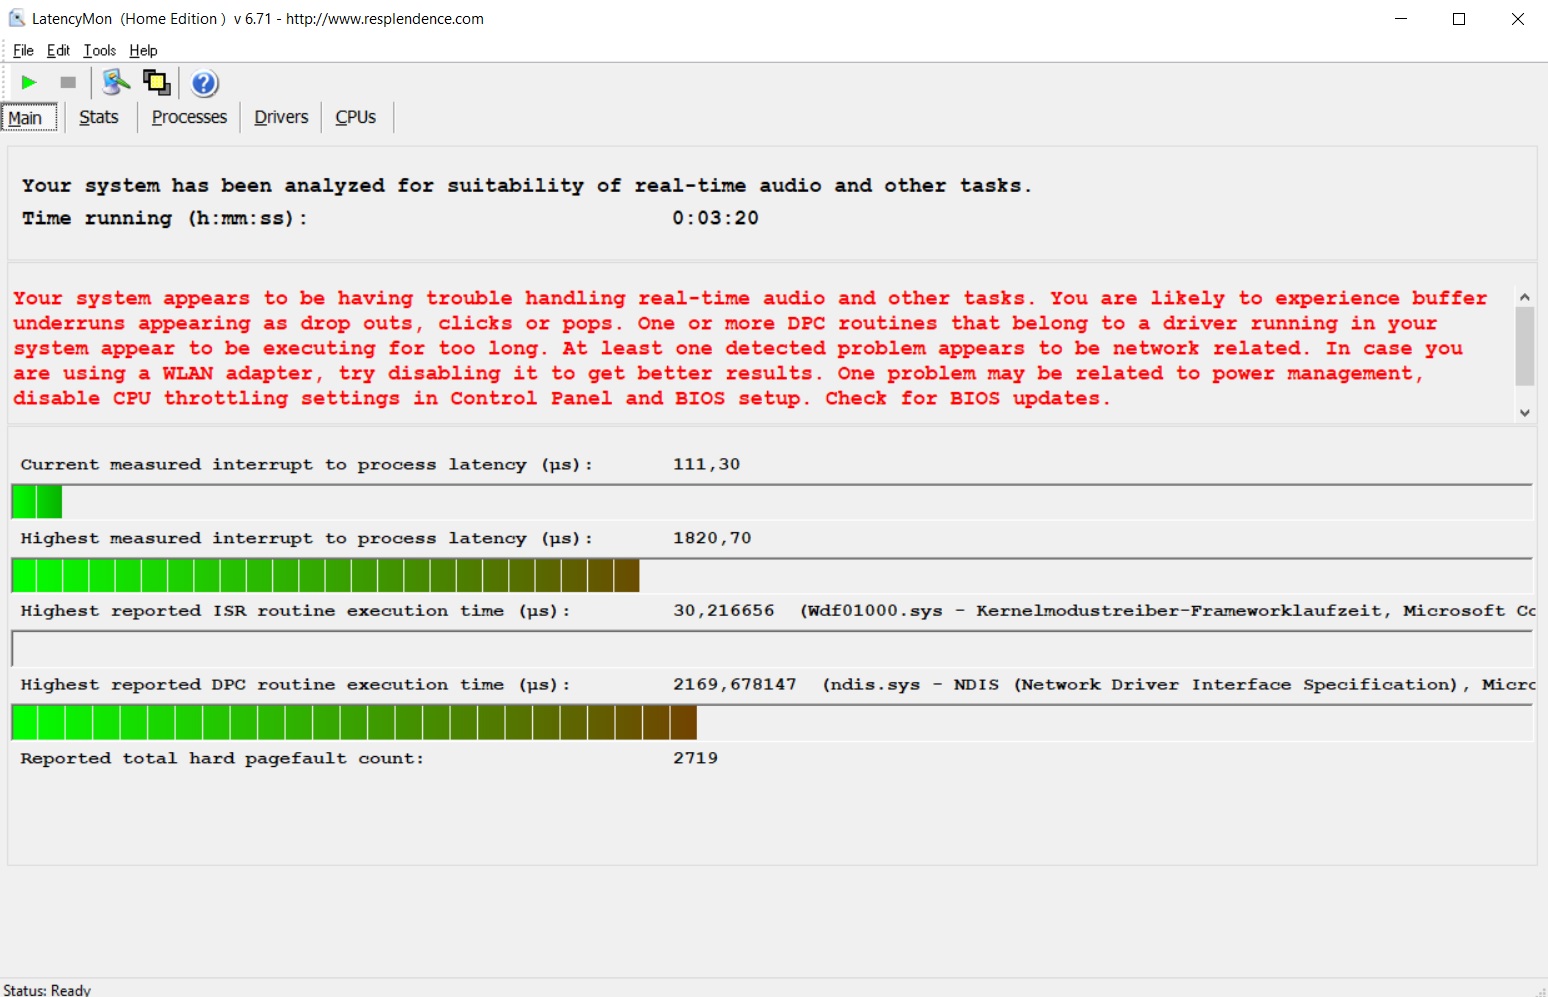
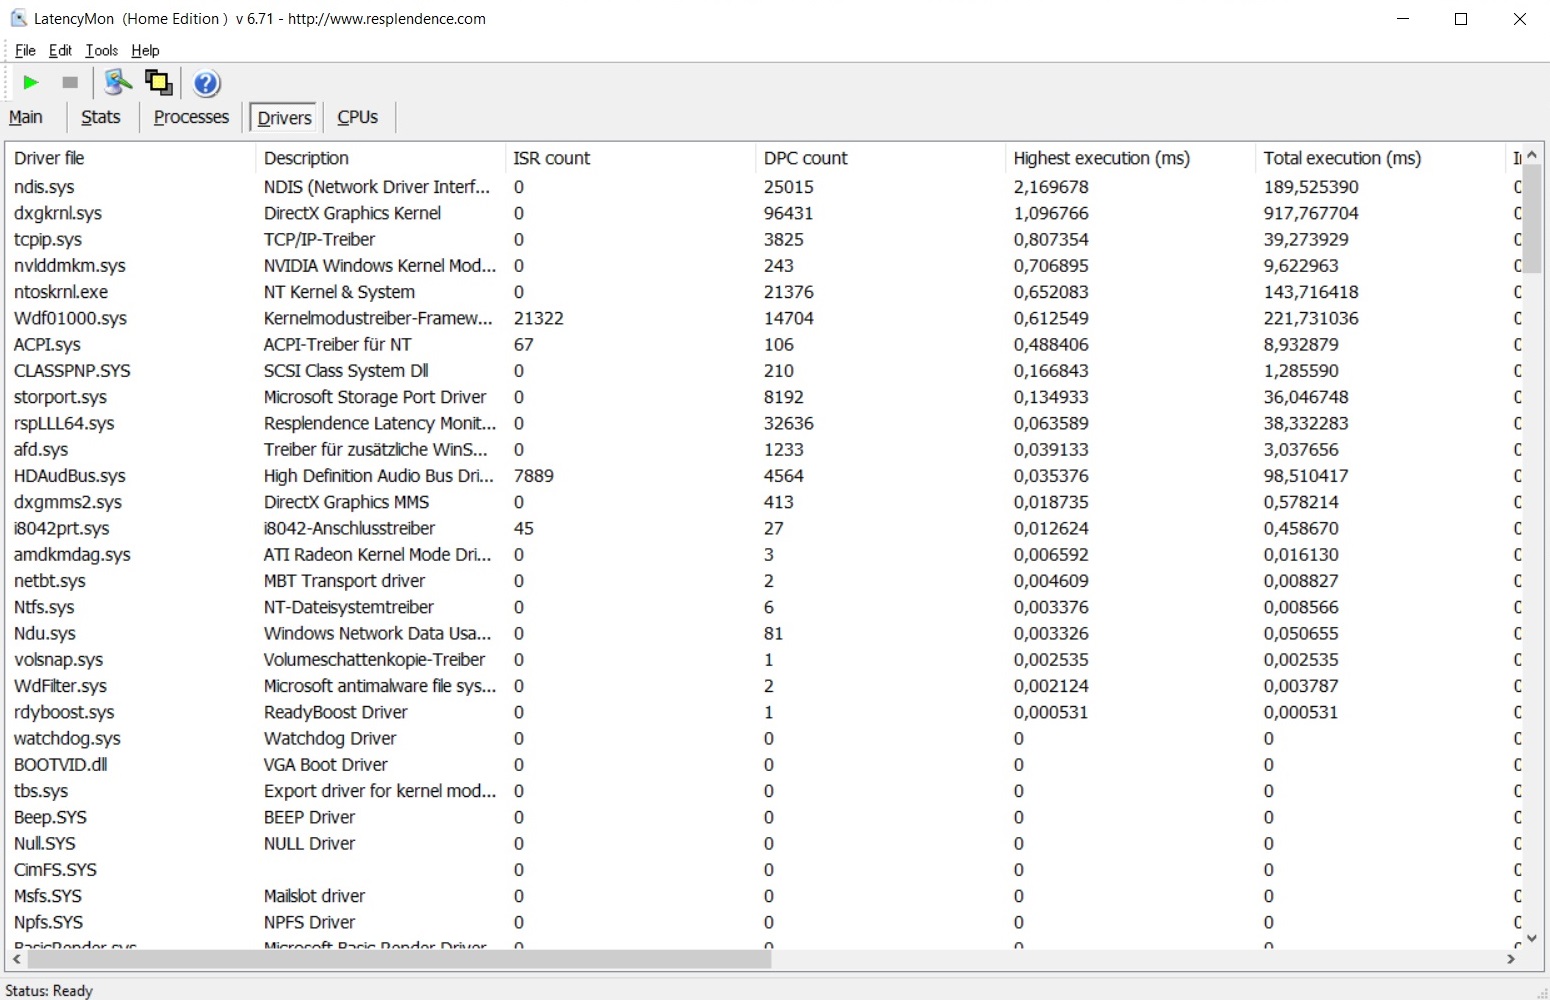
DPC latencies
In the latency test, the 17-incher makes itself comfortable among the competition. Although the Gigabyte Aero 17 HDR YC and the Aorus 17G XB score much worse in the LatencyMon tool, the Neo 17's rates aren't exactly good either.
| DPC Latencies / LatencyMon - interrupt to process latency (max), Web, Youtube, Prime95 | |
| Aorus 17G XB | |
| Gigabyte Aero 17 HDR YC | |
| SCHENKER XMG Neo 17 (Early 2021, RTX 3070, 5800H) | |
| MSI Creator 17 A10SGS | |
| Asus Zephyrus S17 GX701LXS | |
* ... smaller is better
Storage
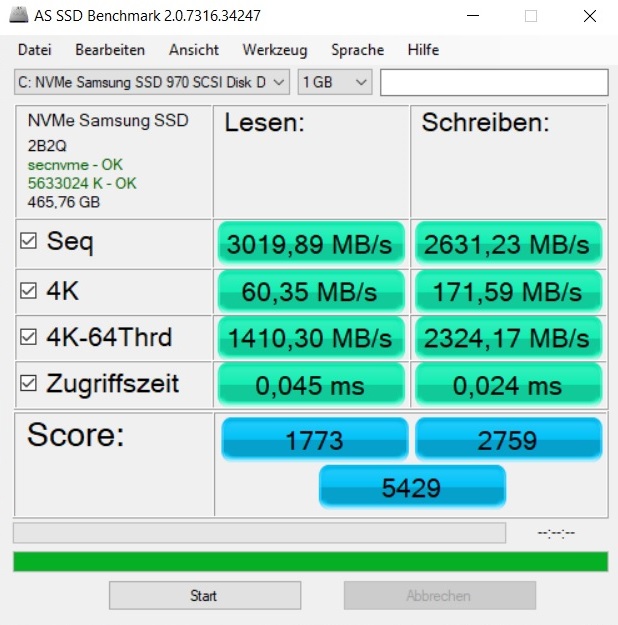
Schenker uses the 500 GB version of the well-known Samsung 970 Evo Plus SSD in our test device. The M.2-based NVMe drive performs very well with both small and large files and can hold its own excellently against the SSDs of the competing laptops, most of which also rely on Samsung drives. A second M.2 slot is still available for mass storage upgrades.
| SCHENKER XMG Neo 17 (Early 2021, RTX 3070, 5800H) Samsung SSD 970 EVO Plus 500GB | Gigabyte Aero 17 HDR YC ESR01TBTLCG-EAC-4 | Asus Zephyrus S17 GX701LXS Samsung PM981a MZVLB1T0HBLR | MSI Creator 17 A10SGS Samsung SSD PM981 MZVLB2T0HMLB | Aorus 17G XB Samsung SSD PM981a MZVLB512HBJQ | |
|---|---|---|---|---|---|
| CrystalDiskMark 5.2 / 6 | -12% | -23% | -21% | -15% | |
| Write 4K | 206.1 | 141.2 -31% | 120 -42% | 158.7 -23% | 123.4 -40% |
| Read 4K | 53 | 46.48 -12% | 45.24 -15% | 41.59 -22% | 45.02 -15% |
| Write Seq | 3018 | 2433 -19% | 2090 -31% | 2388 -21% | 2526 -16% |
| Read Seq | 2575 | 1742 -32% | 2246 -13% | 1623 -37% | 2062 -20% |
| Write 4K Q32T1 | 535 | 565 6% | 392.5 -27% | 432.6 -19% | 497.9 -7% |
| Read 4K Q32T1 | 608 | 655 8% | 348.4 -43% | 526 -13% | 579 -5% |
| Write Seq Q32T1 | 3242 | 3028 -7% | 3015 -7% | 2438 -25% | 2982 -8% |
| Read Seq Q32T1 | 3617 | 3424 -5% | 3445 -5% | 3457 -4% | 3440 -5% |
| AS SSD | -10% | -27% | -12% | -21% | |
| Seq Read | 3020 | 2674 -11% | 2744 -9% | 2815 -7% | 1791 -41% |
| Seq Write | 2631 | 2458 -7% | 1351 -49% | 2278 -13% | 2193 -17% |
| 4K Read | 60.3 | 52.1 -14% | 47.24 -22% | 49.59 -18% | 50.7 -16% |
| 4K Write | 171.6 | 113.4 -34% | 109.1 -36% | 139.1 -19% | 116.8 -32% |
| 4K-64 Read | 1410 | 1881 33% | 1118 -21% | 1603 14% | 1525 8% |
| 4K-64 Write | 2324 | 2849 23% | 1926 -17% | 1711 -26% | 1958 -16% |
| Access Time Read * | 0.045 | 0.102 -127% | 0.064 -42% | 0.059 -31% | 0.07 -56% |
| Access Time Write * | 0.024 | 0.033 -38% | 0.034 -42% | 0.027 -13% | 0.032 -33% |
| Score Read | 1773 | 2201 24% | 1439 -19% | 1934 9% | 1755 -1% |
| Score Write | 2759 | 3208 16% | 2170 -21% | 2078 -25% | 2294 -17% |
| Score Total | 5429 | 6524 20% | 4283 -21% | 4977 -8% | 4972 -8% |
| Total Average (Program / Settings) | -11% /
-11% | -25% /
-25% | -17% /
-16% | -18% /
-18% |
* ... smaller is better

Graphics card
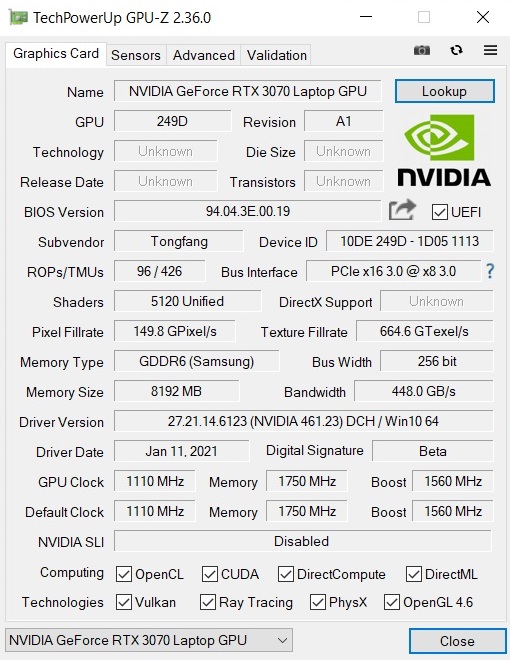
With the GeForce RTX 3070, Nvidia replaces the very successful RTX 2070. Compared with the predecessor, the new Ampere model, which is manufactured in an 8 nm process, offers 5,120 instead of 2,304 shaders, which is a big leap. In the case of the Neo 17, the clock rates amount to 1,100 MHz for the core (base value) and 1,750 MHz for the GDDR6 memory, which, analogous to the RTX 2070, is again comprised of 8 GB (256-bit interface). 8 GB is already pushing the limits in some games (at least at higher resolutions and details) - we would have wished for 10 GB or more from Nvidia here.
| 3DMark Cloud Gate Standard Score | 59795 points | |
| 3DMark Fire Strike Score | 24265 points | |
| 3DMark Time Spy Score | 10679 points | |
Help | ||
Performance is definitely impressive when using the Overboost mode. For example, the RTX 2080 Super Max-Q, which runs in most of the comparison laptops, is outperformed by 18% to 48% in the benchmark course. Thanks to the high TDP number, the RTX 3070 in the Neo 17 can even outperform the RTX 3080 in the Gigabyte Aero 17 HDR YC by about 10%, since the latter's GPU only has a maximum TDP of 105 Watts.
In line with the processor, the graphics card's long-term performance also remains quite constant. In the 60-minute test with the role-playing game The Witcher 3 (Full HD/Ultra), there were no abnormalities in this regard.
Gaming performance
2560x1440 pixels is ideal for the RTX 3070's performance level. Almost all modern games can be played smoothly at maximum details in the native resolution. Only in extremely demanding games like Anno 1800, Crysis Remastered, Watch Dogs Legion, and Cyberpunk 2077 does the average frame rate drop below the 60 FPS mark. There are also enough reserves for ray tracing here and there. The ray tracing benchmarks can be found in the RTX 3070's performance article and on the GPU site.
| The Witcher 3 | |
| 1920x1080 Ultra Graphics & Postprocessing (HBAO+) | |
| Average of class Gaming (8.61 - 216, n=225, last 2 years) | |
| SCHENKER XMG Neo 17 (Early 2021, RTX 3070, 5800H) | |
| Gigabyte Aero 17 HDR YC | |
| Asus Zephyrus S17 GX701LXS | |
| MSI Creator 17 A10SGS | |
| Aorus 17G XB | |
| 3840x2160 High Graphics & Postprocessing (Nvidia HairWorks Off) | |
| Average of class Gaming (50.6 - 167.6, n=48, last 2 years) | |
| SCHENKER XMG Neo 17 (Early 2021, RTX 3070, 5800H) | |
| Gigabyte Aero 17 HDR YC | |
| MSI Creator 17 A10SGS | |
| low | med. | high | ultra | QHD | 4K | |
| GTA V (2015) | 179 | 172 | 163 | 97 | ||
| The Witcher 3 (2015) | 187 | 101 | 71.9 | |||
| Dota 2 Reborn (2015) | 147 | 138 | 131 | 128 | ||
| X-Plane 11.11 (2018) | 110 | 97.1 | 75.8 | |||
| Battlefield V (2018) | 162 | 152 | 124 | 76.6 | ||
| Apex Legends (2019) | 144 | 144 | 142 | 82.3 | ||
| Far Cry New Dawn (2019) | 112 | 101 | 91 | 61 | ||
| Metro Exodus (2019) | 97.4 | 77.2 | 61.6 | 39.2 | ||
| The Division 2 (2019) | 131 | 101 | 70 | 40 | ||
| Anno 1800 (2019) | 78.5 | 39.6 | 39.1 | 31.6 | ||
| Control (2019) | 97.4 | 64.1 | 32.6 | |||
| Borderlands 3 (2019) | 105 | 88.3 | 64.3 | 36 | ||
| Need for Speed Heat (2019) | 96.2 | 91.5 | 83.7 | 53.1 | ||
| Star Wars Jedi Fallen Order (2019) | 98.5 | 94.6 | 85.3 | 53 | ||
| Crysis Remastered (2020) | 86.7 | 61.4 | 50 | 30.9 | ||
| Star Wars Squadrons (2020) | 278 | 261 | 183 | 109 | ||
| FIFA 21 (2020) | 214 | 209 | 204 | 201 | ||
| Watch Dogs Legion (2020) | 81 | 66 | 55 | 33 | ||
| Assassin´s Creed Valhalla (2020) | 77 | 69 | 60 | 38 | ||
| Call of Duty Black Ops Cold War (2020) | 83 | 76.1 | 64.5 | 33.8 | ||
| Immortals Fenyx Rising (2020) | 101 | 85 | 74 | 49 | ||
| Cyberpunk 2077 1.0 (2020) | 82 | 70.3 | 45.6 | 22.1 |
Emissions
Noise emissions
The other side of the coin is an extremely high noise development. In Overboost mode, the Neo 17 reaches between 49 and 55 dB under load, and that can be very unpleasant without a headset. With these rates, the 17-incher is also significantly louder than the competition, which reaches a maximum of 49 dB. When you switch to the Enthusiast mode and operate the system in idle usage, the noise level drops to a moderate 29 to 32 dB (temporarily ramping up to 38 dB). Every now and then, the ventilation turns off completely, so that the laptop is silent.
Noise Level
| Idle |
| 29 / 32 / 38 dB(A) |
| Load |
| 49 / 55 dB(A) |
 | ||
30 dB silent 40 dB(A) audible 50 dB(A) loud |
||
min: | ||
| SCHENKER XMG Neo 17 (Early 2021, RTX 3070, 5800H) R7 5800H, GeForce RTX 3070 Laptop GPU | Gigabyte Aero 17 HDR YC i9-10980HK, GeForce RTX 3080 Laptop GPU | Asus Zephyrus S17 GX701LXS i7-10875H, GeForce RTX 2080 Super Max-Q | MSI Creator 17 A10SGS i7-10875H, GeForce RTX 2080 Super Max-Q | Aorus 17G XB i7-10875H, GeForce RTX 2070 Super Max-Q | Average of class Gaming | |
|---|---|---|---|---|---|---|
| Noise | 5% | 2% | -2% | -6% | 10% | |
| off / environment * | 24 | 26 -8% | 25 -4% | 30 -25% | 30 -25% | 24.1 ? -0% |
| Idle Minimum * | 29 | 30 -3% | 32 -10% | 32 -10% | 35 -21% | 25.6 ? 12% |
| Idle Average * | 32 | 32 -0% | 35 -9% | 33 -3% | 36 -13% | 27.4 ? 14% |
| Idle Maximum * | 38 | 36 5% | 43 -13% | 40 -5% | 41 -8% | 30.8 ? 19% |
| Load Average * | 49 | 45 8% | 44 10% | 47 4% | 47 4% | 43 ? 12% |
| Witcher 3 ultra * | 53 | 42 21% | 41 23% | 46 13% | 48 9% | |
| Load Maximum * | 55 | 49 11% | 45 18% | 48 13% | 49 11% | 53.4 ? 3% |
* ... smaller is better
Temperature
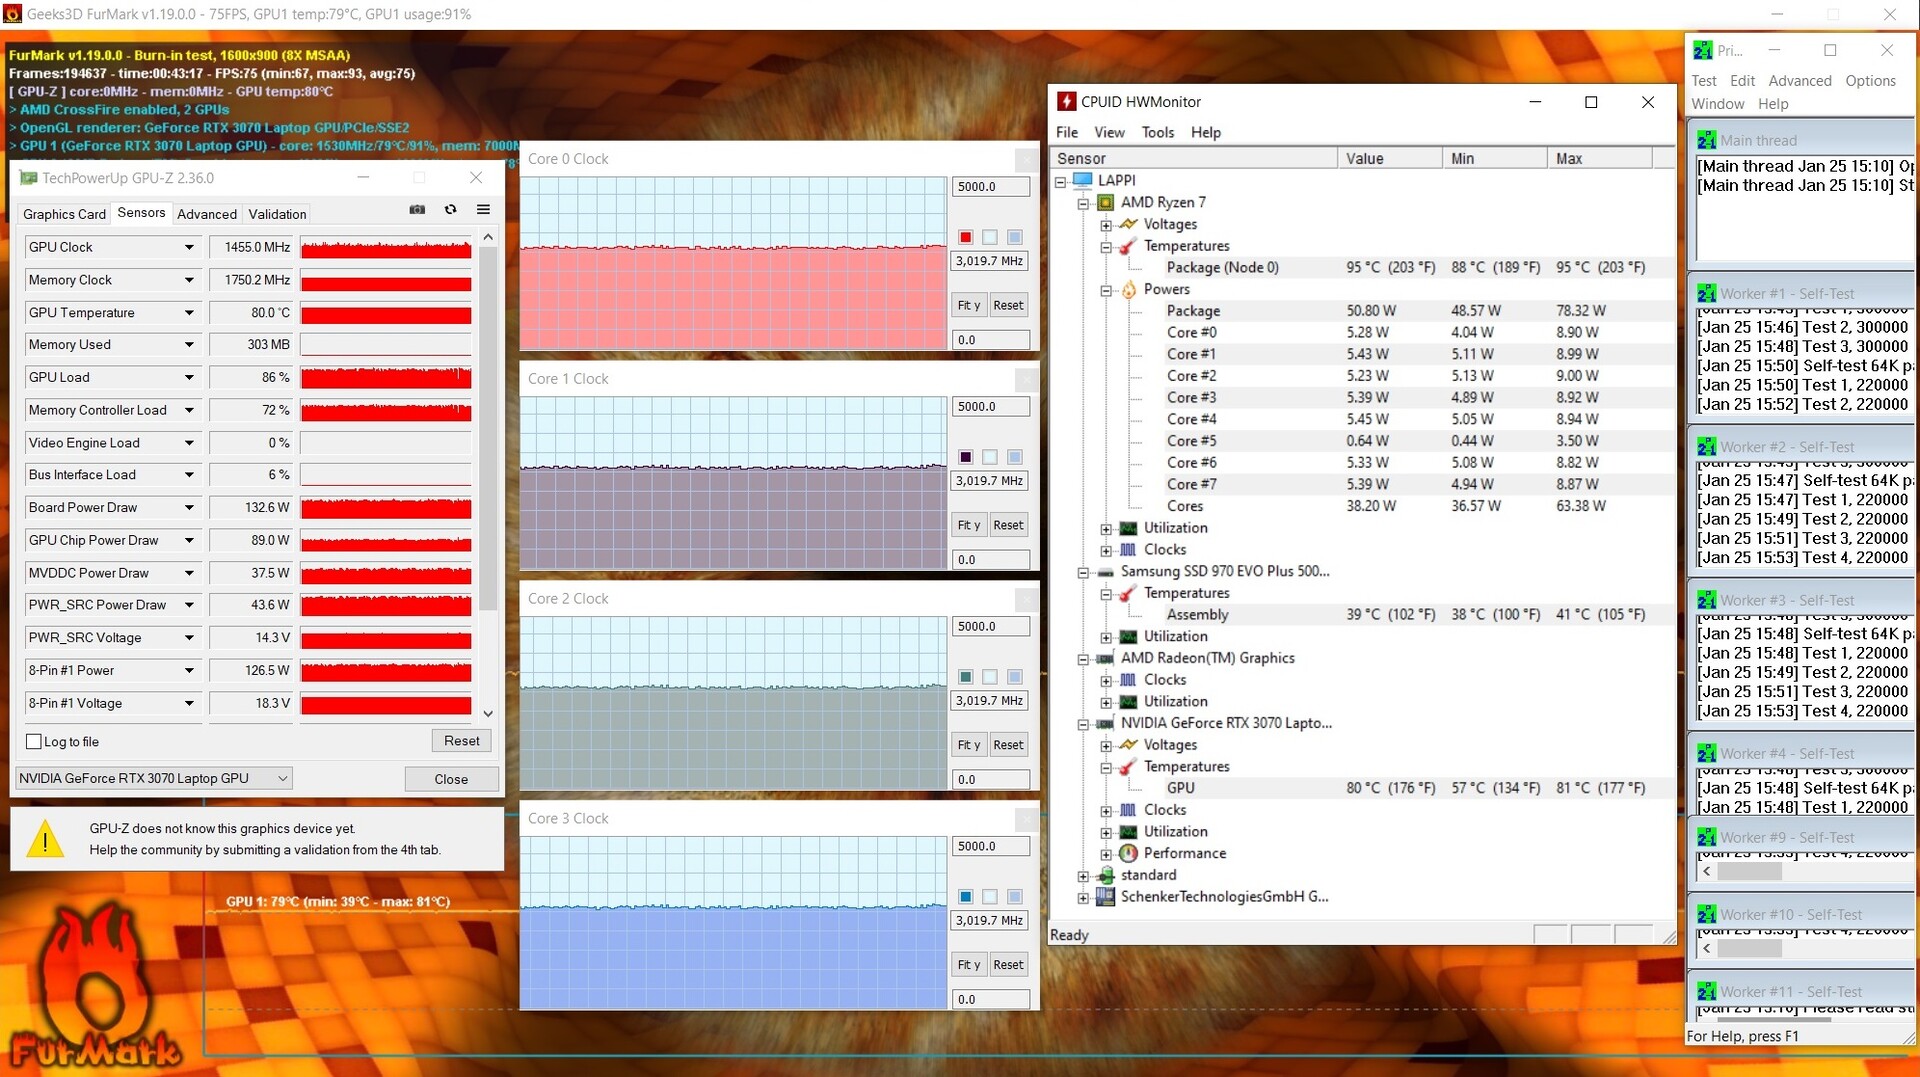
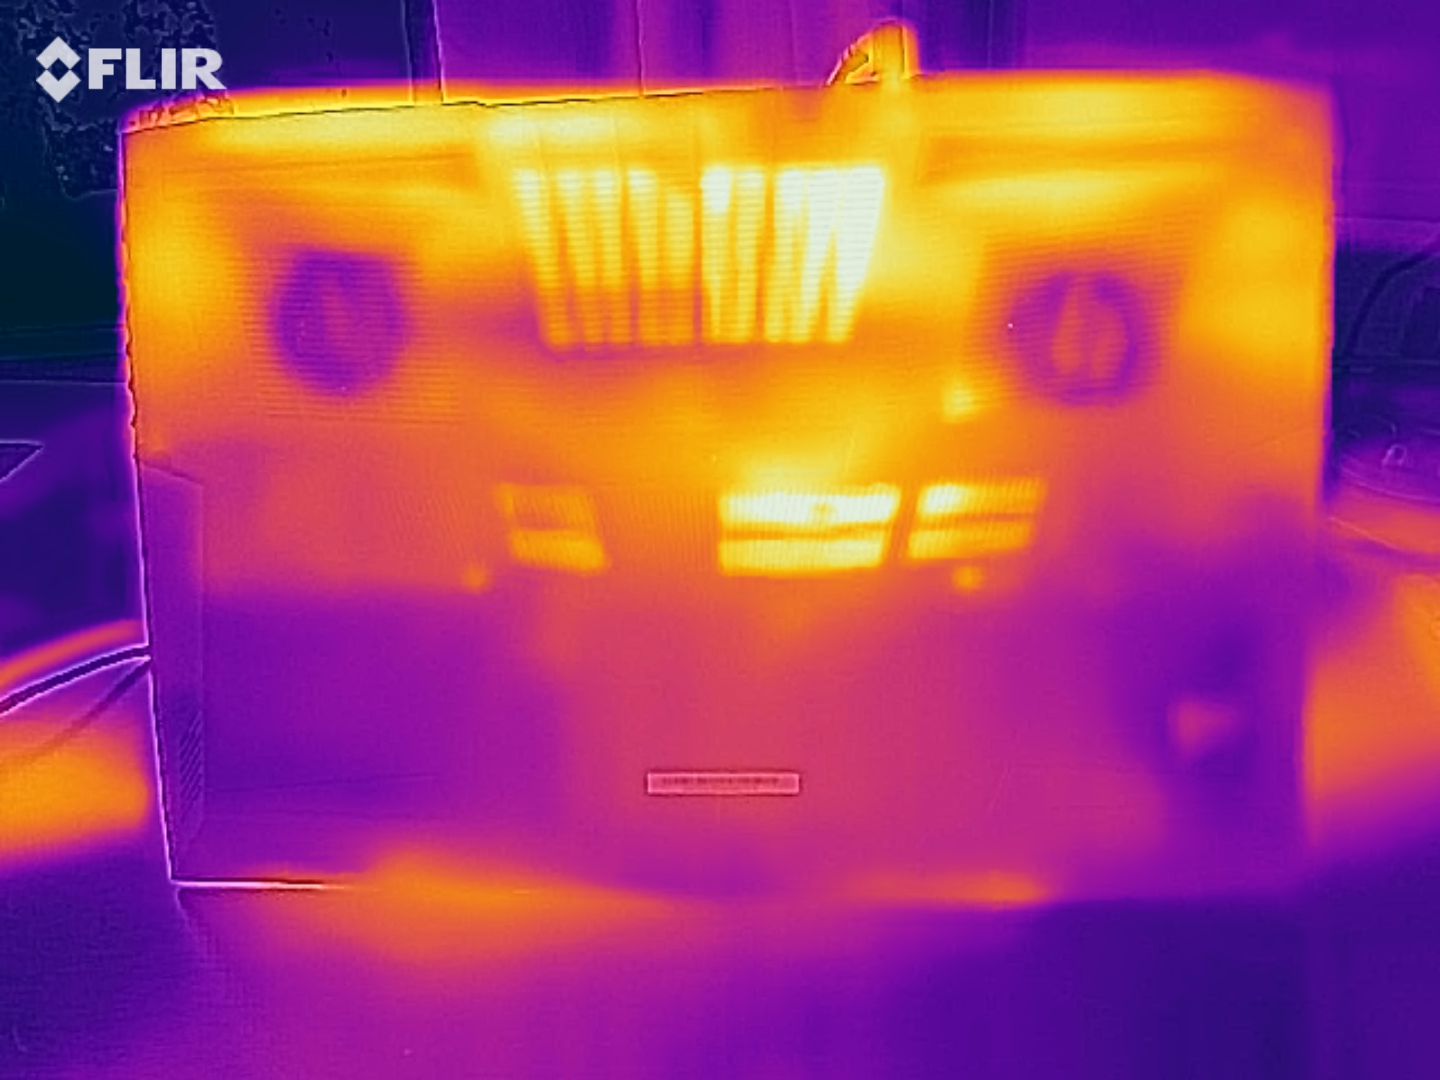
The temperature development of the chassis proves to be average. A maximum of 47 °C (~117 °F) on the top and up to 51 °C (~154 °F) on the bottom after 60 minutes of stress testing with the FurMark and Prime95 tools is neither particularly high nor particularly low. In idle usage, all surfaces of the case stay below the 40 °C (~104 °F) mark. Inside, the CPU and GPU are specifically relevant. While the Ryzen 5 5800H reaches up to 95 °C (~203 °F) in the stress test, the RTX 3070 laptop GPU settles at around 80 °C (~176 °F). Our The Witcher 3 test reveals similar GPU temperatures but significantly lower CPU temperatures.
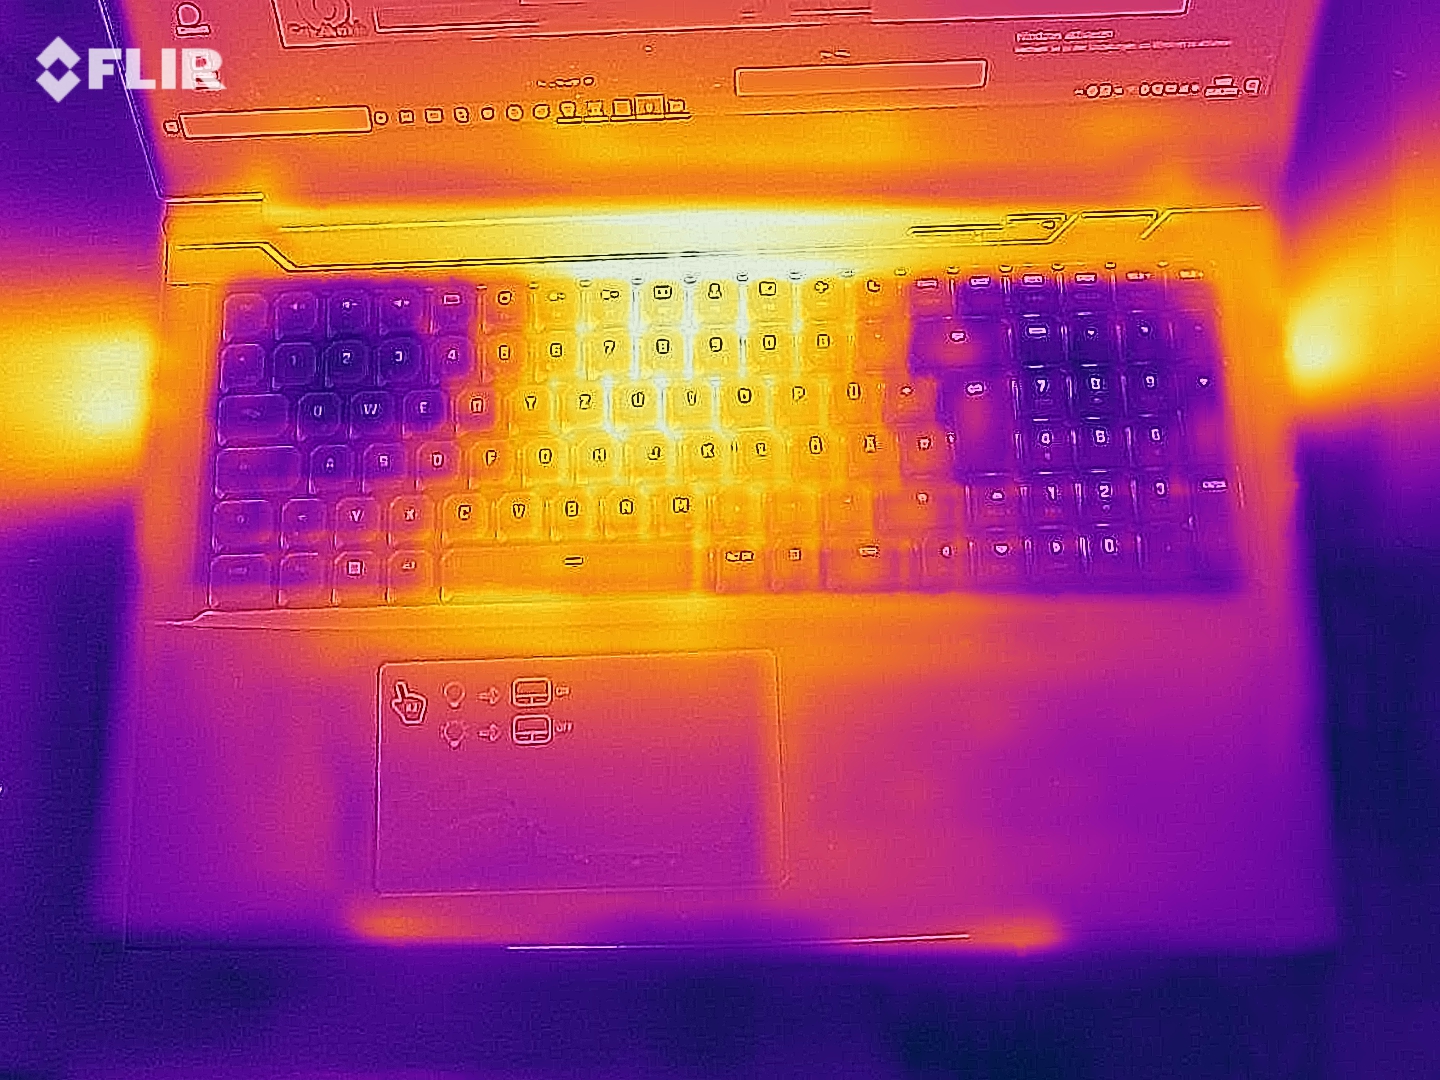
(-) The maximum temperature on the upper side is 47 °C / 117 F, compared to the average of 40.4 °C / 105 F, ranging from 21.2 to 68.8 °C for the class Gaming.
(-) The bottom heats up to a maximum of 51 °C / 124 F, compared to the average of 43.2 °C / 110 F
(+) In idle usage, the average temperature for the upper side is 29.7 °C / 85 F, compared to the device average of 33.8 °C / 93 F.
(±) Playing The Witcher 3, the average temperature for the upper side is 36.6 °C / 98 F, compared to the device average of 33.8 °C / 93 F.
(±) The palmrests and touchpad can get very hot to the touch with a maximum of 36 °C / 96.8 F.
(-) The average temperature of the palmrest area of similar devices was 28.9 °C / 84 F (-7.1 °C / -12.8 F).
| SCHENKER XMG Neo 17 (Early 2021, RTX 3070, 5800H) R7 5800H, GeForce RTX 3070 Laptop GPU | Gigabyte Aero 17 HDR YC i9-10980HK, GeForce RTX 3080 Laptop GPU | Asus Zephyrus S17 GX701LXS i7-10875H, GeForce RTX 2080 Super Max-Q | MSI Creator 17 A10SGS i7-10875H, GeForce RTX 2080 Super Max-Q | Aorus 17G XB i7-10875H, GeForce RTX 2070 Super Max-Q | Average of class Gaming | |
|---|---|---|---|---|---|---|
| Heat | -2% | 4% | -6% | 6% | 5% | |
| Maximum Upper Side * | 47 | 51 -9% | 57 -21% | 52 -11% | 48 -2% | 46 ? 2% |
| Maximum Bottom * | 51 | 58 -14% | 51 -0% | 59 -16% | 59 -16% | 49.5 ? 3% |
| Idle Upper Side * | 32 | 29 9% | 28 12% | 34 -6% | 26 19% | 31.4 ? 2% |
| Idle Bottom * | 37 | 34 8% | 28 24% | 33 11% | 29 22% | 32.5 ? 12% |
* ... smaller is better
Speakers
SCHENKER XMG Neo 17 (Early 2021, RTX 3070, 5800H) audio analysis
(+) | speakers can play relatively loud (84 dB)
Bass 100 - 315 Hz
(-) | nearly no bass - on average 20.8% lower than median
(±) | linearity of bass is average (12.3% delta to prev. frequency)
Mids 400 - 2000 Hz
(+) | balanced mids - only 2.9% away from median
(+) | mids are linear (5.1% delta to prev. frequency)
Highs 2 - 16 kHz
(+) | balanced highs - only 2.7% away from median
(±) | linearity of highs is average (7.6% delta to prev. frequency)
Overall 100 - 16.000 Hz
(+) | overall sound is linear (14.5% difference to median)
Compared to same class
» 25% of all tested devices in this class were better, 7% similar, 69% worse
» The best had a delta of 6%, average was 18%, worst was 132%
Compared to all devices tested
» 15% of all tested devices were better, 3% similar, 82% worse
» The best had a delta of 4%, average was 25%, worst was 134%
Gigabyte Aero 17 HDR YC audio analysis
(+) | speakers can play relatively loud (86 dB)
Bass 100 - 315 Hz
(-) | nearly no bass - on average 20.4% lower than median
(±) | linearity of bass is average (10.2% delta to prev. frequency)
Mids 400 - 2000 Hz
(±) | higher mids - on average 5.3% higher than median
(+) | mids are linear (5.2% delta to prev. frequency)
Highs 2 - 16 kHz
(+) | balanced highs - only 4.2% away from median
(±) | linearity of highs is average (7.7% delta to prev. frequency)
Overall 100 - 16.000 Hz
(±) | linearity of overall sound is average (16.3% difference to median)
Compared to same class
» 38% of all tested devices in this class were better, 6% similar, 56% worse
» The best had a delta of 6%, average was 18%, worst was 132%
Compared to all devices tested
» 22% of all tested devices were better, 5% similar, 73% worse
» The best had a delta of 4%, average was 25%, worst was 134%
Energy management
Energy consumption
The XMG Neo 17 can be operated either with or without graphics switching. When Optimus is enabled, the 17-incher consumes between 13 and 26 watts in idle usage - a passable rate. Under load, we were able to draw between 125 watts (3DMark06 avg.) and 259 watts (stress test max.) from the laptop. With that, the device has a typical high-end consumption.
| Off / Standby | |
| Idle | |
| Load |
|
| SCHENKER XMG Neo 17 (Early 2021, RTX 3070, 5800H) R7 5800H, GeForce RTX 3070 Laptop GPU | Gigabyte Aero 17 HDR YC i9-10980HK, GeForce RTX 3080 Laptop GPU | Asus Zephyrus S17 GX701LXS i7-10875H, GeForce RTX 2080 Super Max-Q | MSI Creator 17 A10SGS i7-10875H, GeForce RTX 2080 Super Max-Q | Aorus 17G XB i7-10875H, GeForce RTX 2070 Super Max-Q | Average of class Gaming | |
|---|---|---|---|---|---|---|
| Power Consumption | -9% | 7% | -16% | -18% | -3% | |
| Idle Minimum * | 13 | 17 -31% | 10 23% | 15 -15% | 20 -54% | 13.7 ? -5% |
| Idle Average * | 16 | 21 -31% | 16 -0% | 20 -25% | 23 -44% | 19.1 ? -19% |
| Idle Maximum * | 26 | 33 -27% | 29 -12% | 42 -62% | 38 -46% | 26.8 ? -3% |
| Load Average * | 125 | 113 10% | 143 -14% | 150 -20% | 105 16% | 110.9 ? 11% |
| Witcher 3 ultra * | 187 | 157 16% | 146 22% | 170 9% | 158 16% | |
| Load Maximum * | 259 | 237 8% | 205 21% | 210 19% | 243 6% | 250 ? 3% |
* ... smaller is better
Battery life
The Neo 17's biggest weakness is its meager battery life. Despite enabling graphics switching, the 17-incher didn't even last 5 hours in our idle test with minimum brightness. Just under 3.5 hours of Internet surfing over WLAN (medium brightness) is also poor. In comparison: The competition offers between 19% and 145% longer runtimes in total. No wonder, since the Neo 17 has to make do with the weakest battery. The rivals can only laugh at the 62 Wh batter (they have capacities between 76 and 99 Wh). The barebone manufacturer Tongfang should make improvements in this regard.
| SCHENKER XMG Neo 17 (Early 2021, RTX 3070, 5800H) R7 5800H, GeForce RTX 3070 Laptop GPU, 62 Wh | Gigabyte Aero 17 HDR YC i9-10980HK, GeForce RTX 3080 Laptop GPU, 99 Wh | Asus Zephyrus S17 GX701LXS i7-10875H, GeForce RTX 2080 Super Max-Q, 76 Wh | MSI Creator 17 A10SGS i7-10875H, GeForce RTX 2080 Super Max-Q, 82 Wh | Aorus 17G XB i7-10875H, GeForce RTX 2070 Super Max-Q, 94 Wh | Average of class Gaming | |
|---|---|---|---|---|---|---|
| Battery Runtime | 100% | 19% | 45% | 145% | 87% | |
| Reader / Idle | 281 | 620 121% | 208 -26% | 434 54% | 598 113% | 544 ? 94% |
| WiFi v1.3 | 208 | 354 70% | 170 -18% | 266 28% | 450 116% | 368 ? 77% |
| Load | 44 | 92 109% | 88 100% | 67 52% | 134 205% | 84.2 ? 91% |
Pros
Cons
Verdict
Those who can put up with high noise development in 3D mode will get one of the strongest RTX 3070 laptops on the market with the XMG Neo 17.
The 17-incher can even outperform some RTX 3080 laptops due to the generous TDP setting in Overboost mode (140 watts including Dynamic Boost). The problem here is the high TDP range of Nvidia's Ampere generation and the lack of Max-Q versions.
The WQHD display, on the other hand, is no cause for controversy: The display convinces with high brightness, good color accuracy, and a fairly low response time, especially since the graphics card can still handle 2560x1440 pixels perfectly in most games.
Buyers have to accept some compromises in terms of battery life, connectivity (no Thunderbolt 3 due to AMD), and webcam quality.
Price and availability
The new XMG Neo 17 will probably be available starting at the end of March for 1,749 Euros (~$2,122) and up.
SCHENKER XMG Neo 17 (Early 2021, RTX 3070, 5800H)
-
01/29/2021 v7
Florian Glaser
Pricecompare

