Razer Blade Pro 17 Early 2021 Laptop Review: The GeForce RTX 30 Difference

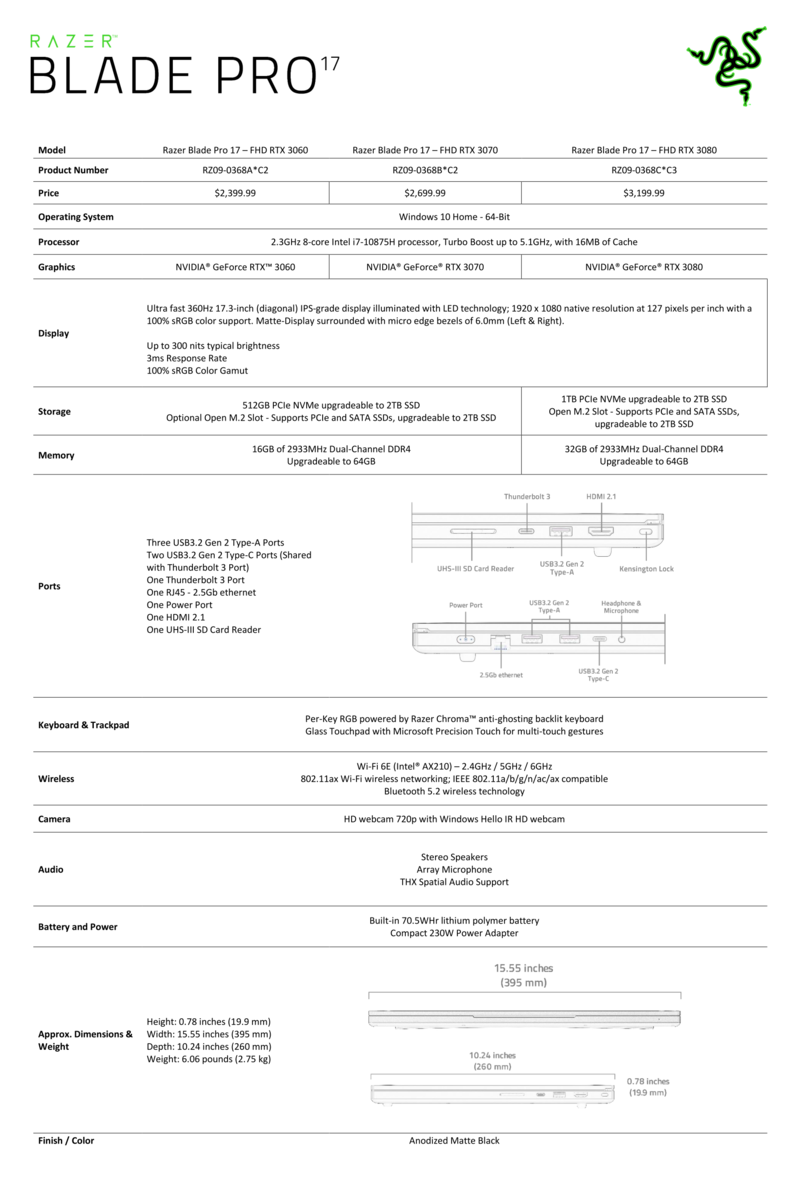
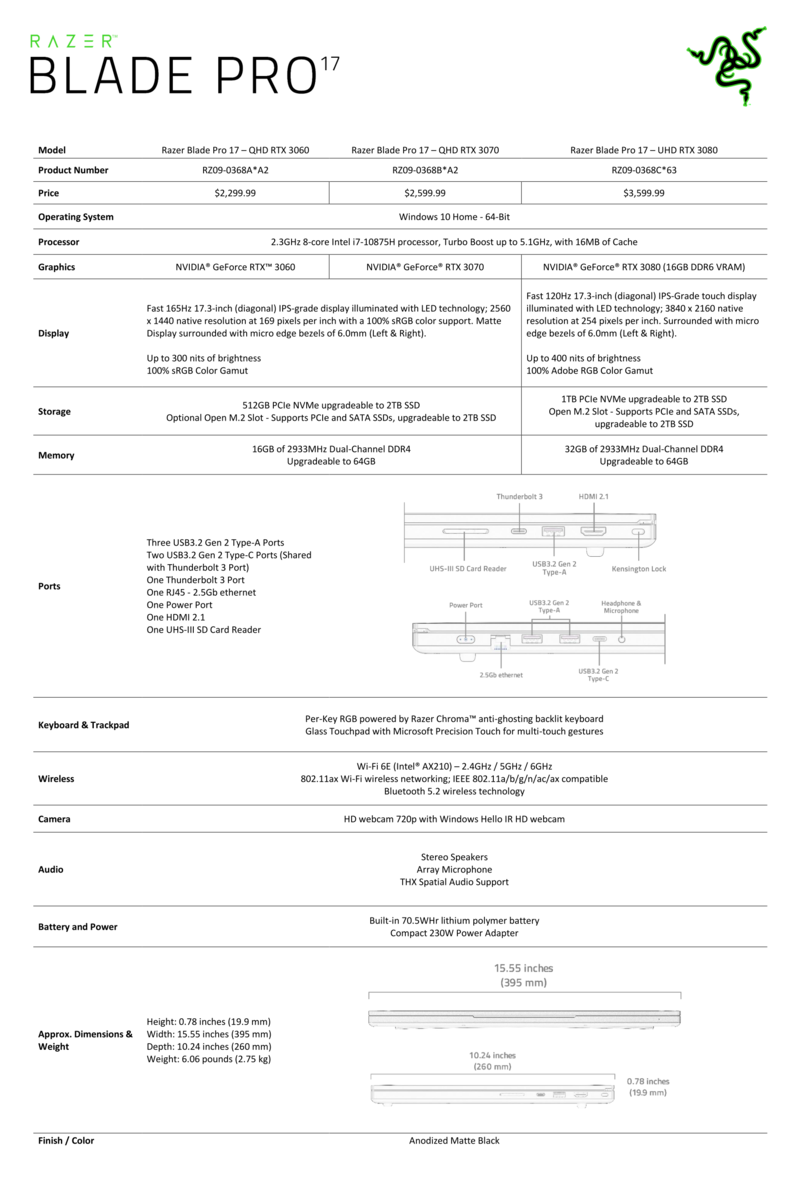
Razer has refreshed its 17.3-inch Blade Pro series with new GeForce RTX 30 Ampere GPUs to supplant last year's RTX 20 Turing options. The newer model also introduces a 165 Hz QHD 1440p display option to supplement the existing 300 Hz FHD and 120 Hz 4K panels. Otherwise, everything else about the laptop remains identical year-over-year.
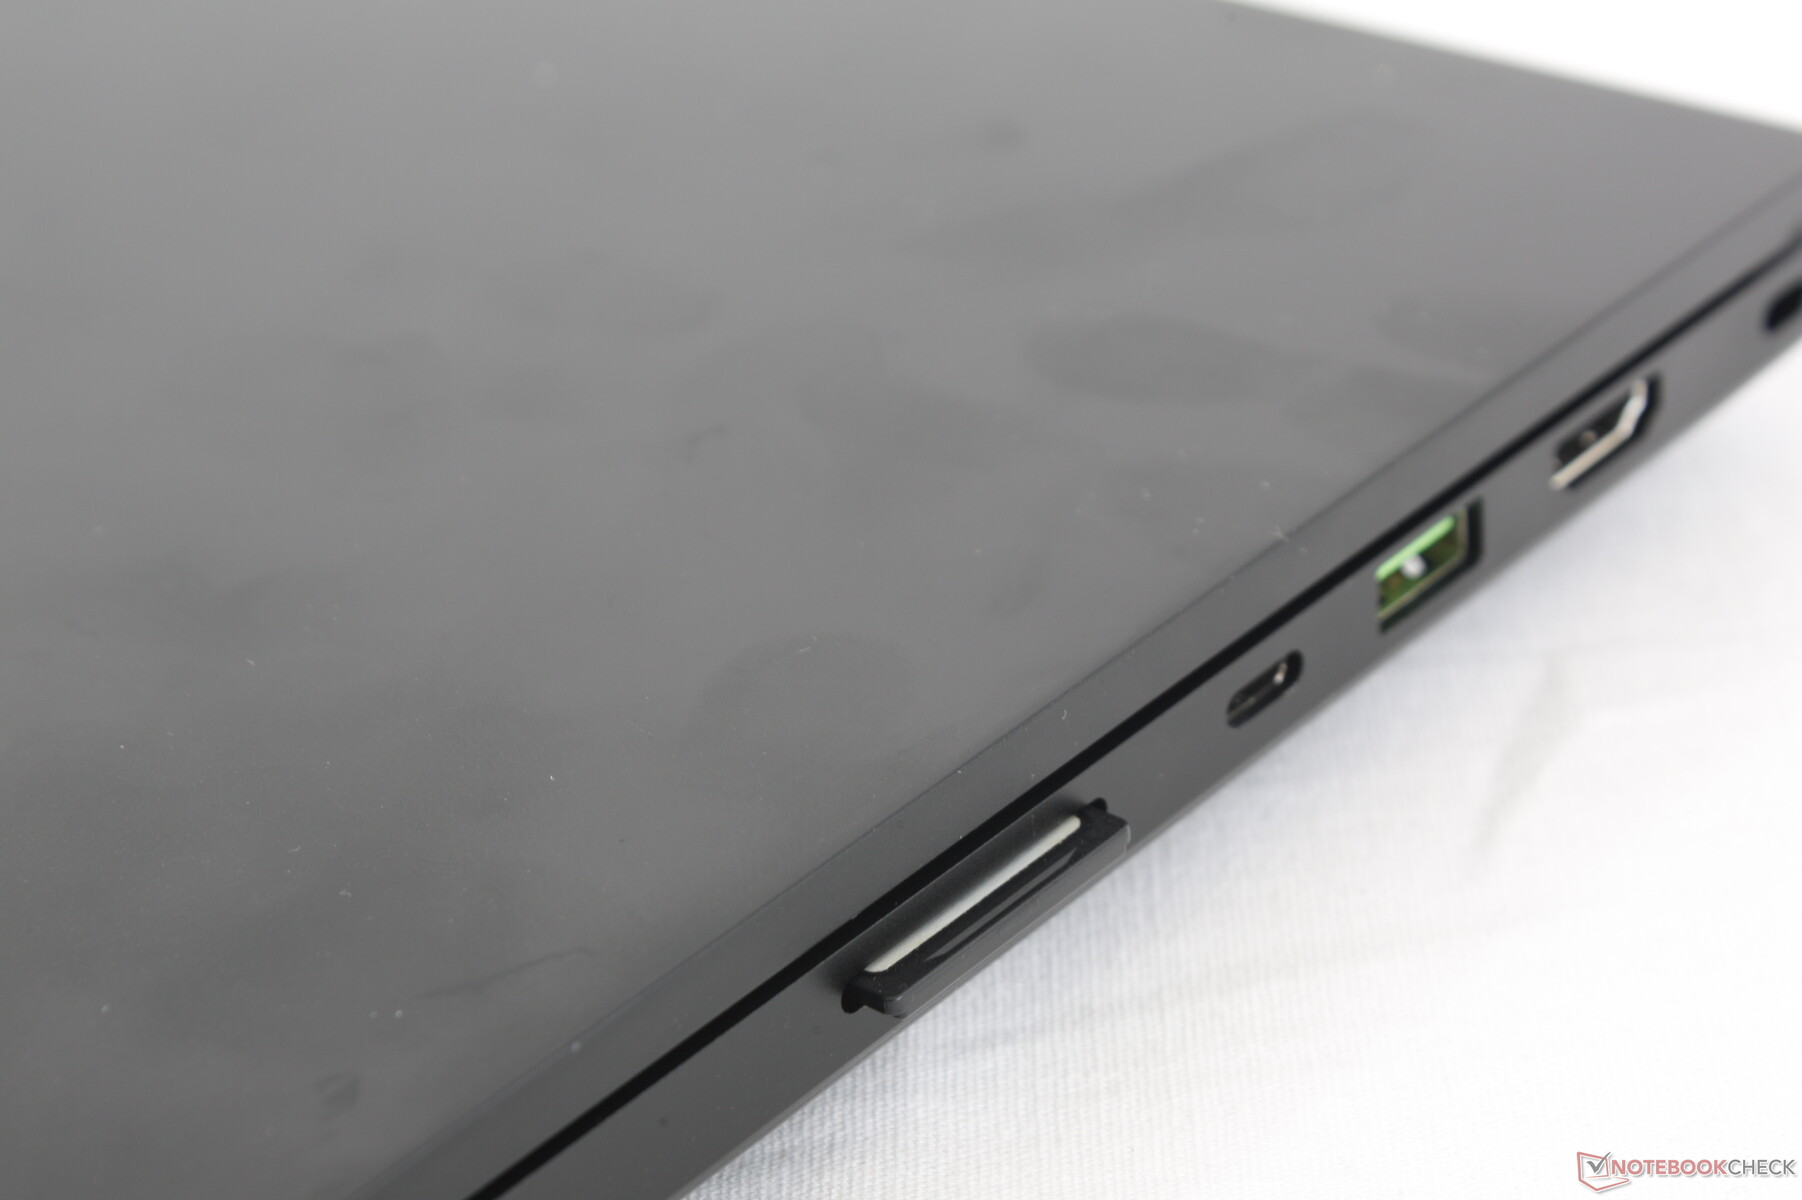
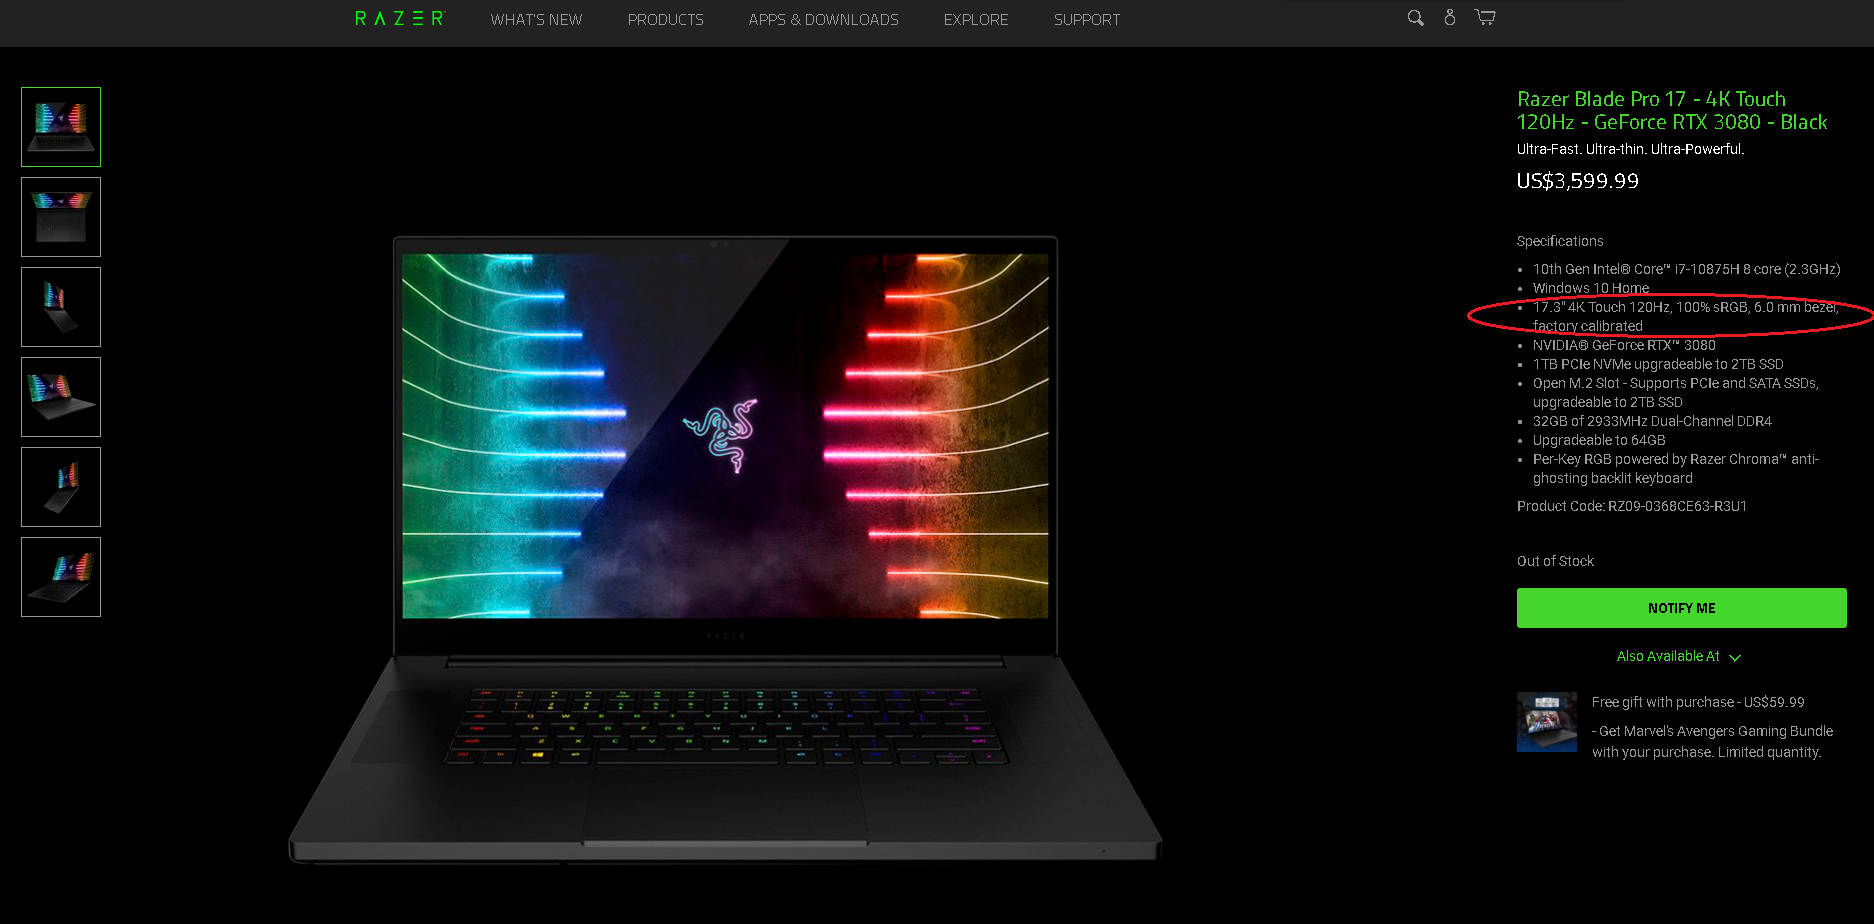
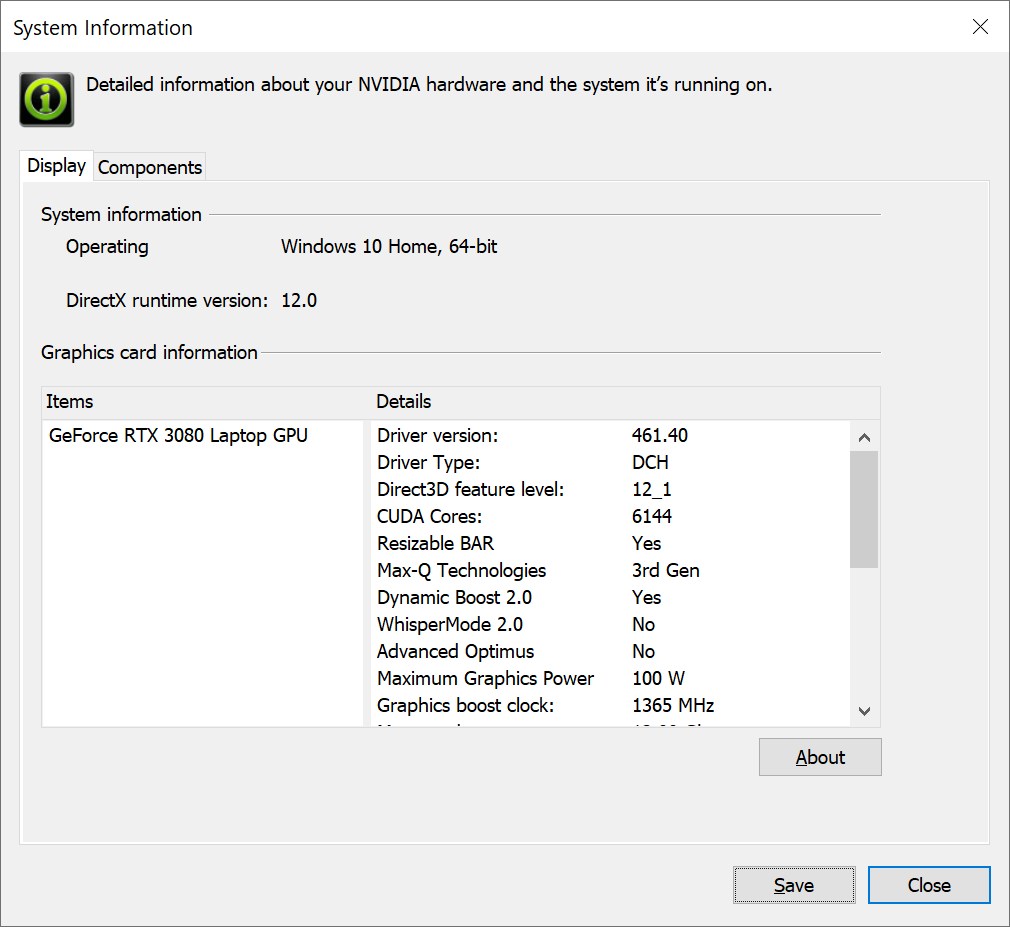
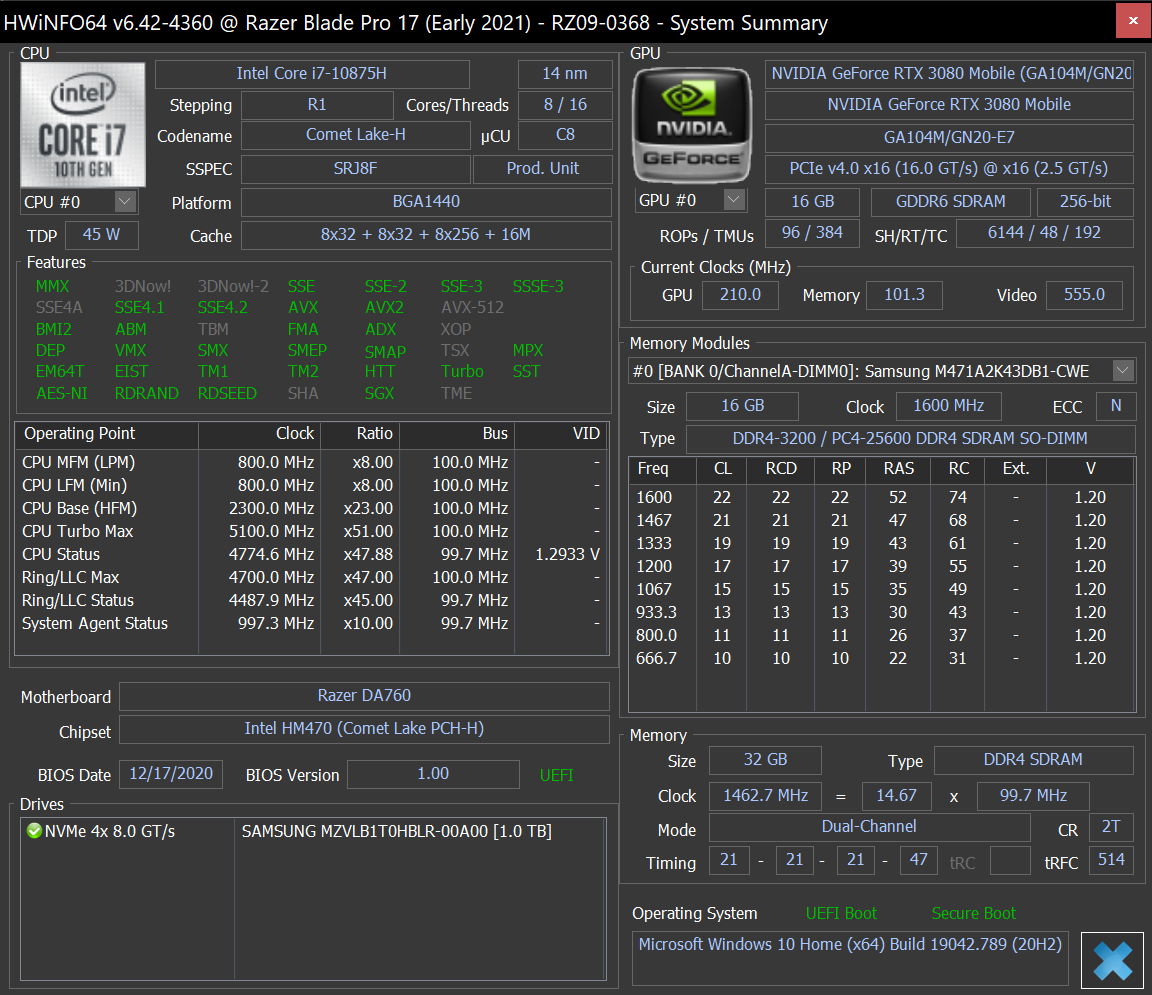
The test configuration we have for this review is the highest-end SKU with the GeForce RTX 3080 and 120 Hz 4K UHD touchscreen retailing for about $3600 USD. We recommend checking out our existing reviews on the 2020 and 2019 Blade Pro models for more information on the chassis and its physical features. The RTX 3080 in the Razer targets a 100 W TGP compared to 135 W on the Asus Zephyrus Duo 15 SE.
More Razer reviews:
potential competitors in comparison
Rating | Date | Model | Weight | Height | Size | Resolution | Price |
|---|---|---|---|---|---|---|---|
| 87.8 % v7 (old) | 02 / 2021 | Razer Blade Pro 17 2021 (QHD Touch) i7-10875H, GeForce RTX 3080 Laptop GPU | 3 kg | 19.9 mm | 17.30" | 3840x2160 | |
| 87.4 % v7 (old) | 06 / 2020 | Razer Blade Pro 17 RTX 2070 Max-Q 300 Hz i7-10875H, GeForce RTX 2070 Max-Q | 2.7 kg | 19.9 mm | 17.30" | 1920x1080 | |
| 85.1 % v7 (old) | 01 / 2021 | Schenker XMG Neo 17 (Early 2021, RTX 3070, 5800H) R7 5800H, GeForce RTX 3070 Laptop GPU | 2.5 kg | 27 mm | 17.30" | 2560x1440 | |
| 87.4 % v7 (old) | 10 / 2020 | MSI GT76 Titan DT 10SGS i9-10900K, GeForce RTX 2080 Super Mobile | 4.2 kg | 42 mm | 17.30" | 3840x2160 | |
| 83.1 % v7 (old) | 10 / 2020 | Asus Strix G17 G712LWS i7-10750H, GeForce RTX 2070 Super Mobile | 2.8 kg | 26.5 mm | 17.30" | 1920x1080 | |
| 83.7 % v7 (old) | 07 / 2020 | MSI GS75 10SF-609US i7-10875H, GeForce RTX 2070 Max-Q | 2.3 kg | 18.9 mm | 17.30" | 1920x1080 |
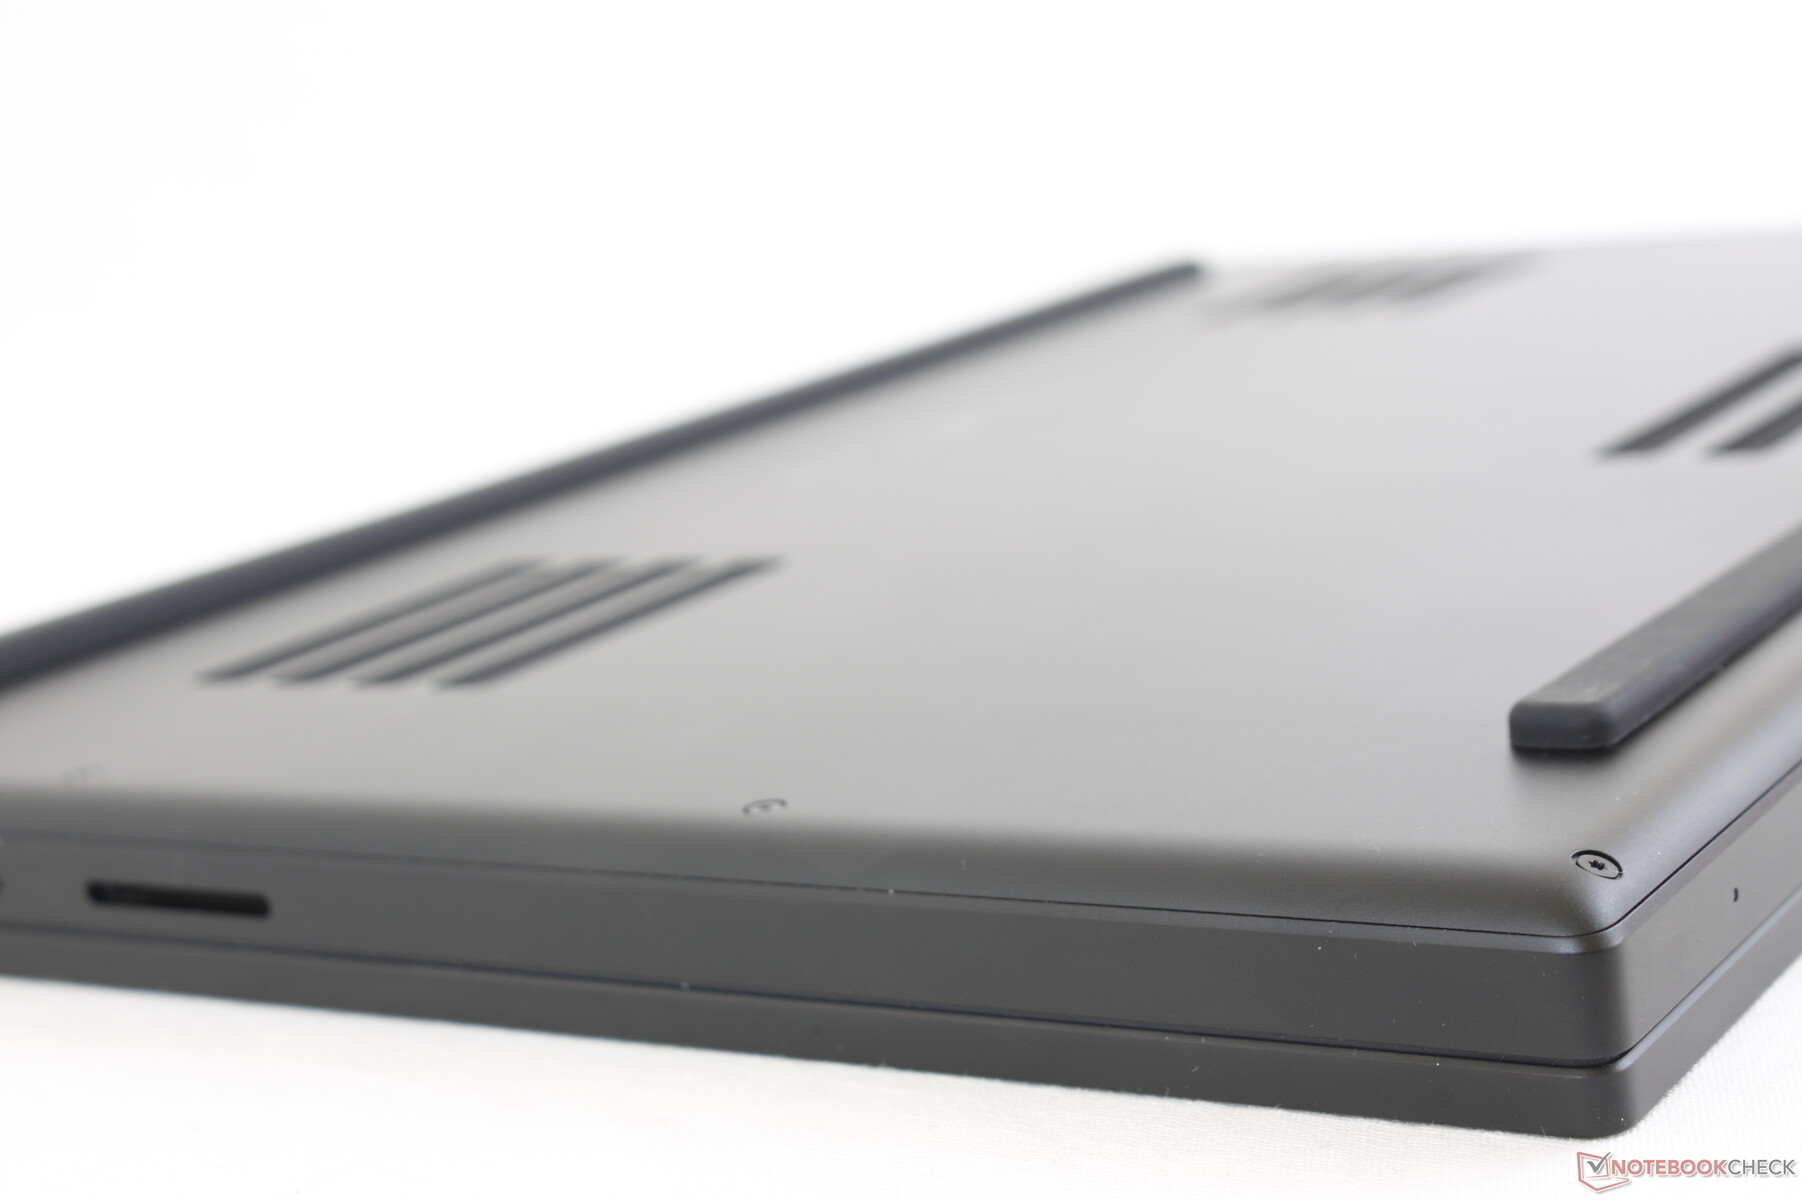
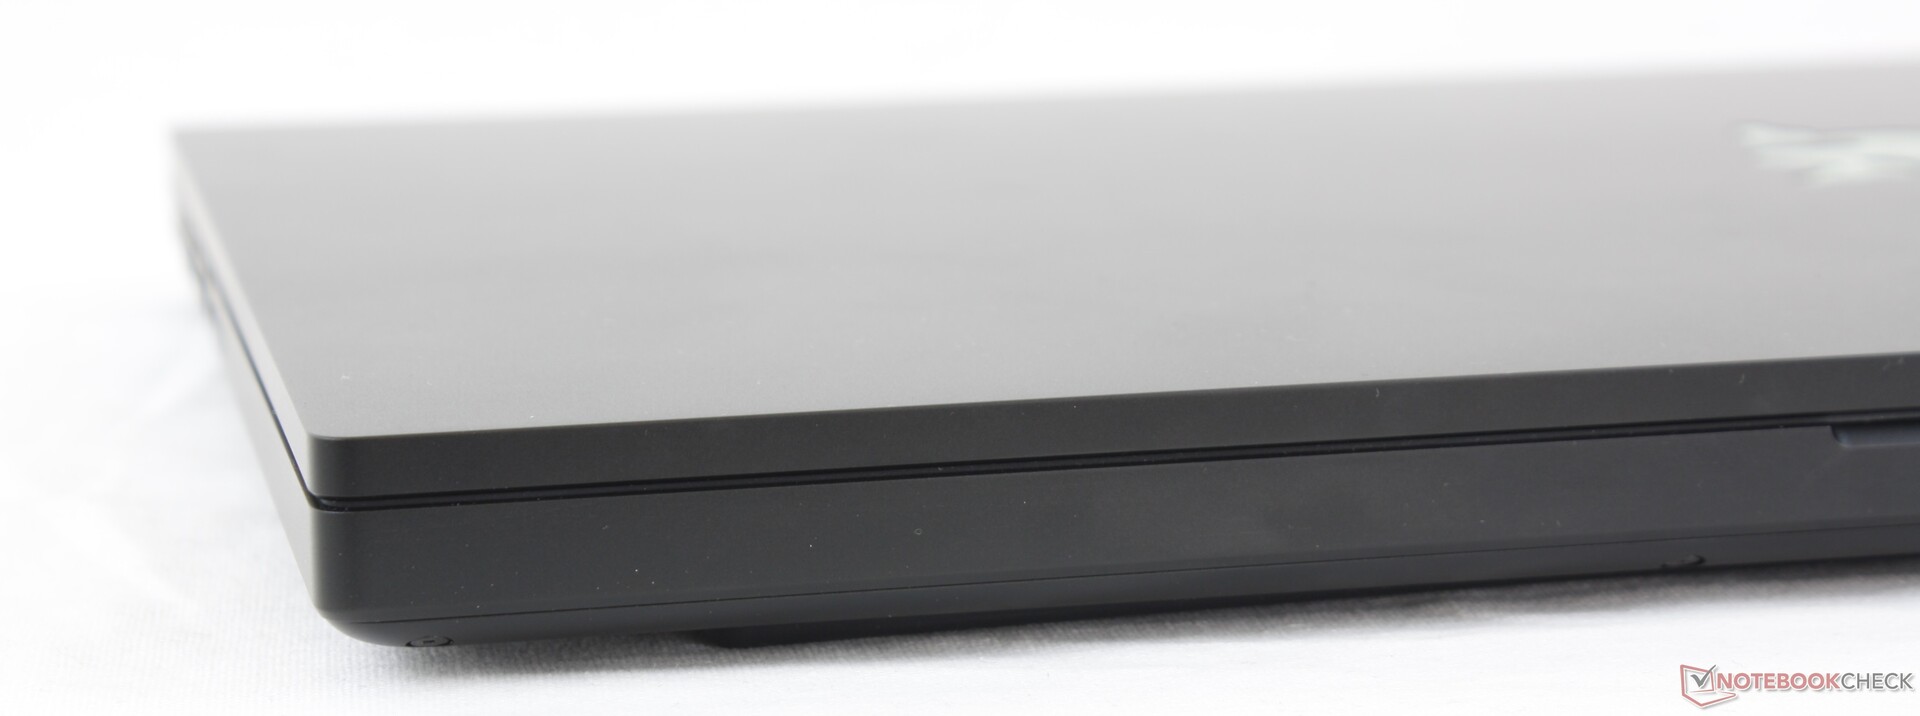
Case
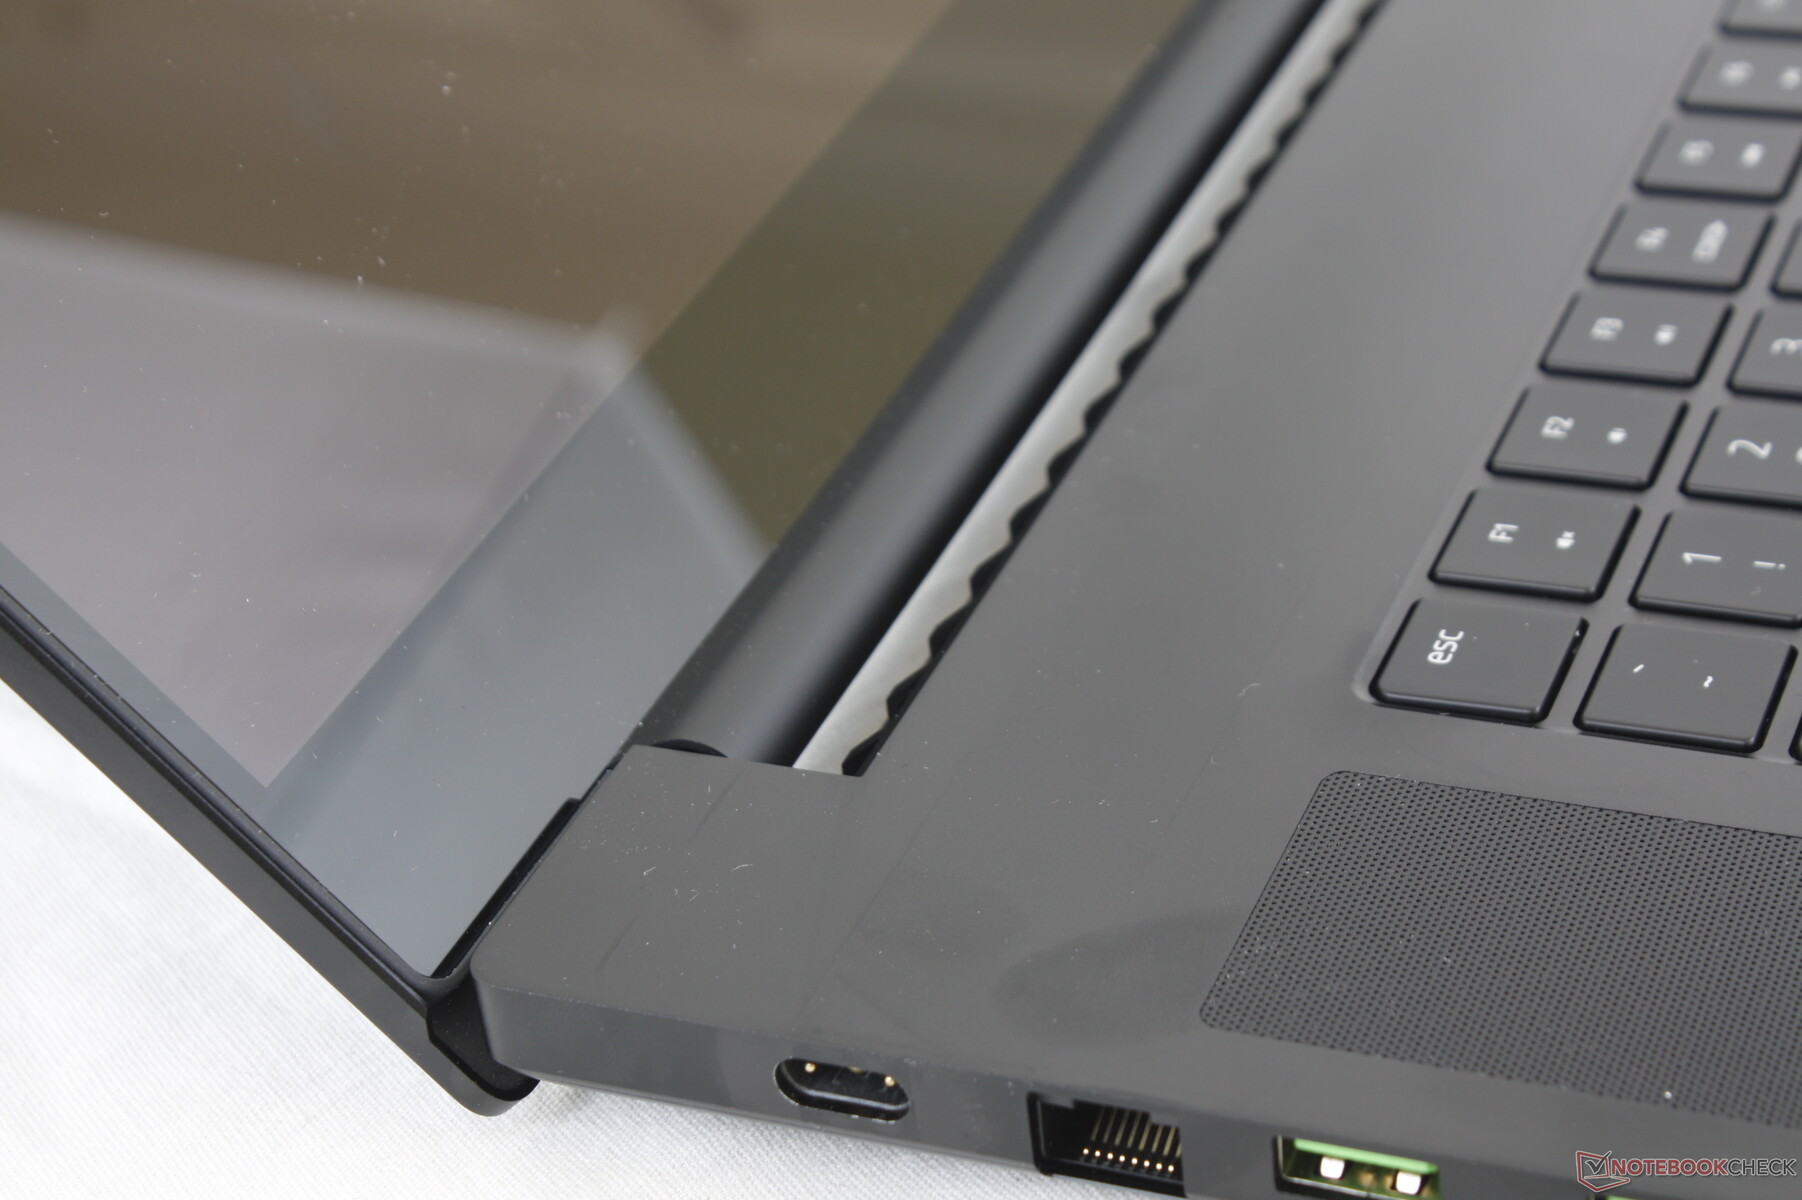
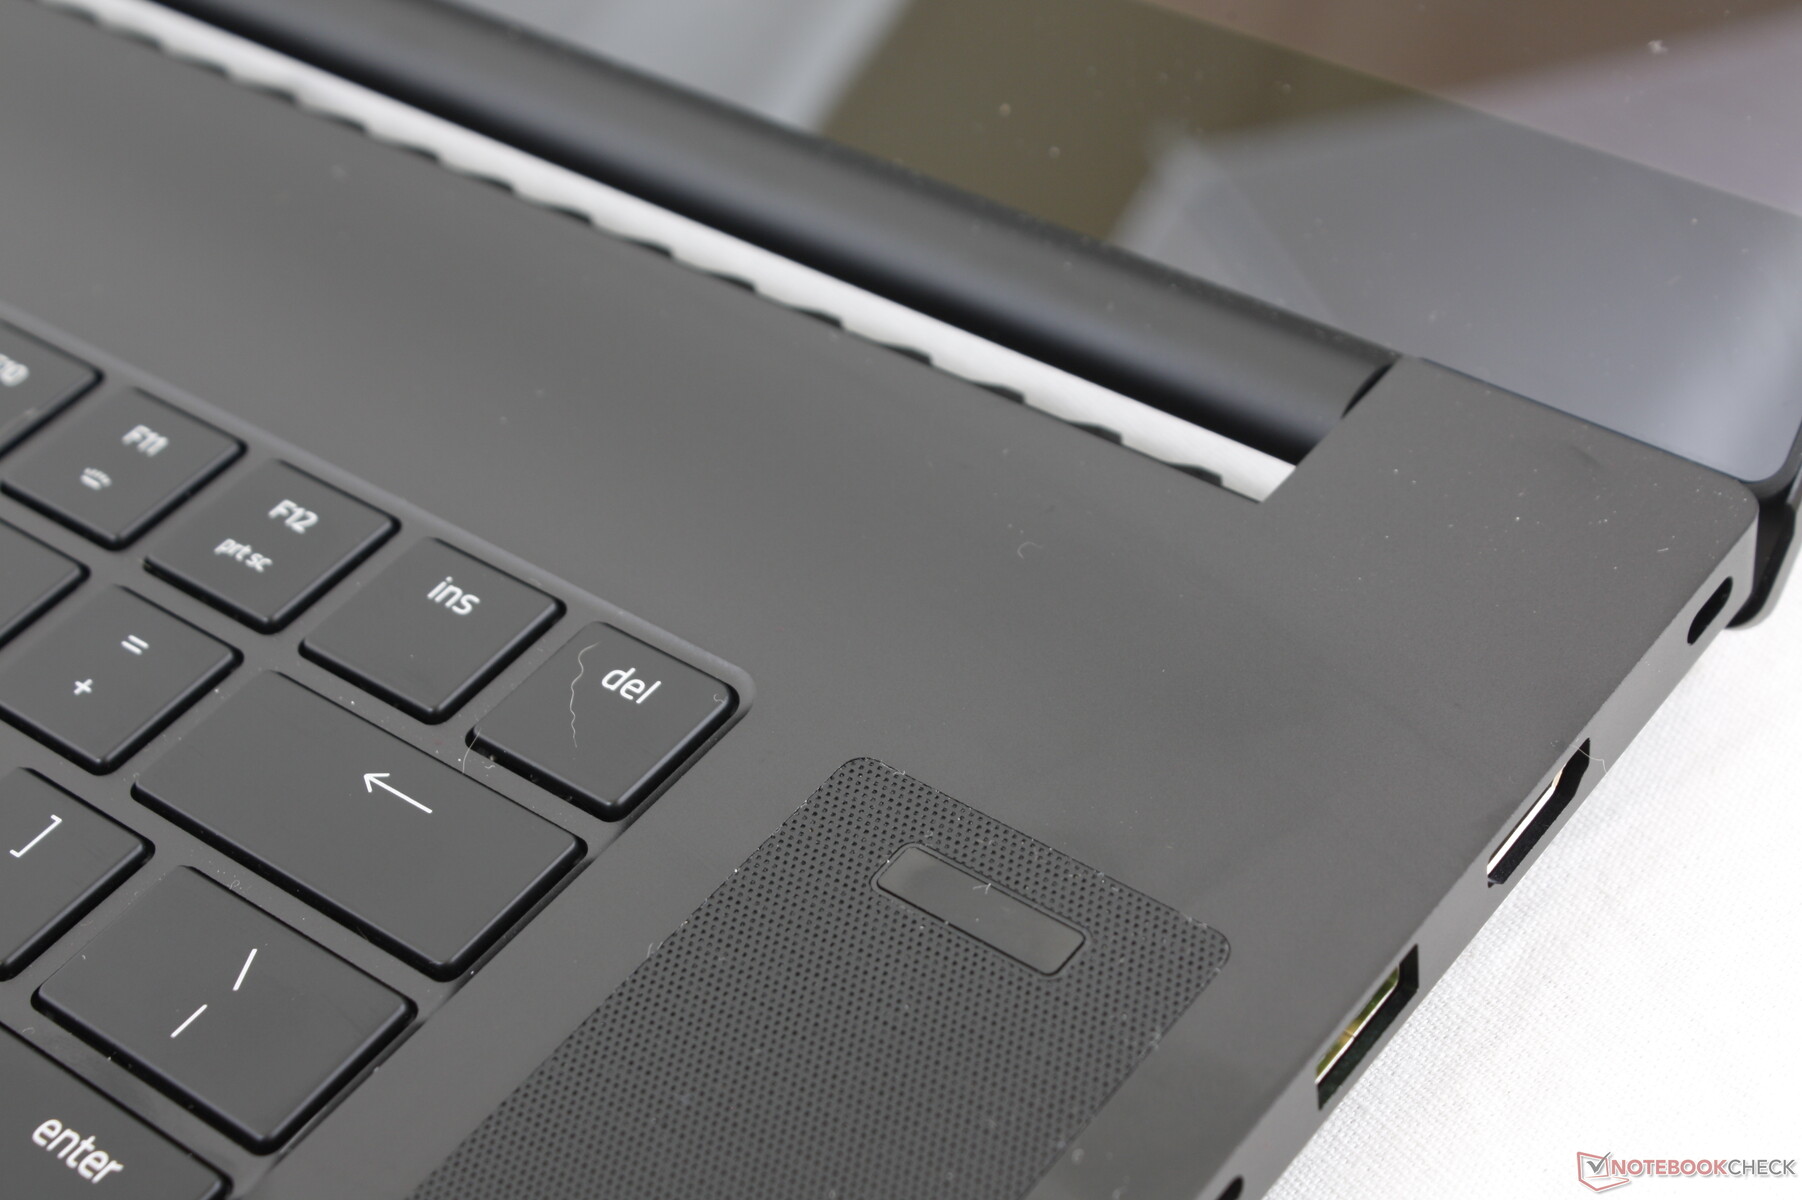
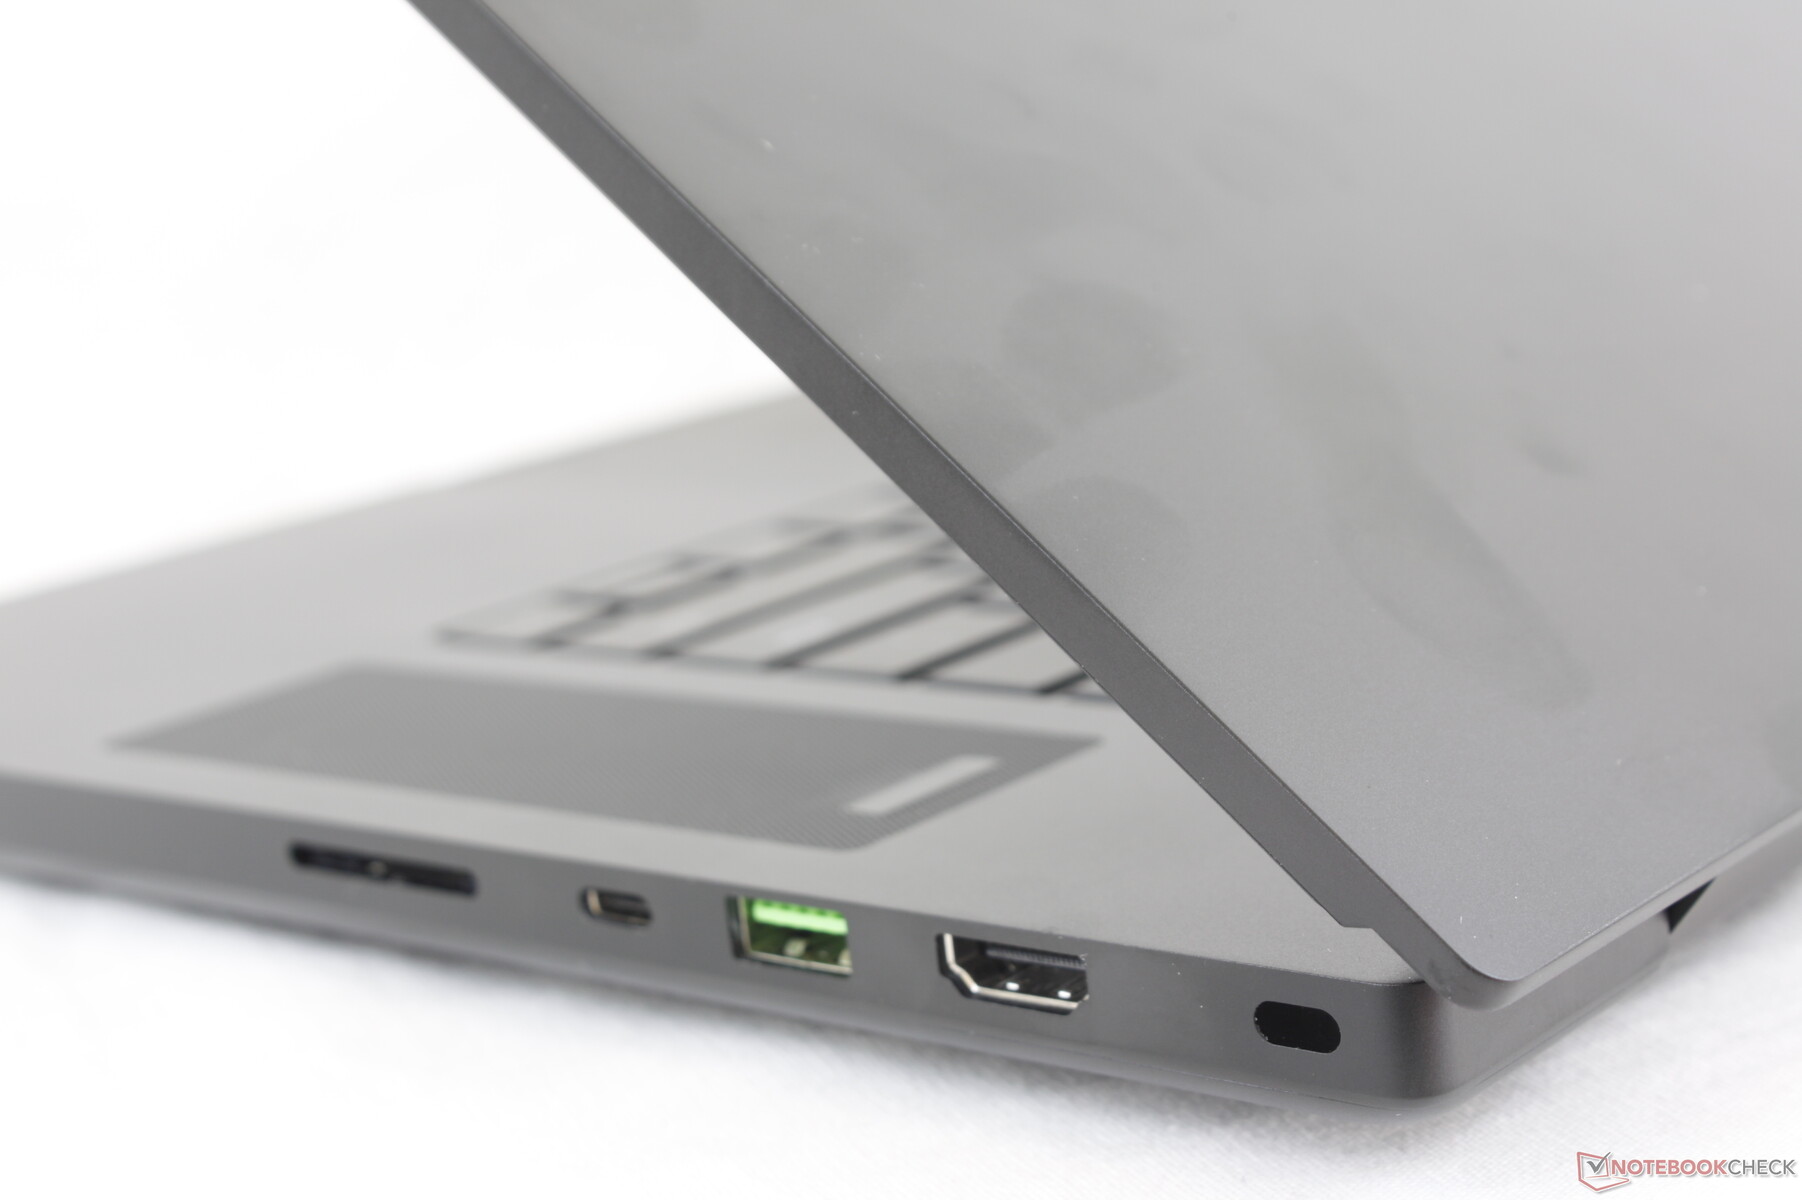
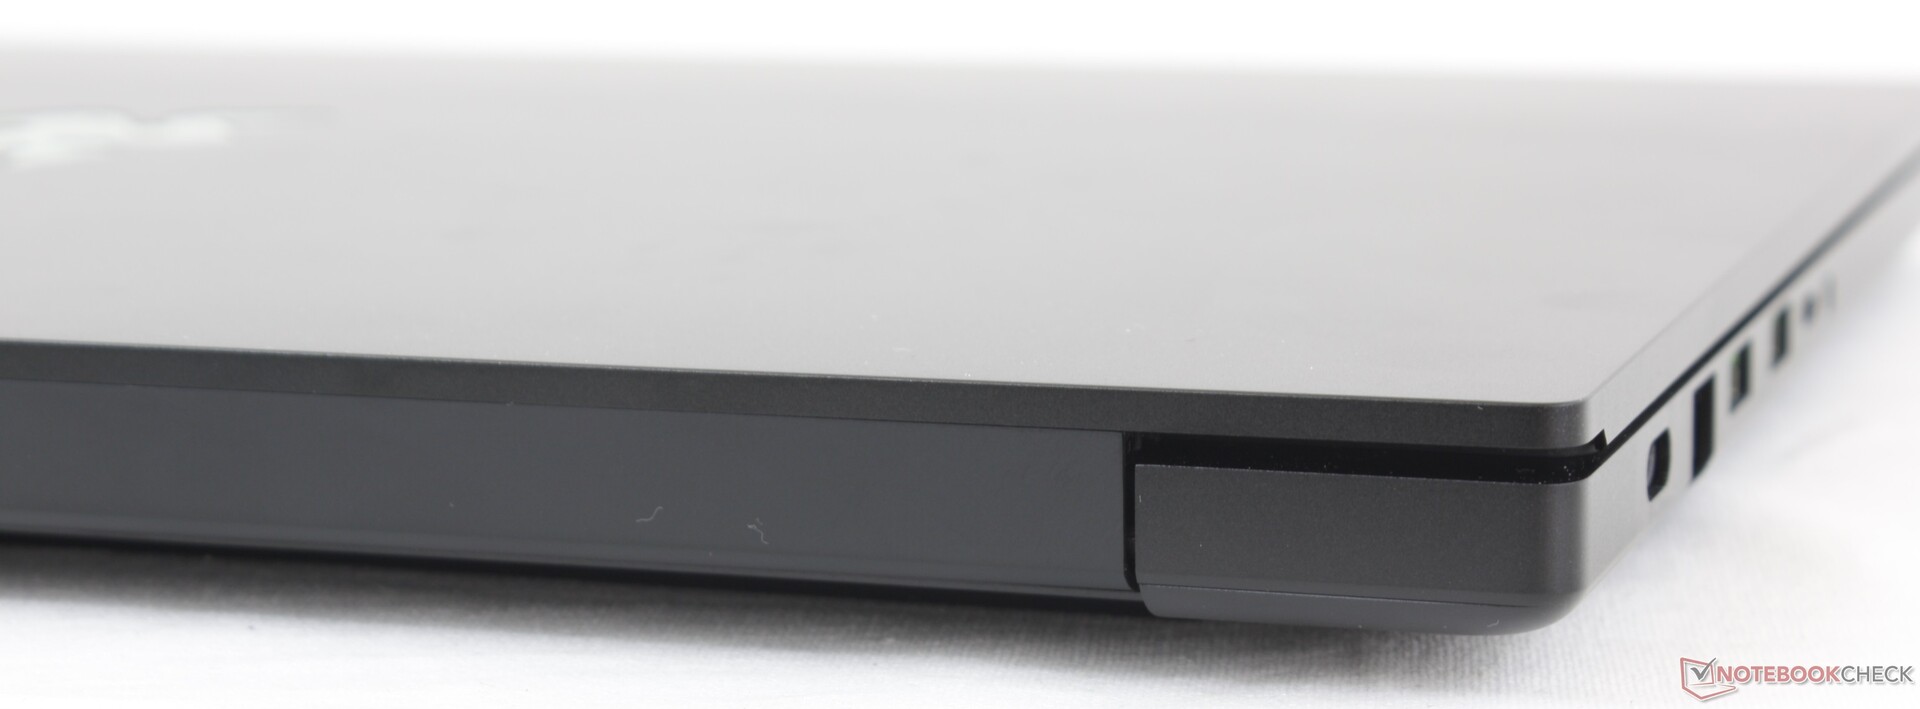
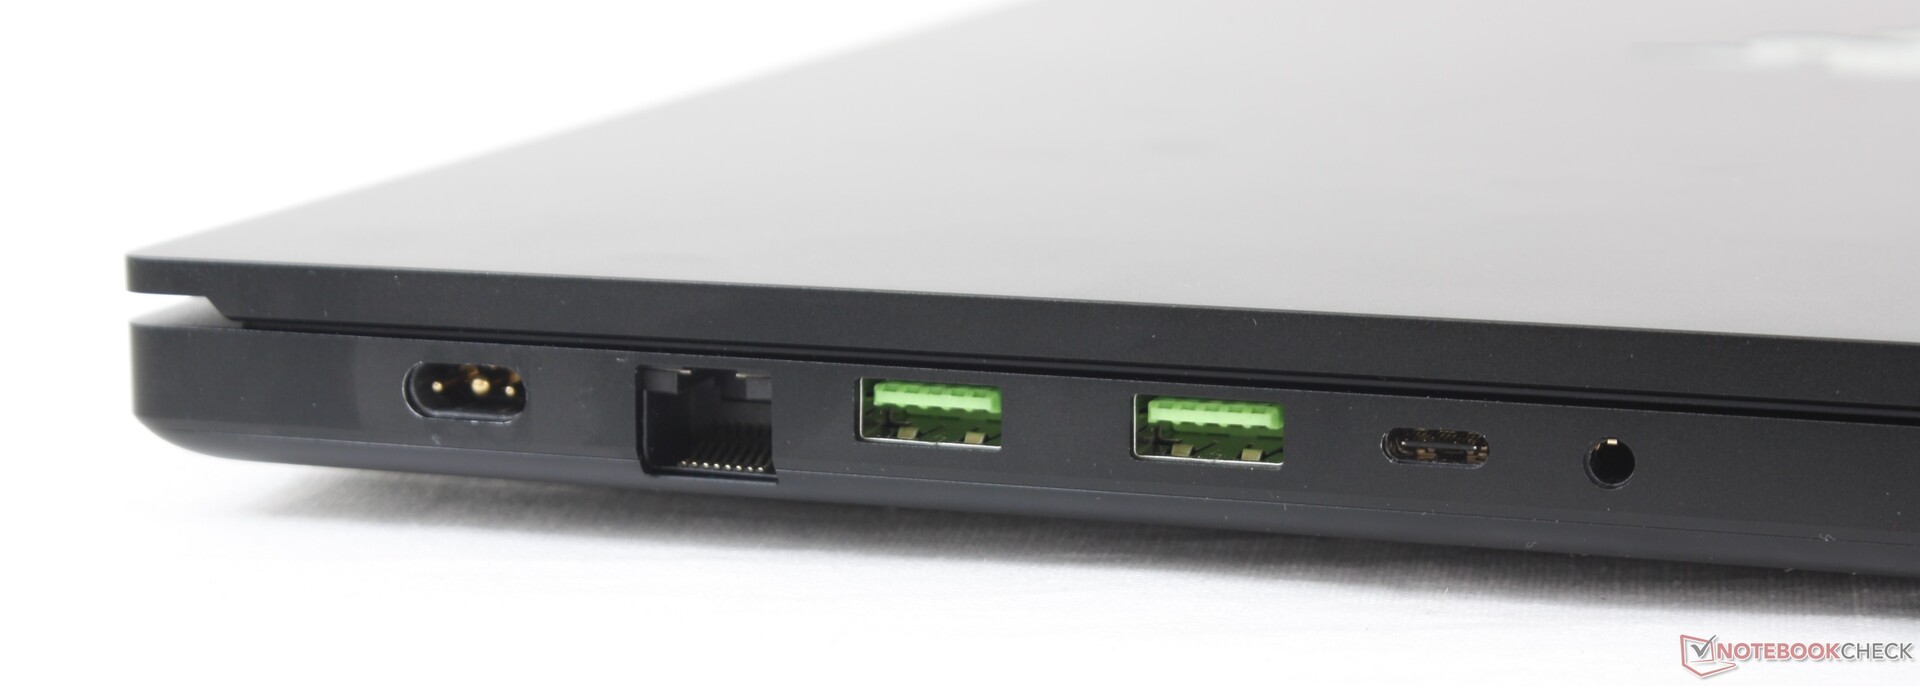
Connectivity
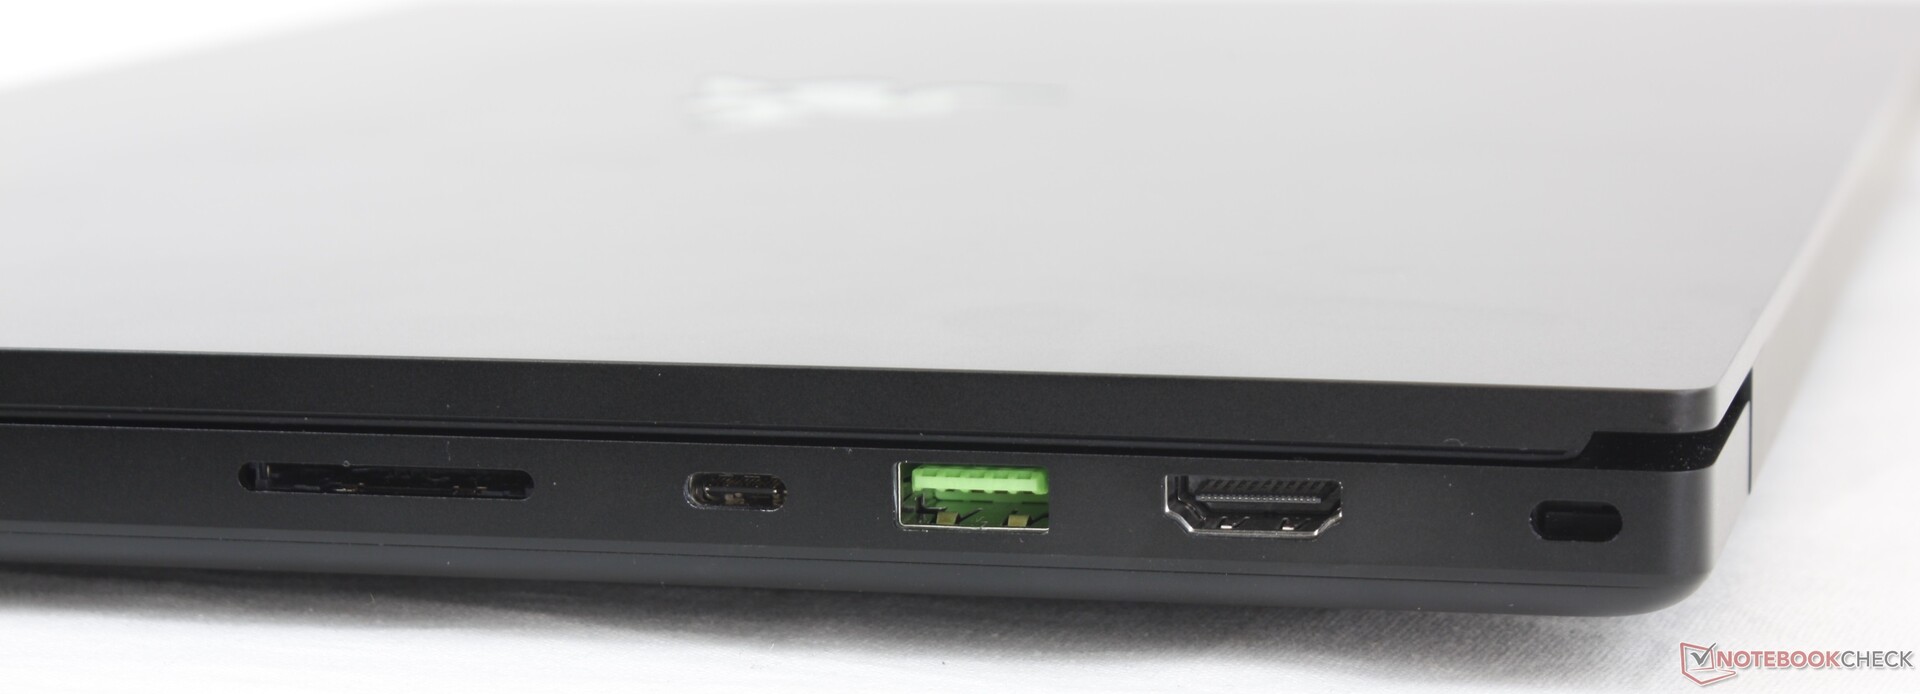
SD Card Reader
| SD Card Reader | |
| average JPG Copy Test (av. of 3 runs) | |
| Razer Blade Pro 17 RTX 2070 Max-Q 300 Hz (Toshiba Exceria Pro SDXC 64 GB UHS-II) | |
| MSI GS75 10SF-609US (Toshiba Exceria Pro M501 UHS-II) | |
| Razer Blade Pro 17 2021 (QHD Touch) (Toshiba Exceria Pro SDXC 64 GB UHS-II) | |
| MSI GT76 Titan DT 10SGS (Toshiba Exceria Pro M501 UHS-II) | |
| Schenker XMG Neo 17 (Early 2021, RTX 3070, 5800H) (Toshiba Exceria Pro SDXC 64 GB UHS-II) | |
| maximum AS SSD Seq Read Test (1GB) | |
| MSI GS75 10SF-609US (Toshiba Exceria Pro M501 UHS-II) | |
| Razer Blade Pro 17 RTX 2070 Max-Q 300 Hz (Toshiba Exceria Pro SDXC 64 GB UHS-II) | |
| MSI GT76 Titan DT 10SGS (Toshiba Exceria Pro M501 UHS-II) | |
| Razer Blade Pro 17 2021 (QHD Touch) (Toshiba Exceria Pro SDXC 64 GB UHS-II) | |
| Schenker XMG Neo 17 (Early 2021, RTX 3070, 5800H) (Toshiba Exceria Pro SDXC 64 GB UHS-II) | |
Communication
Webcam

 GeForce RTX 3080 Laptop GPU, i7-10875H, Samsung PM981a MZVLB1T0HBLR")
 GeForce RTX 3080 Laptop GPU, i7-10875H, Samsung PM981a MZVLB1T0HBLR")
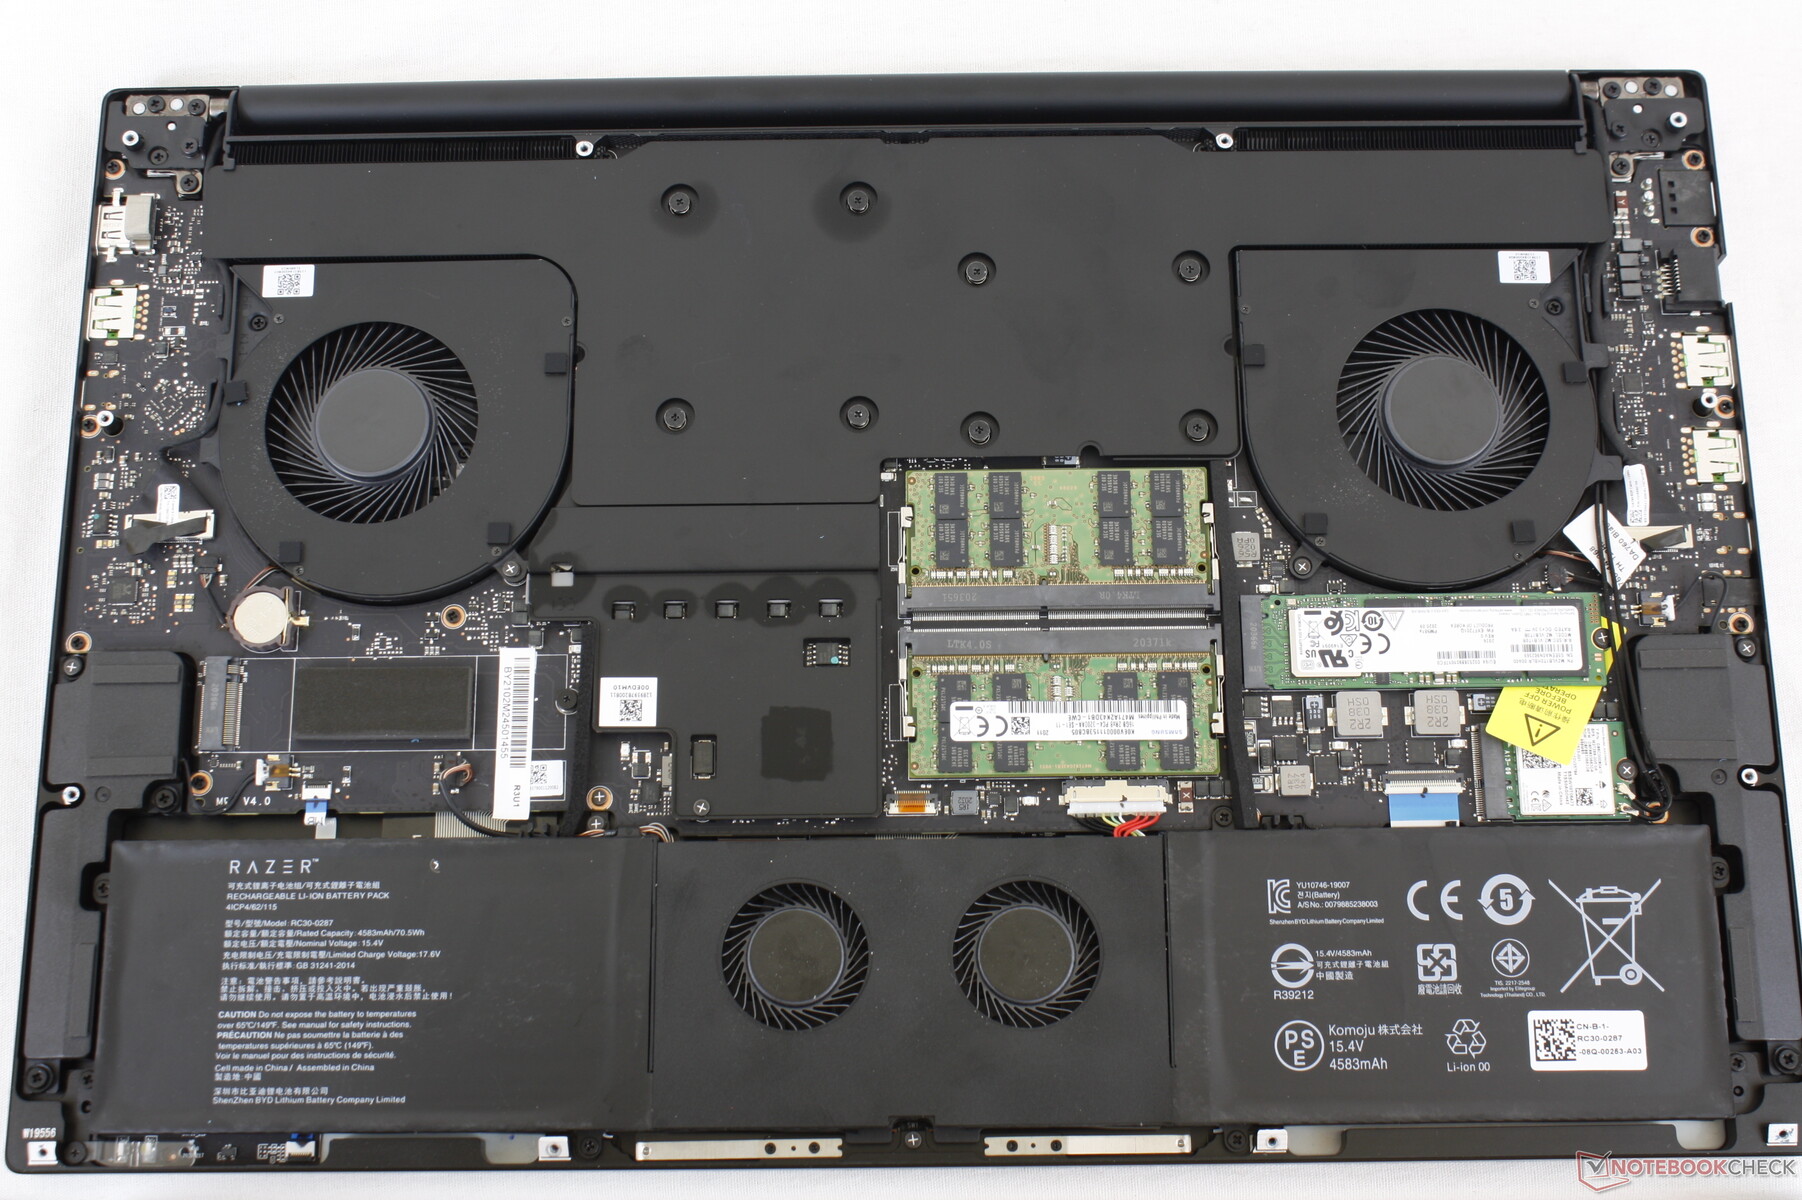
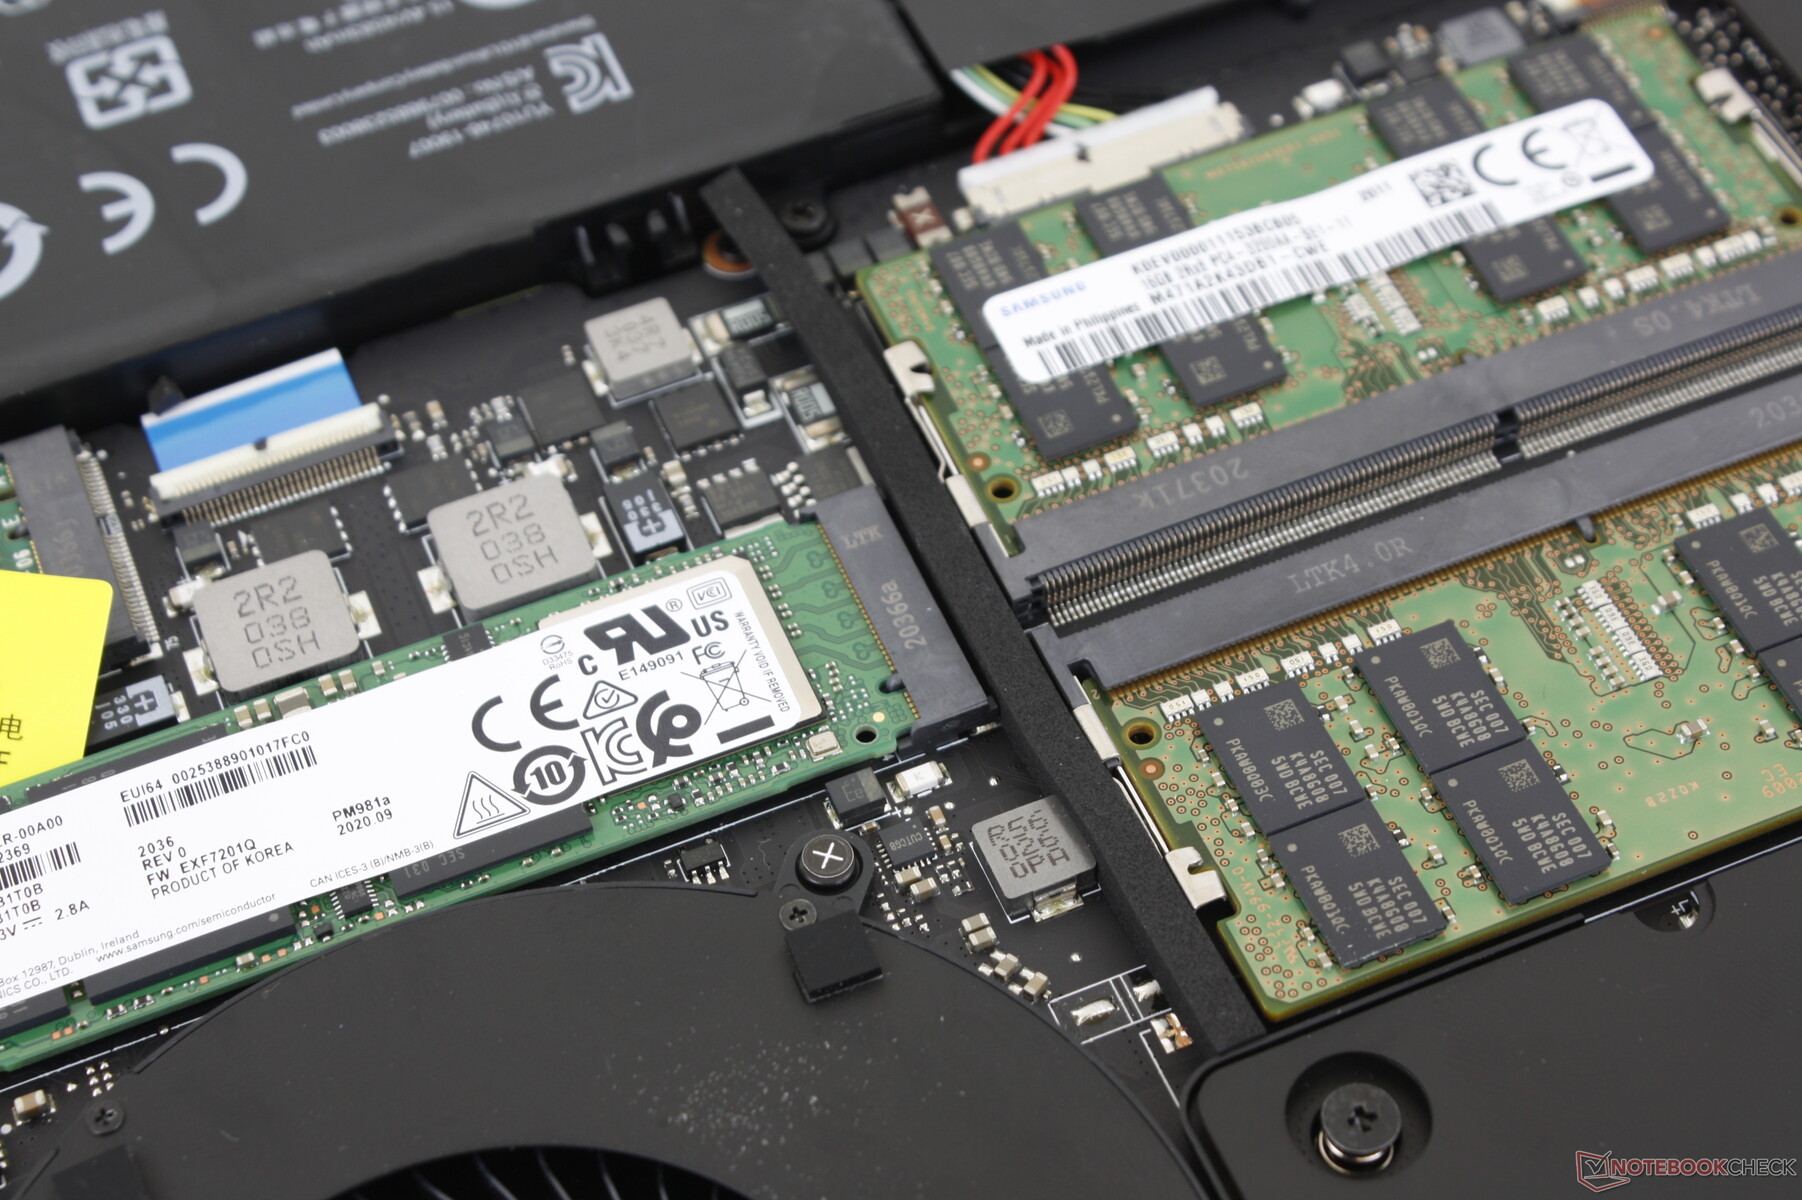
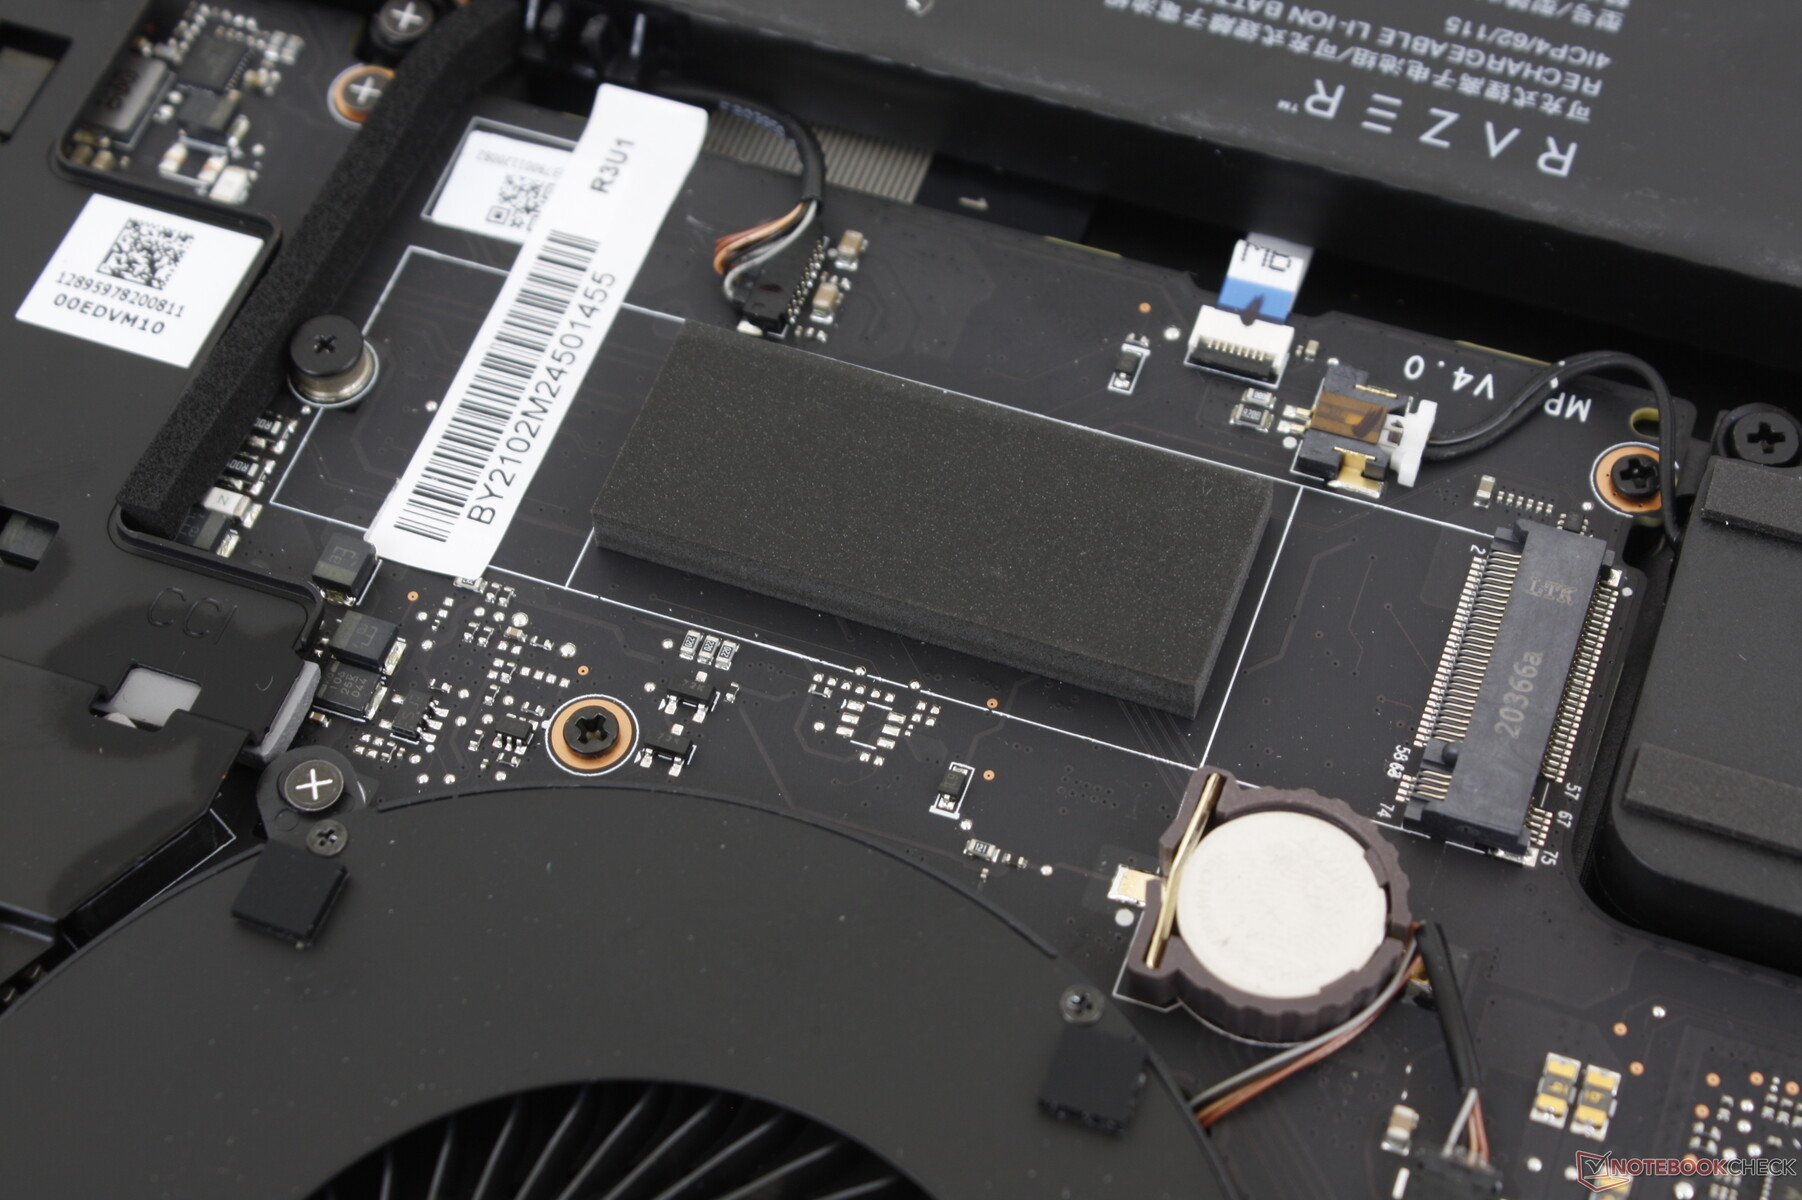
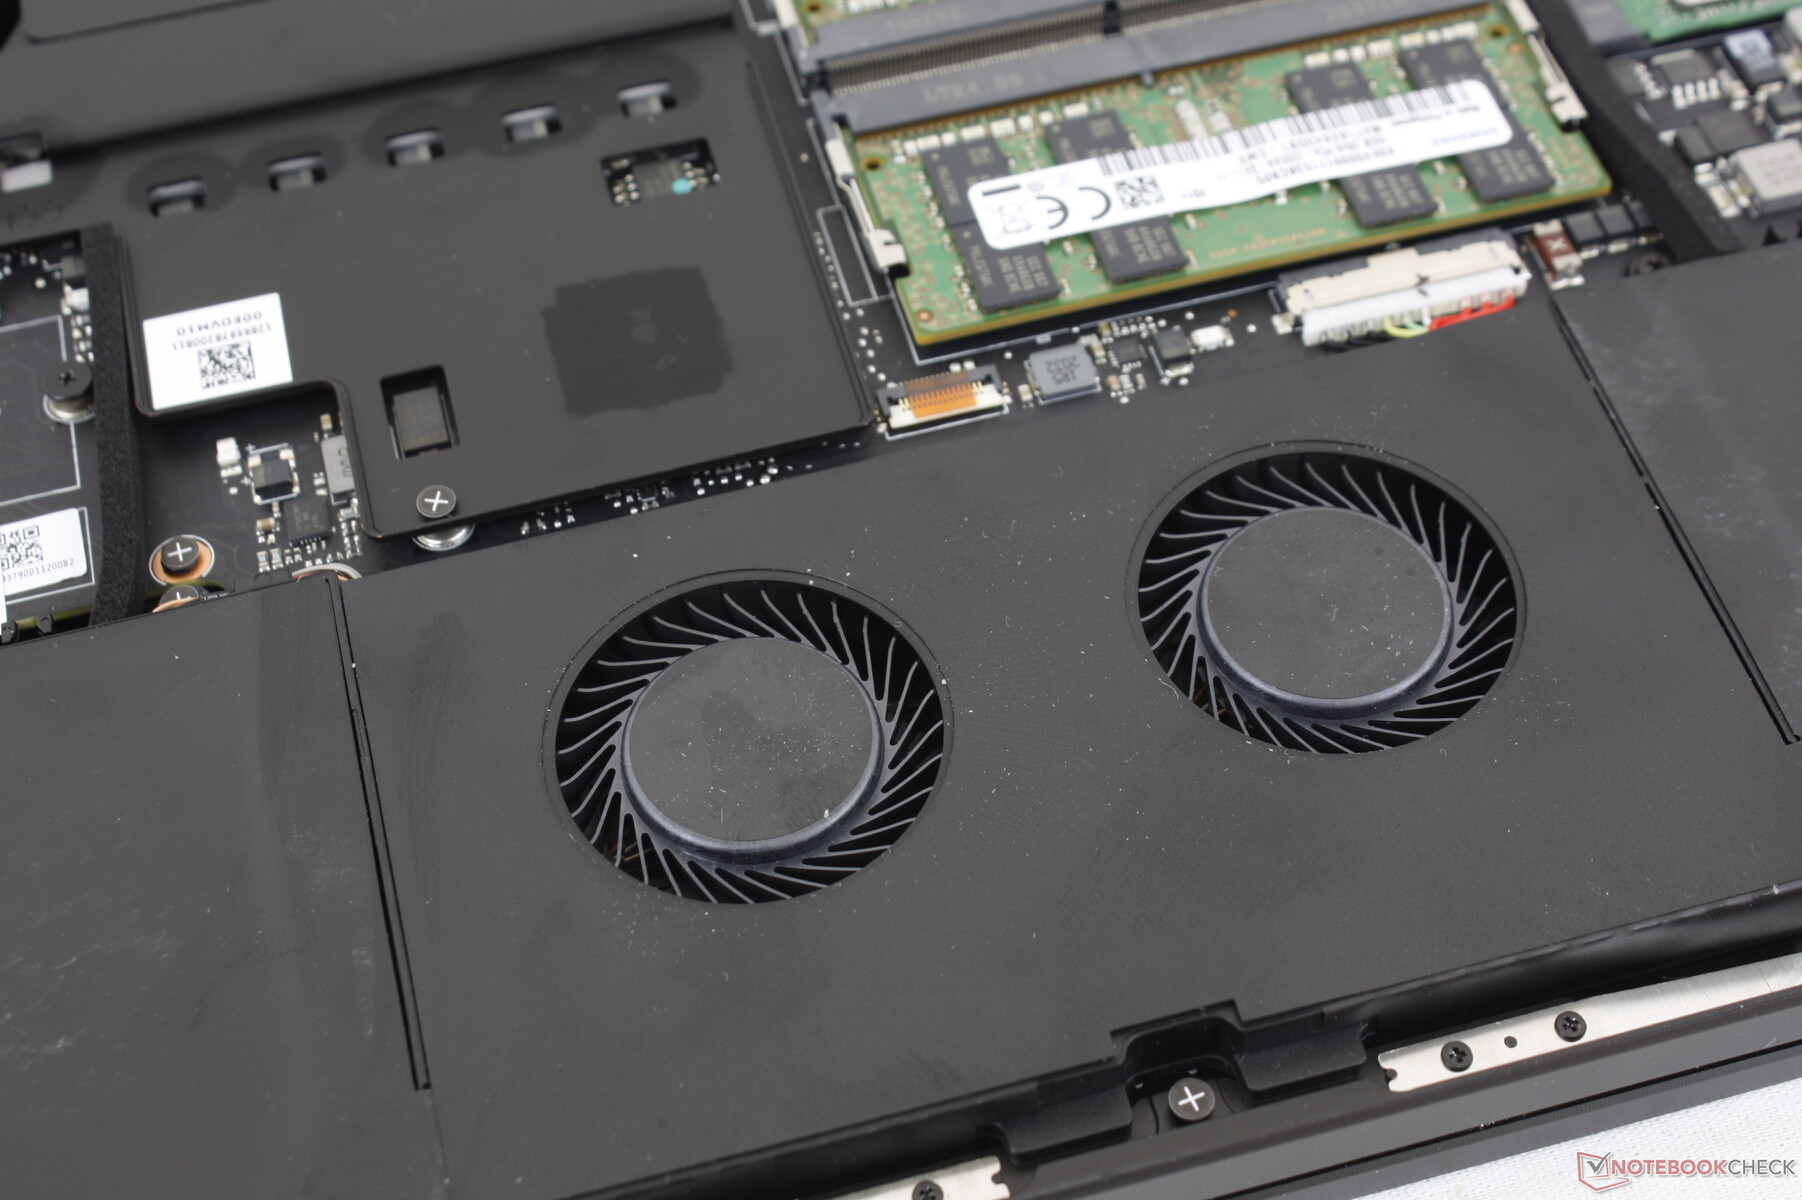
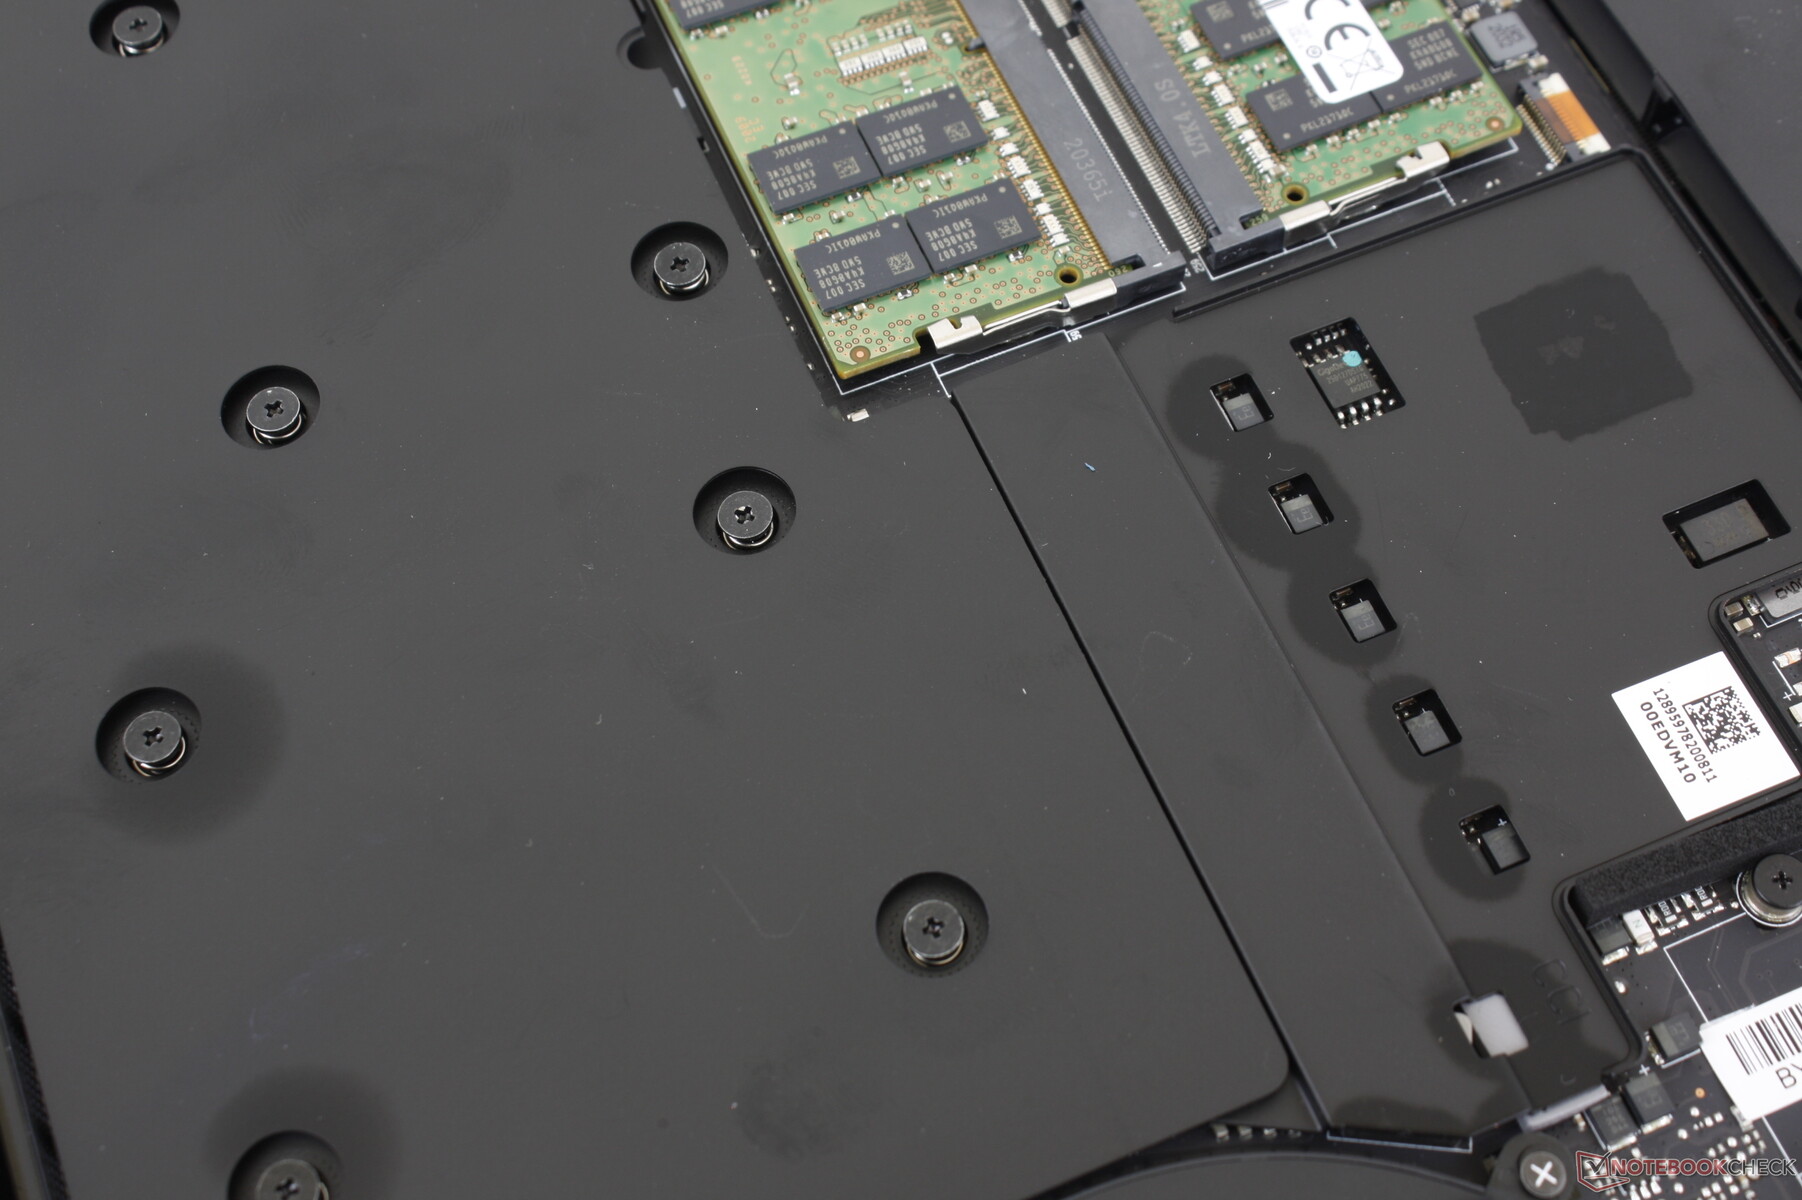
Maintenance
Accessories and Warranty
The retail box includes a small velvet cloth and a few Razer stickers in addition to the usual paper manuals. The standard one-year limited manufacturer warranty applies.
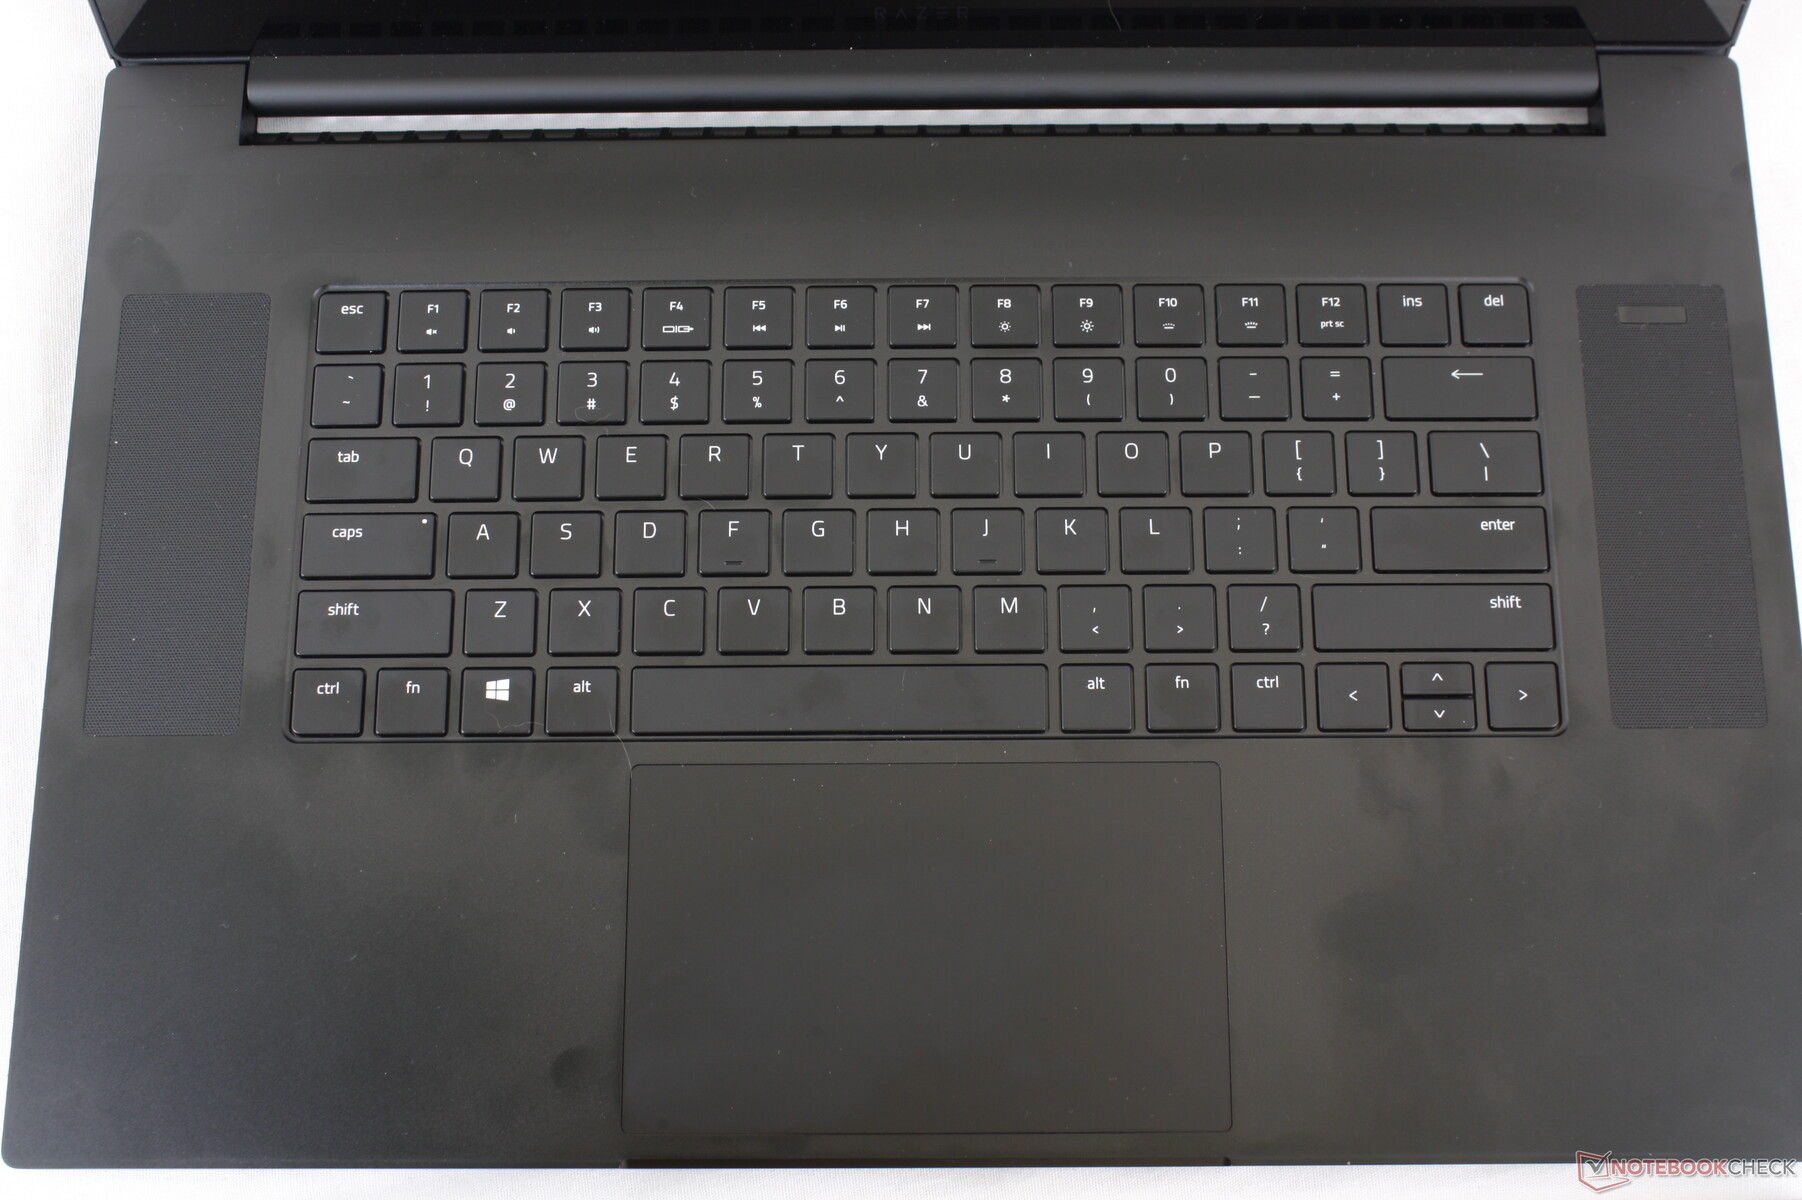
Input Devices
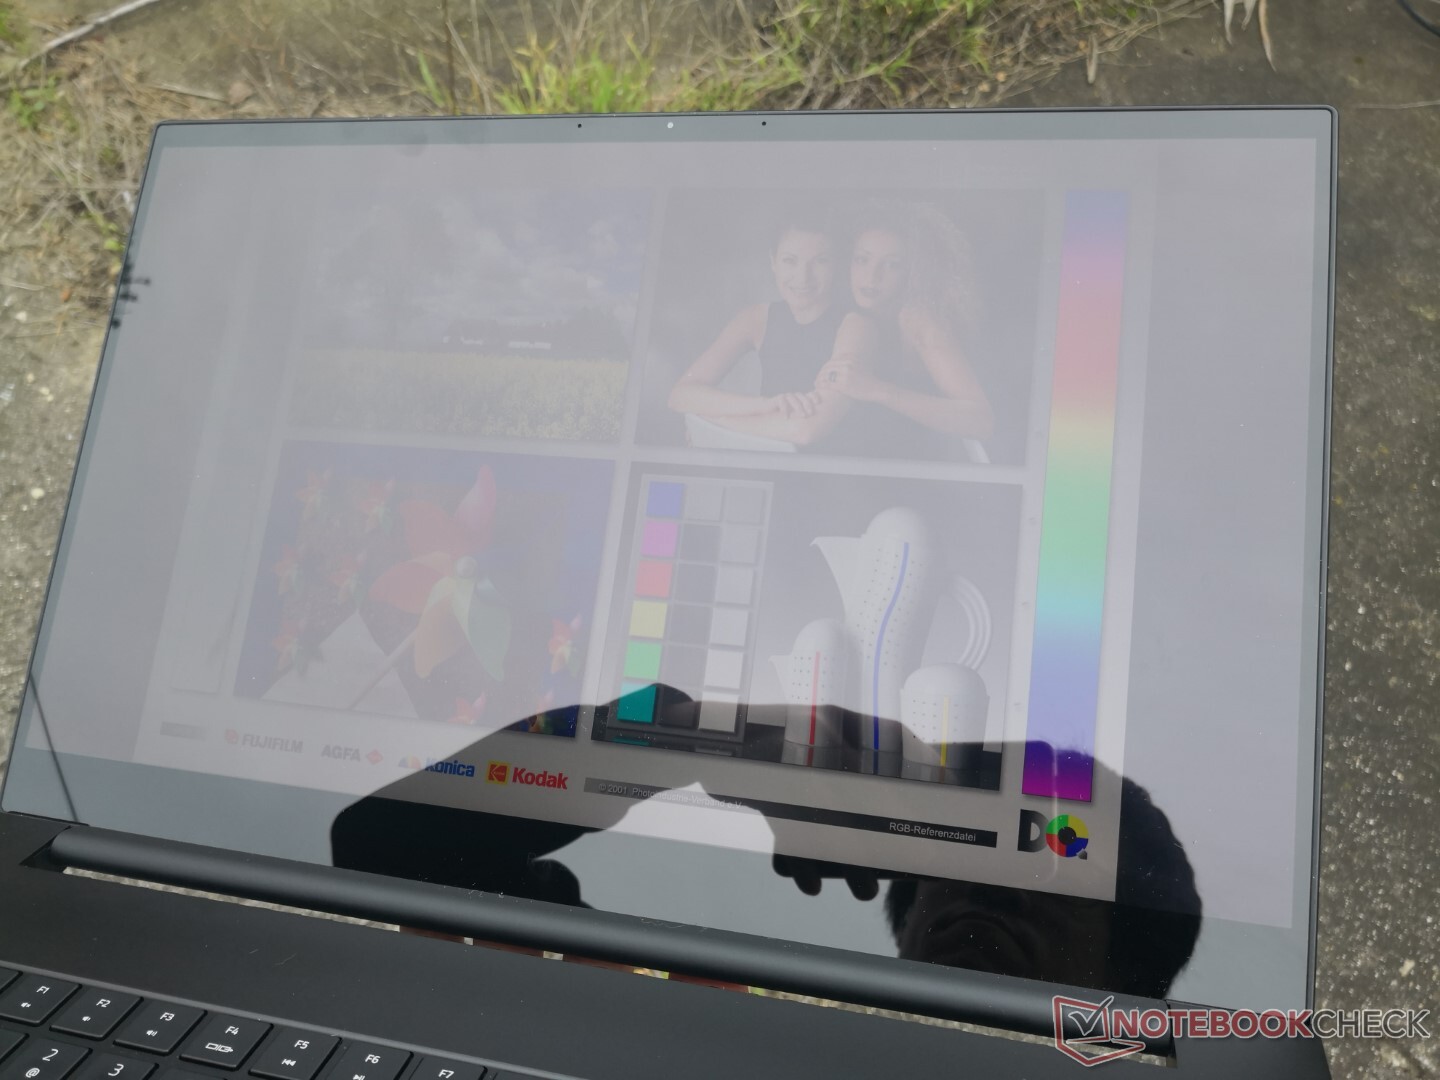
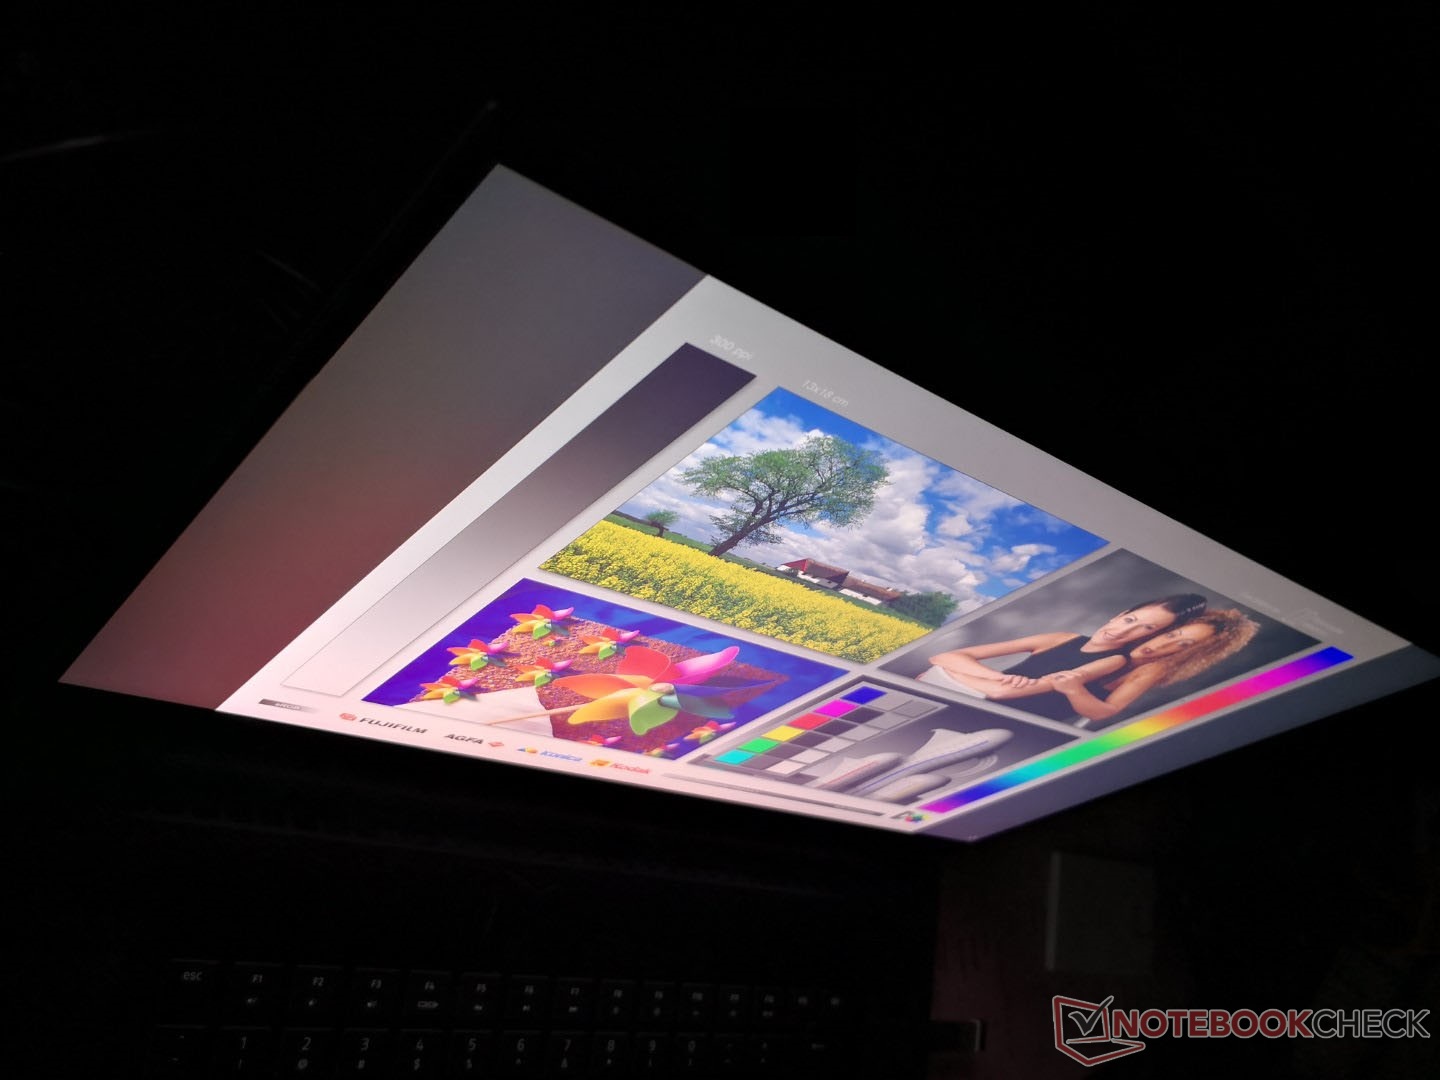
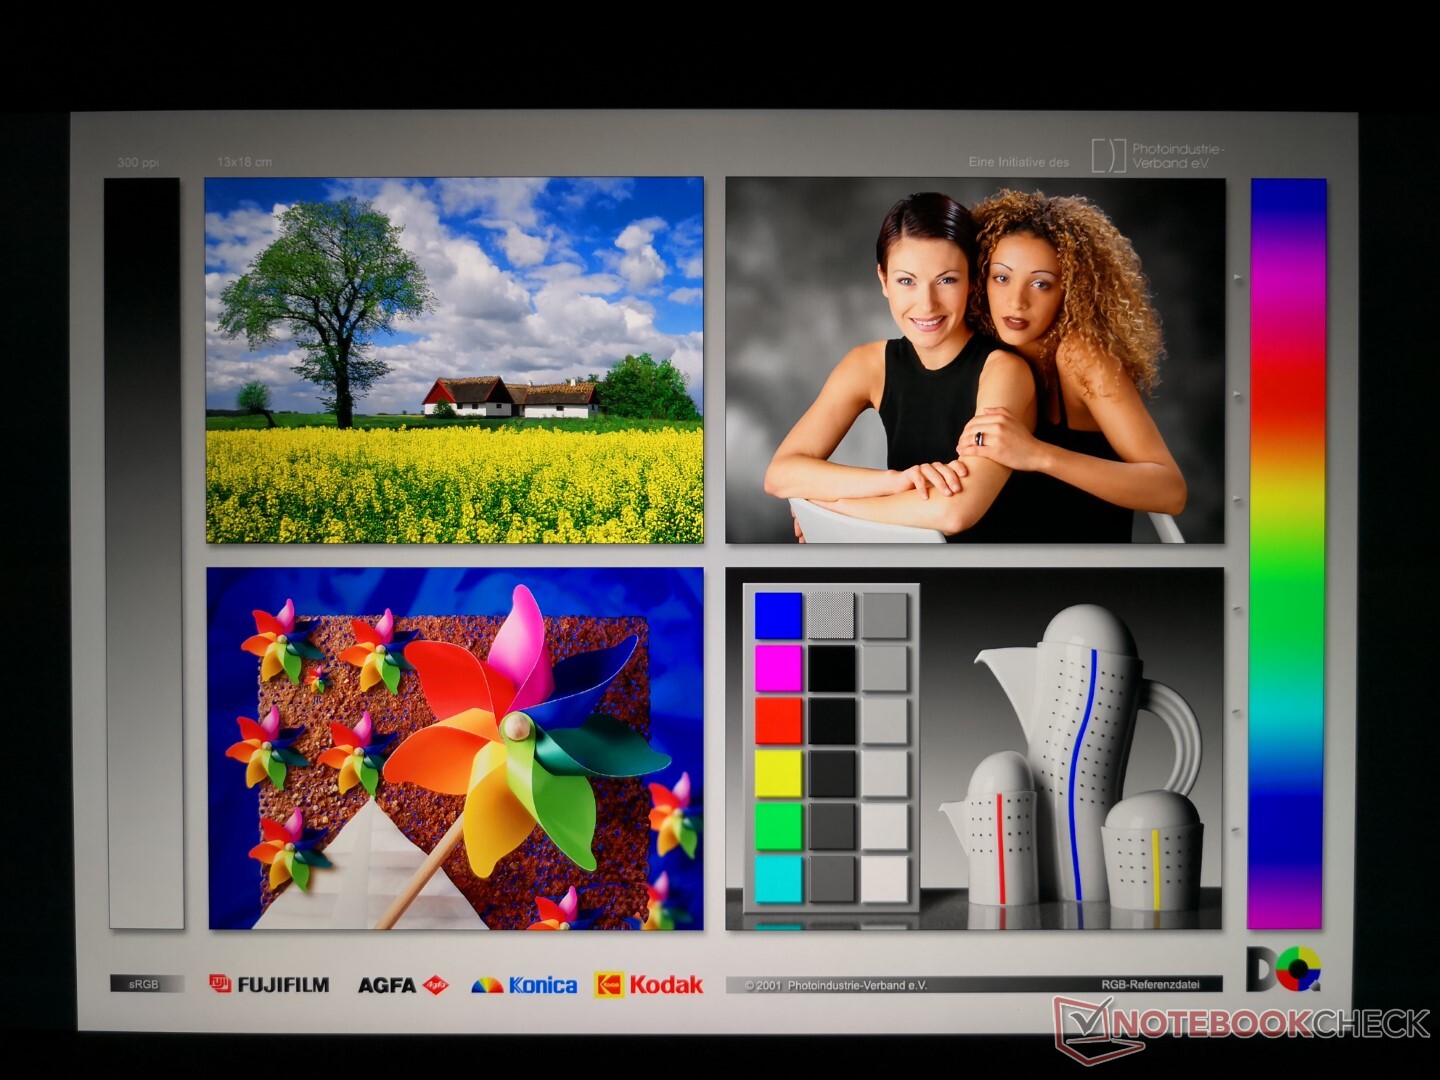
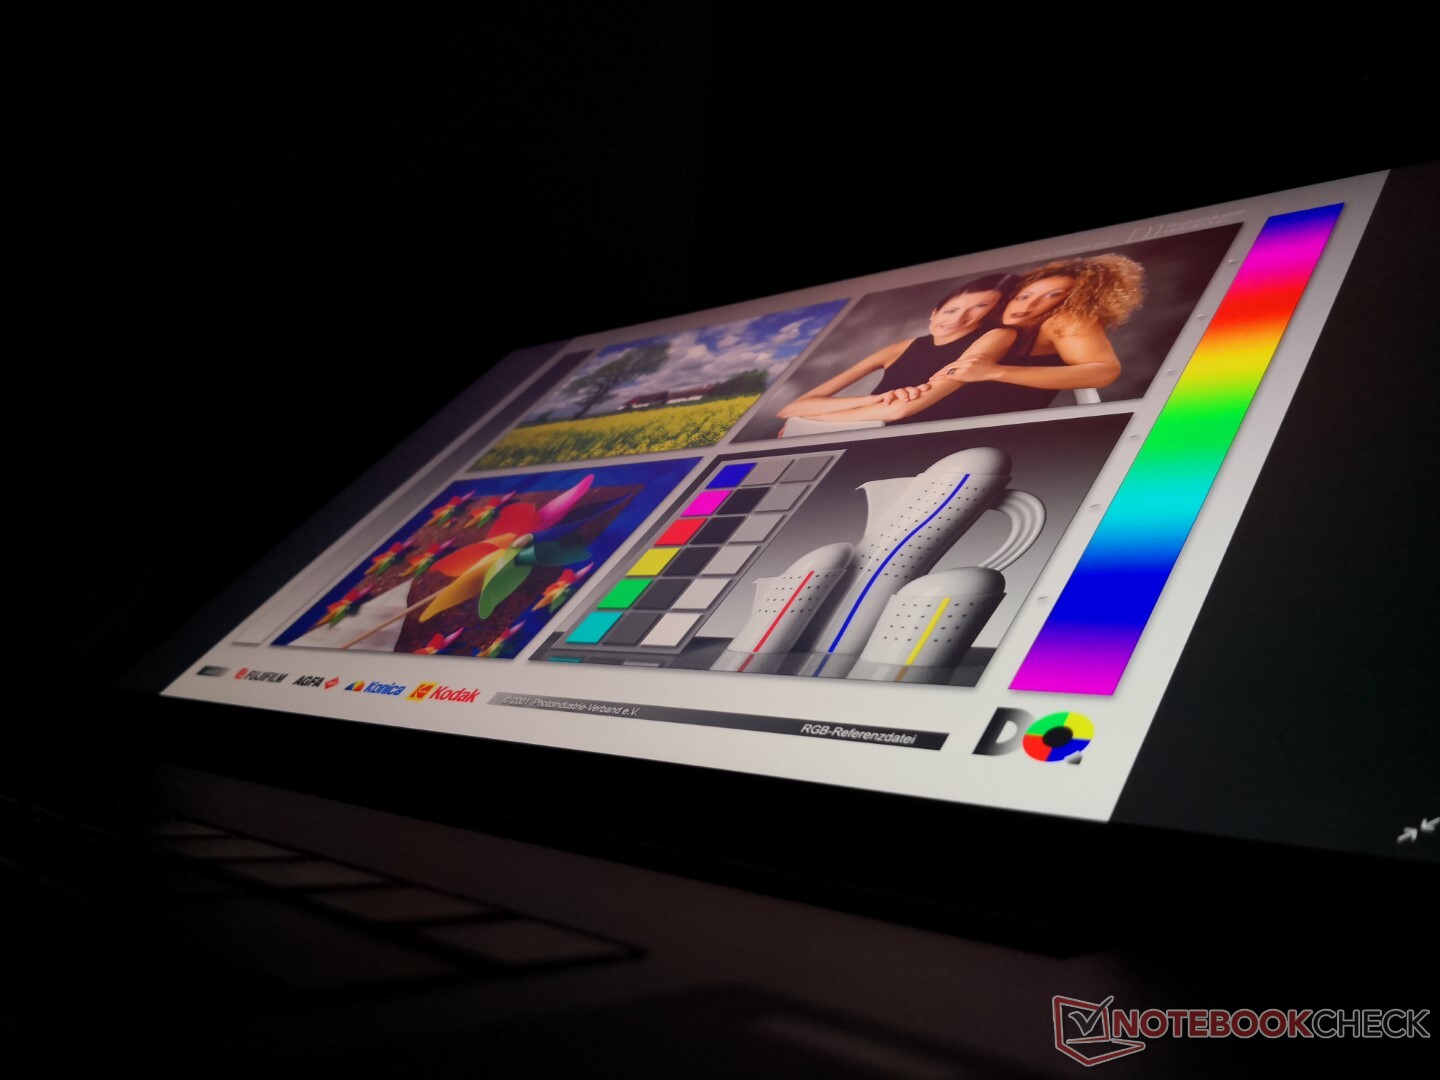
Display
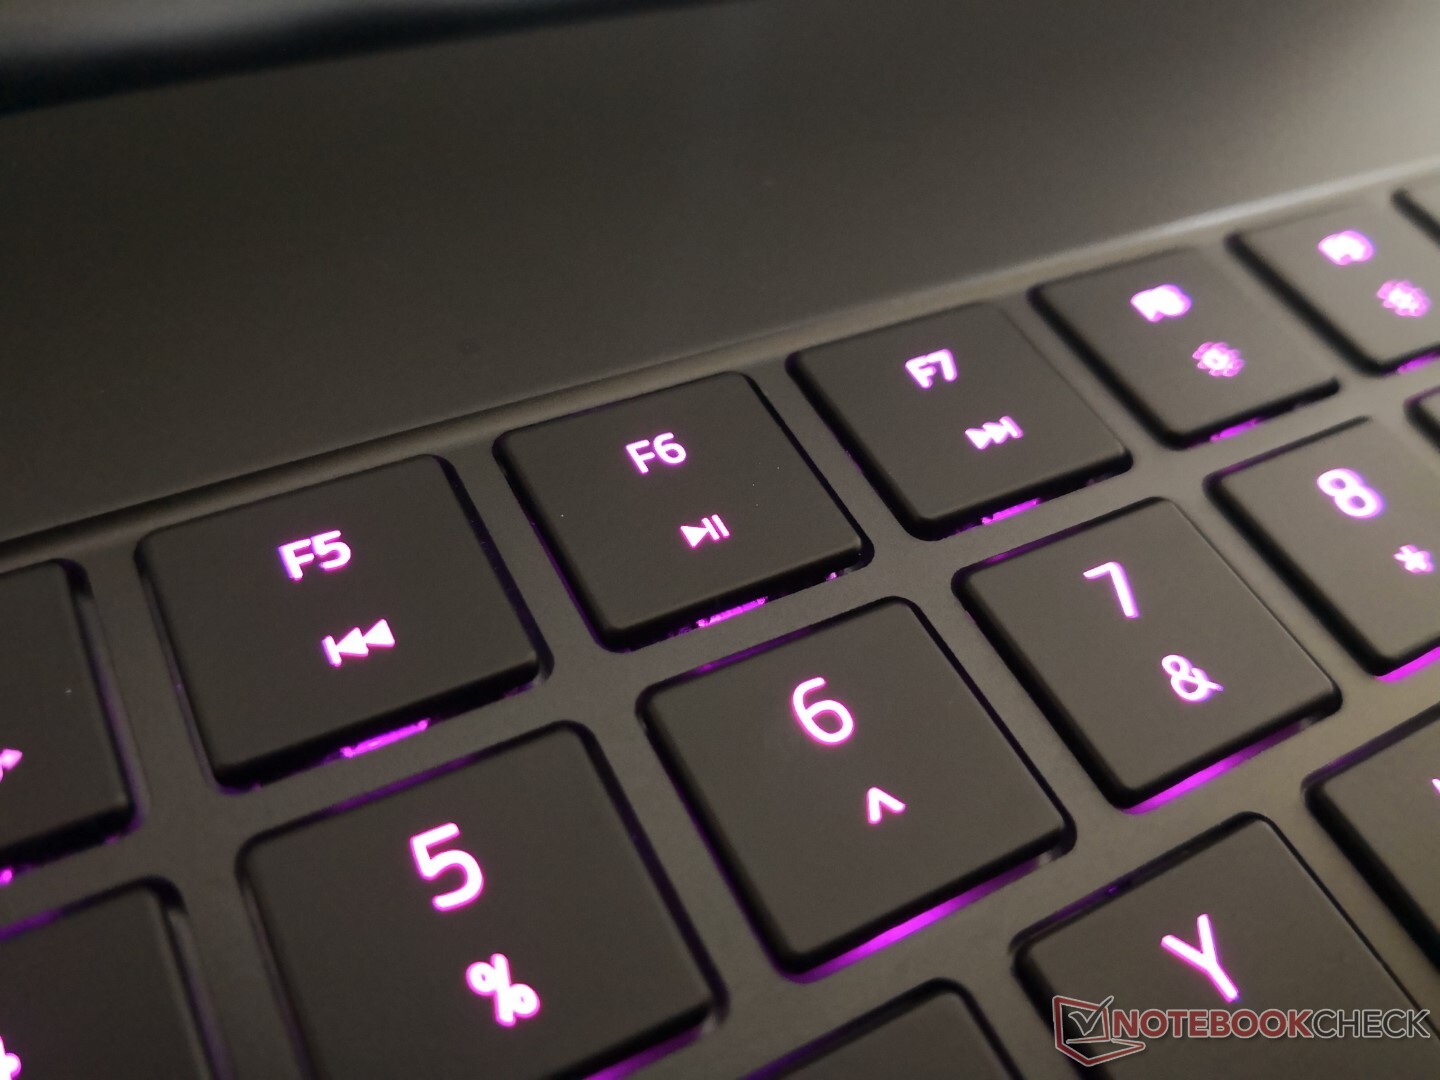
The 4K 120 Hz touchscreen on the 2021 Blade Pro series is identical to the 4K 120 Hz option on the 2020 series as both are B173ZAN03.3 IPS panels from AU Optronics. We'll have to wait for another configuration from Razer to test out the new 165 Hz 1440p panel which will inevitably exhibit different attributes than what we've recorded here on the 4K panel.
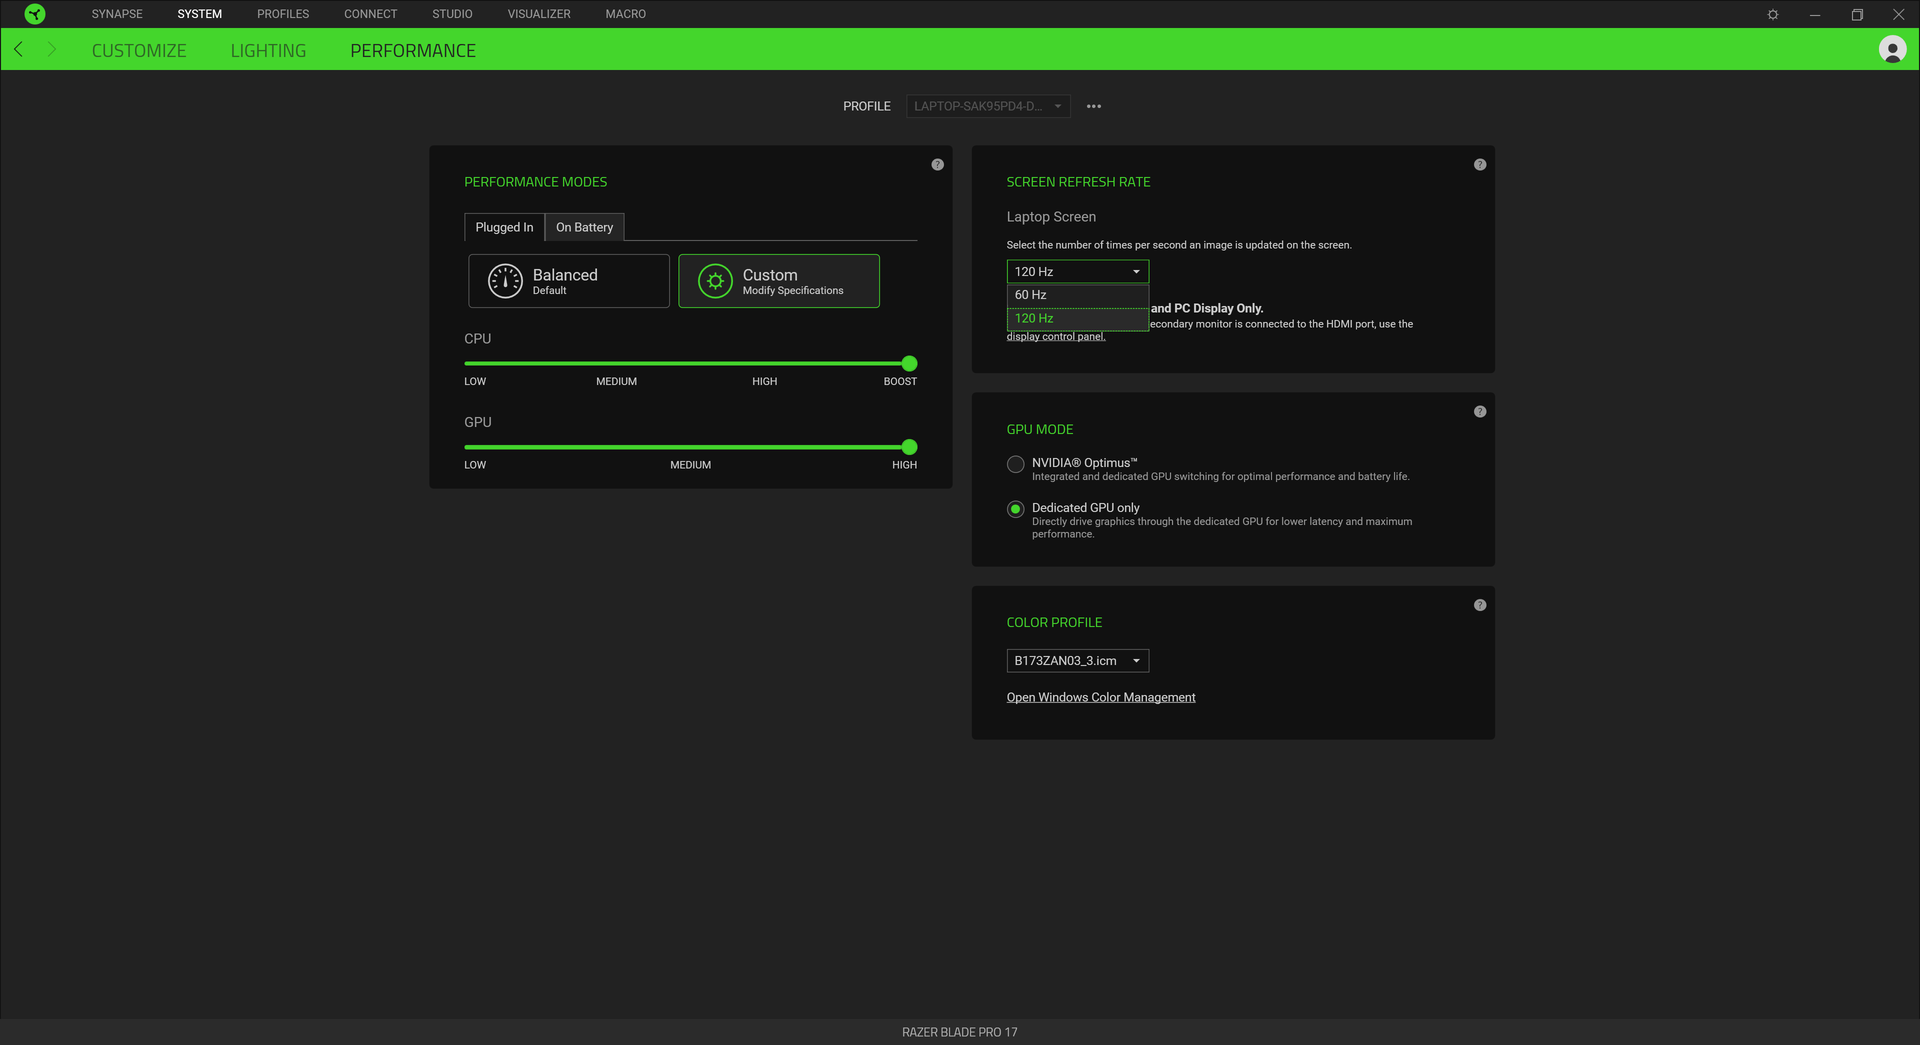
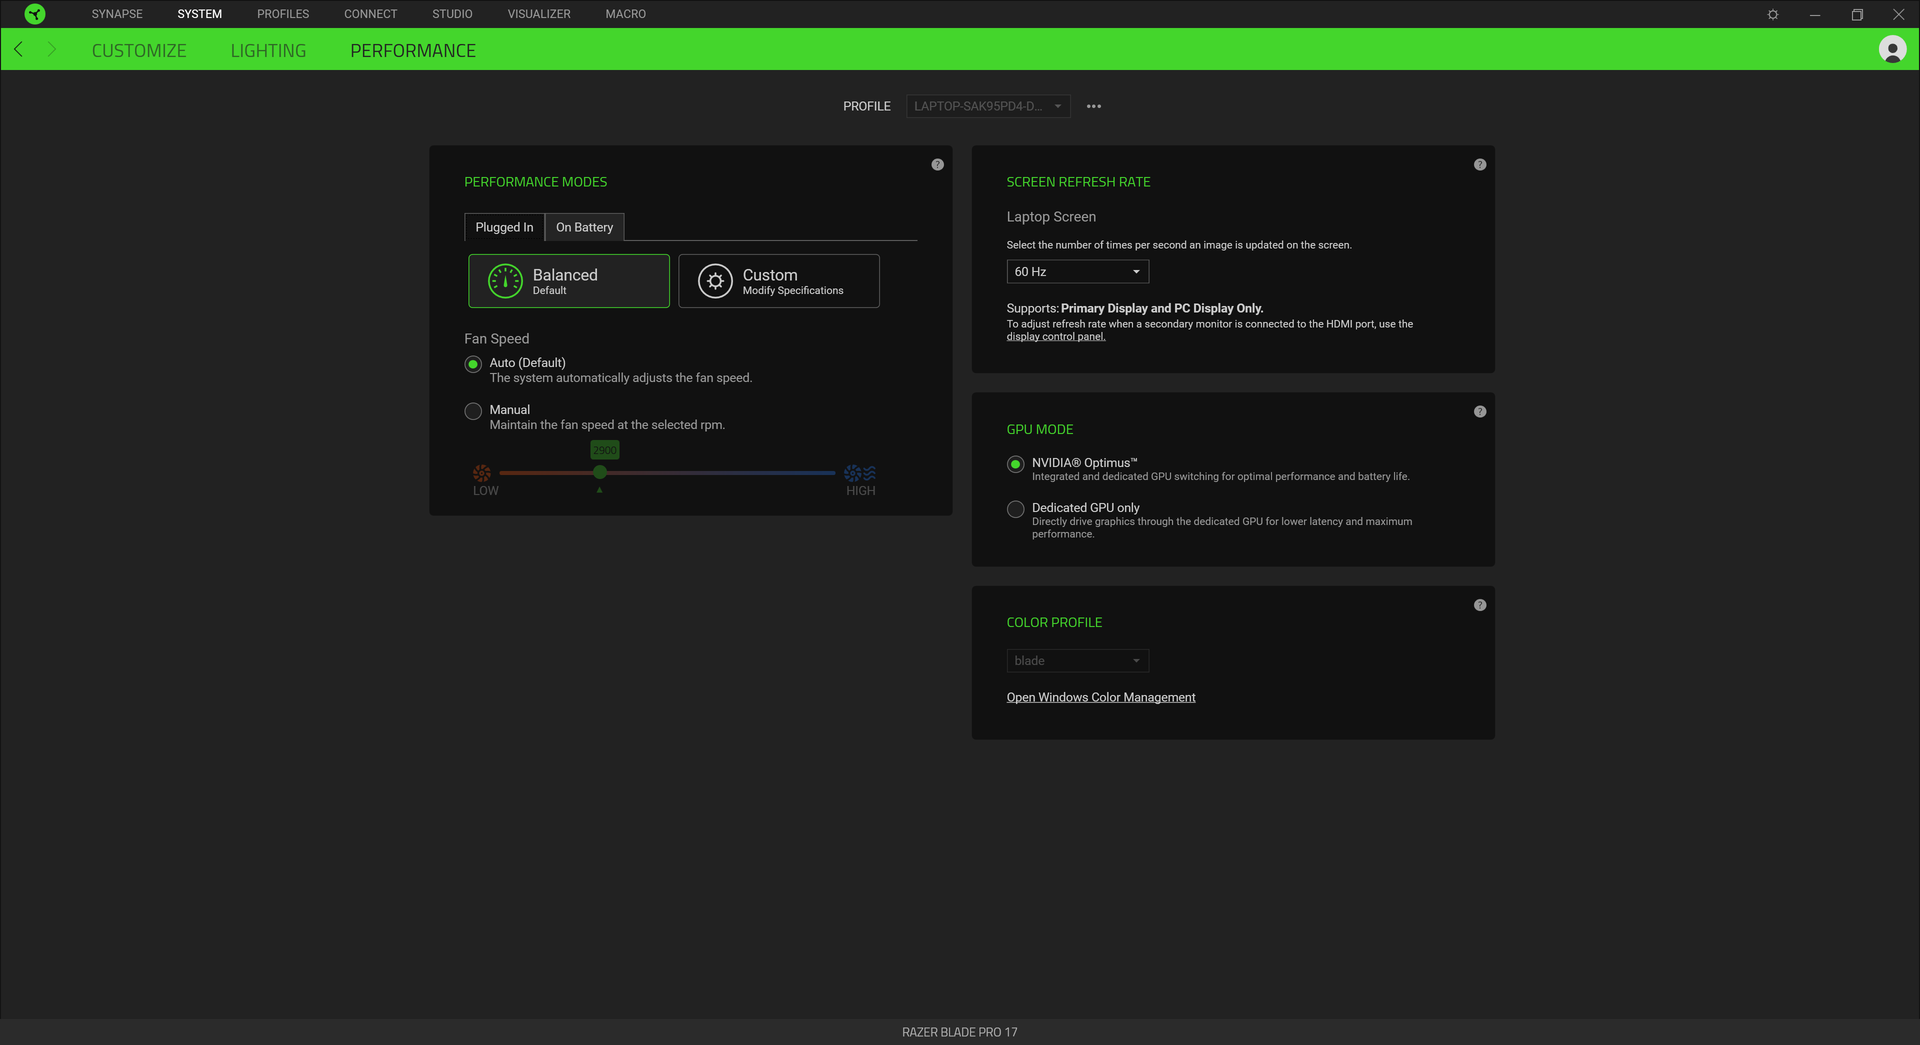
Keep in mind that 120 Hz mode is only available if the discrete GPU is active. Native refresh rate will be limited to 60 Hz if switching to the integrated GPU. A system reboot is required if users want to enable Optimus settings.


| |||||||||||||||||||||||||
Brightness Distribution: 90 %
Center on Battery: 407.2 cd/m²
Contrast: 970:1 (Black: 0.42 cd/m²)
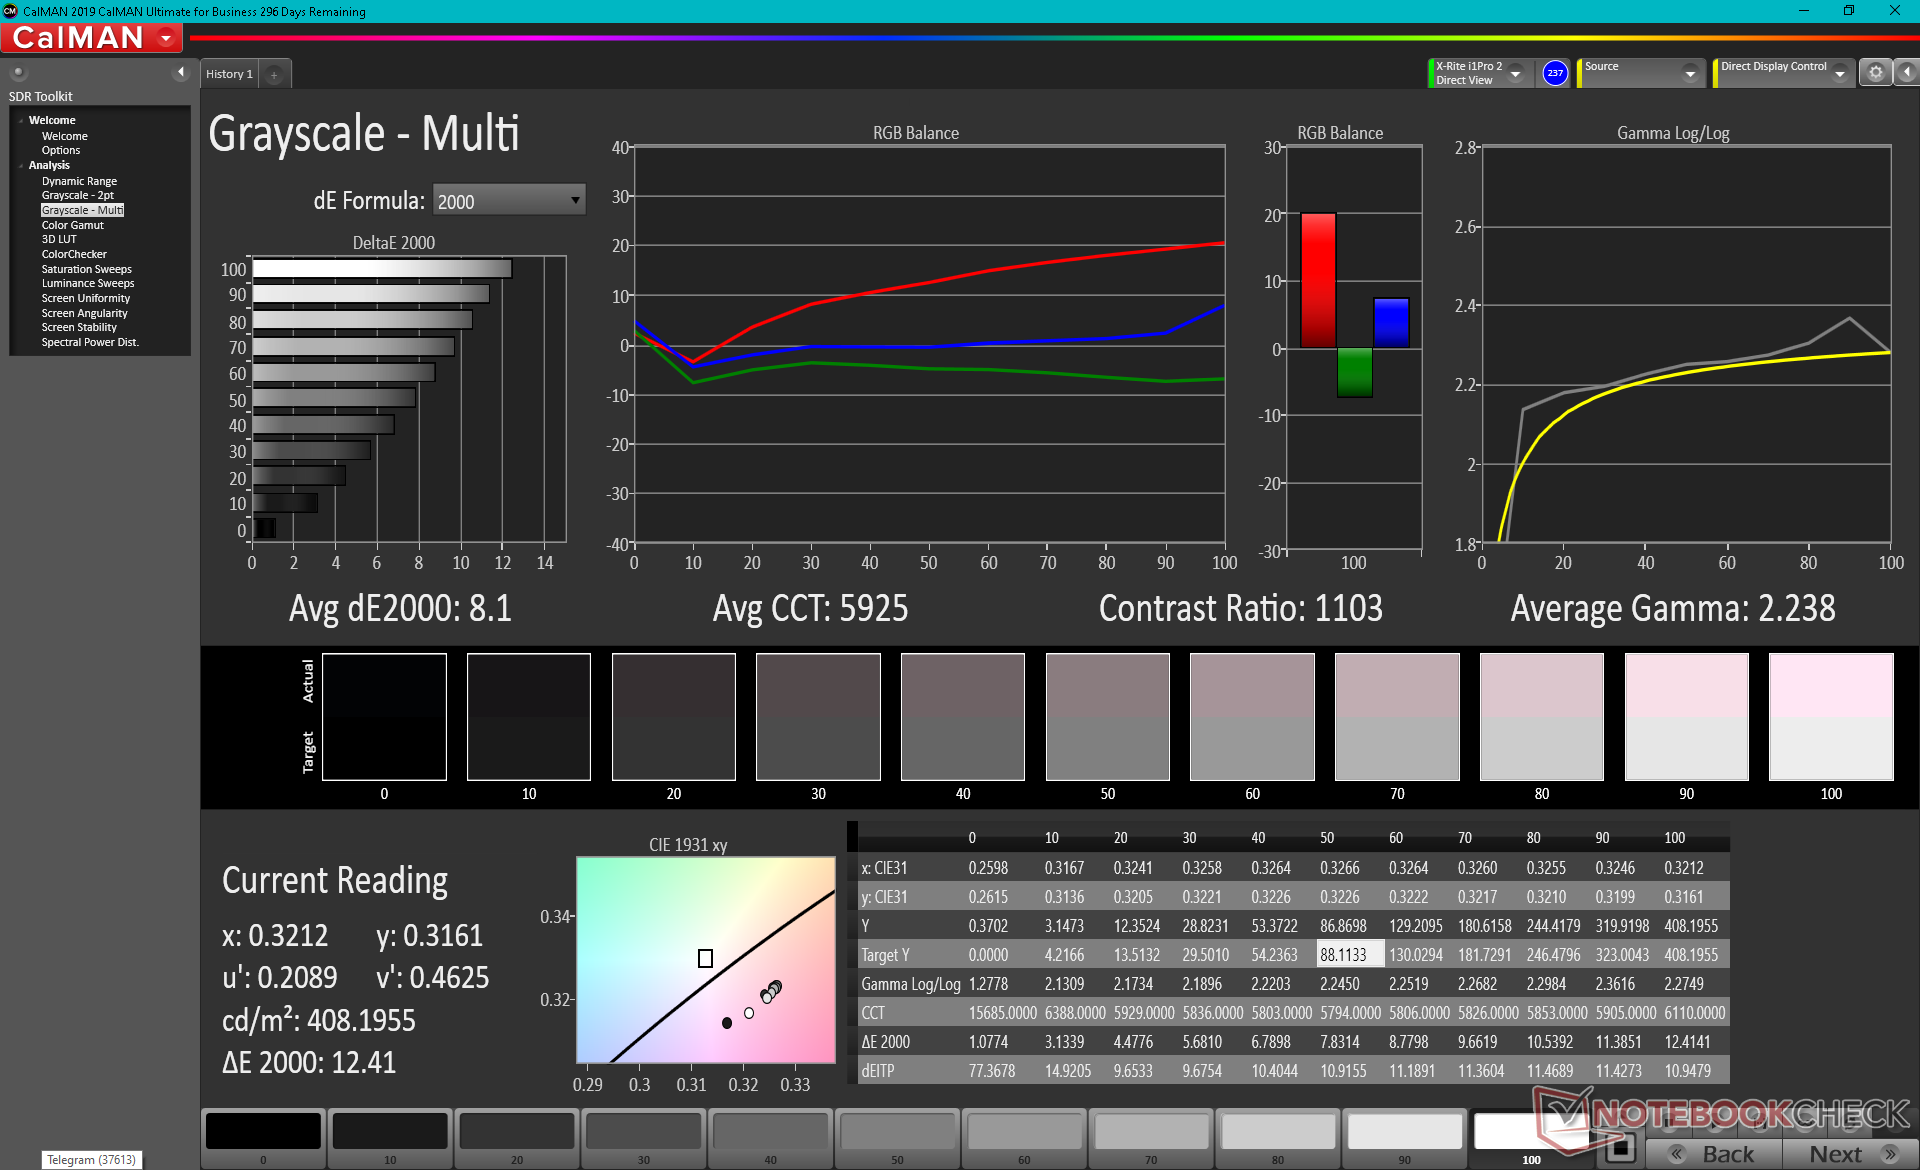
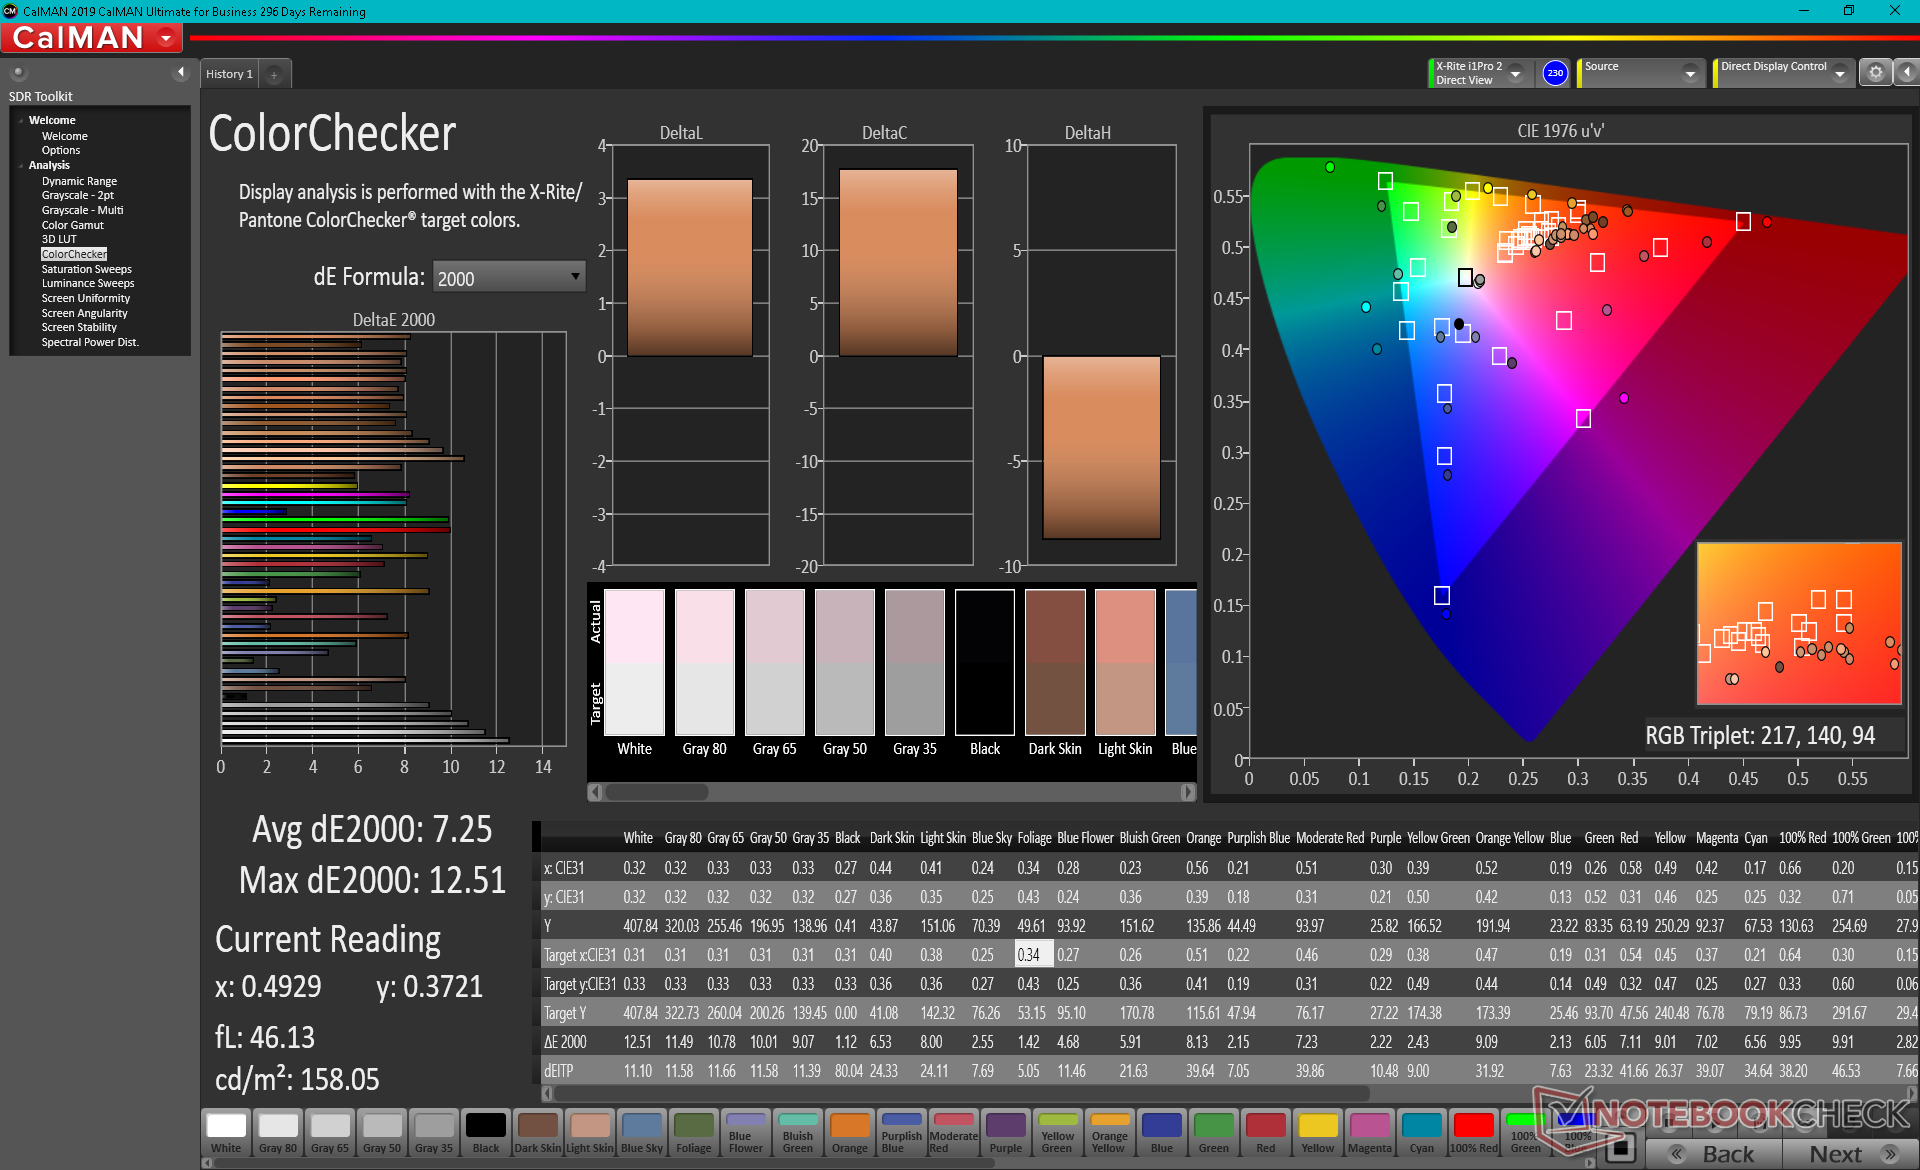
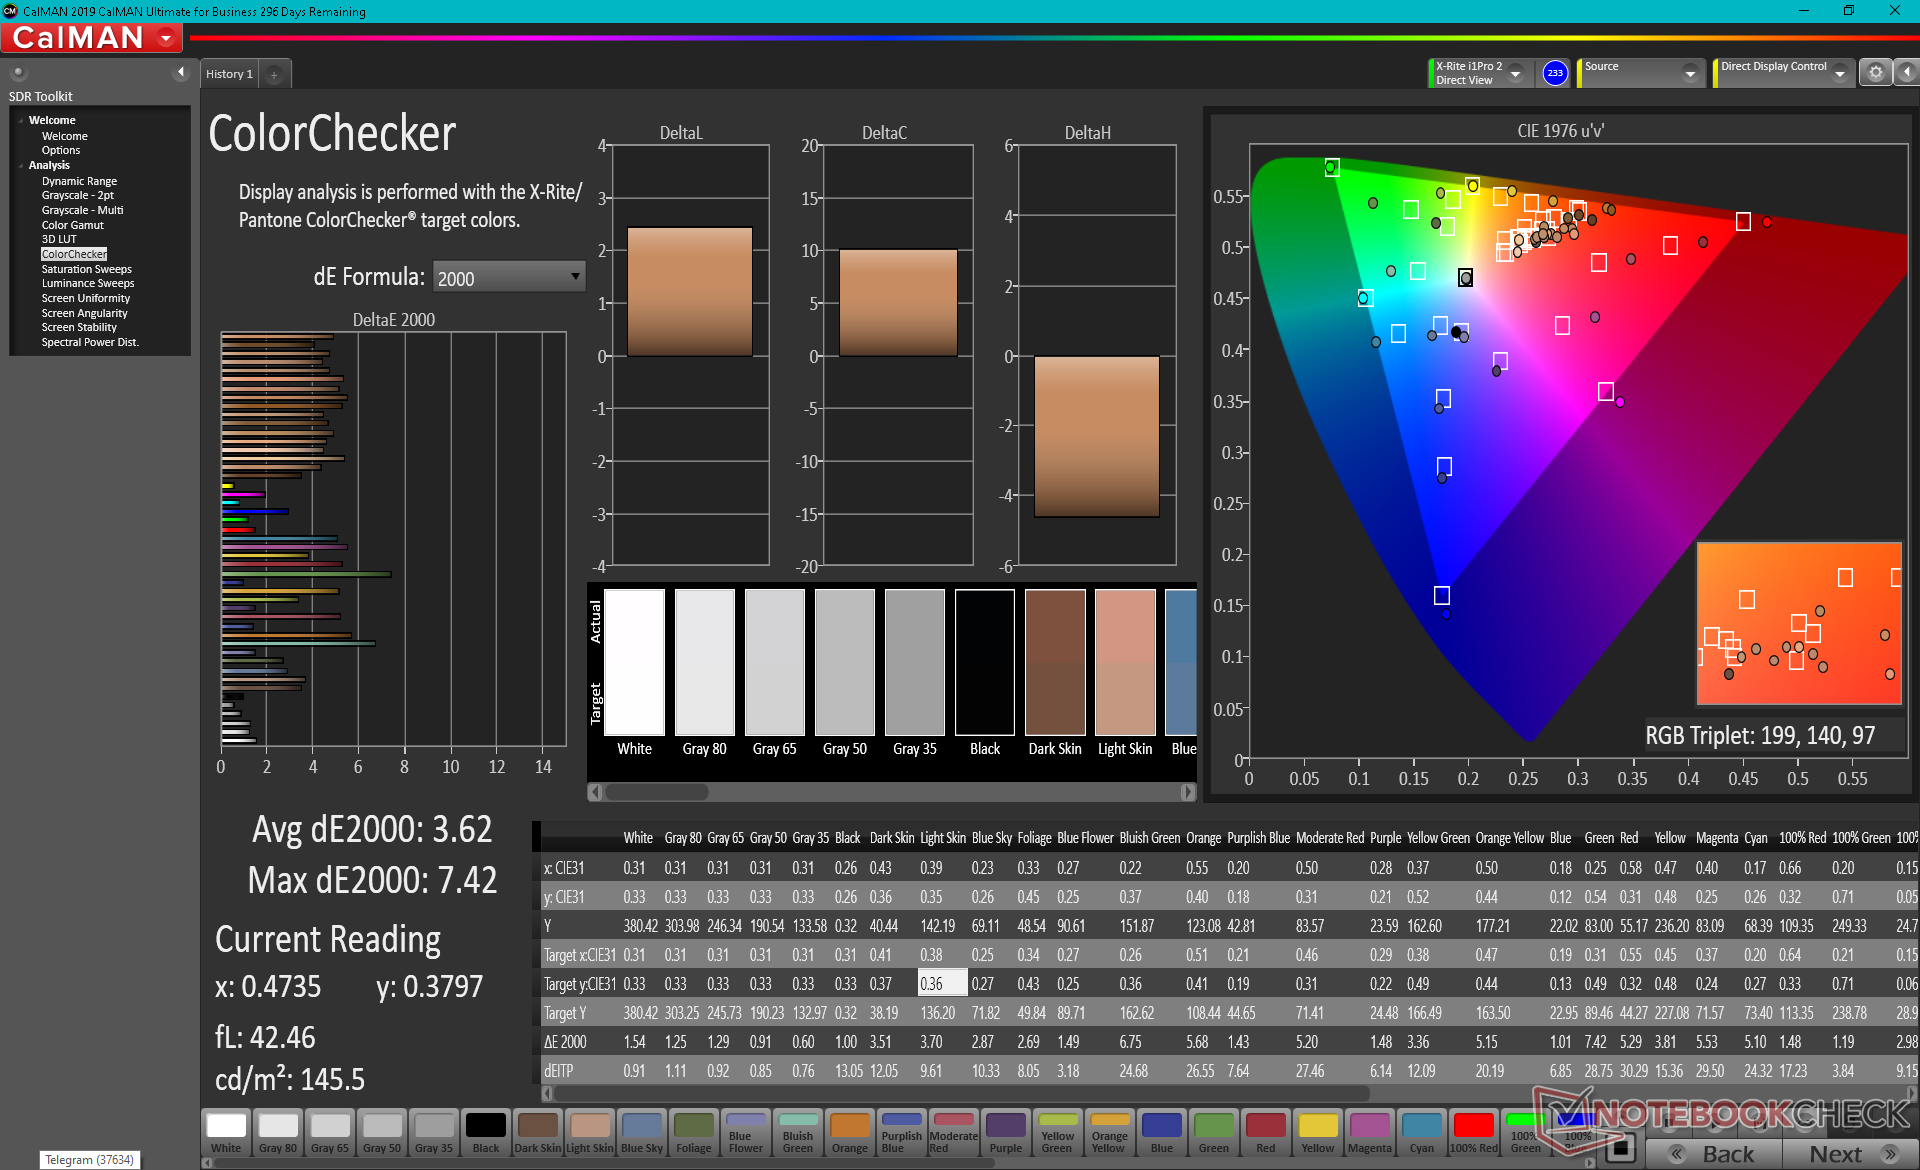
ΔE ColorChecker Calman: 7.25 | ∀{0.5-29.43 Ø4.77}
calibrated: 3.62
ΔE Greyscale Calman: 8.1 | ∀{0.09-98 Ø5}
100% sRGB (Argyll 1.6.3 3D)
88.1% AdobeRGB 1998 (Argyll 1.6.3 3D)
99.9% AdobeRGB 1998 (Argyll 3D)
100% sRGB (Argyll 3D)
88.6% Display P3 (Argyll 3D)
Gamma: 2.24
CCT: 5925 K
| Razer Blade Pro 17 2021 (QHD Touch) AU Optronics B173ZAN03.3, IPS, 17.3", 3840x2160 | Razer Blade Pro 17 RTX 2070 Max-Q 300 Hz Sharp LQ173M1JW02, IPS, 17.3", 1920x1080 | Schenker XMG Neo 17 (Early 2021, RTX 3070, 5800H) BOE NE173QHM-NY2 (BOE0977), IPS, 17.3", 2560x1440 | MSI GT76 Titan DT 10SGS AU Optronics B173ZAN03.3, IPS, 17.3", 3840x2160 | Asus Strix G17 G712LWS LG Philips LP173WFG-SPB3, IPS, 17.3", 1920x1080 | MSI GS75 10SF-609US Sharp LQ173M1JW05, IPS, 17.3", 1920x1080 | |
|---|---|---|---|---|---|---|
| Display | -16% | -16% | -4% | -21% | -13% | |
| Display P3 Coverage (%) | 88.6 | 72.2 -19% | 70.5 -20% | 82.5 -7% | 65.2 -26% | 75.6 -15% |
| sRGB Coverage (%) | 100 | 98.5 -1% | 99.5 0% | 98 -2% | 96.8 -3% | 99.8 0% |
| AdobeRGB 1998 Coverage (%) | 99.9 | 73 -27% | 71.8 -28% | 96.6 -3% | 66.4 -34% | 75.1 -25% |
| Response Times | 42% | 3% | -25% | 9% | 56% | |
| Response Time Grey 50% / Grey 80% * (ms) | 15.2 ? | 5.6 ? 63% | 16.8 ? -11% | 23.2 ? -53% | 14.4 ? 5% | 5 ? 67% |
| Response Time Black / White * (ms) | 12 ? | 9.6 ? 20% | 10 ? 17% | 11.6 ? 3% | 10.4 ? 13% | 6.6 ? 45% |
| PWM Frequency (Hz) | ||||||
| Screen | 5% | 23% | 18% | 16% | 19% | |
| Brightness middle (cd/m²) | 407.2 | 328 -19% | 410 1% | 419.5 3% | 323 -21% | 299.4 -26% |
| Brightness (cd/m²) | 403 | 329 -18% | 381 -5% | 413 2% | 300 -26% | 299 -26% |
| Brightness Distribution (%) | 90 | 78 -13% | 88 -2% | 93 3% | 89 -1% | 84 -7% |
| Black Level * (cd/m²) | 0.42 | 0.35 17% | 0.37 12% | 0.4 5% | 0.31 26% | 0.31 26% |
| Contrast (:1) | 970 | 937 -3% | 1108 14% | 1049 8% | 1042 7% | 966 0% |
| Colorchecker dE 2000 * | 7.25 | 4.74 35% | 2.55 65% | 3.4 53% | 3.01 58% | 1.82 75% |
| Colorchecker dE 2000 max. * | 12.51 | 8.99 28% | 4.33 65% | 7.4 41% | 7.65 39% | 3.91 69% |
| Colorchecker dE 2000 calibrated * | 3.62 | 2.12 41% | 1.28 65% | 3.28 9% | 1 72% | 1.59 56% |
| Greyscale dE 2000 * | 8.1 | 6.8 16% | 3.4 58% | 2 75% | 3.8 53% | 2.7 67% |
| Gamma | 2.24 98% | 2.2 100% | 2.275 97% | 2.14 103% | 2.154 102% | 2.18 101% |
| CCT | 5925 110% | 6446 101% | 6637 98% | 6858 95% | 7507 87% | 6837 95% |
| Color Space (Percent of AdobeRGB 1998) (%) | 88.1 | 64.8 -26% | 72 -18% | 84.6 -4% | 66 -25% | 67.1 -24% |
| Color Space (Percent of sRGB) (%) | 100 | 98.6 -1% | 95 -5% | 97.9 -2% | 90 -10% | 99.8 0% |
| Total Average (Program / Settings) | 10% /
6% | 3% /
13% | -4% /
8% | 1% /
8% | 21% /
18% |
* ... smaller is better
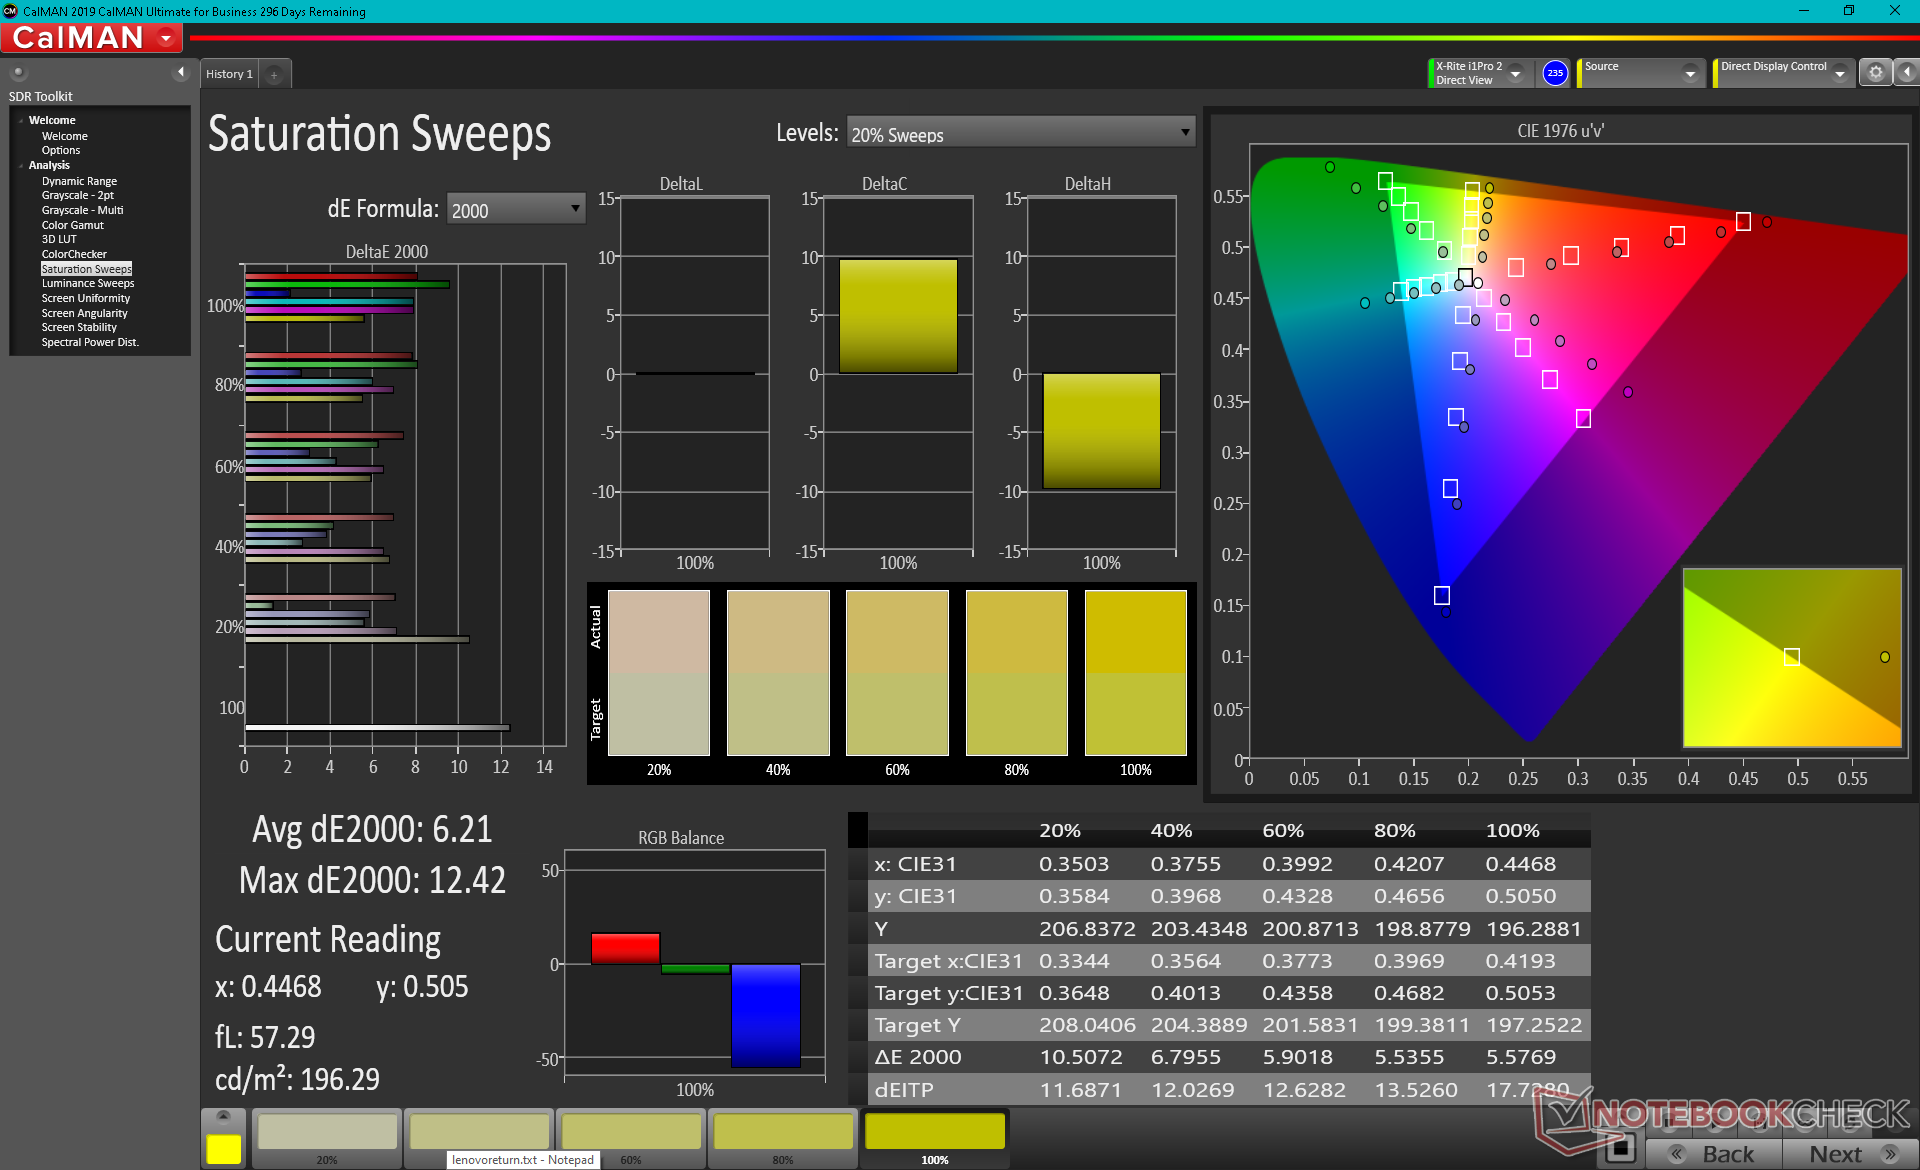
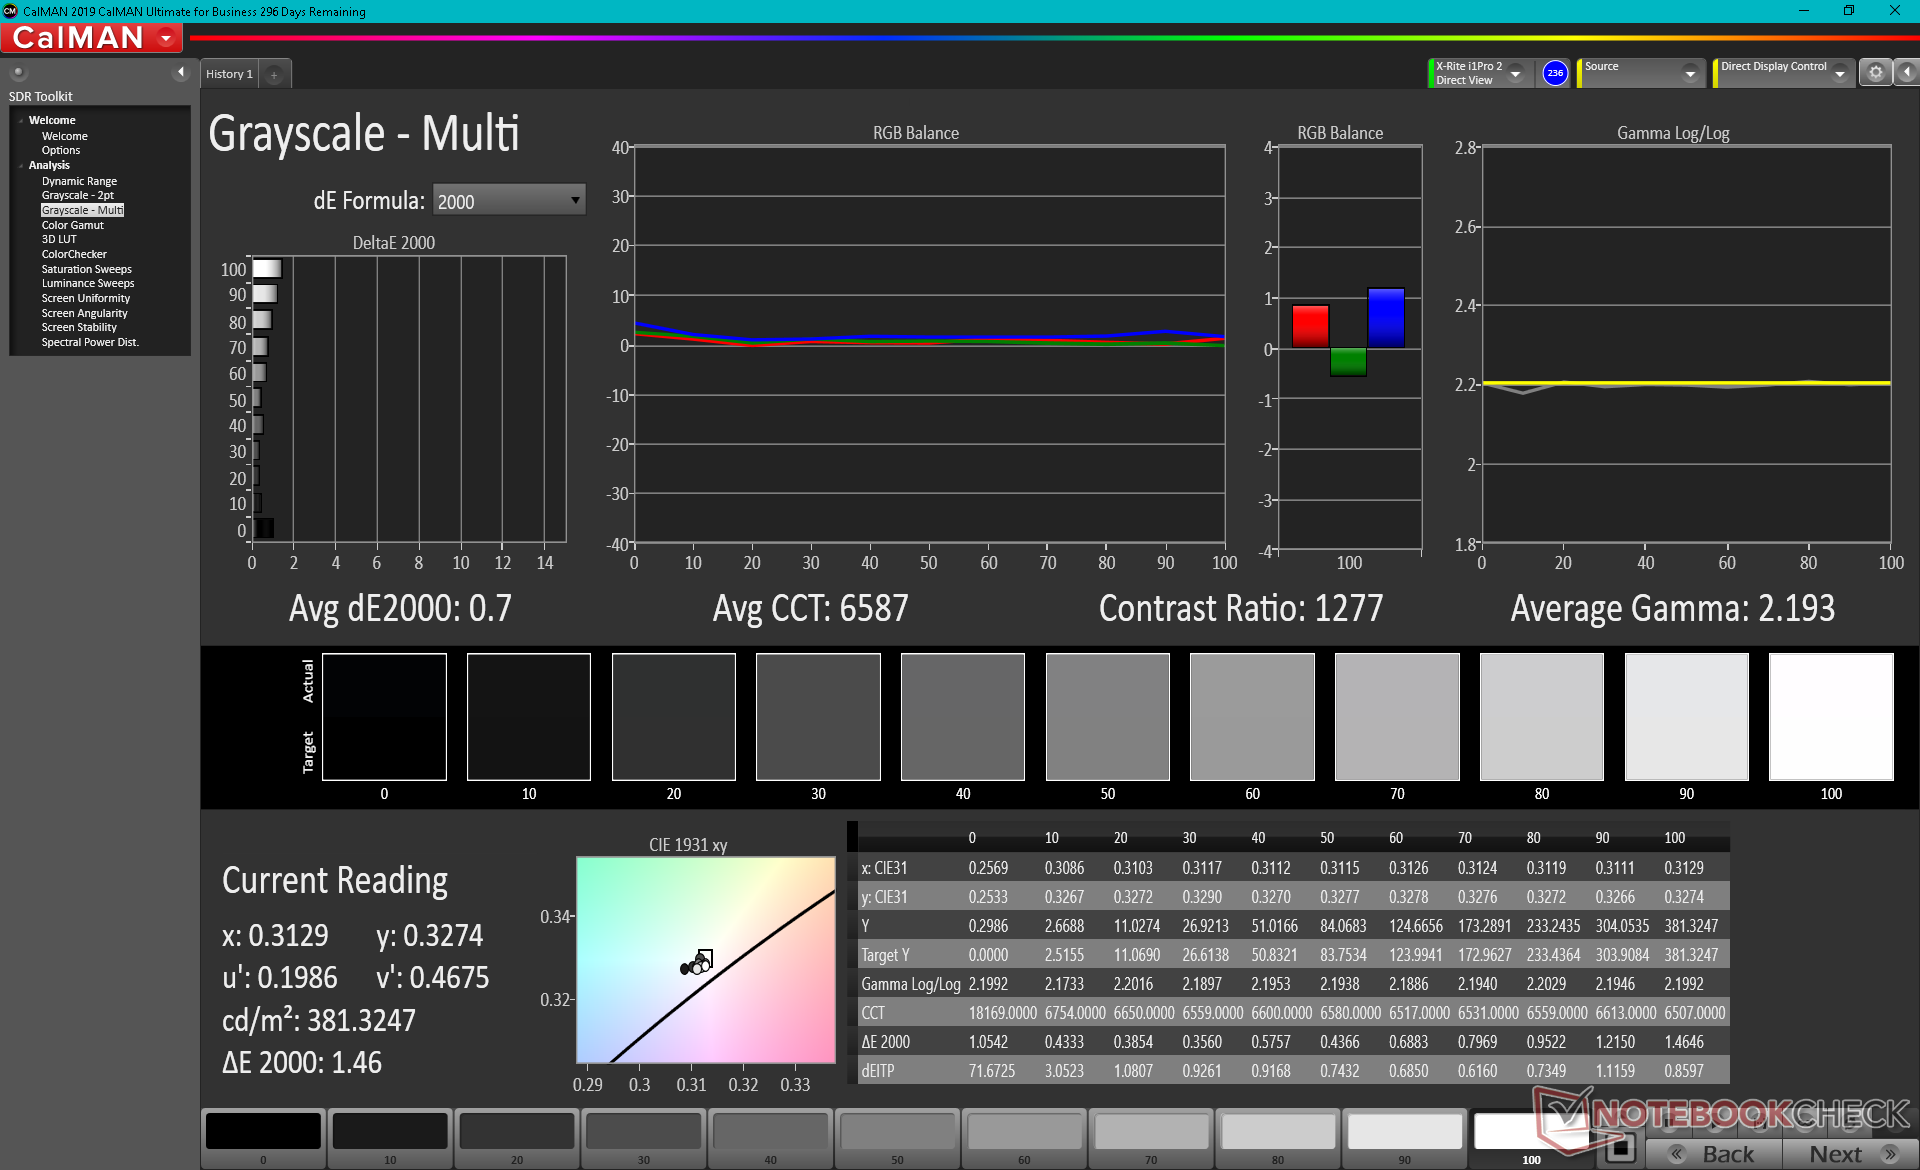
Color space covers all of sRGB and AdobeRGB. Razer has confirmed with us that the "100% sRGB" listing on the 4K configuration product page is an error as it should read "100% AdobeRGB" instead. This is one of the few laptops with a 4K panel capable of both fast refresh rates and deep colors for gaming and graphics editing.

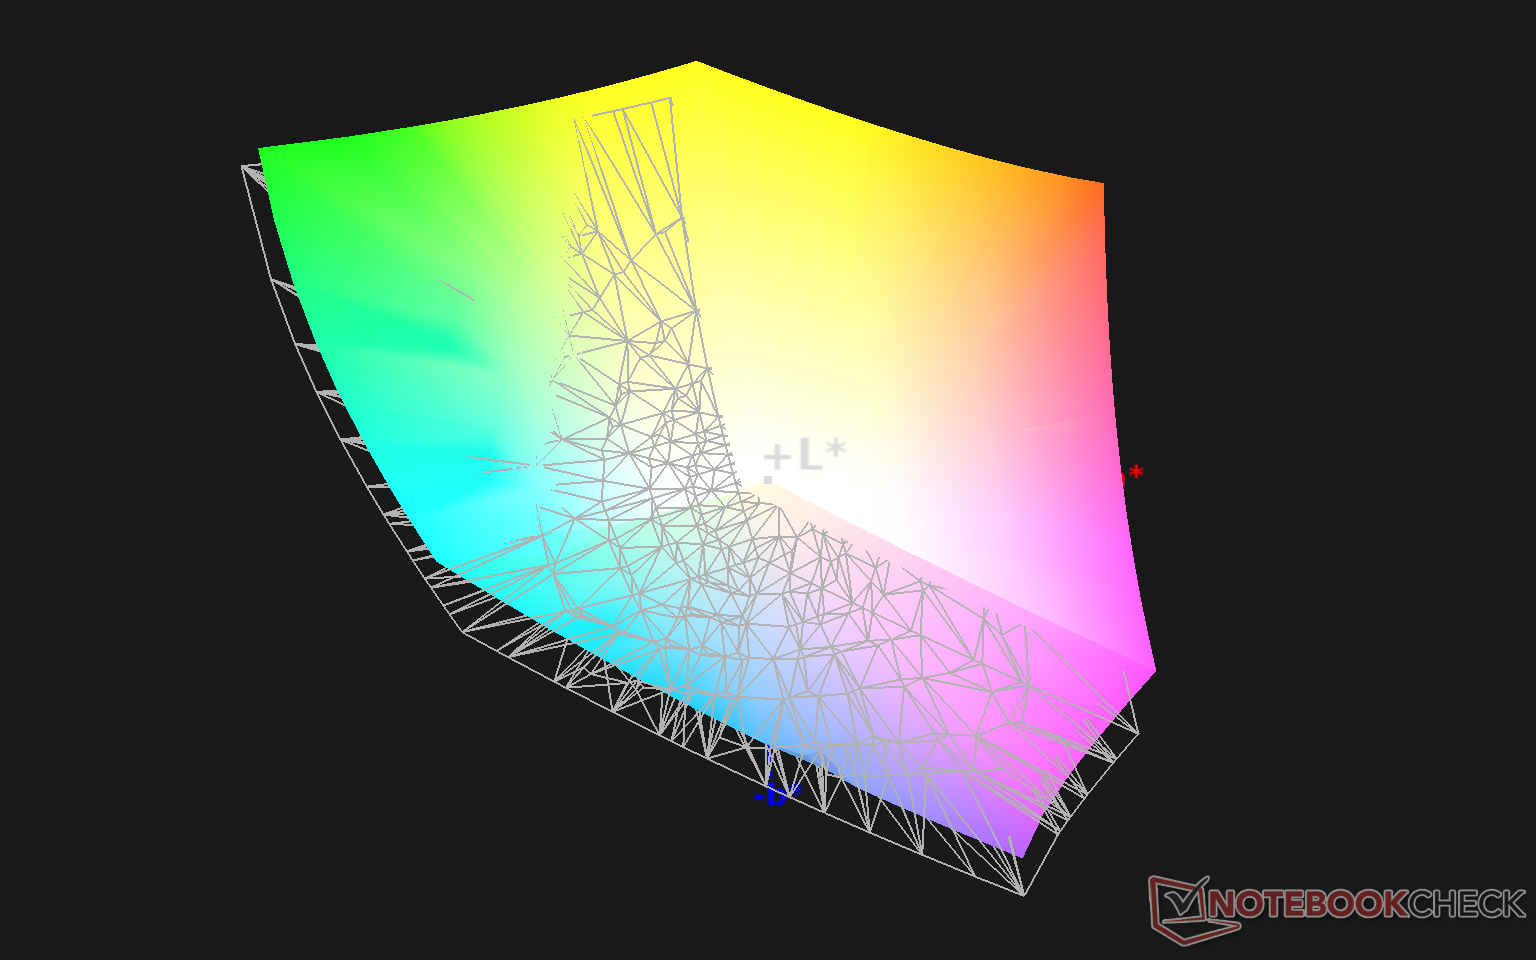
X-Rite colorimeter measurements show an overly warm color temperature resulting in poor grayscale and RGB balance. A calibration addresses this to improve the average grayscale deltaE value to just 0.7. Some tweaking is recommended for new owners if colors appear too warm.
Display Response Times
| ↔ Response Time Black to White | ||
|---|---|---|
| 12 ms ... rise ↗ and fall ↘ combined | ↗ 6 ms rise | 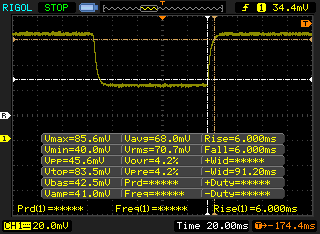 |
| ↘ 6 ms fall | ||
| The screen shows good response rates in our tests, but may be too slow for competitive gamers. In comparison, all tested devices range from 0.1 (minimum) to 240 (maximum) ms. » 31 % of all devices are better. This means that the measured response time is better than the average of all tested devices (20.2 ms). | ||
| ↔ Response Time 50% Grey to 80% Grey | ||
| 15.2 ms ... rise ↗ and fall ↘ combined | ↗ 7.6 ms rise | 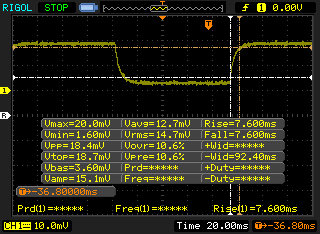 |
| ↘ 7.6 ms fall | ||
| The screen shows good response rates in our tests, but may be too slow for competitive gamers. In comparison, all tested devices range from 0.165 (minimum) to 636 (maximum) ms. » 28 % of all devices are better. This means that the measured response time is better than the average of all tested devices (31.5 ms). | ||
Screen Flickering / PWM (Pulse-Width Modulation)
| Screen flickering / PWM not detected | 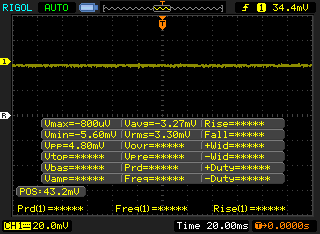 | ||
In comparison: 53 % of all tested devices do not use PWM to dim the display. If PWM was detected, an average of 8070 (minimum: 5 - maximum: 343500) Hz was measured. | |||
Performance
The Core i7-10875H has returned for all SKUs with no Core i5, Core i7-10870H, or Core i9 options. Razer says the Core i9-10980HK offers no major advantages to gaming which is something we can agree on based on our experiences with the Core i7 and Core i9 MSI GS66 SKUs.
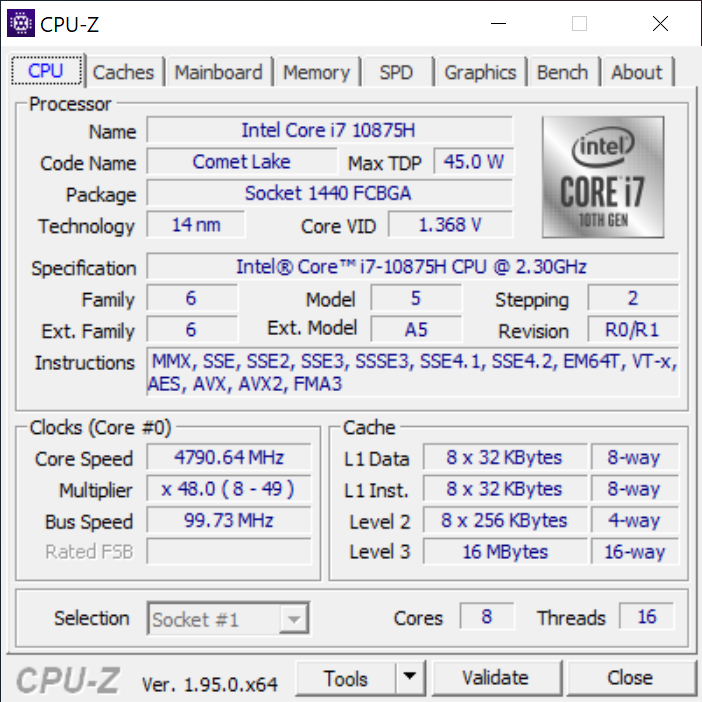
Processor
CPU performance is within a few percentage points of the average Core i7-10875H CPU in our database based on at least 30 other laptops. This is good in the sense that the Blade Pro 17 isn't underperforming, but it also means that the CPU could have been faster had there been additional thermal headroom. The same processor in the Schenker XMG Neo 15, for example, is about 10 to 20 percent faster than our Blade Pro 17.
Turbo Boost sustainability is average. The smaller 15.6-inch MSI GS66 Stealth and Schenker XMG Neo 15 are able to sustain higher clock rates for longer to return higher initial CineBench R15 xT numbers as shown by our comparison graph below.
Gaming laptops with the Ryzen 7 4800H or Ryzen 7 5800H are able to offer even faster processor performance than the Core i7-10875H.
Cinebench R15: CPU Multi 64Bit | CPU Single 64Bit
Blender: v2.79 BMW27 CPU
7-Zip 18.03: 7z b 4 -mmt1 | 7z b 4
Geekbench 5.5: Single-Core | Multi-Core
HWBOT x265 Benchmark v2.2: 4k Preset
LibreOffice : 20 Documents To PDF
R Benchmark 2.5: Overall mean
| Cinebench R20 / CPU (Multi Core) | |
| Schenker XMG Ultra 17 Comet Lake | |
| Schenker XMG Core 17 (Early 2021, RTX 3060, 5800H) | |
| MSI Alpha 17 A4DEK | |
| Alienware m17 R3 P45E | |
| Razer Blade Pro 17 2021 (QHD Touch) | |
| Average Intel Core i7-10875H (1986 - 4176, n=32) | |
| MSI GF75 Thin 10SDR | |
| Razer Blade Pro 17 4K UHD 120 Hz | |
| MSI GF75 Thin 10SCXR | |
| Lenovo Legion Y540-17IRH | |
| Asus TUF FX705DT-AU068T | |
| Cinebench R20 / CPU (Single Core) | |
| Schenker XMG Core 17 (Early 2021, RTX 3060, 5800H) | |
| Schenker XMG Ultra 17 Comet Lake | |
| Razer Blade Pro 17 2021 (QHD Touch) | |
| Average Intel Core i7-10875H (430 - 524, n=32) | |
| MSI Alpha 17 A4DEK | |
| MSI GF75 Thin 10SDR | |
| Alienware m17 R3 P45E | |
| MSI GF75 Thin 10SCXR | |
| Razer Blade Pro 17 4K UHD 120 Hz | |
| Lenovo Legion Y540-17IRH | |
| Asus TUF FX705DT-AU068T | |
| Cinebench R15 / CPU Multi 64Bit | |
| Schenker XMG Ultra 17 Comet Lake | |
| Schenker XMG Core 17 (Early 2021, RTX 3060, 5800H) | |
| MSI Alpha 17 A4DEK | |
| Alienware m17 R3 P45E | |
| Average Intel Core i7-10875H (1003 - 1833, n=38) | |
| Razer Blade Pro 17 2021 (QHD Touch) | |
| MSI GF75 Thin 10SDR | |
| Razer Blade Pro 17 4K UHD 120 Hz | |
| Lenovo Legion Y540-17IRH | |
| MSI GF75 Thin 10SCXR | |
| Asus TUF FX705DT-AU068T | |
| Cinebench R15 / CPU Single 64Bit | |
| Schenker XMG Core 17 (Early 2021, RTX 3060, 5800H) | |
| Schenker XMG Ultra 17 Comet Lake | |
| Alienware m17 R3 P45E | |
| Average Intel Core i7-10875H (190 - 220, n=37) | |
| Razer Blade Pro 17 2021 (QHD Touch) | |
| MSI GF75 Thin 10SDR | |
| MSI Alpha 17 A4DEK | |
| MSI GF75 Thin 10SCXR | |
| Razer Blade Pro 17 4K UHD 120 Hz | |
| Lenovo Legion Y540-17IRH | |
| Asus TUF FX705DT-AU068T | |
| Blender / v2.79 BMW27 CPU | |
| MSI GF75 Thin 10SCXR | |
| MSI GF75 Thin 10SDR | |
| Average Intel Core i7-10875H (259 - 535, n=30) | |
| Razer Blade Pro 17 2021 (QHD Touch) | |
| Schenker XMG Core 17 (Early 2021, RTX 3060, 5800H) | |
| MSI Alpha 17 A4DEK | |
| Alienware m17 R3 P45E | |
| Schenker XMG Ultra 17 Comet Lake | |
| 7-Zip 18.03 / 7z b 4 -mmt1 | |
| Schenker XMG Ultra 17 Comet Lake | |
| Alienware m17 R3 P45E | |
| Average Intel Core i7-10875H (5071 - 5780, n=31) | |
| Razer Blade Pro 17 2021 (QHD Touch) | |
| Schenker XMG Core 17 (Early 2021, RTX 3060, 5800H) | |
| MSI GF75 Thin 10SDR | |
| MSI Alpha 17 A4DEK | |
| MSI GF75 Thin 10SCXR | |
| 7-Zip 18.03 / 7z b 4 | |
| Schenker XMG Ultra 17 Comet Lake | |
| Schenker XMG Core 17 (Early 2021, RTX 3060, 5800H) | |
| MSI Alpha 17 A4DEK | |
| Alienware m17 R3 P45E | |
| Razer Blade Pro 17 2021 (QHD Touch) | |
| Average Intel Core i7-10875H (29844 - 49562, n=31) | |
| MSI GF75 Thin 10SDR | |
| MSI GF75 Thin 10SCXR | |
| Geekbench 5.5 / Single-Core | |
| Schenker XMG Core 17 (Early 2021, RTX 3060, 5800H) | |
| Schenker XMG Ultra 17 Comet Lake | |
| Alienware m17 R3 P45E | |
| Razer Blade Pro 17 2021 (QHD Touch) | |
| Average Intel Core i7-10875H (1233 - 1371, n=29) | |
| MSI GF75 Thin 10SDR | |
| MSI Alpha 17 A4DEK | |
| MSI GF75 Thin 10SCXR | |
| Geekbench 5.5 / Multi-Core | |
| Schenker XMG Ultra 17 Comet Lake | |
| Razer Blade Pro 17 2021 (QHD Touch) | |
| MSI Alpha 17 A4DEK | |
| Alienware m17 R3 P45E | |
| Schenker XMG Core 17 (Early 2021, RTX 3060, 5800H) | |
| Average Intel Core i7-10875H (5715 - 8620, n=29) | |
| MSI GF75 Thin 10SDR | |
| MSI GF75 Thin 10SCXR | |
| HWBOT x265 Benchmark v2.2 / 4k Preset | |
| Schenker XMG Ultra 17 Comet Lake | |
| Schenker XMG Core 17 (Early 2021, RTX 3060, 5800H) | |
| Alienware m17 R3 P45E | |
| MSI Alpha 17 A4DEK | |
| Razer Blade Pro 17 2021 (QHD Touch) | |
| Average Intel Core i7-10875H (7.27 - 14.1, n=27) | |
| MSI GF75 Thin 10SDR | |
| MSI GF75 Thin 10SCXR | |
| LibreOffice / 20 Documents To PDF | |
| MSI Alpha 17 A4DEK | |
| MSI GF75 Thin 10SCXR | |
| MSI GF75 Thin 10SDR | |
| Schenker XMG Core 17 (Early 2021, RTX 3060, 5800H) | |
| Average Intel Core i7-10875H (30.2 - 84.3, n=30) | |
| Alienware m17 R3 P45E | |
| Schenker XMG Ultra 17 Comet Lake | |
| Razer Blade Pro 17 2021 (QHD Touch) | |
| R Benchmark 2.5 / Overall mean | |
| MSI GF75 Thin 10SCXR | |
| MSI GF75 Thin 10SDR | |
| Razer Blade Pro 17 2021 (QHD Touch) | |
| Average Intel Core i7-10875H (0.546 - 0.662, n=29) | |
| MSI Alpha 17 A4DEK | |
| Alienware m17 R3 P45E | |
| Schenker XMG Core 17 (Early 2021, RTX 3060, 5800H) | |
| Schenker XMG Ultra 17 Comet Lake | |
* ... smaller is better
System Performance
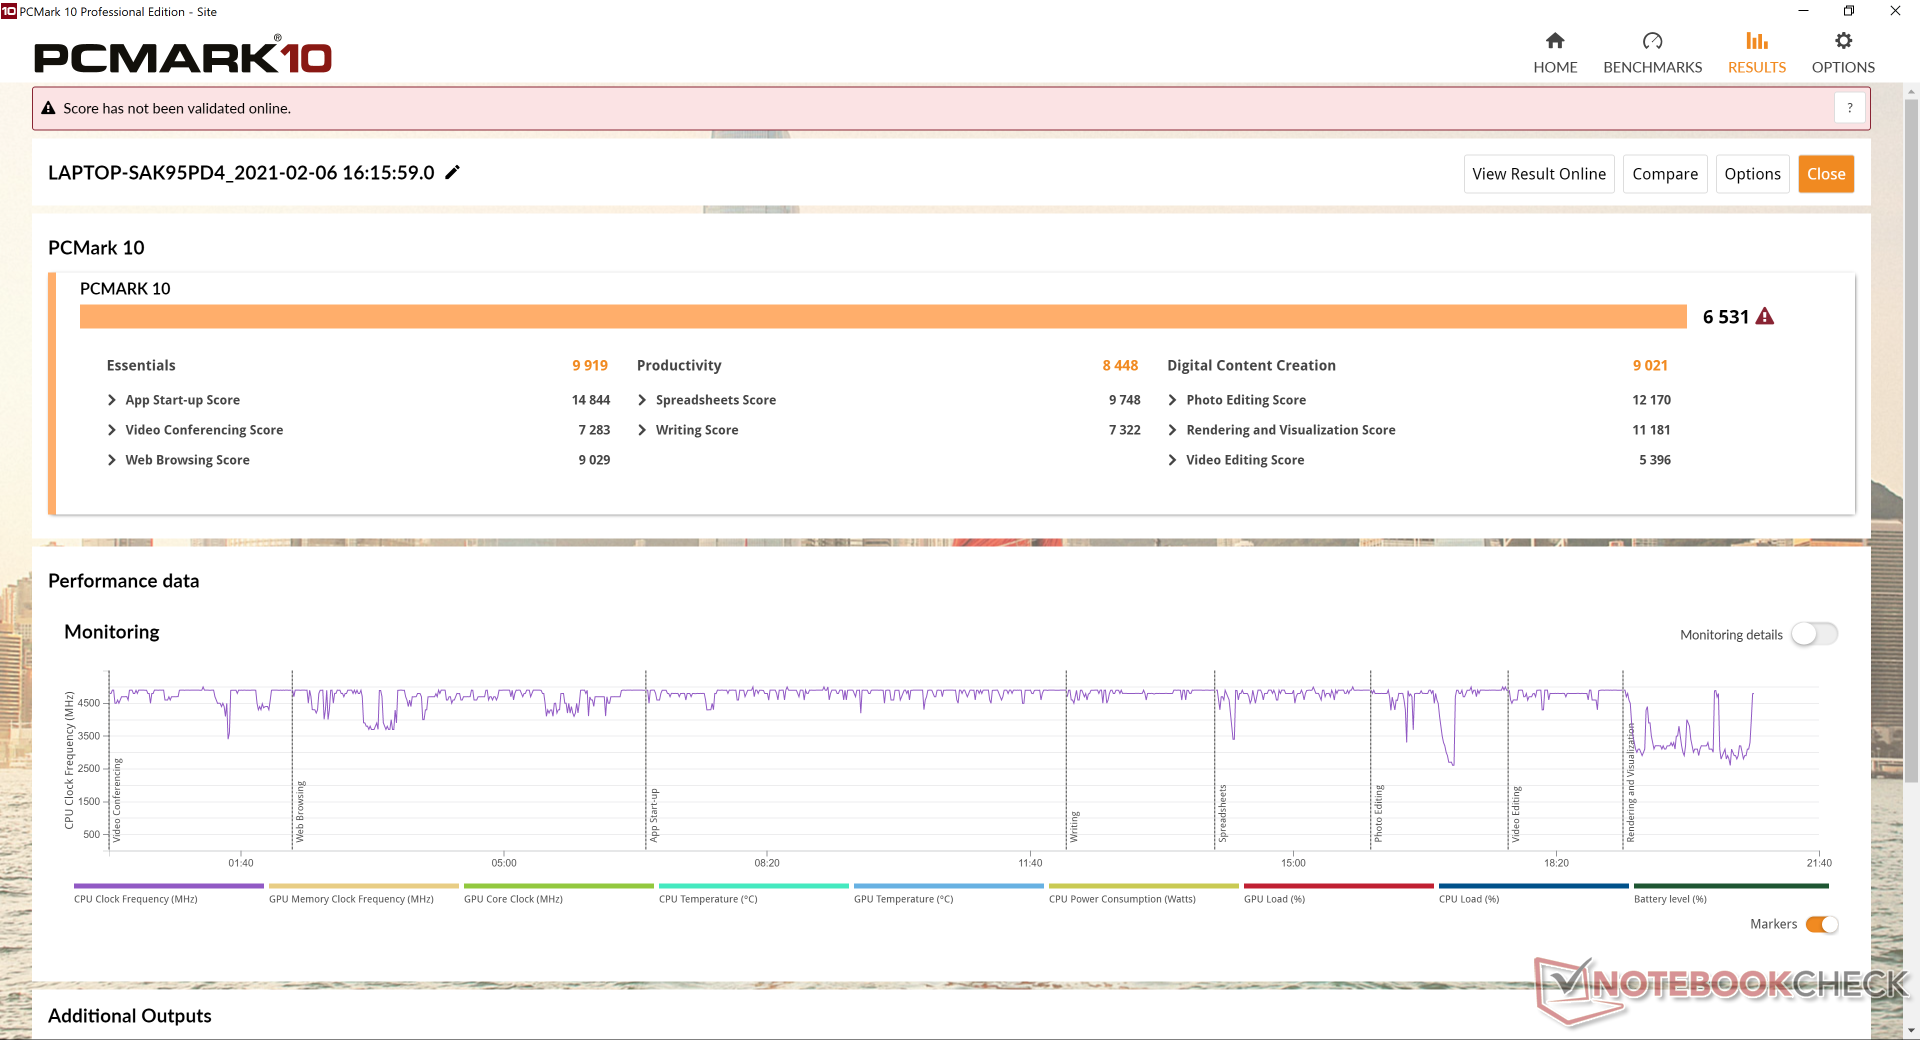
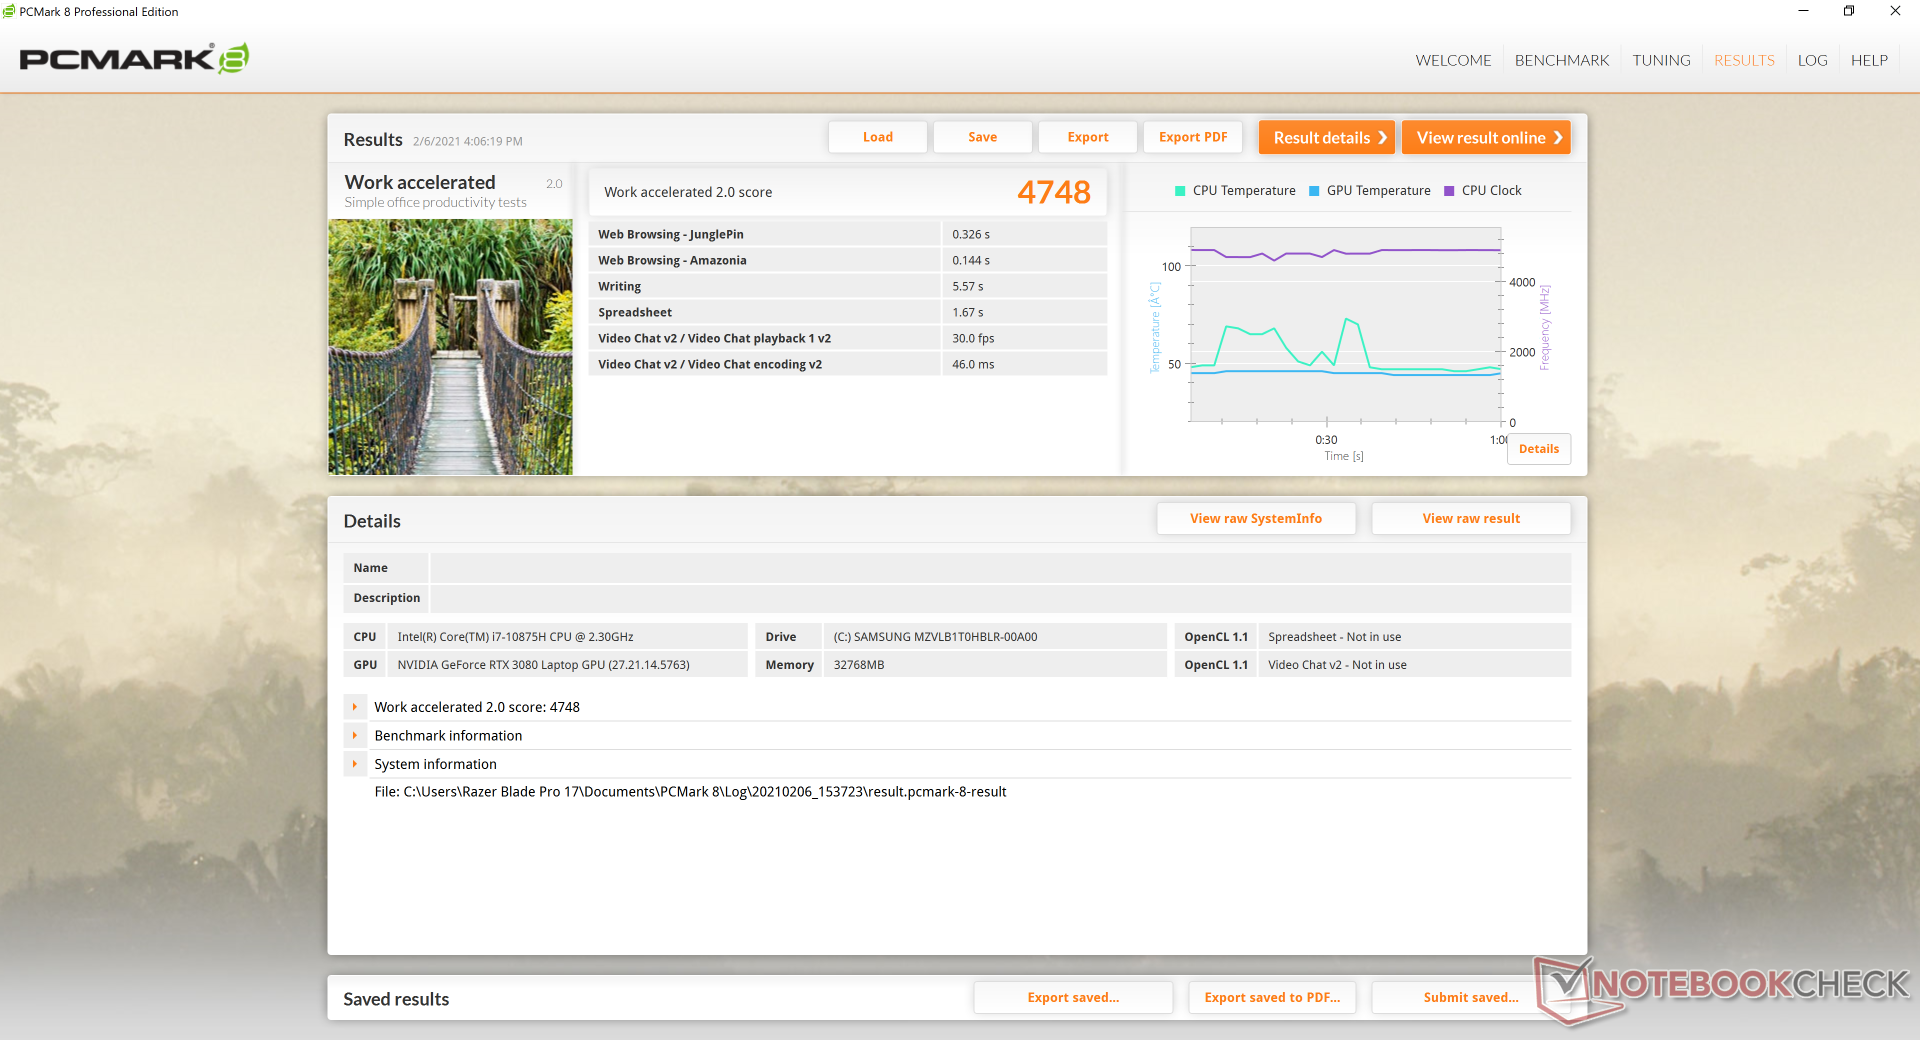
PCMark benchmarks are nearly identical to the GeForce RTX 2070 Max-Q configuration meaning day-to-day workloads aren't going to feel all that much faster just because of the newer GeForce RTX 30 GPU.
The Razer Synapse software will sometimes fail to launch if not connected to the internet. Cold boot ups or waking from sleep, for example, may cause Synapse to not launch or auto-login properly. Terminating the software via Task Manager would be the fastest way to reset it should the problem occur. This has been an annoying issue for years and it's disappointing to still see it unfixed.
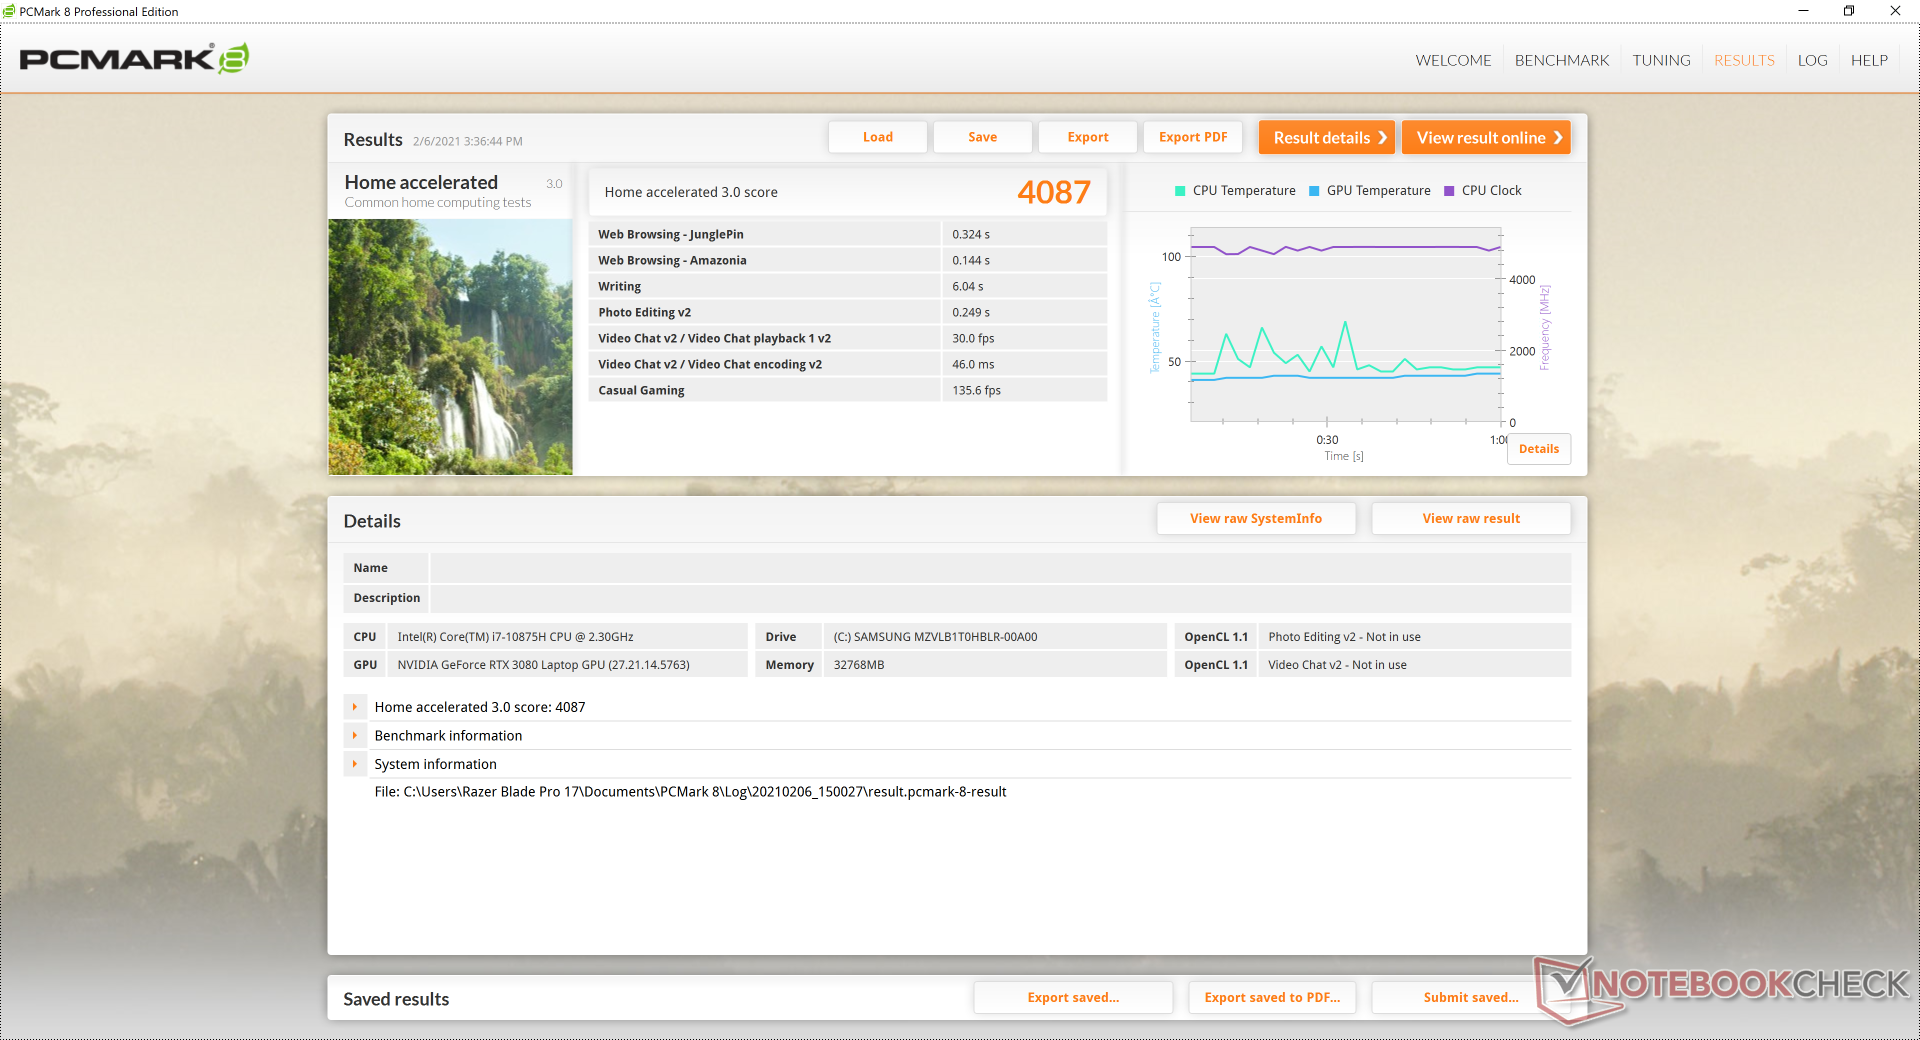
| PCMark 8 Home Score Accelerated v2 | 4087 points | |
| PCMark 8 Work Score Accelerated v2 | 4748 points | |
| PCMark 10 Score | 6531 points | |
Help | ||
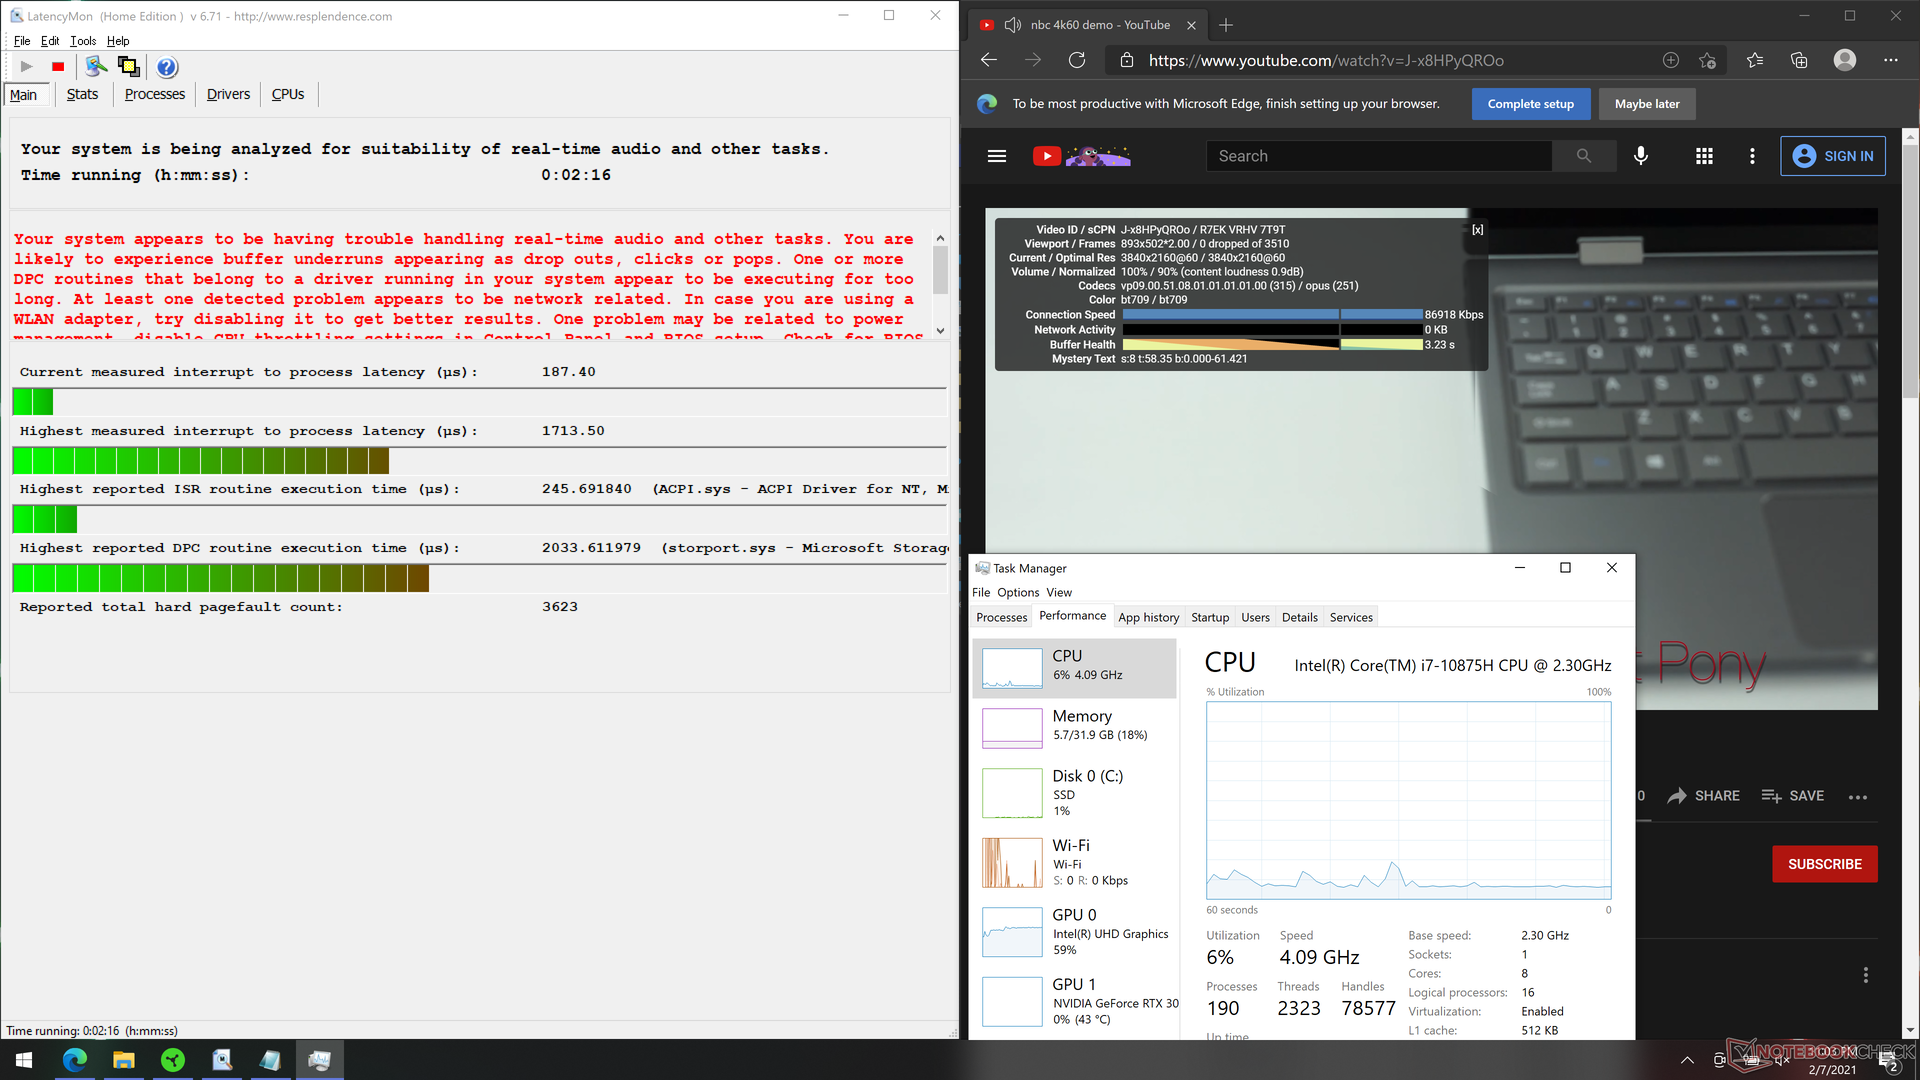
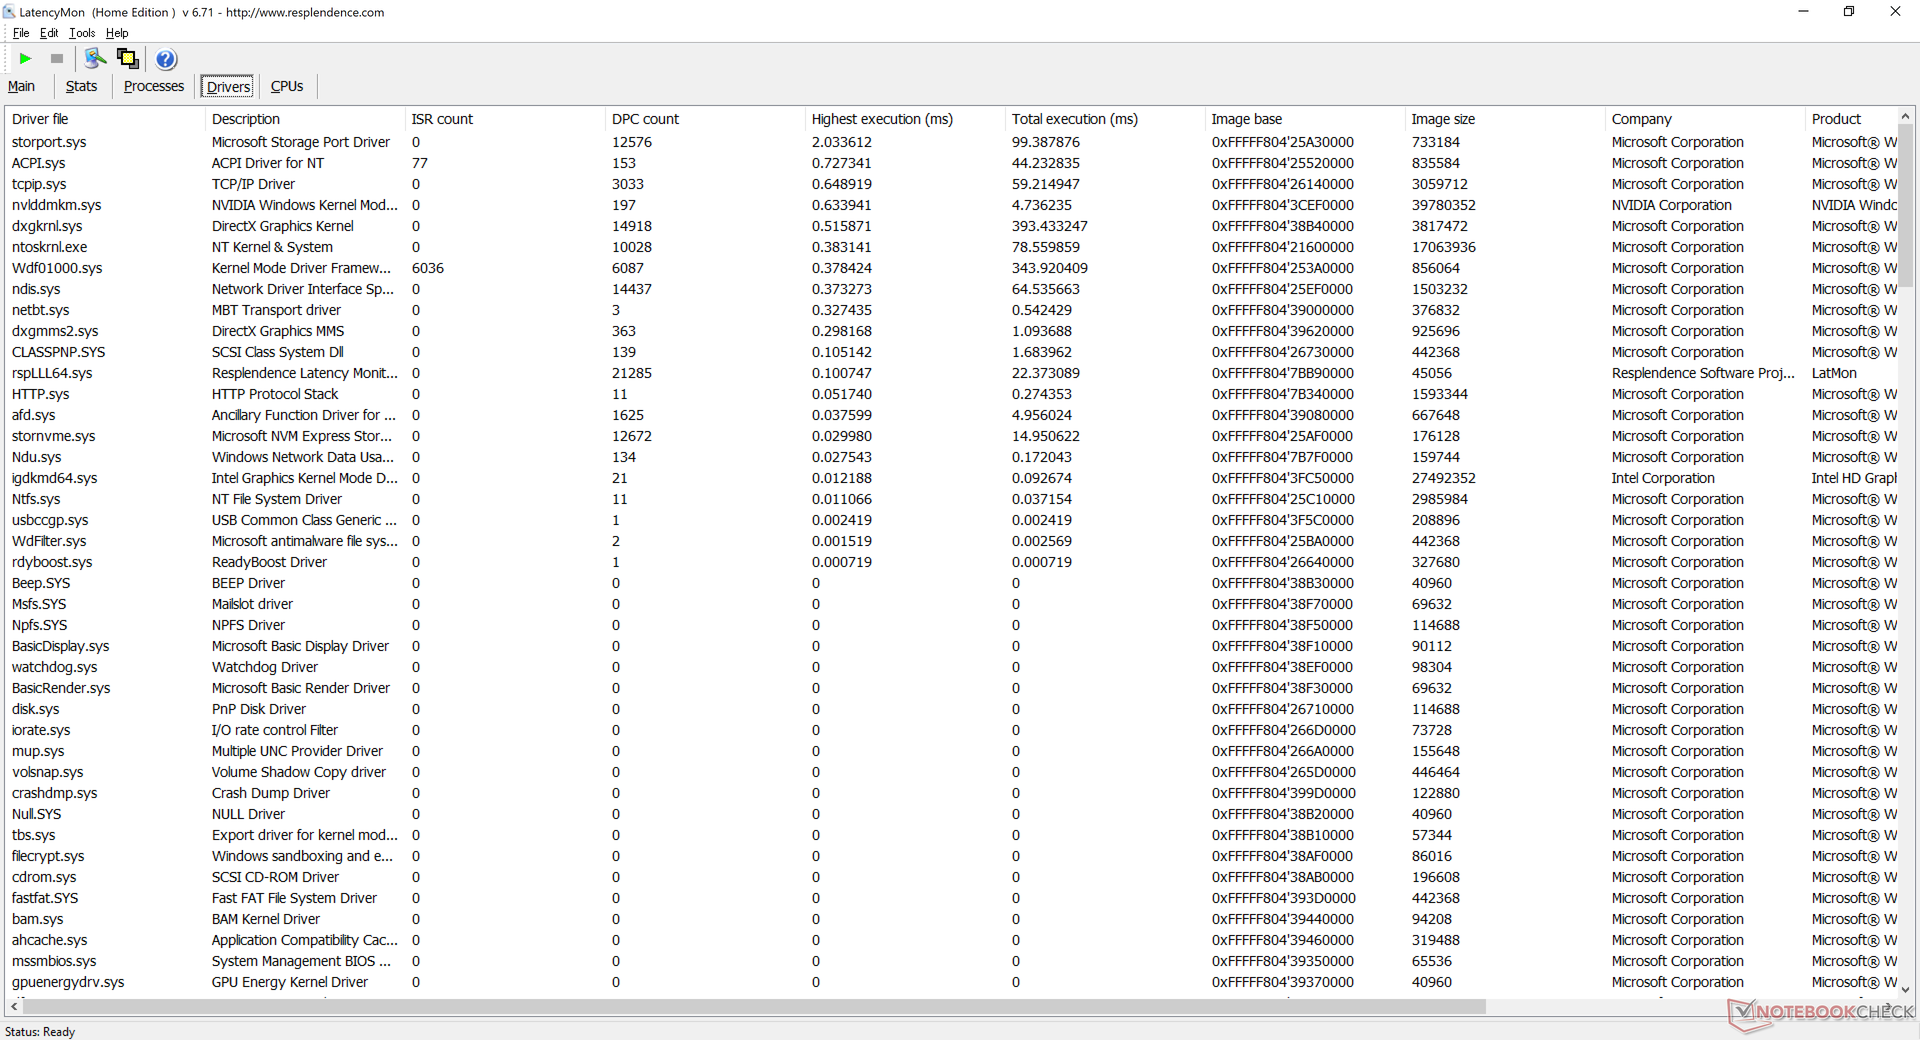
DPC Latency
LatencyMon shows DPC latency issues when opening multiple browser tabs and pages on our homepage. 4K video playback at 60 FPS is otherwise smooth and with no process interruptions or dropped frames.
| DPC Latencies / LatencyMon - interrupt to process latency (max), Web, Youtube, Prime95 | |
| MSI GT76 Titan DT 10SGS | |
| Asus Strix G17 G712LWS | |
| Schenker XMG Neo 17 (Early 2021, RTX 3070, 5800H) | |
| Razer Blade Pro 17 2021 (QHD Touch) | |
| Razer Blade Pro 17 RTX 2070 Max-Q 300 Hz | |
| MSI GS75 10SF-609US | |
* ... smaller is better
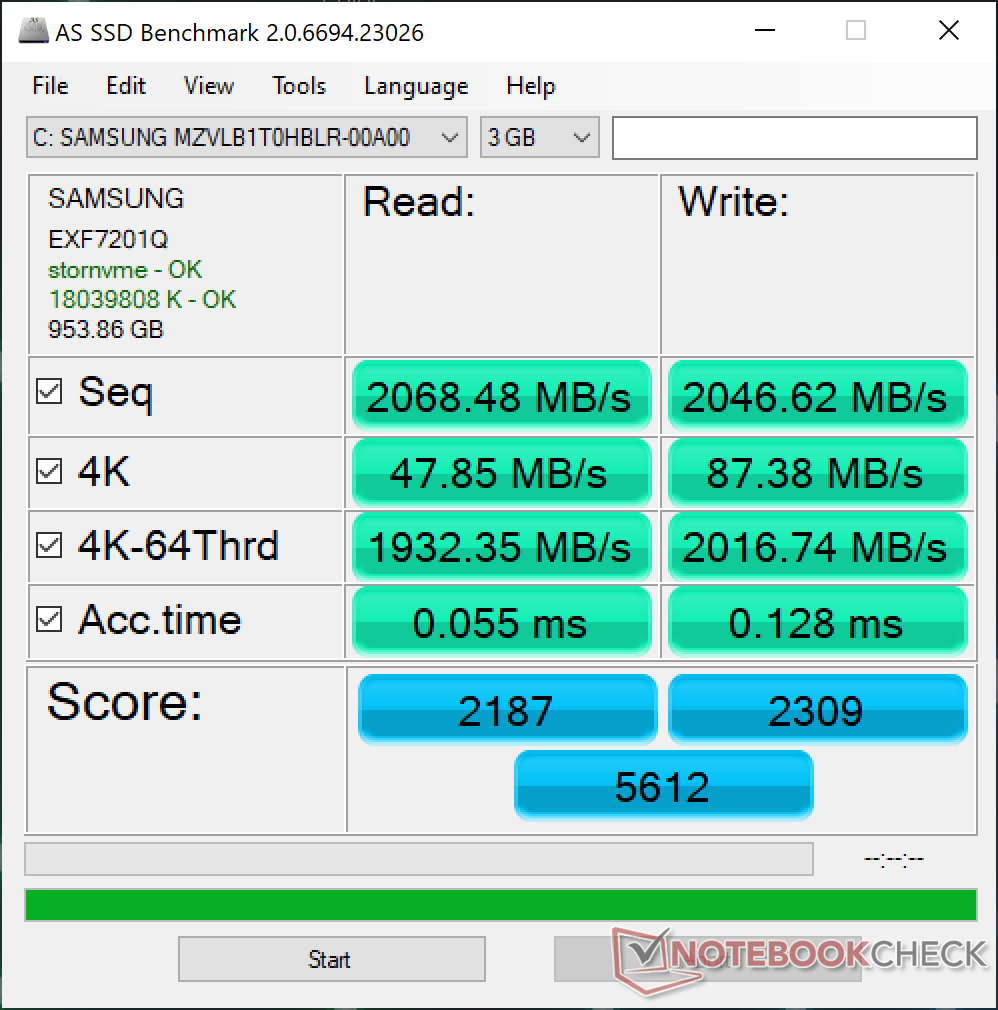
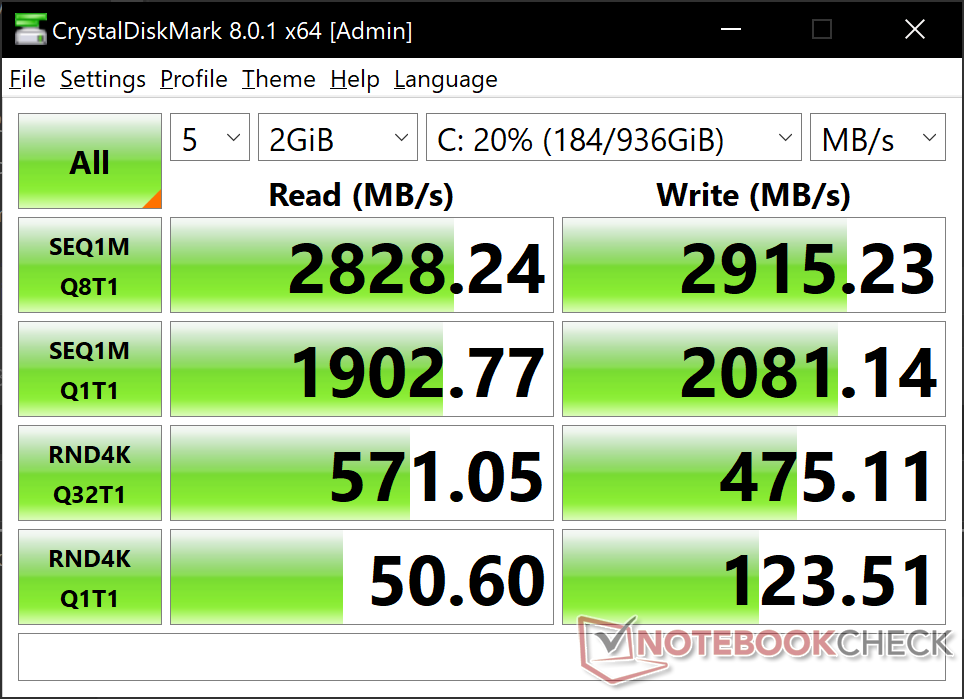
Storage Devices
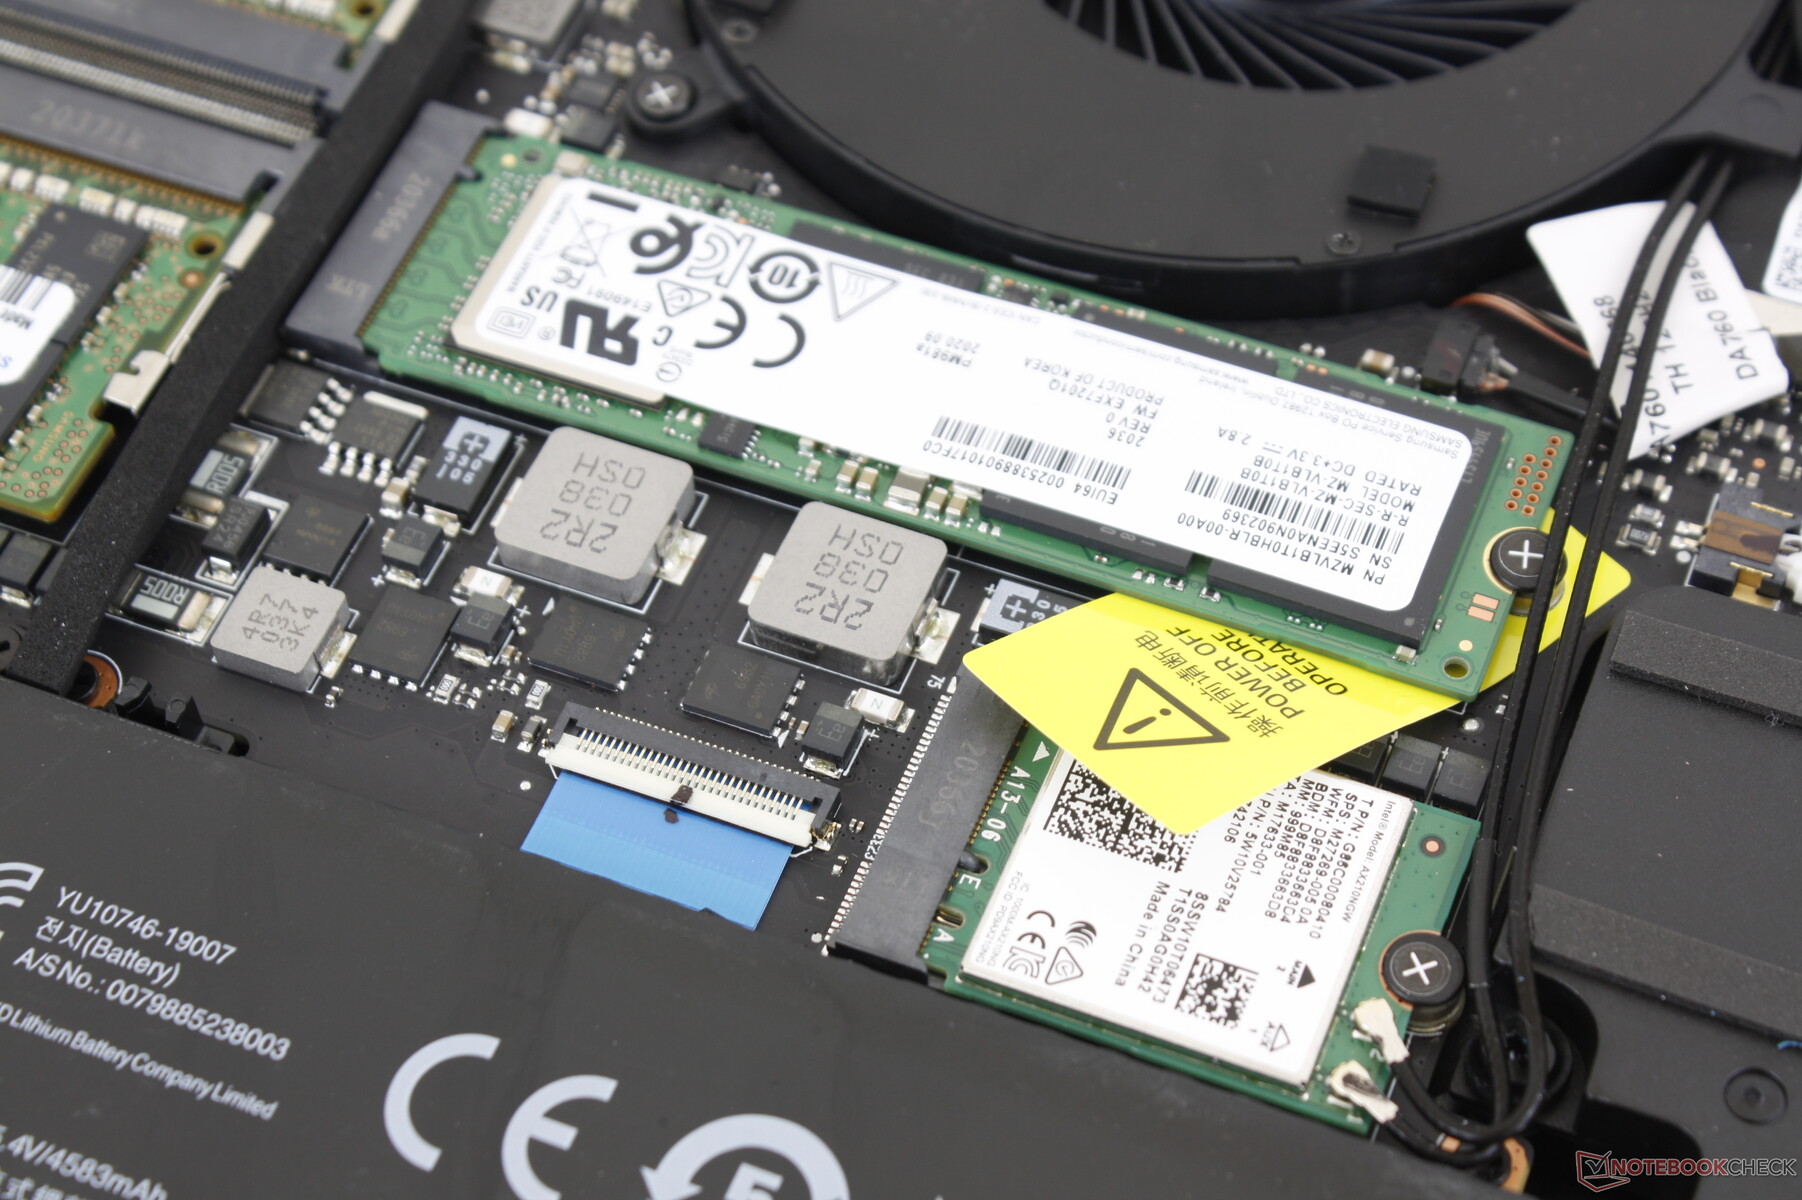
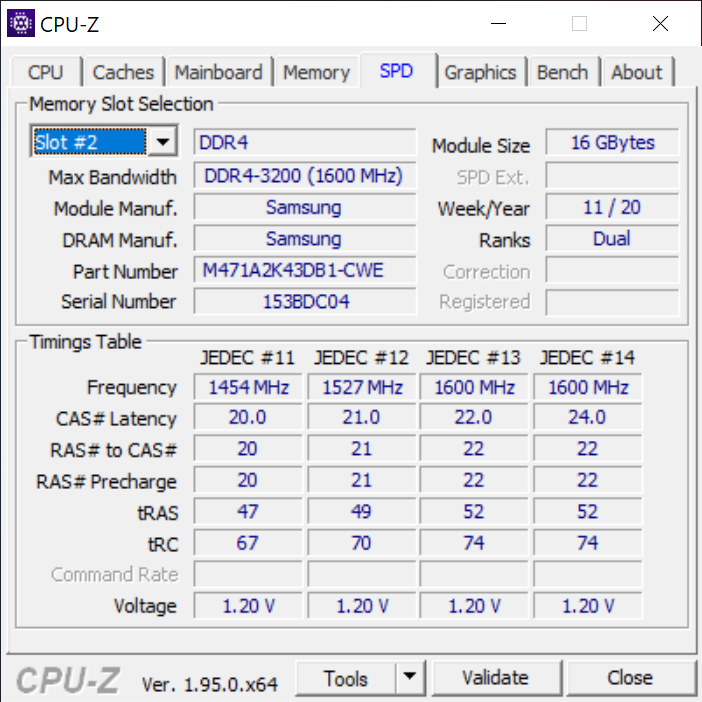
Razer Blade laptops usually come with Samsung or Lite-On SSDs and the 2021 model is no different. Our configuration uses a 1 TB Samsung PM981a which is both faster and pricier than the 1 TB Intel SSD 660p as found on many Asus laptops. Perhaps the next generation Blade Pro 17 may integrate PCIe 4.0 slots for even faster transfer rates.
More storage benchmarks and comparisons can be found on our table here.
| Razer Blade Pro 17 2021 (QHD Touch) Samsung PM981a MZVLB1T0HBLR | Razer Blade Pro 17 RTX 2070 Max-Q 300 Hz Lite-On CA5-8D512 | Asus Strix G17 G712LWS Intel SSD 660p 1TB SSDPEKNW010T8 | MSI GS66 Stealth 10UG WDC PC SN730 SDBPNTY-1T00 | Schenker XMG Neo 17 (Early 2021, RTX 3070, 5800H) Samsung SSD 970 EVO Plus 500GB | |
|---|---|---|---|---|---|
| AS SSD | -30% | -29% | 4% | 26% | |
| Seq Read (MB/s) | 2068 | 2019 -2% | 1778 -14% | 2198 6% | 3020 46% |
| Seq Write (MB/s) | 2047 | 1314 -36% | 1478 -28% | 2596 27% | 2631 29% |
| 4K Read (MB/s) | 47.85 | 46.61 -3% | 49.76 4% | 43.81 -8% | 60.3 26% |
| 4K Write (MB/s) | 87.4 | 90.2 3% | 117.9 35% | 115.5 32% | 171.6 96% |
| 4K-64 Read (MB/s) | 1932 | 665 -66% | 591 -69% | 1692 -12% | 1410 -27% |
| 4K-64 Write (MB/s) | 2017 | 813 -60% | 875 -57% | 2162 7% | 2324 15% |
| Access Time Read * (ms) | 0.055 | 0.058 -5% | 0.082 -49% | 0.056 -2% | 0.045 18% |
| Access Time Write * (ms) | 0.128 | 0.167 -30% | 0.041 68% | 0.098 23% | 0.024 81% |
| Score Read (Points) | 2187 | 913 -58% | 818 -63% | 1956 -11% | 1773 -19% |
| Score Write (Points) | 2309 | 1034 -55% | 1140 -51% | 2537 10% | 2759 19% |
| Score Total (Points) | 5612 | 2392 -57% | 2377 -58% | 5513 -2% | 5429 -3% |
| Copy ISO MB/s (MB/s) | 2400 | 1715 -29% | 1495 -38% | 2236 -7% | |
| Copy Program MB/s (MB/s) | 684 | 622 -9% | 446 -35% | 690 1% | |
| Copy Game MB/s (MB/s) | 1629 | 1506 -8% | 697 -57% | 1546 -5% | |
| CrystalDiskMark 5.2 / 6 | 6% | -9% | 11% | 31% | |
| Write 4K (MB/s) | 123.5 | 119 -4% | 141.1 14% | 163.1 32% | 206.1 67% |
| Read 4K (MB/s) | 45.96 | 51.9 13% | 60.9 33% | 48.97 7% | 53 15% |
| Write Seq (MB/s) | 1861 | 2258 21% | 1681 -10% | 2607 40% | 3018 62% |
| Read Seq (MB/s) | 1584 | 2283 44% | 1602 1% | 2316 46% | 2575 63% |
| Write 4K Q32T1 (MB/s) | 466.4 | 491 5% | 406.6 -13% | 338 -28% | 535 15% |
| Read 4K Q32T1 (MB/s) | 566 | 540 -5% | 470.2 -17% | 475.6 -16% | 608 7% |
| Write Seq Q32T1 (MB/s) | 2981 | 2253 -24% | 1759 -41% | 3090 4% | 3242 9% |
| Read Seq Q32T1 (MB/s) | 3260 | 3172 -3% | 1932 -41% | 3421 5% | 3617 11% |
| Total Average (Program / Settings) | -12% /
-17% | -19% /
-22% | 8% /
7% | 29% /
28% |
* ... smaller is better

Disk Throttling: DiskSpd Read Loop, Queue Depth 8
GPU Performance
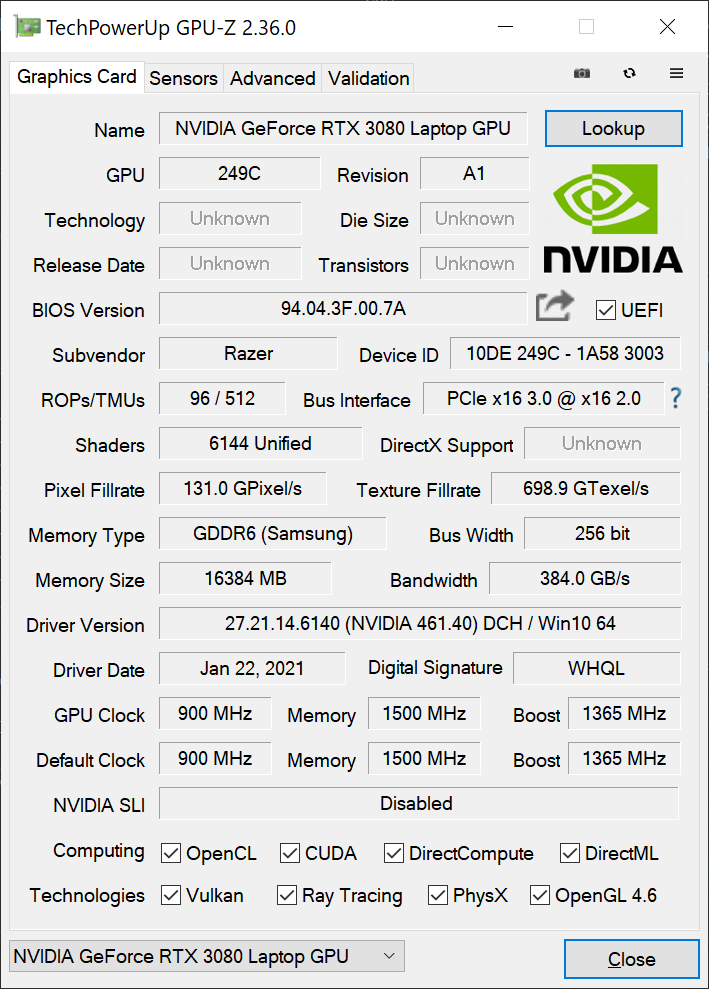
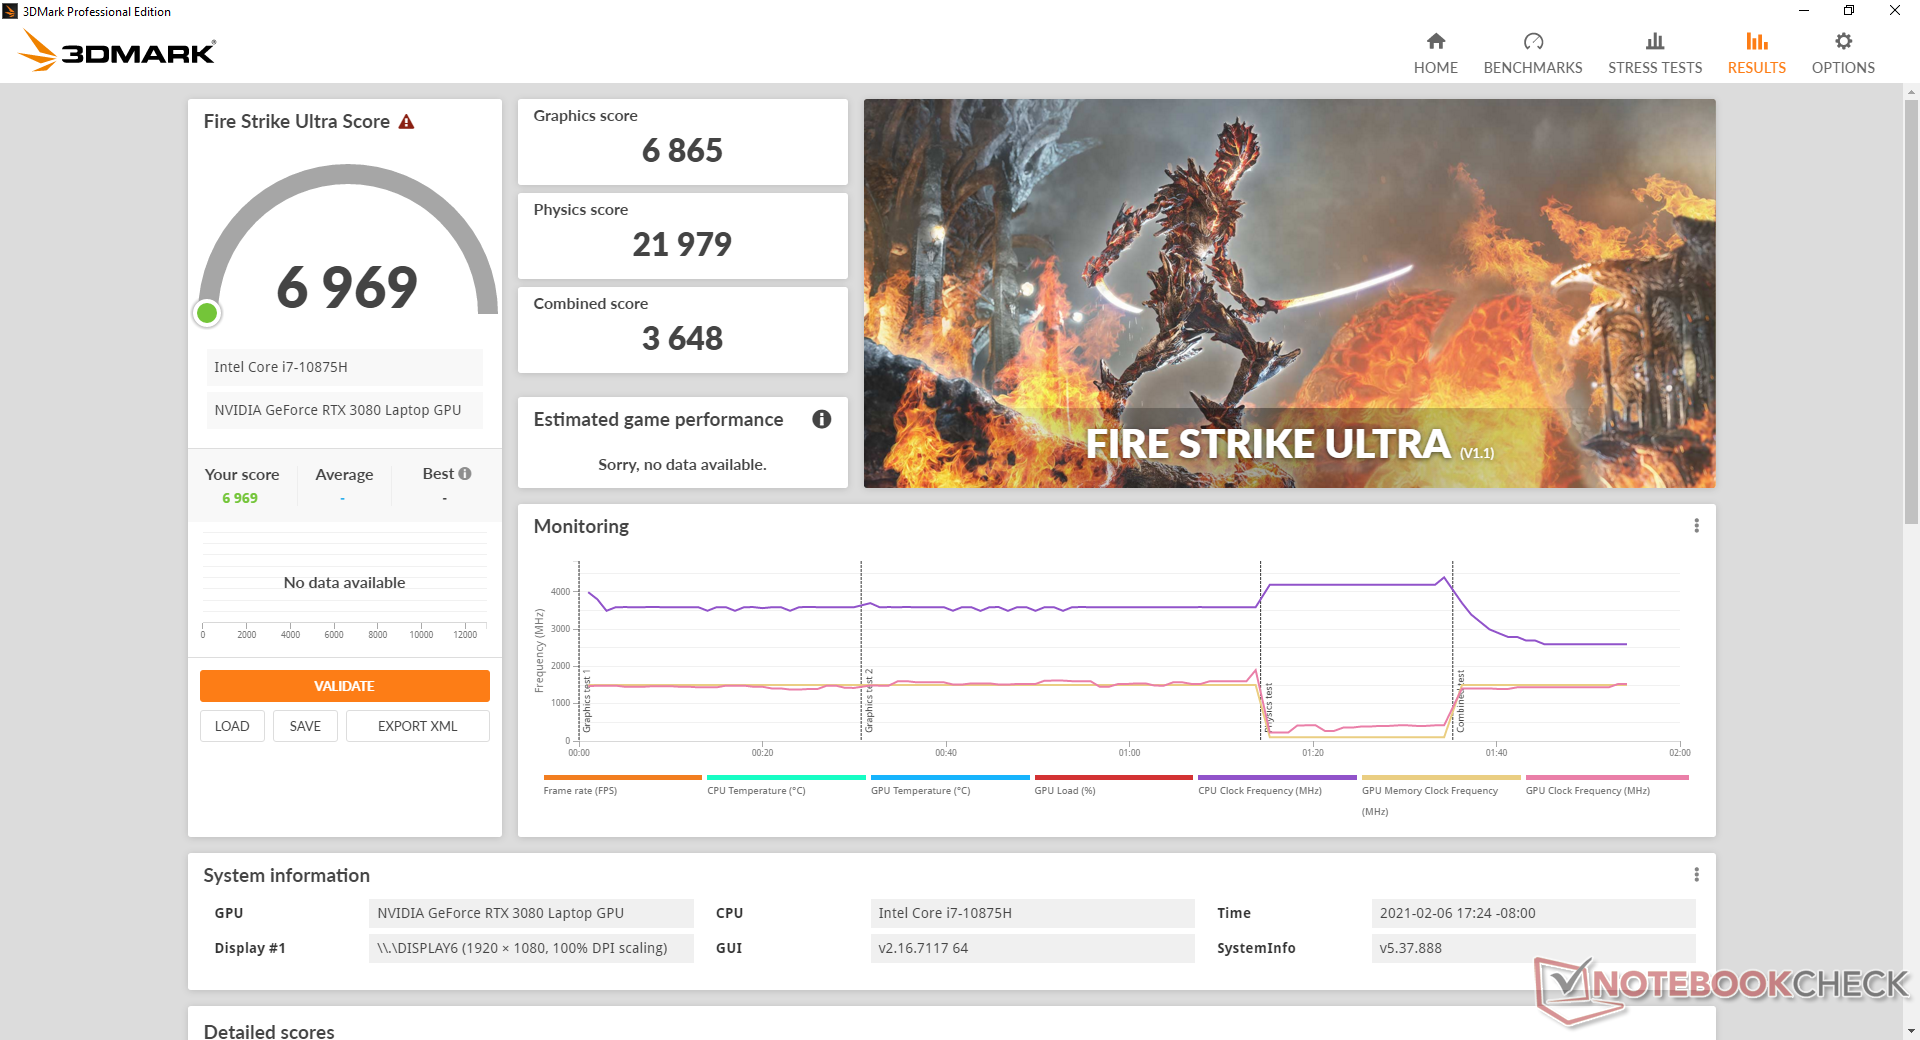
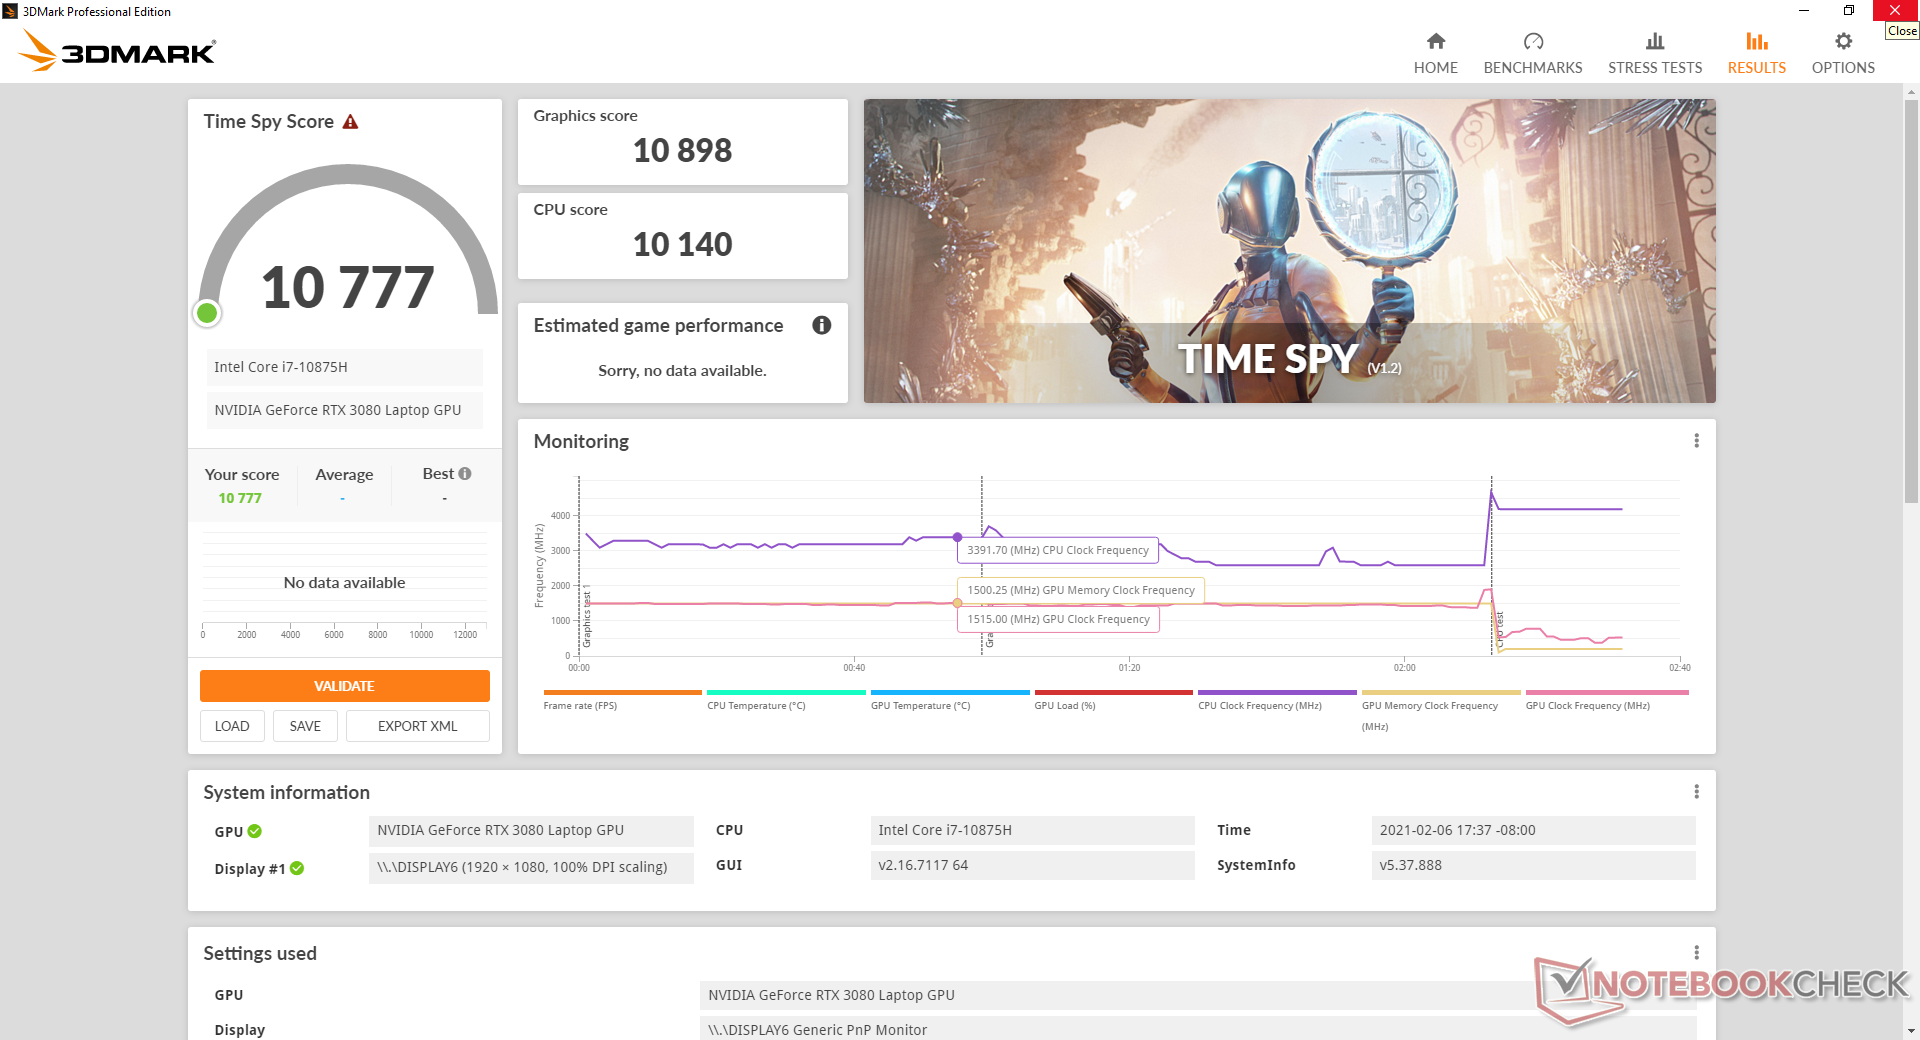
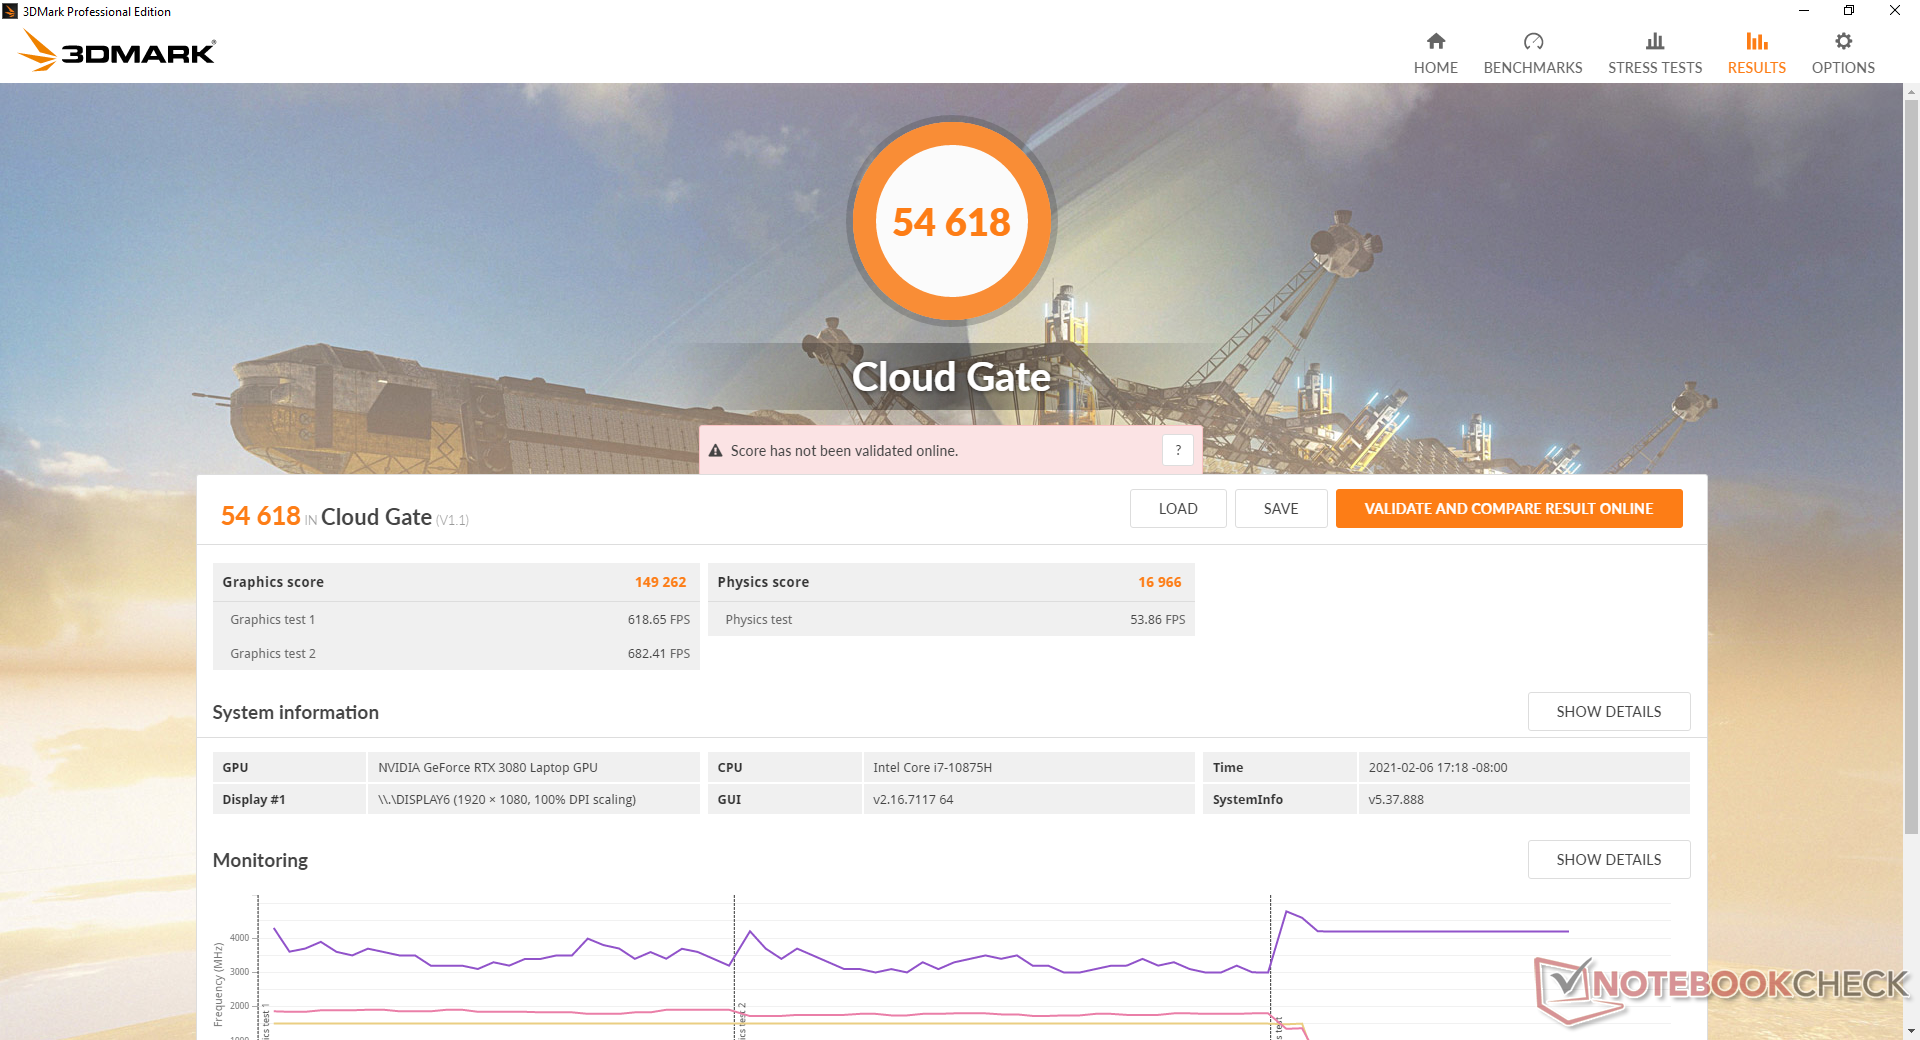
The mobile GeForce RTX 3080 in the latest Razer is about 20 to 30 percent faster than the RTX 2080 Max-Q in last year's configuration. It's a moderate gen-to-gen gain that pales in comparison to the desktop GPU of the same name. Desktop gamers with their "proper" GeForce RTX 3080 GPUs can run games at least 50 percent faster than the mobile version here.

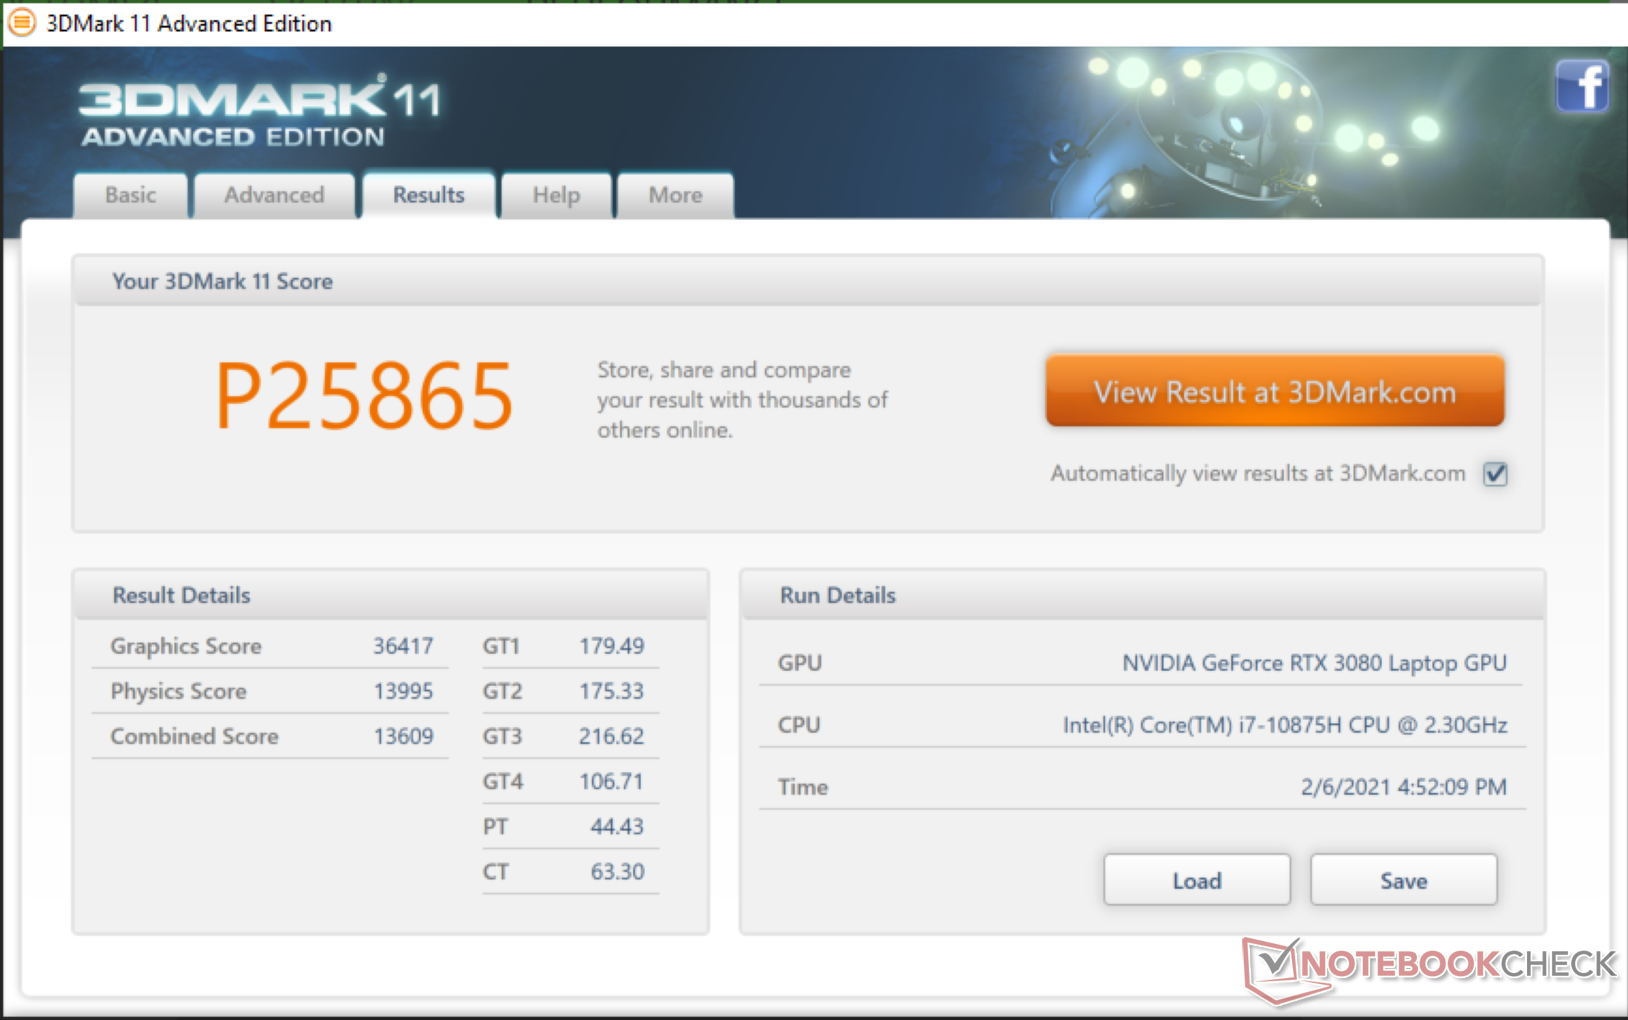
| 3DMark 11 Performance | 29409 points | |
| 3DMark Cloud Gate Standard Score | 54618 points | |
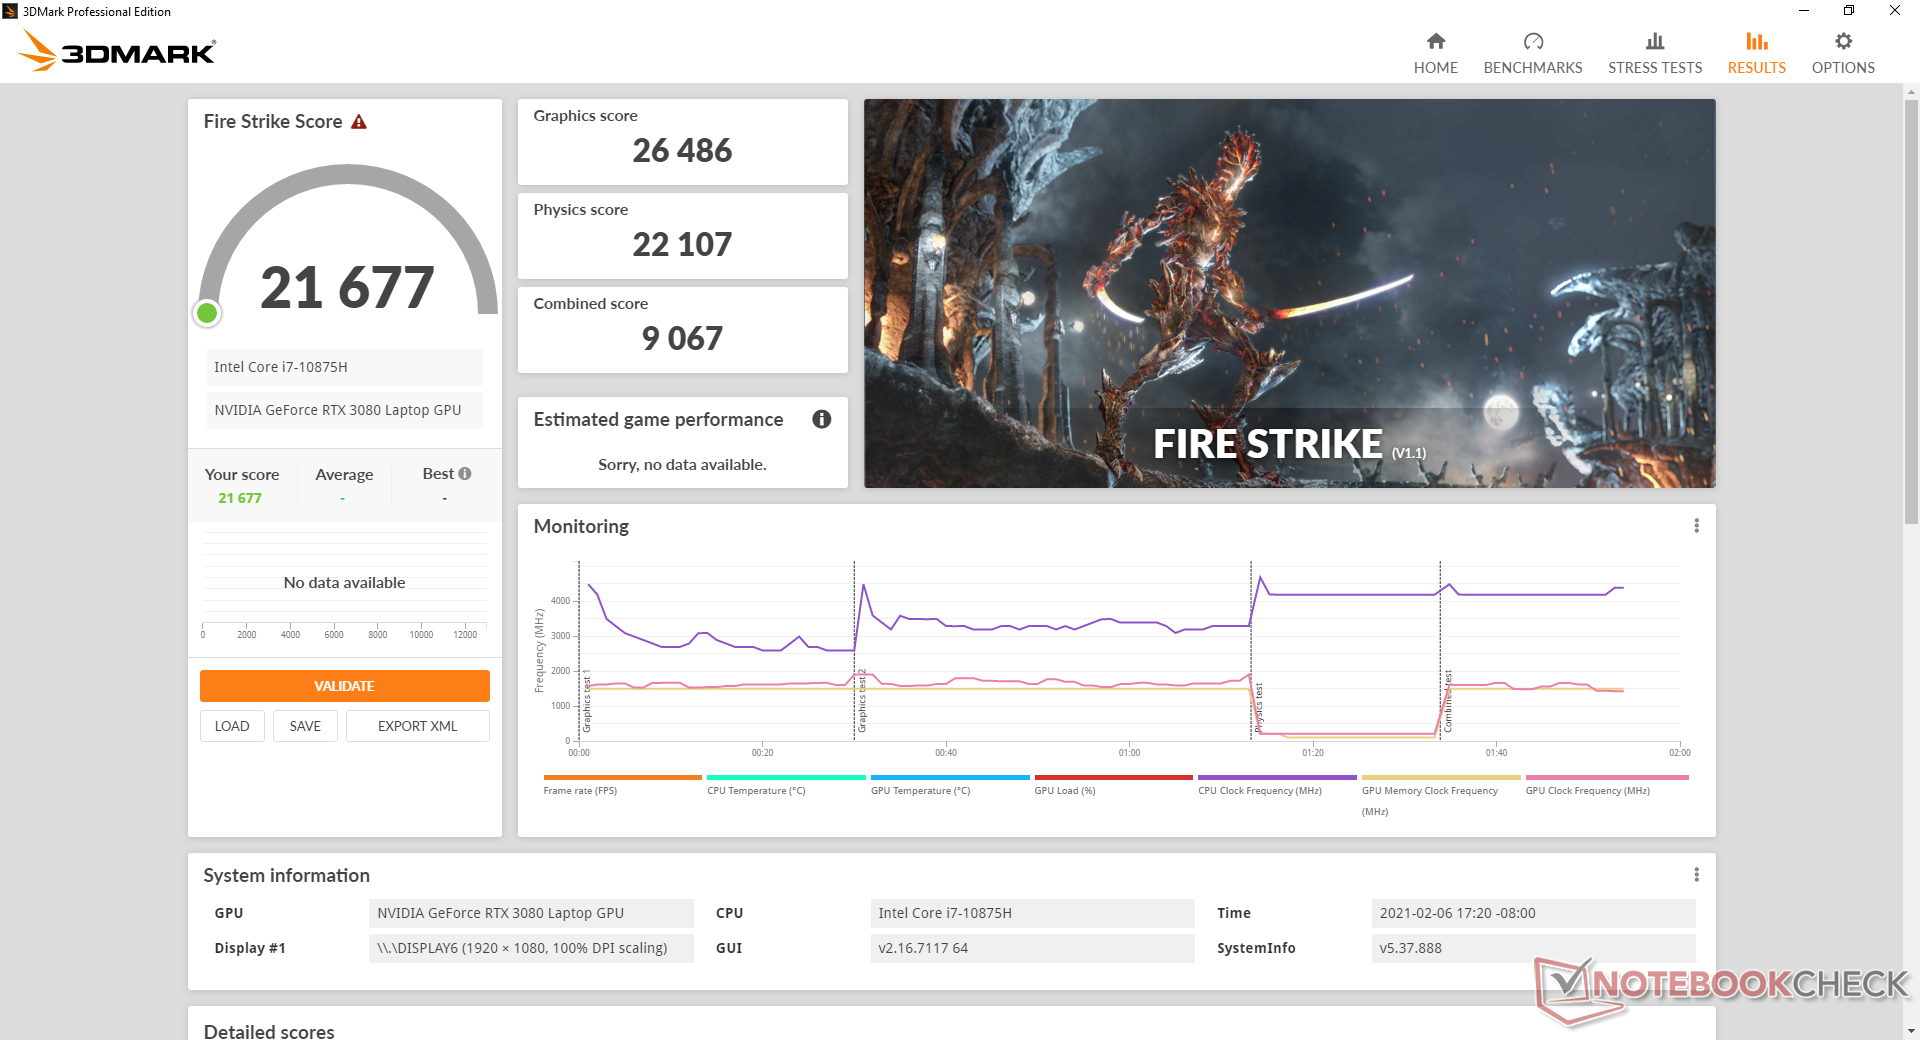
| 3DMark Fire Strike Score | 21677 points | |
| 3DMark Time Spy Score | 10777 points | |
Help | ||
| low | med. | high | ultra | QHD | 4K | |
|---|---|---|---|---|---|---|
| GTA V (2015) | 181 | 174 | 164 | 99.5 | 92.5 | 106 |
| The Witcher 3 (2015) | 368 | 288.6 | 208.1 | 108.3 | 80 | |
| Dota 2 Reborn (2015) | 158 | 147 | 139 | 134 | 128 | |
| Final Fantasy XV Benchmark (2018) | 176 | 140 | 109 | 84.3 | 49.3 | |
| X-Plane 11.11 (2018) | 126 | 113 | 92.3 | 79 | ||
| Strange Brigade (2018) | 437 | 278 | 223 | 197 | 143 | 84.1 |
Emissions
System Noise
Fan noise and behavior are similar to last year's model. The system is silent when idling on desktop on High Performance mode, but even the slightest loads like web browsing or video streaming can cause fan noise to jump to 31 dB(A). To avoid the RPM pulsing, Power Saver settings should be enabled when the extra performance isn't needed.
Fan noise when gaming on the default Balanced mode will be steady at about 42 dB(A). If the fans are set manually to maximum, fan noise can go up to the 54 dB(A) range which is not uncommon for ultra-thin gaming laptops under load.
Nvidia Whisper Mode 2.0 is not available here unlike on the MSI GS66 10UG.
| Razer Blade Pro 17 2021 (QHD Touch) GeForce RTX 3080 Laptop GPU, i7-10875H, Samsung PM981a MZVLB1T0HBLR | Razer Blade Pro 17 RTX 2070 Max-Q 300 Hz GeForce RTX 2070 Max-Q, i7-10875H, Lite-On CA5-8D512 | Schenker XMG Neo 17 (Early 2021, RTX 3070, 5800H) GeForce RTX 3070 Laptop GPU, R7 5800H, Samsung SSD 970 EVO Plus 500GB | MSI GT76 Titan DT 10SGS GeForce RTX 2080 Super Mobile, i9-10900K, 2x WDC PC SN730 SDBPNTY-1T00 (RAID 0) | Asus Strix G17 G712LWS GeForce RTX 2070 Super Mobile, i7-10750H, Intel SSD 660p 1TB SSDPEKNW010T8 | MSI GS75 10SF-609US GeForce RTX 2070 Max-Q, i7-10875H, WDC PC SN730 SDBPNTY-512G | |
|---|---|---|---|---|---|---|
| Noise | -2% | -8% | -2% | -11% | -10% | |
| off / environment * (dB) | 26.1 | 28.2 -8% | 24 8% | 26.4 -1% | 25 4% | 26.2 -0% |
| Idle Minimum * (dB) | 26.1 | 28.2 -8% | 29 -11% | 27.5 -5% | 32 -23% | 31.2 -20% |
| Idle Average * (dB) | 26.5 | 28.2 -6% | 32 -21% | 27.5 -4% | 34 -28% | 31.4 -18% |
| Idle Maximum * (dB) | 30.7 | 30.5 1% | 38 -24% | 29.8 3% | 37 -21% | 34 -11% |
| Load Average * (dB) | 43.5 | 42.2 3% | 49 -13% | 30.9 29% | 51 -17% | 49.5 -14% |
| Witcher 3 ultra * (dB) | 54 | 53 2% | 53 2% | 60.7 -12% | 50 7% | 50.6 6% |
| Load Maximum * (dB) | 55 | 55.5 -1% | 55 -0% | 66.6 -21% | 53 4% | 60.7 -10% |
* ... smaller is better
Noise level
| Idle |
| 26.1 / 26.5 / 30.7 dB(A) |
| Load |
| 43.5 / 55 dB(A) |
 | ||
30 dB silent 40 dB(A) audible 50 dB(A) loud |
||
min: | ||
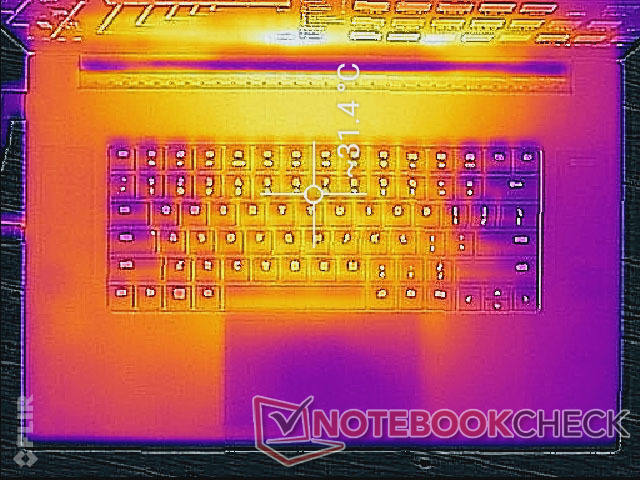
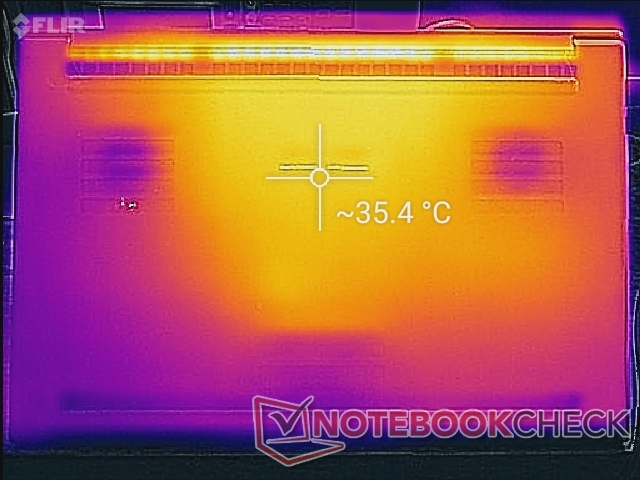
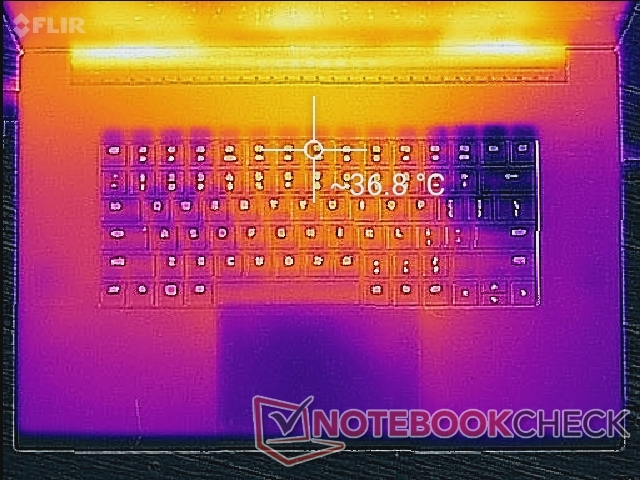
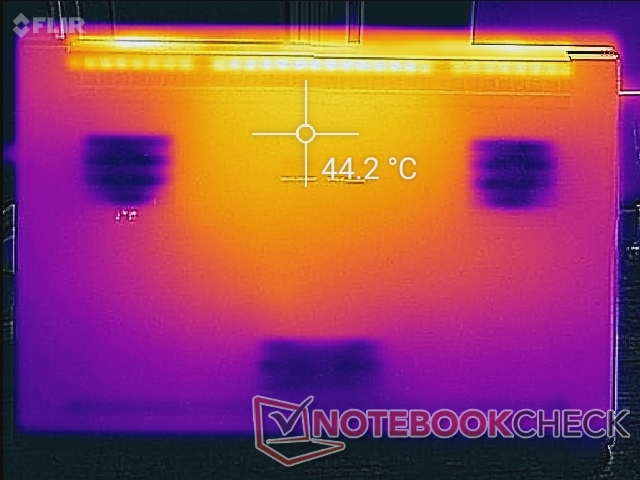
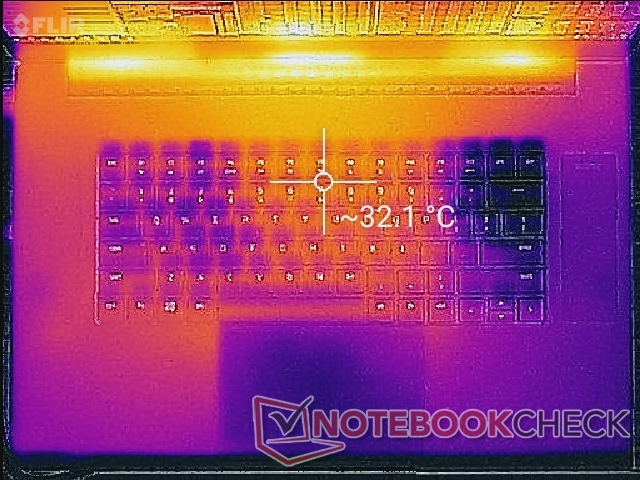
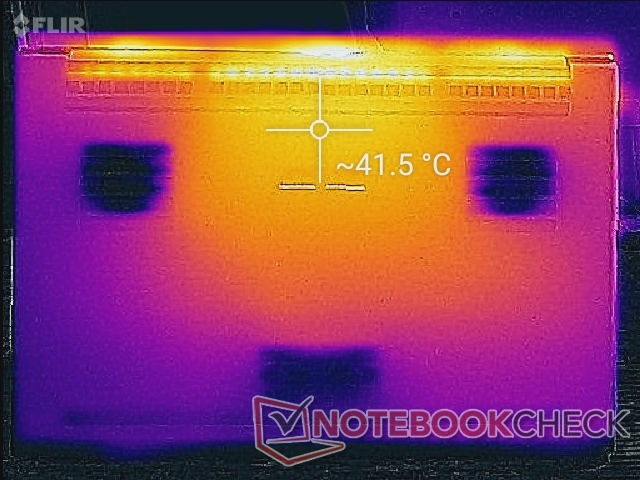
Temperature
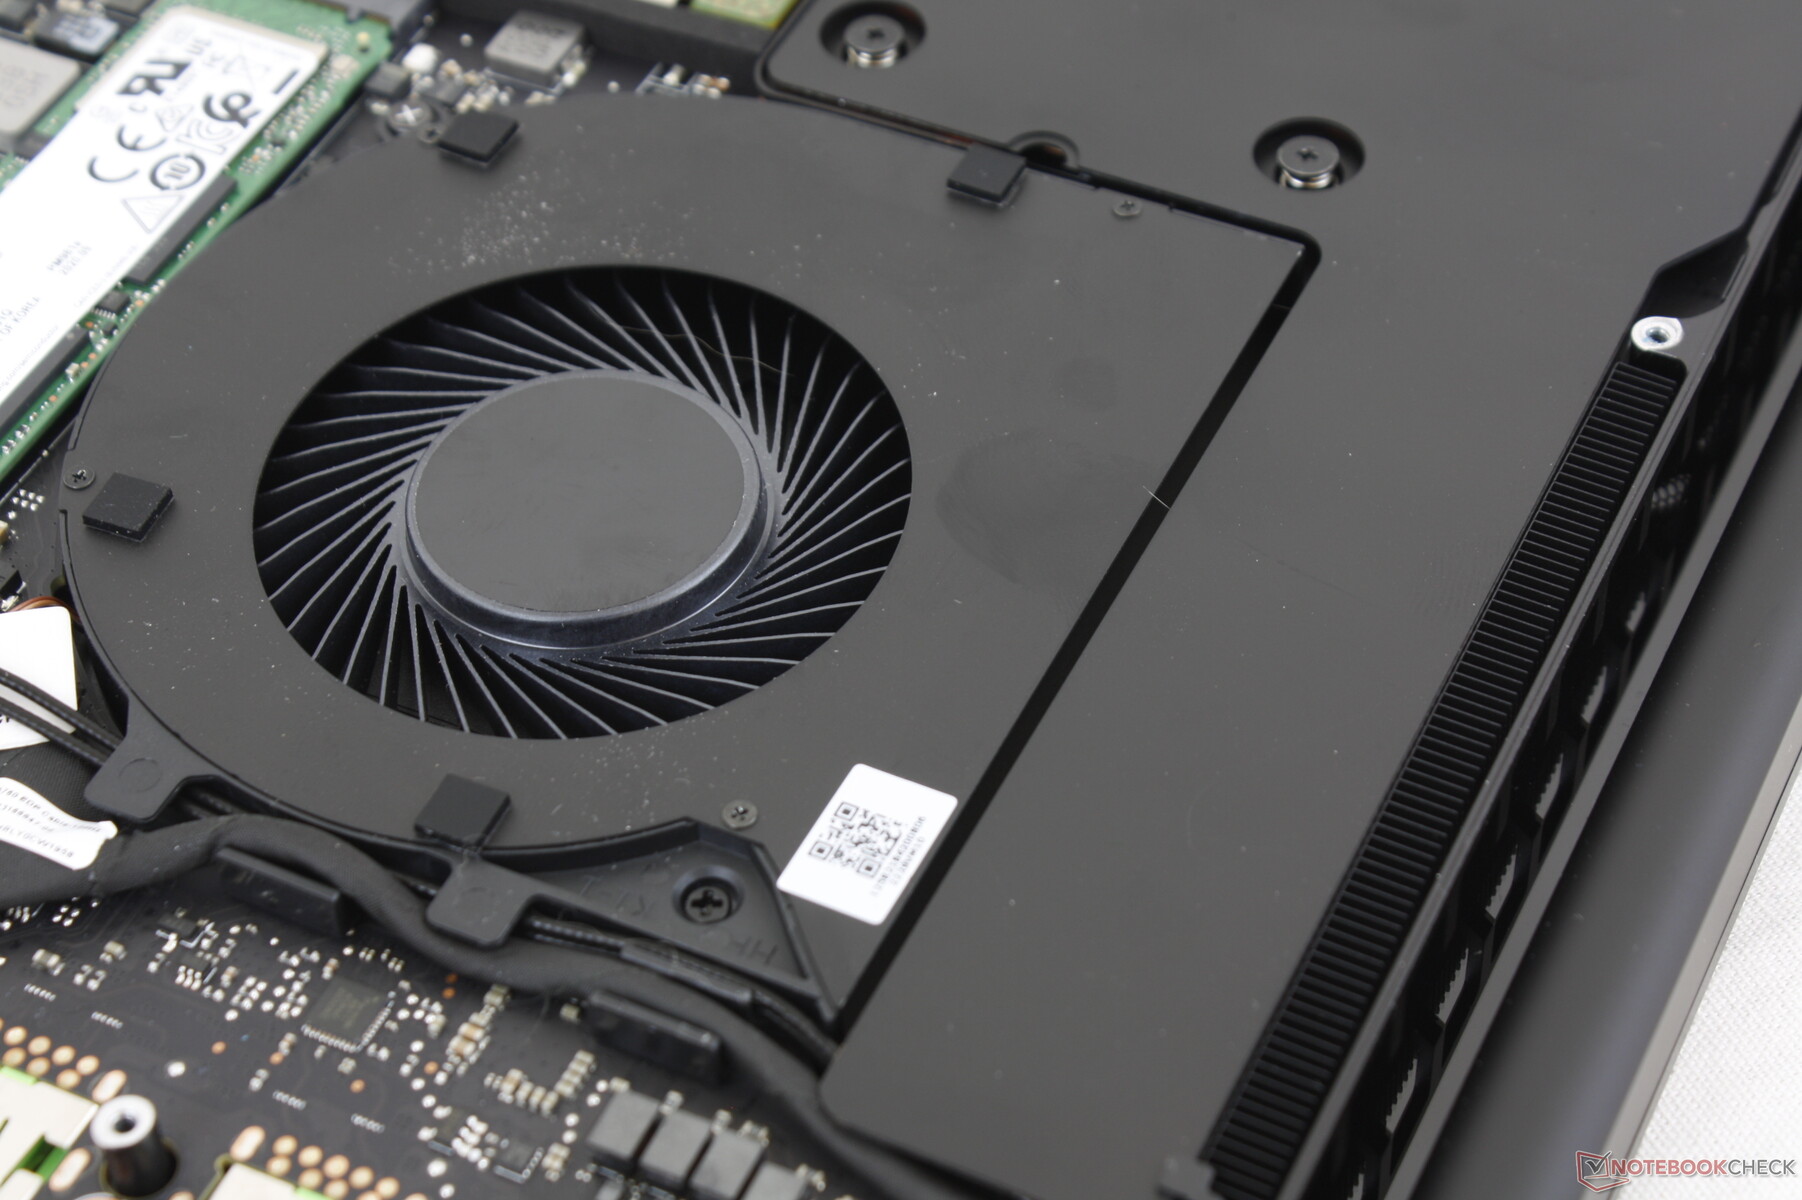
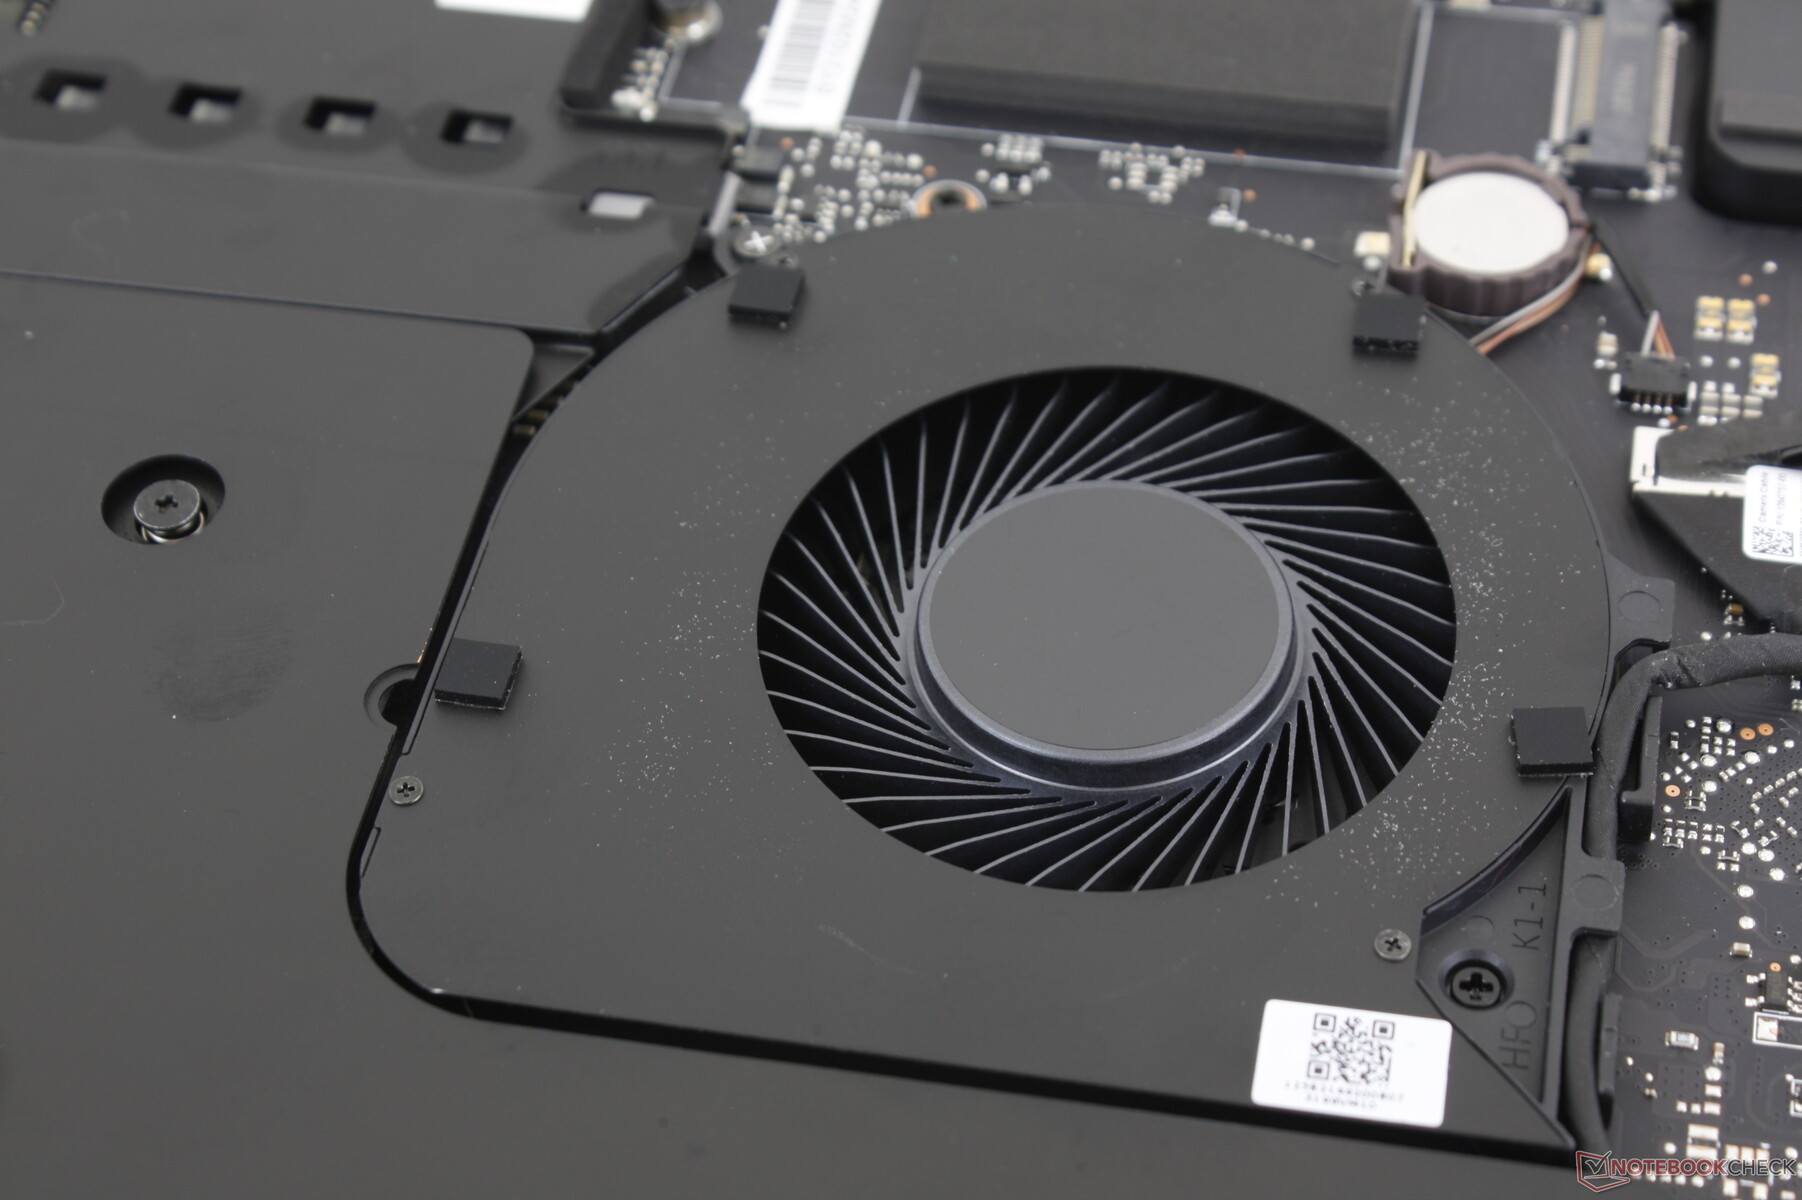
Surface temperatures are still relatively warm with hot spots between 36 C and 45 C on the top and bottom, respectively, when running games. The palm rests will be warmer than on most other gaming laptops due to the tight unibody design of the Razer. The warmth isn't hot enough to be a hindrance, but it's definitely noticeable on the palm when gaming. Moving the two small fans underneath the clickpad to the palm rests instead could potentially help cool the palm rests.
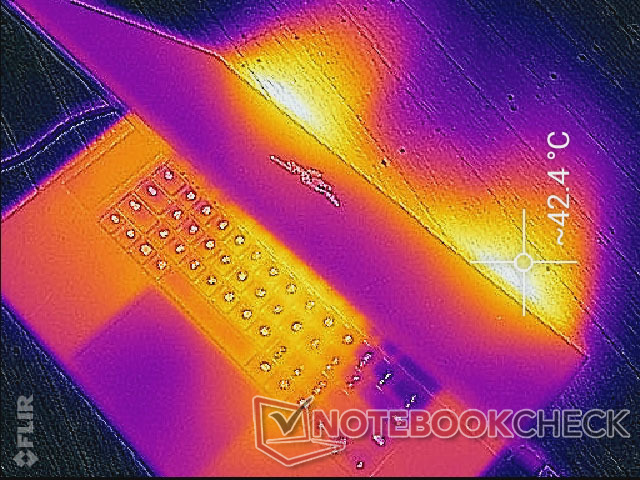
(+) The maximum temperature on the upper side is 38.2 °C / 101 F, compared to the average of 40.4 °C / 105 F, ranging from 21.2 to 68.8 °C for the class Gaming.
(±) The bottom heats up to a maximum of 42.2 °C / 108 F, compared to the average of 43.3 °C / 110 F
(+) In idle usage, the average temperature for the upper side is 29.3 °C / 85 F, compared to the device average of 33.9 °C / 93 F.
(±) Playing The Witcher 3, the average temperature for the upper side is 33.1 °C / 92 F, compared to the device average of 33.9 °C / 93 F.
(+) The palmrests and touchpad are cooler than skin temperature with a maximum of 30.4 °C / 86.7 F and are therefore cool to the touch.
(±) The average temperature of the palmrest area of similar devices was 28.8 °C / 83.8 F (-1.6 °C / -2.9 F).
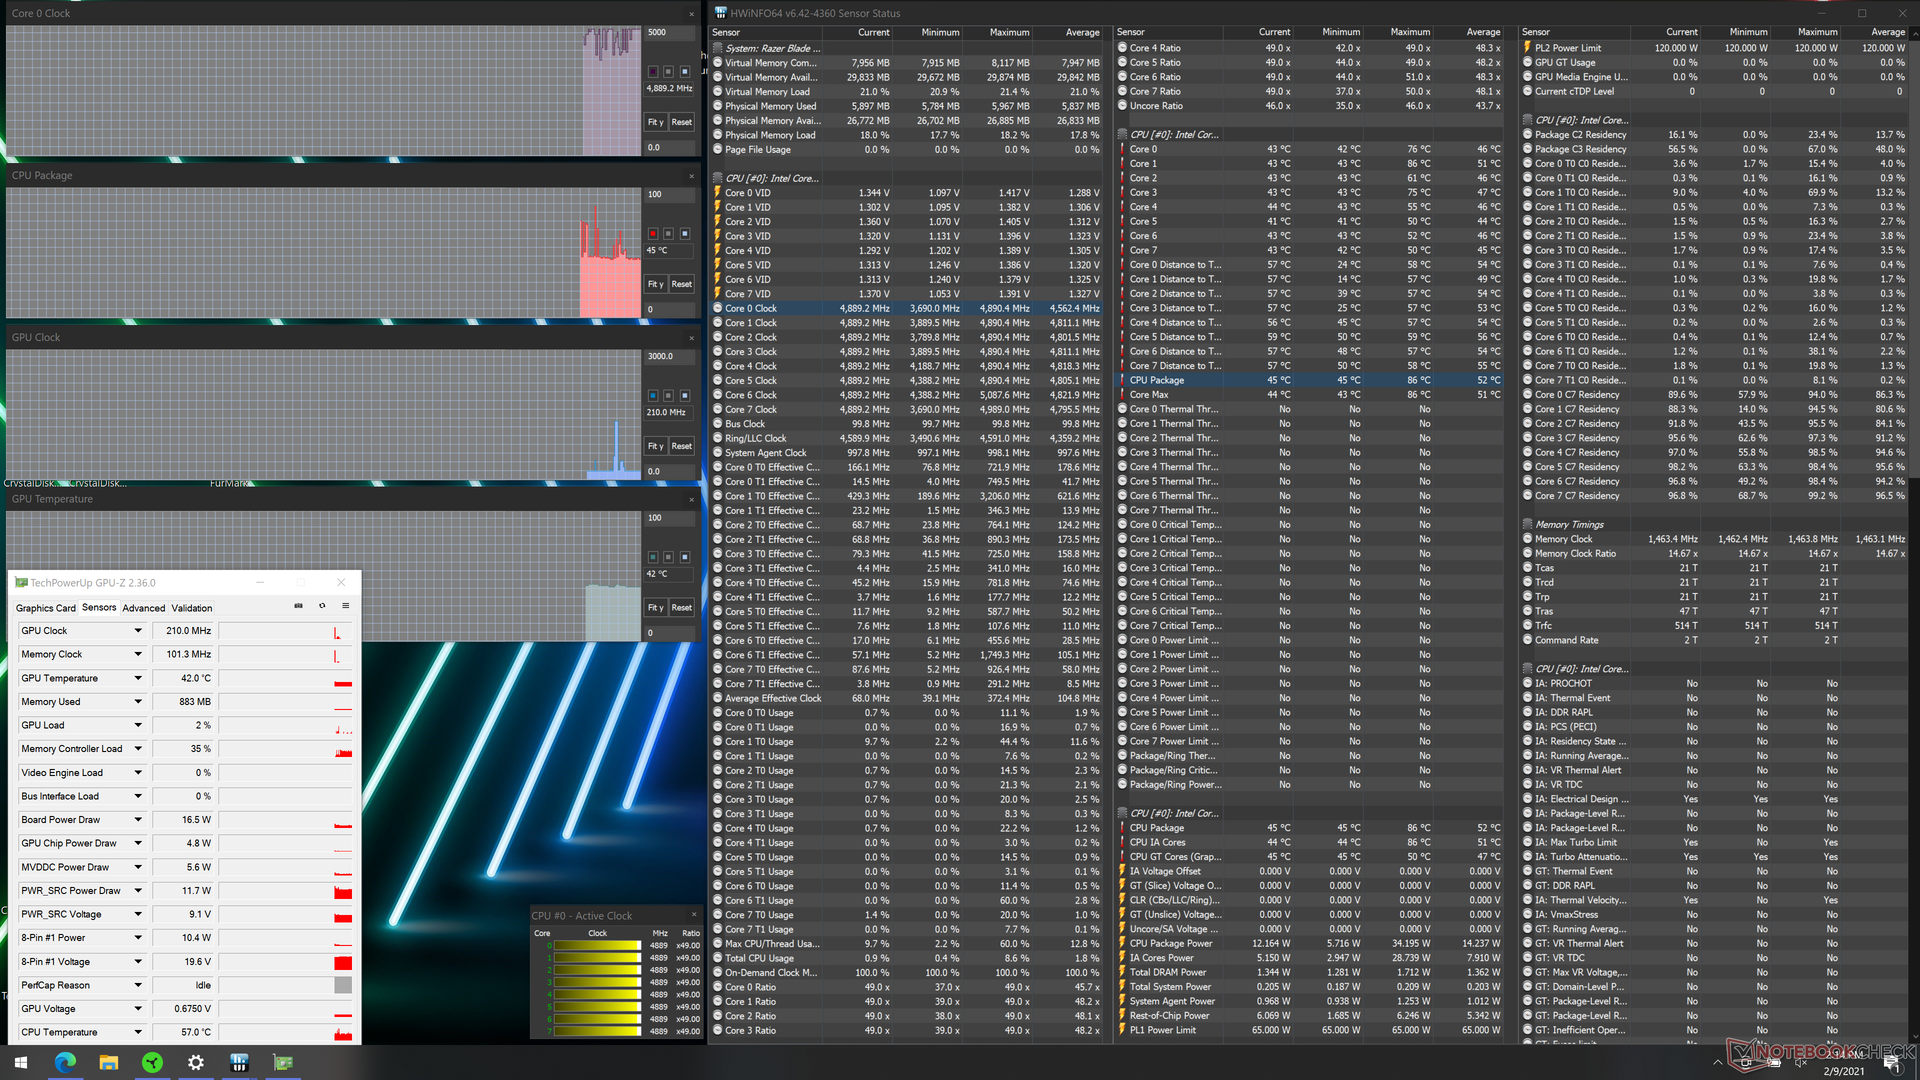
Stress Test
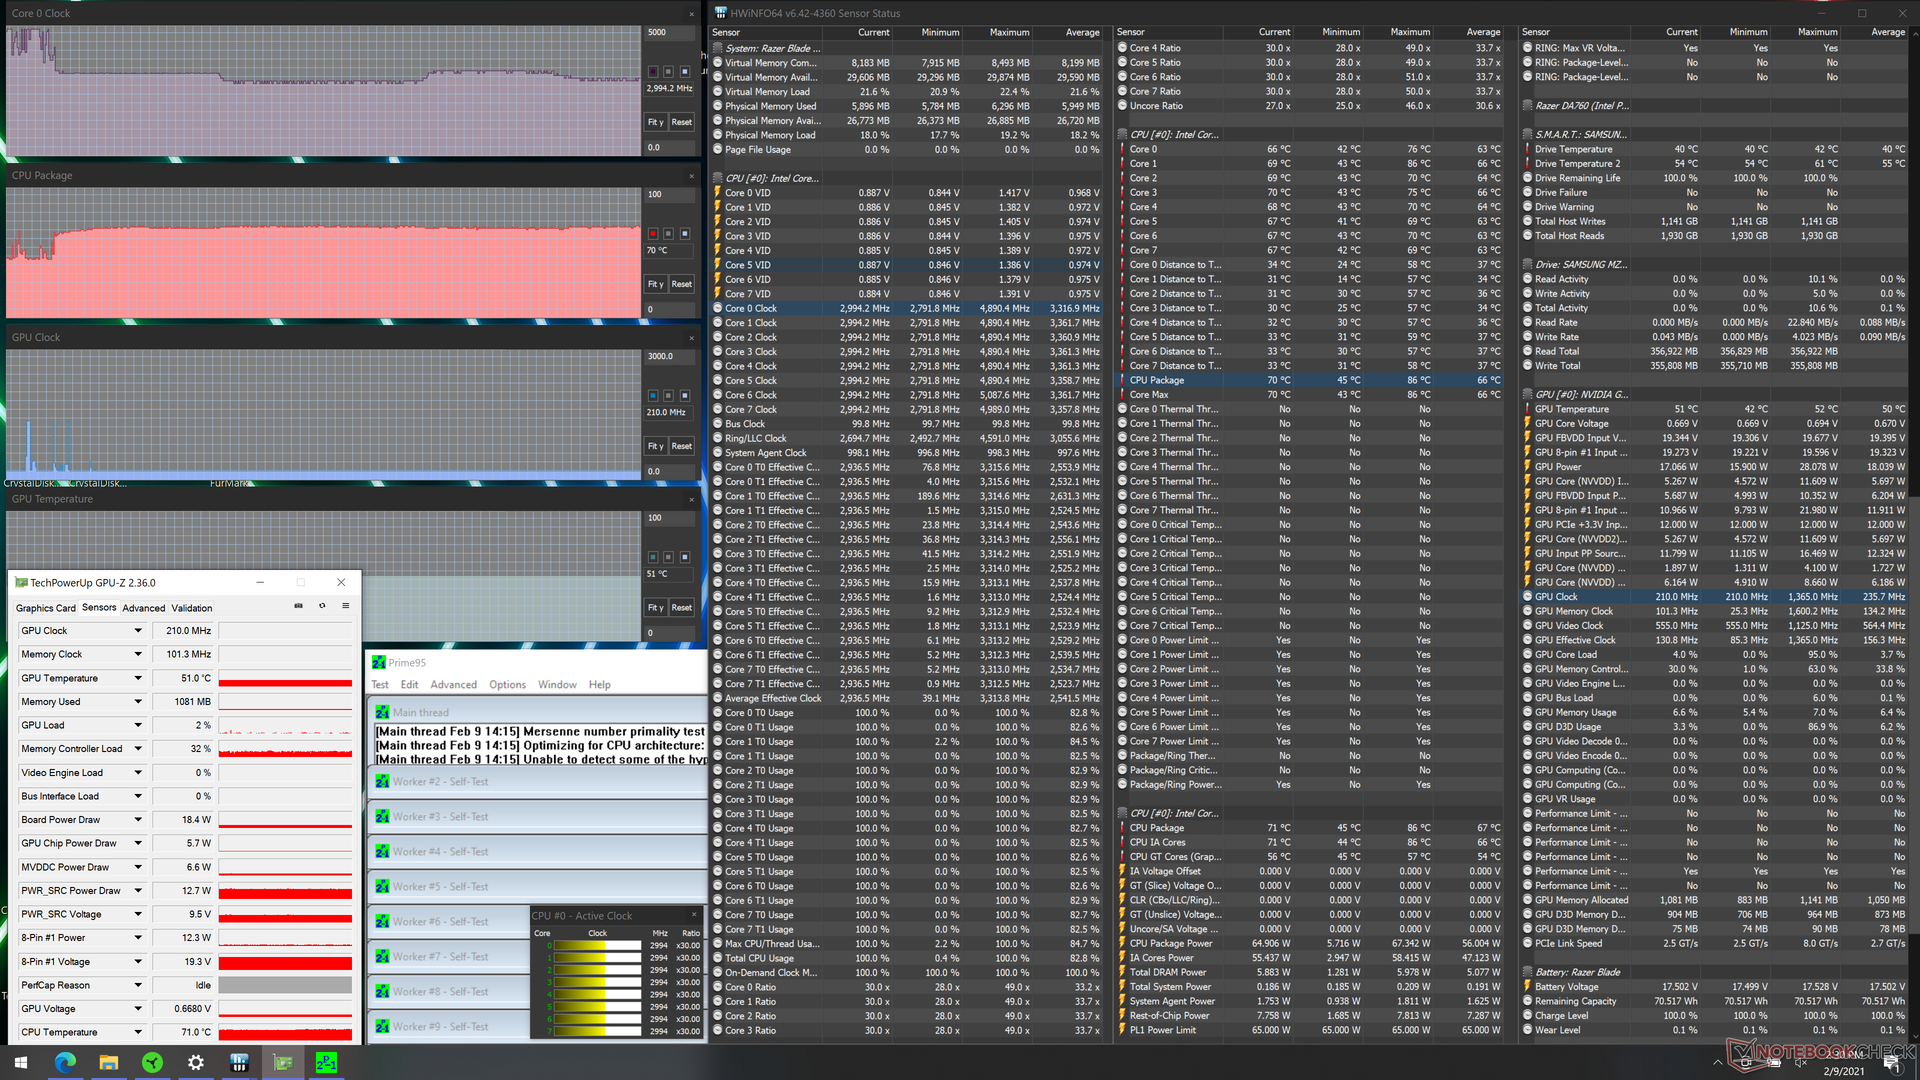
When stressed with Prime95, the CPU would boost to just 2.8 to 3.2 GHz and not any higher which is rather disappointing because the Core i7-10875H is capable of faster Turbo Boost clock rates. The Core i7-10870H in the competing MSI GS66, for example, can boost up to 4 GHz at least temporarily. We're not sure if this is intentional by Razer either because core temperature would stabilize at just 70 C to be a bit cooler than what we're normally used to on Core-H laptops. Note that we had set our system to High Performance mode with both the CPU and GPU set to maximum via Synapse prior to running Prime95 and so the system should be performing at its best in this scenario.
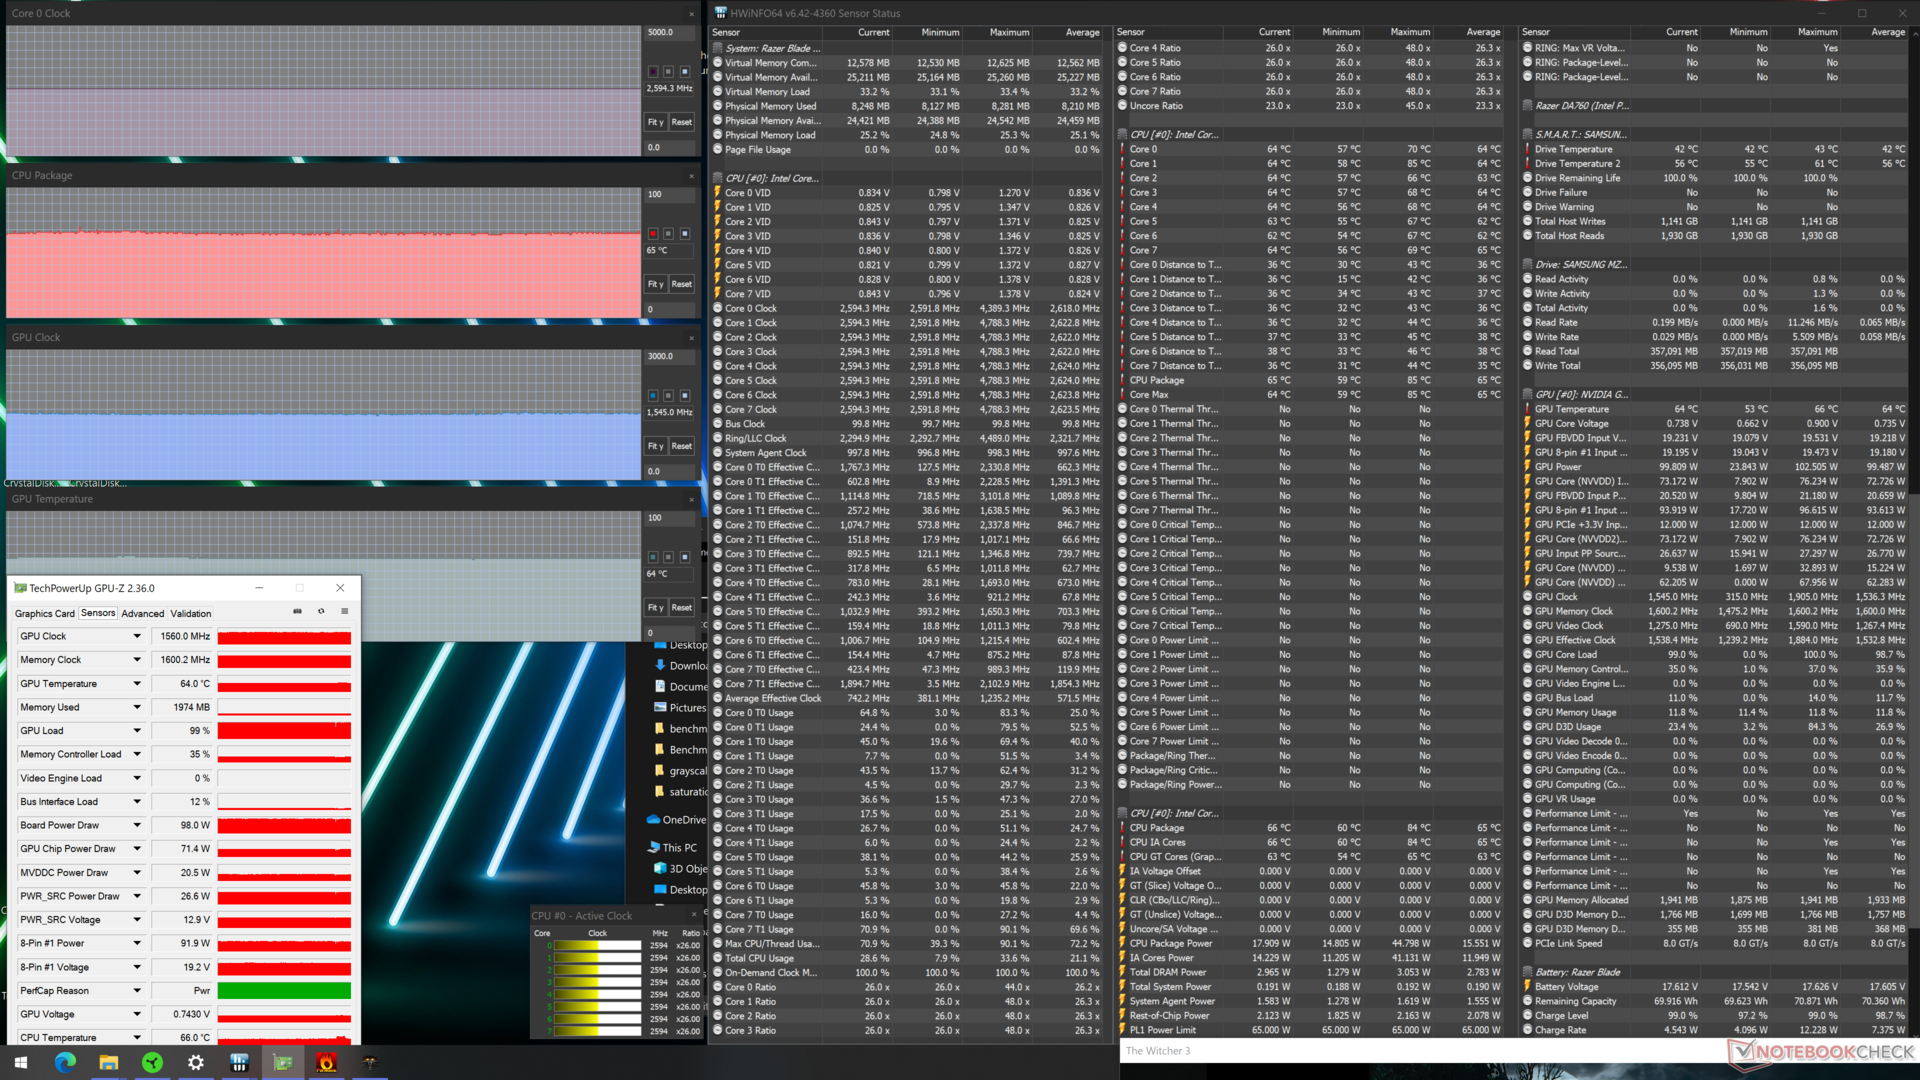
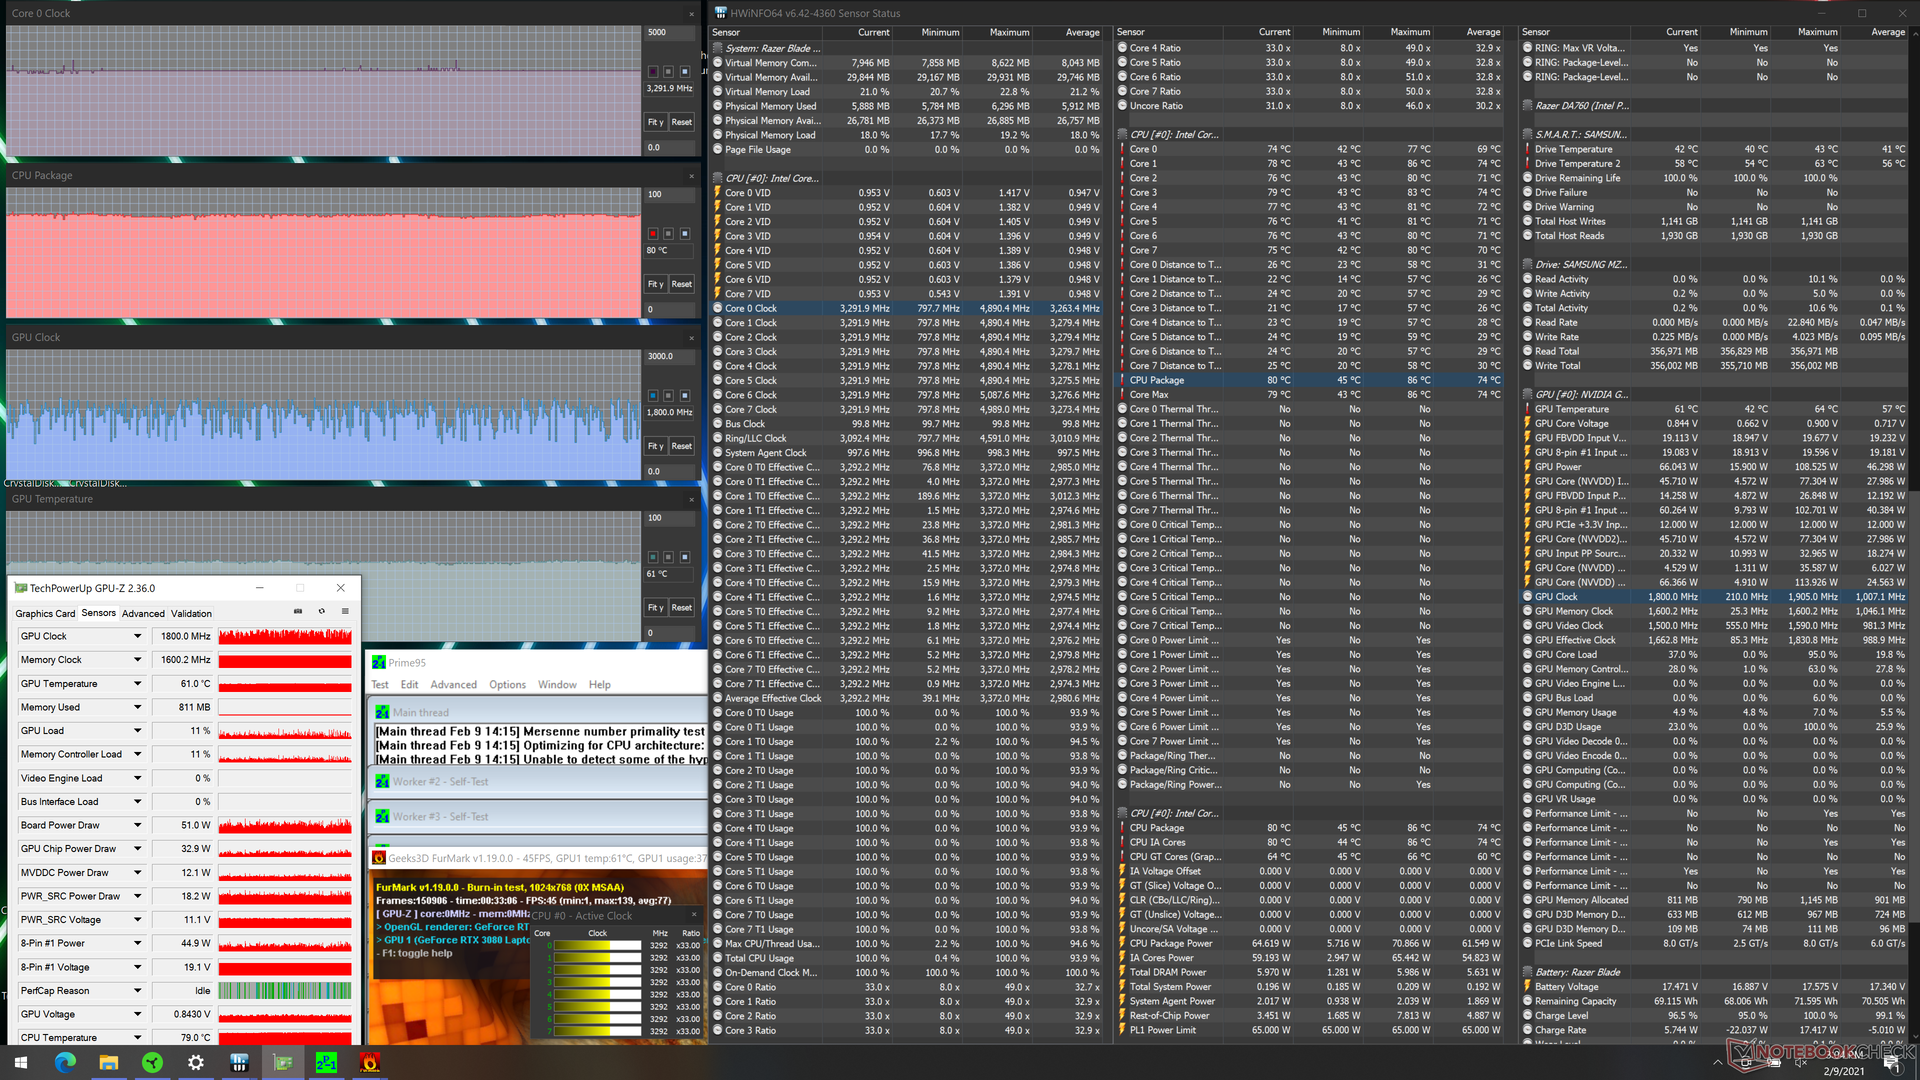
When running both Prime95 and FurMark simultaneously, the CPU remains relatively steady at 3.3 GHz and 80 C while the GPU throttles quite heavily. According to GPU-Z, clock rates and board power draw would cycle between 930 MHz to 1815 MHz and 40 W to 103.5 W, respectively.
GPU performance is thankfully much steadier when running real-world games. Witcher 3 stress, for example, causes the GPU to stabilize at 1560 MHz and at a board power draw of 98 W with relatively cool core temperatures in the mid 60 C range.
Running on battery power limits performance. A Time Spy run on batteries would return Physics and Graphics scores of just 2731 and 2349 points, respectively, compared to 10140 and 10989 points when on mains.
| CPU Clock (GHz) | GPU Clock (MHz) | Average CPU Temperature (°C) | Average GPU Temperature (°C) | |
| System Idle | -- | -- | 45 | 42 |
| Prime95 Stress | 2.8 - 3.2 | -- | 70 | 51 |
| Prime95 + FurMark Stress | 3.3 | 930 - 1815 | 80 | 61 |
| Witcher 3 Stress | 2.6 | 1560 | 65 | 64 |
Speakers


Razer Blade Pro 17 2021 (QHD Touch) audio analysis
(+) | speakers can play relatively loud (86.2 dB)
Bass 100 - 315 Hz
(-) | nearly no bass - on average 19.5% lower than median
(±) | linearity of bass is average (11.2% delta to prev. frequency)
Mids 400 - 2000 Hz
(+) | balanced mids - only 3.4% away from median
(+) | mids are linear (3.6% delta to prev. frequency)
Highs 2 - 16 kHz
(+) | balanced highs - only 2.8% away from median
(+) | highs are linear (5.2% delta to prev. frequency)
Overall 100 - 16.000 Hz
(+) | overall sound is linear (13.6% difference to median)
Compared to same class
» 20% of all tested devices in this class were better, 7% similar, 73% worse
» The best had a delta of 6%, average was 18%, worst was 132%
Compared to all devices tested
» 14% of all tested devices were better, 4% similar, 82% worse
» The best had a delta of 4%, average was 24%, worst was 134%
Apple MacBook 12 (Early 2016) 1.1 GHz audio analysis
(+) | speakers can play relatively loud (83.6 dB)
Bass 100 - 315 Hz
(±) | reduced bass - on average 11.3% lower than median
(±) | linearity of bass is average (14.2% delta to prev. frequency)
Mids 400 - 2000 Hz
(+) | balanced mids - only 2.4% away from median
(+) | mids are linear (5.5% delta to prev. frequency)
Highs 2 - 16 kHz
(+) | balanced highs - only 2% away from median
(+) | highs are linear (4.5% delta to prev. frequency)
Overall 100 - 16.000 Hz
(+) | overall sound is linear (10.2% difference to median)
Compared to same class
» 7% of all tested devices in this class were better, 2% similar, 91% worse
» The best had a delta of 5%, average was 18%, worst was 53%
Compared to all devices tested
» 4% of all tested devices were better, 1% similar, 94% worse
» The best had a delta of 4%, average was 24%, worst was 134%
Energy Management
Power Consumption
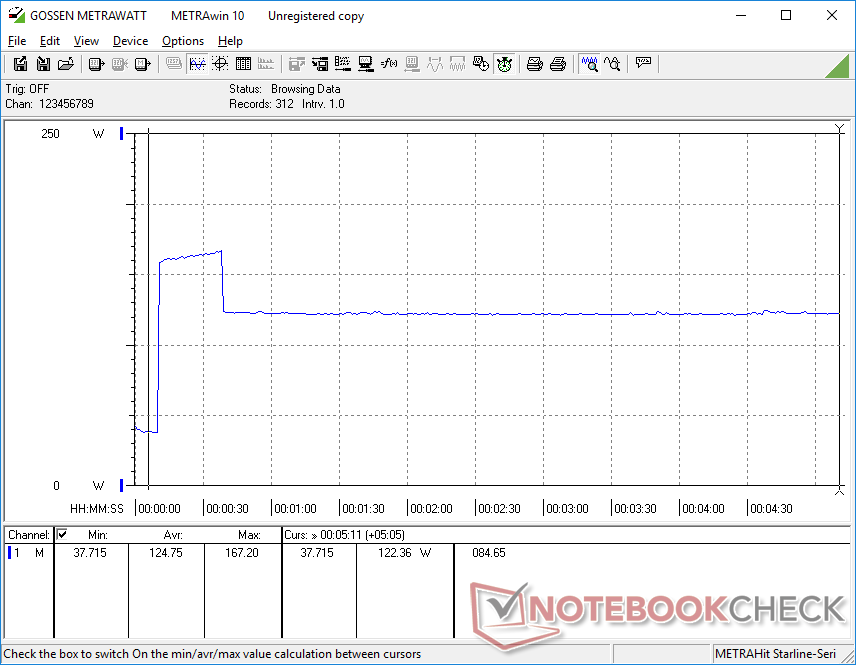
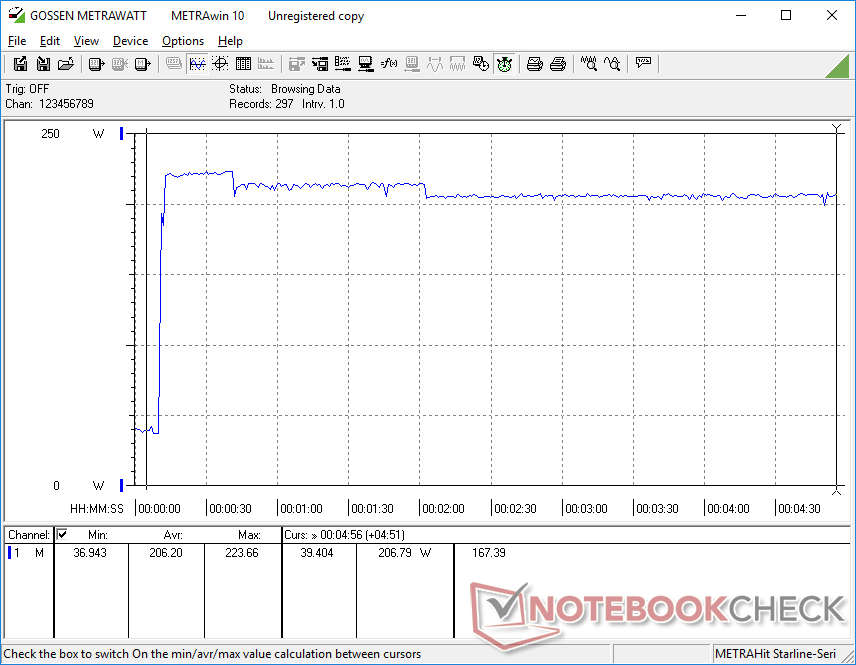
Idling on desktop draws 15 W at minimum when all settings are tuned to Power Saver mode including the integrated GPU. Idling on High Performance mode with the discrete GPU active can consume over twice as much at 37 W.
When gaming, results are similar to what we observed on the RTX 2070-powered Blade Pro 17 and MSI GS66. Owners are therefore getting 25 to 35 percent faster graphics performance at the same power consumption levels for higher gen-to-gen performance-per-watt.
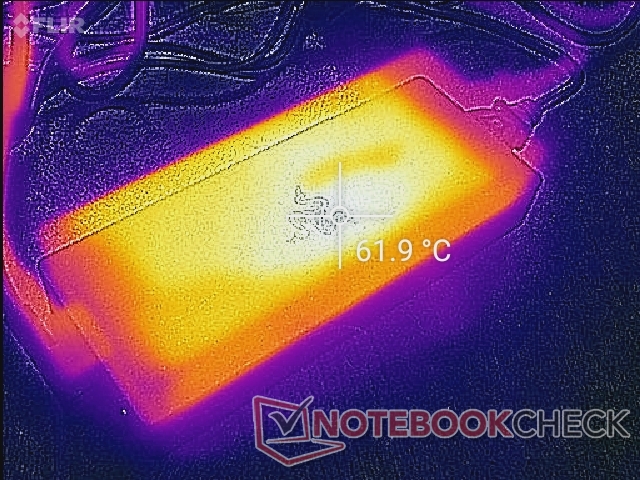
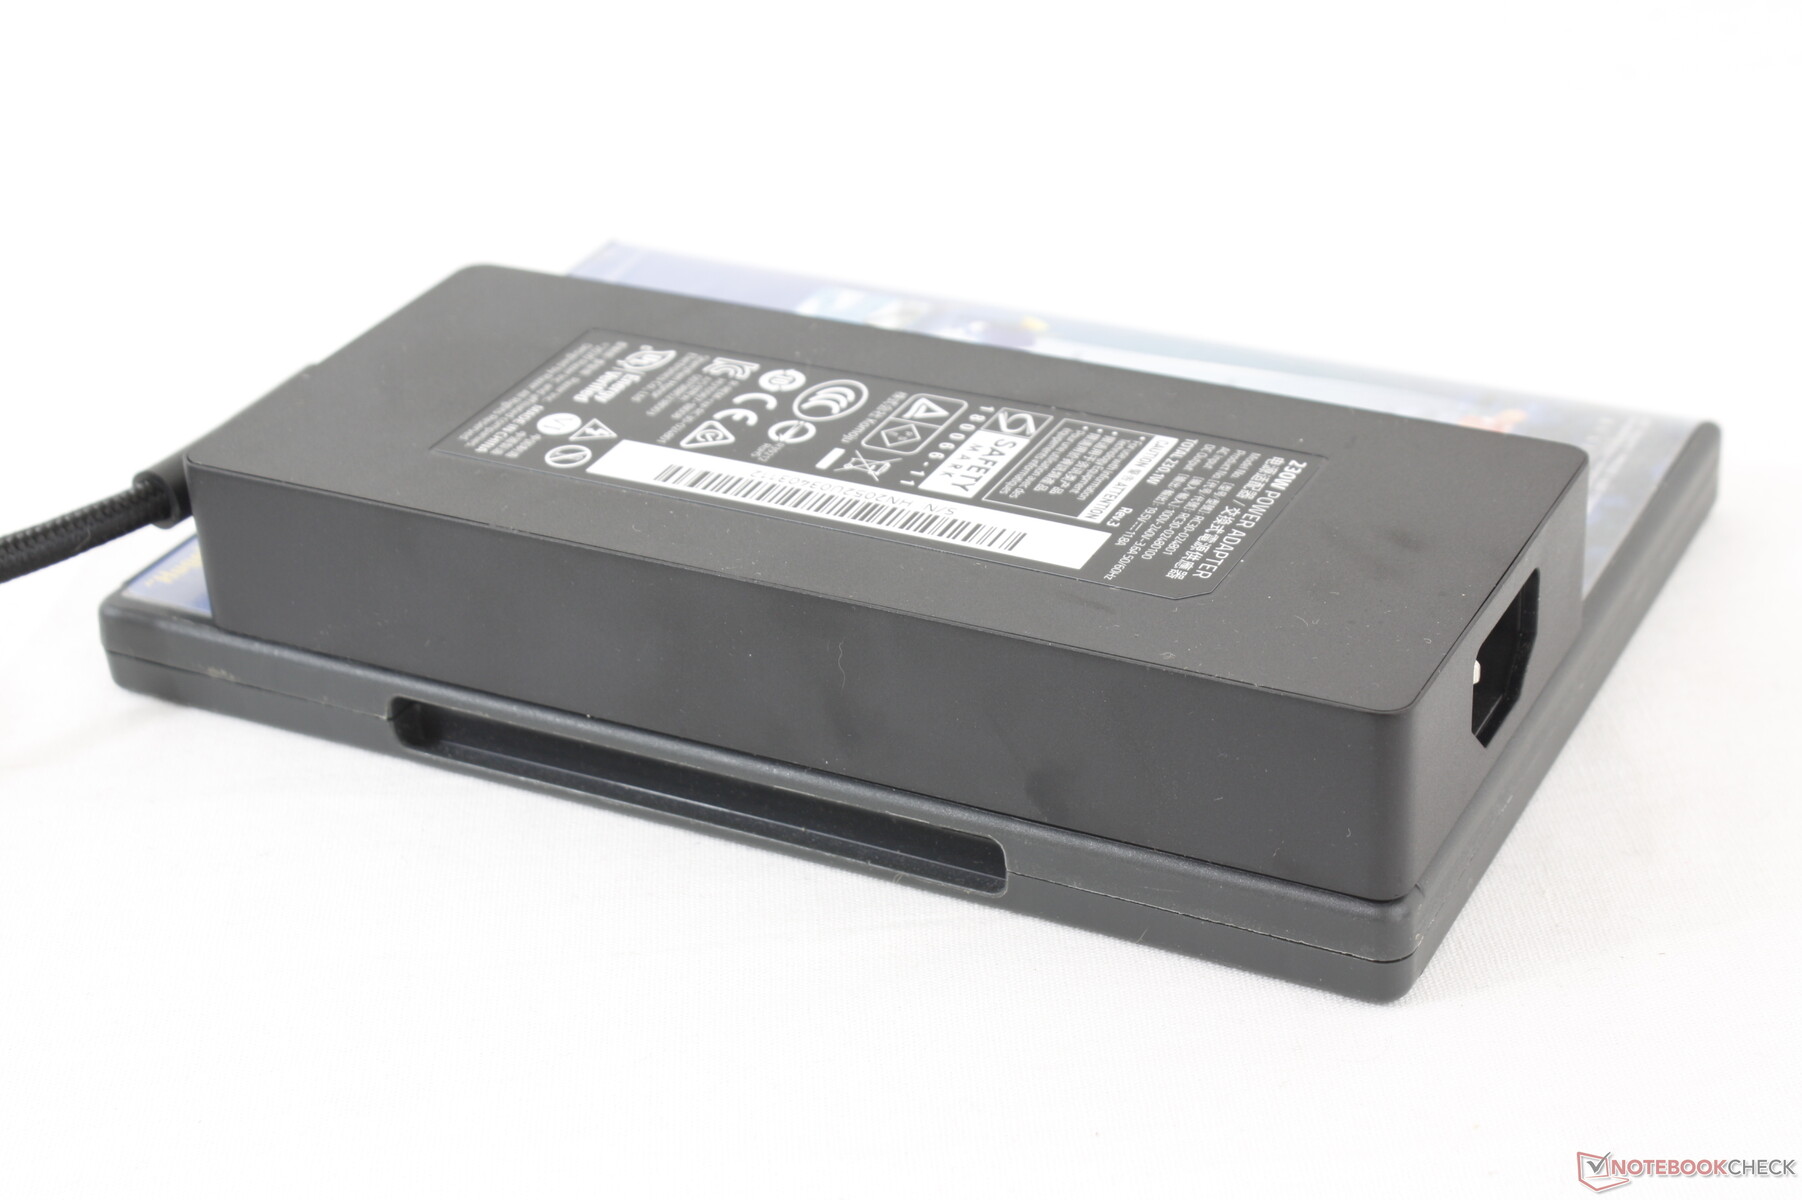
Running Prime95 and FurMark simultaneously would draw 224 W from the small-medium (17 x 7 x 2.5 cm) 230 W AC adapter. Charge rate will slow if running such extreme loads.
| Off / Standby | |
| Idle | |
| Load |
|
Key:
min: | |
| Razer Blade Pro 17 2021 (QHD Touch) i7-10875H, GeForce RTX 3080 Laptop GPU, Samsung PM981a MZVLB1T0HBLR, IPS, 3840x2160, 17.3" | Razer Blade Pro 17 RTX 2070 Max-Q 300 Hz i7-10875H, GeForce RTX 2070 Max-Q, Lite-On CA5-8D512, IPS, 1920x1080, 17.3" | Schenker XMG Neo 17 (Early 2021, RTX 3070, 5800H) R7 5800H, GeForce RTX 3070 Laptop GPU, Samsung SSD 970 EVO Plus 500GB, IPS, 2560x1440, 17.3" | MSI GT76 Titan DT 10SGS i9-10900K, GeForce RTX 2080 Super Mobile, 2x WDC PC SN730 SDBPNTY-1T00 (RAID 0), IPS, 3840x2160, 17.3" | Asus Strix G17 G712LWS i7-10750H, GeForce RTX 2070 Super Mobile, Intel SSD 660p 1TB SSDPEKNW010T8, IPS, 1920x1080, 17.3" | MSI GS75 10SF-609US i7-10875H, GeForce RTX 2070 Max-Q, WDC PC SN730 SDBPNTY-512G, IPS, 1920x1080, 17.3" | |
|---|---|---|---|---|---|---|
| Power Consumption | -5% | 4% | -69% | 10% | -6% | |
| Idle Minimum * (Watt) | 15.2 | 19.6 -29% | 13 14% | 25.9 -70% | 10 34% | 19.2 -26% |
| Idle Average * (Watt) | 20.3 | 21.7 -7% | 16 21% | 38 -87% | 14 31% | 22.4 -10% |
| Idle Maximum * (Watt) | 37.3 | 36.1 3% | 26 30% | 53.2 -43% | 25 33% | 34.7 7% |
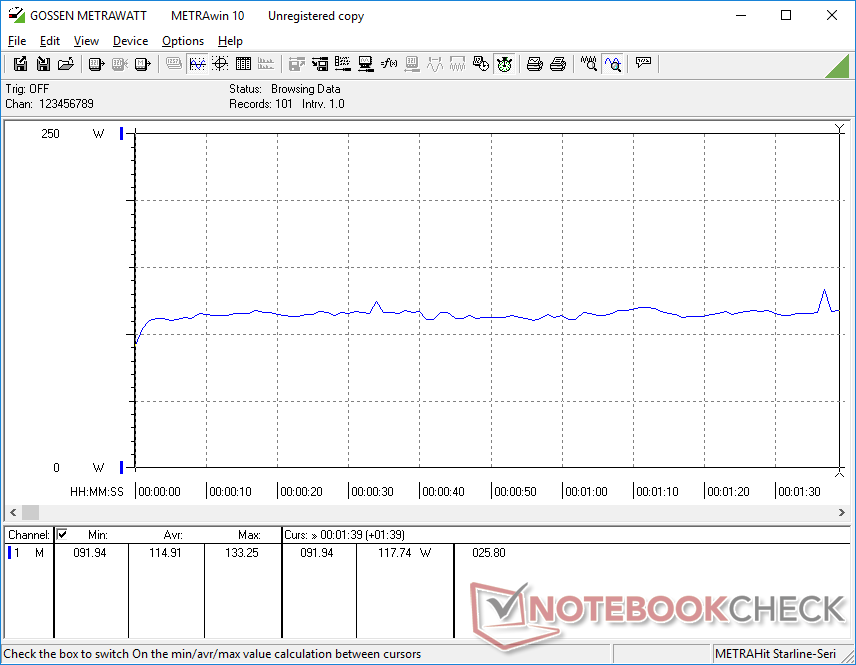
| Load Average * (Watt) | 114.9 | 115.6 -1% | 125 -9% | 123.8 -8% | 134 -17% | 106.7 7% |
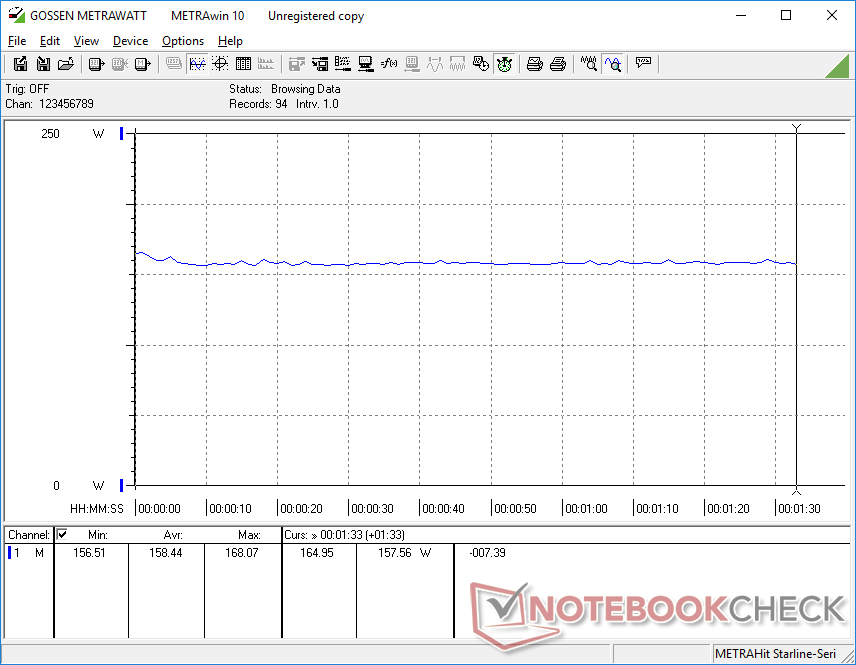
| Witcher 3 ultra * (Watt) | 158.4 | 157 1% | 187 -18% | 312.5 -97% | 186 -17% | 160.5 -1% |
| Load Maximum * (Watt) | 223.7 | 219.9 2% | 259 -16% | 459.8 -106% | 230 -3% | 248.7 -11% |
* ... smaller is better
Battery Life
Runtimes are are about the same as last year's model if not slightly longer at about 6 hours of real-world WLAN use. The MSI GS66 can run for even longer as it comes with a larger capacity battery (99 Wh vs 70 Wh).
Charging from empty to full capacity takes about 1.5 to 2 hours. Third-party USB-C chargers will also work albeit at much slower recharge rates.
| Razer Blade Pro 17 2021 (QHD Touch) i7-10875H, GeForce RTX 3080 Laptop GPU, 70.5 Wh | Razer Blade Pro 17 RTX 2070 Max-Q 300 Hz i7-10875H, GeForce RTX 2070 Max-Q, 70 Wh | Schenker XMG Neo 17 (Early 2021, RTX 3070, 5800H) R7 5800H, GeForce RTX 3070 Laptop GPU, 62 Wh | MSI GT76 Titan DT 10SGS i9-10900K, GeForce RTX 2080 Super Mobile, 90 Wh | Asus Strix G17 G712LWS i7-10750H, GeForce RTX 2070 Super Mobile, 66 Wh | MSI GS75 10SF-609US i7-10875H, GeForce RTX 2070 Max-Q, 80.25 Wh | |
|---|---|---|---|---|---|---|
| Battery runtime | -17% | -48% | -59% | -0% | 54% | |
| Reader / Idle (h) | 9.9 | 4.7 -53% | 9.1 -8% | 8.6 -13% | ||
| WiFi v1.3 (h) | 5.9 | 4.9 -17% | 3.5 -41% | 2.4 -59% | 5.5 -7% | 4.9 -17% |
| Load (h) | 1.4 | 0.7 -50% | 1.6 14% | 4.1 193% |
Pros
Cons
Verdict
The mobile GeForce RTX 3080 here offers about 15 to 25 percent faster raw graphics performance than the RTX 2080 Super Max-Q which was the fastest GPU available for the 2020 Blade Pro 17. As of this writing, our RTX 3080 configuration comes with twice the RAM (32 GB vs. 16 GB) than the RTX 2080 Super Max-Q configuration for only $100 USD more ($3500 vs. $3600) when all other specifications are held equal. If you're in the market for a new Razer, then you may as well spend the extra $100 for both the extra RAM and GPU performance or wait for steeper price cuts on the older 2020 models.
The 2021 Razer Blade Pro is a minor refinement of the 2020 Blade Pro despite the jump to GeForce RTX 30 graphics. Performance is a bit better for slightly higher performance-per-dollar.
The gen-to-gen gains between Nvidia mobile Turing and mobile Ampere are nowhere near as great as the gains between desktop Turing and desktop Ampere because mobile Ampere is limited by the same TGP ceilings as mobile Turing. Ultimately, laptop gamers won't be missing much by going with an older GeForce RTX 20 laptop especially if they can find one on sale.
Price and availability
Best Buy has our exact configuration available for $3600 USD. Of course, users can also purchase directly from Razer at Razerzone.com.
Razer Blade Pro 17 2021 (QHD Touch)
- 02/15/2021 v7 (old)
Allen Ngo
Price comparison
