Razer Blade Stealth Tiger Lake GTX 1650 Ti Max-Q Laptop Review: A Small Step Forward
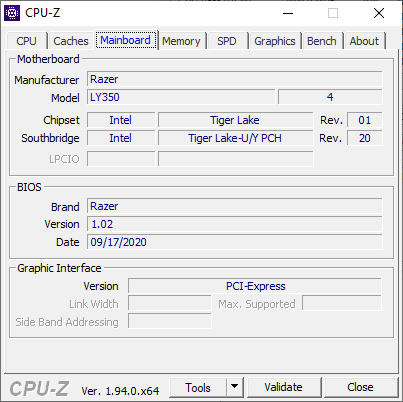
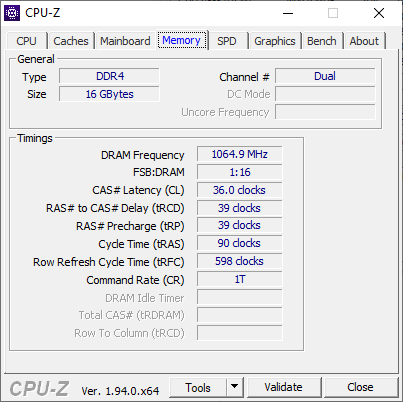
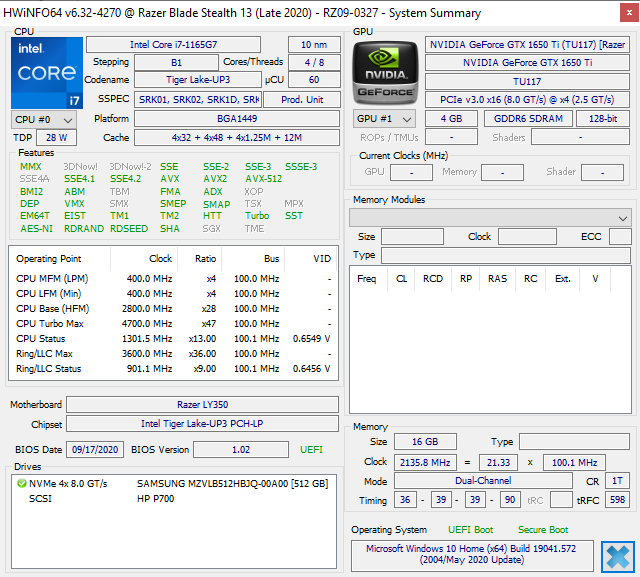
The year wouldn't be complete without some sort of refresh for the Blade Stealth series. Razer has updated its 13.3-inch subnotebook by bumping up the 10th gen Ice Lake Core i7-1065G7 CPU to the 11th gen Tiger Lake Core i7-1165G7 alongside Thunderbolt 4 support and faster RAM (2133.3 MHz vs. 1866.7 MHz). Otherwise, the system comes with the same GeForce GTX 1650 Ti max-Q GPU and chassis design as the 2019 and 2018 models.
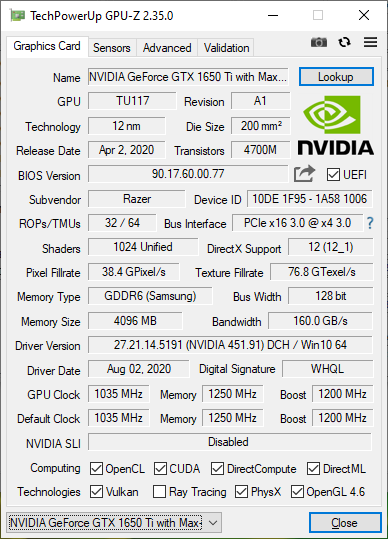
The Ice Lake Blade Stealth series was sort of a mess and so hopefully Razer can get started on the right foot again with Tiger Lake. Prices start at $1800 USD for the 120 Hz FHD matte display or $2000 USD for the 60 Hz 4K OLED glossy touchscreen. Both options come with the same Core i7-1165G7 CPU, 16 GB of soldered RAM, GTX 1650 Ti Max-Q GPU, and 512 GB NVMe SSD. Keep in mind that this is one of the fastest GPUs you can find on any 13-inch laptop as alternatives like the Asus ZenBook 13, MacBook Pro 13, Lenovo Yoga S940, or Dell XPS 13 are typically limited to slower GeForce MX options or none at all.
More Razer reviews:
Rating | Date | Model | Weight | Height | Size | Resolution | Price |
|---|---|---|---|---|---|---|---|
| 85.5 % v7 (old) | 10 / 2020 | Razer Blade Stealth i7-1165G7 GTX 1650 Ti Max-Q i7-1165G7, GeForce GTX 1650 Ti Max-Q | 1.4 kg | 15.3 mm | 13.30" | 1920x1080 | |
| 84.8 % v7 (old) | 06 / 2020 | Razer Blade Stealth Core i7 GTX 1650 Ti Max-Q 4K i7-1065G7, GeForce GTX 1650 Ti Max-Q | 1.5 kg | 15.3 mm | 13.30" | 3840x2160 | |
| 88.1 % v7 (old) | 10 / 2020 | Dell XPS 13 9310 Core i7 FHD i7-1165G7, Iris Xe G7 96EUs | 1.3 kg | 14.8 mm | 13.40" | 1920x1200 | |
| 87.4 % v7 (old) | 06 / 2020 | Huawei MateBook X Pro 2020 i7 i7-10510U, GeForce MX250 | 1.3 kg | 14.6 mm | 13.90" | 3000x2000 | |
| 85.1 % v7 (old) | 10 / 2020 | Asus Zenbook S UX393JA i7-1065G7, Iris Plus Graphics G7 (Ice Lake 64 EU) | 1.4 kg | 15.7 mm | 13.90" | 3300x2200 | |
| 84.4 % v7 (old) | 10 / 2020 | Lenovo Yoga Slim 7-14IIL05 i7-1065G7, GeForce MX350 | 1.4 kg | 14.9 mm | 14.00" | 1920x1080 |
Case
Connectivity
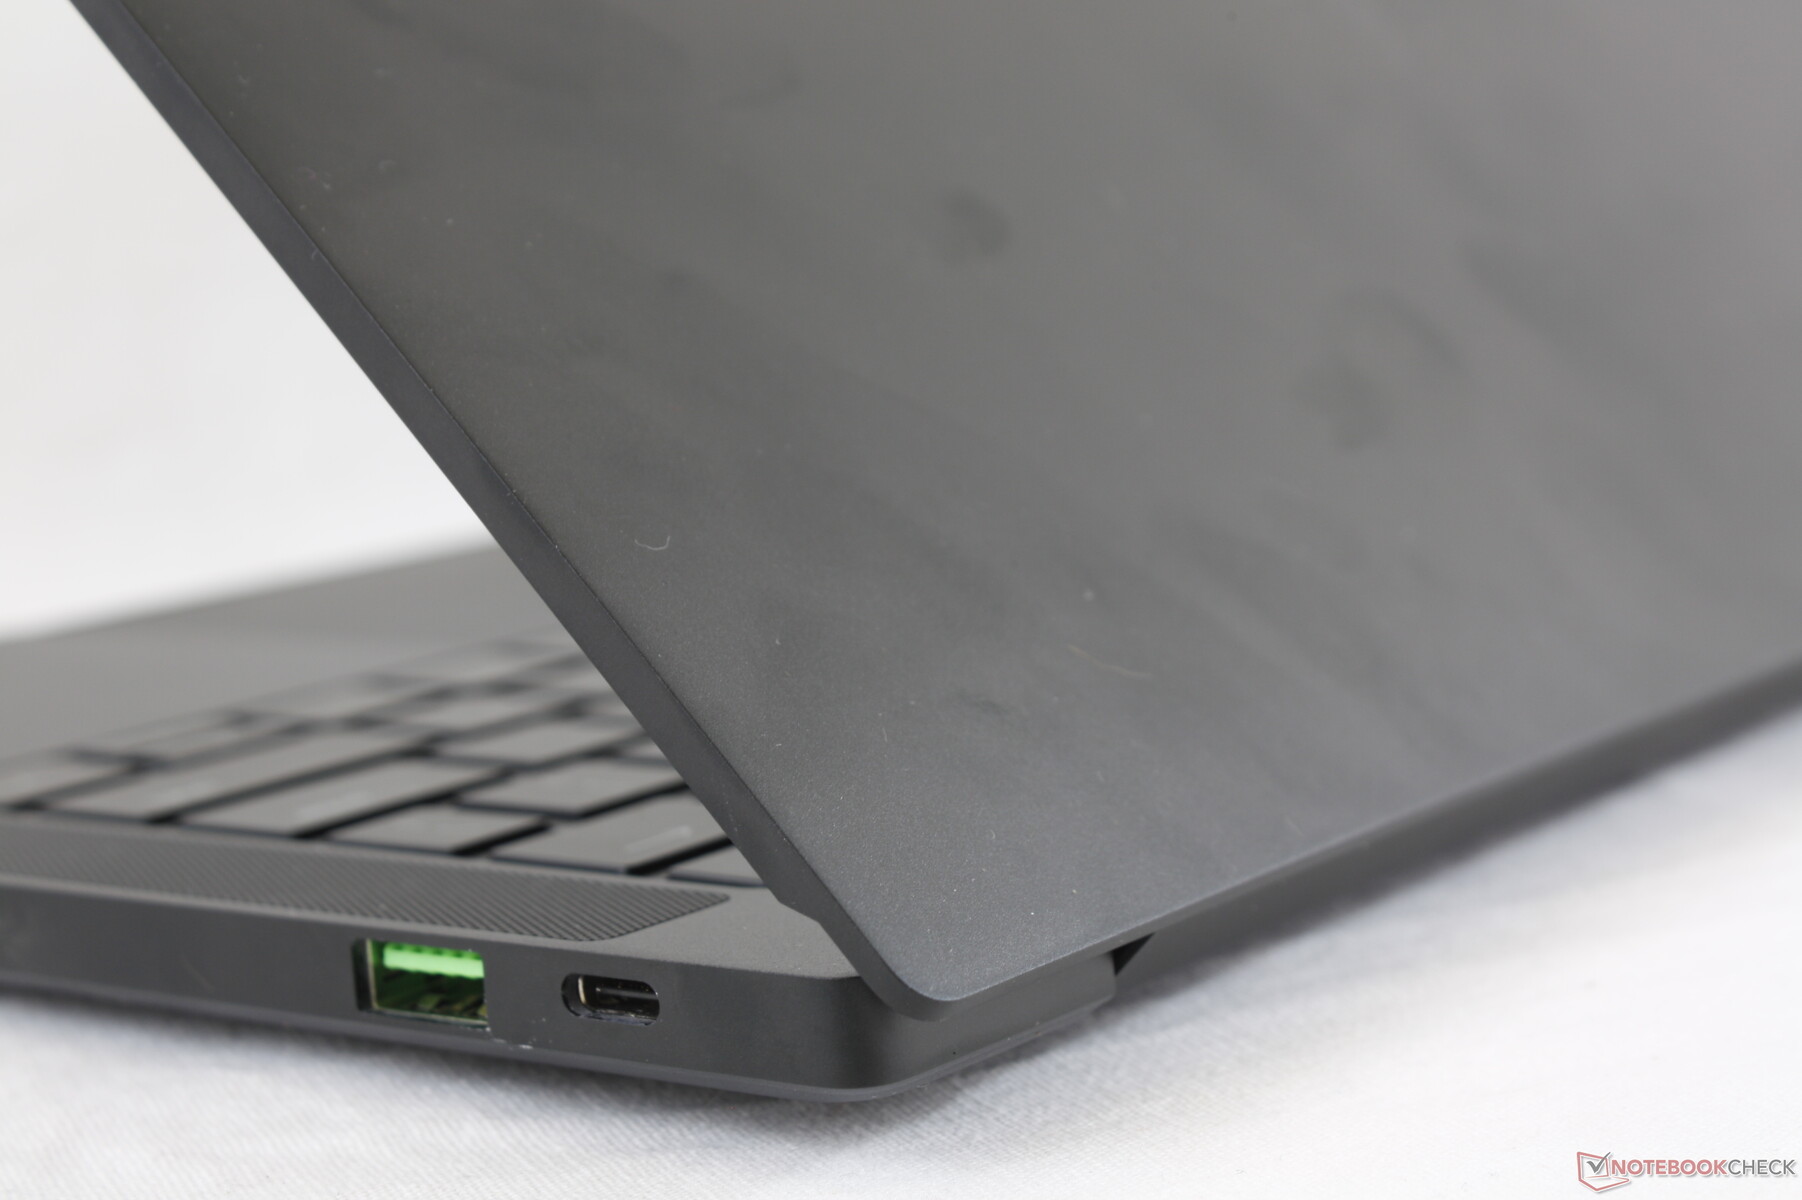
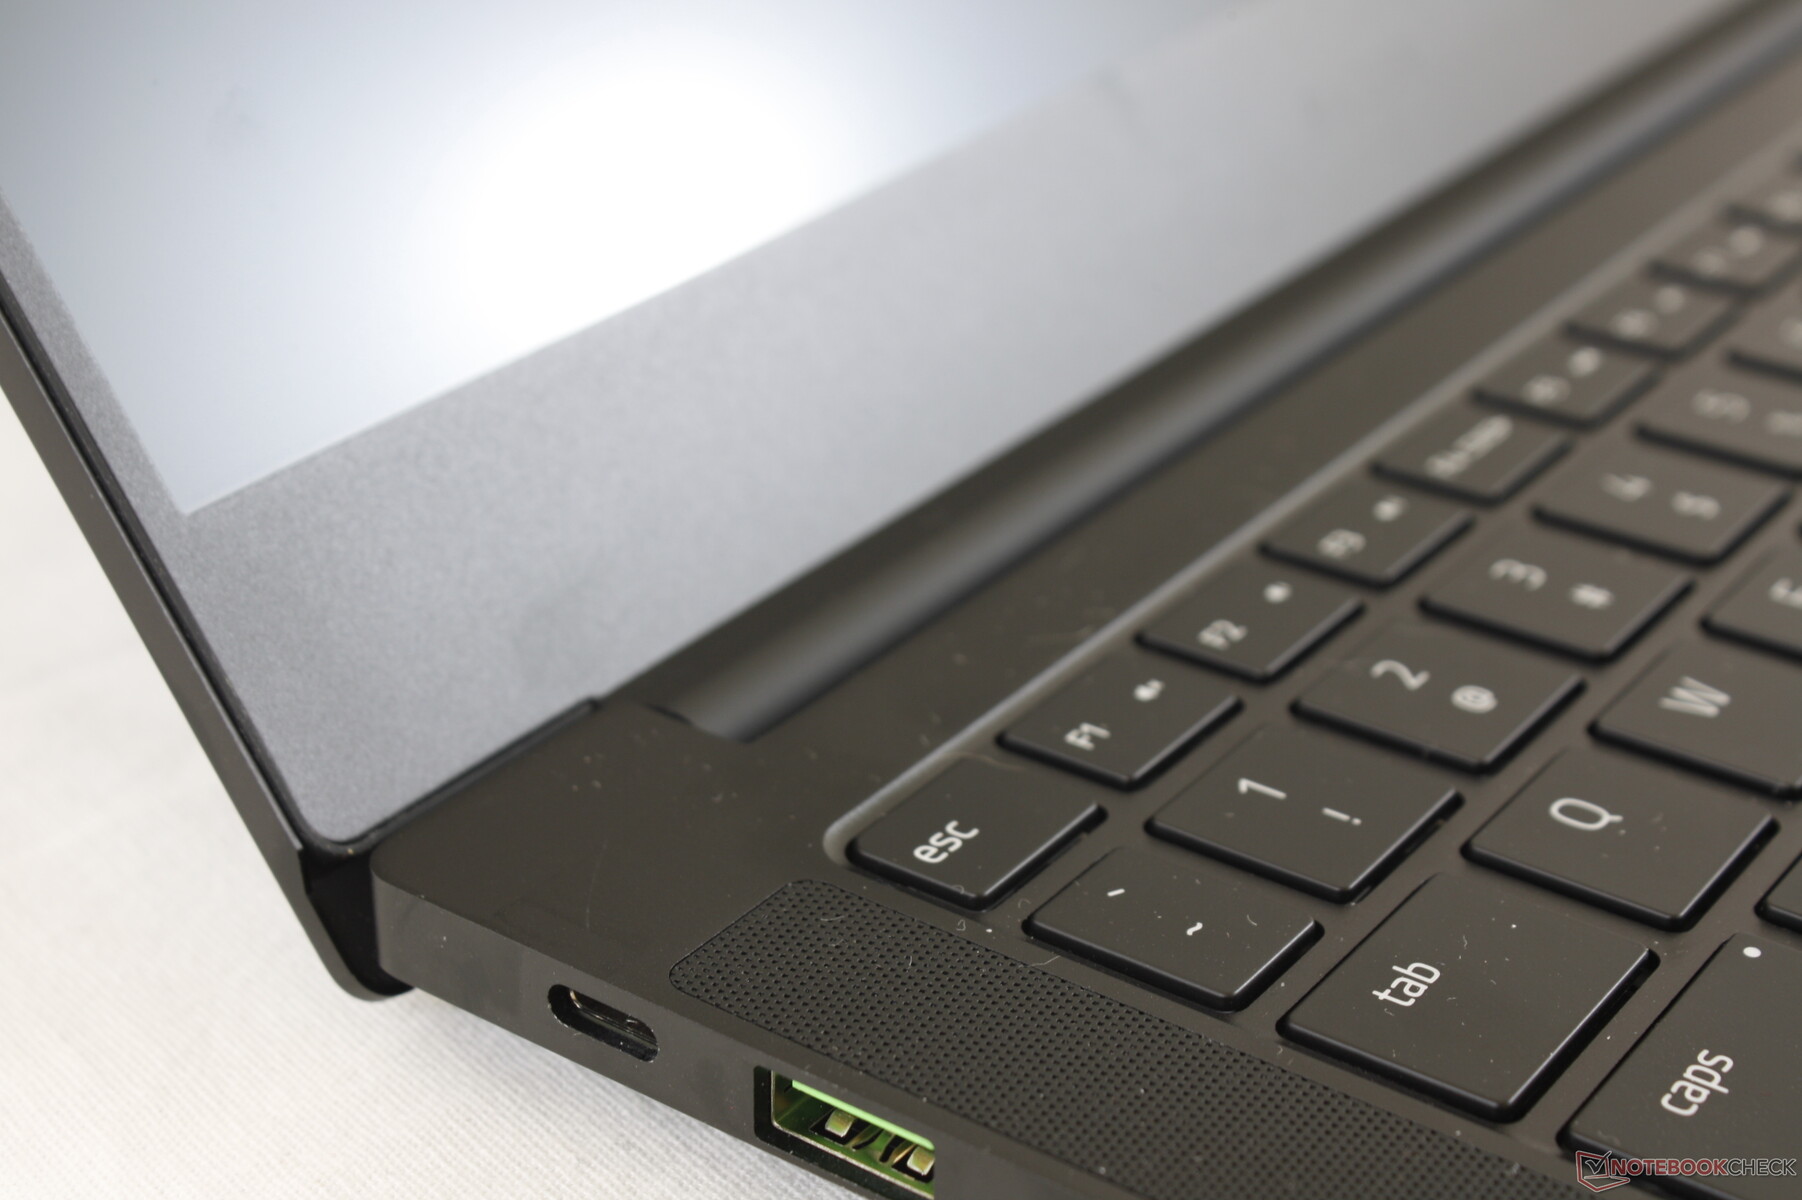
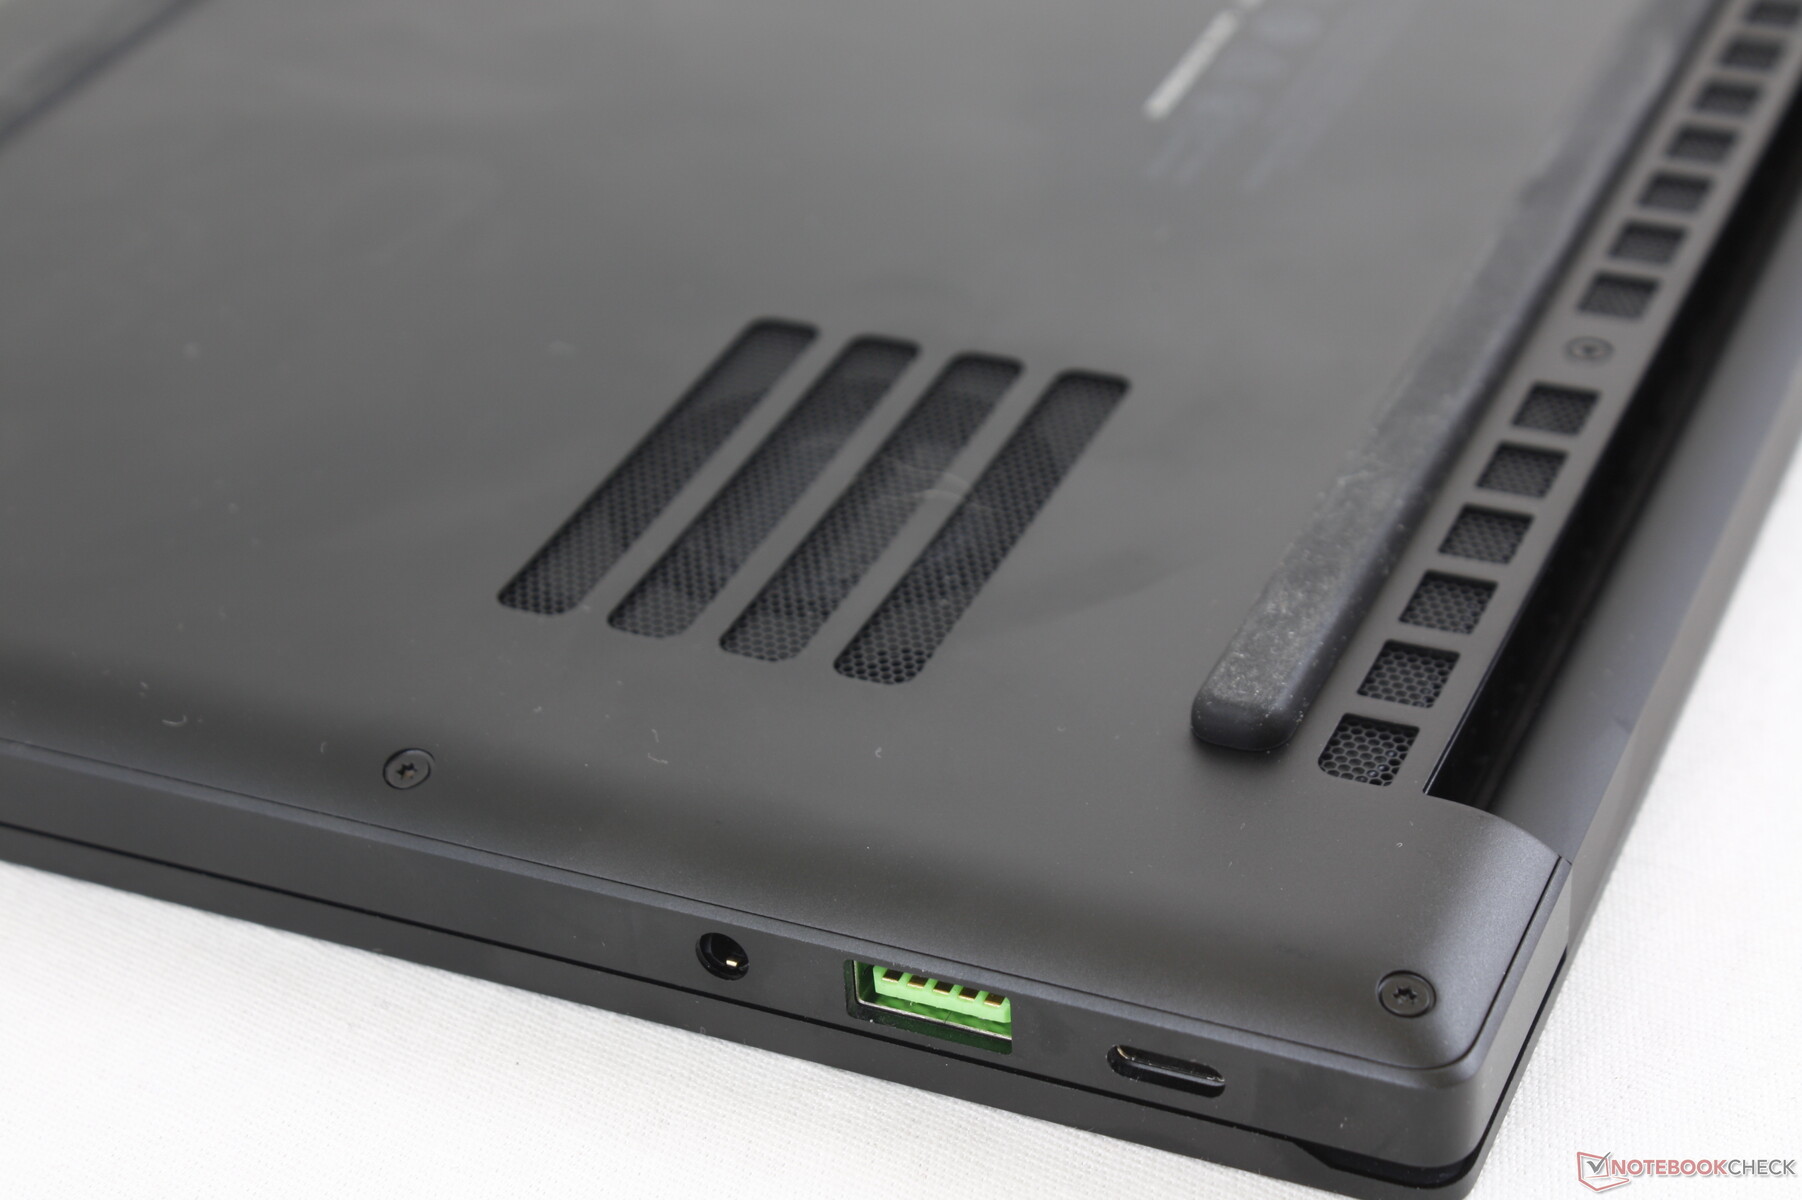
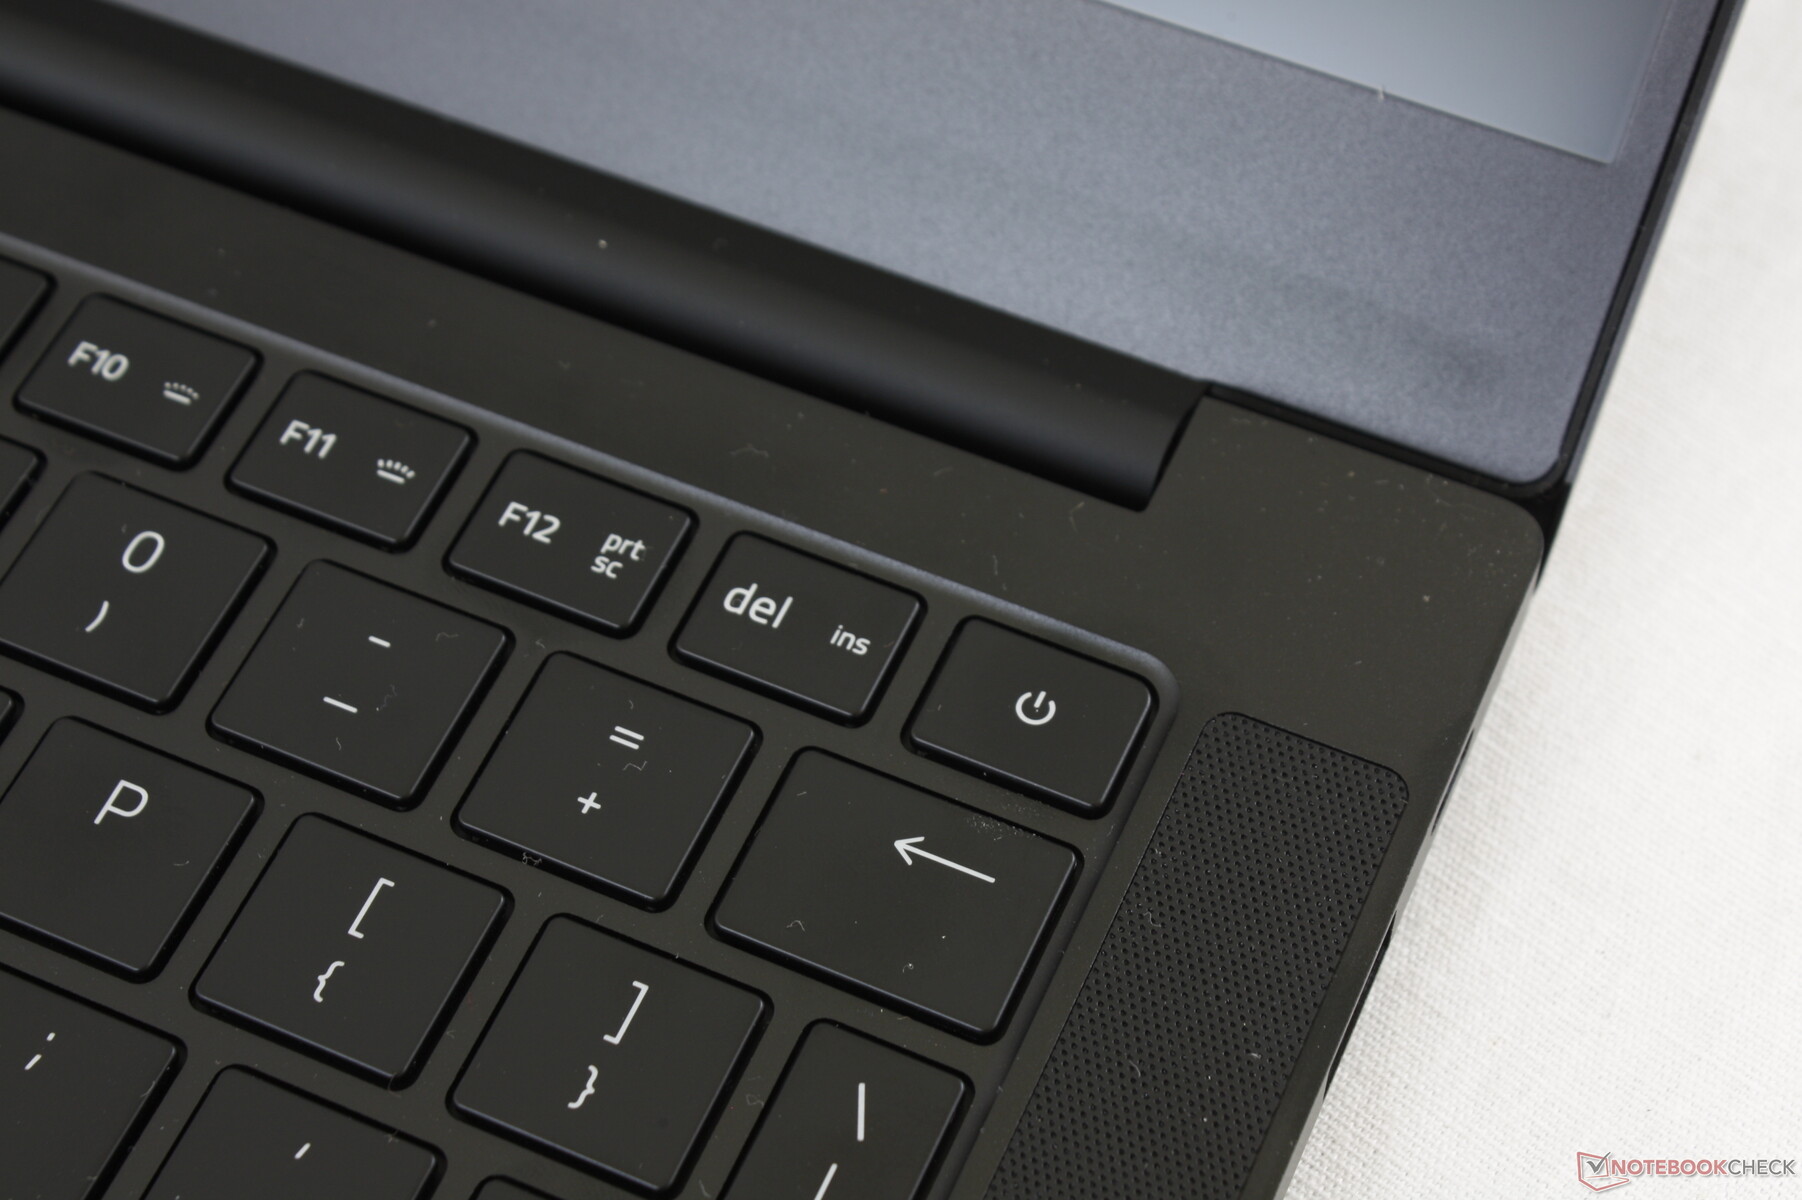
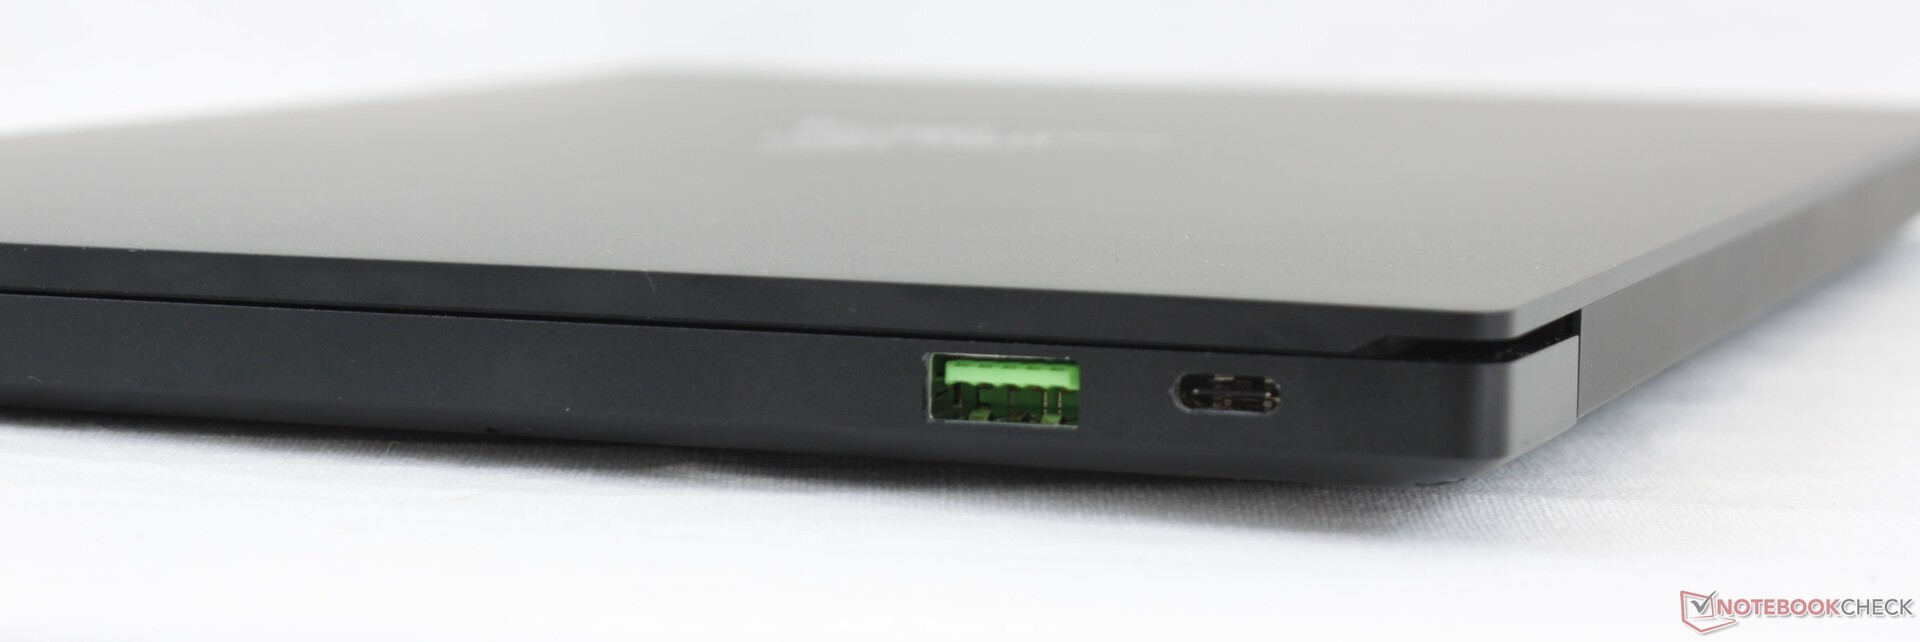
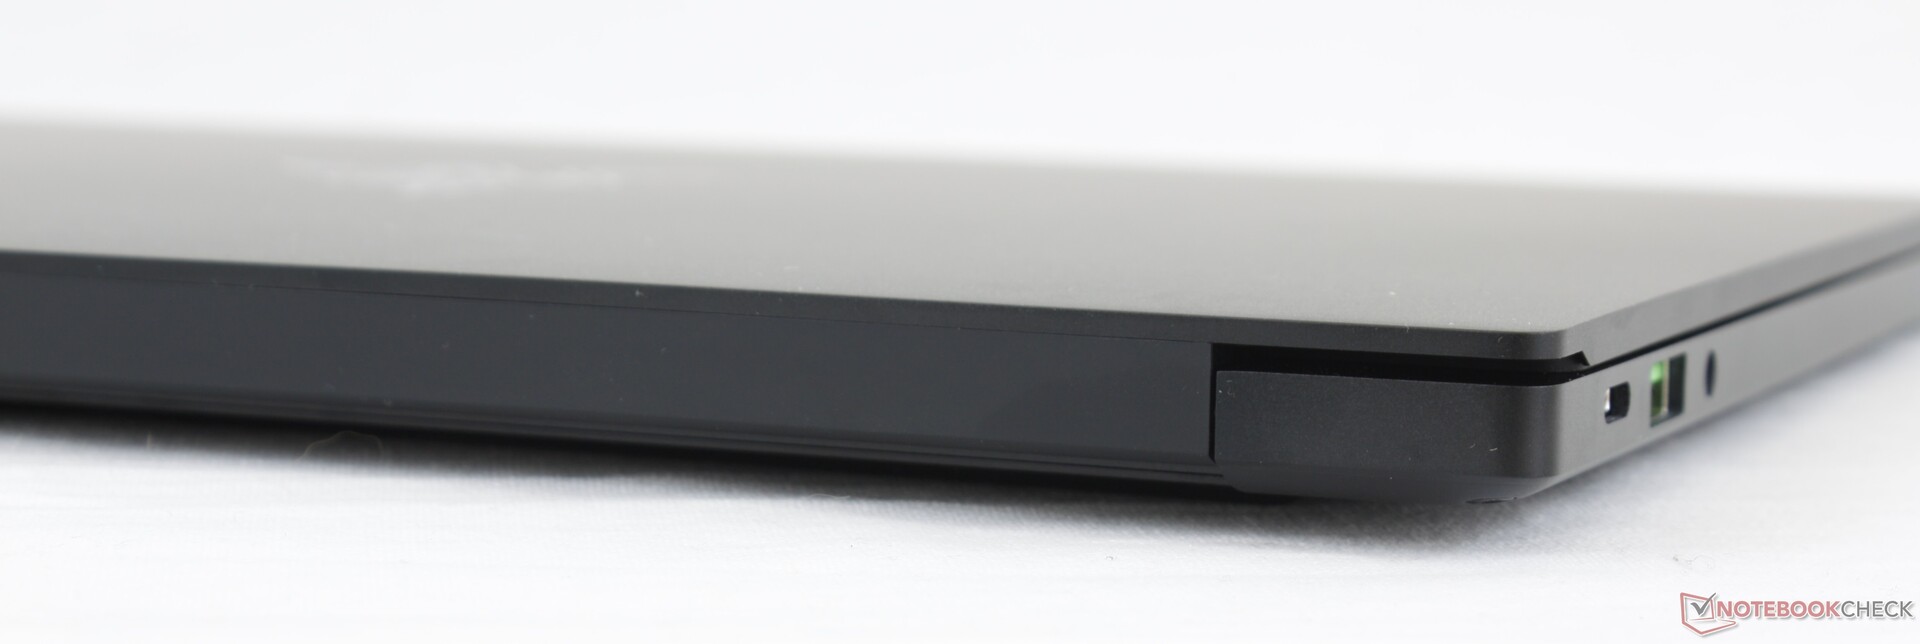
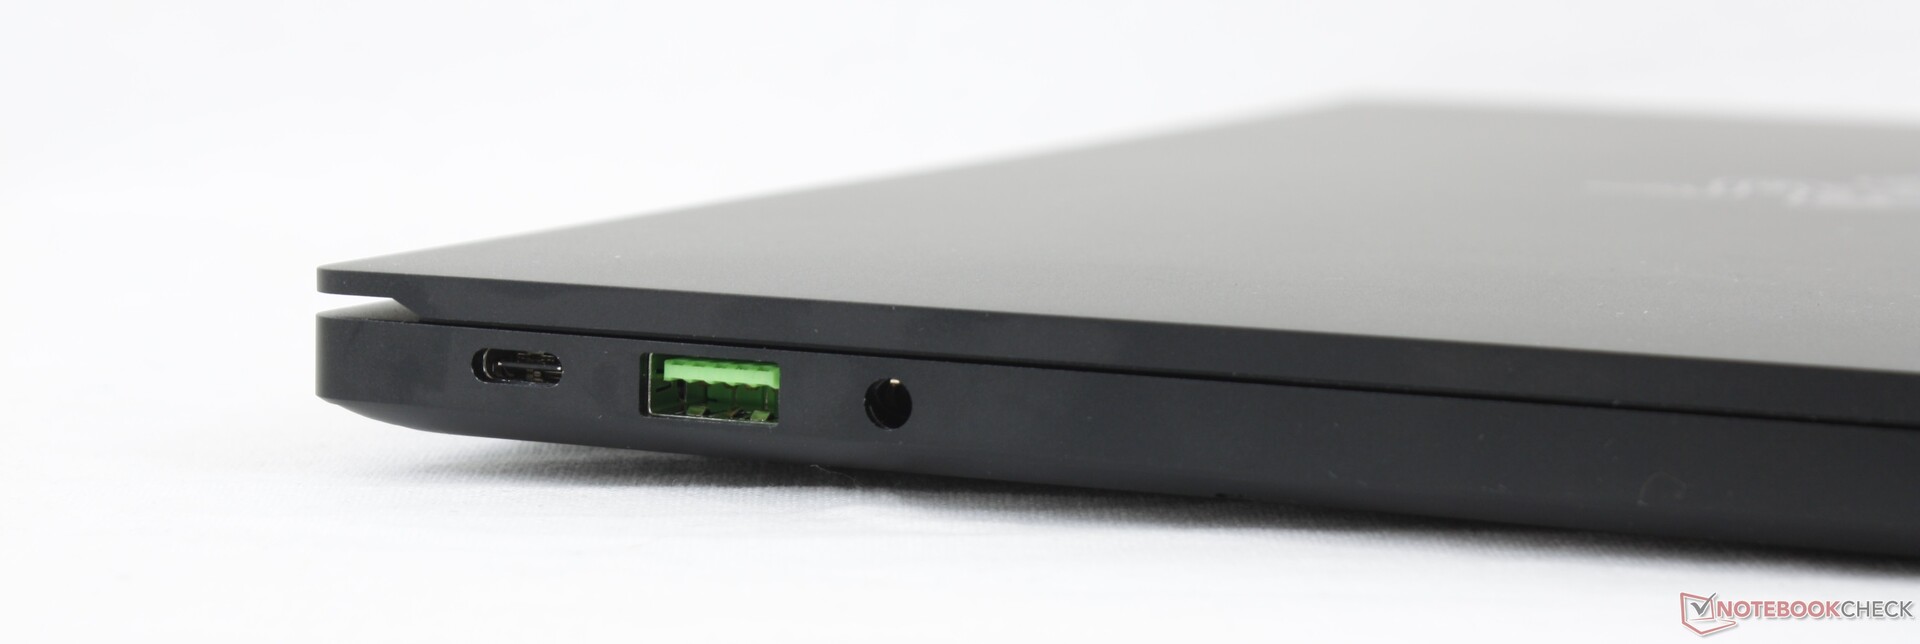
Razer has upgraded both of the Thunderbolt 3 ports to Thunderbolt 4 which pretty much all other Tiger Lake laptops support by default. Port positioning and options are otherwise identical gen-to-gen. It's too bad that there is still no integrated SD card reader for this series.
Communication
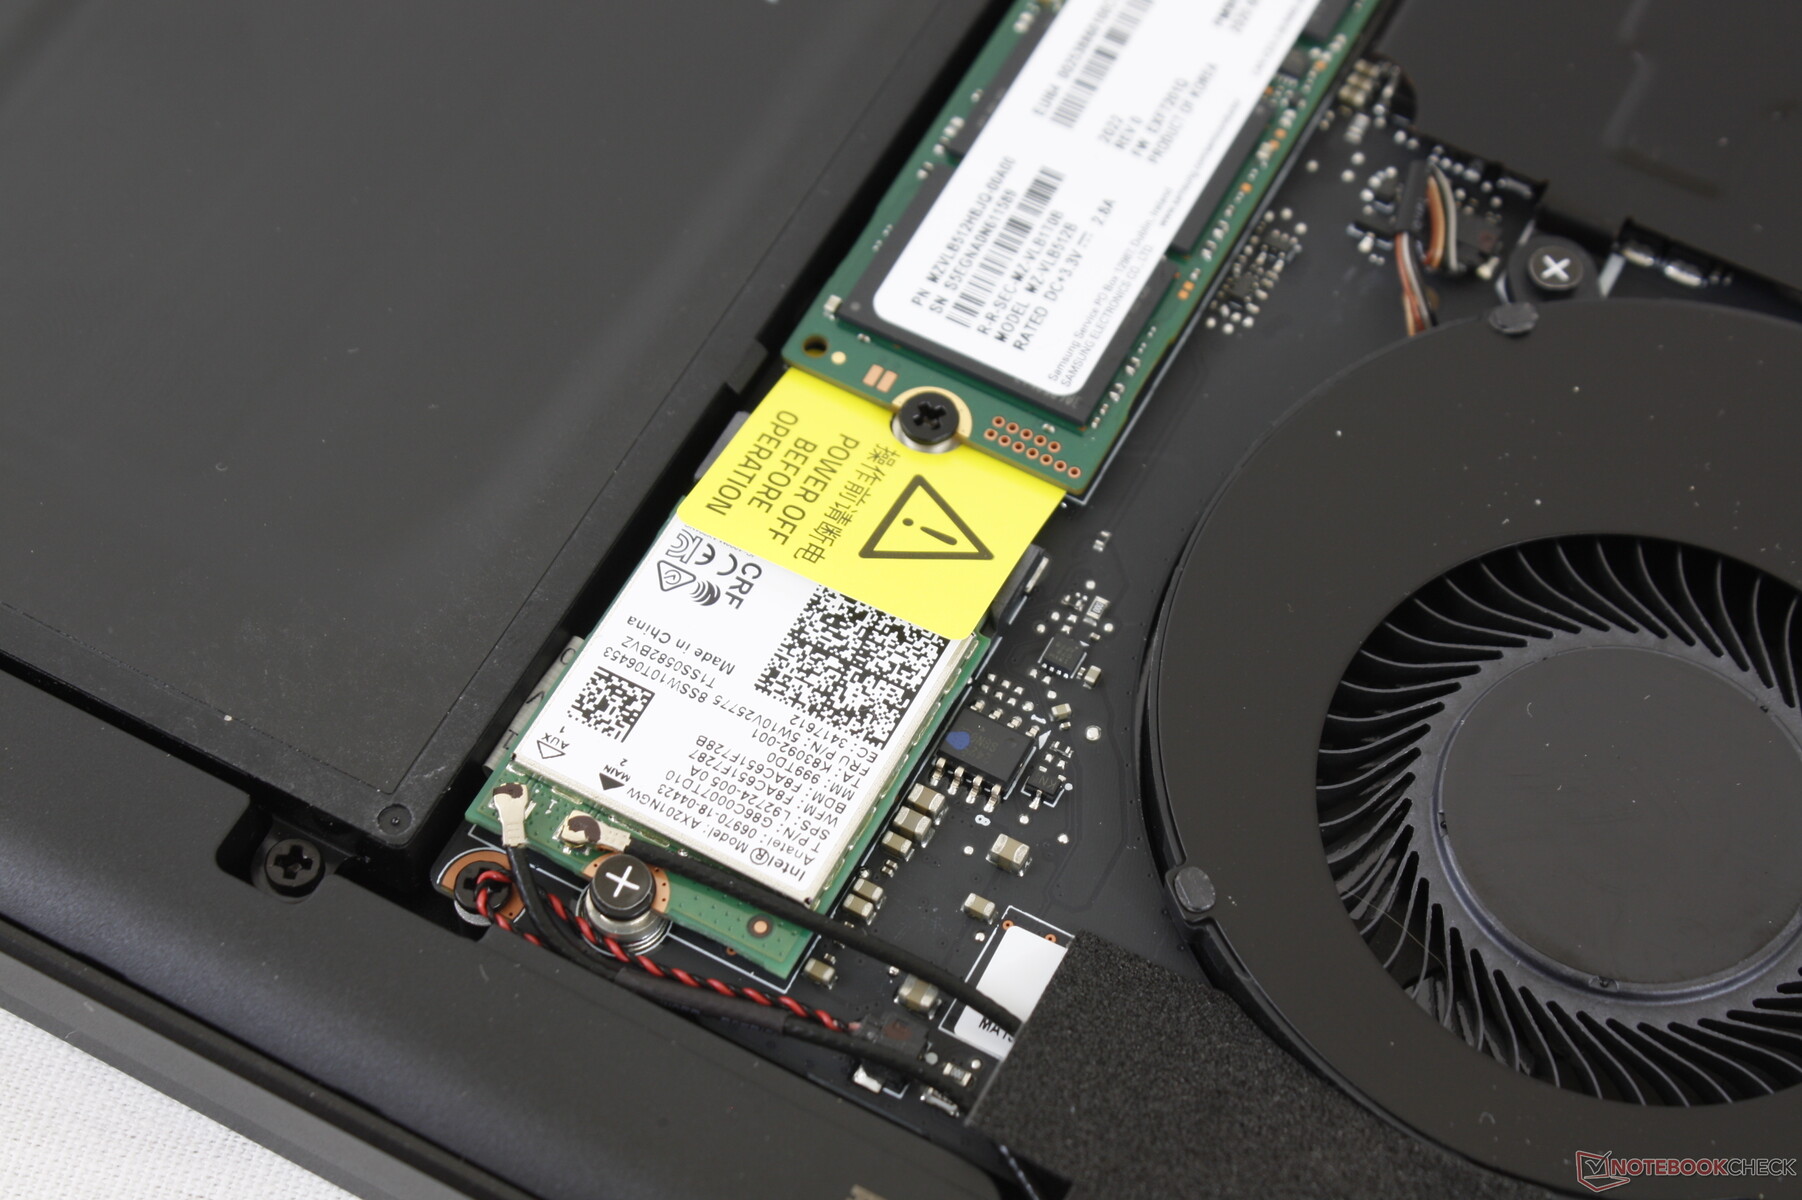
The Intel AX201 comes standard for the second year in a row for Wi-Fi 6 and Bluetooth 5.1 connectivity. We didn't experience any issues when paired with our Netgear RAX200 router.
Webcam


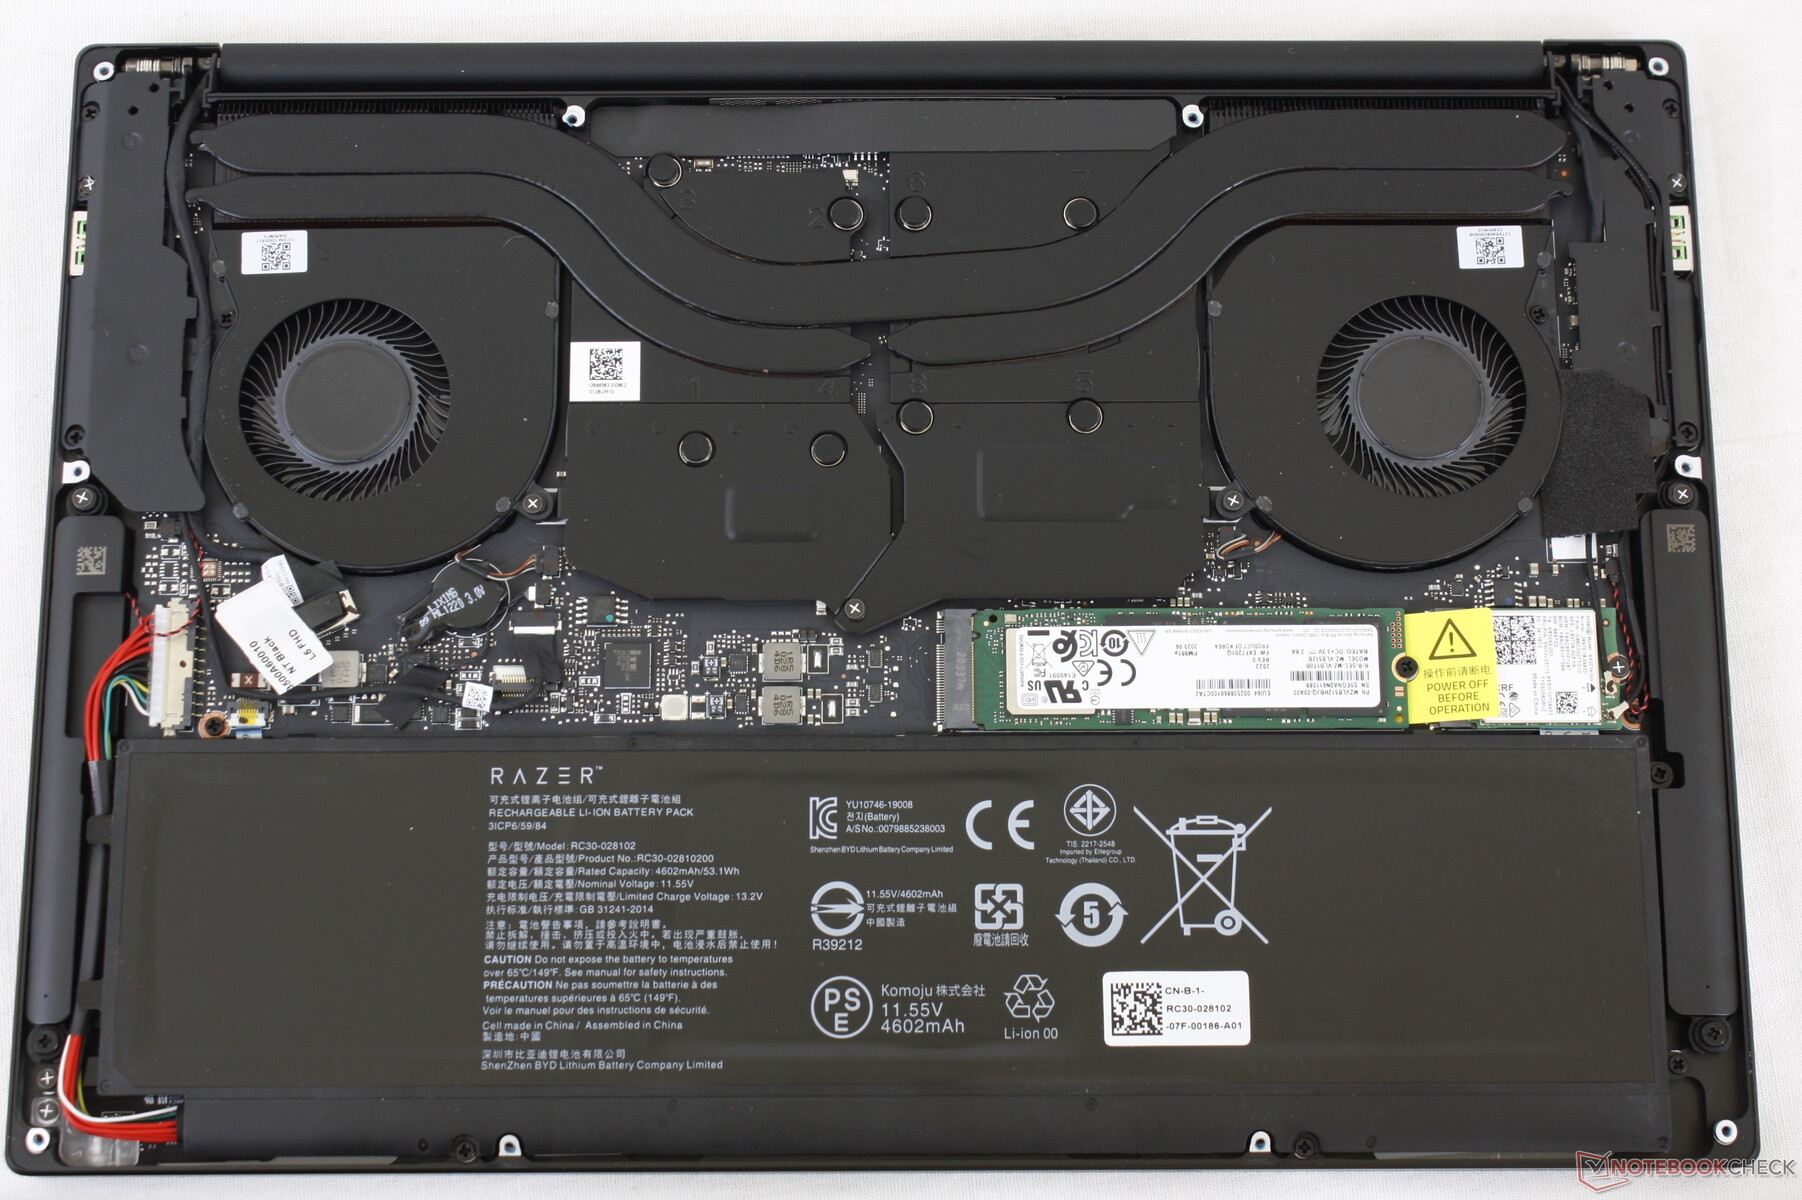
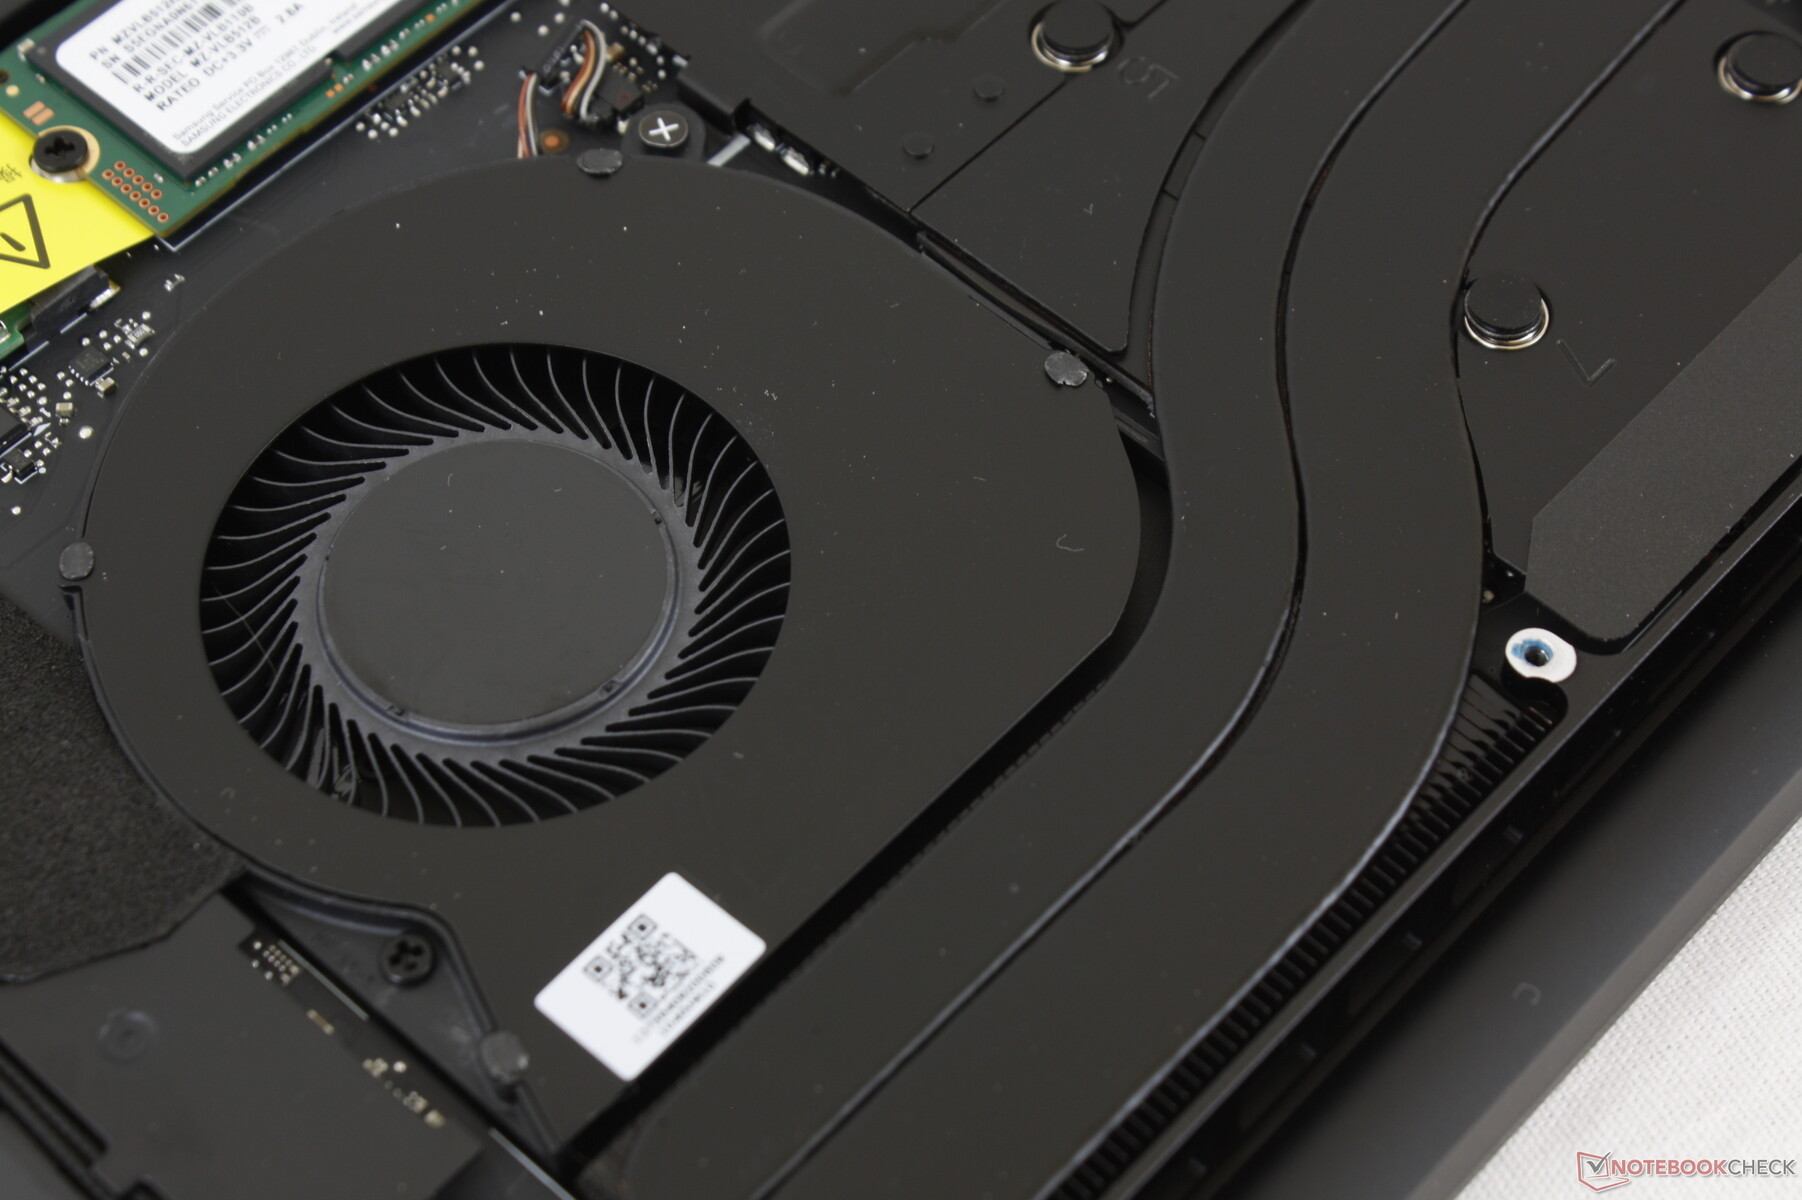
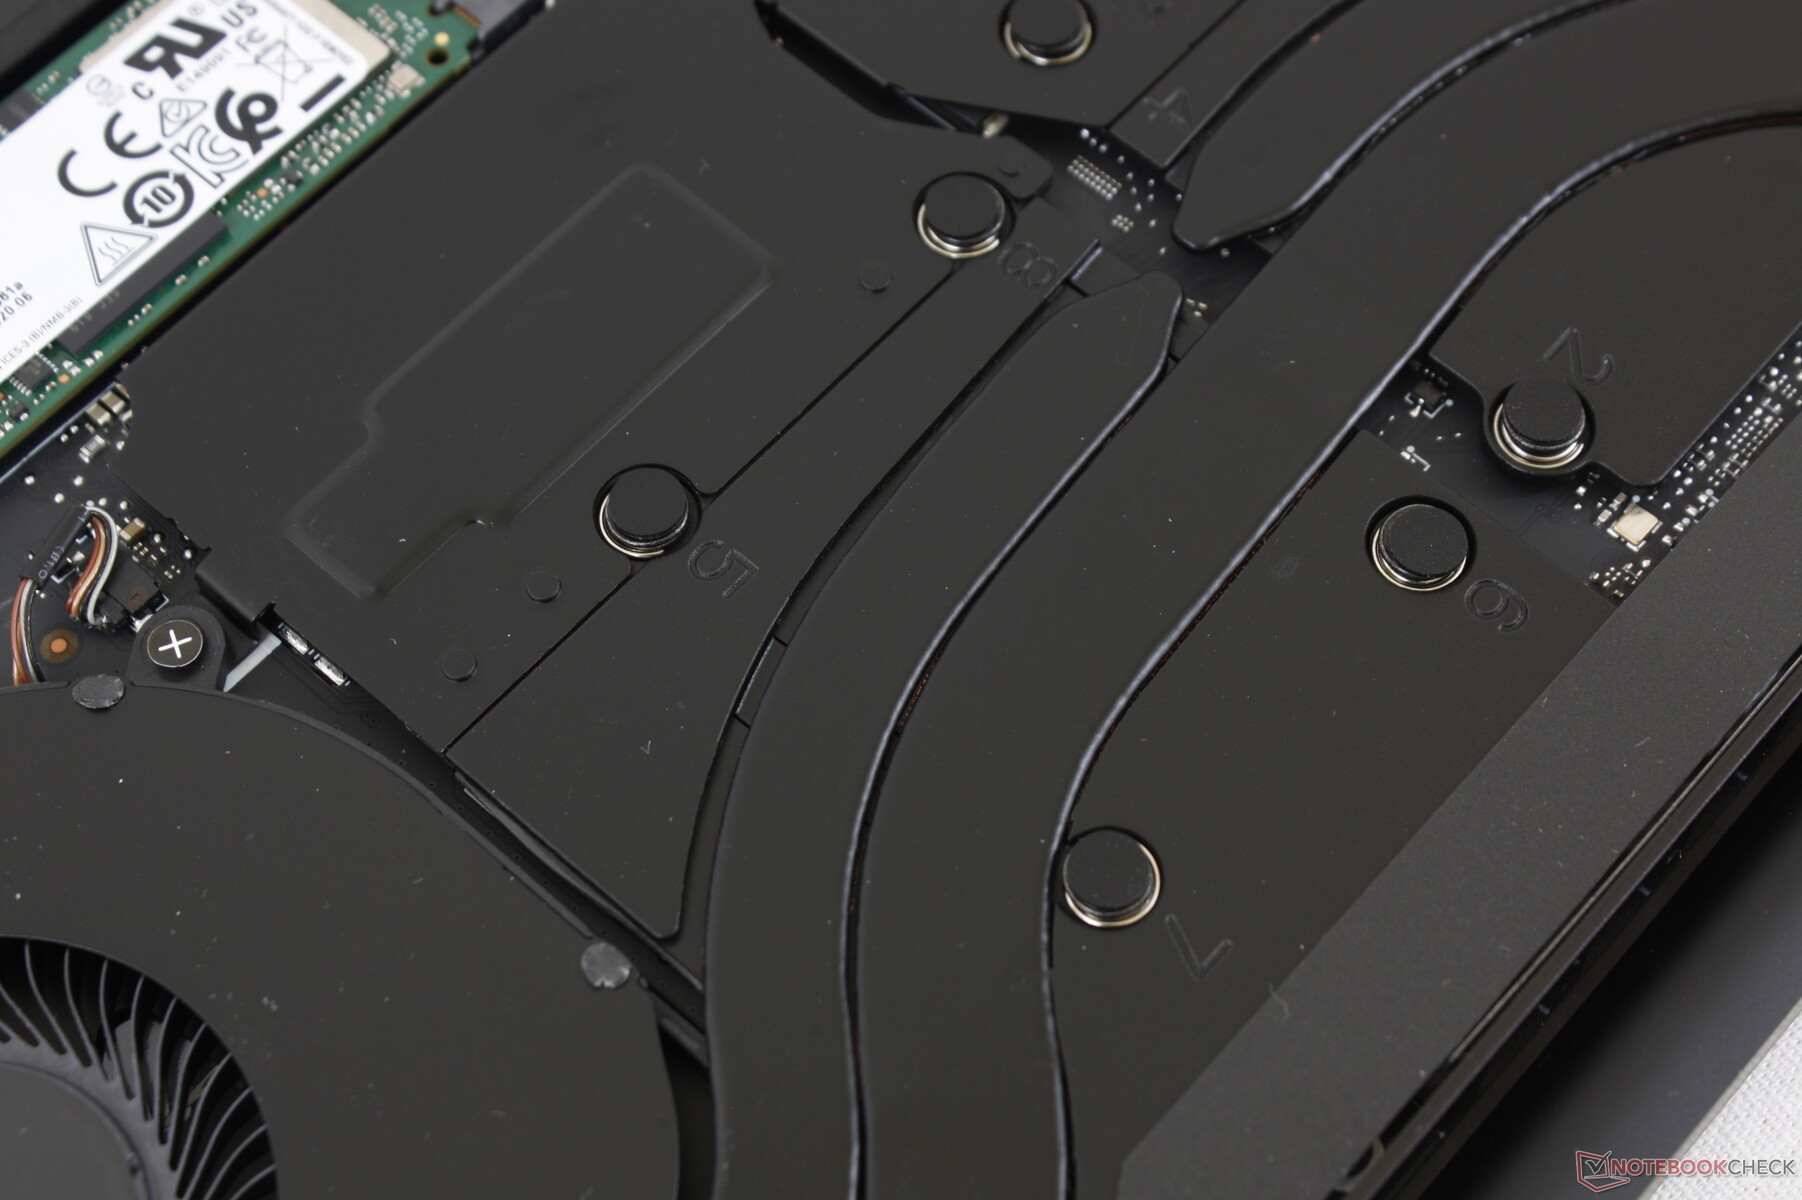
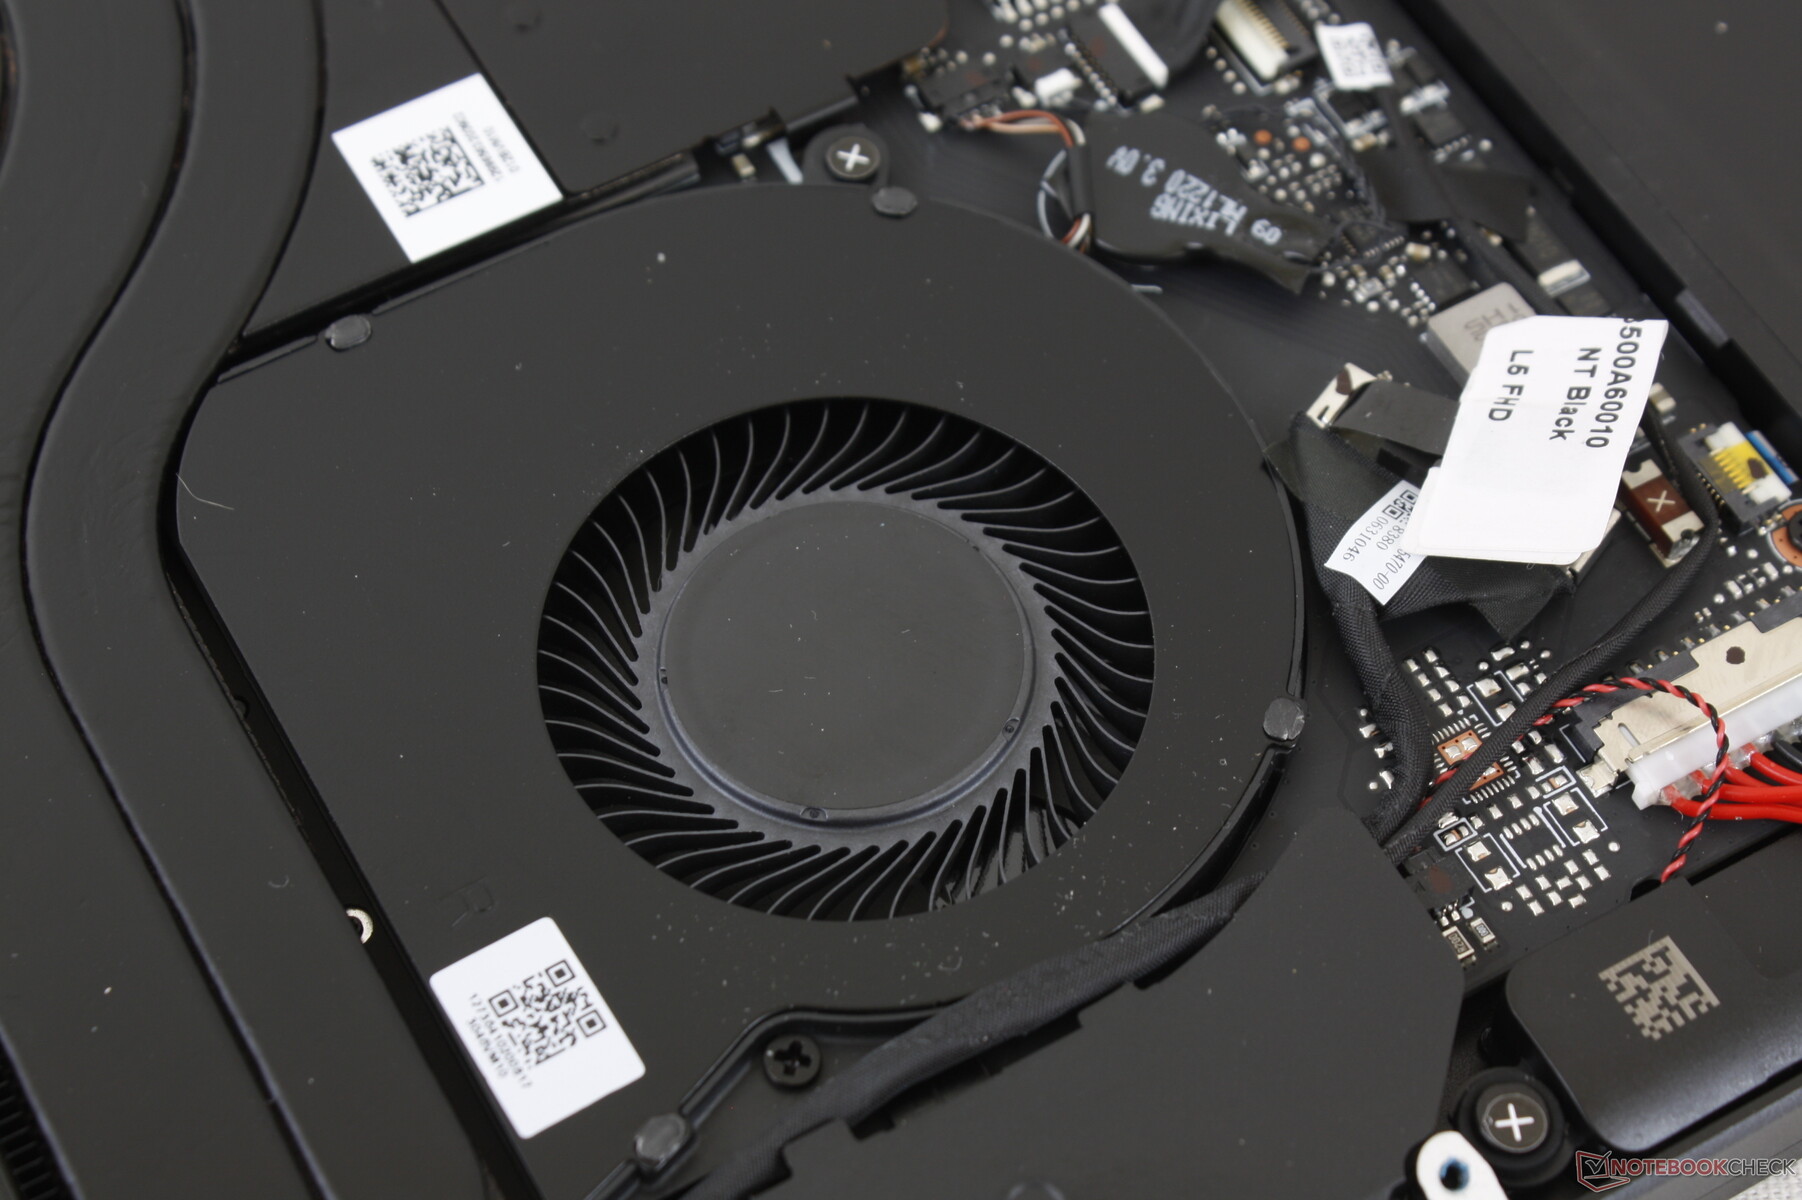
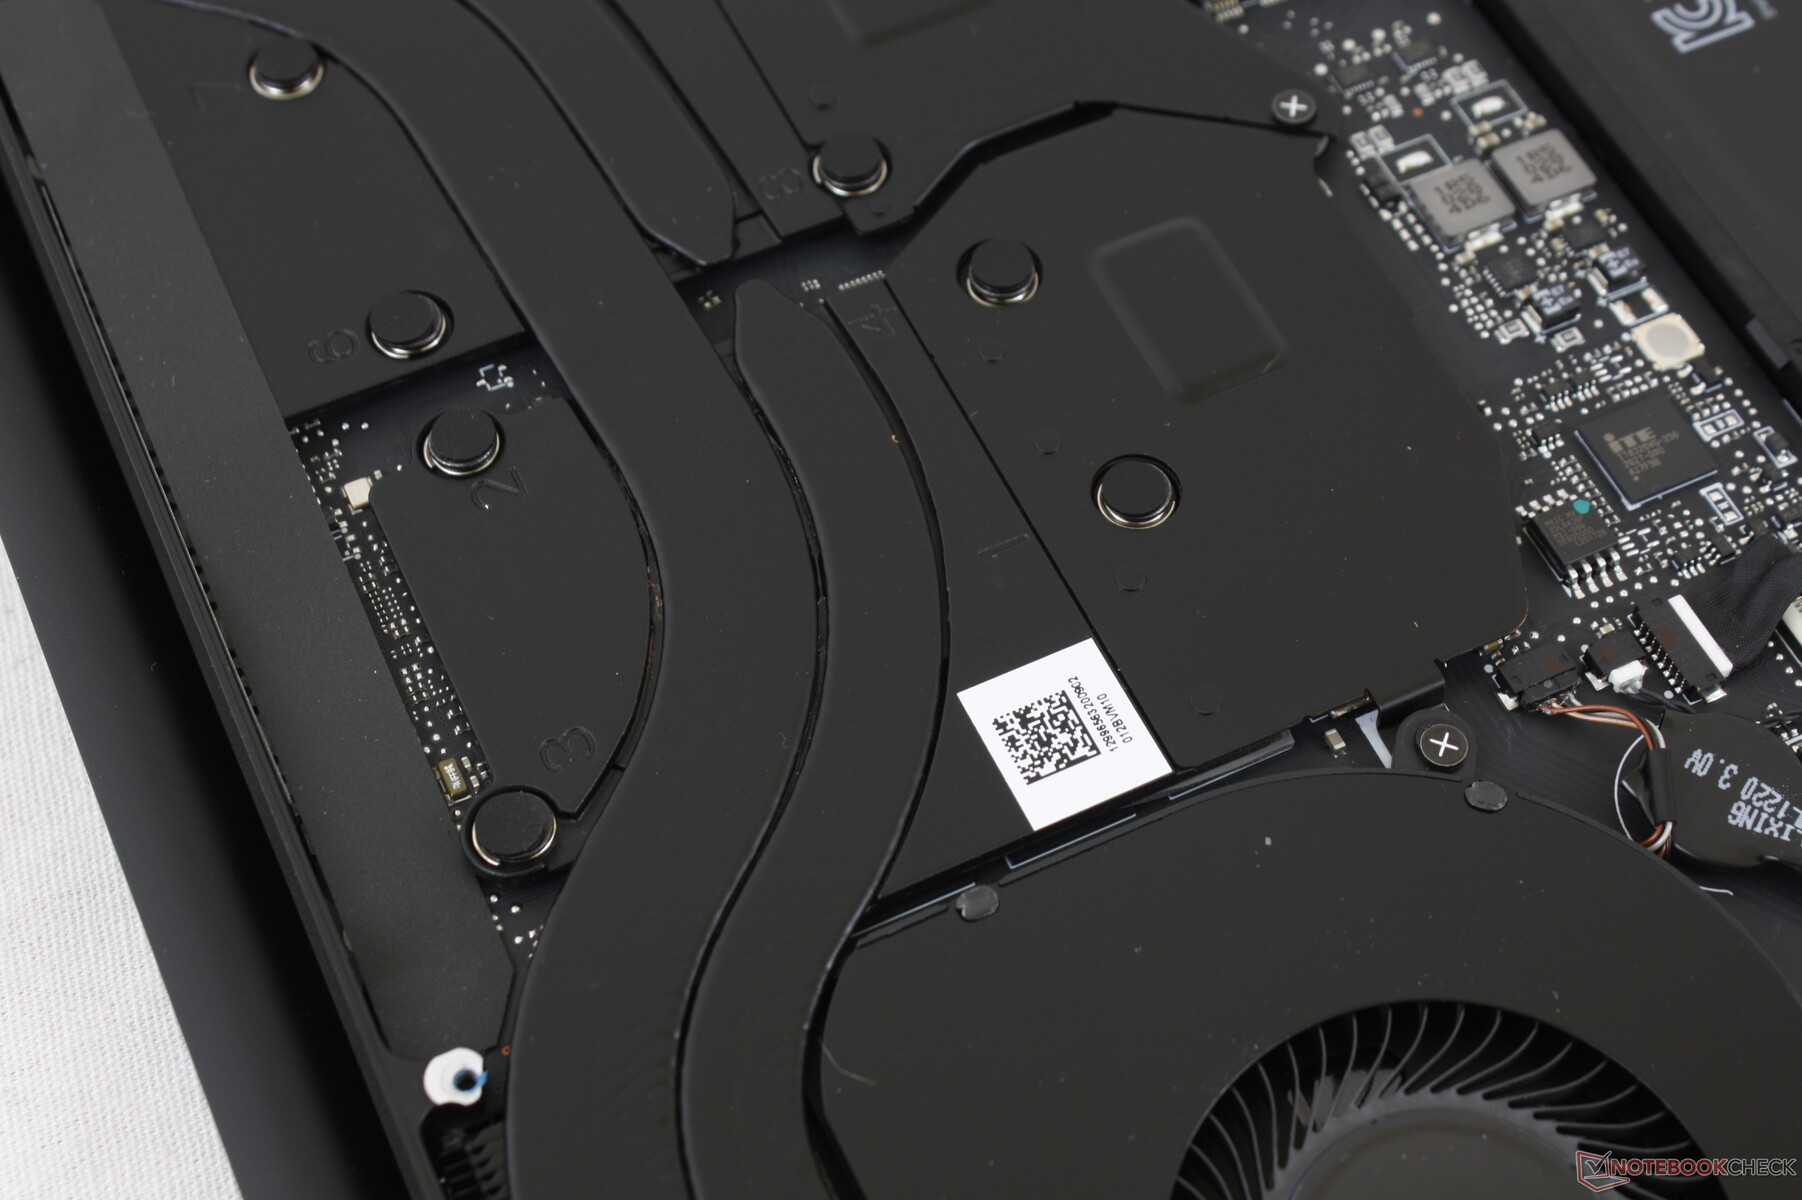
Maintenance
Accessories and Warranty
There are no extra adapters or accessories in the box other than the AC adapter. The standard one-year limited warranty applies.
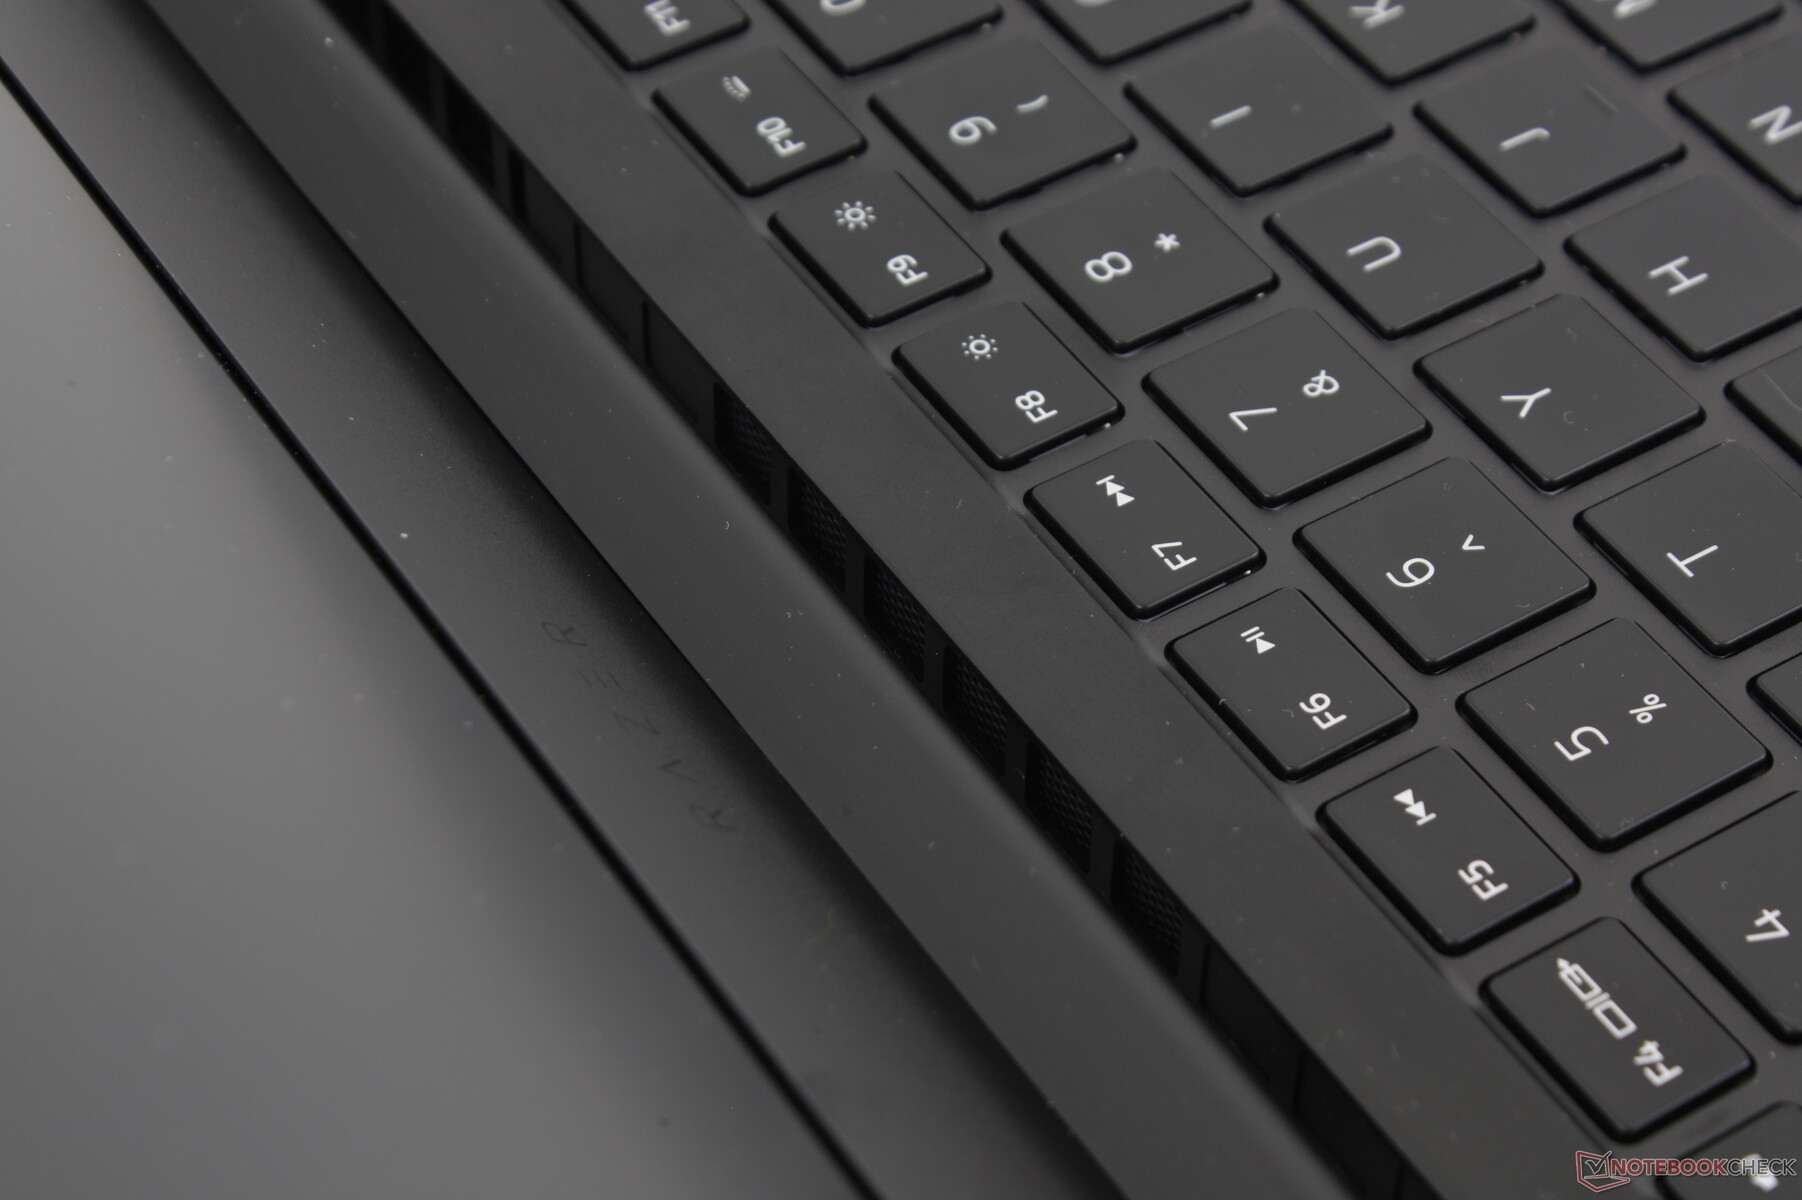
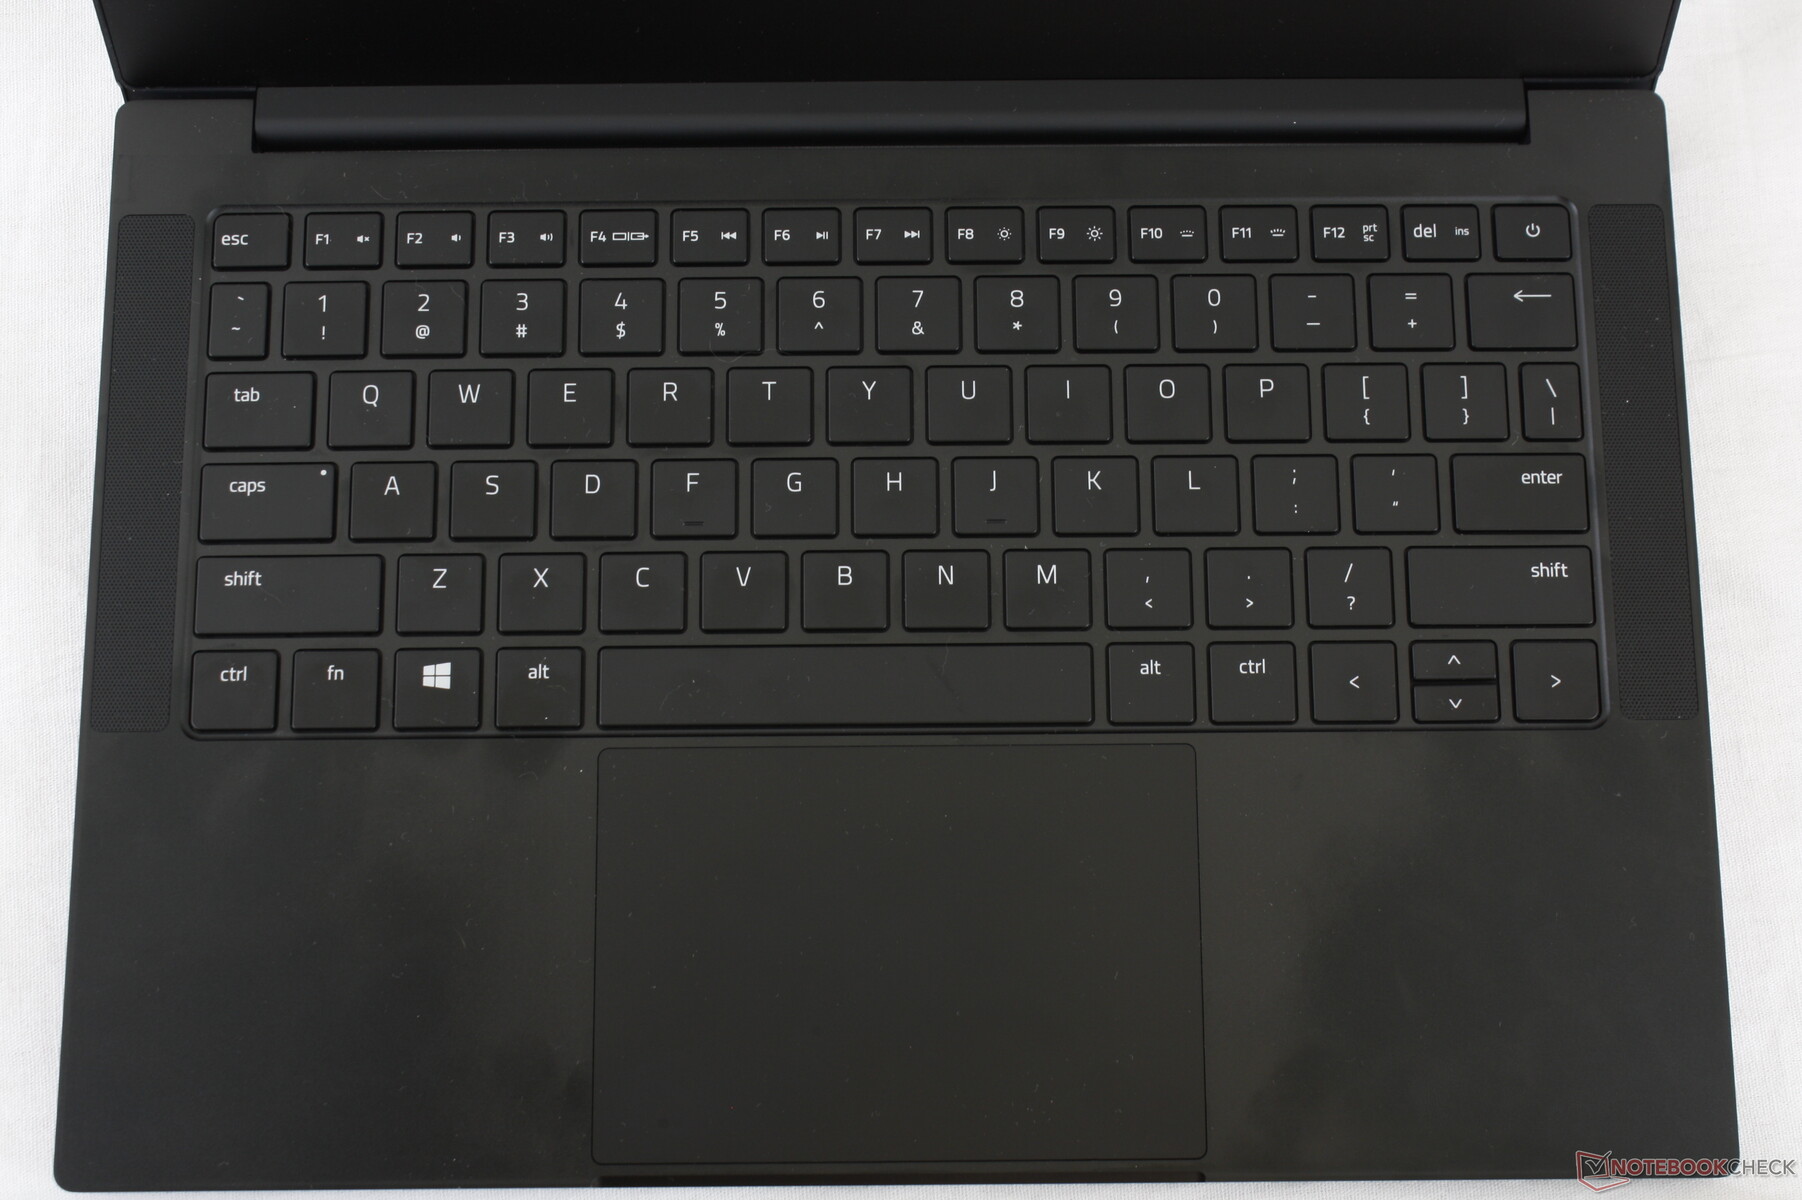
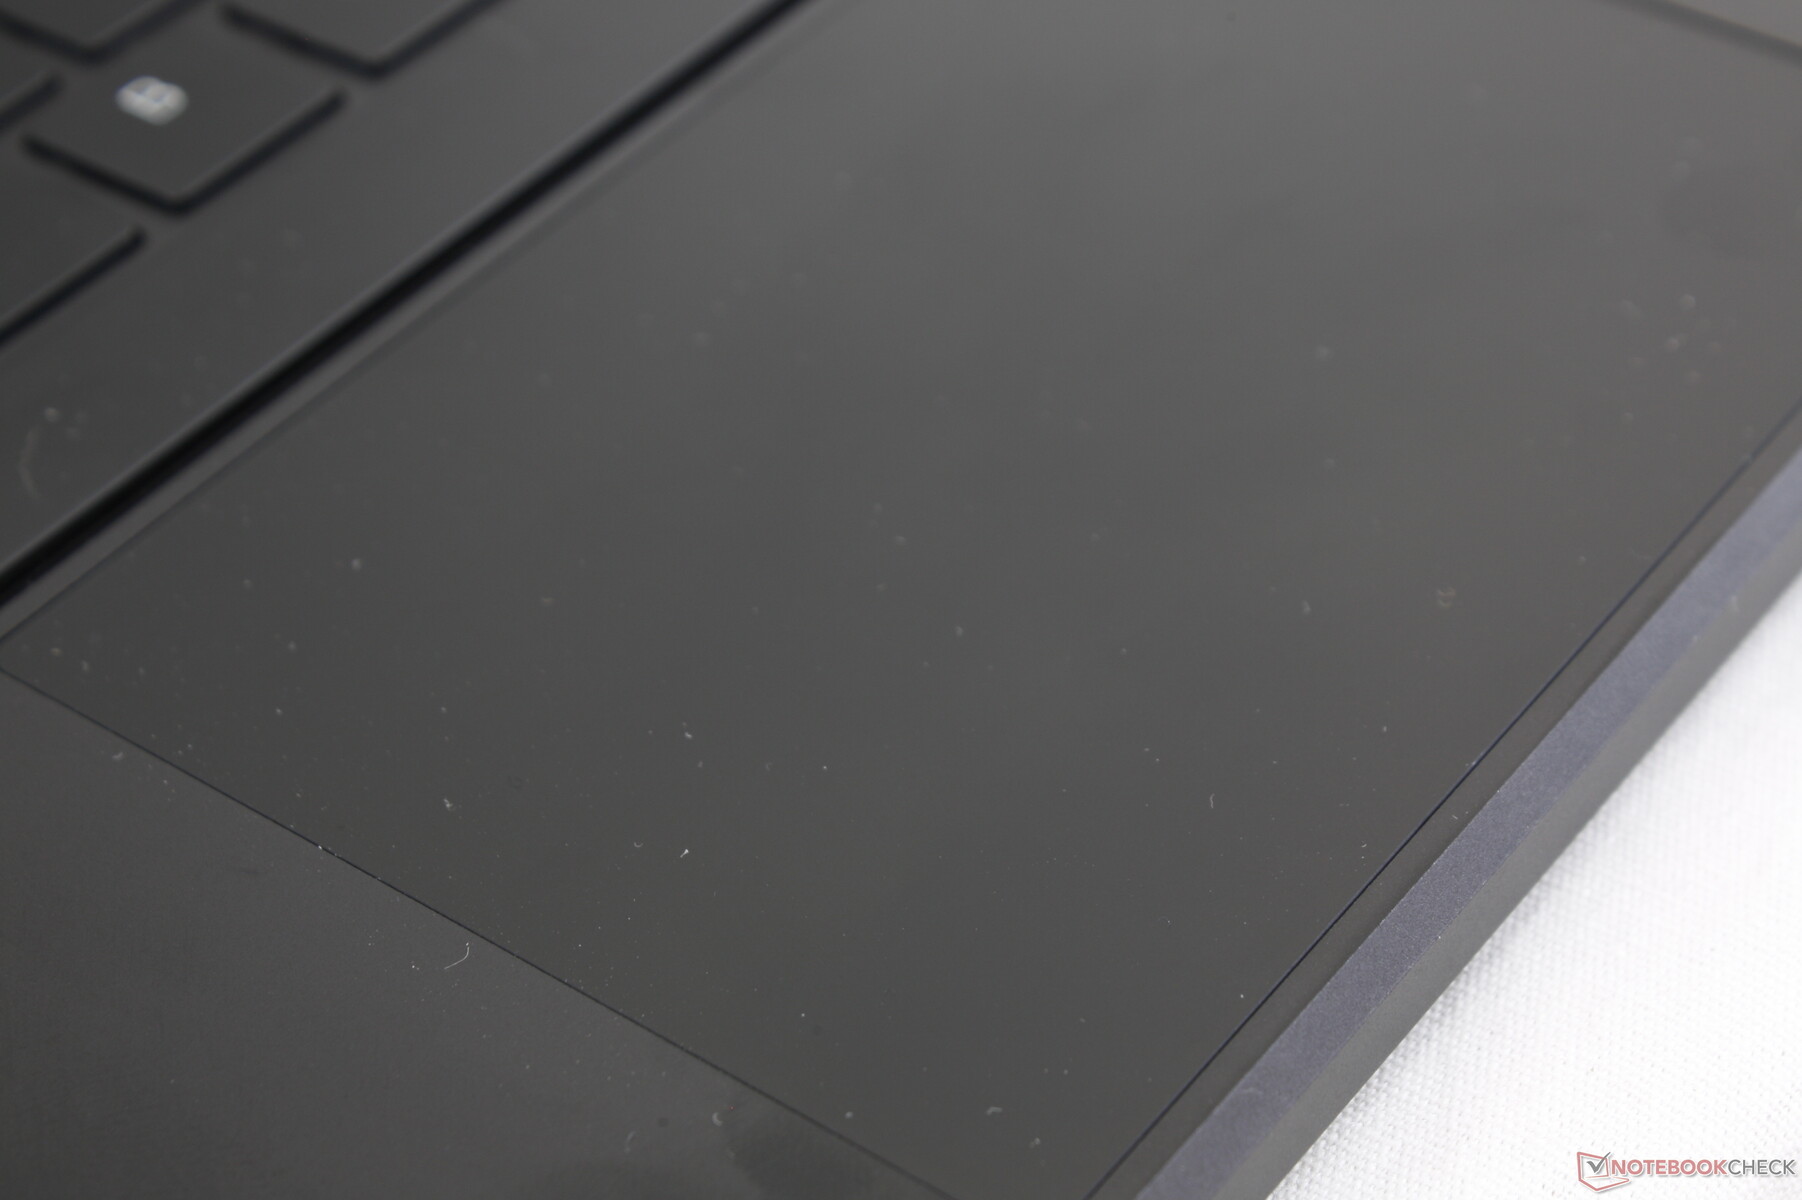
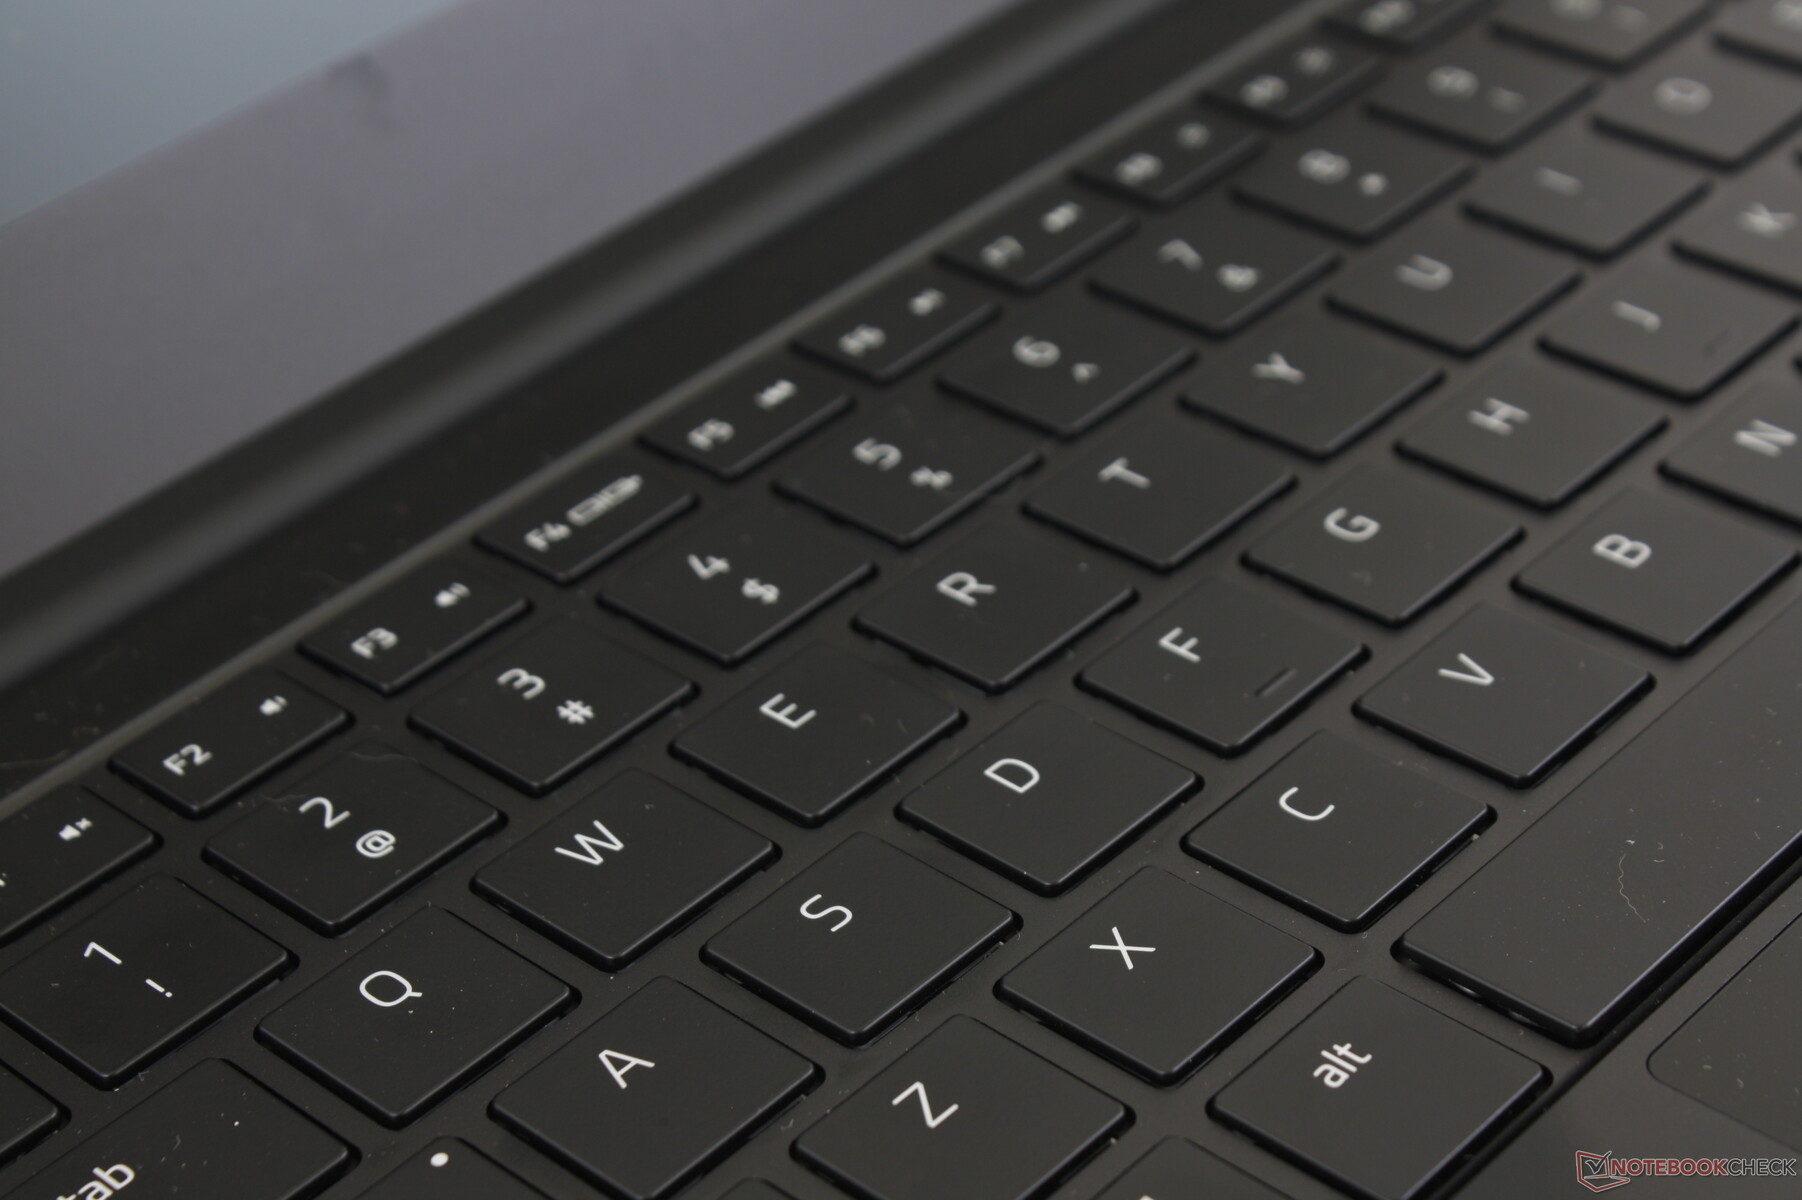
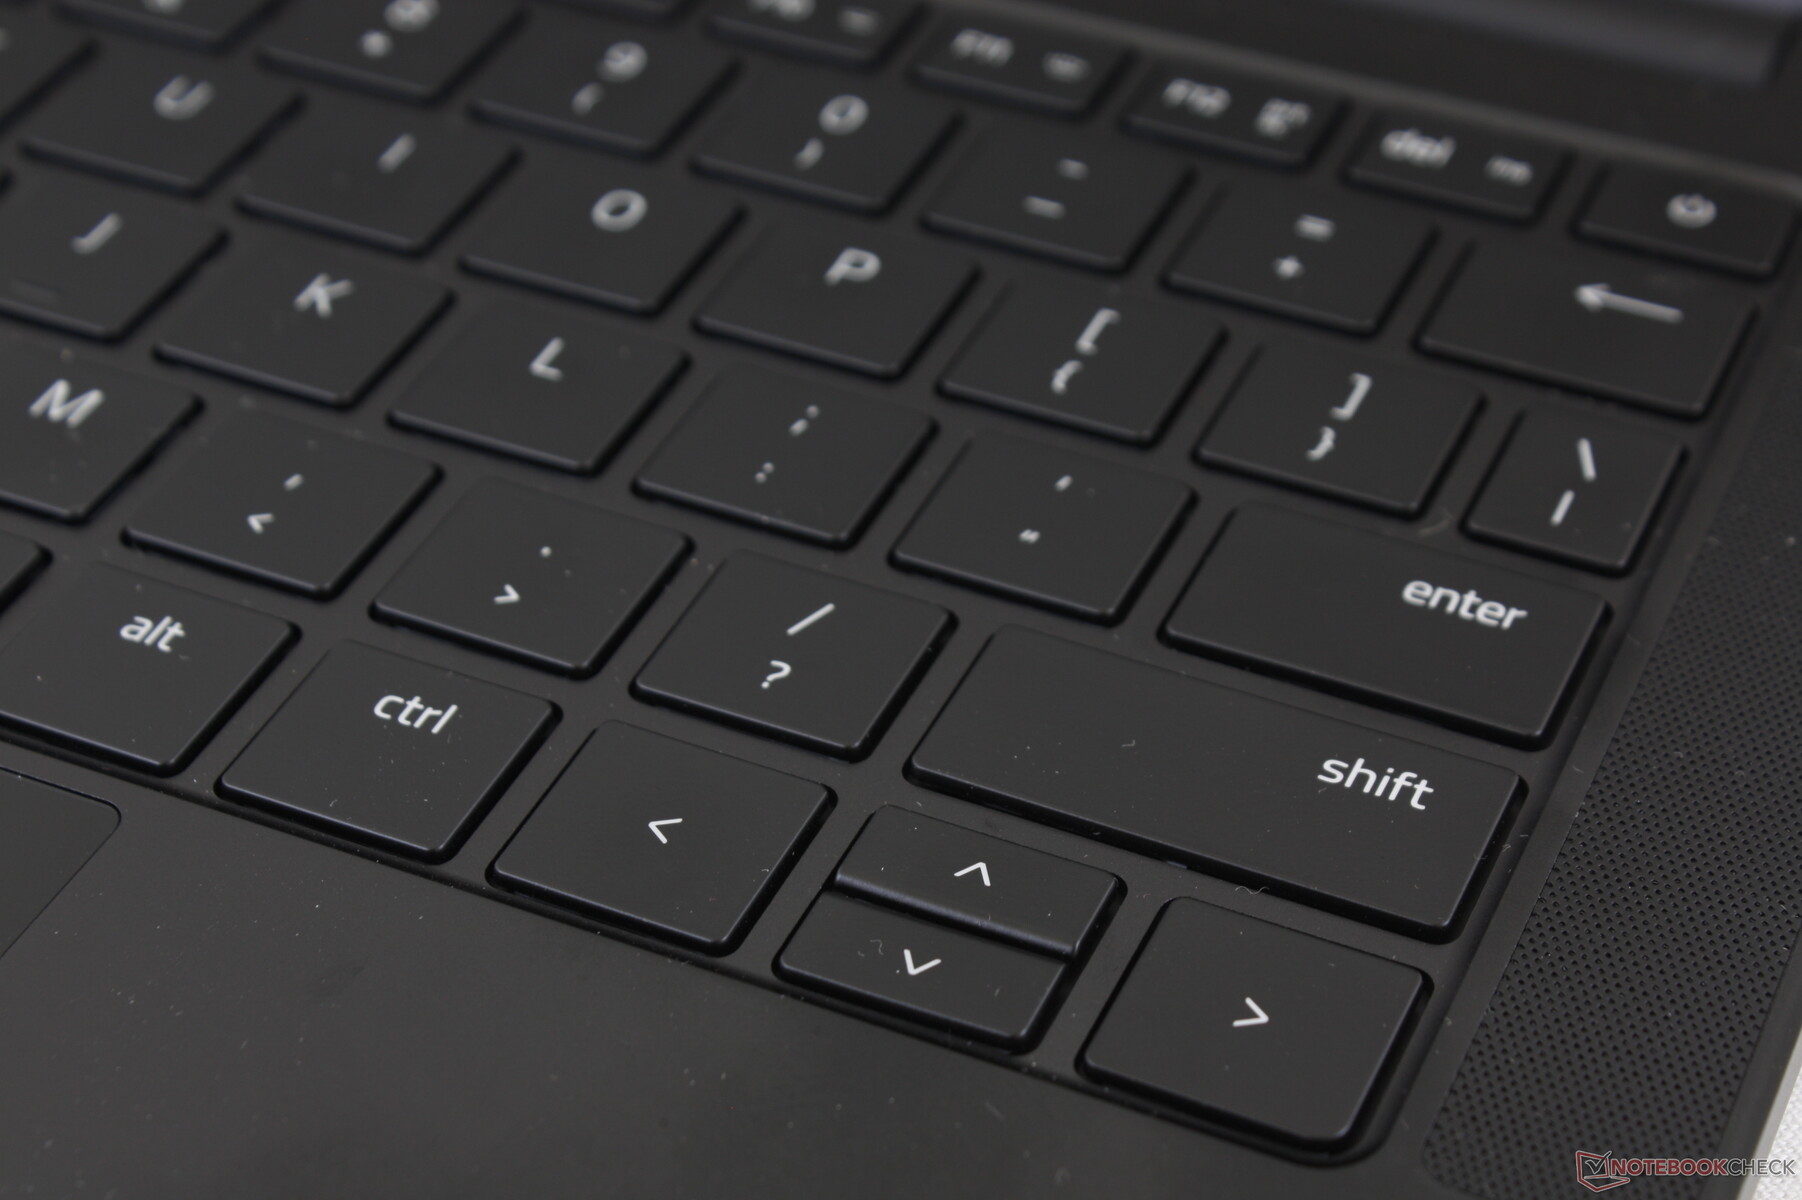
Input Devices
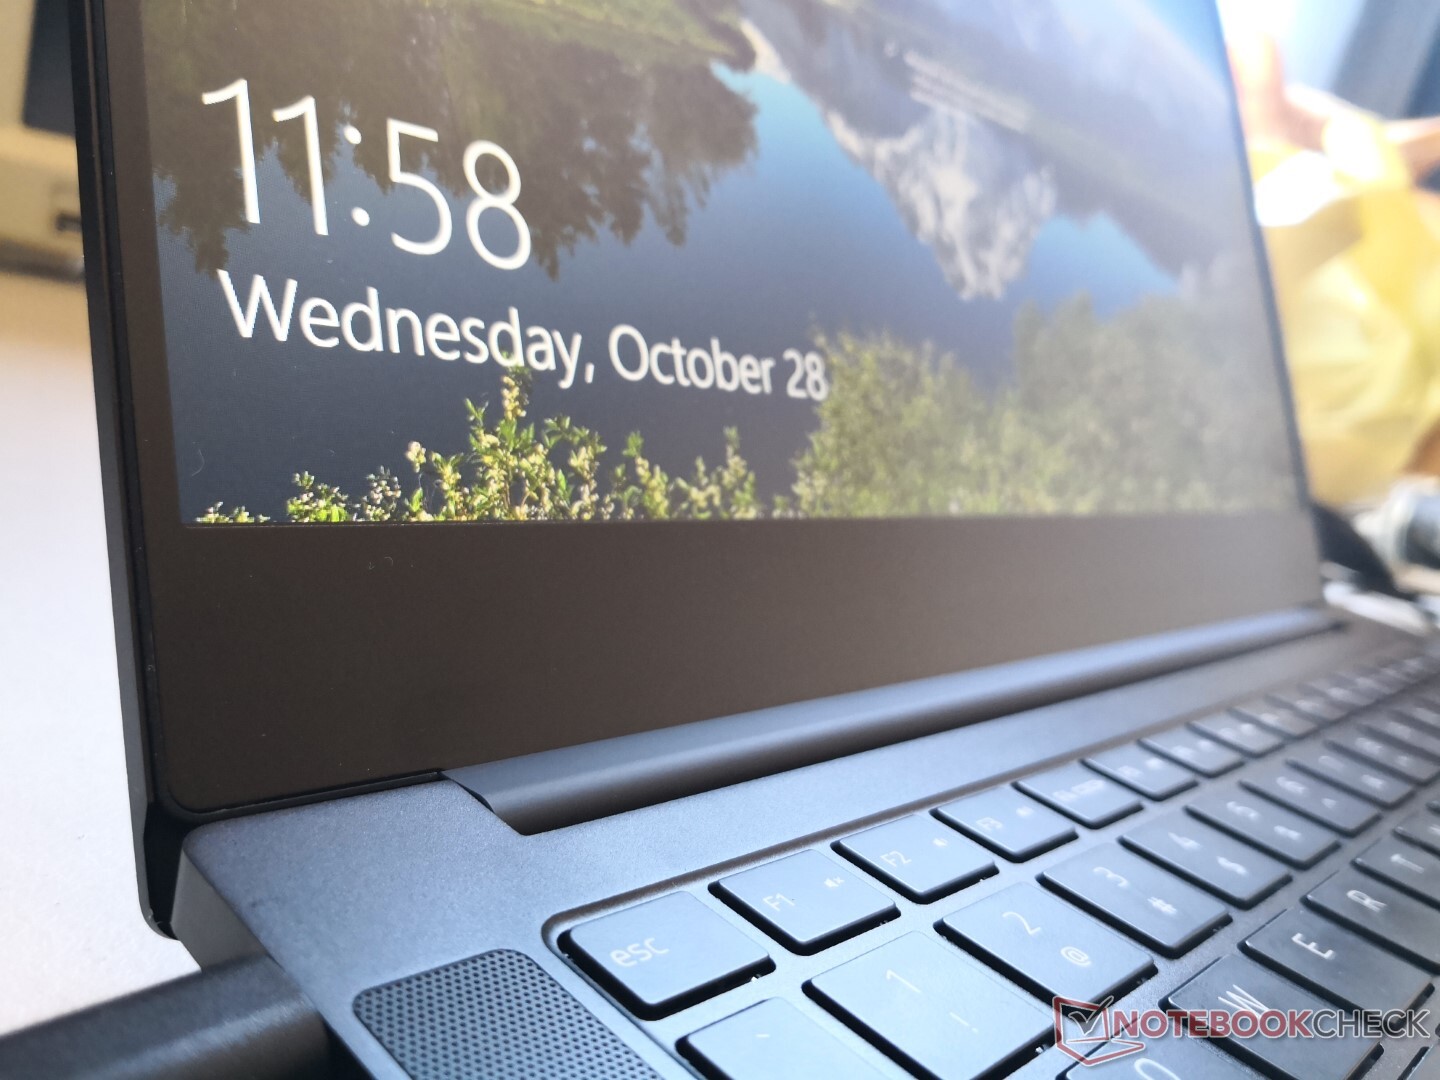
Display
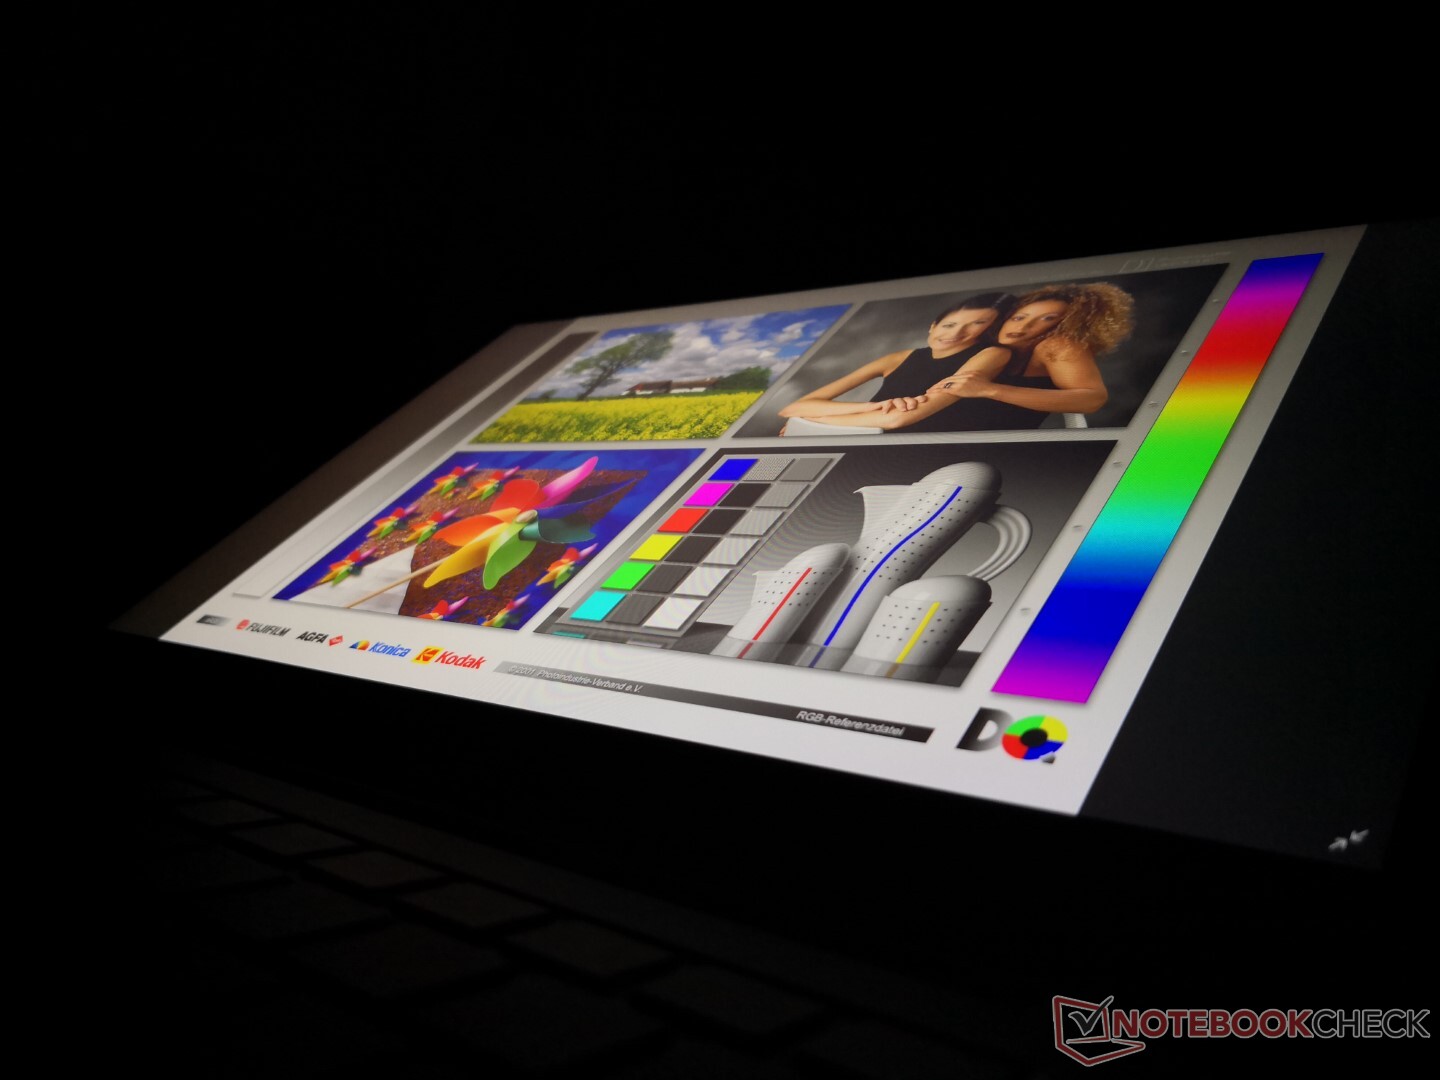
The Blade Stealth continues to be one of the few (if not only) 13.3-inch laptops with 120 Hz display options. Indeed, its Sharp LQ133M1JW46 IPS panel can be found on no other laptop in our database at the moment. Color coverage and contrast ratio remain about the same as last year's Ice Lake-powered 4K UHD Blade Stealth, but black-white response times are still average at best and brightness is actually down by about 15 to 20 percent. This is still a high quality panel no less so long as users don't expect the same super-fast response times or high brightness levels that the larger Blade 15 is able to offer.


| |||||||||||||||||||||||||
Brightness Distribution: 88 %
Center on Battery: 356.8 cd/m²
Contrast: 1049:1 (Black: 0.34 cd/m²)
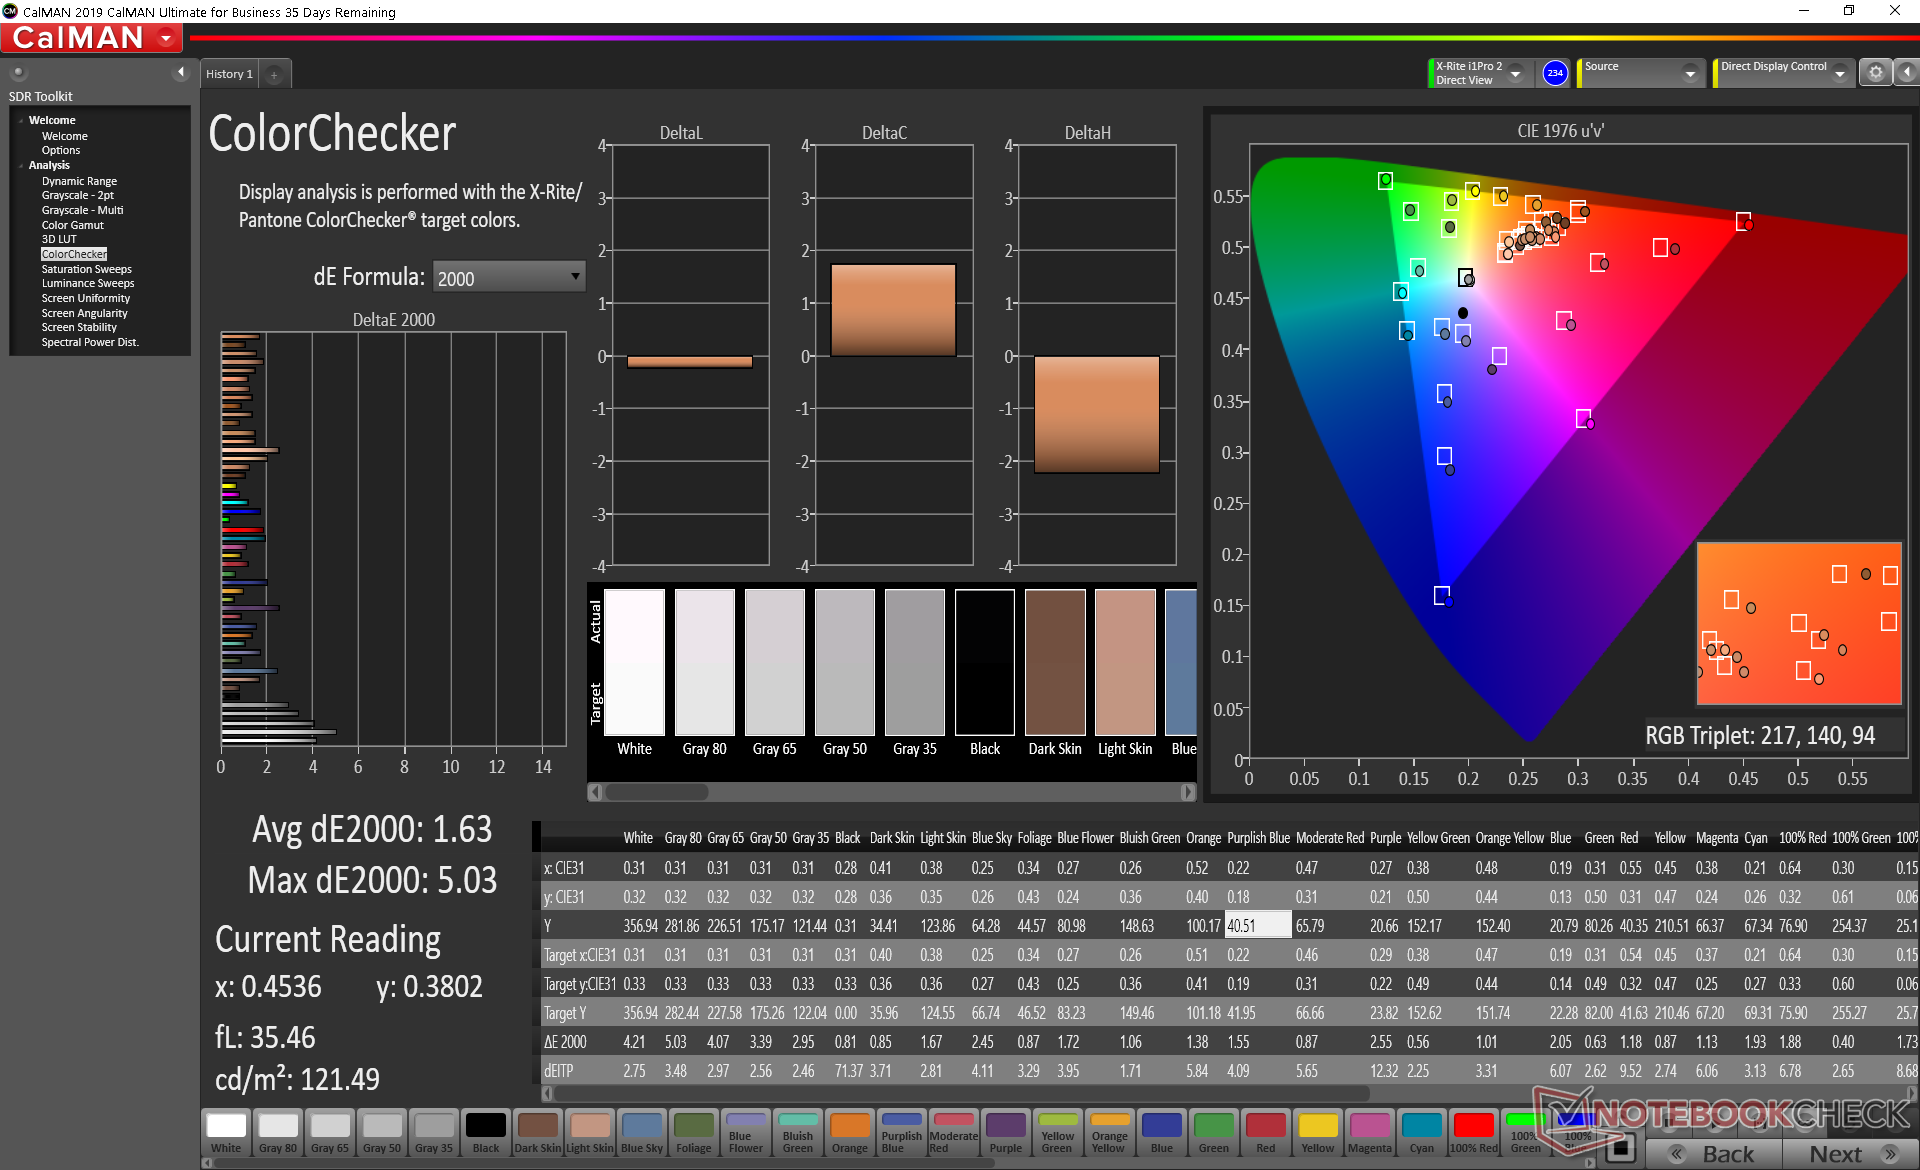
ΔE ColorChecker Calman: 1.63 | ∀{0.5-29.43 Ø4.74}
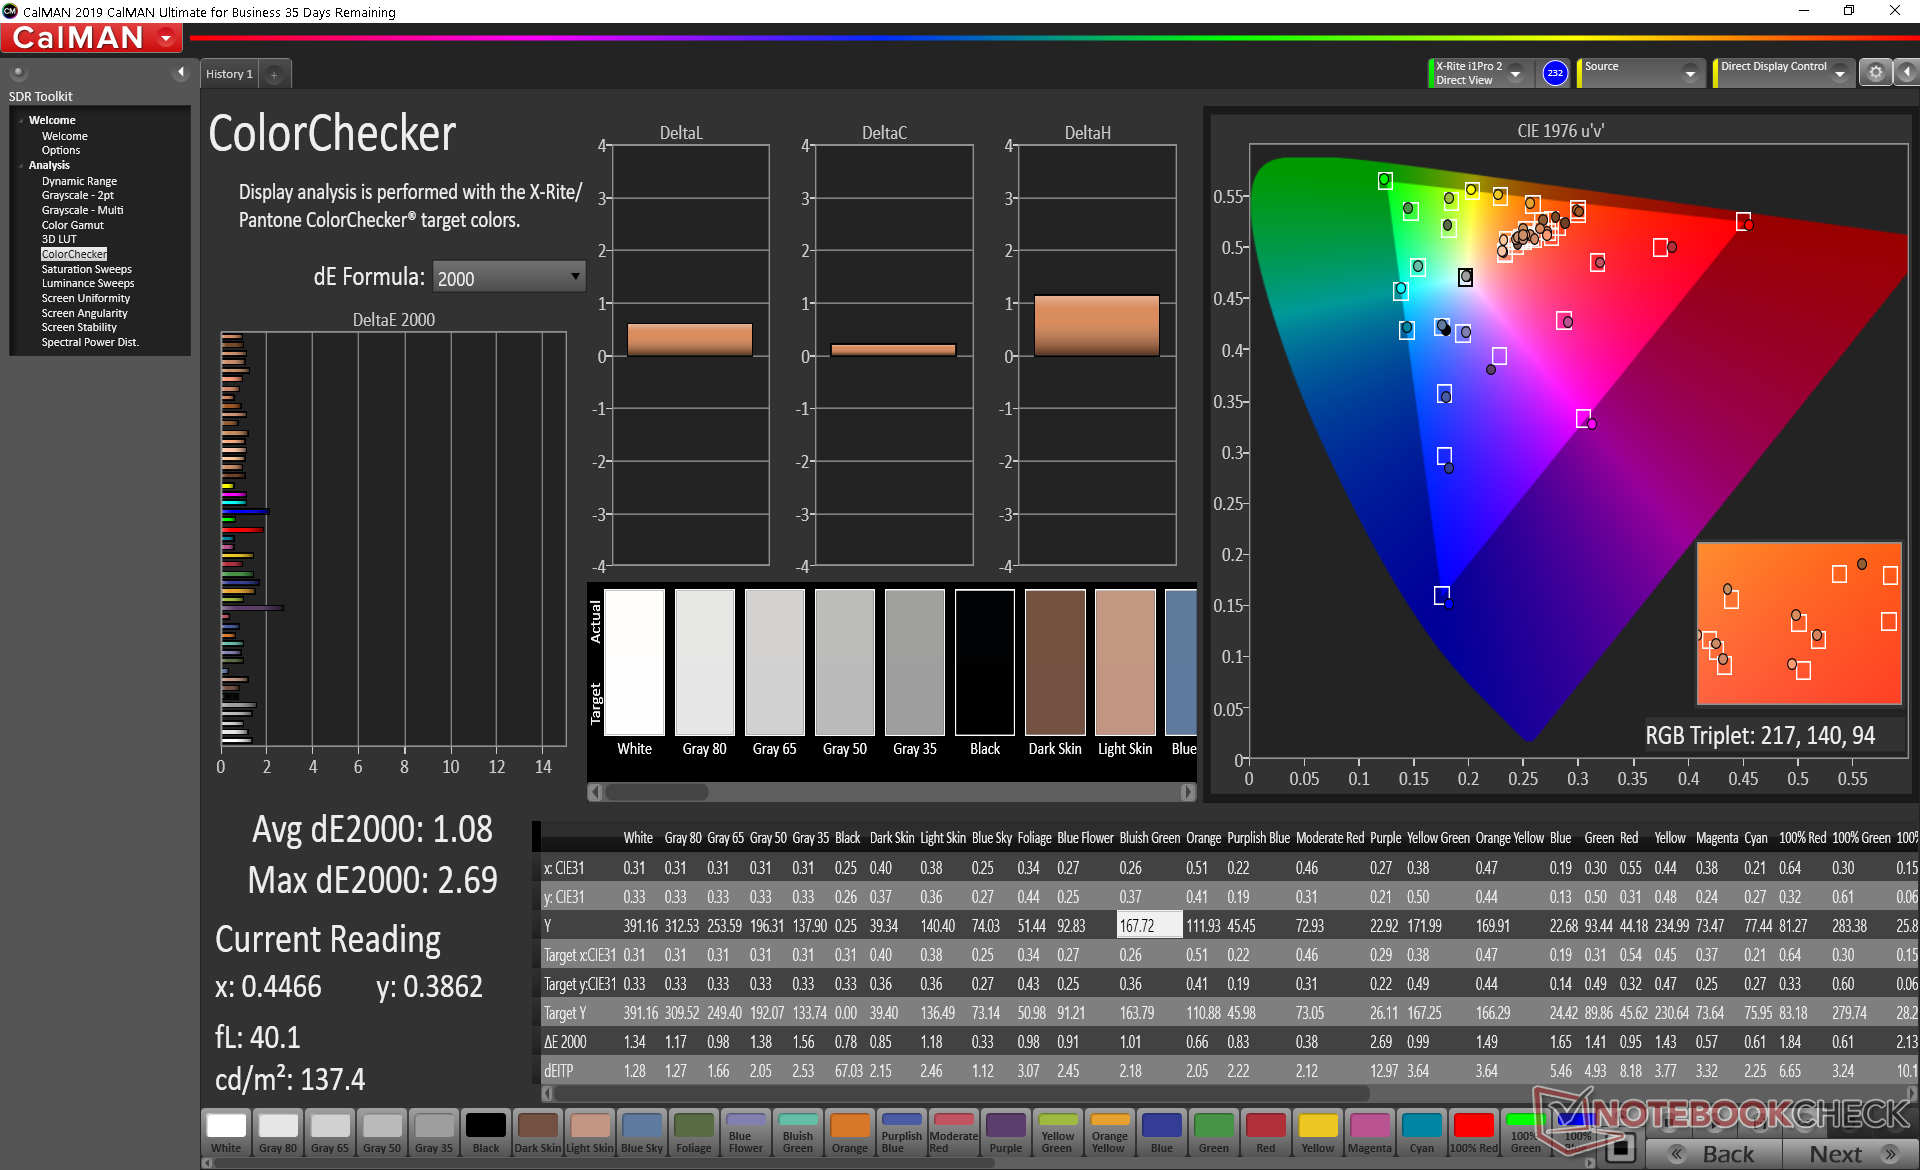
calibrated: 1.08
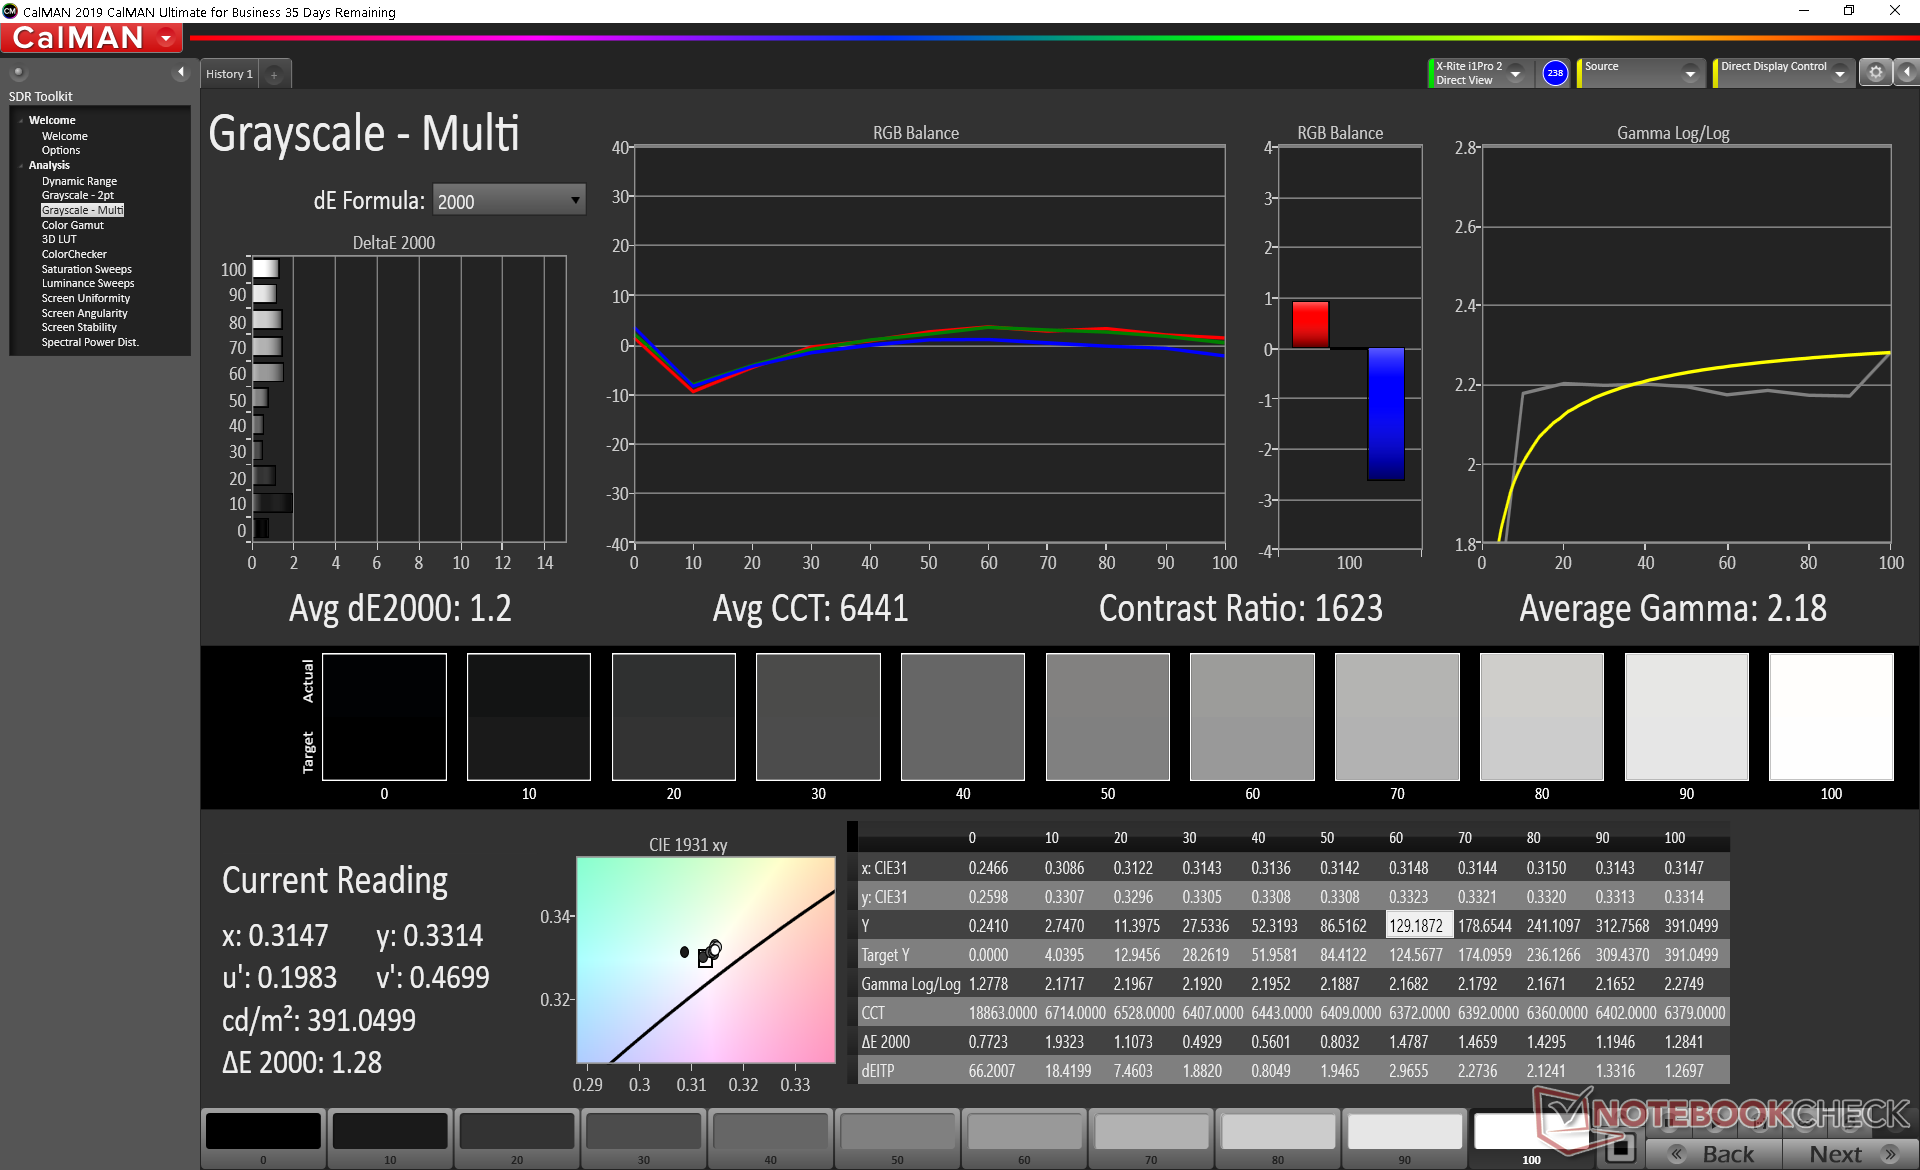
ΔE Greyscale Calman: 3 | ∀{0.09-98 Ø4.98}
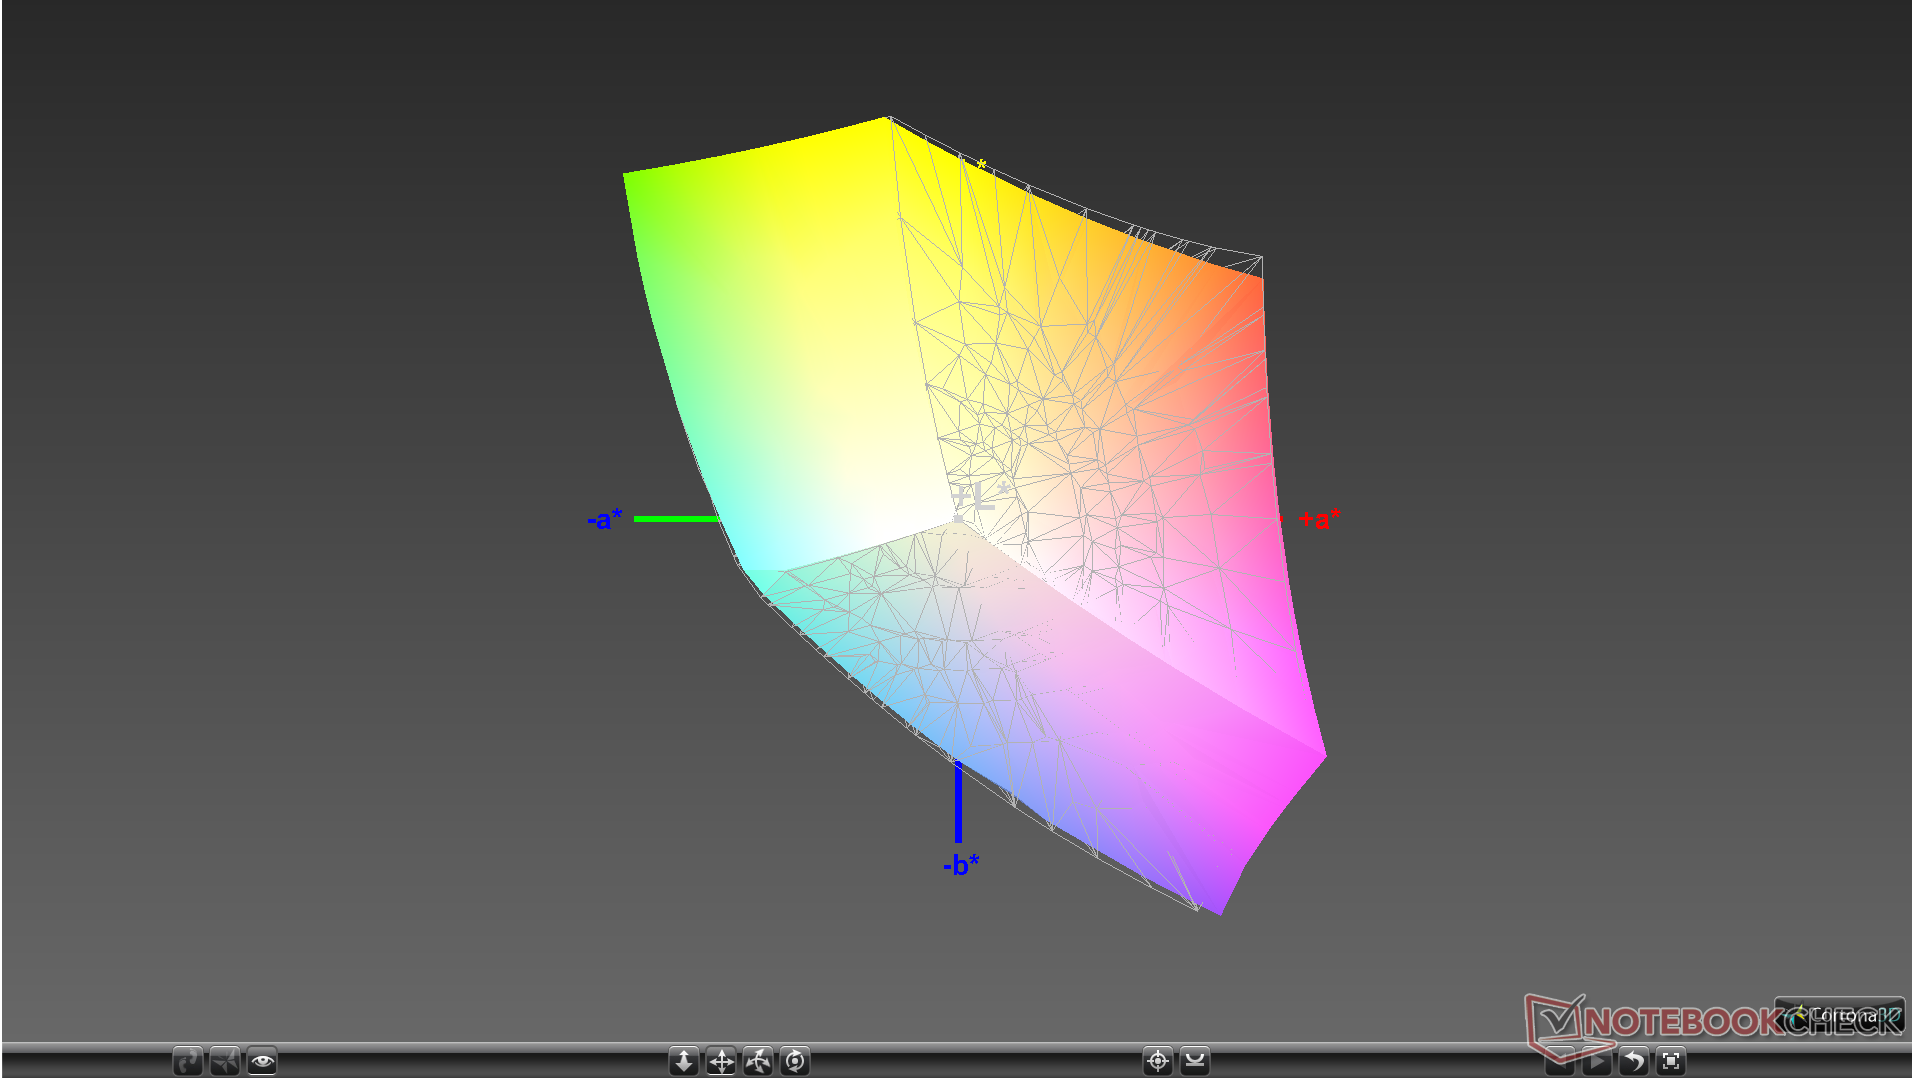
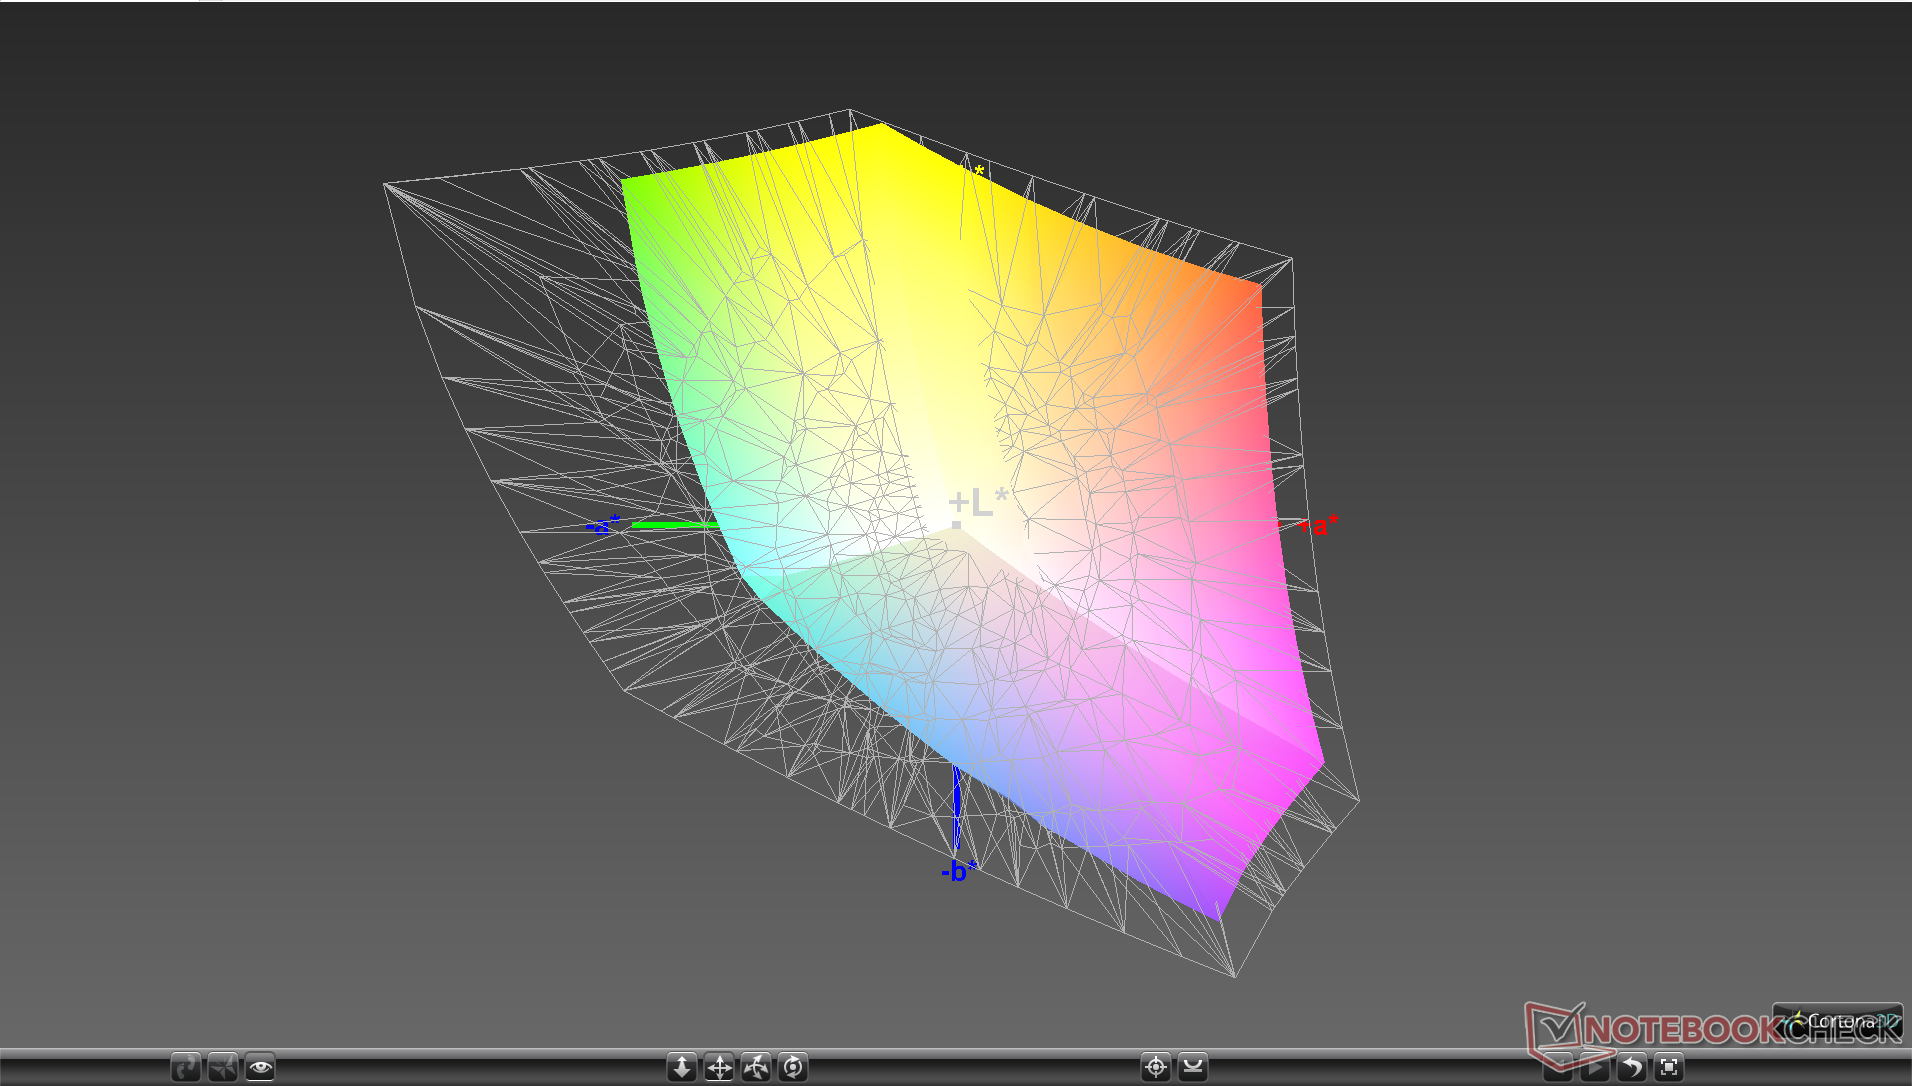
97.6% sRGB (Argyll 1.6.3 3D)
62% AdobeRGB 1998 (Argyll 1.6.3 3D)
67.1% AdobeRGB 1998 (Argyll 3D)
97.4% sRGB (Argyll 3D)
66% Display P3 (Argyll 3D)
Gamma: 2.23
CCT: 6434 K
| Razer Blade Stealth i7-1165G7 GTX 1650 Ti Max-Q Sharp LQ133M1JW46, IPS, 13.3", 1920x1080 | Razer Blade Stealth Core i7 GTX 1650 Ti Max-Q 4K AUO272B, IPS, 13.3", 3840x2160 | Dell XPS 13 9310 Core i7 FHD Sharp LQ134N1, IPS, 13.4", 1920x1200 | Huawei MateBook X Pro 2020 i7 JDI LPM139M422A, LTPS, 13.9", 3000x2000 | Asus Zenbook S UX393JA AU Optronics B139KAN01.0, IPS, 13.9", 3300x2200 | Lenovo Yoga Slim 7-14IIL05 N140HCG-EQ1, , 14", 1920x1080 | |
|---|---|---|---|---|---|---|
| Display | -4% | 6% | 2% | 27% | 1% | |
| Display P3 Coverage (%) | 66 | 63.7 -3% | 70.9 7% | 66.6 1% | 97.7 48% | 66.4 1% |
| sRGB Coverage (%) | 97.4 | 93.7 -4% | 99.1 2% | 99.4 2% | 99.8 2% | 98.8 1% |
| AdobeRGB 1998 Coverage (%) | 67.1 | 64.5 -4% | 72.9 9% | 68.6 2% | 87.9 31% | 68.4 2% |
| Response Times | 1% | 11% | 16% | -1% | 9% | |
| Response Time Grey 50% / Grey 80% * (ms) | 57.6 ? | 57.6 ? -0% | 52 ? 10% | 49.6 ? 14% | 56.4 ? 2% | 51.2 ? 11% |
| Response Time Black / White * (ms) | 37.6 ? | 37.2 ? 1% | 33.2 ? 12% | 30.8 ? 18% | 38.8 ? -3% | 35.2 ? 6% |
| PWM Frequency (Hz) | 2475 ? | 29070 ? | ||||
| Screen | -0% | -6% | 28% | -20% | 6% | |
| Brightness middle (cd/m²) | 356.8 | 467 31% | 543.3 52% | 557 56% | 444.1 24% | 289 -19% |
| Brightness (cd/m²) | 336 | 448 33% | 524 56% | 532 58% | 423 26% | 286 -15% |
| Brightness Distribution (%) | 88 | 92 5% | 92 5% | 87 -1% | 89 1% | 92 5% |
| Black Level * (cd/m²) | 0.34 | 0.39 -15% | 0.38 -12% | 0.33 3% | 0.37 -9% | 0.17 50% |
| Contrast (:1) | 1049 | 1197 14% | 1430 36% | 1688 61% | 1200 14% | 1700 62% |
| Colorchecker dE 2000 * | 1.63 | 2.1 -29% | 3.02 -85% | 1.4 14% | 2.94 -80% | 2.5 -53% |
| Colorchecker dE 2000 max. * | 5.03 | 5.1 -1% | 7.61 -51% | 2.5 50% | 7.37 -47% | 4.7 7% |
| Colorchecker dE 2000 calibrated * | 1.08 | 2.04 -89% | 1.23 -14% | 0.7 35% | 3.05 -182% | 0.6 44% |
| Greyscale dE 2000 * | 3 | 1.3 57% | 5 -67% | 2 33% | 2.9 3% | 3.4 -13% |
| Gamma | 2.23 99% | 2.26 97% | 2.02 109% | 2.14 103% | 2.1 105% | 1.98 111% |
| CCT | 6434 101% | 6501 100% | 6550 99% | 6689 97% | 6766 96% | 7005 93% |
| Color Space (Percent of AdobeRGB 1998) (%) | 62 | 59.5 -4% | 66.8 8% | 62.5 1% | 78.2 26% | 62.6 1% |
| Color Space (Percent of sRGB) (%) | 97.6 | 93.4 -4% | 99.6 2% | 99.5 2% | 99.8 2% | 98.9 1% |
| Total Average (Program / Settings) | -1% /
-1% | 4% /
-2% | 15% /
22% | 2% /
-9% | 5% /
6% |
* ... smaller is better
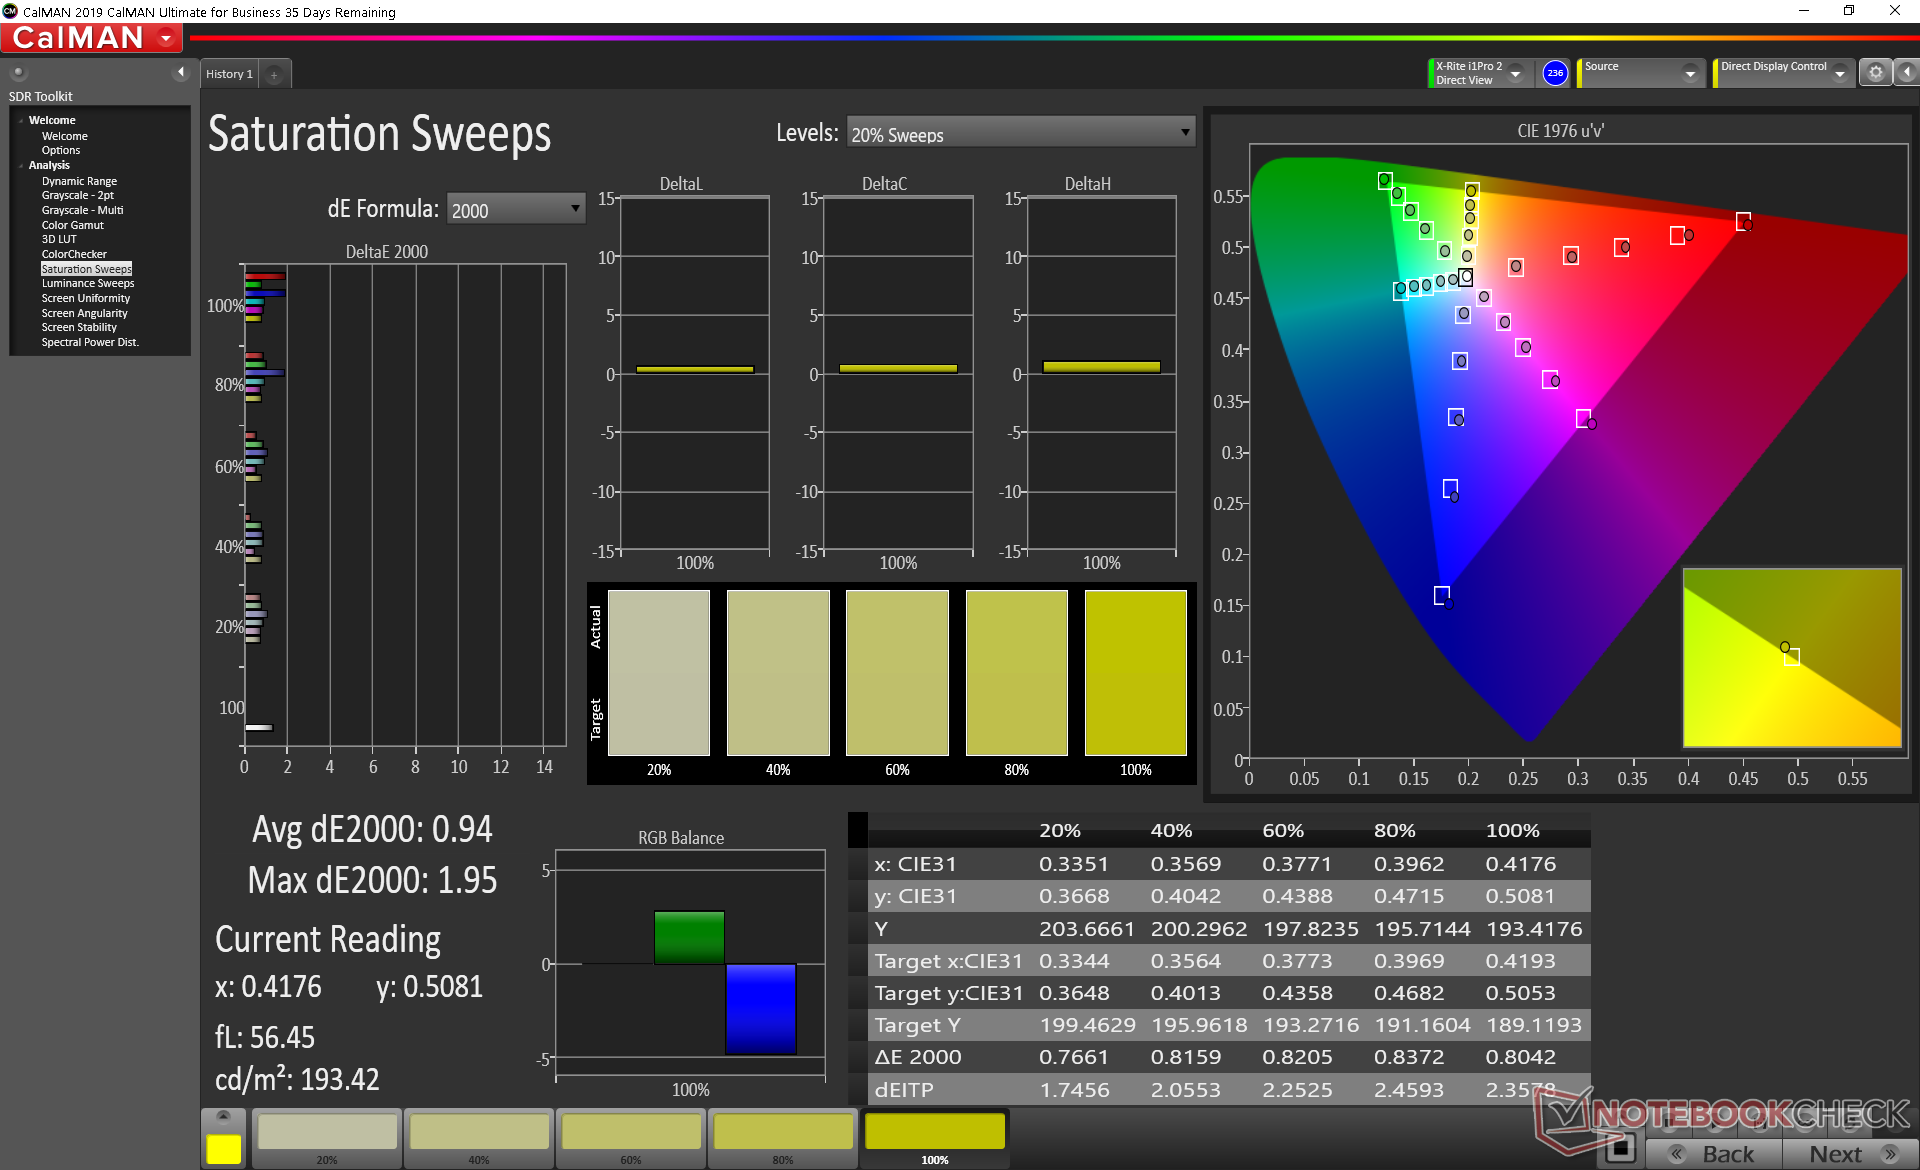
Color space encompasses all of sRGB and not any higher. The Blade Stealth series doesn't offer full AdobeRGB or DCI-P3 coverage options unlike on the larger Blade 15 or Blade Pro.
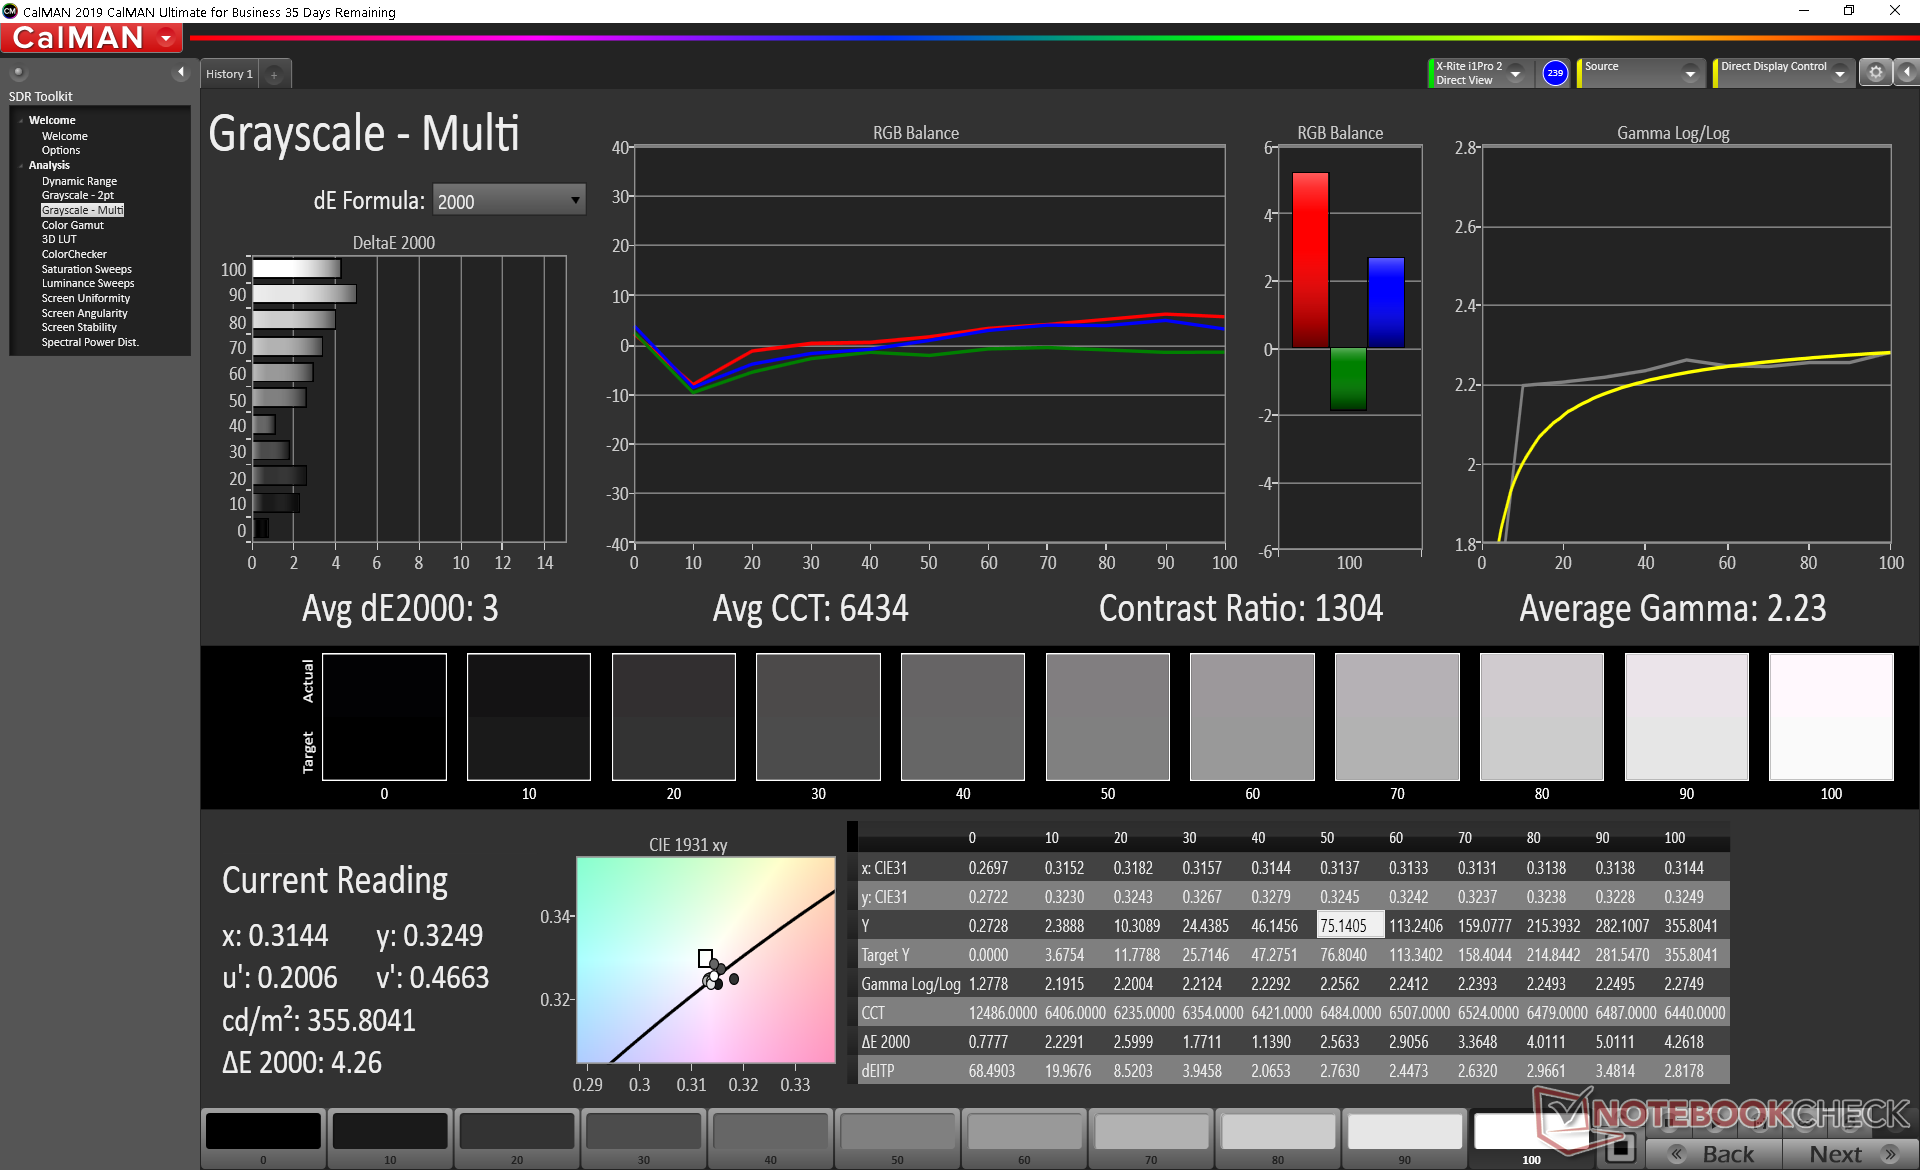
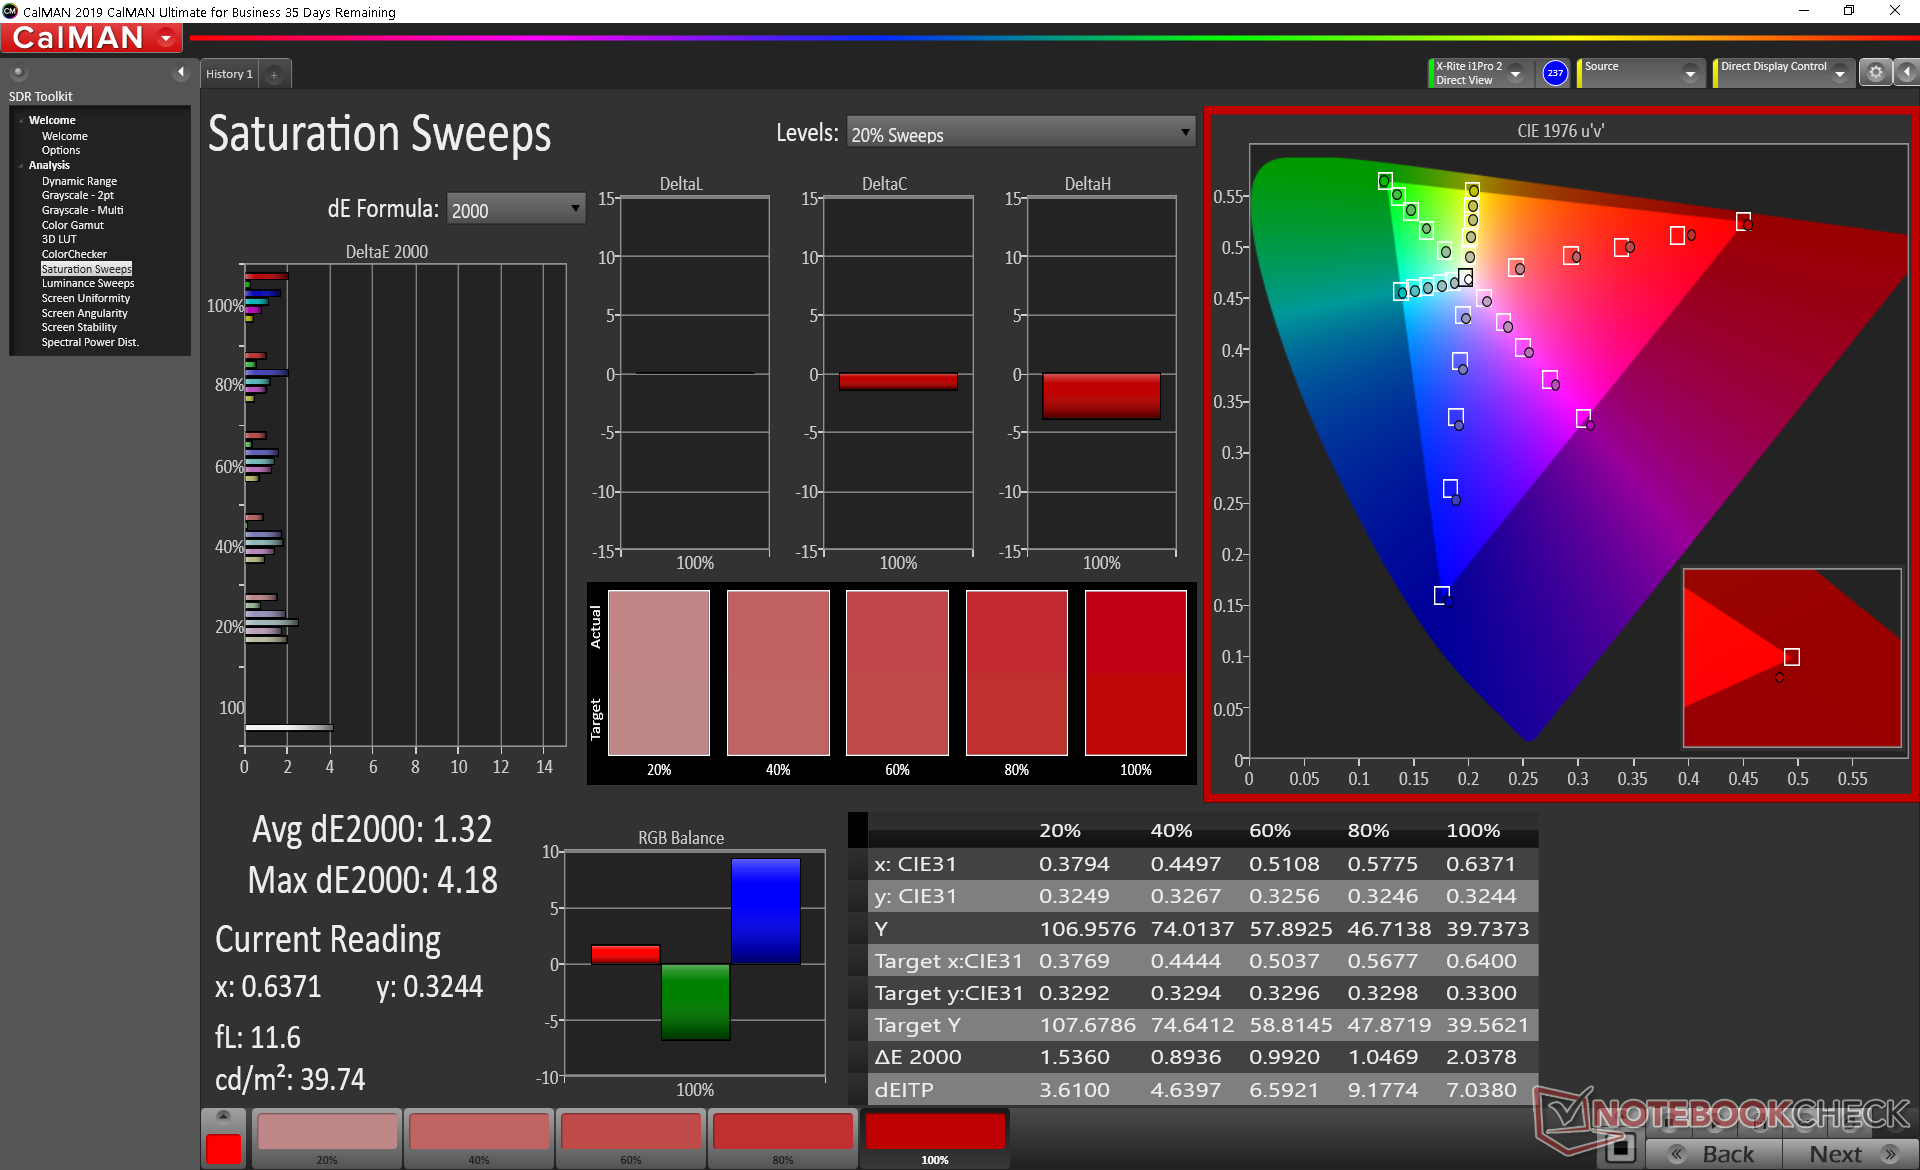
The display is well-calibrated out of the box with average grayscale and color deltaE values of just 3 and 1.63, respectively. Calibrating the display ourselves with an X-Rite colorimter would improve both grayscale and RGB balance even further albeit just marginally.
Display Response Times
| ↔ Response Time Black to White | ||
|---|---|---|
| 37.6 ms ... rise ↗ and fall ↘ combined | ↗ 20.4 ms rise | 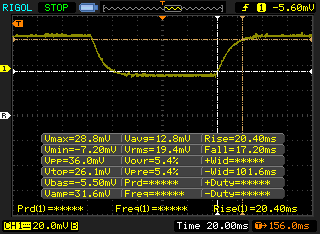 |
| ↘ 17.2 ms fall | ||
| The screen shows slow response rates in our tests and will be unsatisfactory for gamers. In comparison, all tested devices range from 0.1 (minimum) to 240 (maximum) ms. » 95 % of all devices are better. This means that the measured response time is worse than the average of all tested devices (19.9 ms). | ||
| ↔ Response Time 50% Grey to 80% Grey | ||
| 57.6 ms ... rise ↗ and fall ↘ combined | ↗ 26 ms rise | 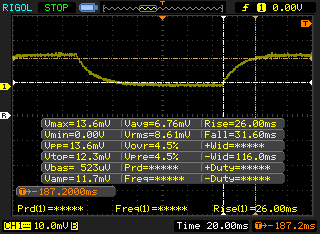 |
| ↘ 31.6 ms fall | ||
| The screen shows slow response rates in our tests and will be unsatisfactory for gamers. In comparison, all tested devices range from 0.165 (minimum) to 636 (maximum) ms. » 94 % of all devices are better. This means that the measured response time is worse than the average of all tested devices (31.2 ms). | ||
Screen Flickering / PWM (Pulse-Width Modulation)
| Screen flickering / PWM not detected | 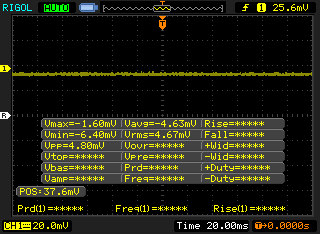 | ||
In comparison: 52 % of all tested devices do not use PWM to dim the display. If PWM was detected, an average of 7867 (minimum: 5 - maximum: 343500) Hz was measured. | |||
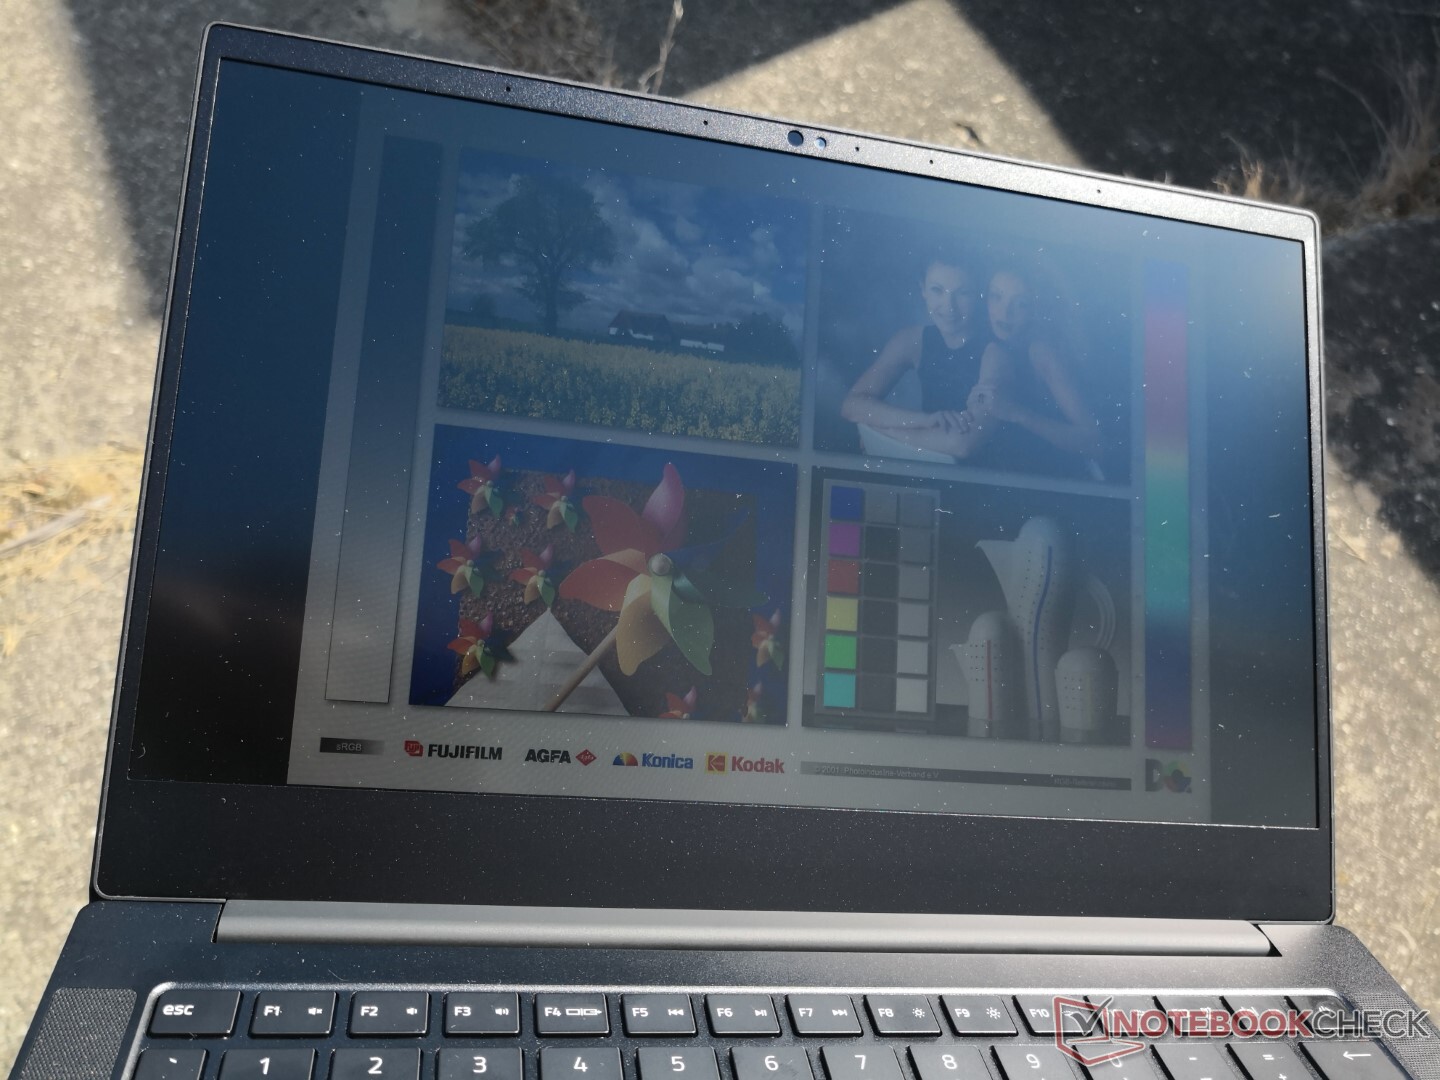
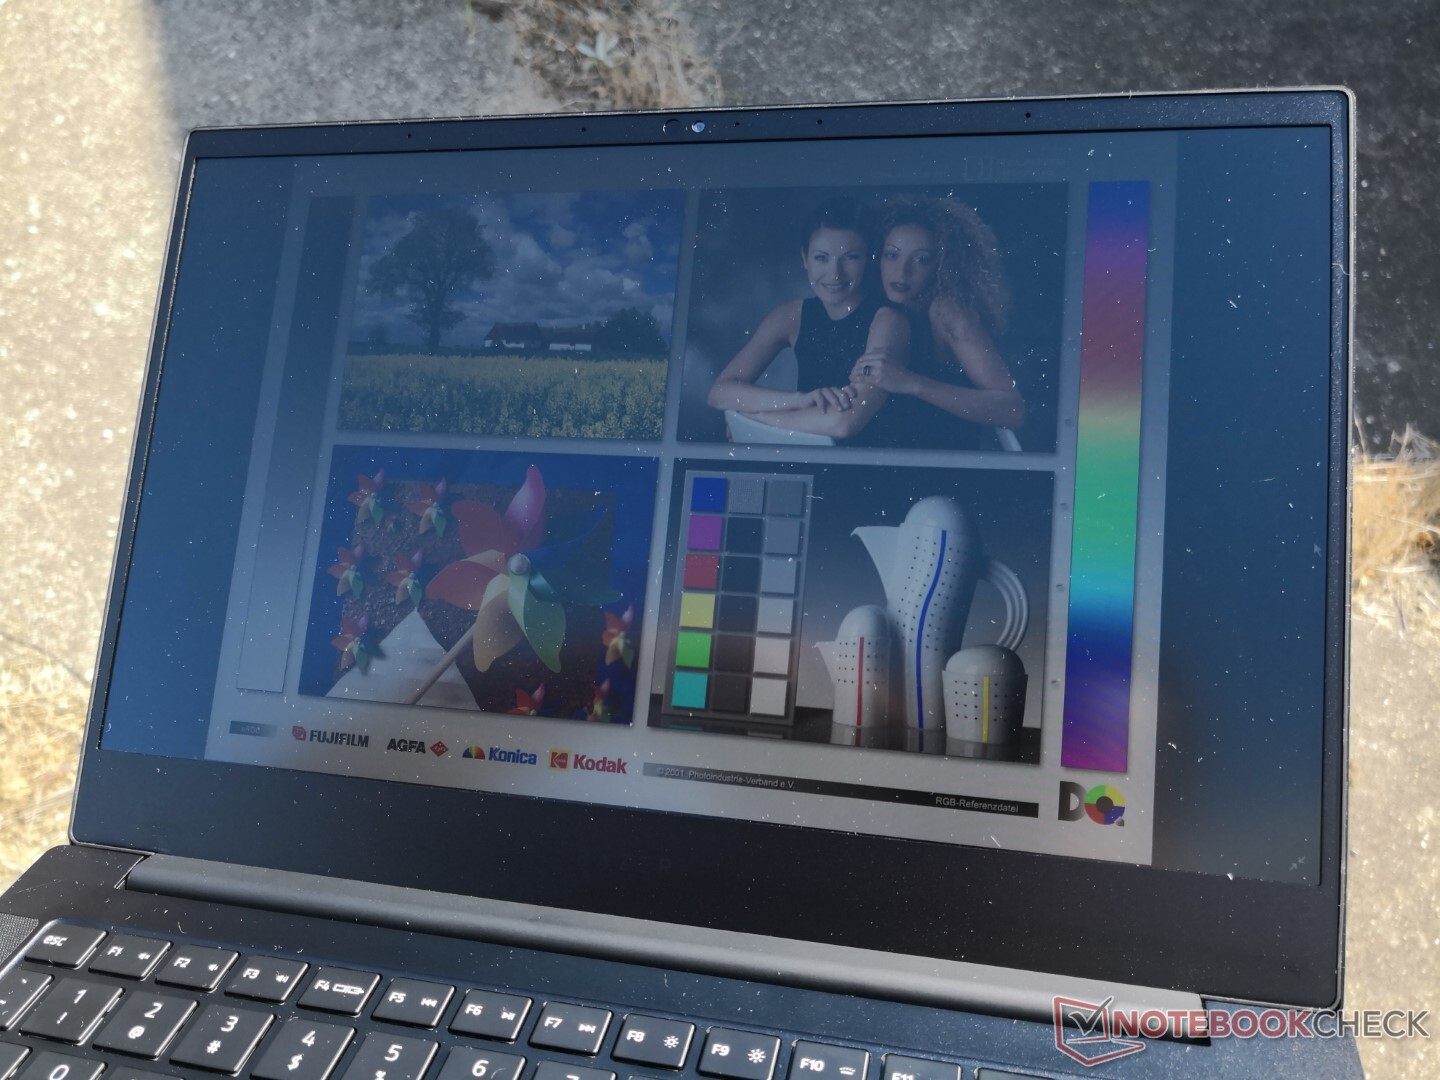
Though the display isn't necessarily dim, it also isn't nearly as bright as most other flagship Ultrabooks. Many popular models like the MacBook Pro 13, Dell XPS 13, or Huawei MateBook X Pro can reach over 500 nits compared to "only" 330 nits on our Blade Stealth for better outdoor visibility.


Performance
Razer doesn't like offering anything slower than the Core i7 series and this remains true on the Tiger Lake Blade Stealth. The company seems content sticking with Intel with no AMD options for the time being.
Interestingly, there are no Tiger Lake SKUs at the moment without the GeForce GTX 1650 Ti Max-Q GPU in contrast to the original Ice Lake Blade Stealth. Perhaps the lukewarm reception to the iGPU-only Ice Lake version had a hand in Razer dropping an iGPU-only Tiger Lake option.
All benchmarks below were performed on the Razer Gaming power profile for the highest possible scores. We recommend that owners become familiar with Razer Synapse as system features are tied directly to this pre-installed software.
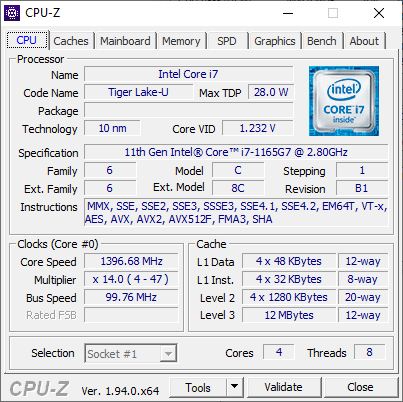
Processor
Raw multi-thread CPU performance is about 15 to 20 percent faster than the 25 W Core i7-1065G7 Blade Stealth released earlier this year. When compared to the 15 W Core i7-1065G7, our Tiger Lake system can be up to 45 percent faster. Sustained performance is also noticeably better than on both the XPS 13 9310 and ZenBook 14 UX425 each with the same Core i7-1165G7 CPU likely due to the heavier and more capable cooling solution in the Blade Stealth. When running CineBench R15 xT in a loop, for example, scores would be 25 percent higher on the Tiger Lake Blade Stealth even after factoring in performance throttling.
Tiger Lake is still outperformed by less expensive 7 nm Ryzen parts like the octa-core Ryzen 7 4700U or even the hexa-core Ryzen 5 4500U in multi-threaded loads. Nonetheless, Intel chips are arguably better optimized with Windows and games.
See our dedicated page on the Core i7-1165G7 for more technical information and benchmark comparisons.
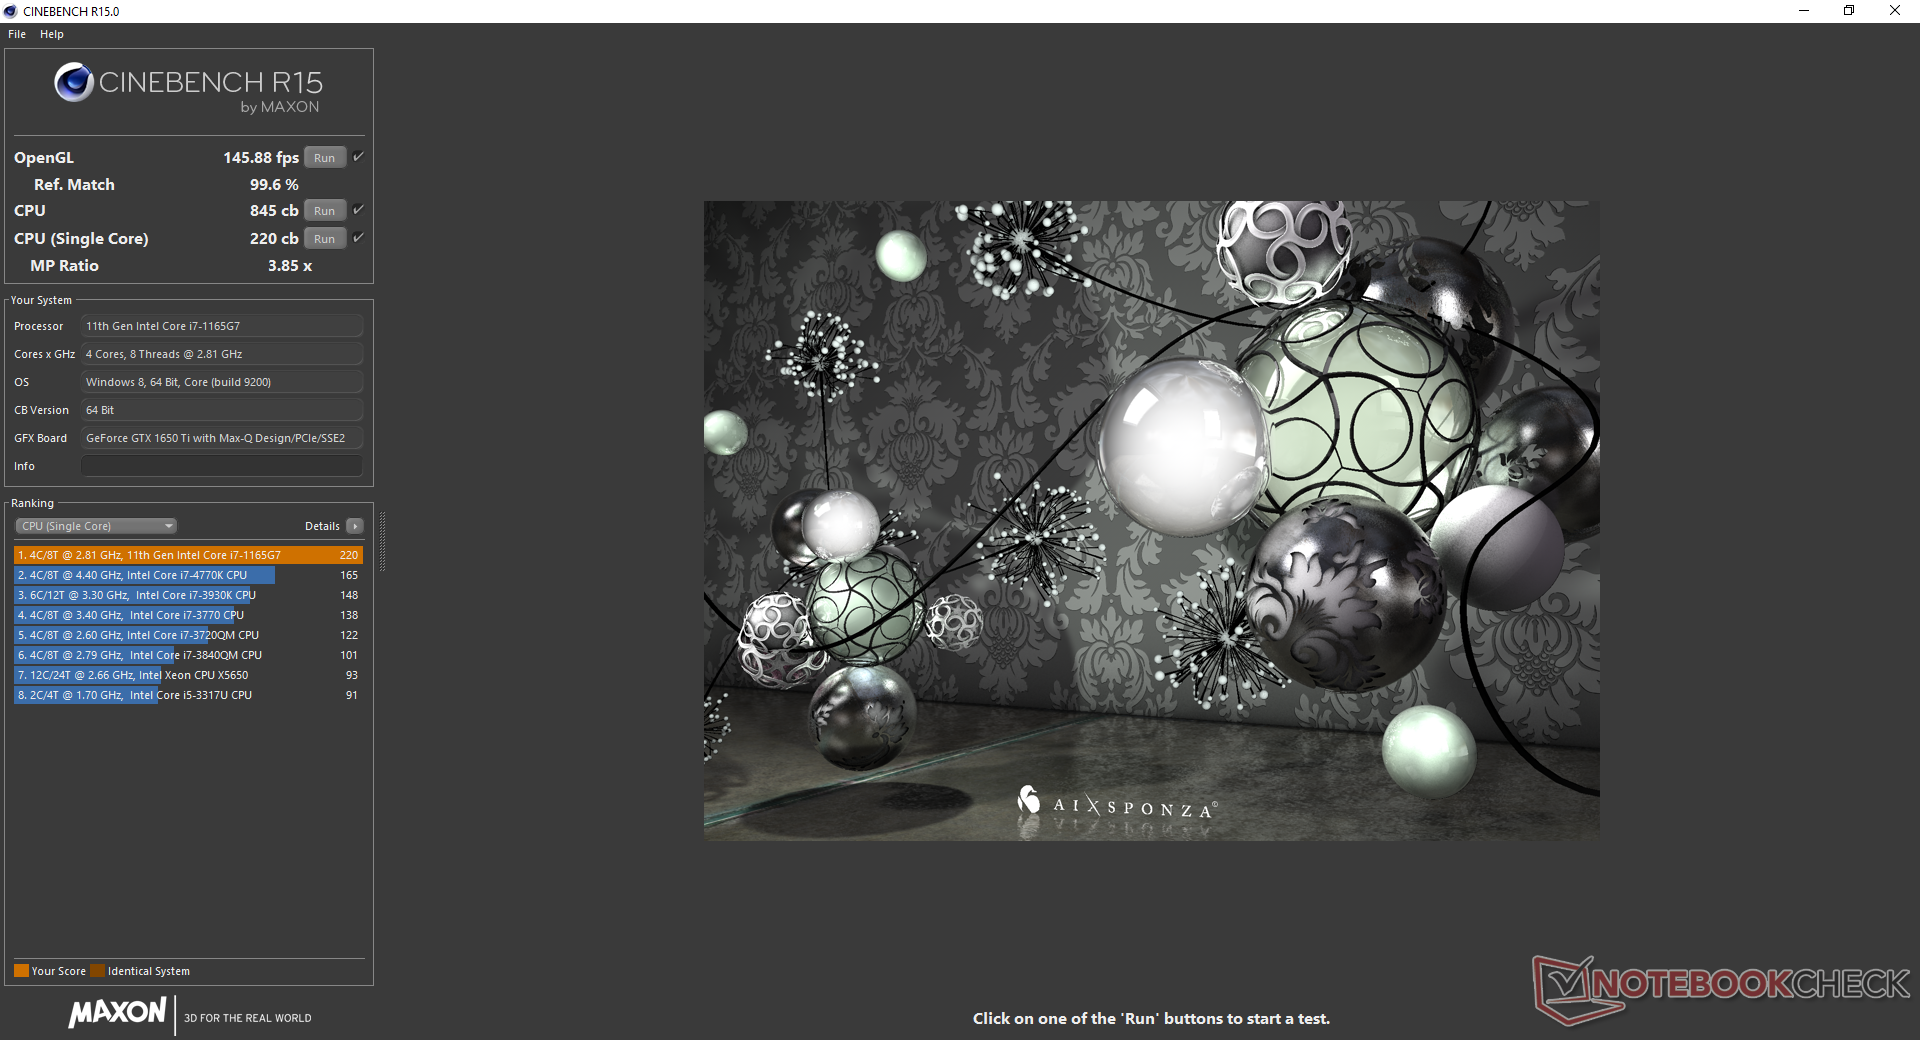
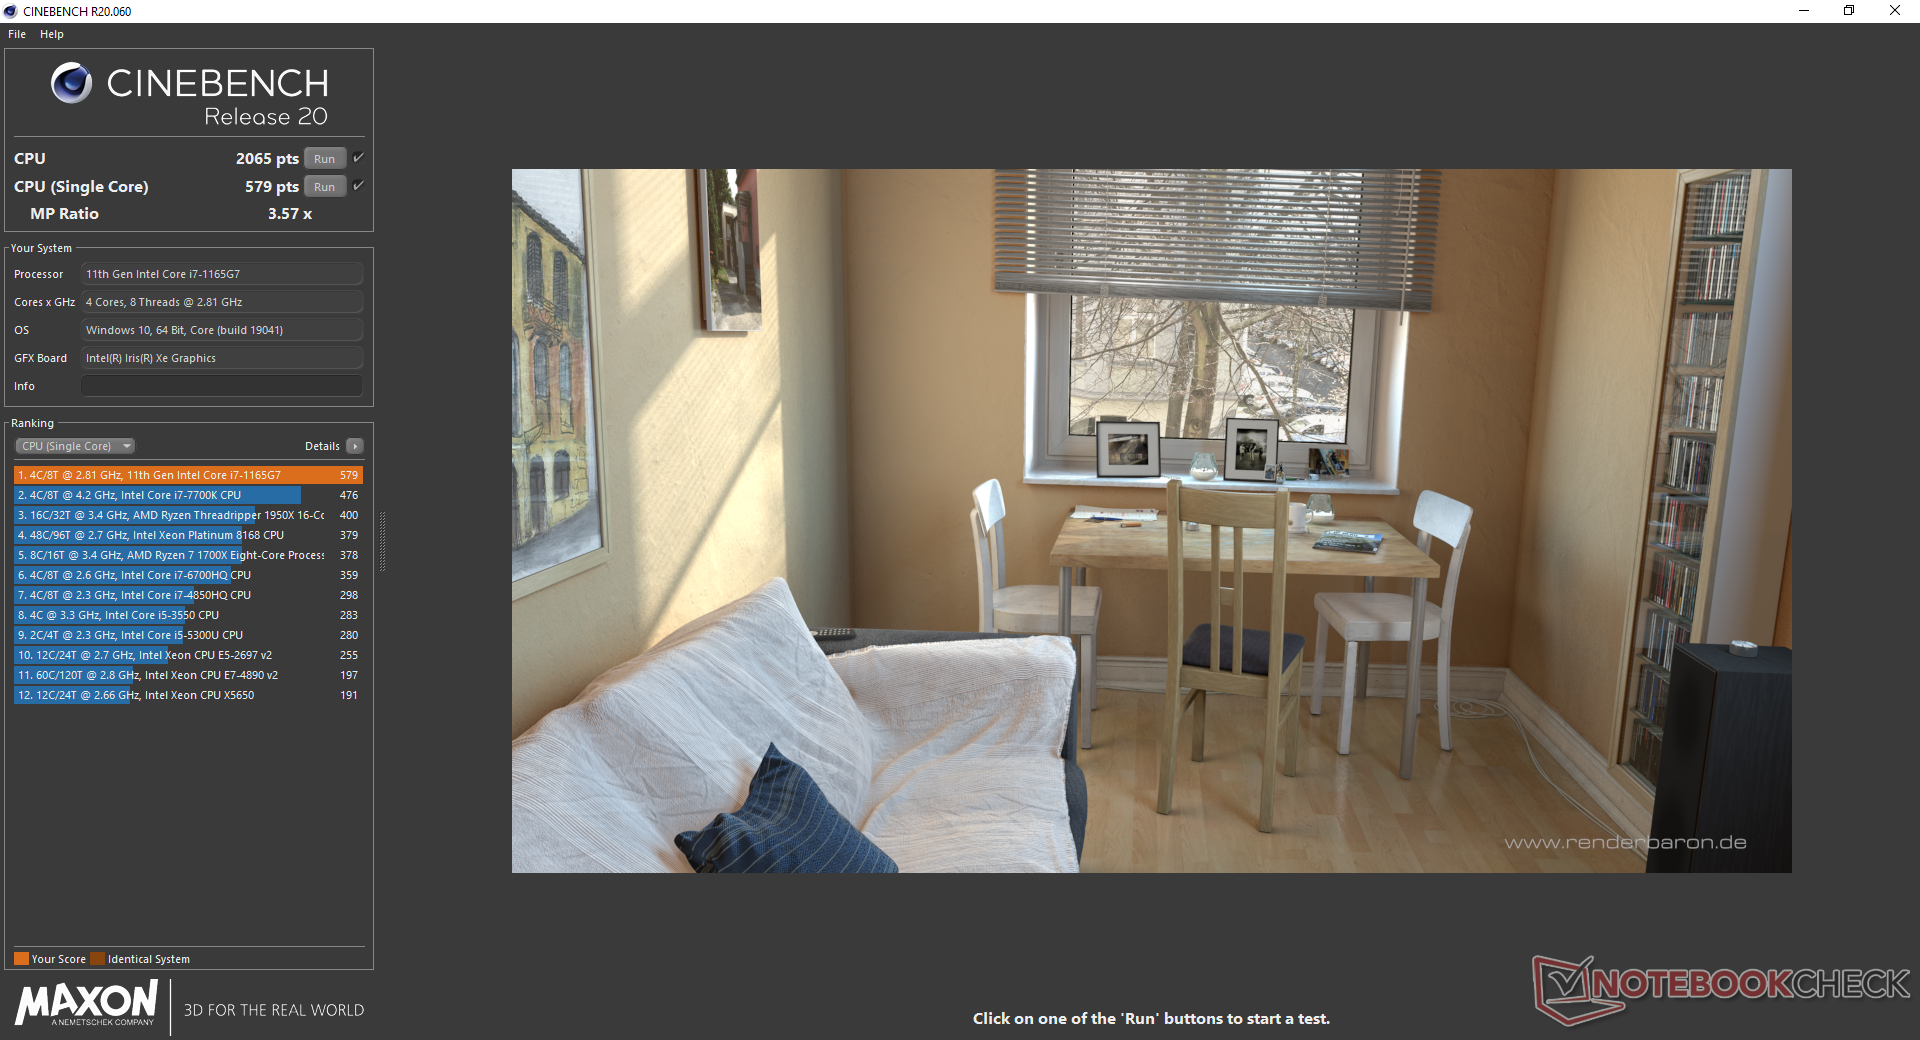
Cinebench R15: CPU Multi 64Bit | CPU Single 64Bit
Blender: v2.79 BMW27 CPU
7-Zip 18.03: 7z b 4 -mmt1 | 7z b 4
Geekbench 5.5: Single-Core | Multi-Core
HWBOT x265 Benchmark v2.2: 4k Preset
LibreOffice : 20 Documents To PDF
R Benchmark 2.5: Overall mean
| Blender / v2.79 BMW27 CPU | |
| Dell XPS 13 9300 i5 FHD | |
| Average Intel Core i7-1165G7 (468 - 1138, n=80) | |
| Lenovo IdeaPad 5 14ARE05 | |
| Razer Blade Stealth i7-1165G7 GTX 1650 Ti Max-Q | |
| Acer Swift 3 SF314-42-R4XJ | |
| Lenovo Yoga Slim 7-14ARE | |
| 7-Zip 18.03 / 7z b 4 -mmt1 | |
| Razer Blade Stealth i7-1165G7 GTX 1650 Ti Max-Q | |
| Average Intel Core i7-1165G7 (4478 - 5507, n=80) | |
| Lenovo Yoga Slim 7-14ARE | |
| Acer Swift 3 SF314-42-R4XJ | |
| Lenovo IdeaPad 5 14ARE05 | |
| Dell XPS 13 9300 i5 FHD | |
| Razer Blade Stealth Core i7 GTX 1650 Ti Max-Q 4K | |
| Geekbench 5.5 / Single-Core | |
| Razer Blade Stealth i7-1165G7 GTX 1650 Ti Max-Q | |
| Average Intel Core i7-1165G7 (1302 - 1595, n=77) | |
| Dell XPS 13 9300 i5 FHD | |
| Razer Blade Stealth Core i7 GTX 1650 Ti Max-Q 4K | |
| Lenovo Yoga Slim 7-14ARE | |
| Lenovo Yoga Slim 7-14ARE | |
| Acer Swift 3 SF314-42-R4XJ | |
| Lenovo IdeaPad 5 14ARE05 | |
| HWBOT x265 Benchmark v2.2 / 4k Preset | |
| Lenovo Yoga Slim 7-14ARE | |
| Acer Swift 3 SF314-42-R4XJ | |
| Razer Blade Stealth i7-1165G7 GTX 1650 Ti Max-Q | |
| Lenovo IdeaPad 5 14ARE05 | |
| Average Intel Core i7-1165G7 (1.39 - 8.47, n=80) | |
| Dell XPS 13 9300 i5 FHD | |
| LibreOffice / 20 Documents To PDF | |
| Razer Blade Stealth Core i7 GTX 1650 Ti Max-Q 4K | |
| Acer Swift 3 SF314-42-R4XJ | |
| Lenovo IdeaPad 5 14ARE05 | |
| Lenovo Yoga Slim 7-14ARE | |
| Average Intel Core i7-1165G7 (21.5 - 88.1, n=78) | |
| Razer Blade Stealth i7-1165G7 GTX 1650 Ti Max-Q | |
| R Benchmark 2.5 / Overall mean | |
| Dell XPS 13 9300 i5 FHD | |
| Lenovo IdeaPad 5 14ARE05 | |
| Acer Swift 3 SF314-42-R4XJ | |
| Lenovo Yoga Slim 7-14ARE | |
| Average Intel Core i7-1165G7 (0.552 - 1.002, n=80) | |
| Razer Blade Stealth i7-1165G7 GTX 1650 Ti Max-Q | |
* ... smaller is better
System Performance
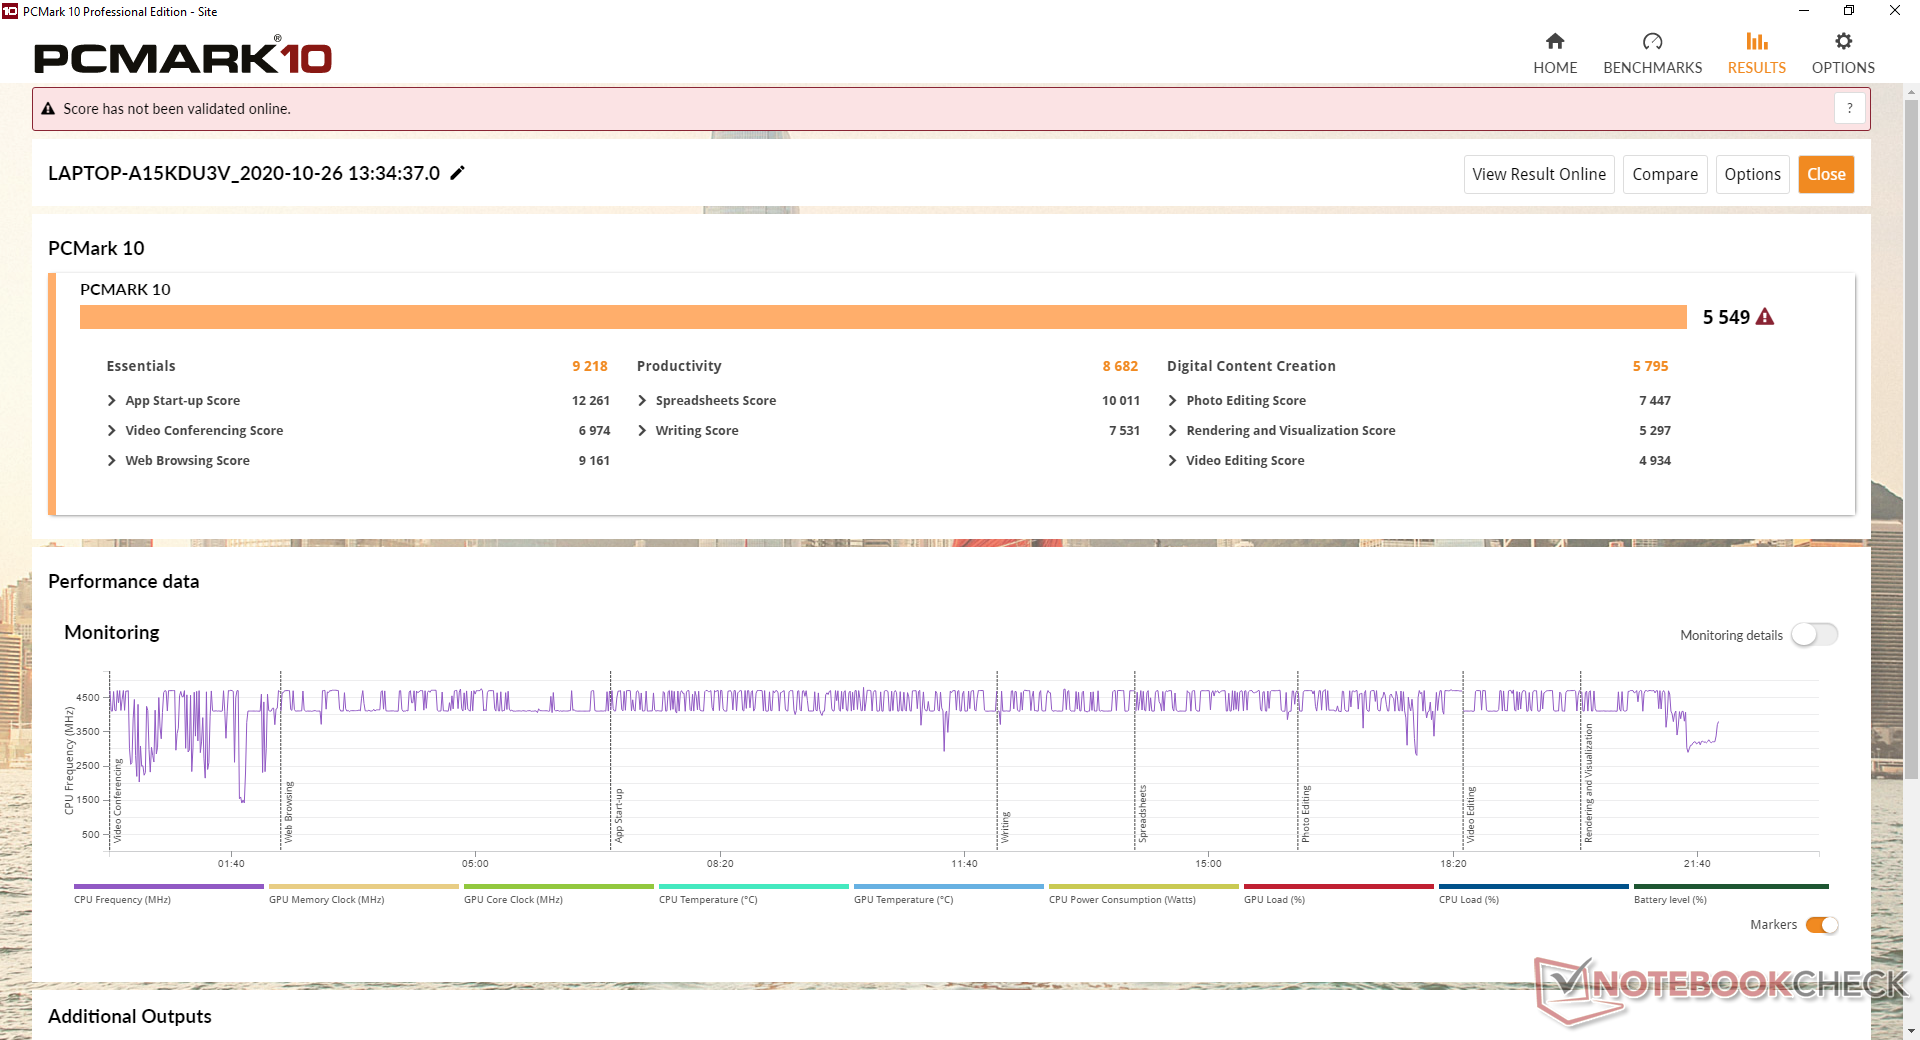
PCMark results are faster than any 13.3-inch laptop in our database simply because none are able to offer anything close to the GeForce GTX 1650 Ti Max-Q. Scores are consistently higher than the Ice Lake Blade Stealth as well.
We didn't experience any hardware or software issues during our time with the unit save for a bug related to Synapse. The software would sometimes refuse to launch if not connected to the internet which can be problematic if working in an environment with poor Wi-Fi.
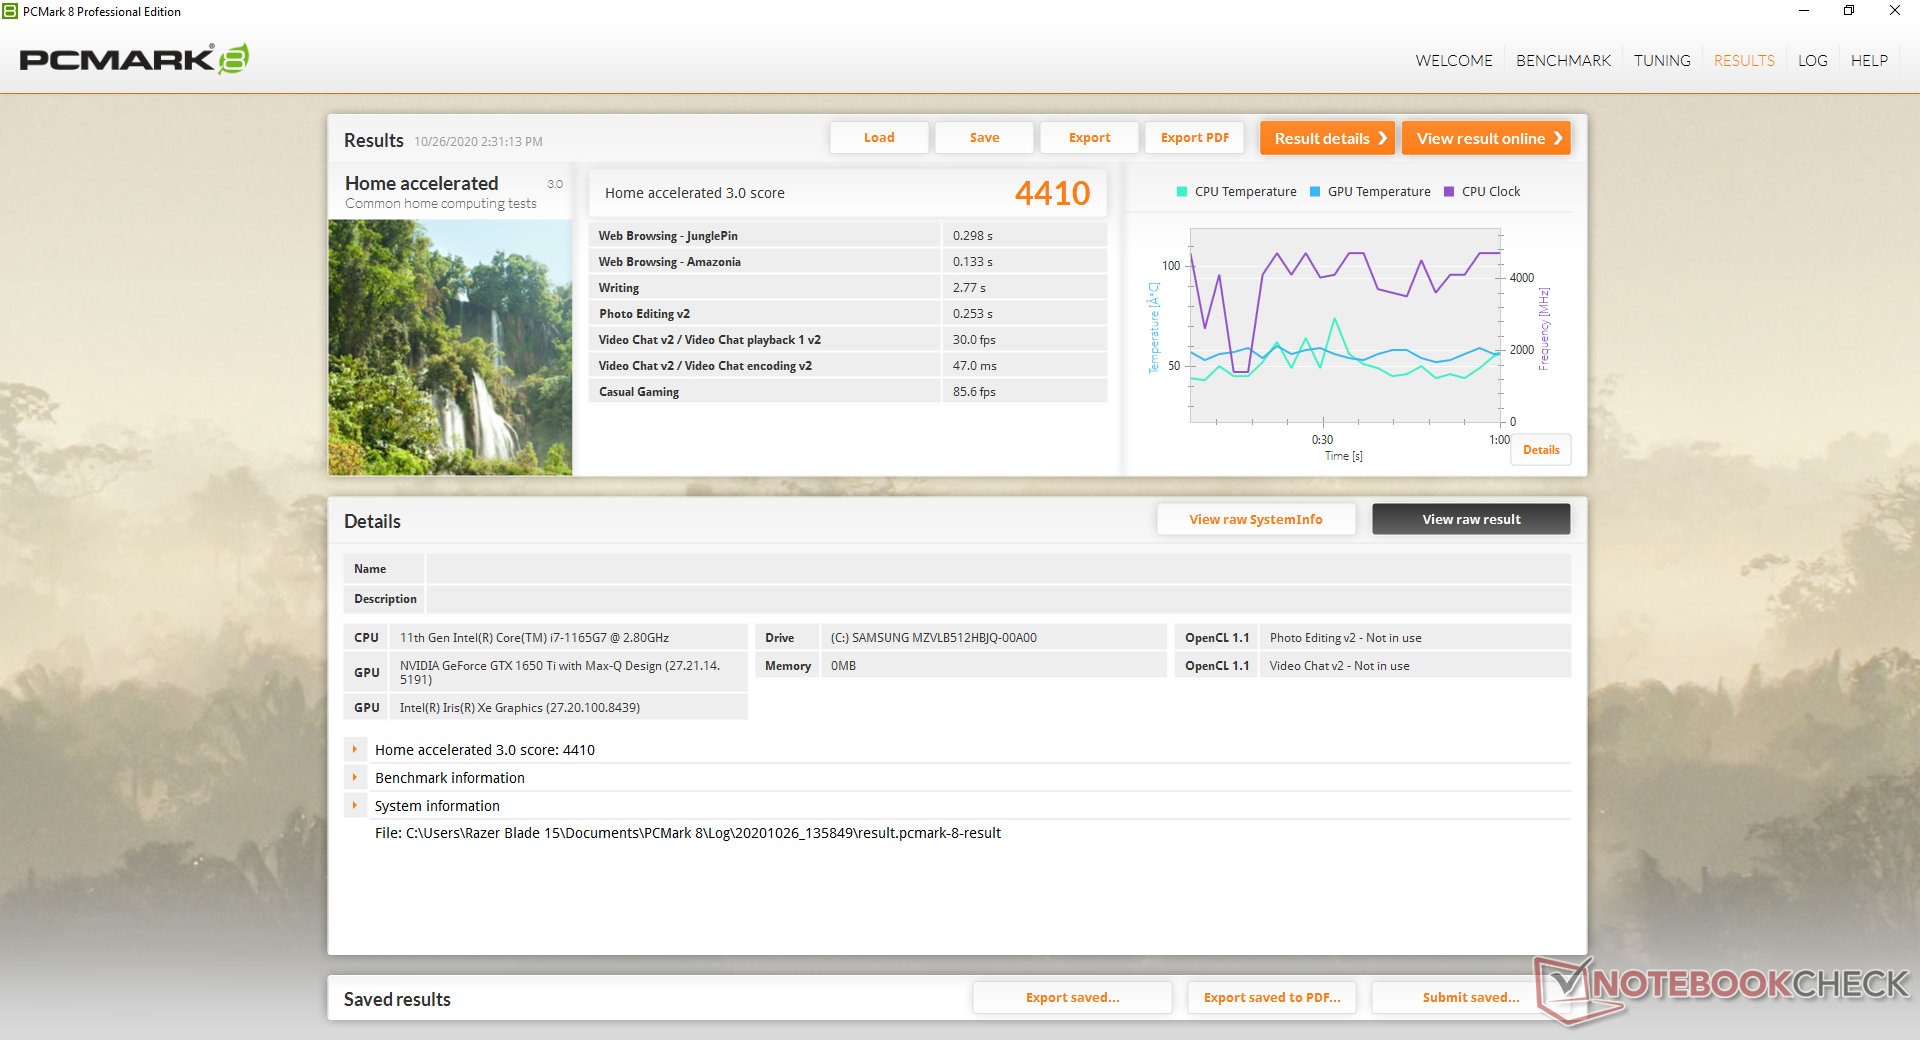
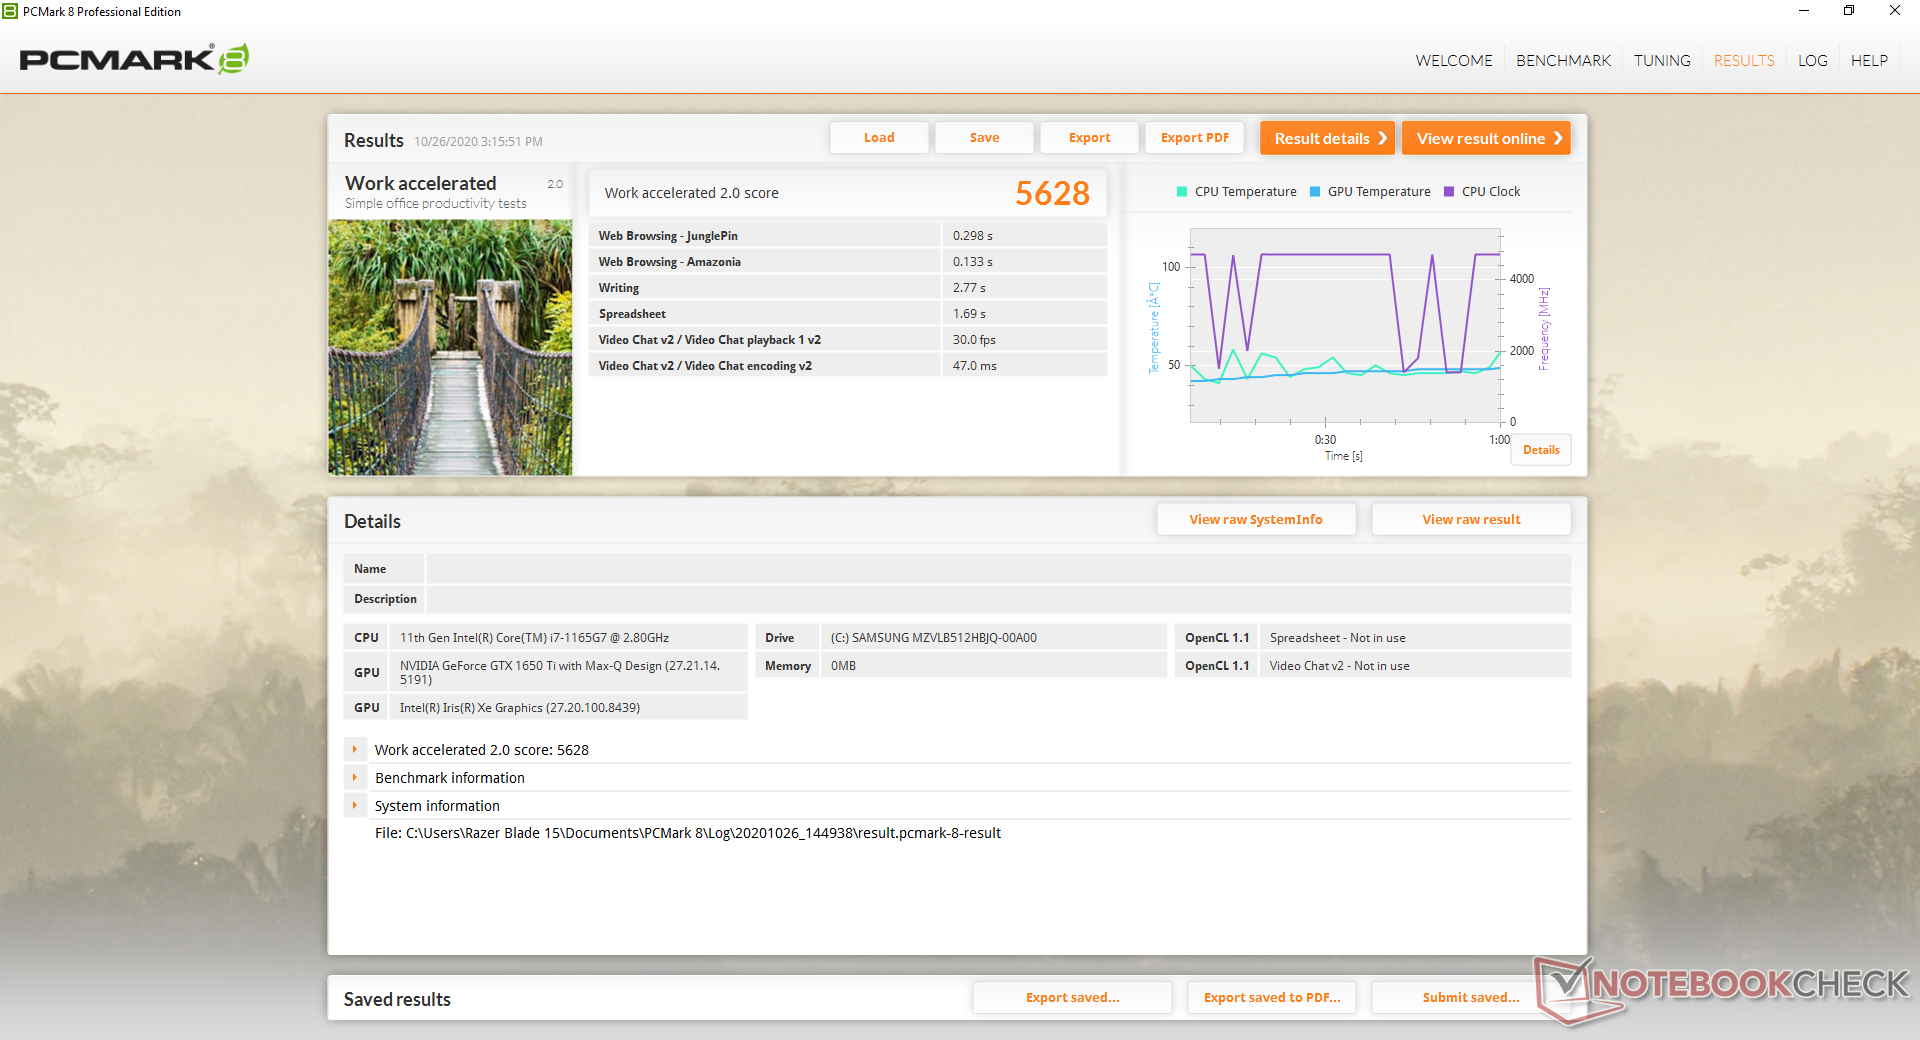
| PCMark 8 Home Score Accelerated v2 | 4410 points | |
| PCMark 8 Work Score Accelerated v2 | 5628 points | |
| PCMark 10 Score | 5549 points | |
Help | ||
DPC Latency
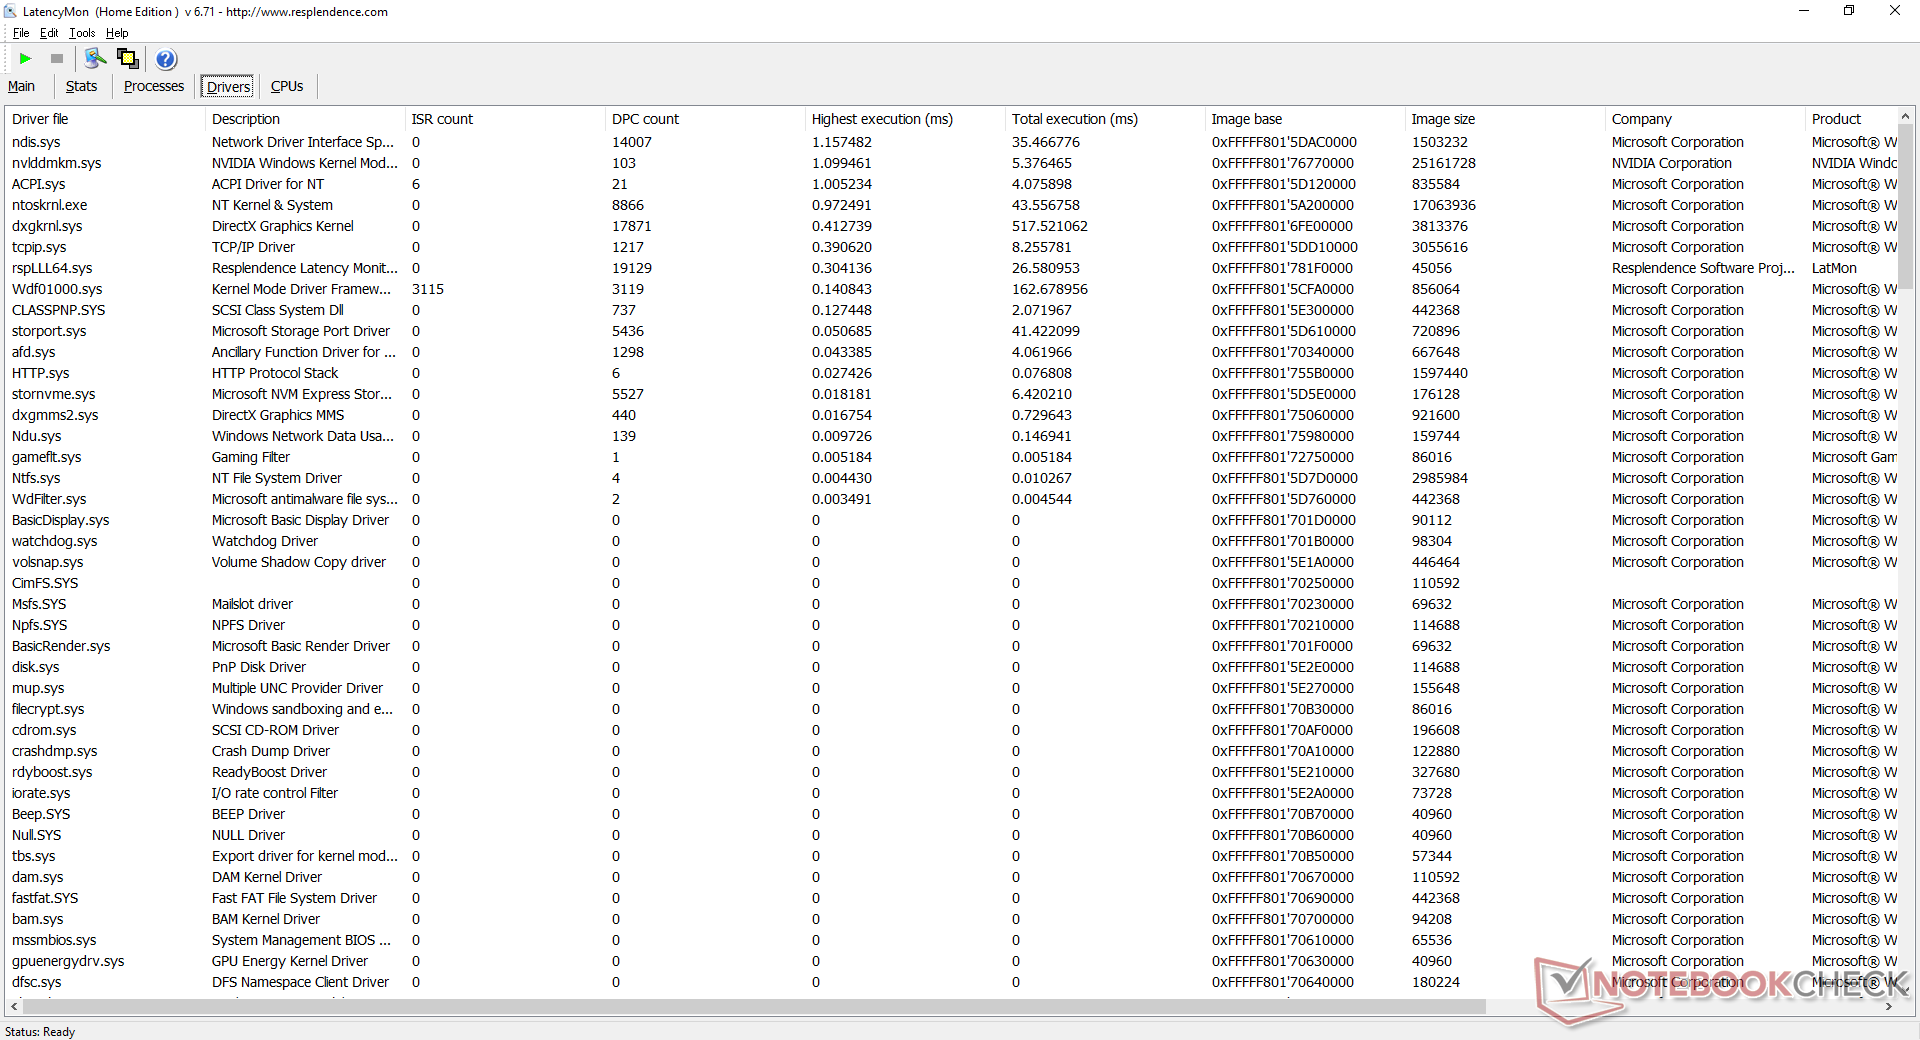
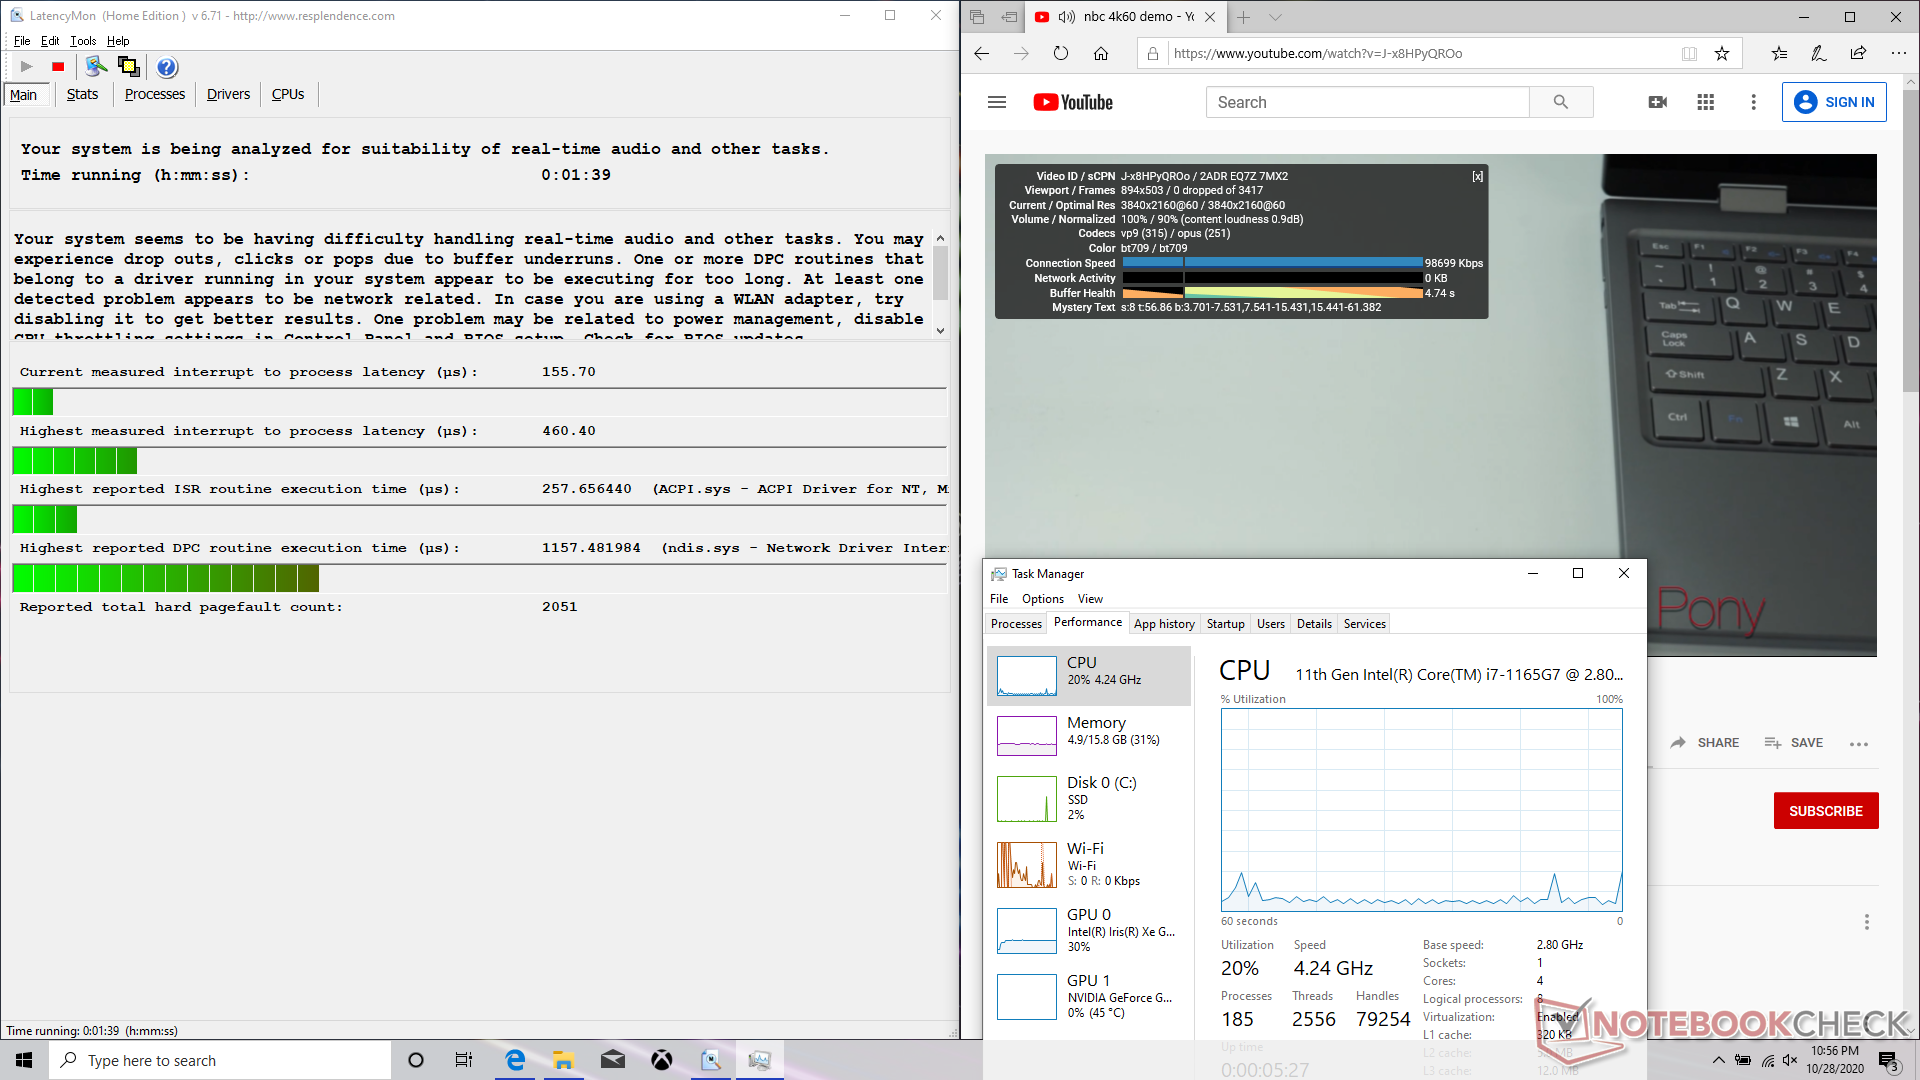
| DPC Latencies / LatencyMon - interrupt to process latency (max), Web, Youtube, Prime95 | |
| Razer Blade Stealth Core i7 GTX 1650 Ti Max-Q 4K | |
| Asus Zenbook S UX393JA | |
| Razer Blade Stealth i7-1165G7 GTX 1650 Ti Max-Q | |
| Dell XPS 13 9310 Core i7 FHD | |
| Lenovo Yoga Slim 7-14IIL05 | |
* ... smaller is better
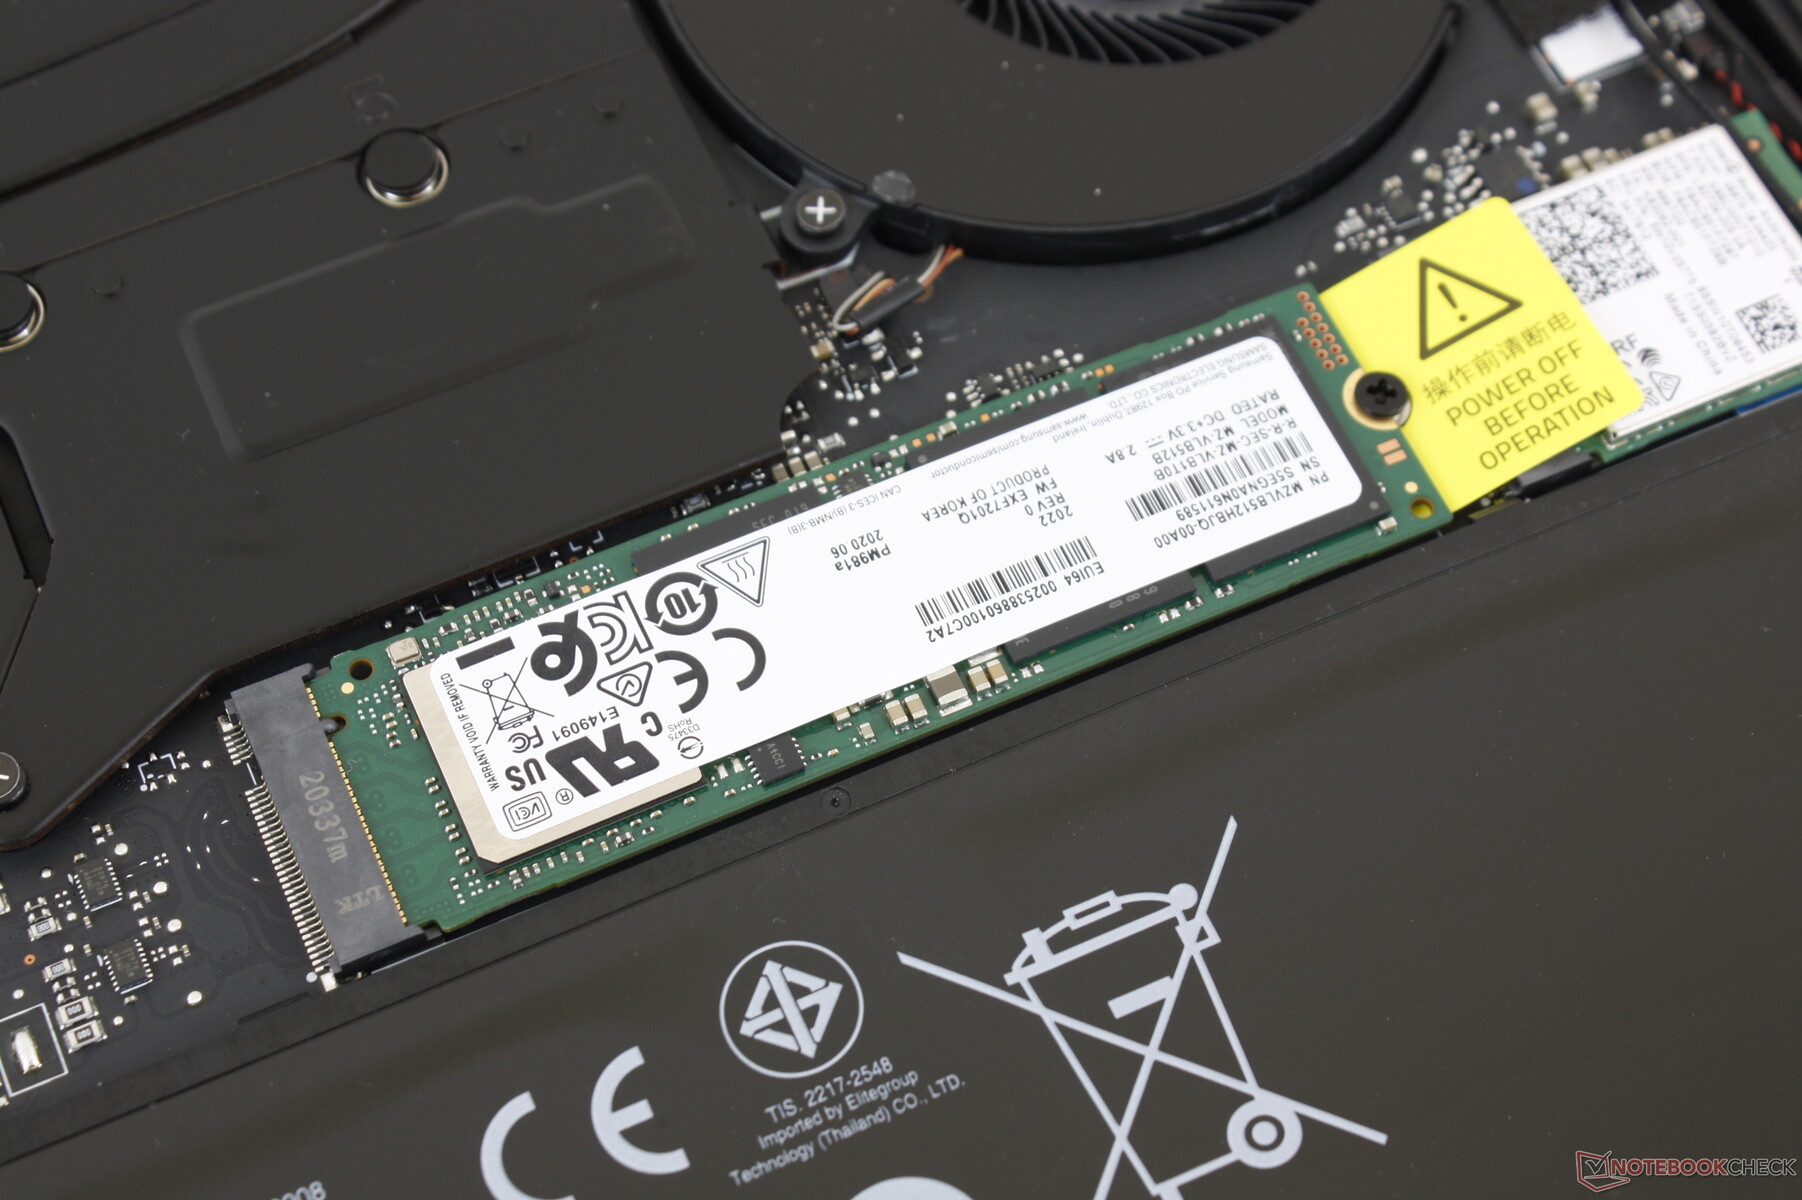
Storage Devices
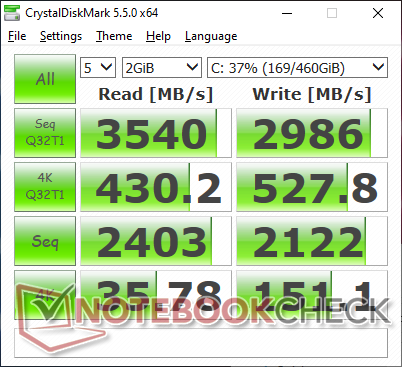
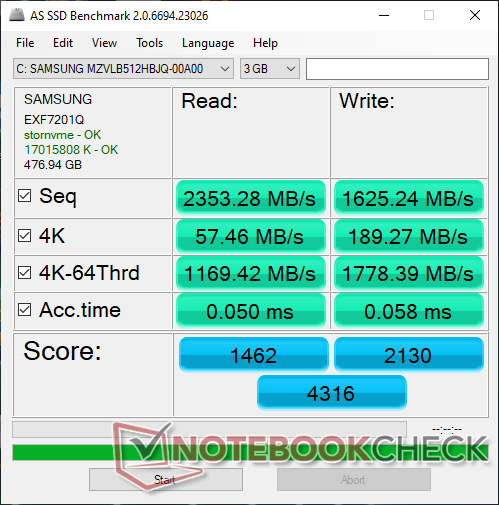
Most Razer laptops come with either Samsung or Lite-On NVMe SSDs. In our case, the unit shipped with a Samsung PM981a for sequential read and write rates approaching 3500 MB/s and 2900 MB/s, respectively. Other NVMe SSDs like the Intel 660p or Western Digital SN730 are typically cheaper and more common on gaming laptops, albeit with slower transfer rates.
See our table of SSDs and HDDs for more benchmark comparisons.
| Razer Blade Stealth i7-1165G7 GTX 1650 Ti Max-Q Samsung SSD PM981a MZVLB512HBJQ | Razer Blade Stealth Core i7 GTX 1650 Ti Max-Q 4K Lite-On CA5-8D512 | Dell XPS 13 9310 Core i7 FHD Micron 2300 512GB MTFDHBA512TDV | Asus Zenbook S UX393JA Intel SSD 660p 1TB SSDPEKNW010T8 | Lenovo Yoga Slim 7-14IIL05 WDC PC SN730 SDBPNTY-512G | |
|---|---|---|---|---|---|
| AS SSD | -29% | -56% | -36% | -17% | |
| Seq Read (MB/s) | 2353 | 2220 -6% | 2091 -11% | 1405 -40% | 2703 15% |
| Seq Write (MB/s) | 1625 | 2006 23% | 1396 -14% | 1062 -35% | 1104 -32% |
| 4K Read (MB/s) | 57.5 | 51.4 -11% | 49.29 -14% | 50.8 -12% | 46.41 -19% |
| 4K Write (MB/s) | 189.3 | 119.2 -37% | 104.2 -45% | 124.9 -34% | 154.1 -19% |
| 4K-64 Read (MB/s) | 1169 | 740 -37% | 827 -29% | 590 -50% | 835 -29% |
| 4K-64 Write (MB/s) | 1778 | 968 -46% | 1636 -8% | 840 -53% | 1138 -36% |
| Access Time Read * (ms) | 0.05 | 0.051 -2% | 0.066 -32% | 0.041 18% | 0.058 -16% |
| Access Time Write * (ms) | 0.058 | 0.1 -72% | 0.365 -529% | 0.118 -103% | 0.028 52% |
| Score Read (Points) | 1462 | 1013 -31% | 1086 -26% | 781 -47% | 1151 -21% |
| Score Write (Points) | 2130 | 1288 -40% | 1880 -12% | 1071 -50% | 1402 -34% |
| Score Total (Points) | 4316 | 2822 -35% | 3499 -19% | 2251 -48% | 3073 -29% |
| Copy ISO MB/s (MB/s) | 2073 | 1881 -9% | 1544 -26% | 1459 -30% | 1626 -22% |
| Copy Program MB/s (MB/s) | 673 | 441.8 -34% | 613 -9% | 600 -11% | 568 -16% |
| Copy Game MB/s (MB/s) | 1568 | 505 -68% | 1451 -7% | 1411 -10% | 1151 -27% |
| CrystalDiskMark 5.2 / 6 | 7% | -8% | -22% | -5% | |
| Write 4K (MB/s) | 151.1 | 158.7 5% | 97.5 -35% | 129.5 -14% | 137 -9% |
| Read 4K (MB/s) | 35.78 | 58.2 63% | 50.9 42% | 54 51% | 48.71 36% |
| Write Seq (MB/s) | 2122 | 2219 5% | 1811 -15% | 1265 -40% | 1785 -16% |
| Read Seq (MB/s) | 2403 | 2444 2% | 1836 -24% | 1410 -41% | 2057 -14% |
| Write 4K Q32T1 (MB/s) | 528 | 475.9 -10% | 521 -1% | 420.3 -20% | 436.9 -17% |
| Read 4K Q32T1 (MB/s) | 430.2 | 509 18% | 357.5 -17% | 357.7 -17% | 389 -10% |
| Write Seq Q32T1 (MB/s) | 2986 | 2202 -26% | 2879 -4% | 1799 -40% | 2708 -9% |
| Read Seq Q32T1 (MB/s) | 3540 | 3372 -5% | 3204 -9% | 1616 -54% | 3426 -3% |
| Total Average (Program / Settings) | -11% /
-16% | -32% /
-38% | -29% /
-31% | -11% /
-13% |
* ... smaller is better

Disk Throttling: DiskSpd Read Loop, Queue Depth 8
GPU Performance
3DMark GPU results are only about 6 to 8 percent higher than the Ice Lake model since the GeForce GTX 1650 Ti Max-Q GPU remains identical. The slightly faster performance may be attributed to the slightly faster RAM clock rates. Real-world gaming performance is mostly unchanged as a result or have slightly higher frame rates at best. Nonetheless, performance is still at least two to three times better than the GeForce MX250/350 as found many subnotebooks.
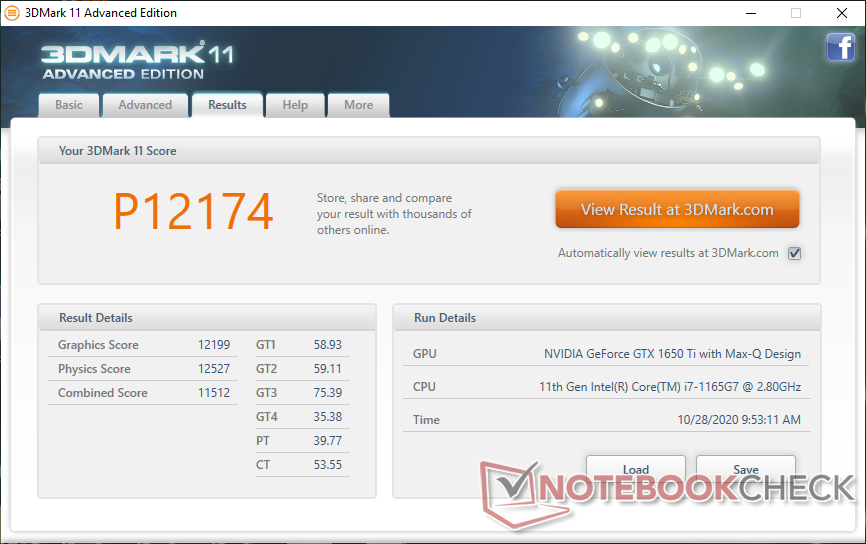
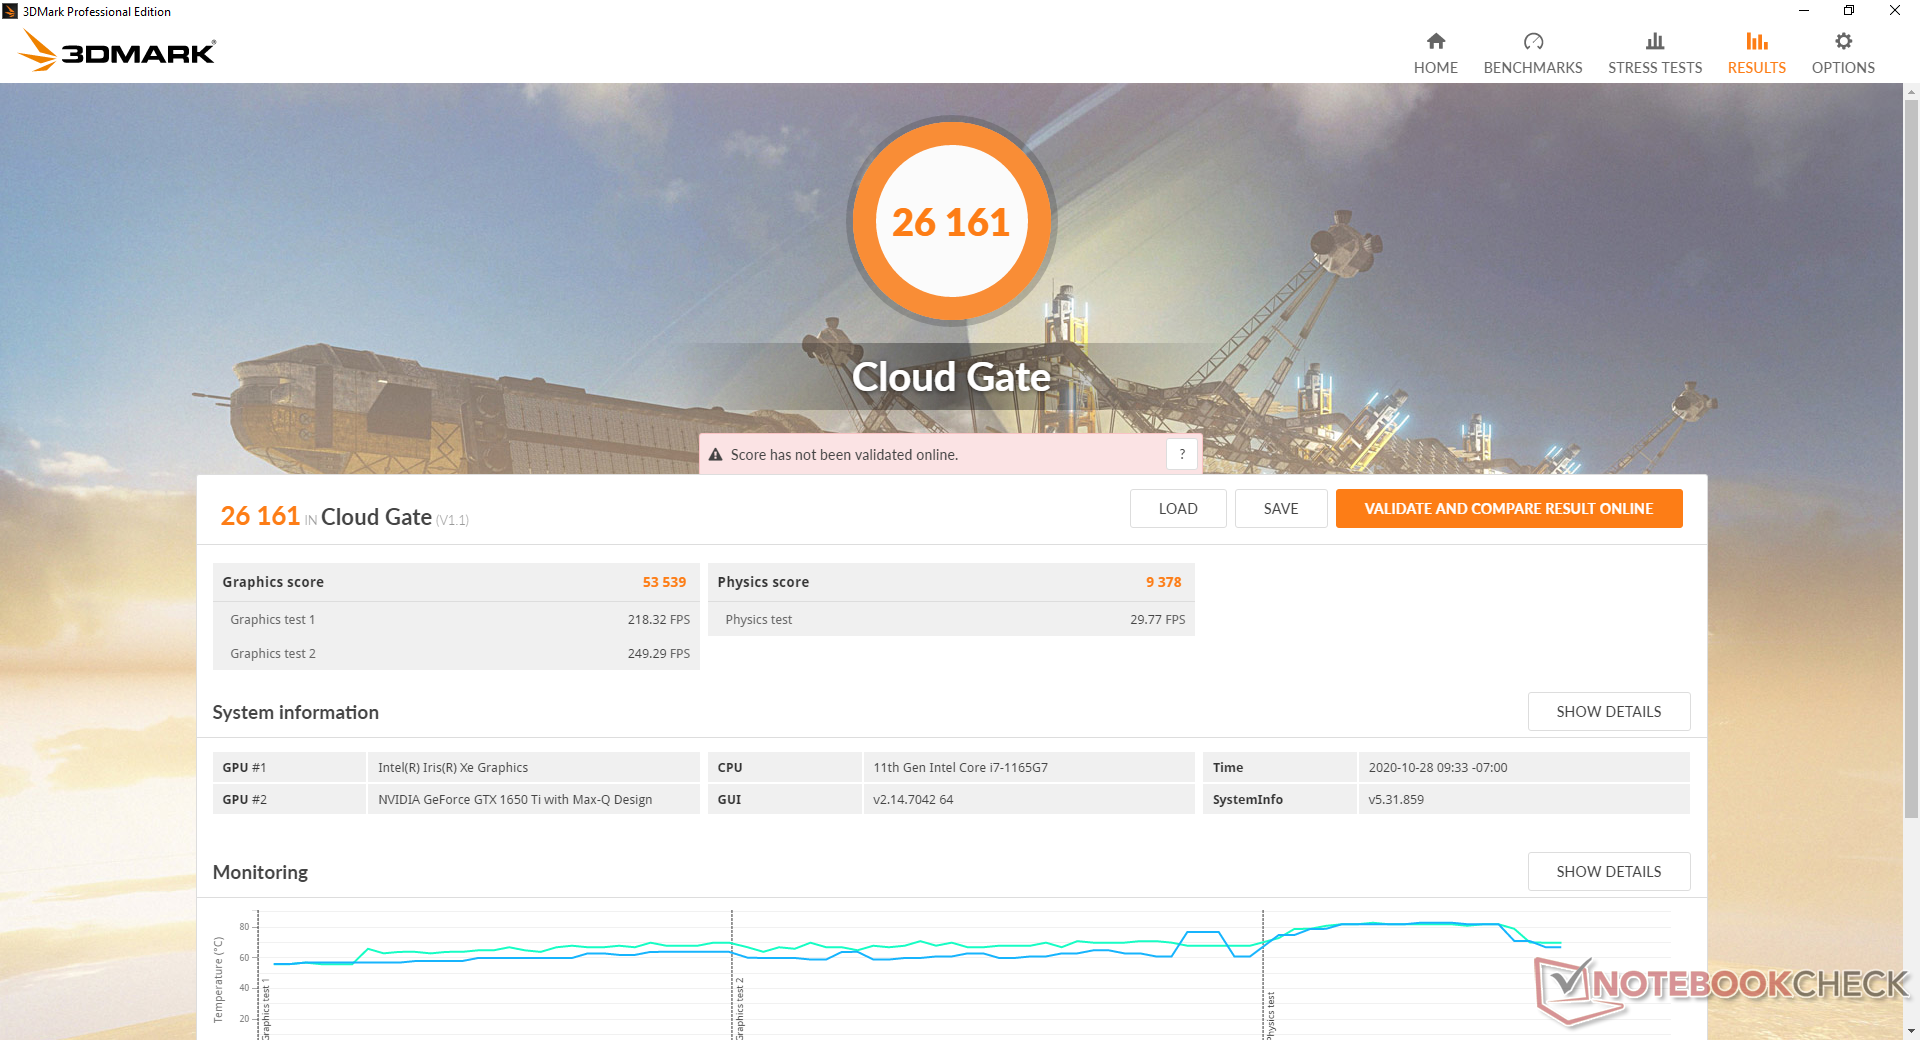
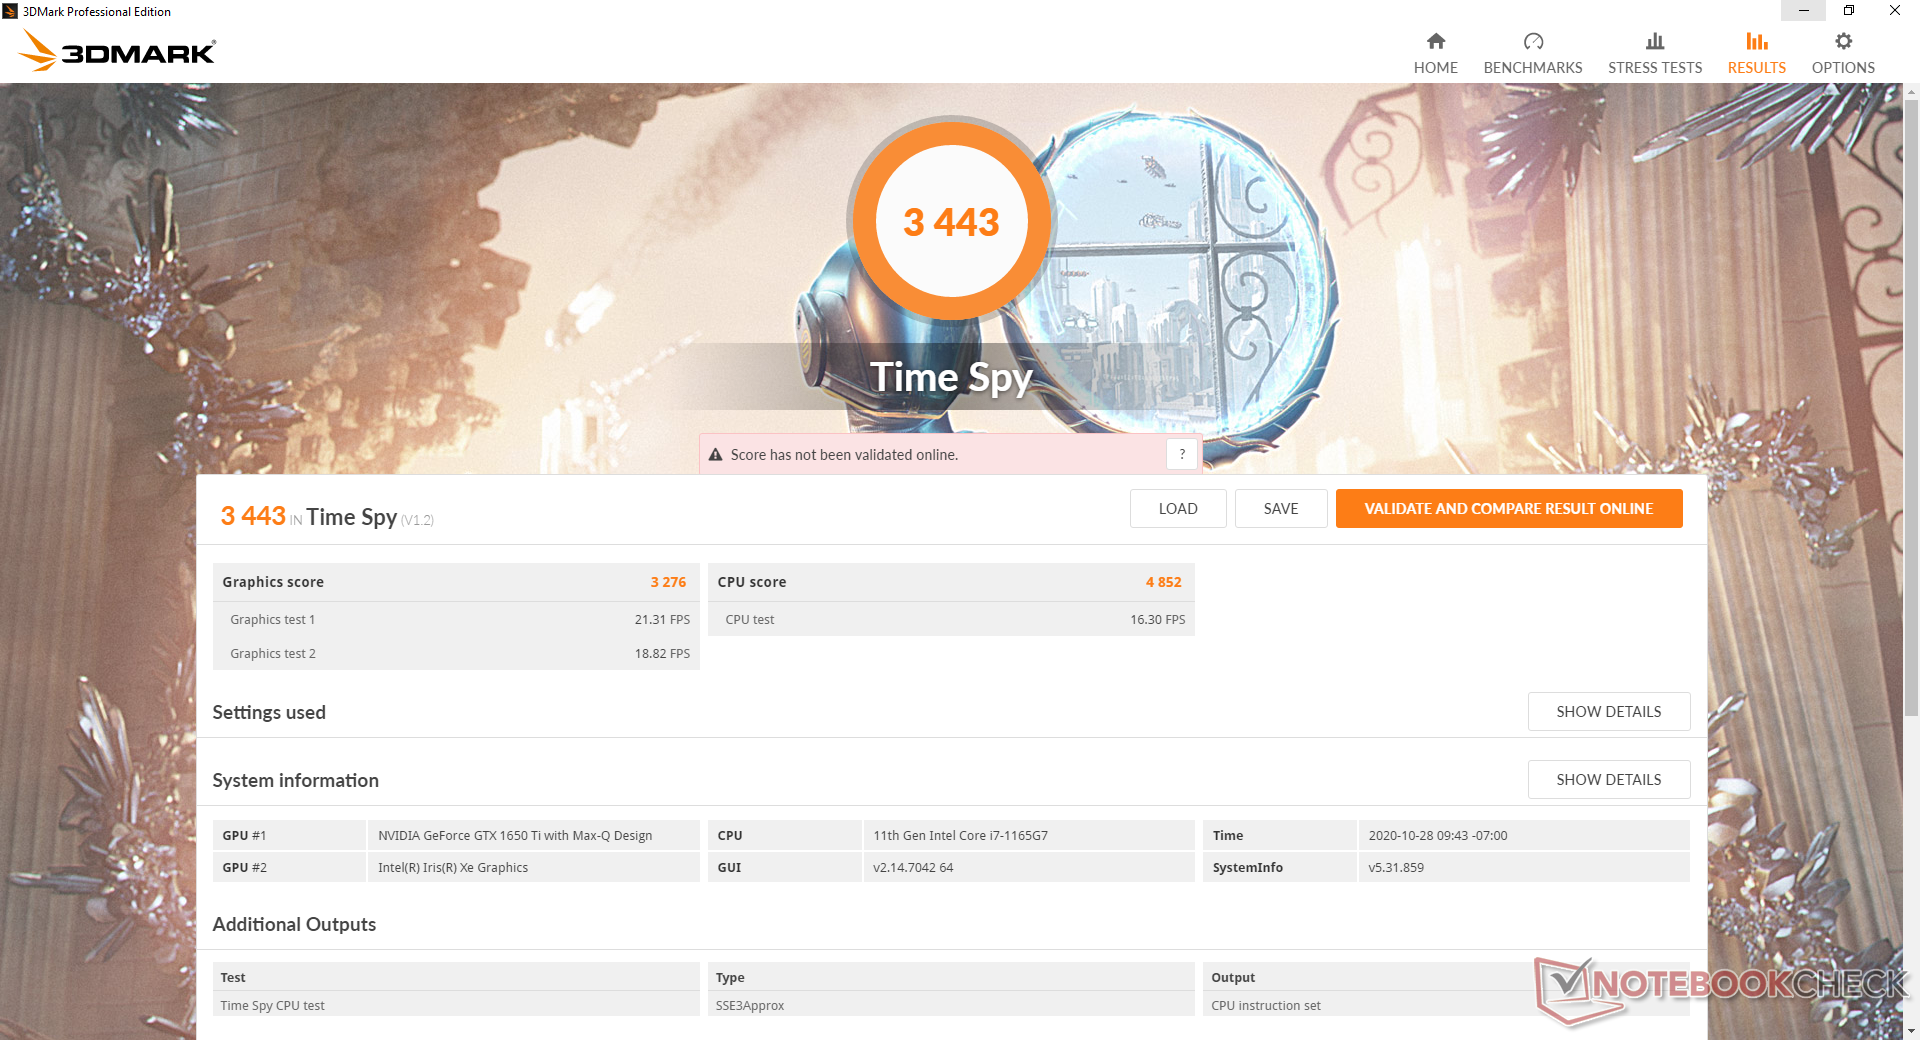
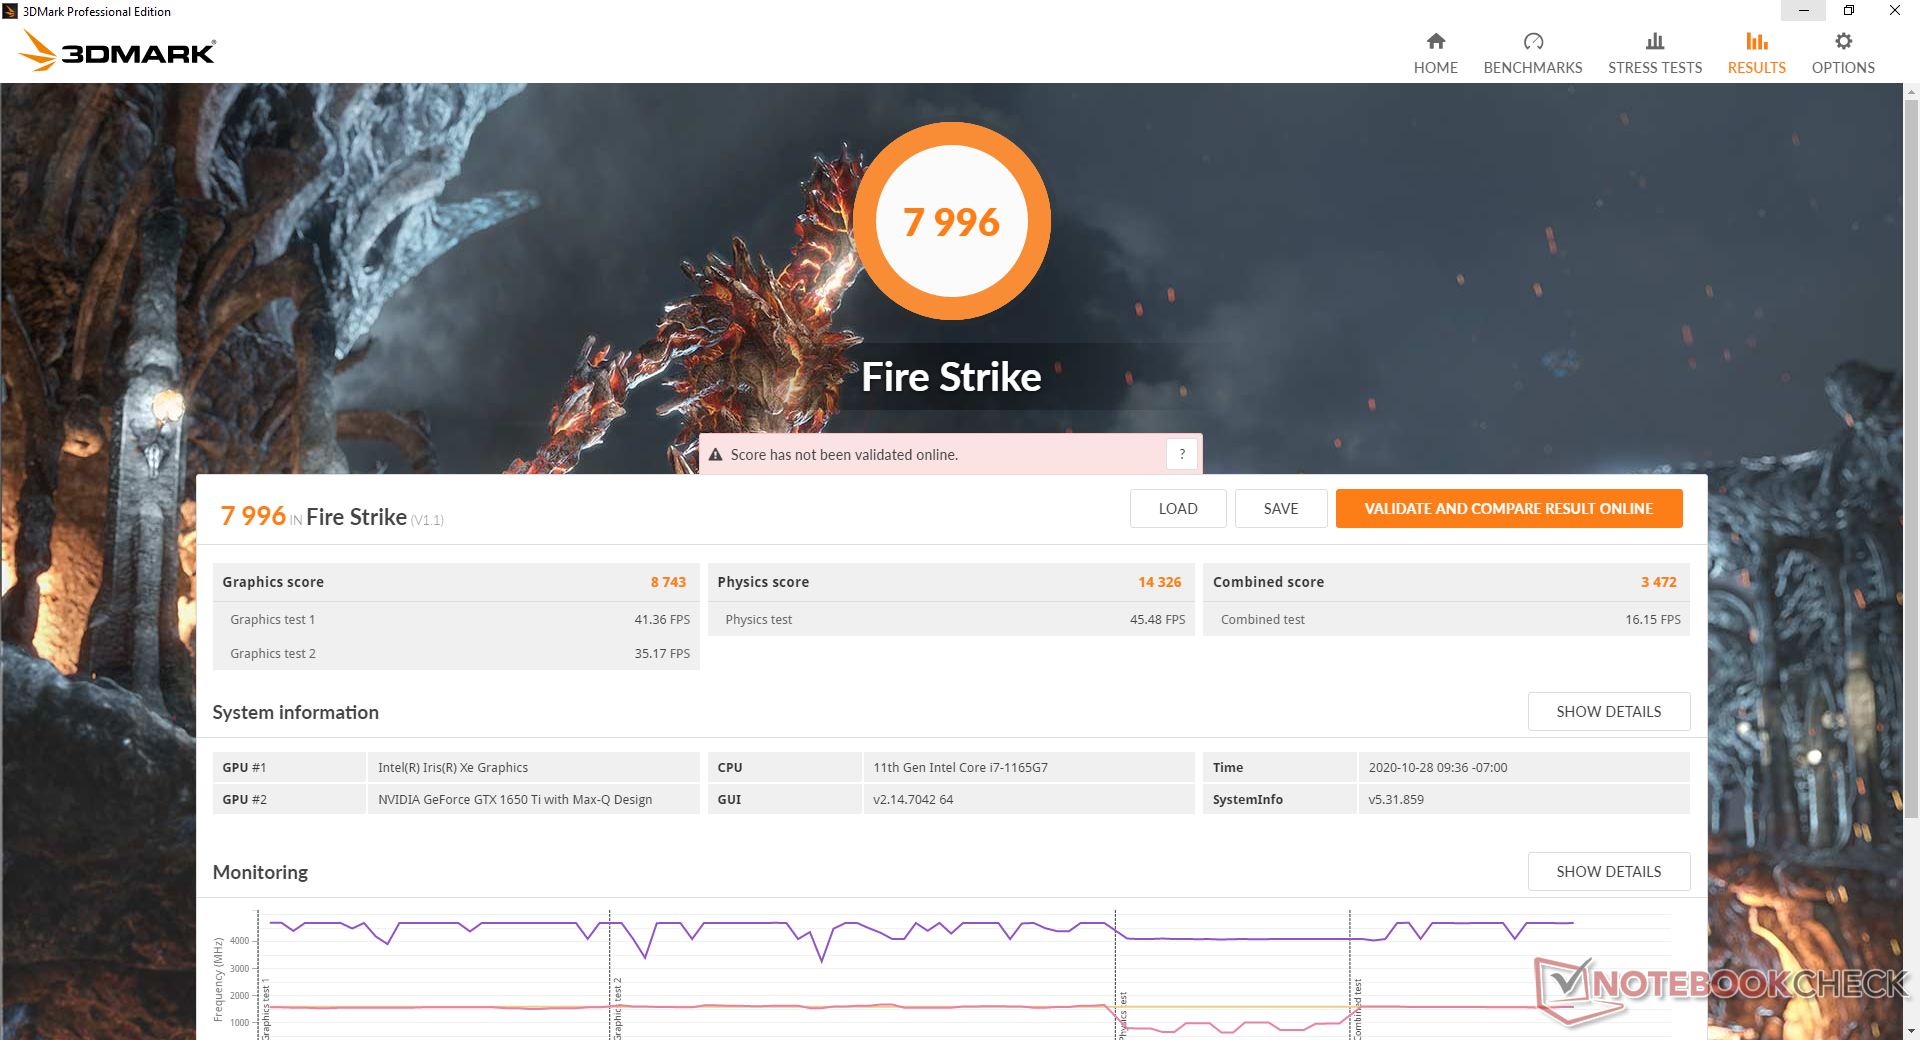
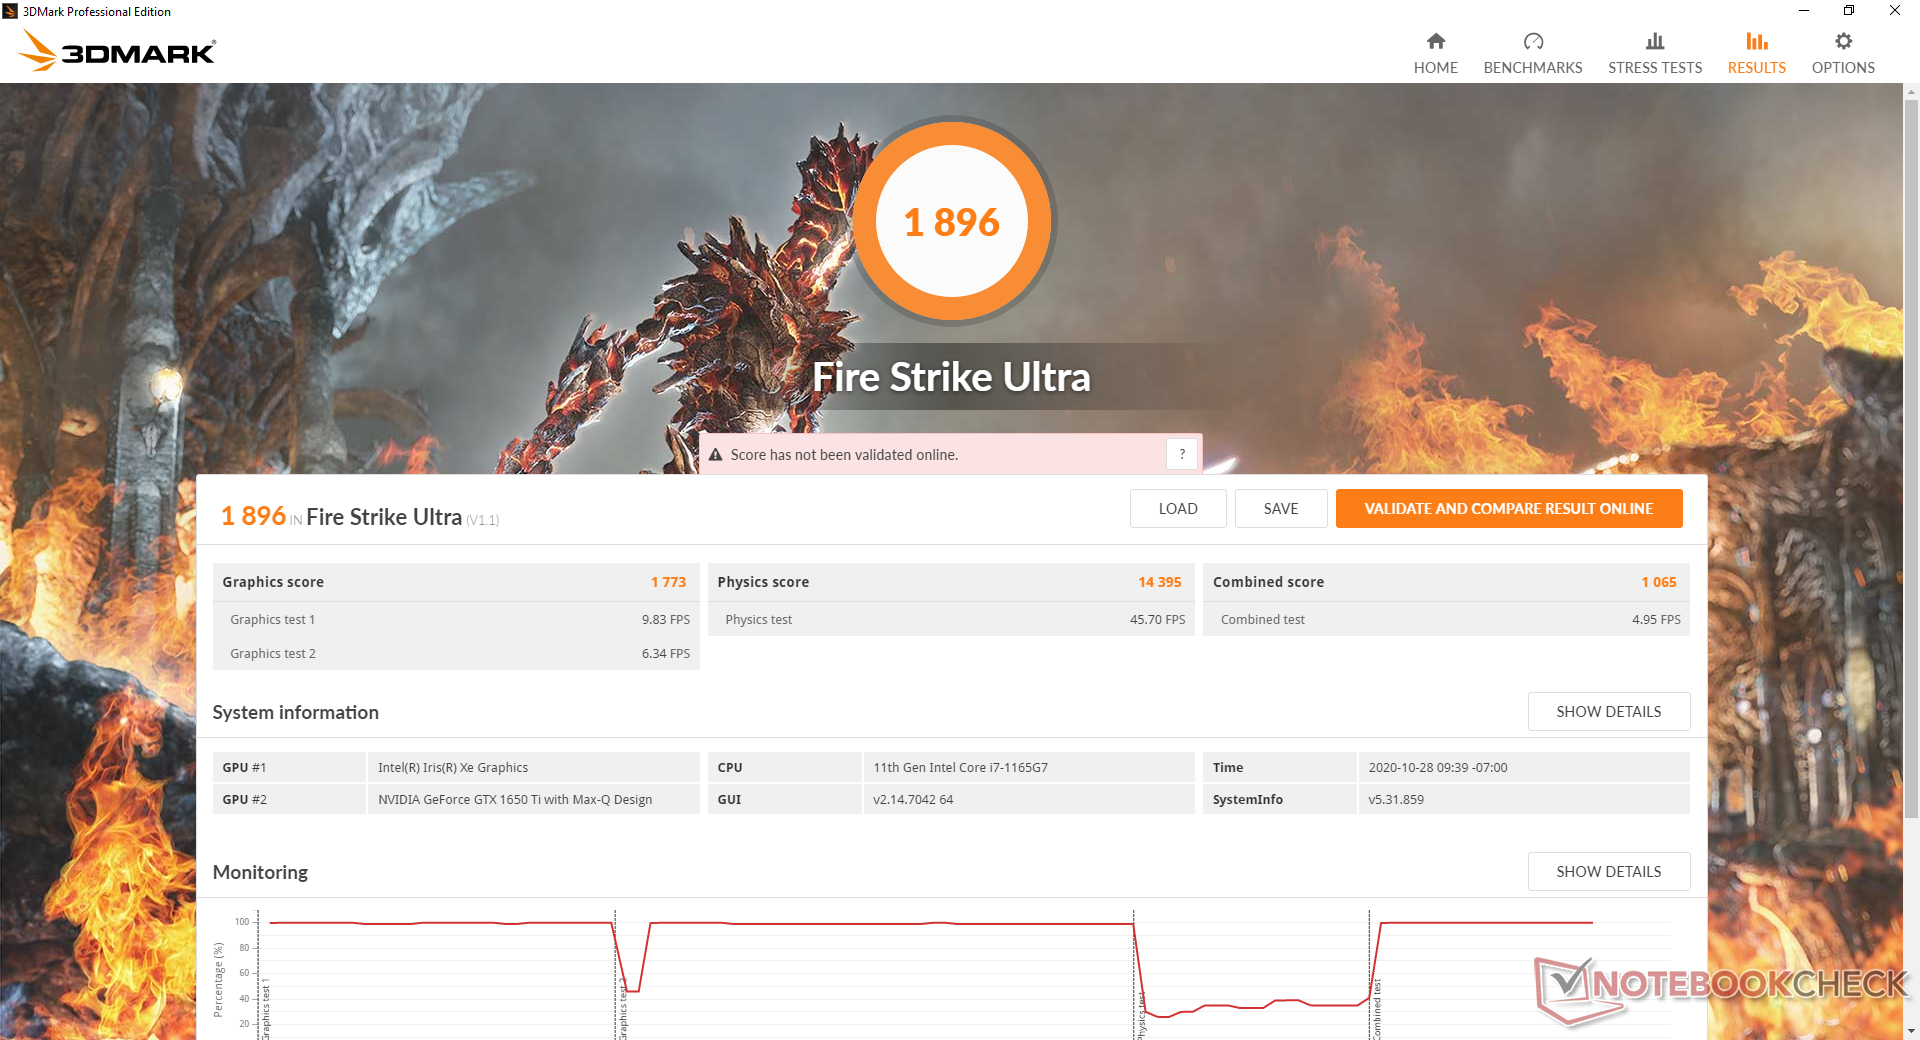
| 3DMark 11 Performance | 12174 points | |
| 3DMark Cloud Gate Standard Score | 26161 points | |
| 3DMark Fire Strike Score | 7996 points | |
| 3DMark Time Spy Score | 3443 points | |
Help | ||
| low | med. | high | ultra | |
|---|---|---|---|---|
| GTA V (2015) | 171 | 164 | 91.5 | 45.4 |
| The Witcher 3 (2015) | 153 | 87.3 | 52.8 | 30.1 |
| Dota 2 Reborn (2015) | 147 | 129 | 121 | 110 |
| Final Fantasy XV Benchmark (2018) | 94 | 48.1 | 33.9 | |
| X-Plane 11.11 (2018) | 96.4 | 87.5 | 72.3 | |
| Strange Brigade (2018) | 196 | 81.5 | 65.6 | 55.2 |
| Total War: Three Kingdoms (2019) | 164.3 | 57.5 | 36 | 18.6 |
Emissions
System Noise
Fan behavior hasn't really changed from the Ice Lake version. Gaming will still induce a fan noise in the 38 dB(A) to 48 dB(A) range depending on frame rate and load. Running 3DMark 06, for example, can cause fan noise to be louder than running Witcher 3 on Ultra settings since the former can be more CPU intensive. In either case, the system will be louder than most other subnotebooks which usually top out at around 40 dB(A) when running such demanding loads.
Fortunately, the Blade Stealth is a quiet system when browsing the web or running other basic workloads where the processors aren't stressed. Fan noise may pulse slightly, but never abruptly to be bothersome.
| Razer Blade Stealth i7-1165G7 GTX 1650 Ti Max-Q GeForce GTX 1650 Ti Max-Q, i7-1165G7, Samsung SSD PM981a MZVLB512HBJQ | Razer Blade Stealth Core i7 GTX 1650 Ti Max-Q 4K GeForce GTX 1650 Ti Max-Q, i7-1065G7, Lite-On CA5-8D512 | Dell XPS 13 9310 Core i7 FHD Iris Xe G7 96EUs, i7-1165G7, Micron 2300 512GB MTFDHBA512TDV | Huawei MateBook X Pro 2020 i7 GeForce MX250, i7-10510U, Samsung PM981a MZVLB1T0HBLR | Lenovo Yoga Slim 7-14IIL05 GeForce MX350, i7-1065G7, WDC PC SN730 SDBPNTY-512G | |
|---|---|---|---|---|---|
| Noise | -3% | 10% | -3% | -7% | |
| off / environment * (dB) | 25.3 | 28 -11% | 25.7 -2% | 29.6 -17% | 29.3 -16% |
| Idle Minimum * (dB) | 25.3 | 28 -11% | 25.7 -2% | 29.6 -17% | 29.3 -16% |
| Idle Average * (dB) | 25.3 | 28 -11% | 25.7 -2% | 29.6 -17% | 29.3 -16% |
| Idle Maximum * (dB) | 27 | 28 -4% | 25.9 4% | 30.3 -12% | 30.5 -13% |
| Load Average * (dB) | 47.9 | 39 19% | 26.2 45% | 38 21% | 41.5 13% |
| Witcher 3 ultra * (dB) | 38.4 | 42.7 -11% | 36.5 5% | 38 1% | 41.5 -8% |
| Load Maximum * (dB) | 45.9 | 43.7 5% | 36.6 20% | 38 17% | 41.5 10% |
* ... smaller is better
Noise level
| Idle |
| 25.3 / 25.3 / 27 dB(A) |
| Load |
| 47.9 / 45.9 dB(A) |
 | ||
30 dB silent 40 dB(A) audible 50 dB(A) loud |
||
min: | ||
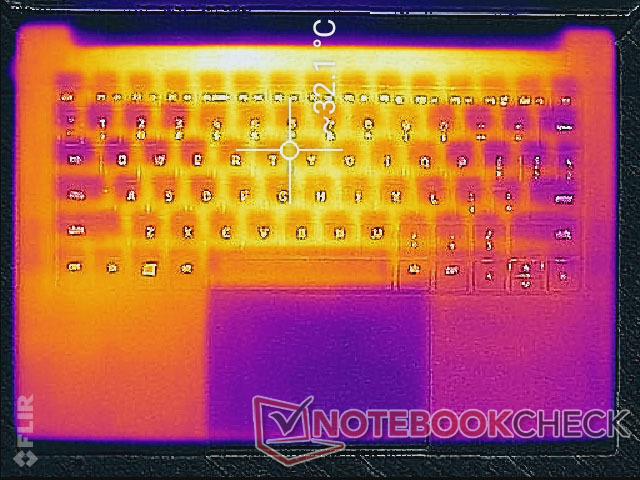
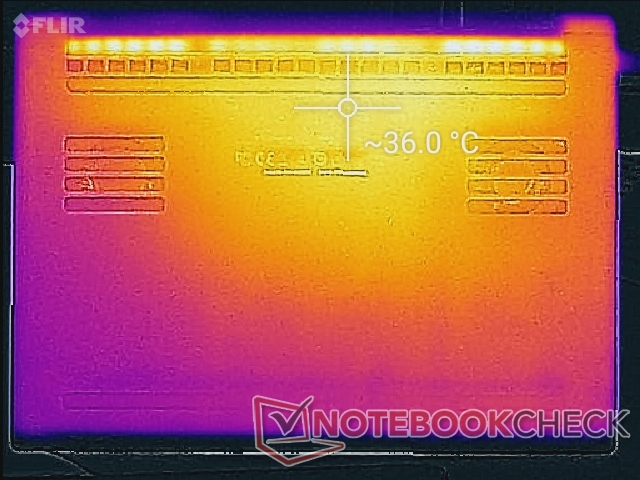
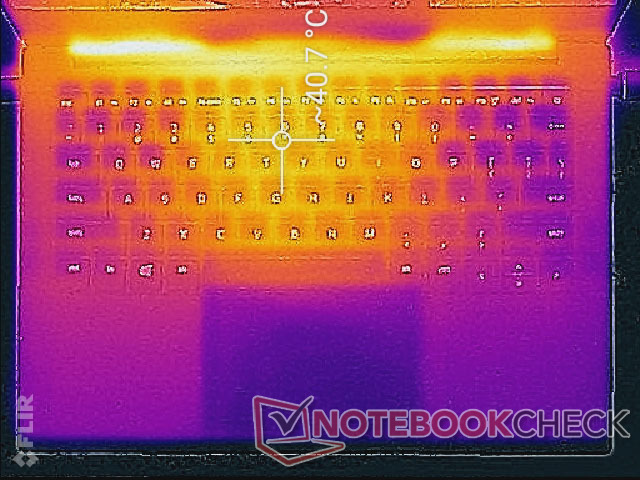
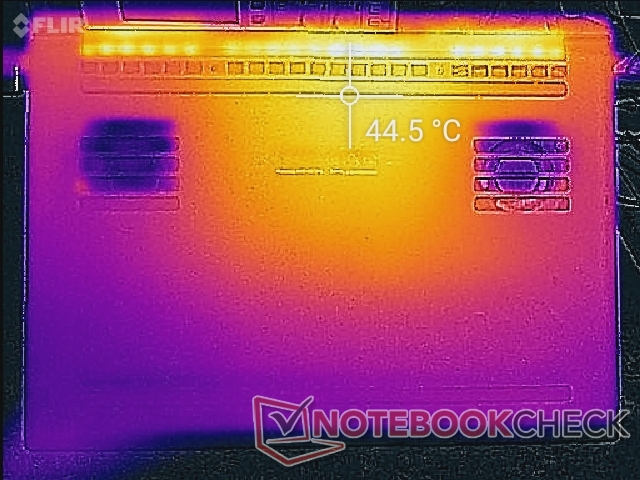
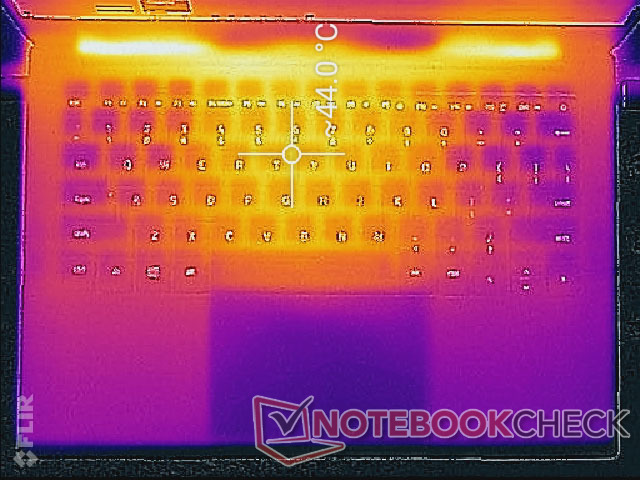
Temperature
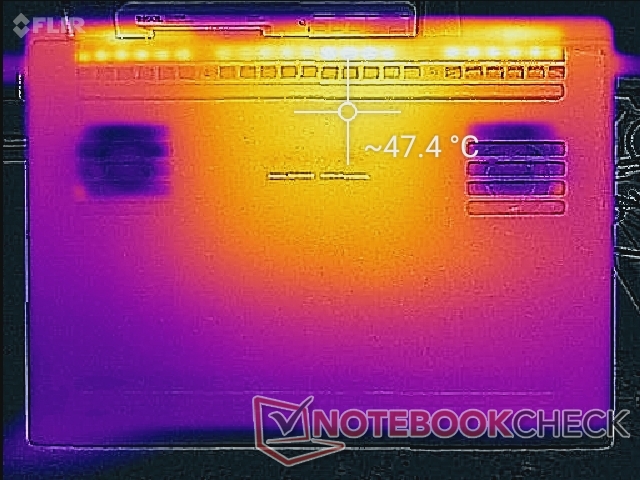
Surface temperatures are a few degrees C cooler than what we recorded on the older Ice Lake GeForce configuration when gaming. However, differences in room temperature during testing could be responsible for the delta as well. The temperature profile continues to be symmetrical and with warmer palm rests than many other gaming laptops due to the tighter unibody metal design. Expect some sweaty palms after long gaming sessions.
(±) The maximum temperature on the upper side is 44 °C / 111 F, compared to the average of 35.9 °C / 97 F, ranging from 21.4 to 59 °C for the class Subnotebook.
(-) The bottom heats up to a maximum of 47.4 °C / 117 F, compared to the average of 39.2 °C / 103 F
(+) In idle usage, the average temperature for the upper side is 30.2 °C / 86 F, compared to the device average of 30.8 °C / 87 F.
(±) Playing The Witcher 3, the average temperature for the upper side is 32.4 °C / 90 F, compared to the device average of 30.8 °C / 87 F.
(+) The palmrests and touchpad are reaching skin temperature as a maximum (33 °C / 91.4 F) and are therefore not hot.
(-) The average temperature of the palmrest area of similar devices was 28.2 °C / 82.8 F (-4.8 °C / -8.6 F).
Stress Test
When running Prime95, CPU clock rates would boost to 3.7 GHz for the first few seconds until hitting a core temperature of 82 C. Clock rates would then drop and stabilize at 3.0 to 3.1 GHz and a more manageable core temperature of 67 C. Running this same test on the Ice Lake Blade Stealth would result in both lower clock rates and higher core temperatures of 2.6 GHz and 70 C, respectively.
When running Witcher 3, the CPU and GPU would each stabilize at about 65 C compared to 75 C on the GeForce MX250-powered Asus ZenBook 14. Not only is Razer's system faster, but it even runs cooler than some 14-inch laptops with discrete GeForce MX GPUs.
Running on battery power will limit performance. A 3DMark 11 test on batteries would return Physics and Graphics scores of 6055 and 11036 points, respectively, compared to 12527 and 12199 points when on mains. The Razer Gaming power profile is automatically disabled if on battery power.
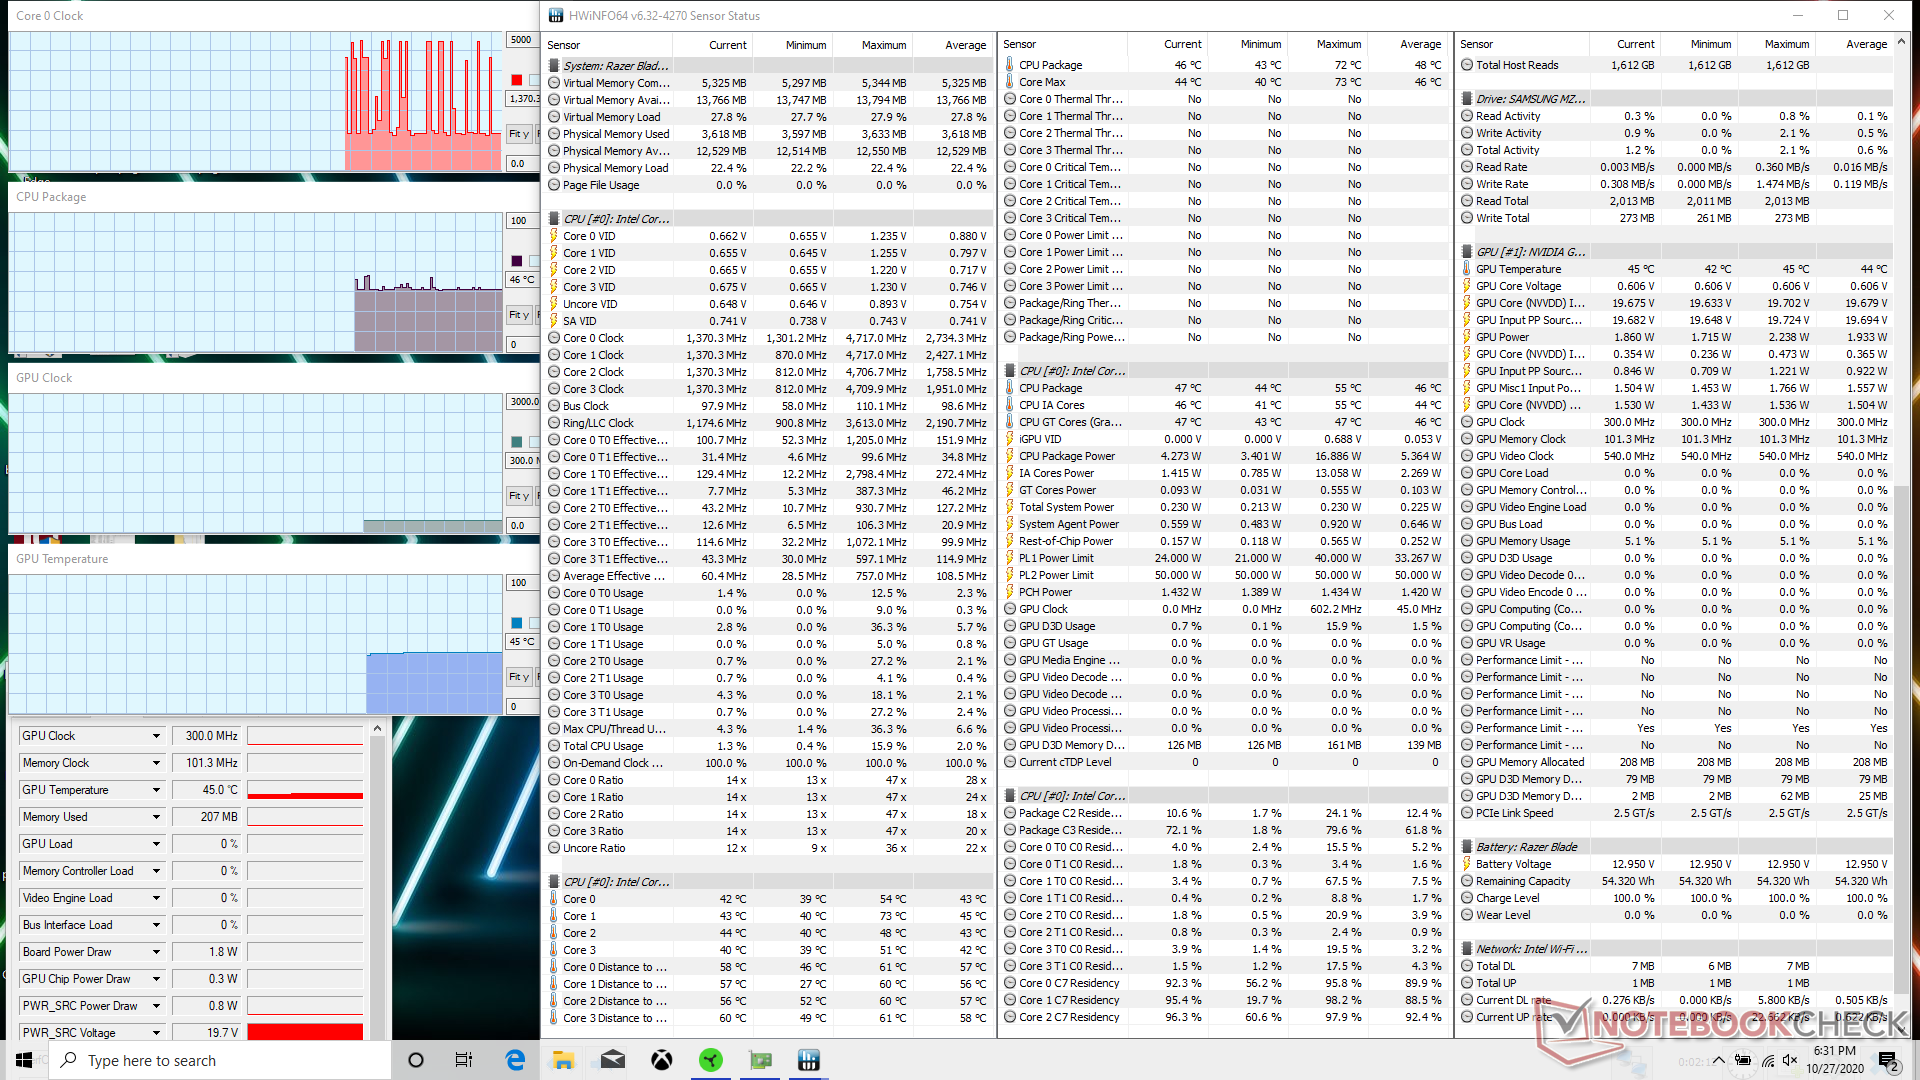
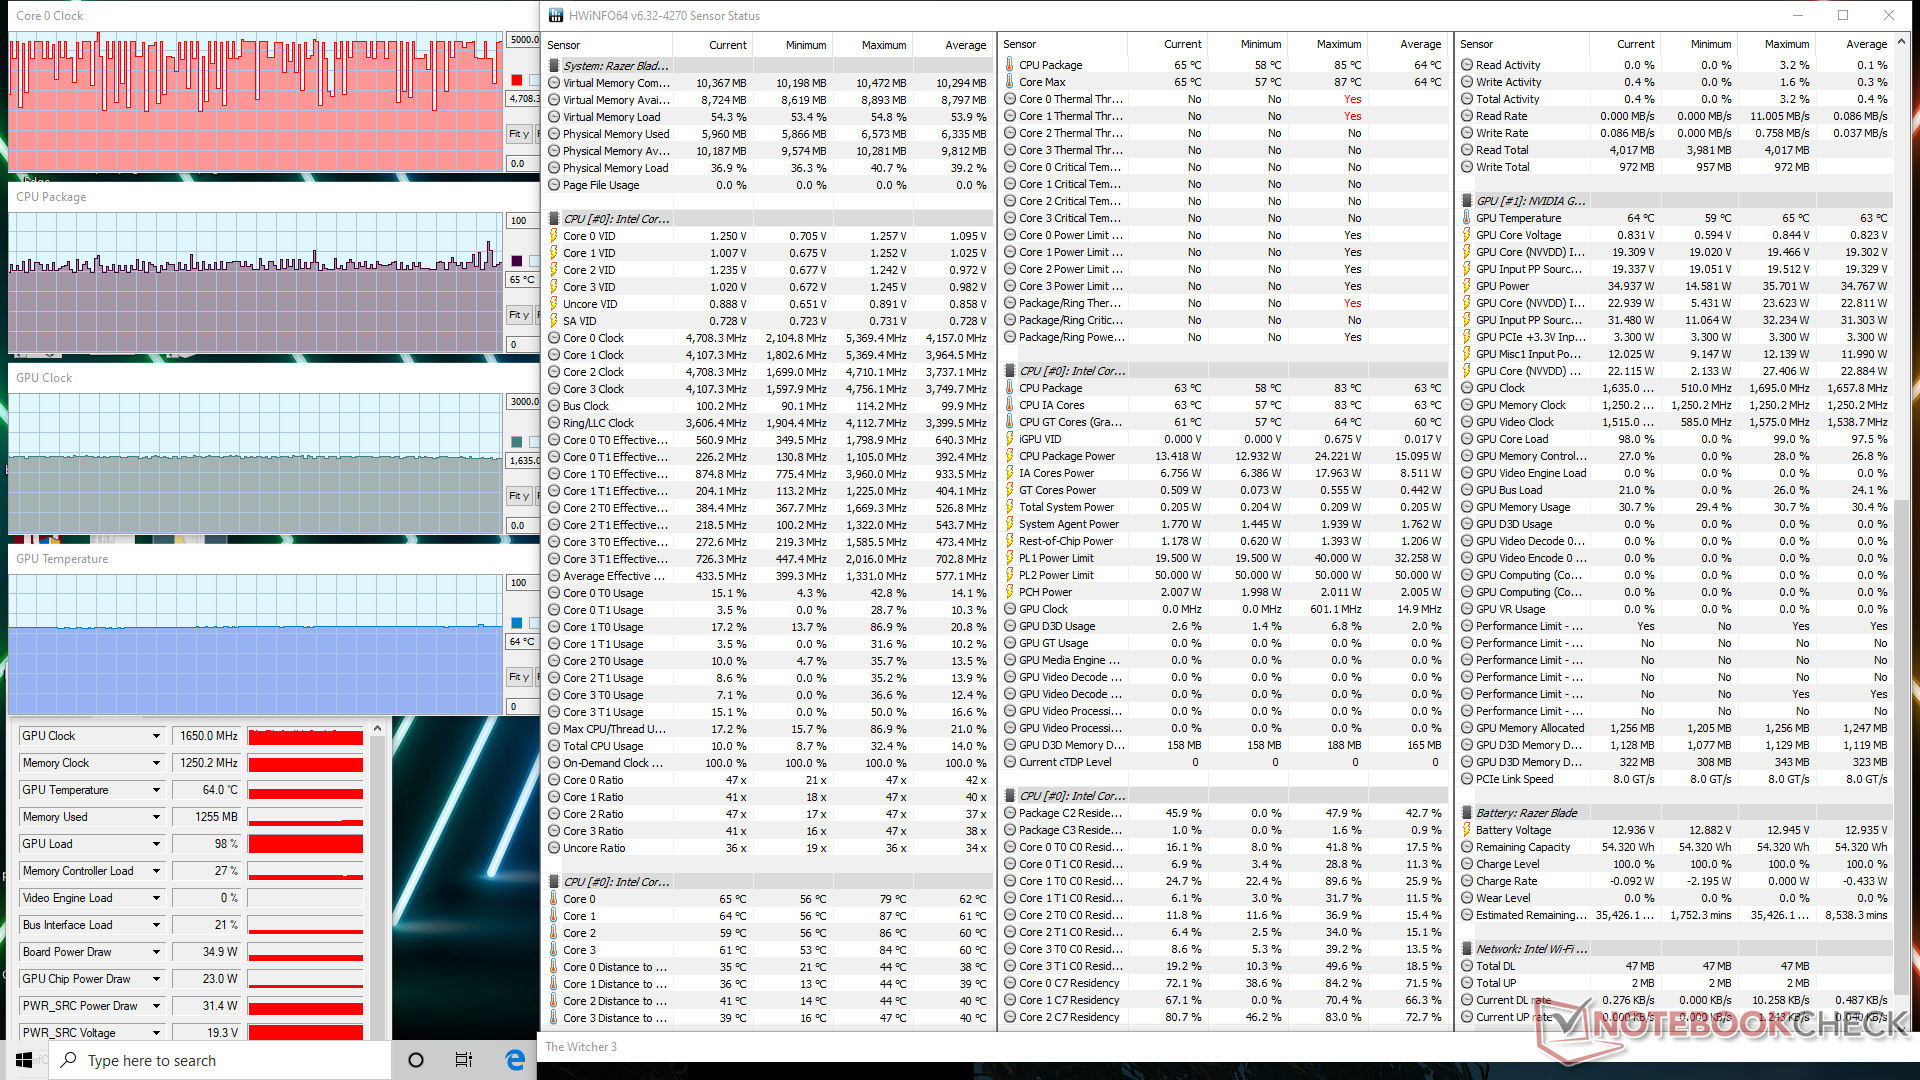
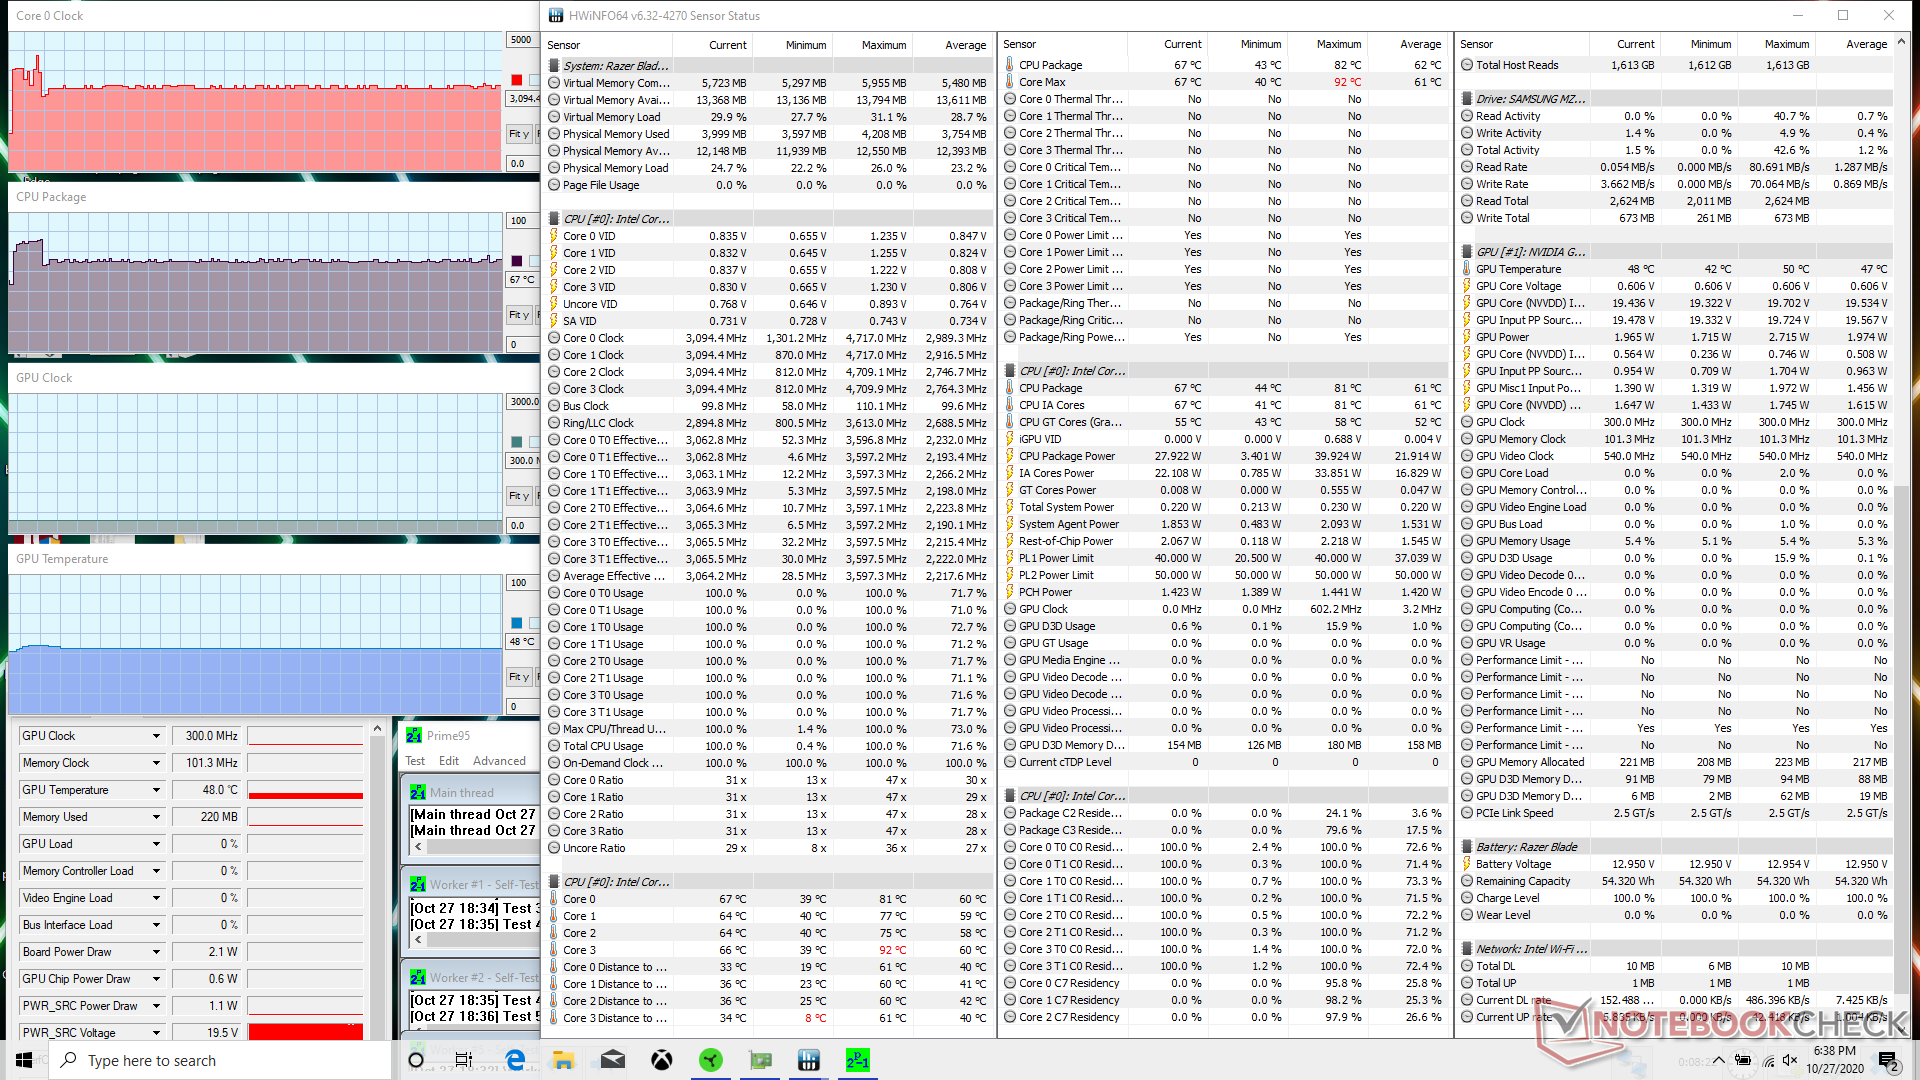
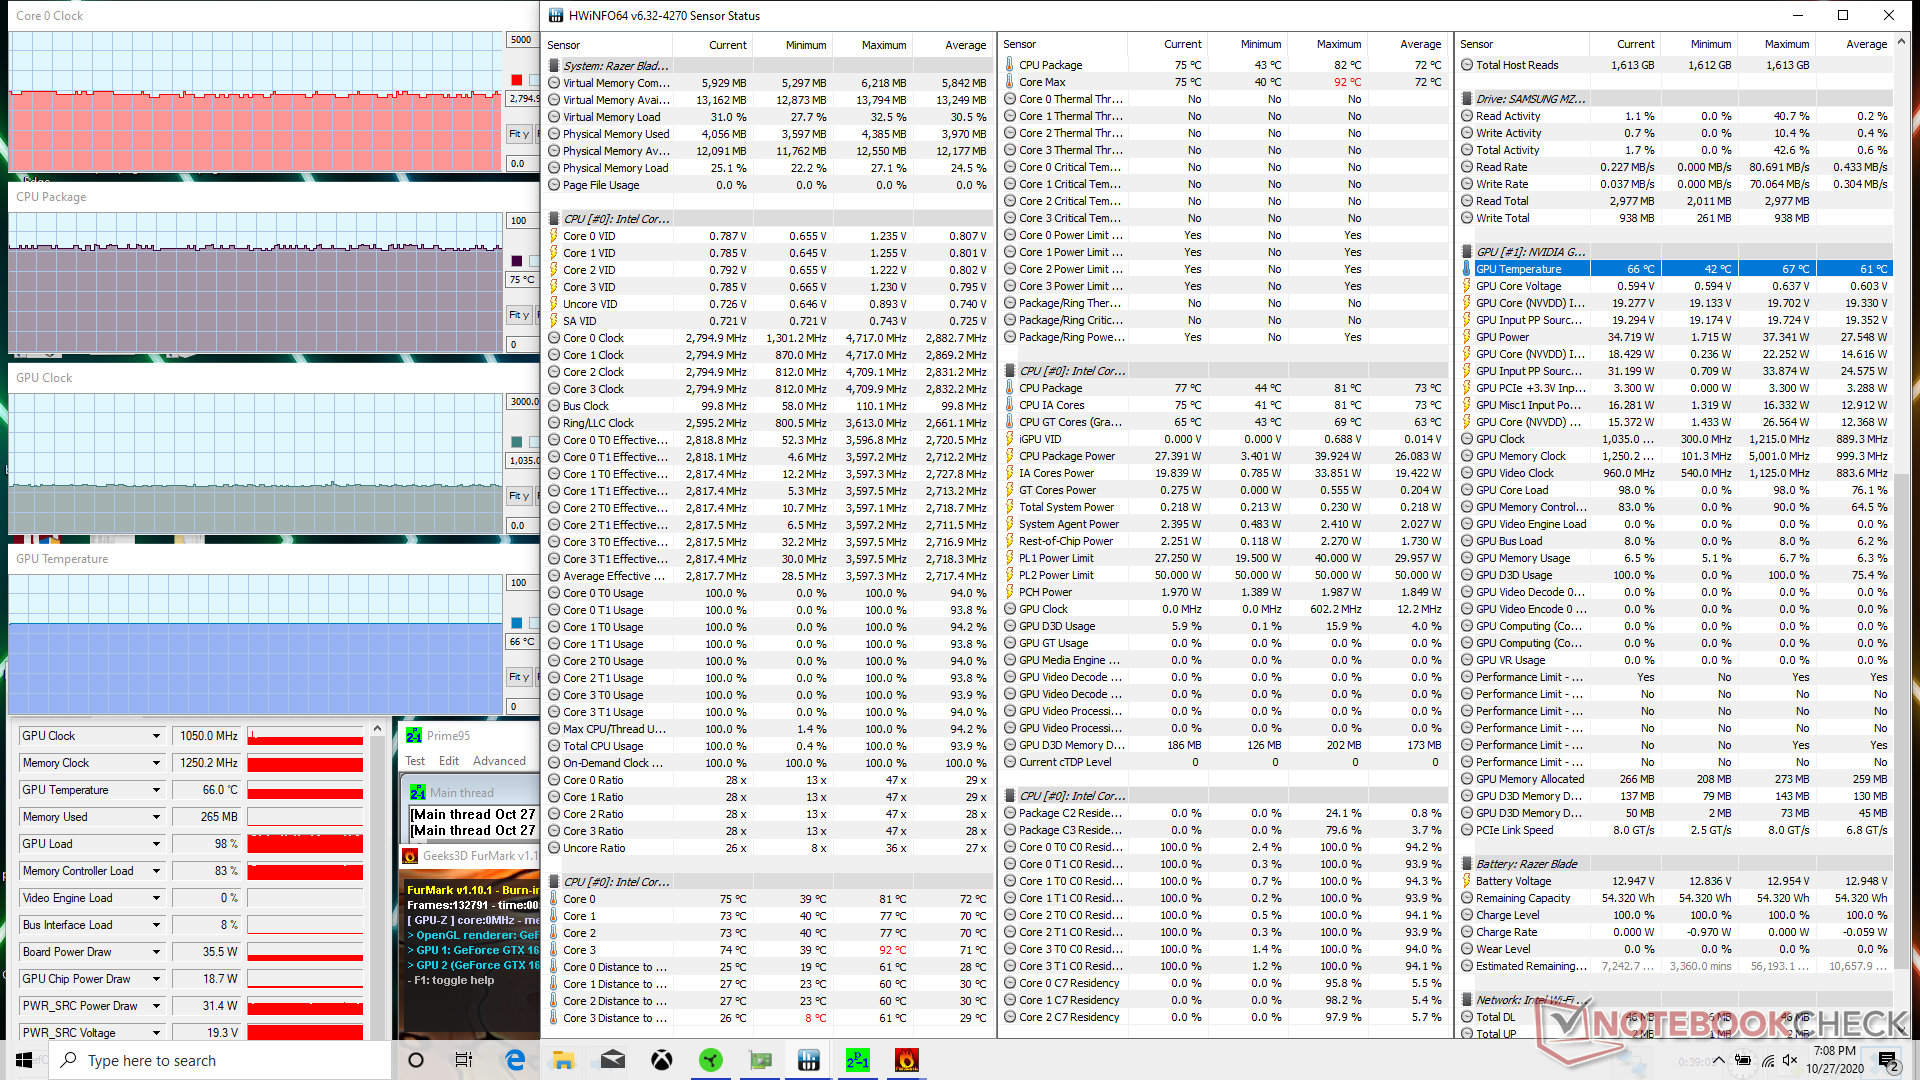
| CPU Clock (GHz) | GPU Clock (MHz) | Average CPU Temperature (°C) | Average GPU Temperature (°C) | |
| System Idle | -- | -- | 46 | 45 |
| Prime95 Stress | 3.0 - 3.1 | -- | 67 | 48 |
| Prime95 + FurMark Stress | ~2.7 - 2.9 | 1050 | 75 | 66 |
| Witcher 3 Stress | 2.1 - 4.7 | 1650 | ~65 | 64 |
Speakers

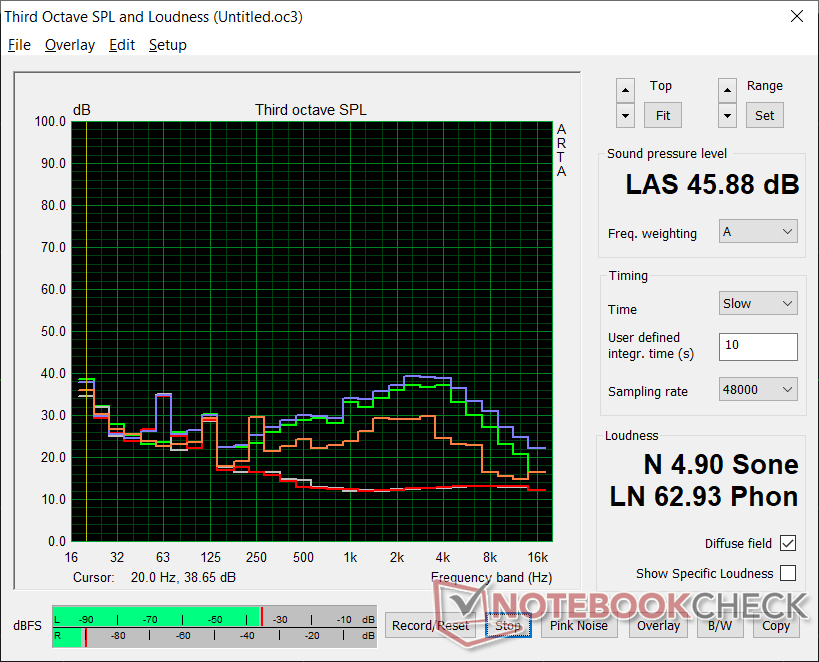
Razer Blade Stealth i7-1165G7 GTX 1650 Ti Max-Q audio analysis
(+) | speakers can play relatively loud (84.3 dB)
Bass 100 - 315 Hz
(-) | nearly no bass - on average 20.2% lower than median
(±) | linearity of bass is average (11.9% delta to prev. frequency)
Mids 400 - 2000 Hz
(±) | higher mids - on average 5.9% higher than median
(±) | linearity of mids is average (10.2% delta to prev. frequency)
Highs 2 - 16 kHz
(±) | higher highs - on average 5.2% higher than median
(±) | linearity of highs is average (7.1% delta to prev. frequency)
Overall 100 - 16.000 Hz
(±) | linearity of overall sound is average (18.9% difference to median)
Compared to same class
» 57% of all tested devices in this class were better, 7% similar, 36% worse
» The best had a delta of 5%, average was 18%, worst was 53%
Compared to all devices tested
» 44% of all tested devices were better, 8% similar, 48% worse
» The best had a delta of 4%, average was 24%, worst was 134%
Apple MacBook 12 (Early 2016) 1.1 GHz audio analysis
(+) | speakers can play relatively loud (83.6 dB)
Bass 100 - 315 Hz
(±) | reduced bass - on average 11.3% lower than median
(±) | linearity of bass is average (14.2% delta to prev. frequency)
Mids 400 - 2000 Hz
(+) | balanced mids - only 2.4% away from median
(+) | mids are linear (5.5% delta to prev. frequency)
Highs 2 - 16 kHz
(+) | balanced highs - only 2% away from median
(+) | highs are linear (4.5% delta to prev. frequency)
Overall 100 - 16.000 Hz
(+) | overall sound is linear (10.2% difference to median)
Compared to same class
» 7% of all tested devices in this class were better, 2% similar, 91% worse
» The best had a delta of 5%, average was 18%, worst was 53%
Compared to all devices tested
» 5% of all tested devices were better, 1% similar, 94% worse
» The best had a delta of 4%, average was 24%, worst was 134%
Energy Management
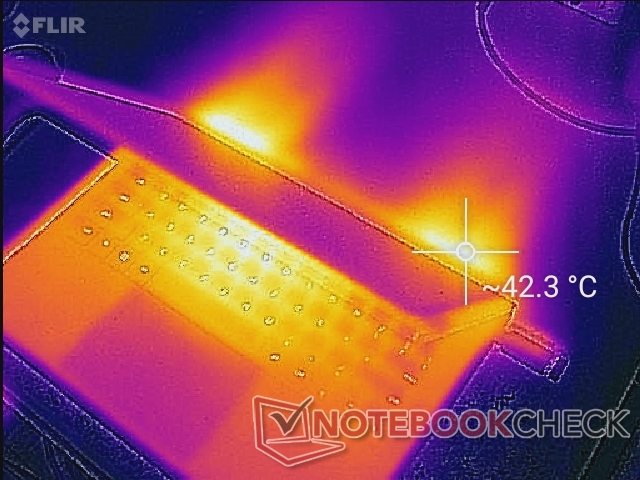
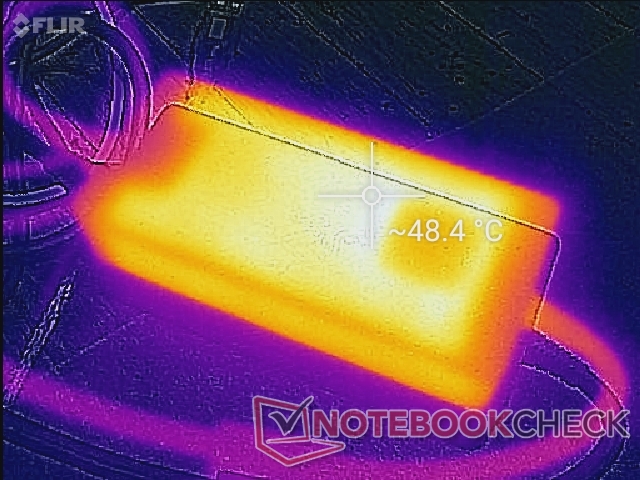
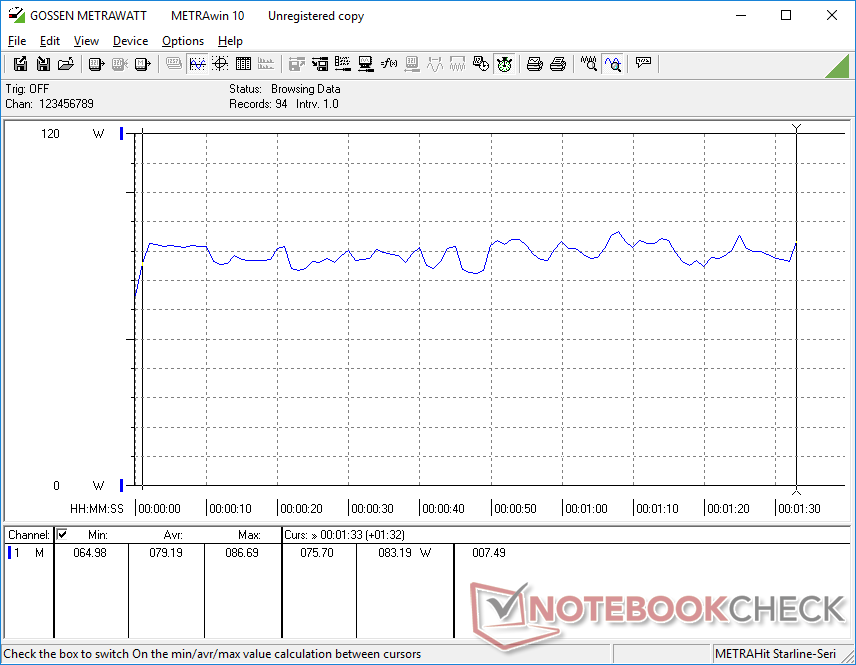
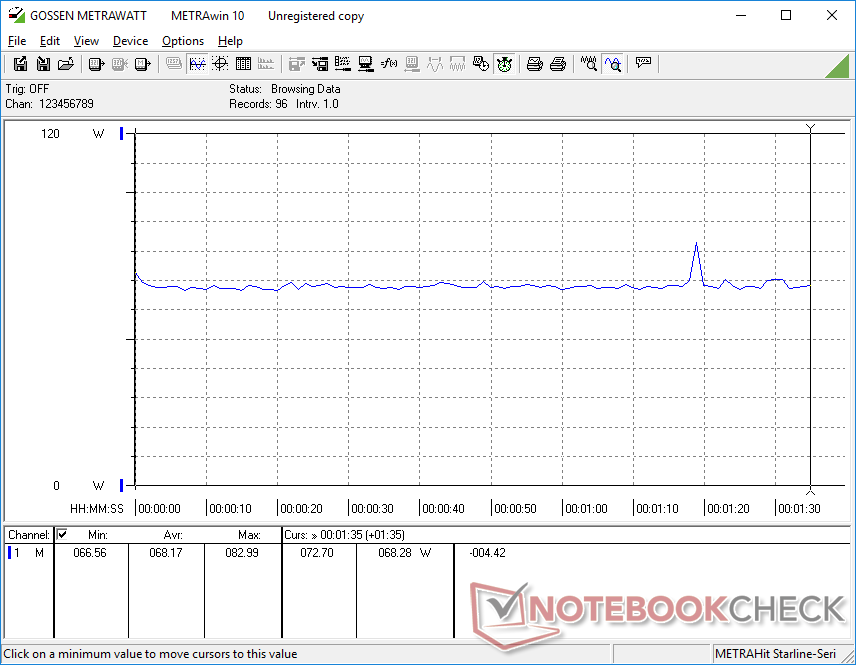
Power Consumption
Gaming can demand between 68 W and 80 W compared to 35 W to 40 W on subnotebooks running on integrated GPUs only or 50 W to 55 W on models with discrete GeForce MX graphics. This is to be expected when considering the more powerful GeForce GTX GPU in the Razer.
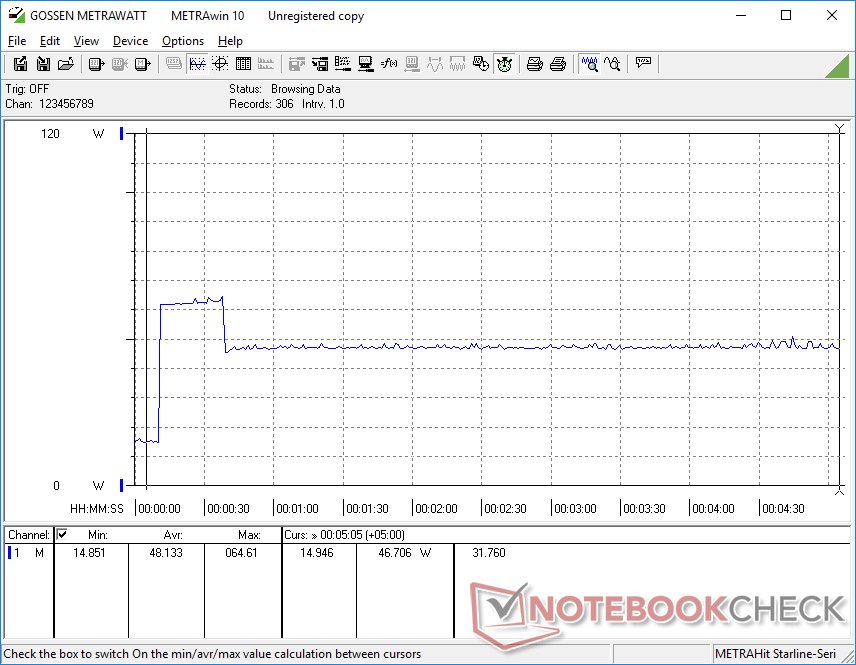
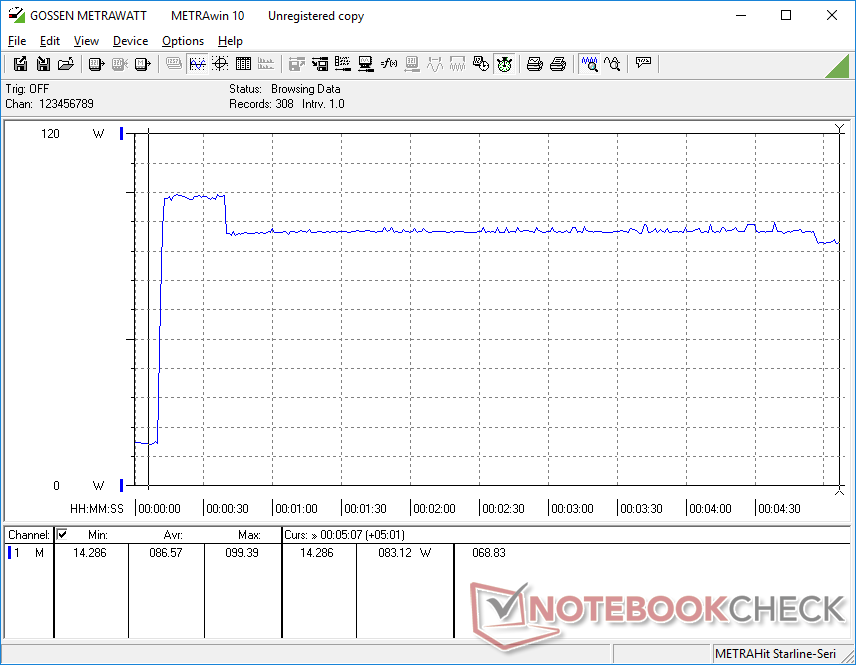
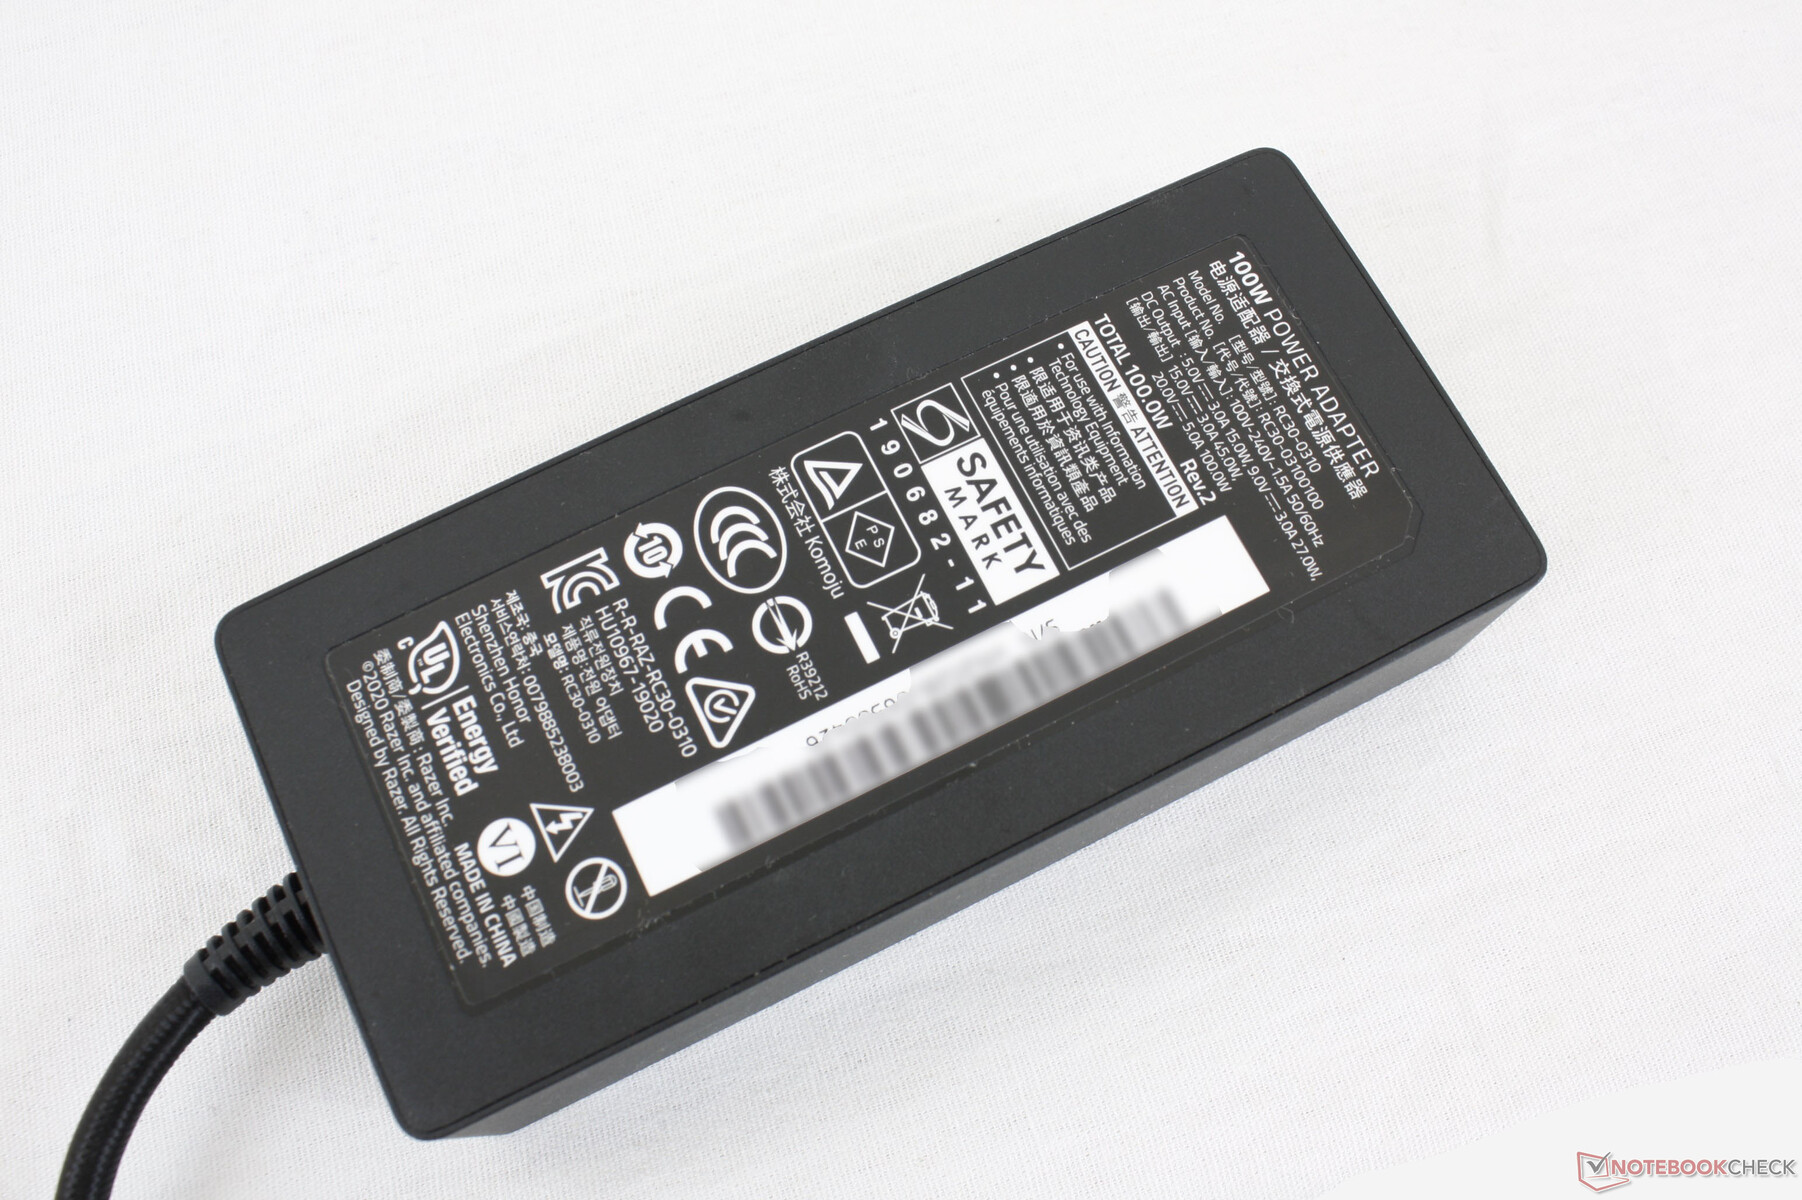
We're able to measure a maximum draw of 99.4 W from the small-medium (~13 x 6 x 2.8 cm) 100 W AC adapter when running Prime95 and FurMark simultaneously. This rate is only temporary as shown by our graph below meaning that the battery will not discharge when running extreme processing loads unlike on some early Whiskey Lake-U models. Overall power consumption is not noticeably more power efficient than the preceding Ice Lake model.
It's worth noting that power consumption is very high when in sleep mode (7.9 W) due to forced Modern Standby. This rate is even higher than idling on desktop at the highest brightness setting which only consumes about 6.3 W.
| Off / Standby | |
| Idle | |
| Load |
|
Key:
min: | |
| Razer Blade Stealth i7-1165G7 GTX 1650 Ti Max-Q i7-1165G7, GeForce GTX 1650 Ti Max-Q, Samsung SSD PM981a MZVLB512HBJQ, IPS, 1920x1080, 13.3" | Razer Blade Stealth Core i7 GTX 1650 Ti Max-Q 4K i7-1065G7, GeForce GTX 1650 Ti Max-Q, Lite-On CA5-8D512, IPS, 3840x2160, 13.3" | Dell XPS 13 9310 Core i7 FHD i7-1165G7, Iris Xe G7 96EUs, Micron 2300 512GB MTFDHBA512TDV, IPS, 1920x1200, 13.4" | Huawei MateBook X Pro 2020 i7 i7-10510U, GeForce MX250, Samsung PM981a MZVLB1T0HBLR, LTPS, 3000x2000, 13.9" | Asus Zenbook S UX393JA i7-1065G7, Iris Plus Graphics G7 (Ice Lake 64 EU), Intel SSD 660p 1TB SSDPEKNW010T8, IPS, 3300x2200, 13.9" | Lenovo Yoga Slim 7-14IIL05 i7-1065G7, GeForce MX350, WDC PC SN730 SDBPNTY-512G, , 1920x1080, 14" | |
|---|---|---|---|---|---|---|
| Power Consumption | -22% | 36% | 12% | 26% | 21% | |
| Idle Minimum * (Watt) | 4 | 6 -50% | 3.9 2% | 4.3 -8% | 4.1 -2% | 3.7 7% |
| Idle Average * (Watt) | 6.3 | 10.9 -73% | 5.9 6% | 8.5 -35% | 7.5 -19% | 5.7 10% |
| Idle Maximum * (Watt) | 14.5 | 15.5 -7% | 6.3 57% | 12 17% | 8.5 41% | 8.2 43% |
| Load Average * (Watt) | 79.2 | 71.9 9% | 39.7 50% | 54.8 31% | 36.8 54% | 57.1 28% |
| Witcher 3 ultra * (Watt) | 68.2 | 72.9 -7% | 34.8 49% | 47.1 31% | 39.2 43% | 54 21% |
| Load Maximum * (Watt) | 99.4 | 100.5 -1% | 47.5 52% | 61.5 38% | 61.6 38% | 82.8 17% |
* ... smaller is better
Battery Life
Runtimes are longer than what we recorded on the preceding Ice Lake GeForce Blade Stealth models. A full charge lasts for just over 9 hours of real-world WLAN use compared to 5.5 to 6.5 hours on the older Ice Lake versions. Remember to enable integrated graphics and to set the system to Balanced or Power Saver mode via Razer Synapse.
Charging from empty to full capacity takes about 1.5 hours. The USB-C AC adapter can be used to charge most other USB-C devices like the Nintendo Switch, smartphones, tablets, and even other laptops.
| Razer Blade Stealth i7-1165G7 GTX 1650 Ti Max-Q i7-1165G7, GeForce GTX 1650 Ti Max-Q, 53.1 Wh | Razer Blade Stealth Core i7 GTX 1650 Ti Max-Q 4K i7-1065G7, GeForce GTX 1650 Ti Max-Q, 53.1 Wh | Dell XPS 13 9310 Core i7 FHD i7-1165G7, Iris Xe G7 96EUs, 52 Wh | Huawei MateBook X Pro 2020 i7 i7-10510U, GeForce MX250, 57.4 Wh | Asus Zenbook S UX393JA i7-1065G7, Iris Plus Graphics G7 (Ice Lake 64 EU), 67 Wh | Lenovo Yoga Slim 7-14IIL05 i7-1065G7, GeForce MX350, 61 Wh | |
|---|---|---|---|---|---|---|
| Battery runtime | -45% | 34% | 16% | 39% | 10% | |
| Reader / Idle (h) | 20.6 | 7.8 -62% | 30 46% | 38.4 86% | ||
| WiFi v1.3 (h) | 9 | 6.5 -28% | 11 22% | 10.4 16% | 8.3 -8% | 9.9 10% |
| Load (h) | 1.7 | 3.2 | 2.4 | 2.7 | 1.4 |
Pros
Cons
Verdict
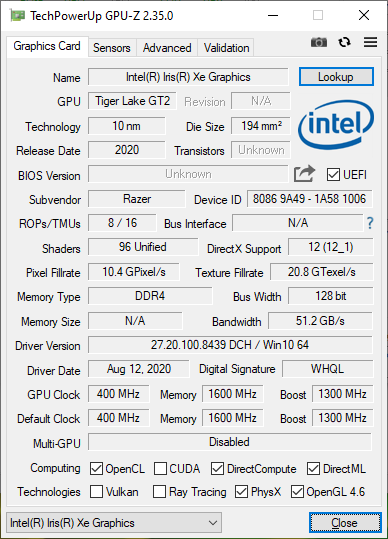
A notable advantage of Tiger Lake is its massive increase in integrated graphics performance over last year's Iris Plus G7. Though it won't magically turn laptops into gaming machines, it will allow super-slim Ultrabooks like the XPS 13 or HP Spectre 13 to run popular games fairly well including DOTA 2, Rocket League, or Fortnite which were previously unplayable on the ancient UHD Graphics 620.
The Razer Blade Stealth is a special case because it already comes equipped with the fastest GPU you can find in a 13-inch form factor: the GeForce GTX 1650 Ti Max-Q. As a result, one of Tiger Lake's best selling points is almost moot since Razer has paired the processor with an already speedy Nvidia GPU. The slight gen-to-gen CPU performance increase is always welcomed, but most games are GPU bound anyways meaning that the 20 percent uptick in multi-thread CPU performance will translate to just a few frame rates more on most games. The main exception here is if owners plan on targeting very low graphics settings to better exploit the 120 Hz display refresh rate where CPU performance begins to matter more. In this case, the gaming performance delta between Tiger Lake and the 25 W Ice Lake Blade Stealth will more likely be greater as shown by our DOTA 2 720p test. Otherwise, gaming performance will only be marginally faster at the default 1080p resolution.
Does this mean that there's no major reason to purchase the Tiger Lake Blade Stealth over the Ice Lake version? The longer battery life is certainly nice, but it would've been even better to see other upgrades like Advanced Optimus for simultaneous G-Sync and Optimus support, fully-lit key symbols for international markets, or even a proper webcam shutter or fingerprint reader. Display brightness isn't quite up to par with traditional subnotebooks like the XPS 13 or MacBook Pro 13 and black-white response times could definitely be faster especially for fast-paced games like Overwatch. It's the best Blade Stealth yet, but it still has a few steps to go before we can call it the "ultimate" gaming subnotebook.
Users settling for the older and cheaper 25 W Ice Lake Blade Stealth won't be missing out on much as it comes with the same 120 Hz display and GTX 1650 Ti Max-Q GPU for an almost identical gaming experience. If you just want the best, then our Tiger Lake configuration is only $100 USD more and with none of that 15 W or 25 W Ice Lake nonsense that Razer pulled off on last year's models. The Tiger Lake update is ultimately a relatively minor refresh as exemplified by the small price difference between generations.
Razer Blade Stealth i7-1165G7 GTX 1650 Ti Max-Q
- 10/31/2020 v7 (old)
Allen Ngo
Price comparison
