 Deutsch
 English
 Español
 Français
 Italiano
 Nederlands
 Polski
 Português
 Русский
 Türkçe
 Svenska
 Chinese
 Magyar
Schenker XMG Neo 15 laptop in review: Comet Lake upgrade

The Schenker XMG Neo 15 recently presented itself in our test with an Intel Core i7-9750H. Since then, not only has the hardware developed further, but also small visual changes have crept in. In addition to these and other points, in the following review we will also look at the performance in comparison with the competing devices listed below. Under each section, you can add other notebooks from our database to the competing devices we have chosen.
Rating | Date | Model | Weight | Height | Size | Resolution | Best Price |
|---|---|---|---|---|---|---|---|
| 85.9 % | 11/2020 | SCHENKER XMG Neo 15 Comet Lake i7-10875H, GeForce RTX 2070 Super Mobile | 2.2 kg | 23 mm | 15.60" | 1920x1080 | |
| 82.8 % | 11/2019 | SCHENKER XMG Neo 15 XNE15M19 i7-9750H, GeForce RTX 2070 Max-Q | 2.1 kg | 22 mm | 15.60" | 1920x1080 | |
| 86.9 % | 08/2020 | Razer Blade 15 RTX 2070 Super Max-Q i7-10875H, GeForce RTX 2070 Super Max-Q | 2.1 kg | 17.8 mm | 15.60" | 1920x1080 | |
| 86.5 % | 08/2020 | Aorus 15G XB i7-10875H, GeForce RTX 2070 Super Max-Q | 2.3 kg | 25 mm | 15.60" | 1920x1080 | |
| 82.9 % | 09/2020 | Asus Zephyrus S15 GX502L i7-10875H, GeForce RTX 2070 Super Mobile | 2.1 kg | 19 mm | 15.60" | 1920x1080 |
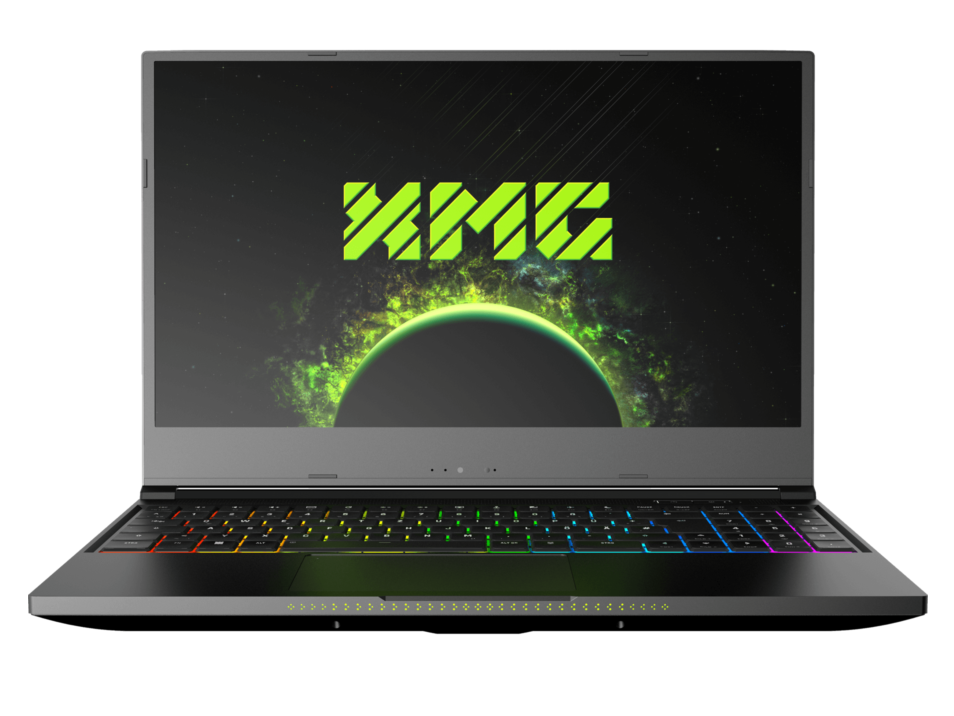
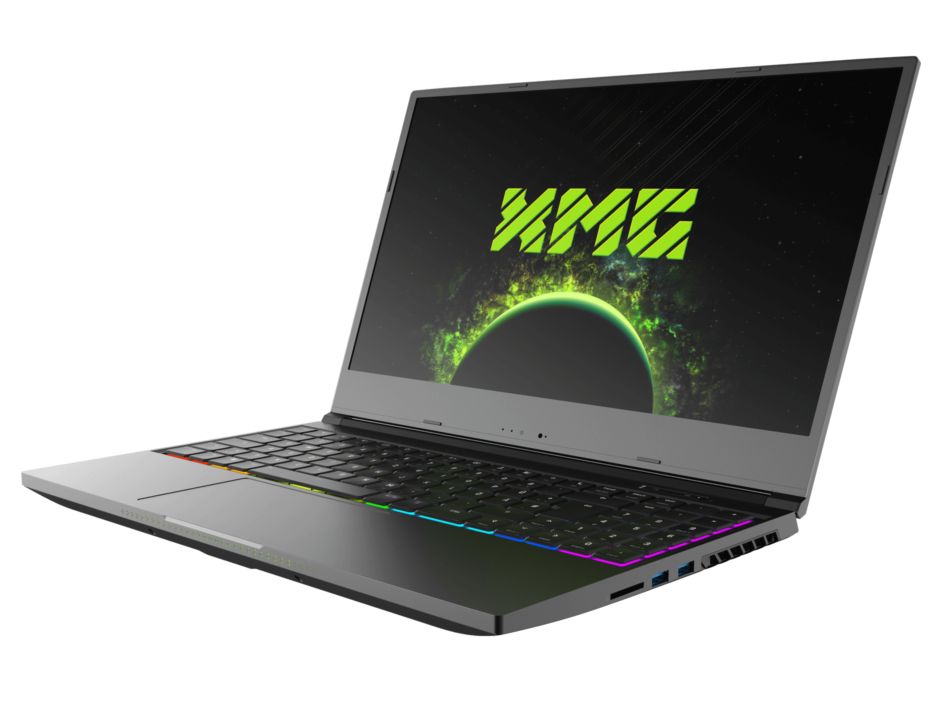
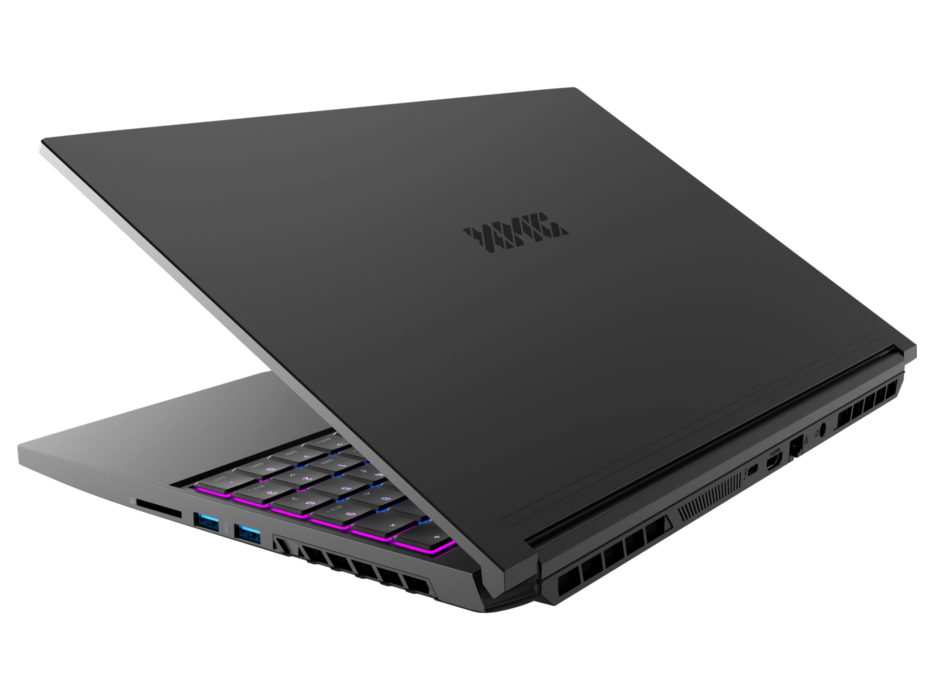
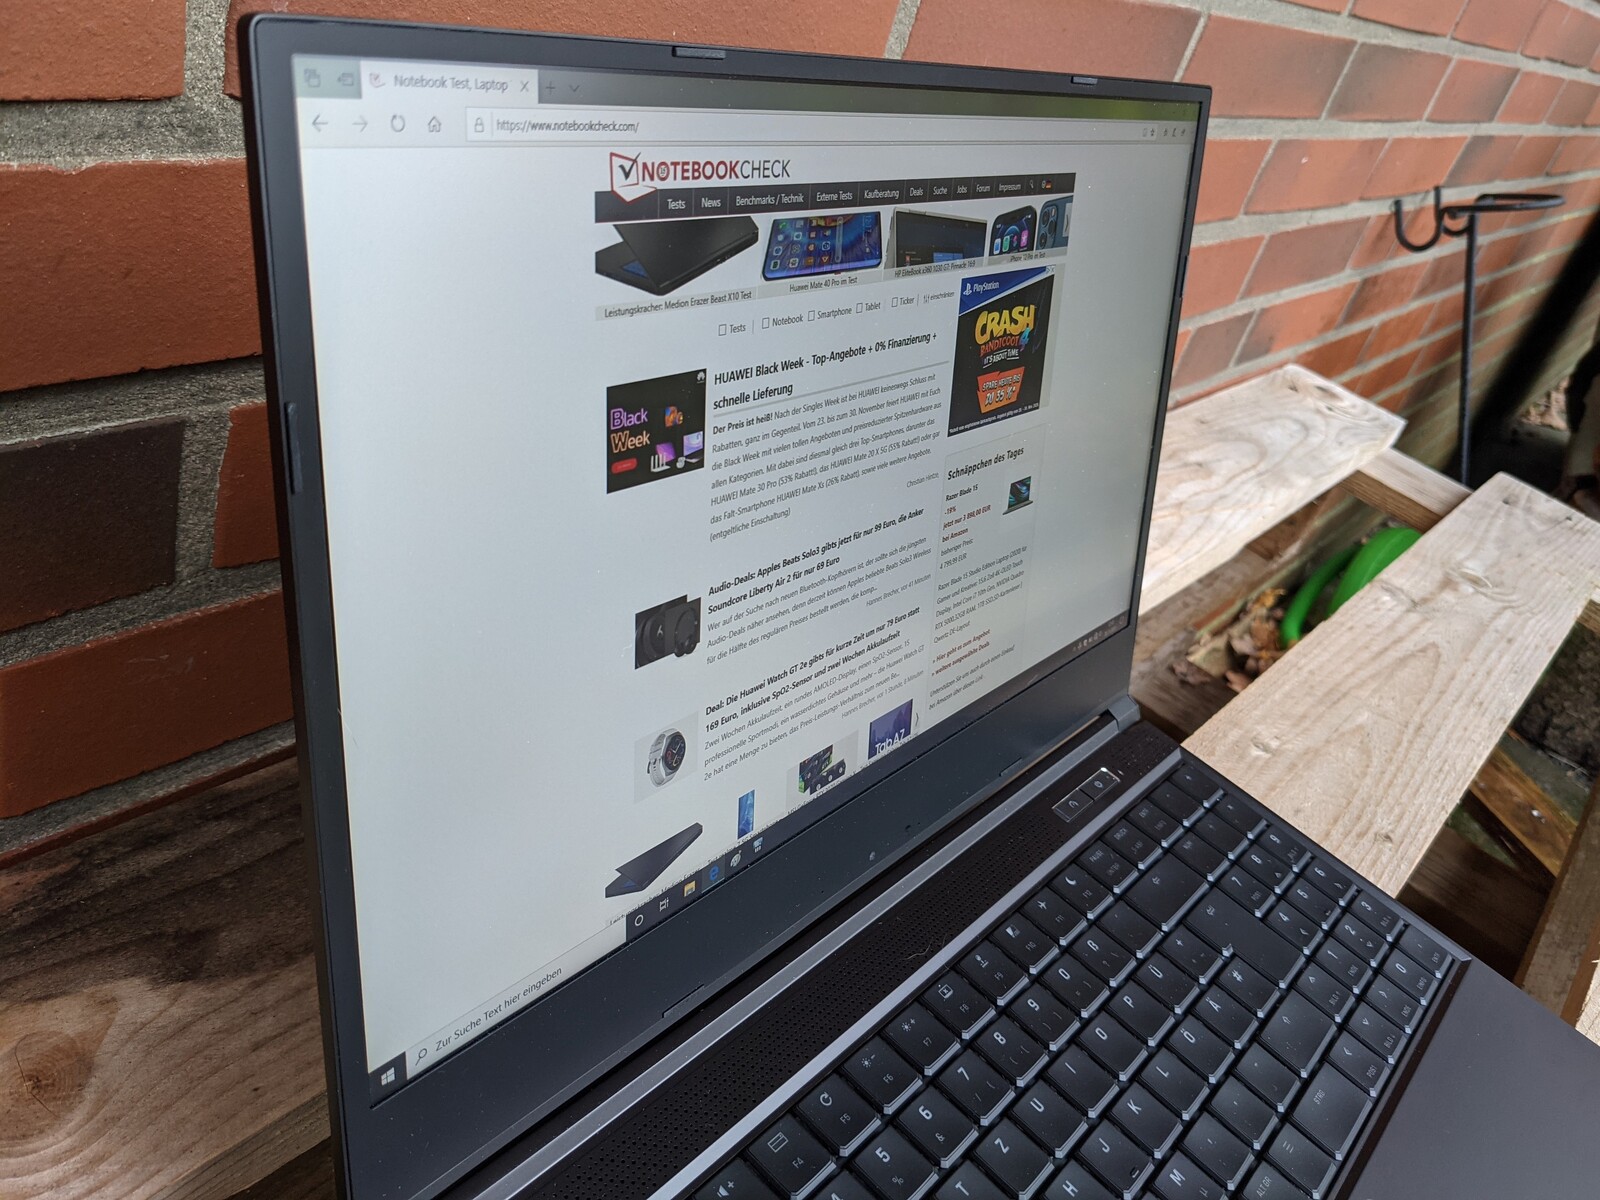
Case - Discreet changes
The case of the XMG Neo 15 receives a discreet upgrade. In addition to the even slimmer-looking frame around the screen, the light bar on the front now sets stronger accents with a dotted pattern. In addition, the webcam moves under the screen, which results in a somewhat unfavorable viewing angle. Also, the controls for switching on and off and the performance button are now square and separate. However, the changes in weight and dimensions are marginal.
Since the basically good impression of the case is preserved, we refer to the test report of an earlier version of the Schenker XMG Neo 15 for a detailed description.
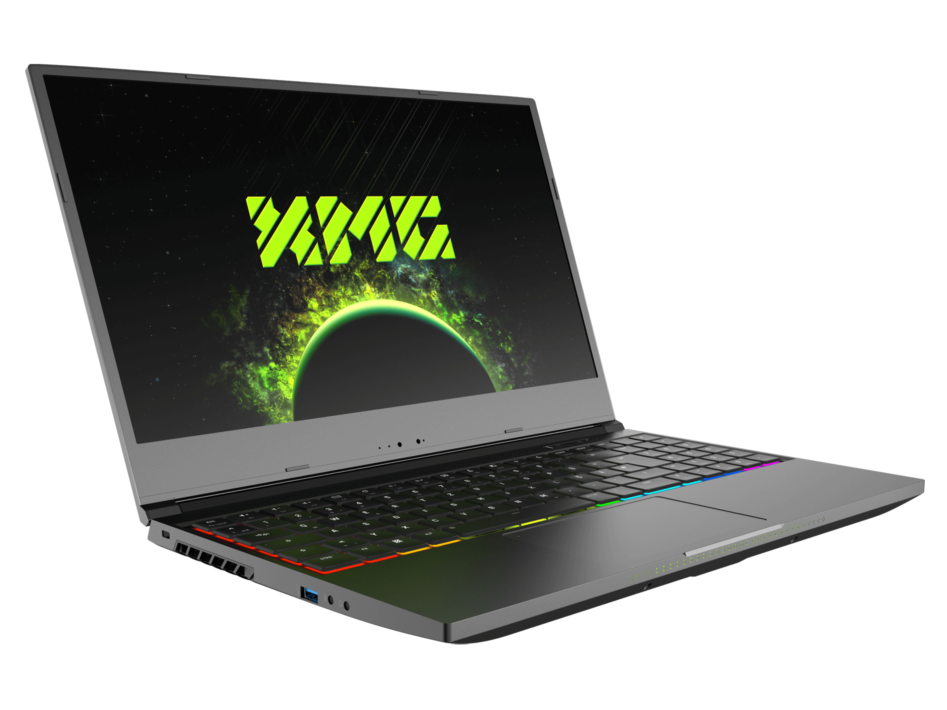
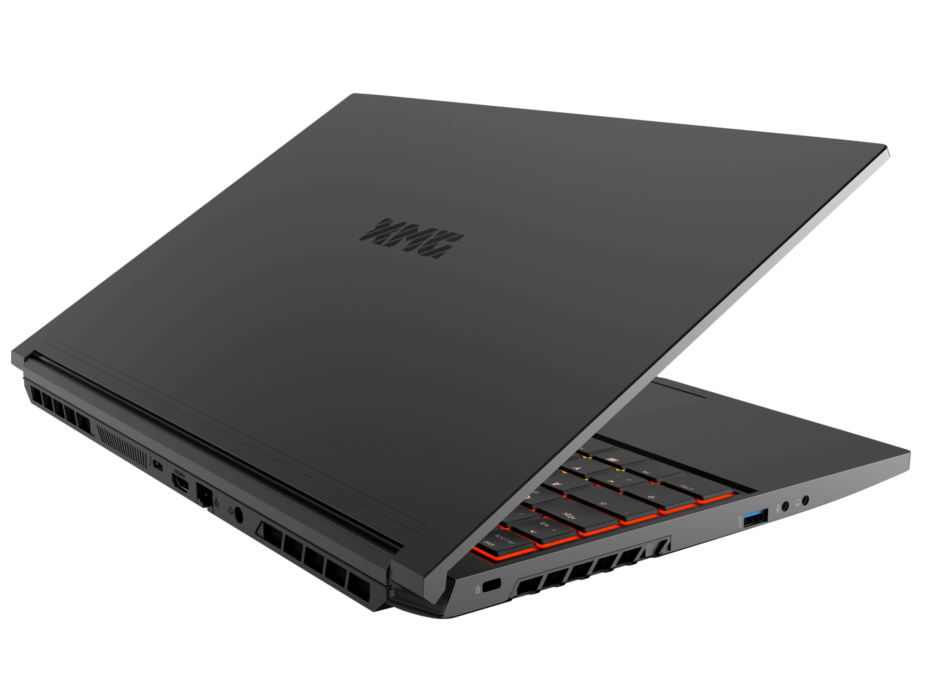
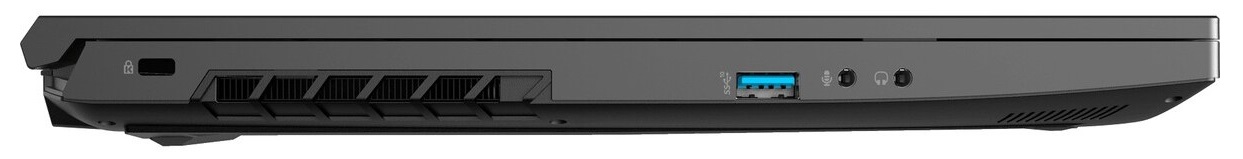
Features - Thunderbolt with DisplayPort
In the current version, the GigabitLAN port of the Schenker XMG Neo 15 is no longer located on the side but is now on the back. The same applies to the Thunderbolt 3 port, which supports DisplayPort with up to two screens via daisy chain but does not offer PowerDelivery. The two single MiniDisplay ports of the previous model have been removed.
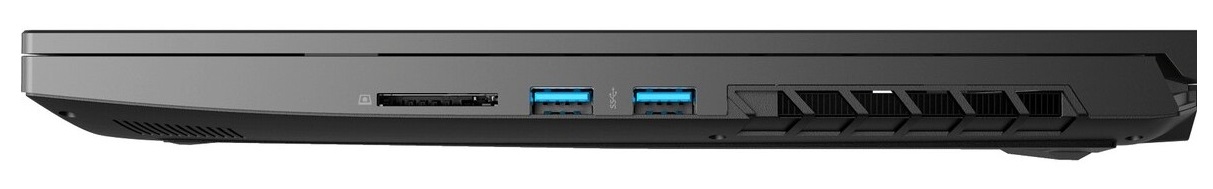


SD card reader
With our reference memory card Toshiba Exceria Pro SDXC 64 GB UHS-II, the SD card reader of the Neo 15 achieves slightly better values than the previous model. In comparison with the listed competition, however, the result is only sufficient for one of the lower places in our test field.
| SD Card Reader | |
| average JPG Copy Test (av. of 3 runs) | |
| Aorus 15G XB (Toshiba Exceria Pro SDXC 64 GB UHS-II) | |
| Razer Blade 15 RTX 2070 Super Max-Q (Toshiba Exceria Pro SDXC 64 GB UHS-II) | |
| Average of class Gaming (19 - 202, n=100, last 2 years) | |
| SCHENKER XMG Neo 15 Comet Lake (Toshiba Exceria Pro SDXC 64 GB UHS-II) | |
| SCHENKER XMG Neo 15 XNE15M19 (Toshiba Exceria Pro SDXC 64 GB UHS-II) | |
| maximum AS SSD Seq Read Test (1GB) | |
| Aorus 15G XB (Toshiba Exceria Pro SDXC 64 GB UHS-II) | |
| Razer Blade 15 RTX 2070 Super Max-Q (Toshiba Exceria Pro SDXC 64 GB UHS-II) | |
| Average of class Gaming (25.8 - 269, n=94, last 2 years) | |
| SCHENKER XMG Neo 15 Comet Lake (Toshiba Exceria Pro SDXC 64 GB UHS-II) | |
| SCHENKER XMG Neo 15 XNE15M19 (Toshiba Exceria Pro SDXC 64 GB UHS-II) | |
Communication
Instead of Wi-Fi 5, users now have Wi-Fi 6 available in the Schenker XMG Neo 15. With our reference router Netgear Nighthawk AX12, the transmission speeds have increased and, at 1,650 Mb/s for data reception, are sufficient for first place in our test field. In contrast, the Neo 15 is only in the middle of the field when it comes to data transmission, as we measured 1,230 Mb/s.
Webcam
The webcam of the Neo 15 offers the widely used low 0.9 MP and therefore delivers a correspondingly low quality. Even under good lighting conditions, subjects in the picture are not sharp and colors are displayed with very low contrast.


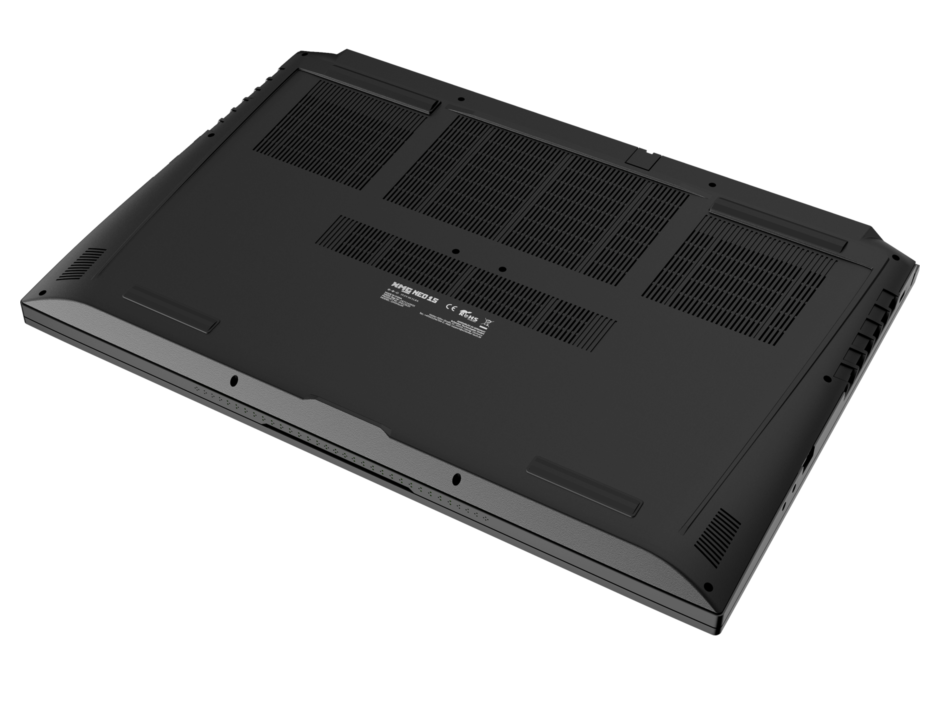
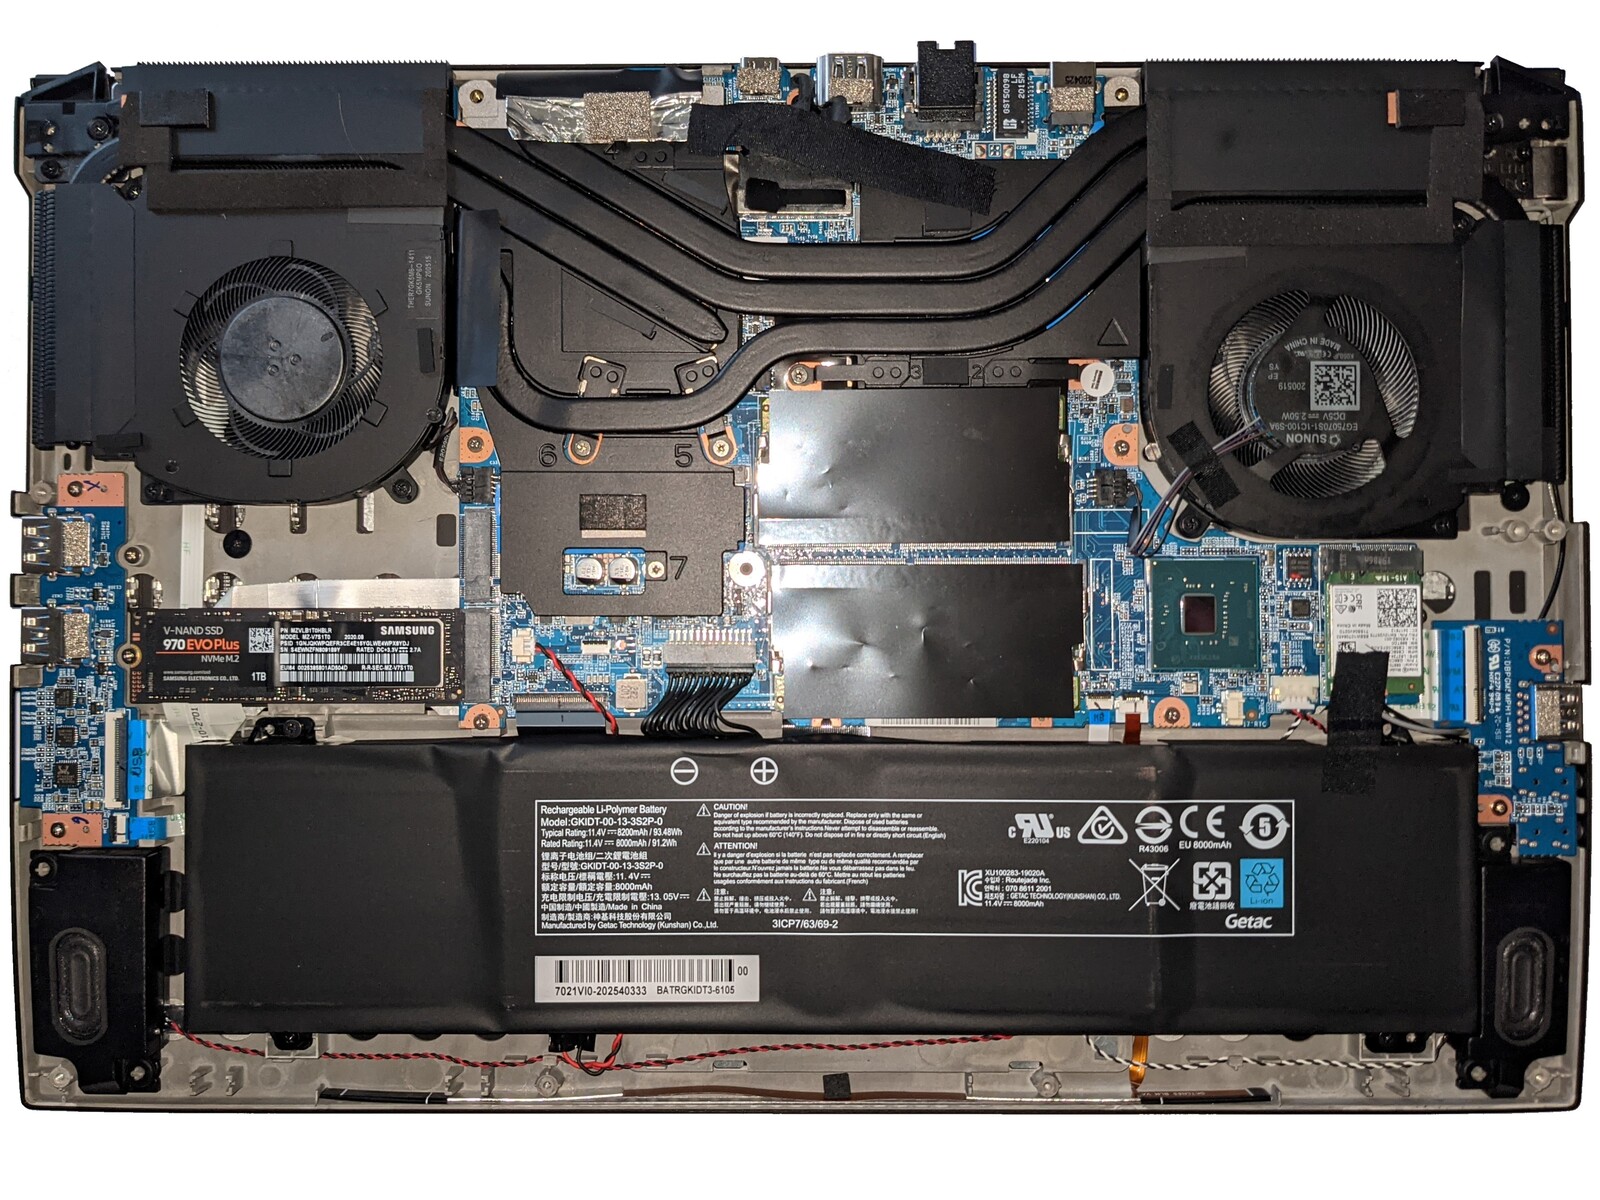
Maintenance
The XMG Neo 15 offers very good maintenance possibilities. After all the screws on the underside have been loosened, the base plate can be removed very easily, without having to worry about any hooks or anchors. Inside, there is free access to two SSD slots, two RAM banks and the WLAN module.
Warranty
Schenker grants buyers of the XMG Neo 15 a warranty period of 24 months. For a surcharge of around 100 Euros (~$120), this period can be extended to 36 months.
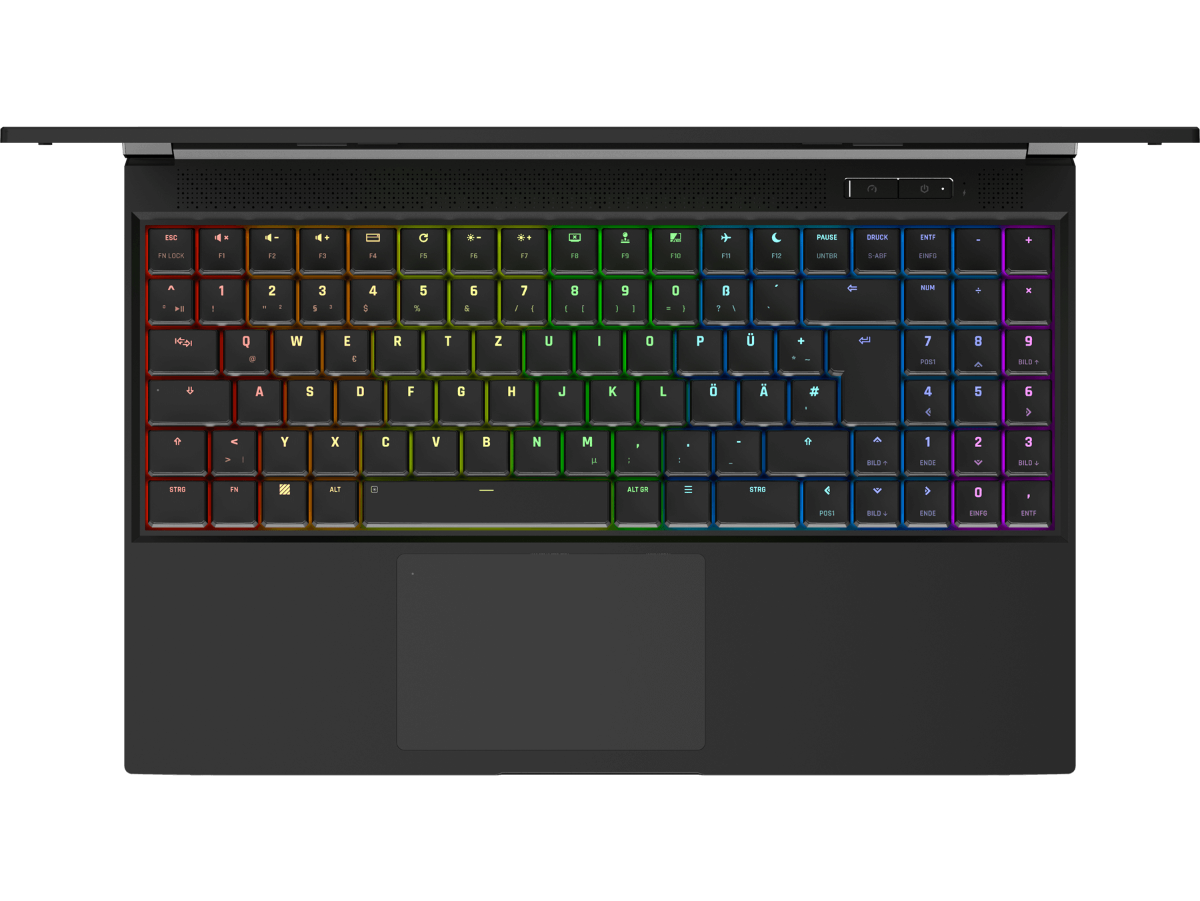
Input devices - Mechanical keyboard convinces
For a description of the input devices we refer here to an earlier version of the Schenker XMG Neo 15.
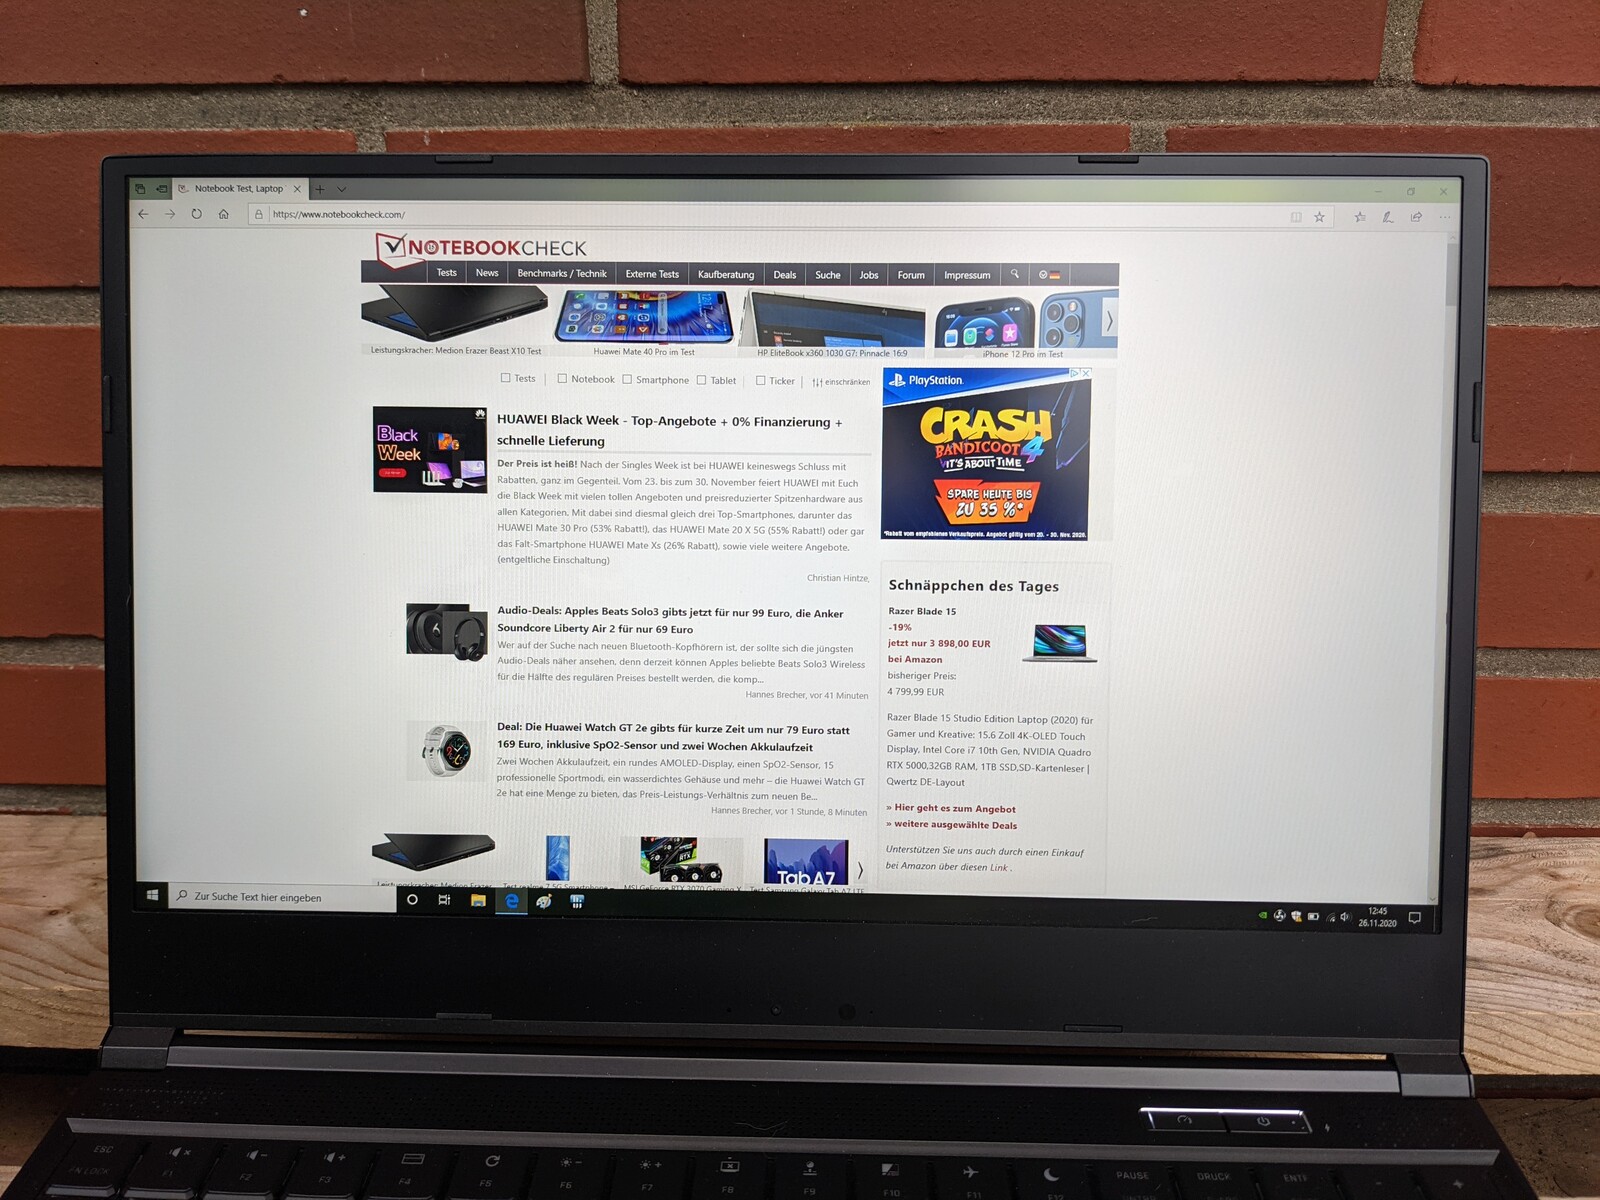
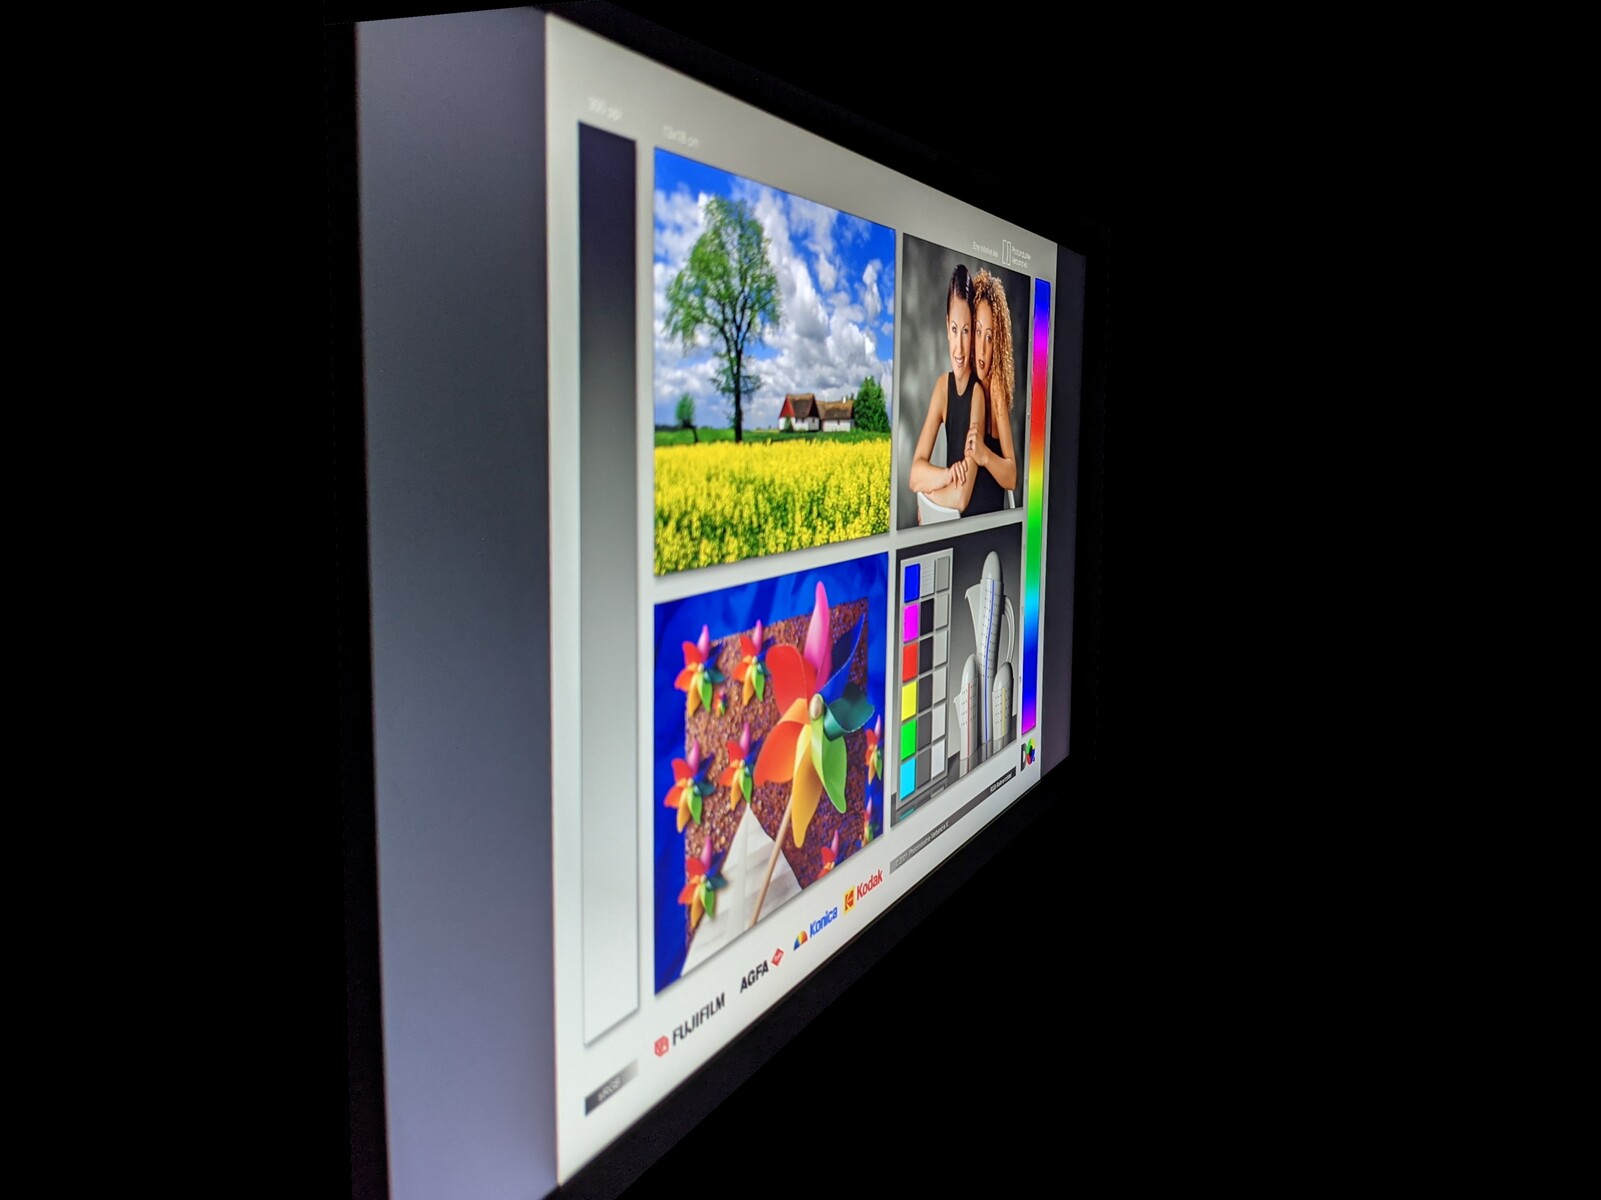
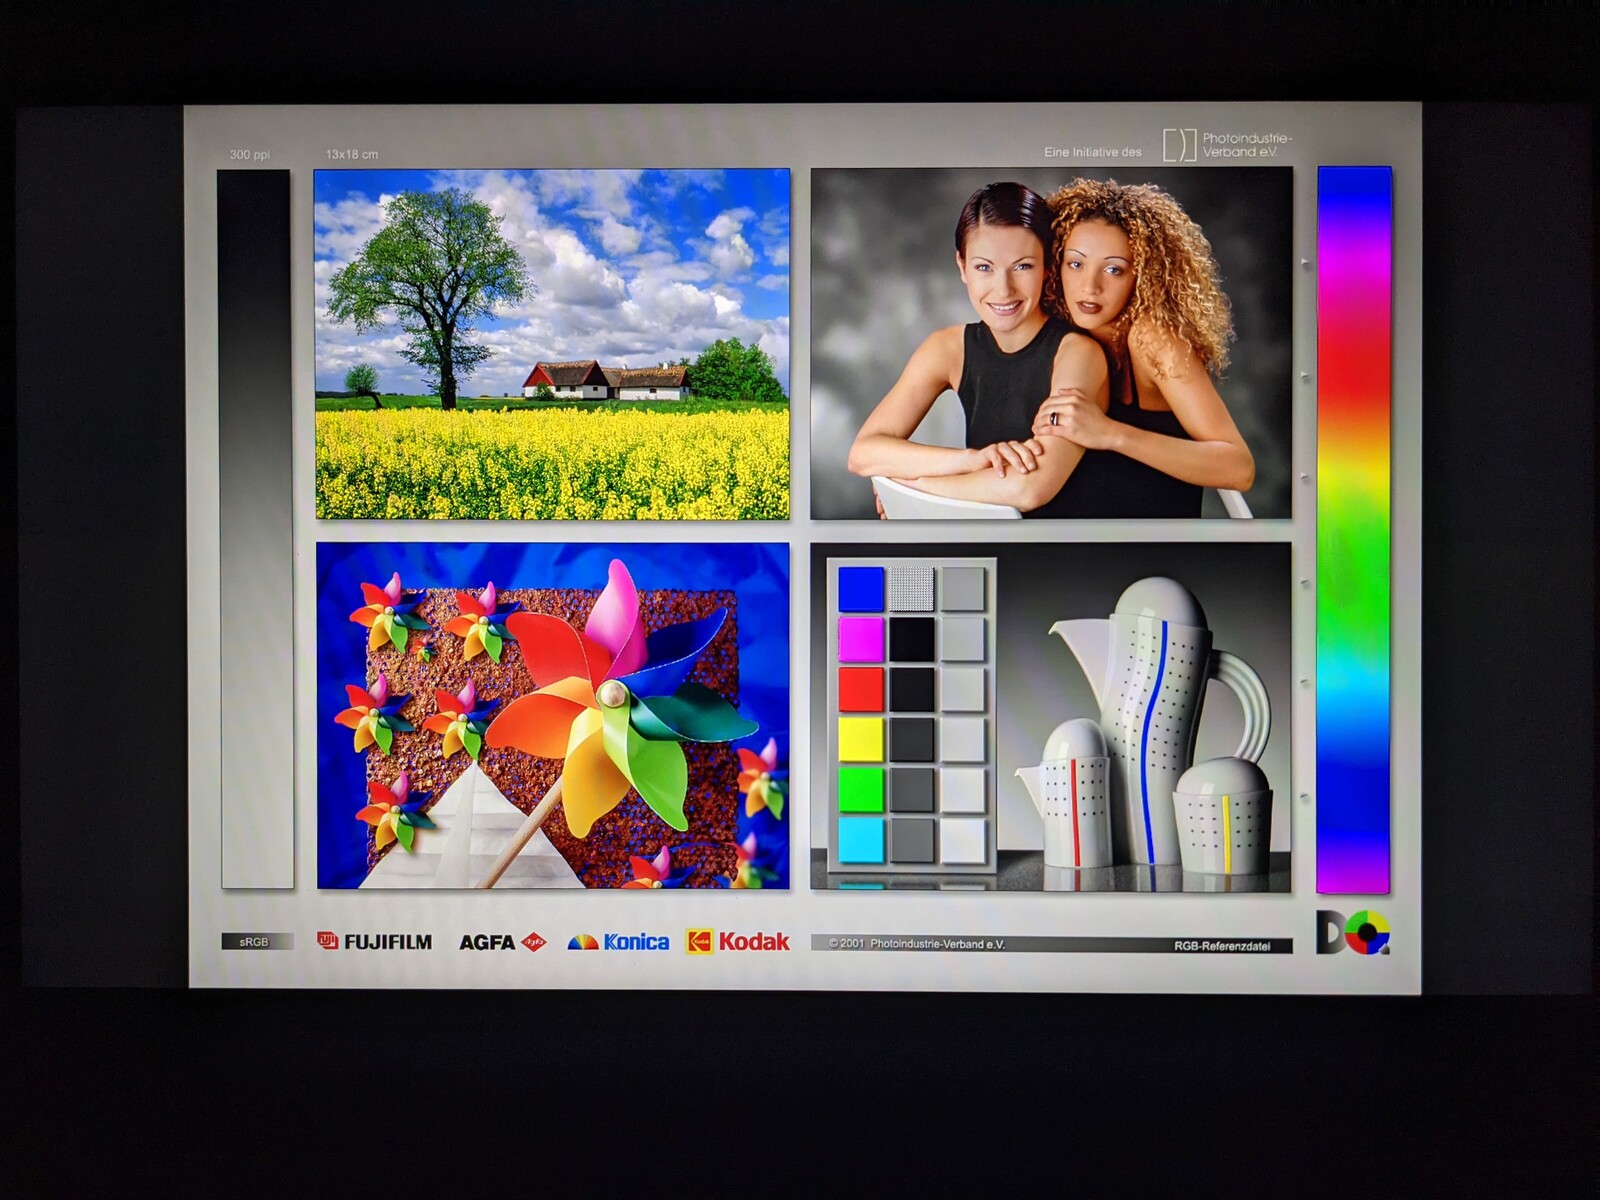
Display - Gaming notebook with 240 Hz panel
The 15.6-inch screen of the Neo 15 offers a resolution of 1920x1080 pixels and a refresh rate of 240 Hz. With an average brightness of 284 cd/m², it is in the middle of our test field. The same applies to the illumination of 89%. Our measurements also show that the screen, however, flickers at a frequency of 23,580 Hz at a brightness value of less than 25%. Since this value is very high, even users with sensitive eyes should be able to use the Neo 15 without any problems.
| |||||||||||||||||||||||||
Brightness Distribution: 87 %
Center on Battery: 308 cd/m²
Contrast: 963:1 (Black: 0.32 cd/m²)
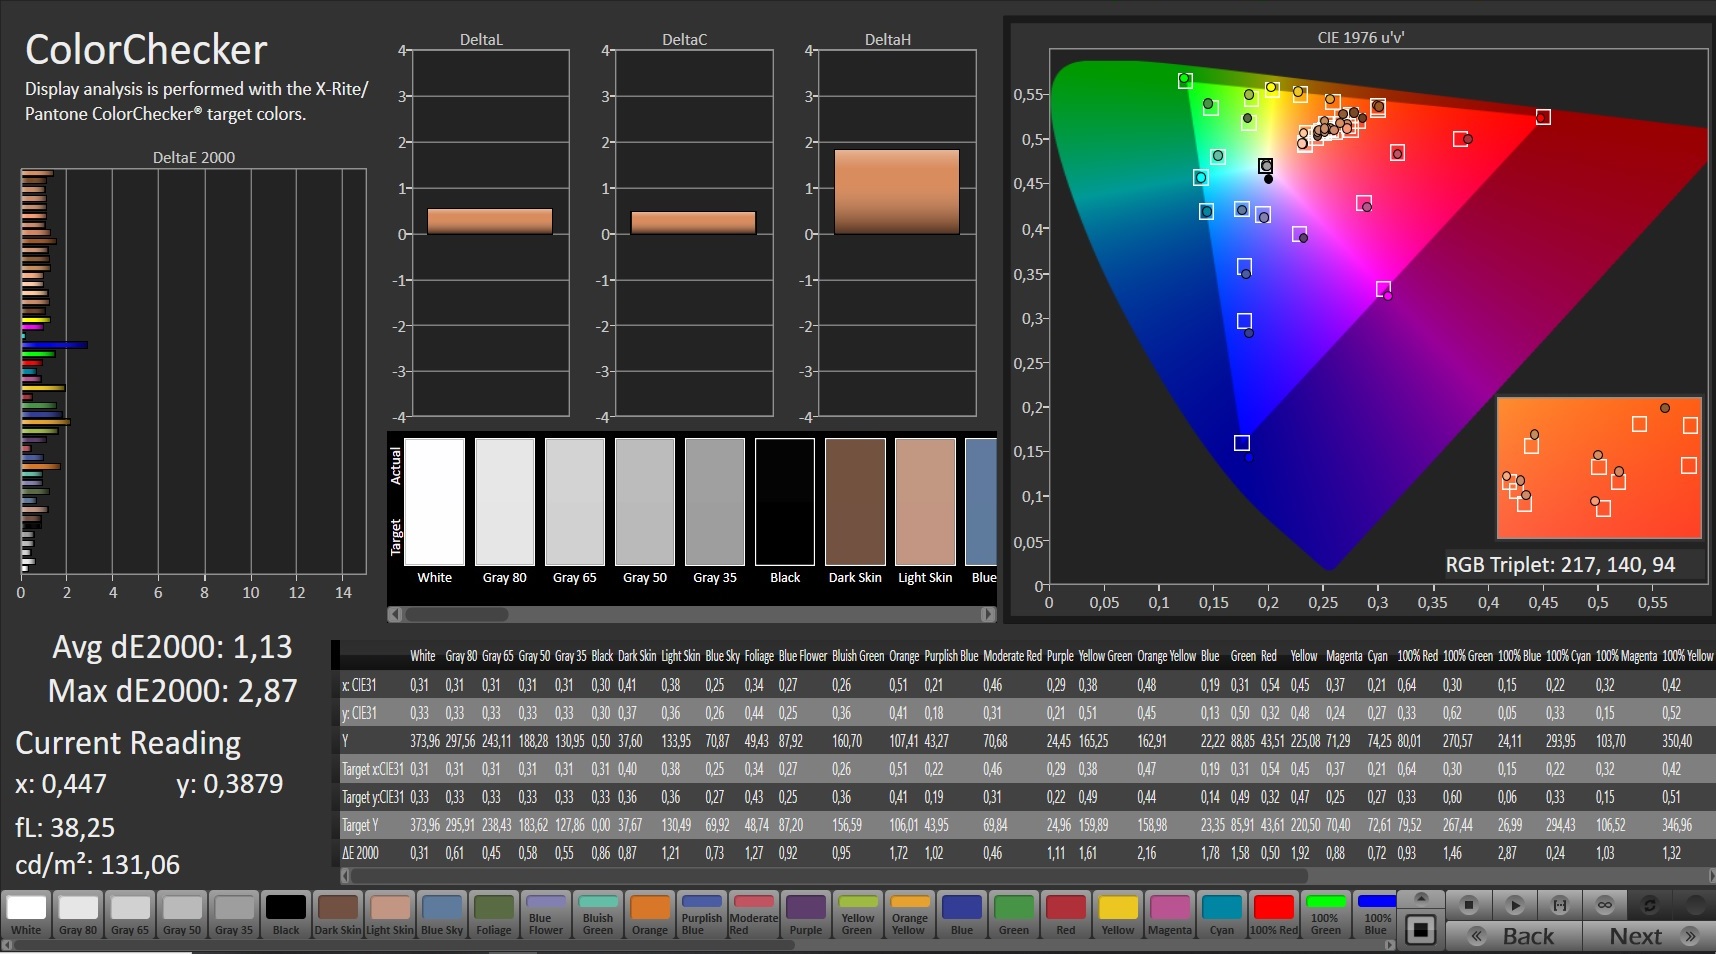
ΔE Color 2.45 | 0.5-29.43 Ø5, calibrated: 0.83
ΔE Greyscale 3.9 | 0.57-98 Ø5.3
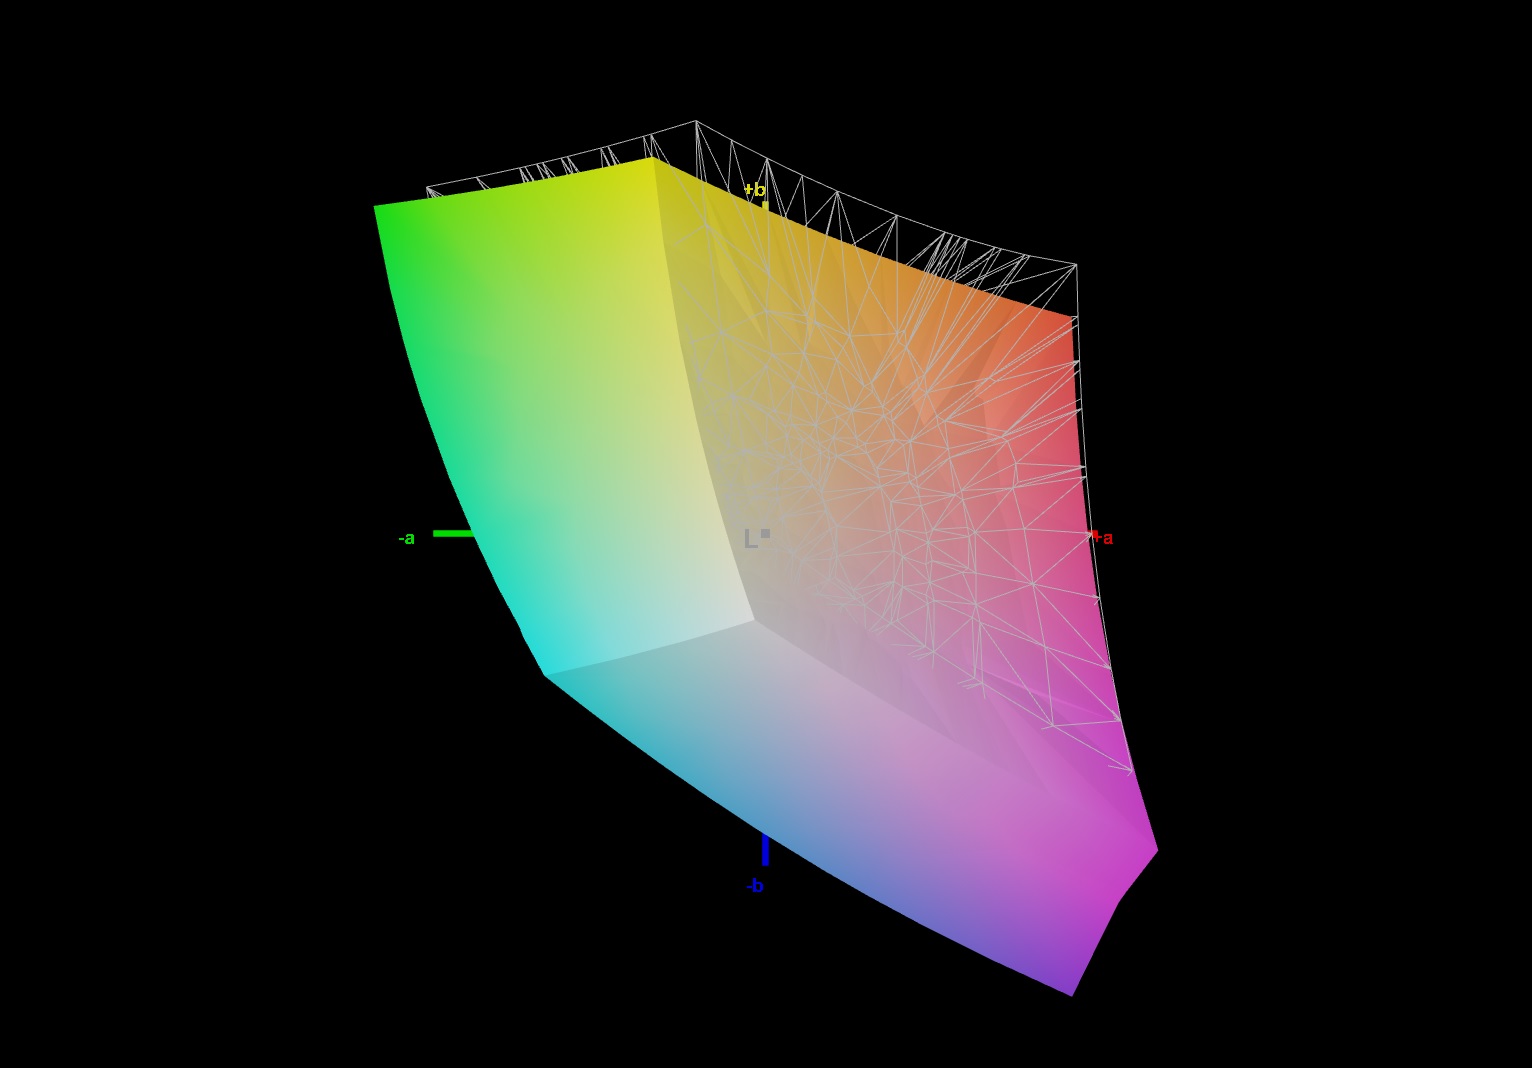
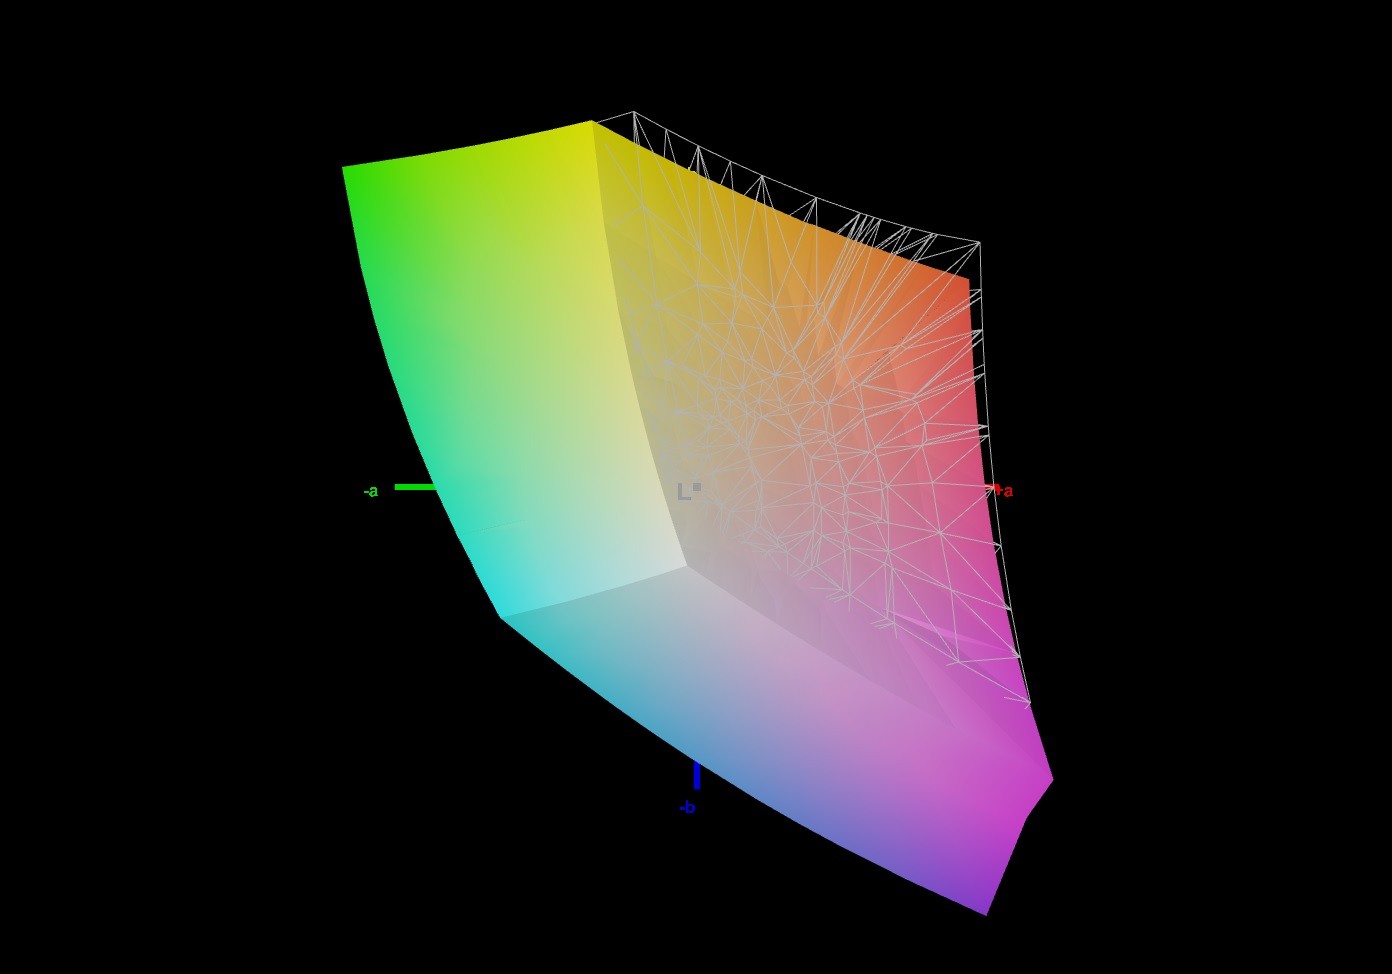
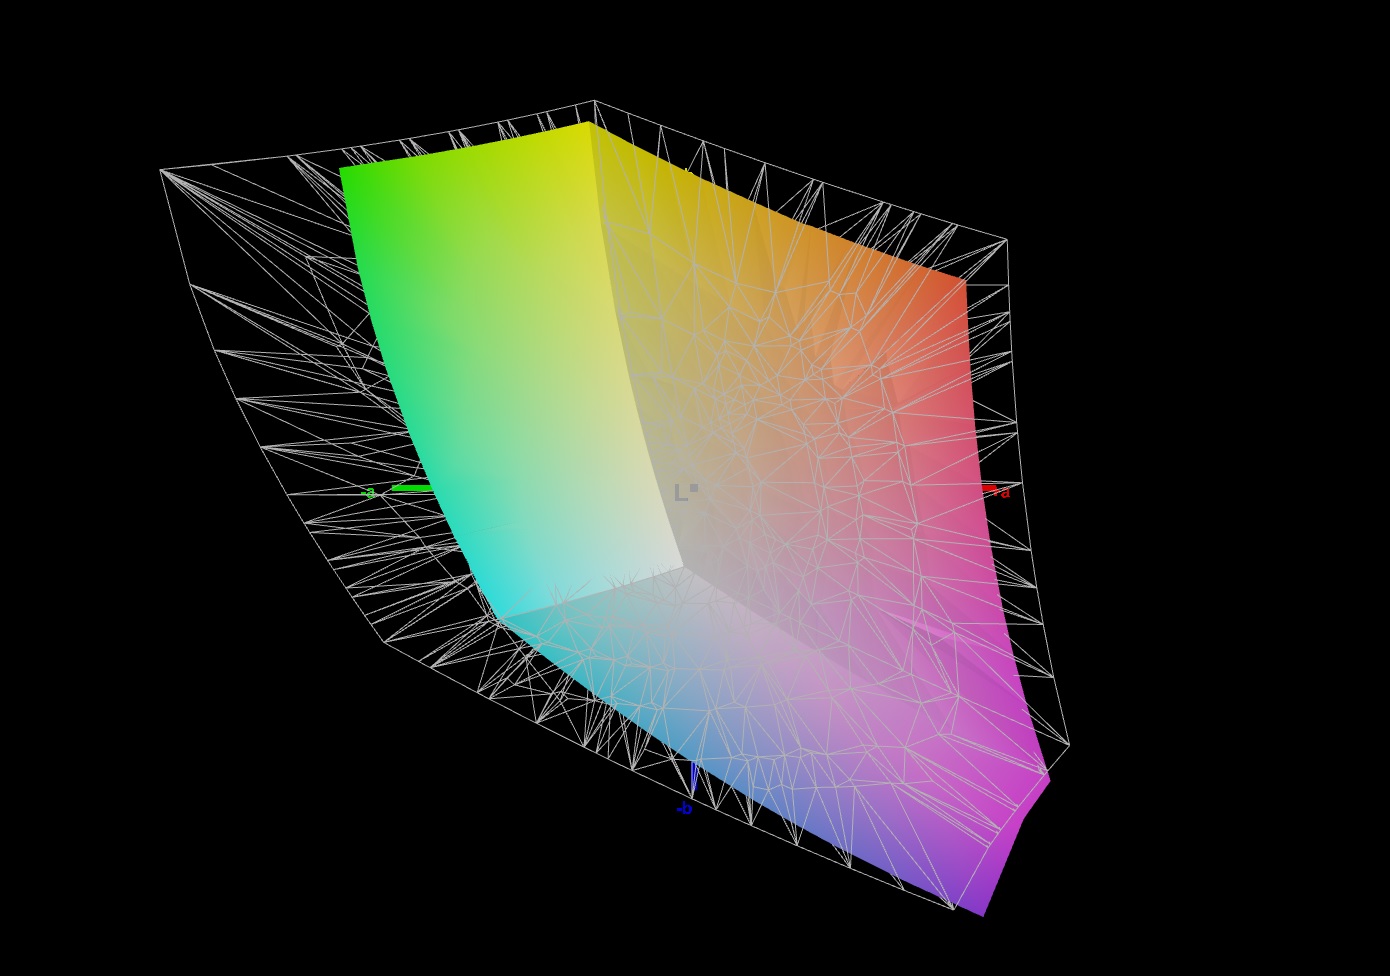
91% sRGB (Argyll 1.6.3 3D)
69% AdobeRGB 1998 (Argyll 1.6.3 3D)
68.8% AdobeRGB 1998 (Argyll 2.2.0 3D)
98.7% sRGB (Argyll 2.2.0 3D)
67.9% Display P3 (Argyll 2.2.0 3D)
Gamma: 2.211
| |||||||||||||||||||||||||
Brightness Distribution: 83 %
Center on Battery: 381 cd/m²
Contrast: 866:1 (Black: 0.44 cd/m²)
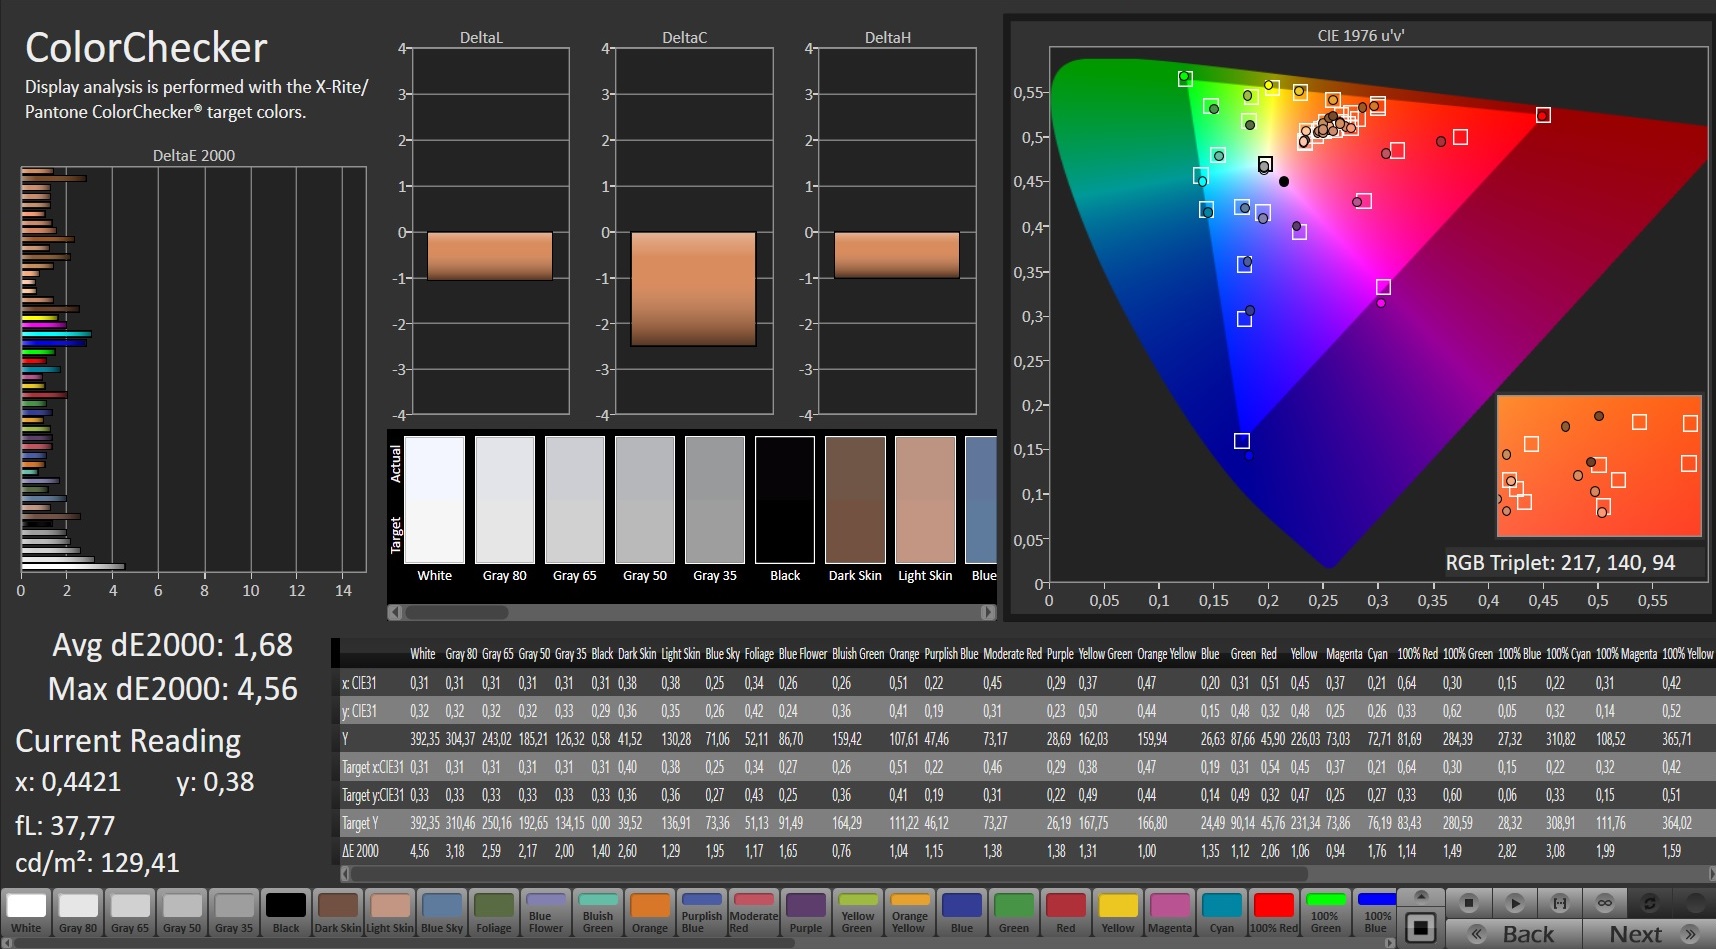
ΔE Color 1.68 | 0.5-29.43 Ø5, calibrated: 1.13
ΔE Greyscale 2 | 0.57-98 Ø5.3
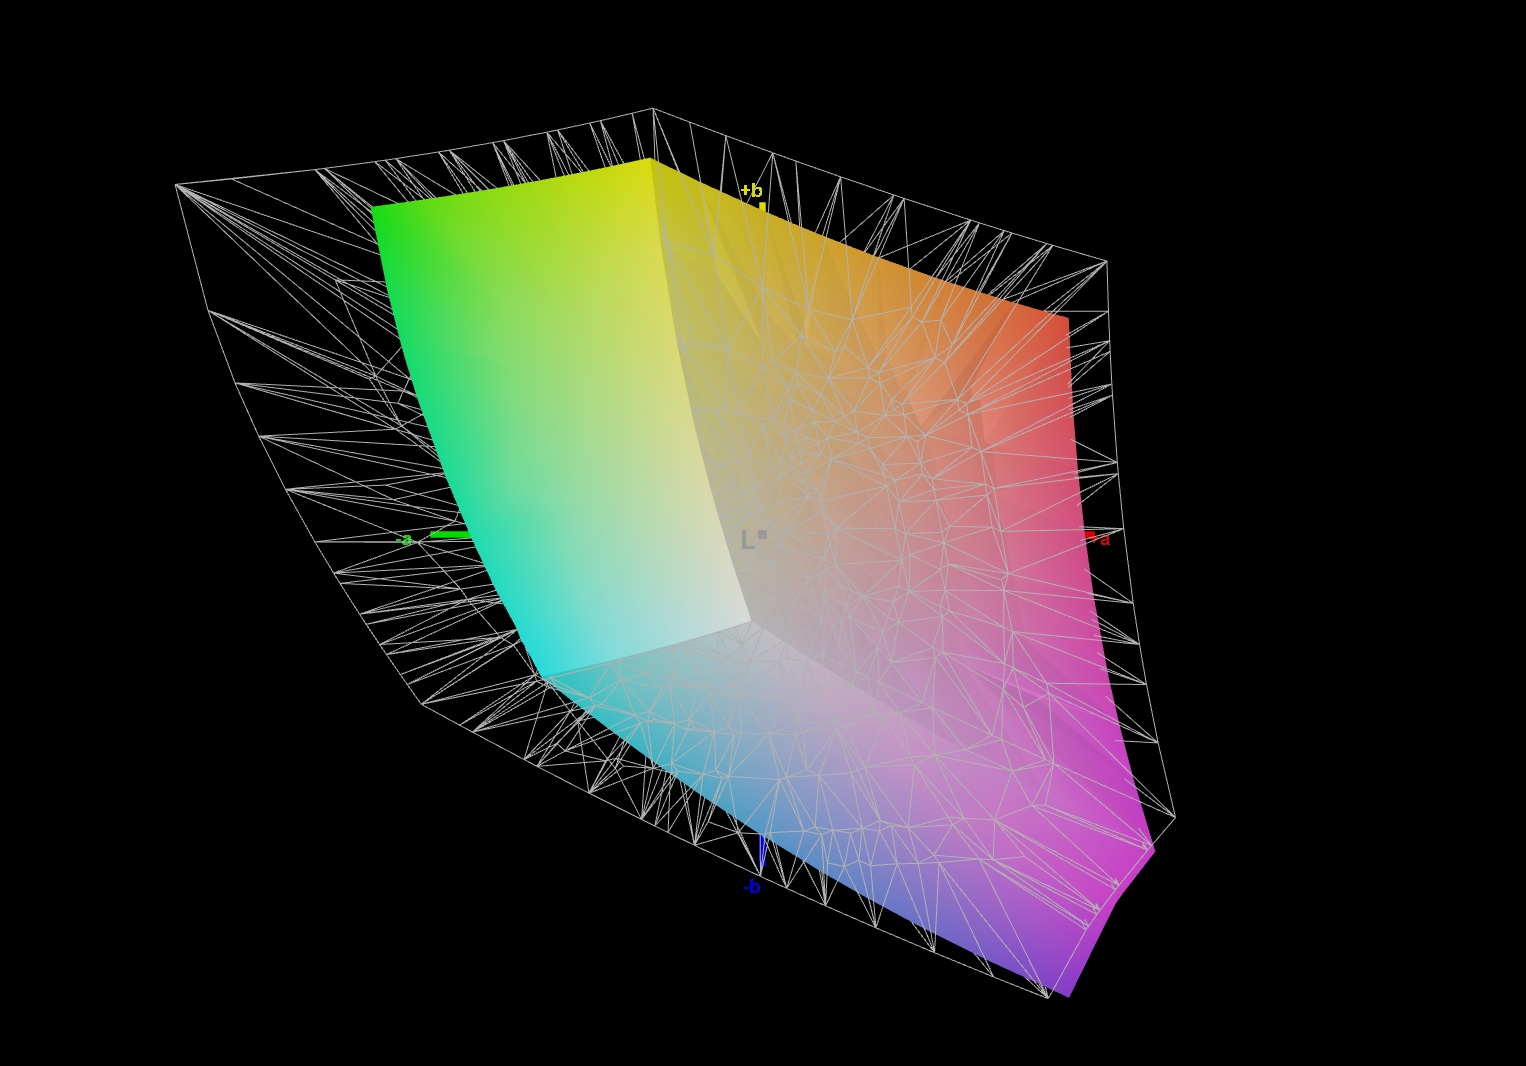
94% sRGB (Argyll 1.6.3 3D)
71% AdobeRGB 1998 (Argyll 1.6.3 3D)
68.8% AdobeRGB 1998 (Argyll 2.2.0 3D)
98.7% sRGB (Argyll 2.2.0 3D)
67.9% Display P3 (Argyll 2.2.0 3D)
Gamma: 2.218
| SCHENKER XMG Neo 15 Comet Lake IPS, 1920x1080, 15.60 | SCHENKER XMG Neo 15 WQHD BOE NE156QHM-NY2, IPS, 2560x1440, 15.60 | SCHENKER XMG Neo 15 XNE15M19 NV156FHM-N4G (BOE084D), IPS, 1920x1080, 15.60 | Razer Blade 15 RTX 2070 Super Max-Q AU Optronics B156HAN12.0, IPS, 1920x1080, 15.60 | Aorus 15G XB Sharp LQ156M1JW03, IGZO, 1920x1080, 15.60 | Asus Zephyrus S15 GX502L B156HAN12.0 (AUOBC8C), IPS, 1920x1080, 15.60 | |
|---|---|---|---|---|---|---|
| Display | 0% | -8% | 0% | -3% | 1% | |
| Display P3 Coverage | 69.5 67.9 | 69.5 0% | 64 -8% | 69.4 0% | 67.2 -3% | 69.7 0% |
| sRGB Coverage | 99.2 98.7 | 99.2 0% | 90.3 -9% | 98.8 0% | 97.8 -1% | 99.7 1% |
| AdobeRGB 1998 Coverage | 70.7 68.8 | 70.7 0% | 65.4 -7% | 70.5 0% | 68 -4% | 71.1 1% |
| Response Times | 8% | 11% | 51% | -4% | 8% | |
| Response Time Grey 50% / Grey 80% * | 15.2 ? | 14.8 ? 3% | 9.6 ? 37% | 3.2 ? 79% | 16 ? -5% | 14 ? 8% |
| Response Time Black / White * | 10.4 ? | 9.2 ? 12% | 12 ? -15% | 8 ? 23% | 11.2 ? -8% | 9.6 ? 8% |
| PWM Frequency | 23580 ? | 23580 ? 0% | ||||
| Screen | 8% | -9% | -8% | 12% | 6% | |
| Brightness middle | 308 | 381 24% | 313 2% | 345.4 12% | 264 -14% | 283 -8% |
| Brightness | 284 | 343 21% | 295 4% | 342 20% | 248 -13% | 289 2% |
| Brightness Distribution | 87 | 83 -5% | 89 2% | 90 3% | 89 2% | 90 3% |
| Black Level * | 0.32 | 0.44 -38% | 0.3 6% | 0.34 -6% | 0.3 6% | 0.24 25% |
| Contrast | 963 | 866 -10% | 1043 8% | 1016 6% | 880 -9% | 1179 22% |
| Colorchecker dE 2000 * | 2.45 | 1.68 31% | 3.33 -36% | 3.18 -30% | 1.21 51% | 2.26 8% |
| Colorchecker dE 2000 max. * | 7.74 | 4.56 41% | 6.25 19% | 6.57 15% | 3.07 60% | 5.64 27% |
| Colorchecker dE 2000 calibrated * | 0.83 | 1.13 -36% | 1.77 -113% | 1.77 -113% | 0.92 -11% | 1.11 -34% |
| Greyscale dE 2000 * | 3.9 | 2 49% | 3.1 21% | 3.8 3% | 1.6 59% | 3.4 13% |
| Gamma | 2.211 100% | 2.218 99% | 2.51 88% | 2.15 102% | 2.192 100% | 2.228 99% |
| CCT | 7434 87% | 6746 96% | 6930 94% | 7109 91% | 6340 103% | 7249 90% |
| Color Space (Percent of AdobeRGB 1998) | 69 | 71 3% | 59 -14% | 64.3 -7% | 68 -1% | 71 3% |
| Color Space (Percent of sRGB) | 91 | 94 3% | 90 -1% | 99 9% | 90 -1% | 93 2% |
| Total Average (Program / Settings) | 5% /
6% | -2% /
-7% | 14% /
1% | 2% /
6% | 5% /
5% |
* ... smaller is better
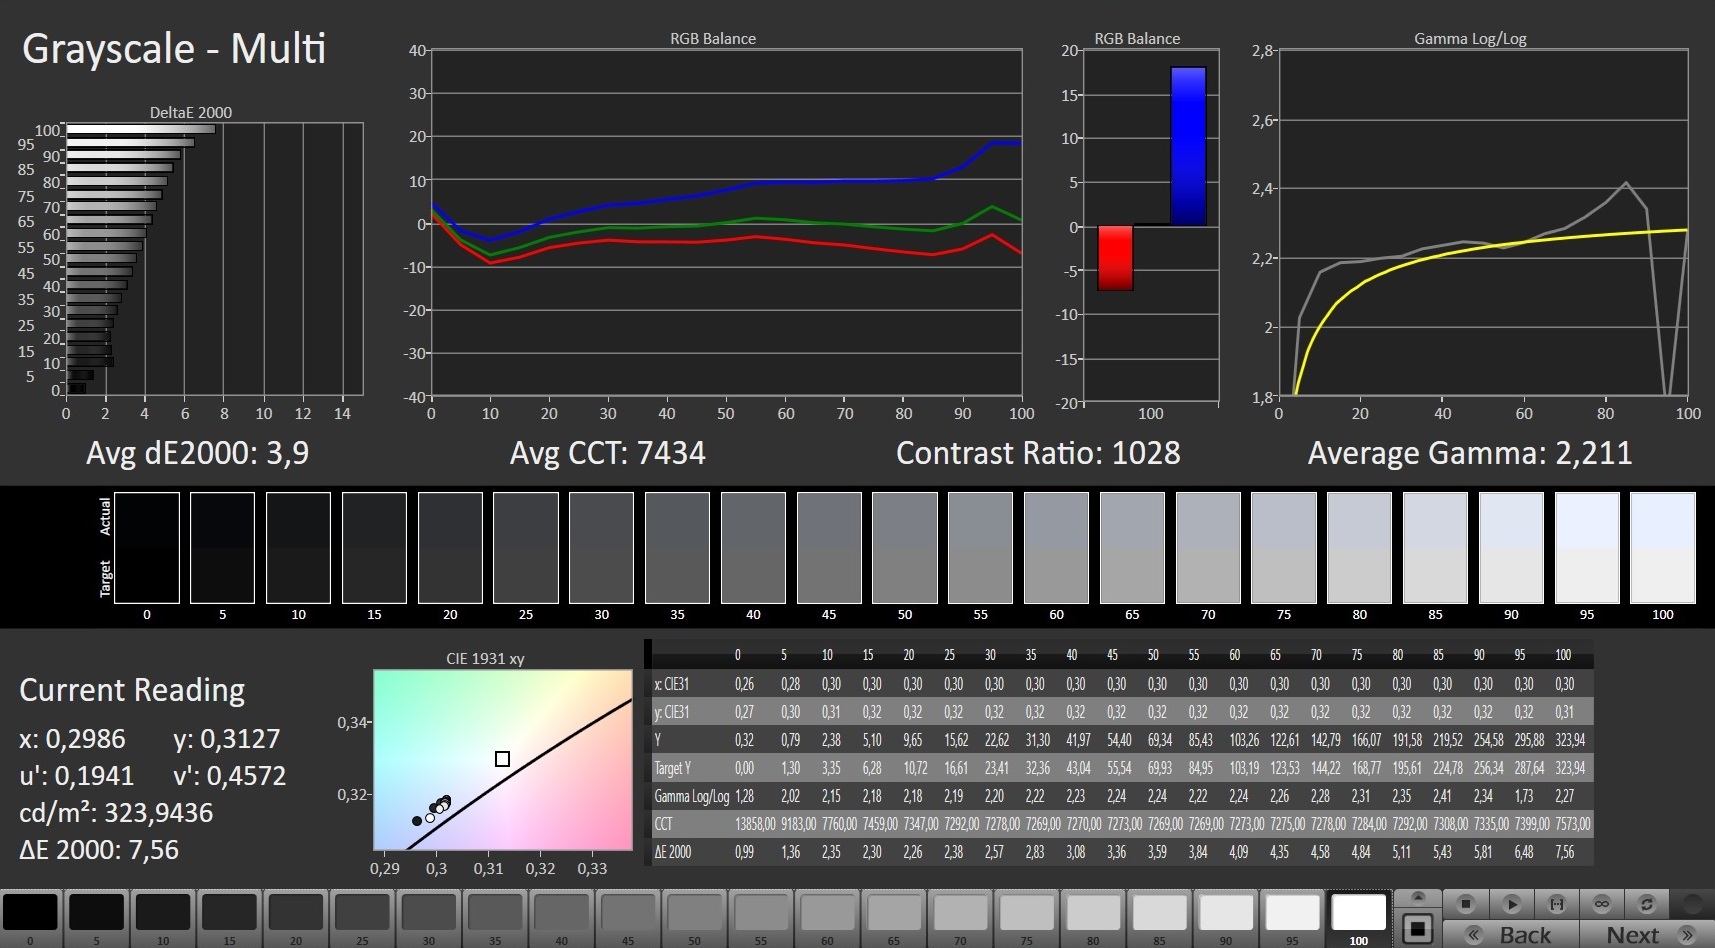
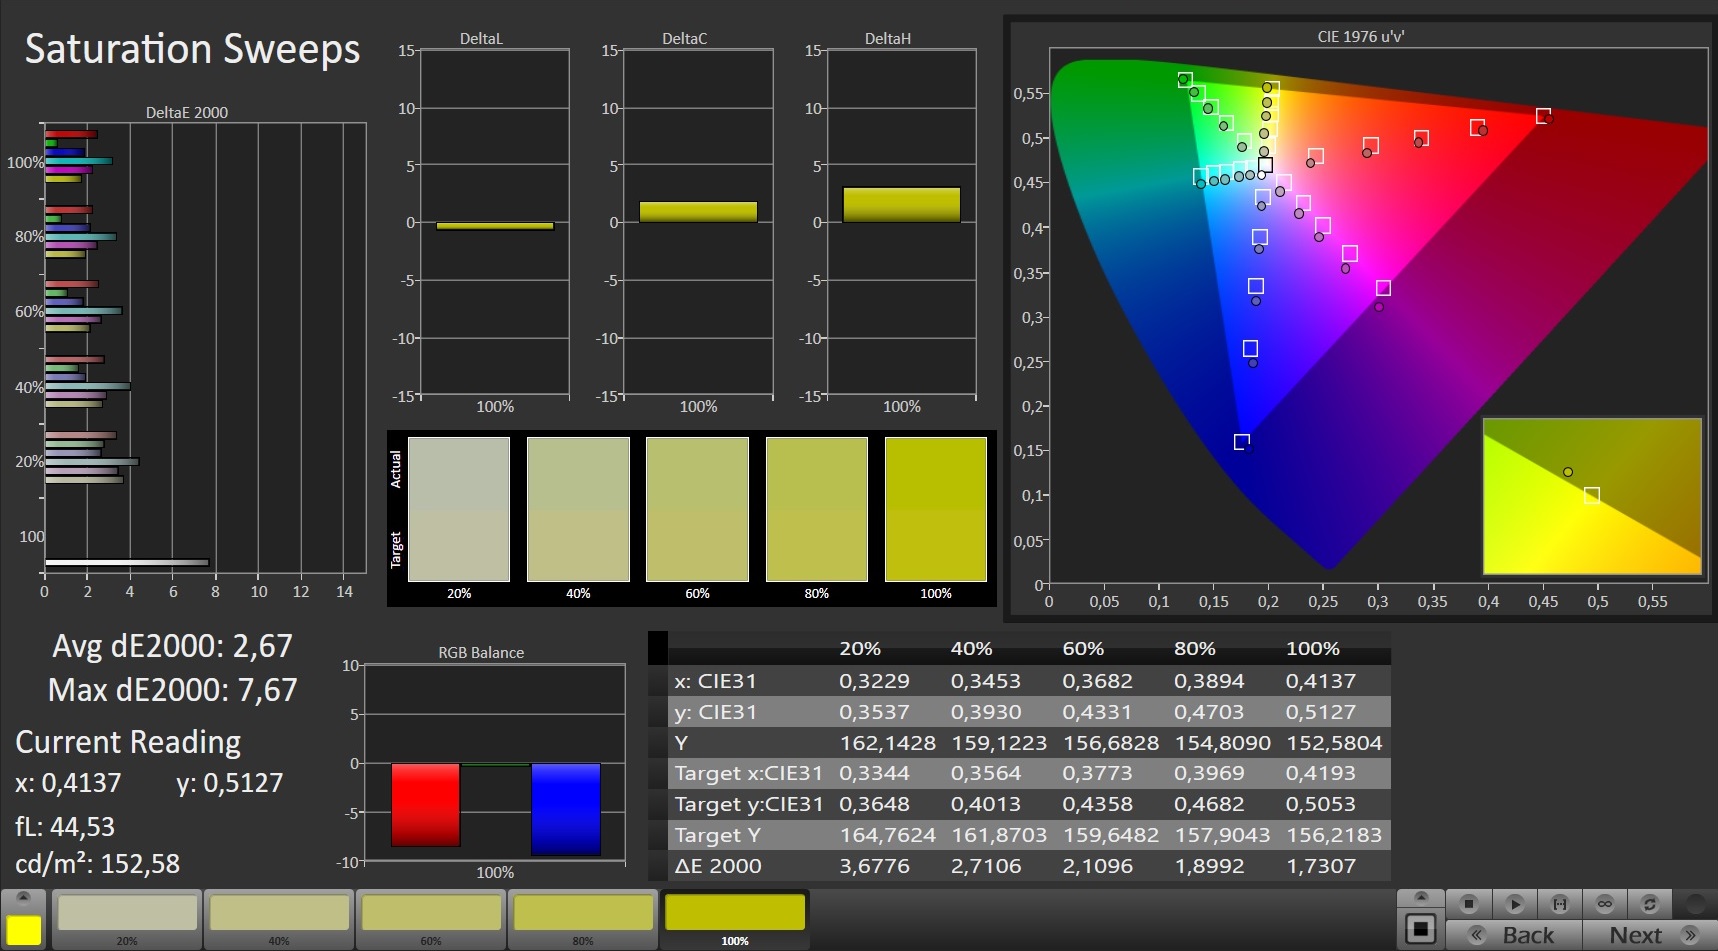
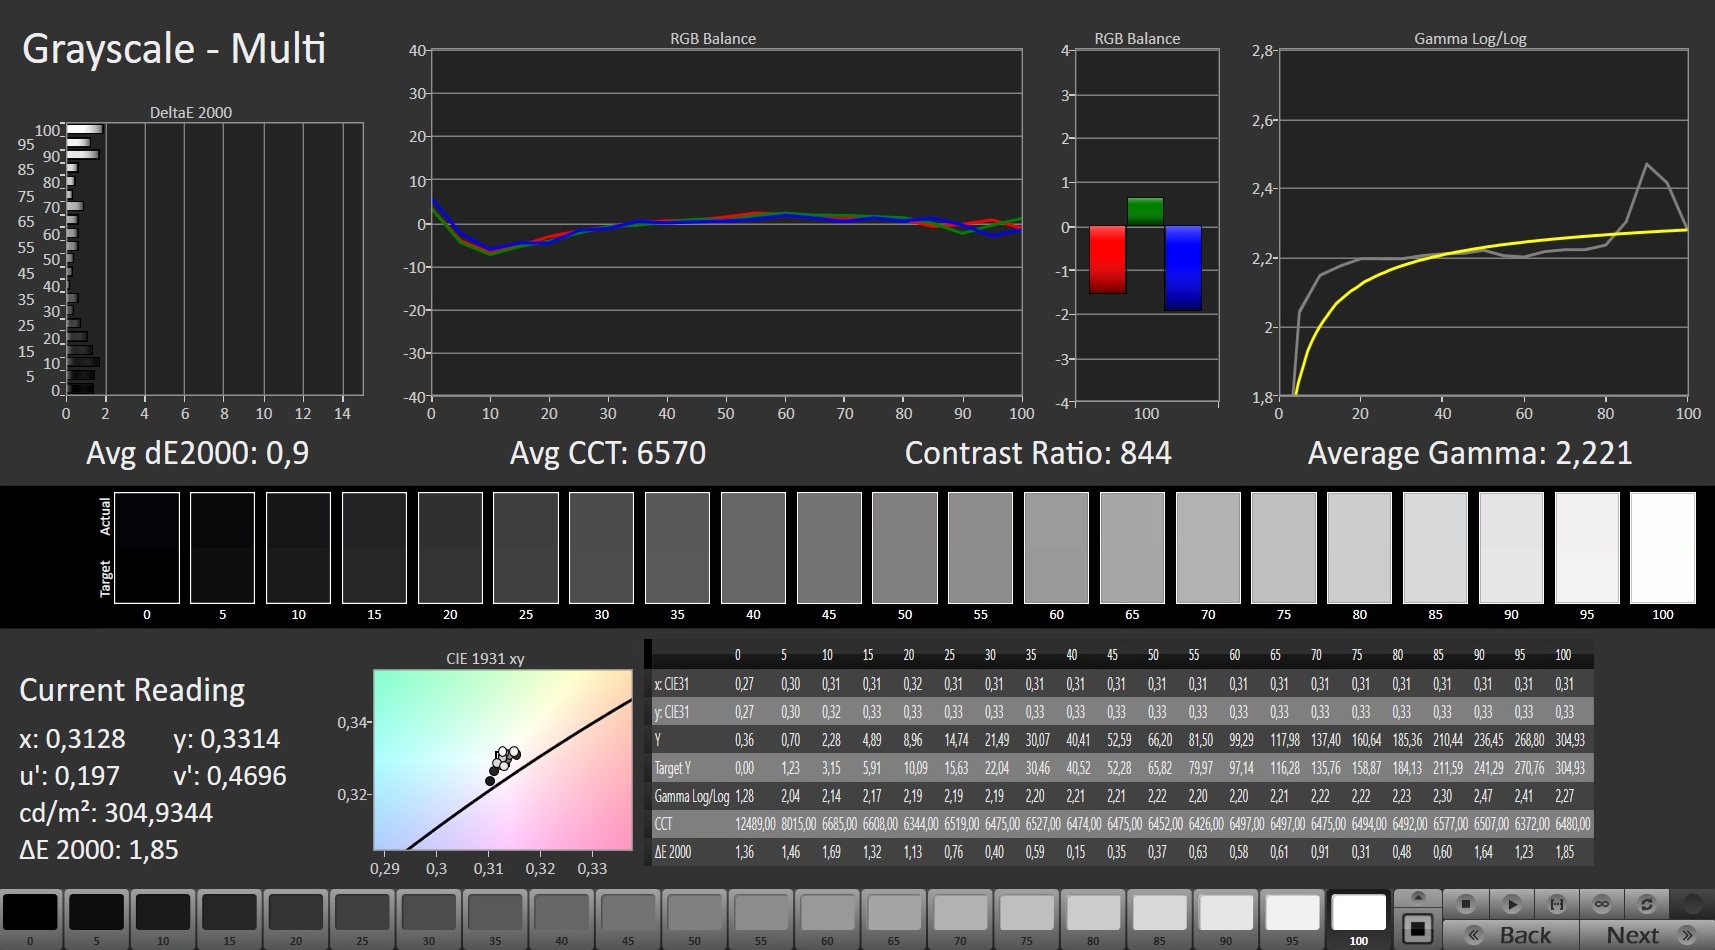
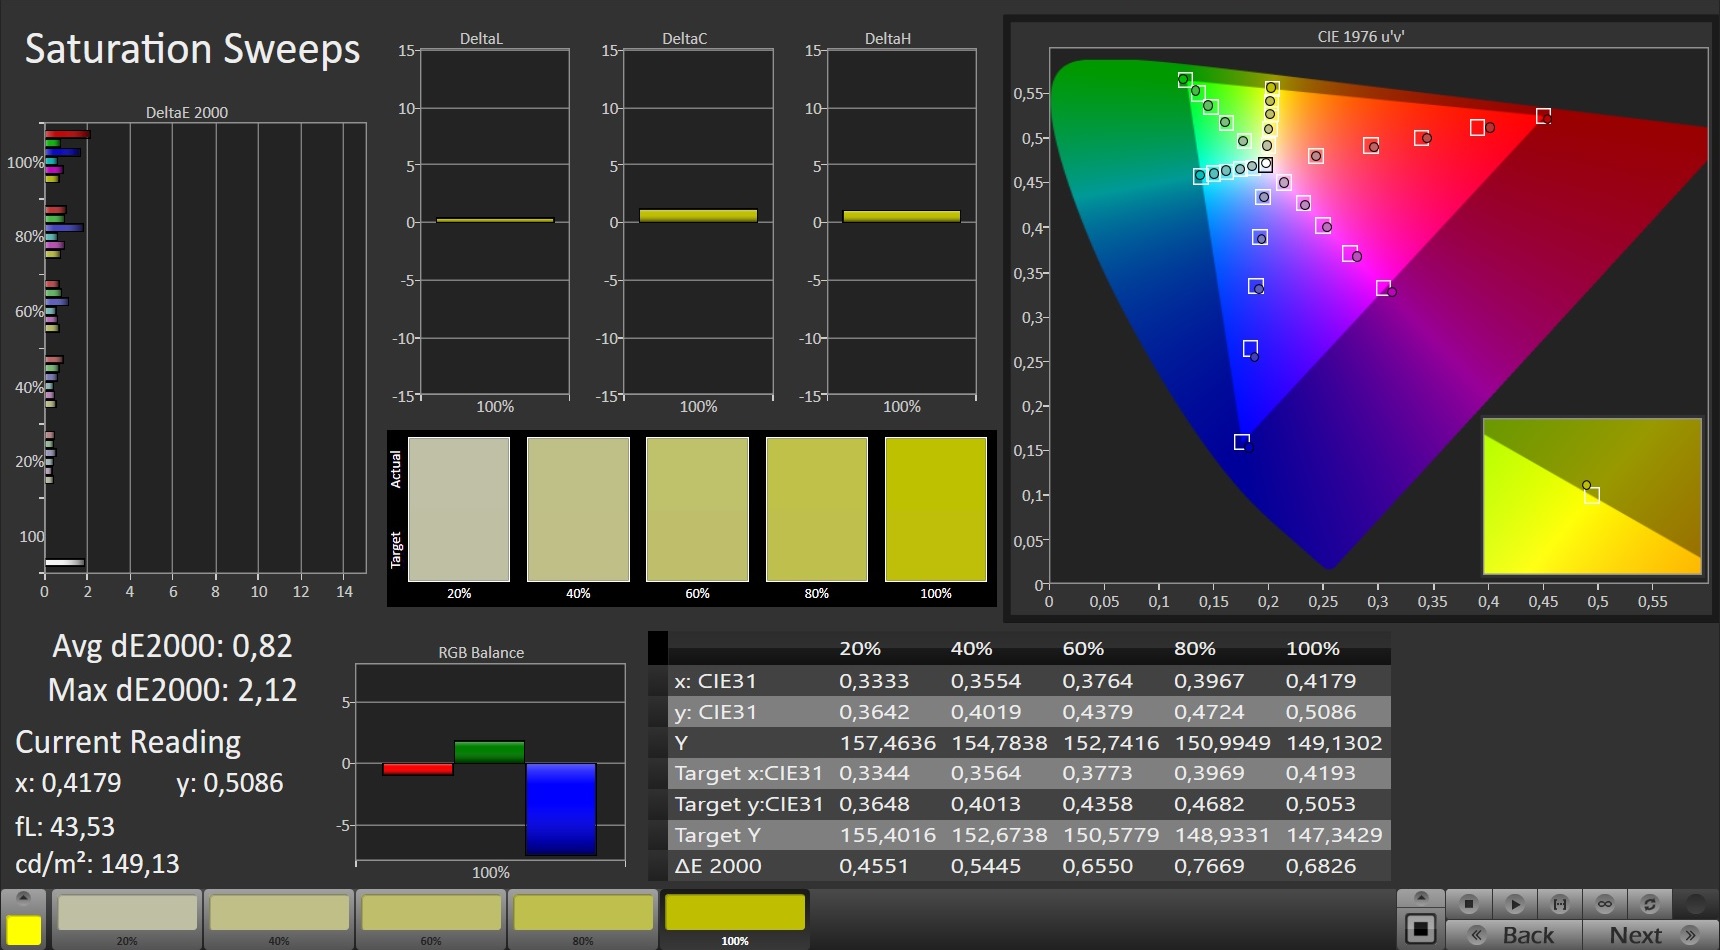
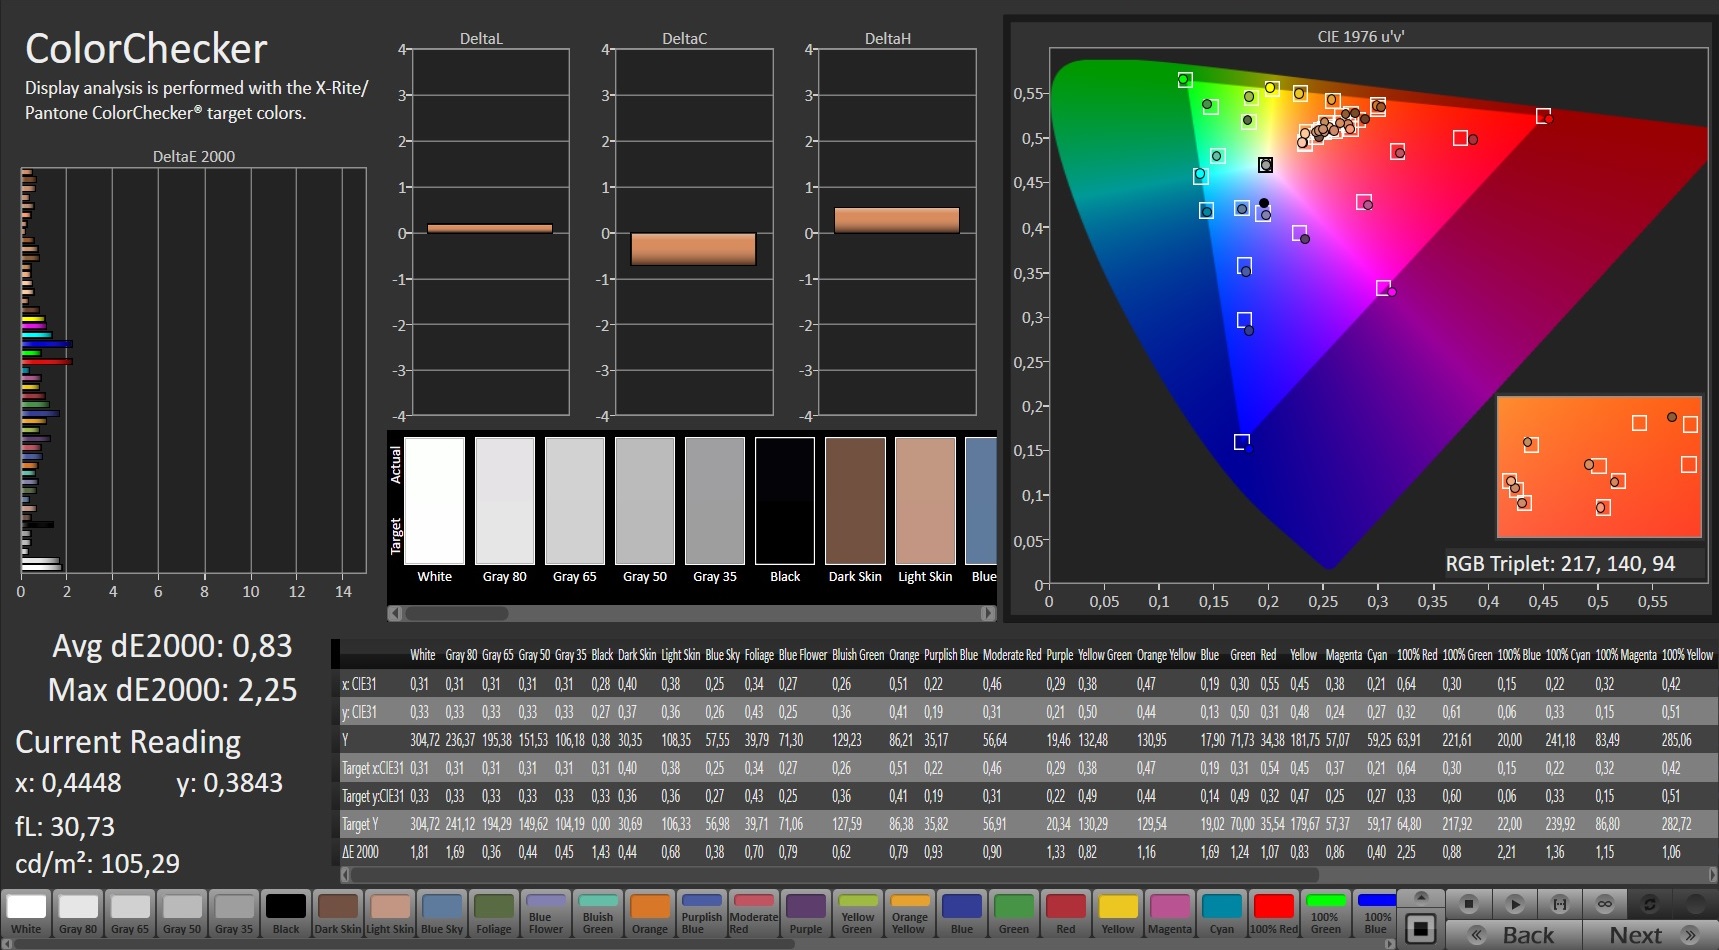
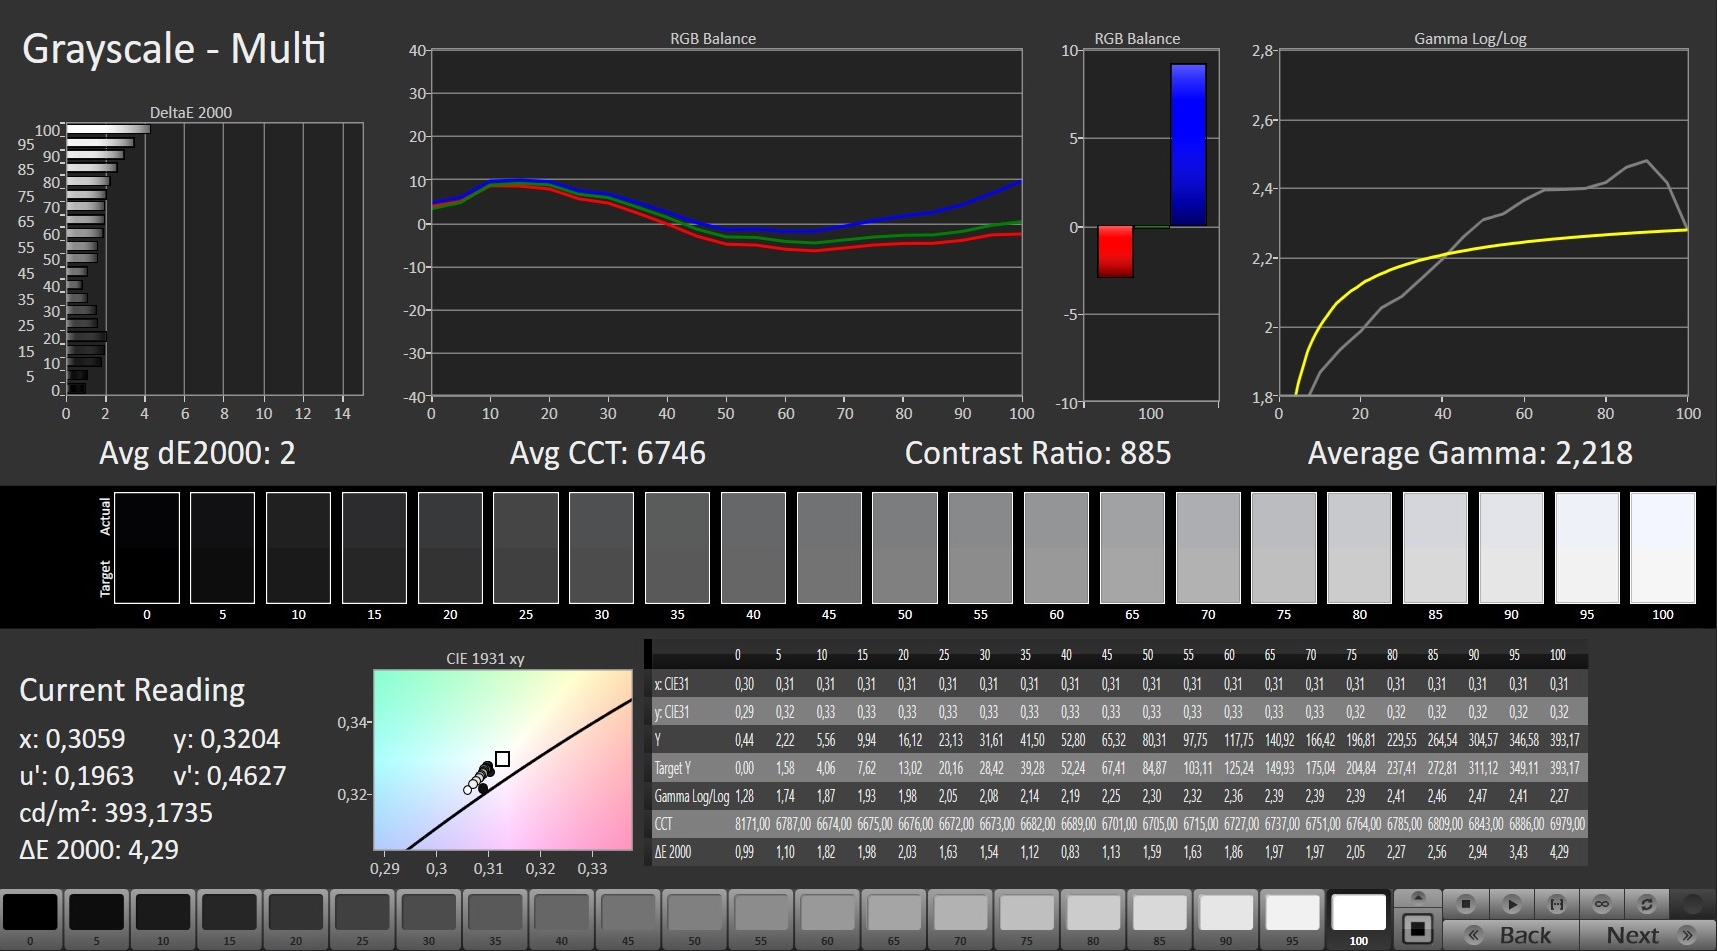
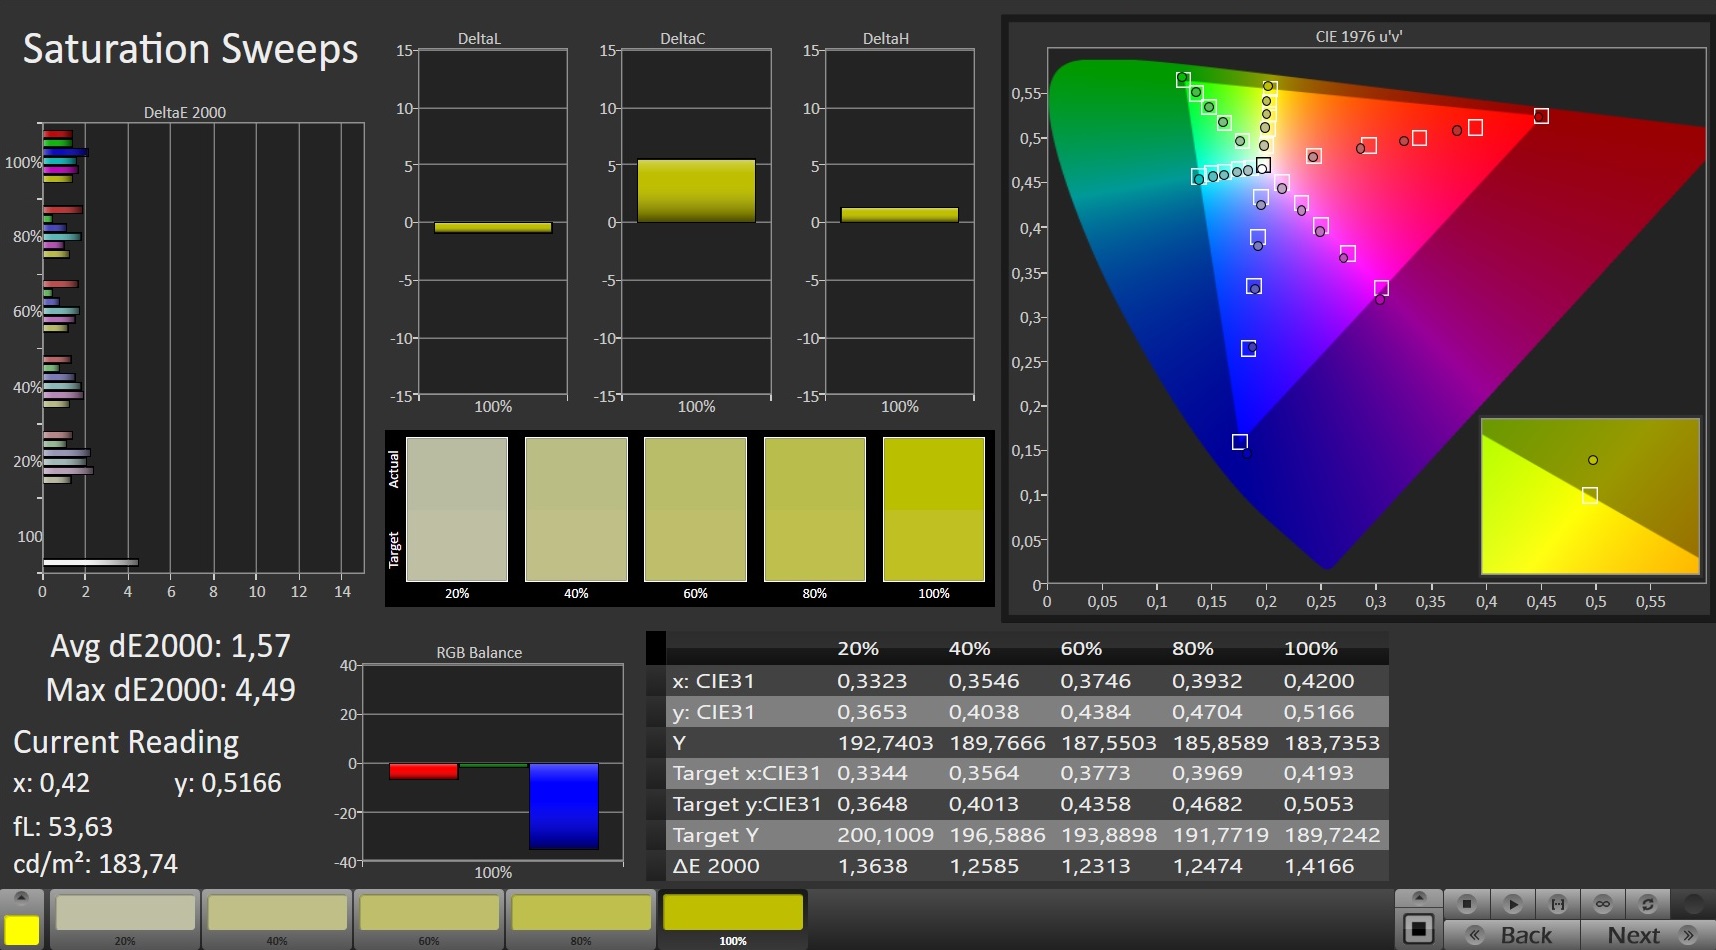
The IPS panel of the Schenker Neo 15 offers a medium contrast ratio of 963:1 and a slightly increased black level of 0.32 cd/m². In combination with the color-space coverage of 91% (sRGB) it reaches the level of our test field, which is led by the Asus ROG Zephyrus S15.
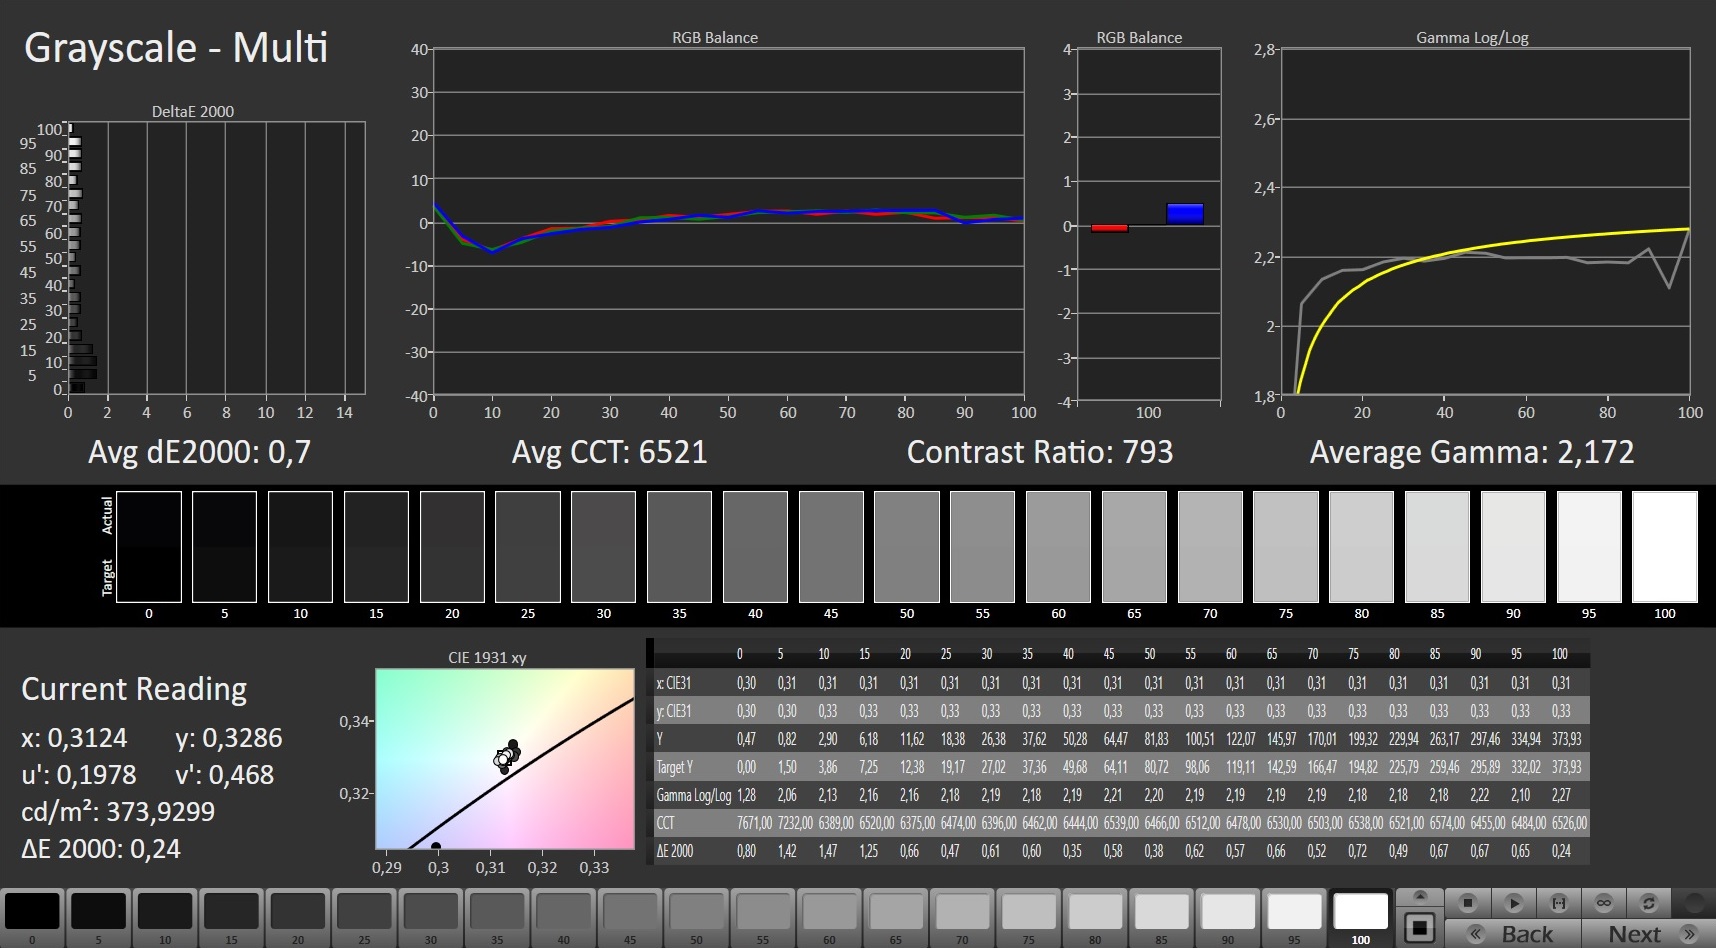
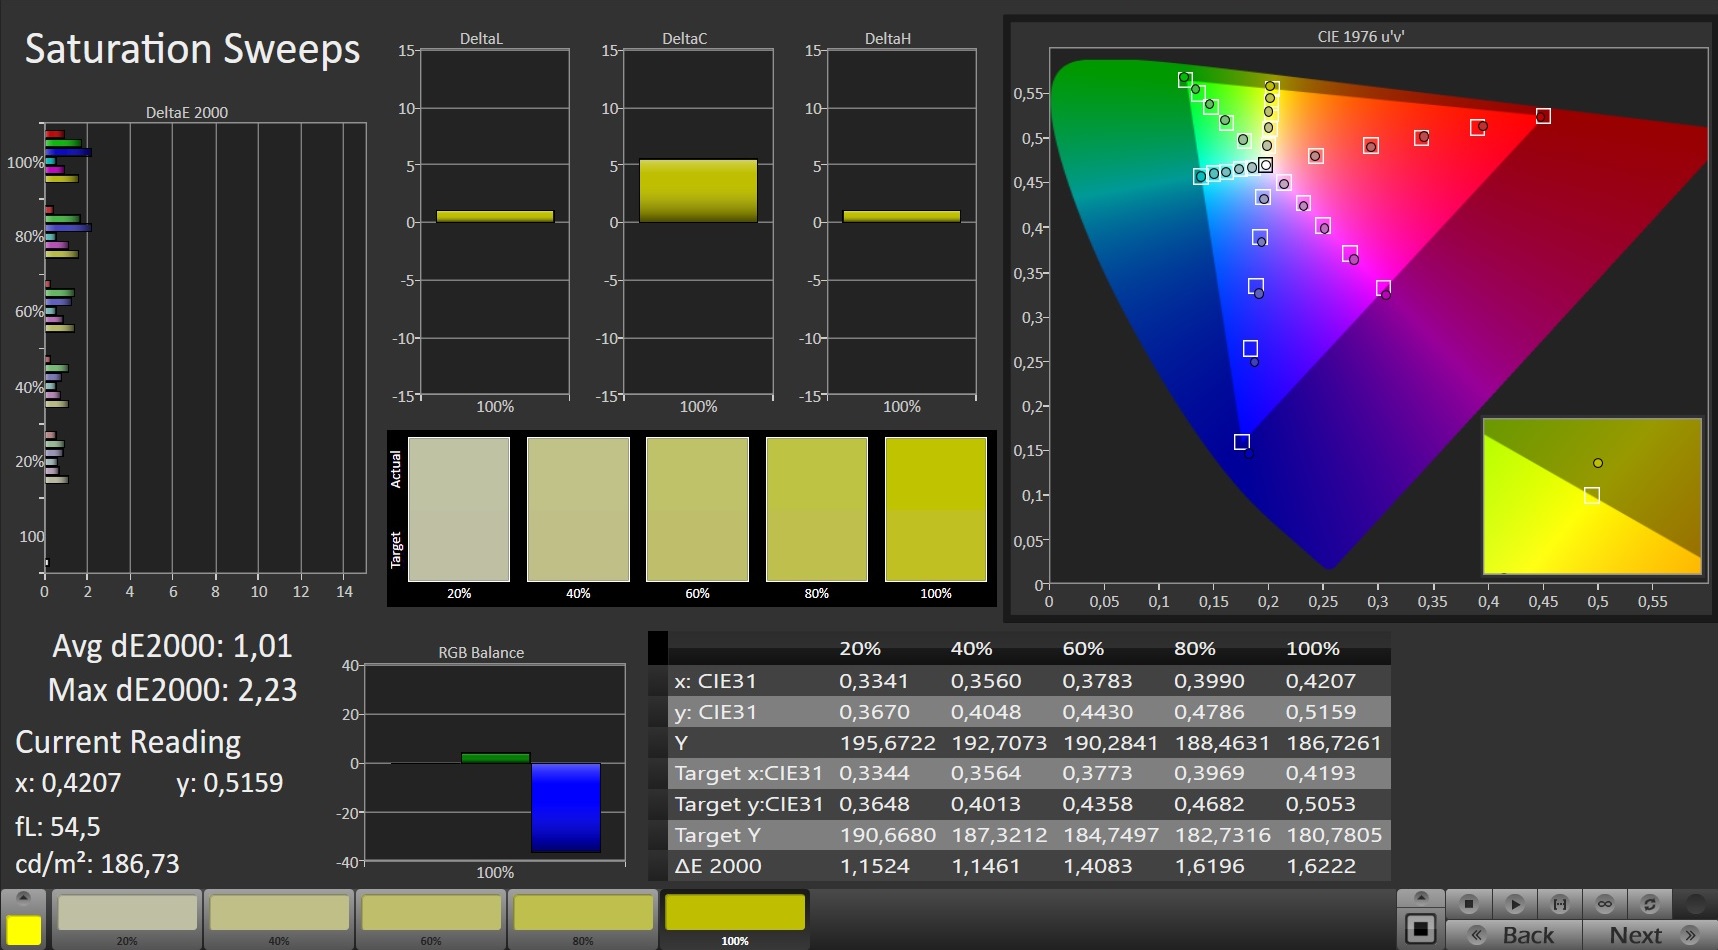
The CalMAN analysis also shows that colors are displayed with a slightly increased blue content ex works. However, this situation can be completely compensated for by calibration. The corresponding ICC file can be downloaded in the top right window next to the graphic for screen illumination.

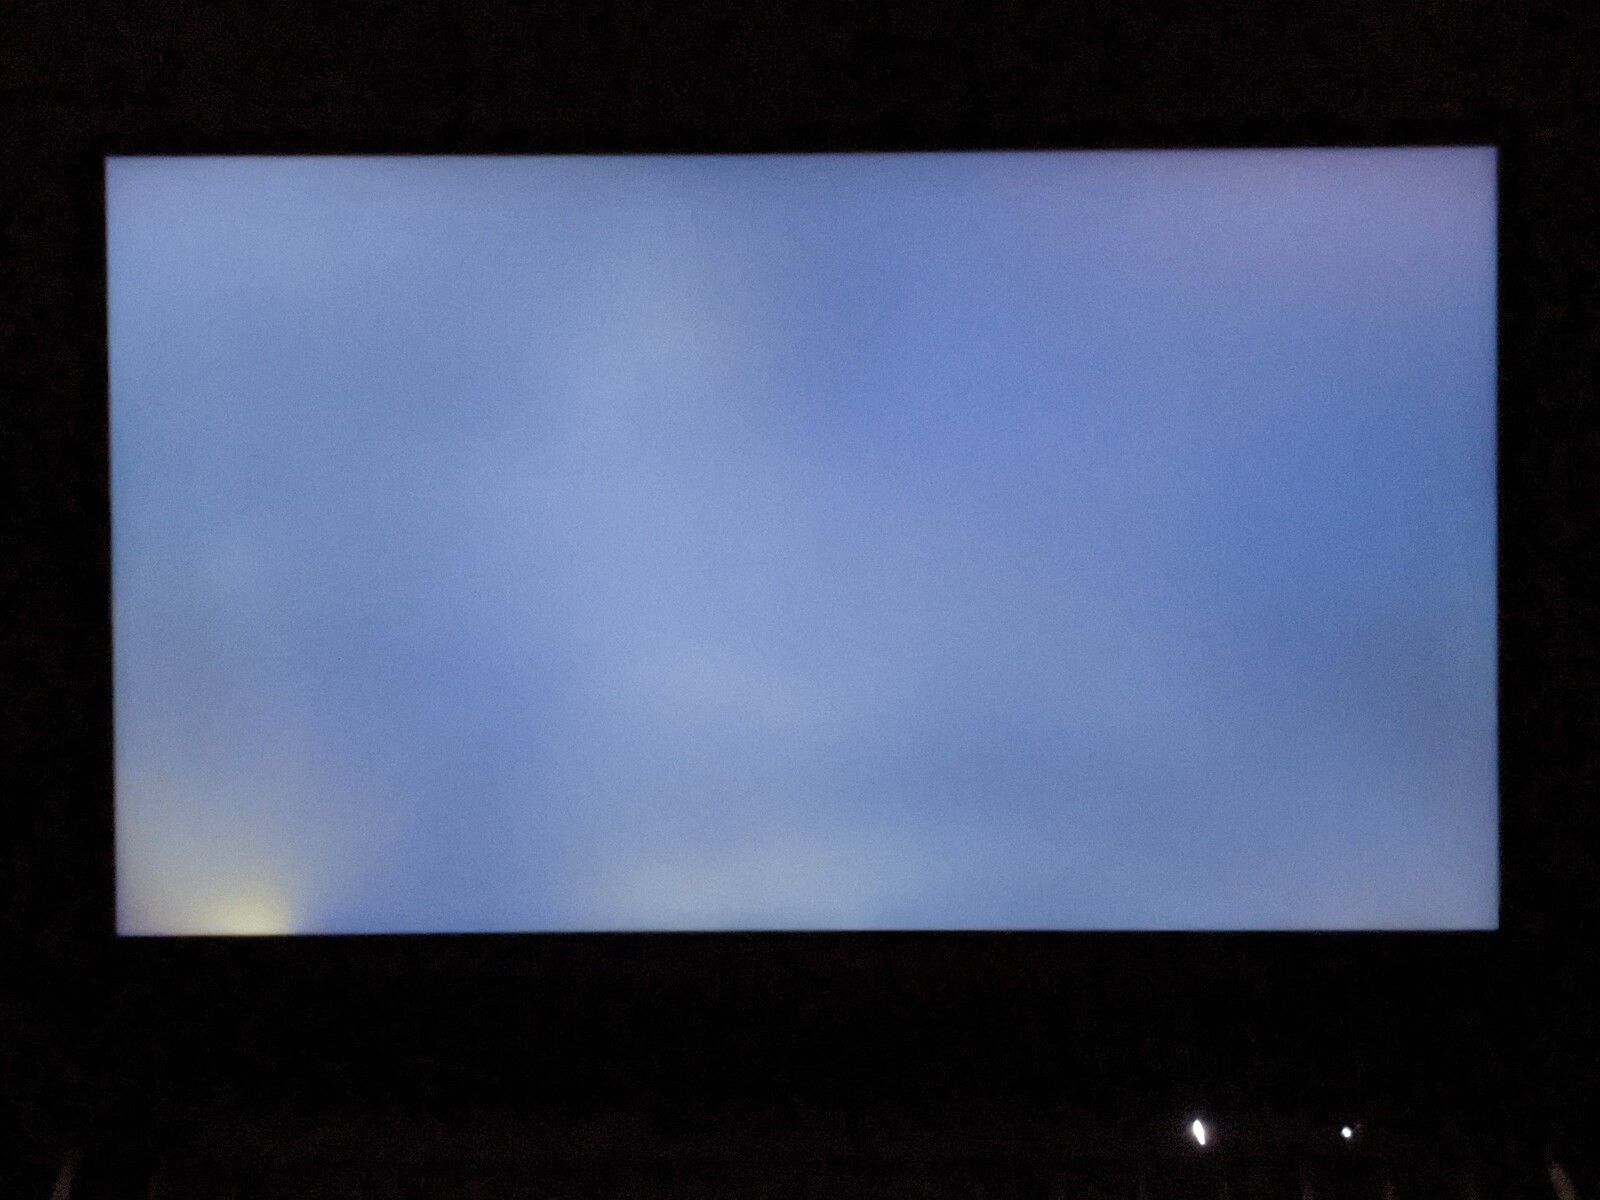
Outdoors, the Schenker XMG Neo 15 is particularly suitable for use on cloudy days. However, the brightness is not high enough for working in direct sunlight.
Display Response Times
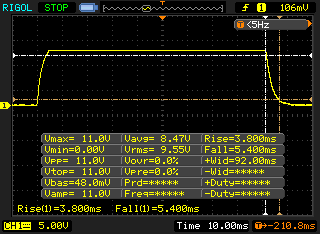
| ↔ Response Time Black to White | ||
|---|---|---|
| 10.4 ms ... rise ↗ and fall ↘ combined | ↗ 5.2 ms rise | 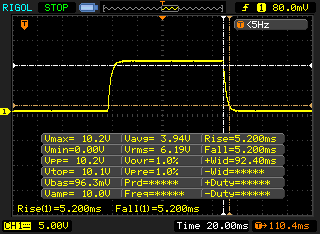 |
| ↘ 5.2 ms fall | ||
| The screen shows good response rates in our tests, but may be too slow for competitive gamers. In comparison, all tested devices range from 0.1 (minimum) to 240 (maximum) ms. » 23 % of all devices are better. This means that the measured response time is better than the average of all tested devices (21.5 ms). | ||
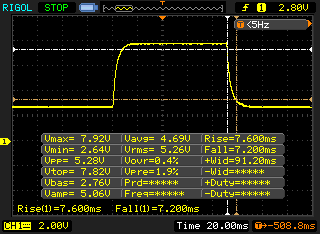
| ↔ Response Time 50% Grey to 80% Grey | ||
| 15.2 ms ... rise ↗ and fall ↘ combined | ↗ 7.6 ms rise | 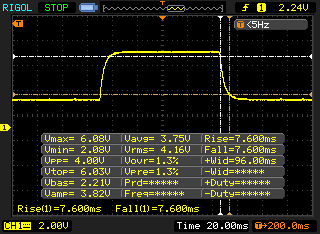 |
| ↘ 7.6 ms fall | ||
| The screen shows good response rates in our tests, but may be too slow for competitive gamers. In comparison, all tested devices range from 0.2 (minimum) to 636 (maximum) ms. » 24 % of all devices are better. This means that the measured response time is better than the average of all tested devices (33.7 ms). | ||
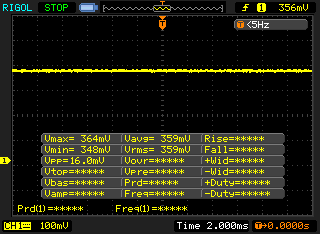
Screen Flickering / PWM (Pulse-Width Modulation)
| Screen flickering / PWM detected | 23580 Hz | ≤ 25 % brightness setting | 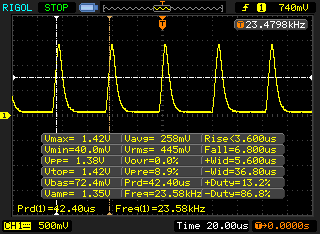 |
The display backlight flickers at 23580 Hz (worst case, e.g., utilizing PWM) Flickering detected at a brightness setting of 25 % and below. There should be no flickering or PWM above this brightness setting. The frequency of 23580 Hz is quite high, so most users sensitive to PWM should not notice any flickering. In comparison: 53 % of all tested devices do not use PWM to dim the display. If PWM was detected, an average of 17900 (minimum: 5 - maximum: 3846000) Hz was measured. | |||
The IPS panel of the Schenker notebook is very stable in terms of viewing angle. Content can be viewed from very flat angles without being distorted or displayed with distorted colors.
Update: Results of the WQHD-Panel (165 Hz)
Performance - Comet-Lake upgrade is worth it
With the XMG Neo 15, Schenker is targeting gamers who are looking for a compact notebook with plenty of power. The available hardware, which has been refreshed with our current test model, is also oriented towards this.
Processor
The Schenker XMG Neo 15 is now also available with an Intel Core i7-10875H. This processor belongs to Intel's Comet Lake generation and offers eight cores that can process up to 16 threads at clock rates between 2.3 and 5 GHz. How long the maximum performance can be maintained is significantly influenced by the cooling system.
Our continuous load test shows that the performance drops relatively quickly by about 4%. However, the Neo 15 is on par with the competition we chose, which also works with a Core i7-10875H. Compared to the XMG Neo 15 with Intel Core i7-9750H, a particularly strong increase in CPU performance is noticeable.
* ... smaller is better
System Performance
In the sub-disciplines of PCMark 10, the Neo 15 achieves values that are above the average of the installed hardware. Only the Productivity result is somewhat lower. Overall, the gaming laptop can secure second place in our test field. In everyday testing, the Schenker notebook ran smoothly at all times and showed no micro-jerking or similar.
| PCMark 10 Score | 5933 points | |
Help | ||
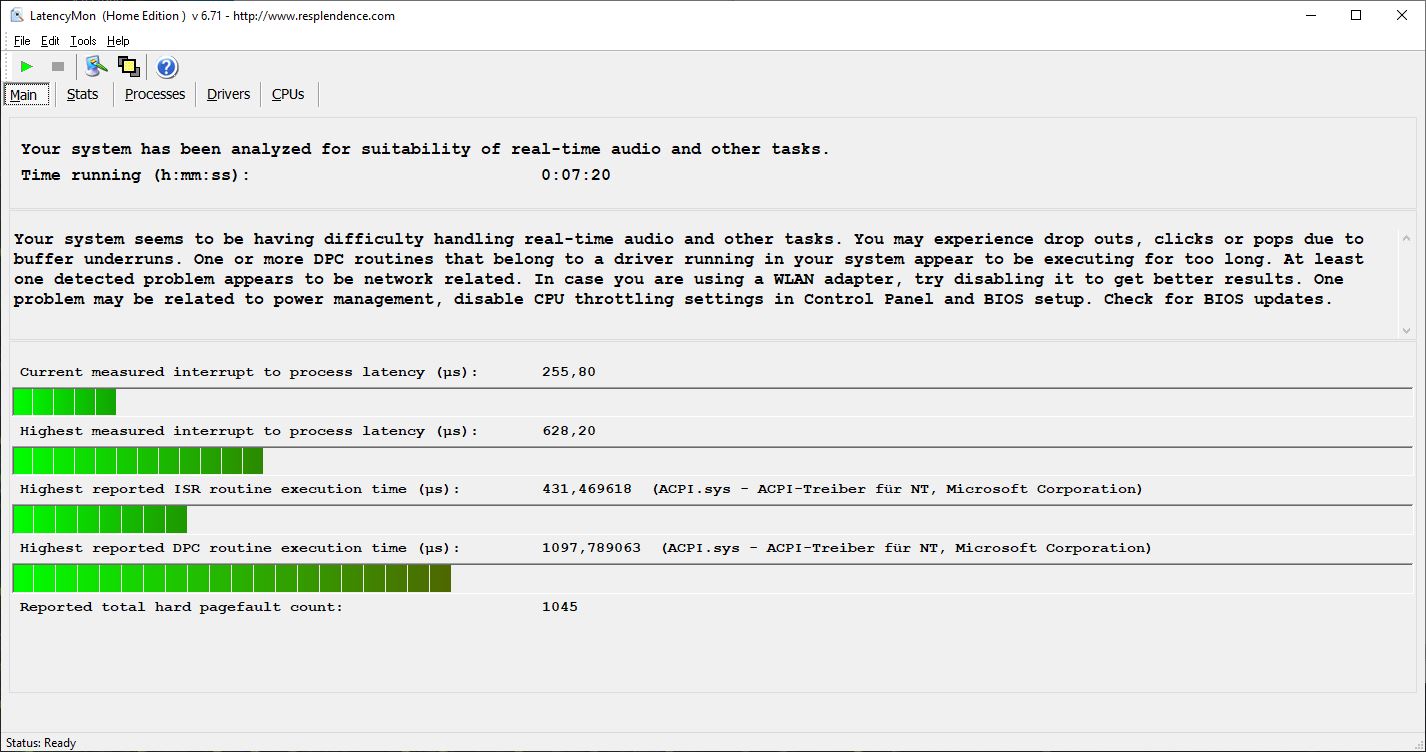
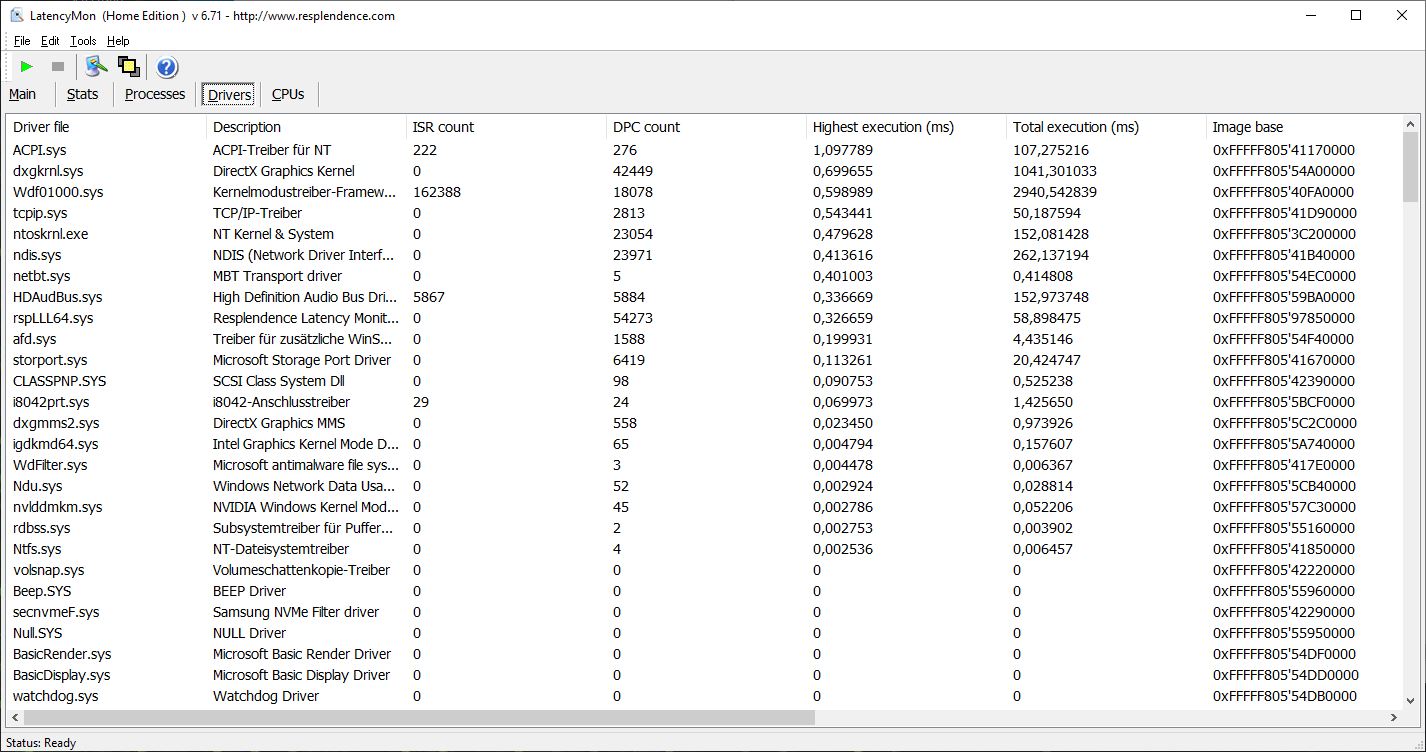
DPC latencies
In the test with LatencyMon, the Schenker XMG Neo 15 shows the lowest delay time in our test field.
| DPC Latencies / LatencyMon - interrupt to process latency (max), Web, Youtube, Prime95 | |
| Asus Zephyrus S15 GX502L | |
| Aorus 15G XB | |
| Razer Blade 15 RTX 2070 Super Max-Q | |
| SCHENKER XMG Neo 15 Comet Lake | |
* ... smaller is better
Mass Storage
Schenker has installed a 1 TB Samsung SSD 970 EVO Plus in our test model of the XMG Neo 15. This delivers very good read and write rates and can therefore leave the assembled competition behind. However, when configuring their laptop, users have the choice between other models and manufacturers, which ultimately also affects the purchase price.
How other mass storage devices compare to the Samsung 970 EVO Plus is shown in our HDD/SSD benchmark list.
| SCHENKER XMG Neo 15 Comet Lake Samsung SSD 970 EVO Plus 1TB | SCHENKER XMG Neo 15 XNE15M19 Seagate FireCuda 510 SSD ZP1000GM30001 | Razer Blade 15 RTX 2070 Super Max-Q Samsung SSD PM981a MZVLB512HBJQ | Aorus 15G XB Samsung SSD PM981a MZVLB512HBJQ | Asus Zephyrus S15 GX502L WDC PC SN730 SDBPNTY-1T00 | Average Samsung SSD 970 EVO Plus 1TB | |
|---|---|---|---|---|---|---|
| CrystalDiskMark 5.2 / 6 | -29% | -14% | -18% | -21% | -8% | |
| Write 4K | 182.6 | 108.7 -40% | 139.8 -23% | 121.6 -33% | 127.4 -30% | 155.5 ? -15% |
| Read 4K | 53.5 | 41.4 -23% | 48.62 -9% | 44.37 -17% | 46.38 -13% | 51.6 ? -4% |
| Write Seq | 3035 | 1083 -64% | 2260 -26% | 2617 -14% | 2034 -33% | 2660 ? -12% |
| Read Seq | 2520 | 917 -64% | 2135 -15% | 1297 -49% | 2172 -14% | 2390 ? -5% |
| Write 4K Q32T1 | 524 | 468.5 -11% | 499.3 -5% | 499 -5% | 413.7 -21% | 447 ? -15% |
| Read 4K Q32T1 | 617 | 530 -14% | 552 -11% | 557 -10% | 354 -43% | 544 ? -12% |
| Write Seq Q32T1 | 3316 | 3057 -8% | 2960 -11% | 2978 -10% | 3063 -8% | 3296 ? -1% |
| Read Seq Q32T1 | 3548 | 3422 -4% | 3269 -8% | 3360 -5% | 3396 -4% | 3551 ? 0% |
| AS SSD | -16% | -54% | -28% | -26% | -10% | |
| Seq Read | 2970 | 2341 -21% | 1957 -34% | 1795 -40% | 2714 -9% | 2800 ? -6% |
| Seq Write | 2559 | 2575 1% | 2092 -18% | 2724 6% | 928 -64% | 2633 ? 3% |
| 4K Read | 56.6 | 51 -10% | 50.2 -11% | 49.67 -12% | 42.83 -24% | 51.2 ? -10% |
| 4K Write | 145 | 118.6 -18% | 96.5 -33% | 109.3 -25% | 120.5 -17% | 131.2 ? -10% |
| 4K-64 Read | 1938 | 1637 -16% | 1594 -18% | 1284 -34% | 978 -50% | 1839 ? -5% |
| 4K-64 Write | 2307 | 2442 6% | 2005 -13% | 1962 -15% | 2797 21% | 2144 ? -7% |
| Access Time Read * | 0.035 | 0.066 -89% | 0.057 -63% | 0.063 -80% | 0.057 -63% | 0.04528 ? -29% |
| Access Time Write * | 0.025 | 0.028 -12% | 0.112 -348% | 0.034 -36% | 0.032 -28% | 0.03128 ? -25% |
| Score Read | 2291 | 1922 -16% | 1840 -20% | 1513 -34% | 1292 -44% | 2171 ? -5% |
| Score Write | 2708 | 2818 4% | 2310 -15% | 2344 -13% | 3011 11% | 2539 ? -6% |
| Score Total | 6152 | 5738 -7% | 5103 -17% | 4685 -24% | 4881 -21% | 5812 ? -6% |
| Total Average (Program / Settings) | -23% /
-21% | -34% /
-37% | -23% /
-24% | -24% /
-24% | -9% /
-9% |
* ... smaller is better

Continuous read: DiskSpd Read Loop, Queue Depth 8
Graphics card
In our test configuration, Schenker uses an Nvidia GeForce RTX 2070 Super, whose performance in the 3DMark benchmarks is on par with other notebooks with this graphics card. However, buyers can also opt for an Nvidia GeForce RTX 2070 Refresh, which lowers the purchase price of the laptop by about 200 Euros (~$239).
How other graphics cards performed in our test can be seen in our GPU benchmark list.
| 3DMark 11 Performance | 24715 points | |
| 3DMark Fire Strike Score | 19216 points | |
| 3DMark Time Spy Score | 8153 points | |
Help | ||
Gaming Performance
The Nvidia GeForce RTX 2070 Super installed here can bring current games smoothly and with high detail levels to the screen. In the titles we tested, we achieved consistently high frame rates, which are maintained without major breakdowns.
What performance can be expected in further titles, we have listed in our GPU game list.
| The Witcher 3 - 1920x1080 Ultra Graphics & Postprocessing (HBAO+) | |
| Average of class Gaming (8.61 - 216, n=226, last 2 years) | |
| Average NVIDIA GeForce RTX 2070 Super Mobile (76.3 - 94.6, n=8) | |
| SCHENKER XMG Neo 15 Comet Lake | |
| Asus Zephyrus S15 GX502L | |
| Aorus 15G XB | |
| Razer Blade 15 RTX 2070 Super Max-Q | |
| SCHENKER XMG Neo 15 XNE15M19 | |
| Far Cry 5 - 1920x1080 Ultra Preset AA:T | |
| Average of class Gaming (14 - 218, n=125, last 2 years) | |
| SCHENKER XMG Neo 15 Comet Lake | |
| Average NVIDIA GeForce RTX 2070 Super Mobile (98 - 112, n=2) | |
| Asus Zephyrus S15 GX502L | |
Our continuous load test with the Ultra settings in The Witcher 3 shows that players do not have to expect a drop in performance even after a long time.
| low | med. | high | ultra | |
| The Witcher 3 (2015) | 84.4 | |||
| Dota 2 Reborn (2015) | 154 | 137 | 127 | 122 |
| X-Plane 11.11 (2018) | 113 | 98.6 | 82.1 | |
| Far Cry 5 (2018) | 112 |
Emissions - Loud under load
Noise emissions
The two fans of the Schenker XMG Neo 15 can become very loud with a noise level of up to 56 dB(A) if the performance mode Enthusiast is selected in the preinstalled Control Center. In idle mode, however, the notebook is pleasantly quiet.
Noise Level
| Idle |
| 26 / 28 / 33 dB(A) |
| Load |
| 52 / 56 dB(A) |
 | ||
30 dB silent 40 dB(A) audible 50 dB(A) loud |
||
min: | ||
Temperature
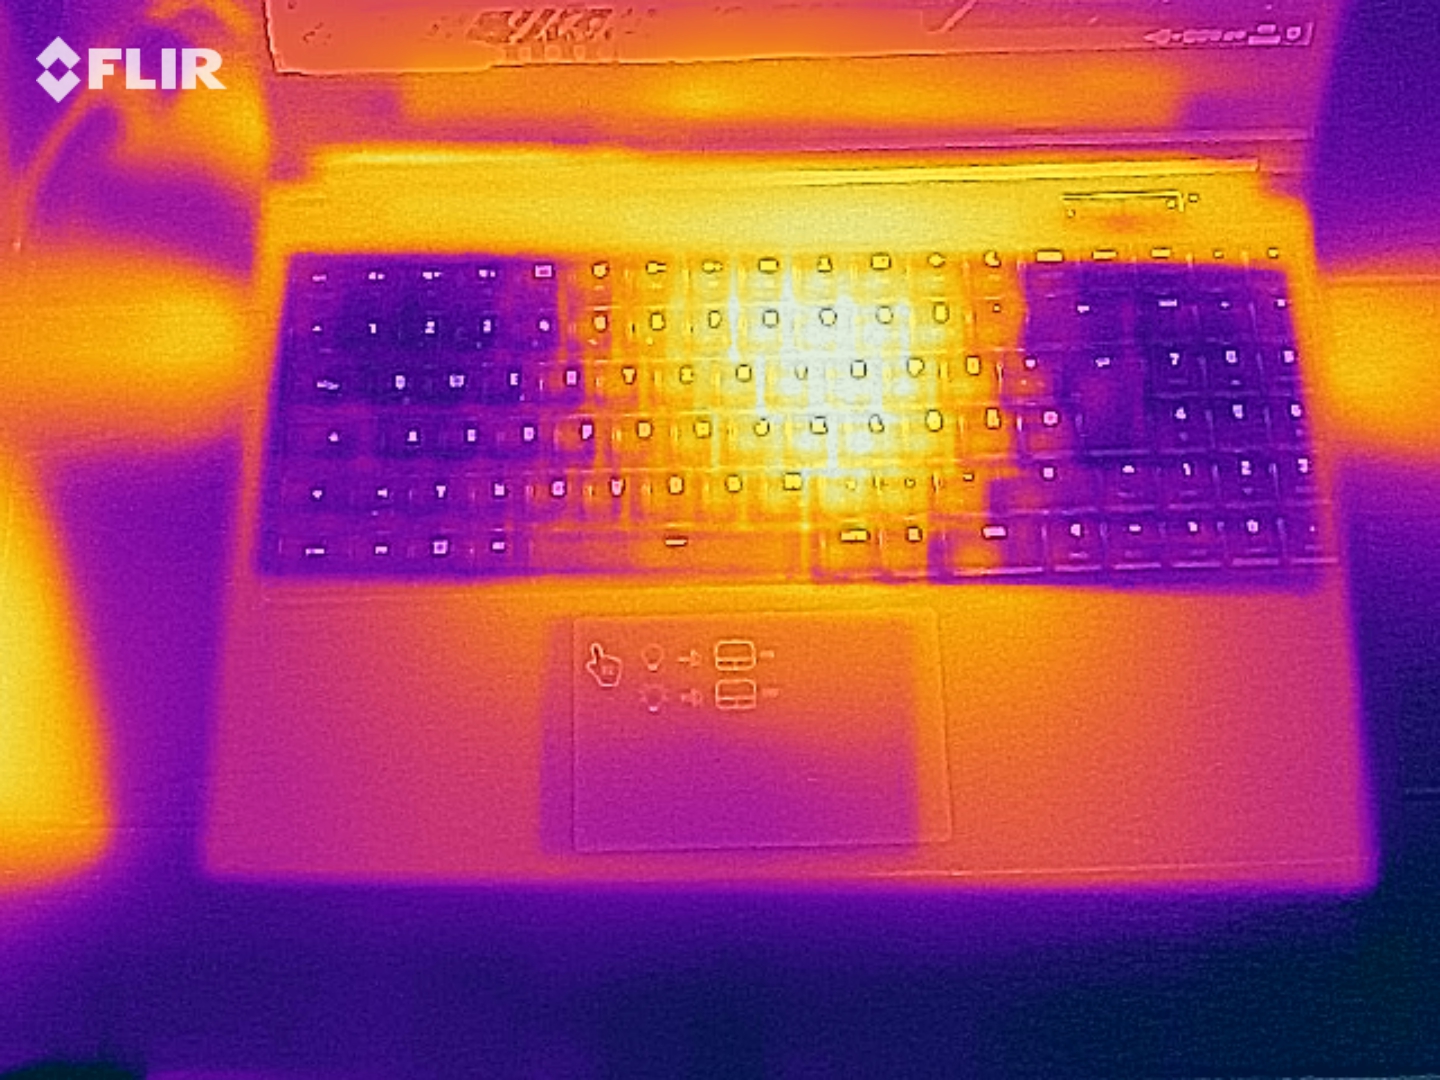
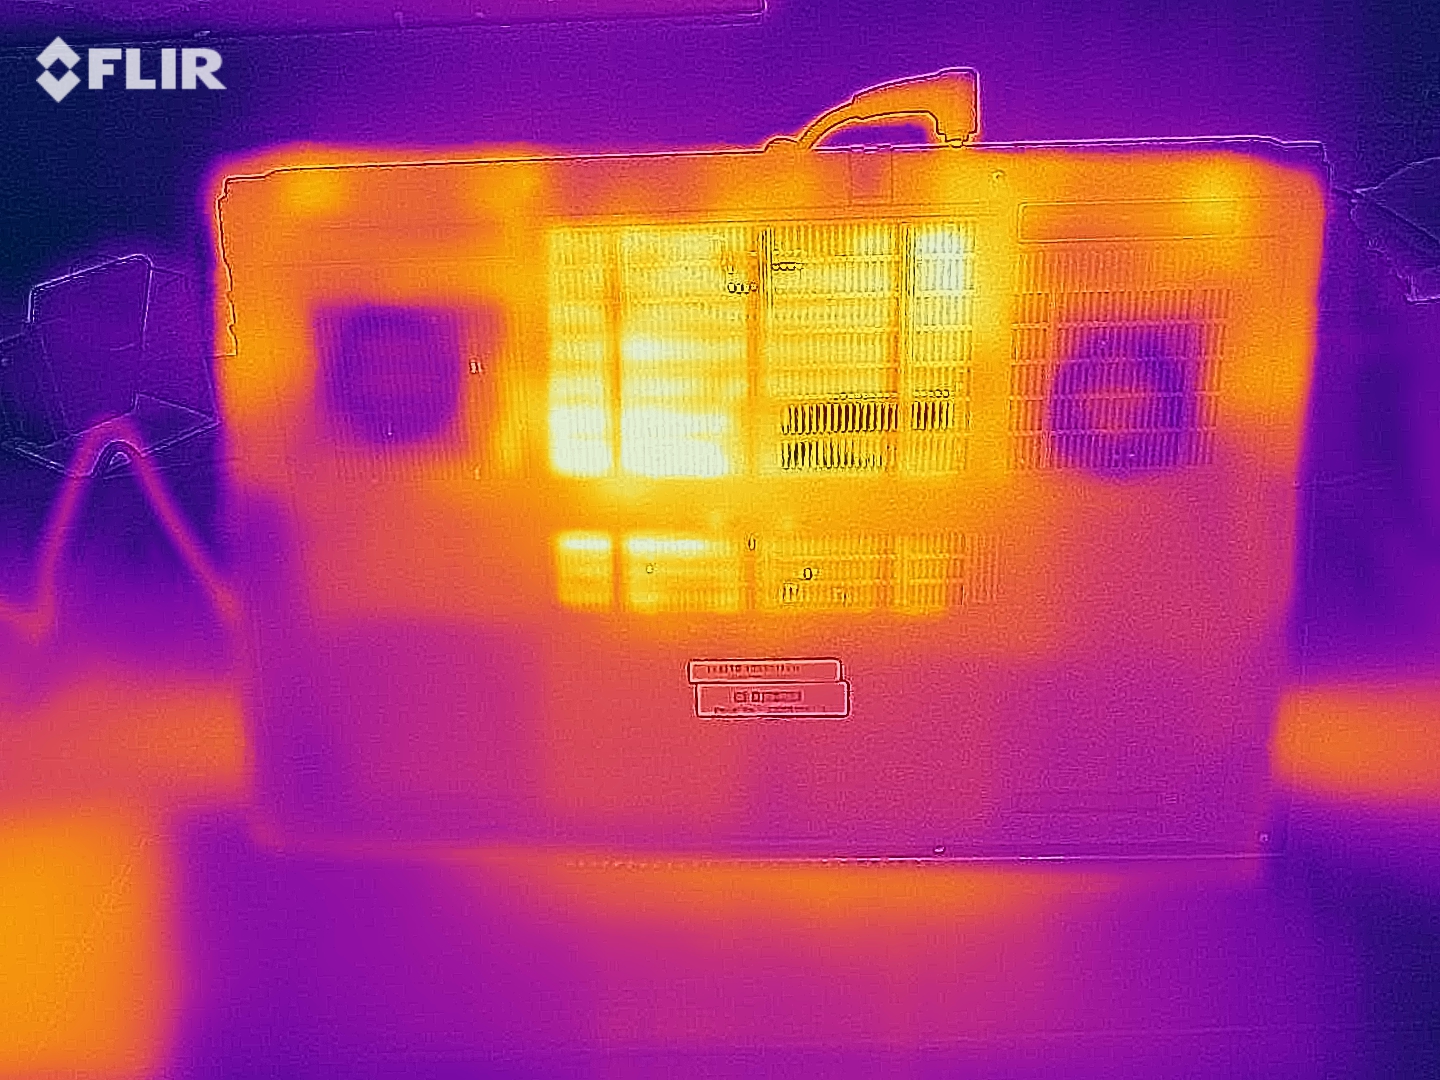
During our test, the surfaces of the XMG Neo 15 heat up to 65 °C. The warmest point here is at the bottom right corner, which means that the Schenker notebook can no longer be placed easily on the thighs under load. However, the temperatures of the wrist-rests remain moderate at all times.
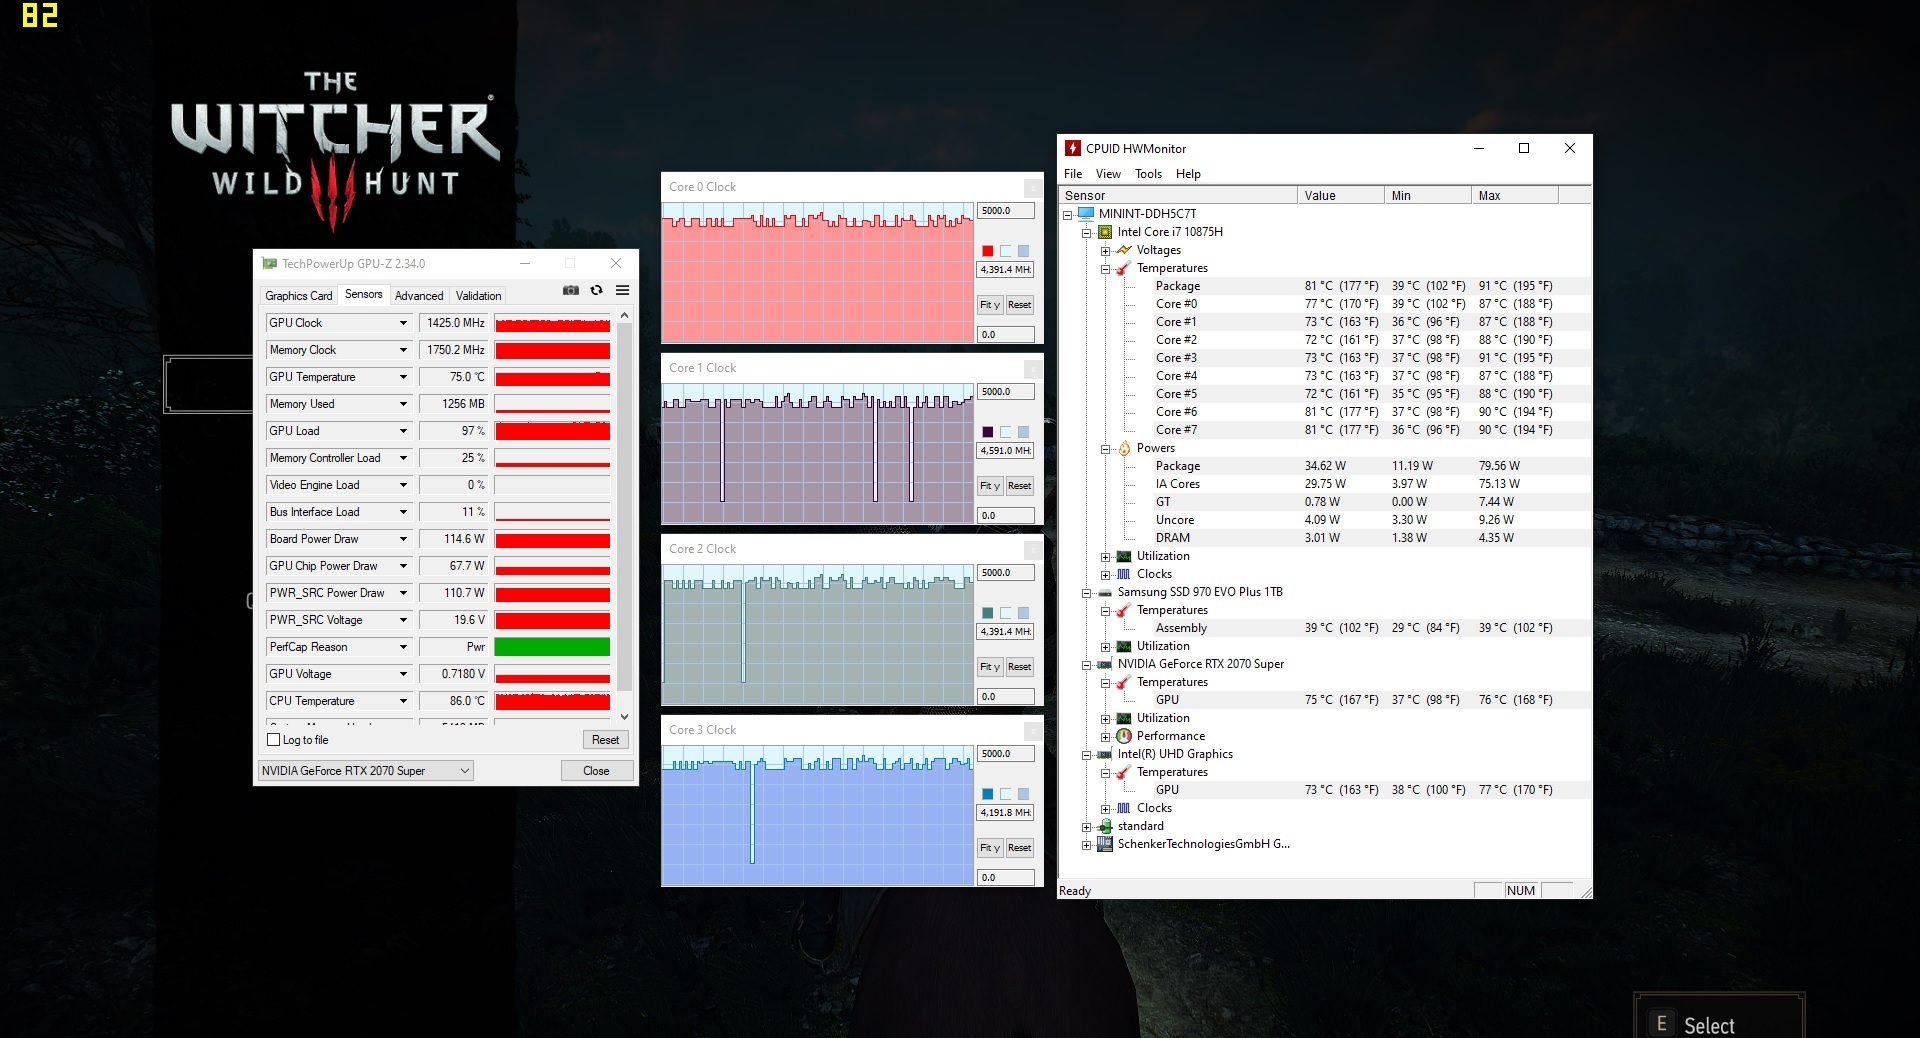
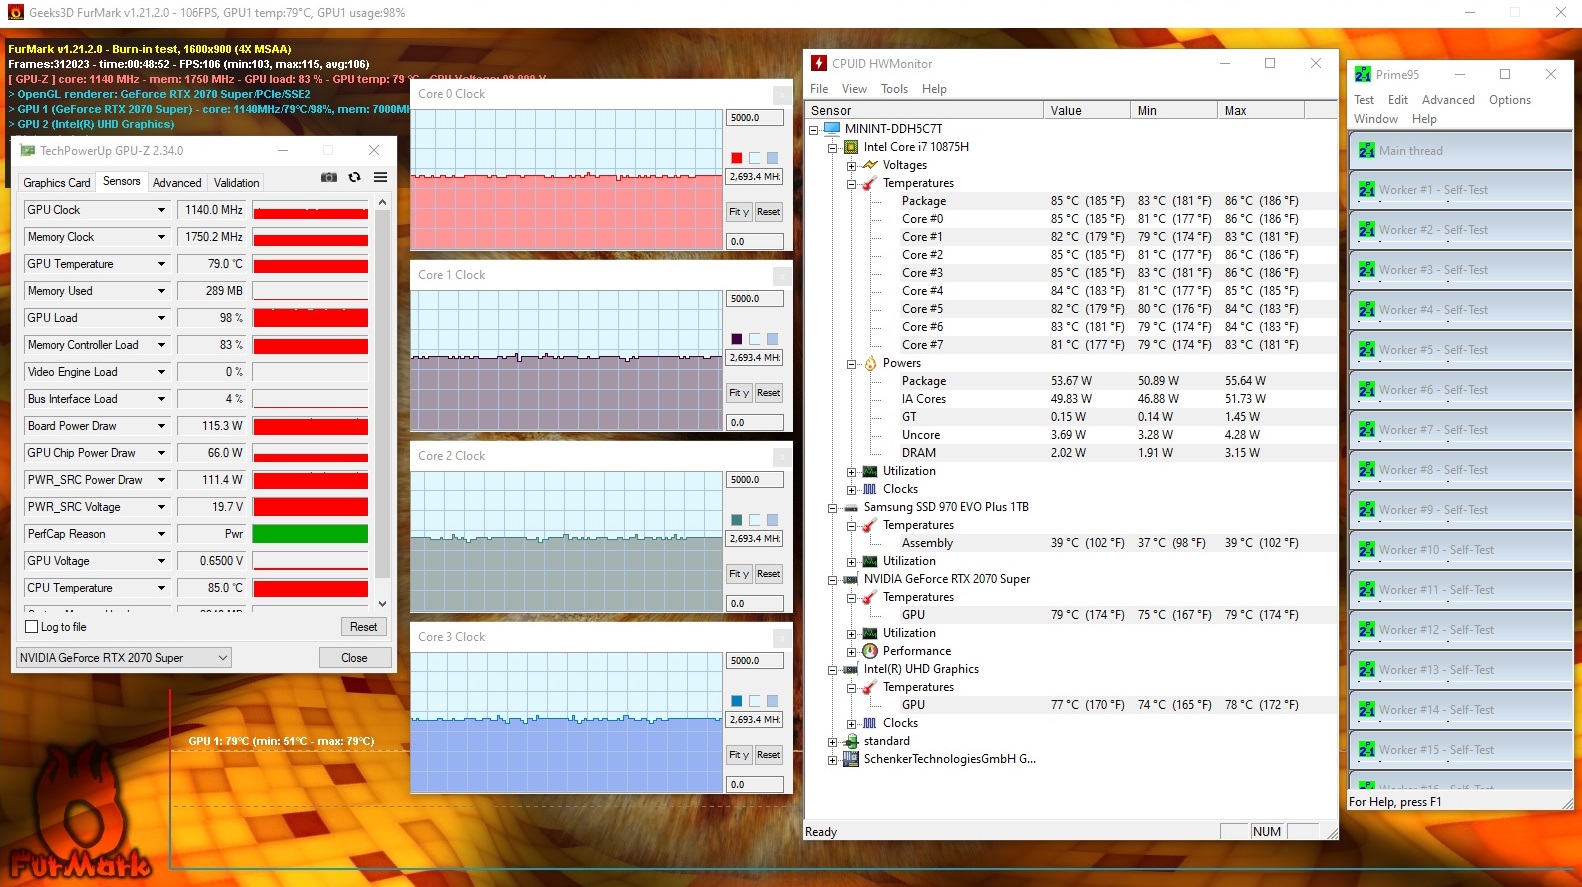
During our endurance stress test, the temperatures inside rose up to 86 °C, while CPU clock rates were kept constant at a level of 2.6 GHz. Thus, the basic clock rate of 2.3 GHz is not undercut and users do not have to expect restrictions due to too high temperatures.
(-) The maximum temperature on the upper side is 46 °C / 115 F, compared to the average of 40.4 °C / 105 F, ranging from 21.2 to 68.8 °C for the class Gaming.
(-) The bottom heats up to a maximum of 65 °C / 149 F, compared to the average of 43.2 °C / 110 F
(+) In idle usage, the average temperature for the upper side is 30.6 °C / 87 F, compared to the device average of 33.8 °C / 93 F.
(-) Playing The Witcher 3, the average temperature for the upper side is 40.8 °C / 105 F, compared to the device average of 33.8 °C / 93 F.
(±) The palmrests and touchpad can get very hot to the touch with a maximum of 39 °C / 102.2 F.
(-) The average temperature of the palmrest area of similar devices was 28.9 °C / 84 F (-10.1 °C / -18.2 F).
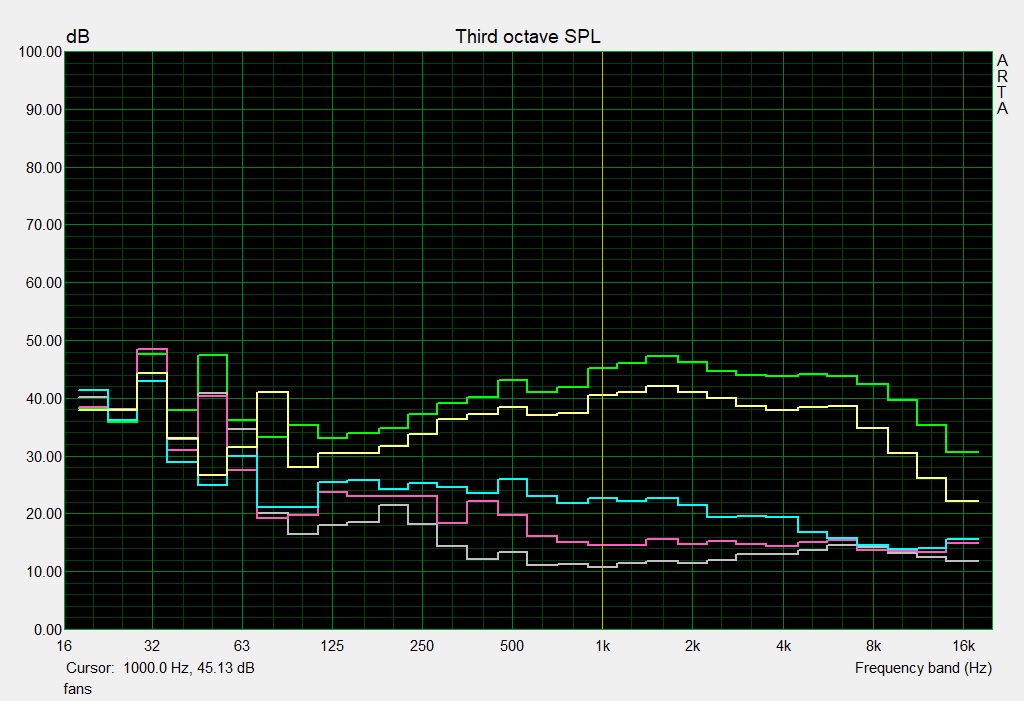
Speakers
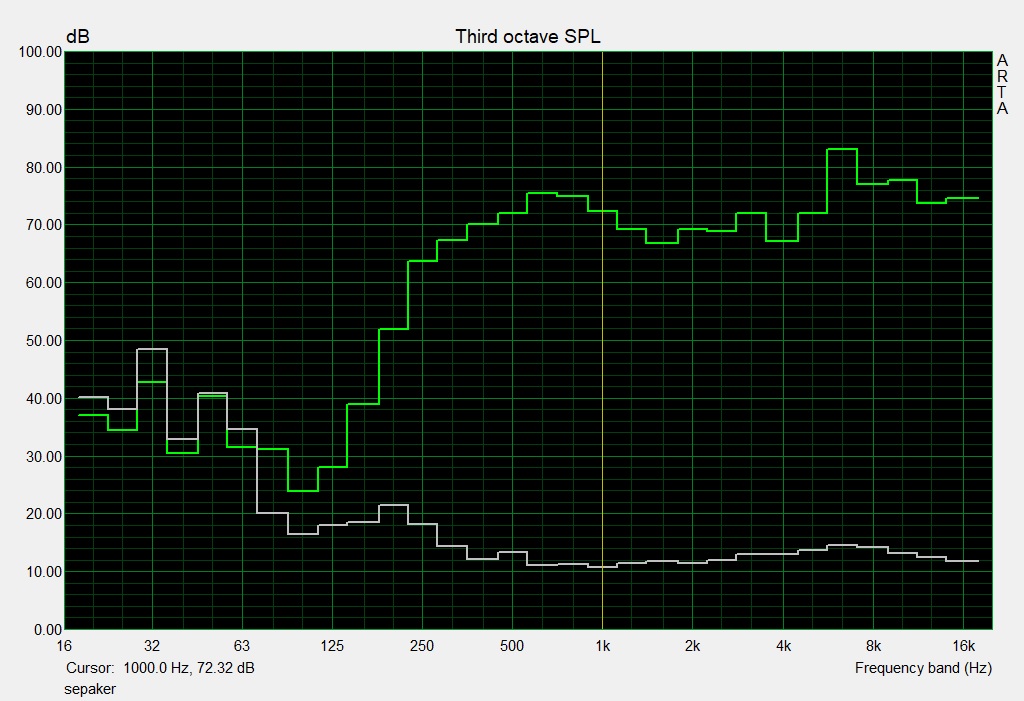
The speakers of the Schenker XMG Neo 15 offer good volume and a relatively wide sound spectrum. This allows media content to be consumed properly even without external speakers or headphones.
SCHENKER XMG Neo 15 Comet Lake audio analysis
(+) | speakers can play relatively loud (87 dB)
Bass 100 - 315 Hz
(-) | nearly no bass - on average 24.5% lower than median
(±) | linearity of bass is average (14.8% delta to prev. frequency)
Mids 400 - 2000 Hz
(+) | balanced mids - only 2.4% away from median
(+) | mids are linear (4.2% delta to prev. frequency)
Highs 2 - 16 kHz
(±) | higher highs - on average 5.1% higher than median
(±) | linearity of highs is average (7.8% delta to prev. frequency)
Overall 100 - 16.000 Hz
(±) | linearity of overall sound is average (15.9% difference to median)
Compared to same class
» 35% of all tested devices in this class were better, 6% similar, 59% worse
» The best had a delta of 6%, average was 18%, worst was 132%
Compared to all devices tested
» 20% of all tested devices were better, 5% similar, 75% worse
» The best had a delta of 4%, average was 25%, worst was 134%
Apple MacBook 12 (Early 2016) 1.1 GHz audio analysis
(+) | speakers can play relatively loud (83.6 dB)
Bass 100 - 315 Hz
(±) | reduced bass - on average 11.3% lower than median
(±) | linearity of bass is average (14.2% delta to prev. frequency)
Mids 400 - 2000 Hz
(+) | balanced mids - only 2.4% away from median
(+) | mids are linear (5.5% delta to prev. frequency)
Highs 2 - 16 kHz
(+) | balanced highs - only 2% away from median
(+) | highs are linear (4.5% delta to prev. frequency)
Overall 100 - 16.000 Hz
(+) | overall sound is linear (10.2% difference to median)
Compared to same class
» 5% of all tested devices in this class were better, 2% similar, 93% worse
» The best had a delta of 5%, average was 19%, worst was 53%
Compared to all devices tested
» 3% of all tested devices were better, 1% similar, 96% worse
» The best had a delta of 4%, average was 25%, worst was 134%
Power management - Usable battery life
Energy consumption
The Schenker XMG Neo 15 shows a slightly increased energy requirement. With an average of 120 watts under load, the power consumption is in the penultimate place of our test field. With a low system load (WLAN, surfing, etc.), it performs slightly better with an average of 19 watts.
According to the label, the included power supply offers an output power of 230 watts.
| Off / Standby | |
| Idle | |
| Load |
|
| SCHENKER XMG Neo 15 Comet Lake i7-10875H, GeForce RTX 2070 Super Mobile | SCHENKER XMG Neo 15 XNE15M19 i7-9750H, GeForce RTX 2070 Max-Q | Razer Blade 15 RTX 2070 Super Max-Q i7-10875H, GeForce RTX 2070 Super Max-Q | Aorus 15G XB i7-10875H, GeForce RTX 2070 Super Max-Q | Asus Zephyrus S15 GX502L i7-10875H, GeForce RTX 2070 Super Mobile | Average NVIDIA GeForce RTX 2070 Super Mobile | Average of class Gaming | |
|---|---|---|---|---|---|---|---|
| Power Consumption | 27% | 0% | 5% | 16% | 10% | 6% | |
| Idle Minimum * | 17 | 11 35% | 14.3 16% | 16 6% | 7 59% | 11.2 ? 34% | 13.8 ? 19% |
| Idle Average * | 19 | 15 21% | 22.3 -17% | 20 -5% | 13 32% | 15.7 ? 17% | 19.2 ? -1% |
| Idle Maximum * | 29 | 21 28% | 36.9 -27% | 30 -3% | 25 14% | 26 ? 10% | 26.9 ? 7% |
| Load Average * | 120 | 94 22% | 118.4 1% | 102 15% | 148 -23% | 129.3 ? -8% | 111.1 ? 7% |
| Witcher 3 ultra * | 186 | 143 23% | 153.7 17% | 156 16% | 175 6% | ||
| Load Maximum * | 250 | 173 31% | 220.8 12% | 256 -2% | 232 7% | 252 ? -1% | 251 ? -0% |
* ... smaller is better
Battery life
In our practical WLAN test, the Schenker XMG Neo 15 achieved a runtime of 5 hours and 23 minutes. This means that it achieves a runtime that is roughly on a par with those of the competition. However, the latter can achieve this with in part significantly lower capacities.
Update: After Schenker detected a bug in our system, we repeated the WLAN test with a second unit and achieved about 7,5 hours.
| SCHENKER XMG Neo 15 Comet Lake i7-10875H, GeForce RTX 2070 Super Mobile, 93 Wh | SCHENKER XMG Neo 15 XNE15M19 i7-9750H, GeForce RTX 2070 Max-Q, 62 Wh | Razer Blade 15 RTX 2070 Super Max-Q i7-10875H, GeForce RTX 2070 Super Max-Q, 80 Wh | Aorus 15G XB i7-10875H, GeForce RTX 2070 Super Max-Q, 94 Wh | Asus Zephyrus S15 GX502L i7-10875H, GeForce RTX 2070 Super Mobile, 76 Wh | Average of class Gaming | |
|---|---|---|---|---|---|---|
| Battery Runtime | ||||||
| WiFi v1.3 | 448 | 340 -24% | 380 -15% | 418 -7% | 181 -60% | 368 ? -18% |
Pros
Cons
Verdict - Significant performance increase through Comet-Lake
Thanks to the update to the Intel Core i7-10875H, the Schenker XMG Neo 15 can easily compete with similarly equipped competitors. The pure CPU performance is comparable to those of other gaming laptops and the system performance as well as the performance of the graphics card leave nothing to be desired. In addition, Schenker offers the current Wi-Fi 6 standard and we also welcome the slight changes to the case. This can be opened very easily and offers extensive maintenance possibilities, which can be used very actively, especially due to the two SSD and RAM slots.
The Comet Lake upgrade brings the Schenker XMG Neo 15 to the level of the competition. On top of that, very good maintenance possibilities are also offered.
The fact that the two DisplayPorts of the predecessor model are no longer needed can, in our opinion, be easily overcome by the DP-capable Thunderbolt 3 connection. But the fact that the webcam has been moved to under the screen is not necessarily a plus point but ultimately a matter of taste.
SCHENKER XMG Neo 15 Comet Lake
-
12/07/2020 v7
Mike Wobker
Pricecompare

