

Intel Core i5-9300H vs Intel Core i5-13500 vs Intel Core i5-8300H
Intel Core i5-9300H
► remove from comparisonThe Intel Core i5-9300H is a fast processor for laptops with four cores based on the Coffee Lake architecture (2019 Refresh, CFL-HR). The processor clocks at between 2.4 and 4.1 GHz (4 with 4 cores) and can execute up to eight threads simultaneously thanks to Hyper-Threading. According to Intel, the CPU is manufactured in an improved 14nm (14nm++) process. Compared to the predecessor, the Core i5-8300H from 2018, the 9300H is clocked slightly higher (+100 MHz CPU, +50 MHz GPU).
The Coffee Lake architecture is similar to Kaby Lake and differs only in the amount of cores (now six cores for the high end versions) and the improved 14nm process (14nm++ according to Intel).
Performance
The Intel Core i5-9300H should perform similar as the older Core i7-7920HQ (3.1 - 4.1 GHz). The faster Coffee Lake CPUs, like the Core i7-8750H/9750H offers two additional cores and is therefore up to 50% faster in multithreaded benchmarks. Still, the performance of the i5-9300H should be sufficient for even demanding applications and games.
Graphics
The integrated Intel UHD Graphics 630 iGPU is supposed to offer a slightly higher performance as its clock rate has been increased by 50 MHz. The architecture is identical to that of the Intel HD Graphics 630. We do expect a performance improvement, but as a low-end solution it will probably only display current games smoothly at reduced details - if at all.
Power Consumption
Intel specifies the TDP with 45 watts and therefore the i5 is only suited for big laptops with good cooling solutions. Using cTDP-down, the CPU can also be configured to 35 Watt resulting in a reduced performance.
Intel Core i5-13500
► remove from comparison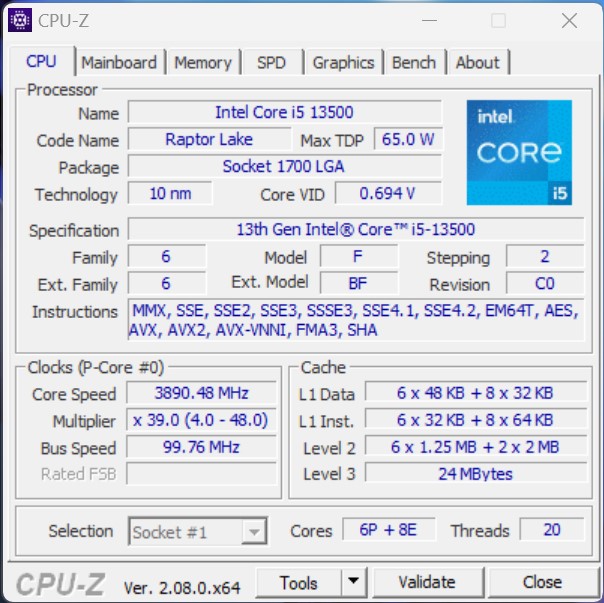
The Intel Core i5-13500 is a fast and relatively power efficient desktop processor based on the Raptor Lake architecture, which was introduced in October 2022. The processor offers a base clock of 2.5 GHz and reaches up to 4.8 GHz in Turbo. The hybrid CPU architecture introduced with Alder Lake is also used in the Raptor Lake processors. Compared to the Intel Core i5-12500, the Intel Core i5-13500 offers more cores, which means a higher overall performance can be achieved. In total, the Intel Core i5-13500 can process up to 20 threads in parallel. The performance cores (P cores) offer hyperthreading for this purpose, which is withheld from the energy-efficient cores (E cores).
Performance
Due to the higher number of physical computing units, the Intel Core i5-13500 offers noticeably more performance compared to the Intel Core i5-12500. Both processors have 6 P-cores, although only the Intel Core i5-13500 is additionally equipped with 8 E-cores.
Graphics unit
Like the Intel Core i5-12600K, the Intel Core i5-13500 offers an integrated graphics unit. The Intel Iris Xe architecture continues to serve as the basis. In terms of performance, however, not much has changed with the new Intel UHD Graphics 770.
Power consumption
The TDP of the Intel Core i5-13500 is 65 watts, with the option to increase this to up to 154 watts in Turbo mode. Compared to the Intel Core i5-12500, the energy requirement increases slightly.
Intel Core i5-8300H
► remove from comparisonThe Intel Core i5-8300H is a fast processor for laptops with four cores based on the Coffee Lake architecture and was announced early 2018. The processor clocks at between 2.3 and 4 GHz (3.9 with 4 cores) and can execute up to eight threads simultaneously thanks to Hyper-Threading. According to Intel, the CPU is manufactured in an improved 14nm (14nm++) process.
The Coffee Lake architecture is similar to Kaby Lake and differs only in the amount of cores (now six cores for the high end versions) and the improved 14nm process (14nm++ according to Intel).
Performance
The Intel Core i5-8300H should perform similar as the older Core i7-7820HQ (2.9 - 4 GHz). The faster Coffee Lake CPUs, like the Core i7-8750H offers two additional cores and is therefore up to 50% faster in multithreaded benchmarks. Still, the performance of the i5-8300H should be sufficient for even demanding applications and games.
Graphics
The integrated Intel UHD Graphics 630 iGPU is supposed to offer a slightly higher performance as its clock rate has been increased by 50 MHz (rumored). The architecture is identical to that of the Intel HD Graphics 630. We do expect a performance improvement, but as a low-end solution it will probably only display current games smoothly at reduced details - if at all.
Power Consumption
Intel specifies the TDP with 45 watts and therefore the i5 is only suited for big laptops with good cooling solutions. Using cTDP-down, the CPU can also be configured to 35 Watt resulting in a reduced performance.
| Model | Intel Core i5-9300H | Intel Core i5-13500 | Intel Core i5-8300H | ||||||||||||||||||||||||||||||||||||||||||||||||||||||||||||||||||||||||||||||||||||||||||||||||||||||||||||||||||||||||||||||||||||||||||||||||||||||||||||||||||||||||
| Codename | Coffee Lake-H | Raptor Lake | Coffee Lake-H | ||||||||||||||||||||||||||||||||||||||||||||||||||||||||||||||||||||||||||||||||||||||||||||||||||||||||||||||||||||||||||||||||||||||||||||||||||||||||||||||||||||||||
| Series | Intel Coffee Lake | Intel Raptor Lake-S | Intel Coffee Lake | ||||||||||||||||||||||||||||||||||||||||||||||||||||||||||||||||||||||||||||||||||||||||||||||||||||||||||||||||||||||||||||||||||||||||||||||||||||||||||||||||||||||||
| Series: Coffee Lake Coffee Lake-H |
|
|
| ||||||||||||||||||||||||||||||||||||||||||||||||||||||||||||||||||||||||||||||||||||||||||||||||||||||||||||||||||||||||||||||||||||||||||||||||||||||||||||||||||||||||
| Clock | 2400 - 4100 MHz | 2500 - 4800 MHz | 2300 - 4000 MHz | ||||||||||||||||||||||||||||||||||||||||||||||||||||||||||||||||||||||||||||||||||||||||||||||||||||||||||||||||||||||||||||||||||||||||||||||||||||||||||||||||||||||||
| L1 Cache | 256 KB | 256 KB | |||||||||||||||||||||||||||||||||||||||||||||||||||||||||||||||||||||||||||||||||||||||||||||||||||||||||||||||||||||||||||||||||||||||||||||||||||||||||||||||||||||||||
| L2 Cache | 1 MB | 11.5 MB | 1 MB | ||||||||||||||||||||||||||||||||||||||||||||||||||||||||||||||||||||||||||||||||||||||||||||||||||||||||||||||||||||||||||||||||||||||||||||||||||||||||||||||||||||||||
| L3 Cache | 8 MB | 24 MB | 8 MB | ||||||||||||||||||||||||||||||||||||||||||||||||||||||||||||||||||||||||||||||||||||||||||||||||||||||||||||||||||||||||||||||||||||||||||||||||||||||||||||||||||||||||
| Cores / Threads | 4 / 8 | 14 / 20 6 x 4.8 GHz Intel Raptor Cove P-Core 8 x 3.5 GHz Intel Gracemont E-Core | 4 / 8 | ||||||||||||||||||||||||||||||||||||||||||||||||||||||||||||||||||||||||||||||||||||||||||||||||||||||||||||||||||||||||||||||||||||||||||||||||||||||||||||||||||||||||
| TDP | 45 Watt | 65 Watt | 45 Watt | ||||||||||||||||||||||||||||||||||||||||||||||||||||||||||||||||||||||||||||||||||||||||||||||||||||||||||||||||||||||||||||||||||||||||||||||||||||||||||||||||||||||||
| Technology | 14 nm | 10 nm | 14 nm | ||||||||||||||||||||||||||||||||||||||||||||||||||||||||||||||||||||||||||||||||||||||||||||||||||||||||||||||||||||||||||||||||||||||||||||||||||||||||||||||||||||||||
| max. Temp. | 100 °C | 100 °C | 100 °C | ||||||||||||||||||||||||||||||||||||||||||||||||||||||||||||||||||||||||||||||||||||||||||||||||||||||||||||||||||||||||||||||||||||||||||||||||||||||||||||||||||||||||
| Socket | FCBGA1440 | LGA 1700 | FCBGA1440 | ||||||||||||||||||||||||||||||||||||||||||||||||||||||||||||||||||||||||||||||||||||||||||||||||||||||||||||||||||||||||||||||||||||||||||||||||||||||||||||||||||||||||
| Features | Dual-Channel DDR4 Memory Controller, HyperThreading, AVX, AVX2, Quick Sync, Virtualization, AES-NI | Intel UHD Graphics 770, DDR5 4800 MT/s, DDR4 3200 MT/s | Dual-Channel DDR4 Memory Controller, HyperThreading, AVX, AVX2, Quick Sync, Virtualization, AES-NI | ||||||||||||||||||||||||||||||||||||||||||||||||||||||||||||||||||||||||||||||||||||||||||||||||||||||||||||||||||||||||||||||||||||||||||||||||||||||||||||||||||||||||
| iGPU | Intel UHD Graphics 630 (350 - 1050 MHz) | Intel UHD Graphics 770 (300 - 1550 MHz) | Intel UHD Graphics 630 (350 - 1000 MHz) | ||||||||||||||||||||||||||||||||||||||||||||||||||||||||||||||||||||||||||||||||||||||||||||||||||||||||||||||||||||||||||||||||||||||||||||||||||||||||||||||||||||||||
| Architecture | x86 | x86 | x86 | ||||||||||||||||||||||||||||||||||||||||||||||||||||||||||||||||||||||||||||||||||||||||||||||||||||||||||||||||||||||||||||||||||||||||||||||||||||||||||||||||||||||||
| $250 U.S. | $250 U.S. | ||||||||||||||||||||||||||||||||||||||||||||||||||||||||||||||||||||||||||||||||||||||||||||||||||||||||||||||||||||||||||||||||||||||||||||||||||||||||||||||||||||||||||
| Announced | |||||||||||||||||||||||||||||||||||||||||||||||||||||||||||||||||||||||||||||||||||||||||||||||||||||||||||||||||||||||||||||||||||||||||||||||||||||||||||||||||||||||||||
| Manufacturer | ark.intel.com | www.intel.de | ark.intel.com | ||||||||||||||||||||||||||||||||||||||||||||||||||||||||||||||||||||||||||||||||||||||||||||||||||||||||||||||||||||||||||||||||||||||||||||||||||||||||||||||||||||||||
| TDP Turbo PL2 | 154 Watt | ||||||||||||||||||||||||||||||||||||||||||||||||||||||||||||||||||||||||||||||||||||||||||||||||||||||||||||||||||||||||||||||||||||||||||||||||||||||||||||||||||||||||||
| Die Size | 215 mm2 |

Benchmarks

Average Benchmarks Intel Core i5-9300H → 100% n=21
Average Benchmarks Intel Core i5-13500 → 198% n=21
Average Benchmarks Intel Core i5-8300H → 92% n=21
* Smaller numbers mean a higher performance
1 This benchmark is not used for the average calculation