AMD Radeon Pro 560 vs NVIDIA GeForce GTX 1060 Max-Q
AMD Radeon Pro 560 ► remove from comparison
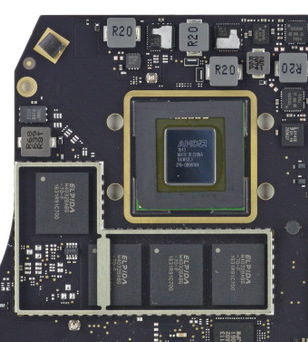
The AMD Radeon Pro 560 is a mobile graphics card based on the small Polaris 21 chip (not verified) from AMD. It is an option for the 15-inch Apple MacBook Pro (Mid 2017) and is probably very similar to the Radeon Pro 460 (except for the slightly improved process for the new Polaris 21 chip). It is similar to the desktop Radeon RX 460 , but not with all 1024 shader units.
Compared to the slower Radeon Pro 555 (entry-level model), the Radeon pro 460 is equipped with 4 GB GDDR5 memory. The average gaming performance in Windows of the Radeon Pro 460 is just above the GeForce GTX 960M and below an average GTX 965M ein. Compared to the slightly raised clocks of the desktop 500-series models, the Radeon Pro 560 should only be slightly faster.
The mobile Radeon Pro 560 should support all features of the desktop RX 460/560 like DisplayPort 1.2 (Polaris actually supports up to 1.4), HDMI 2.0 (via USB-C adapter), new H.265 video de- and encoder as well as architectural improvements. More information about the Polaris architecture is available in our dedicated review .
The Polaris 21 chip is manufactured in a slightly improved 14nm FinFET process according to AMD. The power consumption of the Radeon Pro 460 is 35 Watts according to AMD , so this should also be the case for the Pro 560.
NVIDIA GeForce GTX 1060 Max-Q ► remove from comparison
The Nvidia GeForce GTX 1060 with the Max-Q design is a mobile high-end GPU from the Pascal series. It is designed for thin and light laptops and about 10-15% slower than a regular GTX 1060 for laptops based on the cooling capabilities. The base frequency (1063-1265 MHz) is also much lower than on the regular GTX 1060 (1506 MHz, at least -16%) and the Boost (1341-1480 MHz) is also much lower compared to 1708 MHz (at least -13%) for the regular GTX 1060. The memory clock, however, is identical.
The clock is not the only difference compared to the regular GTX 1060 though. The drivers for the Max-Q version were optimized for efficiency (and not performance; only for Max-Q models), there are optimized voltage converters for 1V operation, high-end cooling methods, and a 40 dB limit for the fan noise (with clock adjustments to ensure this at all times).
Features
The GP106 chip is produced in 16nm FinFET at TSMC and offers a range of new features, like DisplayPort 1.4 (ready), HDMI 2.0b, HDR, Simultaneous Multi-Projection (SMP) and improved H.265 video de- and encoding (PlayReady 3.0). A list of improvements and features can be found in our article on the Pascal architecture .
The power consumption of the Max-Q design is notably lower than the normal GTX 1060 for laptops and ranges between 60 and 70 Watt (TGP) according to Nvidia.
AMD Radeon Pro 560 NVIDIA GeForce GTX 1060 Max-Q GeForce GTX 1000 Series Codename Polaris 21 N17P-G1 Max-Q Architecture Polaris Pascal Pipelines 1024 - unified 1280 - unified Core Speed 907 MHz 1063 - 1265 - 1341 - 1480 (Boost) MHz Memory Speed 5080 MHz 8000 MHz Memory Bus Width 128 Bit 192 Bit Memory Type GDDR5 GDDR5 Max. Amount of Memory 4 GB 6.144 MB Shared Memory no no API DirectX 12, OpenGL Vulkan DirectX 12_1, OpenGL 4.5 Power Consumption 35 Watt 60 - 70 Watt Transistors 3 Billion 4.4 Billion technology 14 nm 16 nm Features DisplayPort 1.3 HBR / 1.4 HDR Ready, HDMI 2.0, AMD FreeSync Multi-Projection, VR Ready, G-SYNC, Vulkan, Multi Monitor Notebook Size large large Date of Announcement 05.06.2017 30.05.2017
Benchmarks Performance Rating - 3DMark 11 + Fire Strike + Time Spy - GeForce GTX 1060 Max-Q
4.8 pt (14%)
...
NVIDIA GeForce GTX 1060 Max-Q
...
max:
3DMark - 3DMark Time Spy Score
1519 Points (4%)
min: 3271 avg: 3415 median: 3415 (10%) max: 3559 Points
3DMark - 3DMark Time Spy Graphics
1376 Points (4%)
min: 3138 avg: 3324 median: 3324 (9%) max: 3510 Points
3DMark - 3DMark Ice Storm Unlimited Graphics
198867 Points (23%)
min: 287286 avg: 346663 median: 367999 (42%) max: 384095 Points
3DMark - 3DMark Ice Storm Extreme Graphics
min: 71289 avg: 105162 median: 96536 (12%) max: 156285 Points
3DMark - 3DMark Cloud Gate Score
15047 Points (16%)
Model CPU GPU RAM Value Apple MacBook Pro 15 2017 (2.9 GHz, 560) i7-7820HQ Radeon Pro 560 4 GB 2.3.3693.0; v1.116 GB 15047
min: 16358 avg: 24167 median: 24154.5 (26%) max: 32658 Points
3DMark - 3DMark Cloud Gate Graphics
23105 Points (6%)
min: 42781 avg: 71376 median: 74101 (19%) max: 81720 Points
3DMark - 3DMark Fire Strike Standard Score
3576 Points (6%)
min: 8292 avg: 9159 median: 9148.5 (16%) max: 9936 Points
3DMark - 3DMark Fire Strike Standard Graphics
3892 Points (4%)
min: 9992 avg: 10659 median: 10430 (12%) max: 11366 Points
3DMark - 3DMark Ice Storm Graphics
min: 80051 avg: 144686 median: 118989 (14%) max: 265343 Points
3DMark 11 - 3DM11 Performance Score
5718 Points (8%)
min: 10176 avg: 11974 median: 11973 (17%) max: 13296 Points
3DMark 11 - 3DM11 Performance GPU
5305 Points (5%)
min: 12970 avg: 13581 median: 13333.5 (11%) max: 14487 Points
3DMark Vantage + AMD Radeon Pro 560 3DMark Vantage - 3DM Vant. Perf. total
18982 Points (6%)
3DM Vant. Perf. GPU no PhysX + AMD Radeon Pro 560 3DMark Vantage - 3DM Vant. Perf. GPU no PhysX
17782 Points (10%)
3DMark 06 3DMark 06 - Standard 1024x768 + AMD Radeon Pro 560
24516 Points (32%)
Model CPU GPU RAM Value 3DMark 06 - Standard 1024x768 Apple MacBook Pro 15 2017 (2.9 GHz, 560) i7-7820HQ Radeon Pro 560 4 GB 16 GB 24516
3DMark 06 - Standard 1280x1024 + NVIDIA GeForce GTX 1060 Max-Q
34189 Points (45%)
Unigine Valley 1.0 - Unigine Valley 1.0 DX
18.2 fps (6%)
SPECviewperf 11 + NVIDIA GeForce GTX 1060 Max-Q SPECviewperf 11 - specvp11 snx-01
9.5 fps (6%)
specvp11 tcvis-02 + NVIDIA GeForce GTX 1060 Max-Q SPECviewperf 11 - specvp11 tcvis-02
2.8 fps (2%)
specvp11 sw-02 + NVIDIA GeForce GTX 1060 Max-Q SPECviewperf 11 - specvp11 sw-02
18.4 fps (14%)
specvp11 proe-05 + NVIDIA GeForce GTX 1060 Max-Q SPECviewperf 11 - specvp11 proe-05
2.8 fps (3%)
specvp11 maya-03 + NVIDIA GeForce GTX 1060 Max-Q SPECviewperf 11 - specvp11 maya-03
17.3 fps (13%)
specvp11 lightwave-01 + NVIDIA GeForce GTX 1060 Max-Q SPECviewperf 11 - specvp11 lightwave-01
20.1 fps (22%)
specvp11 ensight-04 + NVIDIA GeForce GTX 1060 Max-Q SPECviewperf 11 - specvp11 ensight-04
109.7 fps (52%)
specvp11 catia-03 + NVIDIA GeForce GTX 1060 Max-Q SPECviewperf 11 - specvp11 catia-03
19.7 fps (10%)
SPECviewperf 12 + NVIDIA GeForce GTX 1060 Max-Q SPECviewperf 12 - specvp12 sw-03
43.9 fps (11%)
specvp12 snx-02 + NVIDIA GeForce GTX 1060 Max-Q SPECviewperf 12 - specvp12 snx-02
5.4 fps (1%)
specvp12 showcase-01 + NVIDIA GeForce GTX 1060 Max-Q SPECviewperf 12 - specvp12 showcase-01
56.2 fps (12%)
specvp12 mediacal-01 + NVIDIA GeForce GTX 1060 Max-Q SPECviewperf 12 - specvp12 mediacal-01
27.5 fps (7%)
specvp12 maya-04 + NVIDIA GeForce GTX 1060 Max-Q SPECviewperf 12 - specvp12 maya-04
92 fps (25%)
specvp12 energy-01 + NVIDIA GeForce GTX 1060 Max-Q SPECviewperf 12 - specvp12 energy-01
5.2 fps (5%)
specvp12 creo-01 + NVIDIA GeForce GTX 1060 Max-Q SPECviewperf 12 - specvp12 creo-01
34.8 fps (14%)
specvp12 catia-04 + NVIDIA GeForce GTX 1060 Max-Q SPECviewperf 12 - specvp12 catia-04
45.4 fps (8%)
Cinebench R10 Cinebench R10 Shading (32bit) + AMD Radeon Pro 560 Cinebench R10 - Cinebench R10 Shading (32bit)
9792 Points (7%)
Cinebench R10 Shading (32bit) + NVIDIA GeForce GTX 1060 Max-Q
min: 6822 avg: 8146 median: 6829.5 (5%) max: 11275 Points
Cinebench R11.5 Cinebench R11.5 OpenGL 64 Bit + AMD Radeon Pro 560 Cinebench R11.5 - Cinebench R11.5 OpenGL 64 Bit
74.3 fps (26%)
Cinebench R11.5 OpenGL 64 Bit + NVIDIA GeForce GTX 1060 Max-Q
min: 59.6 avg: 68.9 median: 71.7 (25%) max: 76.2 fps
Cinebench R15 + AMD Radeon Pro 560 Cinebench R15 - Cinebench R15 OpenGL 64 Bit
86.8 fps (5%)
Cinebench R15 OpenGL 64 Bit + NVIDIA GeForce GTX 1060 Max-Q
min: 88.5 avg: 107.1 median: 110.6 (6%) max: 120.1 fps
Cinebench R15 OpenGL Ref. Match 64 Bit + AMD Radeon Pro 560 Cinebench R15 - Cinebench R15 OpenGL Ref. Match 64 Bit
99.5 % (100%)
Cinebench R15 OpenGL Ref. Match 64 Bit + NVIDIA GeForce GTX 1060 Max-Q
99.6 % (100%)
GFXBench - GFXBench Car Chase Offscreen
79.4 fps (9%)
GFXBench 3.1 - GFXBench Manhattan ES 3.1 Offscreen
76.8 fps (2%)
GFXBench 3.0 - GFXBench 3.0 Manhattan Offscreen
70 fps (4%)
398 fps (23%)
GFXBench (DX / GLBenchmark) 2.7 + AMD Radeon Pro 560 GFXBench (DX / GLBenchmark) 2.7 - GFXBench T-Rex HD Offscreen C24Z16
283.6 fps (2%)
LuxMark v2.0 64Bit - LuxMark v2.0 Room GPU
686 Samples/s (3%)
1614 Samples/s (7%)
LuxMark v2.0 64Bit - LuxMark v2.0 Sala GPU
1323 Samples/s (2%)
2924 Samples/s (5%)
ComputeMark v2.1 - ComputeMark v2.1 Result
3756 Points (4%)
min: 7555 avg: 7747 median: 7653 (8%) max: 8202 Points
Power Consumption - Witcher 3 Power Consumption *
min: 89 avg: 105 median: 101.9 (22%) max: 123.1 Watt
Power Consumption - Witcher 3 ultra Power Efficiency
min: 0.3006 avg: 0.3 median: 0.3 (35%) max: 0.3955 fps per Watt
Emissions Witcher 3 Fan Noise + NVIDIA GeForce GTX 1060 Max-Q Emissions - Witcher 3 Fan Noise
min: 37.6 avg: 44.1 median: 44.1 (71%) max: 51.3 dB(A)
Clock Speed - GPU Clock Witcher 3 ultra
1440 MHz (56%)
Average Benchmarks AMD Radeon Pro 560 → 100% n=17 Average Benchmarks NVIDIA GeForce GTX 1060 Max-Q → 220% n=17
- Range of benchmark values for this graphics card
- Average benchmark values for this graphics card
* Smaller numbers mean a higher performance
1 This benchmark is not used for the average calculation
Game Benchmarks The following benchmarks stem from our benchmarks of review laptops. The performance depends on the used graphics memory, clock rate, processor, system settings, drivers, and operating systems. So the results don't have to be representative for all laptops with this GPU. For detailed information on the benchmark results, click on the fps number.
GeForce GTX 1060 Max-Q:
110 [X] Dell G5 15 5587 Intel Core i5-8300H 2.3GHz
GeForce GTX 1060 Max-Q
min:
89 fps, max:
137 fps
fps
GeForce GTX 1060 Max-Q:
70 [X] Dell G5 15 5587 Intel Core i5-8300H 2.3GHz
GeForce GTX 1060 Max-Q
min:
5 fps, max:
84 fps
fps
GeForce GTX 1060 Max-Q:
65 [X] Dell G5 15 5587 Intel Core i5-8300H 2.3GHz
GeForce GTX 1060 Max-Q
min:
58 fps, max:
79 fps
fps
GeForce GTX 1060 Max-Q:
48 [X] Dell G5 15 5587 Intel Core i5-8300H 2.3GHz
GeForce GTX 1060 Max-Q
min:
4 fps, max:
71 fps
fps
GeForce GTX 1060 Max-Q:
20 [X] Dell G5 15 5587 Intel Core i5-8300H 2.3GHz
GeForce GTX 1060 Max-Q
min:
17 fps, max:
24 fps
fps
GeForce GTX 1060 Max-Q:
60 110 [X] Dell G5 15 5587 Intel Core i5-8300H 2.3GHz
GeForce GTX 1060 Max-Q
min:
90 fps, max:
131 fps
~ 85 fps
GeForce GTX 1060 Max-Q:
58 66.8 [X] Dell G5 15 5587 Intel Core i5-8300H 2.3GHz
GeForce GTX 1060 Max-Q
min:
55 fps, max:
74 fps
~ 62 fps
GeForce GTX 1060 Max-Q:
52.7 [X] Dell G5 15 5587 Intel Core i5-8300H 2.3GHz
GeForce GTX 1060 Max-Q
min:
45 fps, max:
61 fps
56 ~ 54 fps
GeForce GTX 1060 Max-Q:
38 [X] Dell G5 15 5587 Intel Core i5-8300H 2.3GHz
GeForce GTX 1060 Max-Q
min:
30 fps, max:
45 fps
41 ~ 40 fps
GeForce GTX 1060 Max-Q:
12 [X] Dell G5 15 5587 Intel Core i5-8300H 2.3GHz
GeForce GTX 1060 Max-Q
min:
10 fps, max:
14 fps
fps
GeForce GTX 1060 Max-Q:
73 109 ~ 91 fps
GeForce GTX 1060 Max-Q:
47.2 59 ~ 53 fps
GeForce GTX 1060 Max-Q:
33.9 43 ~ 38 fps
GeForce GTX 1060 Max-Q:
14.6 fps
GeForce GTX 1060 Max-Q:
178 [X] Dell G5 15 5587 Intel Core i5-8300H 2.3GHz
GeForce GTX 1060 Max-Q
min:
133 fps, max:
220 fps
fps
GeForce GTX 1060 Max-Q:
132.6 [X] Dell G5 15 5587 Intel Core i5-8300H 2.3GHz
GeForce GTX 1060 Max-Q
min:
101 fps, max:
157 fps
fps
GeForce GTX 1060 Max-Q:
115.7 [X] Dell G5 15 5587 Intel Core i5-8300H 2.3GHz
GeForce GTX 1060 Max-Q
min:
101 fps, max:
127 fps
fps
GeForce GTX 1060 Max-Q:
72.8 [X] Dell G5 15 5587 Intel Core i5-8300H 2.3GHz
GeForce GTX 1060 Max-Q
min:
64 fps, max:
79 fps
fps
GeForce GTX 1060 Max-Q:
135.5 [X] Dell G5 15 5587 Intel Core i5-8300H 2.3GHz
GeForce GTX 1060 Max-Q
min:
97 fps, max:
192 fps
fps
GeForce GTX 1060 Max-Q:
93.4 [X] Dell G5 15 5587 Intel Core i5-8300H 2.3GHz
GeForce GTX 1060 Max-Q
min:
66 fps, max:
107 fps
fps
GeForce GTX 1060 Max-Q:
81.5 [X] Dell G5 15 5587 Intel Core i5-8300H 2.3GHz
GeForce GTX 1060 Max-Q
min:
66 fps, max:
95 fps
fps
GeForce GTX 1060 Max-Q:
62.2 [X] Dell G5 15 5587 Intel Core i5-8300H 2.3GHz
GeForce GTX 1060 Max-Q
min:
54 fps, max:
71 fps
fps
GeForce GTX 1060 Max-Q:
117.9 [X] Dell G5 15 5587 Intel Core i5-8300H 2.3GHz
GeForce GTX 1060 Max-Q
min:
76 fps, max:
169 fps
fps
GeForce GTX 1060 Max-Q:
89.1 [X] Dell G5 15 5587 Intel Core i5-8300H 2.3GHz
GeForce GTX 1060 Max-Q
min:
65 fps, max:
113 fps
fps
GeForce GTX 1060 Max-Q:
78.5 [X] Dell G5 15 5587 Intel Core i5-8300H 2.3GHz
GeForce GTX 1060 Max-Q
min:
53 fps, max:
96 fps
fps
GeForce GTX 1060 Max-Q:
66.6 [X] Dell G5 15 5587 Intel Core i5-8300H 2.3GHz
GeForce GTX 1060 Max-Q
min:
42 fps, max:
92 fps
fps
GeForce GTX 1060 Max-Q:
23.8 [X] Dell G5 15 5587 Intel Core i5-8300H 2.3GHz
GeForce GTX 1060 Max-Q
min:
16 fps, max:
27 fps
fps
GeForce GTX 1060 Max-Q:
174.9 [X] Dell G5 15 5587 Intel Core i5-8300H 2.3GHz
GeForce GTX 1060 Max-Q
min:
118 fps, max:
251 fps
fps
GeForce GTX 1060 Max-Q:
163.3 [X] Dell G5 15 5587 Intel Core i5-8300H 2.3GHz
GeForce GTX 1060 Max-Q
min:
110 fps, max:
227 fps
fps
GeForce GTX 1060 Max-Q:
91.9 [X] Dell G5 15 5587 Intel Core i5-8300H 2.3GHz
GeForce GTX 1060 Max-Q
min:
68 fps, max:
112 fps
fps
GeForce GTX 1060 Max-Q:
70.9 [X] Dell G5 15 5587 Intel Core i5-8300H 2.3GHz
GeForce GTX 1060 Max-Q
min:
53 fps, max:
88 fps
fps
GeForce GTX 1060 Max-Q:
31.3 [X] Dell G5 15 5587 Intel Core i5-8300H 2.3GHz
GeForce GTX 1060 Max-Q
min:
24 fps, max:
38 fps
fps
GeForce GTX 1060 Max-Q:
77 fps
GeForce GTX 1060 Max-Q:
67 fps
GeForce GTX 1060 Max-Q:
62 fps
GeForce GTX 1060 Max-Q:
52 fps
GeForce GTX 1060 Max-Q:
21 fps
GeForce GTX 1060 Max-Q:
94.7 fps
GeForce GTX 1060 Max-Q:
85.4 fps
GeForce GTX 1060 Max-Q:
71.4 fps
GeForce GTX 1060 Max-Q:
17.6 fps
GeForce GTX 1060 Max-Q:
108.1 fps
GeForce GTX 1060 Max-Q:
83.5 fps
GeForce GTX 1060 Max-Q:
69.6 fps
GeForce GTX 1060 Max-Q:
57.2 fps
GeForce GTX 1060 Max-Q:
17 fps
GeForce GTX 1060 Max-Q:
128 fps
GeForce GTX 1060 Max-Q:
81 82 84 ~ 82 fps
GeForce GTX 1060 Max-Q:
60 62 65 ~ 62 fps
GeForce GTX 1060 Max-Q:
46 46 48 ~ 47 fps
GeForce GTX 1060 Max-Q:
17 27 ~ 22 fps
GeForce GTX 1060 Max-Q:
290.6 [X] Dell G5 15 5587 Intel Core i5-8300H 2.3GHz
GeForce GTX 1060 Max-Q
min:
266 fps, max:
334 fps
fps
GeForce GTX 1060 Max-Q:
277.9 [X] Dell G5 15 5587 Intel Core i5-8300H 2.3GHz
GeForce GTX 1060 Max-Q
min:
249 fps, max:
315 fps
fps
GeForce GTX 1060 Max-Q:
252.3 [X] Dell G5 15 5587 Intel Core i5-8300H 2.3GHz
GeForce GTX 1060 Max-Q
min:
217 fps, max:
289 fps
fps
GeForce GTX 1060 Max-Q:
245.7 [X] Dell G5 15 5587 Intel Core i5-8300H 2.3GHz
GeForce GTX 1060 Max-Q
min:
199 fps, max:
279 fps
fps
GeForce GTX 1060 Max-Q:
130 [X] Dell G5 15 5587 Intel Core i5-8300H 2.3GHz
GeForce GTX 1060 Max-Q
min:
113 fps, max:
150 fps
fps
GeForce GTX 1060 Max-Q:
109 fps
GeForce GTX 1060 Max-Q:
48 fps
GeForce GTX 1060 Max-Q:
35.5 fps
GeForce GTX 1060 Max-Q:
25.6 fps
GeForce GTX 1060 Max-Q:
8.5 fps
GeForce GTX 1060 Max-Q:
94 fps
GeForce GTX 1060 Max-Q:
77 98 ~ 88 fps
GeForce GTX 1060 Max-Q:
56 60 ~ 58 fps
GeForce GTX 1060 Max-Q:
26 fps
GeForce GTX 1060 Max-Q:
141.9 [X] Dell G5 15 5587 Intel Core i5-8300H 2.3GHz
GeForce GTX 1060 Max-Q
min:
126 fps, max:
145 fps
fps
GeForce GTX 1060 Max-Q:
92.5 [X] Dell G5 15 5587 Intel Core i5-8300H 2.3GHz
GeForce GTX 1060 Max-Q
min:
85 fps, max:
101 fps
fps
GeForce GTX 1060 Max-Q:
85.6 [X] Dell G5 15 5587 Intel Core i5-8300H 2.3GHz
GeForce GTX 1060 Max-Q
min:
63 fps, max:
100 fps
fps
GeForce GTX 1060 Max-Q:
63.3 [X] Dell G5 15 5587 Intel Core i5-8300H 2.3GHz
GeForce GTX 1060 Max-Q
min:
53 fps, max:
69 fps
fps
GeForce GTX 1060 Max-Q:
12.9 [X] Dell G5 15 5587 Intel Core i5-8300H 2.3GHz
GeForce GTX 1060 Max-Q
min:
1 fps, max:
25 fps
fps
GeForce GTX 1060 Max-Q:
28.8 fps
GeForce GTX 1060 Max-Q:
250 fps
GeForce GTX 1060 Max-Q:
194 216 ~ 205 fps
GeForce GTX 1060 Max-Q:
134 155 ~ 145 fps
GeForce GTX 1060 Max-Q:
56.5 fps
GeForce GTX 1060 Max-Q:
116 126 ~ 121 fps
GeForce GTX 1060 Max-Q:
65 fps
GeForce GTX 1060 Max-Q:
58.7 fps
GeForce GTX 1060 Max-Q:
33.2 fps
GeForce GTX 1060 Max-Q:
19.4 fps
GeForce GTX 1060 Max-Q:
92.3 fps
GeForce GTX 1060 Max-Q:
87.8 fps
GeForce GTX 1060 Max-Q:
63.9 fps
GeForce GTX 1060 Max-Q:
25.7 fps
GeForce GTX 1060 Max-Q:
169 fps
GeForce GTX 1060 Max-Q:
93 fps
GeForce GTX 1060 Max-Q:
76.1 fps
GeForce GTX 1060 Max-Q:
25.1 fps
GeForce GTX 1060 Max-Q:
101 fps
GeForce GTX 1060 Max-Q:
56.8 fps
GeForce GTX 1060 Max-Q:
39.4 fps
GeForce GTX 1060 Max-Q:
18.9 fps
GeForce GTX 1060 Max-Q:
85.4 fps
GeForce GTX 1060 Max-Q:
64.7 fps
GeForce GTX 1060 Max-Q:
54.8 fps
GeForce GTX 1060 Max-Q:
23.7 fps
GeForce GTX 1060 Max-Q:
124 fps
GeForce GTX 1060 Max-Q:
91.6 fps
GeForce GTX 1060 Max-Q:
81.7 fps
GeForce GTX 1060 Max-Q:
34.6 fps
GeForce GTX 1060 Max-Q:
144 fps
GeForce GTX 1060 Max-Q:
79 fps
GeForce GTX 1060 Max-Q:
67.3 fps
GeForce GTX 1060 Max-Q:
24.8 fps
GeForce GTX 1060 Max-Q:
154 fps
GeForce GTX 1060 Max-Q:
76 fps
GeForce GTX 1060 Max-Q:
67.8 fps
GeForce GTX 1060 Max-Q:
25.3 fps
GeForce GTX 1060 Max-Q:
55.7 [X] Lenovo Legion Y520-15IKBM 80YY001APB Intel Core i5-7300HQ 2.5GHz
GeForce GTX 1060 Max-Q
fps
GeForce GTX 1060 Max-Q:
36.2 40.7 [X] Lenovo Legion Y520-15IKBM 80YY001APB Intel Core i5-7300HQ 2.5GHz
GeForce GTX 1060 Max-Q
~ 38 fps
GeForce GTX 1060 Max-Q:
330 fps
GeForce GTX 1060 Max-Q:
250 fps
GeForce GTX 1060 Max-Q:
248 fps
GeForce GTX 1060 Max-Q:
95.2 fps
GeForce GTX 1060 Max-Q:
110.3 fps
GeForce GTX 1060 Max-Q:
93 93.8 ~ 93 fps
GeForce GTX 1060 Max-Q:
50.2 52 ~ 51 fps
GeForce GTX 1060 Max-Q:
26.7 27.6 ~ 27 fps
GeForce GTX 1060 Max-Q:
15.8 16.3 ~ 16 fps
GeForce GTX 1060 Max-Q:
130 fps
GeForce GTX 1060 Max-Q:
66.4 fps
GeForce GTX 1060 Max-Q:
59.6 fps
GeForce GTX 1060 Max-Q:
20.5 fps
GeForce GTX 1060 Max-Q:
299.2 fps
GeForce GTX 1060 Max-Q:
266.2 fps
GeForce GTX 1060 Max-Q:
165 165.8 ~ 165 fps
GeForce GTX 1060 Max-Q:
50.3 fps
GeForce GTX 1060 Max-Q:
127 fps
GeForce GTX 1060 Max-Q:
91.1 fps
GeForce GTX 1060 Max-Q:
86.2 fps
GeForce GTX 1060 Max-Q:
28.4 fps
GeForce GTX 1060 Max-Q:
75.8 fps
GeForce GTX 1060 Max-Q:
59.8 62.2 ~ 61 fps
GeForce GTX 1060 Max-Q:
52.9 53.2 ~ 53 fps
GeForce GTX 1060 Max-Q:
20.8 21 ~ 21 fps
GeForce GTX 1060 Max-Q:
127 fps
GeForce GTX 1060 Max-Q:
61.9 fps
GeForce GTX 1060 Max-Q:
48.8 fps
GeForce GTX 1060 Max-Q:
22.1 fps
GeForce GTX 1060 Max-Q:
81 fps
GeForce GTX 1060 Max-Q:
71 fps
GeForce GTX 1060 Max-Q:
53 fps
GeForce GTX 1060 Max-Q:
22 fps
GeForce GTX 1060 Max-Q:
224 fps
GeForce GTX 1060 Max-Q:
126 fps
GeForce GTX 1060 Max-Q:
102 fps
GeForce GTX 1060 Max-Q:
37.3 fps
GeForce GTX 1060 Max-Q:
188 fps
GeForce GTX 1060 Max-Q:
93 fps
GeForce GTX 1060 Max-Q:
80.9 fps
GeForce GTX 1060 Max-Q:
29.3 fps
GeForce GTX 1060 Max-Q:
82.6 fps
GeForce GTX 1060 Max-Q:
65.8 fps
GeForce GTX 1060 Max-Q:
29.4 fps
GeForce GTX 1060 Max-Q:
22.2 fps
GeForce GTX 1060 Max-Q:
73.9 78.4 ~ 76 fps
GeForce GTX 1060 Max-Q:
61.3 64.6 ~ 63 fps
GeForce GTX 1060 Max-Q:
25.8 fps
GeForce GTX 1060 Max-Q:
60 fps
GeForce GTX 1060 Max-Q:
60 60 ~ 60 fps
GeForce GTX 1060 Max-Q:
42 fps
GeForce GTX 1060 Max-Q:
129 129 ~ 129 fps
GeForce GTX 1060 Max-Q:
72 [X] Lenovo Legion Y520-15IKBM 80YY001APB Intel Core i5-7300HQ 2.5GHz
GeForce GTX 1060 Max-Q
74 81 81 ~ 77 fps
GeForce GTX 1060 Max-Q:
48 [X] Lenovo Legion Y520-15IKBM 80YY001APB Intel Core i5-7300HQ 2.5GHz
GeForce GTX 1060 Max-Q
49 53 54 ~ 51 fps
GeForce GTX 1060 Max-Q:
26 26 ~ 26 fps
GeForce GTX 1060 Max-Q:
156.8 fps
GeForce GTX 1060 Max-Q:
151.6 fps
GeForce GTX 1060 Max-Q:
106.5 fps
GeForce GTX 1060 Max-Q:
61.8 fps
GeForce GTX 1060 Max-Q:
53.7 fps
GeForce GTX 1060 Max-Q:
170.2 fps
GeForce GTX 1060 Max-Q:
139.9 fps
GeForce GTX 1060 Max-Q:
96.7 fps
GeForce GTX 1060 Max-Q:
76.9 fps
GeForce GTX 1060 Max-Q:
117.2 fps
GeForce GTX 1060 Max-Q:
112 fps
GeForce GTX 1060 Max-Q:
107.6 fps
GeForce GTX 1060 Max-Q:
60.2 [X] Lenovo Legion Y520-15IKBM 80YY001APB Intel Core i5-7300HQ 2.5GHz
GeForce GTX 1060 Max-Q
64.6 69 70.4 ~ 66 fps
GeForce GTX 1060 Max-Q:
53.7 [X] Lenovo Legion Y520-15IKBM 80YY001APB Intel Core i5-7300HQ 2.5GHz
GeForce GTX 1060 Max-Q
fps
GeForce GTX 1060 Max-Q:
68.9 fps
GeForce GTX 1060 Max-Q:
65.7 fps
GeForce GTX 1060 Max-Q:
63.4 fps
GeForce GTX 1060 Max-Q:
40 fps
GeForce GTX 1060 Max-Q:
210.8 fps
GeForce GTX 1060 Max-Q:
152.8 fps
GeForce GTX 1060 Max-Q:
143.3 fps
GeForce GTX 1060 Max-Q:
116.7 fps
GeForce GTX 1060 Max-Q:
64.3 74 ~ 69 fps
GeForce GTX 1060 Max-Q:
159.5 [X] Lenovo Legion Y520-15IKBM 80YY001APB Intel Core i5-7300HQ 2.5GHz
GeForce GTX 1060 Max-Q
180.1 211.6 213.3 213.4 215 ~ 199 fps
GeForce GTX 1060 Max-Q:
308.4 fps
GeForce GTX 1060 Max-Q:
277.7 fps
GeForce GTX 1060 Max-Q:
170.5 fps
GeForce GTX 1060 Max-Q:
115.6 fps
GeForce GTX 1060 Max-Q:
105.8 fps
GeForce GTX 1060 Max-Q:
101 fps
GeForce GTX 1060 Max-Q:
88.7 fps
GeForce GTX 1060 Max-Q:
70 fps
GeForce GTX 1060 Max-Q:
45.7 fps
GeForce GTX 1060 Max-Q:
218.4 fps
GeForce GTX 1060 Max-Q:
192.7 fps
GeForce GTX 1060 Max-Q:
164.7 fps
GeForce GTX 1060 Max-Q:
69.5 fps
GeForce GTX 1060 Max-Q:
140.1 fps
GeForce GTX 1060 Max-Q:
126.3 fps
GeForce GTX 1060 Max-Q:
112.2 fps
GeForce GTX 1060 Max-Q:
64.5 fps
 Deutsch
 English
 Español
 Français
 Italiano
 Nederlands
 Polski
 Português
 Русский
 Türkçe
 Svenska
 Chinese
 Magyar