Qualcomm Adreno 680 vs ARM Mali-G68 MP4 vs Qualcomm Adreno 690
Qualcomm Adreno 680 ► remove from comparison
The Qualcomm Adreno 680 is an integrated graphics card in the Qualcomm Snapdragon 8cx SoC for Windows laptops. According to Qualcomm it is 2x faster than the previous Adreno 630 in the Snapdragon 850 for Windows PCs with a 60% improved efficiency (thanks to the 7nm process). The performance should be similar to a Intel UHD Graphics 620 (e.g. in a 8th gen Core i5) when running native ARM64 compiled Windows apps and games. Running emulated 32 bit games (64 bit games compiled for AMD/Intel are not supported), the performance is notably slower.
ARM Mali-G68 MP4 ► remove from comparison
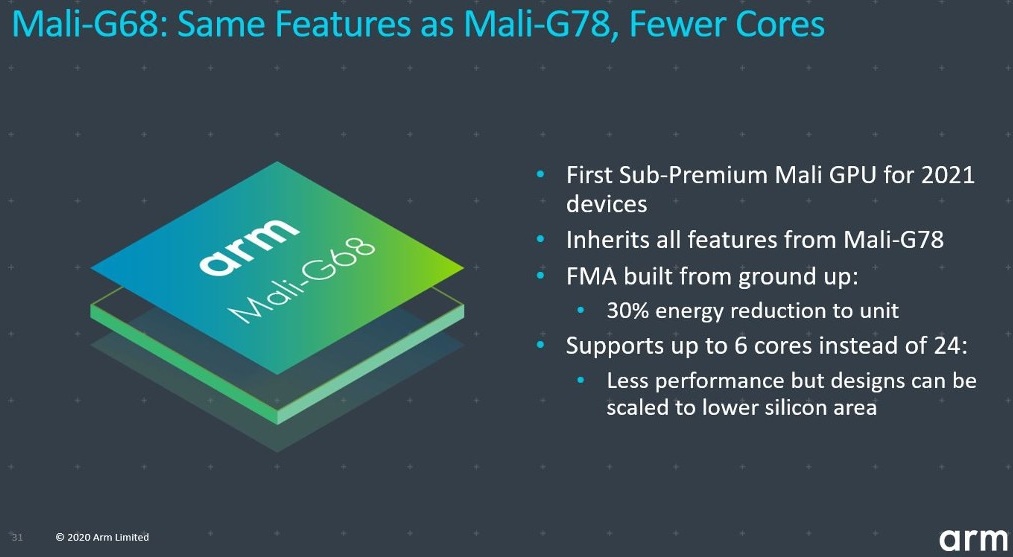
The ARM Mali-G68 MP4 (or G68MC4) is an integrated mid-range graphics card for ARM based SoCs (mostly Android based). The MP4 version uses four of the six possible clusters / cores.
It was introduced mid 2021 in the Mediatek Dimensity 900 . It is based on the Valhall architecture and is advertised by ARM as a "sub-premium GPU". It offers all features of the Mali-G78 series including improvements for battery runtime and machine learning.
Qualcomm Adreno 690 ► remove from comparison
The Qualcomm Adreno 690 is an integrated graphics card in the Qualcomm Snapdragon 8cx Gen 3 SoC for Windows laptops. According to Qualcomm, the 690 is up to 60% faster than the previous generation. In our tests with the Lenovo ThinkPad X13s, the Adreno 690 was only on par with a low en Intel UHD Graphics iGPU and not well suited for 3D games.
The chip is manufactured in 5nm at Samsung (5LPE) and suited for fanless laptops.
Qualcomm Adreno 680 ARM Mali-G68 MP4 Qualcomm Adreno 690 Adreno 600 Series Shared Memory yes no yes API DirectX 12 DirectX 12 Power Consumption 7 Watt 7 Watt technology 7 nm 5 nm 5 nm Date of Announcement 06.12.2018 14.09.2021 06.12.2018 Codename Valhall Architecture Valhall Pipelines 4 - unified Link to Manufacturer Page www.arm.com
Benchmarks Performance Rating - 3DMark 11 + Fire Strike + Time Spy - Adreno 690
1.3 pt (4%)
...
...
max:
3DMark - 3DMark Time Spy Score
909 Points (3%)
3DMark - 3DMark Time Spy Graphics
811 Points (2%)
3DMark - 3DMark Ice Storm Unlimited Graphics
48592 Points (6%)
3DMark - 3DMark Cloud Gate Score
min: 8602 avg: 9818 median: 9818 (10%) max: 11034 Points
3DMark - 3DMark Cloud Gate Graphics
min: 13768 avg: 16708 median: 16707.5 (4%) max: 19647 Points
3DMark - 3DMark Fire Strike Standard Score
min: 2758 avg: 2835 median: 2834.5 (5%) max: 2911 Points
3DMark - 3DMark Fire Strike Standard Graphics
min: 2837 avg: 2933 median: 2932.5 (3%) max: 3028 Points
3DMark - 3DMark Ice Storm Graphics
14652 Points (2%)
3DMark - 3DMark Sling Shot (ES 3.0) Unlimited
min: 4505 avg: 5107 median: 5080 (22%) max: 5612 Points
3DMark - 3DMark Sling Shot (ES 3.0) Unlimited Graphics
min: 5193 avg: 5917 median: 6031 (13%) max: 6313 Points
3DMark - 3DMark Sling Shot Extreme (ES 3.1) Unlimited
min: 3514 avg: 4030 median: 4038 (20%) max: 4362 Points
3DMark - 3DMark Sling Shot Extreme (ES 3.1) Unlimited Graphics
min: 3678 avg: 4174 median: 4212 (13%) max: 4406 Points
3DMark - 3DMark Wild Life Unlimited
min: 2001 avg: 2206 median: 2242.5 (1%) max: 2401 Points
3DMark - 3DMark Wild Life Extreme Unlimited
min: 576 avg: 611 median: 619 (1%) max: 632 Points
3067 Points (4%)
3DMark 11 - 3DM11 Performance Score
min: 1650 avg: 1847 median: 1847 (3%) max: 2044 Points
min: 3063 avg: 3085 median: 3077 (4%) max: 3115 Points
3DMark 11 - 3DM11 Performance GPU
min: 1593 avg: 1936 median: 1935.5 (2%) max: 2278 Points
min: 2898 avg: 2930 median: 2912 (3%) max: 2979 Points
Cinebench R10 Cinebench R10 Shading (32bit) + Qualcomm Adreno 680 Cinebench R10 - Cinebench R10 Shading (32bit)
353 Points (0%)
Cinebench R10 Shading (32bit) + Qualcomm Adreno 690 558 Points (0%)
Cinebench R15 + Qualcomm Adreno 690 Cinebench R15 - Cinebench R15 OpenGL 64 Bit
min: 13.4 avg: 13.7 median: 13.7 (1%) max: 14 fps
Cinebench R15 OpenGL Ref. Match 64 Bit + Qualcomm Adreno 690 Cinebench R15 - Cinebench R15 OpenGL Ref. Match 64 Bit
98 % (98%)
GFXBench - GFXBench 5.0 4K Aztec Ruins High Tier Offscreen
min: 4.1 avg: 4.5 median: 4.5 (2%) max: 4.8 fps
GFXBench - GFXBench 5.0 Aztec Ruins High Tier Offscreen
min: 9.4 avg: 10.6 median: 11 (2%) max: 12 fps
GFXBench - GFXBench 5.0 Aztec Ruins Normal Tier Offscreen
min: 24 avg: 27.9 median: 28 (2%) max: 30 fps
GFXBench - GFXBench Car Chase Offscreen
min: 23 avg: 25.1 median: 25 (3%) max: 27 fps
GFXBench 3.1 - GFXBench Manhattan ES 3.1 Offscreen
min: 38 avg: 42.2 median: 42 (1%) max: 46 fps
GFXBench 3.0 - GFXBench 3.0 Manhattan Offscreen
min: 60 avg: 64.3 median: 64 (4%) max: 69 fps
GFXBench (DX / GLBenchmark) 2.7 + Qualcomm Adreno 680 GFXBench (DX / GLBenchmark) 2.7 - GFXBench T-Rex HD Offscreen C24Z16
140.2 fps (1%)
GFXBench T-Rex HD Offscreen C24Z16 + ARM Mali-G68 MP4
min: 91 avg: 100.6 median: 101.5 (1%) max: 107 fps
Antutu v9 - AnTuTu v9 GPU
min: 109691 avg: 127274 median: 127419 (16%) max: 140863 Points
Basemark GPU 1.2 - Basemark GPU 1.2 Vulkan Official Medium Offscreen 1080
min: 25.38 avg: 34.5 median: 33.6 (0%) max: 39.37 fps
Geekbench 6.2 - Geekbench 6.2 GPU OpenCL
min: 2304 avg: 2340 median: 2322 (1%) max: 2394 Points
Geekbench 6.2 - Geekbench 6.2 GPU Vulkan
min: 2301 avg: 2326 median: 2301 (1%) max: 2375 Points
ComputeMark v2.1 - ComputeMark v2.1 Result
1890 Points (2%)
PassMark PerformanceTest Mobile V1 - PerformanceTest Mobile V1 2D Graphics Tests
min: 13104 avg: 21339 median: 23126 (23%) max: 26121 Points
PassMark PerformanceTest Mobile V1 - PerformanceTest Mobile V1 3D Graphics Tests
min: 4174 avg: 20568 median: 23564 (41%) max: 27937 Points
Power Consumption - Furmark Stress Test Power Consumption - external Monitor *
12.6 Watt (2%)
min: 17 avg: 19.7 median: 19.7 (3%) max: 22.3 Watt
Power Consumption - The Witcher 3 Power Consumption - external Monitor *
15.8 Watt (2%)
Power Consumption - Witcher 3 Power Consumption *
16.4 Watt (4%)
Power Consumption - GFXBench Aztec Ruins Normal Tier Offscreen Power Consumption 150cd *
min: 2.95 avg: 4.4 median: 4.1 (2%) max: 7.55 Watt
Average Benchmarks Qualcomm Adreno 680 → 0% n= Average Benchmarks ARM Mali-G68 MP4 → 0% n= Average Benchmarks Qualcomm Adreno 690 → 0% n=
- Range of benchmark values for this graphics card
- Average benchmark values for this graphics card
* Smaller numbers mean a higher performance
1 This benchmark is not used for the average calculation
Game Benchmarks The following benchmarks stem from our benchmarks of review laptops. The performance depends on the used graphics memory, clock rate, processor, system settings, drivers, and operating systems. So the results don't have to be representative for all laptops with this GPU. For detailed information on the benchmark results, click on the fps number.
Mali-G68 MP4:
30 30 [X] Realme 11 Pro 2.0.4
MediaTek Dimensity 7050 2GHz
Mali-G68 MP4
min:
25 fps, max:
32 fps
~ 30 fps
Mali-G68 MP4:
30 30 [X] Realme 11 Pro 2.0.4
MediaTek Dimensity 7050 2GHz
Mali-G68 MP4
min:
28 fps, max:
31 fps
~ 30 fps
Mali-G68 MP4:
27 35 ~ 31 fps
Mali-G68 MP4:
40 40 [X] Vivo V23 5G 2.0.0
MediaTek Dimensity 920 2GHz
Mali-G68 MP4
min:
38 fps, max:
41 fps
40 60 ~ 45 fps
Mali-G68 MP4:
71 [X] Vivo V23 5G 1.8.16
MediaTek Dimensity 920 2GHz
Mali-G68 MP4
min:
35 fps, max:
86 fps
fps
Mali-G68 MP4:
30 30 30 ~ 30 fps
Mali-G68 MP4:
60 60 [X] Lenovo Tab P12 3.16.1
MediaTek Dimensity 7050 2GHz
Mali-G68 MP4
min:
58 fps, max:
60 fps
120 ~ 80 fps
Qualcomm Adreno 690 low med. high ultra QHD 4K F1 22 26 22.5 17 12.6 X-Plane 11.11 14 12 11 Final Fantasy XV Benchmark 19 12.3 7.29 Dota 2 Reborn 58 55 44 37 The Witcher 3 25 16 10 4 GTA V 29.9 < 30 fps < 60 fps < 120 fps ≥ 120 fps 5 1 4 1 4 1 2 1
ARM Mali-G68 MP4 low med. high ultra QHD 4K Diablo Immortal 30 30 Genshin Impact 34 31 Armajet 76 PUBG Mobile 49 45 37 Dead Trigger 2 71 Asphalt 9: Legends 30 30 Subway Surfers 80 < 30 fps < 60 fps < 120 fps ≥ 120 fps 4 1 2 3 2
For more games that might be playable and a list of all games and graphics cards visit our Gaming List
v1.26
log 02. 06:14:29
#0 checking url part for id 9846 +0s ... 0s
#1 checking url part for id 10953 +0s ... 0s
#2 checking url part for id 11411 +0s ... 0s
#3 not redirecting to Ajax server +0s ... 0s
#4 did not recreate cache, as it is less than 5 days old! Created at Wed, 01 May 2024 05:36:19 +0200 +0.001s ... 0.001s
#5 composed specs +0.134s ... 0.135s
#6 did output specs +0s ... 0.135s
#7 start showIntegratedCPUs +0s ... 0.135s
#8 getting avg benchmarks for device 9846 +0.043s ... 0.178s
#9 got single benchmarks 9846 +0.014s ... 0.191s
#10 getting avg benchmarks for device 10953 +0.001s ... 0.193s
#11 got single benchmarks 10953 +0.072s ... 0.265s
#12 getting avg benchmarks for device 11411 +0.02s ... 0.285s
#13 got single benchmarks 11411 +0.012s ... 0.297s
#14 got avg benchmarks for devices +0s ... 0.297s
#15 min, max, avg, median took s +0.159s ... 0.455s
#16 before gaming benchmark output +0s ... 0.455s
#17 Got 95 rows for game benchmarks. +0.036s ... 0.492s
#18 composed SQL query for gamebenchmarks +0s ... 0.492s
#19 got data and put it in $dataArray +0.008s ... 0.5s
#20 benchmarks composed for output. +0.031s ... 0.531s
#21 calculated avg scores. +0s ... 0.531s
#22 return log +0.002s ... 0.533s
Please share our article, every link counts!
Redaktion, 2017-09- 8 (Update: 2023-07- 1)
 Deutsch
 English
 Español
 Français
 Italiano
 Nederlands
 Polski
 Português
 Русский
 Türkçe
 Svenska
 Chinese
 Magyar