Notebookcheck Logo

AMD Ryzen AI 400 Performance Analysis: Gorgon Point debuts with only minor improvements

Zen 5 Refresh.

AMD is only cautiously updating its mobile processors for 2026. Apart from a slightly higher clock rate, support for faster RAM, and faster NPUs, the new Gorgon Point CPUs do not differ from last year's Strix Point models, so Zen 5 cores and the familiar RDNA 3.5 iGPUs are still used.
AMD Ryzen AI 400 Gorgon Point APU performance and efficiency analysis. (Image Source: AMD)

AMD announced the new Ryzen AI 400 mobile APUs codenamed Gorgon Point at this year's CES. However, this is only a relatively minor update compared to last year's Strix Point generation. 

The familiar Zen 5 architecture is still used for the processor cores, while the iGPUs continue to use RDNA 3.5 compute units (CUs). Laptops featuring Ryzen AI 400 mobile APUs are now available on the market.

Ryzen AI 400 "Gorgon Point" at a glance

AMD's new mobile processors are called Ryzen AI 400 and the same models as with last year's Ryzen AI 300 series APUs are once again available this time. Combinations of full Zen 5 cores and weaker Zen 5c cores that have less cache and lower clocks are used. 

The maximum CPU frequency has been increased by 100 MHz on some models and faster NPUs (50-60 TOPS) are now generally onboard, which is why all processors meet the requirements for Microsoft's Copilot+ certification. 

The speed of the main memory has also been increased and, depending on the model, is now 8,000-8,533 MHz. That being said, manufacturers can also install DDR5-5600 RAM in SO-DIMM modules.

AMD Ryzen AI 400 Overview (Source: AMD)

The processors are generally intended for the 28-54 W TDP range but, as was the case last year, expect to see laptop designs this year that can consume significantly more power up to 85 W.

Like the previous generation, the fastest iGPU, the Radeon 890M, is reserved for the two top models, the Ryzen AI 9 HX470 and Ryzen AI 9 HX 475, which only differ in terms of NPU performance (55 TOPS vs. 60 TOPS). 

The Ryzen AI 9 465 relies on the Radeon 880M, the Ryzen AI 7 450 on the Radeon 860M and the other three models on the Radeon 840M. There are no changes to the clock rates of the iGPUs.

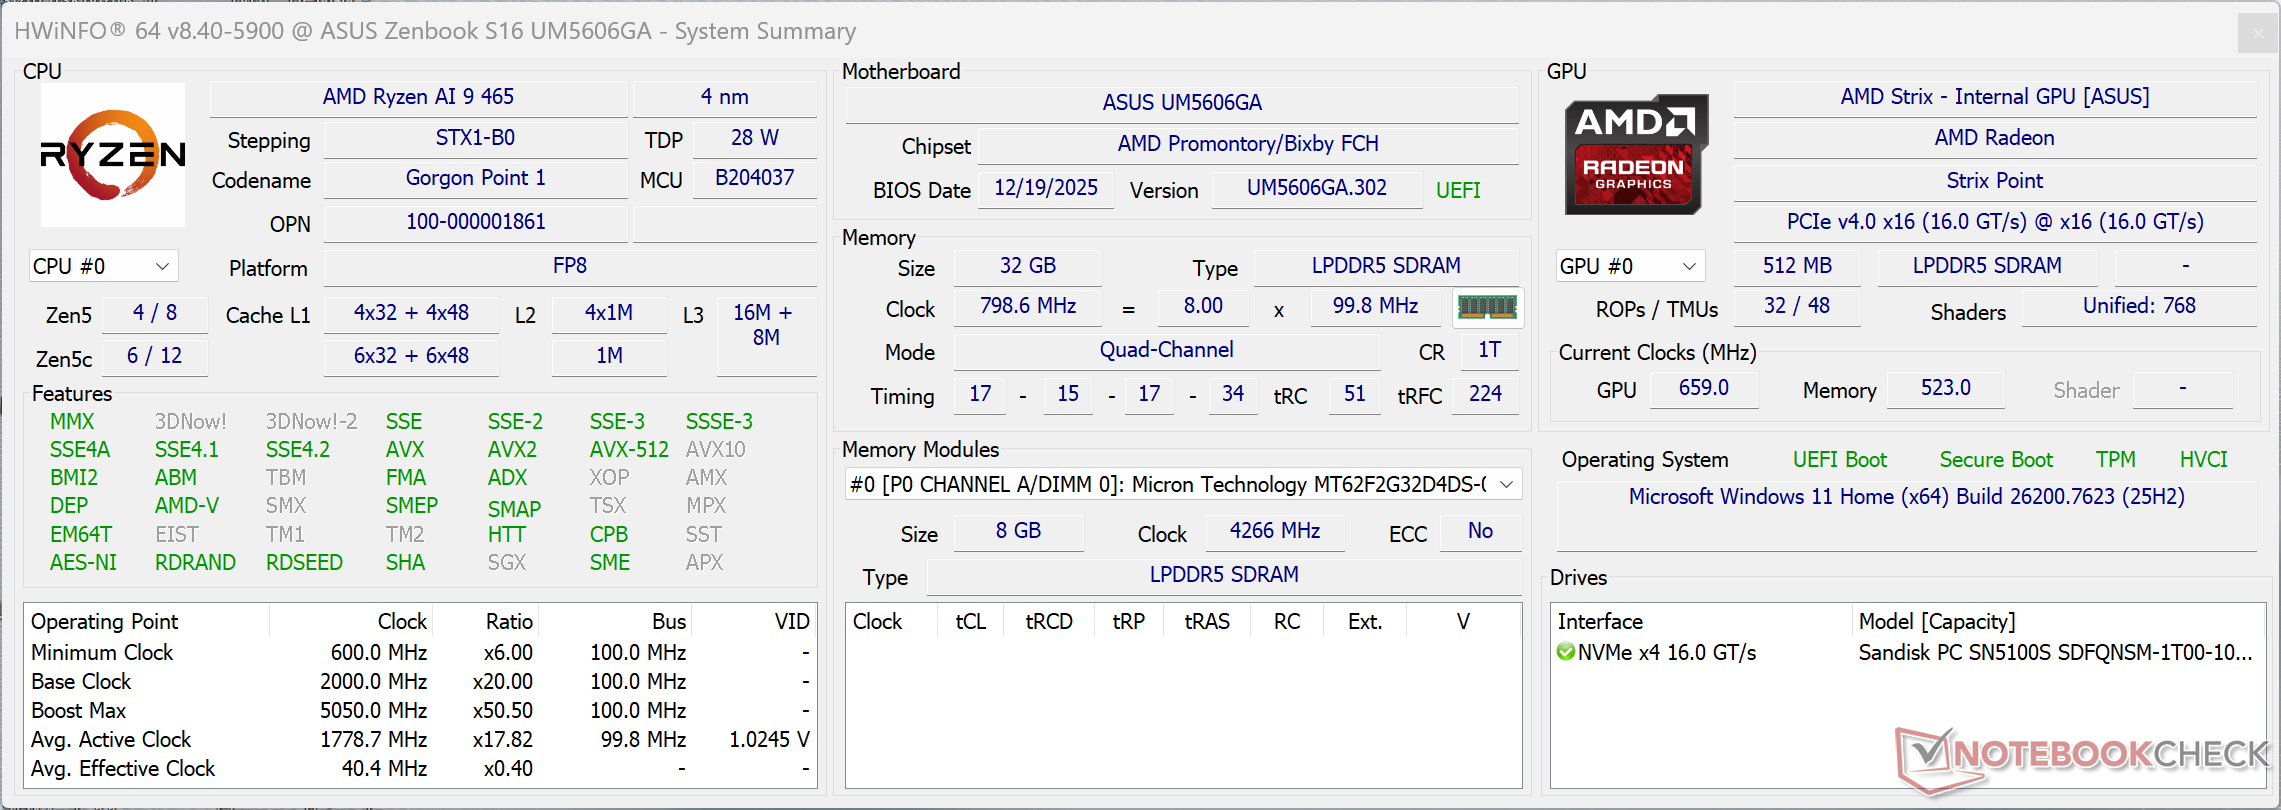
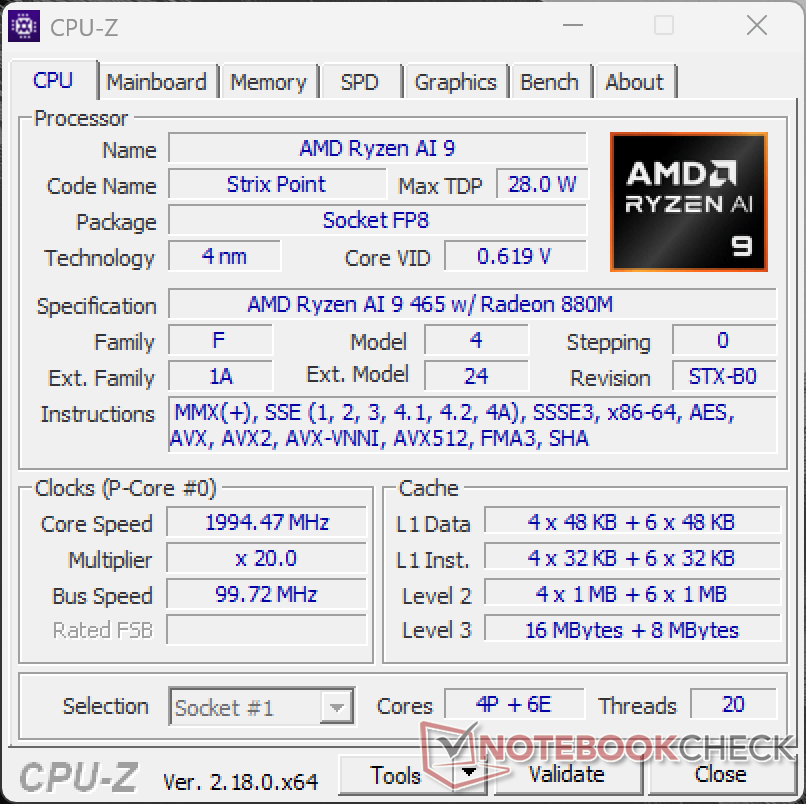
The test system: Asus Zenbook S16

The first device featuring the new Ryzen AI 400 processors to be presented to us is the new Asus Zenbook S16 UM5606GA, which is powered by the AMD Ryzen AI 9 465 along with the familiar Radeon 880M graphics card (Adrenalin driver version 25.20.32.06). 

Similar to last year's model, the Zenbook S16 is a very slim 16-inch laptop, which thus has an impact on the CPU power limits. At 45 W/35 W, this is not the fastest implementation, but at least Asus has raised the power limits slightly compared to a maximum of 33 W previously. 

While last year's model was equipped with LPDDR5x-7500 RAM, the new Zenbook S16 uses faster LPDDR5x-8533 memory. The full review of the new Asus Zenbook S16 will be published in the coming days.

AMD Ryzen AI 9 465: HWiNFO
CPU-Z
CPU-Z

Test procedure

In order to make a meaningful comparison between the different processors, we look at the power consumption in addition to the pure performance in synthetic benchmarks from which we then determine the efficiency. 

The consumption measurements are always carried out on an external display so that we can eliminate the different internal displays as influencing factors. Nevertheless, we measure the overall consumption of the system here and do not just compare the pure TDP values.

Single-core performance and efficiency

Let's start with single-core performance. Since the Ryzen AI 9 465, like its predecessor, the Ryzen AI 9 365, can reach a maximum of 5.0 GHz clocks, there is unsurprisingly no performance advantage here. 

This leaves it behind the current Intel chips (Arrow Lake and Lunar Lake). 

The Snapdragon CPUs without Turbo are narrowly beaten, but the variants with dual-core Turbo are slightly faster. 

Apple's M4 generation (let's not even talk about the M5) is still significantly faster than the Ryzen AI 9 465.

Performance rating: Percent | Cinebench 2024: CPU Single Core | Geekbench 6.5: Single-Core
Performance rating
Apple M5 (10 Cores)
MacBook Pro 14 2025 M5, 30.5, 27.5
100 pt
Apple M4 Pro (12 cores)
MacBook Pro 14 2024 M4 Pro Entry, 0, 0
88.4 pt
Apple M4 (10 cores)
MacBook Pro 14 2024 M4, 24, 24
86 pt
Intel Core Ultra 7 255H
RedmiBook Pro 14 2025, 115, 45
65.7 pt
Intel Core Ultra 9 285H
Prestige 16 AI Evo B2HMG, 115, 45
65.4 pt
Qualcomm Snapdragon X Elite X1E-84-100
Galaxy Book4 Edge 16 X1E-84-100, 0, 0
64.5 pt
Intel Core Ultra 7 268V
Surface Pro OLED Lunar Lake, 37, 30
64.2 pt
Intel Core Ultra 7 268V
Surface Laptop 7 15 Lunar Lake, 37, 30
64 pt
Qualcomm Snapdragon X Elite X1E-80-100
MagicBook Art 14 Snapdragon, 50, 35
63.3 pt
Intel Core Ultra 7 258V
Yoga 7 14 2in1 G10, 37, 25
62.5 pt
AMD Ryzen AI 7 350
IdeaPad Pro 5 14AKP G10, 65, 65
62.3 pt
Intel Core Ultra 7 258V
ThinkPad X9-15 Aura Edition, 37, 25
62.2 pt
Intel Core Ultra 7 255H
MagicBook Art 14 2025, 40, 26
62.1 pt
AMD Ryzen AI 9 HX 370
ProArt P16 H7606WI, 0, 0
62 pt
AMD Ryzen AI 7 350
Yoga Pro 7 14AKP G10, 85, 70
61.8 pt
AMD Ryzen AI 9 465
ZenBook S16 UM5606GA, 45, 35
61.5 pt
AMD Ryzen AI 9 365
ThinkBook 16 G7+ AMD, 65, 50
61.1 pt
AMD Ryzen AI 9 365
Yoga Pro 7 14ASP G9, 60, 54
60.9 pt
AMD Ryzen AI 9 HX 370
Zenbook S 16 UM5606-RK333W, 33, 28
60.6 pt
Intel Core Ultra 5 228V
ThinkPad T14s Gen 6 Intel, 35, 20
57.7 pt
Qualcomm Snapdragon X Elite X1E-78-100
OmniBook X 14, 0, 0
55.4 pt
Qualcomm Snapdragon X Plus X1P-42-100
Surface Laptop 13, 45, 35
53.7 pt
Qualcomm Snapdragon X X1-26-100
ZenBook A14 UX3407QA, 0, 0
48.6 pt
Cinebench 2024 / CPU Single Core
Apple M5 (10 Cores)
MacBook Pro 14 2025 M5, 30.5, 27.5
200 Points
Apple M4 Pro (12 cores)
MacBook Pro 14 2024 M4 Pro Entry, 0, 0
176 Points
Apple M4 (10 cores)
MacBook Pro 14 2024 M4, 24, 24
174 Points
Intel Core Ultra 7 255H
RedmiBook Pro 14 2025, 115, 45
127.6 Points
Qualcomm Snapdragon X Elite X1E-84-100
Galaxy Book4 Edge 16 X1E-84-100, 0, 0
127 Points
Intel Core Ultra 9 285H
Prestige 16 AI Evo B2HMG, 115, 45
127 Points
Intel Core Ultra 7 268V
Surface Pro OLED Lunar Lake, 37, 30
124.9 Points
Intel Core Ultra 7 268V
Surface Laptop 7 15 Lunar Lake, 37, 30
123.3 Points
Qualcomm Snapdragon X Elite X1E-80-100
MagicBook Art 14 Snapdragon, 50, 35
123 Points
Intel Core Ultra 7 258V
Yoga 7 14 2in1 G10, 37, 25
121 Points
Intel Core Ultra 7 258V
ThinkPad X9-15 Aura Edition, 37, 25
119.7 Points
Intel Core Ultra 7 255H
MagicBook Art 14 2025, 40, 26
119 Points
AMD Ryzen AI 7 350
IdeaPad Pro 5 14AKP G10, 65, 65
116.5 Points
AMD Ryzen AI 9 HX 370
ProArt P16 H7606WI, 0, 0
116 Points
AMD Ryzen AI 9 365
ThinkBook 16 G7+ AMD, 65, 50
115.8 Points
AMD Ryzen AI 7 350
Yoga Pro 7 14AKP G10, 85, 70
115.2 Points
AMD Ryzen AI 9 465
ZenBook S16 UM5606GA, 45, 35
115 Points
AMD Ryzen AI 9 HX 370
Zenbook S 16 UM5606-RK333W, 33, 28
113.6 Points
AMD Ryzen AI 9 365
Yoga Pro 7 14ASP G9, 60, 54
113.5 Points
Intel Core Ultra 5 228V
ThinkPad T14s Gen 6 Intel, 35, 20
112.5 Points
Qualcomm Snapdragon X Plus X1P-42-100
Surface Laptop 13, 45, 35
109 Points
Qualcomm Snapdragon X Elite X1E-78-100
OmniBook X 14, 0, 0
108 Points
Qualcomm Snapdragon X X1-26-100
ZenBook A14 UX3407QA, 0, 0
96 Points
Geekbench 6.5 / Single-Core
Apple M5 (10 Cores)
MacBook Pro 14 2025 M5, 30.5, 27.5
4326 Points
Apple M4 Pro (12 cores)
MacBook Pro 14 2024 M4 Pro Entry, 0, 0
3844 Points
Apple M4 Pro (12 cores)
MacBook Pro 14 2024 M4 Pro Entry, 0, 0
3837 Points
Apple M4 (10 cores)
MacBook Pro 14 2024 M4, 24, 24
3673 Points
Intel Core Ultra 7 255H
RedmiBook Pro 14 2025, 115, 45
2923 Points
Intel Core Ultra 9 285H
Prestige 16 AI Evo B2HMG, 115, 45
2912 Points
AMD Ryzen AI 7 350
IdeaPad Pro 5 14AKP G10, 65, 65
2874 Points
Intel Core Ultra 7 268V
Surface Laptop 7 15 Lunar Lake, 37, 30
2871 Points
AMD Ryzen AI 9 HX 370
ProArt P16 H7606WI, 0, 0
2857 Points
Intel Core Ultra 7 268V
Surface Pro OLED Lunar Lake, 37, 30
2855 Points
AMD Ryzen AI 7 350
Yoga Pro 7 14AKP G10, 85, 70
2854 Points
Qualcomm Snapdragon X Elite X1E-84-100
Galaxy Book4 Edge 16 X1E-84-100, 0, 0
2834 Points
AMD Ryzen AI 9 465
ZenBook S16 UM5606GA, 45, 35
2834 Points
AMD Ryzen AI 9 365
Yoga Pro 7 14ASP G9, 60, 54
2815 Points
Qualcomm Snapdragon X Elite X1E-80-100
MagicBook Art 14 Snapdragon, 50, 35
2813 Points
Intel Core Ultra 7 255H
MagicBook Art 14 2025, 40, 26
2797 Points
Intel Core Ultra 7 258V
ThinkPad X9-15 Aura Edition, 37, 25
2795 Points
Intel Core Ultra 7 258V
Yoga 7 14 2in1 G10, 37, 25
2789 Points
AMD Ryzen AI 9 HX 370
Zenbook S 16 UM5606-RK333W, 33, 28
2785 Points
AMD Ryzen AI 9 365
ThinkBook 16 G7+ AMD, 65, 50
2782 Points
Intel Core Ultra 5 228V
ThinkPad T14s Gen 6 Intel, 35, 20
2562 Points
Qualcomm Snapdragon X Elite X1E-78-100
OmniBook X 14, 0, 0
2454 Points
Qualcomm Snapdragon X Plus X1P-42-100
Surface Laptop 13, 45, 35
2287 Points
Qualcomm Snapdragon X X1-26-100
ZenBook A14 UX3407QA, 0, 0
2126 Points
Performance rating: Percent | Cinebench 2024: CPU Single Core | Geekbench 6.5: Single-Core

There are improvements in single-core efficiency, which indicates optimizations in the manufacturing process. We see an advantage of around 20% compared to the old Zenbook S16 with the Ryzen AI 9 HX 370 and also slight advantages over the slower Ryzen AI 7 350 APUs. 

This puts the new Ryzen AI 9 465 roughly on a par with the current Arrow Lake models from Intel, but the Lunar Lake chips are more efficient. 

The ARM competition from Apple and Qualcomm is still significantly more efficient under single-core load.

Power Consumption / Cinebench 2024 Single Power Efficiency - external Monitor
Apple M4 (10 cores)
MacBook Pro 14 2024 M4, 24, 24
13.6 Points per Watt
Apple M5 (10 Cores)
MacBook Pro 14 2025 M5, 30.5, 27.5
13.1 Points per Watt
Qualcomm Snapdragon X Plus X1P-42-100
Surface Laptop 13, 45, 35
9.73 Points per Watt
Apple M4 Pro (12 cores)
MacBook Pro 14 2024 M4 Pro Entry, 0, 0
9.24 Points per Watt
Qualcomm Snapdragon X X1-26-100
ZenBook A14 UX3407QA, 0, 0
8.28 Points per Watt
Qualcomm Snapdragon X Elite X1E-78-100
OmniBook X 14, 0, 0
7.77 Points per Watt
Intel Core Ultra 7 258V
Yoga 7 14 2in1 G10, 37, 25
6.47 Points per Watt
Qualcomm Snapdragon X Elite X1E-84-100
Galaxy Book4 Edge 16 X1E-84-100, 0, 0
6.32 Points per Watt
Qualcomm Snapdragon X Elite X1E-80-100
MagicBook Art 14 Snapdragon, 50, 35
5.86 Points per Watt
Intel Core Ultra 5 228V
ThinkPad T14s Gen 6 Intel, 35, 20
5.77 Points per Watt
Intel Core Ultra 7 268V
Surface Pro OLED Lunar Lake, 37, 30
5.68 Points per Watt
Intel Core Ultra 7 268V
Surface Laptop 7 15 Lunar Lake, 37, 30
5.43 Points per Watt
Intel Core Ultra 7 258V
ThinkPad X9-15 Aura Edition, 37, 25
5.25 Points per Watt
Intel Core Ultra 7 255H
RedmiBook Pro 14 2025, 115, 45
4.62 Points per Watt
AMD Ryzen AI 9 465
ZenBook S16 UM5606GA, 45, 35
4.39 Points per Watt
AMD Ryzen AI 7 350
IdeaPad Pro 5 14AKP G10, 65, 65
4.13 Points per Watt
AMD Ryzen AI 7 350
Yoga Pro 7 14AKP G10, 85, 70
4.04 Points per Watt
AMD Ryzen AI 9 365
Yoga Pro 7 14ASP G9, 60, 54
4.01 Points per Watt
Intel Core Ultra 7 255H
MagicBook Art 14 2025, 40, 26
3.83 Points per Watt
Intel Core Ultra 9 285H
Prestige 16 AI Evo B2HMG, 115, 45
3.76 Points per Watt
AMD Ryzen AI 9 HX 370
Zenbook S 16 UM5606-RK333W, 33, 28
3.64 Points per Watt
AMD Ryzen AI 9 HX 370
ProArt P16 H7606WI, 0, 0
3.4 Points per Watt
Power Consumption / Cinebench 2024 Single Power (external Monitor)
AMD Ryzen AI 9 HX 370
ProArt P16 H7606WI, 0, 0
34.1 (30.9min, 32.1P1 - 51.4max) Watt *
Intel Core Ultra 9 285H
Prestige 16 AI Evo B2HMG, 115, 45
33.8 (28.9min, 30.9P1 - 84.6max) Watt *
AMD Ryzen AI 9 HX 370
Zenbook S 16 UM5606-RK333W, 33, 28
31.2 (28.6min, 29.4P1 - 41max) Watt *
Intel Core Ultra 7 255H
MagicBook Art 14 2025, 40, 26
31.1 (25.7min, 27.2P1 - 39.8max) Watt *
AMD Ryzen AI 7 350
Yoga Pro 7 14AKP G10, 85, 70
28.5 (23.6min, 26.4P1 - 54max) Watt *
AMD Ryzen AI 9 365
Yoga Pro 7 14ASP G9, 60, 54
28.3 (24.6min, 25.9P1 - 45.7max) Watt *
AMD Ryzen AI 7 350
IdeaPad Pro 5 14AKP G10, 65, 65
28.2 (24.7min, 25.7P1 - 47.7max) Watt *
AMD Ryzen AI 7 350
IdeaPad Pro 5 14AKP G10, 65, 65
28.1 (24.5min, 26.2P1 - 69.1max) Watt *
Intel Core Ultra 7 255H
RedmiBook Pro 14 2025, 115, 45
27.6 (22.5min, 24.9P1 - 48.7max) Watt *
AMD Ryzen AI 9 465
ZenBook S16 UM5606GA, 45, 35
26.2 (24.2min, 25P1 - 47.1max) Watt *
Intel Core Ultra 7 258V
ThinkPad X9-15 Aura Edition, 37, 25
22.8 (19min, 20.6P1 - 25.7max) Watt *
Intel Core Ultra 7 268V
Surface Laptop 7 15 Lunar Lake, 37, 30
22.7 (18.3min, 19.7P1 - 36.2max) Watt *
Intel Core Ultra 7 268V
Surface Pro OLED Lunar Lake, 37, 30
22 (18.9min, 19.5P1 - 41.3max) Watt *
Qualcomm Snapdragon X Elite X1E-80-100
MagicBook Art 14 Snapdragon, 50, 35
21 (17.4min, 18.3P1 - 28.2max) Watt *
Qualcomm Snapdragon X Elite X1E-84-100
Galaxy Book4 Edge 16 X1E-84-100, 0, 0
20.1 (13.1min, 17.2P1 - 34max) Watt *
Intel Core Ultra 5 228V
ThinkPad T14s Gen 6 Intel, 35, 20
19.5 (17.5min, 17.9P1 - 26.2max) Watt *
Intel Core Ultra 7 258V
Yoga 7 14 2in1 G10, 37, 25
18.7 (14.8min, 15.8P1 - 27.8max) Watt *
Apple M4 Pro (12 cores)
MacBook Pro 14 2024 M4 Pro Entry, 0, 0
18.4 (16.8min, 17.4P1 - 36.7max) Watt *
Apple M5 (10 Cores)
MacBook Pro 14 2025 M5, 30.5, 27.5
15.3 (14.3min, 14.4P1 - 18.8max) Watt *
Qualcomm Snapdragon X Elite X1E-78-100
OmniBook X 14, 0, 0
13.9 (12.6min, 12.8P1 - 26.8max) Watt *
Apple M4 (10 cores)
MacBook Pro 14 2024 M4, 24, 24
12.8 (11.5min, 11.9P1 - 14.4max) Watt *
Qualcomm Snapdragon X X1-26-100
ZenBook A14 UX3407QA, 0, 0
11.6 (10.4min, 10.7P1 - 16.2max) Watt *
Qualcomm Snapdragon X Plus X1P-42-100
Surface Laptop 13, 45, 35
11.2 (9.99min, 10.4P1 - 27.4max) Watt *

* ... smaller is better

Multi-core performance and efficiency

The multi-core performance of the new Ryzen 9 465 has also increased somewhat, as the results with 45 W/35 W are on a par with the old Ryzen 9 365 with higher power limits (60 W/54 W).

As expected, the Intel Lunar Lake processors are clearly beaten in the multi-core tests. Arrow Lake chips are sometimes faster but also require significantly more power (short-term power limits of up to 115 W).

The Snapdragon chips are generally slower, but Apple's M4 SoC is a few percent faster. The M5 and M4 Pro SoCs show significant advantages in multi-core.

Performance rating: Percent | Cinebench 2024: CPU Multi Core | Geekbench 6.5: Multi-Core
Performance rating
Apple M4 Pro (12 cores)
MacBook Pro 14 2024 M4 Pro Entry, 0, 0
99.4 pt
Apple M5 (10 Cores)
MacBook Pro 14 2025 M5, 30.5, 27.5
85 pt
AMD Ryzen AI 9 HX 370
ProArt P16 H7606WI, 0, 0
79.5 pt
Intel Core Ultra 7 255H
RedmiBook Pro 14 2025, 115, 45
79.4 pt
Intel Core Ultra 9 285H
Prestige 16 AI Evo B2HMG, 115, 45
76.7 pt
Apple M4 (10 cores)
MacBook Pro 14 2024 M4, 24, 24
71.3 pt
AMD Ryzen AI 9 365
Yoga Pro 7 14ASP G9, 60, 54
69.2 pt
Qualcomm Snapdragon X Elite X1E-80-100
MagicBook Art 14 Snapdragon, 50, 35
68.9 pt
AMD Ryzen AI 9 465
ZenBook S16 UM5606GA, 45, 35
68.8 pt
Qualcomm Snapdragon X Elite X1E-84-100
Galaxy Book4 Edge 16 X1E-84-100, 0, 0
68.5 pt
AMD Ryzen AI 7 350
Yoga Pro 7 14AKP G10, 85, 70
68.2 pt
AMD Ryzen AI 7 350
IdeaPad Pro 5 14AKP G10, 65, 65
68.2 pt
AMD Ryzen AI 9 HX 370
Zenbook S 16 UM5606-RK333W, 33, 28
65.4 pt
Intel Core Ultra 7 255H
MagicBook Art 14 2025, 40, 26
63.5 pt
Qualcomm Snapdragon X Elite X1E-78-100
OmniBook X 14, 0, 0
61 pt
Qualcomm Snapdragon X Plus X1P-42-100
Surface Laptop 13, 45, 35
52.4 pt
Intel Core Ultra 7 268V
Surface Pro OLED Lunar Lake, 37, 30
49.4 pt
Intel Core Ultra 7 268V
Surface Laptop 7 15 Lunar Lake, 37, 30
48.5 pt
Qualcomm Snapdragon X X1-26-100
ZenBook A14 UX3407QA, 0, 0
48.3 pt
Intel Core Ultra 7 258V
Yoga 7 14 2in1 G10, 37, 25
47.2 pt
Intel Core Ultra 7 258V
ThinkPad X9-15 Aura Edition, 37, 25
47 pt
Intel Core Ultra 5 228V
ThinkPad T14s Gen 6 Intel, 35, 20
42.2 pt
Cinebench 2024 / CPU Multi Core
Apple M4 Pro (12 cores)
MacBook Pro 14 2024 M4 Pro Entry, 0, 0
1435 Points
Apple M4 Pro (12 cores)
MacBook Pro 14 2024 M4 Pro Entry, 0, 0
1403 Points
AMD Ryzen AI 9 HX 370
ProArt P16 H7606WI, 0, 0
1213 Points
Apple M5 (10 Cores)
MacBook Pro 14 2025 M5, 30.5, 27.5
1172 Points
Intel Core Ultra 7 255H
RedmiBook Pro 14 2025, 115, 45
1053 Points
AMD Ryzen AI 9 365
Yoga Pro 7 14ASP G9, 60, 54
996 Points
Intel Core Ultra 9 285H
Prestige 16 AI Evo B2HMG, 115, 45
991 Points
Apple M4 (10 cores)
MacBook Pro 14 2024 M4, 24, 24
986 Points
AMD Ryzen AI 7 350
IdeaPad Pro 5 14AKP G10, 65, 65
977 Points
AMD Ryzen AI 7 350
Yoga Pro 7 14AKP G10, 85, 70
973 Points
AMD Ryzen AI 9 465
ZenBook S16 UM5606GA, 45, 35
953 Points
Qualcomm Snapdragon X Elite X1E-80-100
MagicBook Art 14 Snapdragon, 50, 35
926 Points
AMD Ryzen AI 9 HX 370
Zenbook S 16 UM5606-RK333W, 33, 28
921 Points
Qualcomm Snapdragon X Elite X1E-84-100
Galaxy Book4 Edge 16 X1E-84-100, 0, 0
866 Points
Qualcomm Snapdragon X Elite X1E-78-100
OmniBook X 14, 0, 0
840 Points
Intel Core Ultra 7 255H
MagicBook Art 14 2025, 40, 26
810 Points
Qualcomm Snapdragon X Plus X1P-42-100
Surface Laptop 13, 45, 35
723 Points
Qualcomm Snapdragon X X1-26-100
ZenBook A14 UX3407QA, 0, 0
646 Points
Intel Core Ultra 7 268V
Surface Pro OLED Lunar Lake, 37, 30
619 Points
Intel Core Ultra 7 268V
Surface Laptop 7 15 Lunar Lake, 37, 30
600 Points
Intel Core Ultra 7 258V
Yoga 7 14 2in1 G10, 37, 25
580 Points
Intel Core Ultra 7 258V
ThinkPad X9-15 Aura Edition, 37, 25
574 Points
Intel Core Ultra 5 228V
ThinkPad T14s Gen 6 Intel, 35, 20
506 Points
Geekbench 6.5 / Multi-Core
Apple M4 Pro (12 cores)
MacBook Pro 14 2024 M4 Pro Entry, 0, 0
20458 Points
Apple M4 Pro (12 cores)
MacBook Pro 14 2024 M4 Pro Entry, 0, 0
20385 Points
Apple M5 (10 Cores)
MacBook Pro 14 2025 M5, 30.5, 27.5
18054 Points
Intel Core Ultra 7 255H
RedmiBook Pro 14 2025, 115, 45
17489 Points
Intel Core Ultra 9 285H
Prestige 16 AI Evo B2HMG, 115, 45
17262 Points
Qualcomm Snapdragon X Elite X1E-84-100
Galaxy Book4 Edge 16 X1E-84-100, 0, 0
15665 Points
AMD Ryzen AI 9 HX 370
ProArt P16 H7606WI, 0, 0
15221 Points
Apple M4 (10 cores)
MacBook Pro 14 2024 M4, 24, 24
15128 Points
Qualcomm Snapdragon X Elite X1E-80-100
MagicBook Art 14 Snapdragon, 50, 35
14998 Points
AMD Ryzen AI 9 465
ZenBook S16 UM5606GA, 45, 35
14562 Points
Intel Core Ultra 7 255H
MagicBook Art 14 2025, 40, 26
14454 Points
AMD Ryzen AI 9 365
Yoga Pro 7 14ASP G9, 60, 54
14118 Points
AMD Ryzen AI 7 350
Yoga Pro 7 14AKP G10, 85, 70
14028 Points
AMD Ryzen AI 7 350
IdeaPad Pro 5 14AKP G10, 65, 65
13988 Points
AMD Ryzen AI 9 HX 370
Zenbook S 16 UM5606-RK333W, 33, 28
13648 Points
Qualcomm Snapdragon X Elite X1E-78-100
OmniBook X 14, 0, 0
12971 Points
Intel Core Ultra 7 268V
Surface Pro OLED Lunar Lake, 37, 30
11388 Points
Intel Core Ultra 7 268V
Surface Laptop 7 15 Lunar Lake, 37, 30
11279 Points
Qualcomm Snapdragon X Plus X1P-42-100
Surface Laptop 13, 45, 35
11125 Points
Intel Core Ultra 7 258V
ThinkPad X9-15 Aura Edition, 37, 25
11037 Points
Intel Core Ultra 7 258V
Yoga 7 14 2in1 G10, 37, 25
11027 Points
Qualcomm Snapdragon X X1-26-100
ZenBook A14 UX3407QA, 0, 0
10550 Points
Intel Core Ultra 5 228V
ThinkPad T14s Gen 6 Intel, 35, 20
10036 Points
Performance rating: Percent | Cinebench 2024: CPU Multi Core | Geekbench 6.5: Multi-Core

Multi-core efficiency sees some small gains as well. In addition to the standard power limits, we also carried out the efficiency measurement with fixed power limits of 35 W, 28 W and 20 W. 

As expected, efficiency improves with lower power limits, although the difference between 28 and 35 W is only minimal. 

At 20 W, however, the efficiency improves noticeably and here the Ryzen AI 9 465 is almost on a par with the M4 SoC.

Power Consumption / Cinebench 2024 Multi Power Efficiency - external Monitor
Apple M5 (10 Cores)
MacBook Pro 14 2025 M5, 30.5, 27.5
27.5 Points per Watt
Apple M4 (10 cores)
MacBook Pro 14 2024 M4, 24, 24
24.8 Points per Watt
Qualcomm Snapdragon X Elite X1E-84-100
Galaxy Book4 Edge 16 X1E-84-100, 0, 0
22.1 Points per Watt
AMD Ryzen AI 9 465
ZenBook S16 UM5606GA, 20, 20
22.1 Points per Watt
Apple M4 Pro (12 cores)
MacBook Pro 14 2024 M4 Pro Entry, 0, 0
21.8 Points per Watt
Qualcomm Snapdragon X Elite X1E-78-100
OmniBook X 14, 0, 0
20.5 Points per Watt
AMD Ryzen AI 9 HX 370
Zenbook S 16 UM5606-RK333W, 33, 28
19.7 Points per Watt
Intel Core Ultra 9 285H
Prestige 16 AI Evo B2HMG, 115, 45
19.1 Points per Watt
Qualcomm Snapdragon X Plus X1P-42-100
Surface Laptop 13, 45, 35
18 Points per Watt
AMD Ryzen AI 9 465
ZenBook S16 UM5606GA, 28, 28
18 Points per Watt
Qualcomm Snapdragon X X1-26-100
ZenBook A14 UX3407QA, 0, 0
17.9 Points per Watt
Qualcomm Snapdragon X Elite X1E-80-100
MagicBook Art 14 Snapdragon, 50, 35
17.1 Points per Watt
AMD Ryzen AI 9 465
ZenBook S16 UM5606GA, 35, 35
17 Points per Watt
AMD Ryzen AI 9 465
ZenBook S16 UM5606GA, 45, 35
16.8 Points per Watt
Intel Core Ultra 7 255H
MagicBook Art 14 2025, 40, 26
16.7 Points per Watt
Intel Core Ultra 7 258V
Yoga 7 14 2in1 G10, 37, 25
15.9 Points per Watt
Intel Core Ultra 7 268V
Surface Pro OLED Lunar Lake, 37, 30
15 Points per Watt
Intel Core Ultra 5 228V
ThinkPad T14s Gen 6 Intel, 35, 20
14.7 Points per Watt
Intel Core Ultra 7 258V
ThinkPad X9-15 Aura Edition, 37, 25
14.1 Points per Watt
Intel Core Ultra 7 255H
RedmiBook Pro 14 2025, 115, 45
12.9 Points per Watt
Intel Core Ultra 7 268V
Surface Laptop 7 15 Lunar Lake, 37, 30
12.7 Points per Watt
AMD Ryzen AI 9 365
Yoga Pro 7 14ASP G9, 60, 54
12.5 Points per Watt
AMD Ryzen AI 7 350
IdeaPad Pro 5 14AKP G10, 65, 65
10.3 Points per Watt
AMD Ryzen AI 9 HX 370
ProArt P16 H7606WI, 0, 0
10.2 Points per Watt
AMD Ryzen AI 7 350
Yoga Pro 7 14AKP G10, 85, 70
9.63 Points per Watt
Power Consumption / Cinebench 2024 Multi Power (external Monitor)
AMD Ryzen AI 9 HX 370
ProArt P16 H7606WI, 0, 0
119.3 (113.6min, 113.9P1 - 121.7max) Watt *
AMD Ryzen AI 7 350
Yoga Pro 7 14AKP G10, 85, 70
101 (88.3min, 91.5P1 - 104.3max) Watt *
AMD Ryzen AI 7 350
IdeaPad Pro 5 14AKP G10, 65, 65
95 (82.2min, 84.7P1 - 98.7max) Watt *
Intel Core Ultra 7 255H
RedmiBook Pro 14 2025, 115, 45
81.7 (68.4min, 68.8P1 - 101.8max) Watt *
AMD Ryzen AI 9 365
Yoga Pro 7 14ASP G9, 60, 54
80 (76.7min, 77P1 - 86.8max) Watt *
Apple M4 Pro (12 cores)
MacBook Pro 14 2024 M4 Pro Entry, 0, 0
65.7 (22.8min, 60.2P1 - 73.1max) Watt *
AMD Ryzen AI 9 465
ZenBook S16 UM5606GA, 45, 35
56.7 (53.3min, 53.8P1 - 68.6max) Watt *
AMD Ryzen AI 9 465
ZenBook S16 UM5606GA, 35, 35
54.6 (52.7min, 53.2P1 - 56.9max) Watt *
Qualcomm Snapdragon X Elite X1E-80-100
MagicBook Art 14 Snapdragon, 50, 35
54 (46.8min, 47.8P1 - 67.4max) Watt *
Intel Core Ultra 9 285H
Prestige 16 AI Evo B2HMG, 115, 45
51.9 (42.9min, 43.4P1 - 102.8max) Watt *
Intel Core Ultra 7 255H
MagicBook Art 14 2025, 40, 26
48.4 (44.2min, 44.5P1 - 64.9max) Watt *
Intel Core Ultra 7 268V
Surface Laptop 7 15 Lunar Lake, 37, 30
47.4 (41min, 42.5P1 - 57.3max) Watt *
AMD Ryzen AI 9 465
ZenBook S16 UM5606GA, 28, 28
46.9 (44.8min, 44.9P1 - 49max) Watt *
AMD Ryzen AI 9 HX 370
Zenbook S 16 UM5606-RK333W, 33, 28
46.7 (28.4min, 29.3P1 - 55.2max) Watt *
Apple M5 (10 Cores)
MacBook Pro 14 2025 M5, 30.5, 27.5
42.6 (39.1min, 39.6P1 - 52.8max) Watt *
Intel Core Ultra 7 268V
Surface Pro OLED Lunar Lake, 37, 30
41.3 (38.9min, 39.6P1 - 41.6max) Watt *
Qualcomm Snapdragon X Elite X1E-78-100
OmniBook X 14, 0, 0
40.9 (29min, 29.2P1 - 68max) Watt *
Intel Core Ultra 7 258V
ThinkPad X9-15 Aura Edition, 37, 25
40.8 (8.41min, 38.5P1 - 58.2max) Watt *
Qualcomm Snapdragon X Plus X1P-42-100
Surface Laptop 13, 45, 35
40.1 (33.7min, 36.4P1 - 52.7max) Watt *
Apple M4 (10 cores)
MacBook Pro 14 2024 M4, 24, 24
39.8 (35.5min, 36.5P1 - 42.4max) Watt *
Qualcomm Snapdragon X Elite X1E-84-100
Galaxy Book4 Edge 16 X1E-84-100, 0, 0
39.1 (35.6min, 36.4P1 - 61.3max) Watt *
Intel Core Ultra 7 258V
Yoga 7 14 2in1 G10, 37, 25
36.4 (33.4min, 34P1 - 51.2max) Watt *
Qualcomm Snapdragon X X1-26-100
ZenBook A14 UX3407QA, 0, 0
36.1 (27.6min, 30.2P1 - 45max) Watt *
AMD Ryzen AI 9 465
ZenBook S16 UM5606GA, 20, 20
34.8 (31.7min, 33.2P1 - 36.6max) Watt *
Intel Core Ultra 5 228V
ThinkPad T14s Gen 6 Intel, 35, 20
34.4 (27.9min, 28.9P1 - 53.8max) Watt *

* ... smaller is better

CPU performance with different power limits

We also checked the CPU multi-core performance at various power limits, whereby we were able to use a maximum of 35 W as the cooling of the Zenbook S16 was the limiting factor here.

The Ryzen AI 9 HX 370 has an advantage here due to the additional CPU cores, but Gorgon Point remains faster compared to the Intel Arrow Lake processors like the Core Ultra 9 285H or the Core Ultra 7 255H, especially in this TDP range up to 35 W. 

Lunar Lake chips are easily beaten here anyway with their low multi-core performance.

Performance with different power limits
Cinebench 2024 Multi-Core
CPU 20 Watt 28 W 35 W 45 W
AMD Ryzen AI 9 465 768 points 842 points 930 points
AMD Ryzen AI 9 HX370 760 points 927 points 1022 points 1107 points
AMD Ryzen 7 PRO 350 604 points 739 points 813 points
Intel Core Ultra 9 285H 597 points 778 points 892 points 977 points
Intel Core Ultra 7 255H 492 points 696 points 834 points 962 points
Intel Core Ultra 7 258V 512 points 587 points
Intel Core Ultra 7 155H 438 points 637 points 752 points 887 points

RAM Performance

We used AIDA64 benchmarks to evaluate memory performance. With the faster LPDDR5x-8533 RAM, the new Ryzen AI 9 465 can secure a slight lead over the Ryzen AI 9 HX 370 with LPDDR5x-7500. 

However, the Lunar Lake chips from Intel are on a comparable level.

AIDA64 / Memory Copy
Lenovo ThinkPad X9-15 Aura Edition
Intel Core Ultra 7 258V, Arc 140V
108661 MB/s
Lenovo Yoga Pro 7 14IAH10
Intel Core Ultra 9 285H, Arc 140T
107783 MB/s
Microsoft Surface Laptop 7 15 Lunar Lake
Intel Core Ultra 7 268V, Arc 140V
107108 MB/s
Asus ZenBook S16 UM5606GA
AMD Ryzen AI 9 465, Radeon 880M
97009 MB/s
Asus Zenbook S 16 UM5606-RK333W
AMD Ryzen AI 9 HX 370, Radeon 890M
90221 MB/s
Schenker XMG Evo 15 (M25)
Intel Core Ultra 7 255H, Arc 140T
89877 MB/s
Lenovo ThinkBook 16 G7+ AMD
AMD Ryzen AI 9 365, Radeon 880M
87648 MB/s
Average of class Multimedia
  (21158 - 109252, n=60, last 2 years)
77673 MB/s
Global Average -2
  (4514 - 234662, n=2096)
52121 MB/s
AIDA64 / Memory Read
Asus ZenBook S16 UM5606GA
AMD Ryzen AI 9 465, Radeon 880M
104171 MB/s
Asus Zenbook S 16 UM5606-RK333W
AMD Ryzen AI 9 HX 370, Radeon 890M
100903 MB/s
Lenovo ThinkBook 16 G7+ AMD
AMD Ryzen AI 9 365, Radeon 880M
97880 MB/s
Microsoft Surface Laptop 7 15 Lunar Lake
Intel Core Ultra 7 268V, Arc 140V
88341 MB/s
Lenovo ThinkPad X9-15 Aura Edition
Intel Core Ultra 7 258V, Arc 140V
87887 MB/s
Lenovo Yoga Pro 7 14IAH10
Intel Core Ultra 9 285H, Arc 140T
85696 MB/s
Schenker XMG Evo 15 (M25)
Intel Core Ultra 7 255H, Arc 140T
85557 MB/s
Average of class Multimedia
  (19699 - 125604, n=60, last 2 years)
79160 MB/s
Global Average -2
  (4031 - 271066, n=2057)
53821 MB/s
AIDA64 / Memory Write
Microsoft Surface Laptop 7 15 Lunar Lake
Intel Core Ultra 7 268V, Arc 140V
117888 MB/s
Lenovo ThinkPad X9-15 Aura Edition
Intel Core Ultra 7 258V, Arc 140V
117878 MB/s
Asus ZenBook S16 UM5606GA
AMD Ryzen AI 9 465, Radeon 880M
110061 MB/s
Asus Zenbook S 16 UM5606-RK333W
AMD Ryzen AI 9 HX 370, Radeon 890M
100401 MB/s
Lenovo ThinkBook 16 G7+ AMD
AMD Ryzen AI 9 365, Radeon 880M
96185 MB/s
Schenker XMG Evo 15 (M25)
Intel Core Ultra 7 255H, Arc 140T
87199 MB/s
Lenovo Yoga Pro 7 14IAH10
Intel Core Ultra 9 285H, Arc 140T
82553 MB/s
Average of class Multimedia
  (17733 - 117933, n=60, last 2 years)
74914 MB/s
Global Average -2
  (3506 - 242868, n=2062)
55430 MB/s
AIDA64 / Memory Latency
Average of class Multimedia
  (7 - 535, n=60, last 2 years)
127.9 ns *
Lenovo ThinkBook 16 G7+ AMD
AMD Ryzen AI 9 365, Radeon 880M
116 ns *
Lenovo Yoga Pro 7 14IAH10
Intel Core Ultra 9 285H, Arc 140T
116 ns *
Asus Zenbook S 16 UM5606-RK333W
AMD Ryzen AI 9 HX 370, Radeon 890M
112.4 ns *
Schenker XMG Evo 15 (M25)
Intel Core Ultra 7 255H, Arc 140T
111.5 ns *
Asus ZenBook S16 UM5606GA
AMD Ryzen AI 9 465, Radeon 880M
102.1 ns *
Microsoft Surface Laptop 7 15 Lunar Lake
Intel Core Ultra 7 268V, Arc 140V
97.4 ns *
Lenovo ThinkPad X9-15 Aura Edition
Intel Core Ultra 7 258V, Arc 140V
97.2 ns *
Global Average -2
  (8.7 - 536, n=2126)
89.6 ns *

* ... smaller is better

GPU performance

As mentioned earlier, there are no changes to integrated graphics, not even to the maximum clock rate. Only the slightly faster RAM may have a positive effect. 

The synthetic benchmarks show a slight advantage in some cases. Nevertheless, the AMD iGPU remains behind the current Intel Arc Graphics 140T and Arc Graphics 140V iGPUs. 

We will add further results for gaming performance and efficiency in the coming days.

3DMark / Time Spy Graphics
AMD Radeon 8060S
Asus ROG Flow Z13 GZ302EA-RU073W, 80
10224 Points
NVIDIA GeForce RTX 4060 Laptop GPU
Schenker Key 14 (M24), 100
10144 Points
NVIDIA GeForce RTX 4060 Laptop GPU
Asus ROG Zephyrus G16 GA605WV, 80
9286 Points
NVIDIA GeForce RTX 5050 Laptop
Lenovo Yoga Pro 9 16IAH10 RTX 5050, 100
9122 Points
NVIDIA GeForce RTX 4050 Laptop GPU
Lenovo IdeaPad Pro 5 16IMH G9 RTX 4050, 90
8574 Points
NVIDIA GeForce RTX 4050 Laptop GPU
Lenovo Yoga Pro 7 14IMH9, RTX 4050, 60
7342 Points
NVIDIA GeForce RTX 4050 Laptop GPU
Dell XPS 14 2024 OLED, 30
5107 Points
NVIDIA GeForce RTX 3050 Ti Laptop GPU
Schenker Vision 14 2022 RTX 3050 Ti, 45
4773 Points
NVIDIA GeForce RTX 3050 6GB Laptop GPU
Asus V16 V3607V, 65
4571 Points
Intel Arc Graphics 140V
Microsoft Surface Laptop 7 15 Lunar Lake, 0
4415 Points
Intel Arc Graphics 140T
MSI Prestige 16 AI Evo B2HMG, 0
4194 Points
Intel Arc Graphics 140V
MSI Claw 8 AI+, 0
4118 Points
AMD Radeon 880M
Asus ZenBook S16 UM5606GA, 0
3688 Points
Intel Arc Graphics 130V
Lenovo ThinkPad E14 Gen 7 21U2002QGE, 0
3538 Points
AMD Radeon 880M
Lenovo ThinkBook 16 G7+ AMD, 0
3464 Points
AMD Radeon 880M
Lenovo Yoga Pro 7 14ASP G9, 0
3423 Points
AMD Radeon 890M
Asus Zenbook S 16 UM5606-RK333W, 0
3421 Points
AMD Radeon 890M
MSI Claw A8 BZ2EM, 0
3331 Points
AMD Radeon 860M
Lenovo ThinkPad X13 G6 AMD, 0
2804 Points
AMD Radeon 780M
Lenovo IdeaPad Slim 3 14 AHP G10, 0
2569 Points
Qualcomm SD X Adreno X1-45 1.7 TFLOPS
Microsoft Surface Pro 12, 0
936 Points
3DMark / Fire Strike Graphics
NVIDIA GeForce RTX 4060 Laptop GPU
Schenker Key 14 (M24), 100
26499 Points
AMD Radeon 8060S
Asus ROG Flow Z13 GZ302EA-RU073W, 80
25992 Points
NVIDIA GeForce RTX 5050 Laptop
Lenovo Yoga Pro 9 16IAH10 RTX 5050, 100
25400 Points
NVIDIA GeForce RTX 4060 Laptop GPU
Asus ROG Zephyrus G16 GA605WV, 80
23753 Points
NVIDIA GeForce RTX 4050 Laptop GPU
Lenovo IdeaPad Pro 5 16IMH G9 RTX 4050, 90
23210 Points
NVIDIA GeForce RTX 4050 Laptop GPU
Lenovo Yoga Pro 7 14IMH9, RTX 4050, 60
19853 Points
NVIDIA GeForce RTX 4050 Laptop GPU
Dell XPS 14 2024 OLED, 30
13591 Points
NVIDIA GeForce RTX 3050 Ti Laptop GPU
Schenker Vision 14 2022 RTX 3050 Ti, 45
12349 Points
NVIDIA GeForce RTX 3050 6GB Laptop GPU
Asus V16 V3607V, 65
11986 Points
Intel Arc Graphics 140V
Microsoft Surface Laptop 7 15 Lunar Lake, 0
10476 Points
Intel Arc Graphics 140V
MSI Claw 8 AI+, 0
9971 Points
AMD Radeon 880M
Lenovo ThinkBook 16 G7+ AMD, 0
9651 Points
AMD Radeon 890M
MSI Claw A8 BZ2EM, 0
9472 Points
AMD Radeon 880M
Asus ZenBook S16 UM5606GA, 0
9427 Points
AMD Radeon 880M
Lenovo Yoga Pro 7 14ASP G9, 0
9388 Points
Intel Arc Graphics 140T
MSI Prestige 16 AI Evo B2HMG, 0
9173 Points
Intel Arc Graphics 130V
Lenovo ThinkPad E14 Gen 7 21U2002QGE, 0
8755 Points
AMD Radeon 890M
Asus Zenbook S 16 UM5606-RK333W, 0
8188 Points
AMD Radeon 860M
Lenovo ThinkPad X13 G6 AMD, 0
7391 Points
AMD Radeon 780M
Lenovo IdeaPad Slim 3 14 AHP G10, 0
7317 Points
Qualcomm SD X Adreno X1-85 3.8 TFLOPS
Honor MagicBook Art 14 Snapdragon, 0
6043 Points
Qualcomm SD X Adreno X1-45 1.7 TFLOPS
Microsoft Surface Pro 12, 0
3736 Points
3DMark / Steel Nomad Score
NVIDIA GeForce RTX 4060 Laptop GPU
Schenker Key 14 (M24), 100
2236 Points
NVIDIA GeForce RTX 5050 Laptop
Lenovo Yoga Pro 9 16IAH10 RTX 5050, 100
2046 Points
NVIDIA GeForce RTX 4060 Laptop GPU
Asus ROG Zephyrus G16 GA605WV, 80
2025 Points
AMD Radeon 8060S
Asus ROG Flow Z13 GZ302EA-RU073W, 80
1874 Points
NVIDIA GeForce RTX 4050 Laptop GPU
Lenovo IdeaPad Pro 5 16IMH G9 RTX 4050, 90
1873 Points
Apple M4 Pro 16-Core GPU
Apple MacBook Pro 14 2024 M4 Pro Entry, 0
1619 Points
NVIDIA GeForce RTX 4050 Laptop GPU
Lenovo Yoga Pro 7 14IMH9, RTX 4050, 60
1561 Points
Apple M5 GPU
Apple MacBook Pro 14 2025 M5, 19
1125 Points
Intel Arc Graphics 140T
MSI Prestige 16 AI Evo B2HMG, 0
919 Points
Intel Arc Graphics 140V
Microsoft Surface Laptop 7 15 Lunar Lake, 0
910 Points
Intel Arc Graphics 140V
MSI Claw 8 AI+, 0
812 Points
AMD Radeon 880M
Asus ZenBook S16 UM5606GA, 0
732 Points
AMD Radeon 890M
MSI Claw A8 BZ2EM, 0
597 Points
AMD Radeon 880M
Lenovo ThinkBook 16 G7+ AMD, 0
572 Points
AMD Radeon 880M
Lenovo Yoga Pro 7 14ASP G9, 0
571 Points
AMD Radeon 890M
Asus Zenbook S 16 UM5606-RK333W, 0
557 Points
Qualcomm SD X Adreno X1-85 3.8 TFLOPS
Honor MagicBook Art 14 Snapdragon, 0
512 Points
AMD Radeon 860M
Lenovo ThinkPad X13 G6 AMD, 0
462 Points
AMD Radeon 780M
Lenovo IdeaPad Slim 3 14 AHP G10, 0
407 Points
Qualcomm SD X Adreno X1-45 1.7 TFLOPS
Microsoft Surface Pro 12, 0
228 Points
3DMark / Steel Nomad Light Score
NVIDIA GeForce RTX 4060 Laptop GPU
Schenker Key 14 (M24), 100
9967 Points
AMD Radeon 8060S
Asus ROG Flow Z13 GZ302EA-RU073W, 80
9653 Points
NVIDIA GeForce RTX 4060 Laptop GPU
Asus ROG Zephyrus G16 GA605WV, 80
9201 Points
Apple M4 Pro 20-Core GPU
Apple MacBook Pro 16 2024 M4 Pro, 32
7781 Points
NVIDIA GeForce RTX 4050 Laptop GPU
Lenovo Yoga Pro 7 14IMH9, RTX 4050, 60
7254 Points
Apple M4 Pro 16-Core GPU
Apple MacBook Pro 14 2024 M4 Pro Entry, 0
6739 Points
Apple M5 GPU
Apple MacBook Pro 14 2025 M5, 19
5221 Points
Intel Arc Graphics 140T
MSI Prestige 16 AI Evo B2HMG, 0
3692 Points
Intel Arc Graphics 140V
Microsoft Surface Laptop 7 15 Lunar Lake, 0
3555 Points
AMD Radeon 880M
Asus ZenBook S16 UM5606GA, 0
3421 Points
AMD Radeon 880M
Lenovo Yoga Pro 7 14ASP G9, 0
3325 Points
Intel Arc Graphics 140V
MSI Claw 8 AI+, 0
3289 Points
AMD Radeon 880M
Lenovo ThinkBook 16 G7+ AMD, 0
3281 Points
AMD Radeon 890M
MSI Claw A8 BZ2EM, 0
3228 Points
AMD Radeon 890M
Asus Zenbook S 16 UM5606-RK333W, 0
3198 Points
Intel Arc Graphics 130V
Lenovo ThinkPad E14 Gen 7 21U2002QGE, 0
2670 Points
AMD Radeon 860M
Lenovo ThinkPad X13 G6 AMD, 0
2454 Points
AMD Radeon 780M
Lenovo IdeaPad Slim 3 14 AHP G10, 0
2447 Points
Qualcomm SD X Adreno X1-85 3.8 TFLOPS
Honor MagicBook Art 14 Snapdragon, 0
2231 Points
Qualcomm SD X Adreno X1-45 1.7 TFLOPS
Microsoft Surface Pro 12, 0
1097 Points

Conclusion: AMD could lose the connection

AMD Ryzen AI 400 performance and efficiency analysis. (Image Source: AMD)

The new Ryzen AI 400 Gorgon Point processors are only a minor update with a slightly higher frequency, and the basic architecture and core composition (number and type of cores) has not changed. This also applies to the integrated Radeon graphics. 

We will expand this analysis with further Ryzen AI 400 processors as soon as we have them, but it looks like there will probably be no changes to the overall picture. Essentially, the multi-core performance in the TDP range up to 35 W remains very good and competitive.

However, AMD is likely to lose some ground to the competition, especially in terms of single-core performance and graphics performance. Apple already showed what it is capable of with the M5 SoC in the fall, especially in single-core numbers. The upcoming M5 Pro chips should also follow suit in terms of multi-core and GPU performance.

The new Intel Panther Lake processors are already in the starting blocks and in just a few days we will be able to get a comprehensive picture of the performance and efficiency of the new mobile processors. 

Based on preliminary benchmarks we were able to carry out at CES 2026, Panther Lake's GPU performance in particular is likely to increase significantly. Qualcomm will also launch the second generation of its Snapdragon X processors on the market this spring with the promise of significant improvements.

Therefore, while AMD was quite competitive overall in 2025, the tide could shift significantly in favor of Intel in 2026. As already mentioned, we will be able to test the new Panther Lake processors extensively in just a few days, which will allow us to better assess AMD's mini refresh.

Read all 1 comments / answer
static version load dynamic
Loading comments
Comment on this article
Please share our article, every link counts!
Mail Logo
Google Logo Add as a preferred
source on Google
> Expert Reviews and News on Laptops, Smartphones and Tech Innovations > Reviews > AMD Ryzen AI 400 Performance Analysis: Gorgon Point debuts with only minor improvements
Andreas Osthoff, 2026-01-26 (Update: 2026-01-26)