Notebookcheck Logo

Intel Arc A530M vs NVIDIA GeForce RTX 3090 Ti vs Intel Arc A370M

Intel Arc A530M

► remove from comparison Intel A530M

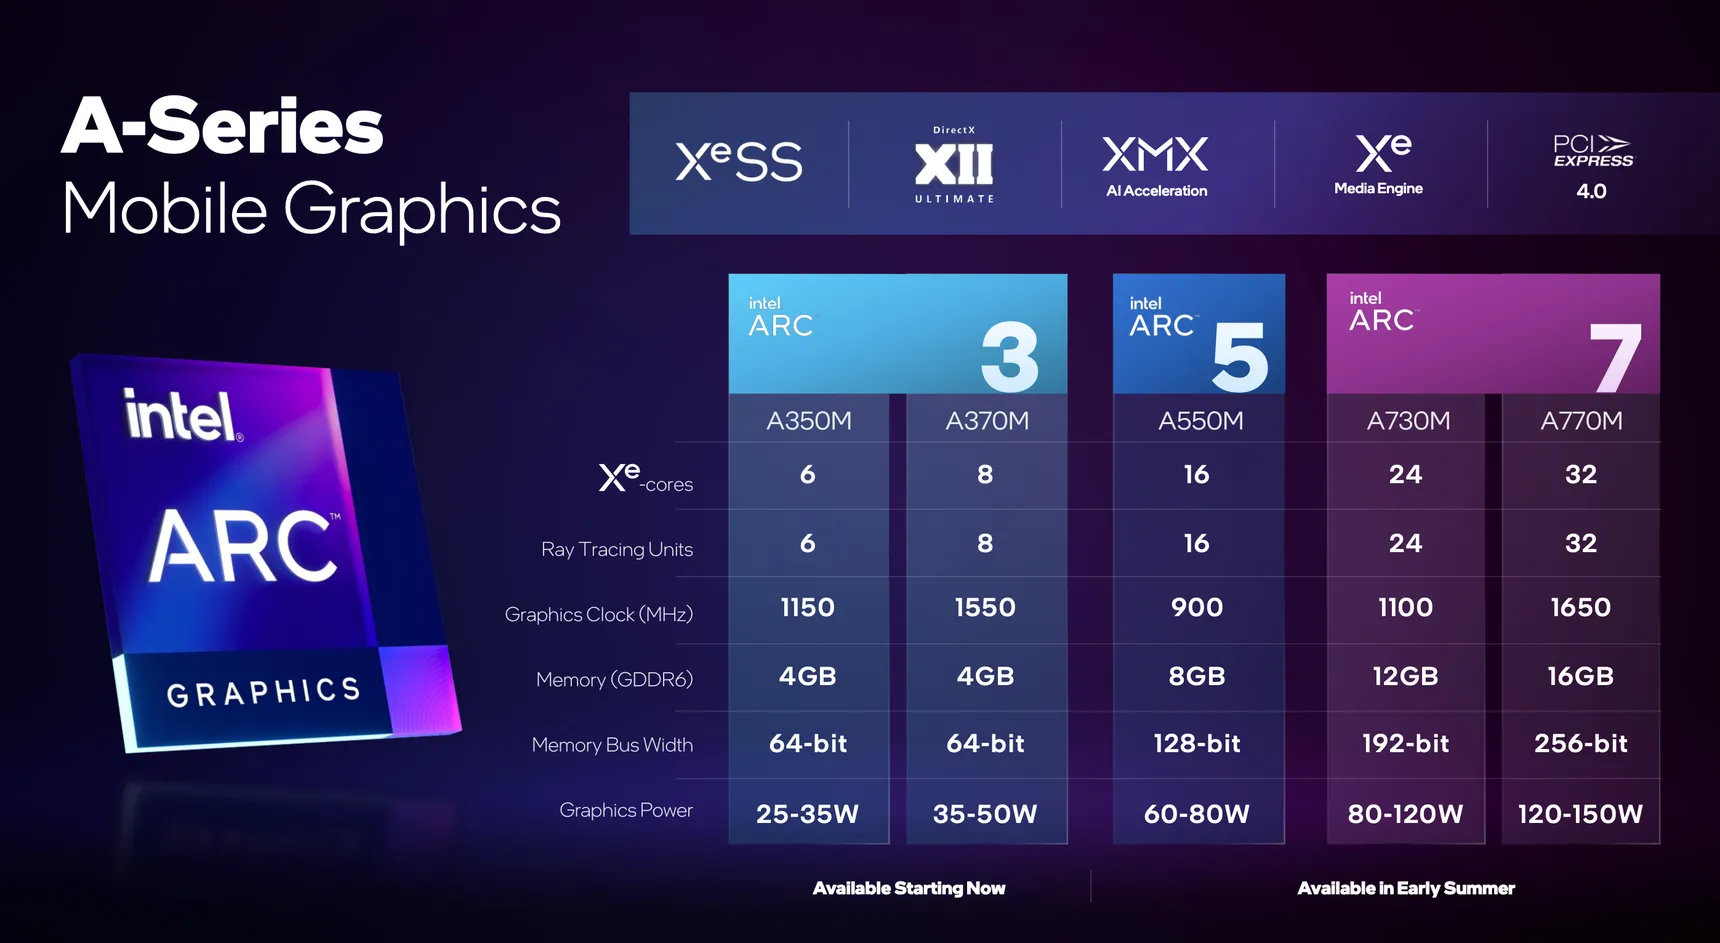
The Intel Arc A530M (device ID 5697) is a dedicated mobile lower- mid-range graphics card for laptops based on Xe HPG microarchitecture. It uses the ACM-G12 chip and offers 12 of the 16 Xe-cores (192 ALUs), 12 ray tracing units and a 128-bit memory bus for 8 GB GDDR6 graphics memory. The cores can clock from 300 MHz (low frequency mode) to 1300 MHz (high frequency) or in short bursts 2050+ MHz (short bursts / Turbo).

The performance of the Arc A530M should be slightly below the older Arc A550M (more cores but less clock speed).

The chip also integrates two media engines for VP9, AVC, HEVC, and AV1 8k en- and decoding. The 4 display pipes support up to 4x 4k120 HDR via DMI 2.0B or DisplayPort 2.0 10G. 

The A530M is produced in 6nm at TSMC (N6 process) and supports dynamic power share (using Deep Link) with 12th gen Intel CPUs (Alder Lake).

NVIDIA GeForce RTX 3090 Ti

► remove from comparison NVIDIA NVIDIA GeForce RTX 3090 Ti

The Nvidia GeForce RTX 3090 Ti is a high-end desktop graphics card based on the Ampere generation. It was announced in early 2022 as the fastest desktop gaming graphics card. It utilizes the large GA102 chip, featuring 10,752 shaders and 24 GB of GDDR6X graphics memory. 

Interestingly, it is possible to toggle ECC support for the Micron memory in this card via the Nvidia Control Panel even with regular Game Ready drivers. Please note that enabling ECC can reduce memory speeds.

Performance

Our tests show RTX 3090 Ti is up to ~15% faster in games compared to the standard RTX 3090.   

Power consumption

The RTX 3090 Ti is rated at 450 watts; the GA102 chip is manufactured according to an 8 nm process.

Intel Arc A370M

► remove from comparison Intel A370M

The Intel Arc A370M is a dedicated mobile entry level graphics card for laptops based on Xe HPG microarchitecture. It uses the ACM-G11 chip and offers all 8 Xe-cores (128 ALUs), 8 ray tracing units and a 64-bit memory bus for 4 GB GDDR6 graphics memory. The chip integrates 7.2 billion transistors and the die measures 157 mm2.

The performance is in the entry level of dedicated graphics cards for laptops in 2022. AMD did publish some gaming benchmarks with medium settings in 5 games that showed that the Radeon RX 6500M is clearly faster. Intel only compared the A370M (with a faster CPU) to the slower Iris iGPU in the i7-1280P (see below). Thanks to the additional 2 cores and higher clock speeds, the entry level Arc A350M should be clearly left behind.

The chip also integrates two media engines for VP9, AVC, HEVC, and AV1 8k en- and decoding. The 4 display pipes support up to 4x 4k120 HDR via DMI 2.0B or DisplayPort 2.0 10G. 

The A370M is produced in 6nm at TSMC (N6 process) and supports dynamic power share (using Deep Link) with 12th gen Intel CPUs (Alder Lake).

Intel Arc A530MNVIDIA GeForce RTX 3090 TiIntel Arc A370M
Arc Series
Arc B580 2560 @ 2.67 - 2.67 GHz192 Bit @ 19000 MHz
Arc A770 4096 @ 2.1 - 2.4 GHz256 Bit @ 16000 MHz
Arc A750 3584 @ 2.05 - 2.4 GHz256 Bit @ 16000 MHz
Arc A580 3072 @ 1.7 - 2 GHz256 Bit @ 16000 MHz
A770M 4096 @ 1.65 GHz256 Bit @ 16000 MHz
A730M 3072 @ 1.1 GHz192 Bit @ 14000 MHz
A570M 16 @ 0.9 - 1.3 GHz128 Bit @ 14000 MHz
A550M 16 @ 0.9 - 2.01 GHz128 Bit @ 14000 MHz
A530M 12 @ 0.9 - 1.3 GHz128 Bit @ 14000 MHz
A370M 8 @ 1.55 GHz64 Bit @ 14000 MHz
Arc A380 1024 @ 2 GHz96 Bit @ 15500 MHz
A310 6 @ 2 GHz64 Bit @ 15500 MHz
A350M 6 @ 1.15 GHz64 Bit @ 14000 MHz
NVIDIA GeForce RTX 3090 Ti 10752 @ 1.56 - 1.86 GHz384 Bit @ 21000 MHz
NVIDIA GeForce RTX 3090 10496 @ 1.4 - 1.7 GHz384 Bit @ 19500 MHz
NVIDIA GeForce RTX 3080 Ti 10240 @ 1.37 - 1.67 GHz384 Bit @ 19000 MHz
NVIDIA GeForce RTX 3080 12 GB 8960/ cores @ 1.26 - 1.71 GHz384 Bit @ 19000 MHz
NVIDIA GeForce RTX 3080 8704 @ 1.45 - 1.71 GHz320 Bit @ 19000 MHz
GeForce RTX 3070 Ti 6144 @ 1.58 - 1.77 GHz256 Bit @ 19000 MHz
GeForce RTX 3080 Ti Laptop GPU 7424 @ 0.98 - 1.59 GHz256 Bit @ 14000 MHz
NVIDIA GeForce RTX 3070 5888 @ 1.5 - 1.73 GHz256 Bit @ 14000 MHz
GeForce RTX 3080 Laptop GPU 6144 @ 0.78 - 1.25 GHz256 Bit @ 14000 MHz
NVIDIA GeForce RTX 3060 Ti 4864 @ 1.41 - 1.67 GHz256 Bit @ 14000 MHz
GeForce RTX 3070 Ti Laptop GPU 5888 @ 0.92 - 1.48 GHz256 Bit @ 14000 MHz
GeForce RTX 3070 Laptop GPU 5120 @ 0.78 - 1.29 GHz256 Bit @ 14000 MHz
NVIDIA GeForce RTX 3060 3584 @ 1.32 - 1.78 GHz192 Bit @ 15000 MHz
GeForce RTX 3080 Max-Q 6144 @ 0.78 - 1.25 GHz256 Bit @ 6000 MHz
GeForce RTX 3070 Max-Q 5120 @ 1.29 GHz256 Bit
GeForce RTX 3060 Laptop GPU 3840 @ 0.82 - 1.7 GHz192 Bit @ 14000 MHz
GeForce RTX 3060 Max-Q 3840 @ 1.28 GHz192 Bit
NVIDIA GeForce RTX 3050 2560 @ 1.55 - 1.78 GHz128 Bit Bit @ 1750 MHz
GeForce RTX 3050 Ti Laptop GPU 2560 @ 1.22 - 1.49 GHz128 Bit @ 12000 MHz
GeForce RTX 3050 6GB Laptop GPU 2560 @ 1.24 - 1.49 GHz96 Bit @ 12000 MHz
GeForce RTX 3050 A Laptop GPU 1792 64 Bit
GeForce RTX 3050 4GB Laptop GPU 2048 @ 1.24 - 1.5 GHz128 Bit @ 12000 MHz
Arc B580 2560 @ 2.67 - 2.67 GHz192 Bit @ 19000 MHz
Arc A770 4096 @ 2.1 - 2.4 GHz256 Bit @ 16000 MHz
Arc A750 3584 @ 2.05 - 2.4 GHz256 Bit @ 16000 MHz
Arc A580 3072 @ 1.7 - 2 GHz256 Bit @ 16000 MHz
A770M 4096 @ 1.65 GHz256 Bit @ 16000 MHz
A730M 3072 @ 1.1 GHz192 Bit @ 14000 MHz
A570M 16 @ 0.9 - 1.3 GHz128 Bit @ 14000 MHz
A550M 16 @ 0.9 - 2.01 GHz128 Bit @ 14000 MHz
A530M 12 @ 0.9 - 1.3 GHz128 Bit @ 14000 MHz
A370M 8 @ 1.55 GHz64 Bit @ 14000 MHz
Arc A380 1024 @ 2 GHz96 Bit @ 15500 MHz
A310 6 @ 2 GHz64 Bit @ 15500 MHz
A350M 6 @ 1.15 GHz64 Bit @ 14000 MHz
CodenameAlchemistAmpere GA102Alchemist
ArchitectureXe HPGAmpereXe HPG
Pipelines12 - unified10752 - unified8 - unified
TMUs96336
ROPs48112
Raytracing Cores12848
Core Speed900 - 1300 (Boost) MHz1560 - 1860 (Boost) MHz1550 MHz
CacheL2: 8 MBL1: 10.5 MB, L2: 6 MBL1: 1.5 MB, L2: 4 MB
Memory Speed14000 effective = 1750 MHz21000 effective = 1313 MHz14000 MHz
Memory Bus Width128 Bit384 Bit64 Bit
Memory TypeGDDR6GDDR6XGDDR6
Max. Amount of Memory8 GB24 GB4 GB
Shared Memorynonono
Memory Bandwidth224 GB/s1008 GB/s112 GB/s
APIDirectX 12_2, Shader 6.6, OpenGL 4.6, OpenCL 3.0, Vulkan 1.3DirectX 12_2, Shader 6.7, OpenGL 4.6DirectX 12_2, OpenGL 4.6, Vulkan 1.3
Power Consumption65 Watt (65 - 95 Watt TGP)450 Watt50 Watt (35 - 50 Watt TGP)
technology6 nm8 nm6 nm
PCIe4 16x4.0 x164 8x
Displays4 Displays (max.), HDMI 2.0b, DisplayPort 2.0 10G Ready4 Displays (max.), HDMI 2.1, DisplayPort 1.4a4 Displays (max.), HDMI 2.0b, DisplayPort 2.0 10G Ready
Date of Announcement31.07.2023 27.01.2022 30.03.2022
Link to Manufacturer Pagewww.intel.comwww.intel.com
Tensor / AI Cores336
Theoretical Performance40 TFLOPS FP16, 40 TFLOPS FP32, 625 TFLOPS FP64
Transistors28.3 Billion7.2 Billion
Die Size 628 mm² 157 mm²
PredecessorGeForce RTX 2080 Ti (Desktop)

Benchmarks

Performance Rating - 3DMark 11 + Fire Strike + Time Spy - NVIDIA GeForce RTX 3090 Ti
19.9 pt (60%)
Restrict / Search: Model: Max. age: years
3DMark - 3DMark Time Spy Score
min: 5663     avg: 5902     median: 5901.5 (16%)     max: 6140 Points
19241 Points (51%)
min: 3505     avg: 4023     median: 4255 (11%)     max: 4308 Points
3DMark - 3DMark Time Spy Graphics
5851 Points (12%)
21645 Points (44%)
min: 3167     avg: 3650     median: 3885 (8%)     max: 3899 Points
3DMark - 3DMark Ice Storm Unlimited Graphics
564087 Points (57%)
3DMark - 3DMark Ice Storm Extreme Graphics
444102 Points (52%)
3DMark - 3DMark Cloud Gate Score
75753 Points (72%)
37%
1 A370M +
min: 27250     avg: 28035     median: 28128 (27%)     max: 28727 Points
3DMark - 3DMark Cloud Gate Graphics
246319 Points (61%)
14%
1 A370M +
min: 33721     avg: 36141     median: 35604 (9%)     max: 39098 Points
3DMark - 3DMark Fire Strike Standard Score
36563 Points (55%)
21%
1 A370M +
min: 7699     avg: 7735     median: 7717 (12%)     max: 7789 Points
3DMark - 3DMark Fire Strike Standard Graphics
53110 Points (49%)
15%
1 A370M +
min: 8015     avg: 8157     median: 8149 (7%)     max: 8307 Points
3DMark - 3DMark Ice Storm Graphics
465704 Points (52%)
3DMark - 3DMark Wild Life Unlimited
118439 Points (60%)
3DMark - 3DMark Wild Life Extreme Unlimited
46562 Points (54%)
3DMark - 3DMark Night Raid
100%
1 A530M +
39500 Points (37%)
64315 Points (61%)
3DMark - 3DMark Night Raid Graphics Score
139165 Points (54%)
3DMark 11 - 3DM11 Performance Score
49471 Points (60%)
25%
1 A370M +
min: 12308     avg: 12563     median: 12520.5 (15%)     max: 12902 Points
3DMark 11 - 3DM11 Performance GPU
69481 Points (53%)
17%
1 A370M +
min: 11748     avg: 12066     median: 12089.5 (9%)     max: 12338 Points
Unigine Valley 1.0 - Unigine Valley 1.0 DX
201.7 fps (61%)
SPECviewperf 12
specvp12 sw-03 + NVIDIA GeForce RTX 3090 Ti
SPECviewperf 12 - specvp12 sw-03
85.7 fps (21%)
specvp12 snx-02 + NVIDIA GeForce RTX 3090 Ti
SPECviewperf 12 - specvp12 snx-02
15.6 fps (2%)
specvp12 showcase-01 + NVIDIA GeForce RTX 3090 Ti
SPECviewperf 12 - specvp12 showcase-01
265 fps (46%)
specvp12 mediacal-01 + NVIDIA GeForce RTX 3090 Ti
SPECviewperf 12 - specvp12 mediacal-01
87.1 fps (22%)
specvp12 maya-04 + NVIDIA GeForce RTX 3090 Ti
SPECviewperf 12 - specvp12 maya-04
197 fps (54%)
specvp12 energy-01 + NVIDIA GeForce RTX 3090 Ti
SPECviewperf 12 - specvp12 energy-01
27.6 fps (25%)
specvp12 creo-01 + NVIDIA GeForce RTX 3090 Ti
SPECviewperf 12 - specvp12 creo-01
76.4 fps (31%)
specvp12 catia-04 + NVIDIA GeForce RTX 3090 Ti
SPECviewperf 12 - specvp12 catia-04
150 fps (25%)
specvp12 3dsmax-05 + NVIDIA GeForce RTX 3090 Ti
SPECviewperf 12 - specvp12 3dsmax-05
371 fps (56%)
SPECviewperf 13 specvp13 sw-04 + NVIDIA GeForce RTX 3090 Ti
SPECviewperf 13 - specvp13 sw-04
118 fps (32%)
specvp13 sw-04 + Intel Arc A370M
51%
1 A370M +
60.4 fps (16%)
specvp13 snx-03 + NVIDIA GeForce RTX 3090 Ti
SPECviewperf 13 - specvp13 snx-03
28 fps (3%)
specvp13 snx-03 + Intel Arc A370M
2 fps (0%)
specvp13 showcase-02 + NVIDIA GeForce RTX 3090 Ti
SPECviewperf 13 - specvp13 showcase-02
265 fps (45%)
specvp13 showcase-02 + Intel Arc A370M
11%
1 A370M +
30.2 fps (5%)
specvp13 medical-02 + NVIDIA GeForce RTX 3090 Ti
SPECviewperf 13 - specvp13 medical-02
113 fps (19%)
specvp13 medical-02 + Intel Arc A370M
25%
1 A370M +
28 fps (5%)
specvp13 maya-05 + NVIDIA GeForce RTX 3090 Ti
SPECviewperf 13 - specvp13 maya-05
493 fps (56%)
specvp13 maya-05 + Intel Arc A370M
15%
1 A370M +
75.1 fps (9%)
specvp13 energy-02 + NVIDIA GeForce RTX 3090 Ti
SPECviewperf 13 - specvp13 energy-02
48.4 fps (16%)
specvp13 energy-02 + Intel Arc A370M
3.9 fps (1%)
specvp13 creo-02 + NVIDIA GeForce RTX 3090 Ti
SPECviewperf 13 - specvp13 creo-02
353 fps (52%)
specvp13 creo-02 + Intel Arc A370M
17%
1 A370M +
61.1 fps (9%)
specvp13 catia-05 + NVIDIA GeForce RTX 3090 Ti
SPECviewperf 13 - specvp13 catia-05
230 fps (26%)
specvp13 catia-05 + Intel Arc A370M
37%
1 A370M +
85.8 fps (10%)
specvp13 3dsmax-06 + NVIDIA GeForce RTX 3090 Ti
SPECviewperf 13 - specvp13 3dsmax-06
373 fps (58%)
specvp13 3dsmax-06 + Intel Arc A370M
17%
1 A370M +
62.7 fps (10%)
SPECviewperf 2020 specvp2020 solidworks-05 4k + NVIDIA GeForce RTX 3090 Ti
SPECviewperf 2020 - specvp2020 solidworks-05 4k
197 fps (47%)
specvp2020 snx-04 4k + NVIDIA GeForce RTX 3090 Ti
SPECviewperf 2020 - specvp2020 snx-04 4k
23.7 fps (2%)
specvp2020 medical-03 4k + NVIDIA GeForce RTX 3090 Ti
SPECviewperf 2020 - specvp2020 medical-03 4k
22.2 fps (14%)
specvp2020 maya-06 4k + NVIDIA GeForce RTX 3090 Ti
SPECviewperf 2020 - specvp2020 maya-06 4k
353 fps (51%)
specvp2020 energy-03 4k + NVIDIA GeForce RTX 3090 Ti
SPECviewperf 2020 - specvp2020 energy-03 4k
31.6 fps (4%)
specvp2020 creo-03 4k + NVIDIA GeForce RTX 3090 Ti
SPECviewperf 2020 - specvp2020 creo-03 4k
84.5 fps (38%)
specvp2020 catia-06 4k + NVIDIA GeForce RTX 3090 Ti
SPECviewperf 2020 - specvp2020 catia-06 4k
58.6 fps (38%)
specvp2020 3dsmax-07 4k + NVIDIA GeForce RTX 3090 Ti
SPECviewperf 2020 - specvp2020 3dsmax-07 4k
145 fps (49%)
specvp2020 solidworks-05 1080p + Intel Arc A370M
SPECviewperf 2020 - specvp2020 solidworks-05 1080p
100%
1 A370M +
20.9 fps (4%)
specvp2020 snx-04 1080p + Intel Arc A370M
SPECviewperf 2020 - specvp2020 snx-04 1080p
100%
1 A370M +
1.9 fps (0%)
specvp2020 medical-03 1080p + Intel Arc A370M
SPECviewperf 2020 - specvp2020 medical-03 1080p
100%
1 A370M +
13.1 fps (4%)
specvp2020 energy-03 1080p + Intel Arc A370M
SPECviewperf 2020 - specvp2020 energy-03 1080p
100%
1 A370M +
3.9 fps (1%)
specvp2020 catia-06 1080p + Intel Arc A370M
SPECviewperf 2020 - specvp2020 catia-06 1080p
100%
1 A370M +
15.7 fps (8%)
specvp2020 3dsmax-07 1080p + Intel Arc A370M
SPECviewperf 2020 - specvp2020 3dsmax-07 1080p
100%
1 A370M +
20.3 fps (5%)
Cinebench R11.5 Cinebench R11.5 OpenGL 64 Bit + NVIDIA GeForce RTX 3090 Ti
Cinebench R11.5 - Cinebench R11.5 OpenGL 64 Bit
108.2 fps (36%)
Cinebench R15
Cinebench R15 OpenGL 64 Bit + NVIDIA GeForce RTX 3090 Ti
Cinebench R15 - Cinebench R15 OpenGL 64 Bit
204 fps (12%)
Cinebench R15 OpenGL 64 Bit + Intel Arc A370M
63%
1 A370M +
min: 125.4     avg: 148.3     median: 129.1 (8%)     max: 190.4 fps
Cinebench R15 OpenGL Ref. Match 64 Bit + NVIDIA GeForce RTX 3090 Ti
Cinebench R15 - Cinebench R15 OpenGL Ref. Match 64 Bit
99.6 % (100%)
Cinebench R15 OpenGL Ref. Match 64 Bit + Intel Arc A370M
98%
1 A370M +
97.8 % (98%)
GFXBench - GFXBench 5.0 Aztec Ruins High Tier Offscreen
100%
1 A530M +
141 fps (25%)
GFXBench - GFXBench Car Chase Offscreen
100%
1 A530M +
242 fps (23%)
LuxMark v2.0 64Bit - LuxMark v2.0 Room GPU
6221 Samples/s (22%)
LuxMark v2.0 64Bit - LuxMark v2.0 Sala GPU
16046 Samples/s (28%)
ComputeMark v2.1 - ComputeMark v2.1 Result
52258 Points (43%)
Power Consumption - Furmark Stress Test Power Consumption - external Monitor *
min: 598     avg: 615     median: 599 (81%)     max: 648 Watt
1019%
1 A370M +
min: 57.7     avg: 68.1     median: 58.8 (8%)     max: 87.7 Watt
Power Consumption - The Witcher 3 Power Consumption - external Monitor *
min: 561     avg: 564     median: 561 (78%)     max: 569 Watt
863%
1 A370M +
min: 61.3     avg: 70.4     median: 65 (9%)     max: 85 Watt
Power Consumption - Witcher 3 Power Consumption *
100%
1 A370M +
min: 65     avg: 73.1     median: 68.8 (15%)     max: 85.6 Watt
Power Consumption - Power Efficiency - Witcher 3 ultra
100%
1 A370M +
min: 0.3014     avg: 0.4     median: 0.4 (35%)     max: 0.3846 fps per Watt
Power Consumption - Power Efficiency - Witcher 3 ultra external Monitor
min: 0.3447     avg: 0.3     median: 0.3 (29%)     max: 0.345 fps per Watt
117%
1 A370M +
min: 0.3035     avg: 0.4     median: 0.4 (34%)     max: 0.4078 fps per Watt
Emissions Witcher 3 Fan Noise + Intel Arc A370M
Emissions - Witcher 3 Fan Noise
100%
1 A370M +
45.2 dB(A) (65%)

Average Benchmarks Intel Arc A530M → 100% n=2

Average Benchmarks NVIDIA GeForce RTX 3090 Ti → 348% n=2

Average Benchmarks Intel Arc A370M → 69% n=2

- Range of benchmark values for this graphics card
red legend - Average benchmark values for this graphics card
* Smaller numbers mean a higher performance
1 This benchmark is not used for the average calculation

Game Benchmarks

The following benchmarks stem from our benchmarks of review laptops. The performance depends on the used graphics memory, clock rate, processor, system settings, drivers, and operating systems. So the results don't have to be representative for all laptops with this GPU. For detailed information on the benchmark results, click on the fps number.

Diablo 4

Diablo 4

2023
low 1920x1080
A370M:
67.1  fps
med. 1920x1080
A370M:
60.9  fps
high 1920x1080
A370M:
39.2  fps
ultra 1920x1080
A370M:
0 (!)  fps
low 1920x1080
A370M:
23  fps
med. 1920x1080
A370M:
19.7  fps
high 1920x1080
A370M:
19.2  fps
ultra 1920x1080
A370M:
17.7  fps
low 1920x1080
A370M:
45.7  fps
med. 1920x1080
A370M:
26.3  fps
high 1920x1080
A370M:
11.6  fps
ultra 1920x1080
A370M:
3.5  fps
low 1920x1080
A370M:
55.7  fps
med. 1920x1080
A370M:
47.8  fps
high 1920x1080
A370M:
37.2  fps
ultra 1920x1080
A370M:
37.1  fps
low 1920x1080
A370M:
27.6  fps
med. 1920x1080
A370M:
17.4  fps
high 1920x1080
A370M:
11.5  fps
ultra 1920x1080
A370M:
11.4  fps
low 1920x1080
A370M:
55.5  fps
med. 1920x1080
A370M:
42.4  fps
high 1920x1080
A370M:
24  fps
ultra 1920x1080
A370M:
20.2  fps
Returnal

Returnal

2023
low 1920x1080
A370M:
27  fps
med. 1920x1080
A370M:
26  fps
high 1920x1080
A370M:
22  fps
ultra 1920x1080
A370M:
10  fps
low 1920x1080
A370M:
43.2  fps
med. 1920x1080
A370M:
30.3  fps
high 1920x1080
A370M:
19.6  fps
ultra 1920x1080
A370M:
12.7  fps
low 1920x1080
A370M:
22.6  fps
med. 1920x1080
A370M:
17.8  fps
high 1920x1080
A370M:
12.1  fps
ultra 1920x1080
A370M:
8.9  fps
low 1920x1080
A370M:
73.4  fps
med. 1920x1080
A370M:
44.6  fps
high 1920x1080
A370M:
40.8  fps
ultra 1920x1080
A370M:
32.6  fps
low 1920x1080
A370M:
22.9  fps
med. 1920x1080
A370M:
19.5  fps
high 1920x1080
A370M:
16.6  fps
ultra 1920x1080
A370M:
14.3  fps
FIFA 23

FIFA 23

2022
low 1920x1080
A370M:
70 (!)  fps
med. 1920x1080
A370M:
62  fps
high 1920x1080
A370M:
40  fps
ultra 1920x1080
A370M:
41  fps
QHD 2560x1440
A370M:
30  fps
F1 22

F1 22

2022
low 1920x1080
A370M:
127.2  fps
med. 1920x1080
A370M:
49.5  fps
high 1920x1080
A370M:
46.3  fps
ultra 1920x1080
A370M:
33  fps
QHD 2560x1440
A370M:
2.9  fps
low 1920x1080
A370M:
127  fps
med. 1920x1080
A370M:
87  fps
high 1920x1080
A370M:
62  fps
ultra 1920x1080
A370M:
55  fps
QHD 2560x1440
A370M:
34  fps
low 1920x1080
NVIDIA GeForce RTX 3090 Ti:
263 263 ~ 263 fps
med. 1920x1080
NVIDIA GeForce RTX 3090 Ti:
260 260 ~ 260 fps
high 1920x1080
NVIDIA GeForce RTX 3090 Ti:
261 261 ~ 261 fps
ultra 1920x1080
NVIDIA GeForce RTX 3090 Ti:
261 261 ~ 261 fps
QHD 2560x1440
NVIDIA GeForce RTX 3090 Ti:
210 210 ~ 210 fps
4K 3840x2160
NVIDIA GeForce RTX 3090 Ti:
113.2 113.2 ~ 113 fps
low 1920x1080
NVIDIA GeForce RTX 3090 Ti:
324  fps
med. 1920x1080
NVIDIA GeForce RTX 3090 Ti:
277 277 ~ 277 fps
high 1920x1080
NVIDIA GeForce RTX 3090 Ti:
231 231 ~ 231 fps
ultra 1920x1080
NVIDIA GeForce RTX 3090 Ti:
190.2 190.2 ~ 190 fps
QHD 2560x1440
NVIDIA GeForce RTX 3090 Ti:
142.6 142.6 ~ 143 fps
4K 3840x2160
NVIDIA GeForce RTX 3090 Ti:
81.1 81.1 ~ 81 fps
low 1920x1080
NVIDIA GeForce RTX 3090 Ti:
219 219 ~ 219 fps
A370M:
46.1  fps
med. 1920x1080
NVIDIA GeForce RTX 3090 Ti:
201 201 ~ 201 fps
A370M:
37.1  fps
high 1920x1080
NVIDIA GeForce RTX 3090 Ti:
172.8 172.8 ~ 173 fps
A370M:
25.4  fps
ultra 1920x1080
NVIDIA GeForce RTX 3090 Ti:
151.8 151.8 ~ 152 fps
A370M:
21  fps
QHD 2560x1440
NVIDIA GeForce RTX 3090 Ti:
103.9 103.9 ~ 104 fps
4K 3840x2160
NVIDIA GeForce RTX 3090 Ti:
53.3 53.3 ~ 53 fps
low 1920x1080
NVIDIA GeForce RTX 3090 Ti:
228 228 ~ 228 fps
A370M:
95.6 97.5 ~ 97 fps
med. 1920x1080
NVIDIA GeForce RTX 3090 Ti:
202 202 ~ 202 fps
A370M:
68.3 69.4 ~ 69 fps
high 1920x1080
NVIDIA GeForce RTX 3090 Ti:
173.4 173.4 ~ 173 fps
A370M:
55 57.6 ~ 56 fps
ultra 1920x1080
NVIDIA GeForce RTX 3090 Ti:
156.6 156.6 ~ 157 fps
A370M:
41.7 41.9 ~ 42 fps
QHD 2560x1440
NVIDIA GeForce RTX 3090 Ti:
153.2 153.2 ~ 153 fps
A370M:
31.3 34.4 ~ 33 fps
4K 3840x2160
NVIDIA GeForce RTX 3090 Ti:
120.5 120.5 ~ 121 fps
low 1920x1080
NVIDIA GeForce RTX 3090 Ti:
60 60 ~ 60 fps
med. 1920x1080
NVIDIA GeForce RTX 3090 Ti:
60 60 ~ 60 fps
high 1920x1080
NVIDIA GeForce RTX 3090 Ti:
60 60 ~ 60 fps
ultra 1920x1080
NVIDIA GeForce RTX 3090 Ti:
60 60 ~ 60 fps
QHD 2560x1440
NVIDIA GeForce RTX 3090 Ti:
60 60 ~ 60 fps
4K 3840x2160
NVIDIA GeForce RTX 3090 Ti:
60 60 ~ 60 fps
low 1920x1080
NVIDIA GeForce RTX 3090 Ti:
202 202 ~ 202 fps
med. 1920x1080
NVIDIA GeForce RTX 3090 Ti:
171.4 171.4 ~ 171 fps
high 1920x1080
NVIDIA GeForce RTX 3090 Ti:
153 153 ~ 153 fps
QHD 2560x1440
NVIDIA GeForce RTX 3090 Ti:
113.2 113.2 ~ 113 fps
4K 3840x2160
NVIDIA GeForce RTX 3090 Ti:
64.3 64.3 ~ 64 fps
low 1920x1080
NVIDIA GeForce RTX 3090 Ti:
411 411 ~ 411 fps
med. 1920x1080
NVIDIA GeForce RTX 3090 Ti:
347 347 ~ 347 fps
high 1920x1080
NVIDIA GeForce RTX 3090 Ti:
315 315 ~ 315 fps
ultra 1920x1080
NVIDIA GeForce RTX 3090 Ti:
290 290 ~ 290 fps
QHD 2560x1440
NVIDIA GeForce RTX 3090 Ti:
208 208 ~ 208 fps
4K 3840x2160
NVIDIA GeForce RTX 3090 Ti:
116 116 ~ 116 fps
low 1920x1080
A370M:
35 35.2 35.8 ~ 35 fps
med. 1920x1080
A370M:
30 31.2 31.8 ~ 31 fps
high 1920x1080
A370M:
24 25.4 25.6 ~ 25 fps
ultra 1920x1080
A370M:
17.3 18 20.4 ~ 19 fps
QHD 2560x1440
A370M:
12 12.4 ~ 12 fps
low 1280x720
NVIDIA GeForce RTX 3090 Ti:
231  fps
med. 1920x1080
NVIDIA GeForce RTX 3090 Ti:
200 200 ~ 200 fps
high 1920x1080
NVIDIA GeForce RTX 3090 Ti:
188 188 ~ 188 fps
ultra 1920x1080
NVIDIA GeForce RTX 3090 Ti:
127 127 ~ 127 fps
QHD 2560x1440
NVIDIA GeForce RTX 3090 Ti:
114 114 ~ 114 fps
4K 3840x2160
NVIDIA GeForce RTX 3090 Ti:
89 89 ~ 89 fps
med. 1920x1080
NVIDIA GeForce RTX 3090 Ti:
195.5 195.5 ~ 196 fps
high 1920x1080
NVIDIA GeForce RTX 3090 Ti:
207 207 ~ 207 fps
ultra 1920x1080
NVIDIA GeForce RTX 3090 Ti:
191.2 191.2 ~ 191 fps
QHD 2560x1440
NVIDIA GeForce RTX 3090 Ti:
149.9 149.9 ~ 150 fps
4K 3840x2160
NVIDIA GeForce RTX 3090 Ti:
93.7 93.7 ~ 94 fps
low 1280x720
A370M:
23  fps
med. 1920x1080
A370M:
14  fps
high 1920x1080
A370M:
12  fps
Far Cry 6

Far Cry 6

2021
low 1280x720
A370M:
86  fps
med. 1920x1080
NVIDIA GeForce RTX 3090 Ti:
179 179 ~ 179 fps
A370M:
44  fps
high 1920x1080
NVIDIA GeForce RTX 3090 Ti:
161.6 162 ~ 162 fps
A370M:
36  fps
ultra 1920x1080
NVIDIA GeForce RTX 3090 Ti:
142 142 ~ 142 fps
A370M:
24  fps
QHD 2560x1440
NVIDIA GeForce RTX 3090 Ti:
132.9 132.9 ~ 133 fps
4K 3840x2160
NVIDIA GeForce RTX 3090 Ti:
89.9 90 ~ 90 fps
F1 2021

F1 2021

2021
low 1280x720
A370M:
192  fps
med. 1920x1080
NVIDIA GeForce RTX 3090 Ti:
537 537 ~ 537 fps
A370M:
89  fps
high 1920x1080
NVIDIA GeForce RTX 3090 Ti:
470 470 ~ 470 fps
A370M:
61 63 ~ 62 fps
ultra 1920x1080
NVIDIA GeForce RTX 3090 Ti:
242 242 ~ 242 fps
A370M:
25  fps
QHD 2560x1440
NVIDIA GeForce RTX 3090 Ti:
189.3 189.3 ~ 189 fps
4K 3840x2160
NVIDIA GeForce RTX 3090 Ti:
114.9 114.9 ~ 115 fps
Hitman 3

Hitman 3

2021
low 1280x720
A370M:
85.7  fps
med. 1920x1080
A370M:
54.9  fps
high 1920x1080
A370M:
50  fps
ultra 1920x1080
A370M:
46.2  fps
QHD 2560x1440
A370M:
23.4  fps
low 1280x720
A370M:
62  fps
med. 1920x1080
NVIDIA GeForce RTX 3090 Ti:
160 160 ~ 160 fps
A370M:
33  fps
high 1920x1080
NVIDIA GeForce RTX 3090 Ti:
138 138 ~ 138 fps
A370M:
20  fps
ultra 1920x1080
NVIDIA GeForce RTX 3090 Ti:
123 123 ~ 123 fps
A370M:
18  fps
QHD 2560x1440
NVIDIA GeForce RTX 3090 Ti:
108 108 ~ 108 fps
A370M:
13  fps
4K 3840x2160
NVIDIA GeForce RTX 3090 Ti:
73 73 ~ 73 fps
Dirt 5

Dirt 5

2020
low 1280x720
A370M:
80.4  fps
med. 1920x1080
A370M:
40.7  fps
high 1920x1080
A370M:
32  fps
ultra 1920x1080
A370M:
23.1  fps
QHD 2560x1440
A370M:
15.2  fps
low 1280x720
A370M:
77  fps
med. 1920x1080
NVIDIA GeForce RTX 3090 Ti:
171.4 171.4 ~ 171 fps
A370M:
45  fps
high 1920x1080
NVIDIA GeForce RTX 3090 Ti:
154.2 154.2 ~ 154 fps
A370M:
34  fps
ultra 1920x1080
NVIDIA GeForce RTX 3090 Ti:
130.2 130.2 ~ 130 fps
A370M:
15  fps
QHD 2560x1440
NVIDIA GeForce RTX 3090 Ti:
107.8 107.8 ~ 108 fps
A370M:
11  fps
4K 3840x2160
NVIDIA GeForce RTX 3090 Ti:
70.1 70.1 ~ 70 fps
med. 1920x1080
NVIDIA GeForce RTX 3090 Ti:
240 240 240 ~ 240 fps
high 1920x1080
NVIDIA GeForce RTX 3090 Ti:
231 231 ~ 231 fps
QHD 2560x1440
NVIDIA GeForce RTX 3090 Ti:
173.9 173.9 ~ 174 fps
4K 3840x2160
NVIDIA GeForce RTX 3090 Ti:
99.2 99.2 ~ 99 fps
low 1280x720
A370M:
57  fps
med. 1920x1080
A370M:
40  fps
high 1920x1080
A370M:
35  fps
ultra 1920x1080
A370M:
31  fps
QHD 2560x1440
A370M:
23  fps
low 1280x720
A370M:
189  fps
med. 1920x1080
A370M:
76.8  fps
high 1920x1080
A370M:
48.8  fps
ultra 1920x1080
A370M:
38.4  fps
QHD 2560x1440
A370M:
27.7  fps
low 1280x720
A370M:
76.4  fps
med. 1920x1080
NVIDIA GeForce RTX 3090 Ti:
204 204 ~ 204 fps
A370M:
47.5  fps
high 1920x1080
NVIDIA GeForce RTX 3090 Ti:
187.6 187.6 ~ 188 fps
A370M:
29.5  fps
ultra 1920x1080
NVIDIA GeForce RTX 3090 Ti:
173.3 173.3 ~ 173 fps
A370M:
22  fps
QHD 2560x1440
NVIDIA GeForce RTX 3090 Ti:
143.1 143.1 ~ 143 fps
A370M:
14.5  fps
4K 3840x2160
NVIDIA GeForce RTX 3090 Ti:
83.8 83.8 ~ 84 fps
Control

Control

2019
med. 1920x1080
NVIDIA GeForce RTX 3090 Ti:
240 240 ~ 240 fps
high 1920x1080
NVIDIA GeForce RTX 3090 Ti:
209 209 ~ 209 fps
QHD 2560x1440
NVIDIA GeForce RTX 3090 Ti:
142.5 142.5 ~ 143 fps
4K 3840x2160
NVIDIA GeForce RTX 3090 Ti:
73.9 73.9 ~ 74 fps
med. 1920x1080
NVIDIA GeForce RTX 3090 Ti:
342.6 342.6 ~ 343 fps
high 1920x1080
NVIDIA GeForce RTX 3090 Ti:
248.9 248.9 ~ 249 fps
ultra 1920x1080
NVIDIA GeForce RTX 3090 Ti:
176.6 176.6 ~ 177 fps
QHD 2560x1440
NVIDIA GeForce RTX 3090 Ti:
117.9 117.9 ~ 118 fps
4K 3840x2160
NVIDIA GeForce RTX 3090 Ti:
59.9 59.9 ~ 60 fps
low 1280x720
A370M:
92.1  fps
med. 1920x1080
NVIDIA GeForce RTX 3090 Ti:
213 213 ~ 213 fps
A370M:
44.1  fps
high 1920x1080
NVIDIA GeForce RTX 3090 Ti:
175.2 175.2 ~ 175 fps
A370M:
31.3  fps
ultra 1920x1080
NVIDIA GeForce RTX 3090 Ti:
145.9 145.9 ~ 146 fps
A370M:
25.5  fps
QHD 2560x1440
NVIDIA GeForce RTX 3090 Ti:
125.3 125.3 ~ 125 fps
A370M:
19.8  fps
4K 3840x2160
NVIDIA GeForce RTX 3090 Ti:
84.3 84.3 ~ 84 fps
low 1280x720
A370M:
67  fps
med. 1920x1080
NVIDIA GeForce RTX 3090 Ti:
265 265 ~ 265 fps
A370M:
49  fps
high 1920x1080
NVIDIA GeForce RTX 3090 Ti:
257 257 ~ 257 fps
A370M:
39 42 ~ 41 fps
ultra 1920x1080
NVIDIA GeForce RTX 3090 Ti:
244 244 ~ 244 fps
A370M:
32  fps
QHD 2560x1440
NVIDIA GeForce RTX 3090 Ti:
184 184 ~ 184 fps
A370M:
20  fps
4K 3840x2160
NVIDIA GeForce RTX 3090 Ti:
106 106 ~ 106 fps
Strange Brigade

Strange Brigade

2018
low 1280x720
A370M:
175.8 175.9 184.8 ~ 179 fps
med. 1920x1080
A370M:
73.2 73.9 76.7 ~ 75 fps
high 1920x1080
A370M:
61.4 62 64.2 ~ 63 fps
ultra 1920x1080
A370M:
52.1 52.5 54.3 ~ 53 fps
QHD 2560x1440
A370M:
37.2  fps
Far Cry 5

Far Cry 5

2018
low 1280x720
A370M:
87 90 ~ 89 fps
med. 1920x1080
A370M:
48 49 ~ 49 fps
high 1920x1080
A370M:
45 46 ~ 46 fps
ultra 1920x1080
A370M:
42 43 ~ 43 fps
QHD 2560x1440
A370M:
28 29 ~ 29 fps
low 1280x720
NVIDIA GeForce RTX 3090 Ti:
169.1 169.1 ~ 169 fps
A370M:
34.7 36.9 43.5 ~ 38 fps
med. 1920x1080
NVIDIA GeForce RTX 3090 Ti:
158.1 158.1 ~ 158 fps
A370M:
27.4 27.8 34.2 ~ 30 fps
high 1920x1080
NVIDIA GeForce RTX 3090 Ti:
135.9 135.9 ~ 136 fps
A370M:
23.9 24 29.9 ~ 26 fps
4K 3840x2160
NVIDIA GeForce RTX 3090 Ti:
115.7 115.7 ~ 116 fps
A370M:
22.2  fps
low 1280x720
NVIDIA GeForce RTX 3090 Ti:
222 222 ~ 222 fps
A370M:
66.9 70.3 70.4 ~ 69 fps
med. 1920x1080
NVIDIA GeForce RTX 3090 Ti:
226 226 ~ 226 fps
A370M:
34.4 37.9 38.4 ~ 37 fps
high 1920x1080
NVIDIA GeForce RTX 3090 Ti:
186.1 186.1 ~ 186 fps
A370M:
19.6 26.3 26.7 ~ 24 fps
QHD 2560x1440
NVIDIA GeForce RTX 3090 Ti:
151.6 151.6 ~ 152 fps
A370M:
14.4 19.3 19.8 37.9 ~ 23 fps
4K 3840x2160
NVIDIA GeForce RTX 3090 Ti:
96.3 96.3 ~ 96 fps
high 1920x1080
A370M:
44  fps
low 1280x720
NVIDIA GeForce RTX 3090 Ti:
257.7 257.7 ~ 258 fps
A370M:
82.6 99.1 104.4 ~ 95 fps
med. 1366x768
NVIDIA GeForce RTX 3090 Ti:
231.2 231.2 ~ 231 fps
A370M:
69.2 83.5 92.2 ~ 82 fps
high 1920x1080
NVIDIA GeForce RTX 3090 Ti:
217.1 217.1 ~ 217 fps
A370M:
62.2 68.4 72.8 ~ 68 fps
ultra 1920x1080
NVIDIA GeForce RTX 3090 Ti:
194.1 195.8 ~ 195 fps
A370M:
57.7 66.3 68.3 ~ 64 fps
4K 3840x2160
NVIDIA GeForce RTX 3090 Ti:
184.2 184.2 ~ 184 fps
A370M:
39.5  fps
low 1024x768
A370M:
121 166.7 168.8 ~ 152 fps
med. 1366x768
A370M:
87 98.9 100 ~ 95 fps
high 1920x1080
NVIDIA GeForce RTX 3090 Ti:
394 394 ~ 394 fps
A370M:
45 53 55.9 ~ 51 fps
ultra 1920x1080
NVIDIA GeForce RTX 3090 Ti:
193.4 193.4 196.3 ~ 194 fps
A370M:
25 25.8 26.3 ~ 26 fps
4K 3840x2160
NVIDIA GeForce RTX 3090 Ti:
172.9 172.9 ~ 173 fps
GTA V

GTA V

2015
low 1024x768
A370M:
145.4 148.6 157.2 ~ 150 fps
med. 1366x768
A370M:
135.1 136.9 148.3 ~ 140 fps
high 1920x1080
NVIDIA GeForce RTX 3090 Ti:
179.9 185.6 ~ 183 fps
A370M:
40.5 40.7 41.4 ~ 41 fps
ultra 1920x1080
NVIDIA GeForce RTX 3090 Ti:
151.8 160.7 ~ 156 fps
A370M:
0 (!) 16.2 16.4 ~ 11 fps
QHD 2560x1440
NVIDIA GeForce RTX 3090 Ti:
146.4 155.3 ~ 151 fps
A370M:
9.7 10.7 11 ~ 10 fps
4K 3840x2160
NVIDIA GeForce RTX 3090 Ti:
179.5 182.6 ~ 181 fps
Intel Arc A530MNVIDIA GeForce RTX 3090 TiIntel Arc A370M
lowmed.highultraQHD4Klowmed.highultraQHD4Klowmed.highultraQHD4K
Diablo 467.160.939.2
Star Wars Jedi Survivor2319.719.217.7
Resident Evil 4 Remake45.726.311.63.52
Company of Heroes 355.747.837.237.1
Sons of the Forest27.617.411.511.4
Atomic Heart55.542.42420.2
Returnal27262210
Hogwarts Legacy43.230.319.612.7
Dead Space Remake22.617.812.18.86
High On Life73.444.640.832.6
A Plague Tale Requiem22.919.516.614.3
FIFA 237062404130
F1 22127.249.546.3332.85
Vampire Bloodhunt12787625534
Cyberpunk 2077 1.62192011731521045346.137.125.421
GRID Legends2282021731571531219769564233
God of War3531251912
Guardians of the Galaxy231412
Far Cry 61791621421339086443624
F1 2021537470242189115192896225
Hitman 385.754.95046.223.4
Assassin´s Creed Valhalla160138123108736233201813
Dirt 580.440.73223.115.2
Watch Dogs Legion171154130108707745341511
Horizon Zero Dawn5740353123
Gears Tactics18976.848.838.427.7
Borderlands 32041881731438476.447.529.52214.5
Metro Exodus2131751461258492.144.131.325.519.8
Shadow of the Tomb Raider2652572441841066749413220
Strange Brigade17975635337.2
Far Cry 58949464329
X-Plane 11.1116915813611638302622.2
Final Fantasy XV Benchmark2222261861529669372423
Middle-earth: Shadow of War44
Dota 2 Reborn2582312171951849582686439.5
The Witcher 3394194173152955126
GTA V183156151181150140411110
Intel Arc A530MNVIDIA GeForce RTX 3090 TiIntel Arc A370M
lowmed.highultraQHD4Klowmed.highultraQHD4Klowmed.highultraQHD4K
< 30 fps
< 60 fps
< 120 fps
≥ 120 fps


< 30 fps
< 60 fps
< 120 fps
≥ 120 fps


5


12


14


12


3
8

1
9
4
< 30 fps
< 60 fps
< 120 fps
≥ 120 fps
6
8
15
7
7
19
9
1
15
18
4
19
12
1
14
4

1
1

For more games that might be playable and a list of all games and graphics cards visit our Gaming List

v1.33
log 31. 11:02:54

#0 ran 0s before starting gpusingle class +0s ... 0s

#1 checking url part for id 11612 +0s ... 0s

#2 checking url part for id 11324 +0s ... 0s

#3 checking url part for id 11306 +0s ... 0s

#4 redirected to Ajax server, took 1756630973s time from redirect:0 +0s ... 0s

#5 did not recreate cache, as it is less than 5 days old! Created at Sun, 31 Aug 2025 05:18:20 +0200 +0s ... 0s

#6 composed specs +0.031s ... 0.031s

#7 did output specs +0s ... 0.031s

#8 start showIntegratedCPUs +0s ... 0.031s

#9 getting avg benchmarks for device 11612 +0.019s ... 0.049s

#10 got single benchmarks 11612 +0.003s ... 0.053s

#11 getting avg benchmarks for device 11324 +0.004s ... 0.056s

#12 got single benchmarks 11324 +0.005s ... 0.061s

#13 getting avg benchmarks for device 11306 +0s ... 0.062s

#14 got single benchmarks 11306 +0.007s ... 0.068s

#15 got avg benchmarks for devices +0s ... 0.068s

#16 min, max, avg, median took s +0.034s ... 0.102s

#17 before gaming benchmark output +0s ... 0.103s

#18 Got 474 rows for game benchmarks. +0.018s ... 0.12s

#19 composed SQL query for gamebenchmarks +0s ... 0.12s

#20 got data and put it in $dataArray +0.004s ... 0.124s

#21 benchmarks composed for output. +0.016s ... 0.14s

#22 calculated avg scores. +0s ... 0.14s

#23 return log +0.001s ... 0.14s

Please share our article, every link counts!
Mail Logo
> Expert Reviews and News on Laptops, Smartphones and Tech Innovations > Benchmarks / Tech > Graphics Card Comparison - Head 2 Head
Redaktion, 2017-09- 8 (Update: 2023-07- 1)