Intel Arc A370M vs NVIDIA RTX 2000 Ada Generation Laptop GPU
Intel Arc A370M ► remove from comparison
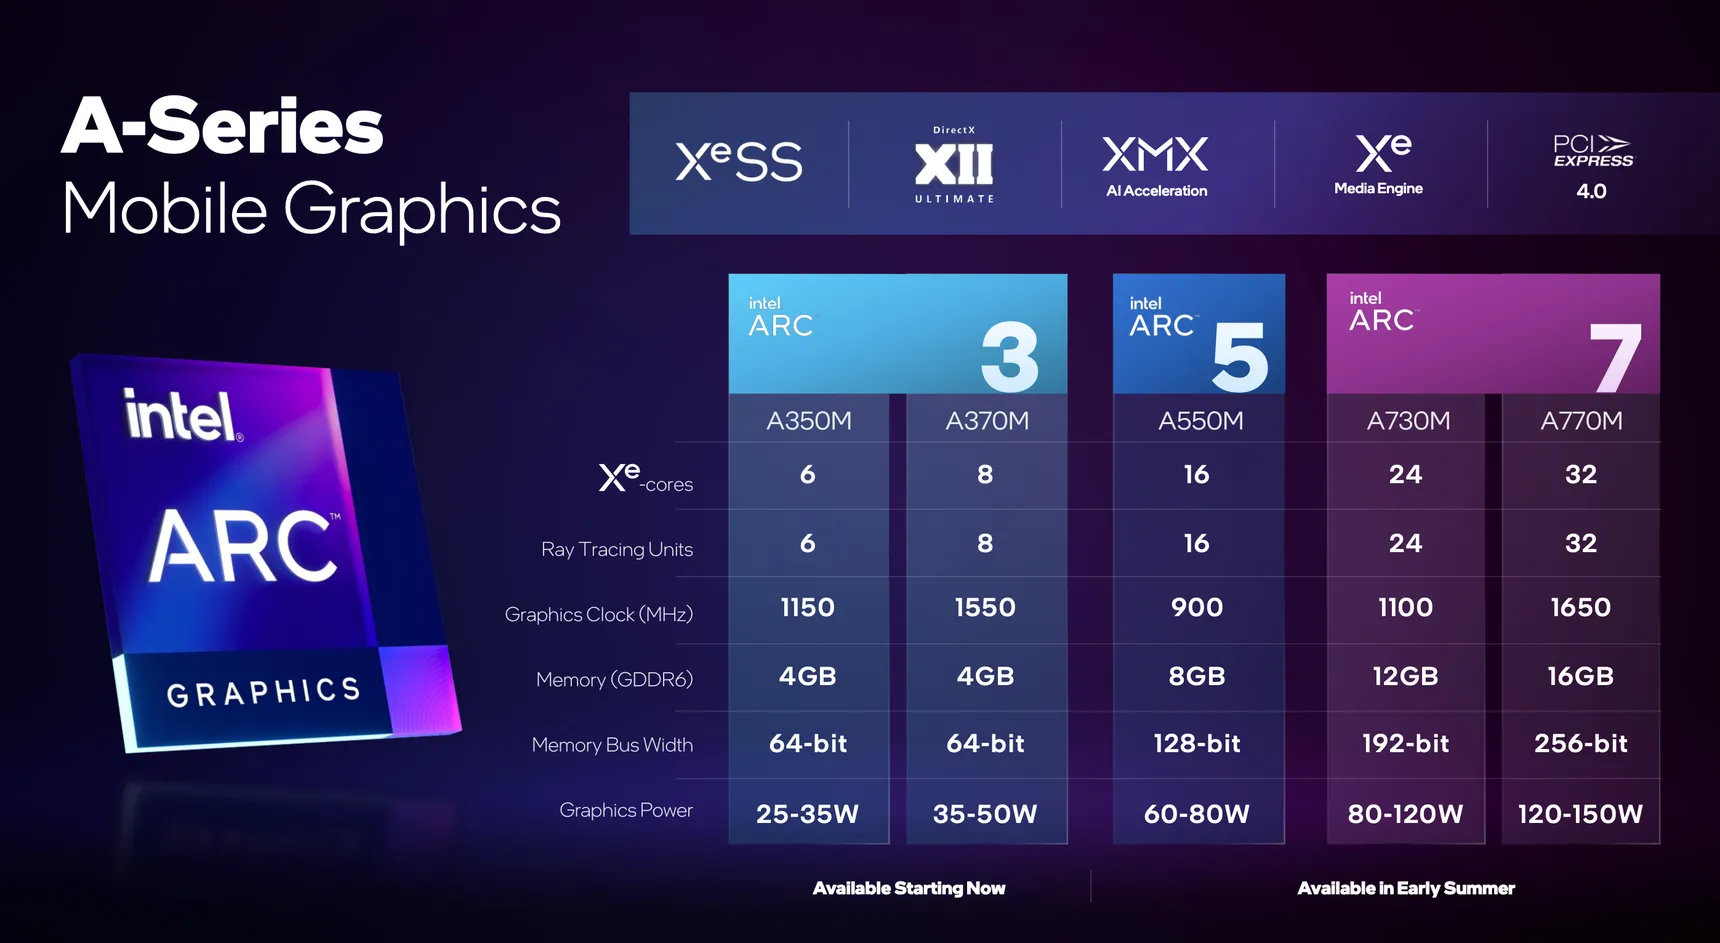
The Intel Arc A370M is a dedicated mobile entry level graphics card for laptops based on Xe HPG microarchitecture. It uses the ACM-G11 chip and offers all 8 Xe-cores (128 ALUs), 8 ray tracing units and a 64-bit memory bus for 4 GB GDDR6 graphics memory. The chip integrates 7.2 billion transistors and the die measures 157 mm2.
The performance is in the entry level of dedicated graphics cards for laptops in 2022. AMD did publish some gaming benchmarks with medium settings in 5 games that showed that the Radeon RX 6500M is clearly faster. Intel only compared the A370M (with a faster CPU) to the slower Iris iGPU in the i7-1280P (see below). Thanks to the additional 2 cores and higher clock speeds, the entry level Arc A350M should be clearly left behind.
The chip also integrates two media engines for VP9, AVC, HEVC, and AV1 8k en- and decoding. The 4 display pipes support up to 4x 4k120 HDR via DMI 2.0B or DisplayPort 2.0 10G.
The A370M is produced in 6nm at TSMC (N6 process) and supports dynamic power share (using Deep Link) with 12th gen Intel CPUs (Alder Lake).
NVIDIA RTX 2000 Ada Generation Laptop GPU ► remove from comparison
The Nvidia RTX 2000 Ada Generation Laptop GPU , not to be confused with the A2000 , P2000 or T2000 , is a mid-range professional graphics card for use in laptops that sports 3,072 CUDA cores and 8 GB of GDDR6 VRAM. It would be fair to say that this is a GeForce RTX 4060 (Laptop) in disguise; consequently, the former is powered by the same AD107 chip as the latter, and is fast enough to handle any triple-A game at 1080p with Ultra quality settings. Brought into existence in 2023, the RTX 2000 leverages TSMC's 5 nm process and Nvidia's Ada Lovelace architecture to achieve very decent performance combined with moderate power consumption. The Nvidia-recommended TGP range for the card is very wide at 35 W to 140 W leading to bizarre performance differences between different systems powered by what is supposed to be the same product.
Quadro series graphics cards ship with much different BIOS and drivers than GeForce cards and are targeted at professional users rather than gamers. Commercial product design, large-scale calculations, simulation, data mining, 24 x 7 operation, certified drivers - if any of this sounds familiar, then a Quadro card will make you happy.
Architecture and Features
Ada Lovelace brings a range of improvements over older graphics cards utilizing the outgoing Ampere architecture. It's not just a better manufacturing process and a higher number of CUDA cores that we have here (up to 16,384 versus 10,752); under-the-hood refinements are plentiful, including an immensely larger L2 cache, an optimized ray tracing routine (a different way is employed to determine what is transparent and what isn't), and other changes. Naturally, these graphics cards can both encode and decode some of the most widely used video codecs, AVC, HEVC and AV1 included; they also support a host of Nvidia technologies, including Optimus and DLSS 3, and they can certainly be used for various AI applications.
The RTX 2000 features 24 RT cores of the 3rd generation, 96 Tensor cores of the 4th generation and 3,072 CUDA cores. Increase those numbers by 50%, and you get an RTX 3000 Ada Generation - as long as we disregard clock speed differences, of course. Unlike costlier Ada Generation professional laptop graphics cards, the RTX 2000 comes with 8 GB of non-ECC VRAM; the lack of error correction makes this card less suitable for super-important tasks and round-the-clock operation. Much like it is with the RTX 3000 Ada Generation, the VRAM is 128-bit wide and delivers a decent bandwidth of ~256 GB/s.
The RTX 2000 Ada Generation makes use of the PCI-Express 4 protocol, just like Ampere-based cards. 8K SUHD monitors are supported, however, DP 1.4a video outputs can potentially prove to be a bottleneck down the line.
Performance
The average RTX 2000 Ada in our extensive database is much closer to the RTX 4050 Laptop than it is to the RTX 4060 Laptop .
Nvidia's marketing materials mention "up to 14.5 TFLOPS" of performance, a significant downgrade compared to 20 TFLOPS delivered by the RTX 3000 Ada Generation .
Your mileage may vary depending on how competent the cooling solution of your laptop is and how high the TGP power target of the RTX 2000 Ada is.
Power consumption
Nvidia no longer divides its laptop graphics cards into Max-Q and non-max-Q models. Instead, laptop makers are free to set the TGP according to their needs, and the range can sometimes be shockingly wide. This is especially the case for the RTX 2000, as the lowest value recommended for it sits at just 35 W while the highest is 300% higher at 140 W. The slowest system built around an RTX 2000 Ada can easily be half as fast as the fastest one. This is the kind of delta that we've already seen on consumer-grade laptops featuring the latest GeForce RTX cards.
Last but not the least, the improved 5 nm process (TSMC 4N) the RTX 2000 is built with makes for very decent energy efficiency, as of mid 2023.
Intel Arc A370M NVIDIA RTX 2000 Ada Generation Laptop GPU RTX Ada Generation Laptop GPU Series Arc A770 4096 @ 2.1 - 2.4 GHz 256 Bit @ 16000 MHz Arc A750 3584 @ 2.05 - 2.4 GHz 256 Bit @ 16000 MHz Arc A580 3072 @ 1.7 - 2 GHz 256 Bit @ 16000 MHz A770M 4096 @ 1.65 GHz 256 Bit @ 16000 MHz A730M 3072 @ 1.1 GHz 192 Bit @ 14000 MHz A570M 16 @ 0.9 - 1.3 GHz 128 Bit @ 14000 MHz A550M 16 @ 0.9 - 2.01 GHz 128 Bit @ 14000 MHz A530M 12 @ 0.9 - 1.3 GHz 128 Bit @ 14000 MHz A370M 8 @ 1.55 GHz 64 Bit @ 14000 MHz Arc A380 1024 @ 2 GHz 96 Bit @ 15500 MHz A310 6 @ 2 GHz 64 Bit @ 15500 MHz A350M 6 @ 1.15 GHz 64 Bit @ 14000 MHz
Codename Alchemist Architecture Xe HPG Ada Lovelace Pipelines 8 - unified 3072 - unified Raytracing Cores 8 24 Core Speed 1550 MHz Cache L1: 1.5 MB, L2: 4 MB L2: 32 MB Memory Speed 14000 MHz 16000 effective = 2000 MHz Memory Bus Width 64 Bit 128 Bit Memory Type GDDR6 GDDR6 Max. Amount of Memory 4 GB 8 GB Shared Memory no no Memory Bandwidth 112 GB/s 256 GB/s API DirectX 12_2, OpenGL 4.6, Vulkan 1.3 DirectX 12 Ultimate, Shader 6.7, OpenGL 4.6, OpenCL 3.0, Vulkan 1.3 Power Consumption 50 Watt (35 - 50 Watt TGP) 115 Watt (35 - 115 Watt TGP) Transistors 7.2 Billion Die Size 157 mm² technology 6 nm 5 nm PCIe 4 8x 4 Displays 4 Displays (max.), HDMI 2.0b, DisplayPort 2.0 10G Ready 4 Displays (max.), HDMI 2.1, DisplayPort 1.4a Date of Announcement 30.03.2022 21.03.2023 Link to Manufacturer Page www.intel.com images.nvidia.com TMUs 96 ROPs 32 Tensor / AI Cores 96 Notebook Size large Predecessor RTX A2000 Laptop GPU
Benchmarks 3DMark - 3DMark Time Spy Score
min: 3505 avg: 4023 median: 4255 (12%) max: 4308 Points
GPU TDP ? TDP 35 W TDP 45 W 100% 99% 81%
min: 7813 avg: 8763 median: 8849 (26%) max: 9628 Points
GPU TDP ? TDP 35 W TDP 45 W TDP 50 W TDP 65 W TDP 80 W 45% 44% 36% 81% 92% 100%
3DMark - 3DMark Time Spy Graphics
min: 3167 avg: 3650 median: 3885 (10%) max: 3899 Points
GPU TDP ? TDP 35 W TDP 45 W 100% 100% 81%
min: 7410 avg: 8334 median: 8433 (22%) max: 9158 Points
GPU TDP ? TDP 35 W TDP 45 W TDP 50 W TDP 65 W TDP 80 W 42% 43% 35% 81% 92% 100%
3DMark - 3DMark Cloud Gate Score
min: 27250 avg: 28035 median: 28128 (30%) max: 28727 Points
GPU TDP ? TDP 35 W TDP 45 W 98% 100% 95%
58198 Points (62%)
GPU TDP ? TDP 35 W TDP 45 W TDP 80 W 48% 49% 47% 100%
3DMark - 3DMark Cloud Gate Graphics
min: 33721 avg: 36141 median: 35604 (9%) max: 39098 Points
GPU TDP ? TDP 35 W TDP 45 W 86% 100% 91%
133204 Points (35%)
GPU TDP ? TDP 35 W TDP 45 W TDP 80 W 25% 29% 27% 100%
3DMark - 3DMark Fire Strike Standard Score
min: 7699 avg: 7735 median: 7717 (14%) max: 7789 Points
GPU TDP ? TDP 35 W TDP 45 W 99% 100% 99%
min: 18177 avg: 20223 median: 19987 (35%) max: 22505 Points
GPU TDP ? TDP 35 W TDP 45 W TDP 50 W TDP 65 W TDP 80 W 34% 35% 34% 81% 89% 100%
3DMark - 3DMark Fire Strike Standard Graphics
min: 8015 avg: 8157 median: 8149 (9%) max: 8307 Points
GPU TDP ? TDP 35 W TDP 45 W 96% 100% 98%
min: 20340 avg: 22325 median: 22039 (25%) max: 24596 Points
GPU TDP ? TDP 35 W TDP 45 W TDP 50 W TDP 65 W TDP 80 W 33% 34% 33% 83% 90% 100%
3DMark - 3DMark Wild Life Extreme Unlimited
15840 Points (18%)
3DMark 11 - 3DM11 Performance Score
min: 12308 avg: 12563 median: 12520.5 (17%) max: 12902 Points
GPU TDP ? TDP 35 W TDP 45 W 100% 100% 97%
min: 25876 avg: 27504 median: 27558 (38%) max: 29077 Points
GPU TDP ? TDP 35 W TDP 45 W TDP 50 W TDP 65 W TDP 80 W 44% 43% 42% 89% 95% 100%
3DMark 11 - 3DM11 Performance GPU
min: 11748 avg: 12066 median: 12089.5 (10%) max: 12338 Points
GPU TDP ? TDP 35 W TDP 45 W 98% 100% 95%
min: 26968 avg: 30077 median: 30262 (26%) max: 33001 Points
GPU TDP ? TDP 35 W TDP 45 W TDP 50 W TDP 65 W TDP 80 W 37% 37% 36% 82% 92% 100%
3DMark Vantage + NVIDIA RTX 2000 Ada Generation Laptop GPU 3DMark Vantage - 3DM Vant. Perf. total
37844 Points (11%)
3DM Vant. Perf. GPU no PhysX + NVIDIA RTX 2000 Ada Generation Laptop GPU 3DMark Vantage - 3DM Vant. Perf. GPU no PhysX
32473 Points (18%)
3DMark 06 3DMark 06 - Standard 1280x1024 + NVIDIA RTX 2000 Ada Generation Laptop GPU
53707 Points (70%)
Unigine Valley 1.0 - Unigine Valley 1.0 DX
34.1 fps (11%)
Blender - Blender 3.3 Classroom CUDA *
min: 51 avg: 85.7 median: 51 (8%) max: 155 Seconds
GPU TDP 50 W TDP 65 W TDP 80 W 120% 120% 100%
Blender - Blender 3.3 Classroom OPTIX *
min: 25 avg: 26.3 median: 26 (10%) max: 28 Seconds
GPU TDP 50 W TDP 65 W TDP 80 W 101% 100% 101%
SPECviewperf 13 specvp13 sw-04 + Intel Arc A370M SPECviewperf 13 - specvp13 sw-04
60.4 fps (16%)
specvp13 sw-04 + NVIDIA RTX 2000 Ada Generation Laptop GPU
min: 173.89 avg: 181.1 median: 174.7 (47%) max: 194.75 fps
GPU TDP 35 W TDP 50 W TDP 65 W TDP 80 W 31% 89% 100% 90%
specvp13 snx-03 + Intel Arc A370M SPECviewperf 13 - specvp13 snx-03
2 fps (0%)
specvp13 snx-03 + NVIDIA RTX 2000 Ada Generation Laptop GPU
min: 315.35 avg: 333.9 median: 330 (37%) max: 356.29 fps
GPU TDP 35 W TDP 50 W TDP 65 W TDP 80 W 1% 89% 93% 100%
specvp13 showcase-02 + Intel Arc A370M SPECviewperf 13 - specvp13 showcase-02
30.2 fps (7%)
specvp13 showcase-02 + NVIDIA RTX 2000 Ada Generation Laptop GPU
min: 79.97 avg: 85.9 median: 82.8 (18%) max: 95.04 fps
GPU TDP 35 W TDP 50 W TDP 65 W TDP 80 W 32% 87% 100% 84%
specvp13 medical-02 + Intel Arc A370M SPECviewperf 13 - specvp13 medical-02
28 fps (6%)
specvp13 medical-02 + NVIDIA RTX 2000 Ada Generation Laptop GPU
min: 103.3 avg: 126.4 median: 110.7 (23%) max: 165.27 fps
GPU TDP 35 W TDP 50 W TDP 65 W TDP 80 W 17% 63% 100% 67%
specvp13 maya-05 + Intel Arc A370M SPECviewperf 13 - specvp13 maya-05
75.1 fps (9%)
specvp13 maya-05 + NVIDIA RTX 2000 Ada Generation Laptop GPU
min: 271.86 avg: 280.7 median: 276.7 (31%) max: 293.61 fps
GPU TDP 35 W TDP 50 W TDP 65 W TDP 80 W 26% 93% 100% 94%
specvp13 energy-02 + Intel Arc A370M SPECviewperf 13 - specvp13 energy-02
3.9 fps (1%)
specvp13 energy-02 + NVIDIA RTX 2000 Ada Generation Laptop GPU
min: 46.29 avg: 48.4 median: 49.4 (16%) max: 49.58 fps
GPU TDP 35 W TDP 50 W TDP 65 W TDP 80 W 8% 93% 100% 100%
specvp13 creo-02 + Intel Arc A370M SPECviewperf 13 - specvp13 creo-02
61.1 fps (9%)
specvp13 creo-02 + NVIDIA RTX 2000 Ada Generation Laptop GPU
min: 249.3 avg: 258.6 median: 261.4 (38%) max: 265.15 fps
GPU TDP 35 W TDP 50 W TDP 65 W TDP 80 W 23% 94% 100% 99%
specvp13 catia-05 + Intel Arc A370M SPECviewperf 13 - specvp13 catia-05
85.8 fps (10%)
specvp13 catia-05 + NVIDIA RTX 2000 Ada Generation Laptop GPU
min: 257.86 avg: 293.4 median: 309.5 (34%) max: 312.95 fps
GPU TDP 35 W TDP 50 W TDP 65 W TDP 80 W 27% 82% 99% 100%
specvp13 3dsmax-06 + Intel Arc A370M SPECviewperf 13 - specvp13 3dsmax-06
62.7 fps (11%)
specvp13 3dsmax-06 + NVIDIA RTX 2000 Ada Generation Laptop GPU
min: 155.94 avg: 179.7 median: 182.5 (32%) max: 200.54 fps
GPU TDP 35 W TDP 50 W TDP 65 W TDP 80 W 31% 91% 100% 78%
SPECviewperf 2020 specvp2020 solidworks-05 1080p + Intel Arc A370M SPECviewperf 2020 - specvp2020 solidworks-05 1080p
20.9 fps (4%)
specvp2020 solidworks-05 1080p + NVIDIA RTX 2000 Ada Generation Laptop GPU
min: 191.93 avg: 205.4 median: 198.6 (39%) max: 225.76 fps
GPU TDP 35 W TDP 50 W TDP 65 W TDP 80 W 9% 85% 88% 100%
specvp2020 snx-04 1080p + Intel Arc A370M SPECviewperf 2020 - specvp2020 snx-04 1080p
1.9 fps (0%)
specvp2020 snx-04 1080p + NVIDIA RTX 2000 Ada Generation Laptop GPU
min: 315.31 avg: 341.5 median: 327.9 (53%) max: 381.32 fps
GPU TDP 35 W TDP 50 W TDP 65 W TDP 80 W 1% 83% 86% 100%
specvp2020 medical-03 1080p + Intel Arc A370M SPECviewperf 2020 - specvp2020 medical-03 1080p
13.1 fps (9%)
specvp2020 medical-03 1080p + NVIDIA RTX 2000 Ada Generation Laptop GPU
min: 50.48 avg: 66.6 median: 57.2 (41%) max: 92.01 fps
GPU TDP 35 W TDP 50 W TDP 65 W TDP 80 W 14% 55% 100% 62%
specvp2020 energy-03 1080p + Intel Arc A370M SPECviewperf 2020 - specvp2020 energy-03 1080p
3.9 fps (3%)
specvp2020 energy-03 1080p + NVIDIA RTX 2000 Ada Generation Laptop GPU
min: 46.5 avg: 50.2 median: 49.7 (40%) max: 54.54 fps
GPU TDP 35 W TDP 50 W TDP 65 W TDP 80 W 7% 85% 91% 100%
specvp2020 catia-06 1080p + Intel Arc A370M SPECviewperf 2020 - specvp2020 catia-06 1080p
15.7 fps (10%)
specvp2020 catia-06 1080p + NVIDIA RTX 2000 Ada Generation Laptop GPU
min: 81.59 avg: 85.6 median: 84 (54%) max: 91.24 fps
GPU TDP 35 W TDP 50 W TDP 65 W TDP 80 W 17% 89% 92% 100%
specvp2020 3dsmax-07 1080p + Intel Arc A370M SPECviewperf 2020 - specvp2020 3dsmax-07 1080p
20.3 fps (9%)
specvp2020 3dsmax-07 1080p + NVIDIA RTX 2000 Ada Generation Laptop GPU
min: 73.7 avg: 84.5 median: 84.6 (38%) max: 95.09 fps
GPU TDP 35 W TDP 50 W TDP 65 W TDP 80 W 21% 78% 89% 100%
specvp2020 maya-06 1080p + NVIDIA RTX 2000 Ada Generation Laptop GPU SPECviewperf 2020 - specvp2020 maya-06 1080p
min: 309.59 avg: 331.5 median: 329.5 (48%) max: 355.25 fps
GPU TDP 50 W TDP 65 W TDP 80 W 87% 93% 100%
specvp2020 creo-03 1080p + NVIDIA RTX 2000 Ada Generation Laptop GPU SPECviewperf 2020 - specvp2020 creo-03 1080p
min: 96.6 avg: 118.7 median: 121.7 (60%) max: 137.93 fps
GPU TDP 50 W TDP 65 W TDP 80 W 88% 100% 70%
specvp2020 solidworks-05 4k + NVIDIA RTX 2000 Ada Generation Laptop GPU SPECviewperf 2020 - specvp2020 solidworks-05 4k
77.6 fps (23%)
specvp2020 snx-04 4k + NVIDIA RTX 2000 Ada Generation Laptop GPU SPECviewperf 2020 - specvp2020 snx-04 4k
148.1 fps (15%)
specvp2020 medical-03 4k + NVIDIA RTX 2000 Ada Generation Laptop GPU SPECviewperf 2020 - specvp2020 medical-03 4k
17 fps (16%)
specvp2020 maya-06 4k + NVIDIA RTX 2000 Ada Generation Laptop GPU SPECviewperf 2020 - specvp2020 maya-06 4k
114 fps (19%)
specvp2020 energy-03 4k + NVIDIA RTX 2000 Ada Generation Laptop GPU SPECviewperf 2020 - specvp2020 energy-03 4k
14.9 fps (3%)
specvp2020 creo-03 4k + NVIDIA RTX 2000 Ada Generation Laptop GPU SPECviewperf 2020 - specvp2020 creo-03 4k
69.2 fps (33%)
specvp2020 catia-06 4k + NVIDIA RTX 2000 Ada Generation Laptop GPU SPECviewperf 2020 - specvp2020 catia-06 4k
44.7 fps (29%)
specvp2020 3dsmax-07 4k + NVIDIA RTX 2000 Ada Generation Laptop GPU SPECviewperf 2020 - specvp2020 3dsmax-07 4k
46.8 fps (20%)
Cinebench R15 + Intel Arc A370M Cinebench R15 - Cinebench R15 OpenGL 64 Bit
min: 125.4 avg: 148.3 median: 129.1 (8%) max: 190.4 fps
GPU TDP ? TDP 35 W TDP 45 W 100% 66% 68%
Cinebench R15 OpenGL 64 Bit + NVIDIA RTX 2000 Ada Generation Laptop GPU
min: 223 avg: 290.3 median: 295 (17%) max: 353 fps
GPU TDP ? TDP 35 W TDP 45 W TDP 50 W TDP 65 W TDP 80 W 54% 36% 37% 63% 84% 100%
Cinebench R15 OpenGL Ref. Match 64 Bit + Intel Arc A370M Cinebench R15 - Cinebench R15 OpenGL Ref. Match 64 Bit
97.8 % (98%)
GPU TDP ? TDP 35 W TDP 45 W 100% 100% 100%
Cinebench R15 OpenGL Ref. Match 64 Bit + NVIDIA RTX 2000 Ada Generation Laptop GPU
99.6 % (100%)
GPU TDP ? TDP 35 W TDP 45 W TDP 50 W TDP 65 W TDP 80 W 98% 98% 98% 100% 100% 100%
GFXBench - GFXBench 5.0 4K Aztec Ruins High Tier Offscreen
27 fps (11%)
GFXBench - GFXBench 5.0 Aztec Ruins High Tier Offscreen
61.4 fps (11%)
GFXBench - GFXBench 5.0 Aztec Ruins Normal Tier Offscreen
162.8 fps (12%)
GFXBench - GFXBench Car Chase Offscreen
145.2 fps (16%)
GFXBench 3.1 - GFXBench Manhattan ES 3.1 Offscreen
193.4 fps (4%)
GFXBench 3.0 - GFXBench 3.0 Manhattan Offscreen
304.1 fps (18%)
GFXBench (DX / GLBenchmark) 2.7 + NVIDIA RTX 2000 Ada Generation Laptop GPU GFXBench (DX / GLBenchmark) 2.7 - GFXBench T-Rex HD Offscreen C24Z16
599 fps (5%)
Basemark GPU 1.2 - Basemark GPU 1.2 Vulkan Official Medium Offscreen 1080
min: 104.6 avg: 196.8 median: 196.8 (1%) max: 289 fps
GPU TDP 50 W TDP 65 W 36% 100%
Basemark GPU 1.2 - Basemark GPU 1.2 Vulkan Official High Offscreen 2160
3.6 fps (1%)
Geekbench 6.2 - Geekbench 6.2 GPU OpenCL
min: 75472 avg: 76342 median: 76342 (22%) max: 77212 Points
GPU TDP 50 W TDP 65 W 100% 98%
Geekbench 6.2 - Geekbench 6.2 GPU Vulkan
min: 19217 avg: 46136 median: 46136 (15%) max: 73055 Points
GPU TDP 50 W TDP 65 W 100% 26%
LuxMark v2.0 64Bit - LuxMark v2.0 Room GPU
2981 Samples/s (13%)
LuxMark v2.0 64Bit - LuxMark v2.0 Sala GPU
6323 Samples/s (11%)
ComputeMark v2.1 - ComputeMark v2.1 Result
14884 Points (16%)
Power Consumption - Furmark Stress Test Power Consumption - external Monitor *
min: 57.7 avg: 68.1 median: 58.8 (8%) max: 87.7 Watt
GPU TDP ? TDP 35 W TDP 45 W 100% 105% 105%
min: 75.1 avg: 94.2 median: 87.9 (12%) max: 119.5 Watt
GPU TDP ? TDP 35 W TDP 45 W TDP 50 W TDP 65 W TDP 80 W 105% 111% 110% 108% 105% 100%
Power Consumption - The Witcher 3 Power Consumption - external Monitor *
min: 61.3 avg: 70.4 median: 65 (9%) max: 85 Watt
GPU TDP ? TDP 35 W TDP 45 W 100% 103% 104%
min: 84.4 avg: 109.1 median: 101.5 (14%) max: 141.5 Watt
GPU TDP ? TDP 35 W TDP 45 W TDP 50 W TDP 65 W TDP 80 W 110% 113% 114% 110% 107% 100%
Power Consumption - Witcher 3 Power Consumption *
min: 65 avg: 73.1 median: 68.8 (15%) max: 85.6 Watt
GPU TDP ? TDP 35 W TDP 45 W 100% 105% 106%
min: 87.9 avg: 112.5 median: 104.7 (23%) max: 144.9 Watt
GPU TDP ? TDP 35 W TDP 45 W TDP 50 W TDP 65 W TDP 80 W 119% 125% 126% 118% 113% 100%
Power Consumption - Witcher 3 ultra Power Efficiency
min: 0.3014 avg: 0.4 median: 0.4 (35%) max: 0.3846 fps per Watt
GPU TDP ? TDP 35 W TDP 45 W 78% 99% 100%
0.8 fps per Watt (69%)
GPU TDP ? TDP 35 W TDP 45 W TDP 65 W 40% 50% 51% 100%
Power Consumption - Witcher 3 ultra Power Efficiency - external Monitor
min: 0.3035 avg: 0.4 median: 0.4 (34%) max: 0.4078 fps per Watt
GPU TDP ? TDP 35 W TDP 45 W 74% 99% 100%
0.8 fps per Watt (65%)
GPU TDP ? TDP 35 W TDP 45 W TDP 65 W 39% 52% 52% 100%
Emissions Witcher 3 Fan Noise + Intel Arc A370M Emissions - Witcher 3 Fan Noise
45.2 dB(A) (72%)
Witcher 3 Fan Noise + NVIDIA RTX 2000 Ada Generation Laptop GPU
min: 40.7 avg: 44.9 median: 43.3 (69%) max: 50.6 dB(A)
GPU TDP ? TDP 50 W TDP 65 W TDP 80 W 89% 86% 80% 100%
Average Benchmarks Intel Arc A370M → 100% n=25 Average Benchmarks NVIDIA RTX 2000 Ada Generation Laptop GPU → 1730% n=25
- Range of benchmark values for this graphics card
- Average benchmark values for this graphics card
* Smaller numbers mean a higher performance
1 This benchmark is not used for the average calculation
Game Benchmarks The following benchmarks stem from our benchmarks of review laptops. The performance depends on the used graphics memory, clock rate, processor, system settings, drivers, and operating systems. So the results don't have to be representative for all laptops with this GPU. For detailed information on the benchmark results, click on the fps number.
NVIDIA RTX 2000 Ada Generation Laptop GPU:
113 fps
NVIDIA RTX 2000 Ada Generation Laptop GPU:
103 fps
NVIDIA RTX 2000 Ada Generation Laptop GPU:
97 fps
NVIDIA RTX 2000 Ada Generation Laptop GPU:
76 fps
NVIDIA RTX 2000 Ada Generation Laptop GPU:
58 fps
NVIDIA RTX 2000 Ada Generation Laptop GPU:
85.4 [X] HP ZBook Power 15 G10 2.02
AMD Ryzen 7 PRO 7840HS 3.8GHz
NVIDIA RTX 2000 Ada Generation Laptop GPU
min:
49.2 fps, max:
119.7 fps
fps
NVIDIA RTX 2000 Ada Generation Laptop GPU:
64.5 [X] HP ZBook Power 15 G10 2.02
AMD Ryzen 7 PRO 7840HS 3.8GHz
NVIDIA RTX 2000 Ada Generation Laptop GPU
min:
46.8 fps, max:
101.4 fps
fps
NVIDIA RTX 2000 Ada Generation Laptop GPU:
55.2 [X] HP ZBook Power 15 G10 2.02
AMD Ryzen 7 PRO 7840HS 3.8GHz
NVIDIA RTX 2000 Ada Generation Laptop GPU
min:
41.1 fps, max:
72 fps
fps
NVIDIA RTX 2000 Ada Generation Laptop GPU:
48.3 [X] HP ZBook Power 15 G10 2.02
AMD Ryzen 7 PRO 7840HS 3.8GHz
NVIDIA RTX 2000 Ada Generation Laptop GPU
min:
29.5 fps, max:
105.8 fps
fps
NVIDIA RTX 2000 Ada Generation Laptop GPU:
29.9 [X] HP ZBook Power 15 G10 2.02
AMD Ryzen 7 PRO 7840HS 3.8GHz
NVIDIA RTX 2000 Ada Generation Laptop GPU
min:
24.5 fps, max:
41 fps
fps
NVIDIA RTX 2000 Ada Generation Laptop GPU:
201 202 ~ 202 fps
NVIDIA RTX 2000 Ada Generation Laptop GPU:
191.1 192.1 ~ 192 fps
NVIDIA RTX 2000 Ada Generation Laptop GPU:
142.1 147 ~ 145 fps
NVIDIA RTX 2000 Ada Generation Laptop GPU:
44.4 49.2 ~ 47 fps
NVIDIA RTX 2000 Ada Generation Laptop GPU:
27.6 31.6 ~ 30 fps
100%
A370M:
67.1 [X] Acer Swift X SFX16 Intel Core i5-1240P 1.2GHz
A370M
min:
13.1 fps, P0.1:
17.8 fps, P1:
37.3 fps, max:
201 fps
fps
100%
A370M:
60.9 [X] Acer Swift X SFX16 Intel Core i5-1240P 1.2GHz
A370M
min:
26 fps, P0.1:
28.3 fps, P1:
47 fps, max:
182.9 fps
fps
100%
A370M:
39.2 [X] Acer Swift X SFX16 Intel Core i5-1240P 1.2GHz
A370M
min:
27.1 fps, P0.1:
27.3 fps, P1:
32.1 fps, max:
63.2 fps
fps
A370M:
0 (!) [X] Acer Swift X SFX16 Intel Core i5-1240P 1.2GHz
A370M
fps
100%
A370M:
23 [X] Acer Swift X SFX16 Intel Core i5-1240P 1.2GHz
A370M
min:
15.6 fps, P0.1:
15.9 fps, P1:
17.4 fps, max:
31.2 fps
fps
213%
NVIDIA RTX 2000 Ada Generation Laptop GPU:
49 fps
100%
A370M:
19.7 [X] Acer Swift X SFX16 Intel Core i5-1240P 1.2GHz
A370M
min:
11.6 fps, P0.1:
12.3 fps, P1:
14.8 fps, max:
34.5 fps
fps
228%
NVIDIA RTX 2000 Ada Generation Laptop GPU:
45 fps
100%
A370M:
19.2 [X] Acer Swift X SFX16 Intel Core i5-1240P 1.2GHz
A370M
min:
9.43 fps, P0.1:
11.5 fps, P1:
14.2 fps, max:
28.6 fps
fps
219%
NVIDIA RTX 2000 Ada Generation Laptop GPU:
42 fps
100%
A370M:
17.7 [X] Acer Swift X SFX16 Intel Core i5-1240P 1.2GHz
A370M
min:
9.19 fps, P0.1:
10.4 fps, P1:
13.3 fps, max:
23.4 fps
fps
226%
NVIDIA RTX 2000 Ada Generation Laptop GPU:
40 fps
NVIDIA RTX 2000 Ada Generation Laptop GPU:
27 fps
100%
A370M:
45.7 [X] Acer Swift X SFX16 Intel Core i5-1240P 1.2GHz
A370M
min:
3.9 fps, P0.1:
5.4 fps, P1:
38.1 fps, max:
56.8 fps
fps
100%
A370M:
26.3 [X] Acer Swift X SFX16 Intel Core i5-1240P 1.2GHz
A370M
min:
7.96 fps, P0.1:
10.9 fps, P1:
18.9 fps, max:
48.6 fps
fps
100%
A370M:
11.6 [X] Acer Swift X SFX16 Intel Core i5-1240P 1.2GHz
A370M
min:
8.48 fps, P0.1:
8.59 fps, P1:
9.05 fps, max:
23.2 fps
fps
100%
A370M:
3.5 [X] Acer Swift X SFX16 Intel Core i5-1240P 1.2GHz
A370M
min:
3.06 fps, P0.1:
3.06 fps, P1:
3.06 fps, max:
4.06 fps
fps
100%
A370M:
55.7 [X] Acer Swift X SFX16 Intel Core i5-1240P 1.2GHz
A370M
min:
13 fps
fps
100%
A370M:
47.8 [X] Acer Swift X SFX16 Intel Core i5-1240P 1.2GHz
A370M
min:
24 fps
fps
100%
A370M:
37.2 [X] Acer Swift X SFX16 Intel Core i5-1240P 1.2GHz
A370M
min:
15 fps
fps
100%
A370M:
37.1 [X] Acer Swift X SFX16 Intel Core i5-1240P 1.2GHz
A370M
min:
19 fps
fps
100%
A370M:
27.6 [X] Acer Swift X SFX16 Intel Core i5-1240P 1.2GHz
A370M
min:
10.8 fps, P0.1:
10.8 fps, P1:
12.9 fps, max:
56.7 fps
fps
100%
A370M:
17.4 [X] Acer Swift X SFX16 Intel Core i5-1240P 1.2GHz
A370M
min:
2.69 fps, P0.1:
3.85 fps, P1:
6.82 fps, max:
32 fps
fps
100%
A370M:
11.5 [X] Acer Swift X SFX16 Intel Core i5-1240P 1.2GHz
A370M
min:
3.05 fps, P0.1:
3.69 fps, P1:
5.56 fps, max:
18.9 fps
fps
100%
A370M:
11.4 [X] Acer Swift X SFX16 Intel Core i5-1240P 1.2GHz
A370M
min:
2.21 fps, P0.1:
2.89 fps, P1:
5.29 fps, max:
20.2 fps
fps
100%
A370M:
55.5 [X] Acer Swift X SFX16 Intel Core i5-1240P 1.2GHz
A370M
min:
24.6 fps, P0.1:
39.5 fps, P1:
45.9 fps, max:
127.6 fps
fps
100%
A370M:
42.4 [X] Acer Swift X SFX16 Intel Core i5-1240P 1.2GHz
A370M
min:
32.5 fps, P0.1:
33.5 fps, P1:
35.3 fps, max:
60.1 fps
fps
100%
A370M:
24 [X] Acer Swift X SFX16 Intel Core i5-1240P 1.2GHz
A370M
min:
20 fps
fps
100%
A370M:
20.2 [X] Acer Swift X SFX16 Intel Core i5-1240P 1.2GHz
A370M
min:
14.2 fps, P0.1:
16.9 fps, P1:
17.4 fps, max:
26.9 fps
fps
100%
A370M:
27 [X] Acer Swift X SFX16 Intel Core i5-1240P 1.2GHz
A370M
min:
12 fps
fps
100%
A370M:
26 [X] Acer Swift X SFX16 Intel Core i5-1240P 1.2GHz
A370M
min:
11 fps
fps
100%
A370M:
22 [X] Acer Swift X SFX16 Intel Core i5-1240P 1.2GHz
A370M
min:
9 fps
fps
100%
A370M:
10 [X] Acer Swift X SFX16 Intel Core i5-1240P 1.2GHz
A370M
min:
5 fps
fps
100%
A370M:
43.2 [X] Acer Swift X SFX16 Intel Core i5-1240P 1.2GHz
A370M
min:
14.6 fps, P0.1:
21.9 fps, P1:
33.7 fps, max:
70.1 fps
fps
234%
NVIDIA RTX 2000 Ada Generation Laptop GPU:
101 fps
100%
A370M:
30.3 [X] Acer Swift X SFX16 Intel Core i5-1240P 1.2GHz
A370M
min:
7.72 fps, P0.1:
13.5 fps, P1:
23.7 fps, max:
60 fps
fps
264%
NVIDIA RTX 2000 Ada Generation Laptop GPU:
80 fps
100%
A370M:
19.6 [X] Acer Swift X SFX16 Intel Core i5-1240P 1.2GHz
A370M
min:
10 fps, P0.1:
10.7 fps, P1:
14.4 fps, max:
58 fps
fps
327%
NVIDIA RTX 2000 Ada Generation Laptop GPU:
64 fps
100%
A370M:
12.7 [X] Acer Swift X SFX16 Intel Core i5-1240P 1.2GHz
A370M
min:
7.28 fps, P0.1:
7.4 fps, P1:
9.08 fps, max:
26.7 fps
fps
417%
NVIDIA RTX 2000 Ada Generation Laptop GPU:
53 fps
NVIDIA RTX 2000 Ada Generation Laptop GPU:
38 fps
100%
A370M:
22.6 [X] Acer Swift X SFX16 Intel Core i5-1240P 1.2GHz
A370M
min:
9.77 fps, P0.1:
11.5 fps, P1:
15.3 fps, max:
81.3 fps
fps
100%
A370M:
17.8 [X] Acer Swift X SFX16 Intel Core i5-1240P 1.2GHz
A370M
min:
12.5 fps, P0.1:
12.7 fps, P1:
13.4 fps, max:
44.8 fps
fps
100%
A370M:
12.1 [X] Acer Swift X SFX16 Intel Core i5-1240P 1.2GHz
A370M
min:
7.93 fps, P0.1:
7.95 fps, P1:
8.73 fps, max:
16.7 fps
fps
100%
A370M:
8.9 [X] Acer Swift X SFX16 Intel Core i5-1240P 1.2GHz
A370M
min:
6.87 fps, P0.1:
6.89 fps, P1:
7.1 fps, max:
11 fps
fps
100%
A370M:
73.4 [X] Acer Swift X SFX16 Intel Core i5-1240P 1.2GHz
A370M
min:
34.6 fps, P0.1:
41.3 fps, P1:
46.6 fps, max:
157.5 fps
fps
100%
A370M:
44.6 [X] Acer Swift X SFX16 Intel Core i5-1240P 1.2GHz
A370M
min:
24.6 fps, P0.1:
25.4 fps, P1:
30.5 fps, max:
130.3 fps
fps
100%
A370M:
40.8 [X] Acer Swift X SFX16 Intel Core i5-1240P 1.2GHz
A370M
min:
22.6 fps, P0.1:
23.4 fps, P1:
26.1 fps, max:
114.8 fps
fps
100%
A370M:
32.6 [X] Acer Swift X SFX16 Intel Core i5-1240P 1.2GHz
A370M
min:
15.5 fps, P0.1:
18 fps, P1:
21 fps, max:
104.6 fps
fps
100%
A370M:
22.9 [X] Acer Swift X SFX16 Intel Core i5-1240P 1.2GHz
A370M
min:
17 fps, P0.1:
17.7 fps, P1:
18.6 fps, max:
34.8 fps
fps
100%
A370M:
19.5 [X] Acer Swift X SFX16 Intel Core i5-1240P 1.2GHz
A370M
min:
15.3 fps, P0.1:
15.4 fps, P1:
16.1 fps, max:
26.1 fps
fps
100%
A370M:
16.6 [X] Acer Swift X SFX16 Intel Core i5-1240P 1.2GHz
A370M
min:
12.5 fps, P0.1:
12.9 fps, P1:
13.8 fps, max:
22.2 fps
fps
100%
A370M:
14.3 [X] Acer Swift X SFX16 Intel Core i5-1240P 1.2GHz
A370M
min:
11.7 fps, P0.1:
11.7 fps, P1:
12 fps, max:
24.7 fps
fps
149%
NVIDIA RTX 2000 Ada Generation Laptop GPU:
166.7 [X] HP ZBook Power 15 G10 959964
AMD Ryzen 7 PRO 7840HS 3.8GHz
NVIDIA RTX 2000 Ada Generation Laptop GPU
min:
143 fps, P1:
98 fps, max:
207 fps
213 ~ 190 fps
349%
NVIDIA RTX 2000 Ada Generation Laptop GPU:
151.8 [X] HP ZBook Power 15 G10 959964
AMD Ryzen 7 PRO 7840HS 3.8GHz
NVIDIA RTX 2000 Ada Generation Laptop GPU
min:
137 fps, P1:
92 fps, max:
171 fps
193.2 ~ 173 fps
279%
NVIDIA RTX 2000 Ada Generation Laptop GPU:
119.9 [X] HP ZBook Power 15 G10 959964
AMD Ryzen 7 PRO 7840HS 3.8GHz
NVIDIA RTX 2000 Ada Generation Laptop GPU
min:
104 fps, P1:
74 fps, max:
129 fps
138.5 ~ 129 fps
148%
NVIDIA RTX 2000 Ada Generation Laptop GPU:
44.2 [X] HP ZBook Power 15 G10 959964
AMD Ryzen 7 PRO 7840HS 3.8GHz
NVIDIA RTX 2000 Ada Generation Laptop GPU
min:
38 fps, P1:
37 fps, max:
51 fps
52.8 ~ 49 fps
1123%
NVIDIA RTX 2000 Ada Generation Laptop GPU:
28.9 [X] HP ZBook Power 15 G10 959964
AMD Ryzen 7 PRO 7840HS 3.8GHz
NVIDIA RTX 2000 Ada Generation Laptop GPU
min:
24 fps, P1:
24 fps, max:
33 fps
34.2 ~ 32 fps
NVIDIA RTX 2000 Ada Generation Laptop GPU:
119.8 fps
NVIDIA RTX 2000 Ada Generation Laptop GPU:
110.5 fps
NVIDIA RTX 2000 Ada Generation Laptop GPU:
77.3 fps
NVIDIA RTX 2000 Ada Generation Laptop GPU:
62.3 fps
NVIDIA RTX 2000 Ada Generation Laptop GPU:
43.5 fps
219%
NVIDIA RTX 2000 Ada Generation Laptop GPU:
101 fps
218%
NVIDIA RTX 2000 Ada Generation Laptop GPU:
81 fps
283%
NVIDIA RTX 2000 Ada Generation Laptop GPU:
72 fps
310%
NVIDIA RTX 2000 Ada Generation Laptop GPU:
65 fps
NVIDIA RTX 2000 Ada Generation Laptop GPU:
41 fps
183%
NVIDIA RTX 2000 Ada Generation Laptop GPU:
157 fps
275%
NVIDIA RTX 2000 Ada Generation Laptop GPU:
121 fps
289%
NVIDIA RTX 2000 Ada Generation Laptop GPU:
104 fps
363%
NVIDIA RTX 2000 Ada Generation Laptop GPU:
87 fps
NVIDIA RTX 2000 Ada Generation Laptop GPU:
63 fps
184%
NVIDIA RTX 2000 Ada Generation Laptop GPU:
353 fps
258%
NVIDIA RTX 2000 Ada Generation Laptop GPU:
230 fps
100%
A370M:
61 63 [X] Intel Reference Laptop Intel Core i7-12700H 1.7GHz
A370M
~ 62 fps
301%
NVIDIA RTX 2000 Ada Generation Laptop GPU:
186.6 fps
397%
NVIDIA RTX 2000 Ada Generation Laptop GPU:
99.2 fps
NVIDIA RTX 2000 Ada Generation Laptop GPU:
74.9 fps
100%
A370M:
39 42 [X] Intel Reference Laptop Intel Core i7-12700H 1.7GHz
A370M
~ 41 fps
223%
NVIDIA RTX 2000 Ada Generation Laptop GPU:
332 [X] HP ZBook Power 15 G10 1.47.22.14 D3D12
AMD Ryzen 7 PRO 7840HS 3.8GHz
NVIDIA RTX 2000 Ada Generation Laptop GPU
min:
112.3 fps, P1:
251 fps, max:
511 fps
408 459 ~ 400 fps
285%
NVIDIA RTX 2000 Ada Generation Laptop GPU:
183 [X] HP ZBook Power 15 G10 1.47.22.14 D3D12
AMD Ryzen 7 PRO 7840HS 3.8GHz
NVIDIA RTX 2000 Ada Generation Laptop GPU
min:
88.1 fps, P1:
152.3 fps, max:
359 fps
228 231 ~ 214 fps
273%
NVIDIA RTX 2000 Ada Generation Laptop GPU:
148.4 [X] HP ZBook Power 15 G10 1.47.22.14 D3D12
AMD Ryzen 7 PRO 7840HS 3.8GHz
NVIDIA RTX 2000 Ada Generation Laptop GPU
min:
37.9 fps, P1:
110.3 fps, max:
328 fps
182.5 184.2 ~ 172 fps
283%
NVIDIA RTX 2000 Ada Generation Laptop GPU:
132.5 [X] HP ZBook Power 15 G10 1.47.22.14 D3D12
AMD Ryzen 7 PRO 7840HS 3.8GHz
NVIDIA RTX 2000 Ada Generation Laptop GPU
min:
80.3 fps, P1:
100.2 fps, max:
303 fps
158.2 158.4 ~ 150 fps
274%
NVIDIA RTX 2000 Ada Generation Laptop GPU:
94.1 [X] HP ZBook Power 15 G10 1.47.22.14 D3D12
AMD Ryzen 7 PRO 7840HS 3.8GHz
NVIDIA RTX 2000 Ada Generation Laptop GPU
min:
60.9 fps, P1:
75.7 fps, max:
170 fps
103.9 107.5 ~ 102 fps
100%
A370M:
87 90 ~ 89 fps
183%
NVIDIA RTX 2000 Ada Generation Laptop GPU:
151 [X] HP ZBook Power 15 G10 AMD Ryzen 7 PRO 7840HS 3.8GHz
NVIDIA RTX 2000 Ada Generation Laptop GPU
min:
105 fps, max:
196 fps
175 ~ 163 fps
100%
A370M:
48 49 ~ 49 fps
245%
NVIDIA RTX 2000 Ada Generation Laptop GPU:
110 [X] HP ZBook Power 15 G10 AMD Ryzen 7 PRO 7840HS 3.8GHz
NVIDIA RTX 2000 Ada Generation Laptop GPU
min:
96 fps, max:
127 fps
130 ~ 120 fps
100%
A370M:
45 46 ~ 46 fps
241%
NVIDIA RTX 2000 Ada Generation Laptop GPU:
102 [X] HP ZBook Power 15 G10 AMD Ryzen 7 PRO 7840HS 3.8GHz
NVIDIA RTX 2000 Ada Generation Laptop GPU
min:
92 fps, max:
123 fps
120 ~ 111 fps
100%
A370M:
42 43 ~ 43 fps
242%
NVIDIA RTX 2000 Ada Generation Laptop GPU:
95 [X] HP ZBook Power 15 G10 AMD Ryzen 7 PRO 7840HS 3.8GHz
NVIDIA RTX 2000 Ada Generation Laptop GPU
min:
86 fps, max:
111 fps
113 ~ 104 fps
100%
A370M:
28 29 ~ 29 fps
248%
NVIDIA RTX 2000 Ada Generation Laptop GPU:
63 [X] HP ZBook Power 15 G10 AMD Ryzen 7 PRO 7840HS 3.8GHz
NVIDIA RTX 2000 Ada Generation Laptop GPU
min:
56 fps, max:
76 fps
81 ~ 72 fps
339%
NVIDIA RTX 2000 Ada Generation Laptop GPU:
80.6 149.2 156.5 ~ 129 fps
377%
NVIDIA RTX 2000 Ada Generation Laptop GPU:
73 131.6 133.5 ~ 113 fps
338%
NVIDIA RTX 2000 Ada Generation Laptop GPU:
52.5 103.4 108.9 ~ 88 fps
270%
NVIDIA RTX 2000 Ada Generation Laptop GPU:
173.3 199.2 ~ 186 fps
292%
NVIDIA RTX 2000 Ada Generation Laptop GPU:
93.5 111.2 120.3 ~ 108 fps
325%
NVIDIA RTX 2000 Ada Generation Laptop GPU:
67.7 83.5 84.2 ~ 78 fps
252%
NVIDIA RTX 2000 Ada Generation Laptop GPU:
50.3 61.3 63.7 ~ 58 fps
100%
A370M:
44 [X] Intel Reference Laptop Intel Core i7-12700H 1.7GHz
A370M
fps
183%
NVIDIA RTX 2000 Ada Generation Laptop GPU:
155 [X] HP ZBook Power 15 G10 AMD Ryzen 7 PRO 7840HS 3.8GHz
NVIDIA RTX 2000 Ada Generation Laptop GPU
min:
138.6 fps, max:
-1 fps
178.4 188.2 ~ 174 fps
188%
NVIDIA RTX 2000 Ada Generation Laptop GPU:
140.8 [X] HP ZBook Power 15 G10 AMD Ryzen 7 PRO 7840HS 3.8GHz
NVIDIA RTX 2000 Ada Generation Laptop GPU
min:
125.7 fps, max:
-1 fps
153.1 168.7 ~ 154 fps
216%
NVIDIA RTX 2000 Ada Generation Laptop GPU:
136.9 [X] HP ZBook Power 15 G10 AMD Ryzen 7 PRO 7840HS 3.8GHz
NVIDIA RTX 2000 Ada Generation Laptop GPU
min:
120 fps, max:
-1 fps
143.9 160.7 ~ 147 fps
217%
NVIDIA RTX 2000 Ada Generation Laptop GPU:
132 [X] HP ZBook Power 15 G10 AMD Ryzen 7 PRO 7840HS 3.8GHz
NVIDIA RTX 2000 Ada Generation Laptop GPU
min:
115.8 fps, max:
-1 fps
133.4 150.2 ~ 139 fps
252%
NVIDIA RTX 2000 Ada Generation Laptop GPU:
336.4 [X] HP ZBook Power 15 G10 AMD Ryzen 7 PRO 7840HS 3.8GHz
NVIDIA RTX 2000 Ada Generation Laptop GPU
min:
296 fps, max:
364 fps
390 424 ~ 383 fps
271%
NVIDIA RTX 2000 Ada Generation Laptop GPU:
219 [X] HP ZBook Power 15 G10 AMD Ryzen 7 PRO 7840HS 3.8GHz
NVIDIA RTX 2000 Ada Generation Laptop GPU
min:
202 fps, max:
234 fps
261 291 ~ 257 fps
312%
NVIDIA RTX 2000 Ada Generation Laptop GPU:
127.9 [X] HP ZBook Power 15 G10 AMD Ryzen 7 PRO 7840HS 3.8GHz
NVIDIA RTX 2000 Ada Generation Laptop GPU
min:
111 fps, max:
139 fps
164 184.5 ~ 159 fps
308%
NVIDIA RTX 2000 Ada Generation Laptop GPU:
65.5 [X] HP ZBook Power 15 G10 AMD Ryzen 7 PRO 7840HS 3.8GHz
NVIDIA RTX 2000 Ada Generation Laptop GPU
min:
61 fps, max:
72 fps
79.6 95.6 ~ 80 fps
NVIDIA RTX 2000 Ada Generation Laptop GPU:
65 fps
120%
NVIDIA RTX 2000 Ada Generation Laptop GPU:
176.3 178.1 [X] HP ZBook Power 15 G10 AMD Ryzen 7 PRO 7840HS 3.8GHz
NVIDIA RTX 2000 Ada Generation Laptop GPU
min:
3.76 fps, P1:
125 fps, max:
365 fps
185.2 ~ 180 fps
125%
NVIDIA RTX 2000 Ada Generation Laptop GPU:
170.6 [X] HP ZBook Power 15 G10 AMD Ryzen 7 PRO 7840HS 3.8GHz
NVIDIA RTX 2000 Ada Generation Laptop GPU
min:
3.86 fps, P1:
111.1 fps, max:
347 fps
173.4 181.3 ~ 175 fps
407%
NVIDIA RTX 2000 Ada Generation Laptop GPU:
157.7 [X] HP ZBook Power 15 G10 AMD Ryzen 7 PRO 7840HS 3.8GHz
NVIDIA RTX 2000 Ada Generation Laptop GPU
min:
4.55 fps, P1:
111.1 fps, max:
325 fps
163.6 171.9 173 ~ 167 fps
864%
NVIDIA RTX 2000 Ada Generation Laptop GPU:
86.2 [X] HP ZBook Power 15 G10 AMD Ryzen 7 PRO 7840HS 3.8GHz
NVIDIA RTX 2000 Ada Generation Laptop GPU
min:
7.39 fps, P1:
55.6 fps, max:
153.8 fps
98 101.6 ~ 95 fps
700%
NVIDIA RTX 2000 Ada Generation Laptop GPU:
60.6 [X] HP ZBook Power 15 G10 AMD Ryzen 7 PRO 7840HS 3.8GHz
NVIDIA RTX 2000 Ada Generation Laptop GPU
min:
9.07 fps, P1:
41.7 fps, max:
122.1 fps
69 74.6 76.8 ~ 70 fps
Average Gaming Intel Arc A370M → 100% Average Gaming 30-70 fps → 100%
Average Gaming NVIDIA RTX 2000 Ada Generation Laptop GPU → 297% Average Gaming 30-70 fps → 346%
 Deutsch
 English
 Español
 Français
 Italiano
 Nederlands
 Polski
 Português
 Русский
 Türkçe
 Svenska
 Chinese
 Magyar