Notebookcheck Logo
Teaser

Nvidia RTX Spark Analysis - Finally an answer to Apple's M5 Pro & M5 Max?

Local AI powerhouse.

RTX Spark is Nvidia's first SoC and combines a custom ARM-CPU with a Blackwell GPU and up to 128 GB RAM. The new chips are designed for AI workloads, content creators and you can play games as well. We tested the new RTX Spark SoC and compare it with Apple, AMD, Intel & Qualcomm. Update: Surface Laptop Ultra Benchmarks
Andreas Osthoff 👁 Published 🇩🇪 🇳🇱 ...
Nvidia ARM Benchmark AI Blackwell RTX 5000 Laptop RTX Spark Wi-Fi 7 Windows

Nvidia's new RTX Spark chips are finally here. We had the chance to test the new platform and compare the results with all the other laptop chips from AMD (especially Strix Halo), Intel, Qualcomm and obviously Apple's M5-series chips. We test the CPU performance, GPU performance, gaming performance, AI performance and the efficiency.

Nvidia RTX Spark N1X Overview
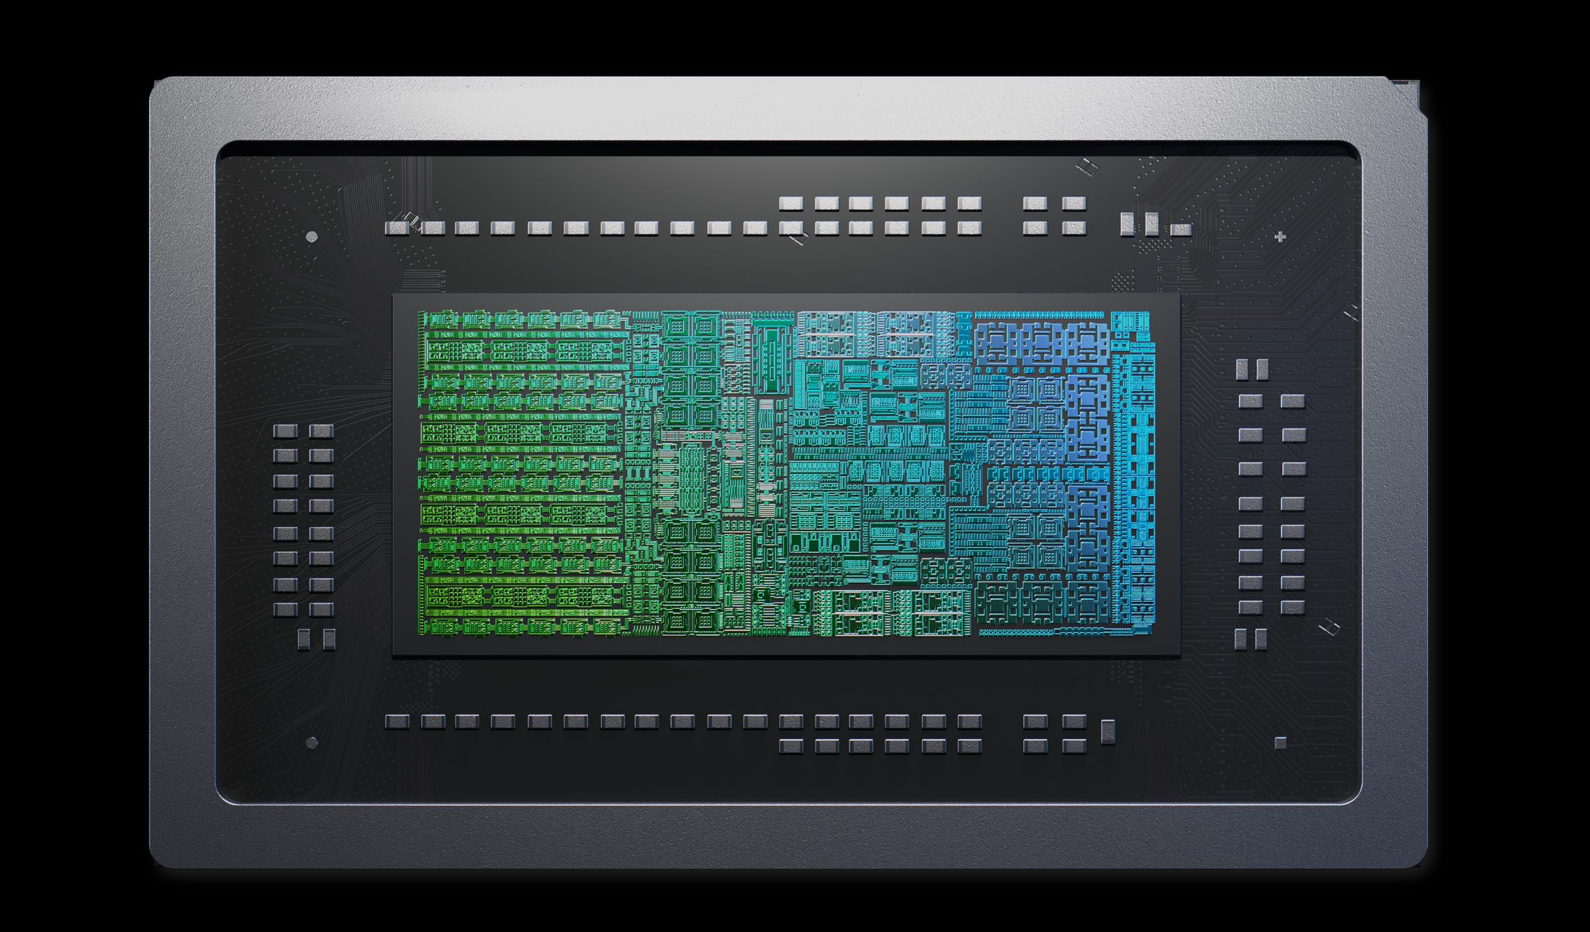
Nvidia RTX Spark N1X
ⓘ Nvidia
Nvidia RTX Spark N1X

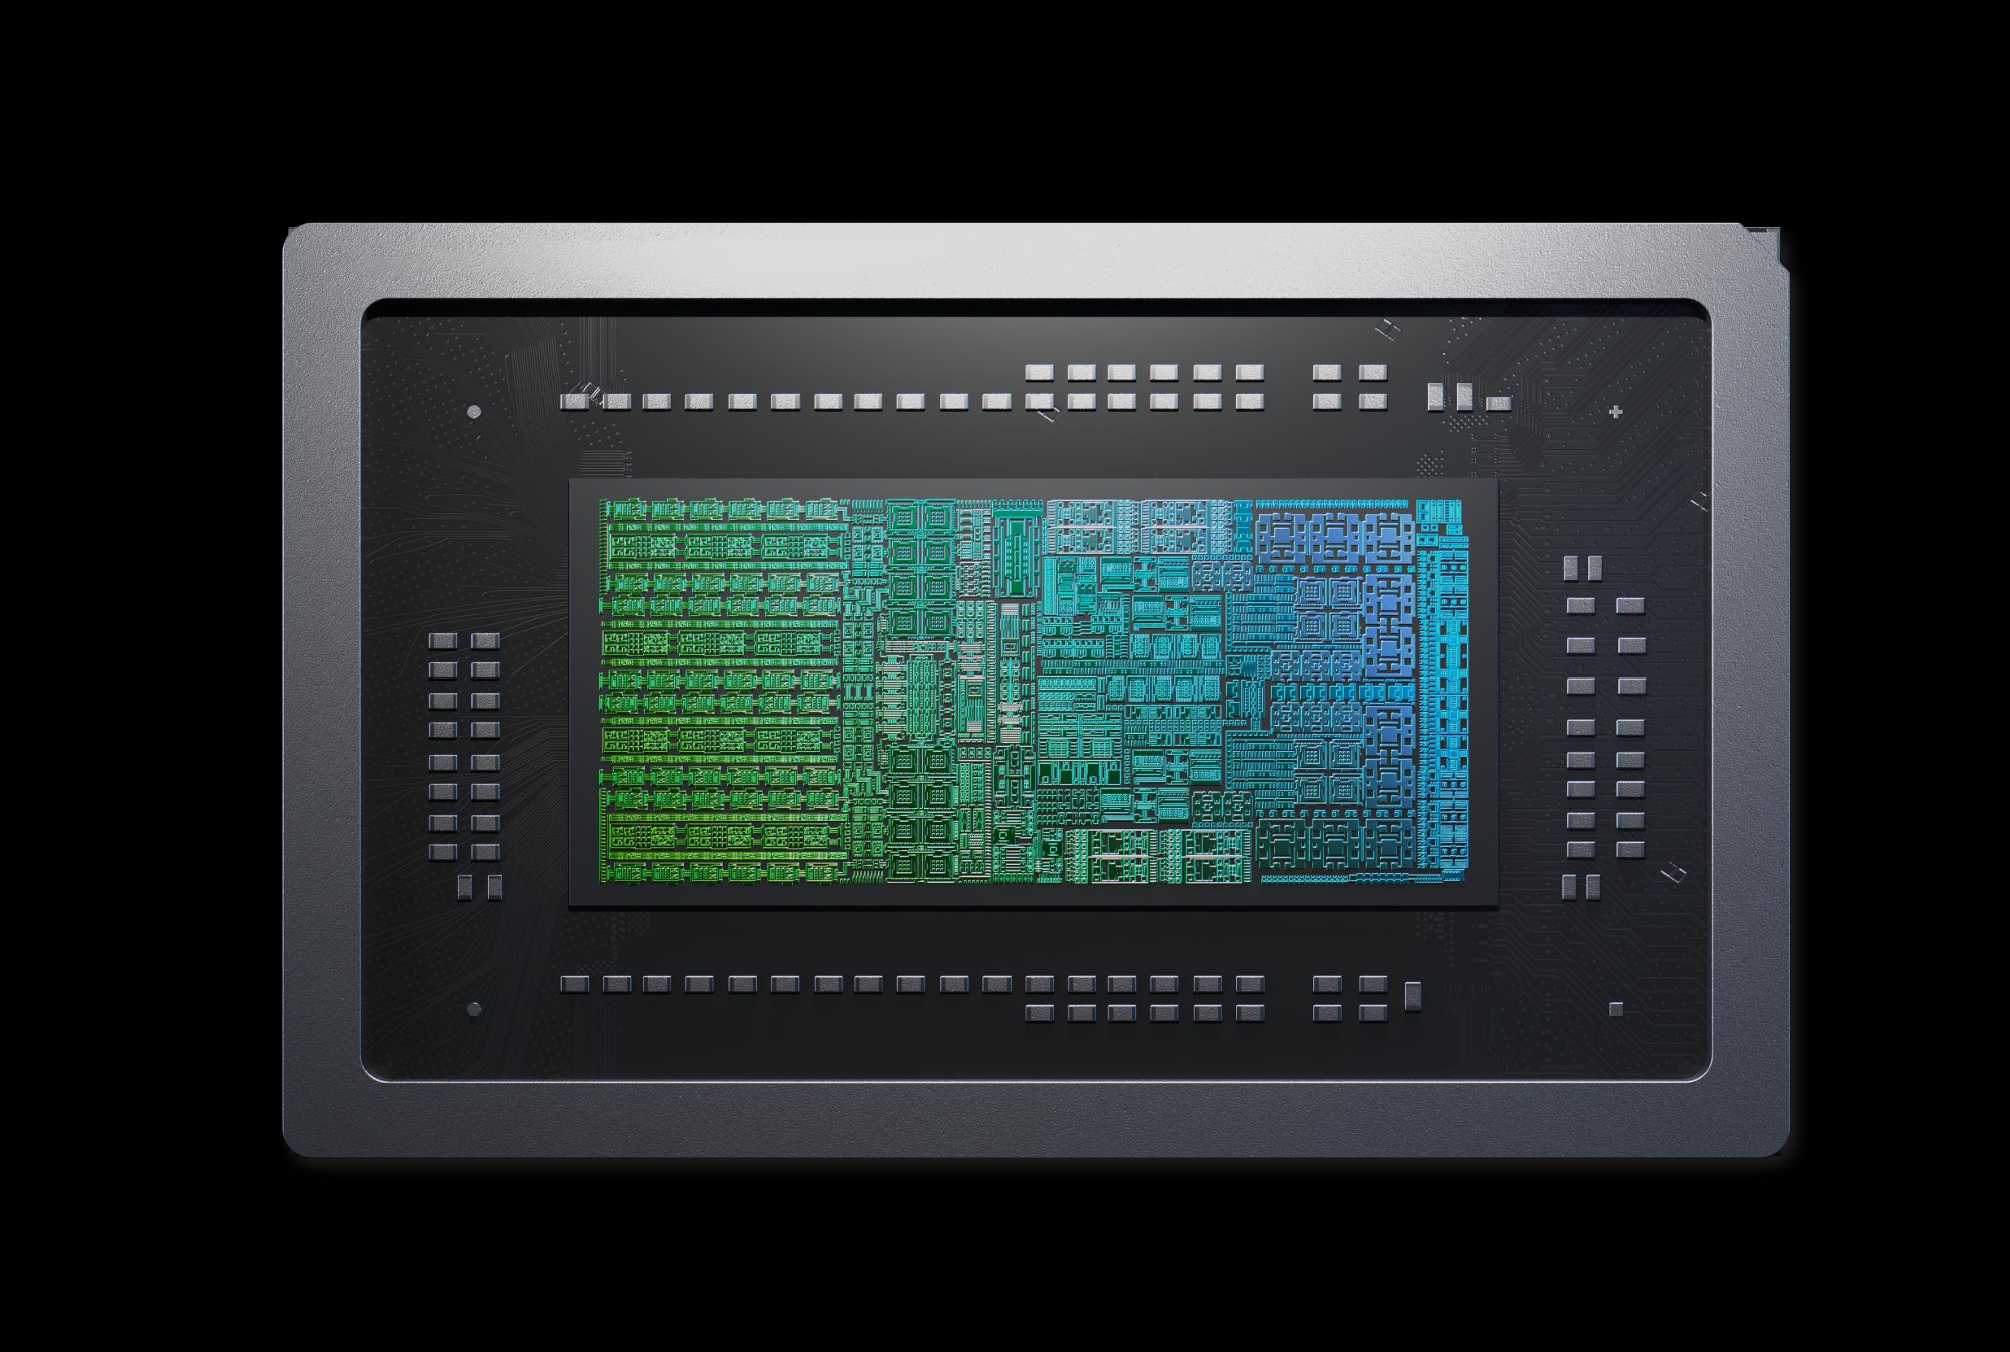
The RTX Spark N1X is Nvidia's first SoC that combines a custom-built ARM CPU with Nvidia's Blackwell GPU as well as up to 128 GB memory. We are already familiar with this approach from Apple's M-series chips and of course AMD's Strix Halo SoCs. As the RTX Spark N1X uses an ARM CPU, it also requires the ARM version of Windows, so compatibility will also be aspect to consider here. The RTX Spark N1X has a maximum TDP of 80 Watts for mobile applications, while desktop systems can consume up to 120 Watts.

Nvidia uses a custom-built MediaTek CPU with up to 20 cores in four clusters. You get up to ten performance cores (ARM Cortex X925 up to 4.1 GHz) and ten efficiency cores (ARM Cortex A725 up to 2.8 GHz). It is manufactured at TMSC in a 3 nm process. The CPU tile also includes the memory interface for up to 128 GB LPDDR5x-9400 RAM, display connectors (HDMI 2.1a & DisplayPort 2.0) as well as high-speed I/O connectivity (4x USB 4.0, PCIe 5.0, Wi-Fi 7).
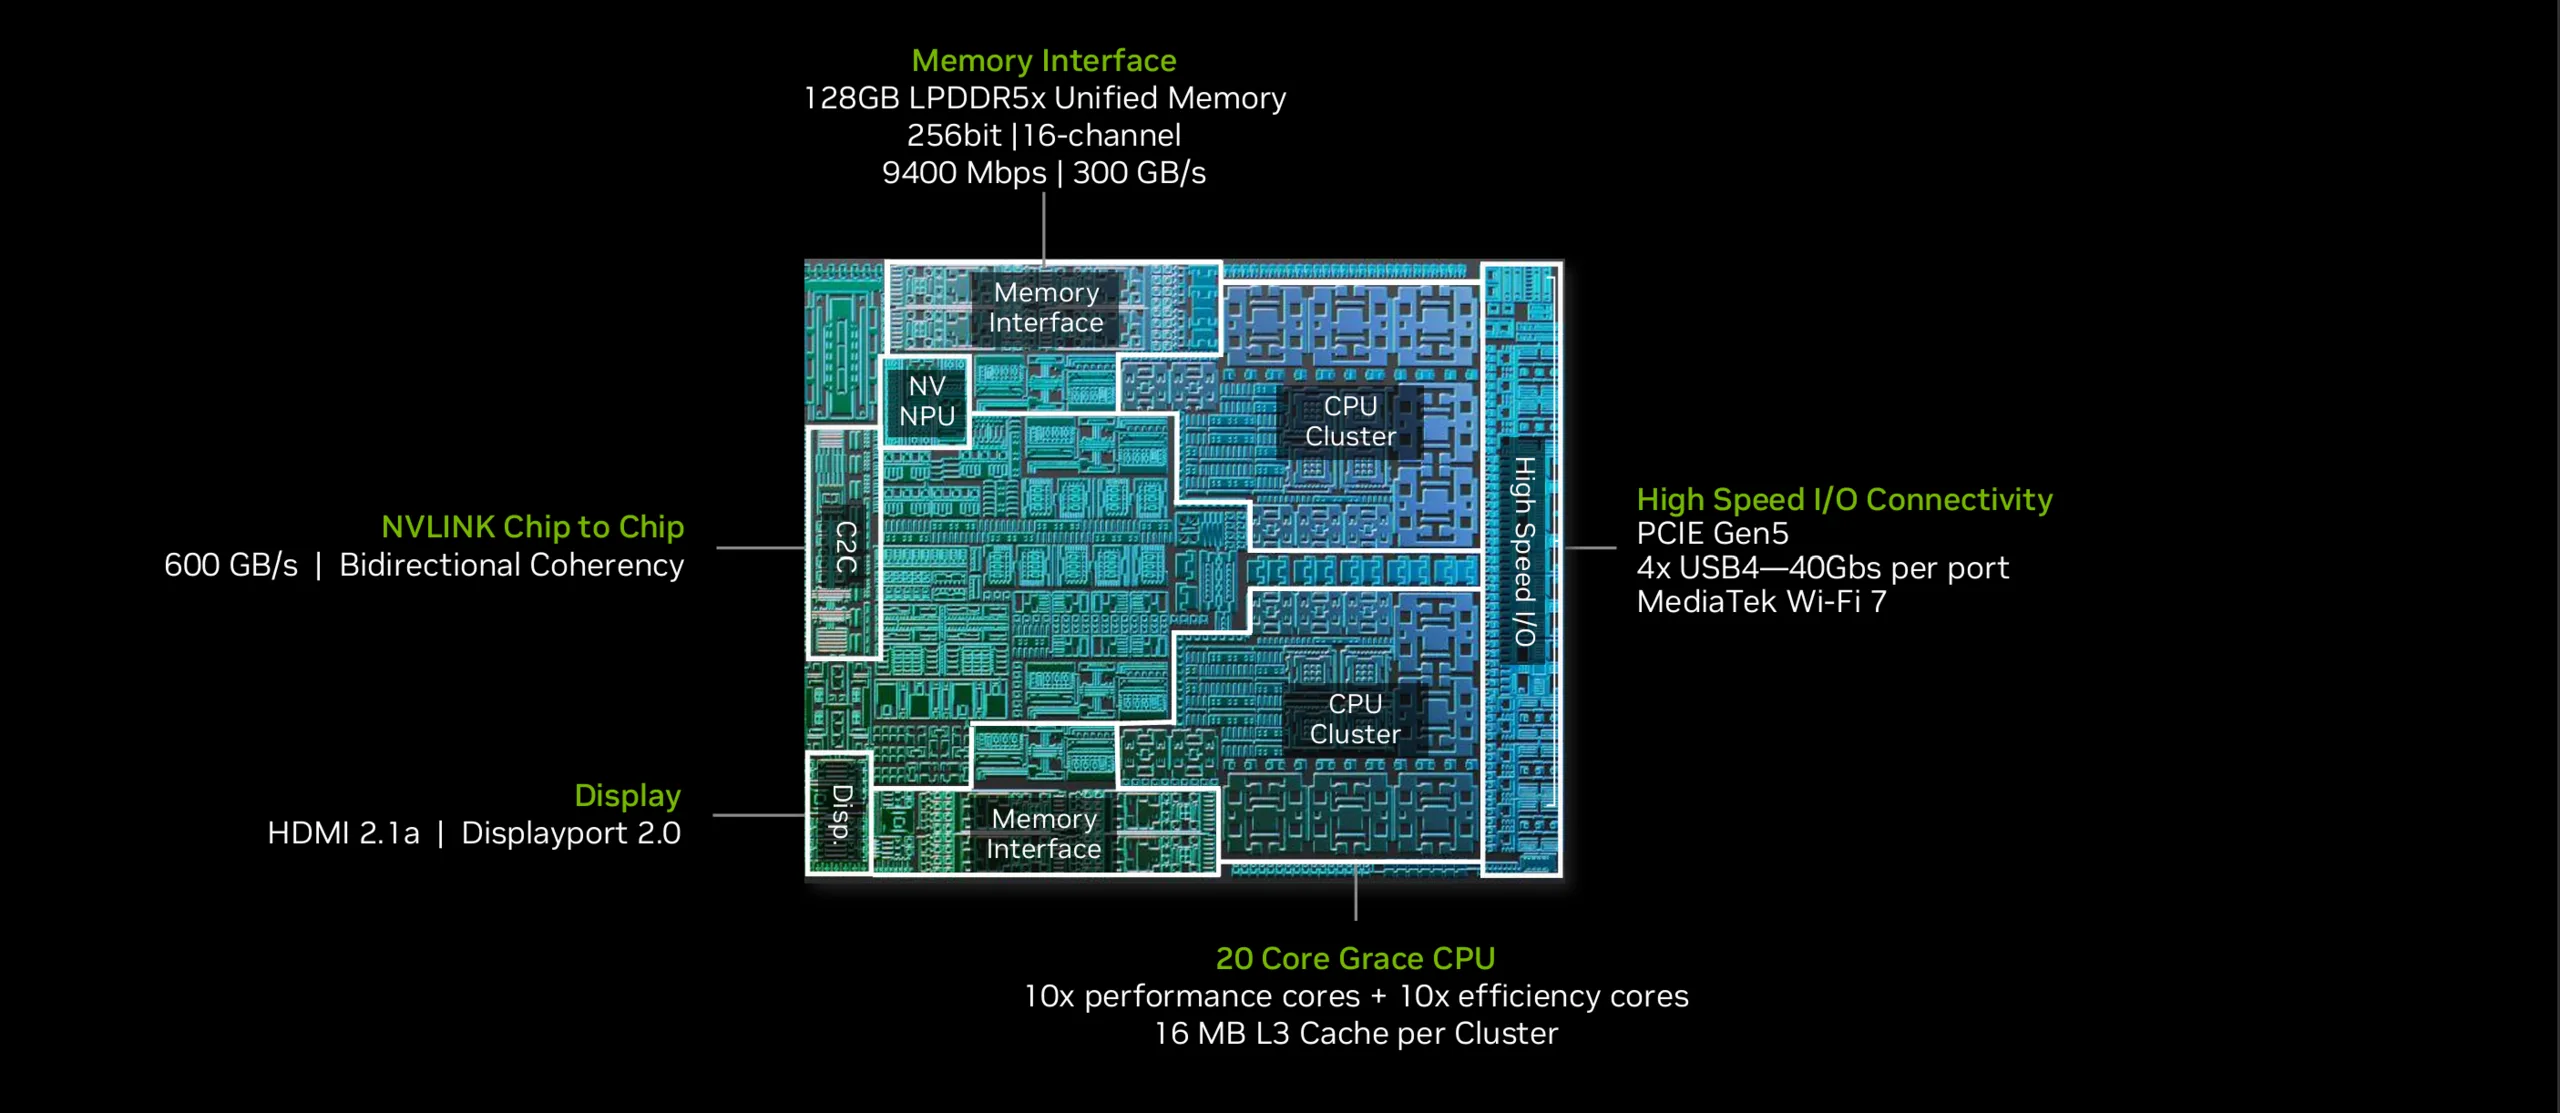
RTX Spark N1X 20-core ARM CPU
ⓘ Nvidia
RTX Spark N1X 20-core ARM CPU

The GPU part is a familiar Blackwell GPU (GB20B) with either 5120 or 6144 CUDA cores running at up to 2535 MHz. Since the chip generation is identical to current consumer GPUs like the GeForce RTX 5070, the N1X GPU can also take advantage of all current software optimizations like DLSS5 or Frame Generation. 
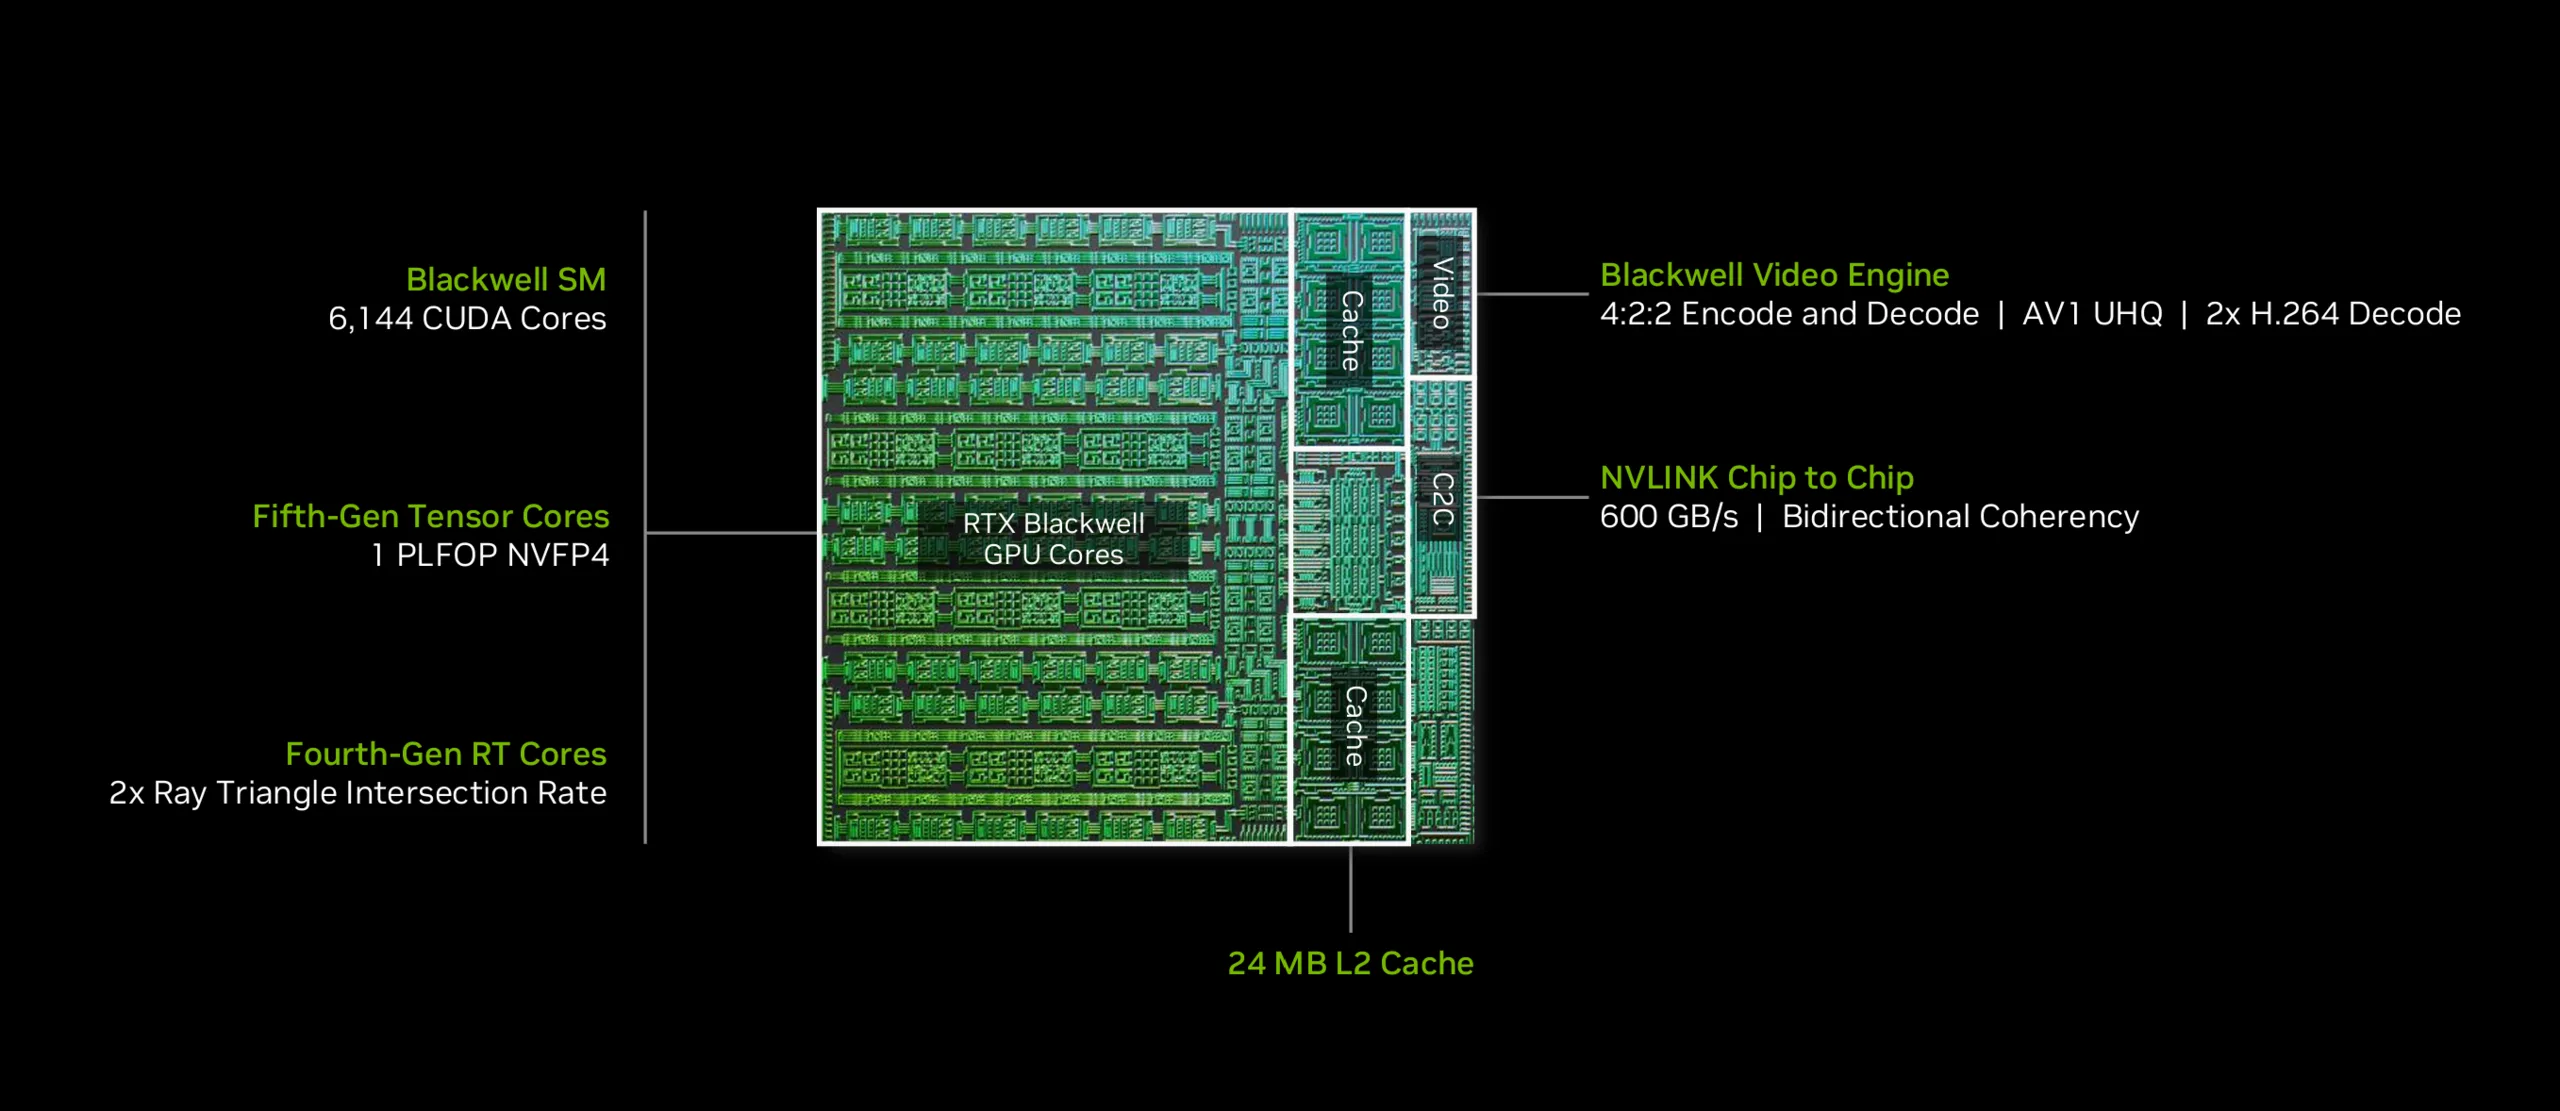
RTX Spark N1X 6144-core Blackwell GPU
ⓘ Nvidia
RTX Spark N1X 6144-core Blackwell GPU

The maximum memory bandwidth is 300 GB/s, which is comparable to Apple's M5 Pro SoC. Both the CPU and GPU tiles are connected via NVLink with a bandwidth of 600 GB/s. In addition to the N1X with 20 CPU cores and 6144 GPU cores, there is also a smaller N1X with 18 CPU cores (9x performance + 9x efficiency) as well as 5120 GPU cores. Since the name is identical, you have to pay attention to the exact specs when you purchase a laptop with RTX Spark. Please see the full technical specifications of the two N1X versions in the table below.
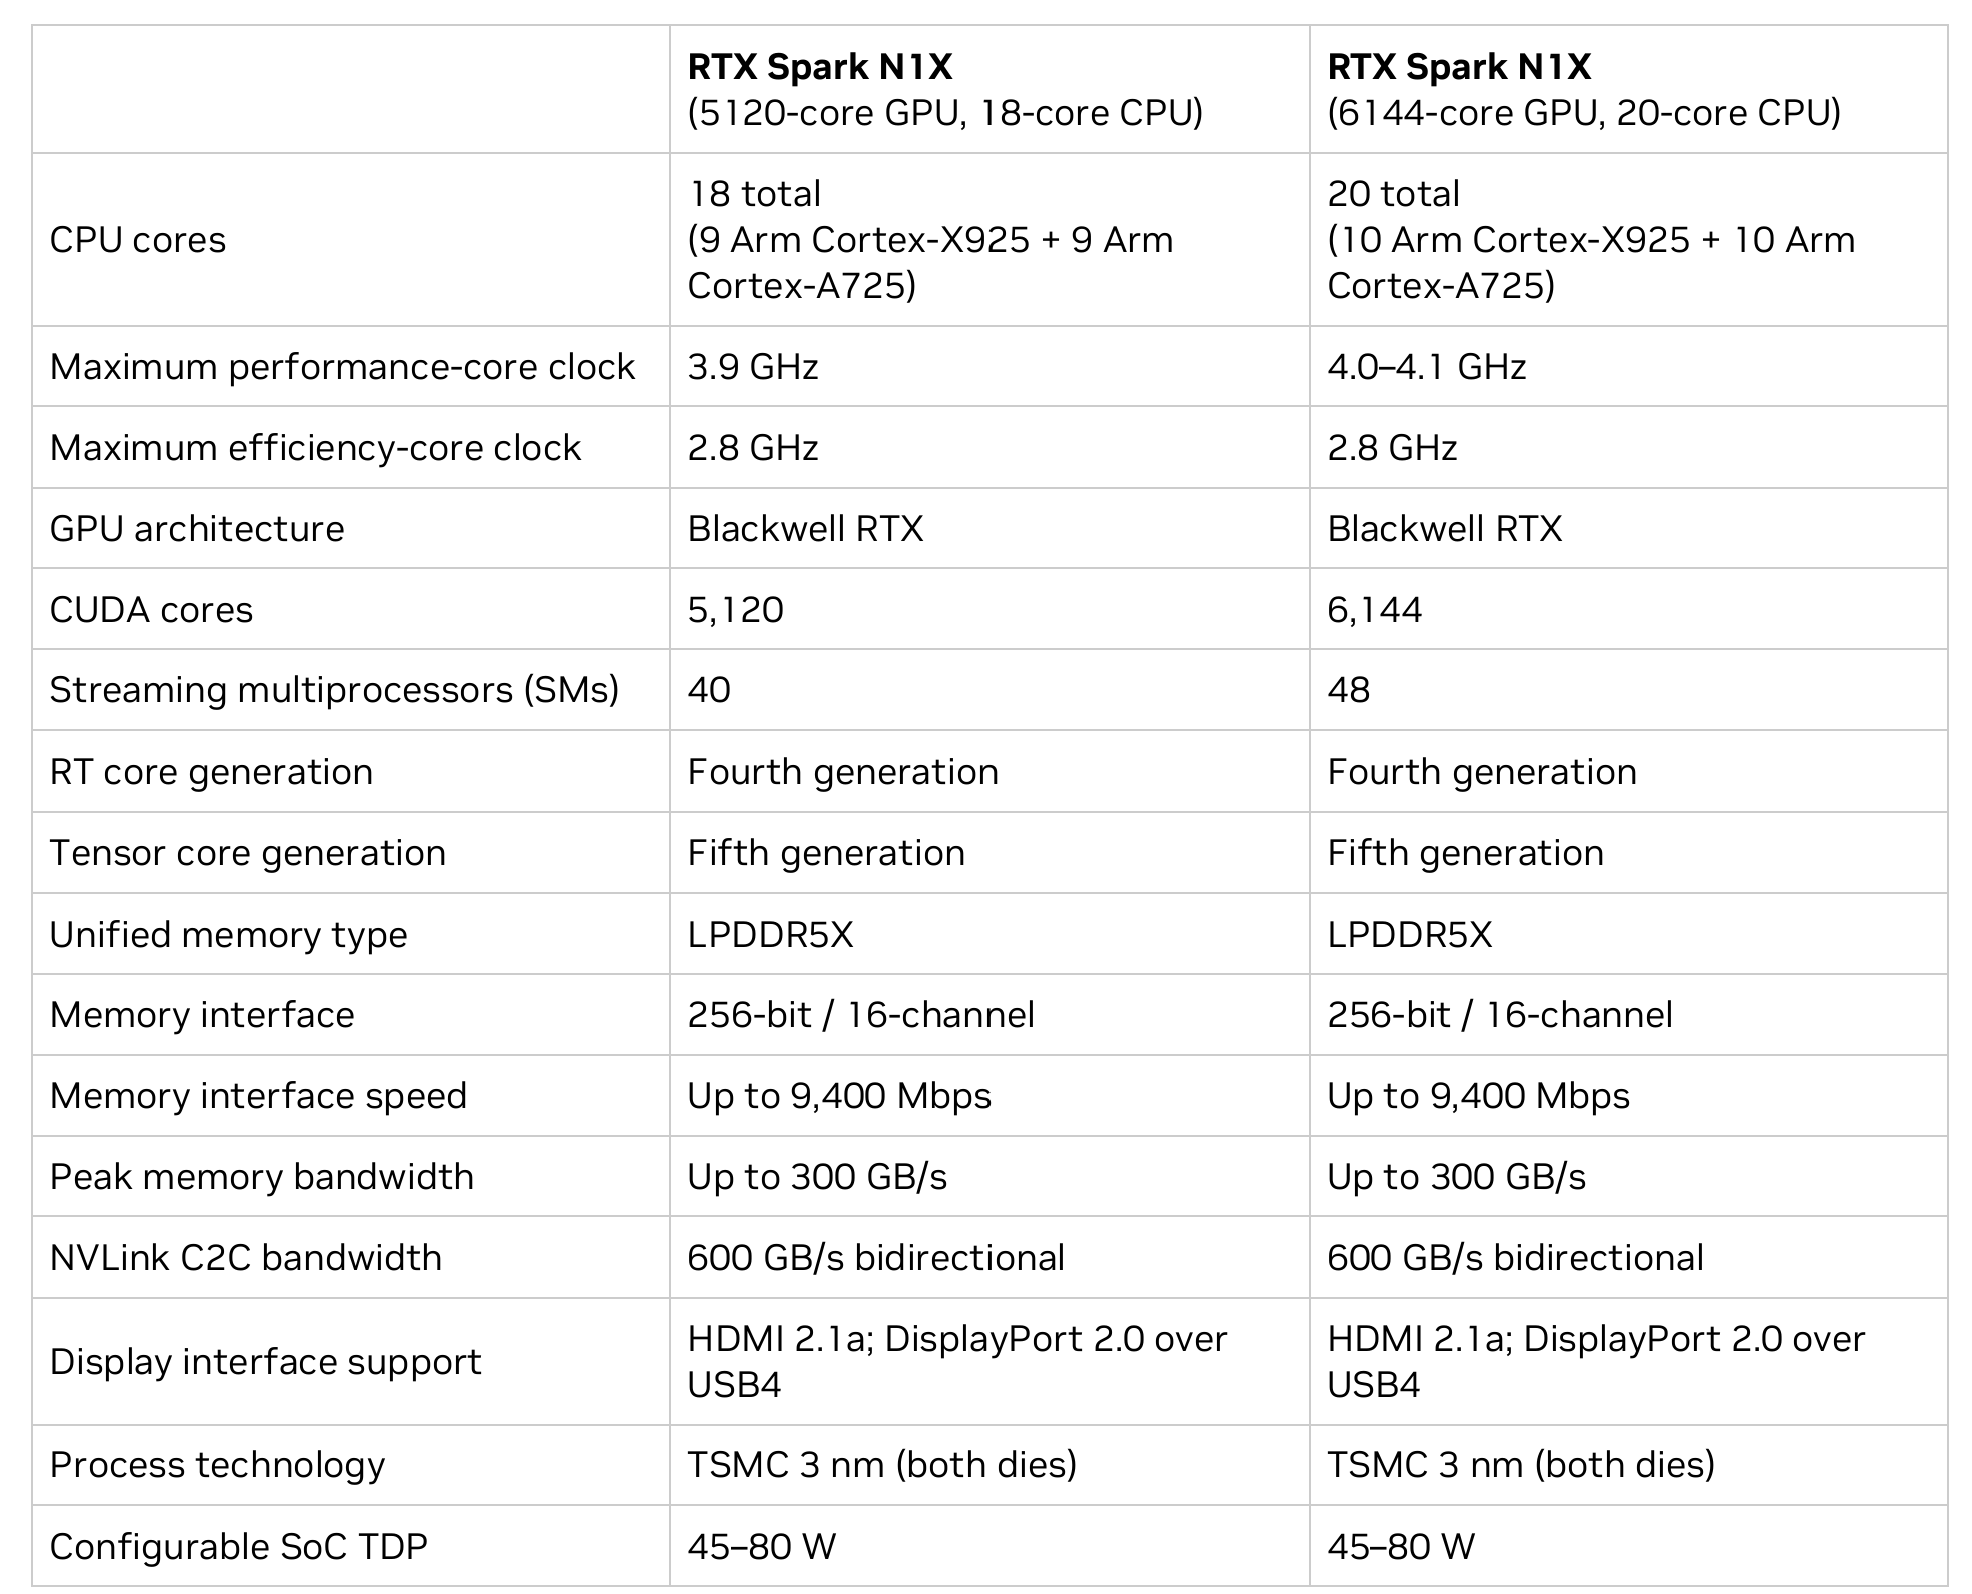
RTX Spark N1X Overview
ⓘ Nvidia
RTX Spark N1X Overview

Test Systems

Asus ProArt P16 RTX Spark

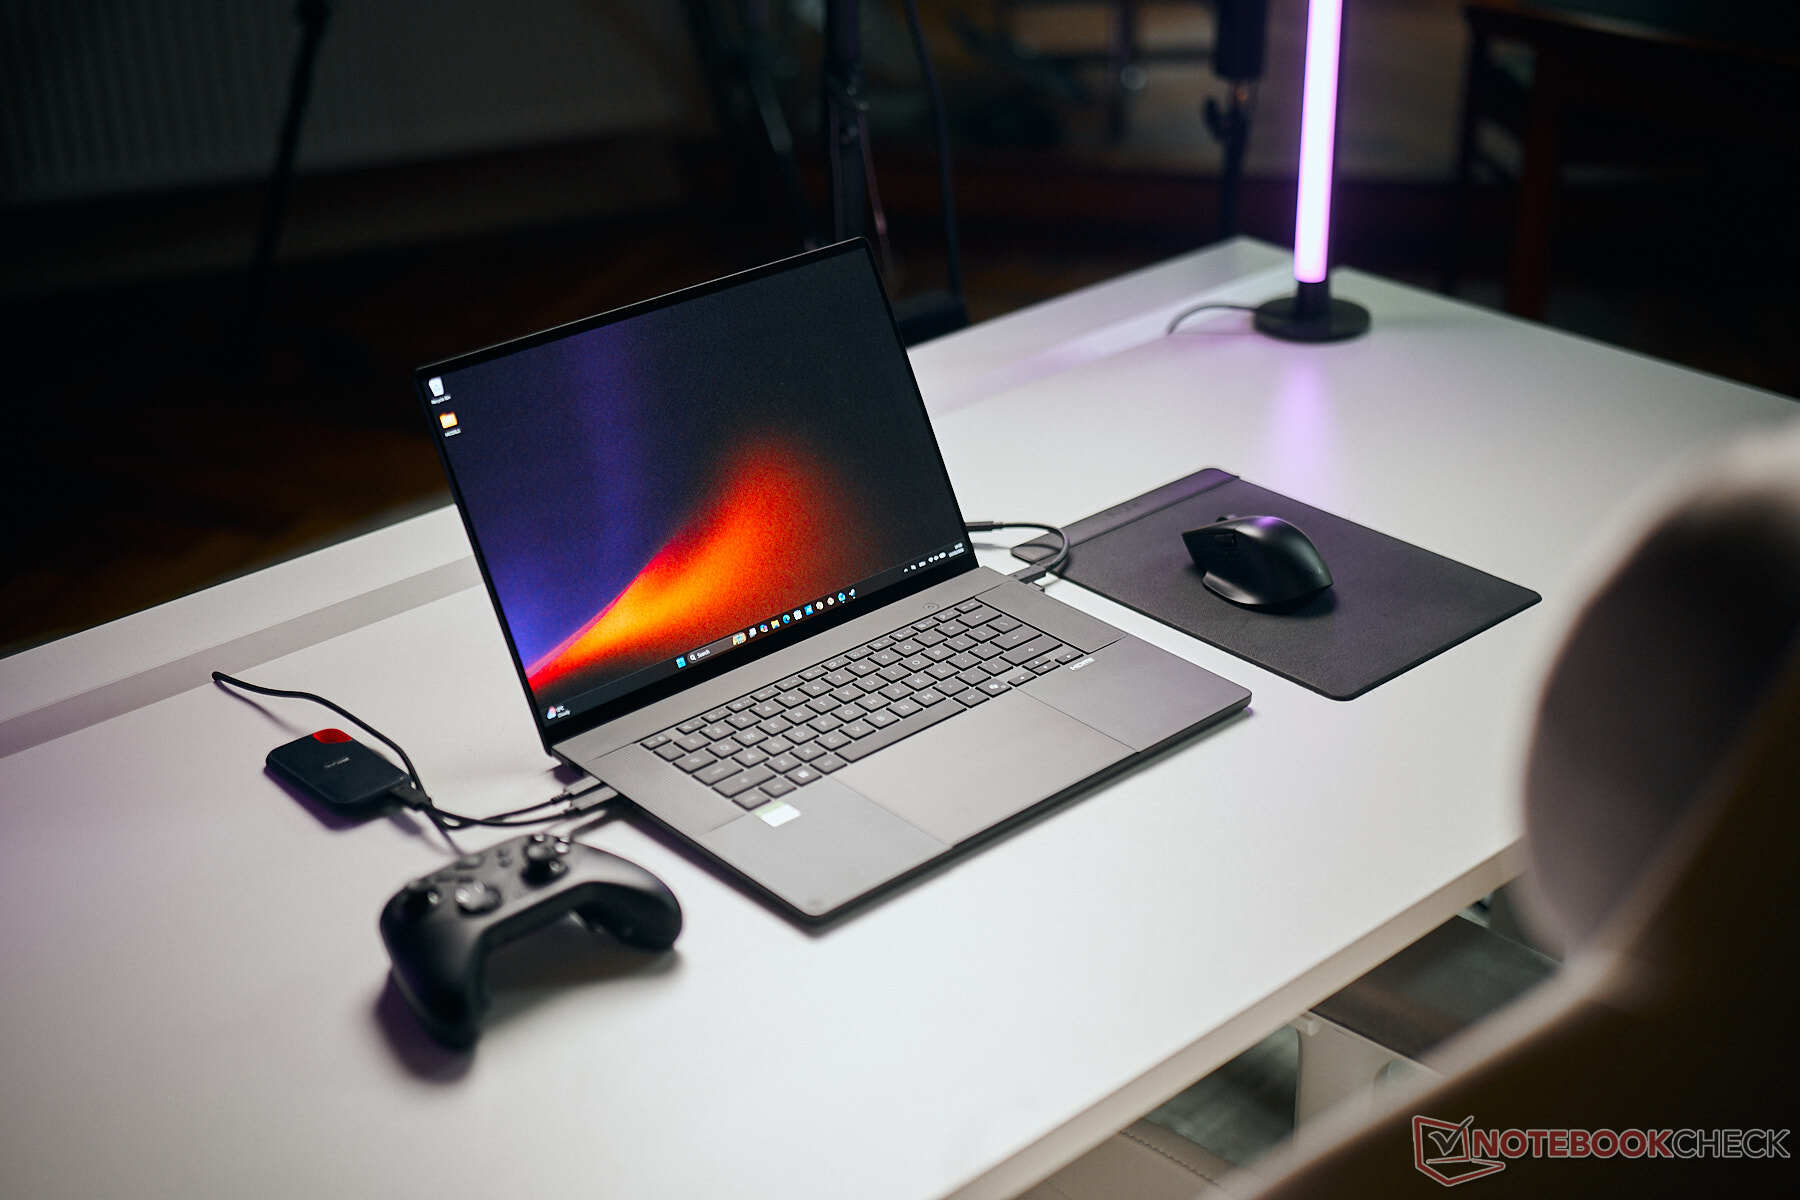
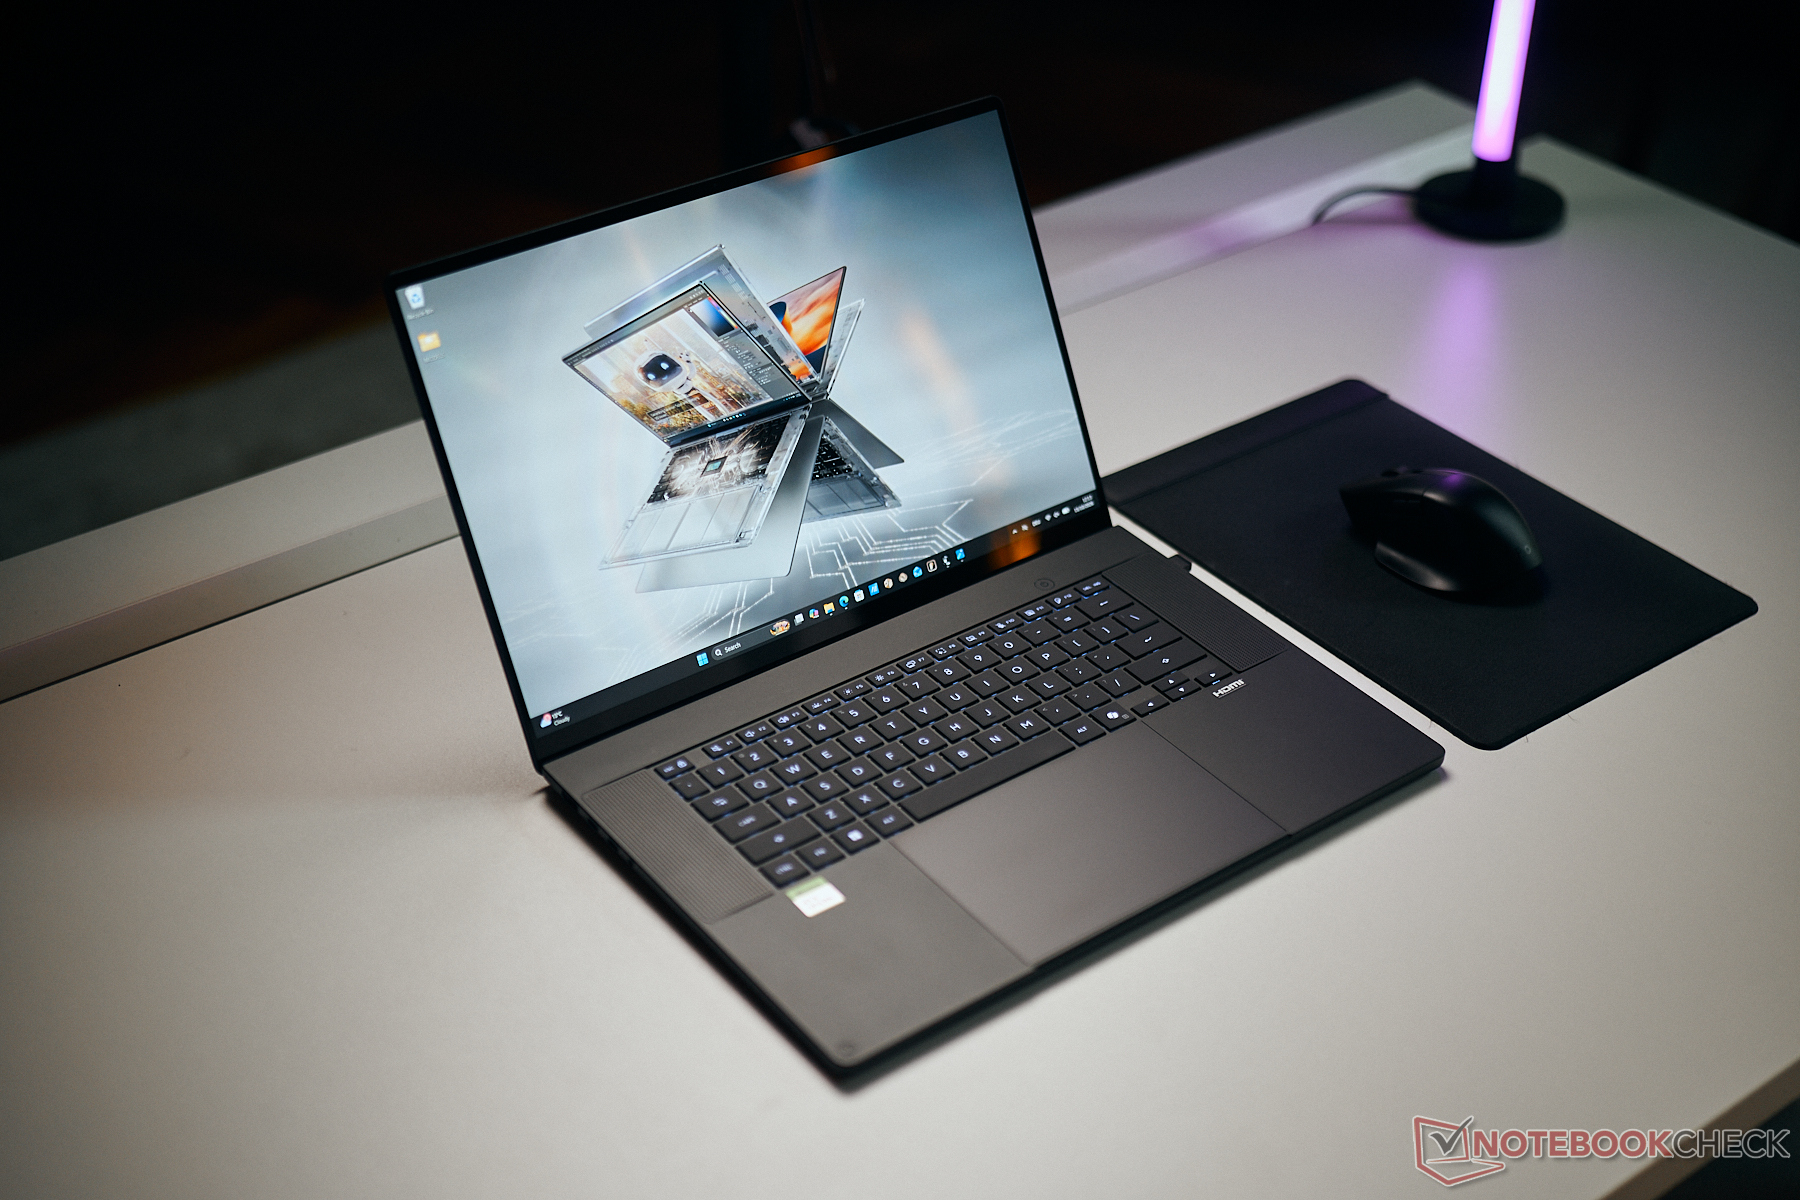
Our test system is the updated 2026 model of the Asus ProArt P16, which was completely redesigned for the new RTX Spark chips. Our review unit features the high-end RTX Spark N1X chip with 20 CPU cores, 6144 GPU cores and 64 GB RAM (LPDDR5x-9400) in combination with a 3K display OLED panel. Our full review of the new ProArt P16 will be online soon, but right now we can only say that the chip consumes up to 85/70 Watts in Performance mode. The only way to monitor CPU & GPU consumption data right now is Nvidia's performance overlay (Alt+R), as HWiNFO does not show any consumption numbers and GPU-Z results in crashes.

Update October 16th: We are also reviewing the new Microsoft Surface Laptop Ultra right now, which is also equipped with the faster RTX Spark N1X chip with 20 CPU cores, 6144 CUDA cores and combined with 64 GB RAM. We have updated the charts below and included benchmarks. The Surface Laptop Ultra also runs the N1X at the full 80 Watts, so the overall performance is very similar to the ProArt P16. Our full review of the Surface Laptop Ultra will be released within the next couple of days.

Testing Conditions

In order to make a meaningful comparison between the different processors and graphics cards, we look at the power consumption in addition to the pure performance in synthetic benchmarks from which we then determine the efficiency.

The consumption measurements are always carried out on an external display so as to eliminate the different internal displays as influencing factors. Nevertheless, we measure the overall consumption of the system here and not just compare the pure TDP values.

Single-Core Performance & Efficiency

We start with the single-core performance and the N1X performs pretty well. It is faster than AMD's Zen 5 chips and on par with Intel's latest Panther Lake chips. Qualcomm's new X2 chips are a bit faster and Apple is obviously on a completely different level in terms of single-core performance.

Performance rating: Percent | Cinebench 2024: CPU Single Core | Geekbench 6.7: Single-Core
Performance rating
Apple M5 Max
MacBook Pro 16 2026 M5 Max
99.5 pt
Apple M5 Pro 18-Core
MacBook Pro 16 2026 M5 Pro
99.5 pt
Apple M4 Max 16-Core
MacBook Pro 16 M4 Max
89 pt
Qualcomm Snapdragon X2 Elite Extreme X2E-94-100
Zenbook A16 UX3607
81.7 pt
Qualcomm Snapdragon X2 Elite X2E-88-100
Zenbook A14 UX3704NA
81 pt
Nvidia RTX Spark N1x 675
Surface Laptop Ultra 2026
68.3 pt
Nvidia RTX Spark N1x 675
ProArt P16 H7607
68 pt
Intel Core Ultra X9 388H
ZenBook Duo UX8407AA
67.1 pt
Intel Core Ultra 9 386H
ROG Zephyrus G16 GU606AW
63.9 pt
AMD Ryzen AI Max+ 395
ROG Flow Z13 GZ302EA-RU073W
63.4 pt
AMD Ryzen AI Max+ 395
ProArt PX13 HN7306EA
63.3 pt
AMD Ryzen AI Max PRO 390
ZBook Ultra G1a A3ZQ0ET
58.8 pt
Cinebench 2024 / CPU Single Core
Apple M5 Pro 18-Core
MacBook Pro 16 2026 M5 Pro
201 Points +55%
Apple M5 Max
MacBook Pro 16 2026 M5 Max
199 Points +53%
Apple M4 Max 16-Core
MacBook Pro 16 M4 Max
178 Points +37%
Qualcomm Snapdragon X2 Elite Extreme X2E-94-100
Zenbook A16 UX3607
151 Points +16%
Qualcomm Snapdragon X2 Elite X2E-88-100
Zenbook A14 UX3704NA
149 Points +15%
Nvidia RTX Spark N1x 675
Surface Laptop Ultra 2026
131 Points +1%
Nvidia RTX Spark N1x 675
ProArt P16 H7607
130 Points
Intel Core Ultra X9 388H
ZenBook Duo UX8407AA
129.8 Points 0%
Intel Core Ultra 9 386H
ROG Zephyrus G16 GU606AW
120.4 Points -7%
AMD Ryzen AI Max+ 395
ROG Flow Z13 GZ302EA-RU073W
116.8 Points -10%
AMD Ryzen AI Max+ 395
ProArt PX13 HN7306EA
116.4 Points -10%
AMD Ryzen AI Max PRO 390
ZBook Ultra G1a A3ZQ0ET
107.8 Points -17%
Geekbench 6.7 / Single-Core
Apple M5 Max
MacBook Pro 16 2026 M5 Max
4336 Points +40%
Apple M5 Pro 18-Core
MacBook Pro 16 2026 M5 Pro
4295 Points +39%
Apple M4 Max 16-Core
MacBook Pro 16 M4 Max
3880 Points +25%
Qualcomm Snapdragon X2 Elite Extreme X2E-94-100
Zenbook A16 UX3607
3826 Points +24%
Qualcomm Snapdragon X2 Elite X2E-88-100
Zenbook A14 UX3704NA
3814 Points +23%
Nvidia RTX Spark N1x 675
Surface Laptop Ultra 2026
3096 Points 0%
Nvidia RTX Spark N1x 675
ProArt P16 H7607
3092 Points
Intel Core Ultra X9 388H
ZenBook Duo UX8407AA
3020 Points -2%
AMD Ryzen AI Max+ 395
ROG Flow Z13 GZ302EA-RU073W
2978 Points -4%
AMD Ryzen AI Max+ 395
ProArt PX13 HN7306EA
2975 Points -4%
Intel Core Ultra 9 386H
ROG Zephyrus G16 GU606AW
2947 Points -5%
AMD Ryzen AI Max PRO 390
ZBook Ultra G1a A3ZQ0ET
2774 Points -10%

During single-core workloads, the N1X CPU core consumes roughly 9 Watts with a total system power draw of ~30 Watts. The efficiency is solid only slightly behind a Panther Lake Core Ultra X chip in the Asus Zenbook Duo, while it is better compared to all the AMD rivals. Snapdragon X2 chips and Apple M5 chips are superior here, though.

Power Consumption / Cinebench 2024 Single Power Efficiency - external Monitor
Apple M5 Pro 18-Core
MacBook Pro 16 2026 M5 Pro
9.57 Points per Watt +125%
Apple M5 Max
MacBook Pro 16 2026 M5 Max
9.26 Points per Watt +117%
Apple M4 Max 16-Core
MacBook Pro 16 M4 Max
8.24 Points per Watt +93%
Qualcomm Snapdragon X2 Elite Extreme X2E-94-100
Zenbook A16 UX3607
5.83 Points per Watt +37%
Qualcomm Snapdragon X2 Elite X2E-88-100
Zenbook A14 UX3704NA
5.64 Points per Watt +32%
Intel Core Ultra X9 388H
ZenBook Duo UX8407AA
5.17 Points per Watt +21%
Nvidia RTX Spark N1x 675
ProArt P16 H7607
4.26 Points per Watt
Nvidia RTX Spark N1x 675
Surface Laptop Ultra 2026
3.92 Points per Watt -8%
AMD Ryzen AI Max+ 395
ProArt PX13 HN7306EA
2.94 Points per Watt -31%
AMD Ryzen AI Max PRO 390
ZBook Ultra G1a A3ZQ0ET
2.72 Points per Watt -36%
AMD Ryzen AI Max+ 395
ROG Flow Z13 GZ302EA-RU073W
2.62 Points per Watt -38%
Intel Core Ultra 9 386H
ROG Zephyrus G16 GU606AW
2.14 Points per Watt -50%
Power Consumption / Cinebench 2024 Single Power (external Monitor)
Intel Core Ultra 9 386H
ROG Zephyrus G16 GU606AW
56.2 (49.1min, 51.1P1 - 67.7max) Watt * -84%
AMD Ryzen AI Max+ 395
ROG Flow Z13 GZ302EA-RU073W
44.6 (42min, 42.4P1 - 70.6max) Watt * -46%
AMD Ryzen AI Max PRO 390
ZBook Ultra G1a A3ZQ0ET
39.6 (31.2min, 36.1P1 - 65.3max) Watt * -30%
AMD Ryzen AI Max+ 395
ProArt PX13 HN7306EA
39.6 (36.9min, 37.7P1 - 64.5max) Watt * -30%
Nvidia RTX Spark N1x 675
Surface Laptop Ultra 2026
33.4 (29.9min, 30.4P1 - 44.3max) Watt * -10%
Nvidia RTX Spark N1x 675
ProArt P16 H7607
30.5 (20.9min, 23.7P1 - 70max) Watt *
Qualcomm Snapdragon X2 Elite X2E-88-100
Zenbook A14 UX3704NA
26.4 (23.2min, 24.7P1 - 37.3max) Watt * +13%
Qualcomm Snapdragon X2 Elite Extreme X2E-94-100
Zenbook A16 UX3607
25.9 (22.5min, 22.7P1 - 35.3max) Watt * +15%
Intel Core Ultra X9 388H
ZenBook Duo UX8407AA
25.1 (21.9min, 22.6P1 - 37.3max) Watt * +18%
Apple M4 Max 16-Core
MacBook Pro 16 M4 Max
21.6 (19.9min, 20.1P1 - 23.2max) Watt * +29%
Apple M5 Max
MacBook Pro 16 2026 M5 Max
21.5 (18.5min, 18.9P1 - 25.1max) Watt * +30%
Apple M5 Pro 18-Core
MacBook Pro 16 2026 M5 Pro
21 (18.8min, 20P1 - 23.3max) Watt * +31%

* ... smaller is better

Multi-Core Performance & Efficiency

Multi-core performance is very good and the RTX Spark N1X can keep up with the fastest AMD Strix Halo systems. Intel's Panther Lake is easily beaten and most Snapdragon X2 Elite chips as well, only the rare Snapdragon X2 Elite Extreme is slightly faster. Compared to Apple's processors, the N1X can just beat the latest M6 chip, but falls behind the M4/M5 Pro & Max models.

Performance rating: Percent | Cinebench 2024: CPU Multi Core | Geekbench 6.7: Multi-Core
Performance rating
Apple M5 Max
MacBook Pro 16 2026 M5 Max
100 pt
Apple M5 Pro 18-Core
MacBook Pro 16 2026 M5 Pro
94.4 pt
Apple M4 Max 16-Core
MacBook Pro 16 M4 Max
83.9 pt
Qualcomm Snapdragon X2 Elite Extreme X2E-94-100
Zenbook A16 UX3607
74 pt
Apple M4 Pro 14-Core
MacBook Pro 16 2024 M4 Pro
72.2 pt
AMD Ryzen AI Max+ 395
ROG Flow Z13 GZ302EA-RU073W
68.5 pt
Nvidia RTX Spark N1x 675
ProArt P16 H7607
68.4 pt
Nvidia RTX Spark N1x 675
Surface Laptop Ultra 2026
67.1 pt
AMD Ryzen AI Max+ 395
ProArt PX13 HN7306EA
65.8 pt
Apple M6
Mac Mini M6
64.9 pt
Qualcomm Snapdragon X2 Elite X2E-88-100
Zenbook A14 UX3704NA
63.3 pt
Intel Core Ultra 9 386H
ROG Zephyrus G16 GU606AW
54.3 pt
Intel Core Ultra X9 388H
ZenBook Duo UX8407AA
53 pt
AMD Ryzen AI Max PRO 390
ZBook Ultra G1a A3ZQ0ET
52.5 pt
Cinebench 2024 / CPU Multi Core
Apple M5 Max
MacBook Pro 16 2026 M5 Max
2490 Points +44%
Apple M5 Pro 18-Core
MacBook Pro 16 2026 M5 Pro
2347 Points +36%
Apple M4 Max 16-Core
MacBook Pro 16 M4 Max
2069 Points +20%
Apple M4 Max 16-Core
MacBook Pro 16 M4 Max
2015 Points +17%
Qualcomm Snapdragon X2 Elite Extreme X2E-94-100
Zenbook A16 UX3607
1761 Points +2%
Apple M4 Pro 14-Core
MacBook Pro 16 2024 M4 Pro
1729 Points 0%
Nvidia RTX Spark N1x 675
ProArt P16 H7607
1726 Points
Nvidia RTX Spark N1x 675
Surface Laptop Ultra 2026
1682 Points -3%
AMD Ryzen AI Max+ 395
ProArt PX13 HN7306EA
1673 Points -3%
AMD Ryzen AI Max+ 395
ROG Flow Z13 GZ302EA-RU073W
1648 Points -5%
Qualcomm Snapdragon X2 Elite X2E-88-100
Zenbook A14 UX3704NA
1471 Points -15%
Apple M6
Mac Mini M6
1468 Points -15%
AMD Ryzen AI Max PRO 390
ZBook Ultra G1a A3ZQ0ET
1316 Points -24%
Intel Core Ultra 9 386H
ROG Zephyrus G16 GU606AW
1271 Points -26%
Intel Core Ultra X9 388H
ZenBook Duo UX8407AA
1172 Points -32%
Geekbench 6.7 / Multi-Core
Apple M5 Max
MacBook Pro 16 2026 M5 Max
30057 Points +48%
Apple M5 Pro 18-Core
MacBook Pro 16 2026 M5 Pro
28436 Points +40%
Apple M4 Max 16-Core
MacBook Pro 16 M4 Max
25760 Points +27%
Qualcomm Snapdragon X2 Elite Extreme X2E-94-100
Zenbook A16 UX3607
23204 Points +14%
Apple M4 Pro 14-Core
MacBook Pro 16 2024 M4 Pro
22509 Points +11%
Apple M6
Mac Mini M6
21302 Points +5%
AMD Ryzen AI Max+ 395
ROG Flow Z13 GZ302EA-RU073W
21269 Points +5%
Qualcomm Snapdragon X2 Elite X2E-88-100
Zenbook A14 UX3704NA
20325 Points 0%
Nvidia RTX Spark N1x 675
ProArt P16 H7607
20296 Points
Nvidia RTX Spark N1x 675
Surface Laptop Ultra 2026
20031 Points -1%
AMD Ryzen AI Max+ 395
ProArt PX13 HN7306EA
19364 Points -5%
Intel Core Ultra X9 388H
ZenBook Duo UX8407AA
17694 Points -13%
Intel Core Ultra 9 386H
ROG Zephyrus G16 GU606AW
17319 Points -15%
AMD Ryzen AI Max PRO 390
ZBook Ultra G1a A3ZQ0ET
15649 Points -23%
Performance rating: Percent | Cinebench 2024: CPU Multi Core | Geekbench 6.7: Multi-Core

The N1X consumes up to 85 Watts and then settles at 70 Watts in the Performance mode of the Asus ProArt P16. The multi-core efficiency is roughly on par with the Strix Halo systems. Intel's Panther Lake systems are better (but are also much slower) and the second generation of Snapdragon processors is also superior, just like Apple's M4/M5 chips. We will add efficiency data for the slower power modes of the ProArt P16 soon.

Power Consumption / Cinebench 2024 Multi Power Efficiency - external Monitor
Apple M6
Mac Mini M6
32.5 Points per Watt +139%
Qualcomm Snapdragon X2 Elite X2E-88-100
Zenbook A14 UX3704NA
23.2 Points per Watt +71%
Apple M5 Pro 18-Core
MacBook Pro 16 2026 M5 Pro
23 Points per Watt +69%
Apple M4 Max 16-Core
MacBook Pro 16 M4 Max
22.4 Points per Watt +65%
Qualcomm Snapdragon X2 Elite Extreme X2E-94-100
Zenbook A16 UX3607
22.2 Points per Watt +63%
Apple M5 Max
MacBook Pro 16 2026 M5 Max
21.2 Points per Watt +56%
Apple M4 Pro 14-Core
MacBook Pro 16 2024 M4 Pro
20.2 Points per Watt +49%
Intel Core Ultra X9 388H
ZenBook Duo UX8407AA
16.2 Points per Watt +19%
AMD Ryzen AI Max+ 395
ProArt PX13 HN7306EA
15.1 Points per Watt +11%
Nvidia RTX Spark N1x 675
Surface Laptop Ultra 2026
14.9 Points per Watt +10%
AMD Ryzen AI Max+ 395
ROG Flow Z13 GZ302EA-RU073W
14.7 Points per Watt +8%
Nvidia RTX Spark N1x 675
ProArt P16 H7607
13.6 Points per Watt
AMD Ryzen AI Max PRO 390
ZBook Ultra G1a A3ZQ0ET
12.3 Points per Watt -10%
Intel Core Ultra 9 386H
ROG Zephyrus G16 GU606AW
12.1 Points per Watt -11%
Power Consumption / Cinebench 2024 Multi Power (external Monitor)
Nvidia RTX Spark N1x 675
ProArt P16 H7607
127.1 (121.4min, 122.4P1 - 138.7max) Watt *
Apple M5 Max
MacBook Pro 16 2026 M5 Max
117.5 (107.9min, 108.8P1 - 129.6max) Watt * +8%
Nvidia RTX Spark N1x 675
Surface Laptop Ultra 2026
112.9 (93.3min, 95.4P1 - 136.2max) Watt * +11%
AMD Ryzen AI Max+ 395
ROG Flow Z13 GZ302EA-RU073W
112.4 (109.8min, 109.9P1 - 134.7max) Watt * +12%
AMD Ryzen AI Max+ 395
ProArt PX13 HN7306EA
111.1 (105.2min, 106.5P1 - 127.7max) Watt * +13%
AMD Ryzen AI Max PRO 390
ZBook Ultra G1a A3ZQ0ET
107.3 (103.7min, 103.8P1 - 119.6max) Watt * +16%
Intel Core Ultra 9 386H
ROG Zephyrus G16 GU606AW
104.9 (95.9min, 96.2P1 - 111.1max) Watt * +17%
Apple M5 Pro 18-Core
MacBook Pro 16 2026 M5 Pro
102 (82.3min, 87P1 - 123.5max) Watt * +20%
Apple M4 Max 16-Core
MacBook Pro 16 M4 Max
92.2 (85.6min, 87.1P1 - 105.4max) Watt * +27%
Apple M4 Pro 14-Core
MacBook Pro 16 2024 M4 Pro
85.8 (77.5min, 77.7P1 - 89.6max) Watt * +32%
Qualcomm Snapdragon X2 Elite Extreme X2E-94-100
Zenbook A16 UX3607
79.2 (57min, 62.7P1 - 99.1max) Watt * +38%
Intel Core Ultra X9 388H
ZenBook Duo UX8407AA
72.2 (66min, 66.8P1 - 89.8max) Watt * +43%
Qualcomm Snapdragon X2 Elite X2E-88-100
Zenbook A14 UX3704NA
63.3 (56.6min, 57.5P1 - 81.9max) Watt * +50%
Apple M6
Mac Mini M6
45.2 (41.5min, 42.2P1 - 47.2max) Watt * +64%

* ... smaller is better

GPU Performance

As we mentioned before, the Blackwell GPU is basically what you get in consumer GeForce cards. Keep in mind that some benchmarks like Time Spy have to be emulated, which will affect the performance. We therefore limited our benchmark selection to native ARM tests like 3DMark Steel Nomad. Here, the GPU performance is comparable to powerful versions of the Nvidia GeForce RTX 5070 and around 50 % faster than the Radeon 8060S. Intel and Qualcomm cannot compete in this regard. Apple's M5 Pro GPU is also slower (-28 %), while the M5 Max GPU is faster (+27 %).

Performance rating: Percent | 3DMark: Steel Nomad Score | Steel Nomad Light Score | Geekbench 6.7: GPU OpenCL
Performance rating
NVIDIA GeForce RTX 5090 Laptop
ProArt P16 RTX 5090
100 pt
NVIDIA GeForce RTX 5080 Laptop
ThinkPad T16g Gen 3 RTX 5080
87.1 pt
NVIDIA GeForce RTX 5070 Ti Laptop
XMG APEX 16 MAX
86.1 pt
Apple M5 Max 40-Core GPU
MacBook Pro 16 2026 M5 Max
83.8 pt
NVIDIA GeForce RTX 5070 Ti Laptop
ROG Zephyrus G14 GU405AR
78.9 pt
NVIDIA RTX Spark N1X 6144-Core Blackwell GPU
ProArt P16 H7607
67.8 pt
NVIDIA GeForce RTX 5070 Laptop
XMG FUSION 16 (M25)
67.2 pt
NVIDIA RTX Spark N1X 6144-Core Blackwell GPU
Surface Laptop Ultra 2026
64.7 pt
NVIDIA GeForce RTX 5070 Laptop
Galaxy Book6 Ultra
61.8 pt
NVIDIA GeForce RTX 5070 Laptop
ThinkPad T1g Gen 8 21TD003GE
59 pt
NVIDIA GeForce RTX 5060 Laptop
Legion 7 16 AGP11
57.2 pt
NVIDIA GeForce RTX 5060 Laptop
ThinkBook 16p G6 21R00013GE
55.7 pt
NVIDIA GeForce RTX 5070 Laptop
Yoga Pro 9i 16 RTX 5070
53.1 pt
Apple M5 Pro 20-Core GPU
MacBook Pro 16 2026 M5 Pro
47.2 pt
AMD Radeon 8060S
ProArt PX13 HN7306EA
44.1 pt
AMD Radeon 8060S
ROG Flow Z13 GZ302EA-RU073W
43.9 pt
Intel Arc B390 12 Xe3 Panther Lake iGPU
ZenBook Duo UX8407AA
31.4 pt
Qualcomm Adreno X2-90
Zenbook A16 UX3607
24.9 pt
Qualcomm Adreno X2-90
Zenbook A14 UX3704NA
22.2 pt
3DMark / Steel Nomad Score
NVIDIA GeForce RTX 5090 Laptop
ProArt P16 RTX 5090
4959 Points +58%
Apple M5 Max 40-Core GPU
MacBook Pro 16 2026 M5 Max
4386 Points +40%
NVIDIA GeForce RTX 5080 Laptop
ThinkPad T16g Gen 3 RTX 5080
4022 Points +28%
NVIDIA GeForce RTX 5070 Ti Laptop
XMG APEX 16 MAX
3953 Points +26%
NVIDIA GeForce RTX 5070 Ti Laptop
ROG Zephyrus G14 GU405AR
3694 Points +18%
NVIDIA RTX Spark N1X 6144-Core Blackwell GPU
ProArt P16 H7607
3134 Points
NVIDIA RTX Spark N1X 6144-Core Blackwell GPU
Surface Laptop Ultra 2026
3134 Points 0%
NVIDIA GeForce RTX 5070 Laptop
XMG FUSION 16 (M25)
3075 Points -2%
NVIDIA GeForce RTX 5070 Laptop
Yoga Pro 9i 16 RTX 5070
2906 Points -7%
NVIDIA GeForce RTX 5070 Laptop
Galaxy Book6 Ultra
2784 Points -11%
NVIDIA GeForce RTX 5070 Laptop
ThinkPad T1g Gen 8 21TD003GE
2636 Points -16%
NVIDIA GeForce RTX 5060 Laptop
Legion 7 16 AGP11
2605 Points -17%
NVIDIA GeForce RTX 5060 Laptop
ThinkBook 16p G6 21R00013GE
2603 Points -17%
Apple M5 Pro 20-Core GPU
MacBook Pro 16 2026 M5 Pro
2323 Points -26%
AMD Radeon 8060S
ProArt PX13 HN7306EA
2019 Points -36%
AMD Radeon 8060S
ROG Flow Z13 GZ302EA-RU073W
1874 Points -40%
Intel Arc B390 12 Xe3 Panther Lake iGPU
ZenBook Duo UX8407AA
1667 Points -47%
Qualcomm Adreno X2-90
Zenbook A16 UX3607
1264 Points -60%
Qualcomm Adreno X2-90
Zenbook A14 UX3704NA
1095 Points -65%
3DMark / Steel Nomad Light Score
NVIDIA GeForce RTX 5090 Laptop
ProArt P16 RTX 5090
21012 Points +58%
NVIDIA GeForce RTX 5070 Ti Laptop
XMG APEX 16 MAX
18188 Points +37%
Apple M5 Max 40-Core GPU
MacBook Pro 16 2026 M5 Max
17649 Points +33%
NVIDIA GeForce RTX 5080 Laptop
ThinkPad T16g Gen 3 RTX 5080
17002 Points +28%
NVIDIA GeForce RTX 5070 Ti Laptop
ROG Zephyrus G14 GU405AR
16907 Points +27%
NVIDIA GeForce RTX 5070 Laptop
Yoga Pro 9i 16 RTX 5070
13721 Points +3%
NVIDIA GeForce RTX 5070 Laptop
XMG FUSION 16 (M25)
13426 Points +1%
NVIDIA RTX Spark N1X 6144-Core Blackwell GPU
ProArt P16 H7607
13266 Points
NVIDIA RTX Spark N1X 6144-Core Blackwell GPU
Surface Laptop Ultra 2026
12900 Points -3%
NVIDIA GeForce RTX 5070 Laptop
Galaxy Book6 Ultra
12271 Points -8%
NVIDIA GeForce RTX 5060 Laptop
Legion 7 16 AGP11
12141 Points -8%
NVIDIA GeForce RTX 5070 Laptop
ThinkPad T1g Gen 8 21TD003GE
11903 Points -10%
NVIDIA GeForce RTX 5060 Laptop
ThinkBook 16p G6 21R00013GE
11804 Points -11%
Apple M5 Pro 20-Core GPU
MacBook Pro 16 2026 M5 Pro
10018 Points -24%
AMD Radeon 8060S
ProArt PX13 HN7306EA
9866 Points -26%
AMD Radeon 8060S
ROG Flow Z13 GZ302EA-RU073W
9653 Points -27%
Intel Arc B390 12 Xe3 Panther Lake iGPU
ZenBook Duo UX8407AA
6338 Points -52%
Qualcomm Adreno X2-90
Zenbook A16 UX3607
5492 Points -59%
Qualcomm Adreno X2-90
Zenbook A14 UX3704NA
4877 Points -63%
Geekbench 6.7 / GPU OpenCL
NVIDIA GeForce RTX 5090 Laptop
ProArt P16 RTX 5090
187922 Points +30%
NVIDIA GeForce RTX 5080 Laptop
ThinkPad T16g Gen 3 RTX 5080
186625 Points +29%
NVIDIA GeForce RTX 5070 Ti Laptop
XMG APEX 16 MAX
172925 Points +19%
NVIDIA GeForce RTX 5070 Ti Laptop
ROG Zephyrus G14 GU405AR
153565 Points +6%
Apple M5 Max 40-Core GPU
MacBook Pro 16 2026 M5 Max
148149 Points +2%
NVIDIA RTX Spark N1X 6144-Core Blackwell GPU
ProArt P16 H7607
144949 Points
NVIDIA GeForce RTX 5070 Laptop
XMG FUSION 16 (M25)
142486 Points -2%
NVIDIA GeForce RTX 5070 Laptop
Galaxy Book6 Ultra
132895 Points -8%
NVIDIA RTX Spark N1X 6144-Core Blackwell GPU
Surface Laptop Ultra 2026
130738 Points -10%
NVIDIA GeForce RTX 5070 Laptop
ThinkPad T1g Gen 8 21TD003GE
126177 Points -13%
NVIDIA GeForce RTX 5060 Laptop
Legion 7 16 AGP11
115157 Points -21%
NVIDIA GeForce RTX 5060 Laptop
ThinkBook 16p G6 21R00013GE
109612 Points -24%
AMD Radeon 8060S
ROG Flow Z13 GZ302EA-RU073W
90181 Points -38%
Apple M5 Pro 20-Core GPU
MacBook Pro 16 2026 M5 Pro
88251 Points -39%
AMD Radeon 8060S
ProArt PX13 HN7306EA
83773 Points -42%
NVIDIA GeForce RTX 5070 Laptop
Yoga Pro 9i 16 RTX 5070
66275 Points -54%
Intel Arc B390 12 Xe3 Panther Lake iGPU
ZenBook Duo UX8407AA
57288 Points -60%
Qualcomm Adreno X2-90
Zenbook A16 UX3607
43591 Points -70%
Qualcomm Adreno X2-90
Zenbook A14 UX3704NA
39874 Points -72%
Performance rating: Percent | 3DMark: Steel Nomad Score | Steel Nomad Light Score | Geekbench 6.7: GPU OpenCL

Gaming Performance & Efficiency

Gaming is obviously another important aspect with a Blackwell GPU and this is also very interesting considering the ARM version of Windows. From our experiences with Snapdragon laptops over the last two years, we know that some titles are not compatible. This includes titles like F1 25 or Battlefield 6, for example, even though we already saw a working version of F1 25 at Gamescom, so this might change soon. Then there is also the performance aspect, since the vast majority of titles have to be emulated right now. We had the chance to test the Marvel Rivals in a native version and the performance advantage was roughly 20 % in 1080p and with much higher 1% low results (9 vs. 29 fps), so this is a significant difference. We also faced issues with stutters in titles like Assassin's Creed BlackF Flag or Shadows. We are currently still testing and update this article soon.

For this comparison, we only included Cyberpunk 2077 as well as Baldur's Gate 3 and the emulation definitely takes a toll. Compared to the synthetic benchmarks, the N1X loses ground to the RTX 5070 and is closer to the RTX 5060 in Cyberpunk, for example, while being competitive in Baldur's Gate 3. The larger memory is obviously an advantage in demanding games and we expect there will be native ARM version for the majority of upcoming titles. As of right now, gaming is definitely possible, especially with features like DLSS and Frame Generation, but laptops with powerful GeForce GPUs are (still) superior for gaming.

Cyberpunk 2077 / Ultra Preset (FSR off)
NVIDIA GeForce RTX 5090 Laptop
ProArt P16 RTX 5090
90.8 (72.6min - 114.9max) fps +60%
NVIDIA GeForce RTX 5070 Ti Laptop
XMG APEX 16 MAX
82.9 (69.5min - 107max) fps +46%
NVIDIA GeForce RTX 5070 Ti Laptop
ROG Zephyrus G14 GU405AR
77.4 (64.3min - 98max) fps +36%
NVIDIA GeForce RTX 5080 Laptop
ThinkPad T16g Gen 3 RTX 5080
74.4 (62min - 94.6max) fps +31%
NVIDIA GeForce RTX 5070 Ti Laptop
ROG Zephyrus G16 2025 5070 Ti
68.4 (57.1min - 89.2max) fps +20%
NVIDIA GeForce RTX 5070 Laptop
XMG FUSION 16 (M25)
65.2 (55.7min - 81.9max) fps +15%
Apple M5 Max 40-Core GPU
MacBook Pro 16 2026 M5 Max
63.1 fps +11%
NVIDIA GeForce RTX 5070 Laptop
Yoga Pro 9i 16 RTX 5070
62.8 (53.8min - 79.1max) fps +11%
NVIDIA GeForce RTX 5070 Laptop
Galaxy Book6 Ultra
57.4 (49.2min - 71.9max) fps +1%
NVIDIA GeForce RTX 5060 Laptop
ThinkBook 16p G6 21R00013GE
57 (48.9min - 72.8max) fps 0%
NVIDIA RTX Spark N1X 6144-Core Blackwell GPU
ProArt P16 H7607
56.8 (42.2min - 69max) fps
NVIDIA GeForce RTX 5060 Laptop
Legion 7 16 AGP11
56.2 (47.6min - 72max) fps -1%
NVIDIA GeForce RTX 5070 Laptop
ThinkPad T1g Gen 8 21TD003GE
56.1 (47.7min - 71.2max) fps -1%
NVIDIA RTX Spark N1X 6144-Core Blackwell GPU
Surface Laptop Ultra 2026
54.6 (44.4min - 69max) fps -4%
AMD Radeon 8060S
ProArt PX13 HN7306EA
49.4 (40.2min - 64.4max) fps -13%
AMD Radeon 8060S
ROG Flow Z13 GZ302EA-RU073W
46.4 (39.2min - 60.2max) fps -18%
Apple M5 Pro 20-Core GPU
MacBook Pro 16 2026 M5 Pro
33.4 fps -41%
Intel Arc B390 12 Xe3 Panther Lake iGPU
ZenBook Duo UX8407AA
28.9 (24.1min - 38.6max) fps -49%
Qualcomm Adreno X2-90
Zenbook A16 UX3607
22.7 (19.4min - 30max) fps -60%
Cyberpunk 2077 / Ultra Preset (FSR off)
NVIDIA GeForce RTX 5070 Ti Laptop
XMG APEX 16 MAX
128 (103min - 160.2max) fps +67%
NVIDIA GeForce RTX 5090 Laptop
ProArt P16 RTX 5090
112.3 (80.7min - 139.2max) fps +47%
NVIDIA GeForce RTX 5070 Ti Laptop
ROG Zephyrus G14 GU405AR
111.9 (88.8min - 143.4max) fps +46%
NVIDIA GeForce RTX 5080 Laptop
ThinkPad T16g Gen 3 RTX 5080
107.6 (84.2min - 137.7max) fps +40%
NVIDIA GeForce RTX 5070 Ti Laptop
ROG Zephyrus G16 2025 5070 Ti
105.4 (82.3min - 135.9max) fps +38%
NVIDIA GeForce RTX 5070 Laptop
XMG FUSION 16 (M25)
103.8 (85.4min - 128.8max) fps +36%
Apple M5 Max 40-Core GPU
MacBook Pro 16 2026 M5 Max
102.8 fps +34%
NVIDIA GeForce RTX 5070 Laptop
Yoga Pro 9i 16 RTX 5070
98.3 (80min - 123.8max) fps +28%
NVIDIA GeForce RTX 5060 Laptop
Legion 7 16 AGP11
90.5 (72.4min - 113.7max) fps +18%
NVIDIA GeForce RTX 5060 Laptop
ThinkBook 16p G6 21R00013GE
90 (74.4min - 113.3max) fps +17%
NVIDIA GeForce RTX 5070 Laptop
ThinkPad T1g Gen 8 21TD003GE
87.3 (69.7min - 110.7max) fps +14%
NVIDIA GeForce RTX 5070 Laptop
Galaxy Book6 Ultra
84.6 (62.2min - 105.6max) fps +10%
AMD Radeon 8060S
ProArt PX13 HN7306EA
79.5 (63.2min - 105max) fps +4%
NVIDIA RTX Spark N1X 6144-Core Blackwell GPU
ProArt P16 H7607
76.6 (57.1min - 94.9max) fps
NVIDIA RTX Spark N1X 6144-Core Blackwell GPU
Surface Laptop Ultra 2026
76.6 (58min - 96.6max) fps 0%
AMD Radeon 8060S
ROG Flow Z13 GZ302EA-RU073W
75.6 (62min - 97.7max) fps -1%
AMD Radeon 8050S
ZBook Ultra G1a A3ZQ0ET
63.1 (51.7min, 45.1P1 - 80.2max) fps -18%
Apple M5 Pro 20-Core GPU
MacBook Pro 16 2026 M5 Pro
57.8 fps -25%
Intel Arc B390 12 Xe3 Panther Lake iGPU
ZenBook Duo UX8407AA
47.7 (37.8min - 61.7max) fps -38%
Qualcomm Adreno X2-90
Zenbook A16 UX3607
38.2 (30.9min - 49.7max) fps -50%
Qualcomm Adreno X2-90
Zenbook A14 UX3704NA
30.8 (25.3min - 39.9max) fps -60%
Baldur's Gate 3 / Ultra Preset
NVIDIA GeForce RTX 5090 Laptop
ProArt P16 RTX 5090
121 fps +53%
NVIDIA GeForce RTX 5070 Ti Laptop
ROG Zephyrus G14 GU405AR
120 (117.6min, 117.9P0.1, 118.7P1 - 123.3max) fps +52%
NVIDIA GeForce RTX 5070 Ti Laptop
XMG APEX 16 MAX
110.5 (92.1min, 95.8P0.1, 99P1 - 123.3max) fps +40%
NVIDIA GeForce RTX 5080 Laptop
ThinkPad T16g Gen 3 RTX 5080
107 (68.2min, 83.6P0.1, 96.6P1 - 126.4max) fps +35%
Apple M5 Max 40-Core GPU
MacBook Pro 16 2026 M5 Max
96.4 fps +22%
NVIDIA GeForce RTX 5070 Ti Laptop
ROG Zephyrus G16 2025 5070 Ti
93.9 fps +19%
NVIDIA GeForce RTX 5070 Laptop
XMG FUSION 16 (M25)
84.1 (71.6min, 75.9P0.1, 76.9P1 - 94.3max) fps +6%
NVIDIA RTX Spark N1X 6144-Core Blackwell GPU
ProArt P16 H7607
79.1 (54.2min, 59.8P0.1, 65.6P1 - 99.3max) fps
NVIDIA GeForce RTX 5060 Laptop
ThinkBook 16p G6 21R00013GE
78 (10.9min, 69.1P0.1, 71.4P1 - 139.7max) fps -1%
NVIDIA GeForce RTX 5060 Laptop
Legion 7 16 AGP11
76.4 (65.3min, 66.4P0.1, 68.8P1 - 90.6max) fps -3%
NVIDIA GeForce RTX 5070 Laptop
Galaxy Book6 Ultra
76.2 (56.4min, 57.1P0.1, 68.6P1 - 86.7max) fps -4%
NVIDIA RTX Spark N1X 6144-Core Blackwell GPU
Surface Laptop Ultra 2026
75.8 (49min, 51.6P0.1, 62.3P1 - 94.9max) fps -4%
NVIDIA GeForce RTX 5070 Laptop
ThinkPad T1g Gen 8 21TD003GE
72.8 (34.9min, 54P0.1, 64.7P1 - 82.6max) fps -8%
NVIDIA GeForce RTX 5070 Laptop
Yoga Pro 9i 16 RTX 5070
63.1 fps -20%
AMD Radeon 8060S
ProArt PX13 HN7306EA
60.8 (55min, 55.2P0.1, 56.3P1 - 67.3max) fps -23%
Apple M5 Pro 20-Core GPU
MacBook Pro 16 2026 M5 Pro
56.7 fps -28%
AMD Radeon 8060S
ROG Flow Z13 GZ302EA-RU073W
55.2 fps -30%
Intel Arc B390 12 Xe3 Panther Lake iGPU
ZenBook Duo UX8407AA
31.4 (25.9min, 26.2P0.1, 27.6P1 - 34.8max) fps -60%
Qualcomm Adreno X2-90
Zenbook A16 UX3607
28.7 (21.2min, 21.6P0.1, 23.2P1 - 32.2max) fps -64%
Baldur's Gate 3 / Ultra Preset
NVIDIA GeForce RTX 5090 Laptop
ProArt P16 RTX 5090
158.7 fps +70%
NVIDIA GeForce RTX 5070 Ti Laptop
XMG APEX 16 MAX
155.6 (107.2min, 130P0.1, 140P1 - 192.8max) fps +67%
NVIDIA GeForce RTX 5080 Laptop
ThinkPad T16g Gen 3 RTX 5080
145.9 (27min, 79.7P0.1, 113.3P1 - 217max) fps +56%
NVIDIA GeForce RTX 5070 Ti Laptop
ROG Zephyrus G14 GU405AR
141.9 (90.2min, 102.1P0.1, 119.1P1 - 183max) fps +52%
Apple M5 Max 40-Core GPU
MacBook Pro 16 2026 M5 Max
134.6 fps +44%
NVIDIA GeForce RTX 5070 Ti Laptop
ROG Zephyrus G16 2025 5070 Ti
131.2 fps +40%
NVIDIA GeForce RTX 5070 Laptop
XMG FUSION 16 (M25)
121 (101min, 103.8P0.1, 109.6P1 - 139.5max) fps +30%
NVIDIA GeForce RTX 5060 Laptop
ThinkBook 16p G6 21R00013GE
115.6 (97.5min, 98.1P0.1, 105.3P1 - 135.6max) fps +24%
NVIDIA GeForce RTX 5060 Laptop
Legion 7 16 AGP11
112.2 (90.4min, 93.5P0.1, 101.2P1 - 155.7max) fps +20%
NVIDIA GeForce RTX 5070 Laptop
Galaxy Book6 Ultra
109.2 (88.4min, 93.8P0.1, 97.6P1 - 128.1max) fps +17%
NVIDIA GeForce RTX 5070 Laptop
ThinkPad T1g Gen 8 21TD003GE
106 (79.2min, 92.7P0.1, 95.4P1 - 120.9max) fps +13%
NVIDIA RTX Spark N1X 6144-Core Blackwell GPU
Surface Laptop Ultra 2026
97.4 (48.8min, 52.5P0.1, 72.4P1 - 137.2max) fps +4%
NVIDIA RTX Spark N1X 6144-Core Blackwell GPU
ProArt P16 H7607
93.4 (55min, 57.7P0.1, 67.4P1 - 135.8max) fps
AMD Radeon 8060S
ProArt PX13 HN7306EA
90.5 (62.4min, 66.1P0.1, 83.3P1 - 101.6max) fps -3%
NVIDIA GeForce RTX 5070 Laptop
Yoga Pro 9i 16 RTX 5070
87.3 fps -7%
AMD Radeon 8060S
ROG Flow Z13 GZ302EA-RU073W
85.3 fps -9%
Apple M5 Pro 20-Core GPU
MacBook Pro 16 2026 M5 Pro
83.8 fps -10%
AMD Radeon 8050S
ZBook Ultra G1a A3ZQ0ET
68.7 (35.6min, 50.1P0.1, 62.2P1 - 80max) fps -26%
Intel Arc B390 12 Xe3 Panther Lake iGPU
ZenBook Duo UX8407AA
44.6 (38min, 38.3P0.1, 40.6P1 - 49.8max) fps -52%
Qualcomm Adreno X2-90
Zenbook A16 UX3607
42.5 (28.7min, 29.8P0.1, 39.3P1 - 48max) fps -54%
Qualcomm Adreno X2-90
Zenbook A14 UX3704NA
34.8 (23.1min, 23.9P0.1, 29.6P1 - 40.8max) fps -63%

We also checked the efficiency while gaming, but once again keep in mind that Cyberpunk is the x64 version (there is no native ARM version for Windows yet, only for macOS), which affects the performance and therefore also the efficiency. The numbers are still solid and the N1X is just slightly worse compared to systems with the GeForce RTX 5060/5070. It beats the AMD Strix Halo systems and also the MacBook Pro 16 with the M5 Pro. 

Power Consumption / Cyberpunk 2077 ultra Efficiency
Qualcomm Adreno X2-90
Zenbook A14 UX3704NA
0.841 fps per Watt +44%
NVIDIA GeForce RTX 5070 Laptop
ThinkPad T1g Gen 8 21TD003GE
0.688 fps per Watt +18%
Apple M5 Pro 20-Core GPU
MacBook Pro 16 2026 M5 Pro
0.672 fps per Watt +15%
AMD Radeon 8060S
ProArt PX13 HN7306EA
0.66 fps per Watt +13%
NVIDIA GeForce RTX 5070 Ti Laptop
ROG Zephyrus G14 GU405AR
0.655 fps per Watt +12%
NVIDIA RTX Spark N1X 6144-Core Blackwell GPU
Surface Laptop Ultra 2026
0.654 fps per Watt +12%
NVIDIA GeForce RTX 5070 Laptop
Galaxy Book6 Ultra
0.622 fps per Watt +6%
NVIDIA GeForce RTX 5090 Laptop
ProArt P16 RTX 5090
0.616 fps per Watt +5%
NVIDIA GeForce RTX 5080 Laptop
ThinkPad T16g Gen 3 RTX 5080
0.606 fps per Watt +4%
NVIDIA RTX Spark N1X 6144-Core Blackwell GPU
ProArt P16 H7607
0.585 fps per Watt
NVIDIA GeForce RTX 5070 Laptop
Yoga Pro 9i 16 RTX 5070
0.583 fps per Watt 0%
AMD Radeon 8060S
ROG Flow Z13 GZ302EA-RU073W
0.562 fps per Watt -4%
Qualcomm Adreno X2-90
Zenbook A16 UX3607
0.562 fps per Watt -4%
AMD Radeon 8050S
ZBook Ultra G1a A3ZQ0ET
0.543 fps per Watt -7%
Intel Arc B390 12 Xe3 Panther Lake iGPU
ZenBook Duo UX8407AA
0.533 fps per Watt -9%
NVIDIA GeForce RTX 5070 Laptop
XMG FUSION 16 (M25)
0.525 fps per Watt -10%
NVIDIA GeForce RTX 5060 Laptop
Legion 7 16 AGP11
0.523 fps per Watt -11%
NVIDIA GeForce RTX 5070 Ti Laptop
XMG APEX 16 MAX
0.514 fps per Watt -12%
NVIDIA GeForce RTX 5060 Laptop
ThinkBook 16p G6 21R00013GE
0.3825 fps per Watt -35%

AI Performance

Local AI is the major talking point of all chip manufacturers. But what does local AI mean and how can you use it? In simple terms, if you have lots of memory, you can download models and run the locally on your machine without using cloud services and obviously without paying for them. There are obviously different models and what you do will be completely unique from user to user. Once you have a model running, you can pretty much use it as a chat bot like you would with ChatGPT or Gemini, but agents take AI workloads one step further. We used Hermes and we used it to create slides for our YouTube video review of RTX Spark, for example, which can also be seen in the next section (Creator Benchmarks). Instead of simply answering your questions, the agent can get information from different sources and create documents. Agents can do much more and this is just a simple example, but even this approach already improved our workflow. 

The big problem in evaluating the performance is that the evolution of AI models is rapidly progressing and creating a database is problematic. We are also still trying to find the best benchmarks and right now, we use Mlperf 2.0 as the main comparison. Geekbench AI on the other hand is not really suitable right now as you can only run the CPU test on the RTX Spark N1X. Our Mlperf results show a mixed picture, and the N1X trades places with the M5 Pro depending on the individual test. We will continue testing the AI performance and update this article once we have additional results for you. 

MLPerf Client 2.0 / GPU Llama 3.1 8B SWE Agent Avg Expected Duration
Apple MacBook Pro 14 2024 M4 Pro Entry
M4 Pro 16-Core GPU, M4 Pro 12-Core, Apple SSD AP1024Z
152.9 s * -231%
Apple MacBook Pro 14 2024 M4 Pro Entry
M4 Pro 16-Core GPU, M4 Pro 12-Core, Apple SSD AP1024Z
129.9 s * -181%
Apple MacBook Pro 16 2026 M5 Pro
M5 Pro 20-Core GPU, M5 Pro 18-Core, Apple SSD AP4096Z
74.5 s * -61%
Apple MacBook Pro 16 2026 M5 Pro
M5 Pro 20-Core GPU, M5 Pro 18-Core, Apple SSD AP4096Z
55.4 s * -20%
Lenovo Legion 5 Pro 16IAH7H
GeForce RTX 3060 Laptop GPU, i7-12700H, 2x Samsung PM9A1 MZVL21T0HCLR (RAID 0)
51.6 s * -12%
Asus ProArt P16 H7607
RTX Spark N1X 6144-Core Blackwell GPU, Spark RTX N1x 675, SanDisk PC SN5100S 2TB
46.234 s *
Razer Blade 16 Early 2023
GeForce RTX 4080 Laptop GPU, i9-13950HX, SSSTC CA6-8D1024
37.7 s * +18%
Asus ROG Strix Scar 17 G733PY-XS96
GeForce RTX 4090 Laptop GPU, R9 7945HX, SK hynix PC801 HFS001TEJ9X101N
30.4 s * +34%
Lenovo Legion 9 18IAX10 RTX 5090
GeForce RTX 5090 Laptop, Ultra 9 275HX, Samsung PM9E1 MZVLC2T0HBLD
24.7 s * +47%
MLPerf Client 2.0 / GPU Llama 3.1 8B SWE Agent Avg Tools Duration
Lenovo Legion 5 Pro 16IAH7H
GeForce RTX 3060 Laptop GPU, i7-12700H, 2x Samsung PM9A1 MZVL21T0HCLR (RAID 0)
8.32 s * -30%
Asus ROG Strix Scar 17 G733PY-XS96
GeForce RTX 4090 Laptop GPU, R9 7945HX, SK hynix PC801 HFS001TEJ9X101N
7.7 s * -20%
Razer Blade 16 Early 2023
GeForce RTX 4080 Laptop GPU, i9-13950HX, SSSTC CA6-8D1024
7.69 s * -20%
Asus ProArt P16 H7607
RTX Spark N1X 6144-Core Blackwell GPU, Spark RTX N1x 675, SanDisk PC SN5100S 2TB
6.414 s *
Lenovo Legion 9 18IAX10 RTX 5090
GeForce RTX 5090 Laptop, Ultra 9 275HX, Samsung PM9E1 MZVLC2T0HBLD
5.56 s * +13%
Apple MacBook Pro 14 2024 M4 Pro Entry
M4 Pro 16-Core GPU, M4 Pro 12-Core, Apple SSD AP1024Z
4.97 s * +23%
Apple MacBook Pro 14 2024 M4 Pro Entry
M4 Pro 16-Core GPU, M4 Pro 12-Core, Apple SSD AP1024Z
4.91 s * +23%
Apple MacBook Pro 16 2026 M5 Pro
M5 Pro 20-Core GPU, M5 Pro 18-Core, Apple SSD AP4096Z
3.97 s * +38%
Apple MacBook Pro 16 2026 M5 Pro
M5 Pro 20-Core GPU, M5 Pro 18-Core, Apple SSD AP4096Z
3.95 s * +38%
MLPerf Client 2.0 / GPU Llama 3.1 8B LLM TTFT
Apple MacBook Pro 14 2024 M4 Pro Entry
M4 Pro 16-Core GPU, M4 Pro 12-Core, Apple SSD AP1024Z
2.37 s * -690%
Apple MacBook Pro 14 2024 M4 Pro Entry
M4 Pro 16-Core GPU, M4 Pro 12-Core, Apple SSD AP1024Z
2.25 s * -650%
Lenovo Legion 5 Pro 16IAH7H
GeForce RTX 3060 Laptop GPU, i7-12700H, 2x Samsung PM9A1 MZVL21T0HCLR (RAID 0)
0.44 s * -47%
Asus ProArt P16 H7607
RTX Spark N1X 6144-Core Blackwell GPU, Spark RTX N1x 675, SanDisk PC SN5100S 2TB
0.3 s *
Razer Blade 16 Early 2023
GeForce RTX 4080 Laptop GPU, i9-13950HX, SSSTC CA6-8D1024
0.24 s * +20%
Asus ROG Strix Scar 17 G733PY-XS96
GeForce RTX 4090 Laptop GPU, R9 7945HX, SK hynix PC801 HFS001TEJ9X101N
0.15 s * +50%
Lenovo Legion 9 18IAX10 RTX 5090
GeForce RTX 5090 Laptop, Ultra 9 275HX, Samsung PM9E1 MZVLC2T0HBLD
0.15 s * +50%
MLPerf Client 2.0 / GPU Llama 3.1 8B LLM Tokens/s
Lenovo Legion 9 18IAX10 RTX 5090
GeForce RTX 5090 Laptop, Ultra 9 275HX, Samsung PM9E1 MZVLC2T0HBLD
123.7 TPS +122%
Asus ROG Strix Scar 17 G733PY-XS96
GeForce RTX 4090 Laptop GPU, R9 7945HX, SK hynix PC801 HFS001TEJ9X101N
100.8 TPS +81%
Razer Blade 16 Early 2023
GeForce RTX 4080 Laptop GPU, i9-13950HX, SSSTC CA6-8D1024
73.4 TPS +32%
Lenovo Legion 5 Pro 16IAH7H
GeForce RTX 3060 Laptop GPU, i7-12700H, 2x Samsung PM9A1 MZVL21T0HCLR (RAID 0)
61.6 TPS +10%
Asus ProArt P16 H7607
RTX Spark N1X 6144-Core Blackwell GPU, Spark RTX N1x 675, SanDisk PC SN5100S 2TB
55.8 TPS
Apple MacBook Pro 14 2024 M4 Pro Entry
M4 Pro 16-Core GPU, M4 Pro 12-Core, Apple SSD AP1024Z
43.2 TPS -23%
Apple MacBook Pro 14 2024 M4 Pro Entry
M4 Pro 16-Core GPU, M4 Pro 12-Core, Apple SSD AP1024Z
37.4 TPS -33%
MLPerf Client 2.0 / GPU Qwen 3 8B SWE Agent Avg Expected Duration
Apple MacBook Pro 14 2024 M4 Pro Entry
M4 Pro 16-Core GPU, M4 Pro 12-Core, Apple SSD AP1024Z
132.7 s * -188%
Apple MacBook Pro 16 2026 M5 Pro
M5 Pro 20-Core GPU, M5 Pro 18-Core, Apple SSD AP4096Z
55.7 s * -21%
Asus ProArt P16 H7607
RTX Spark N1X 6144-Core Blackwell GPU, Spark RTX N1x 675, SanDisk PC SN5100S 2TB
46.115 s *
Lenovo Legion 9 18IAX10 RTX 5090
GeForce RTX 5090 Laptop, Ultra 9 275HX, Samsung PM9E1 MZVLC2T0HBLD
25.7 s * +44%
MLPerf Client 2.0 / GPU Qwen 3 8B SWE Agent Avg Tools Duration
Asus ProArt P16 H7607
RTX Spark N1X 6144-Core Blackwell GPU, Spark RTX N1x 675, SanDisk PC SN5100S 2TB
6.556 s *
Lenovo Legion 9 18IAX10 RTX 5090
GeForce RTX 5090 Laptop, Ultra 9 275HX, Samsung PM9E1 MZVLC2T0HBLD
5.56 s * +15%
Apple MacBook Pro 14 2024 M4 Pro Entry
M4 Pro 16-Core GPU, M4 Pro 12-Core, Apple SSD AP1024Z
4.91 s * +25%
Apple MacBook Pro 16 2026 M5 Pro
M5 Pro 20-Core GPU, M5 Pro 18-Core, Apple SSD AP4096Z
4 s * +39%
MLPerf Client 2.0 / GPU Qwen 3 8B LLM TTFT
Apple MacBook Pro 14 2024 M4 Pro Entry
M4 Pro 16-Core GPU, M4 Pro 12-Core, Apple SSD AP1024Z
2.32 s * -759%
Apple MacBook Pro 16 2026 M5 Pro
M5 Pro 20-Core GPU, M5 Pro 18-Core, Apple SSD AP4096Z
0.54 s * -100%
Asus ProArt P16 H7607
RTX Spark N1X 6144-Core Blackwell GPU, Spark RTX N1x 675, SanDisk PC SN5100S 2TB
0.27 s *
Lenovo Legion 9 18IAX10 RTX 5090
GeForce RTX 5090 Laptop, Ultra 9 275HX, Samsung PM9E1 MZVLC2T0HBLD
0.15 s * +44%
MLPerf Client 2.0 / GPU Qwen 3 8B LLM Tokens/s
Lenovo Legion 9 18IAX10 RTX 5090
GeForce RTX 5090 Laptop, Ultra 9 275HX, Samsung PM9E1 MZVLC2T0HBLD
119 TPS +121%
Asus ProArt P16 H7607
RTX Spark N1X 6144-Core Blackwell GPU, Spark RTX N1x 675, SanDisk PC SN5100S 2TB
53.8 TPS
Apple MacBook Pro 16 2026 M5 Pro
M5 Pro 20-Core GPU, M5 Pro 18-Core, Apple SSD AP4096Z
52.3 TPS -3%
Apple MacBook Pro 14 2024 M4 Pro Entry
M4 Pro 16-Core GPU, M4 Pro 12-Core, Apple SSD AP1024Z
47.5 TPS -12%
Geekbench AI / Single Precision CPU 1.7
Apple MacBook Pro 16 2026 M5 Pro
M5 Pro 20-Core GPU, M5 Pro 18-Core, Apple SSD AP4096Z
5018 Points +212%
Asus ProArt P16 H7607
RTX Spark N1X 6144-Core Blackwell GPU, Spark RTX N1x 675, SanDisk PC SN5100S 2TB
1606 Points
Geekbench AI / Half Precision CPU 1.7
Apple MacBook Pro 16 2026 M5 Pro
M5 Pro 20-Core GPU, M5 Pro 18-Core, Apple SSD AP4096Z
8738 Points +170%
Asus ProArt P16 H7607
RTX Spark N1X 6144-Core Blackwell GPU, Spark RTX N1x 675, SanDisk PC SN5100S 2TB
3237 Points
Geekbench AI / Quantized CPU 1.7
Apple MacBook Pro 16 2026 M5 Pro
M5 Pro 20-Core GPU, M5 Pro 18-Core, Apple SSD AP4096Z
7007 Points +8%
Asus ProArt P16 H7607
RTX Spark N1X 6144-Core Blackwell GPU, Spark RTX N1x 675, SanDisk PC SN5100S 2TB
6468 Points

* ... smaller is better

PugetBench Creator Benchmarks

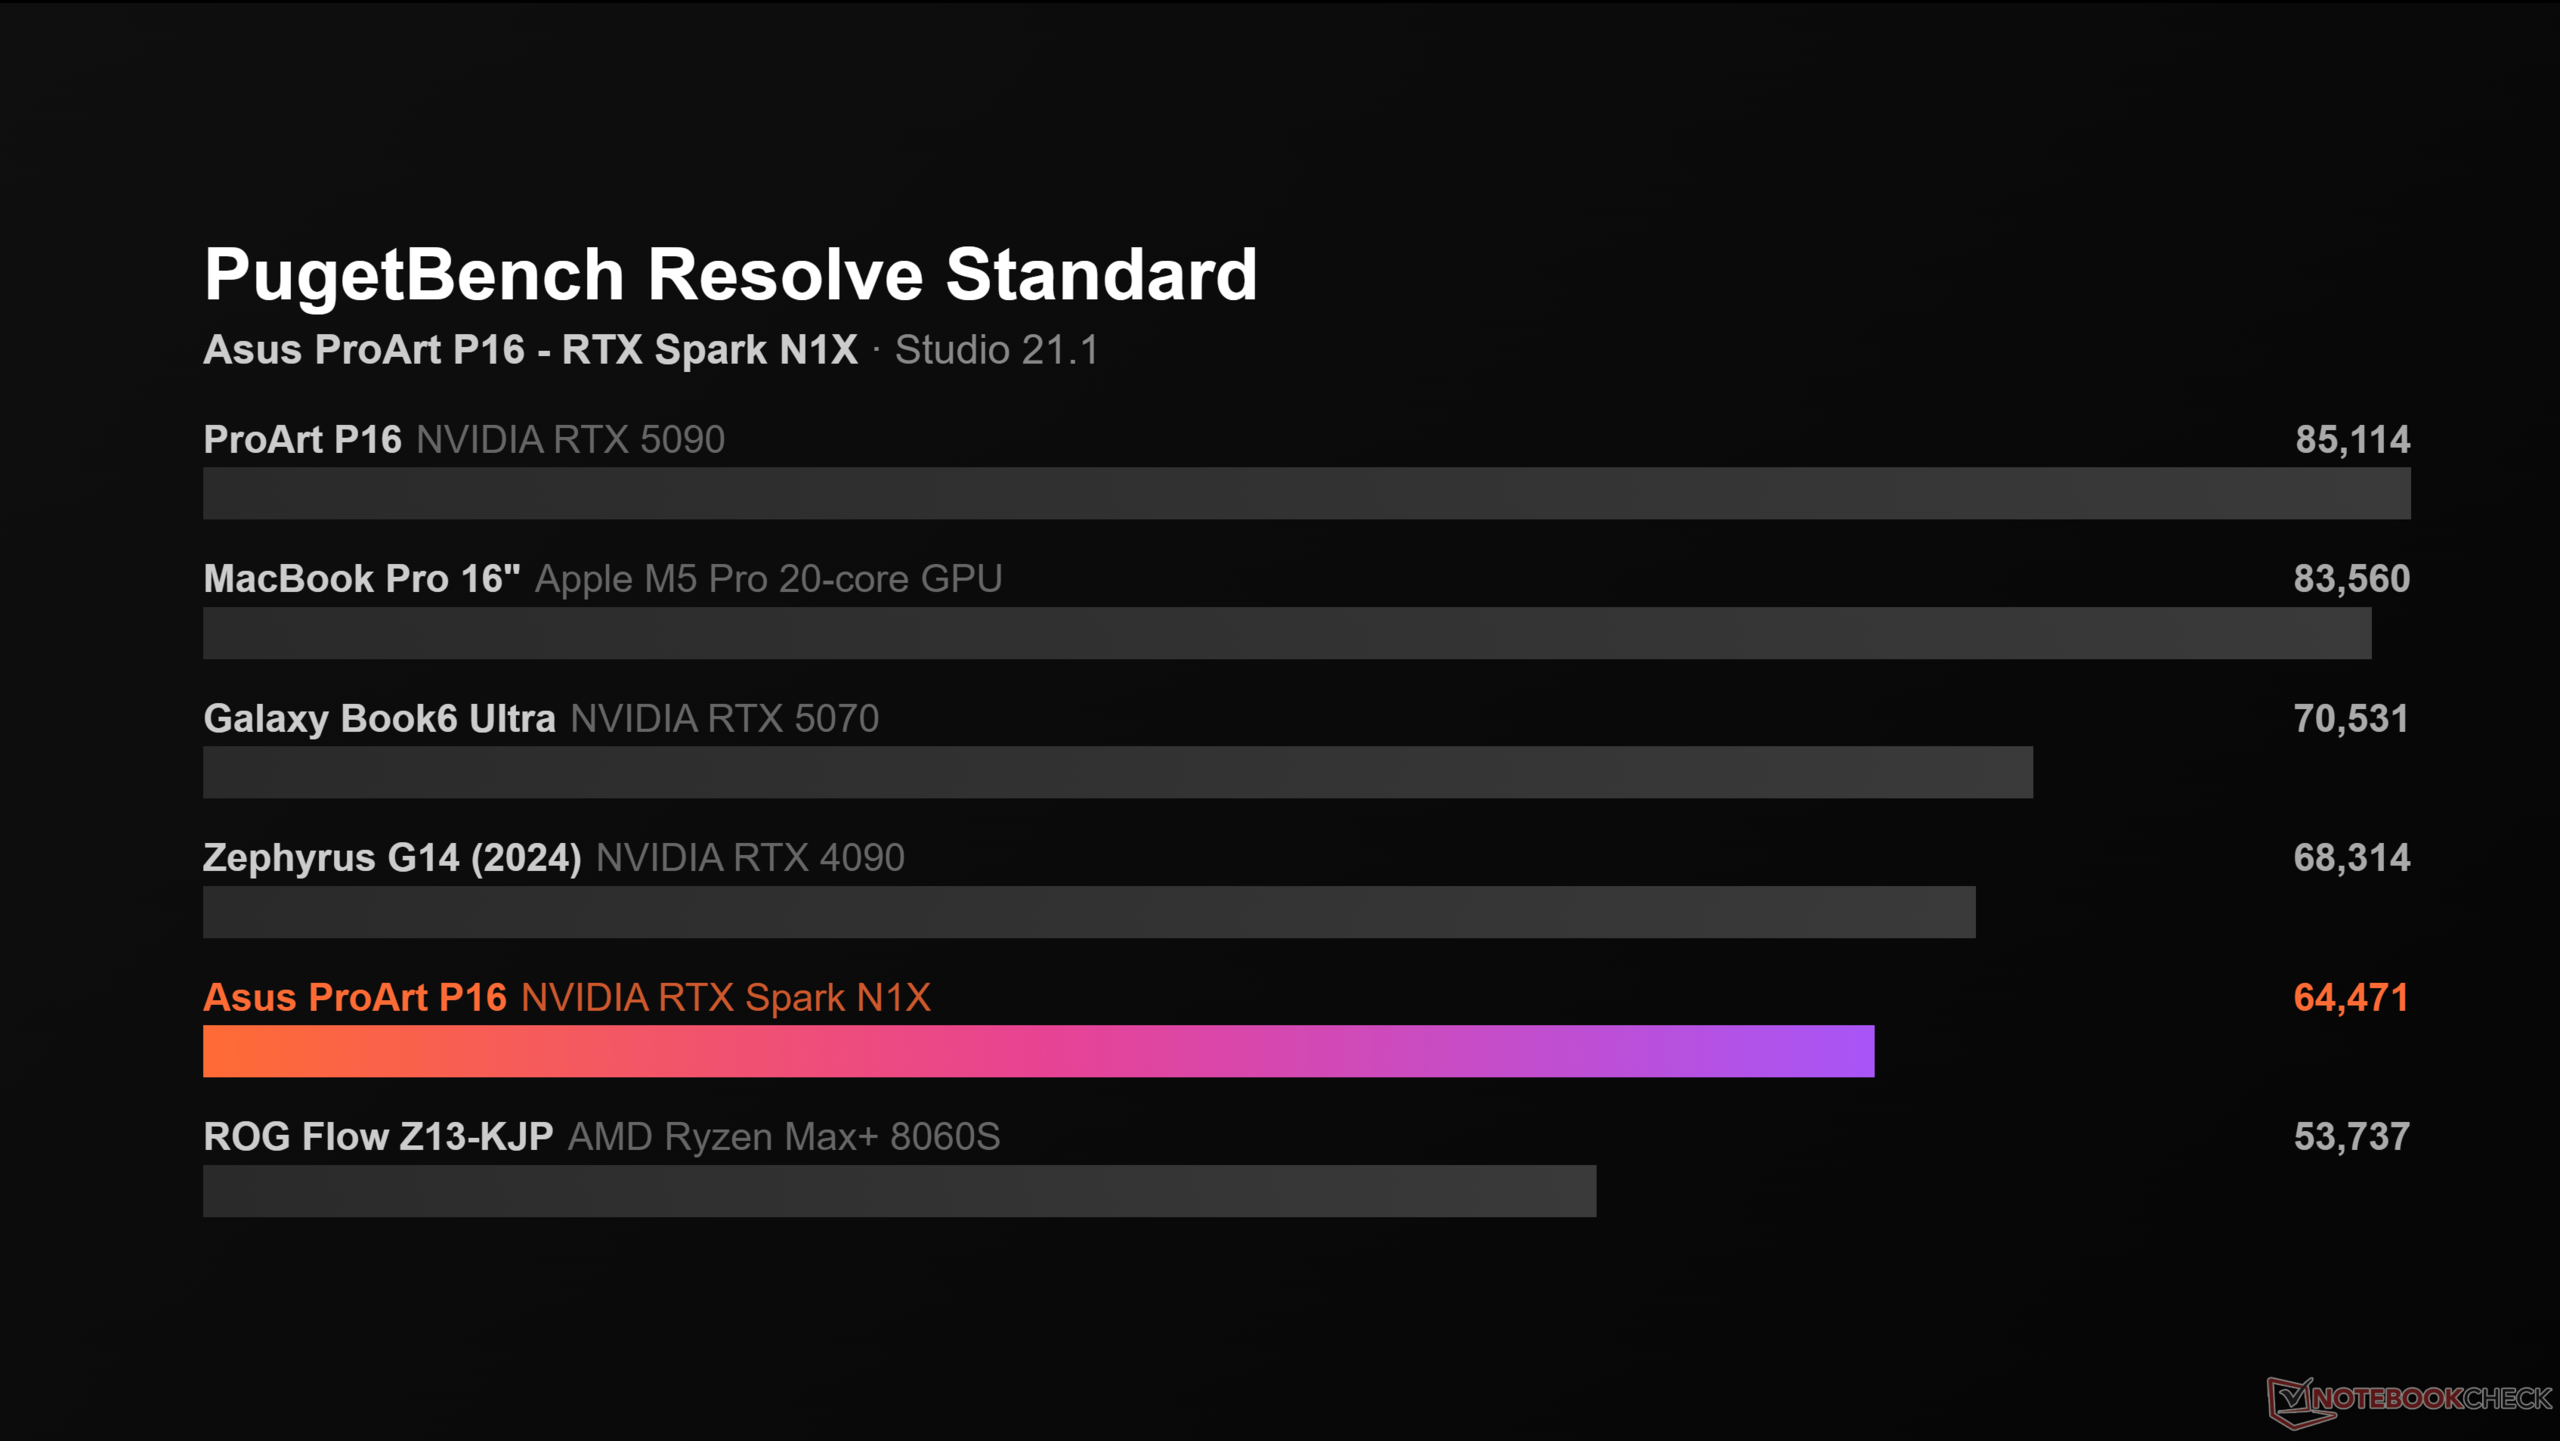
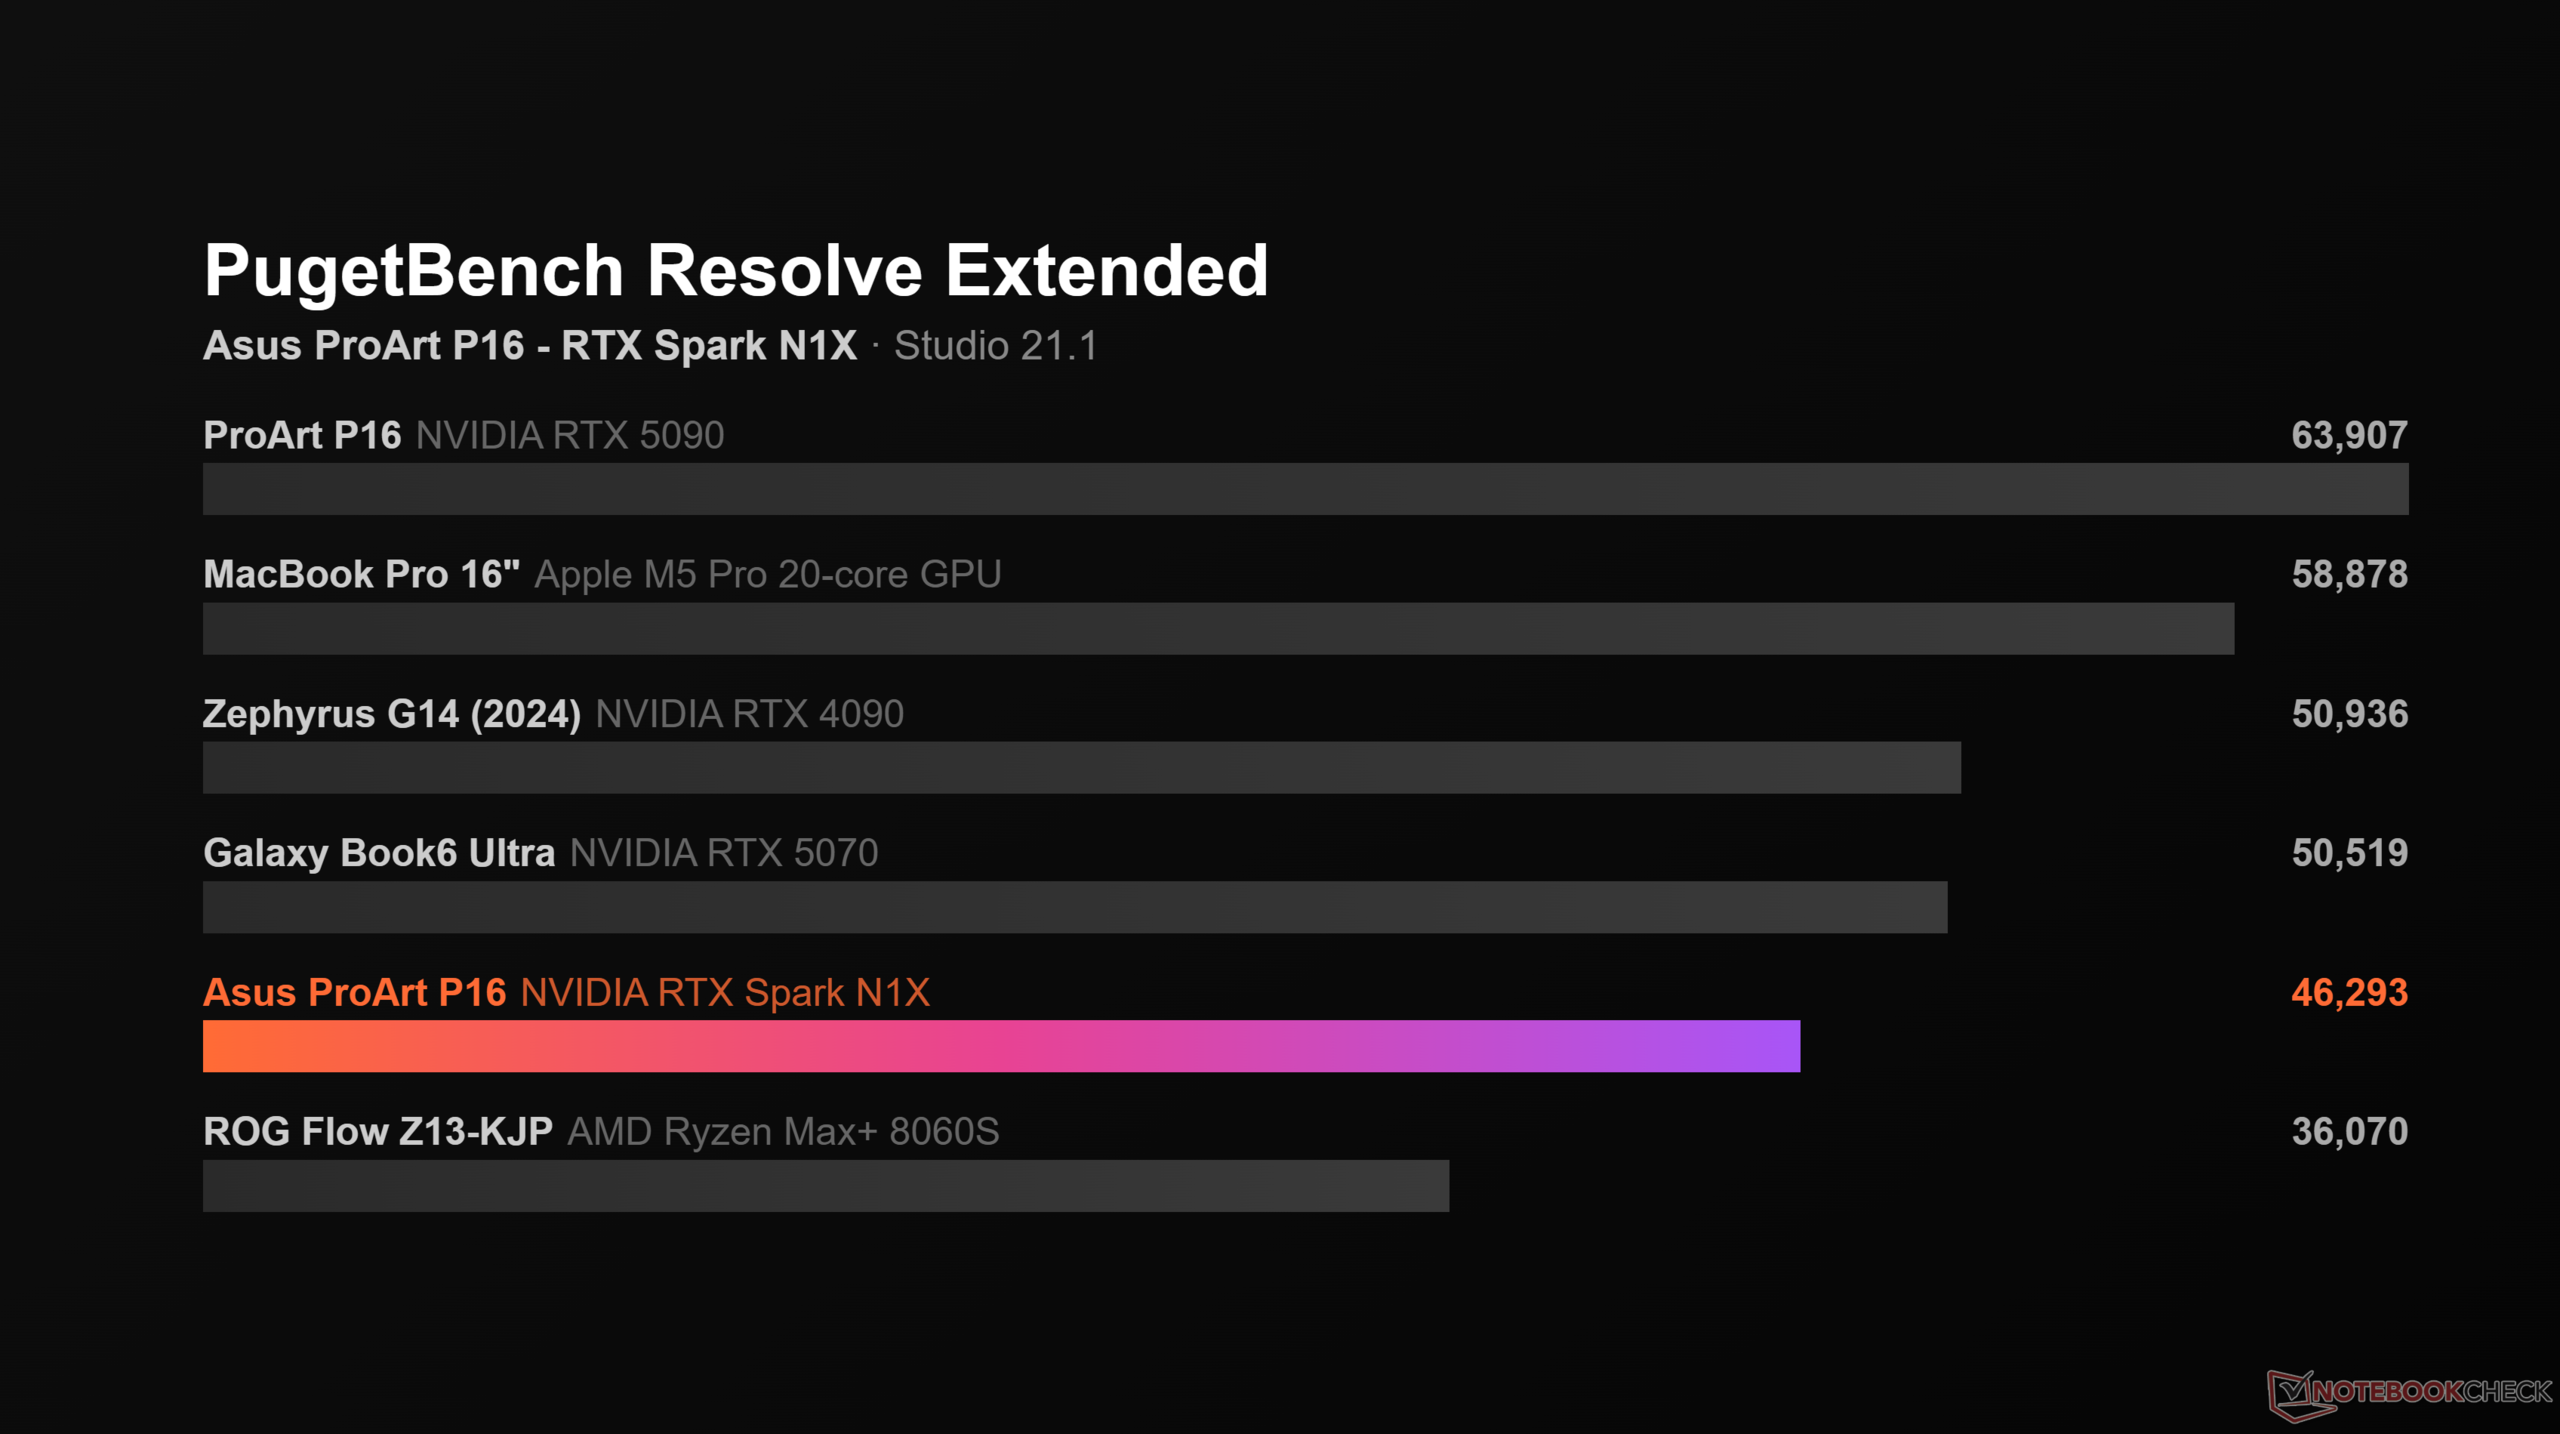
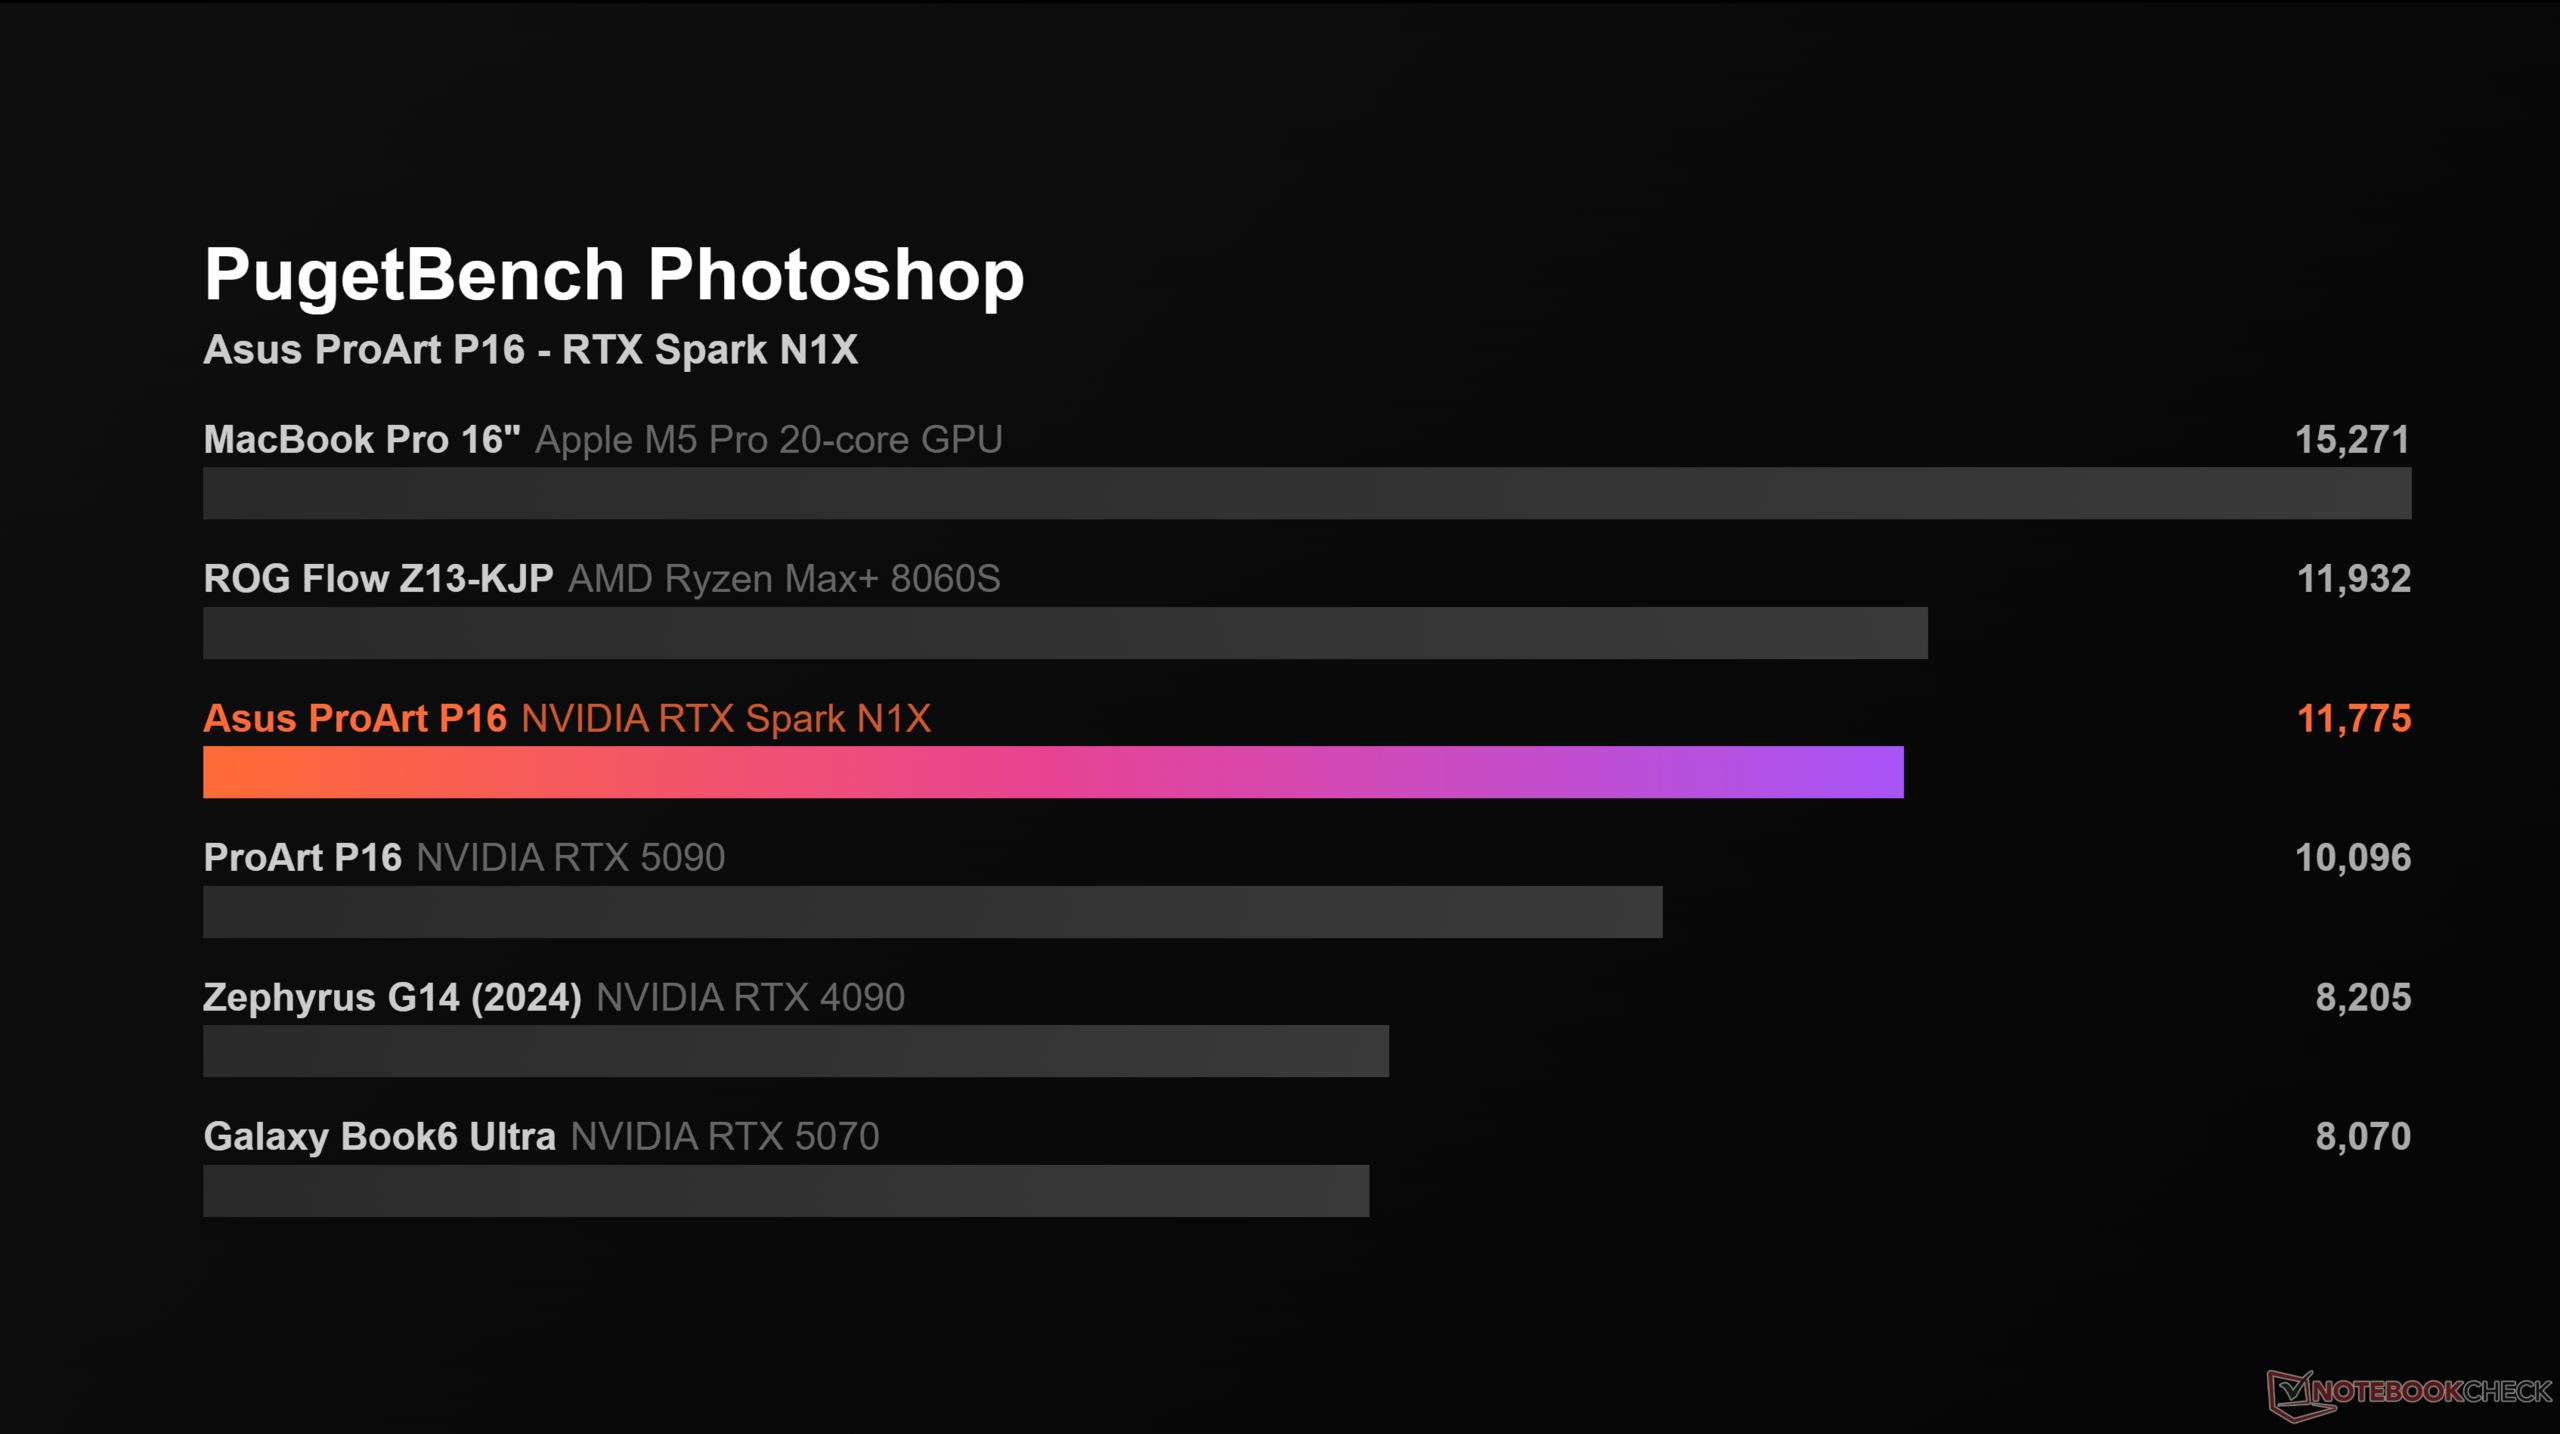
We also performed some creator benchmarks. In Adobe Photoshop, the new N1X performs well and is on par with AMD's Strix Halo SoC, but the M5 Pro is clearly ahead thanks to the powerful CPU. There are rumors about an update for Photoshop, which is supposed to take more advantage of GPU acceleration, so we are curious to see the performance as soon as it will be released. The Resolve benchmarks are a bit disappointing, but considering the benchmark does not need much VRAM and the software loves fast GPUs and is heavily optimized for macOS, the results make more sense. However, once you work with a lot of RAW footage and fill up the VRAM quickly, the N1X definitely has the edge over GPUs like the RTX 5070. 
Verdict - A solid first effort with high-end hardware
Asus ProArt P16
Asus ProArt P16

The new Nvidia RTX Spark N1X is a very solid effort overall and offers a great solution for users that work with AI and create content, but also want to play games all on one very sleek machine. While it does not stand out in any individual area, the overall package is very compelling. The CPU performance is very solid for a first-gen product, even though the efficiency definitely leaves room for improvements. The GPU performance is also very respectable and on par with the GeForce RTX 5070 in terms of raw power, while having the advantage of more RAM for demanding games or larger projects (modelling, picture and video editing, for example). As it uses the ARM version of Windows, there are still some compatibility issues (especially with games), but the overall situation is much better compared to the launch of the first-gen Snapdragon Windows laptops, for example.

And whether you like the approach or not, RTX Spark is currently the only way to get the best Windows hardware possible. All manufacturers (Microsoft, Asus, Lenovo, Dell, HP and MSI) offer absolute premium hardware with the best displays on the market. These laptops are expensive though and if you only want to play games, dedicated gaming laptops with GeForce RTX GPUs are still superior. However, RTX Spark might also be the next chapter for gaming machines. Nvidia dominates the laptop market anyway, so who knows, maybe they will just combine the next GPU generation (RTX 6000) with the second-generation ARM CPU and not offer dedicated laptop GPUs anymore. 

Transparency

The selection of devices to be reviewed is made by our editorial team. The test sample was provided to the author as a loan by the manufacturer or retailer for the purpose of this review. The lender had no influence on this review, nor did the manufacturer receive a copy of this review before publication. There was no obligation to publish this review. As an independent media company, Notebookcheck is not subjected to the authority of manufacturers, retailers or publishers.

This is how Notebookcheck is testing

Every year, Notebookcheck independently reviews hundreds of laptops and smartphones using standardized procedures to ensure that all results are comparable. We have continuously developed our test methods for around 20 years and set industry standards in the process. In our test labs, high-quality measuring equipment is utilized by experienced technicians and editors. These tests involve a multi-stage validation process. Our complex rating system is based on hundreds of well-founded measurements and benchmarks, which maintains objectivity. Further information on our test methods can be found here.

Google LogoAdd as a preferred source on Google
Mail Logo
> Expert reviews and news on laptops, smartphones and tech innovations > Reviews > Nvidia RTX Spark Analysis - Finally an answer to Apple's M5 Pro & M5 Max?
Andreas Osthoff, 2026-10-15 (Update: 2026-10-16)