




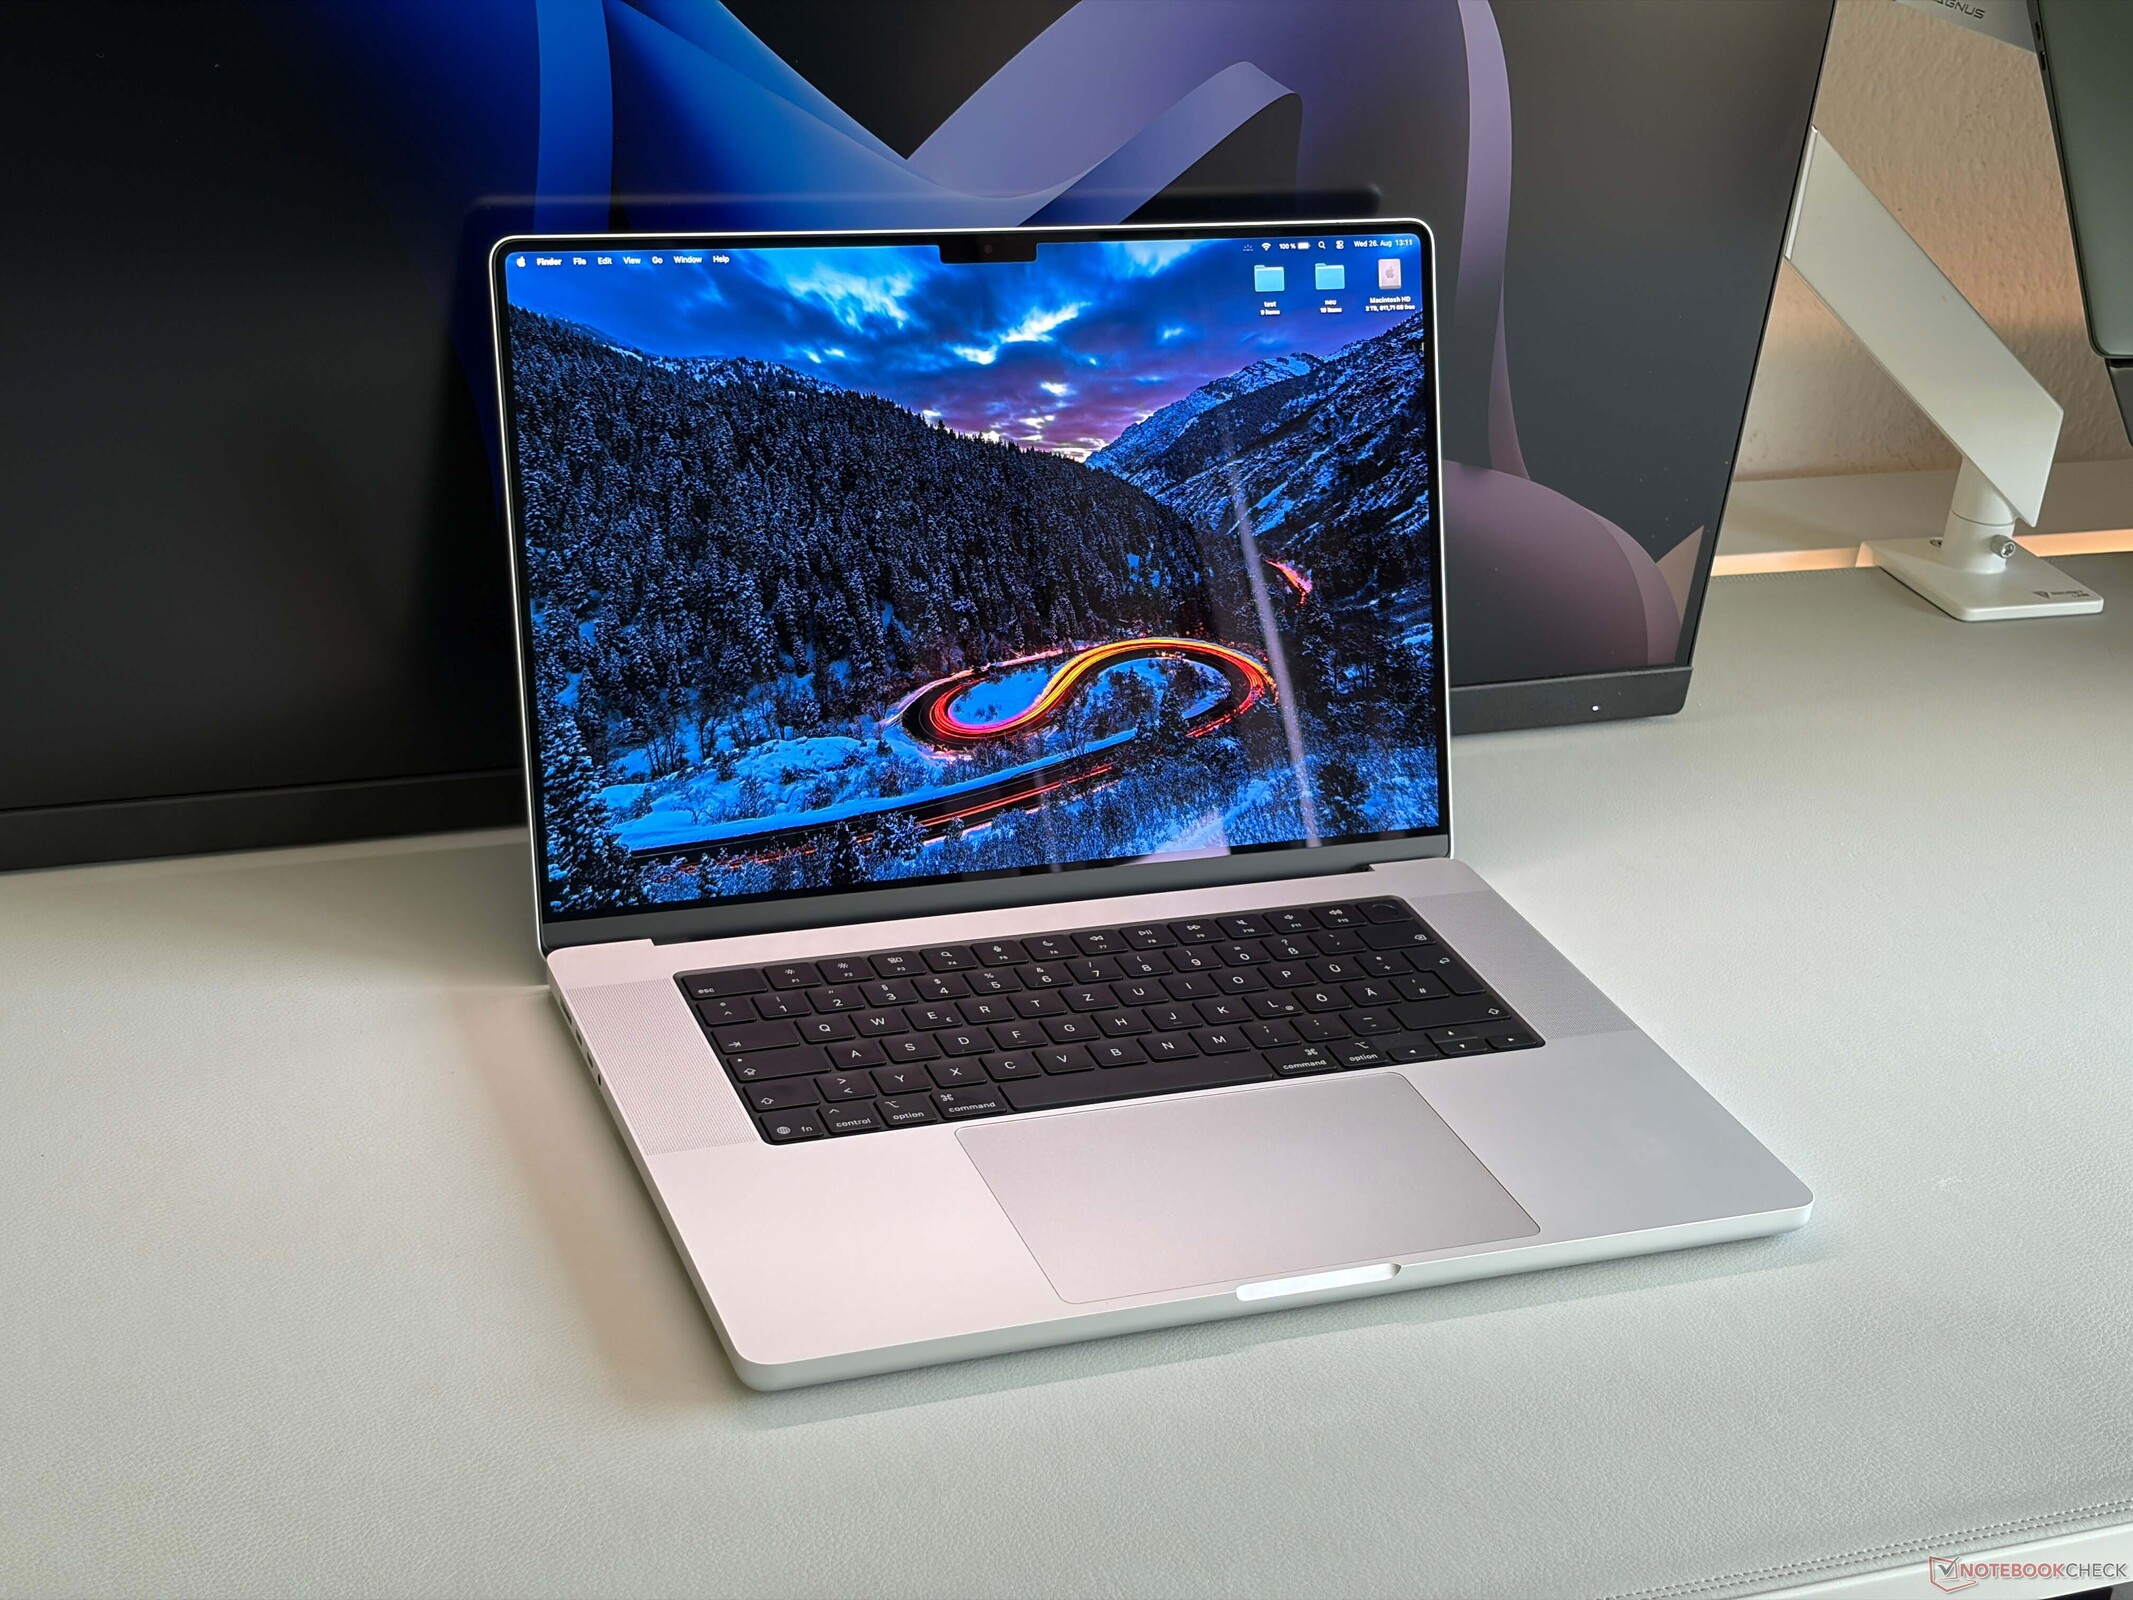
Verdict - MacBook Pro is still an excellent multimedia laptop, but starts to show its age
We already know that the 2026 MacBook Pro 16 is an excellent multimedia laptop from our review of the M5 Pro unit a couple of months ago, but the larger 16-inch chassis handles the powerful M5 Max SoC much better compared to the MacBook Pro 14 and the performance is both better as well as more consistent. However, even the MacBook Pro 16 cannot utilize the full potential of the M5 Max and the cooling system can only handle 70 Watts. While this was sufficient for the older chips like the M1 Max and M2 Max 4 or 5 years ago, it simply is not enough today. Combined with the insufficient power adapter and limitations regarding the power delivery (the battery level drops by 12 % in one hour under full load, even with more powerful PSUs), it simply shows that the current chassis and cooling unit need a redesign.
Don't get us wrong, the MacBook Pro 16 is still a very powerful system and the cooling unit is usually very quiet or even inaudible, but considering the prices you must pay, these limitations are not ideal. This is also the case for the Wi-Fi 7 module, which only supports 160 MHz, so transfer rates are capped at around 2 Gbps (instead of 3-4 Gbps on 320 MHz modules).
The Mini-LED panel on the other hand can still easily keep up with the best tandem OLED panels in terms of image impression, brightness and color accuracy. You can also get a matte version and if rumors are true, there will soon be a MacBook Pro with an OLED touchscreen. All in all, the MacBook Pro 16 with the M5 Max is one of the most powerful and complete packages you can get in the multimedia segment, despite the drawbacks.
Pros
Cons
Price and Availability
You can get our review unit with the M5 Max, 48 GB RAM and 2 TB SSD storage for $4499 from Amazon.

Table of Contents
Specifications
Case, Connectivity & Input Devices
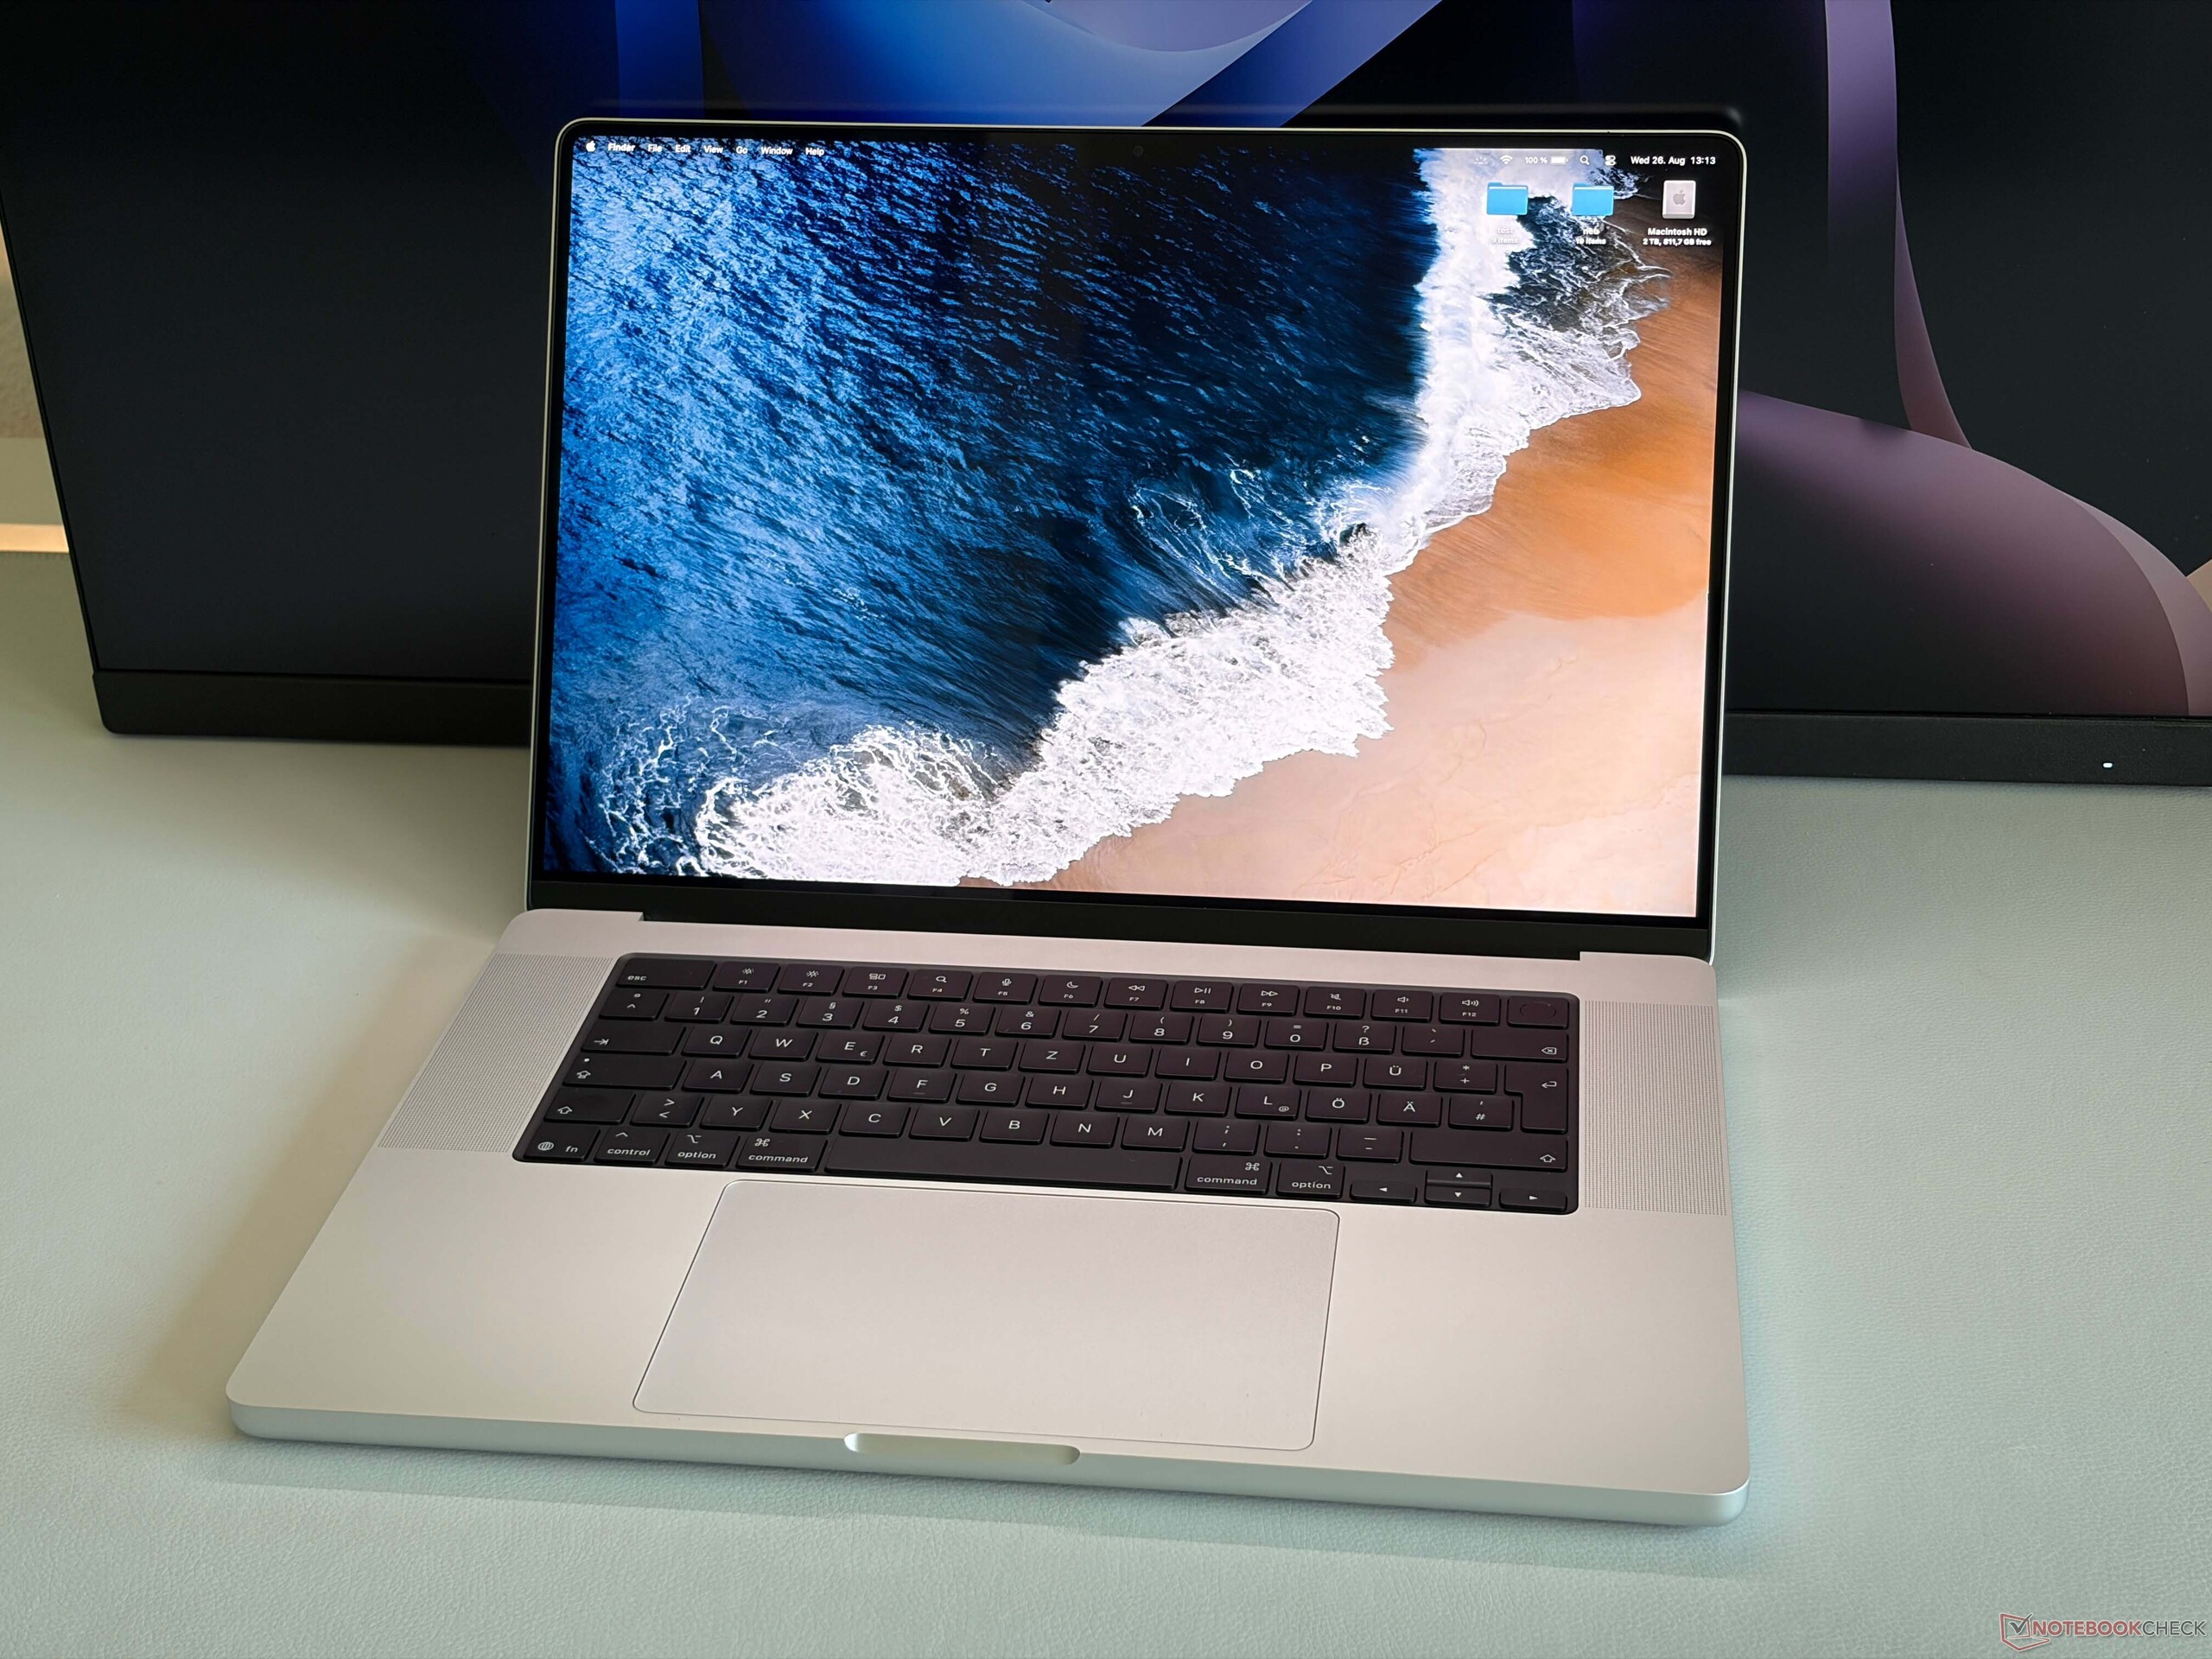
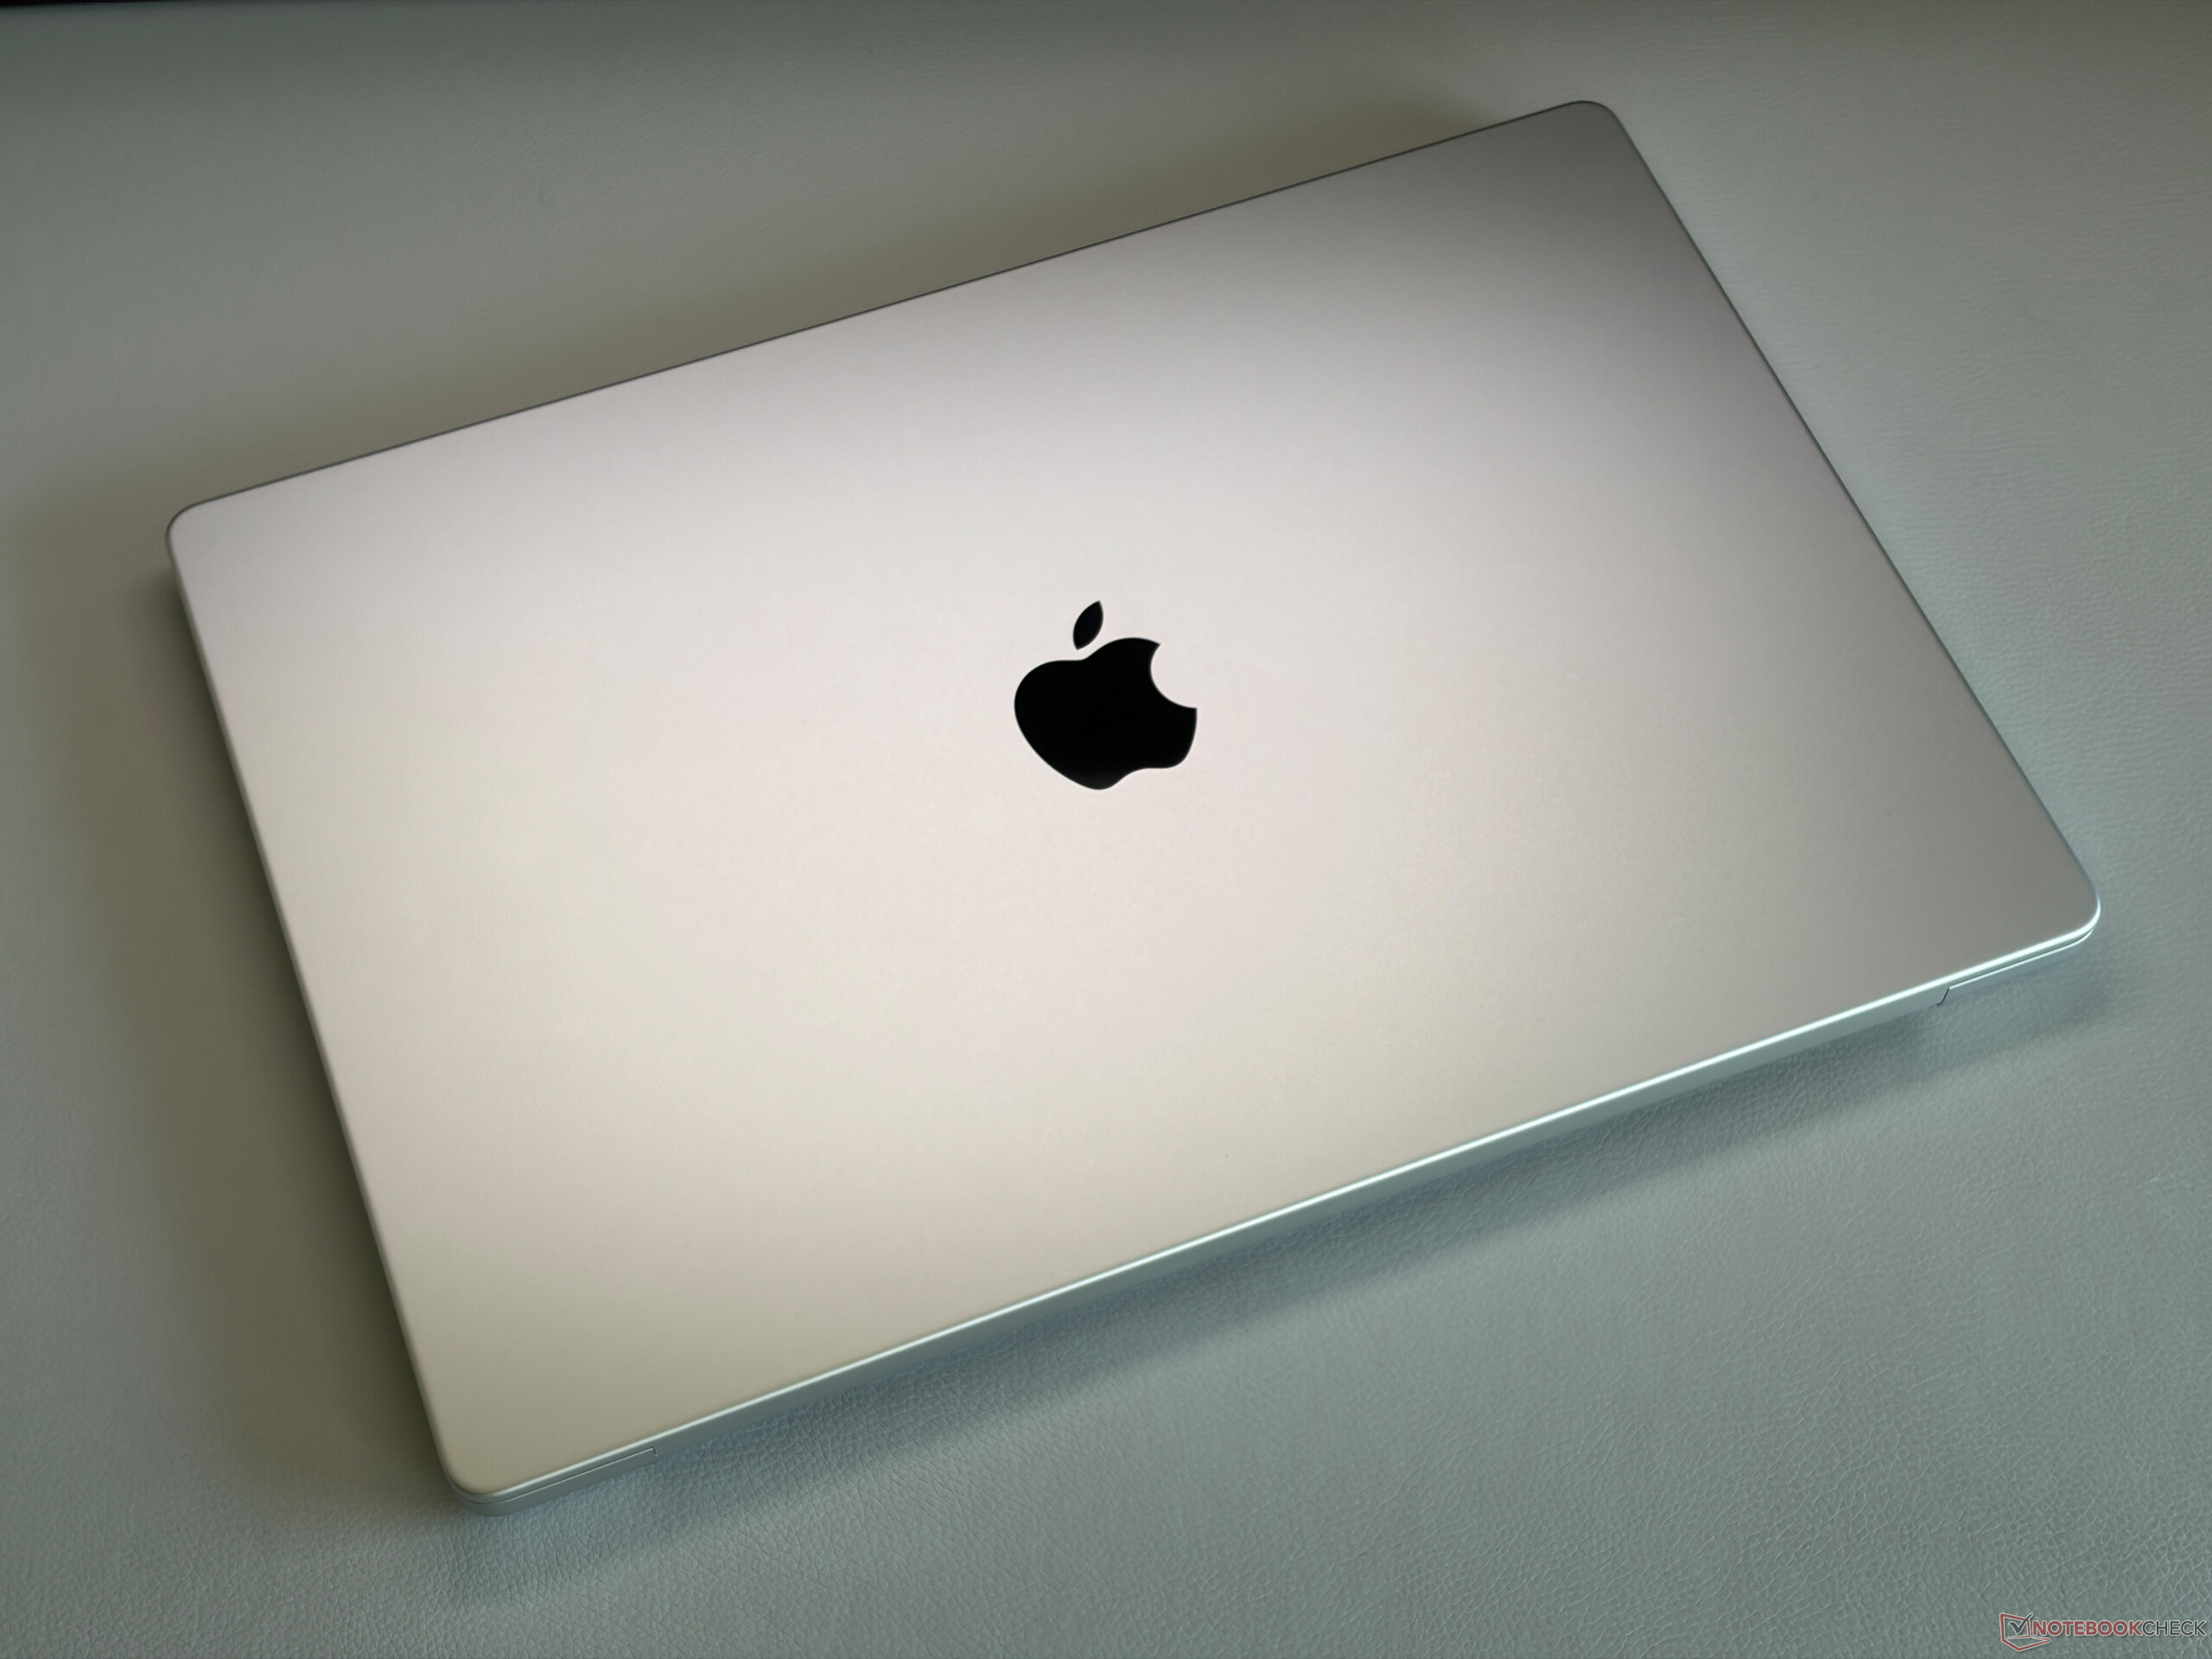
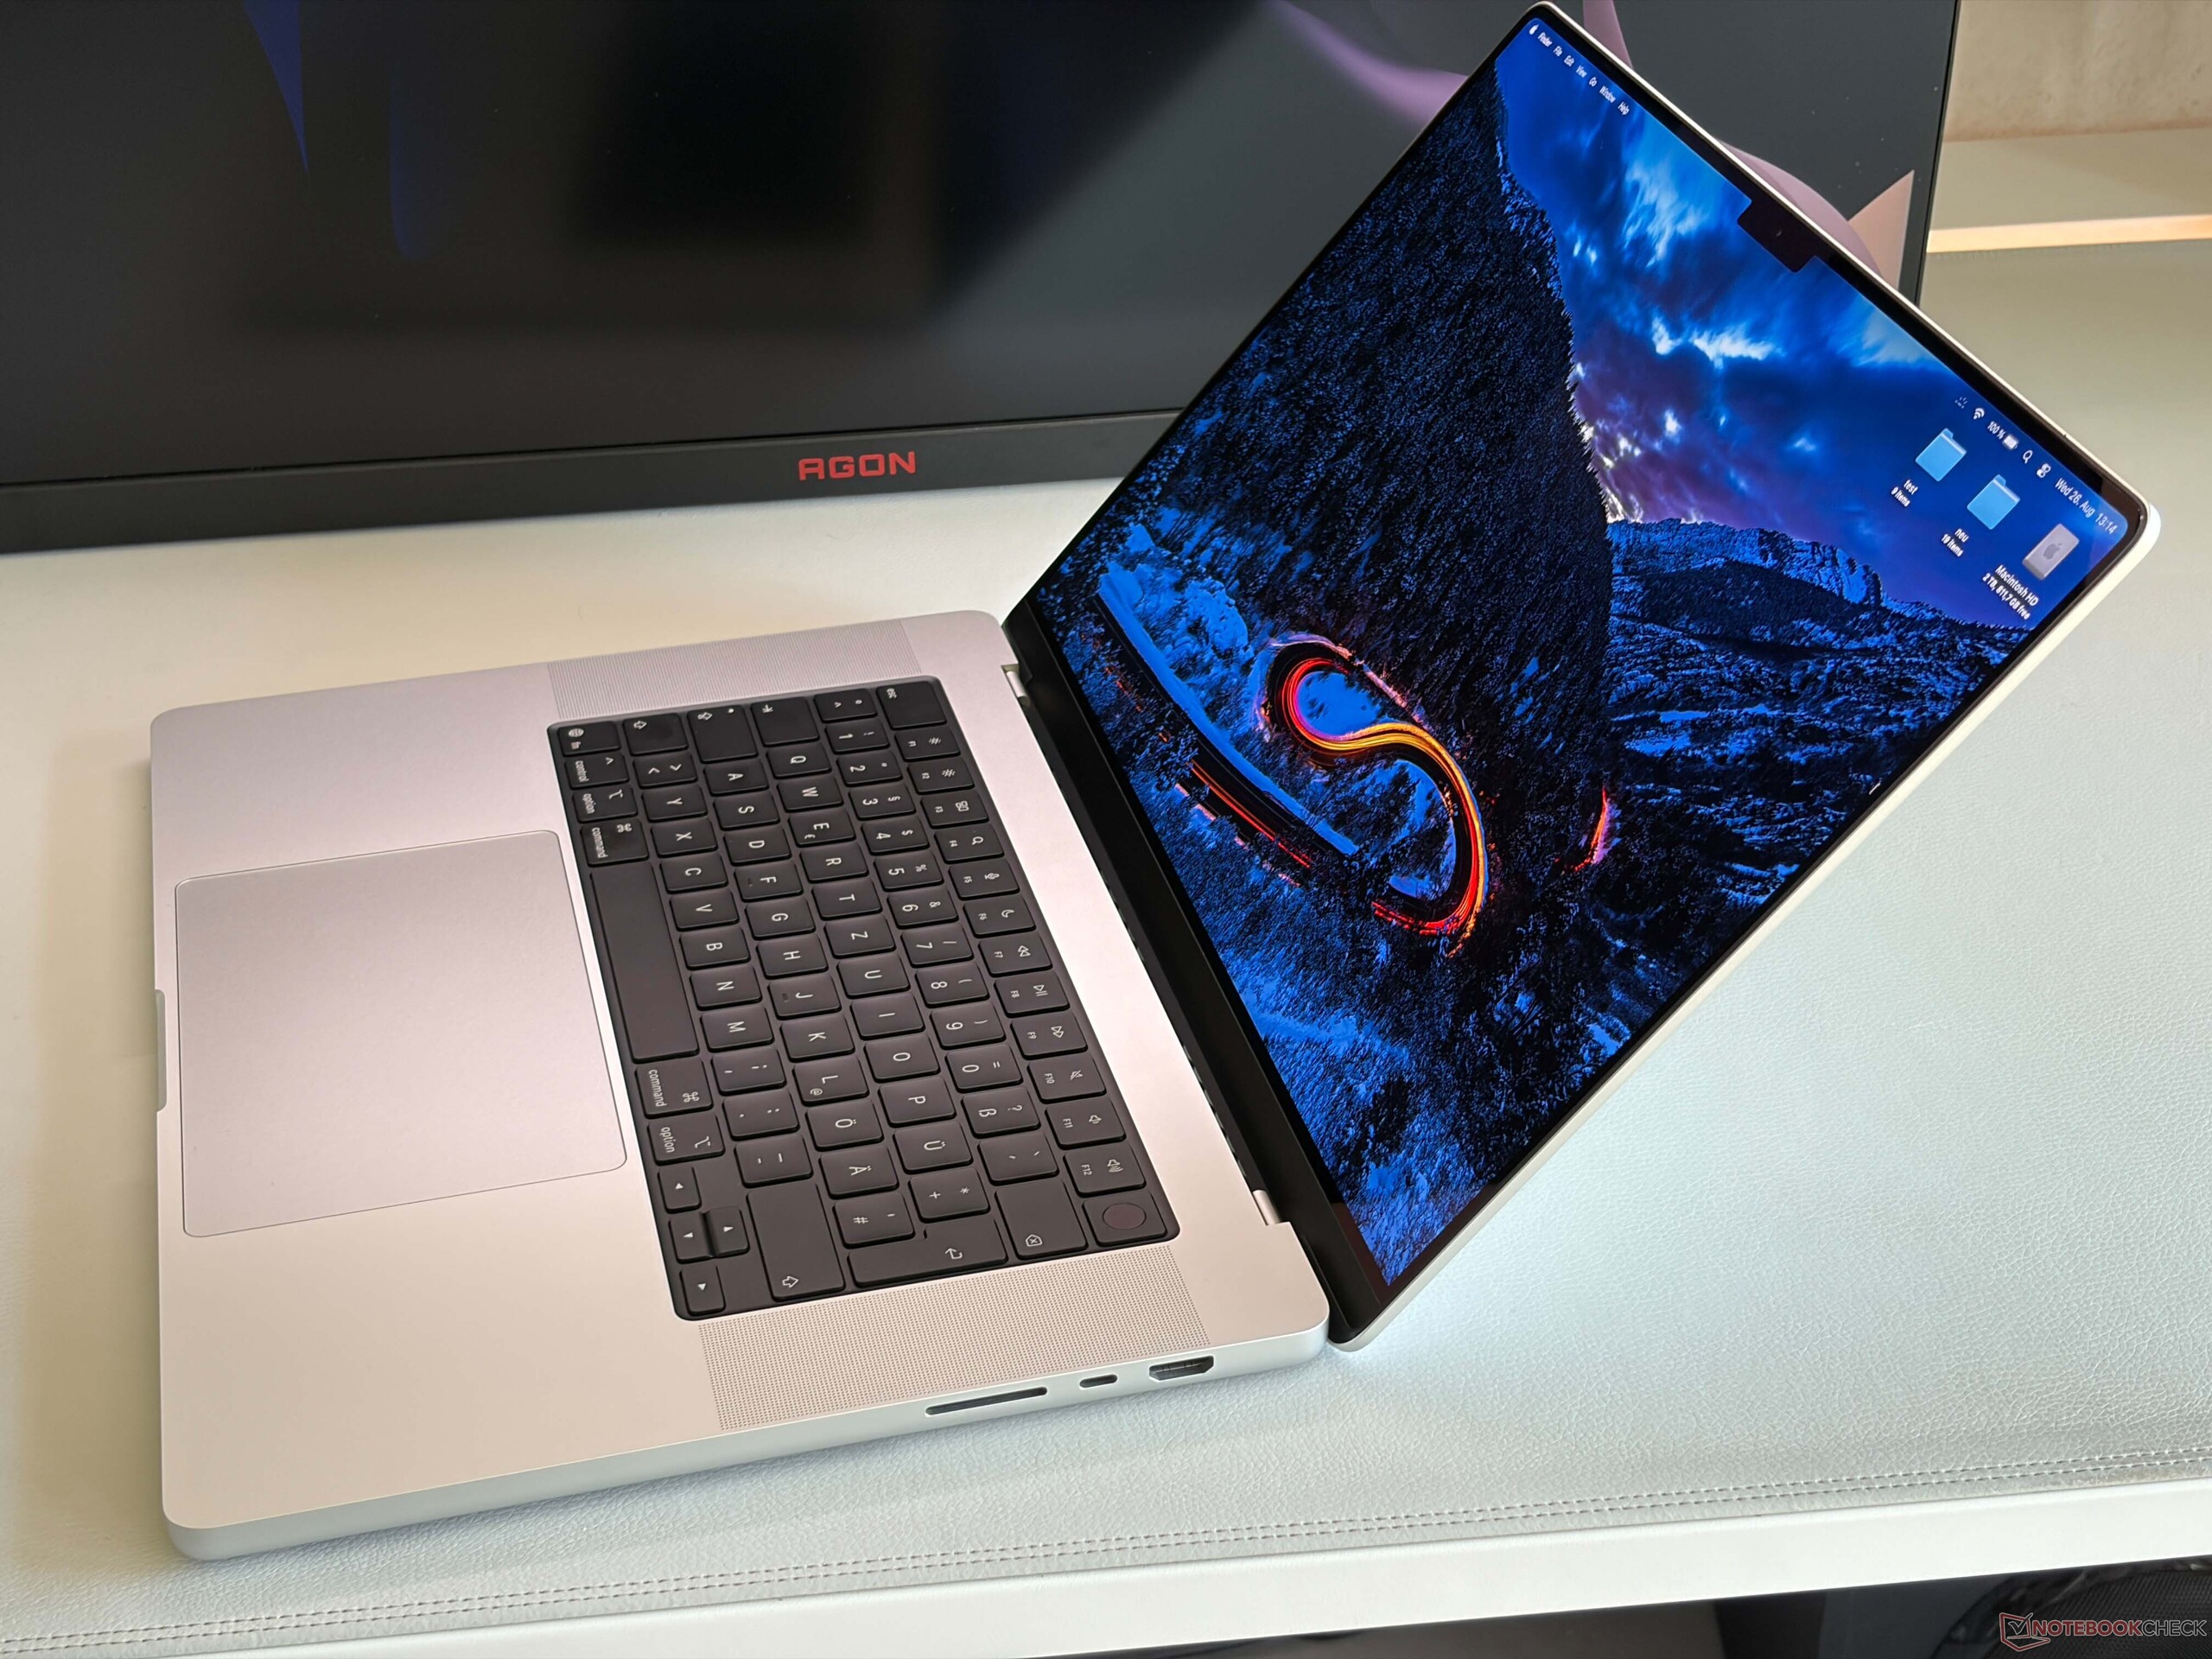
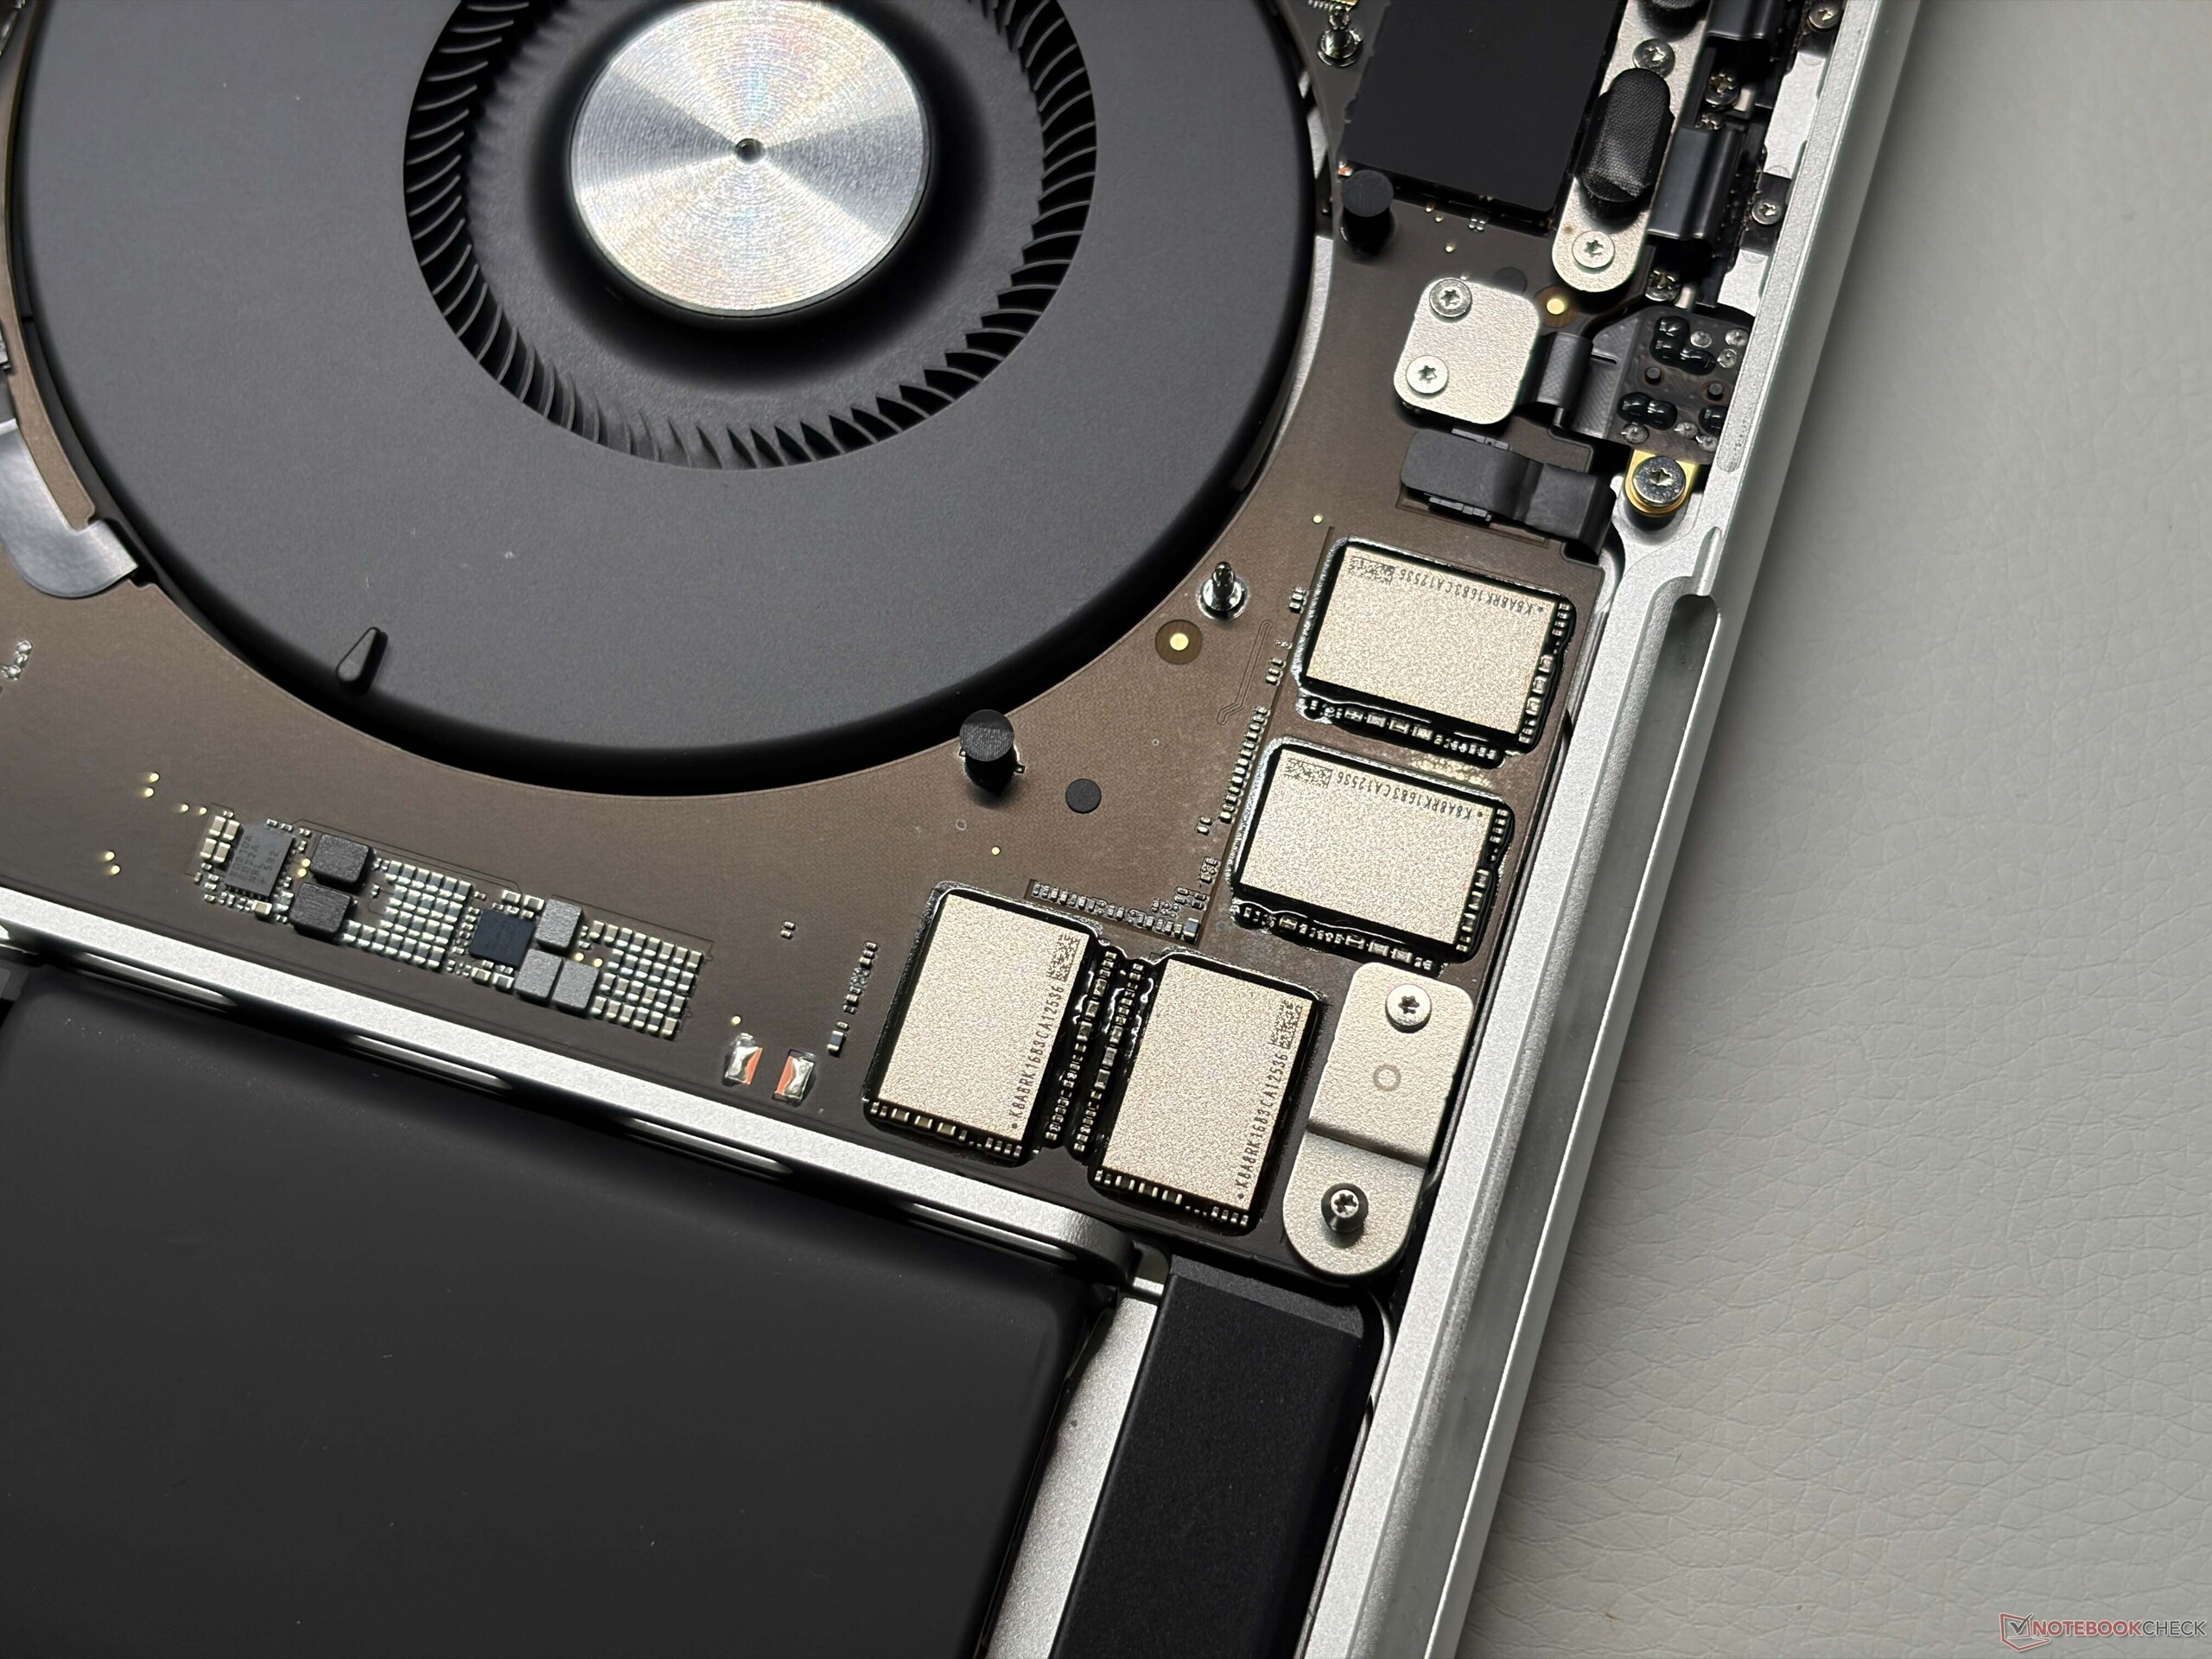
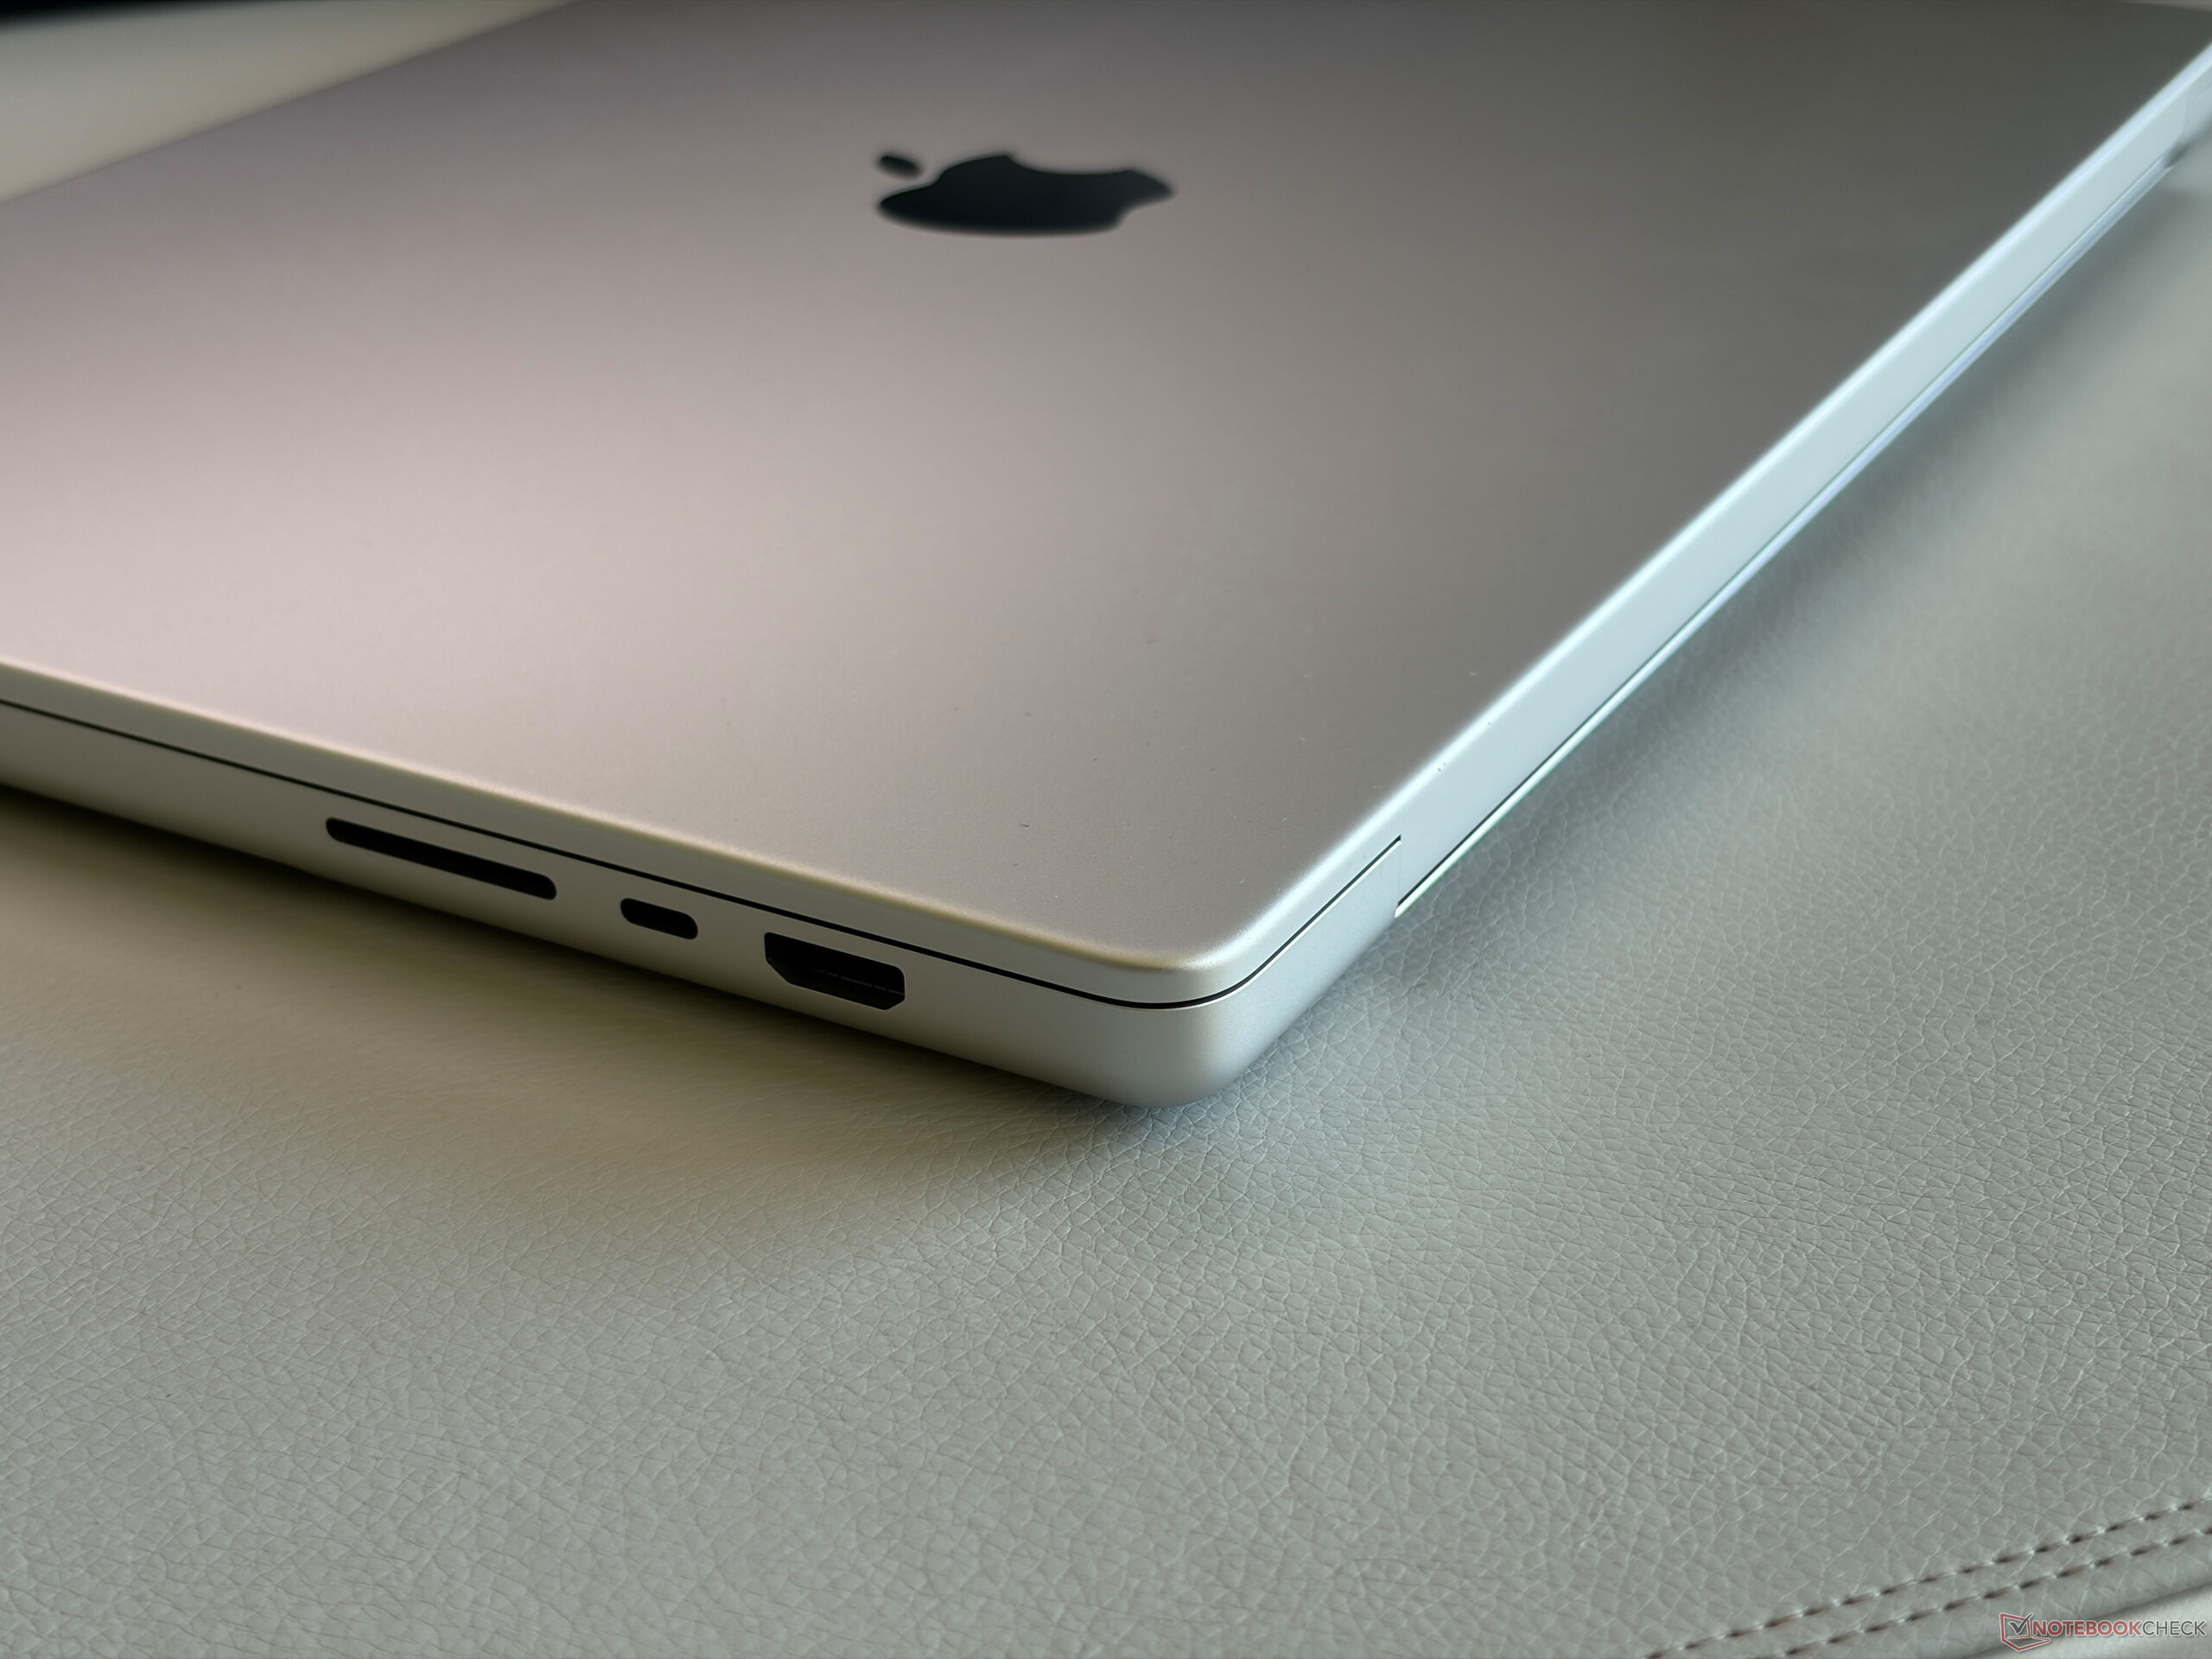
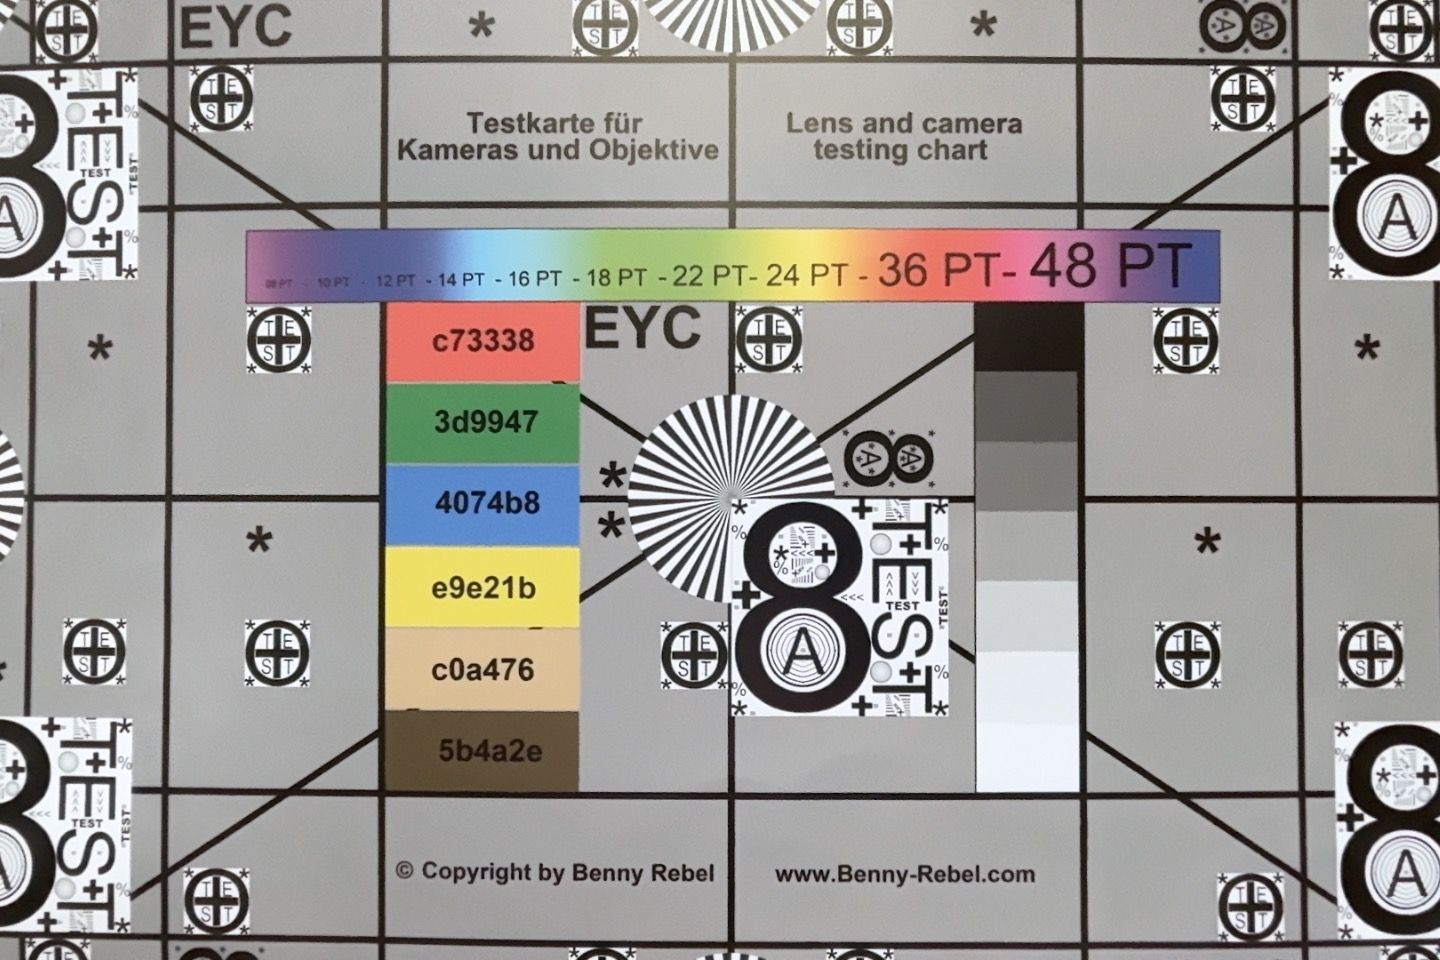
The chassis is familiar from previous generations and you get a high-quality aluminum chassis with good input devices as well as Thunderbolt 5 connectivity (three ports). However, the chassis is also pretty heavy at 2.14 kg and there are lighter alternatives. Maintenance options are still limited to the cleaning of the fans, because all components are soldered. Apple's N1 chip provides Bluetooth 6 as well as Wi-Fi 7, but it is limited to 160 MHz so transfer rates are capped at around 2 Gbps. The SDXC-card reader is fast, but does not support the SD-Express standard. The 12 MP CenterStage webcam works well, but the resolution of pictures and videos is low and it still does not support Face-ID.

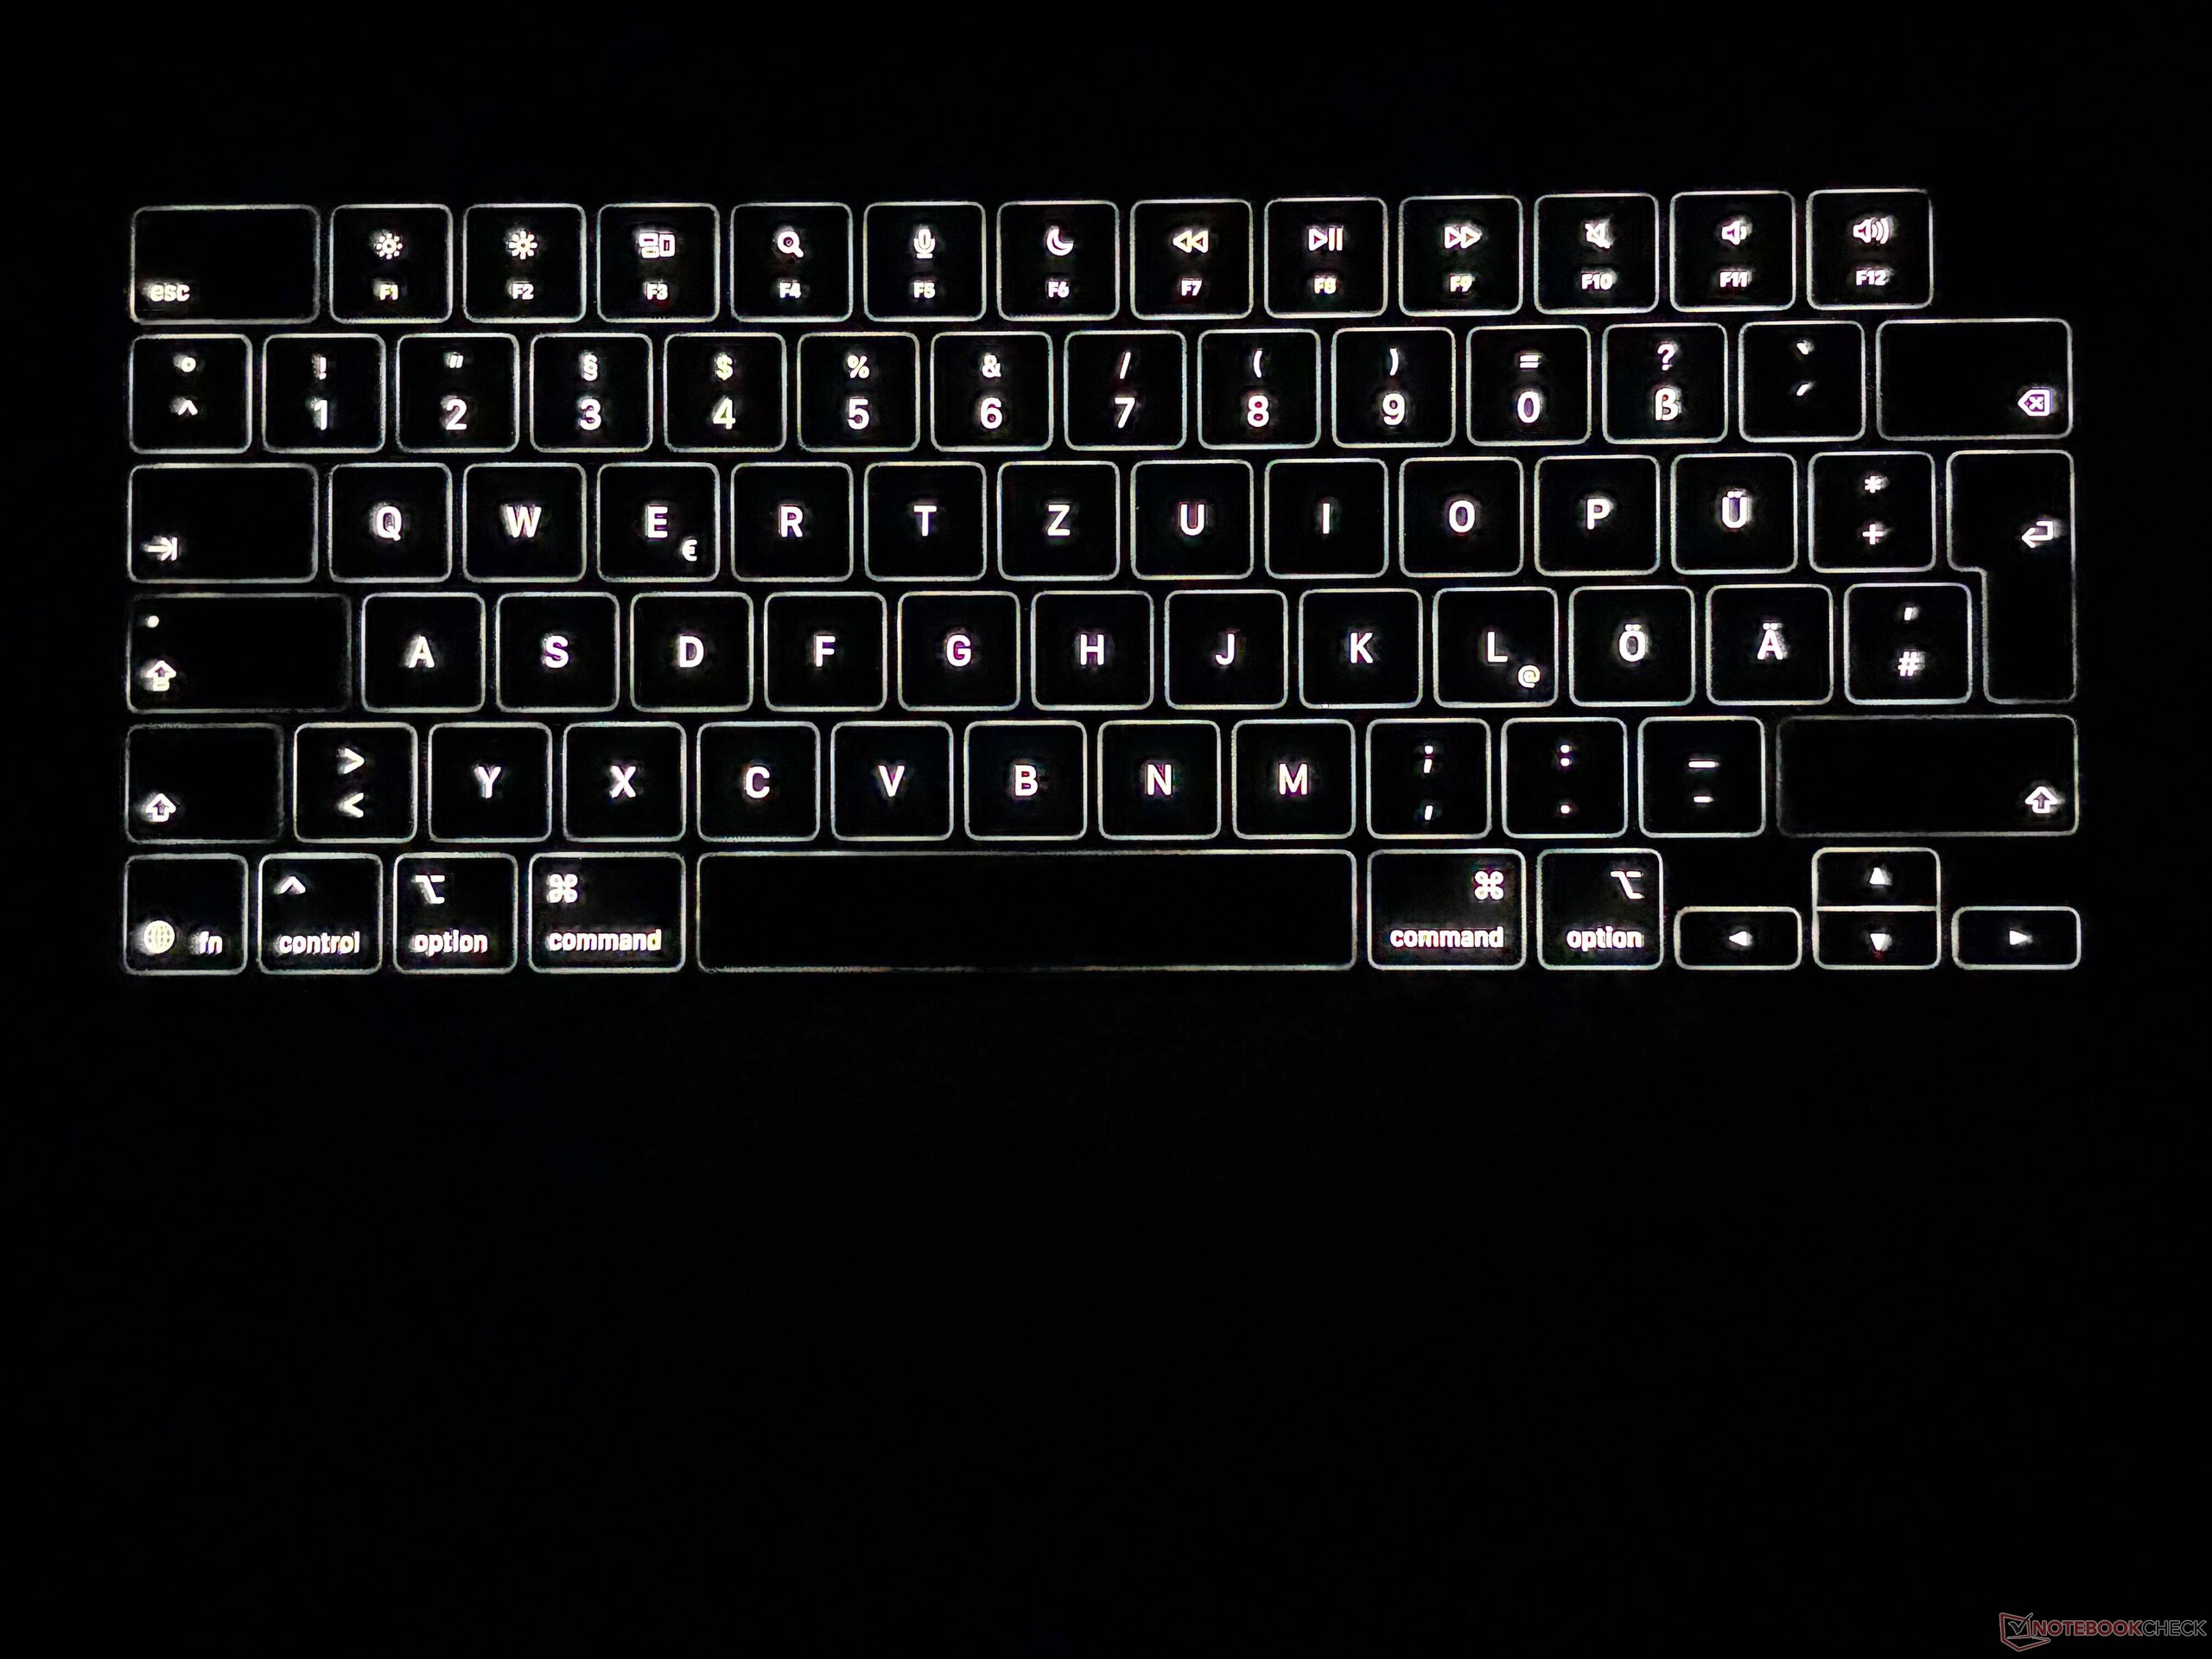
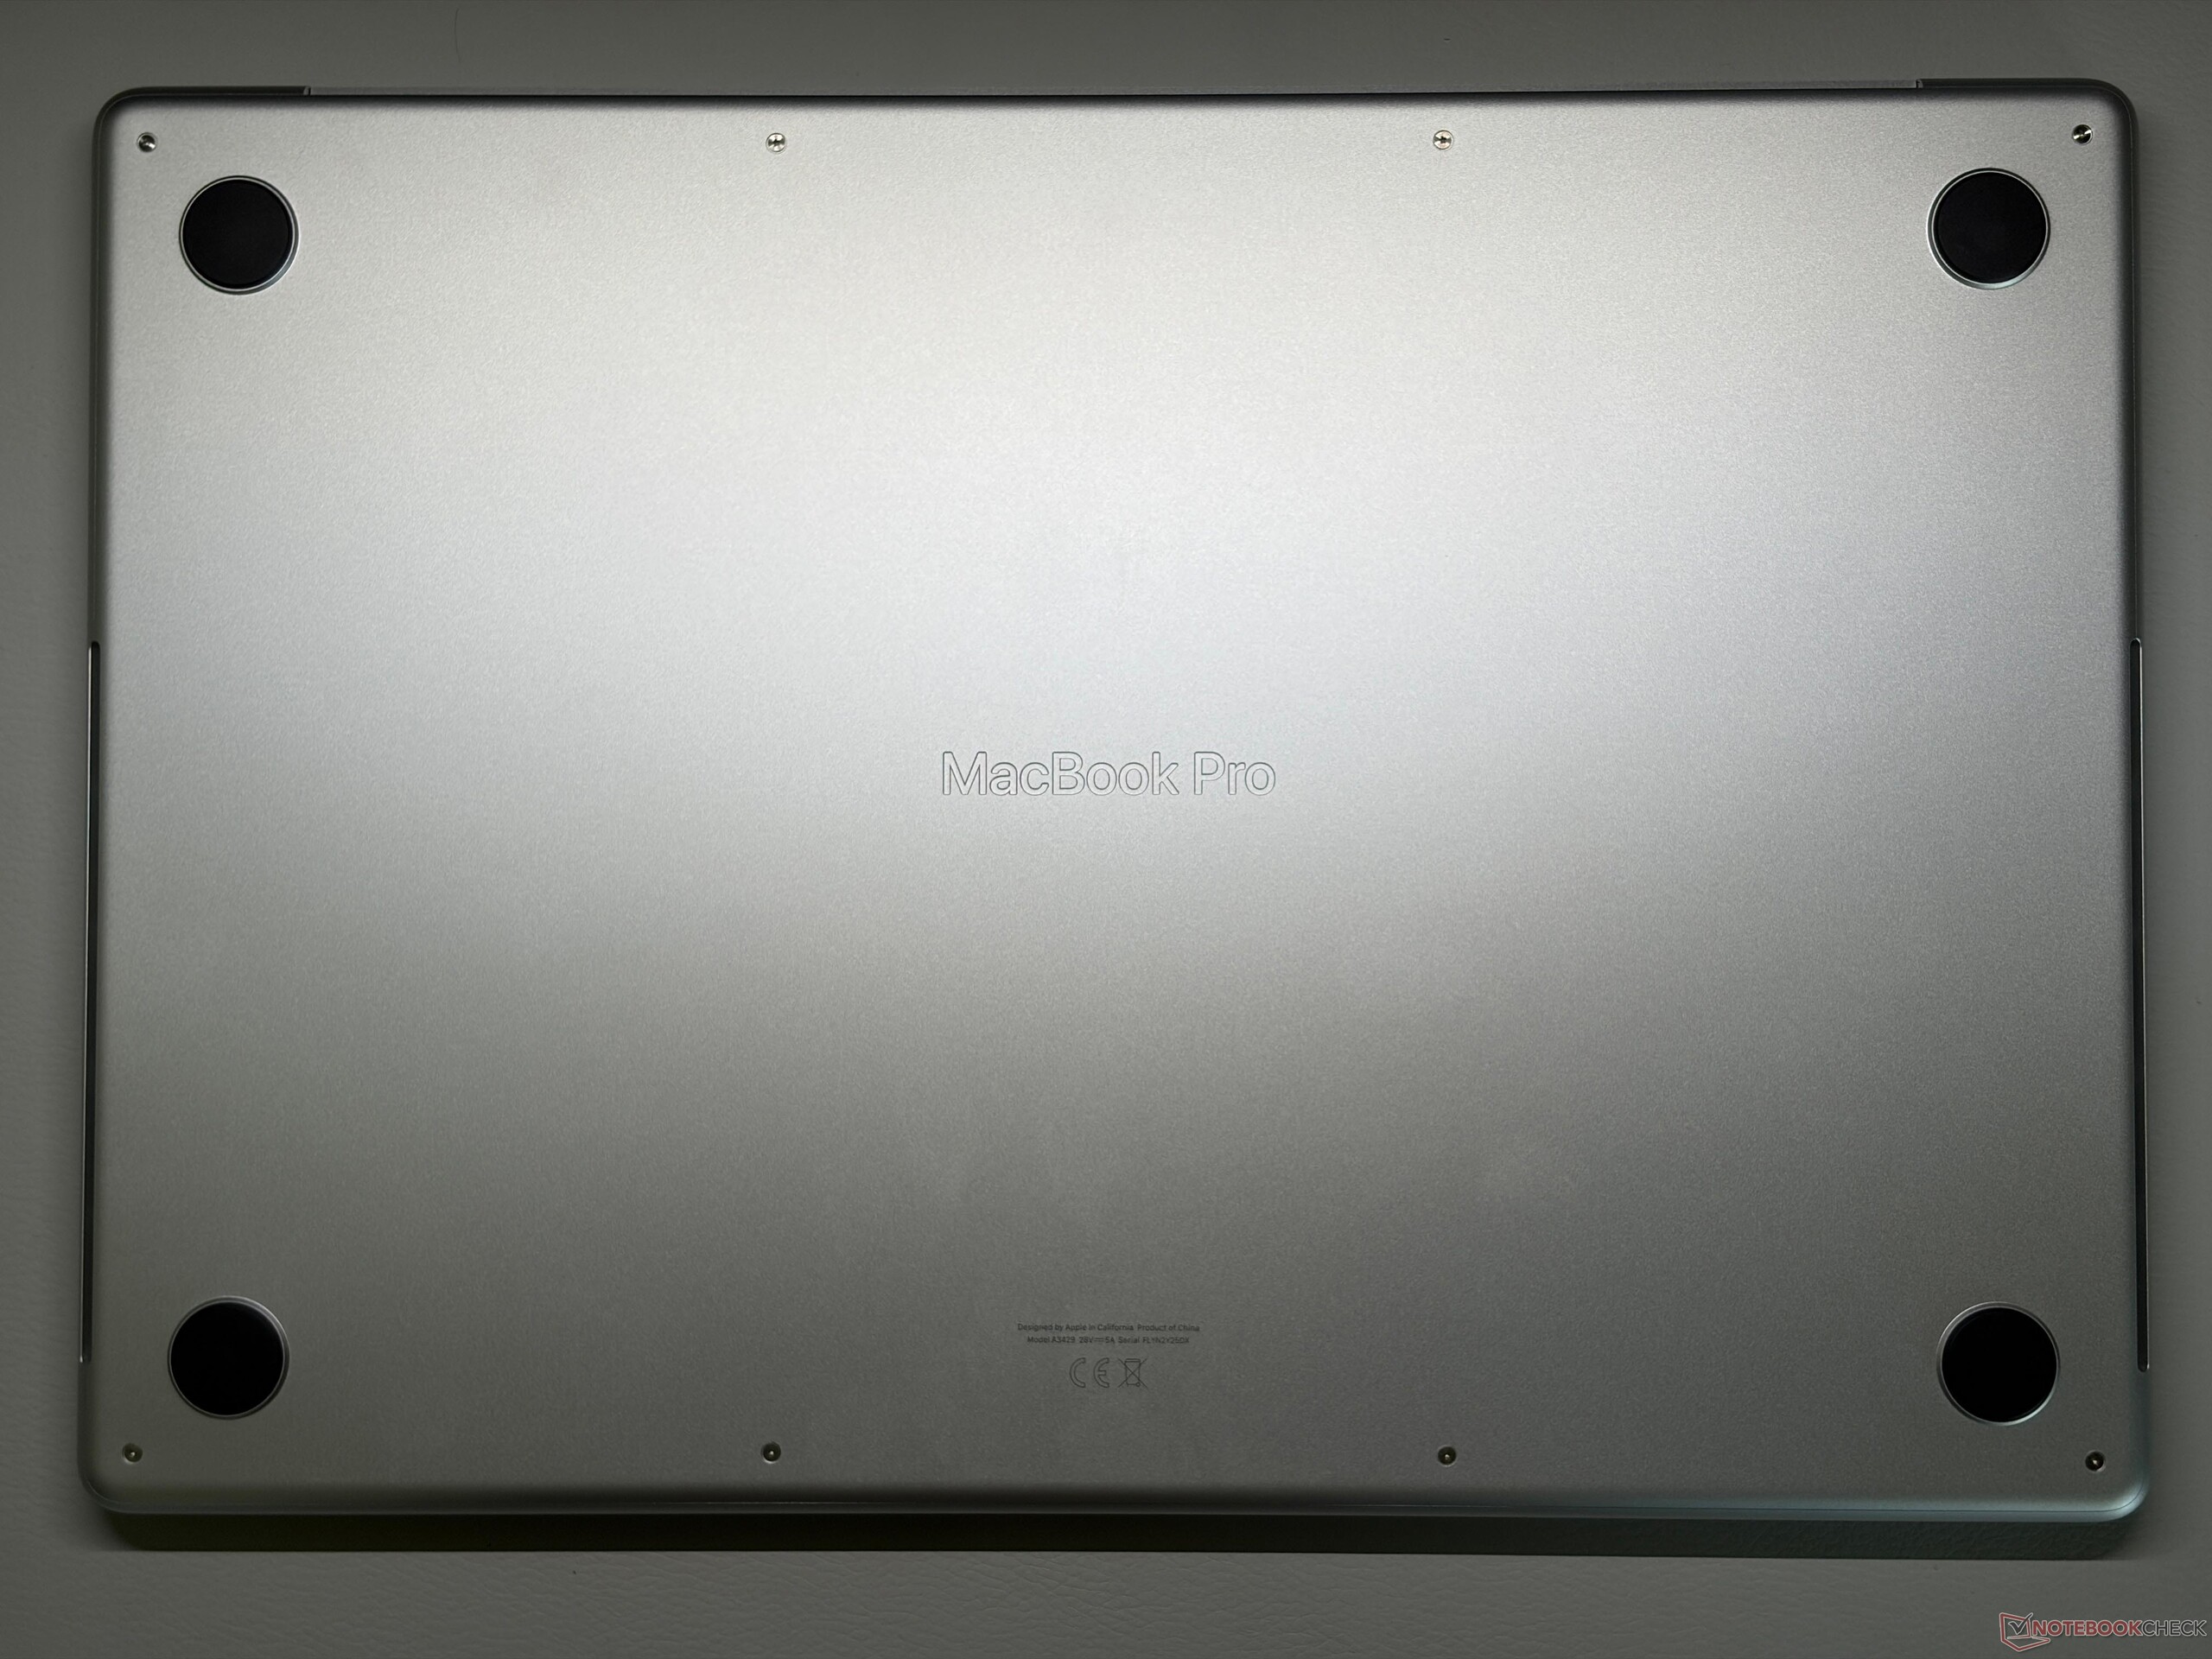
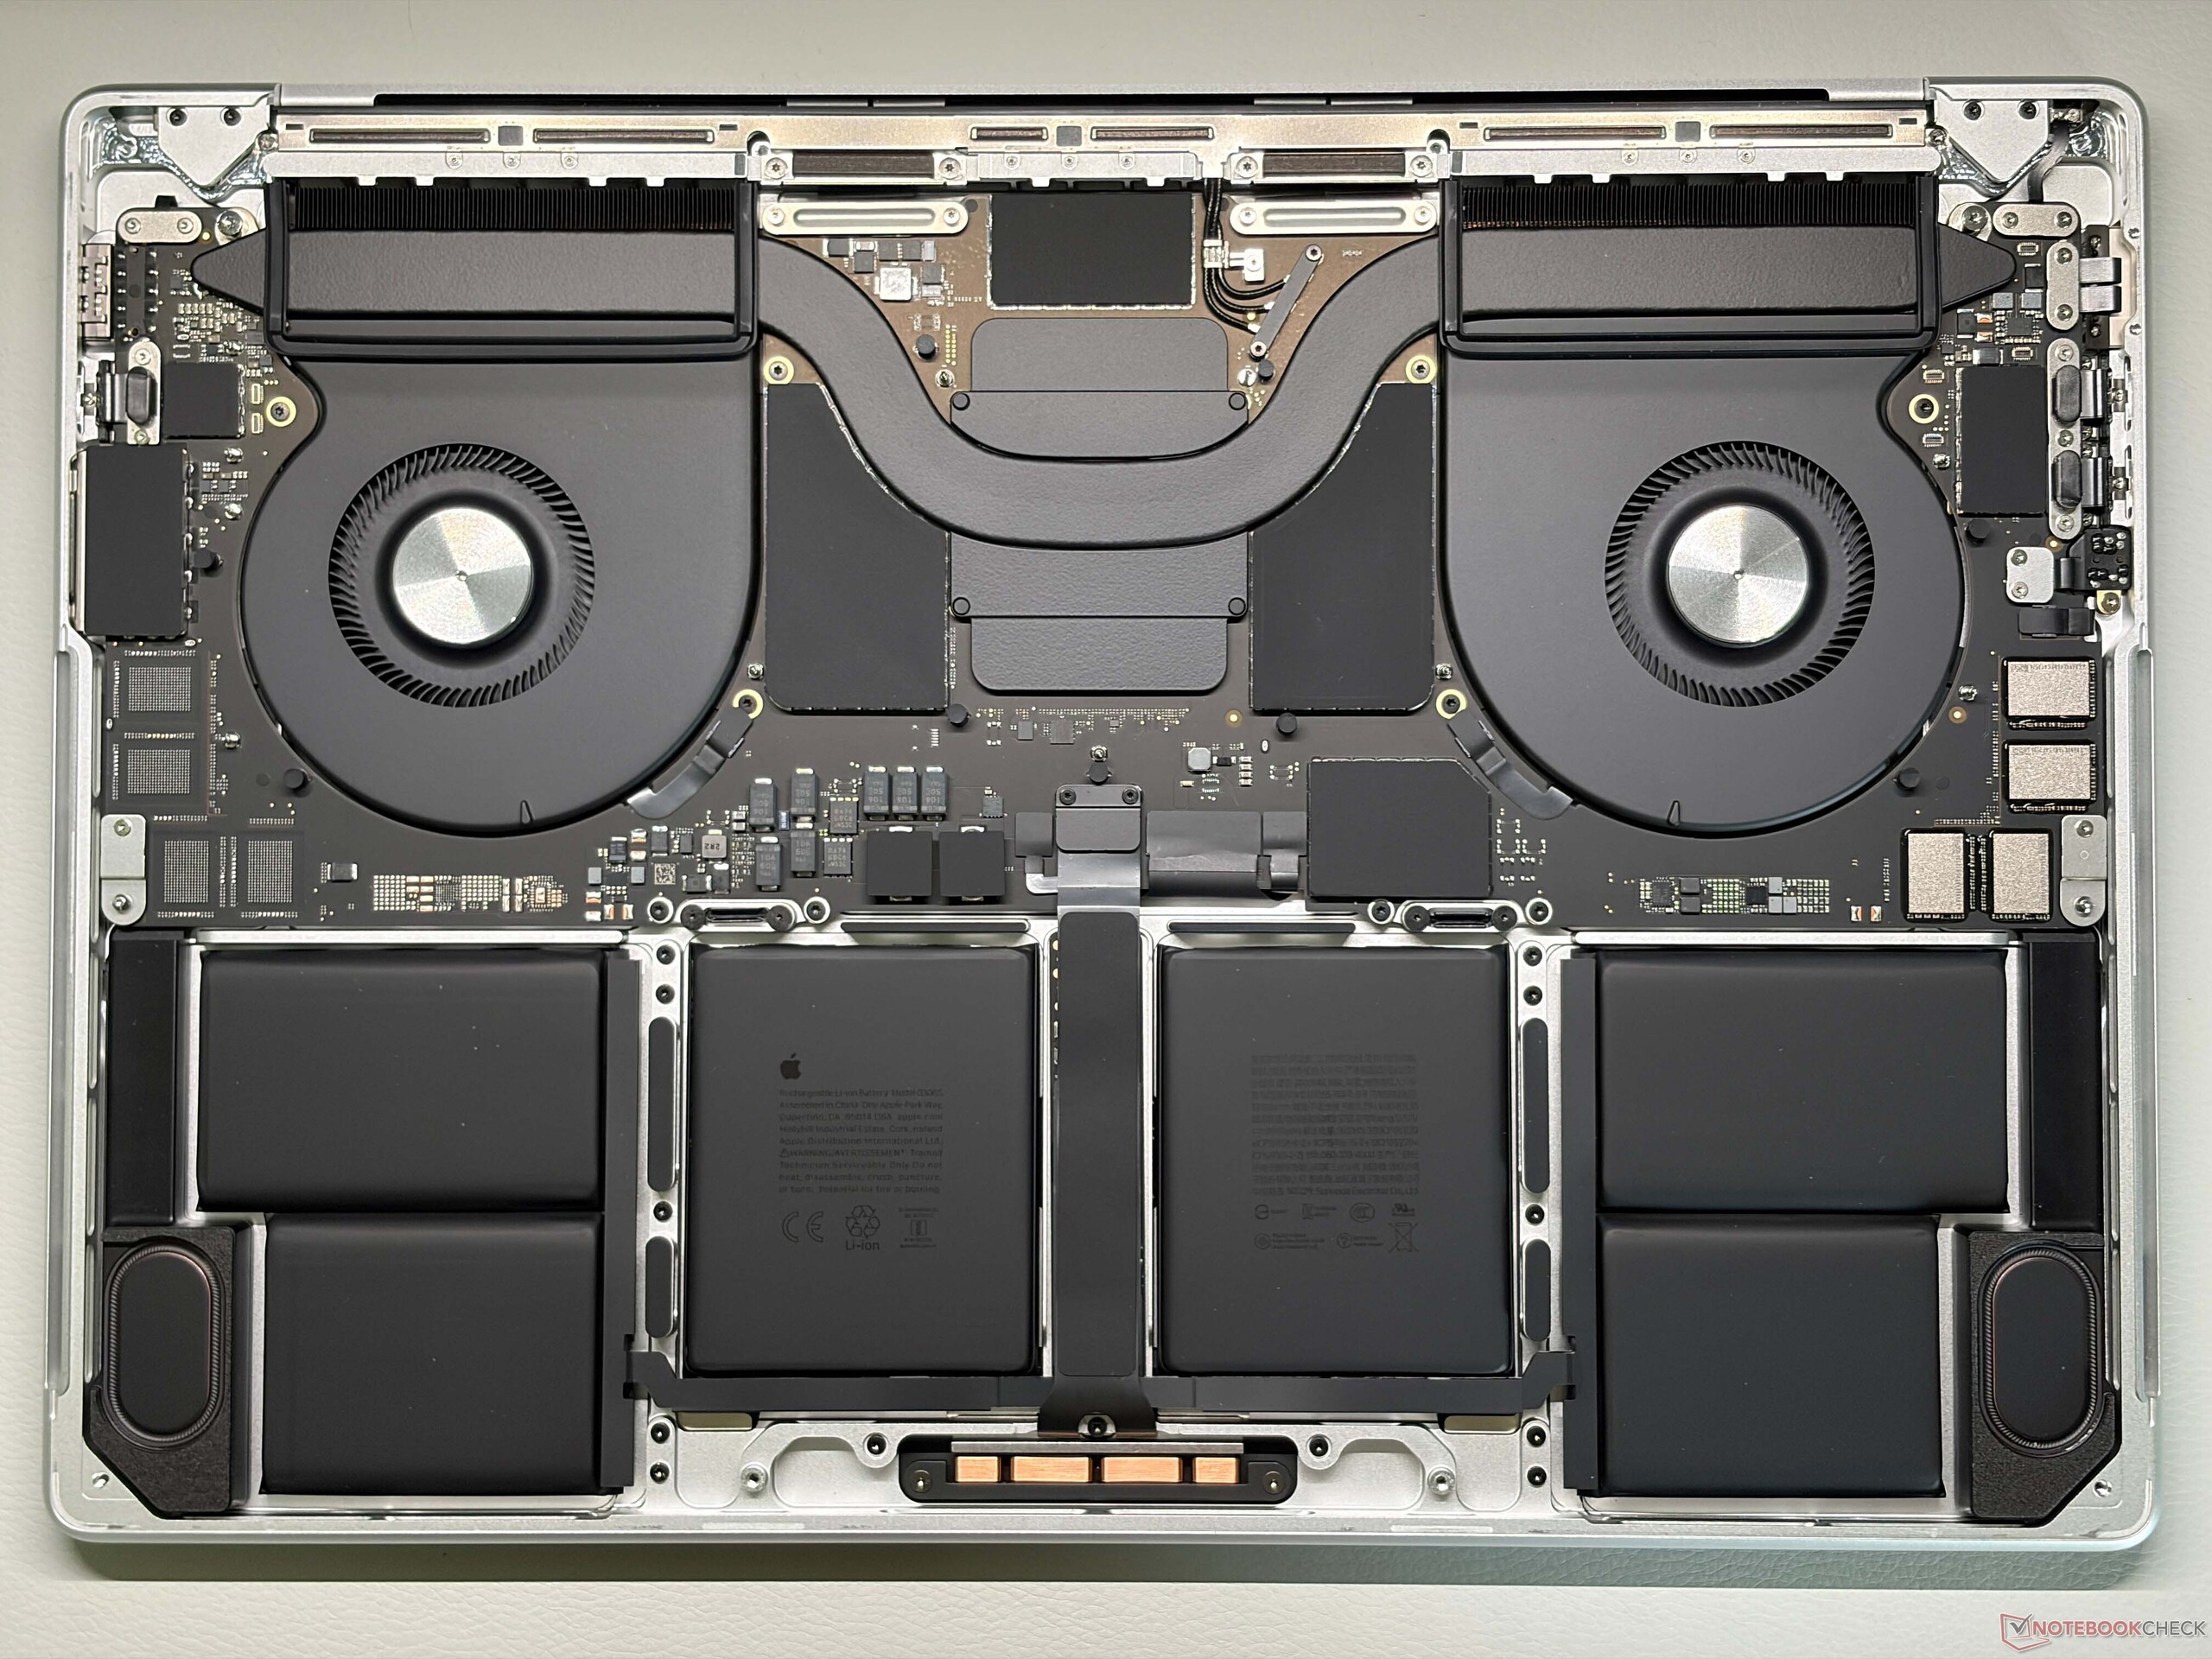
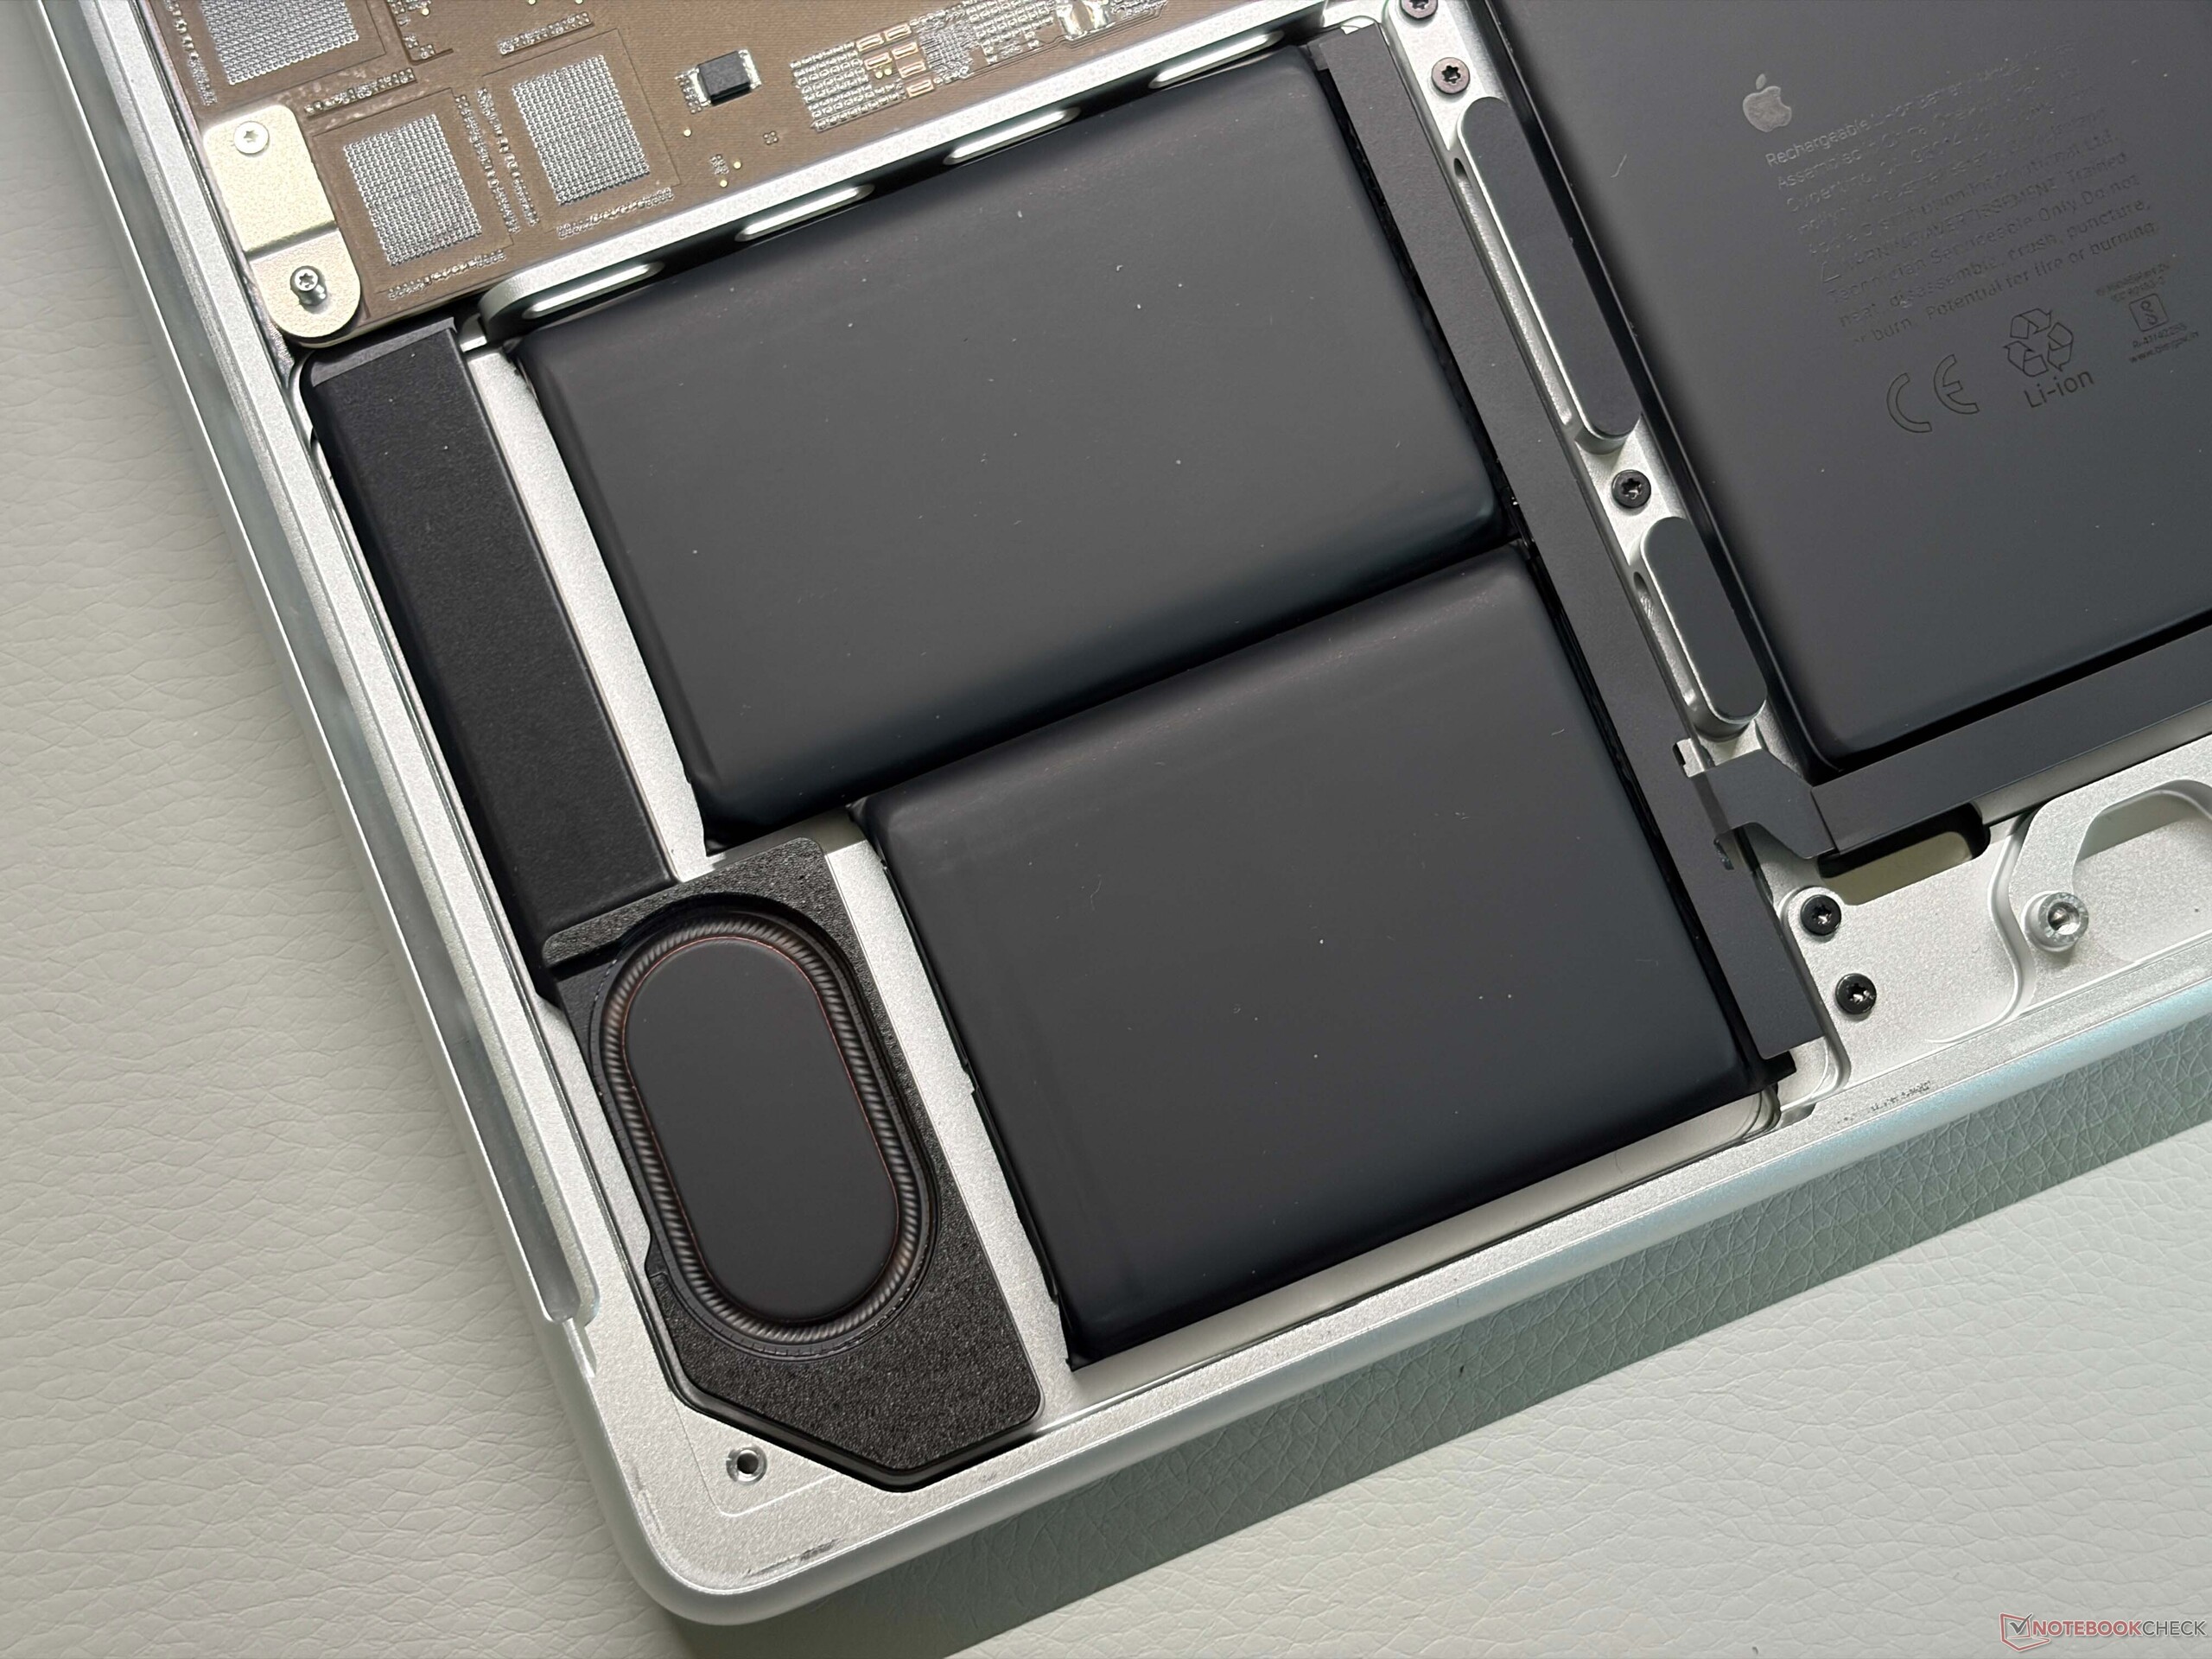


| SD Card Reader | |
| average JPG Copy Test (av. of 3 runs) | |
| Lenovo ThinkPad T1g Gen 8 21TD003GE (ADATA SD8.0 Express 512 GBAV Pro V60) | |
| Lenovo ThinkPad T1g Gen 8 21TD003GE (Angelbird AV Pro V60) | |
| Apple MacBook Pro 16 2026 M5 Max (Angelbird AV Pro V60) | |
| Average of class Multimedia (22.3 - 567, n=34, last 2 years) | |
| Apple MacBook Pro 16 2026 M5 Pro (Angelbird AV Pro V60) | |
| Lenovo ThinkBook 16p G6 21R00013GE (Angelbird AV Pro V60) | |
| Lenovo Yoga Pro 9i 16 RTX 5070 (Angelbird AV Pro V60) | |
| Samsung Galaxy Book6 Ultra (Angelbird AV Pro V60) | |
| maximum AS SSD Seq Read Test (1GB) | |
| Lenovo ThinkPad T1g Gen 8 21TD003GE (ADATA SD8.0 Express 512 GB) | |
| Lenovo ThinkPad T1g Gen 8 21TD003GE (Angelbird AV Pro V60) | |
| Apple MacBook Pro 16 2026 M5 Max (Angelbird AV Pro V60) | |
| Apple MacBook Pro 16 2026 M5 Pro (Angelbird AV Pro V60) | |
| Average of class Multimedia (37.3 - 1455, n=33, last 2 years) | |
| Lenovo Yoga Pro 9i 16 RTX 5070 (Angelbird AV Pro V60) | |
| Lenovo ThinkBook 16p G6 21R00013GE (Angelbird AV Pro V60) | |
| Samsung Galaxy Book6 Ultra (Angelbird AV Pro V60) | |
| Networking | |
| Apple MacBook Pro 16 2026 M5 Max | |
| iperf3 receive Wi-Fi6/7 RT-BE96U | |
| iperf3 transmit Wi-Fi6/7 RT-BE96U | |
| Apple MacBook Pro 16 2026 M5 Pro | |
| iperf3 transmit AXE11000 | |
| iperf3 receive AXE11000 | |
| Dell XPS 16 Core Ultra X7 358H | |
| iperf3 transmit AXE11000 | |
| iperf3 receive AXE11000 | |
| iperf3 transmit AXE11000 6GHz | |
| iperf3 receive AXE11000 6GHz | |
| Samsung Galaxy Book6 Ultra | |
| iperf3 transmit AXE11000 | |
| iperf3 receive AXE11000 | |
| Lenovo ThinkPad T1g Gen 8 21TD003GE | |
| iperf3 transmit AXE11000 | |
| iperf3 receive AXE11000 | |
| Lenovo ThinkBook 16p G6 21R00013GE | |
| iperf3 transmit AXE11000 | |
| iperf3 receive AXE11000 | |
| Lenovo Yoga Pro 9i 16 RTX 5070 | |
| iperf3 transmit AXE11000 | |
| iperf3 receive AXE11000 | |


Display - Gorgeous Mini-LED panel
Apple still uses the same Mini-LED panel (16.2-inch, 3456 x 2204 pixels, 120 Hz, glossy, no touchscreen), which is also available in a matte version. Image quality is still impressive after many years and you get perfect blacks and very accurate colors. There is flickering due to the Mini-LED backlight, but the frequency is very high at almost 15 kHz, so there should not be any issues. We still have no accurate way of determining response times of Mini-LED panels due to the constant flickering, so the displayed results are not completely accurate. Keep in mind that the panel itself is an IPS screen, so response times will always be slower compared to OLED panels. In practice, however, we did not notice any issues with ghosting.
In terms of brightness, the Mini-HDR panel can still easily keep up with the best tandem OLED panels on the market. We determined an SDR brightness close to 700 nits without the light sensor and up to 1164 nits when the sensor is active. For HDR contents, we measured up to 1737 nits and 1325 nits for a completely white image. HDR handling in macOS is also still superior to Windows. The panel covers the sRGB and P3 color spaces completely and color accuracy is excellent in our analysis with the professional CalMAN software, but keep in mind that the brightness is limited by macOS when you work in the sRGB color space.



| |||||||||||||||||||||||||
Brightness Distribution: 93 %
Center on Battery: 710 cd/m²
Contrast: ∞:1 (Black: 0 cd/m²)
ΔE ColorChecker Calman: 1.1 | ∀{0.5-29.43 Ø4.69}
ΔE Greyscale Calman: 2.7 | ∀{0.09-98 Ø4.94}
88.2% AdobeRGB 1998 (Argyll 3D)
100% sRGB (Argyll 3D)
99.3% Display P3 (Argyll 3D)
Gamma: 2
CCT: 6760 K
| Apple MacBook Pro 16 2026 M5 Max Mini-LED, 3456x2234, 16.2", 120 Hz | Lenovo Yoga Pro 9i 16 RTX 5070 ATNA60KA01-0, OLED, 3200x2000, 16", 120 Hz | Asus ProArt P16 RTX 5090 ATNA60HC03-0, OLED, 3840x2400, 16", 120 Hz | Dell XPS 16 Core Ultra X7 358H LG Philips 160WV1, OLED, 3200x2000, 16", 120 Hz | Samsung Galaxy Book6 Ultra ATNA60HR05-0, OLED, 2880x1800, 16", 120 Hz | Lenovo ThinkPad T1g Gen 8 21TD003GE ATNA60KA02-0, Tandem-OLED, 3200x2000, 16", 120 Hz | Lenovo ThinkBook 16p G6 21R00013GE NE160QDM-NZB, IPS, 2560x1600, 16", 240 Hz | |
|---|---|---|---|---|---|---|---|
| Display | 0% | -2% | -15% | -9% | -3% | -2% | |
| HDR Peak Brightness (cd/m²) | 1737 | 1600 -8% | 1600 -8% | 518 -70% | 1182 -32% | 1530 -12% | |
| Display P3 Coverage (%) | 99.3 | 97.4 -2% | 98.9 0% | 99.5 0% | 97 -2% | 98.8 -1% | 96.7 -3% |
| sRGB Coverage (%) | 100 | 100 0% | 100 0% | 100 0% | 99.9 0% | 100 0% | 99.8 0% |
| AdobeRGB 1998 Coverage (%) | 88.2 | 96.8 10% | 88.6 0% | 96.5 9% | 85.3 -3% | 88.9 1% | 86.5 -2% |
| Response Times | 91% | 85% | 87% | 62% | 91% | 78% | |
| Response Time Grey 50% / Grey 80% * (ms) | 43 ? | 0.27 ? 99% | 0.3 ? 99% | 0.65 ? 98% | 0.5 ? 99% | 0.26 ? 99% | 13.2 ? 69% |
| Response Time Black / White * (ms) | 41.2 ? | 0.37 ? 99% | 0.45 ? 99% | 0.87 ? 98% | 0.4 ? 99% | 0.42 ? 99% | 5.8 ? 86% |
| PWM Frequency (Hz) | 14880 | 1200 | 480 ? | 240.2 ? | 240 ? | 1200 ? | |
| PWM Amplitude * (%) | 90 | 22 76% | 38 58% | 31 66% | 100 -11% | 22 76% | |
| Screen | 29% | 27% | -95% | 1% | -31% | -47% | |
| Brightness middle (cd/m²) | 710 | 974 37% | 661 -7% | 395.4 -44% | 499 -30% | 578 -19% | 504 -29% |
| Brightness (cd/m²) | 682 | 979 44% | 663 -3% | 392 -43% | 505 -26% | 583 -15% | 504 -26% |
| Brightness Distribution (%) | 93 | 98 5% | 99 6% | 95 2% | 97 4% | 98 5% | 94 1% |
| Black Level * (cd/m²) | 0.37 | ||||||
| Colorchecker dE 2000 * | 1.1 | 0.9 18% | 0.5 55% | 3.69 -235% | 0.9 18% | 1.6 -45% | 2 -82% |
| Colorchecker dE 2000 max. * | 2.1 | 1.7 19% | 1.4 33% | 7.94 -278% | 2.1 -0% | 4.5 -114% | 4.7 -124% |
| Greyscale dE 2000 * | 2.7 | 1.3 52% | 0.6 78% | 1.9 30% | 1.6 41% | 2.6 4% | 3.2 -19% |
| Gamma | 2 110% | 2.21 100% | 2.19 100% | 2.28 96% | 2.22 99% | 2.19 100% | 2.22 99% |
| CCT | 6760 96% | 6751 96% | 6565 99% | 6274 104% | 6445 101% | 6527 100% | 7188 90% |
| Colorchecker dE 2000 calibrated * | 0.68 | 0.7 | |||||
| Contrast (:1) | 1362 | ||||||
| Total Average (Program / Settings) | 40% /
35% | 37% /
32% | -8% /
-28% | 18% /
12% | 19% /
6% | 10% /
-12% |
* ... smaller is better


Performance - M5 Max with 48 GB RAM


Testing Conditions
The table below shows the different power profiles and the performance figures. We used the High Power mode for our benchmarks and measurements to show the maximum performance potential of the M5 Max. The Automatic mode is still very powerful and we recommend it for everyday tasks. The results are identical on battery power.
| CPU (Watts) | CB2024 Multi (points) |
GPU (Watts) | Steel Nomad (points) |
Cyberpunk 2077 QHD Ultra (fps) |
TDP Stress test CPU&GPU (Watts) |
max. fan noise (dB(A)) | |
|---|---|---|---|---|---|---|---|
| Low Power | 13 | 999 | 9 | 2096 | 30 | 13 | 24.8 |
| Auto | 75/54 | 2312 | 72/38 | 4373 | 62.7 | 94/48 | 40.9 |
| High Power | 2490 | 2073 | 72/42 | 4386 | 63.1 | 114/70 | 53.9 |
Processor
The M5 Max CPU can consume up to 75 Watts and levels off at 70 Watts under sustained workloads, so the performance is very stable. The single-core performance of the current M5 generation is still ridiculous and at least two generations ahead of the competition (even Qualcomm just caught up to the M3 generation) and the multi-core performance is also excellent. Compared to its direct Windows competition, it can be up to twice as powerful; only the HX-CPUs from Intel and AMD in powerful gaming laptops can keep up to a certain degree. However, you also get this level of performance on battery power on the MacBook, which is not the case on Windows laptops.
Cinebench 2024: CPU Multi Core | CPU Single Core
Geekbench 6.7: Multi-Core | Single-Core
| CPU Performance rating | |
| Apple MacBook Pro 16 2026 M5 Max | |
| Average Apple M5 Max | |
| Apple MacBook Pro 16 2026 M5 Pro | |
| Lenovo ThinkBook 16p G6 21R00013GE | |
| Lenovo Yoga Pro 9i 16 RTX 5070 | |
| Lenovo ThinkPad T1g Gen 8 21TD003GE | |
| Samsung Galaxy Book6 Ultra | |
| Average of class Multimedia | |
| Asus ProArt P16 RTX 5090 | |
| Dell XPS 16 Core Ultra X7 358H | |
| Cinebench 2024 / CPU Multi Core | |
| Apple MacBook Pro 16 2026 M5 Max | |
| Apple MacBook Pro 16 2026 M5 Pro | |
| Average Apple M5 Max (2073 - 2490, n=3) | |
| Lenovo ThinkBook 16p G6 21R00013GE | |
| Asus ProArt P16 RTX 5090 | |
| Samsung Galaxy Book6 Ultra | |
| Lenovo Yoga Pro 9i 16 RTX 5070 | |
| Lenovo ThinkPad T1g Gen 8 21TD003GE | |
| Average of class Multimedia (327 - 2490, n=61, last 2 years) | |
| Dell XPS 16 Core Ultra X7 358H | |
| Cinebench 2024 / CPU Single Core | |
| Apple MacBook Pro 16 2026 M5 Pro | |
| Average Apple M5 Max (199 - 201, n=3) | |
| Apple MacBook Pro 16 2026 M5 Max | |
| Lenovo ThinkBook 16p G6 21R00013GE | |
| Average of class Multimedia (72.5 - 201, n=55, last 2 years) | |
| Lenovo Yoga Pro 9i 16 RTX 5070 | |
| Lenovo ThinkPad T1g Gen 8 21TD003GE | |
| Dell XPS 16 Core Ultra X7 358H | |
| Samsung Galaxy Book6 Ultra | |
| Asus ProArt P16 RTX 5090 | |
| Geekbench 6.7 / Multi-Core | |
| Apple MacBook Pro 16 2026 M5 Max | |
| Average Apple M5 Max (29000 - 30057, n=5) | |
| Apple MacBook Pro 16 2026 M5 Pro | |
| Lenovo ThinkBook 16p G6 21R00013GE | |
| Lenovo Yoga Pro 9i 16 RTX 5070 | |
| Lenovo ThinkPad T1g Gen 8 21TD003GE | |
| Dell XPS 16 Core Ultra X7 358H | |
| Samsung Galaxy Book6 Ultra | |
| Average of class Multimedia (4983 - 30057, n=61, last 2 years) | |
| Asus ProArt P16 RTX 5090 | |
| Geekbench 6.7 / Single-Core | |
| Apple MacBook Pro 16 2026 M5 Max | |
| Apple MacBook Pro 16 2026 M5 Pro | |
| Average Apple M5 Max (4200 - 4336, n=5) | |
| Lenovo Yoga Pro 9i 16 RTX 5070 | |
| Average of class Multimedia (1591 - 4336, n=61, last 2 years) | |
| Lenovo ThinkBook 16p G6 21R00013GE | |
| Lenovo ThinkPad T1g Gen 8 21TD003GE | |
| Asus ProArt P16 RTX 5090 | |
| Dell XPS 16 Core Ultra X7 358H | |
| Samsung Galaxy Book6 Ultra | |
System & SSD Performance
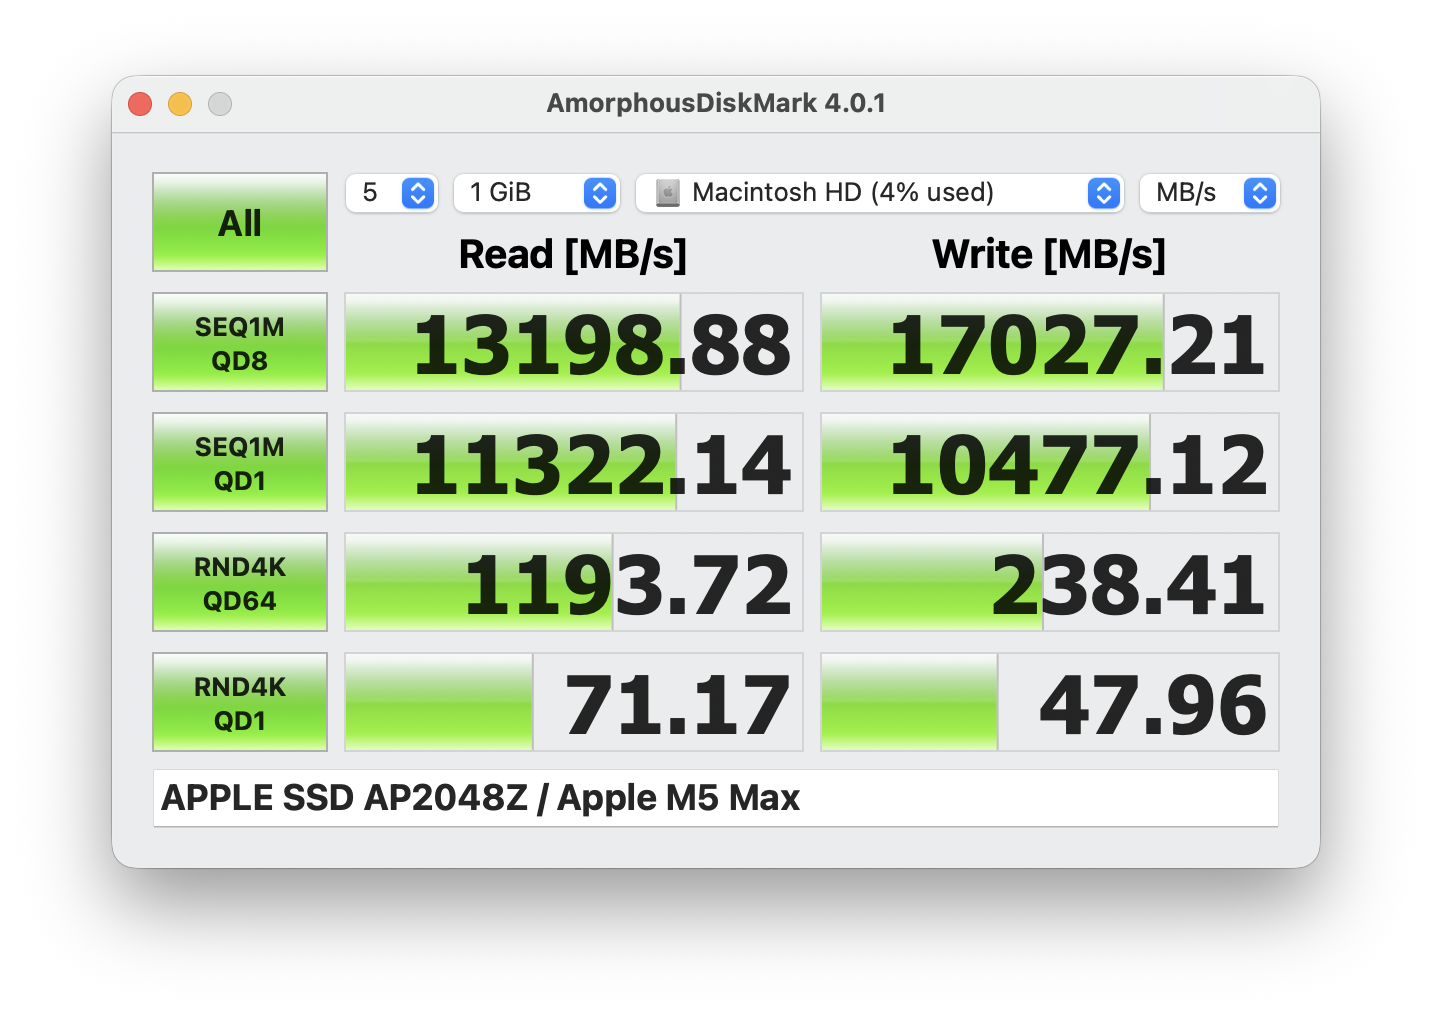
System performance is excellent and the MacBook Pro 16 is a very responsive system, even though you will not notice a difference between the M5 Max or the base model in everyday situations. Apple uses PCIe 5.0 SSDs and our 2 TB drive (1.94 TB free) manages transfer rates of up to 17 GB/s (write) or 13 GB/s (read), respectively.

CrossMark: Overall | Productivity | Creativity | Responsiveness
WebXPRT 3: Overall
WebXPRT 4: Overall
Mozilla Kraken 1.1: Total
| Performance rating | |
| Apple MacBook Pro 16 2026 M5 Max | |
| Average Apple M5 Max, Apple M5 Max 40-Core GPU | |
| Apple MacBook Pro 16 2026 M5 Pro | |
| Lenovo ThinkPad T1g Gen 8 21TD003GE | |
| Lenovo Yoga Pro 9i 16 RTX 5070 | |
| Lenovo ThinkBook 16p G6 21R00013GE | |
| Dell XPS 16 Core Ultra X7 358H | |
| Average of class Multimedia | |
| Samsung Galaxy Book6 Ultra | |
| Asus ProArt P16 RTX 5090 | |
| CrossMark / Overall | |
| Apple MacBook Pro 16 2026 M5 Max | |
| Average Apple M5 Max, Apple M5 Max 40-Core GPU (2728 - 3231, n=2) | |
| Apple MacBook Pro 16 2026 M5 Pro | |
| Lenovo ThinkPad T1g Gen 8 21TD003GE | |
| Dell XPS 16 Core Ultra X7 358H | |
| Lenovo Yoga Pro 9i 16 RTX 5070 | |
| Lenovo ThinkBook 16p G6 21R00013GE | |
| Asus ProArt P16 RTX 5090 | |
| Average of class Multimedia (866 - 3231, n=56, last 2 years) | |
| Samsung Galaxy Book6 Ultra | |
| CrossMark / Productivity | |
| Apple MacBook Pro 16 2026 M5 Max | |
| Average Apple M5 Max, Apple M5 Max 40-Core GPU (2477 - 2677, n=2) | |
| Apple MacBook Pro 16 2026 M5 Pro | |
| Lenovo ThinkPad T1g Gen 8 21TD003GE | |
| Lenovo ThinkBook 16p G6 21R00013GE | |
| Lenovo Yoga Pro 9i 16 RTX 5070 | |
| Dell XPS 16 Core Ultra X7 358H | |
| Average of class Multimedia (931 - 2677, n=56, last 2 years) | |
| Asus ProArt P16 RTX 5090 | |
| Samsung Galaxy Book6 Ultra | |
| CrossMark / Creativity | |
| Apple MacBook Pro 16 2026 M5 Max | |
| Average Apple M5 Max, Apple M5 Max 40-Core GPU (3465 - 4522, n=2) | |
| Apple MacBook Pro 16 2026 M5 Pro | |
| Dell XPS 16 Core Ultra X7 358H | |
| Lenovo ThinkPad T1g Gen 8 21TD003GE | |
| Lenovo Yoga Pro 9i 16 RTX 5070 | |
| Lenovo ThinkBook 16p G6 21R00013GE | |
| Asus ProArt P16 RTX 5090 | |
| Samsung Galaxy Book6 Ultra | |
| Average of class Multimedia (907 - 4522, n=56, last 2 years) | |
| CrossMark / Responsiveness | |
| Apple MacBook Pro 16 2026 M5 Max | |
| Lenovo ThinkPad T1g Gen 8 21TD003GE | |
| Average Apple M5 Max, Apple M5 Max 40-Core GPU (1777 - 2073, n=2) | |
| Apple MacBook Pro 16 2026 M5 Pro | |
| Dell XPS 16 Core Ultra X7 358H | |
| Lenovo Yoga Pro 9i 16 RTX 5070 | |
| Lenovo ThinkBook 16p G6 21R00013GE | |
| Average of class Multimedia (605 - 2073, n=56, last 2 years) | |
| Samsung Galaxy Book6 Ultra | |
| Asus ProArt P16 RTX 5090 | |
| WebXPRT 3 / Overall | |
| Apple MacBook Pro 16 2026 M5 Max | |
| Average Apple M5 Max, Apple M5 Max 40-Core GPU (584 - 622, n=2) | |
| Apple MacBook Pro 16 2026 M5 Pro | |
| Average of class Multimedia (197.4 - 622, n=59, last 2 years) | |
| Lenovo Yoga Pro 9i 16 RTX 5070 | |
| Lenovo ThinkPad T1g Gen 8 21TD003GE | |
| Lenovo ThinkBook 16p G6 21R00013GE | |
| Samsung Galaxy Book6 Ultra | |
| Dell XPS 16 Core Ultra X7 358H | |
| Asus ProArt P16 RTX 5090 | |
| WebXPRT 4 / Overall | |
| Apple MacBook Pro 16 2026 M5 Max | |
| Average Apple M5 Max, Apple M5 Max 40-Core GPU (397 - 415, n=2) | |
| Apple MacBook Pro 16 2026 M5 Pro | |
| Lenovo ThinkBook 16p G6 21R00013GE | |
| Lenovo Yoga Pro 9i 16 RTX 5070 | |
| Lenovo ThinkPad T1g Gen 8 21TD003GE | |
| Dell XPS 16 Core Ultra X7 358H | |
| Average of class Multimedia (167.3 - 415, n=59, last 2 years) | |
| Samsung Galaxy Book6 Ultra | |
| Asus ProArt P16 RTX 5090 | |
| Mozilla Kraken 1.1 / Total | |
| Samsung Galaxy Book6 Ultra | |
| Dell XPS 16 Core Ultra X7 358H | |
| Lenovo ThinkPad T1g Gen 8 21TD003GE | |
| Average of class Multimedia (228 - 835, n=60, last 2 years) | |
| Lenovo Yoga Pro 9i 16 RTX 5070 | |
| Asus ProArt P16 RTX 5090 | |
| Lenovo ThinkBook 16p G6 21R00013GE | |
| Apple MacBook Pro 16 2026 M5 Max | |
| Average Apple M5 Max, Apple M5 Max 40-Core GPU (233 - 236, n=2) | |
| Apple MacBook Pro 16 2026 M5 Pro | |
* ... smaller is better
GPU Performance
The M5 Max GPU can access the system memory, which means it has an advantage over most Windows competitors with Nvidia GPUs, which are usually limited to 8 or 16 GB VRAM. Systems with AMD's Strix Halo and the upcoming Nvidia RTX Spark machines will also have this advantage. In terms of raw performance, the M5 Max GPU with 40 cores is very powerful and is only 12 % slower than the RTX 5090 (running at 120W) in the ProArt P16 in the demanding 3DMark Steel Nomad test and clearly faster than direct competitors equipped with the RTX 5060 or RTX 5070 GPUs. The gaming performance is a bit worse in comparison, but still good and you can play all supported titles with the highest settings. However, the number of games is still limited on macOS, so a Windows machine is still superior in this regard.
| 3DMark Steel Nomad Score | 4386 points | |
| 3DMark Steel Nomad Light Score | 17649 points | |
Help | ||
| Blender / v3.3 Classroom METAL | |
| Average of class Multimedia (17.8 - 68, n=6, last 2 years) | |
| Apple MacBook Pro 16 2026 M5 Pro | |
| Apple MacBook Pro 16 2023 M3 Max | |
| Average Apple M5 Max 40-Core GPU (23.3 - 25.6, n=2) | |
| Apple MacBook Pro 16 2026 M5 Max | |
| Apple MacBook Pro 16 M4 Max | |
| Blender / v3.3 Classroom OPTIX/RTX | |
| Average of class Multimedia (12 - 105, n=17, last 2 years) | |
| Lenovo Yoga Pro 9i 16 RTX 5070 | |
| Lenovo ThinkPad T1g Gen 8 21TD003GE | |
| Lenovo ThinkBook 16p G6 21R00013GE | |
| Samsung Galaxy Book6 Ultra | |
| Asus ProArt P16 RTX 5090 | |
| Blender / v3.3 Classroom CUDA | |
| Lenovo ThinkBook 16p G6 21R00013GE | |
| Lenovo ThinkBook 16p G6 21R00013GE | |
| Average of class Multimedia (20 - 186, n=17, last 2 years) | |
| Lenovo ThinkPad T1g Gen 8 21TD003GE | |
| Lenovo Yoga Pro 9i 16 RTX 5070 | |
| Samsung Galaxy Book6 Ultra | |
| Asus ProArt P16 RTX 5090 | |
| Blender / v3.3 Classroom CPU | |
| Average of class Multimedia (133 - 1042, n=57, last 2 years) | |
| Dell XPS 16 Core Ultra X7 358H | |
| Samsung Galaxy Book6 Ultra | |
| Lenovo ThinkPad T1g Gen 8 21TD003GE | |
| Lenovo Yoga Pro 9i 16 RTX 5070 | |
| Asus ProArt P16 RTX 5090 | |
| Apple MacBook Pro 16 2023 M3 Max | |
| Lenovo ThinkBook 16p G6 21R00013GE | |
| Apple MacBook Pro 16 M4 Max | |
| Average Apple M5 Max 40-Core GPU (133 - 149, n=2) | |
| Apple MacBook Pro 16 2026 M5 Pro | |
| Apple MacBook Pro 16 2026 M5 Max | |
| Blender / v3.3 Classroom oneAPI/Intel | |
| Average of class Multimedia (105 - 492, n=17, last 2 years) | |
| Dell XPS 16 Core Ultra X7 358H | |
* ... smaller is better
| Assassin's Creed Shadows - 2560x1440 Ultra High | |
| Asus ProArt P16 RTX 5090 | |
| Apple MacBook Pro 16 2026 M5 Max | |
| Lenovo Yoga Pro 9i 16 RTX 5070 | |
| Average of class Multimedia (18 - 49, n=12, last 2 years) | |
| Apple MacBook Pro 16 2026 M5 Pro | |
| Total War Pharaoh - 2560x1440 Ultra Preset | |
| Apple MacBook Pro 16 2026 M5 Max | |
| Apple MacBook Pro 16 2026 M5 Pro | |
| Average of class Multimedia (35.3 - 58.9, n=10, last 2 years) | |
| low | med. | high | ultra | QHD | 4K | |
|---|---|---|---|---|---|---|
| Baldur's Gate 3 (2023) | 210.6 | 170.3 | 141.7 | 134.6 | 96.4 | 50.6 |
| Cyberpunk 2077 (2023) | 152.7 | 136.4 | 117.2 | 102.8 | 63.1 | 25.4 |
| Total War Pharaoh (2023) | 55.3 | 55.5 | 54.3 | |||
| Assassin's Creed Shadows (2025) | 75 | 67 | 61 | 42 | 37 | 26 |
Emissions & Power Consumption
System Noise

The MacBook Pro is still a very quiet laptop and the fan curves are still very defensive, so short peak load situations (especially in Automatic mode) usually do not result in audible fan activity. If you really stress the laptop, the fans will be very loud in High Power mode at almost 54 dB(A) and much quieter at ~41 dB(A) in Automatic mode. In Low Power mode, however, the fans are not audible at all at their lowest speed.
Noise level
| Idle |
| 24.8 / 24.8 / 24.8 dB(A) |
| Load |
| 33.8 / 53.9 dB(A) |
 | ||
30 dB silent 40 dB(A) audible 50 dB(A) loud |
||
min:  , med: , med:  , max: , max:  Earthworks M23R, Arta (15 cm distance) environment noise: 24.8 dB(A) Earthworks M23R, Arta (15 cm distance) environment noise: 24.8 dB(A) | ||
| Apple MacBook Pro 16 2026 M5 Max M5 Max, M5 Max 40-Core GPU | Dell XPS 16 Core Ultra X7 358H Ultra X7 358H, Arc B390 Panther Lake iGPU | Samsung Galaxy Book6 Ultra Ultra 7 356H, GeForce RTX 5070 Laptop | Lenovo ThinkPad T1g Gen 8 21TD003GE Ultra 9 285H, GeForce RTX 5070 Laptop | Lenovo ThinkBook 16p G6 21R00013GE Ultra 7 255HX, GeForce RTX 5060 Laptop | Lenovo Yoga Pro 9i 16 RTX 5070 Ultra 9 285H, GeForce RTX 5070 Laptop | Asus ProArt P16 RTX 5090 Ryzen AI 9 HX 370, GeForce RTX 5090 Laptop | |
|---|---|---|---|---|---|---|---|
| Noise | 5% | -0% | -1% | -2% | -4% | -10% | |
| off / environment * (dB) | 24.8 | 23.3 6% | 25.1 -1% | 25 -1% | 24.3 2% | 24.1 3% | 24.2 2% |
| Idle Minimum * (dB) | 24.8 | 23.4 6% | 25.1 -1% | 25 -1% | 24.3 2% | 24.1 3% | 24.2 2% |
| Idle Average * (dB) | 24.8 | 23.4 6% | 25.1 -1% | 25 -1% | 24.3 2% | 24.1 3% | 27.6 -11% |
| Idle Maximum * (dB) | 24.8 | 25.8 -4% | 25.1 -1% | 27.3 -10% | 28.3 -14% | 25.1 -1% | 32.6 -31% |
| Load Average * (dB) | 33.8 | 38 -12% | 36.9 -9% | 37.3 -10% | 38 -12% | 44.2 -31% | 42.6 -26% |
| Cyberpunk 2077 ultra * (dB) | 48.9 | 38.1 22% | 48.5 1% | 47.8 2% | 48.5 1% | 52.7 -8% | 51.2 -5% |
| Load Maximum * (dB) | 53.9 | 48.6 10% | 48.5 10% | 47.8 11% | 51.9 4% | 52.7 2% | 53.2 1% |
* ... smaller is better
Temperature
The surface temperatures are no problem even under full load. We only measure up to 43 °C, so there are no limitations. During the stress test, the M5 Max draws up to 114 Watts and then quickly levels off at 70 Watts.
(±) The maximum temperature on the upper side is 43.3 °C / 110 F, compared to the average of 36.8 °C / 98 F, ranging from 21 to 71 °C for the class Multimedia.
(±) The bottom heats up to a maximum of 42.9 °C / 109 F, compared to the average of 39.1 °C / 102 F
(+) In idle usage, the average temperature for the upper side is 23.2 °C / 74 F, compared to the device average of 31.3 °C / 88 F.
(-) 3: The average temperature for the upper side is 38.3 °C / 101 F, compared to the average of 31.3 °C / 88 F for the class Multimedia.
(+) The palmrests and touchpad are reaching skin temperature as a maximum (32.5 °C / 90.5 F) and are therefore not hot.
(-) The average temperature of the palmrest area of similar devices was 28.7 °C / 83.7 F (-3.8 °C / -6.8 F).


| Apple MacBook Pro 16 2026 M5 Max M5 Max, M5 Max 40-Core GPU | Apple MacBook Pro 16 2026 M5 Pro M5 Pro 18-Core, M5 Pro 20-Core GPU | Dell XPS 16 Core Ultra X7 358H Ultra X7 358H, Arc B390 Panther Lake iGPU | Samsung Galaxy Book6 Ultra Ultra 7 356H, GeForce RTX 5070 Laptop | Lenovo ThinkPad T1g Gen 8 21TD003GE Ultra 9 285H, GeForce RTX 5070 Laptop | Lenovo ThinkBook 16p G6 21R00013GE Ultra 7 255HX, GeForce RTX 5060 Laptop | Lenovo Yoga Pro 9i 16 RTX 5070 Ultra 9 285H, GeForce RTX 5070 Laptop | Asus ProArt P16 RTX 5090 Ryzen AI 9 HX 370, GeForce RTX 5090 Laptop | |
|---|---|---|---|---|---|---|---|---|
| Heat | 1% | 3% | -8% | -9% | -2% | -10% | -11% | |
| Maximum Upper Side * (°C) | 43.3 | 40.6 6% | 40.6 6% | 42.7 1% | 44.7 -3% | 41.3 5% | 41.8 3% | 47 -9% |
| Maximum Bottom * (°C) | 42.9 | 42.4 1% | 39.8 7% | 49.1 -14% | 42.8 -0% | 41.8 3% | 47.9 -12% | 51.6 -20% |
| Idle Upper Side * (°C) | 23.4 | 23.8 -2% | 23.2 1% | 25.4 -9% | 26.9 -15% | 25.5 -9% | 26.3 -12% | 24.9 -6% |
| Idle Bottom * (°C) | 23.5 | 23.6 -0% | 23.8 -1% | 25.5 -9% | 27.3 -16% | 25.4 -8% | 27.6 -17% | 25.5 -9% |
* ... smaller is better
Speakers
The speaker system with six modules is still one of the best you can get and slightly better compared to the rivals, even though they are not far off.
Apple MacBook Pro 16 2026 M5 Max audio analysis
(+) | speakers can play relatively loud (83.5 dB)
Bass 100 - 315 Hz
(+) | good bass - only 4.7% away from median
(+) | bass is linear (5.5% delta to prev. frequency)
Mids 400 - 2000 Hz
(+) | balanced mids - only 0.9% away from median
(+) | mids are linear (2.7% delta to prev. frequency)
Highs 2 - 16 kHz
(+) | balanced highs - only 2.3% away from median
(+) | highs are linear (2.6% delta to prev. frequency)
Overall 100 - 16.000 Hz
(+) | overall sound is linear (5.4% difference to median)
Compared to same class
» 1% of all tested devices in this class were better, 1% similar, 98% worse
» The best had a delta of 5%, average was 17%, worst was 45%
Compared to all devices tested
» 0% of all tested devices were better, 0% similar, 100% worse
» The best had a delta of 4%, average was 23%, worst was 136%
Apple MacBook Pro 16 2026 M5 Pro audio analysis
(+) | speakers can play relatively loud (84.7 dB)
Bass 100 - 315 Hz
(+) | good bass - only 4.9% away from median
(+) | bass is linear (6% delta to prev. frequency)
Mids 400 - 2000 Hz
(+) | balanced mids - only 1% away from median
(+) | mids are linear (2.7% delta to prev. frequency)
Highs 2 - 16 kHz
(+) | balanced highs - only 2.7% away from median
(+) | highs are linear (2.9% delta to prev. frequency)
Overall 100 - 16.000 Hz
(+) | overall sound is linear (5.2% difference to median)
Compared to same class
» 1% of all tested devices in this class were better, 1% similar, 98% worse
» The best had a delta of 5%, average was 17%, worst was 45%
Compared to all devices tested
» 0% of all tested devices were better, 0% similar, 100% worse
» The best had a delta of 4%, average was 23%, worst was 136%
Dell XPS 16 Core Ultra X7 358H audio analysis
(+) | speakers can play relatively loud (85.1 dB)
Bass 100 - 315 Hz
(±) | reduced bass - on average 7.6% lower than median
(+) | bass is linear (6.1% delta to prev. frequency)
Mids 400 - 2000 Hz
(+) | balanced mids - only 2.1% away from median
(+) | mids are linear (3.4% delta to prev. frequency)
Highs 2 - 16 kHz
(+) | balanced highs - only 2.3% away from median
(+) | highs are linear (4.1% delta to prev. frequency)
Overall 100 - 16.000 Hz
(+) | overall sound is linear (6.2% difference to median)
Compared to same class
» 4% of all tested devices in this class were better, 0% similar, 96% worse
» The best had a delta of 5%, average was 17%, worst was 45%
Compared to all devices tested
» 0% of all tested devices were better, 0% similar, 99% worse
» The best had a delta of 4%, average was 23%, worst was 136%
Samsung Galaxy Book6 Ultra audio analysis
(+) | speakers can play relatively loud (85.6 dB)
Bass 100 - 315 Hz
(±) | reduced bass - on average 5.9% lower than median
(±) | linearity of bass is average (7.9% delta to prev. frequency)
Mids 400 - 2000 Hz
(+) | balanced mids - only 3.7% away from median
(+) | mids are linear (4.3% delta to prev. frequency)
Highs 2 - 16 kHz
(+) | balanced highs - only 2.2% away from median
(+) | highs are linear (3.4% delta to prev. frequency)
Overall 100 - 16.000 Hz
(+) | overall sound is linear (7.3% difference to median)
Compared to same class
» 6% of all tested devices in this class were better, 1% similar, 93% worse
» The best had a delta of 5%, average was 17%, worst was 45%
Compared to all devices tested
» 1% of all tested devices were better, 0% similar, 99% worse
» The best had a delta of 4%, average was 23%, worst was 136%
Lenovo ThinkPad T1g Gen 8 21TD003GE audio analysis
(+) | speakers can play relatively loud (85.6 dB)
Bass 100 - 315 Hz
(±) | reduced bass - on average 9.3% lower than median
(±) | linearity of bass is average (11.9% delta to prev. frequency)
Mids 400 - 2000 Hz
(+) | balanced mids - only 2.5% away from median
(+) | mids are linear (4% delta to prev. frequency)
Highs 2 - 16 kHz
(+) | balanced highs - only 3.4% away from median
(±) | linearity of highs is average (7.5% delta to prev. frequency)
Overall 100 - 16.000 Hz
(+) | overall sound is linear (8.7% difference to median)
Compared to same class
» 11% of all tested devices in this class were better, 2% similar, 87% worse
» The best had a delta of 5%, average was 17%, worst was 45%
Compared to all devices tested
» 3% of all tested devices were better, 1% similar, 97% worse
» The best had a delta of 4%, average was 23%, worst was 136%
Lenovo ThinkBook 16p G6 21R00013GE audio analysis
(+) | speakers can play relatively loud (83.3 dB)
Bass 100 - 315 Hz
(±) | reduced bass - on average 6.8% lower than median
(±) | linearity of bass is average (9.8% delta to prev. frequency)
Mids 400 - 2000 Hz
(±) | higher mids - on average 5.4% higher than median
(+) | mids are linear (4.2% delta to prev. frequency)
Highs 2 - 16 kHz
(+) | balanced highs - only 2.8% away from median
(+) | highs are linear (3.8% delta to prev. frequency)
Overall 100 - 16.000 Hz
(+) | overall sound is linear (10.1% difference to median)
Compared to same class
» 14% of all tested devices in this class were better, 2% similar, 84% worse
» The best had a delta of 5%, average was 17%, worst was 45%
Compared to all devices tested
» 5% of all tested devices were better, 2% similar, 94% worse
» The best had a delta of 4%, average was 23%, worst was 136%
Lenovo Yoga Pro 9i 16 RTX 5070 audio analysis
(±) | speaker loudness is average but good (81.4 dB)
Bass 100 - 315 Hz
(±) | reduced bass - on average 5.5% lower than median
(±) | linearity of bass is average (7.5% delta to prev. frequency)
Mids 400 - 2000 Hz
(+) | balanced mids - only 1.7% away from median
(+) | mids are linear (3.1% delta to prev. frequency)
Highs 2 - 16 kHz
(±) | reduced highs - on average 6.2% lower than median
(+) | highs are linear (3.9% delta to prev. frequency)
Overall 100 - 16.000 Hz
(+) | overall sound is linear (9.7% difference to median)
Compared to same class
» 14% of all tested devices in this class were better, 1% similar, 85% worse
» The best had a delta of 5%, average was 17%, worst was 45%
Compared to all devices tested
» 4% of all tested devices were better, 1% similar, 95% worse
» The best had a delta of 4%, average was 23%, worst was 136%
Asus ProArt P16 RTX 5090 audio analysis
(±) | speaker loudness is average but good (80.8 dB)
Bass 100 - 315 Hz
(+) | good bass - only 3.3% away from median
(±) | linearity of bass is average (7.7% delta to prev. frequency)
Mids 400 - 2000 Hz
(+) | balanced mids - only 2.9% away from median
(+) | mids are linear (1.9% delta to prev. frequency)
Highs 2 - 16 kHz
(+) | balanced highs - only 4.1% away from median
(+) | highs are linear (5.5% delta to prev. frequency)
Overall 100 - 16.000 Hz
(+) | overall sound is linear (8.3% difference to median)
Compared to same class
» 9% of all tested devices in this class were better, 2% similar, 89% worse
» The best had a delta of 5%, average was 17%, worst was 45%
Compared to all devices tested
» 2% of all tested devices were better, 1% similar, 97% worse
» The best had a delta of 4%, average was 23%, worst was 136%
Power Consumption & Battery Life

While the MacBook Pro 16 is efficient under light workloads and while idling, the power consumption under load is a problem. We record a maximum figure of 150 Watts, which then fluctuates between 130-140 Watts over the course of the stress test. However, the battery level drops from 100 to just 88 % after one hour of combined workloads, which is an issue. We also tested a more powerful 180W adapter, but the behavior was the same. Battery life at 150 nits is excellent with 18.5 hours in our Wi-Fi test and still decent (considering the high brightness) at maximum SDR brightness with almost 7 hours.
| Off / Standby | 0.08 / 1.1 Watt |
| Idle | 2.7 / 13.3 / 13.5 Watt |
| Load |
141 / 150.3 Watt |
   
| |
Key:
min: ,
med: ,
max: Metrahit Energy | |
| Apple MacBook Pro 16 2026 M5 Max M5 Max, M5 Max 40-Core GPU, Apple SSD AP2048Z, Mini-LED, 3456x2234, 16.2" | Apple MacBook Pro 16 2026 M5 Pro M5 Pro 18-Core, M5 Pro 20-Core GPU, Apple SSD AP4096Z, Mini-LED, 3456x2234, 16.2" | Dell XPS 16 Core Ultra X7 358H Ultra X7 358H, Arc B390 Panther Lake iGPU, , OLED, 3200x2000, 16" | Samsung Galaxy Book6 Ultra Ultra 7 356H, GeForce RTX 5070 Laptop, Samsung PM9C1b MZVL81T0HFLB-00BH1, OLED, 2880x1800, 16" | Lenovo ThinkPad T1g Gen 8 21TD003GE Ultra 9 285H, GeForce RTX 5070 Laptop, Samsung PM9E1 MZVLC2T0HBLD, Tandem-OLED, 3200x2000, 16" | Lenovo ThinkBook 16p G6 21R00013GE Ultra 7 255HX, GeForce RTX 5060 Laptop, SK hynix PVC10 HFS001TEM4X182N, IPS, 2560x1600, 16" | Lenovo Yoga Pro 9i 16 RTX 5070 Ultra 9 285H, GeForce RTX 5070 Laptop, WD PC SN7100S SDFPMSL-1T00-1101, OLED, 3200x2000, 16" | Asus ProArt P16 RTX 5090 Ryzen AI 9 HX 370, GeForce RTX 5090 Laptop, Micron 2500 2TB MTFDKBA2T0QGN-1BN1AABGA, OLED, 3840x2400, 16" | Average Apple M5 Max 40-Core GPU | Average of class Multimedia | |
|---|---|---|---|---|---|---|---|---|---|---|
| Power Consumption | -2% | 36% | 14% | -22% | -63% | -42% | -57% | 10% | 2% | |
| Idle Minimum * (Watt) | 2.7 | 4.4 -63% | 4 -48% | 4.4 -63% | 8.5 -215% | 9 -233% | 8.8 -226% | 10.9 -304% | 2.6 ? 4% | 5.39 ? -100% |
| Idle Average * (Watt) | 13.3 | 18.3 -38% | 4.4 67% | 6.4 52% | 13.6 -2% | 14.8 -11% | 16.1 -21% | 12.1 9% | 12.5 ? 6% | 10.2 ? 23% |
| Idle Maximum * (Watt) | 13.5 | 18.4 -36% | 10.2 24% | 7.1 47% | 14.1 -4% | 16.7 -24% | 16.5 -22% | 12.5 7% | 12.7 ? 6% | 12.4 ? 8% |
| Load Average * (Watt) | 141 | 84.2 40% | 44.2 69% | 55.1 61% | 84.5 40% | 92.8 34% | 89.3 37% | 129.3 8% | 118.3 ? 16% | 65.5 ? 54% |
| Cyberpunk 2077 ultra external monitor * (Watt) | 136.7 | 79.8 42% | 62.4 54% | 133 3% | 118.1 14% | 212 -55% | 157.9 -16% | 172.8 -26% | ||
| Cyberpunk 2077 ultra * (Watt) | 128.9 | 82.5 36% | 62.6 51% | 134.3 -4% | 120.3 7% | 215 -67% | 160.6 -25% | 176.6 -37% | ||
| Load Maximum * (Watt) | 150.3 | 145 4% | 94.6 37% | 143.9 4% | 143 5% | 281.5 -87% | 177.4 -18% | 233.9 -56% | 124.6 ? 17% | 111 ? 26% |
* ... smaller is better
Power Consumption Cyberpunk / Stress Test
Power Consumption external Monitor
Notebookcheck Rating
Apple MacBook Pro 16 2026 M5 Max
- 08/27/2026 v8
Andreas Osthoff
 Total Sustainability Score:
 Potential Competitors in Comparison
Image | Model / Review | Price | Weight | Height | Display |
|---|---|---|---|---|---|
1. 92.4%  | Apple MacBook Pro 16 2026 M5 Max Apple M5 Max ⎘ Apple M5 Max 40-Core GPU ⎘ 48 GB Memory, 2048 GB SSD | List Price: 5699€ | 2.1 kg | 16.8 mm | 16.20" 3456x2234 254 PPI Mini-LED |
2. 92.3%  | Apple MacBook Pro 16 2026 M5 Pro Apple M5 Pro 18-Core ⎘ Apple M5 Pro 20-Core GPU ⎘ 64 GB Memory, 4096 GB SSD | List Price: 5298€ | 2.1 kg | 16.8 mm | 16.20" 3456x2234 254 PPI Mini-LED |
3. 87.2%  | Dell XPS 16 Core Ultra X7 358H Intel Core Ultra X7 358H ⎘ Intel Arc B390 12 Xe3 Panther Lake iGPU ⎘ 32 GB Memory | Amazon: 1. $1,977.99 Dell Premium 16 (Previously ... 2. $1,699.99 Dell XPS 14 Premium Laptop D... 3. $1,999.00 Dell Premium 16 (Previously ... List Price: 2350 USD | 1.7 kg | 14.62 mm | 16.00" 3200x2000 236 PPI OLED |
4. 90.7%  | Samsung Galaxy Book6 Ultra Intel Core Ultra 7 356H ⎘ NVIDIA GeForce RTX 5070 Laptop ⎘ 32 GB Memory, 1000 GB SSD | List Price: 3599€ | 1.9 kg | 15.4 mm | 16.00" 2880x1800 212 PPI OLED |
5. 92.4%  | Lenovo ThinkPad T1g Gen 8 21TD003GE Intel Core Ultra 9 285H ⎘ NVIDIA GeForce RTX 5070 Laptop ⎘ 64 GB Memory, 2048 GB SSD | List Price: 4500€ | 1.9 kg | 15.8 mm | 16.00" 3200x2000 236 PPI Tandem-OLED |
6. 89.9%  | Lenovo ThinkBook 16p G6 21R00013GE Intel Core Ultra 7 255HX ⎘ NVIDIA GeForce RTX 5060 Laptop ⎘ 32 GB Memory, 1024 GB SSD | List Price: 1939€ | 2.1 kg | 17.9 mm | 16.00" 2560x1600 189 PPI IPS |
7. 90.4%  | Lenovo Yoga Pro 9i 16 RTX 5070 Intel Core Ultra 9 285H ⎘ NVIDIA GeForce RTX 5070 Laptop ⎘ 64 GB Memory, 1024 GB SSD | List Price: 2800€ | 1.9 kg | 17.9 mm | 16.00" 3200x2000 236 PPI OLED |
8. 89.7%  | Asus ProArt P16 RTX 5090 AMD Ryzen AI 9 HX 370 ⎘ NVIDIA GeForce RTX 5090 Laptop ⎘ 64 GB Memory, 2048 GB SSD | Amazon: $4,390.64 List Price: 4799€ | 2 kg | 18.3 mm | 16.00" 3840x2400 283 PPI OLED |
Transparency
The selection of devices to be reviewed is made by our editorial team. The test sample was provided to the author as a loan by the manufacturer or retailer for the purpose of this review. The lender had no influence on this review, nor did the manufacturer receive a copy of this review before publication. There was no obligation to publish this review. As an independent media company, Notebookcheck is not subjected to the authority of manufacturers, retailers or publishers.
This is how Notebookcheck is testing
Every year, Notebookcheck independently reviews hundreds of laptops and smartphones using standardized procedures to ensure that all results are comparable. We have continuously developed our test methods for around 20 years and set industry standards in the process. In our test labs, high-quality measuring equipment is utilized by experienced technicians and editors. These tests involve a multi-stage validation process. Our complex rating system is based on hundreds of well-founded measurements and benchmarks, which maintains objectivity. Further information on our test methods can be found here.
 Add as a preferred source on Google


