Verdict - The Asus Zenbook A16 is pretty much unbeatable at $1599
The new Zenbook A16 is a very interesting 16-inch laptop and has the potential to shake up the x86 competition. The device itself with the lightweight, yet high-quality chassis with a weight of just 1.2 kg, good keyboard and great OLED screen is already very convincing, but paired with the new Snapdragon X2 Elite Extreme, the A16 is just so much more powerful than AMD's or Intel's mobile processor. Both the single-core as well as multi-core performance are big improvements and the GPU performance basically doubled.
Sure, if you want to utilize the full CPU performance, the fans will be very loud, but the big advantage of the new X2 Elite Extreme is the good performance at lower power limits. Even in Whisper mode, where the fan noise does not exceed 30 dB(A), the CPU performance is still superior to AMD and Intel. Apple is still ahead in terms of single-core performance, while the GPU performance of the M5 is comparable and the multi-core performance is lower.
There is not much to criticize here. The battery could be bigger, but this would have increased the weight, and the card reader does not support the SD-Express standard. Otherwise, this is a great overall package and considering the aggressive price of just $1599 for this config with the powerful X2 Elite Extreme and 48 GB RAM, well, we are not sure why you would get a much more expensive Windows laptop in this segment of everyday multimedia laptop.
Pros
Cons
Table of Contents
- Verdict - The Asus Zenbook A16 is pretty much unbeatable at $1599
- Specifications
- Case - Zenbook A16 only weighs 1.2 kg
- Connectivity
- Input Devices
- Display - 120 Hz OLED
- Performance - Snapdragon X2 Elite Extreme & 48 GB RAM
- Emissions - Quiet in everyday scenarios
- Energy Management
- Notebookcheck Rating
- Potential Competitors in Comparison
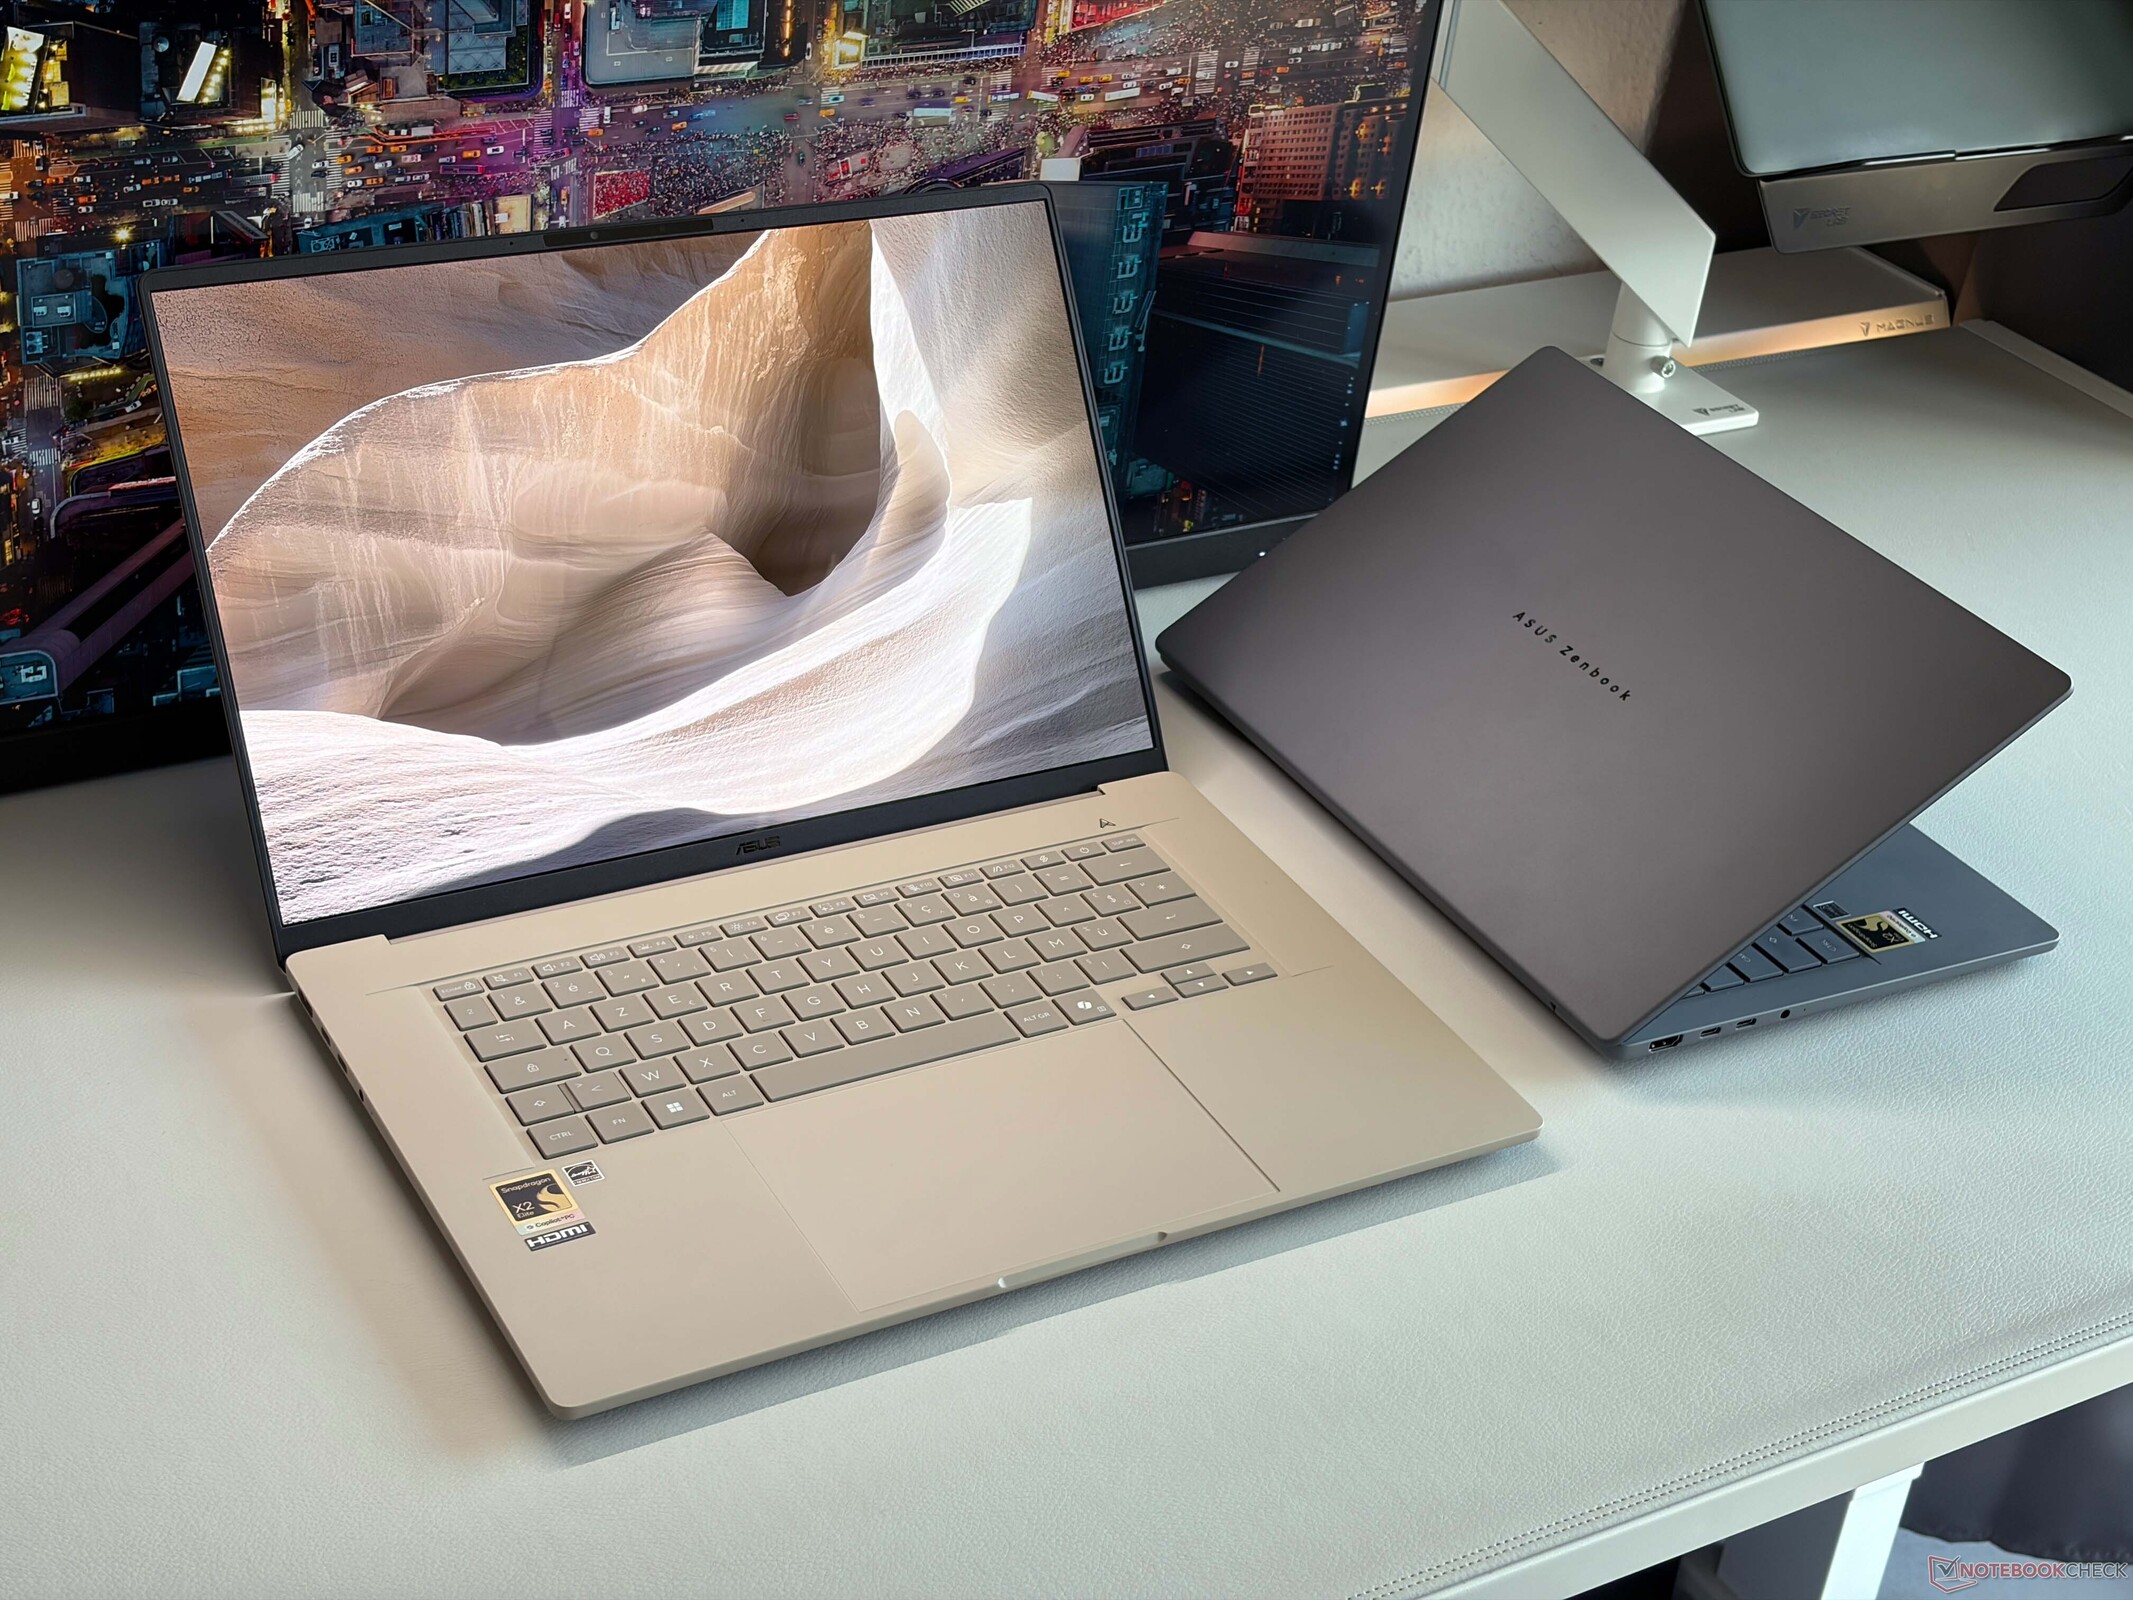
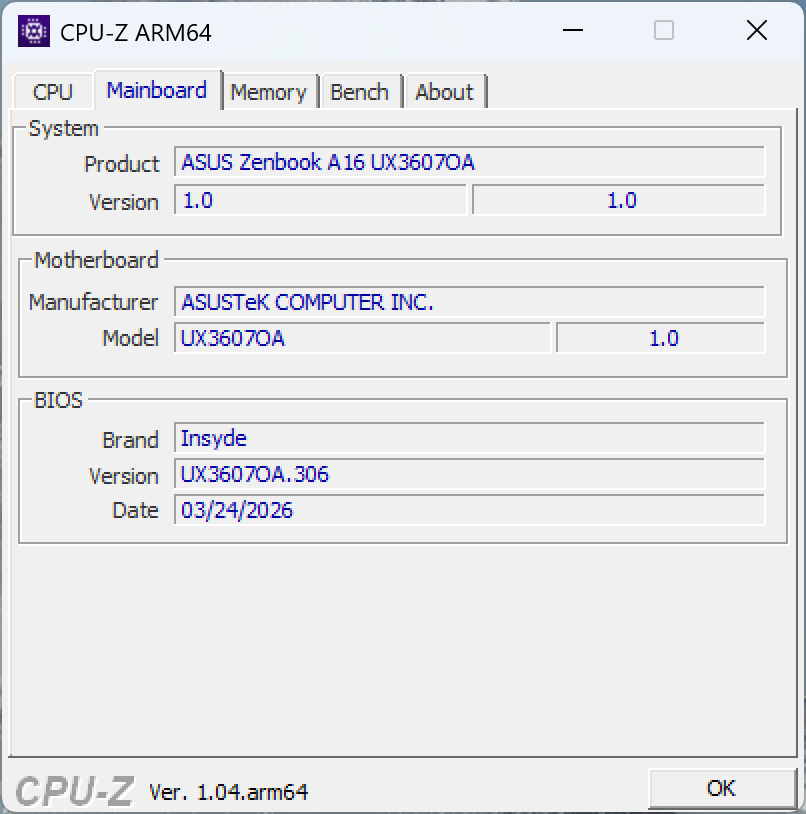
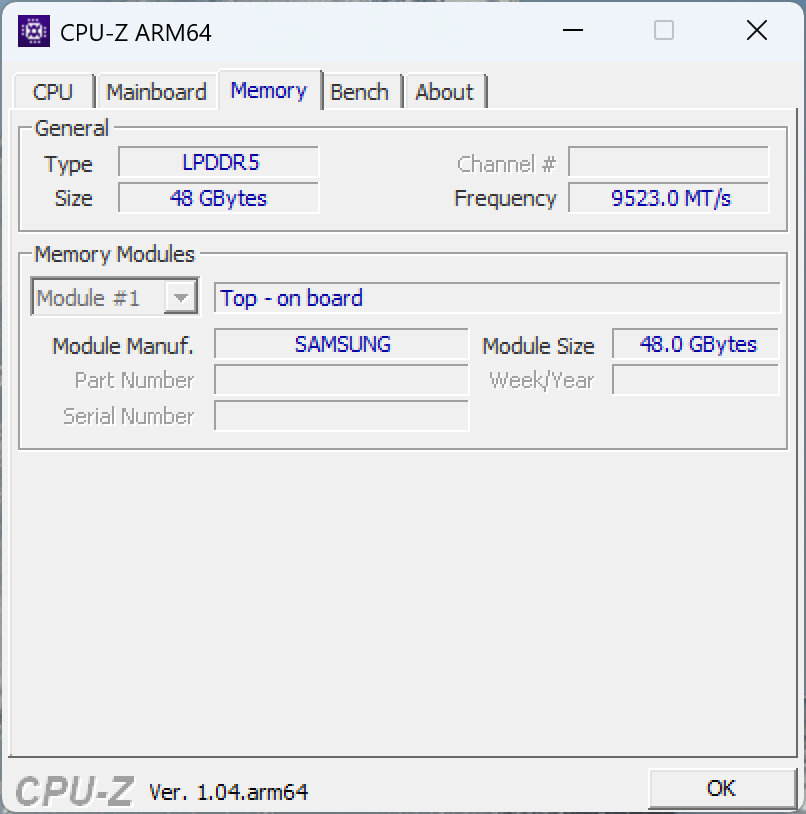
Following the Snapdragon powered Zenbook A14 from 2024, Asus now also launches a larger 16-inch model as a direct rival for the Zenbook S16 and devices like the Dell XPS 16 or Samsung's Galaxy Book6 Pro 16 and obviously Apple's 15-inch MacBook Air. The new Zenbook A16 also uses a very lightweight chassis and tips the scale at just 1.21 kg. For $1599 you get the brand-new Qualcomm Snapdragon X2 Elite Extreme processor in combination with 48 GB RAM, 1 TB SSD storage as well as a 16-inch OLED panel with 120 Hz and 2.8K resolution. Please also see our analysis of the new Snapdragon X2 Elite chips for more details:
Specifications
Case - Zenbook A16 only weighs 1.2 kg
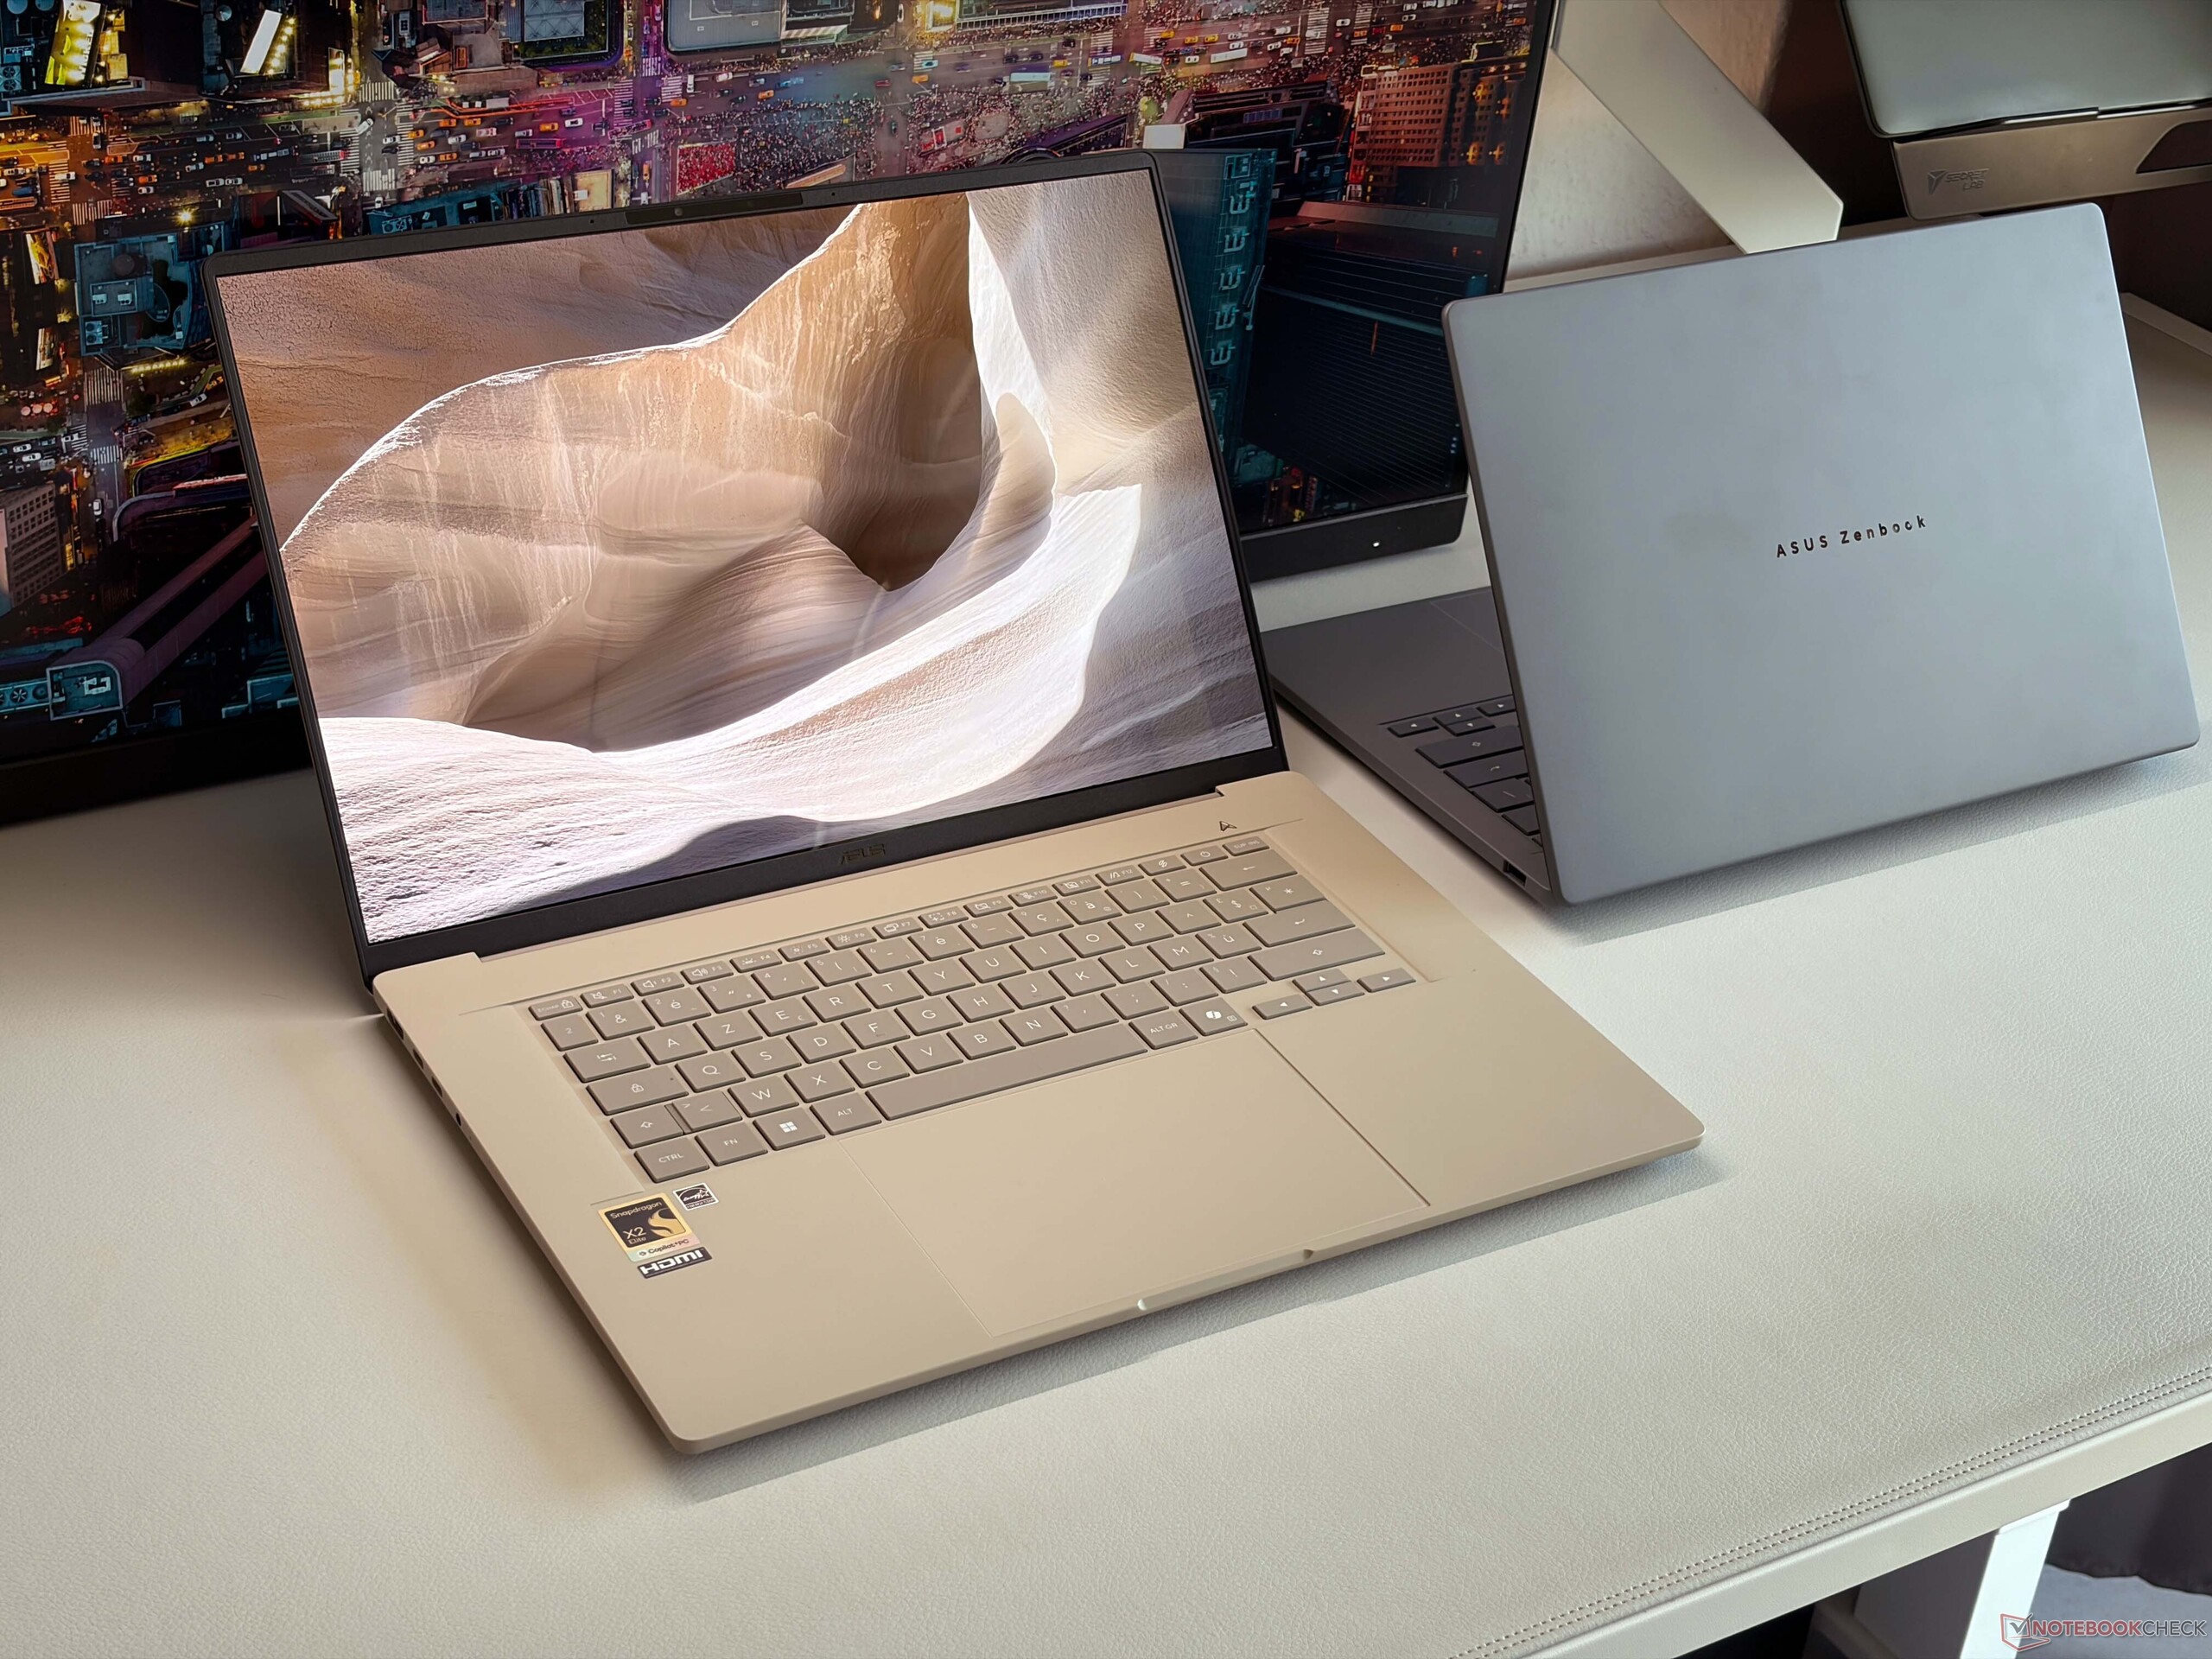
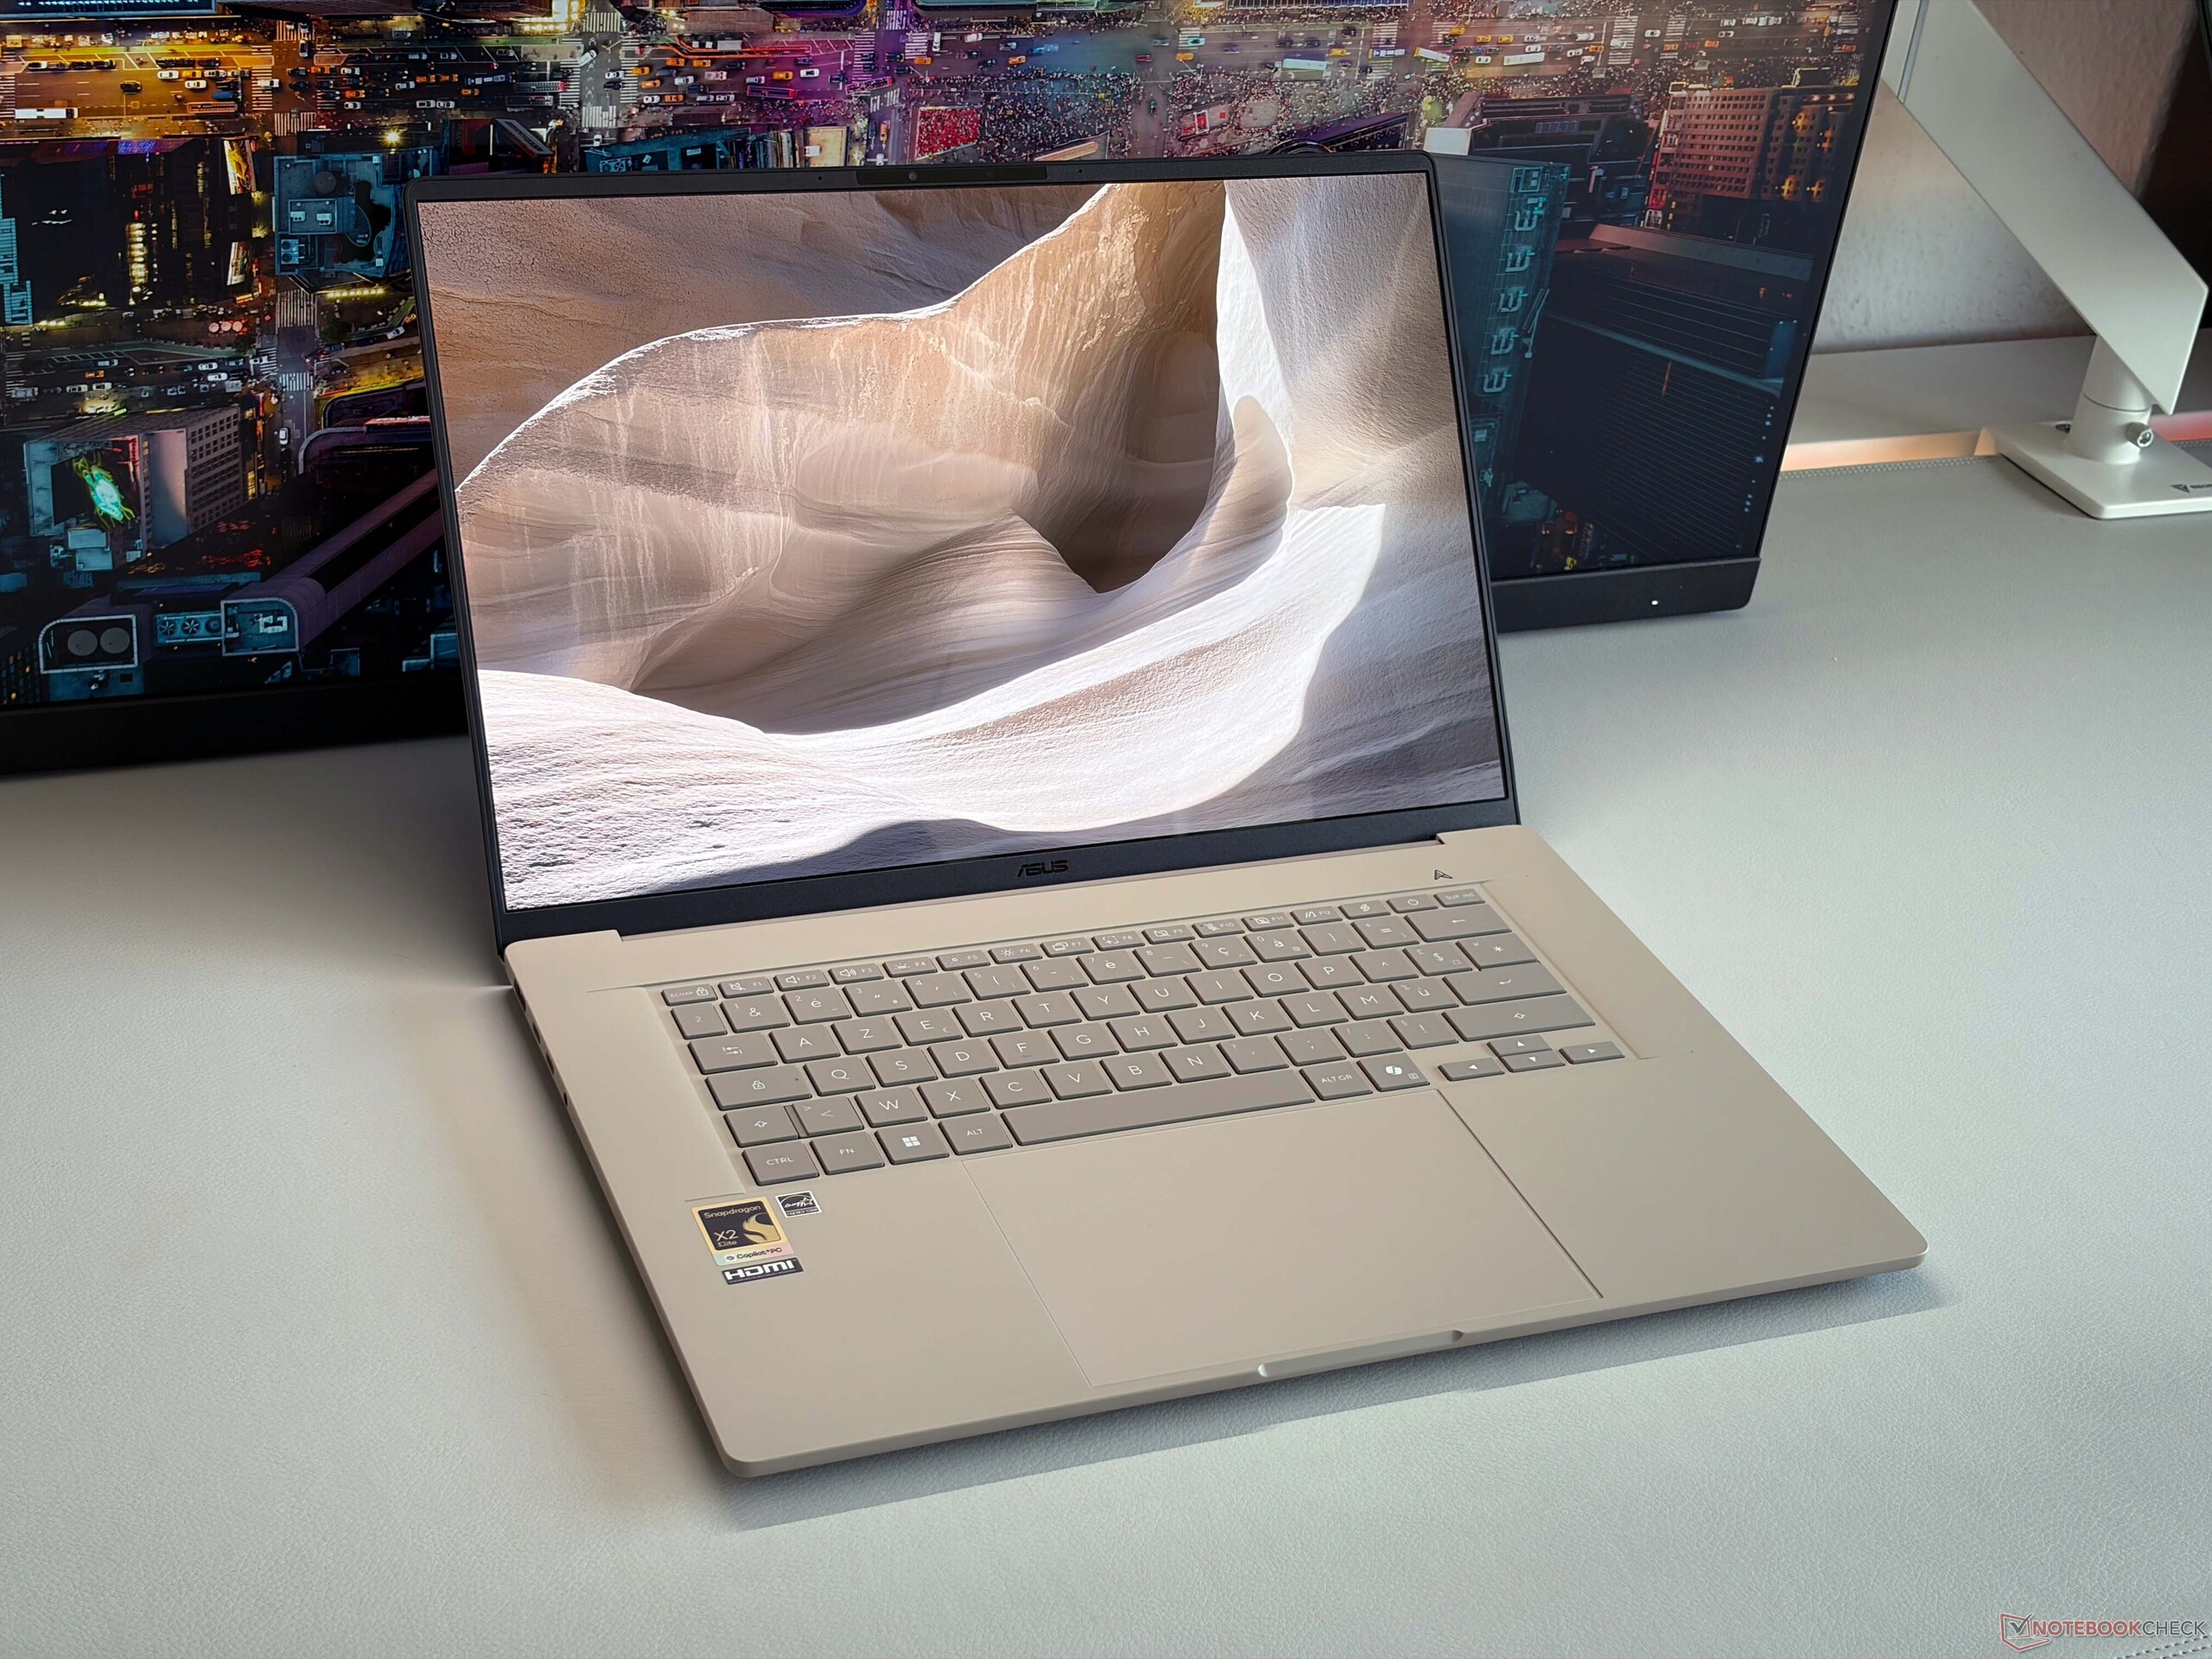
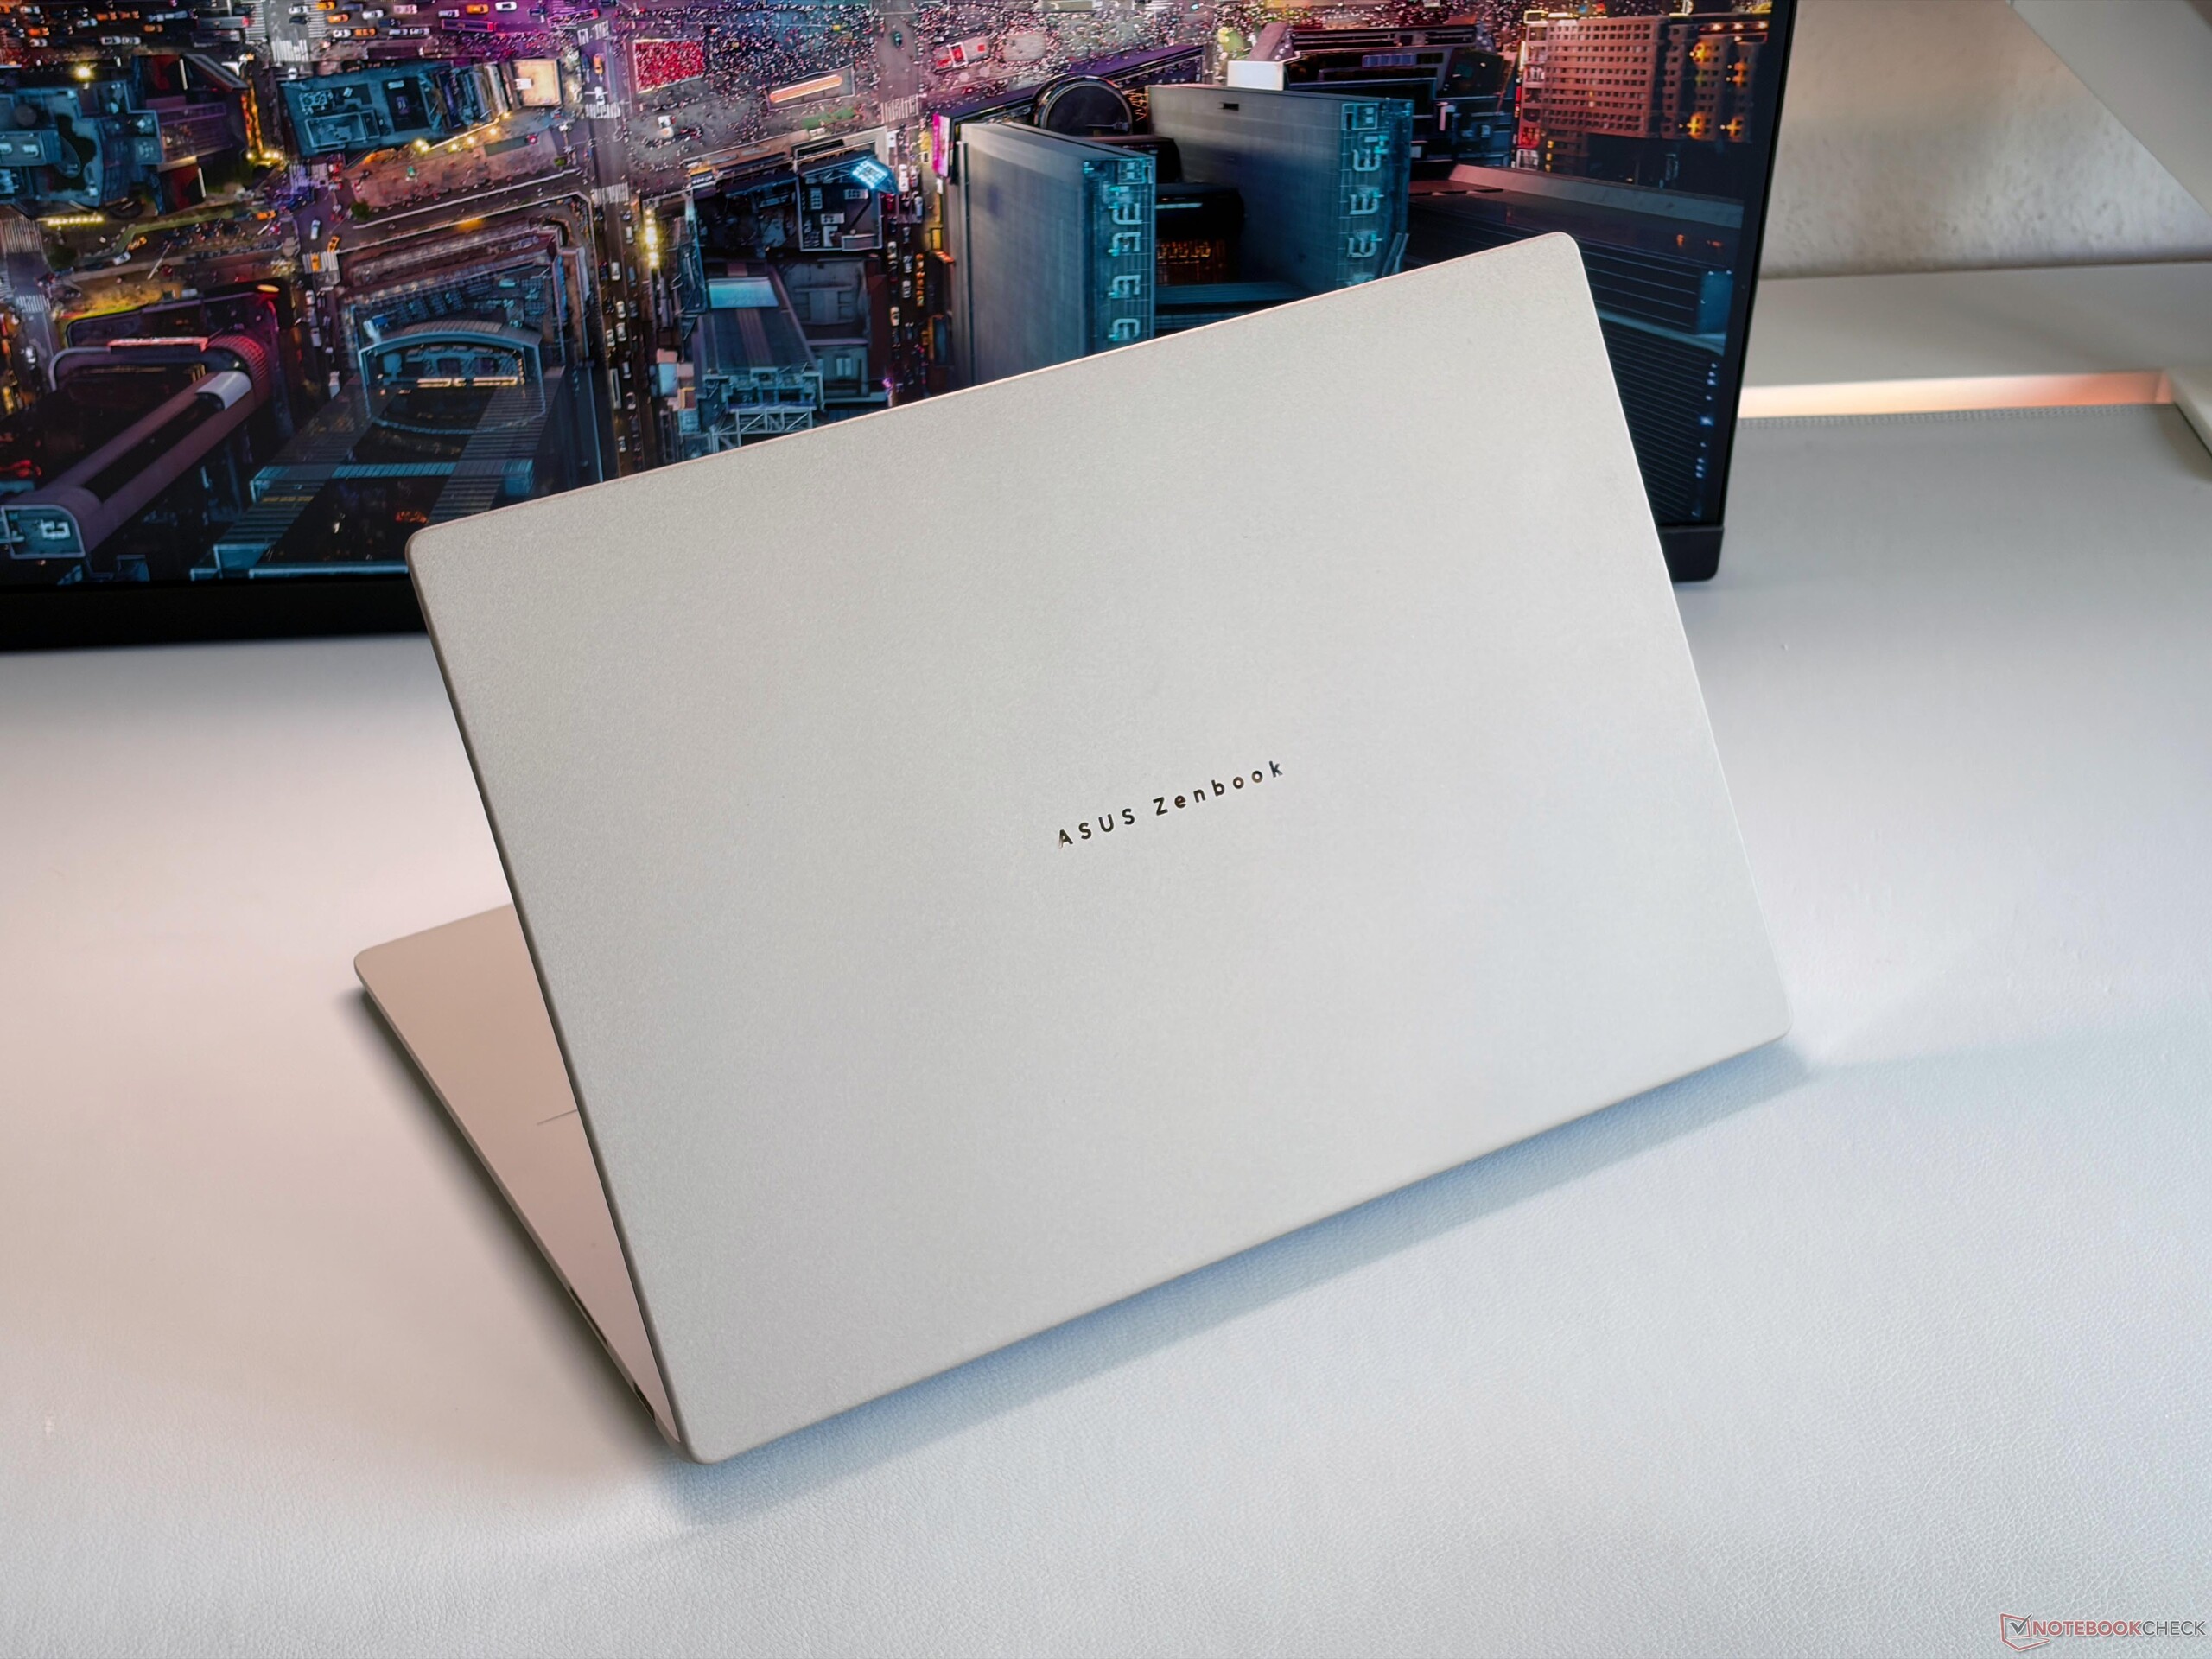
The chassis design follows the smaller Zenbook A14 and the 16-inch Zenbook A16 is also available in the familiar colors Iceland Gray or Zabriskie Beige. Compared to the AMD powered Zenbook S16, the base unit is more rounded and the overall weight difference is very noticeable at more than 300 grams. Asus uses its ceraluminum material for the chassis construction and even though the A16 is a very light device, it is still very stable and sturdy and even feels a bit more dense compared to the smaller Zenbook A14 (under 1 kg). There are no creaking noises and the stability of the base unit is excellent. The lid is a bit more flexible, but this is no problem. We would have liked to see a better calibration of the hinges (max. opening angle ~135 degrees), because the lid wobbles a bit.
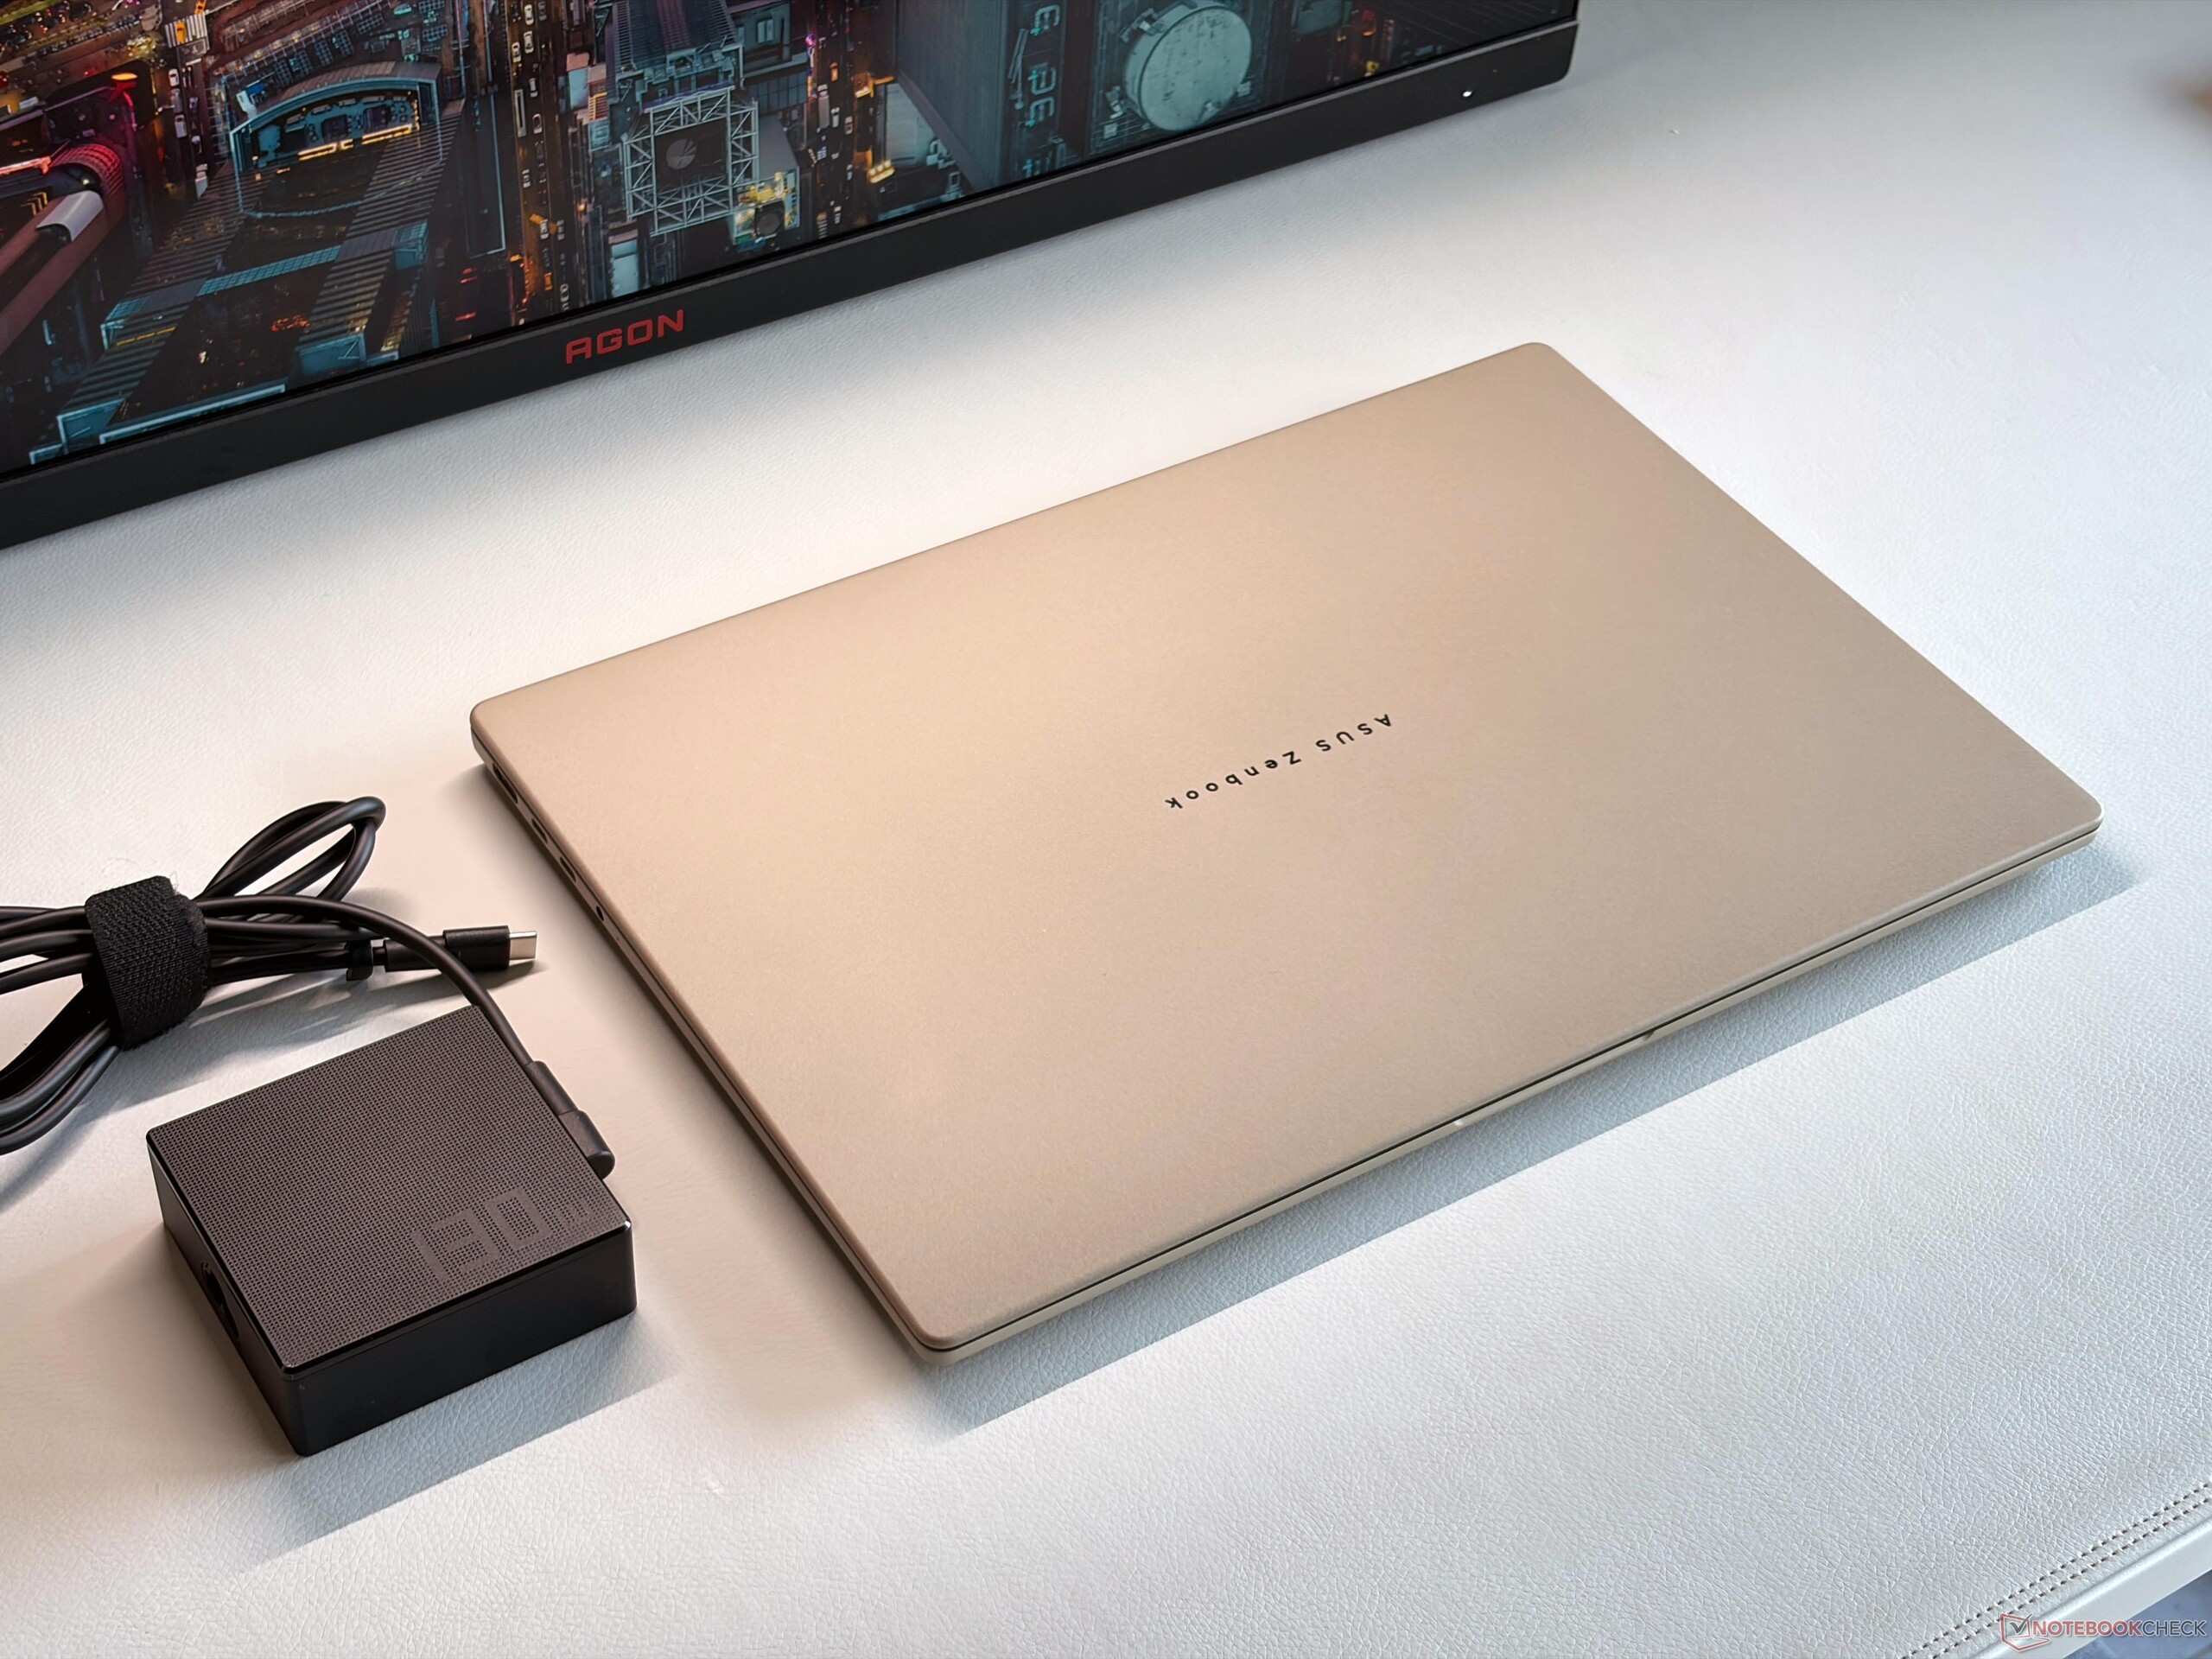
The lower weight of the Zenbook A16 is noticeable compared to the rivals and even the smaller 15-inch MacBook Air is 300 grams heavier. The included 130W power supply tips the scale at 469 grams.
Connectivity
The Zenbook A16 offers two USB-C 4.0 ports, one HDMI 2.1 output as well as a regular USB-A port on the right side. We would have liked to see an additional USB-C port on the right side for charging, but most users should be okay with the number of ports. Asus also includes a full-size SD-card reader on the right side and transfer rates in combination with our reference card are good at more than 200 MB/s, but the faster SD-Express standard is not supported. The 1080p webcam with IR-sensor for facial recognition supports all the AI functions from Windows, but the image quality is just average.


| SD Card Reader | |
| average JPG Copy Test (av. of 3 runs) | |
| Asus Zenbook A16 UX3607 (Angelbird AV Pro V60) | |
| Asus ZenBook S16 UM5606GA (Angelbird AV Pro V60) | |
| Average of class Multimedia (23 - 531, n=44, last 2 years) | |
| Microsoft Surface Laptop 15 Snapdragon X Elite (AV Pro SD microSD 128 GB V60) | |
| maximum AS SSD Seq Read Test (1GB) | |
| Asus Zenbook A16 UX3607 (Angelbird AV Pro V60) | |
| Asus ZenBook S16 UM5606GA (Angelbird AV Pro V60) | |
| Average of class Multimedia (27.9 - 1455, n=43, last 2 years) | |
| Microsoft Surface Laptop 15 Snapdragon X Elite (AV Pro SD microSD 128 GB V60) | |
| Networking | |
| Asus Zenbook A16 UX3607 | |
| iperf3 transmit RT-BE96U WiFi7 | |
| iperf3 receive RT-BE96U WiFi7 | |
| Apple MacBook Air 15 M5 | |
| iperf3 transmit AXE11000 | |
| iperf3 receive AXE11000 | |
| Lenovo ThinkPad X9-15 Aura Edition | |
| iperf3 transmit AXE11000 | |
| iperf3 receive AXE11000 | |
| Samsung Galaxy Book6 Pro | |
| iperf3 transmit AXE11000 | |
| iperf3 receive AXE11000 | |
| iperf3 transmit RT-BE96U WiFi7 | |
| iperf3 receive RT-BE96U WiFi7 | |
| Dell XPS 16 Core Ultra 5 325 | |
| iperf3 transmit AXE11000 | |
| iperf3 receive AXE11000 | |
| iperf3 transmit AXE11000 6GHz | |
| iperf3 receive AXE11000 6GHz | |
| Asus ZenBook S16 UM5606GA | |
| iperf3 transmit AXE11000 | |
| iperf3 receive AXE11000 | |
| Microsoft Surface Laptop 15 Snapdragon X Elite | |
| iperf3 transmit AXE11000 | |
| iperf3 receive AXE11000 | |
| iperf3 transmit AXE11000 6GHz | |
| iperf3 receive AXE11000 6GHz | |


Maintenance
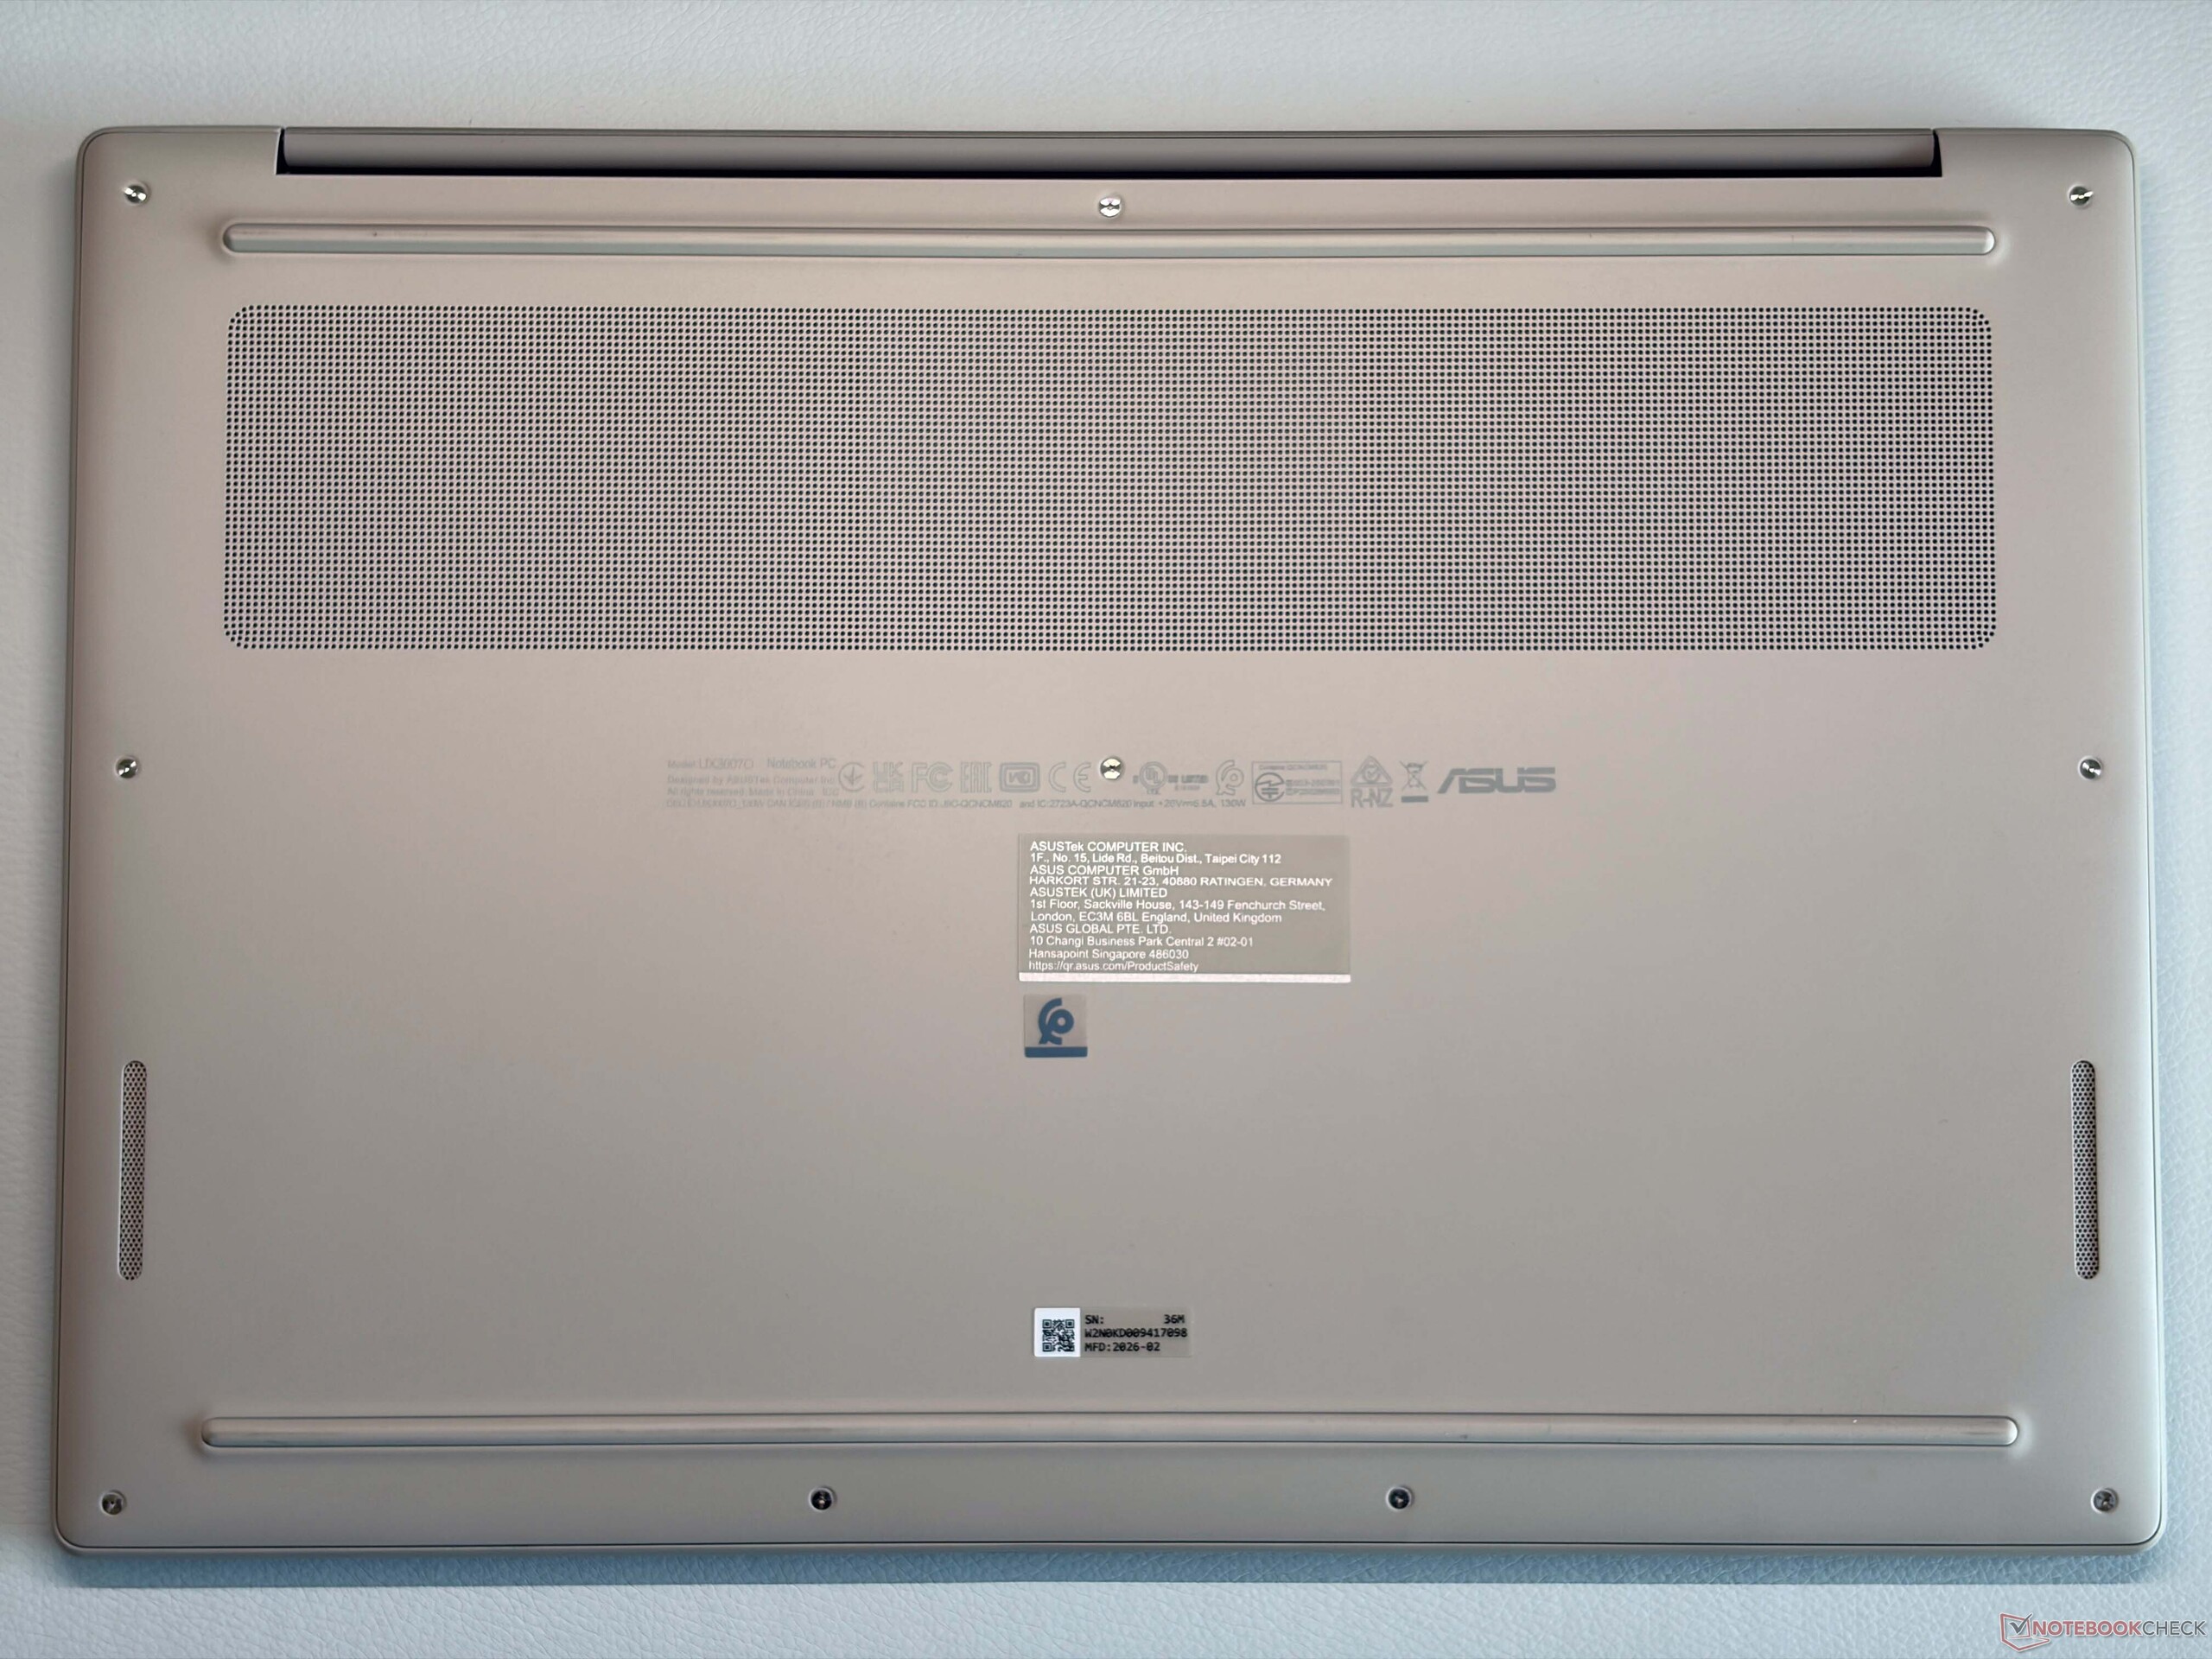
The bottom panel is secured by Torx T5 screws and it is no problem to remove it. Your maintenance tasks are limited to the cleaning of the fans and you can replace the SSD as well as the battery if necessary, all the other components are soldered.


Input Devices
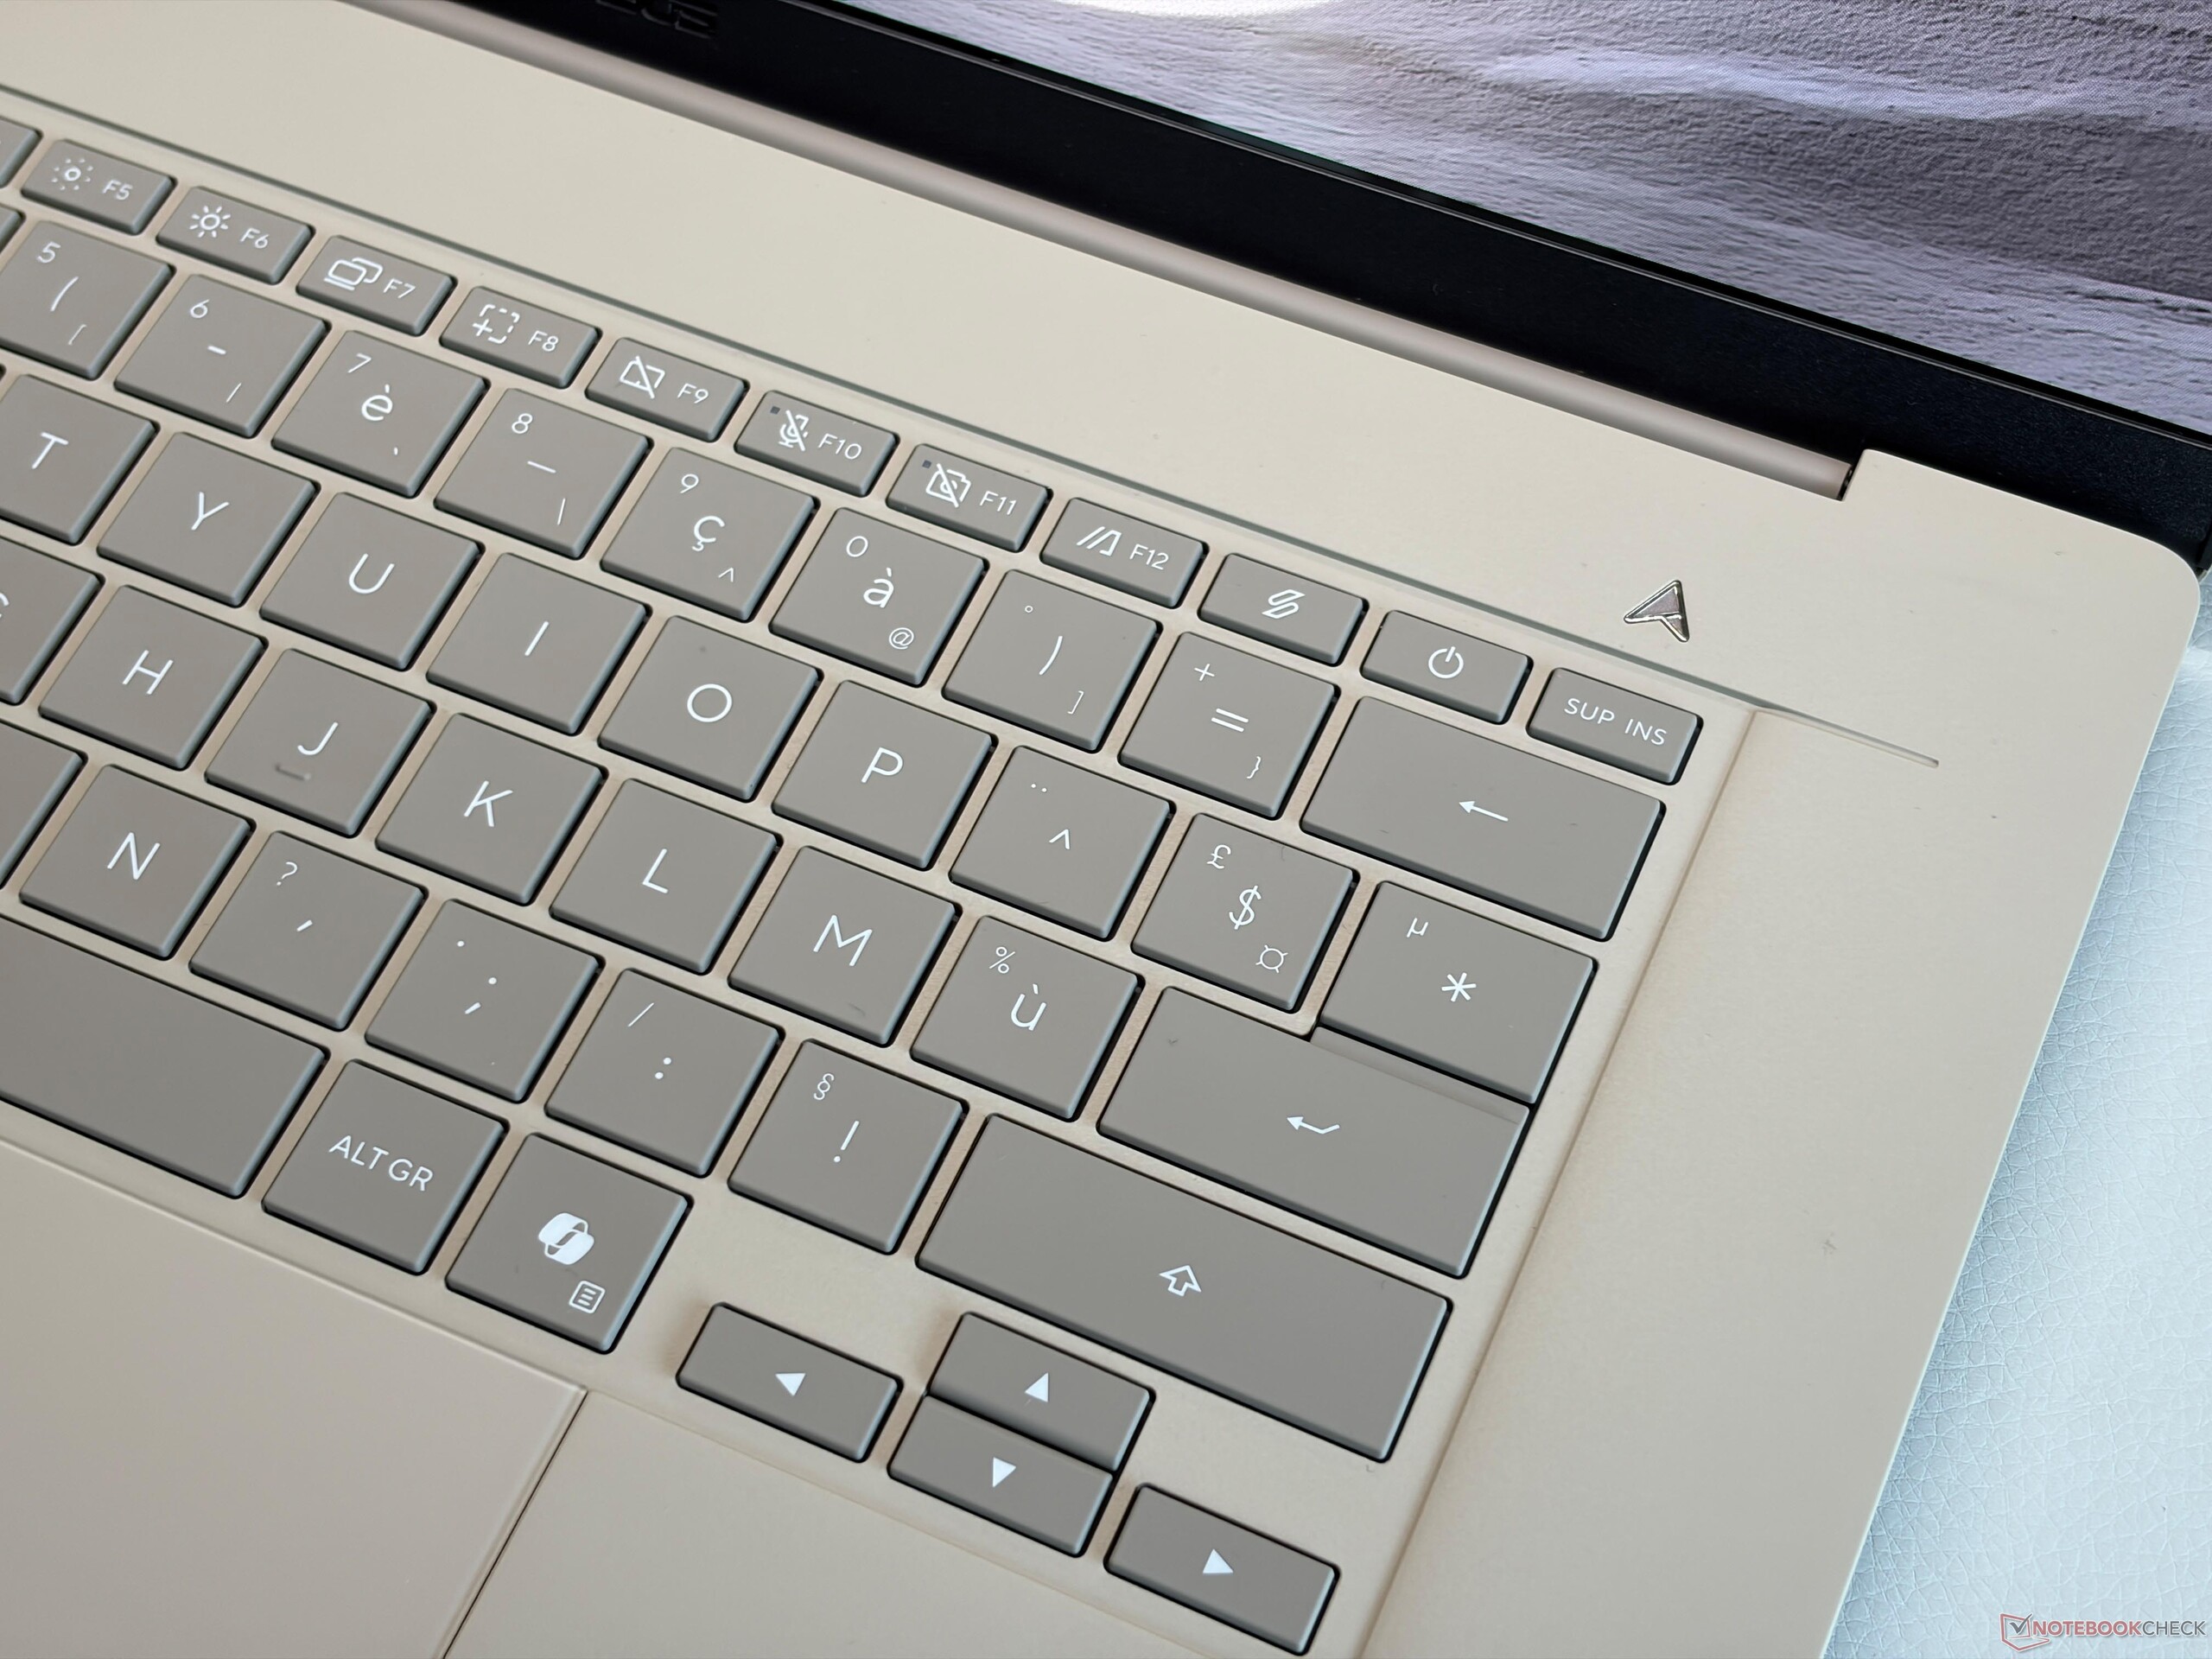
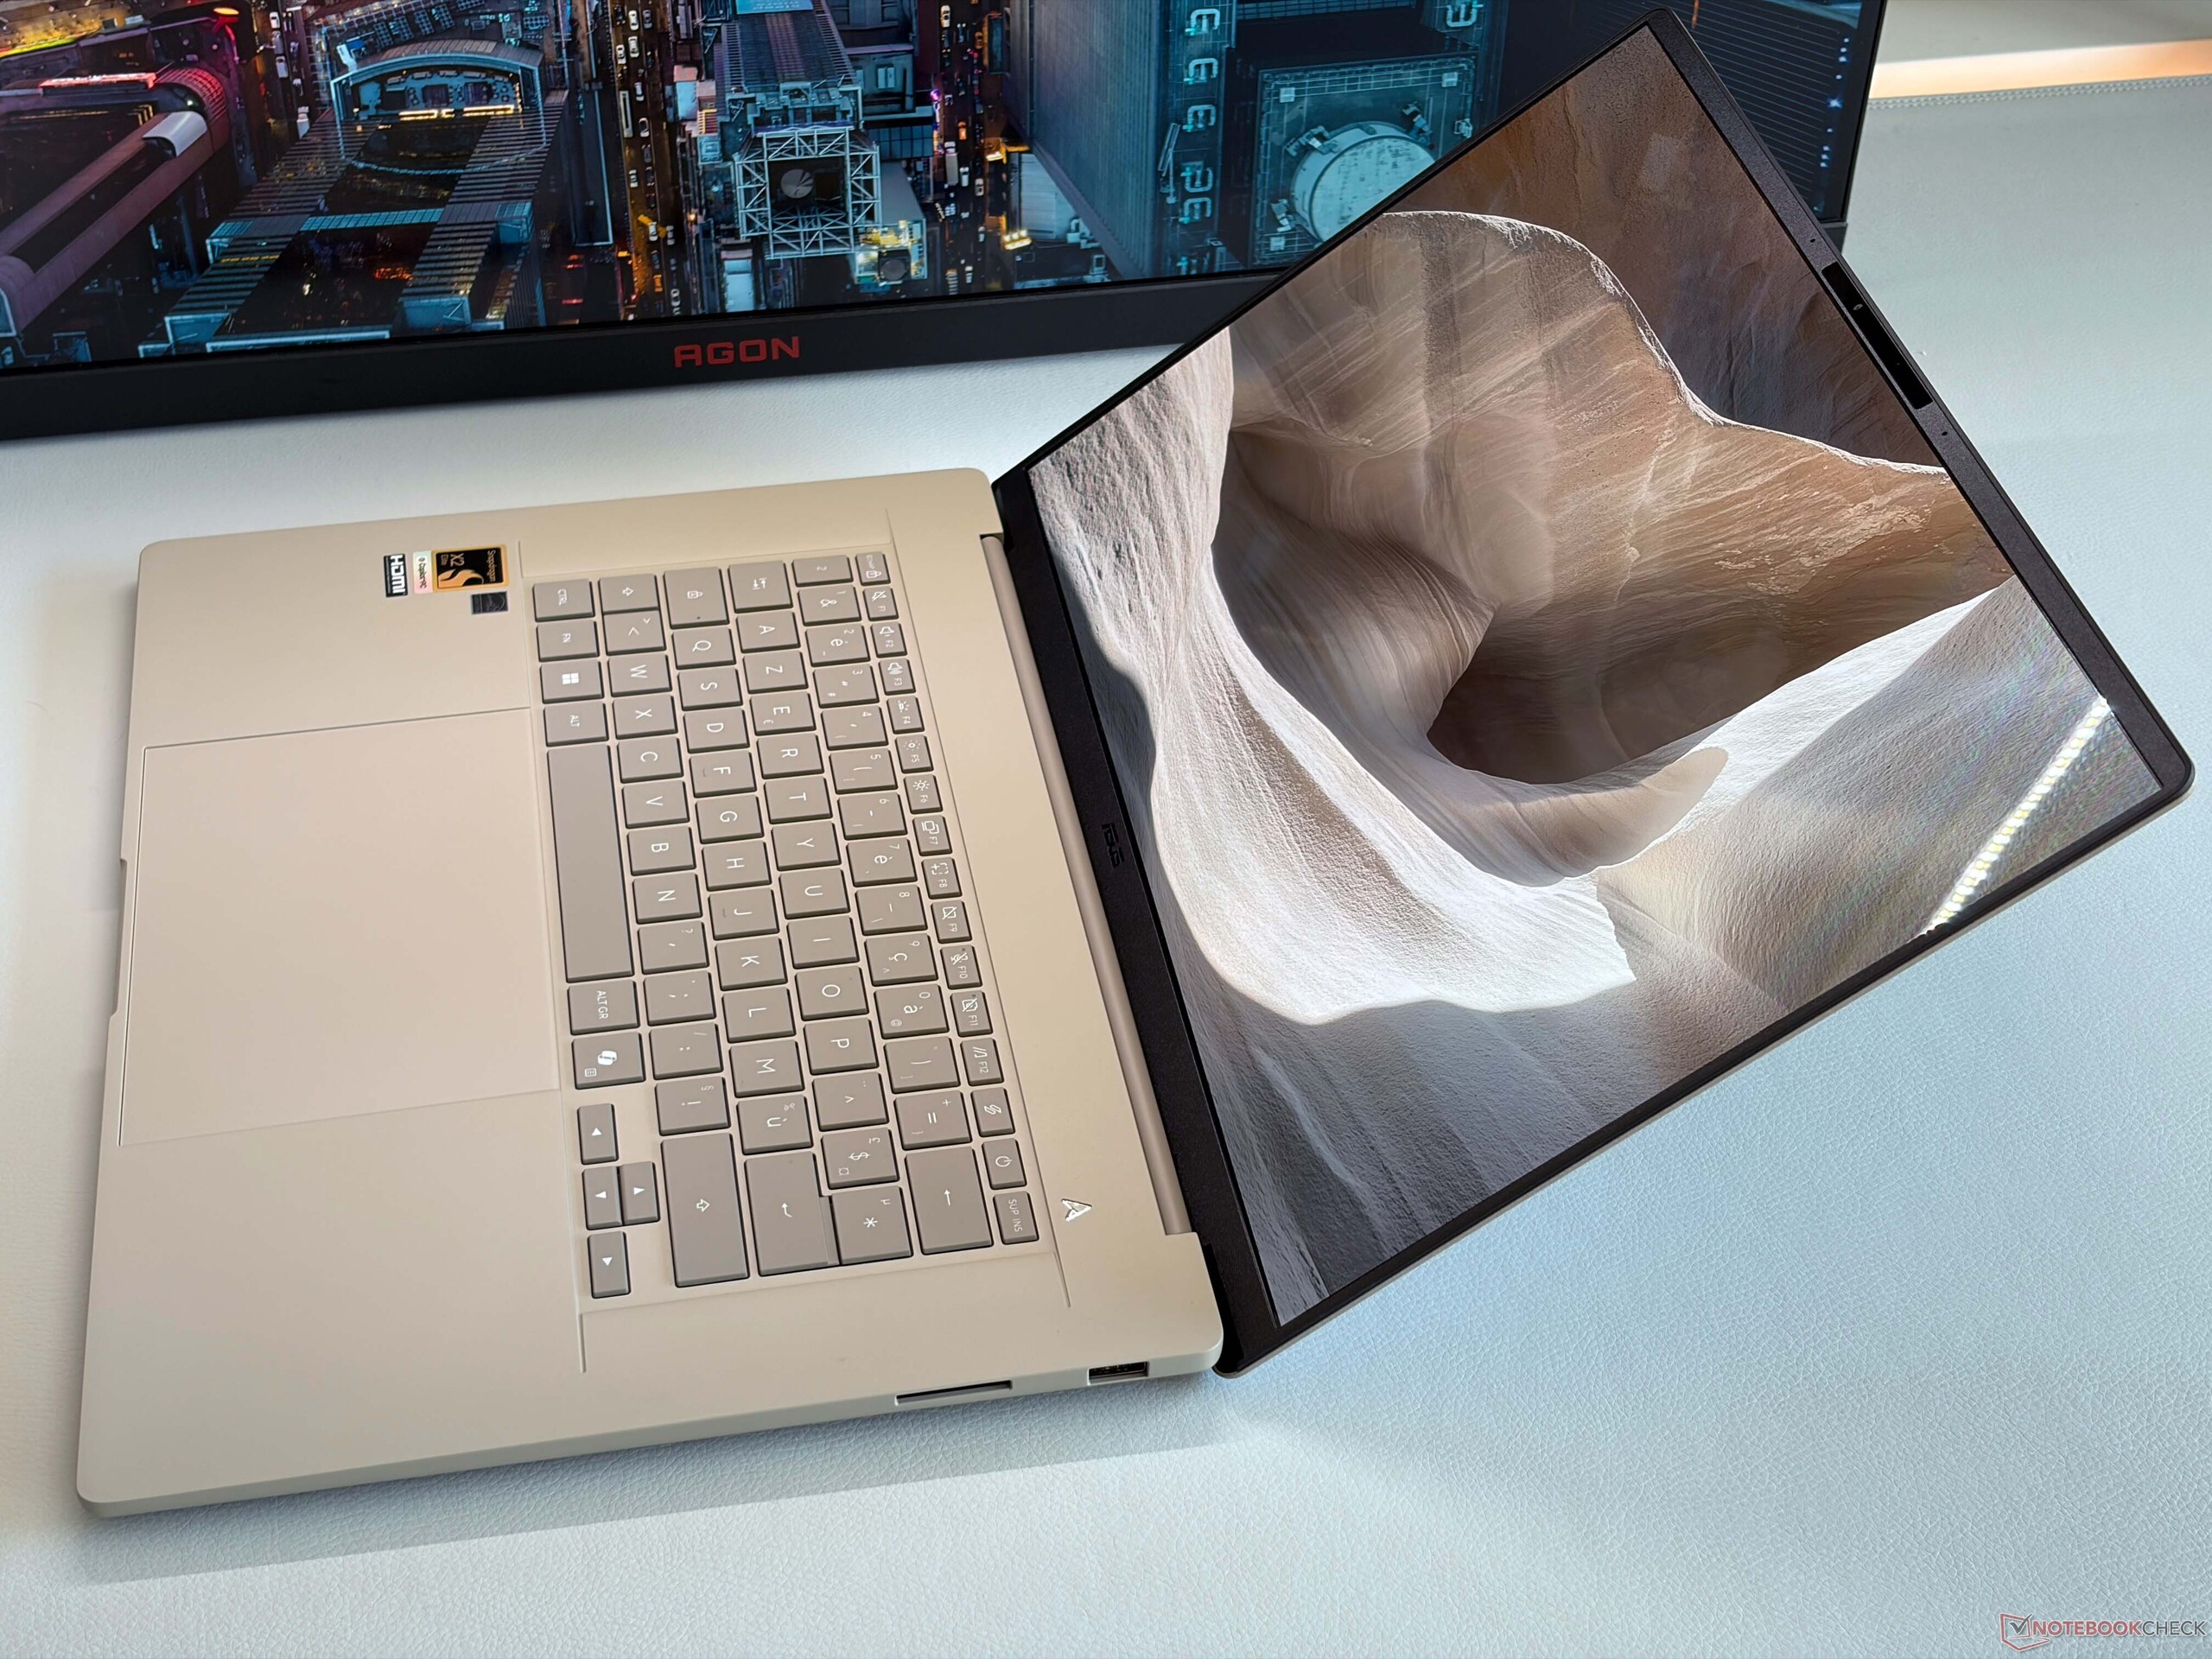
Asus uses a keyboard with 1.3 mm travel, but compared to the smaller Zenbook A14, the base unit is even more rigid and the overall typing experience is a bit more comfortable. The white background illumination works well in combination with the darker key caps and it can be controlled automatically via sensor. The large clickpad (15 x 10 cm) offers excellent gliding capabilities, but the mechanical clicks in the lower half are a bit loud. We recommend you use tap to click.


Display - 120 Hz OLED
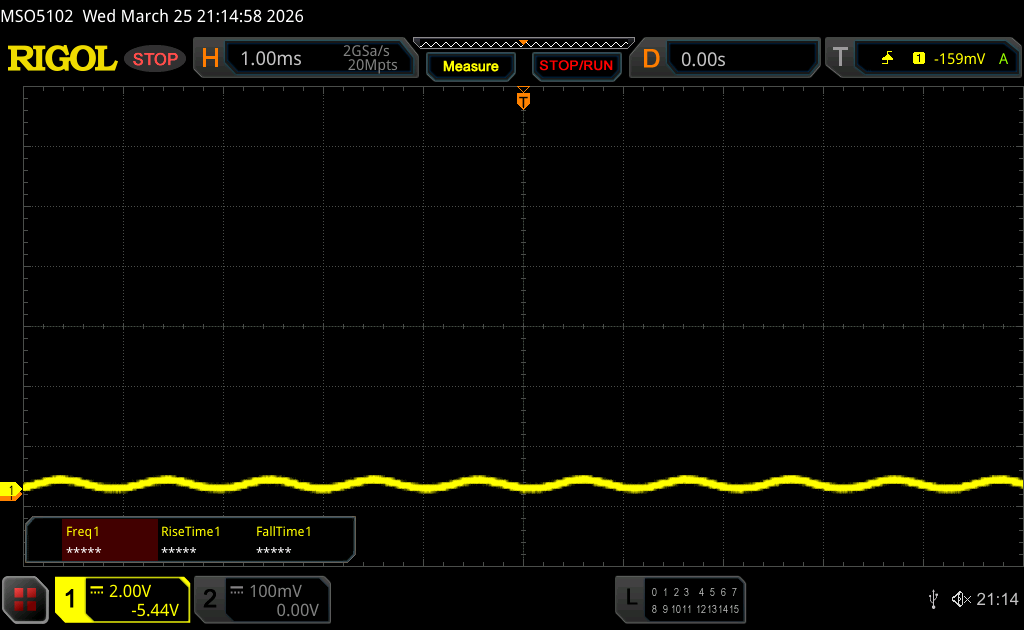
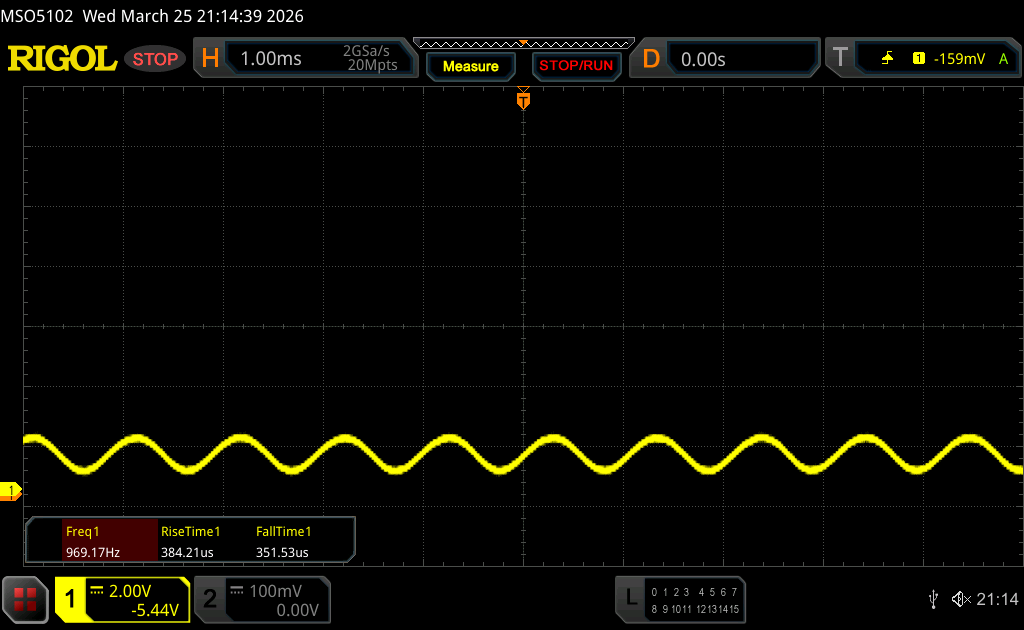
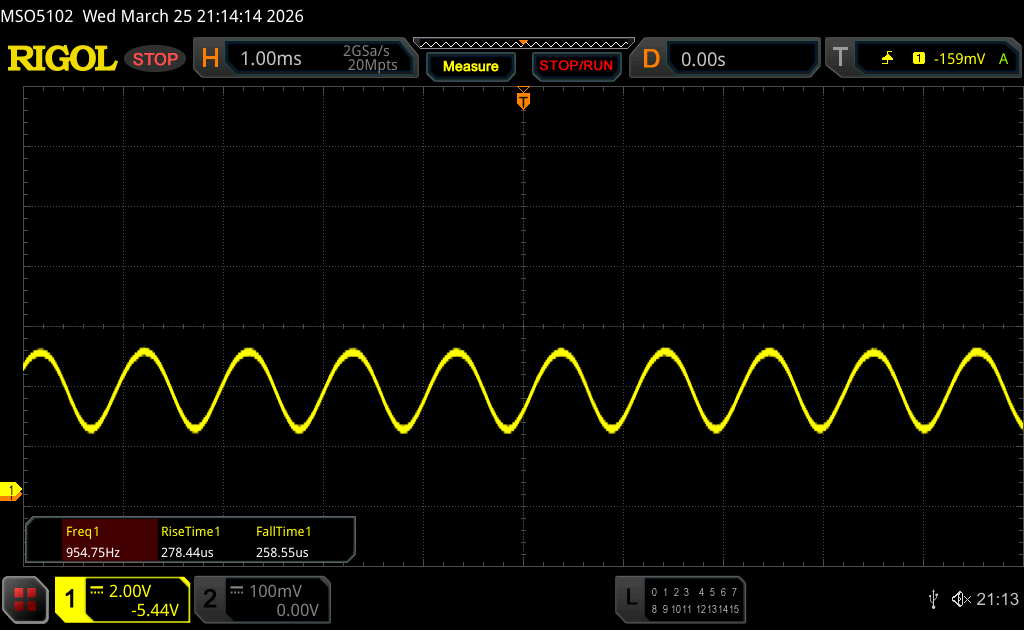
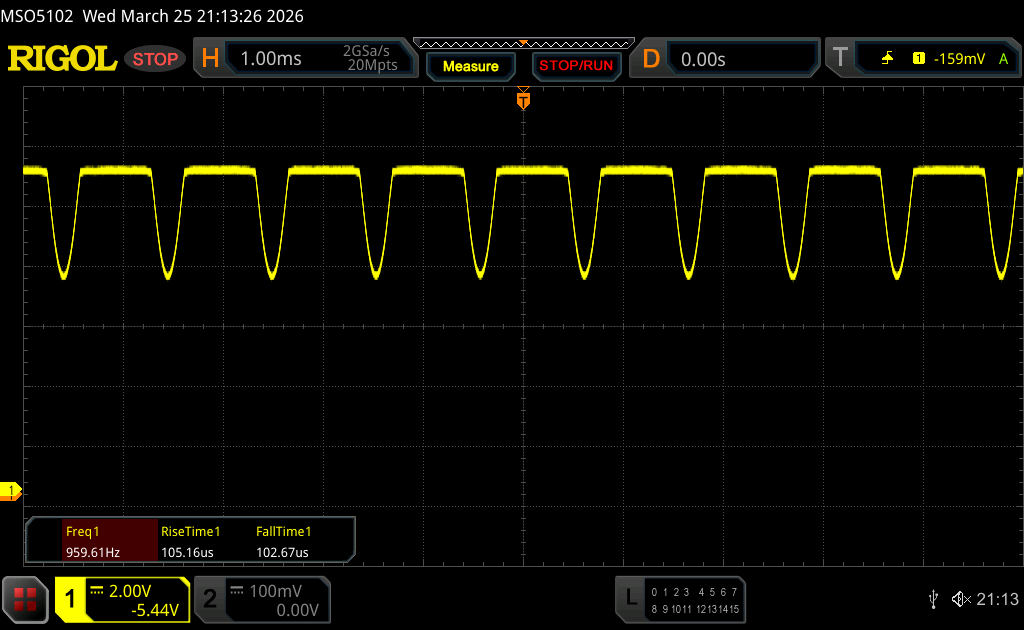
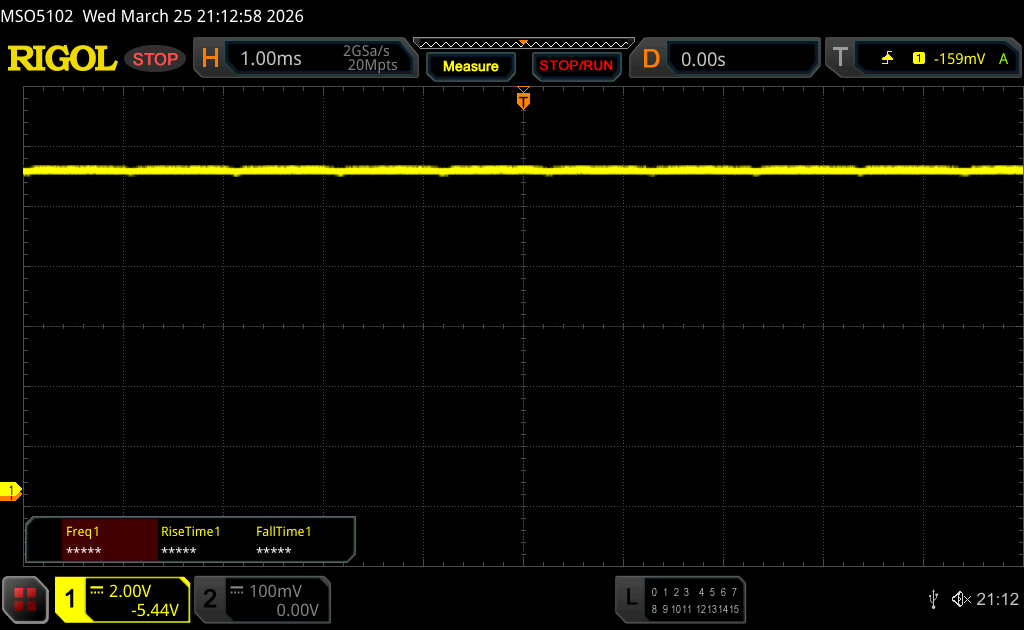
Asus uses a 2.8K OLED screen from Samsung (2880 x 1800 pixels, 16:10) with a refresh rate of 120 Hz that we already know from the AMD powered Zenbook S16. You can also get SKUs with a touchscreen, but this model is around 80 grams heavier due to an additional layer of glass. There are no problems with a grainy white contents and the overall image quality with deep blacks, rich colors and high contrast ratios is excellent. Both the brightness as well as the color temperature can be controlled via ambient light sensor. There is PWM flickering, but the frequency is pretty high at 960 Hz and Asus still offers is software solution for flicker-free OLED dimming, so the less harmful DC dimming is also used for lower brightness levels.
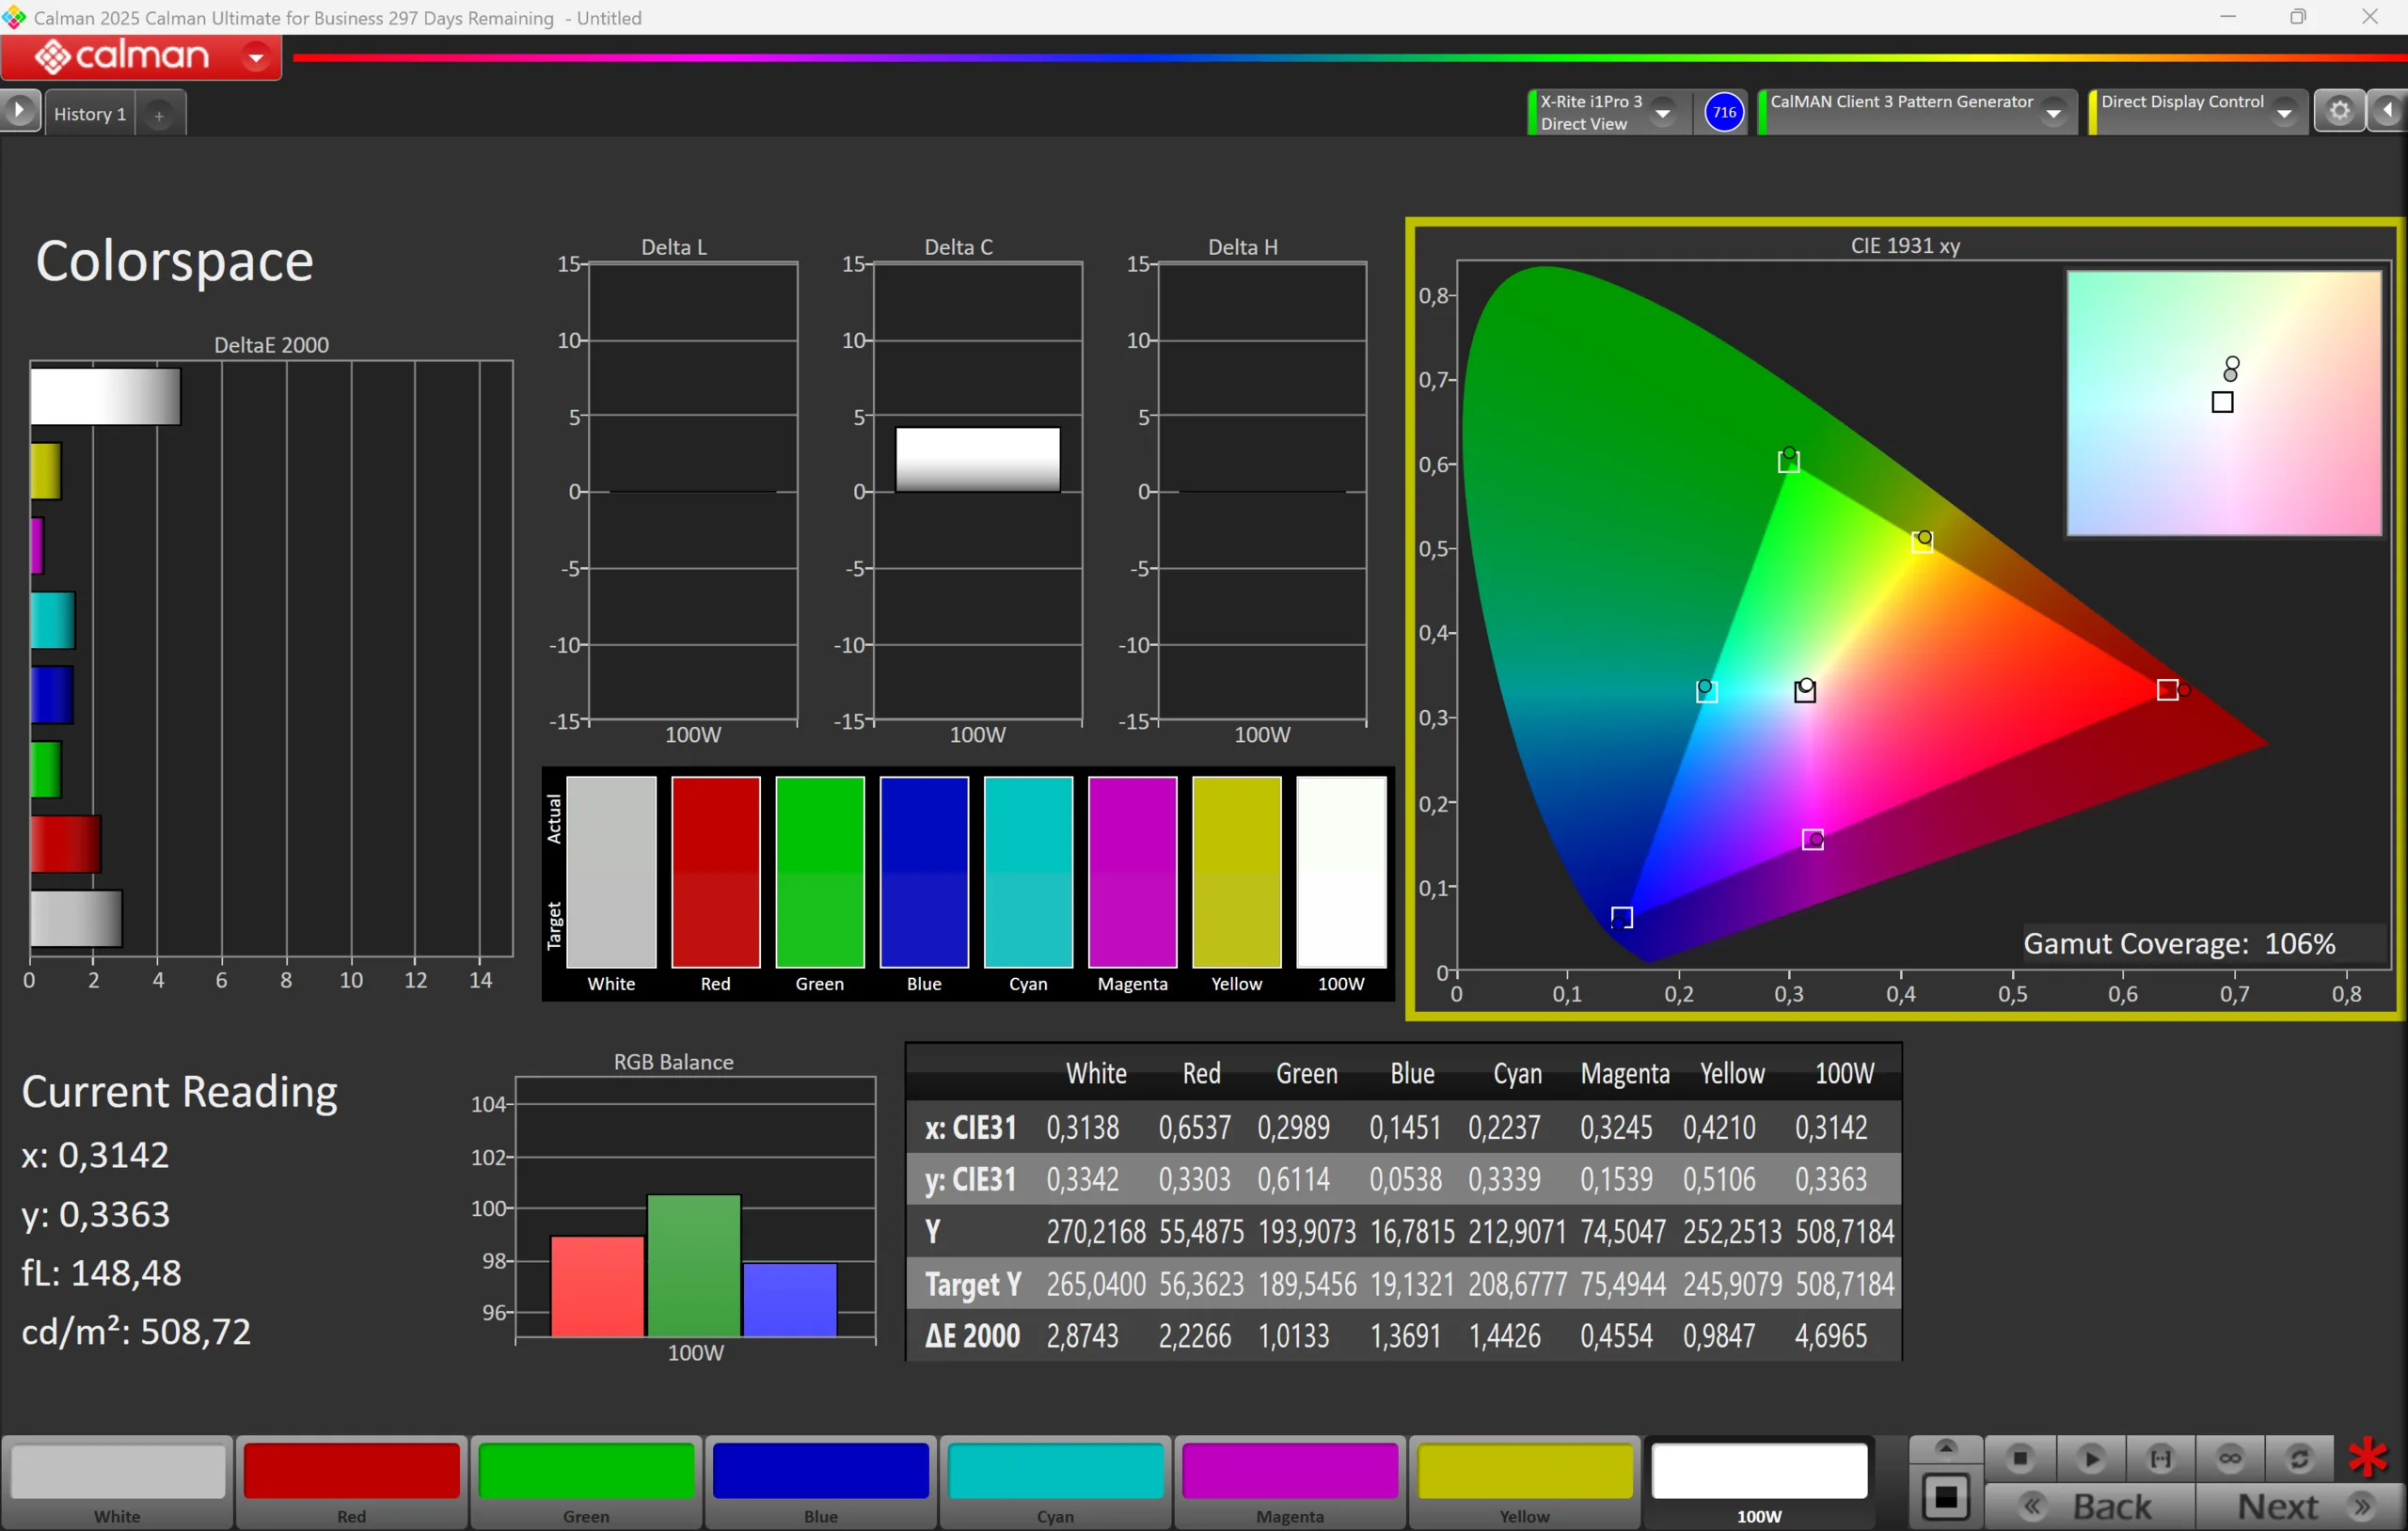
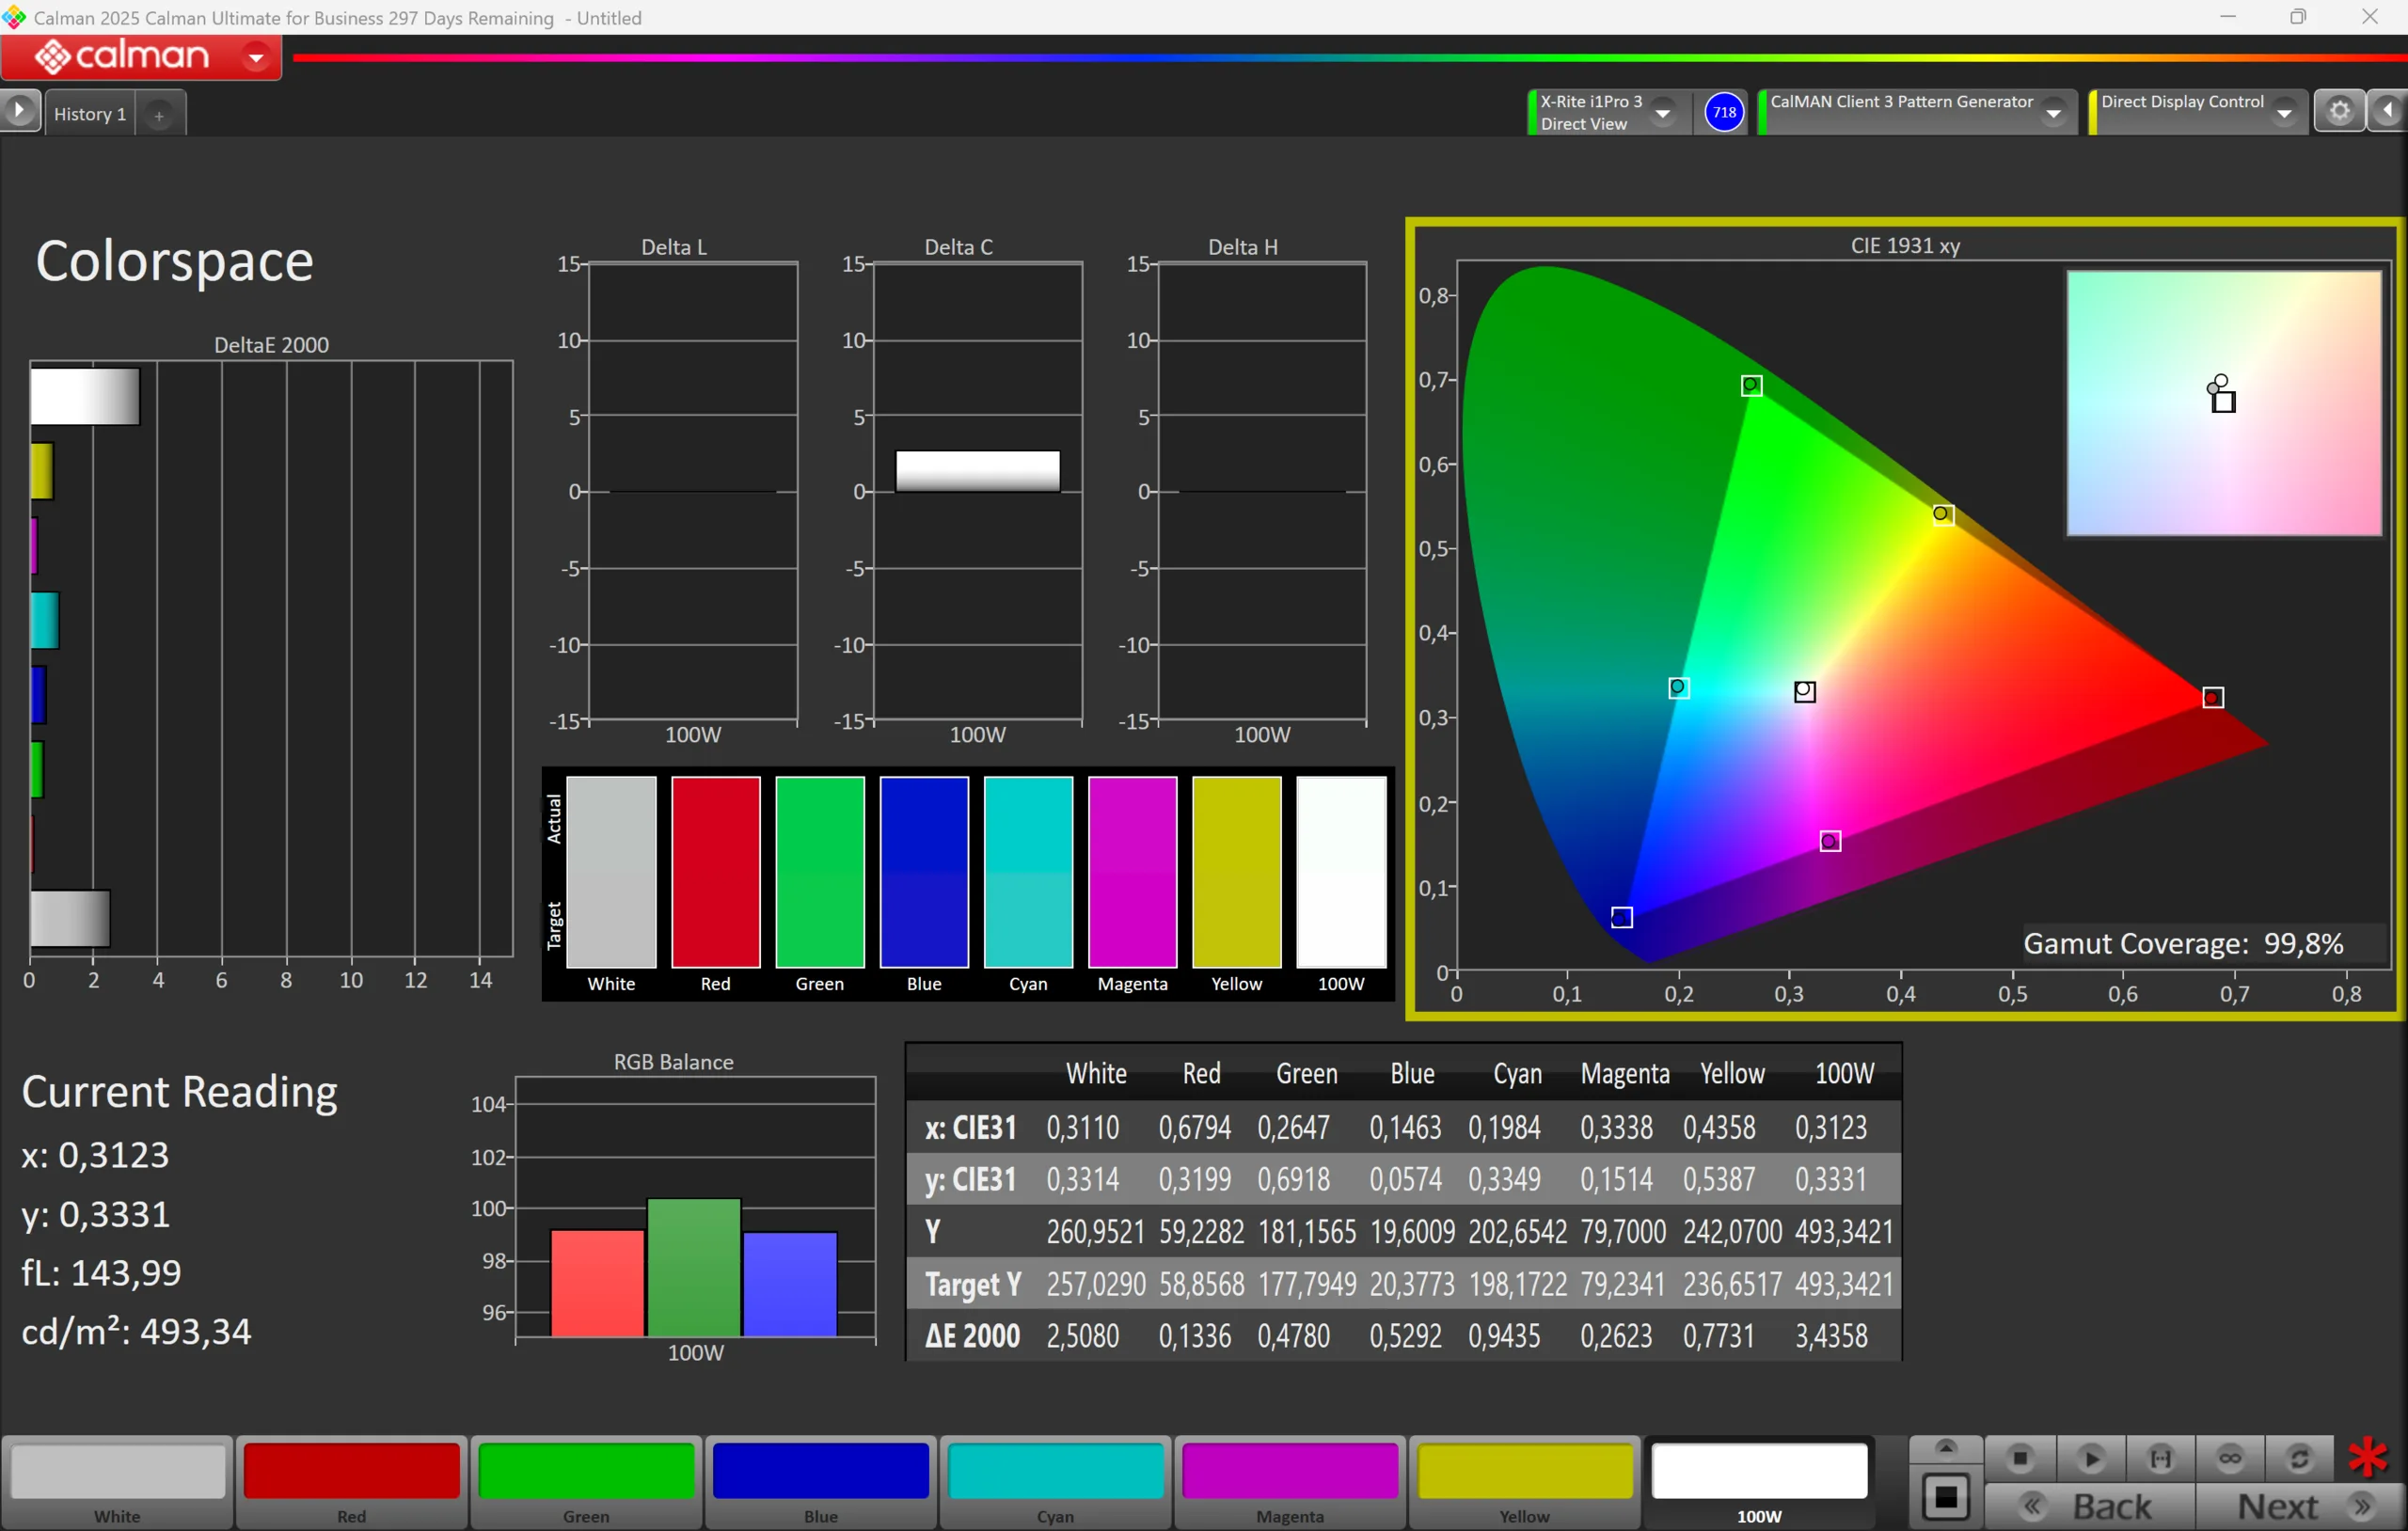
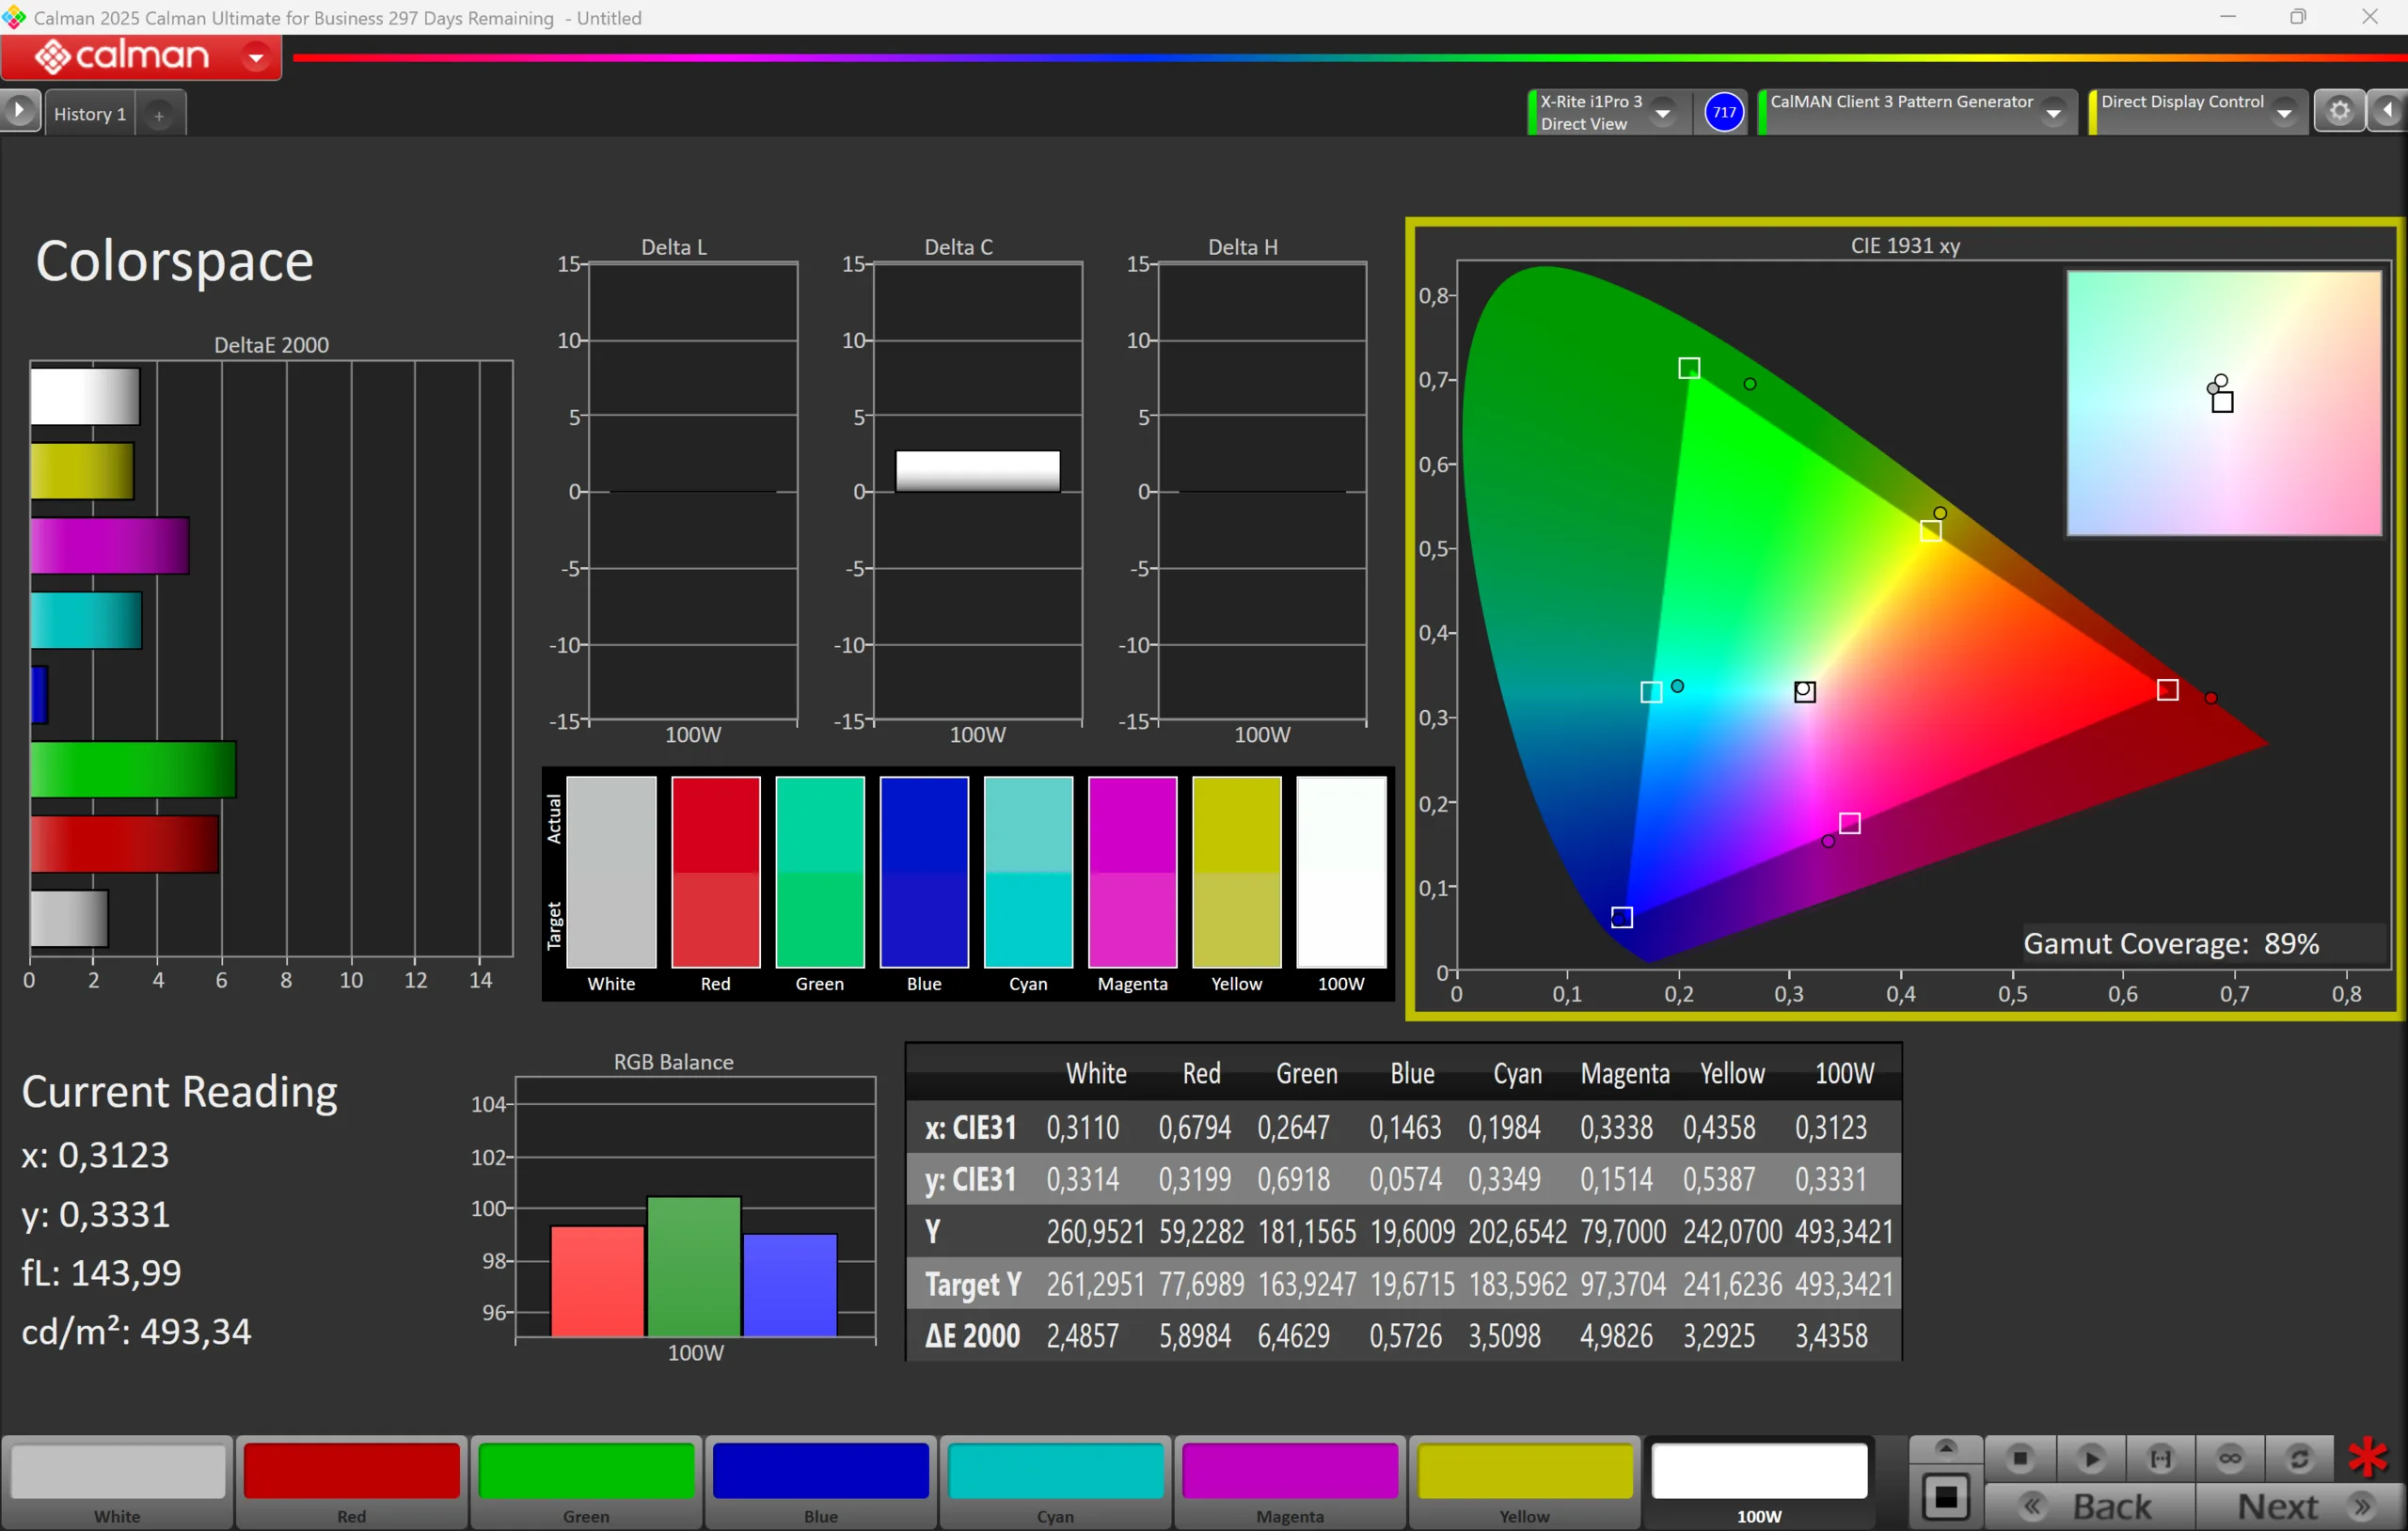
We measure an average SDR brightness of 495 nits and up to 1116 nits in HDR mode (724 nits for a completely white image). Asus offers different color profiles and we analyzed them with the professional CalMAN software. Both the P3 as well as sRGB profile offer very accurate colors, so picture editing is no problem, but the grayscale performance is not ideal. Our calibration software is not compatible with Windows on ARM, so we could not calibrate the panel.
| |||||||||||||||||||||||||
Brightness Distribution: 98 %
Center on Battery: 493 cd/m²
Contrast: 24650:1 (Black: 0.02 cd/m²)
ΔE ColorChecker Calman: 1.1 | ∀{0.5-29.43 Ø4.72}
ΔE Greyscale Calman: 2.1 | ∀{0.09-98 Ø4.97}
89% AdobeRGB 1998 (Argyll 3D)
100% sRGB (Argyll 3D)
99.8% Display P3 (Argyll 3D)
Gamma: 2.15
CCT: 6544 K
| Asus Zenbook A16 UX3607 ATNA60HR07-0, OLED, 2880x1800, 16", 120 Hz | Apple MacBook Air 15 M5 IPS, 2880x1864, 15.3", 60 Hz | Lenovo ThinkPad X9-15 Aura Edition ATNA53JB01-0, OLED, 2880x1800, 15.3", 120 Hz | Samsung Galaxy Book6 Pro ATNA60HR05-0, OLED, 2880x1800, 16", 120 Hz | Dell XPS 16 Core Ultra 5 325 LG Philips 160WUX, IPS, 1920x1200, 16", 120 Hz | Asus ZenBook S16 UM5606GA ATNA60HR07-0, OLED, 2880x1800, 16", 120 Hz | Microsoft Surface Laptop 15 Snapdragon X Elite Sharp LQ150P1JX61, IPS, 2496x1664, 15", 120 Hz | |
|---|---|---|---|---|---|---|---|
| Display | -2% | 2% | -2% | -20% | 2% | ||
| Display P3 Coverage (%) | 99.8 | 97.5 -2% | 100 0% | 98.3 -2% | 66.2 -34% | 99.8 0% | |
| sRGB Coverage (%) | 100 | 98.3 -2% | 100 0% | 99.9 0% | 97.4 -3% | 100 0% | |
| AdobeRGB 1998 Coverage (%) | 89 | 86.3 -3% | 94.6 6% | 85.9 -3% | 67.7 -24% | 94 6% | |
| Response Times | -2229% | 32% | 3% | -3591% | 15% | -4167% | |
| Response Time Grey 50% / Grey 80% * (ms) | 2 ? | 26.9 ? -1245% | 1.46 ? 27% | 0.51 ? 74% | 39.3 ? -1865% | 1.27 ? 36% | 44.4 ? -2120% |
| Response Time Black / White * (ms) | 0.48 ? | 15.9 ? -3213% | 0.44 ? 8% | 0.41 ? 15% | 26 ? -5317% | 0.43 ? 10% | 30.3 ? -6213% |
| PWM Frequency (Hz) | 960 ? | 1200 ? | 240 ? | 960 ? | |||
| PWM Amplitude * (%) | 56 | 22 61% | 100 -79% | 56 -0% | |||
| Screen | -292% | 28% | 11% | -183% | 5% | -198% | |
| Brightness middle (cd/m²) | 493 | 538 9% | 509 3% | 502 2% | 534.6 8% | 465 -6% | 579.9 18% |
| Brightness (cd/m²) | 495 | 521 5% | 508 3% | 507 2% | 515 4% | 466 -6% | 576 16% |
| Brightness Distribution (%) | 98 | 90 -8% | 97 -1% | 97 -1% | 92 -6% | 99 1% | 92 -6% |
| Black Level * (cd/m²) | 0.02 | 0.44 -2100% | 0.01 50% | 0.26 -1200% | 0.34 -1600% | ||
| Contrast (:1) | 24650 | 1223 -95% | 50900 106% | 2056 -92% | 1706 -93% | ||
| Colorchecker dE 2000 * | 1.1 | 2.1 -91% | 1.1 -0% | 1 9% | 2.53 -130% | 1 9% | 0.96 13% |
| Colorchecker dE 2000 max. * | 3.9 | 4.1 -5% | 2.5 36% | 2.4 38% | 4.57 -17% | 3 23% | 2.39 39% |
| Greyscale dE 2000 * | 2.1 | 3.1 -48% | 1.5 29% | 1.8 14% | 2.7 -29% | 1.9 10% | 1.4 33% |
| Gamma | 2.15 102% | 2.19 100% | 2.28 96% | 2.24 98% | 2.32 95% | 2.19 100% | 2.13 103% |
| CCT | 6544 99% | 7075 92% | 6294 103% | 6435 101% | 6860 95% | 6458 101% | 6407 101% |
| Colorchecker dE 2000 calibrated * | 0.7 | 1.26 | |||||
| Total Average (Program / Settings) | -841% /
-523% | 21% /
23% | 4% /
6% | -1265% /
-670% | 7% /
7% | -2183% /
-991% |
* ... smaller is better


Display Response Times
| ↔ Response Time Black to White | ||
|---|---|---|
| 0.48 ms ... rise ↗ and fall ↘ combined | ↗ 0.23 ms rise | 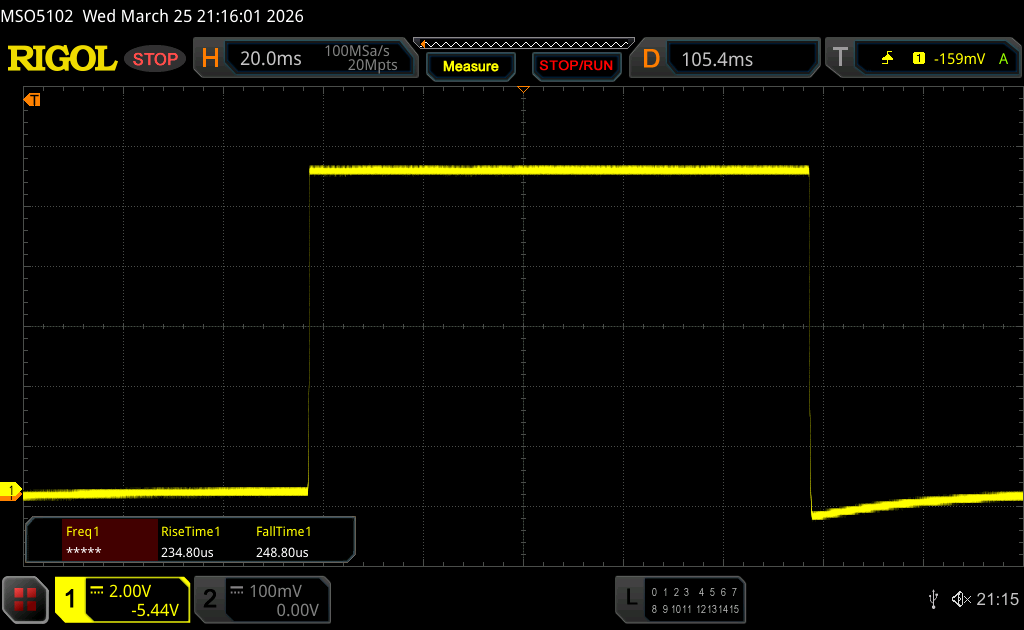 |
| ↘ 0.25 ms fall | ||
| The screen shows very fast response rates in our tests and should be very well suited for fast-paced gaming. In comparison, all tested devices range from 0.1 (minimum) to 240 (maximum) ms. » 1 % of all devices are better. This means that the measured response time is better than the average of all tested devices (19.8 ms). | ||
| ↔ Response Time 50% Grey to 80% Grey | ||
| 2 ms ... rise ↗ and fall ↘ combined | ↗ 1 ms rise | 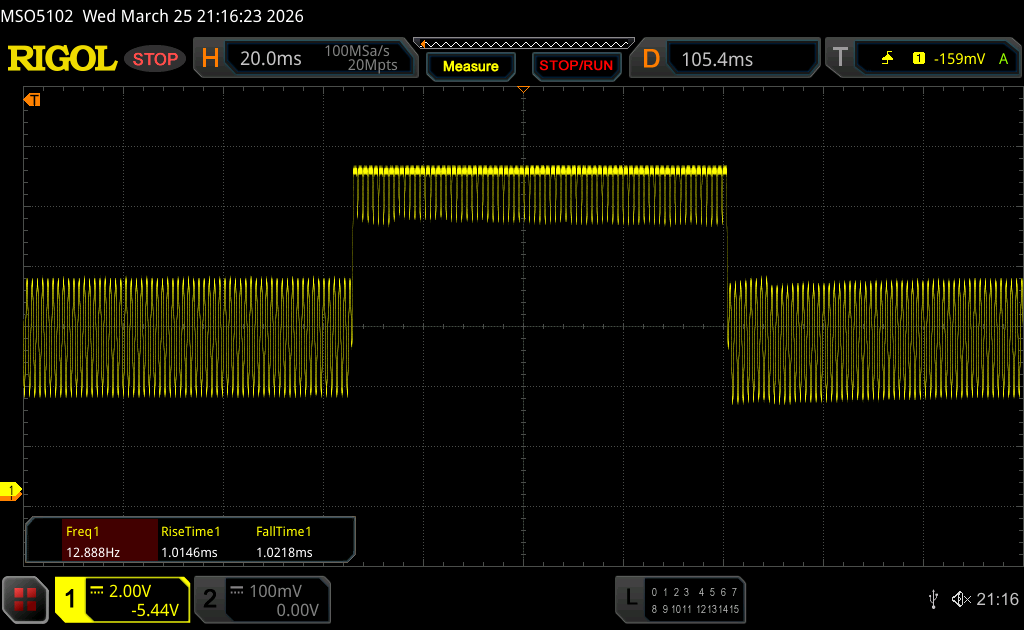 |
| ↘ 1 ms fall | ||
| The screen shows very fast response rates in our tests and should be very well suited for fast-paced gaming. In comparison, all tested devices range from 0.165 (minimum) to 636 (maximum) ms. » 10 % of all devices are better. This means that the measured response time is better than the average of all tested devices (31 ms). | ||
Screen Flickering / PWM (Pulse-Width Modulation)
| Screen flickering / PWM detected | 960 Hz Amplitude: 56 % | ≤ 100 % brightness setting | 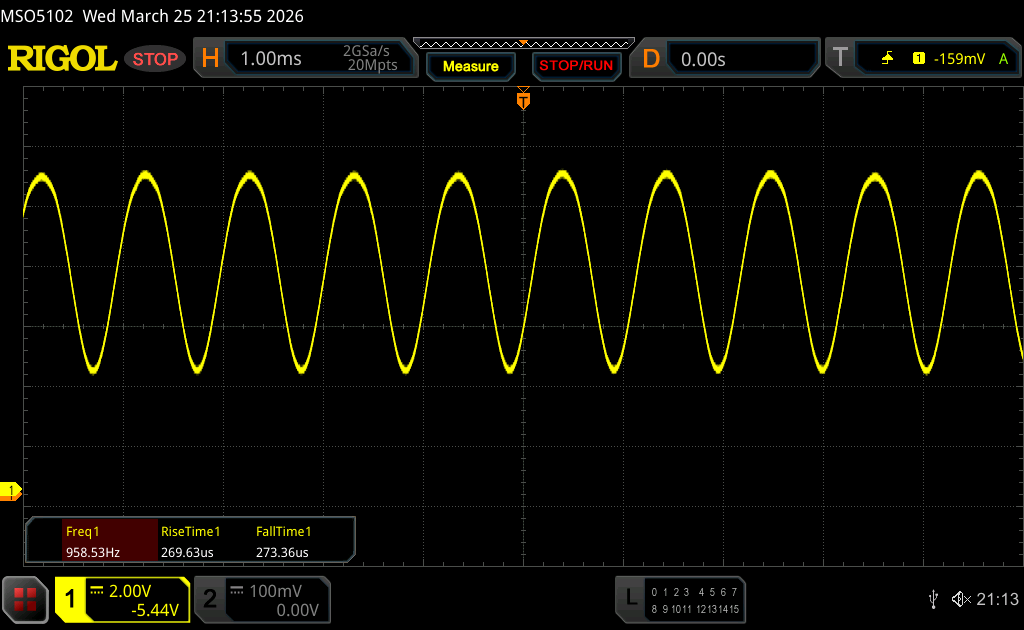 |
The display backlight flickers at 960 Hz (worst case, e.g., utilizing PWM) Flickering detected at a brightness setting of 100 % and below. There should be no flickering or PWM above this brightness setting. The frequency of 960 Hz is quite high, so most users sensitive to PWM should not notice any flickering. In comparison: 52 % of all tested devices do not use PWM to dim the display. If PWM was detected, an average of 7778 (minimum: 5 - maximum: 343500) Hz was measured. | |||


Performance - Snapdragon X2 Elite Extreme & 48 GB RAM
Testing Conditions
Asus offers multiple power profiles that can also be synchronized with the power modes of Windows. We used the Performance mode to get the maximum performance of the new Snapdragon X2 Elite Extreme, but in everyday situations, the CPU performance in Whisper mode is still around 20 % better compared to the direct Windows alternatives as well as the MacBook Air M5 (in multi-core scenarios).
| Power mode | TDP (Watts) | Cinebench 2024 Multi (points) | Steel Nomad Light (points) | Cyberpunk 2077 1080p Med (fps) | max. fan noise (dB(A)) |
|---|---|---|---|---|---|
| Whisper | 52/31/18 | 1203 | 5060 | 36.4 | 30.5 |
| Standard | 75/56/40 | 1619 | 5331 | 42.9 | 37.3 |
| Performance | 97/72 | 1761 | 5492 | 50.3 | 51.1 |
| Battery | 88/60 | 1617 | 5414 | 50.3 | 51.1 |
Processor - X2E-94-100
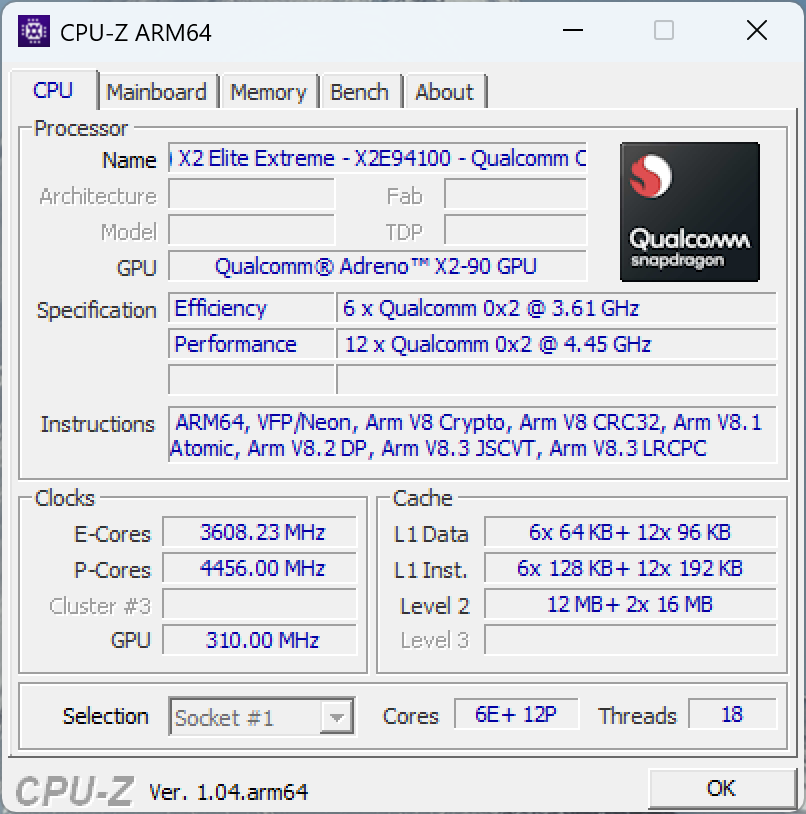
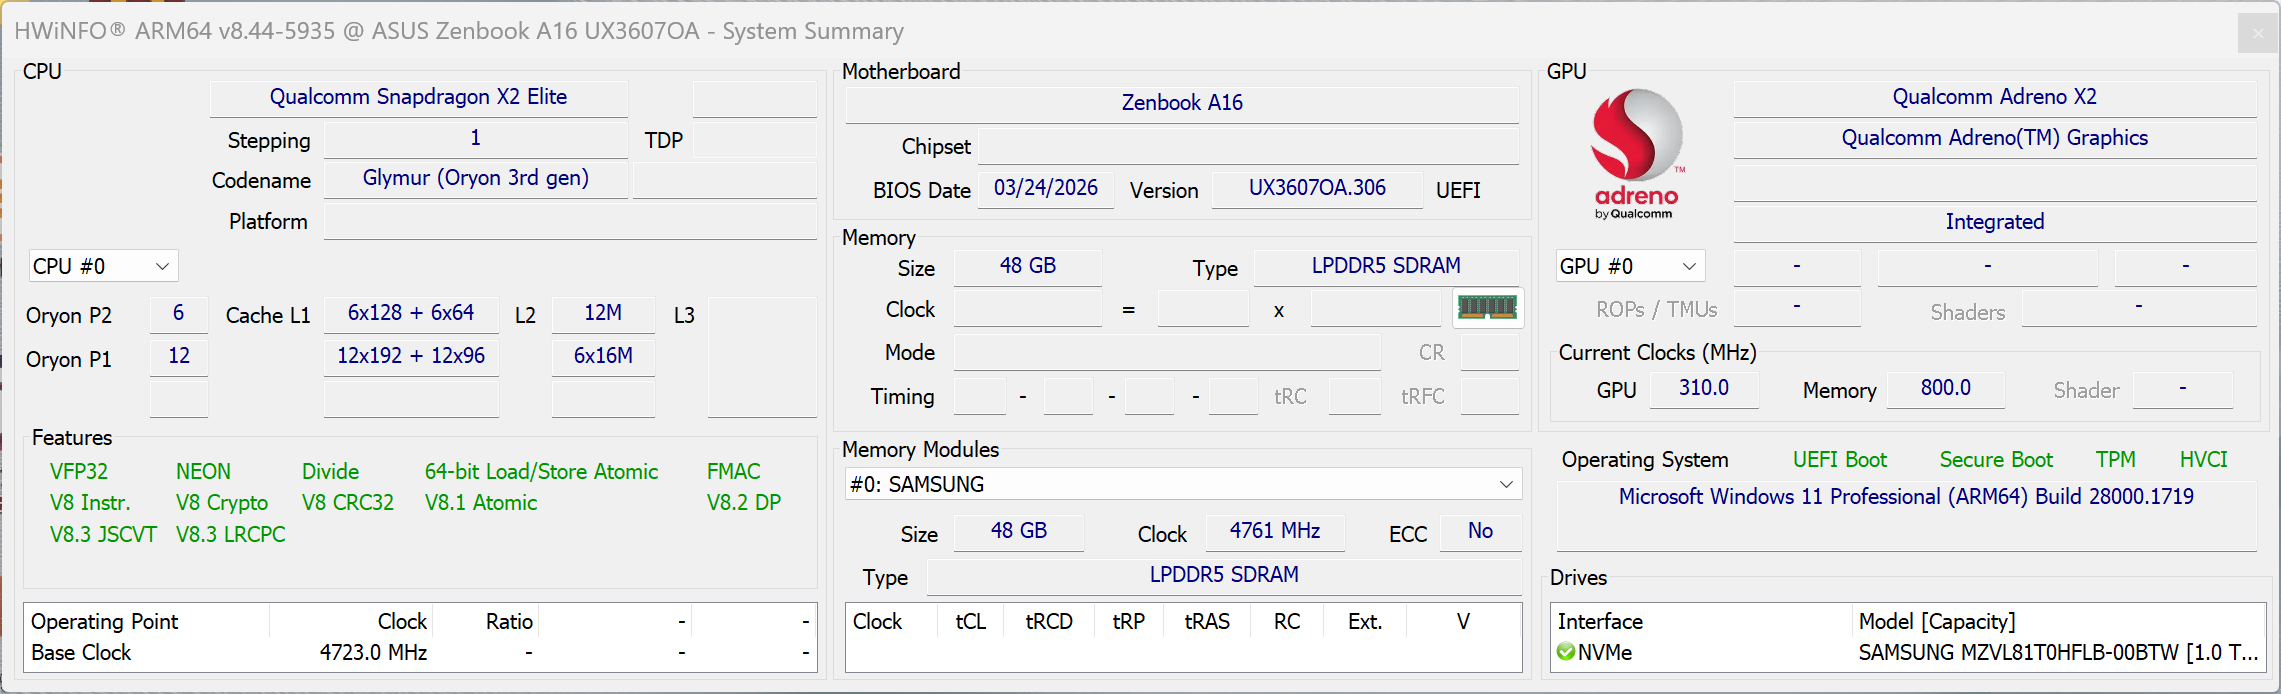
The Snapdragon X2E-94-100 is the second fastest X2 CPU and the only difference compared to the top-tier X2E-96-100 is a 300 MHz lower single-core turbo. The X2E-94-100 reaches up to 4.7 GHz and there are 18 CPU cores (2x 6 prime cores, 6 performance cores). Please see our analysis for more technical information about the new chips.
The performance of the new Snapdragon X2 chip is excellent and we can see a performance advantage of around 20 % over the previous generation in single-core scenarios and it also clearly beats all the x86 competitors from AMD as well as Intel including the latest Panther Lake generation. Compared to Apple, the Snapdragon X2 is close to the M4 generation, but the current M5 chips is still ~32 % faster.
This changes in multi-core scenarios where the new Zenbook A16 easily beats all of its rivals, and it is even 20 % faster than all of its rivals in the extremely quiet Whisper mode. This is very impressive, just as the stability of the performance. On battery power, the maximum performance is slightly reduced, but the result is still excellent (-8 %). Please see our in-depth analysis article for more benchmarks and efficiency measurements.
Cinebench R15 Multi Loop
Cinebench 2024: CPU Multi Core | CPU Single Core
Geekbench 6.7: Multi-Core | Single-Core
| CPU Performance rating | |
| Asus Zenbook A16 UX3607 | |
| Average Qualcomm Snapdragon X2 Elite Extreme X2E-94-100 | |
| Apple MacBook Air 15 M5 | |
| Samsung Galaxy Book6 Pro | |
| Average of class Multimedia | |
| Asus ZenBook S16 UM5606GA | |
| Microsoft Surface Laptop 15 Snapdragon X Elite | |
| Lenovo ThinkPad X9-15 Aura Edition | |
| Dell XPS 16 Core Ultra 5 325 | |
| Cinebench 2024 / CPU Multi Core | |
| Asus Zenbook A16 UX3607 | |
| Average Qualcomm Snapdragon X2 Elite Extreme X2E-94-100 (1203 - 1761, n=3) | |
| Average of class Multimedia (327 - 2437, n=82, last 2 years) | |
| Samsung Galaxy Book6 Pro | |
| Apple MacBook Air 15 M5 | |
| Asus ZenBook S16 UM5606GA | |
| Microsoft Surface Laptop 15 Snapdragon X Elite | |
| Dell XPS 16 Core Ultra 5 325 | |
| Lenovo ThinkPad X9-15 Aura Edition | |
| Cinebench 2024 / CPU Single Core | |
| Apple MacBook Air 15 M5 | |
| Asus Zenbook A16 UX3607 | |
| Average Qualcomm Snapdragon X2 Elite Extreme X2E-94-100 (n=1) | |
| Average of class Multimedia (72.5 - 201, n=63, last 2 years) | |
| Microsoft Surface Laptop 15 Snapdragon X Elite | |
| Samsung Galaxy Book6 Pro | |
| Lenovo ThinkPad X9-15 Aura Edition | |
| Asus ZenBook S16 UM5606GA | |
| Dell XPS 16 Core Ultra 5 325 | |
| Geekbench 6.7 / Multi-Core | |
| Asus Zenbook A16 UX3607 | |
| Average Qualcomm Snapdragon X2 Elite Extreme X2E-94-100 (n=1) | |
| Apple MacBook Air 15 M5 | |
| Samsung Galaxy Book6 Pro | |
| Average of class Multimedia (4983 - 29415, n=76, last 2 years) | |
| Asus ZenBook S16 UM5606GA | |
| Microsoft Surface Laptop 15 Snapdragon X Elite | |
| Microsoft Surface Laptop 15 Snapdragon X Elite | |
| Microsoft Surface Laptop 15 Snapdragon X Elite | |
| Dell XPS 16 Core Ultra 5 325 | |
| Lenovo ThinkPad X9-15 Aura Edition | |
| Geekbench 6.7 / Single-Core | |
| Apple MacBook Air 15 M5 | |
| Asus Zenbook A16 UX3607 | |
| Average Qualcomm Snapdragon X2 Elite Extreme X2E-94-100 (n=1) | |
| Average of class Multimedia (1534 - 4335, n=75, last 2 years) | |
| Samsung Galaxy Book6 Pro | |
| Asus ZenBook S16 UM5606GA | |
| Microsoft Surface Laptop 15 Snapdragon X Elite | |
| Microsoft Surface Laptop 15 Snapdragon X Elite | |
| Microsoft Surface Laptop 15 Snapdragon X Elite | |
| Lenovo ThinkPad X9-15 Aura Edition | |
| Dell XPS 16 Core Ultra 5 325 | |
We also included older and emulated benchmarks like Cinebench R23 as well. They did run without problems, but the performance is slightly lower compared to native apps.
Cinebench R23: Multi Core | Single Core
Cinebench R20: CPU (Multi Core) | CPU (Single Core)
Cinebench R15: CPU Multi 64Bit | CPU Single 64Bit
Blender: v2.79 BMW27 CPU
7-Zip 18.03: 7z b 4 -mmt1
HWBOT x265 Benchmark v2.2: 4k Preset
LibreOffice : 20 Documents To PDF
R Benchmark 2.5: Overall mean
| CPU Performance rating | |
| Samsung Galaxy Book6 Pro | |
| Asus Zenbook A16 UX3607 | |
| Average Qualcomm Snapdragon X2 Elite Extreme X2E-94-100 | |
| Asus ZenBook S16 UM5606GA | |
| Average of class Multimedia | |
| Dell XPS 16 Core Ultra 5 325 | |
| Lenovo ThinkPad X9-15 Aura Edition | |
| Microsoft Surface Laptop 15 Snapdragon X Elite | |
| Cinebench R23 / Multi Core | |
| Asus Zenbook A16 UX3607 | |
| Average Qualcomm Snapdragon X2 Elite Extreme X2E-94-100 (n=1) | |
| Samsung Galaxy Book6 Pro | |
| Asus ZenBook S16 UM5606GA | |
| Average of class Multimedia (4861 - 33362, n=81, last 2 years) | |
| Dell XPS 16 Core Ultra 5 325 | |
| Microsoft Surface Laptop 15 Snapdragon X Elite | |
| Lenovo ThinkPad X9-15 Aura Edition | |
| Cinebench R23 / Single Core | |
| Samsung Galaxy Book6 Pro | |
| Asus ZenBook S16 UM5606GA | |
| Average of class Multimedia (1128 - 2459, n=73, last 2 years) | |
| Lenovo ThinkPad X9-15 Aura Edition | |
| Dell XPS 16 Core Ultra 5 325 | |
| Asus Zenbook A16 UX3607 | |
| Average Qualcomm Snapdragon X2 Elite Extreme X2E-94-100 (n=1) | |
| Microsoft Surface Laptop 15 Snapdragon X Elite | |
| Cinebench R20 / CPU (Multi Core) | |
| Asus Zenbook A16 UX3607 | |
| Average Qualcomm Snapdragon X2 Elite Extreme X2E-94-100 (n=1) | |
| Samsung Galaxy Book6 Pro | |
| Asus ZenBook S16 UM5606GA | |
| Average of class Multimedia (1887 - 12912, n=64, last 2 years) | |
| Dell XPS 16 Core Ultra 5 325 | |
| Lenovo ThinkPad X9-15 Aura Edition | |
| Microsoft Surface Laptop 15 Snapdragon X Elite | |
| Cinebench R20 / CPU (Single Core) | |
| Asus ZenBook S16 UM5606GA | |
| Samsung Galaxy Book6 Pro | |
| Average of class Multimedia (425 - 853, n=64, last 2 years) | |
| Lenovo ThinkPad X9-15 Aura Edition | |
| Dell XPS 16 Core Ultra 5 325 | |
| Asus Zenbook A16 UX3607 | |
| Average Qualcomm Snapdragon X2 Elite Extreme X2E-94-100 (n=1) | |
| Microsoft Surface Laptop 15 Snapdragon X Elite | |
| Cinebench R15 / CPU Multi 64Bit | |
| Asus Zenbook A16 UX3607 | |
| Average Qualcomm Snapdragon X2 Elite Extreme X2E-94-100 (n=1) | |
| Samsung Galaxy Book6 Pro | |
| Asus ZenBook S16 UM5606GA | |
| Average of class Multimedia (856 - 5224, n=68, last 2 years) | |
| Microsoft Surface Laptop 15 Snapdragon X Elite | |
| Dell XPS 16 Core Ultra 5 325 | |
| Lenovo ThinkPad X9-15 Aura Edition | |
| Cinebench R15 / CPU Single 64Bit | |
| Samsung Galaxy Book6 Pro | |
| Asus Zenbook A16 UX3607 | |
| Average Qualcomm Snapdragon X2 Elite Extreme X2E-94-100 (n=1) | |
| Lenovo ThinkPad X9-15 Aura Edition | |
| Average of class Multimedia (184.8 - 326, n=66, last 2 years) | |
| Dell XPS 16 Core Ultra 5 325 | |
| Microsoft Surface Laptop 15 Snapdragon X Elite | |
| Asus ZenBook S16 UM5606GA | |
| Blender / v2.79 BMW27 CPU | |
| Lenovo ThinkPad X9-15 Aura Edition | |
| Microsoft Surface Laptop 15 Snapdragon X Elite | |
| Dell XPS 16 Core Ultra 5 325 | |
| Average of class Multimedia (100 - 557, n=65, last 2 years) | |
| Samsung Galaxy Book6 Pro | |
| Asus ZenBook S16 UM5606GA | |
| Asus Zenbook A16 UX3607 | |
| Average Qualcomm Snapdragon X2 Elite Extreme X2E-94-100 (n=1) | |
| 7-Zip 18.03 / 7z b 4 -mmt1 | |
| Samsung Galaxy Book6 Pro | |
| Asus Zenbook A16 UX3607 | |
| Average Qualcomm Snapdragon X2 Elite Extreme X2E-94-100 (n=1) | |
| Asus ZenBook S16 UM5606GA | |
| Average of class Multimedia (3666 - 7545, n=63, last 2 years) | |
| Lenovo ThinkPad X9-15 Aura Edition | |
| Dell XPS 16 Core Ultra 5 325 | |
| Microsoft Surface Laptop 15 Snapdragon X Elite | |
| HWBOT x265 Benchmark v2.2 / 4k Preset | |
| Asus ZenBook S16 UM5606GA | |
| Samsung Galaxy Book6 Pro | |
| Average of class Multimedia (5.26 - 36.1, n=63, last 2 years) | |
| Dell XPS 16 Core Ultra 5 325 | |
| Asus Zenbook A16 UX3607 | |
| Average Qualcomm Snapdragon X2 Elite Extreme X2E-94-100 (n=1) | |
| Lenovo ThinkPad X9-15 Aura Edition | |
| Microsoft Surface Laptop 15 Snapdragon X Elite | |
| LibreOffice / 20 Documents To PDF | |
| Samsung Galaxy Book6 Pro | |
| Asus ZenBook S16 UM5606GA | |
| Microsoft Surface Laptop 15 Snapdragon X Elite | |
| Average of class Multimedia (23.9 - 146.7, n=64, last 2 years) | |
| Dell XPS 16 Core Ultra 5 325 | |
| Lenovo ThinkPad X9-15 Aura Edition | |
| Asus Zenbook A16 UX3607 | |
| Average Qualcomm Snapdragon X2 Elite Extreme X2E-94-100 (n=1) | |
| R Benchmark 2.5 / Overall mean | |
| Microsoft Surface Laptop 15 Snapdragon X Elite | |
| Asus Zenbook A16 UX3607 | |
| Average Qualcomm Snapdragon X2 Elite Extreme X2E-94-100 (n=1) | |
| Lenovo ThinkPad X9-15 Aura Edition | |
| Average of class Multimedia (0.3604 - 0.947, n=63, last 2 years) | |
| Samsung Galaxy Book6 Pro | |
| Dell XPS 16 Core Ultra 5 325 | |
| Asus ZenBook S16 UM5606GA | |
* ... smaller is better
AIDA64: FP32 Ray-Trace | FPU Julia | CPU SHA3 | CPU Queen | FPU SinJulia | FPU Mandel | CPU AES | CPU ZLib | FP64 Ray-Trace | CPU PhotoWorxx | CPU CheckMate
| Performance rating | |
| Asus ZenBook S16 UM5606GA -1! | |
| Samsung Galaxy Book6 Pro -1! | |
| Average of class Multimedia | |
| Asus Zenbook A16 UX3607 -1! | |
| Average Qualcomm Snapdragon X2 Elite Extreme X2E-94-100 -1! | |
| Dell XPS 16 Core Ultra 5 325 -1! | |
| Lenovo ThinkPad X9-15 Aura Edition | |
| Microsoft Surface Laptop 15 Snapdragon X Elite -1! | |
| AIDA64 / FP32 Ray-Trace | |
| Asus ZenBook S16 UM5606GA (v6.92.6600) | |
| Average of class Multimedia (2214 - 50388, n=60, last 2 years) | |
| Samsung Galaxy Book6 Pro (v8.20.8100) | |
| Asus Zenbook A16 UX3607 (v8.20.8100) | |
| Average Qualcomm Snapdragon X2 Elite Extreme X2E-94-100 (n=1) | |
| Lenovo ThinkPad X9-15 Aura Edition (v6.92.6600) | |
| Lenovo ThinkPad X9-15 Aura Edition (v6.92.6600) | |
| Lenovo ThinkPad X9-15 Aura Edition (v8.20.8100) | |
| Dell XPS 16 Core Ultra 5 325 (v8.20.8100) | |
| Microsoft Surface Laptop 15 Snapdragon X Elite (v6.92.6600) | |
| AIDA64 / FPU Julia | |
| Asus ZenBook S16 UM5606GA (v6.92.6600) | |
| Average of class Multimedia (12867 - 201874, n=61, last 2 years) | |
| Samsung Galaxy Book6 Pro (v8.20.8100) | |
| Dell XPS 16 Core Ultra 5 325 (v8.20.8100) | |
| Lenovo ThinkPad X9-15 Aura Edition (v6.92.6600) | |
| Lenovo ThinkPad X9-15 Aura Edition (v8.20.8100) | |
| Lenovo ThinkPad X9-15 Aura Edition (v6.92.6600) | |
| Asus Zenbook A16 UX3607 (v8.20.8100) | |
| Average Qualcomm Snapdragon X2 Elite Extreme X2E-94-100 (n=1) | |
| Microsoft Surface Laptop 15 Snapdragon X Elite (v6.92.6600) | |
| AIDA64 / CPU SHA3 | |
| Asus Zenbook A16 UX3607 (v8.20.8100) | |
| Average Qualcomm Snapdragon X2 Elite Extreme X2E-94-100 (n=1) | |
| Asus ZenBook S16 UM5606GA (v6.92.6600) | |
| Samsung Galaxy Book6 Pro (v8.20.8100) | |
| Average of class Multimedia (626 - 8623, n=61, last 2 years) | |
| Microsoft Surface Laptop 15 Snapdragon X Elite (v6.92.6600) | |
| Dell XPS 16 Core Ultra 5 325 (v8.20.8100) | |
| Lenovo ThinkPad X9-15 Aura Edition (v6.92.6600) | |
| Lenovo ThinkPad X9-15 Aura Edition (v8.20.8100) | |
| Lenovo ThinkPad X9-15 Aura Edition (v6.92.6600) | |
| AIDA64 / CPU Queen | |
| Asus ZenBook S16 UM5606GA (v6.92.6600) | |
| Average of class Multimedia (13483 - 181505, n=48, last 2 years) | |
| Microsoft Surface Laptop 15 Snapdragon X Elite (v6.92.6600) | |
| Lenovo ThinkPad X9-15 Aura Edition (v6.92.6600) | |
| Lenovo ThinkPad X9-15 Aura Edition (v6.92.6600) | |
| AIDA64 / FPU SinJulia | |
| Asus ZenBook S16 UM5606GA (v6.92.6600) | |
| Average of class Multimedia (886 - 28794, n=61, last 2 years) | |
| Samsung Galaxy Book6 Pro (v8.20.8100) | |
| Lenovo ThinkPad X9-15 Aura Edition (v8.20.8100) | |
| Lenovo ThinkPad X9-15 Aura Edition (v6.92.6600) | |
| Lenovo ThinkPad X9-15 Aura Edition (v6.92.6600) | |
| Dell XPS 16 Core Ultra 5 325 (v8.20.8100) | |
| Asus Zenbook A16 UX3607 (v8.20.8100) | |
| Average Qualcomm Snapdragon X2 Elite Extreme X2E-94-100 (n=1) | |
| Microsoft Surface Laptop 15 Snapdragon X Elite (v6.92.6600) | |
| AIDA64 / FPU Mandel | |
| Asus ZenBook S16 UM5606GA (v6.92.6600) | |
| Samsung Galaxy Book6 Pro (v8.20.8100) | |
| Average of class Multimedia (6395 - 105740, n=60, last 2 years) | |
| Dell XPS 16 Core Ultra 5 325 (v8.20.8100) | |
| Lenovo ThinkPad X9-15 Aura Edition (v6.92.6600) | |
| Lenovo ThinkPad X9-15 Aura Edition (v6.92.6600) | |
| Lenovo ThinkPad X9-15 Aura Edition (v8.20.8100) | |
| Asus Zenbook A16 UX3607 (v8.20.8100) | |
| Average Qualcomm Snapdragon X2 Elite Extreme X2E-94-100 (n=1) | |
| Microsoft Surface Laptop 15 Snapdragon X Elite (v6.92.6600) | |
| AIDA64 / CPU AES | |
| Asus Zenbook A16 UX3607 (v8.20.8100) | |
| Average Qualcomm Snapdragon X2 Elite Extreme X2E-94-100 (n=1) | |
| Asus ZenBook S16 UM5606GA (v6.92.6600) | |
| Average of class Multimedia (8171 - 126790, n=61, last 2 years) | |
| Samsung Galaxy Book6 Pro (v8.20.8100) | |
| Microsoft Surface Laptop 15 Snapdragon X Elite (v6.92.6600) | |
| Lenovo ThinkPad X9-15 Aura Edition (v8.20.8100) | |
| Lenovo ThinkPad X9-15 Aura Edition (v6.92.6600) | |
| Lenovo ThinkPad X9-15 Aura Edition (v6.92.6600) | |
| Dell XPS 16 Core Ultra 5 325 (v8.20.8100) | |
| AIDA64 / CPU ZLib | |
| Asus Zenbook A16 UX3607 (v8.20.8100) | |
| Average Qualcomm Snapdragon X2 Elite Extreme X2E-94-100 (n=1) | |
| Asus ZenBook S16 UM5606GA (v6.92.6600) | |
| Samsung Galaxy Book6 Pro (v8.20.8100) | |
| Average of class Multimedia (143.8 - 2022, n=61, last 2 years) | |
| Microsoft Surface Laptop 15 Snapdragon X Elite (v6.92.6600) | |
| Dell XPS 16 Core Ultra 5 325 (v8.20.8100) | |
| Lenovo ThinkPad X9-15 Aura Edition (v6.92.6600) | |
| Lenovo ThinkPad X9-15 Aura Edition (v8.20.8100) | |
| Lenovo ThinkPad X9-15 Aura Edition (v6.92.6600) | |
| AIDA64 / FP64 Ray-Trace | |
| Asus ZenBook S16 UM5606GA (v6.92.6600) | |
| Average of class Multimedia (1014 - 26875, n=61, last 2 years) | |
| Samsung Galaxy Book6 Pro (v8.20.8100) | |
| Asus Zenbook A16 UX3607 (v8.20.8100) | |
| Average Qualcomm Snapdragon X2 Elite Extreme X2E-94-100 (n=1) | |
| Lenovo ThinkPad X9-15 Aura Edition (v6.92.6600) | |
| Lenovo ThinkPad X9-15 Aura Edition (v6.92.6600) | |
| Lenovo ThinkPad X9-15 Aura Edition (v8.20.8100) | |
| Dell XPS 16 Core Ultra 5 325 (v8.20.8100) | |
| Microsoft Surface Laptop 15 Snapdragon X Elite (v6.92.6600) | |
| AIDA64 / CPU PhotoWorxx | |
| Samsung Galaxy Book6 Pro (v8.20.8100) | |
| Asus Zenbook A16 UX3607 (v8.20.8100) | |
| Average Qualcomm Snapdragon X2 Elite Extreme X2E-94-100 (n=1) | |
| Lenovo ThinkPad X9-15 Aura Edition (v8.20.8100) | |
| Lenovo ThinkPad X9-15 Aura Edition (v6.92.6600) | |
| Lenovo ThinkPad X9-15 Aura Edition (v6.92.6600) | |
| Dell XPS 16 Core Ultra 5 325 (v8.20.8100) | |
| Asus ZenBook S16 UM5606GA (v6.92.6600) | |
| Average of class Multimedia (8187 - 88154, n=61, last 2 years) | |
| Microsoft Surface Laptop 15 Snapdragon X Elite (v6.92.6600) | |
| AIDA64 / CPU CheckMate | |
| Samsung Galaxy Book6 Pro (v8.20.8100) | |
| Average of class Multimedia (569 - 4742, n=16, last 2 years) | |
| Dell XPS 16 Core Ultra 5 325 (v8.20.8100) | |
| Lenovo ThinkPad X9-15 Aura Edition (v8.20.8100) | |
| Asus Zenbook A16 UX3607 (v8.20.8100) | |
| Average Qualcomm Snapdragon X2 Elite Extreme X2E-94-100 (n=1) | |
System Performance
The subjective performance impression is very good and we did not encounter any stability issues during our review period. Compared to the previous Snapdragon X1 generation, the whole Windows on ARM experience was much smoother for our tests, but there can still be compatibility issues with legacy or specialized software. We could not use our calibration software, for example. We recommend you check if all the apps you need actually work properly before you purchase a Snapdragon laptop.
CrossMark: Overall | Productivity | Creativity | Responsiveness
WebXPRT 3: Overall
WebXPRT 4: Overall
Mozilla Kraken 1.1: Total
| Performance rating | |
| Apple MacBook Air 15 M5 | |
| Asus Zenbook A16 UX3607 | |
| Average Qualcomm Snapdragon X2 Elite Extreme X2E-94-100, Qualcomm Adreno X2-90 | |
| Samsung Galaxy Book6 Pro | |
| Average of class Multimedia | |
| Microsoft Surface Laptop 15 Snapdragon X Elite | |
| Lenovo ThinkPad X9-15 Aura Edition | |
| Dell XPS 16 Core Ultra 5 325 | |
| Asus ZenBook S16 UM5606GA | |
| CrossMark / Overall | |
| Apple MacBook Air 15 M5 | |
| Samsung Galaxy Book6 Pro | |
| Asus Zenbook A16 UX3607 | |
| Average Qualcomm Snapdragon X2 Elite Extreme X2E-94-100, Qualcomm Adreno X2-90 (n=1) | |
| Average of class Multimedia (866 - 2728, n=67, last 2 years) | |
| Lenovo ThinkPad X9-15 Aura Edition | |
| Dell XPS 16 Core Ultra 5 325 | |
| Asus ZenBook S16 UM5606GA | |
| Microsoft Surface Laptop 15 Snapdragon X Elite | |
| CrossMark / Productivity | |
| Apple MacBook Air 15 M5 | |
| Samsung Galaxy Book6 Pro | |
| Average of class Multimedia (931 - 2489, n=67, last 2 years) | |
| Asus Zenbook A16 UX3607 | |
| Average Qualcomm Snapdragon X2 Elite Extreme X2E-94-100, Qualcomm Adreno X2-90 (n=1) | |
| Lenovo ThinkPad X9-15 Aura Edition | |
| Asus ZenBook S16 UM5606GA | |
| Dell XPS 16 Core Ultra 5 325 | |
| Microsoft Surface Laptop 15 Snapdragon X Elite | |
| CrossMark / Creativity | |
| Apple MacBook Air 15 M5 | |
| Samsung Galaxy Book6 Pro | |
| Asus Zenbook A16 UX3607 | |
| Average Qualcomm Snapdragon X2 Elite Extreme X2E-94-100, Qualcomm Adreno X2-90 (n=1) | |
| Average of class Multimedia (907 - 3465, n=67, last 2 years) | |
| Lenovo ThinkPad X9-15 Aura Edition | |
| Asus ZenBook S16 UM5606GA | |
| Dell XPS 16 Core Ultra 5 325 | |
| Microsoft Surface Laptop 15 Snapdragon X Elite | |
| CrossMark / Responsiveness | |
| Asus Zenbook A16 UX3607 | |
| Average Qualcomm Snapdragon X2 Elite Extreme X2E-94-100, Qualcomm Adreno X2-90 (n=1) | |
| Apple MacBook Air 15 M5 | |
| Samsung Galaxy Book6 Pro | |
| Average of class Multimedia (605 - 2024, n=67, last 2 years) | |
| Asus ZenBook S16 UM5606GA | |
| Dell XPS 16 Core Ultra 5 325 | |
| Lenovo ThinkPad X9-15 Aura Edition | |
| Microsoft Surface Laptop 15 Snapdragon X Elite | |
| WebXPRT 3 / Overall | |
| Apple MacBook Air 15 M5 | |
| Asus Zenbook A16 UX3607 | |
| Average Qualcomm Snapdragon X2 Elite Extreme X2E-94-100, Qualcomm Adreno X2-90 (n=1) | |
| Microsoft Surface Laptop 15 Snapdragon X Elite | |
| Average of class Multimedia (136.4 - 596, n=70, last 2 years) | |
| Asus ZenBook S16 UM5606GA | |
| Lenovo ThinkPad X9-15 Aura Edition | |
| Samsung Galaxy Book6 Pro | |
| Dell XPS 16 Core Ultra 5 325 | |
| WebXPRT 4 / Overall | |
| Asus Zenbook A16 UX3607 | |
| Average Qualcomm Snapdragon X2 Elite Extreme X2E-94-100, Qualcomm Adreno X2-90 (n=1) | |
| Apple MacBook Air 15 M5 | |
| Microsoft Surface Laptop 15 Snapdragon X Elite | |
| Average of class Multimedia (167.3 - 402, n=71, last 2 years) | |
| Lenovo ThinkPad X9-15 Aura Edition | |
| Samsung Galaxy Book6 Pro | |
| Dell XPS 16 Core Ultra 5 325 | |
| Asus ZenBook S16 UM5606GA | |
| Mozilla Kraken 1.1 / Total | |
| Dell XPS 16 Core Ultra 5 325 | |
| Asus ZenBook S16 UM5606GA | |
| Lenovo ThinkPad X9-15 Aura Edition | |
| Samsung Galaxy Book6 Pro | |
| Average of class Multimedia (228 - 835, n=73, last 2 years) | |
| Microsoft Surface Laptop 15 Snapdragon X Elite | |
| Asus Zenbook A16 UX3607 | |
| Average Qualcomm Snapdragon X2 Elite Extreme X2E-94-100, Qualcomm Adreno X2-90 (n=1) | |
| Apple MacBook Air 15 M5 | |
* ... smaller is better
| AIDA64 / Memory Copy | |
| Samsung Galaxy Book6 Pro | |
| Lenovo ThinkPad X9-15 Aura Edition | |
| Asus Zenbook A16 UX3607 | |
| Average Qualcomm Snapdragon X2 Elite Extreme X2E-94-100 (n=1) | |
| Dell XPS 16 Core Ultra 5 325 | |
| Asus ZenBook S16 UM5606GA | |
| Average of class Multimedia (11299 - 132135, n=61, last 2 years) | |
| Microsoft Surface Laptop 15 Snapdragon X Elite | |
| AIDA64 / Memory Read | |
| Asus Zenbook A16 UX3607 | |
| Average Qualcomm Snapdragon X2 Elite Extreme X2E-94-100 (n=1) | |
| Microsoft Surface Laptop 15 Snapdragon X Elite | |
| Samsung Galaxy Book6 Pro | |
| Asus ZenBook S16 UM5606GA | |
| Lenovo ThinkPad X9-15 Aura Edition | |
| Dell XPS 16 Core Ultra 5 325 | |
| Average of class Multimedia (11624 - 174586, n=61, last 2 years) | |
| AIDA64 / Memory Write | |
| Samsung Galaxy Book6 Pro | |
| Lenovo ThinkPad X9-15 Aura Edition | |
| Asus ZenBook S16 UM5606GA | |
| Dell XPS 16 Core Ultra 5 325 | |
| Average of class Multimedia (11755 - 134998, n=61, last 2 years) | |
| Asus Zenbook A16 UX3607 | |
| Average Qualcomm Snapdragon X2 Elite Extreme X2E-94-100 (n=1) | |
| Microsoft Surface Laptop 15 Snapdragon X Elite | |
DPC Latency
We could not perform our standardized latency test. 4K video playback did not result in dropped frames.
Storage Devices
Despite the large 16-inch chassis, the Zenbook A16 only offers a single M.2-2280 slot for SSDs (PCIe 4.0). Our review unit was equipped with a 1 TB drive from Samsung, which offers good and mostly stable transfer rates.

* ... smaller is better
Disk Throttling: DiskSpd Read Loop, Queue Depth 8
GPU Performance
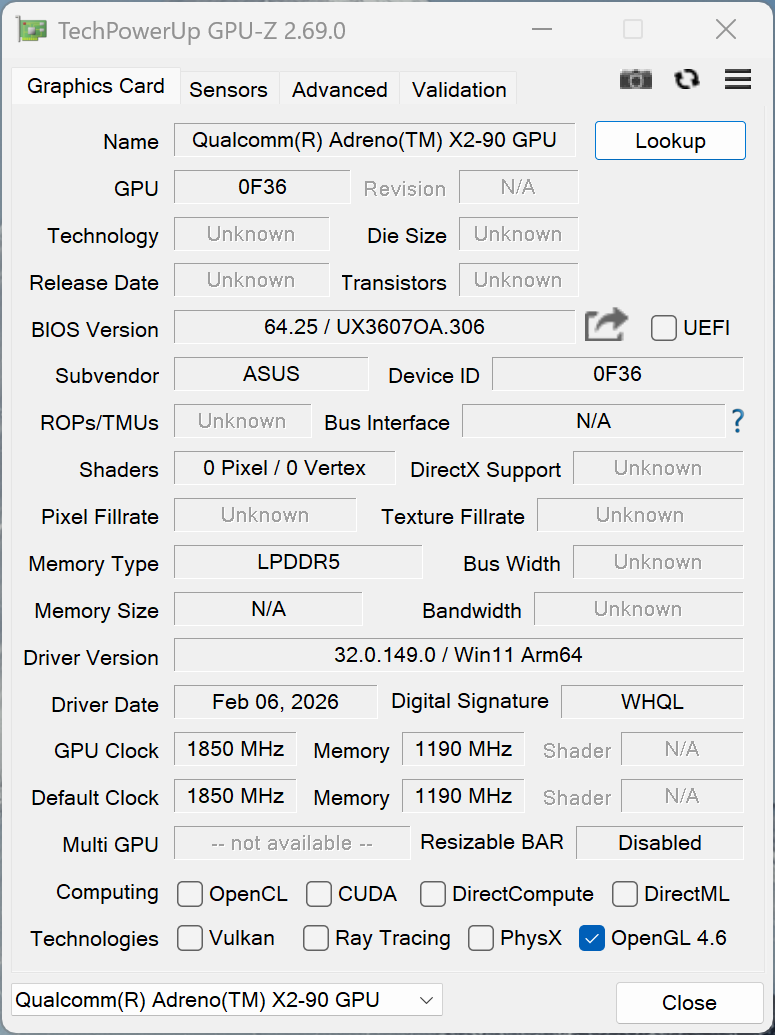
The Snapdragon X2E-94-100 is equipped with the fastest version of the Adreno X2-90 GPU with a maximum clock of 1850 MHz and a consumption of 25 Watts. The GPU performance was always a weak spot for the previous generation, so we are happy to report that Qualcomm improved the GPU significantly and is almost twice as fast as the old Adreno X1-85 (3.8 TFLOPS). There was a faster version with 4.6 TFLOPS, but it was super rare and actually not much faster in the Galaxy Book4 Edge 16. Compared to the X2-90 in the X2E-88-100 with a maximum clock of 1700 MHz we see a difference of around 15 %.
The X2-90 is slightly faster than the 10-core M5 GPU from Apple as well as Intel's Lunar Lake as well as Arrow Lake and AMD's Radeon 890M/880M. Intel's latest Arc B370 and B390 iGPUs are faster, but not by that much when you consider how much power they need (37-43 Watts). And what we have seen so far, 16-inch rivals like the XPS 16 or Galaxy Book6 Pro with the new Core Ultra X chips are clearly north of $2000.
The graphics performance is completely stable, both on battery power as well as during sustained workloads. Please see our analysis for more information about the performance and efficiency.
| 3DMark 06 Standard Score | 24681 points | |
| 3DMark Vantage P Result | 47555 points | |
| 3DMark 11 Performance | 13746 points | |
| 3DMark Fire Strike Score | 11139 points | |
| 3DMark Time Spy Score | 4533 points | |
| 3DMark Steel Nomad Score | 1264 points | |
| 3DMark Steel Nomad Light Score | 5492 points | |
| 3DMark Steel Nomad Light Unlimited Score | 5492 points | |
Help | ||
| Blender / v3.3 Classroom CPU | |
| Microsoft Surface Laptop 15 Snapdragon X Elite | |
| Lenovo ThinkPad X9-15 Aura Edition | |
| Dell XPS 16 Core Ultra 5 325 | |
| Average of class Multimedia (134.5 - 1042, n=67, last 2 years) | |
| Average Qualcomm Adreno X2-90 (320 - 406, n=3) | |
| Apple MacBook Air 15 M5 | |
| Samsung Galaxy Book6 Pro | |
| Asus Zenbook A16 UX3607 | |
| Asus ZenBook S16 UM5606GA | |
| Blender / v3.3 Classroom METAL | |
| Apple MacBook Air 15 M5 | |
| Average of class Multimedia (17.8 - 68, n=5, last 2 years) | |
| Blender / v3.3 Classroom oneAPI/Intel | |
| Average of class Multimedia (105 - 492, n=18, last 2 years) | |
| Dell XPS 16 Core Ultra 5 325 | |
* ... smaller is better
Gaming Performance
Qualcomm improved the compatibility with games and now supports Game Pass as well as Epic's anti-cheat software, so you can play Fortnite, for example. there can still be issues though, starting with simpler things like graphics errors (AC Shadows when you set the details to high) or games won't launch at all (like F1 24 or F1 25). If you want to play a specific title, you should definitely check the compatibility with Windows on ARM.
Supported games like Cyberpunk 2077 or Baldur's Gate 3, for example, run very well in 1080p and high details. The gaming performance is also superior to the direct rivals, and you will need a Panther Lake chips with the Arc B370 or Arc B390 iGPU, which will probably increase the price significantly. The gaming performance is also completely stable, even on battery power.
| Strange Brigade - 1920x1080 ultra AA:ultra AF:16 | |
| Average of class Multimedia (13.3 - 303, n=66, last 2 years) | |
| Asus Zenbook A16 UX3607 | |
| Lenovo ThinkPad X9-15 Aura Edition | |
| Samsung Galaxy Book6 Pro | |
| Asus ZenBook S16 UM5606GA | |
| Dell XPS 16 Core Ultra 5 325 | |
Cyberpunk 2077 ultra FPS Chart
| low | med. | high | ultra | QHD | |
|---|---|---|---|---|---|
| GTA V (2015) | 90.6 | 41.1 | 28.1 | ||
| Dota 2 Reborn (2015) | 103.5 | 86.3 | 80.3 | 70.7 | |
| Final Fantasy XV Benchmark (2018) | 110.5 | 65.6 | 34.5 | 26.7 | |
| X-Plane 11.11 (2018) | 54.4 | 47.7 | 42.6 | ||
| Far Cry 5 (2018) | 68 | 58 | 55 | 50 | 45 |
| Strange Brigade (2018) | 279 | 115.3 | 89.2 | 81.7 | 59 |
| Shadow of the Tomb Raider (2018) | 128 | 56 | 51 | 46 | 31 |
| Baldur's Gate 3 (2023) | 60 | 49.1 | 43.4 | 42.5 | 28.7 |
| Cyberpunk 2077 (2023) | 61.9 | 50.1 | 43 | 38.2 | 22.7 |
| Total War Pharaoh (2023) | 185.9 | 132.8 | 99.3 | 84.1 | 58.9 |
| Assassin's Creed Shadows (2025) | 27 | 25 | 21 | 16 |
Emissions - Quiet in everyday scenarios
System Noise

The fan noise depends heavily on the power mode, but as we have shown before, the performance is still excellent in Whisper mode (up to 30.5 dB(A)), so this mode is more than sufficient for everyday tasks. If you really want to utilize the full performance of the new X2 Elite Extreme, the fan noise will increase to 51 dB(A) under load, which is very loud. The fans almost immediately stop spinning after the load period is over, though. We did not hear any electronic noises like coil whine.
Noise level
| Idle |
| 24.9 / 24.9 / 24.9 dB(A) |
| Load |
| 27.9 / 51.1 dB(A) |
 | ||
30 dB silent 40 dB(A) audible 50 dB(A) loud |
||
min: | ||
| Asus Zenbook A16 UX3607 X2E-94-100, X2-90 | Apple MacBook Air 15 M5 M5 10-Core, M5 10-Core GPU | Lenovo ThinkPad X9-15 Aura Edition Core Ultra 7 258V, Arc 140V | Samsung Galaxy Book6 Pro Ultra 7 356H, Intel Graphics 4 Xe3 PTL | Dell XPS 16 Core Ultra 5 325 Ultra 5 325, Intel Graphics 4 Xe3 PTL | Asus ZenBook S16 UM5606GA Ryzen AI 9 465, Radeon 880M | Microsoft Surface Laptop 15 Snapdragon X Elite SD X Elite X1E-80-100, Adreno X1-85 3.8 TFLOPS | |
|---|---|---|---|---|---|---|---|
| Noise | 2% | 4% | 6% | -8% | 15% | ||
| off / environment * (dB) | 24.9 | 24.4 2% | 25.3 -2% | 22.8 8% | 24.9 -0% | 23.3 6% | |
| Idle Minimum * (dB) | 24.9 | 24.4 2% | 25.3 -2% | 22.9 8% | 24.9 -0% | 23.3 6% | |
| Idle Average * (dB) | 24.9 | 24.4 2% | 25.3 -2% | 22.9 8% | 24.9 -0% | 23.3 6% | |
| Idle Maximum * (dB) | 24.9 | 24.4 2% | 25.3 -2% | 23.9 4% | 24.9 -0% | 23.3 6% | |
| Load Average * (dB) | 27.9 | 35.8 -28% | 31.8 -14% | 34.8 -25% | 45.7 -64% | 25.7 8% | |
| Cyberpunk 2077 ultra * (dB) | 51.1 | 39.4 23% | 38.4 25% | 38 26% | 49 4% | 31.1 39% | |
| Load Maximum * (dB) | 51.1 | 45 12% | 38.4 25% | 43.3 15% | 50.4 1% | 33.2 35% |
* ... smaller is better
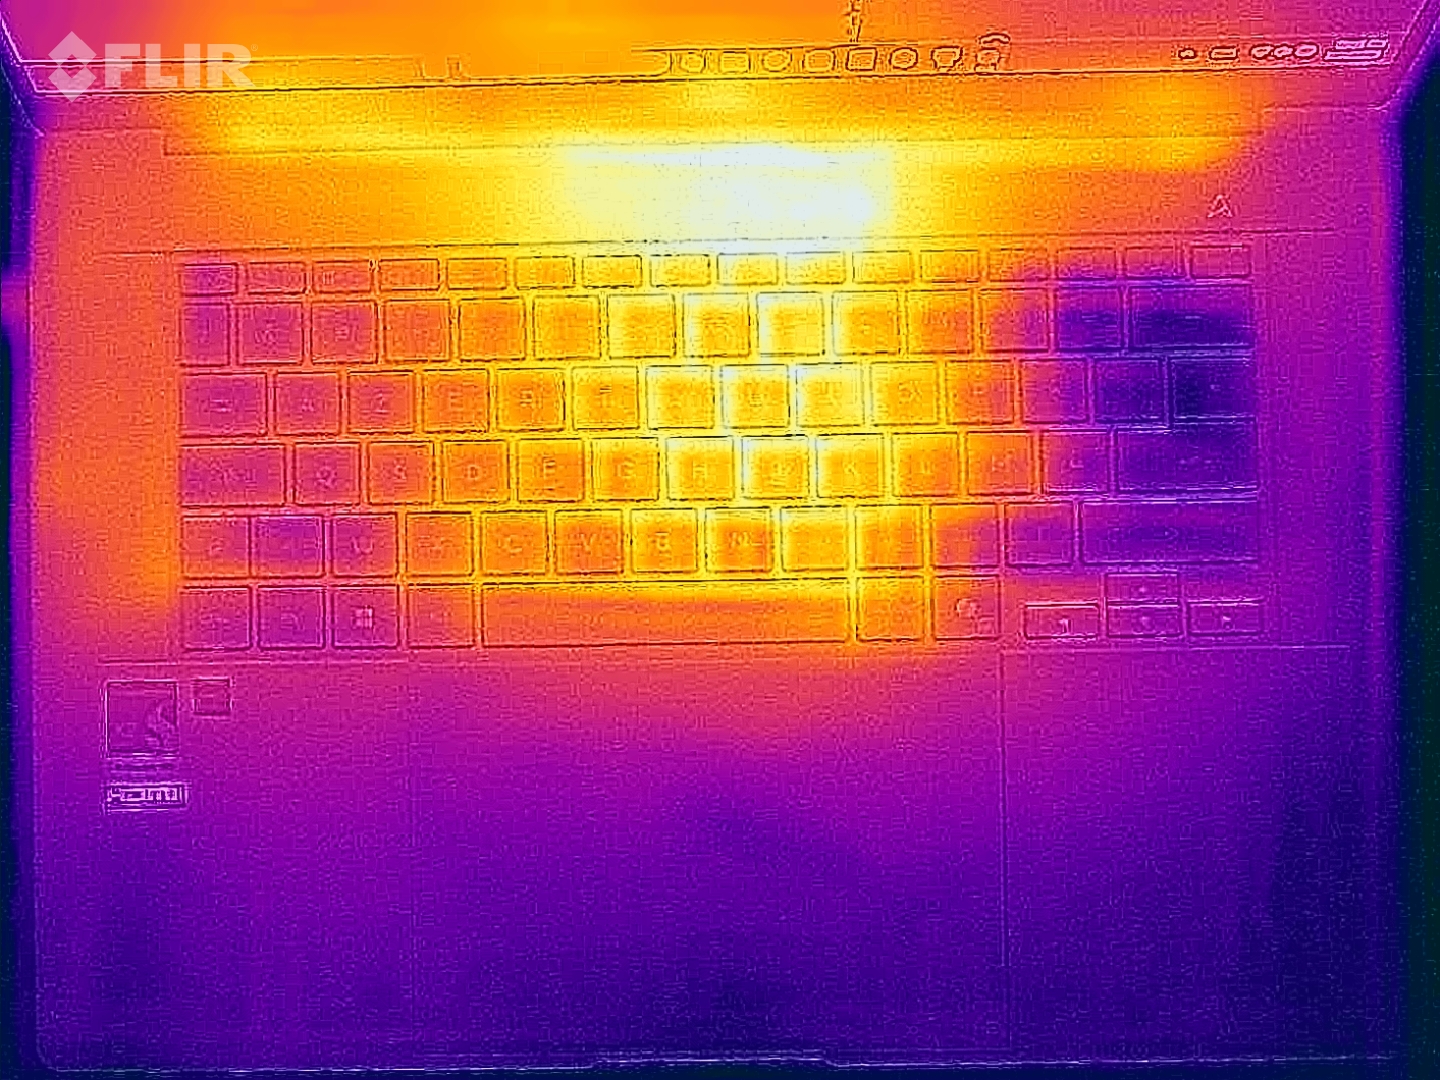
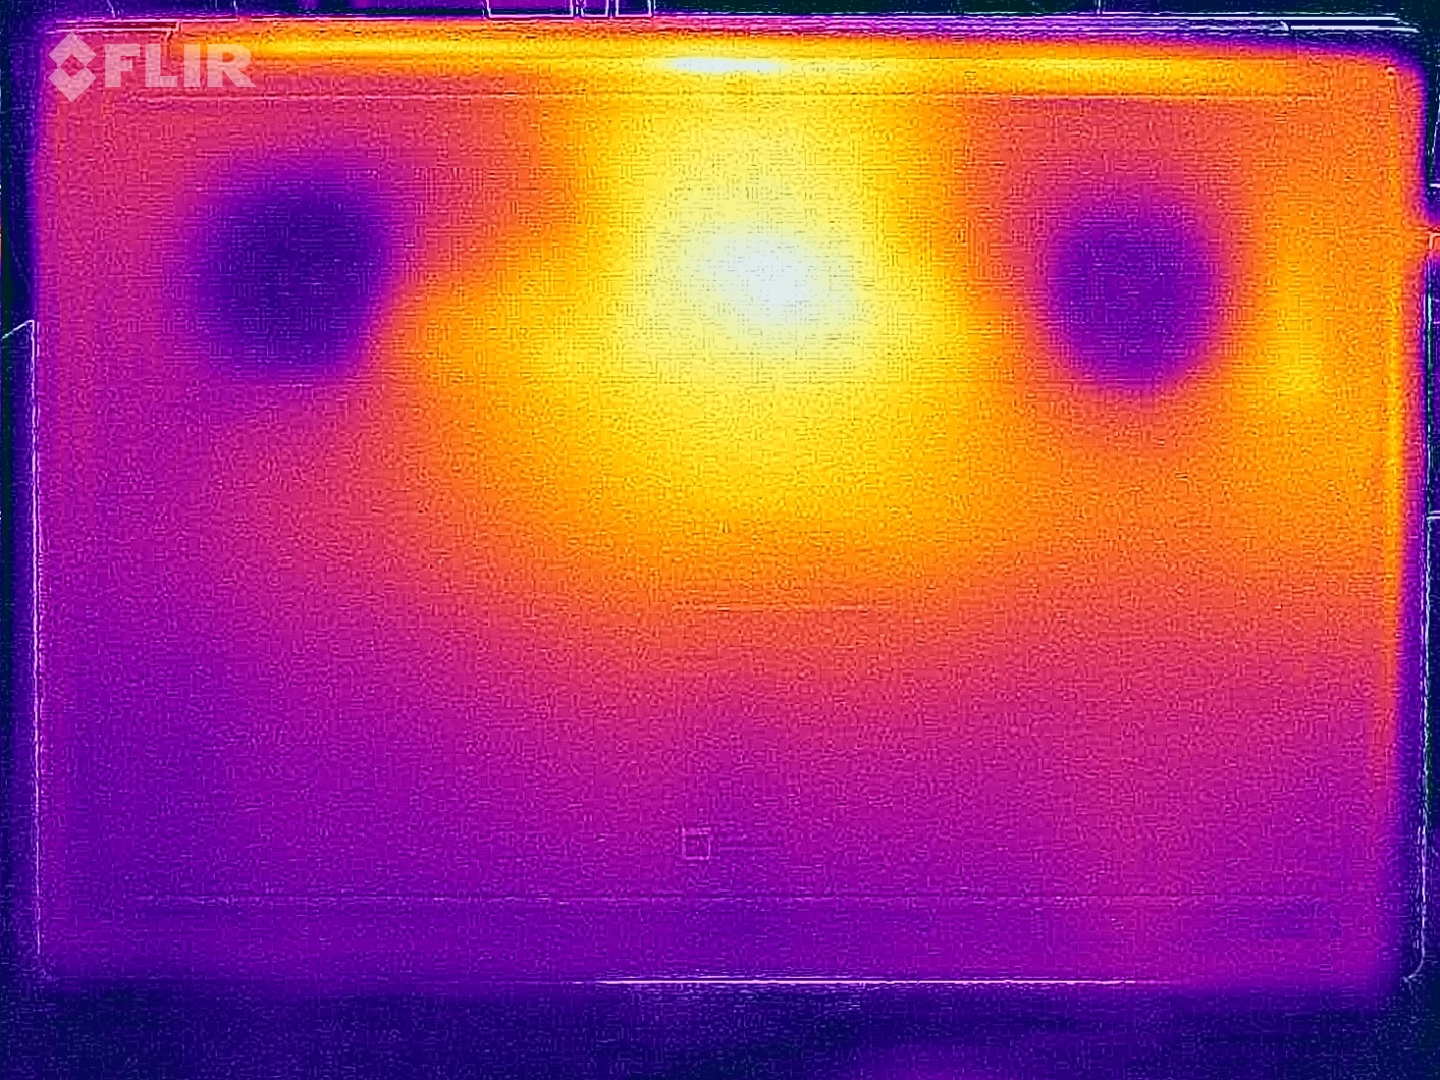
Temperature
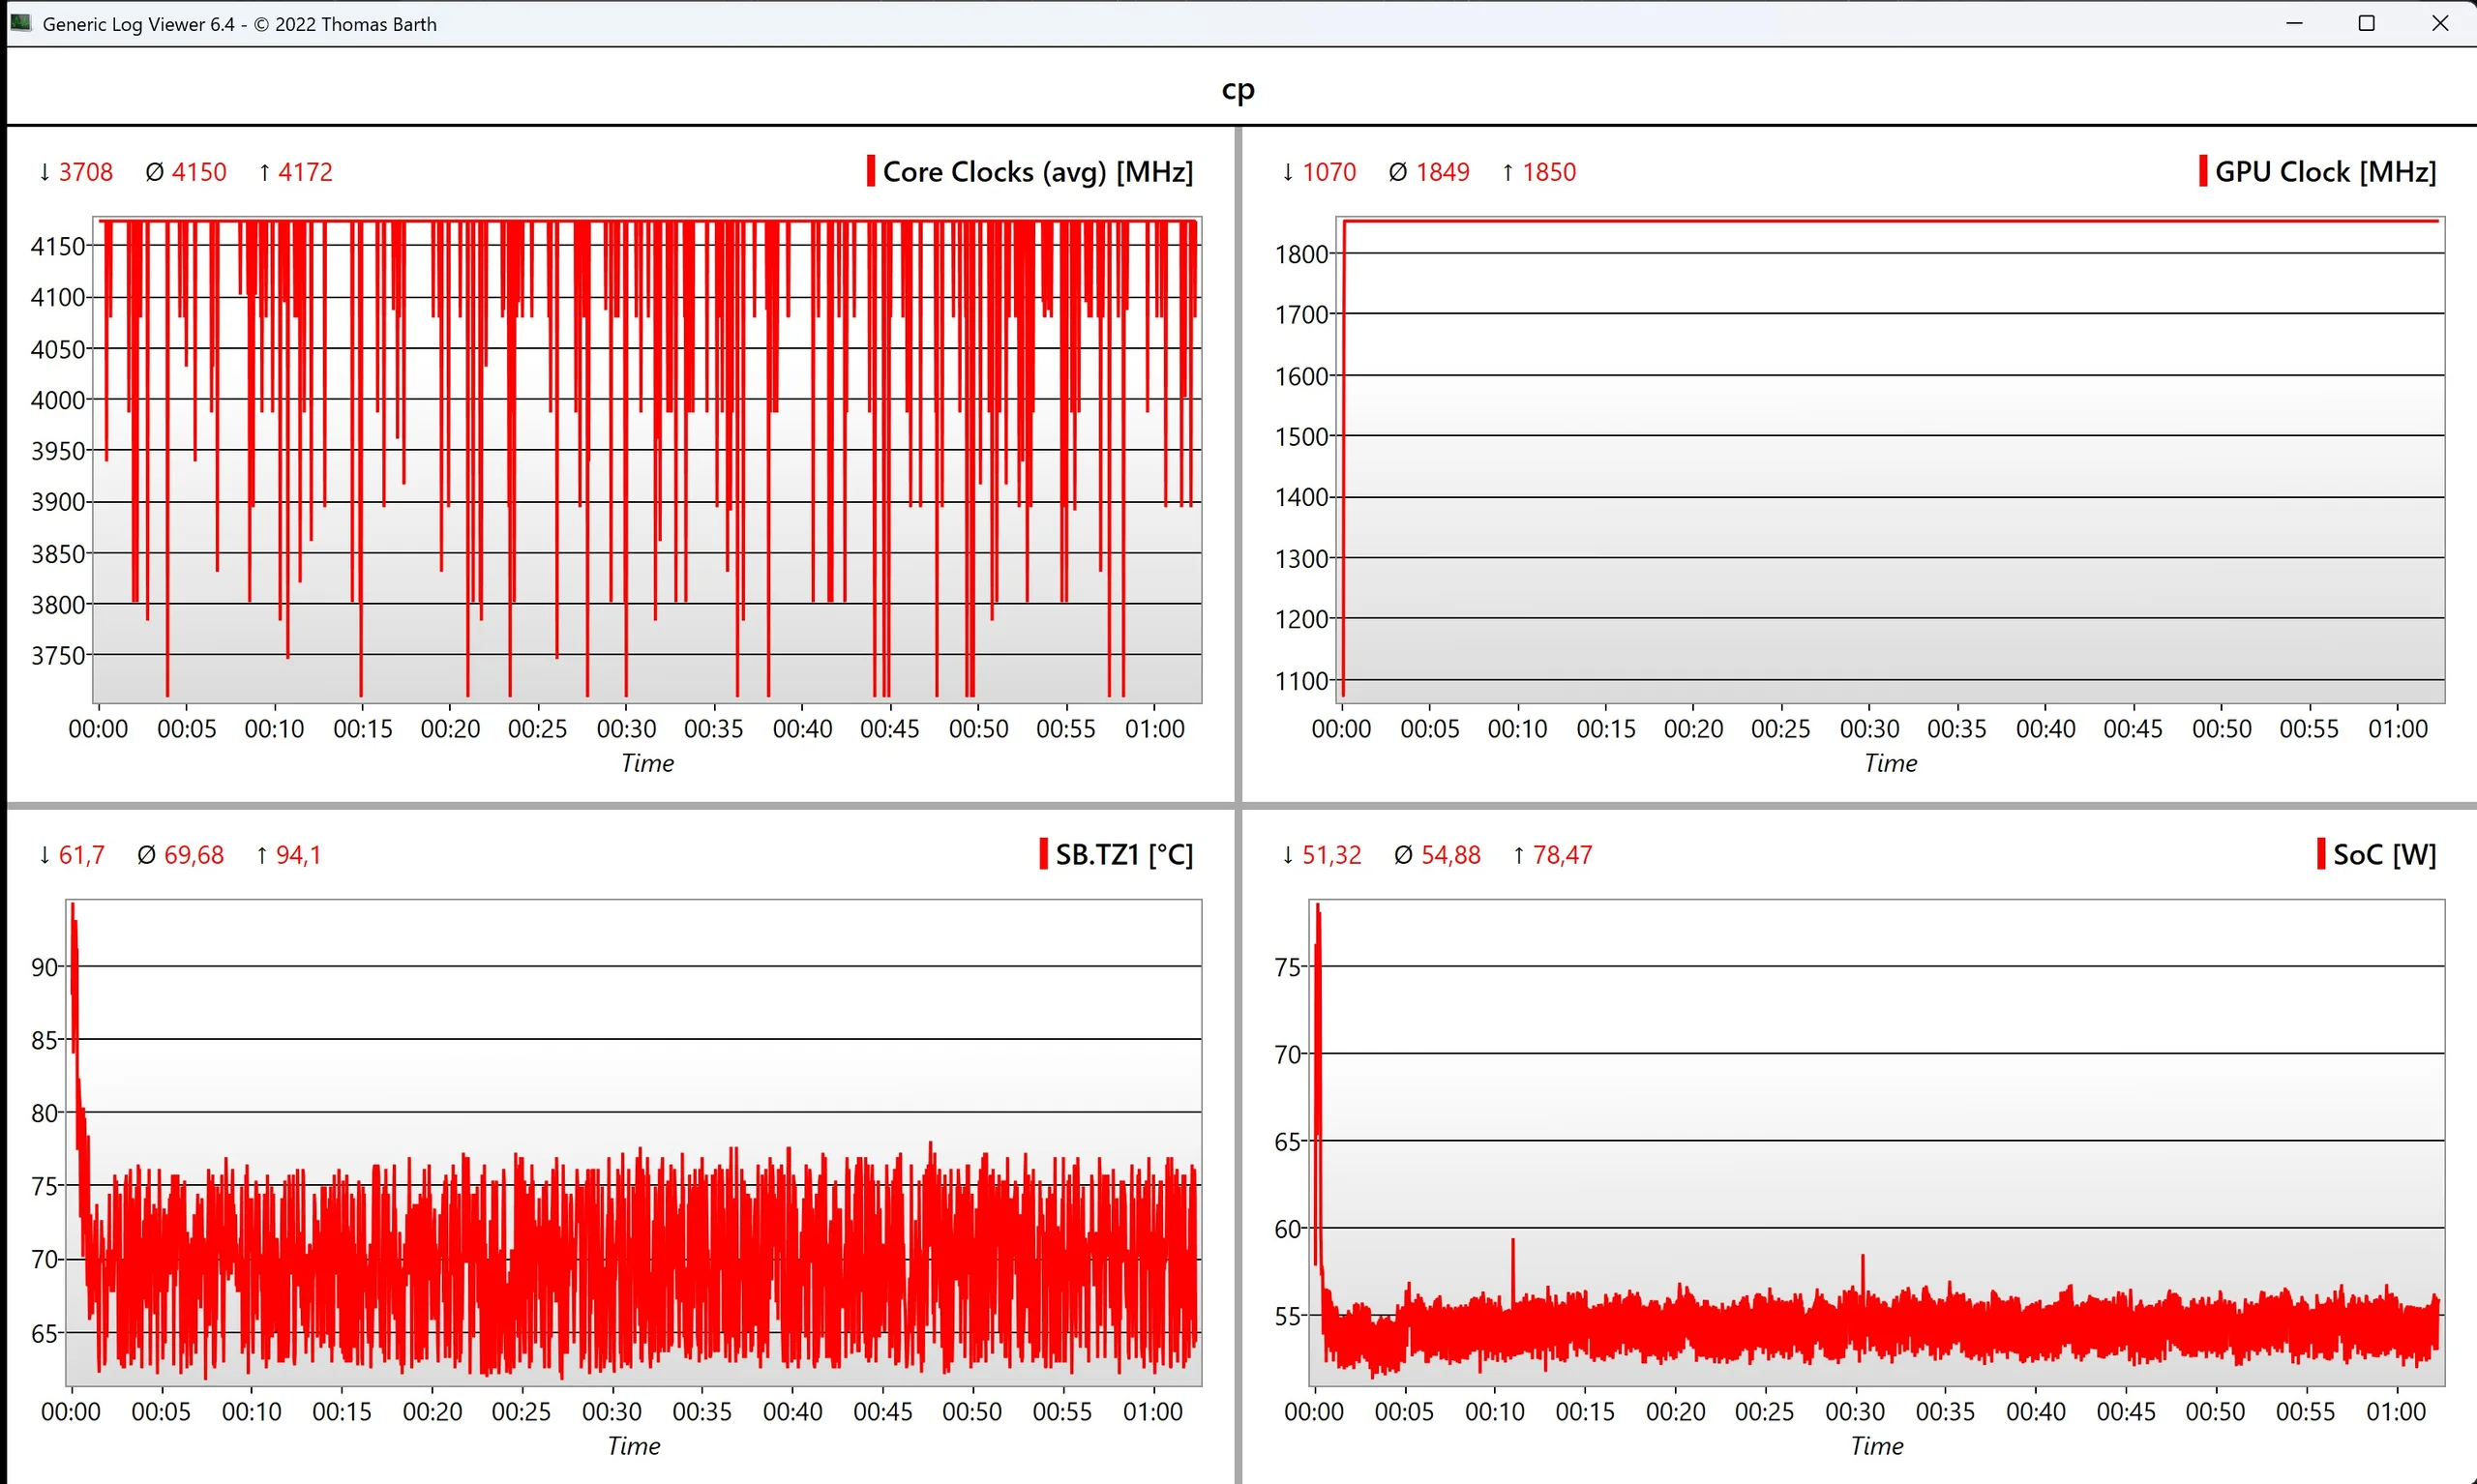
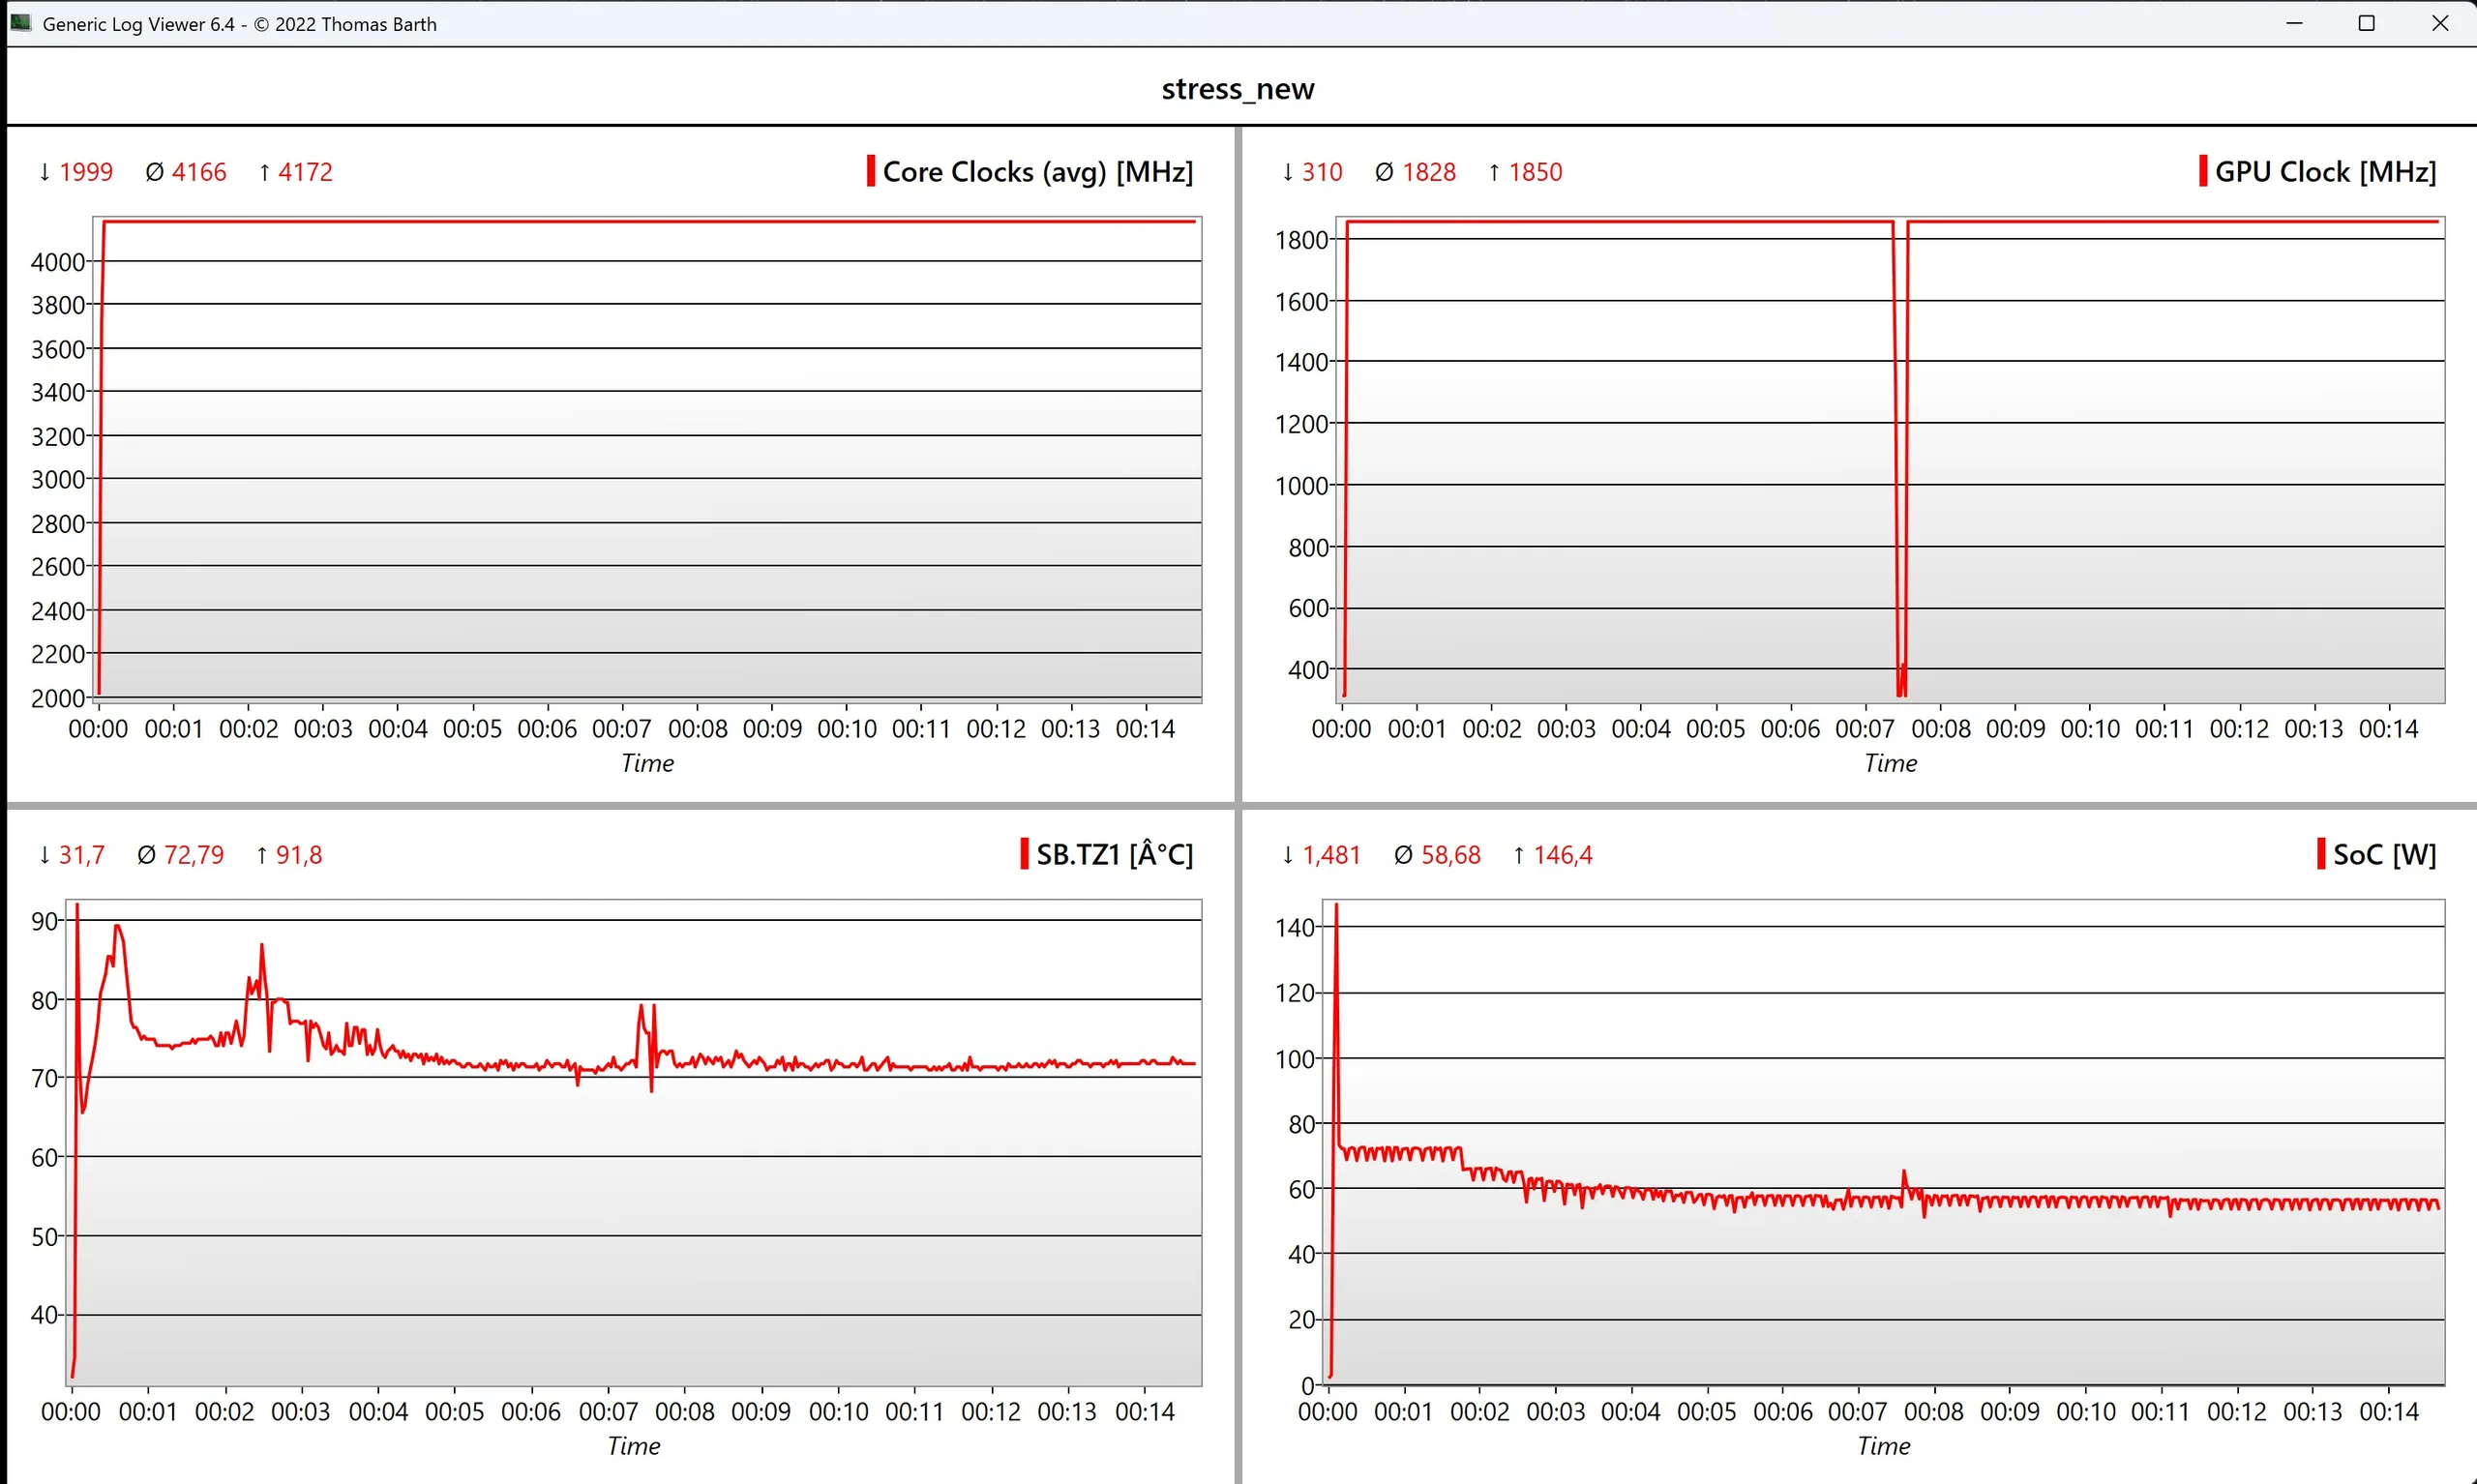
The surface temperatures are very low overall considering the amount of performance and the slim chassis. Light workloads usually do not result in any perceptible heat at all, but even if you stress the device in Performance mode, we only measured more than 40 °C at a few spots. This is very impressive and means you can always use the Zenbook A16 on your lap. During our stress test, the SoC initially consumes 146 Watts, but it immediately drops to 72 Watts and then levels off at 56 Watts after five minutes, which is maintained over the course of the stress test.
(±) The maximum temperature on the upper side is 43.2 °C / 110 F, compared to the average of 36.8 °C / 98 F, ranging from 21 to 71 °C for the class Multimedia.
(±) The bottom heats up to a maximum of 43.3 °C / 110 F, compared to the average of 39.1 °C / 102 F
(+) In idle usage, the average temperature for the upper side is 24.3 °C / 76 F, compared to the device average of 31.3 °C / 88 F.
(±) 3: The average temperature for the upper side is 32.8 °C / 91 F, compared to the average of 31.3 °C / 88 F for the class Multimedia.
(+) The palmrests and touchpad are cooler than skin temperature with a maximum of 26.6 °C / 79.9 F and are therefore cool to the touch.
(+) The average temperature of the palmrest area of similar devices was 28.7 °C / 83.7 F (+2.1 °C / 3.8 F).
| Asus Zenbook A16 UX3607 X2E-94-100, X2-90 | Apple MacBook Air 15 M5 M5 10-Core, M5 10-Core GPU | Lenovo ThinkPad X9-15 Aura Edition Core Ultra 7 258V, Arc 140V | Samsung Galaxy Book6 Pro Ultra 7 356H, Intel Graphics 4 Xe3 PTL | Dell XPS 16 Core Ultra 5 325 Ultra 5 325, Intel Graphics 4 Xe3 PTL | Asus ZenBook S16 UM5606GA Ryzen AI 9 465, Radeon 880M | Microsoft Surface Laptop 15 Snapdragon X Elite SD X Elite X1E-80-100, Adreno X1-85 3.8 TFLOPS | |
|---|---|---|---|---|---|---|---|
| Heat | 4% | 7% | 12% | 6% | -3% | 10% | |
| Maximum Upper Side * (°C) | 43.2 | 44.1 -2% | 42.1 3% | 37.8 13% | 43.8 -1% | 43.4 -0% | 45.4 -5% |
| Maximum Bottom * (°C) | 43.3 | 43.1 -0% | 39.5 9% | 40.1 7% | 42 3% | 46.2 -7% | 37.2 14% |
| Idle Upper Side * (°C) | 26.7 | 24 10% | 24.5 8% | 22.6 15% | 23.2 13% | 26.5 1% | 22.4 16% |
| Idle Bottom * (°C) | 26 | 23.9 8% | 24.4 6% | 22.8 12% | 23.6 9% | 27 -4% | 22 15% |
* ... smaller is better
Speakers
The sound system with 6 modules performs well, but most rivals offer a bit more punch. Still, you will not be disappointed by the sound quality of the Zenbook A16.
Asus Zenbook A16 UX3607 audio analysis
(+) | speakers can play relatively loud (84.5 dB)
Bass 100 - 315 Hz
(±) | reduced bass - on average 6.4% lower than median
(±) | linearity of bass is average (8.3% delta to prev. frequency)
Mids 400 - 2000 Hz
(+) | balanced mids - only 3.9% away from median
(+) | mids are linear (4.2% delta to prev. frequency)
Highs 2 - 16 kHz
(+) | balanced highs - only 3.3% away from median
(+) | highs are linear (5% delta to prev. frequency)
Overall 100 - 16.000 Hz
(+) | overall sound is linear (9.8% difference to median)
Compared to same class
» 13% of all tested devices in this class were better, 2% similar, 85% worse
» The best had a delta of 5%, average was 17%, worst was 45%
Compared to all devices tested
» 4% of all tested devices were better, 1% similar, 95% worse
» The best had a delta of 4%, average was 24%, worst was 134%
Apple MacBook Air 15 M5 audio analysis
(+) | speakers can play relatively loud (84.8 dB)
Bass 100 - 315 Hz
(±) | reduced bass - on average 6.8% lower than median
(+) | bass is linear (6.6% delta to prev. frequency)
Mids 400 - 2000 Hz
(+) | balanced mids - only 2% away from median
(+) | mids are linear (3.3% delta to prev. frequency)
Highs 2 - 16 kHz
(+) | balanced highs - only 3.6% away from median
(+) | highs are linear (3.2% delta to prev. frequency)
Overall 100 - 16.000 Hz
(+) | overall sound is linear (7.7% difference to median)
Compared to same class
» 2% of all tested devices in this class were better, 0% similar, 98% worse
» The best had a delta of 5%, average was 18%, worst was 53%
Compared to all devices tested
» 1% of all tested devices were better, 0% similar, 98% worse
» The best had a delta of 4%, average was 24%, worst was 134%
Lenovo ThinkPad X9-15 Aura Edition audio analysis
(+) | speakers can play relatively loud (87.5 dB)
Bass 100 - 315 Hz
(±) | reduced bass - on average 12.5% lower than median
(+) | bass is linear (6.8% delta to prev. frequency)
Mids 400 - 2000 Hz
(+) | balanced mids - only 3.1% away from median
(+) | mids are linear (5.3% delta to prev. frequency)
Highs 2 - 16 kHz
(+) | balanced highs - only 2.4% away from median
(+) | highs are linear (3.3% delta to prev. frequency)
Overall 100 - 16.000 Hz
(+) | overall sound is linear (9.5% difference to median)
Compared to same class
» 1% of all tested devices in this class were better, 0% similar, 99% worse
» The best had a delta of 7%, average was 21%, worst was 53%
Compared to all devices tested
» 4% of all tested devices were better, 1% similar, 95% worse
» The best had a delta of 4%, average was 24%, worst was 134%
Samsung Galaxy Book6 Pro audio analysis
(±) | speaker loudness is average but good (81.1 dB)
Bass 100 - 315 Hz
(±) | reduced bass - on average 13.7% lower than median
(±) | linearity of bass is average (8.9% delta to prev. frequency)
Mids 400 - 2000 Hz
(+) | balanced mids - only 3.1% away from median
(+) | mids are linear (3.5% delta to prev. frequency)
Highs 2 - 16 kHz
(+) | balanced highs - only 1.3% away from median
(+) | highs are linear (2.7% delta to prev. frequency)
Overall 100 - 16.000 Hz
(+) | overall sound is linear (11% difference to median)
Compared to same class
» 16% of all tested devices in this class were better, 3% similar, 81% worse
» The best had a delta of 5%, average was 17%, worst was 45%
Compared to all devices tested
» 6% of all tested devices were better, 2% similar, 92% worse
» The best had a delta of 4%, average was 24%, worst was 134%
Dell XPS 16 Core Ultra 5 325 audio analysis
(+) | speakers can play relatively loud (85.3 dB)
Bass 100 - 315 Hz
(±) | reduced bass - on average 6.1% lower than median
(+) | bass is linear (5.6% delta to prev. frequency)
Mids 400 - 2000 Hz
(+) | balanced mids - only 3.2% away from median
(+) | mids are linear (4.6% delta to prev. frequency)
Highs 2 - 16 kHz
(+) | balanced highs - only 2.4% away from median
(+) | highs are linear (3.3% delta to prev. frequency)
Overall 100 - 16.000 Hz
(+) | overall sound is linear (7% difference to median)
Compared to same class
» 5% of all tested devices in this class were better, 1% similar, 94% worse
» The best had a delta of 5%, average was 17%, worst was 45%
Compared to all devices tested
» 1% of all tested devices were better, 0% similar, 99% worse
» The best had a delta of 4%, average was 24%, worst was 134%
Asus ZenBook S16 UM5606GA audio analysis
(±) | speaker loudness is average but good (78.2 dB)
Bass 100 - 315 Hz
(+) | good bass - only 4.6% away from median
(+) | bass is linear (6.2% delta to prev. frequency)
Mids 400 - 2000 Hz
(+) | balanced mids - only 1.9% away from median
(+) | mids are linear (5% delta to prev. frequency)
Highs 2 - 16 kHz
(+) | balanced highs - only 2.1% away from median
(+) | highs are linear (4.9% delta to prev. frequency)
Overall 100 - 16.000 Hz
(+) | overall sound is linear (7.6% difference to median)
Compared to same class
» 6% of all tested devices in this class were better, 2% similar, 92% worse
» The best had a delta of 5%, average was 17%, worst was 45%
Compared to all devices tested
» 1% of all tested devices were better, 0% similar, 98% worse
» The best had a delta of 4%, average was 24%, worst was 134%
Microsoft Surface Laptop 15 Snapdragon X Elite audio analysis
(±) | speaker loudness is average but good (81 dB)
Bass 100 - 315 Hz
(±) | reduced bass - on average 11.7% lower than median
(±) | linearity of bass is average (9.1% delta to prev. frequency)
Mids 400 - 2000 Hz
(+) | balanced mids - only 3.3% away from median
(+) | mids are linear (3.2% delta to prev. frequency)
Highs 2 - 16 kHz
(+) | balanced highs - only 3.1% away from median
(+) | highs are linear (6.3% delta to prev. frequency)
Overall 100 - 16.000 Hz
(+) | overall sound is linear (11.4% difference to median)
Compared to same class
» 3% of all tested devices in this class were better, 2% similar, 95% worse
» The best had a delta of 7%, average was 21%, worst was 53%
Compared to all devices tested
» 7% of all tested devices were better, 2% similar, 91% worse
» The best had a delta of 4%, average was 24%, worst was 134%
Energy Management
Power Consumption

The maximum idle consumption is pretty average at around 8.4 Watts and other OLED devices like the ThinkPad X9 15 or the Galaxy Book6 Pro are more efficient. While playing games, you can expect around 60 Watts and during the stress test, the 130W power adapter is the limiting factor for a second, before it drops to ~100 Watts and finally ~90 Watts. Overall, the 130W module is therefore sufficient and the battery is not discharged under sustained workloads, either.
| Off / Standby | |
| Idle | |
| Load |
|
Key:
min: | |
| Asus Zenbook A16 UX3607 X2E-94-100, X2-90, Samsung PM9C1b MZVL81T0HFLB-00BTW, OLED, 2880x1800, 16" | Apple MacBook Air 15 M5 M5 10-Core, M5 10-Core GPU, Apple SSD AP2048Z, IPS, 2880x1864, 15.3" | Lenovo ThinkPad X9-15 Aura Edition Core Ultra 7 258V, Arc 140V, WD PC SN740 SDDQMQD-1T00, OLED, 2880x1800, 15.3" | Samsung Galaxy Book6 Pro Ultra 7 356H, Intel Graphics 4 Xe3 PTL, Samsung PM9C1b MZVL8512HFLU-00BLL, OLED, 2880x1800, 16" | Dell XPS 16 Core Ultra 5 325 Ultra 5 325, Intel Graphics 4 Xe3 PTL, SK hynix PVC10 HFS512GEM4X182N, IPS, 1920x1200, 16" | Asus ZenBook S16 UM5606GA Ryzen AI 9 465, Radeon 880M, SanDisk PC SN5100S, OLED, 2880x1800, 16" | Microsoft Surface Laptop 15 Snapdragon X Elite SD X Elite X1E-80-100, Adreno X1-85 3.8 TFLOPS, Samsung PM9B1 256GB MZ9L4256HCJQ, IPS, 2496x1664, 15" | Average Qualcomm Adreno X2-90 | Average of class Multimedia | |
|---|---|---|---|---|---|---|---|---|---|
| Power Consumption | 25% | 35% | 32% | 35% | 3% | 22% | 12% | -25% | |
| Idle Minimum * (Watt) | 5.1 | 2.2 57% | 2.4 53% | 2.5 51% | 1.3 75% | 3.7 27% | 3 41% | 4.3 ? 16% | 5.64 ? -11% |
| Idle Average * (Watt) | 8.1 | 11.7 -44% | 3.9 52% | 4.2 48% | 4.5 44% | 7.4 9% | 8.3 -2% | 6.47 ? 20% | 10 ? -23% |
| Idle Maximum * (Watt) | 8.4 | 11.8 -40% | 5.1 39% | 4.6 45% | 4.6 45% | 9.5 -13% | 8.4 -0% | 8.3 ? 1% | 12.2 ? -45% |
| Load Average * (Watt) | 40.5 | 36.2 11% | 42.5 -5% | 42.2 -4% | 36.5 10% | 57.9 -43% | 34.3 15% | 40.1 ? 1% | 64.8 ? -60% |
| Cyberpunk 2077 ultra * (Watt) | 56.9 | 23.5 59% | 43.5 24% | 52.7 7% | 47.9 16% | 58.5 -3% | 45.8 20% | ||
| Cyberpunk 2077 ultra external monitor * (Watt) | 58.2 | 21.7 63% | 40.2 31% | 40.6 30% | 45.4 22% | 57 2% | 41 30% | ||
| Load Maximum * (Watt) | 128.9 | 37.4 71% | 64.4 50% | 70.8 45% | 82.8 36% | 76.9 40% | 65.2 49% | 99.5 ? 23% | 111.7 ? 13% |
* ... smaller is better
Power Consumption Cyberpunk / Stress Test
Power Consumption external Monitor
Battery Life
Asus uses a 70 Wh battery and the battery runtimes are okay, but we are actually not that impressed. A Wi-Fi runtime of 13 hours at 150 nits is nothing special. This is comparable to the Zenbook S16 with a larger 83 Wh battery, so the A16 is mor efficient, but the user still does not get a longer runtime. We would have preferred a bigger battery, because the other rivals manage runtimes of around 16 hours. The Dell XPS 16 is a bit of an outlier with its Full-HD IPS screen, but the A16 will also be available with a Full-HD-OLED if you want the maximum battery stamina.
The battery disadvantage also shows in the Wi-Fi test at maximum panel brightness, where we record only 6.5 hours. The MacBook Air with the bright IPS screen has the same issue at 6.7 hours. Local video playback at 150 nits is possible for more than 16 hours, while you can discharge the battery in under one hour if you really push the CPU.

| Asus Zenbook A16 UX3607 X2E-94-100, X2-90, 70 Wh | Apple MacBook Air 15 M5 M5 10-Core, M5 10-Core GPU, 66.5 Wh | Lenovo ThinkPad X9-15 Aura Edition Core Ultra 7 258V, Arc 140V, 80 Wh | Samsung Galaxy Book6 Pro Ultra 7 356H, Intel Graphics 4 Xe3 PTL, 78 Wh | Dell XPS 16 Core Ultra 5 325 Ultra 5 325, Intel Graphics 4 Xe3 PTL, 70 Wh | Asus ZenBook S16 UM5606GA Ryzen AI 9 465, Radeon 880M, 83 Wh | Microsoft Surface Laptop 15 Snapdragon X Elite SD X Elite X1E-80-100, Adreno X1-85 3.8 TFLOPS, 64 Wh | Average of class Multimedia | |
|---|---|---|---|---|---|---|---|---|
| Battery runtime | 32% | 73% | 25% | 105% | 1% | 52% | 26% | |
| H.264 (h) | 16.3 | 23 41% | 16.4 ? 1% | |||||
| WiFi v1.3 (h) | 13 | 17.2 32% | 17.5 35% | 16.3 25% | 26.6 105% | 13.1 1% | 14.8 14% | 12 ? -8% |
| Load (h) | 0.9 | 2.2 144% | 1.7 89% | 1.675 ? 86% | ||||
| Reader / Idle (h) | 31.7 | 25.2 ? |
Notebookcheck Rating
Asus Zenbook A16 UX3607
- 04/07/2026 v8
Andreas Osthoff
 Total Sustainability Score:
 Potential Competitors in Comparison
Image | Model / Review | Price | Weight | Height | Display |
|---|---|---|---|---|---|
1. 87.5%  | Asus Zenbook A16 UX3607 Qualcomm Snapdragon X2 Elite Extreme X2E-94-100 ⎘ Qualcomm Adreno X2-90 ⎘ 48 GB Memory, 1000 GB SSD | Amazon: 1. $1,999.99 Asus Zenbook A16 UX3607 UX36... 2. $779.00 ASUS Zenbook A14; Copilot+ P... 3. $1,699.99 ASUS Zenbook Pro S 16 AI Lap... | 1.2 kg | 16.5 mm | 16.00" 2880x1800 212 PPI OLED |
2. 91.6%  | Apple MacBook Air 15 M5 Apple M5 10-Core ⎘ Apple M5 10-Core GPU ⎘ 32 GB Memory, 2048 GB SSD | Amazon: | 1.5 kg | 11.5 mm | 15.30" 2880x1864 224 PPI IPS |
3. 90.1%  | Lenovo ThinkPad X9-15 Aura Edition Intel Core Ultra 7 258V ⎘ Intel Arc Graphics 140V ⎘ 32 GB Memory, 1024 GB SSD | Amazon: List Price: 1989€ | 1.4 kg | 17.7 mm | 15.30" 2880x1800 222 PPI OLED |
4. 86.3%  | Samsung Galaxy Book6 Pro Intel Core Ultra 7 356H ⎘ Intel Graphics 4 Xe3 Panther Lake iGPU ⎘ 32 GB Memory, 512 GB SSD | Amazon: List Price: 2199€ | 1.6 kg | 11.9 mm | 16.00" 2880x1800 212 PPI OLED |
5. 84.2%  | Dell XPS 16 Core Ultra 5 325 Intel Core Ultra 5 325 ⎘ Intel Graphics 4 Xe3 Panther Lake iGPU ⎘ 16 GB Memory, 512 GB SSD | Amazon: 1. $1,977.99 Dell Premium 16 (Previously ... 2. $2,599.00 Dell Premium 16 (XPS 16 2025... 3. $2,499.00 Dell Premium 16 (XPS 16 2025... List Price: 1600 USD | 1.7 kg | 15.4 mm | 16.00" 1920x1200 142 PPI IPS |
6. 86.6%  | Asus ZenBook S16 UM5606GA AMD Ryzen AI 9 465 ⎘ AMD Radeon 880M ⎘ 32 GB Memory, 1024 GB SSD | Amazon: List Price: 1799€ | 1.5 kg | 12.9 mm | 16.00" 2880x1800 212 PPI OLED |
7. 84.3%  | Microsoft Surface Laptop 15 Snapdragon X Elite Qualcomm Snapdragon X Elite X1E-80-100 ⎘ Qualcomm SD X Adreno X1-85 3.8 TFLOPS ⎘ 16 GB Memory, 256 GB SSD | Amazon: List Price: 1100 USD | 1.7 kg | 18.29 mm | 15.00" 2496x1664 200 PPI IPS |
Transparency
The selection of devices to be reviewed is made by our editorial team. The test sample was provided to the author as a loan by the manufacturer or retailer for the purpose of this review. The lender had no influence on this review, nor did the manufacturer receive a copy of this review before publication. There was no obligation to publish this review. As an independent media company, Notebookcheck is not subjected to the authority of manufacturers, retailers or publishers.
This is how Notebookcheck is testing
Every year, Notebookcheck independently reviews hundreds of laptops and smartphones using standardized procedures to ensure that all results are comparable. We have continuously developed our test methods for around 20 years and set industry standards in the process. In our test labs, high-quality measuring equipment is utilized by experienced technicians and editors. These tests involve a multi-stage validation process. Our complex rating system is based on hundreds of well-founded measurements and benchmarks, which maintains objectivity. Further information on our test methods can be found here.
