




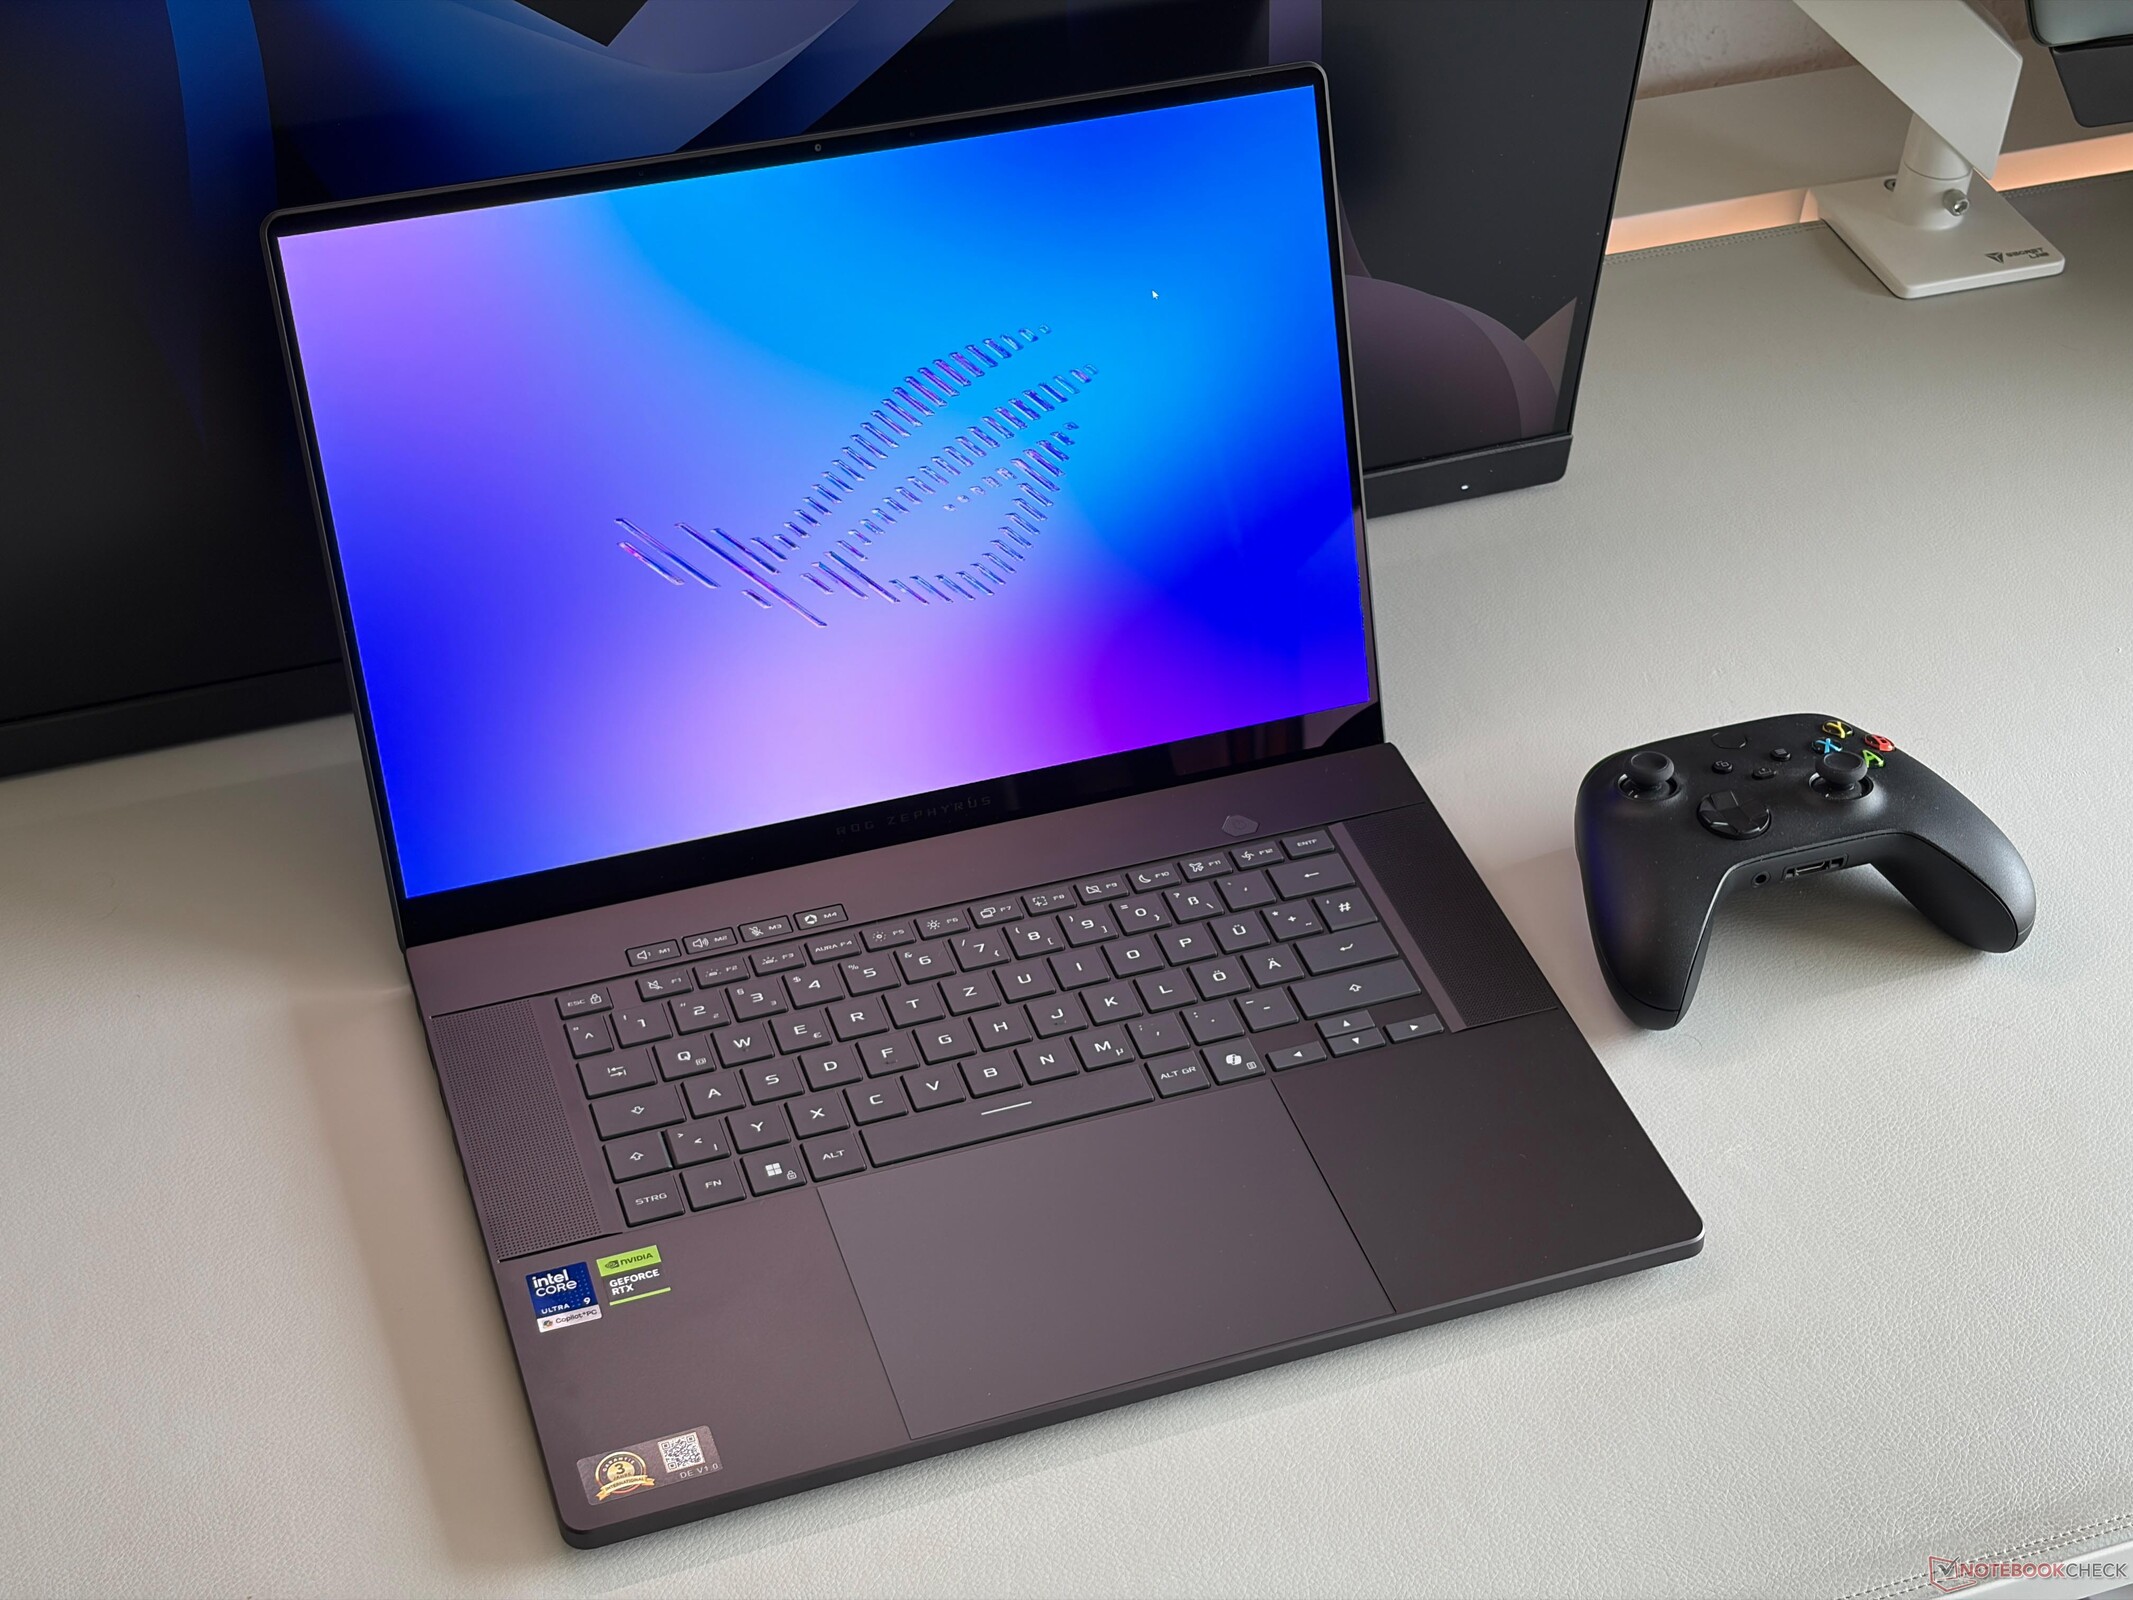
Verdict - Asus ROG Zephyrus G16 2026 is a noticeable improvement
The 2026 Asus ROG Zephyrus G16 is a noticeable improvement. The 240 Hz OLED panel is much brighter than before, which is great news for HDR gaming, the Intel Panther Lake processor is more efficient and results in longer battery runtimes and the GPU now runs at a higher wattage than before, which improves the gaming performance even though we did not get new graphics cards. The familiar qualities of the Zephyrus G16 still include the excellent keyboard, the sturdy aluminum chassis (with improved hinges) as well as the excellent sound system.
The memory is still soldered and configurations with 64 GB are also extremely expensive at more than $5,000. This means the 2026 model with the RTX 5080 and the aforementioned improvements is more expensive than the old 2025 model was with the RTX 5090. While all laptops are getting more expensive, this is still a tough pill to swallow.
Pros
Cons
Price and Availability
You can get the 2026 Asus ROG Zephyrus G16 with the GeForce RTX 5080, 32 GB RAM & 2 TB SSD storage for $3389 from BestBuy.

Specifications
Case, Connectivity and Input Devices
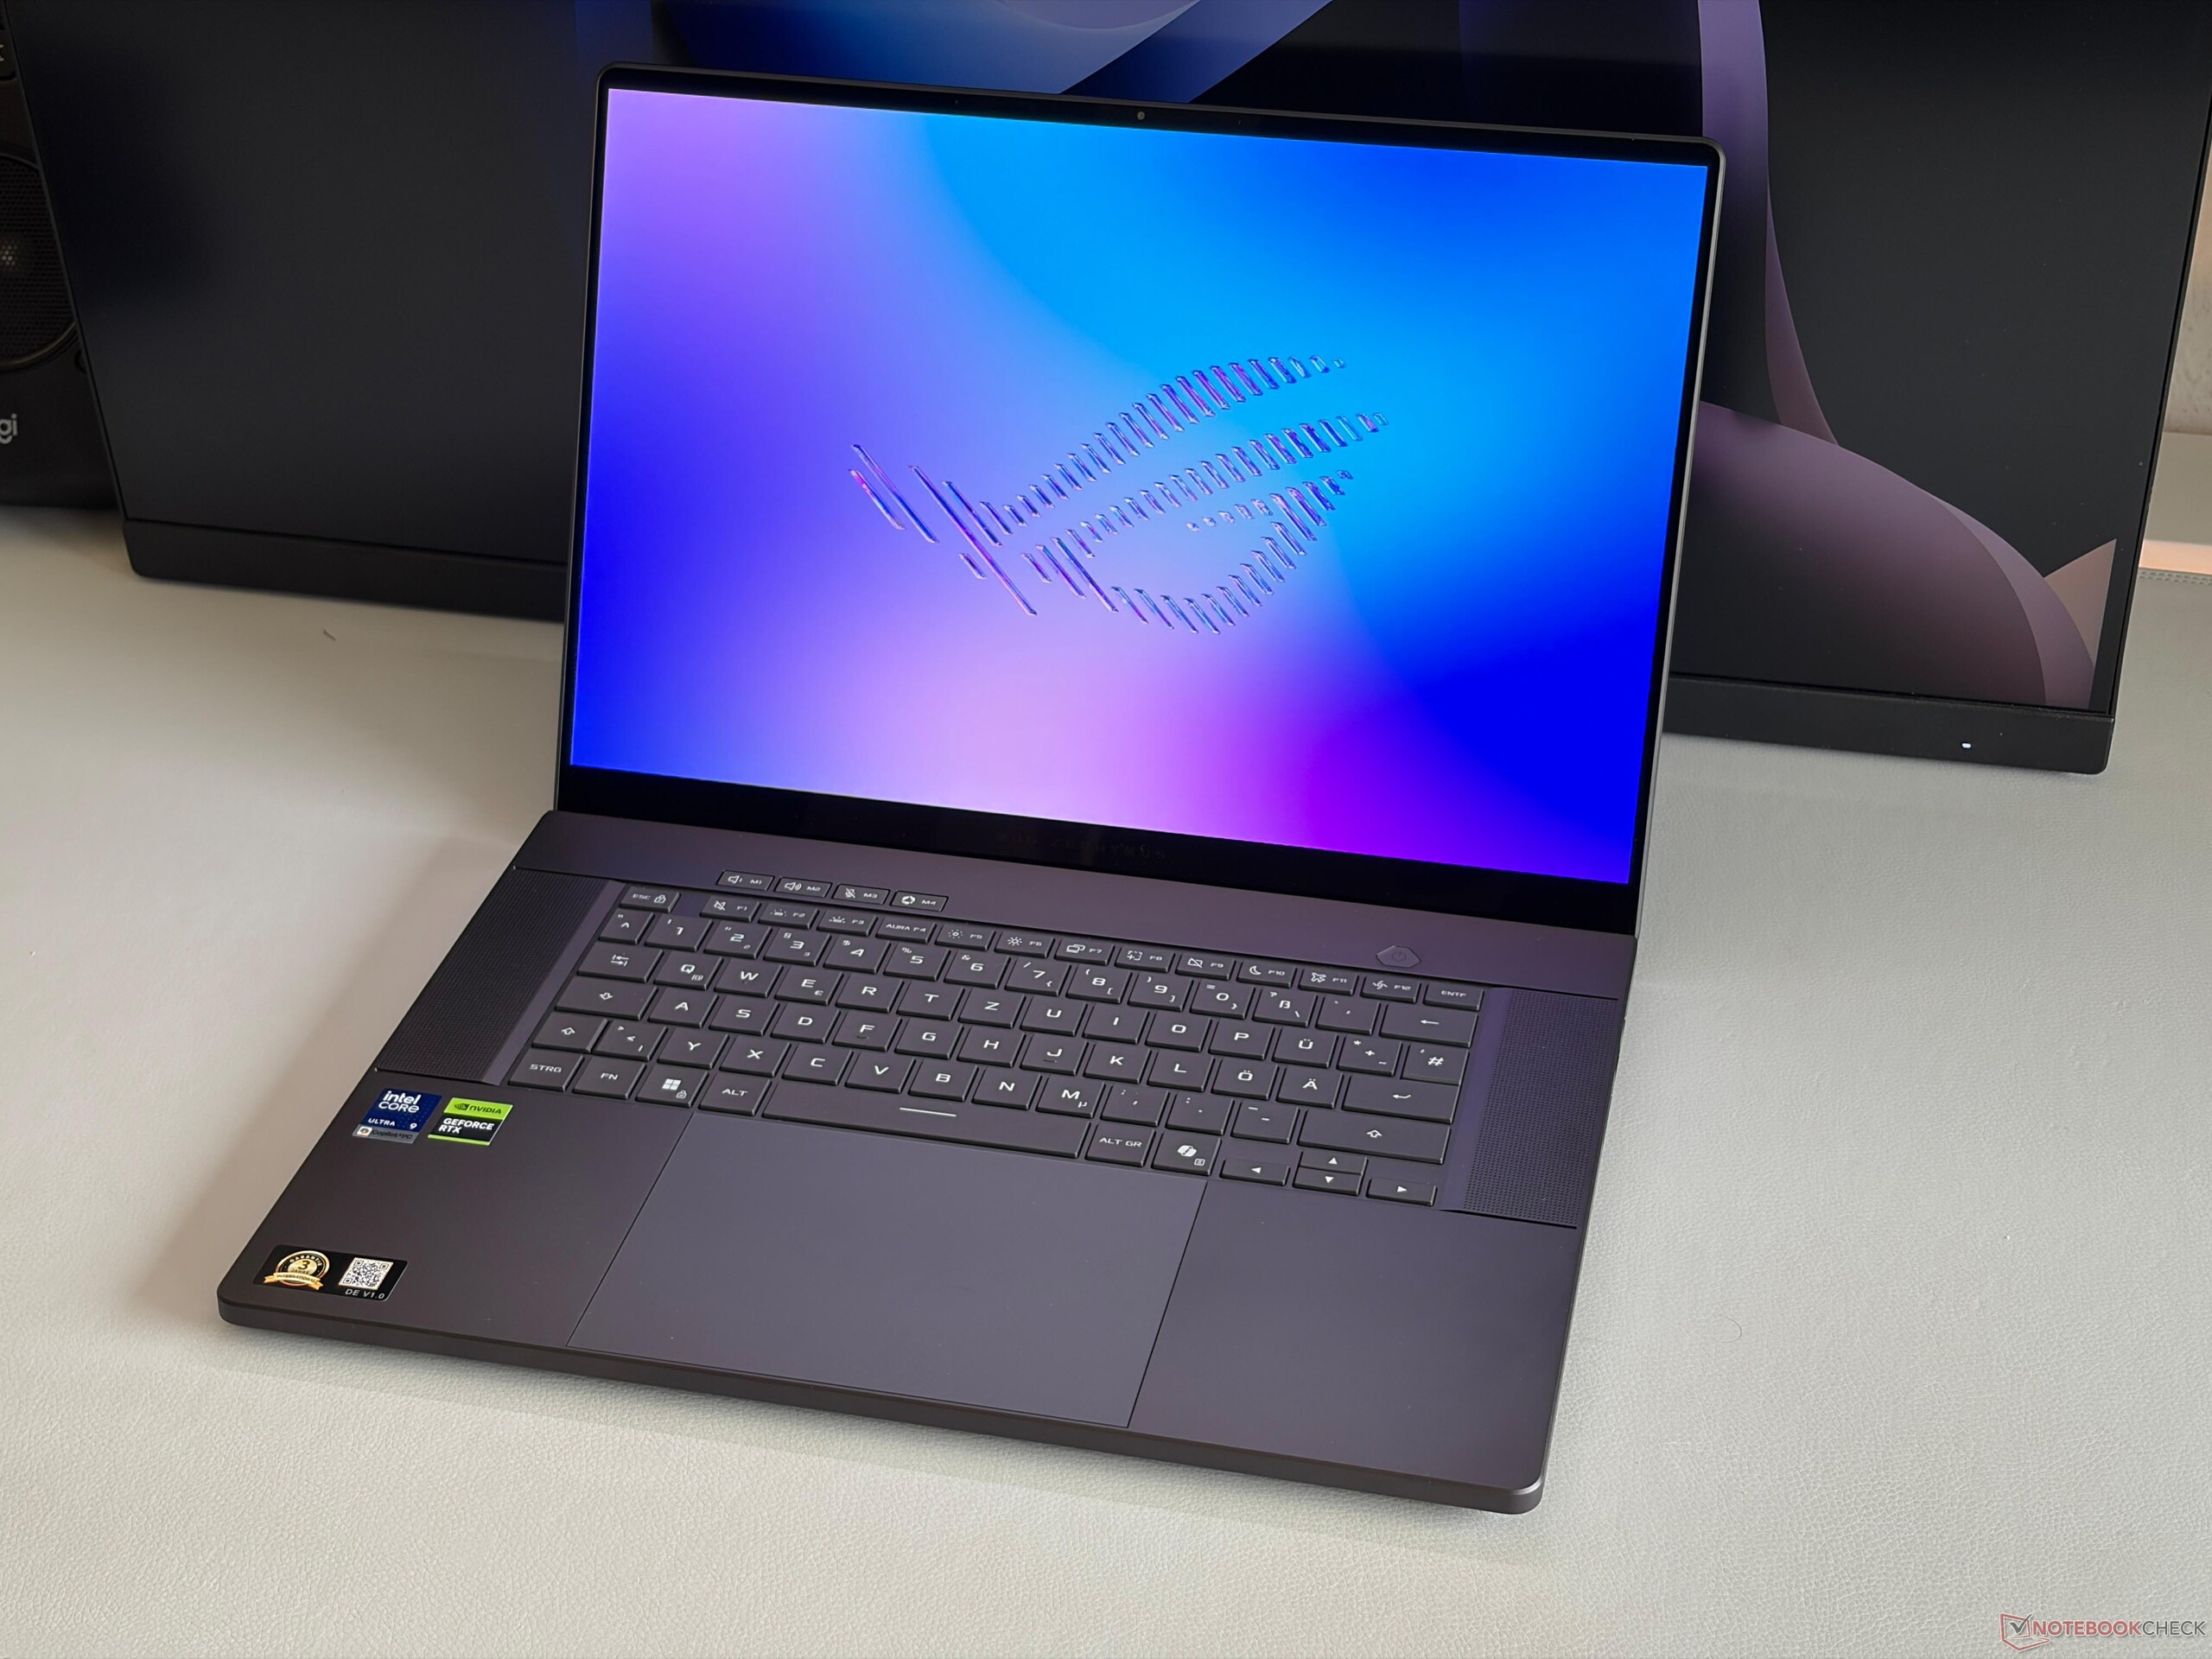
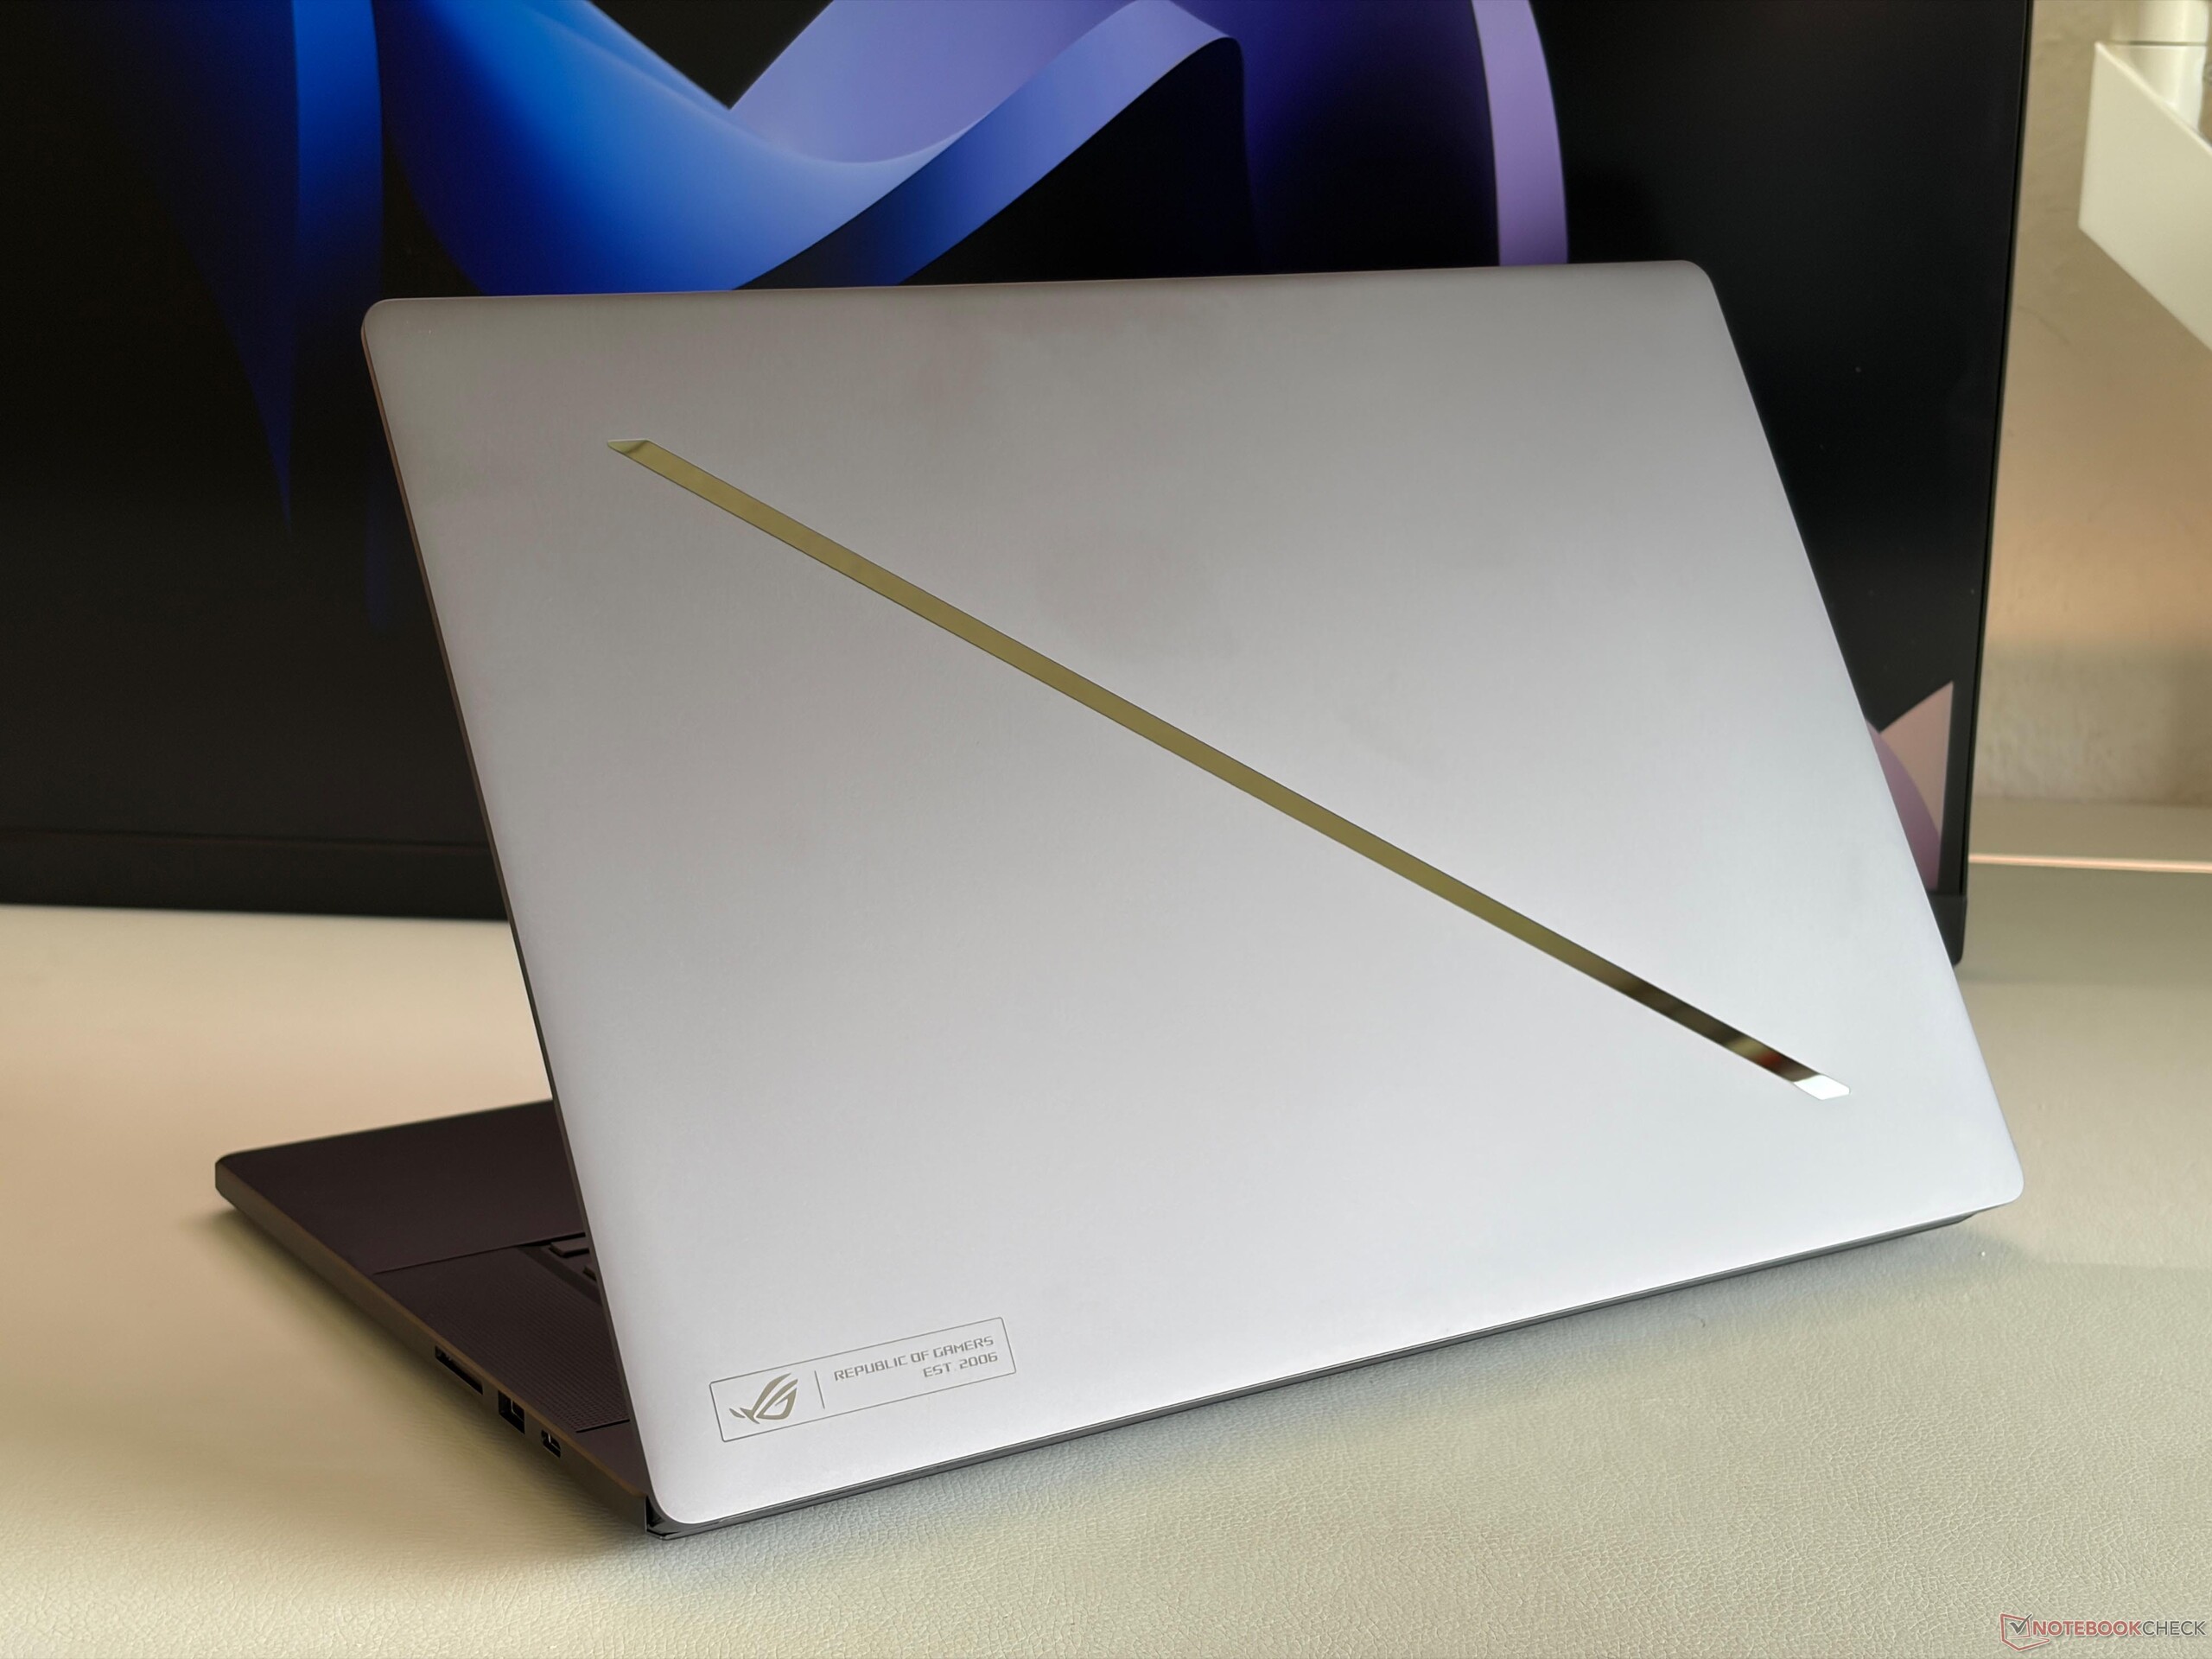
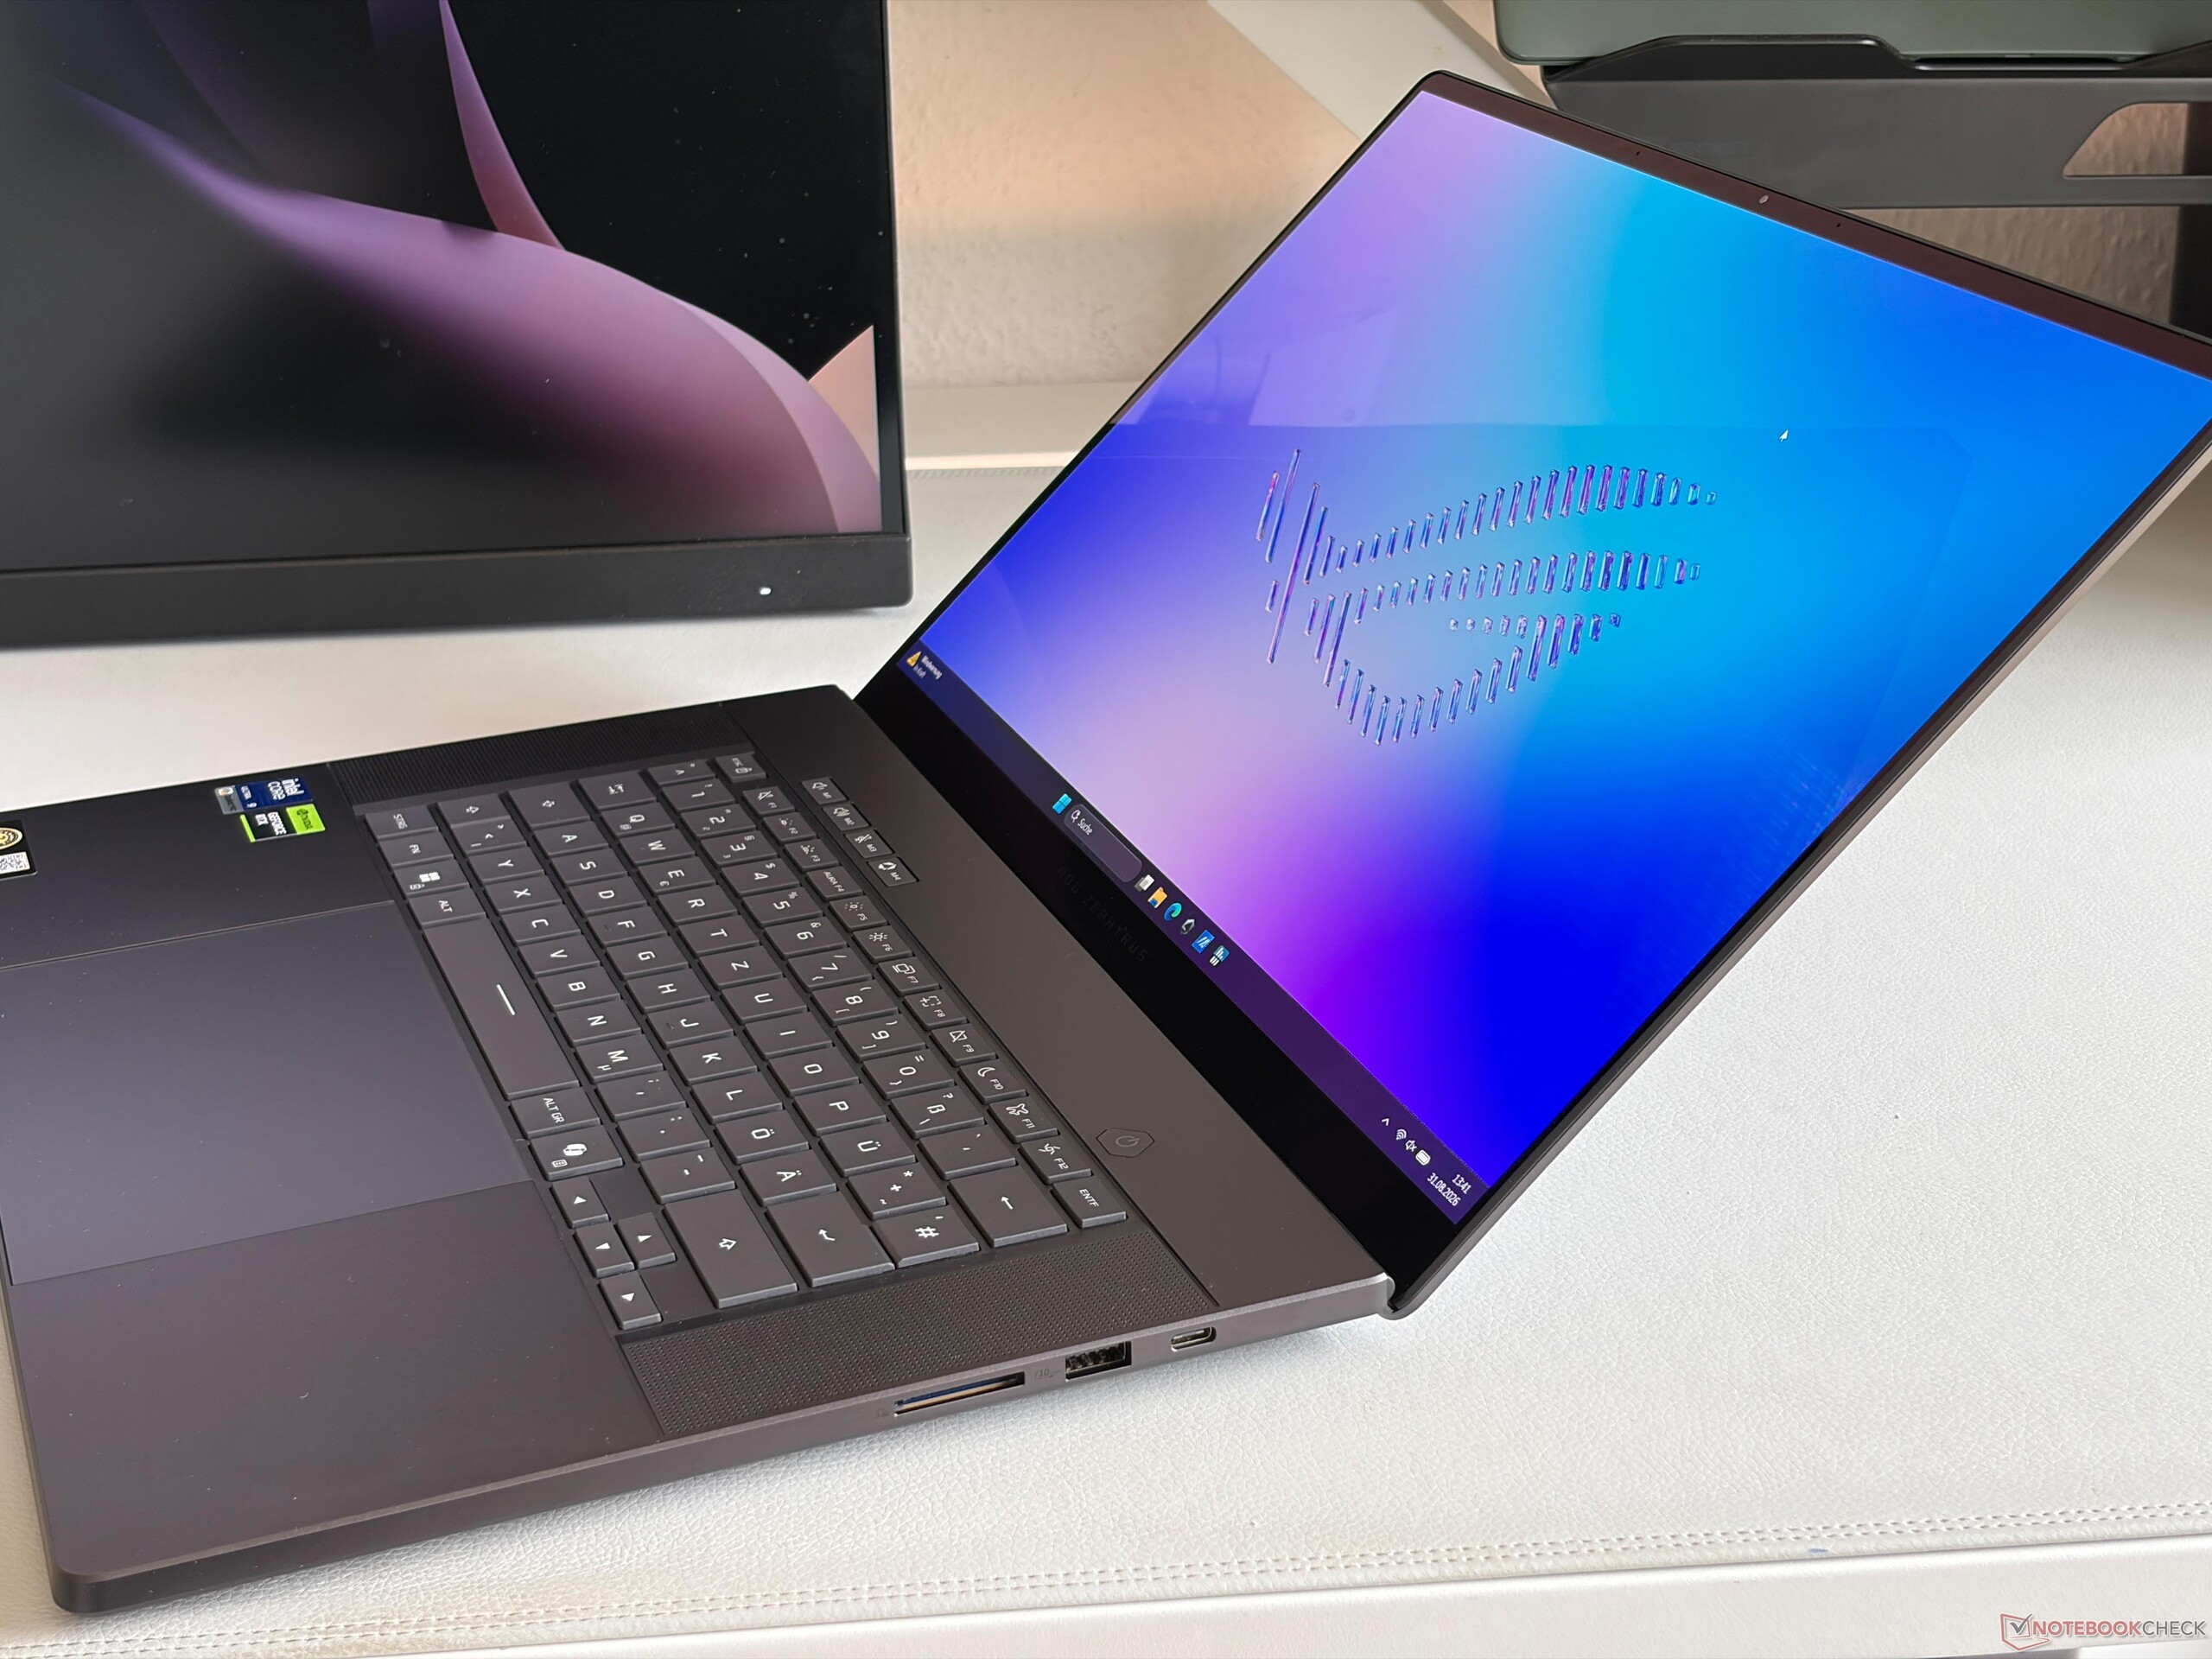
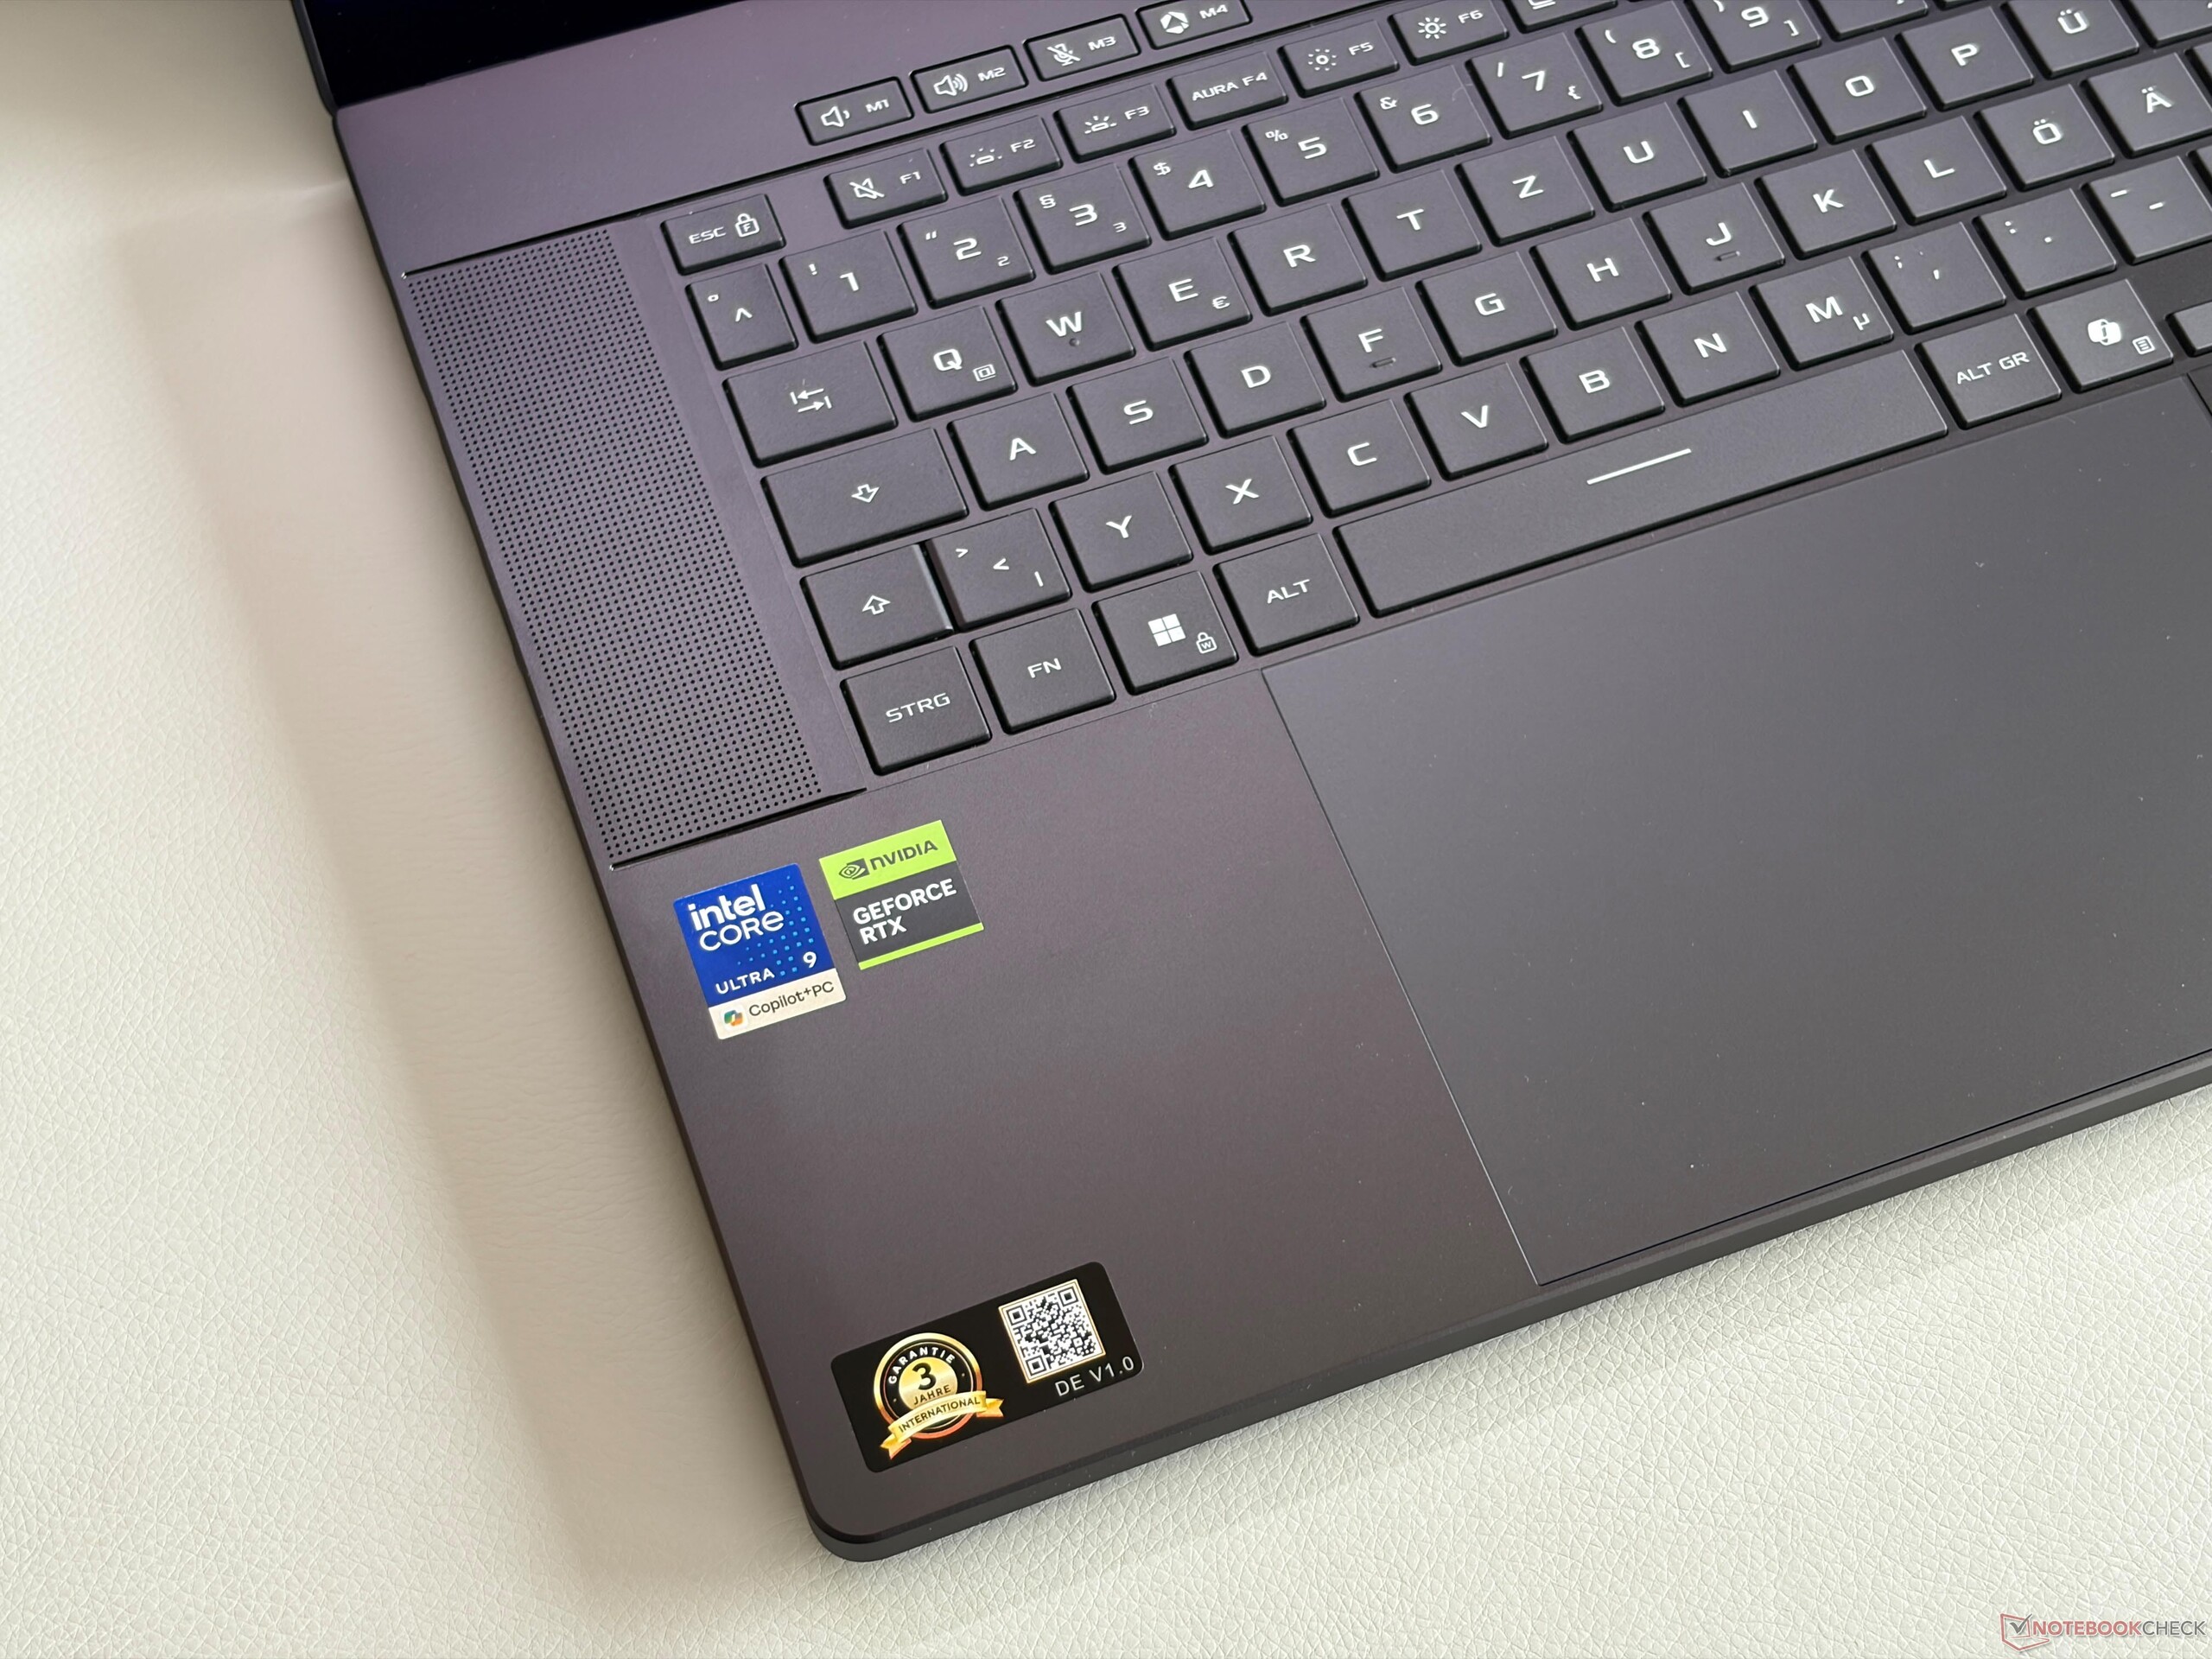
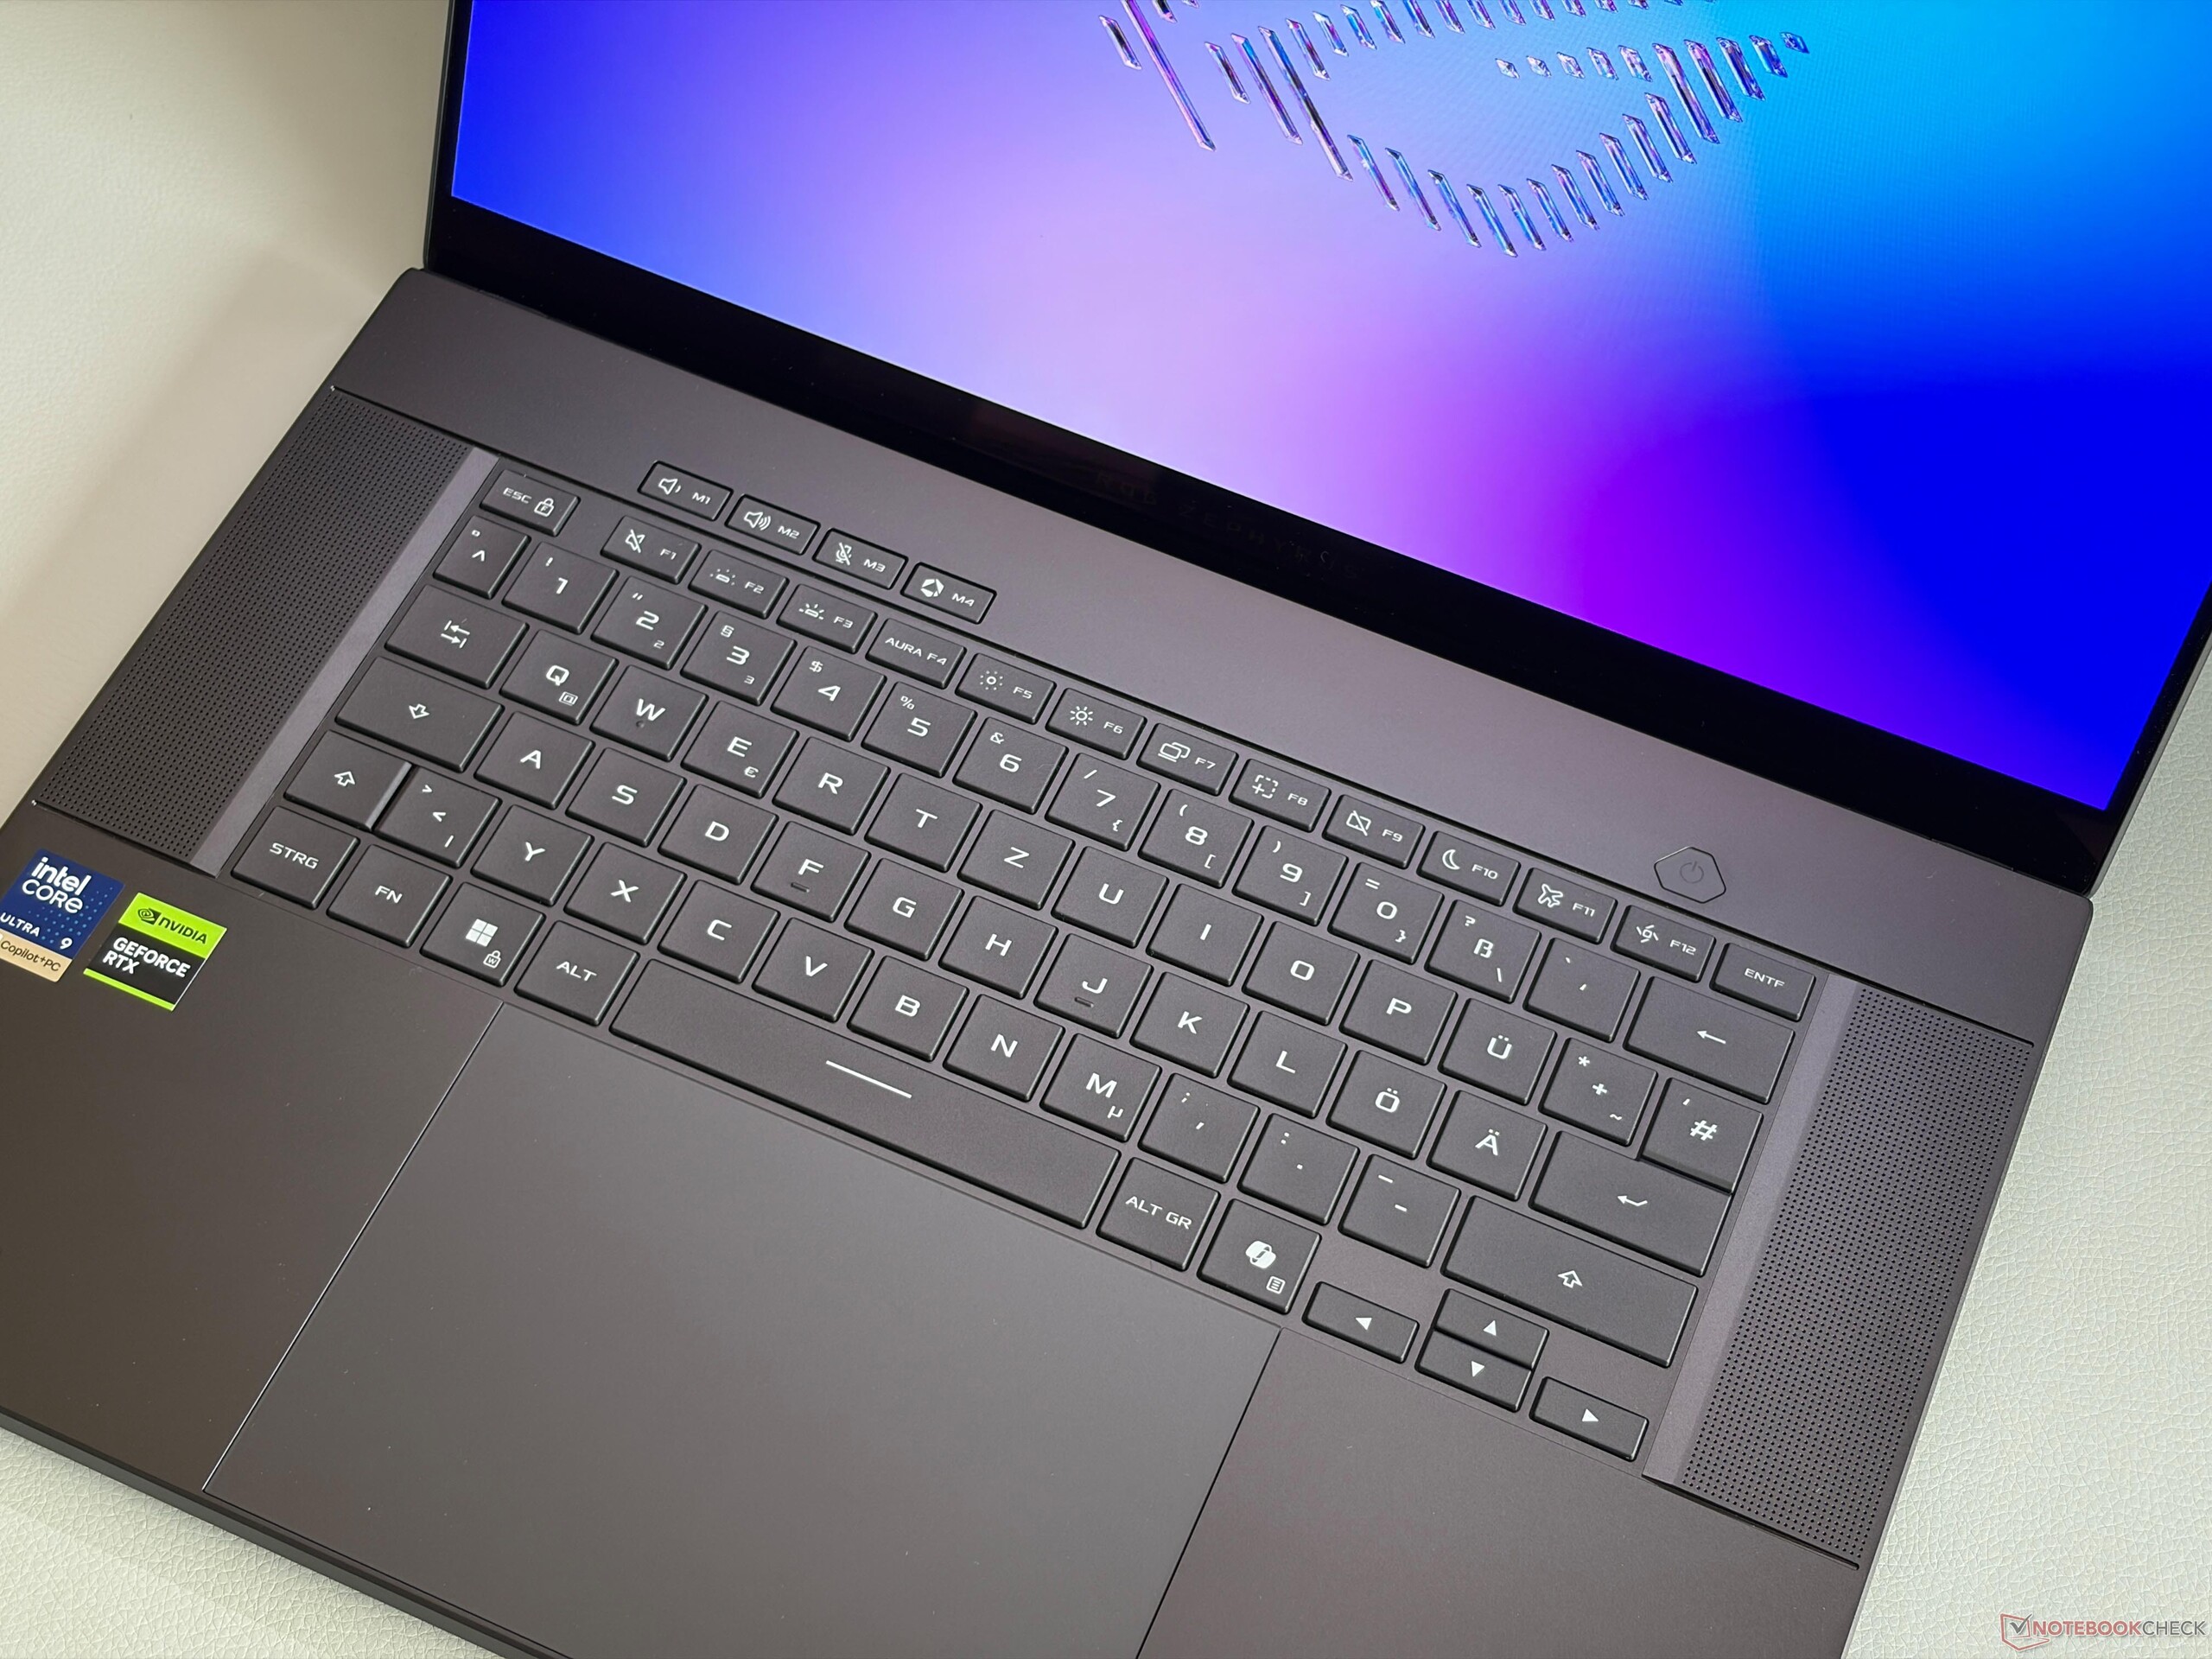
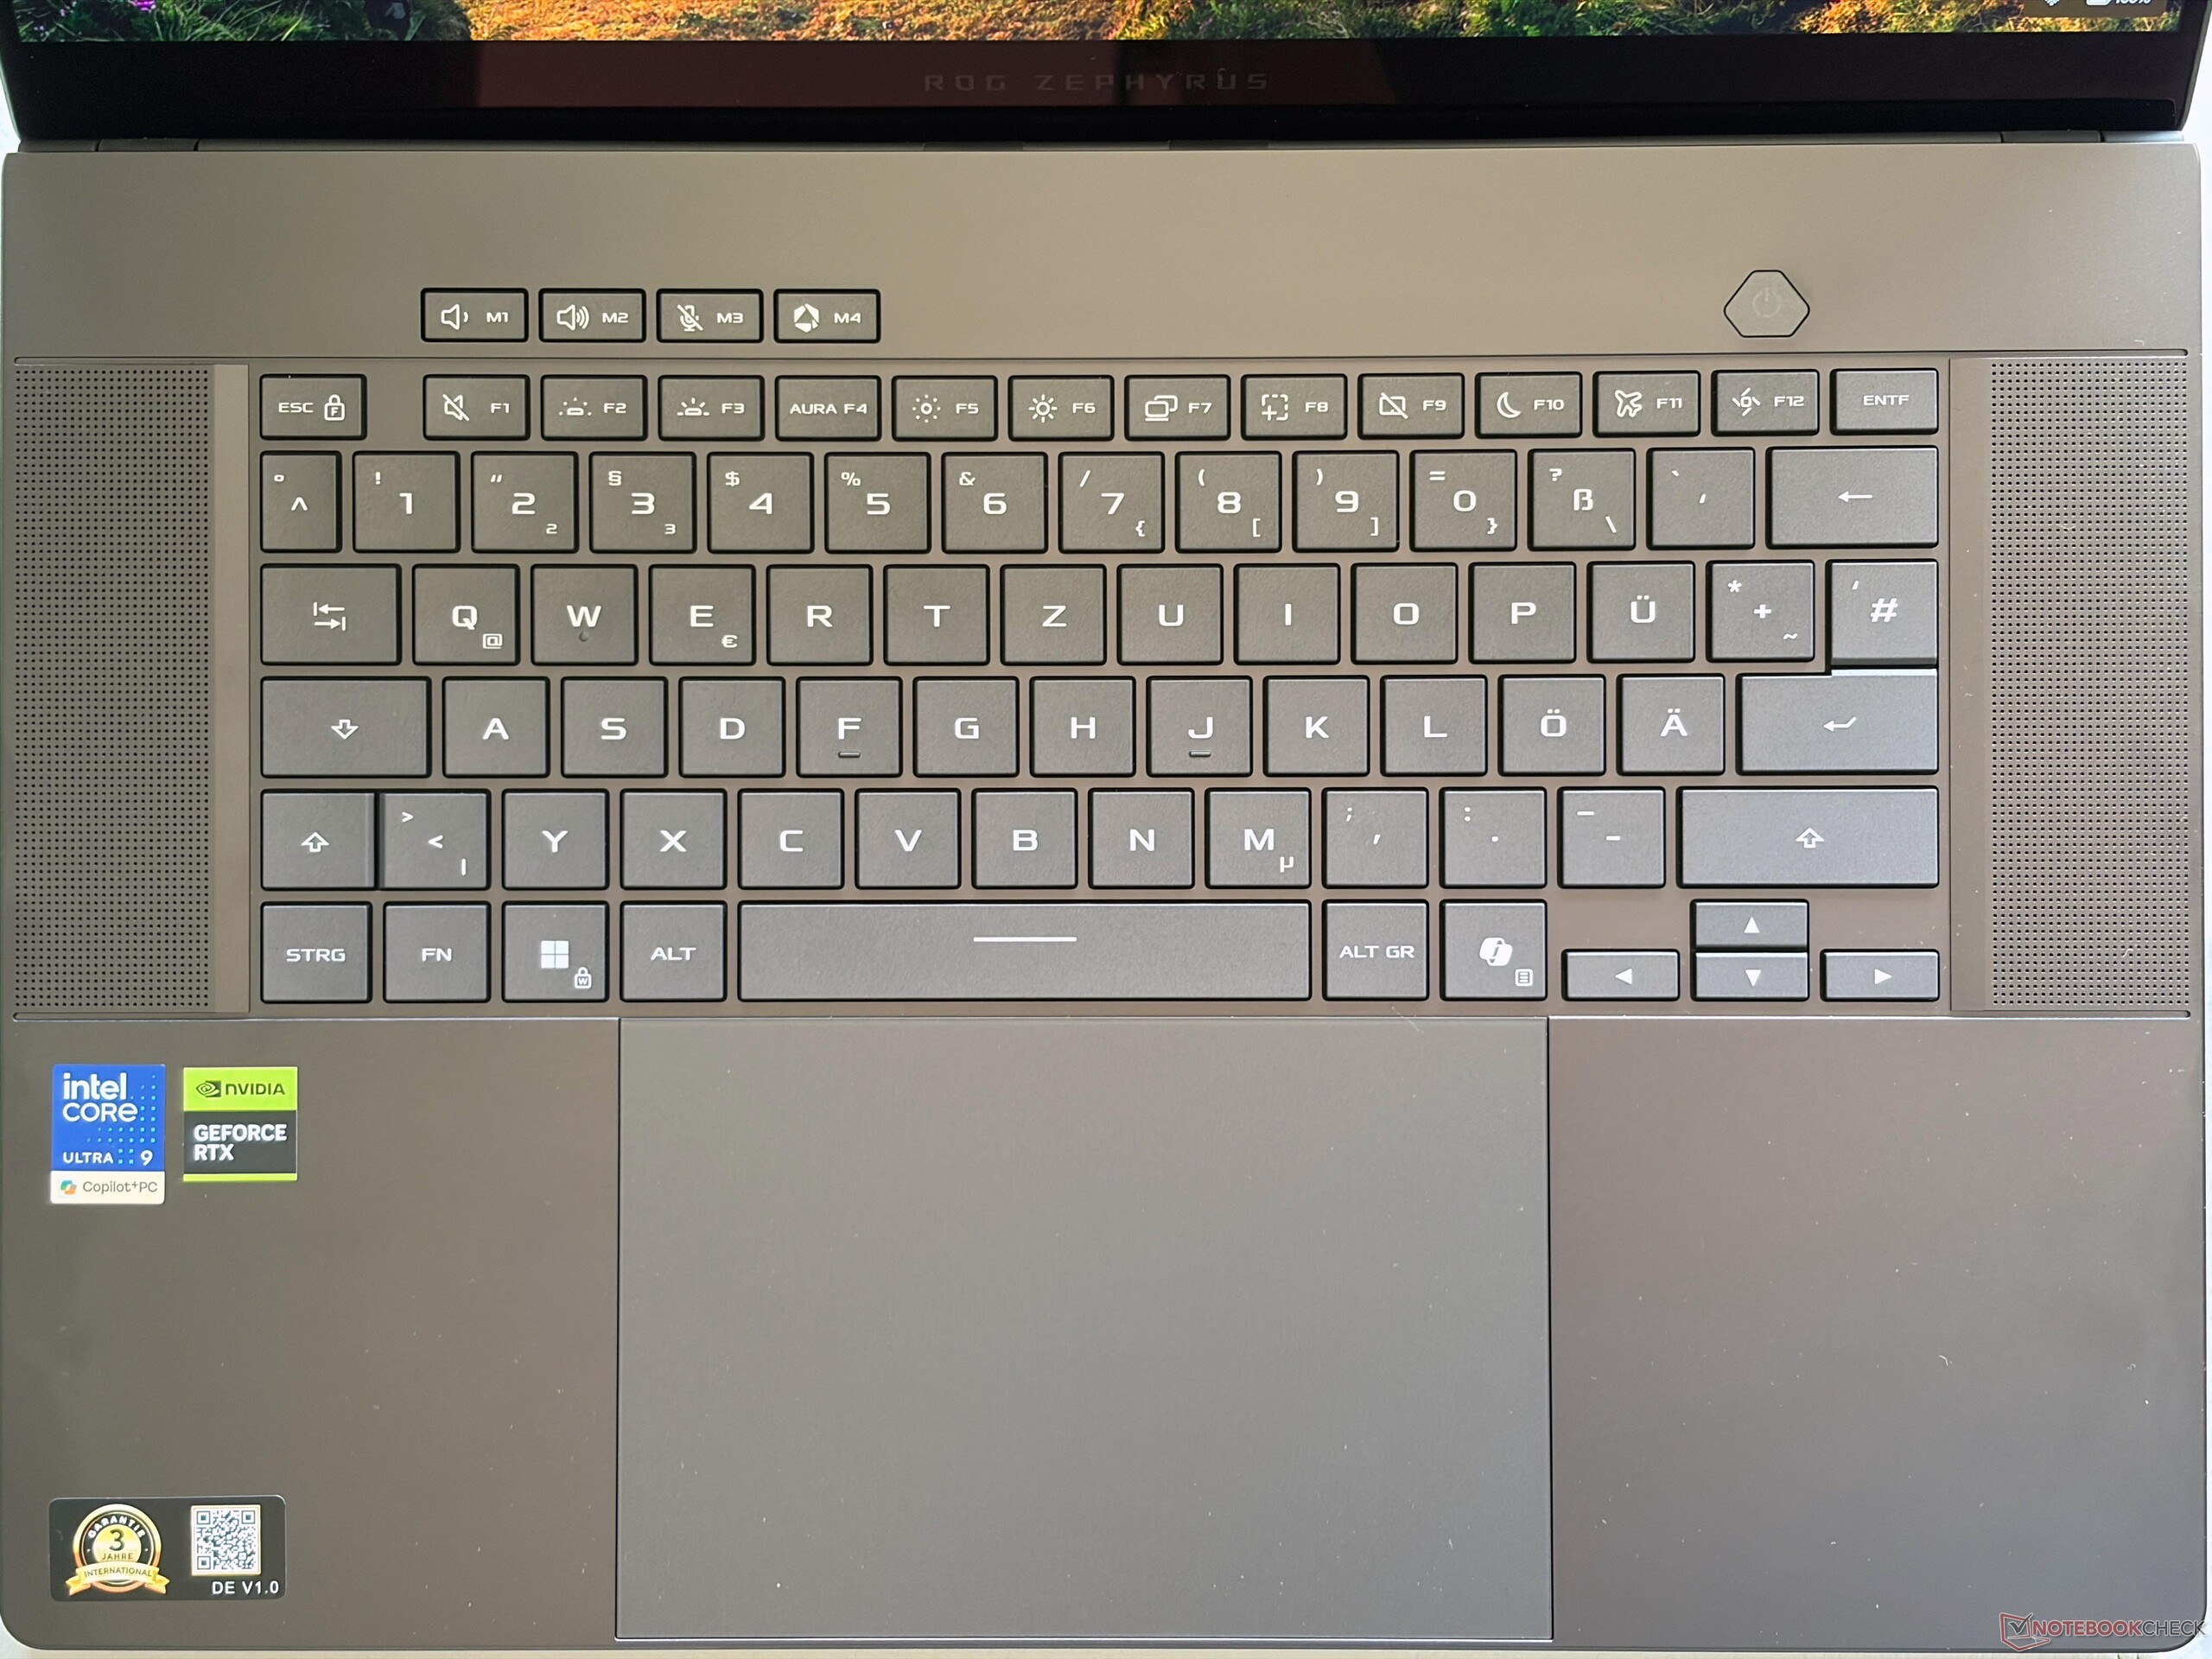
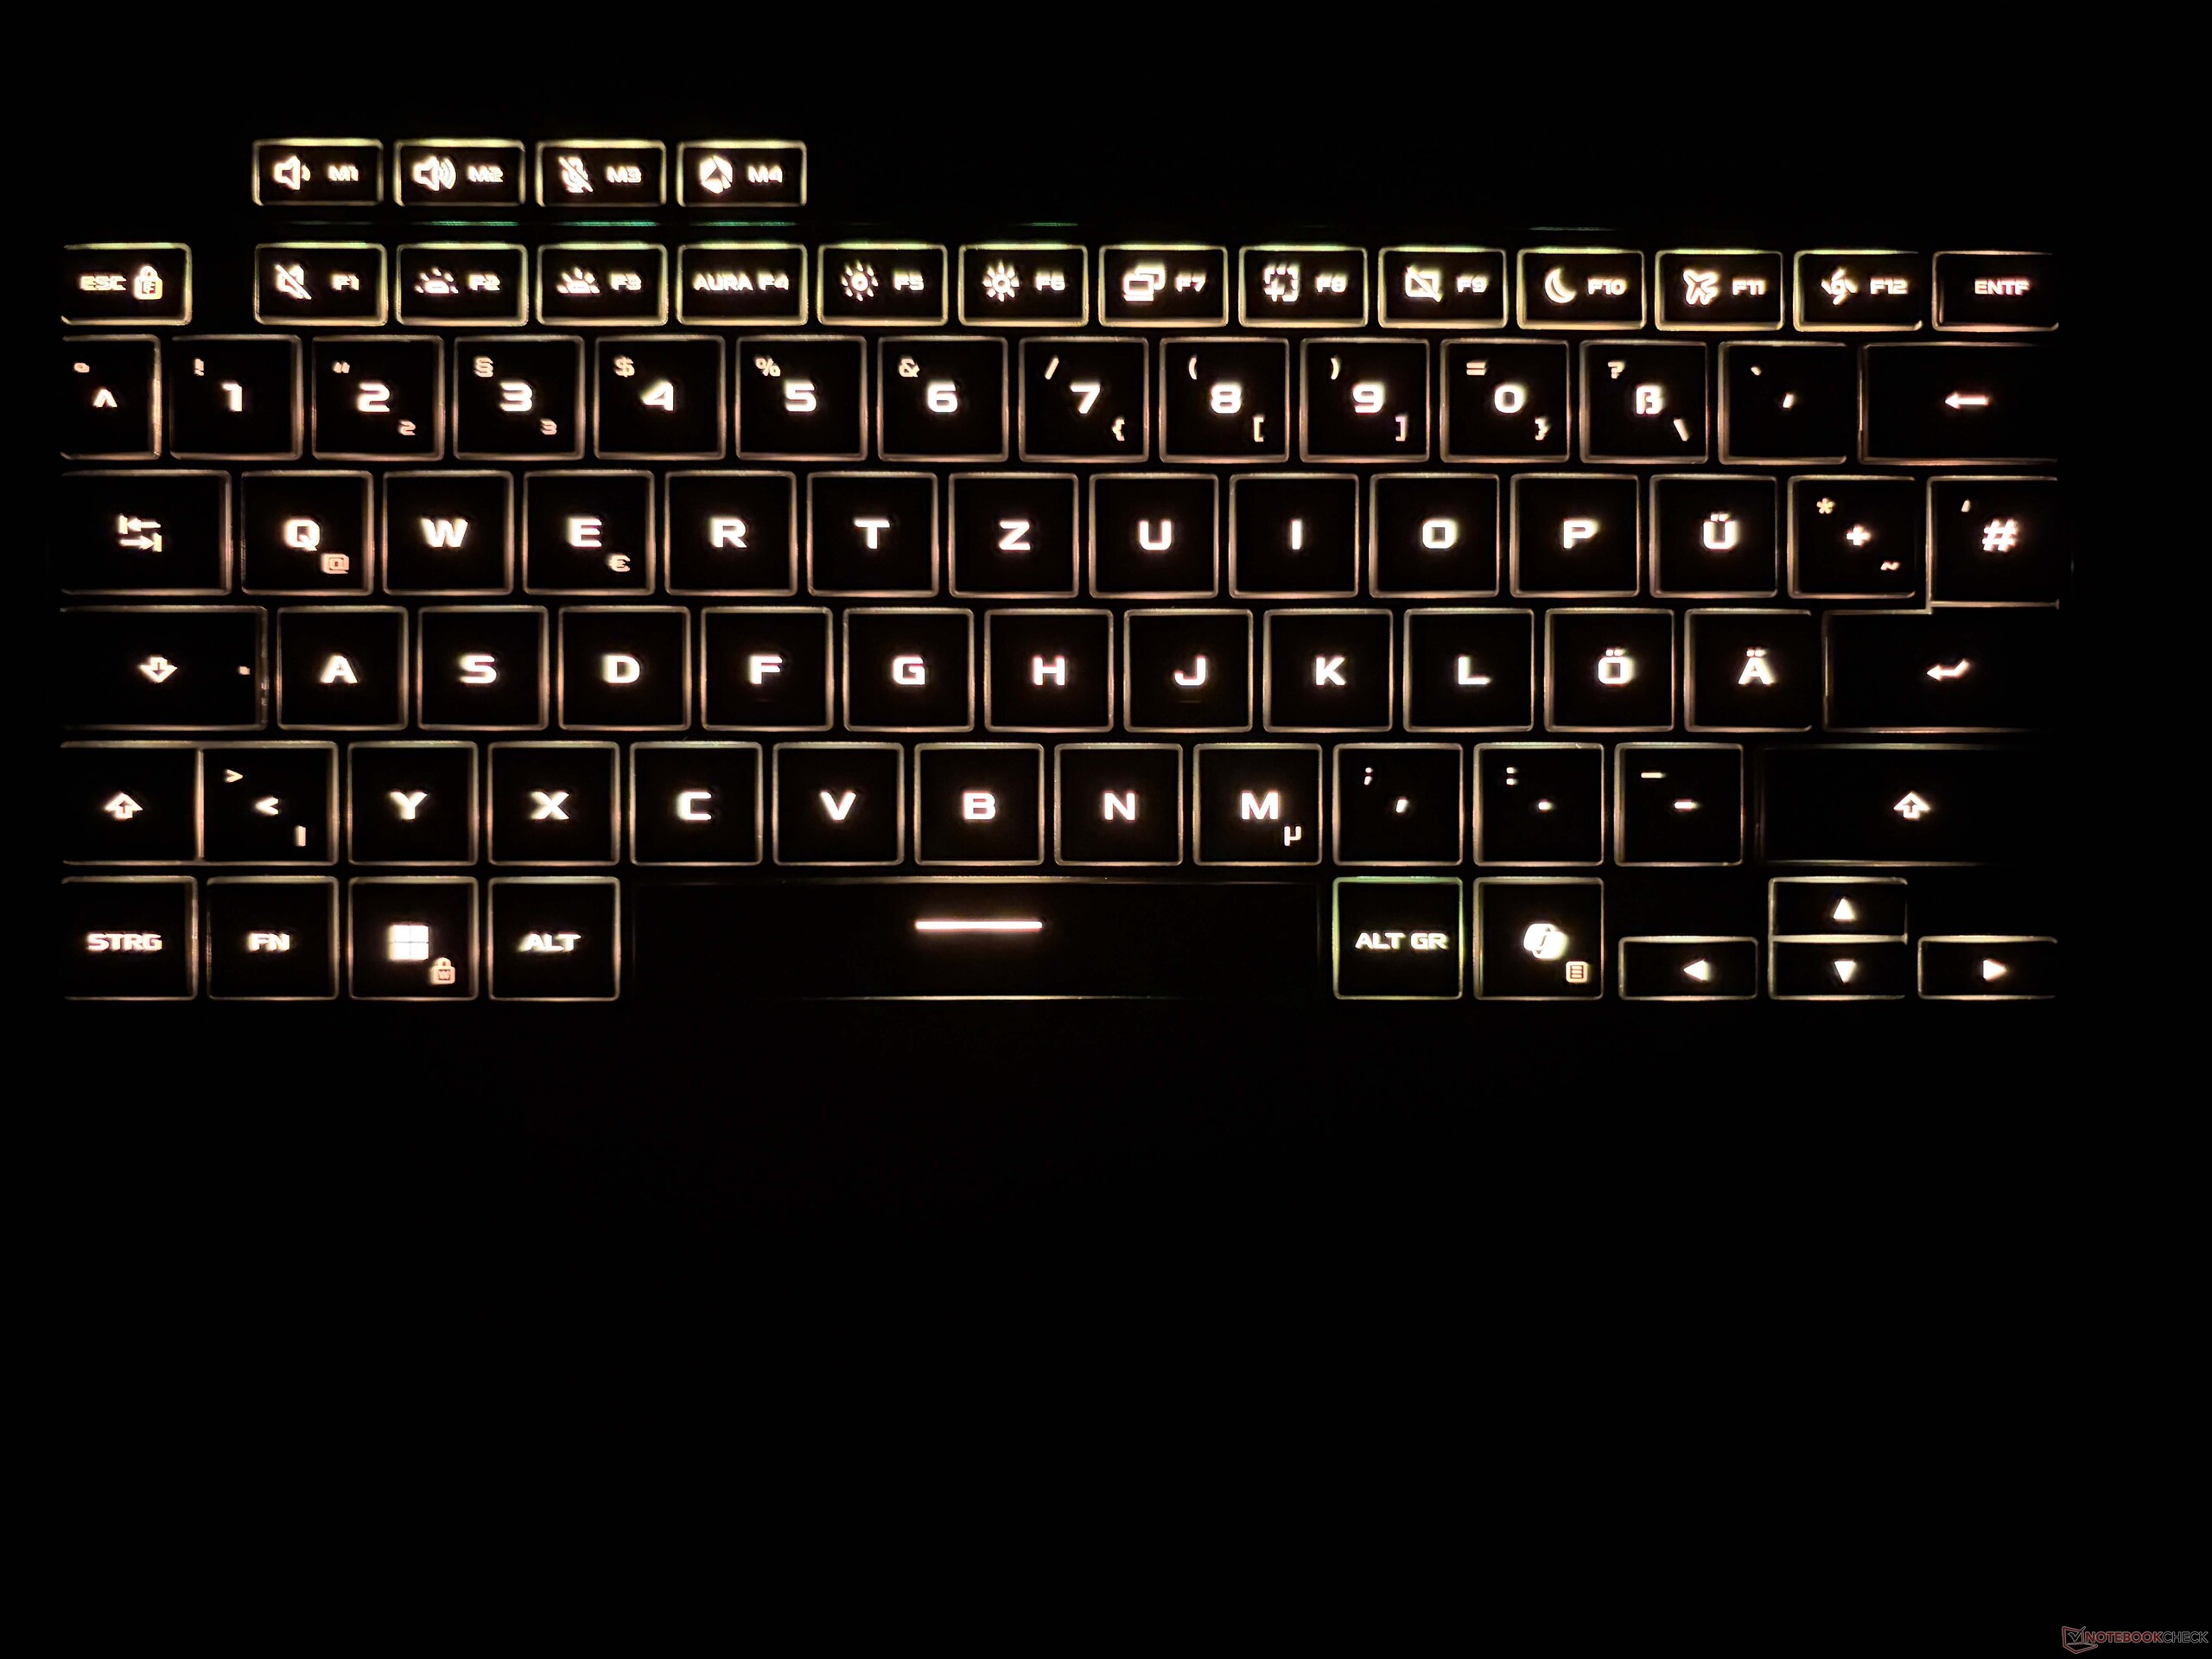
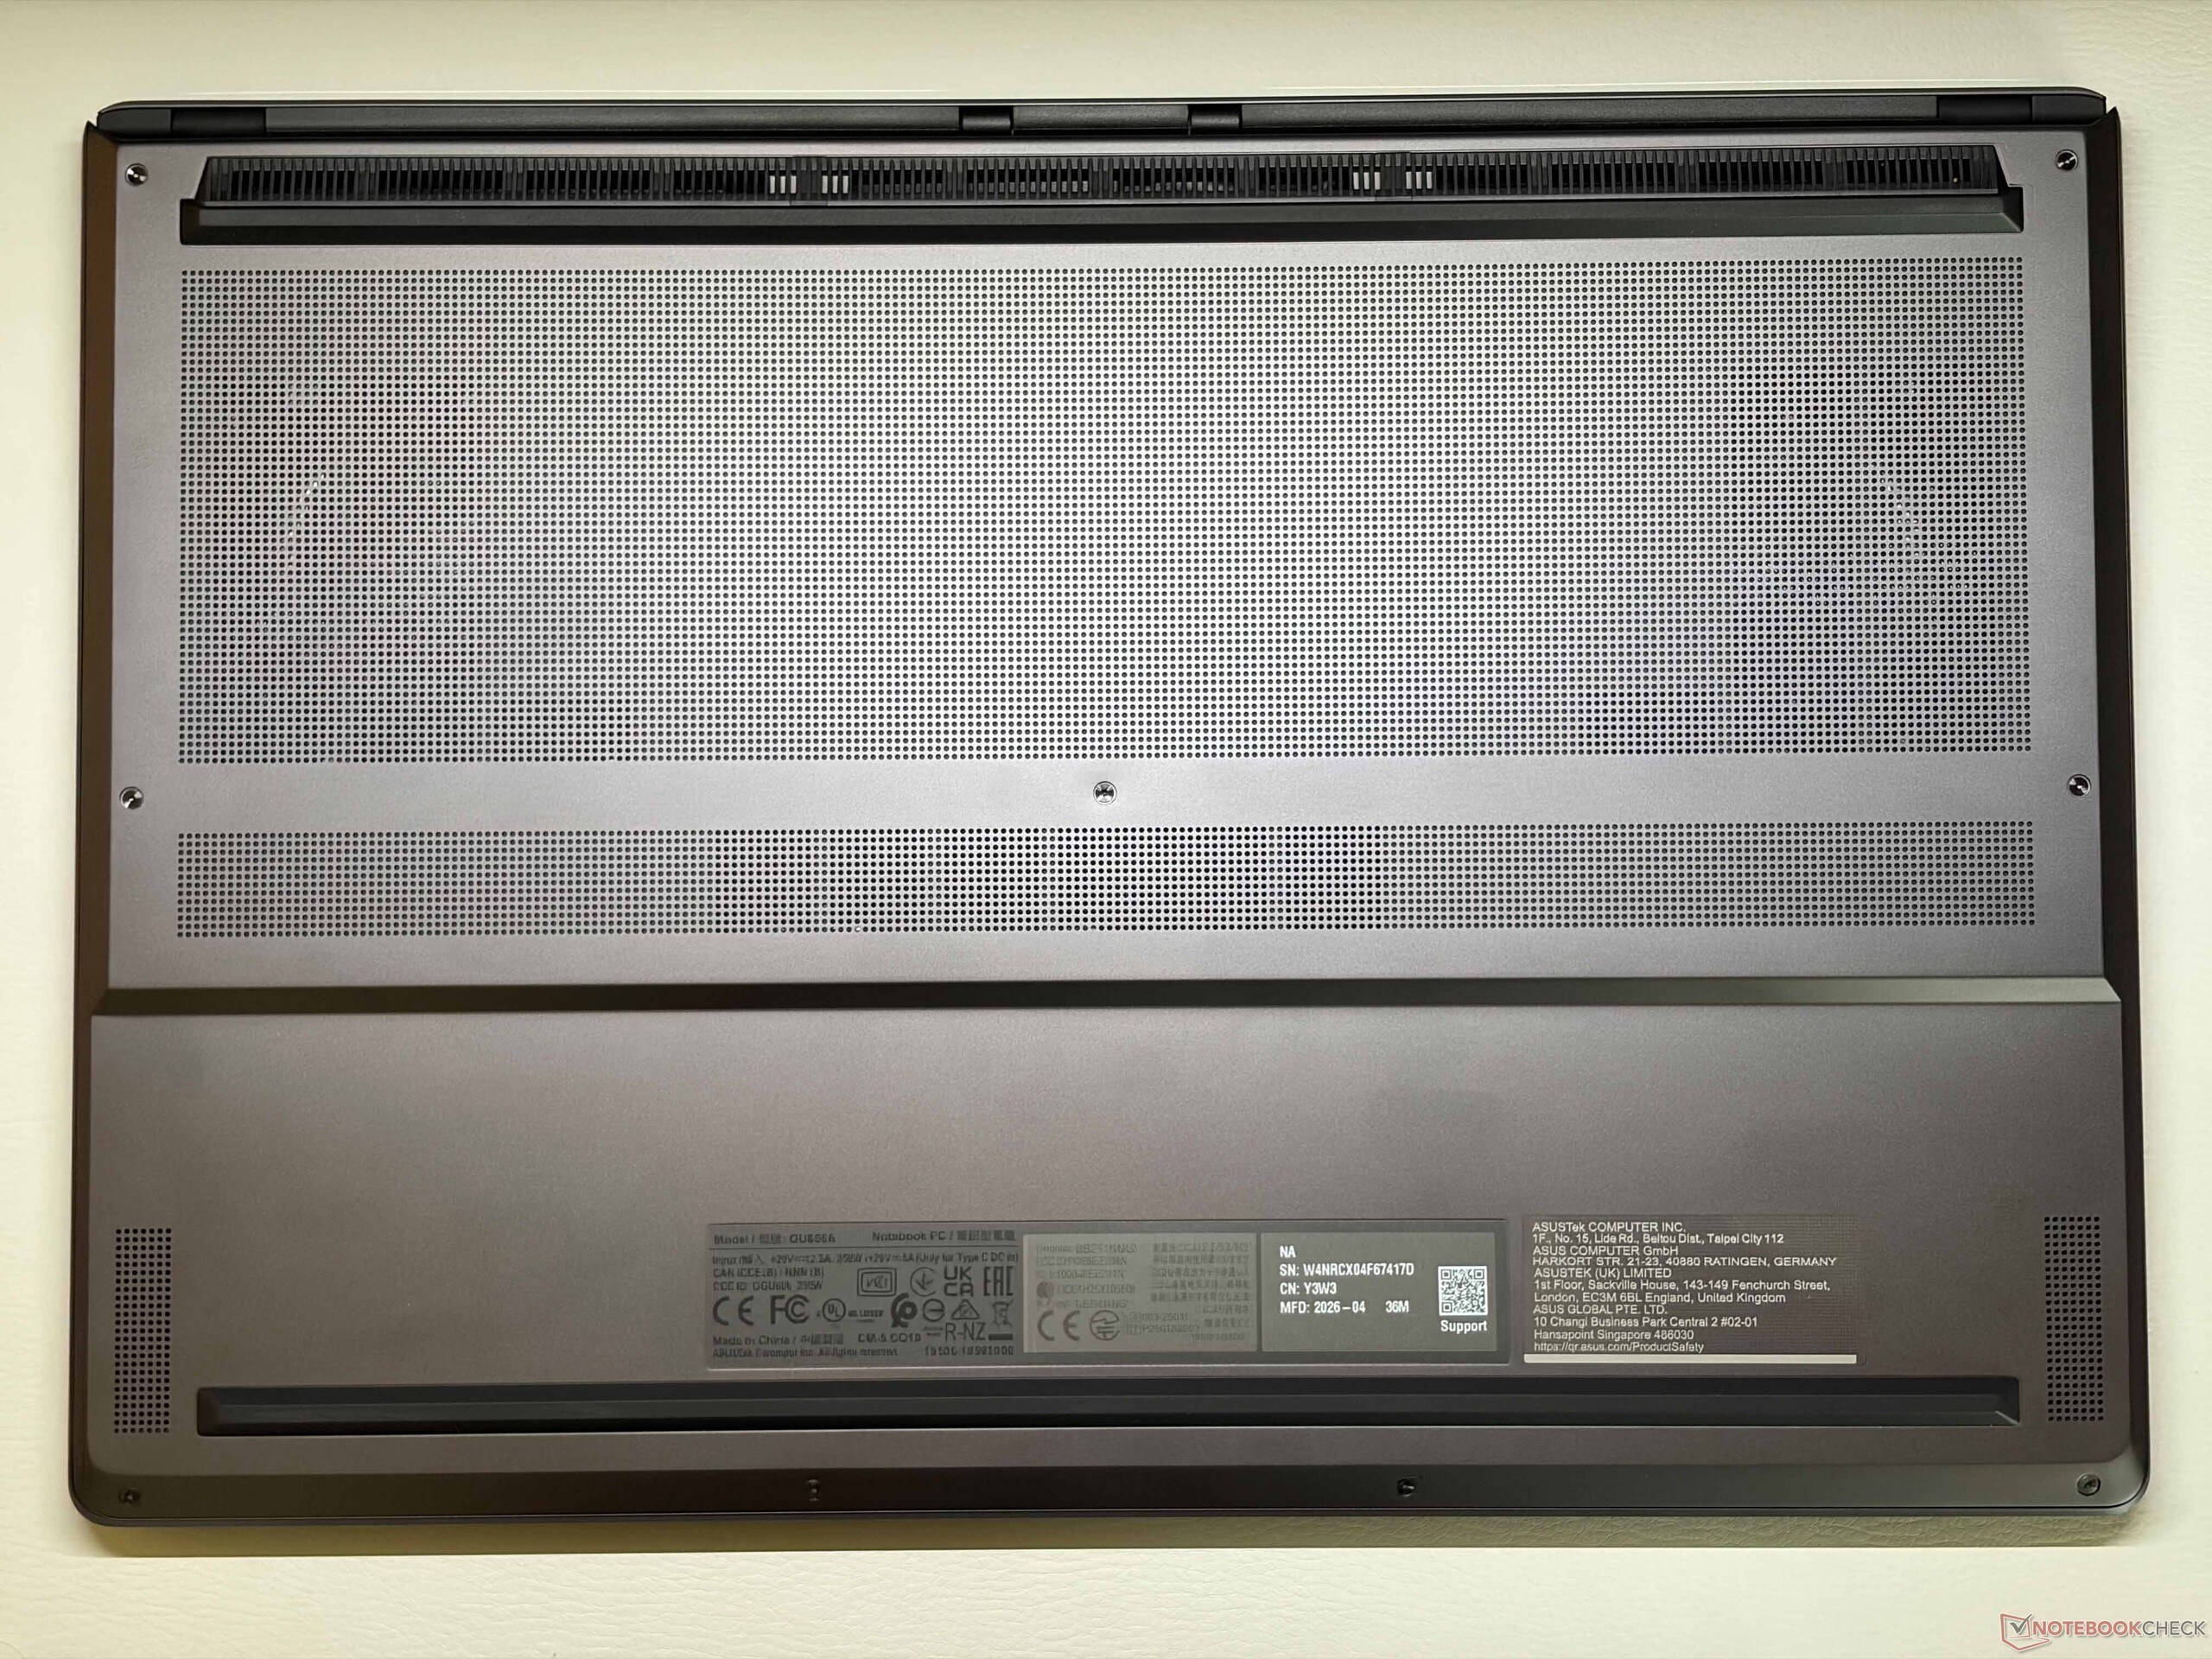
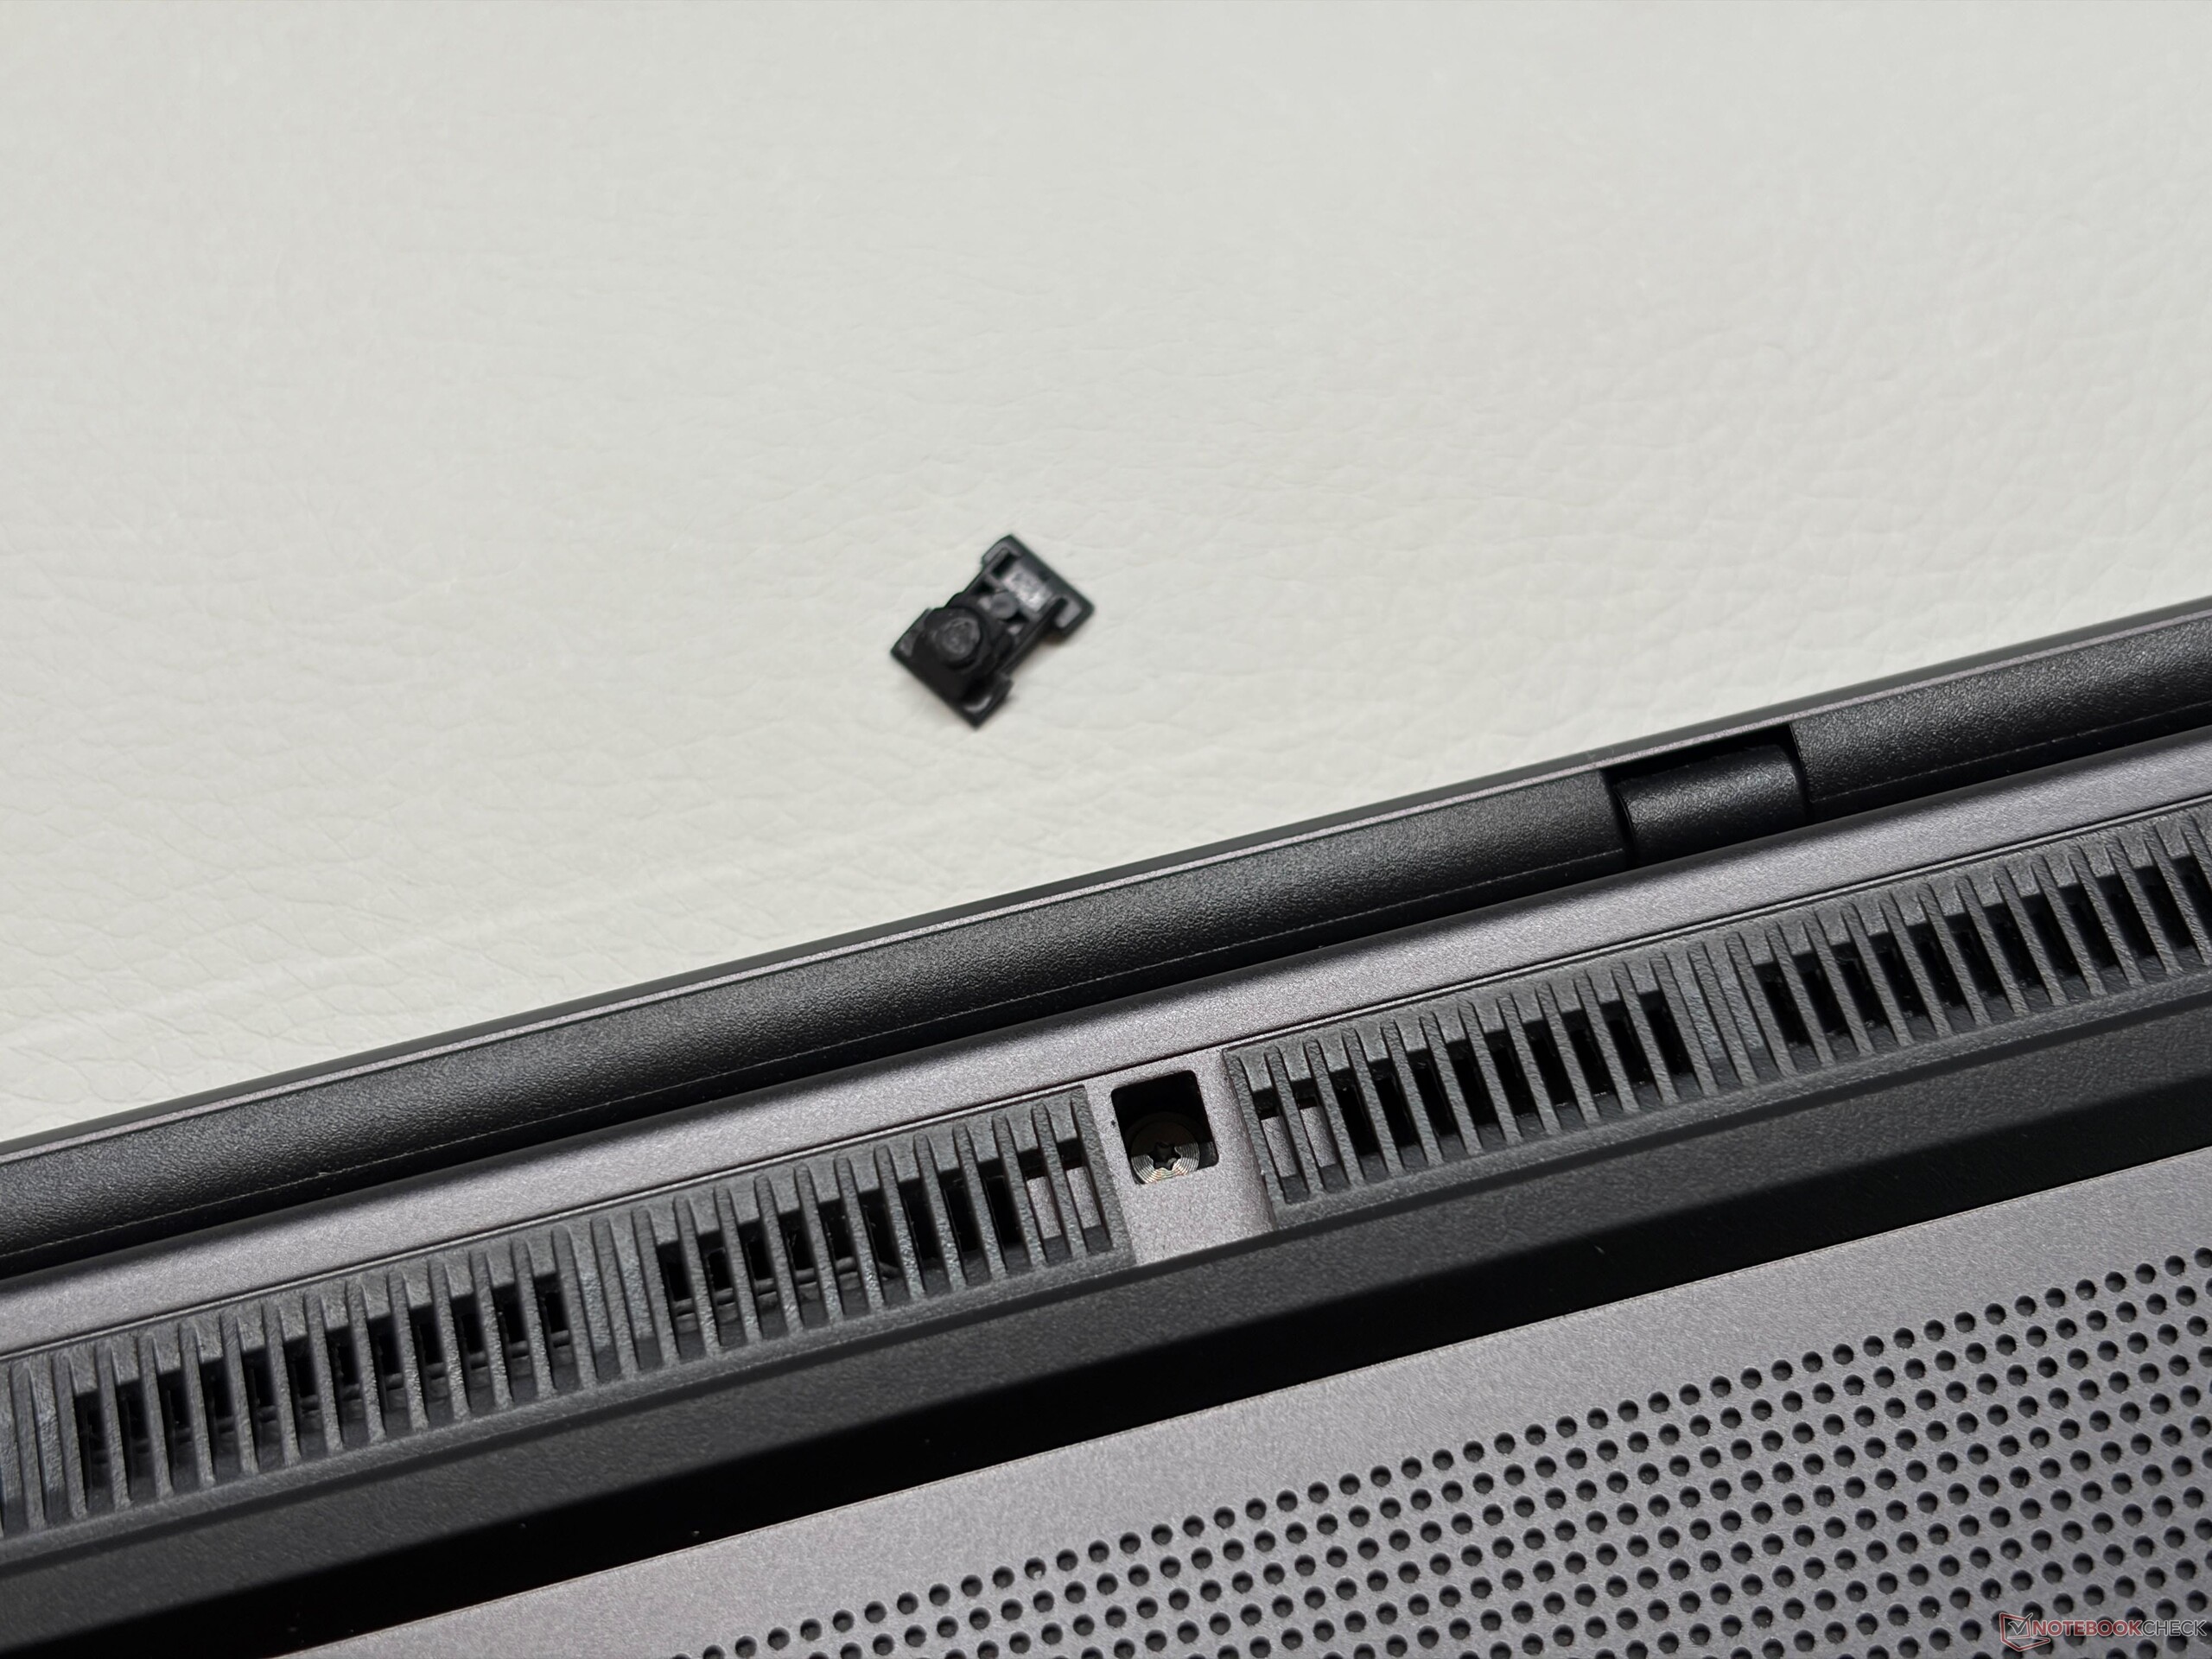
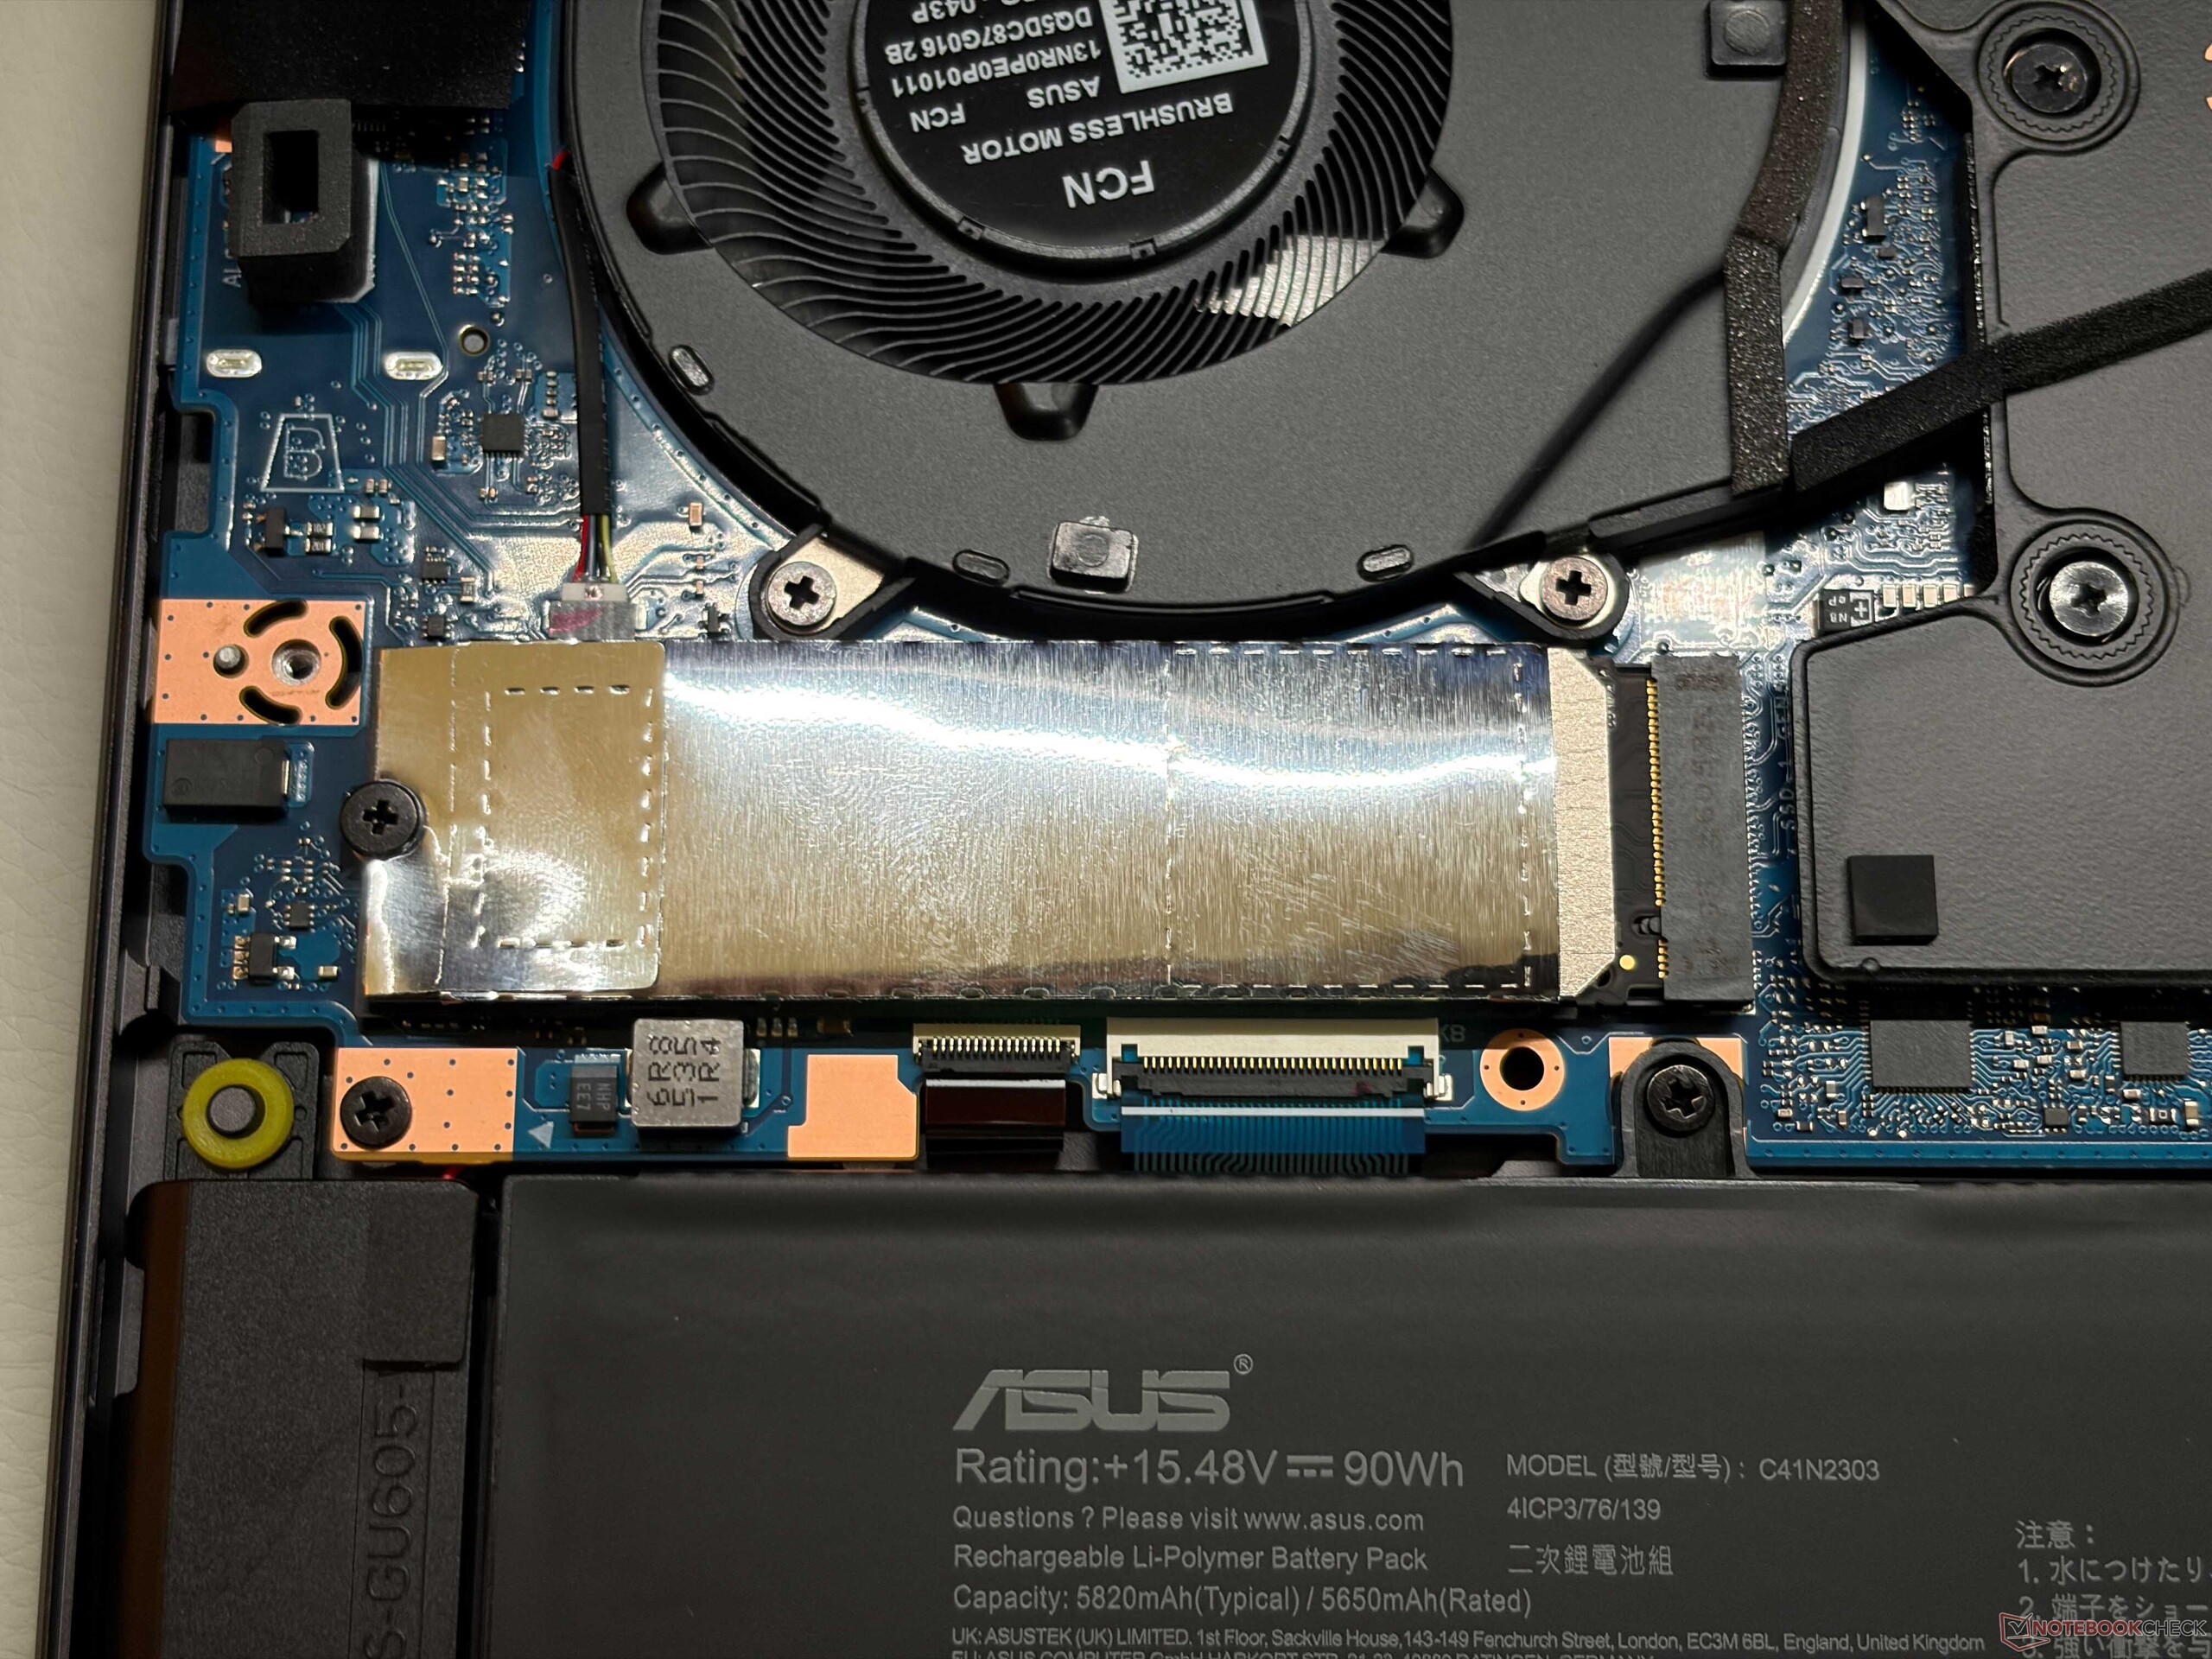
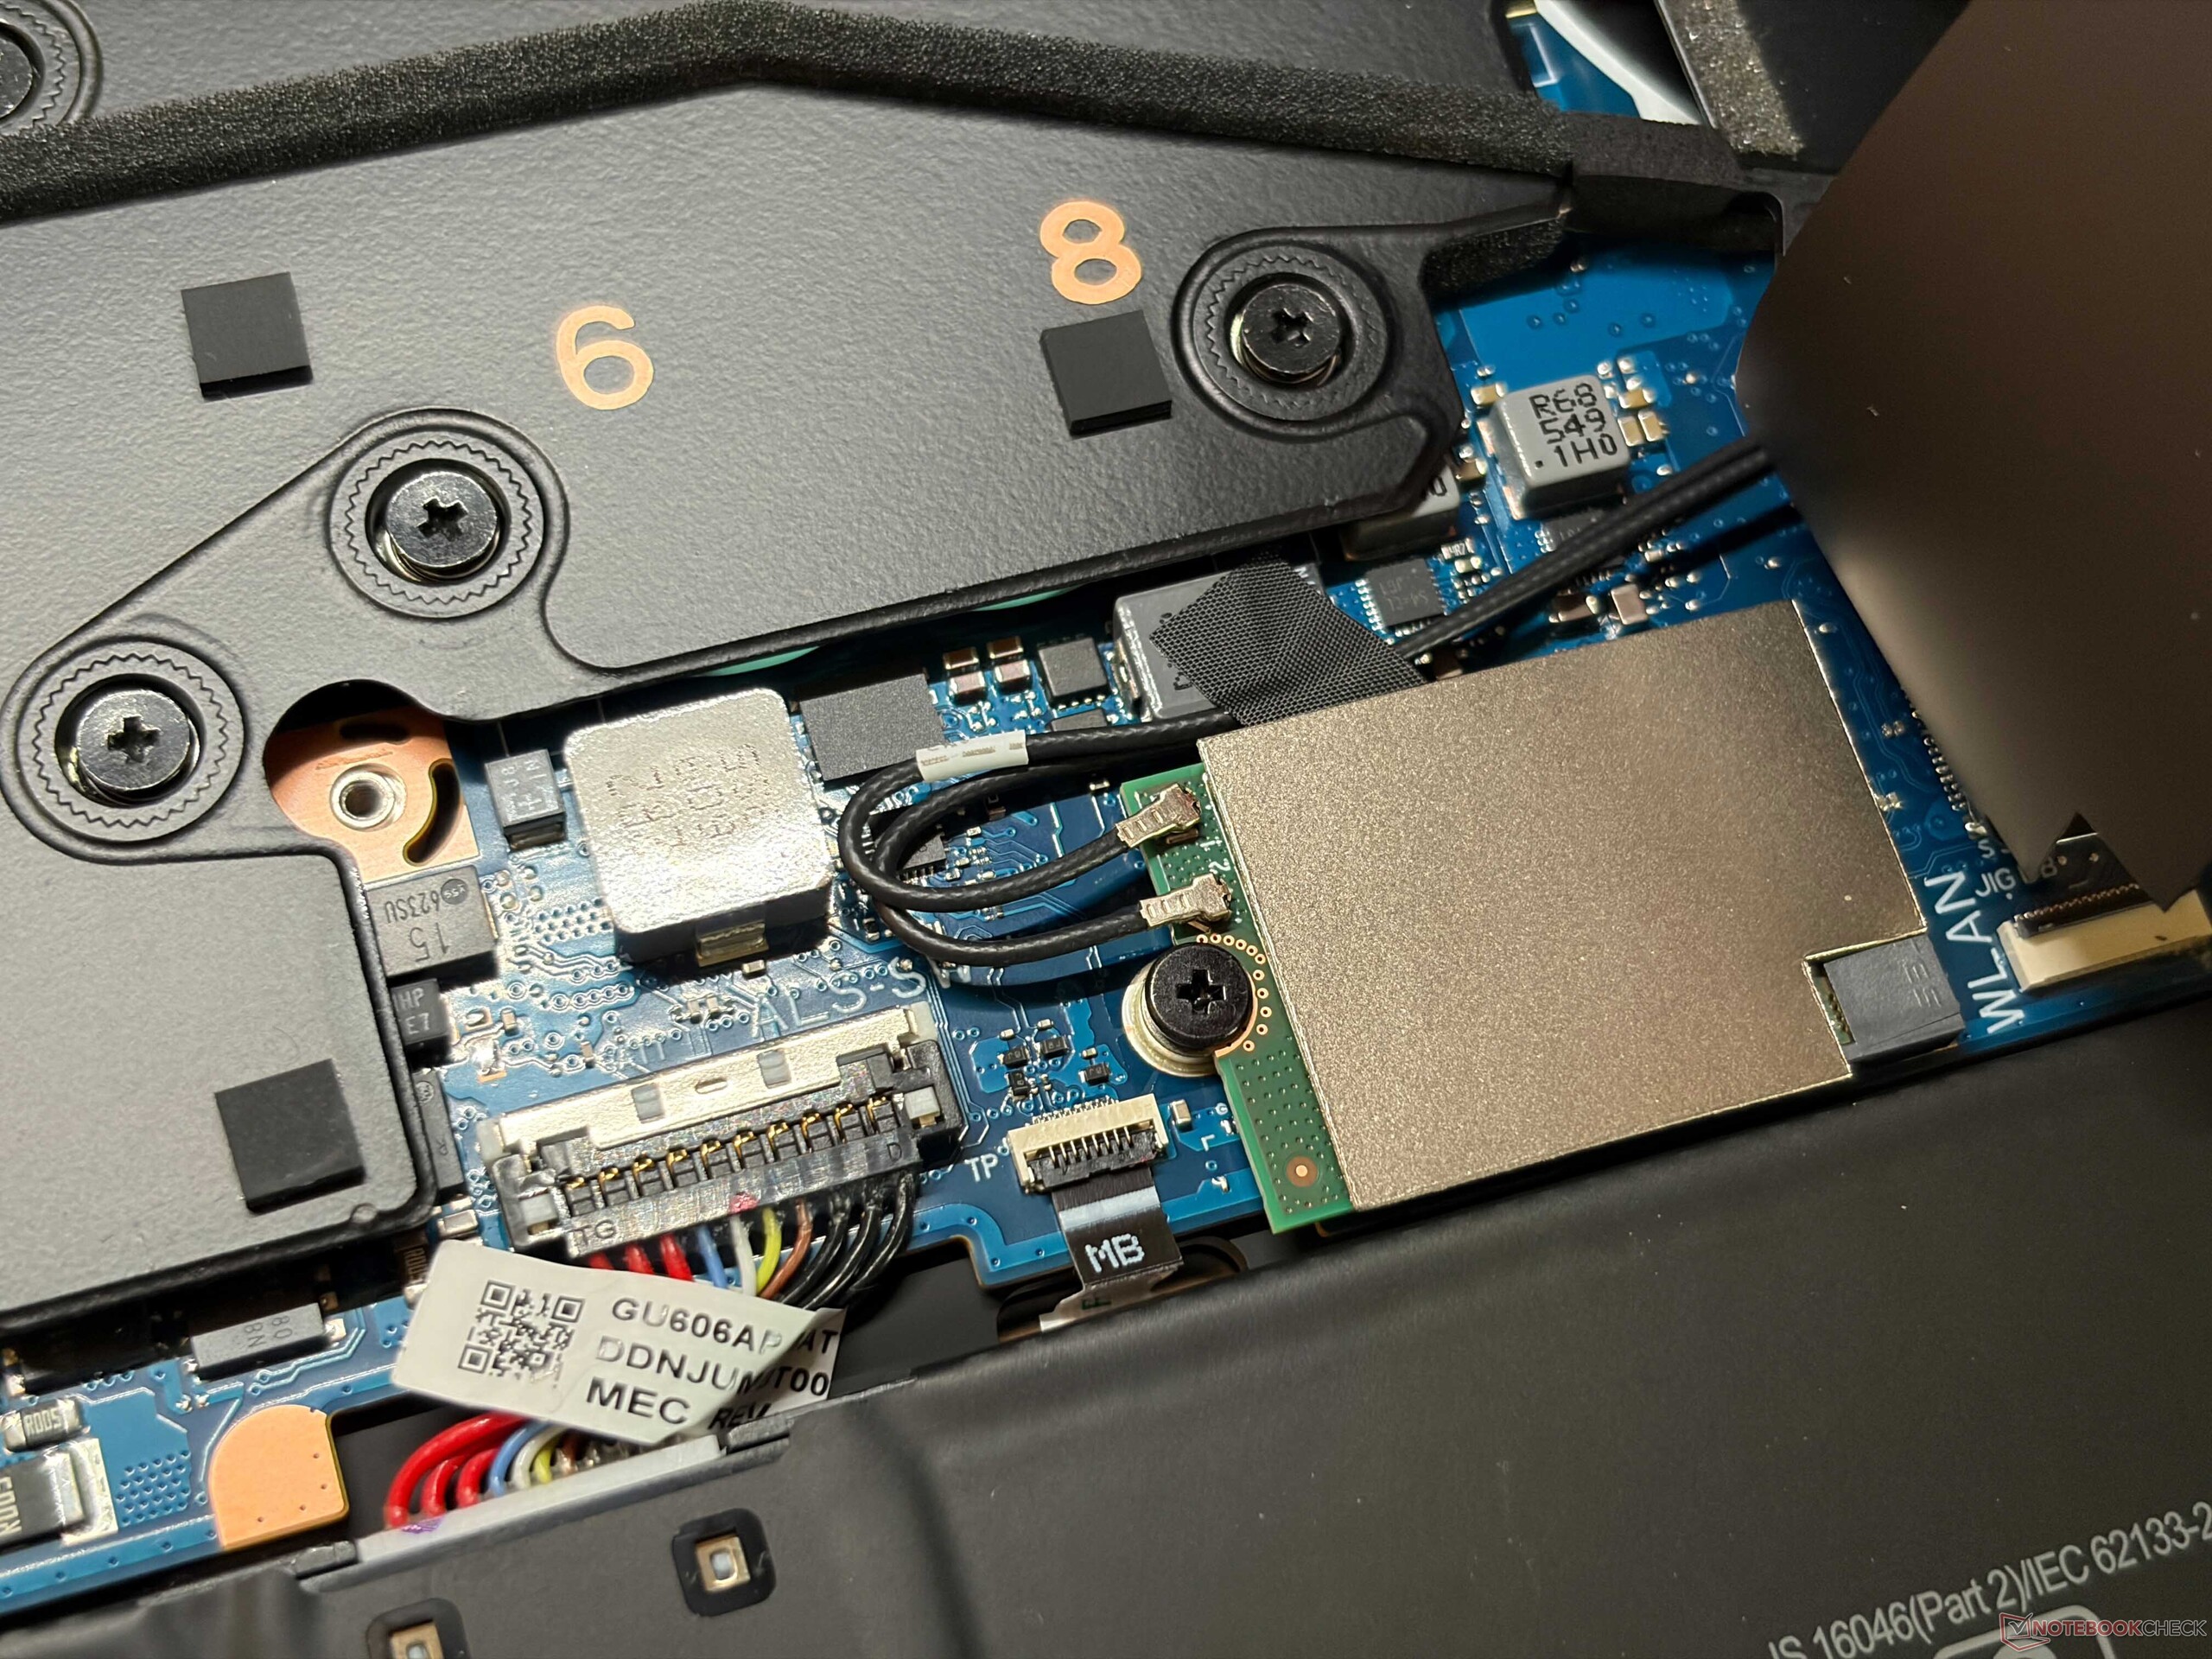
The chassis itself did not change and the Asus ROG Zephyrus G16 2026 is once again a high-end gaming/multimedia laptop with a very sturdy aluminum chassis. We cannot find any flaws and Asus also improved the hinge stability a bit, so there is only minor wobbling. You can choose between a black or a white chassis and even our black review unit does not suffer too much from fingerprints. Maintenance options are still limited to the M.2-2280 SSD, the Wi-Fi module and the cleaning of the fans, but the RAM is once again soldered. The RGB backlit keyboard still offers 1.7 mm travel and is once again one of the most comfortable keyboards you can get in a laptop. The large clickpad works very well and mechanical clicks are very quiet. You get a Wi-Fi 7 module (even though transfer rates are limited to ~2.5 Gbps, despite 320 MHz) and the 1080p webcam takes decent images. The SD-card reader (UHS-II) manages fast transfer rates of up to 218 MB/s, but does not support the SD-Express standard.



| SD Card Reader | |
| average JPG Copy Test (av. of 3 runs) | |
| Alienware 16 Area-51 Core Ultra 9 290HX Plus (Toshiba Exceria Pro SDXC 64 GB UHS-II) | |
| Aorus Master 16 AM6J | |
| Asus ROG Zephyrus G16 GU606AW (Angelbird AV Pro V60) | |
| Razer Blade 16 Core Ultra 9 386H (Toshiba Exceria Pro SDXC 64 GB UHS-II) | |
| Average of class Gaming (23.3 - 210, n=50, last 2 years) | |
| Asus ROG Zephyrus G16 GU605CW (AV Pro SD microSD 128 GB V60) | |
| maximum AS SSD Seq Read Test (1GB) | |
| Razer Blade 16 Core Ultra 9 386H (Toshiba Exceria Pro SDXC 64 GB UHS-II) | |
| Alienware 16 Area-51 Core Ultra 9 290HX Plus (Toshiba Exceria Pro SDXC 64 GB UHS-II) | |
| Asus ROG Zephyrus G16 GU606AW (Angelbird AV Pro V60) | |
| Aorus Master 16 AM6J | |
| Average of class Gaming (25.5 - 261, n=47, last 2 years) | |
| Asus ROG Zephyrus G16 GU605CW (AV Pro SD microSD 128 GB V60) | |
| Networking | |
| Asus ROG Zephyrus G16 GU606AW | |
| iperf3 transmit Wi-Fi6/7 RT-BE96U | |
| iperf3 receive Wi-Fi6/7 RT-BE96U | |
| Razer Blade 16 Core Ultra 9 386H | |
| iperf3 receive AXE11000 6GHz | |
| iperf3 transmit AXE11000 6GHz | |
| iperf3 receive AXE11000 | |
| iperf3 transmit AXE11000 | |
| Asus ROG Zephyrus G16 GU605CW | |
| iperf3 receive AXE11000 6GHz | |
| iperf3 transmit AXE11000 6GHz | |
| iperf3 receive AXE11000 | |
| iperf3 transmit AXE11000 | |
| Aorus Master 16 AM6J | |
| iperf3 transmit Wi-Fi6/7 RT-BE96U | |
| iperf3 receive Wi-Fi6/7 RT-BE96U | |
| Alienware 16 Area-51 Core Ultra 9 290HX Plus | |
| iperf3 receive AXE11000 6GHz | |
| iperf3 transmit AXE11000 6GHz | |
| iperf3 receive AXE11000 | |
| iperf3 transmit AXE11000 | |
| Lenovo Legion 5 Pro 16IAX10H | |
| iperf3 receive AXE11000 | |
| iperf3 transmit AXE11000 | |


Display - Brighter 240 Hz OLED
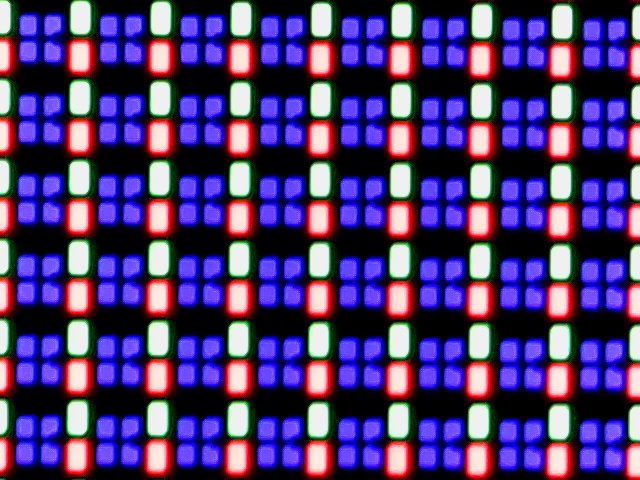
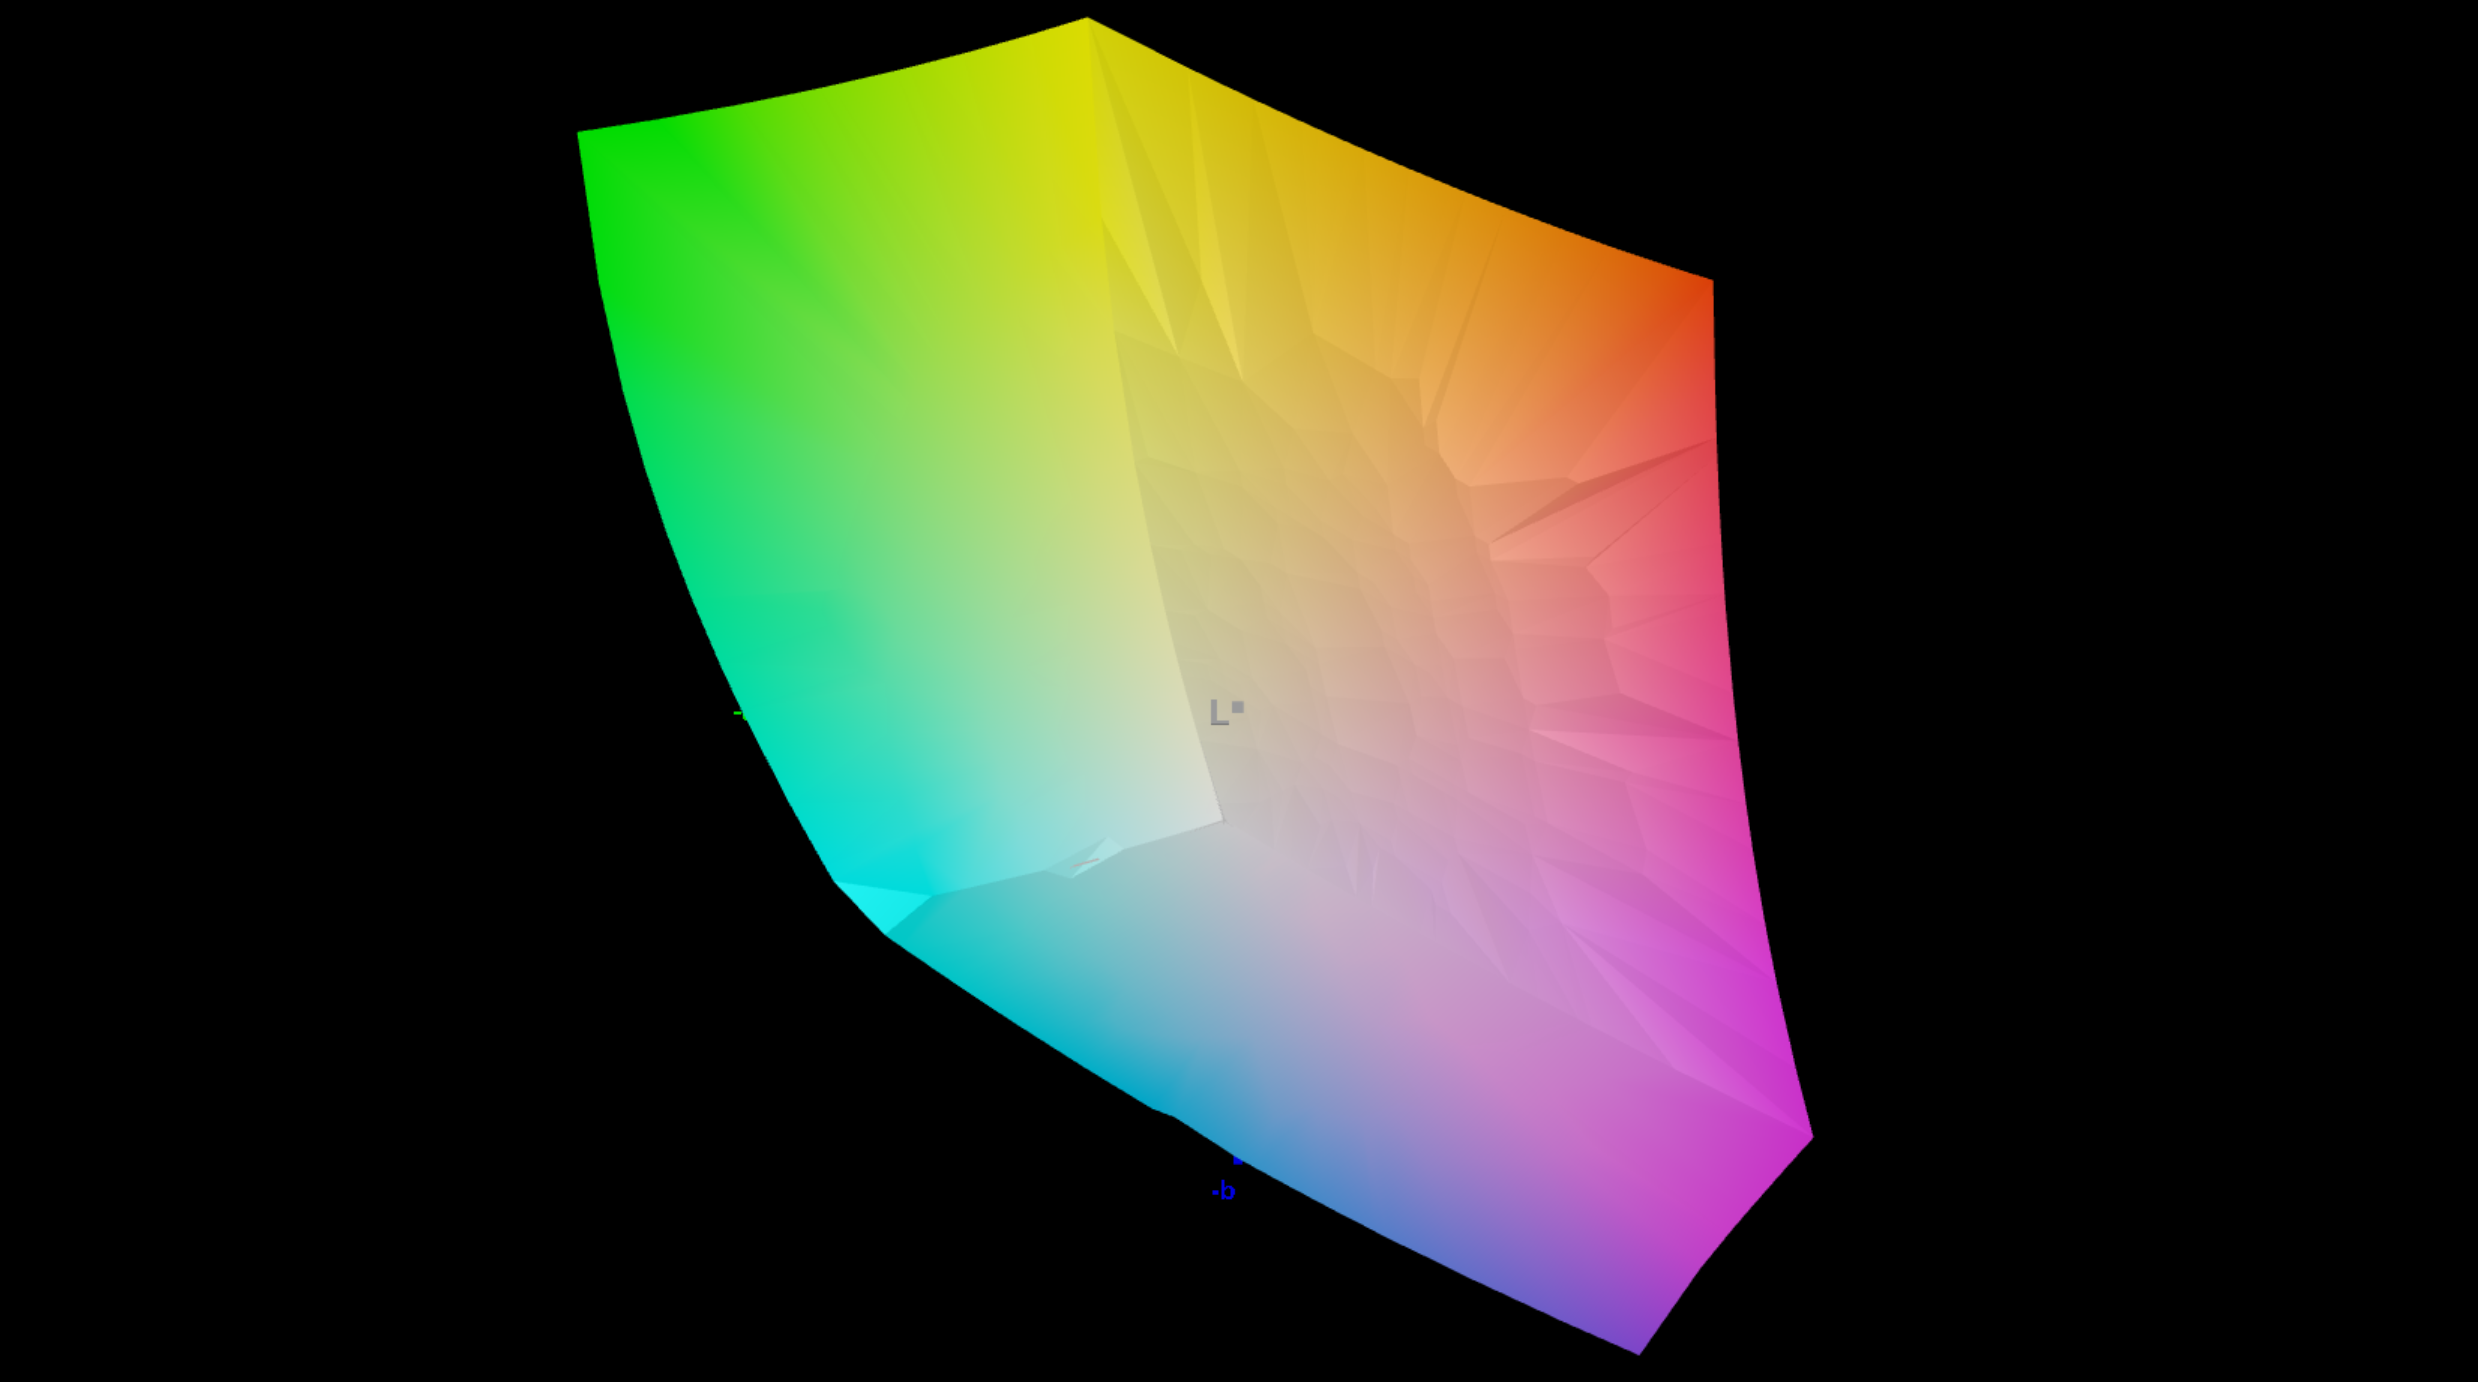
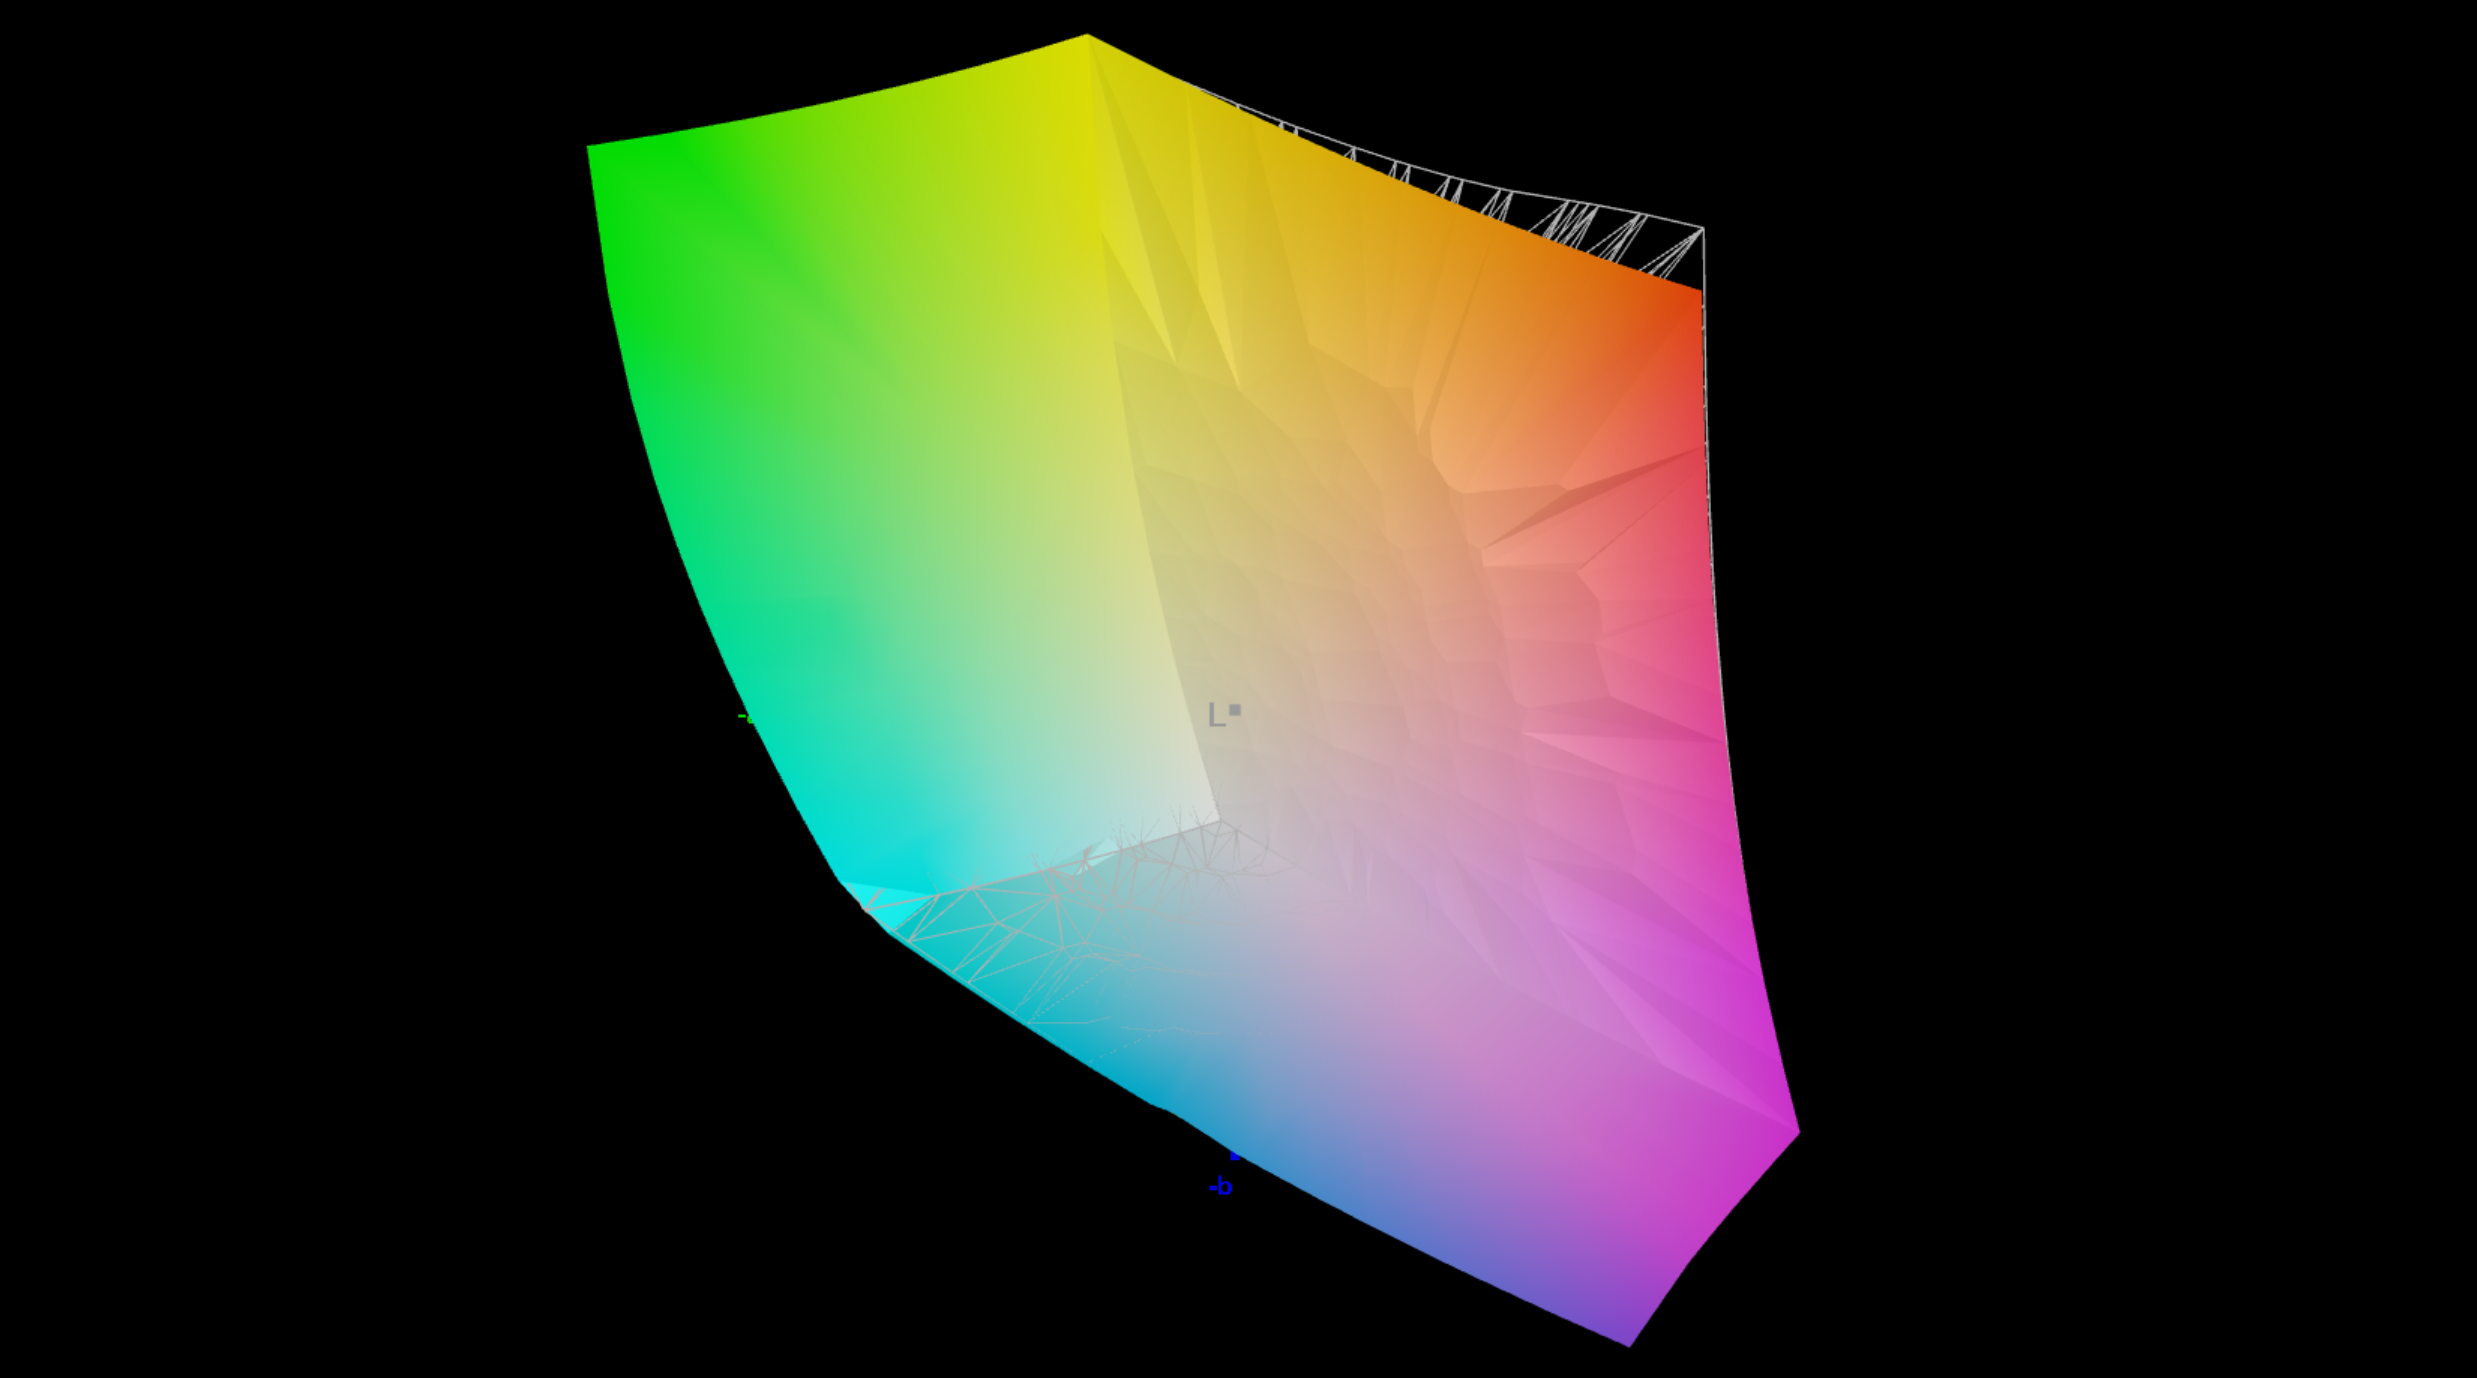
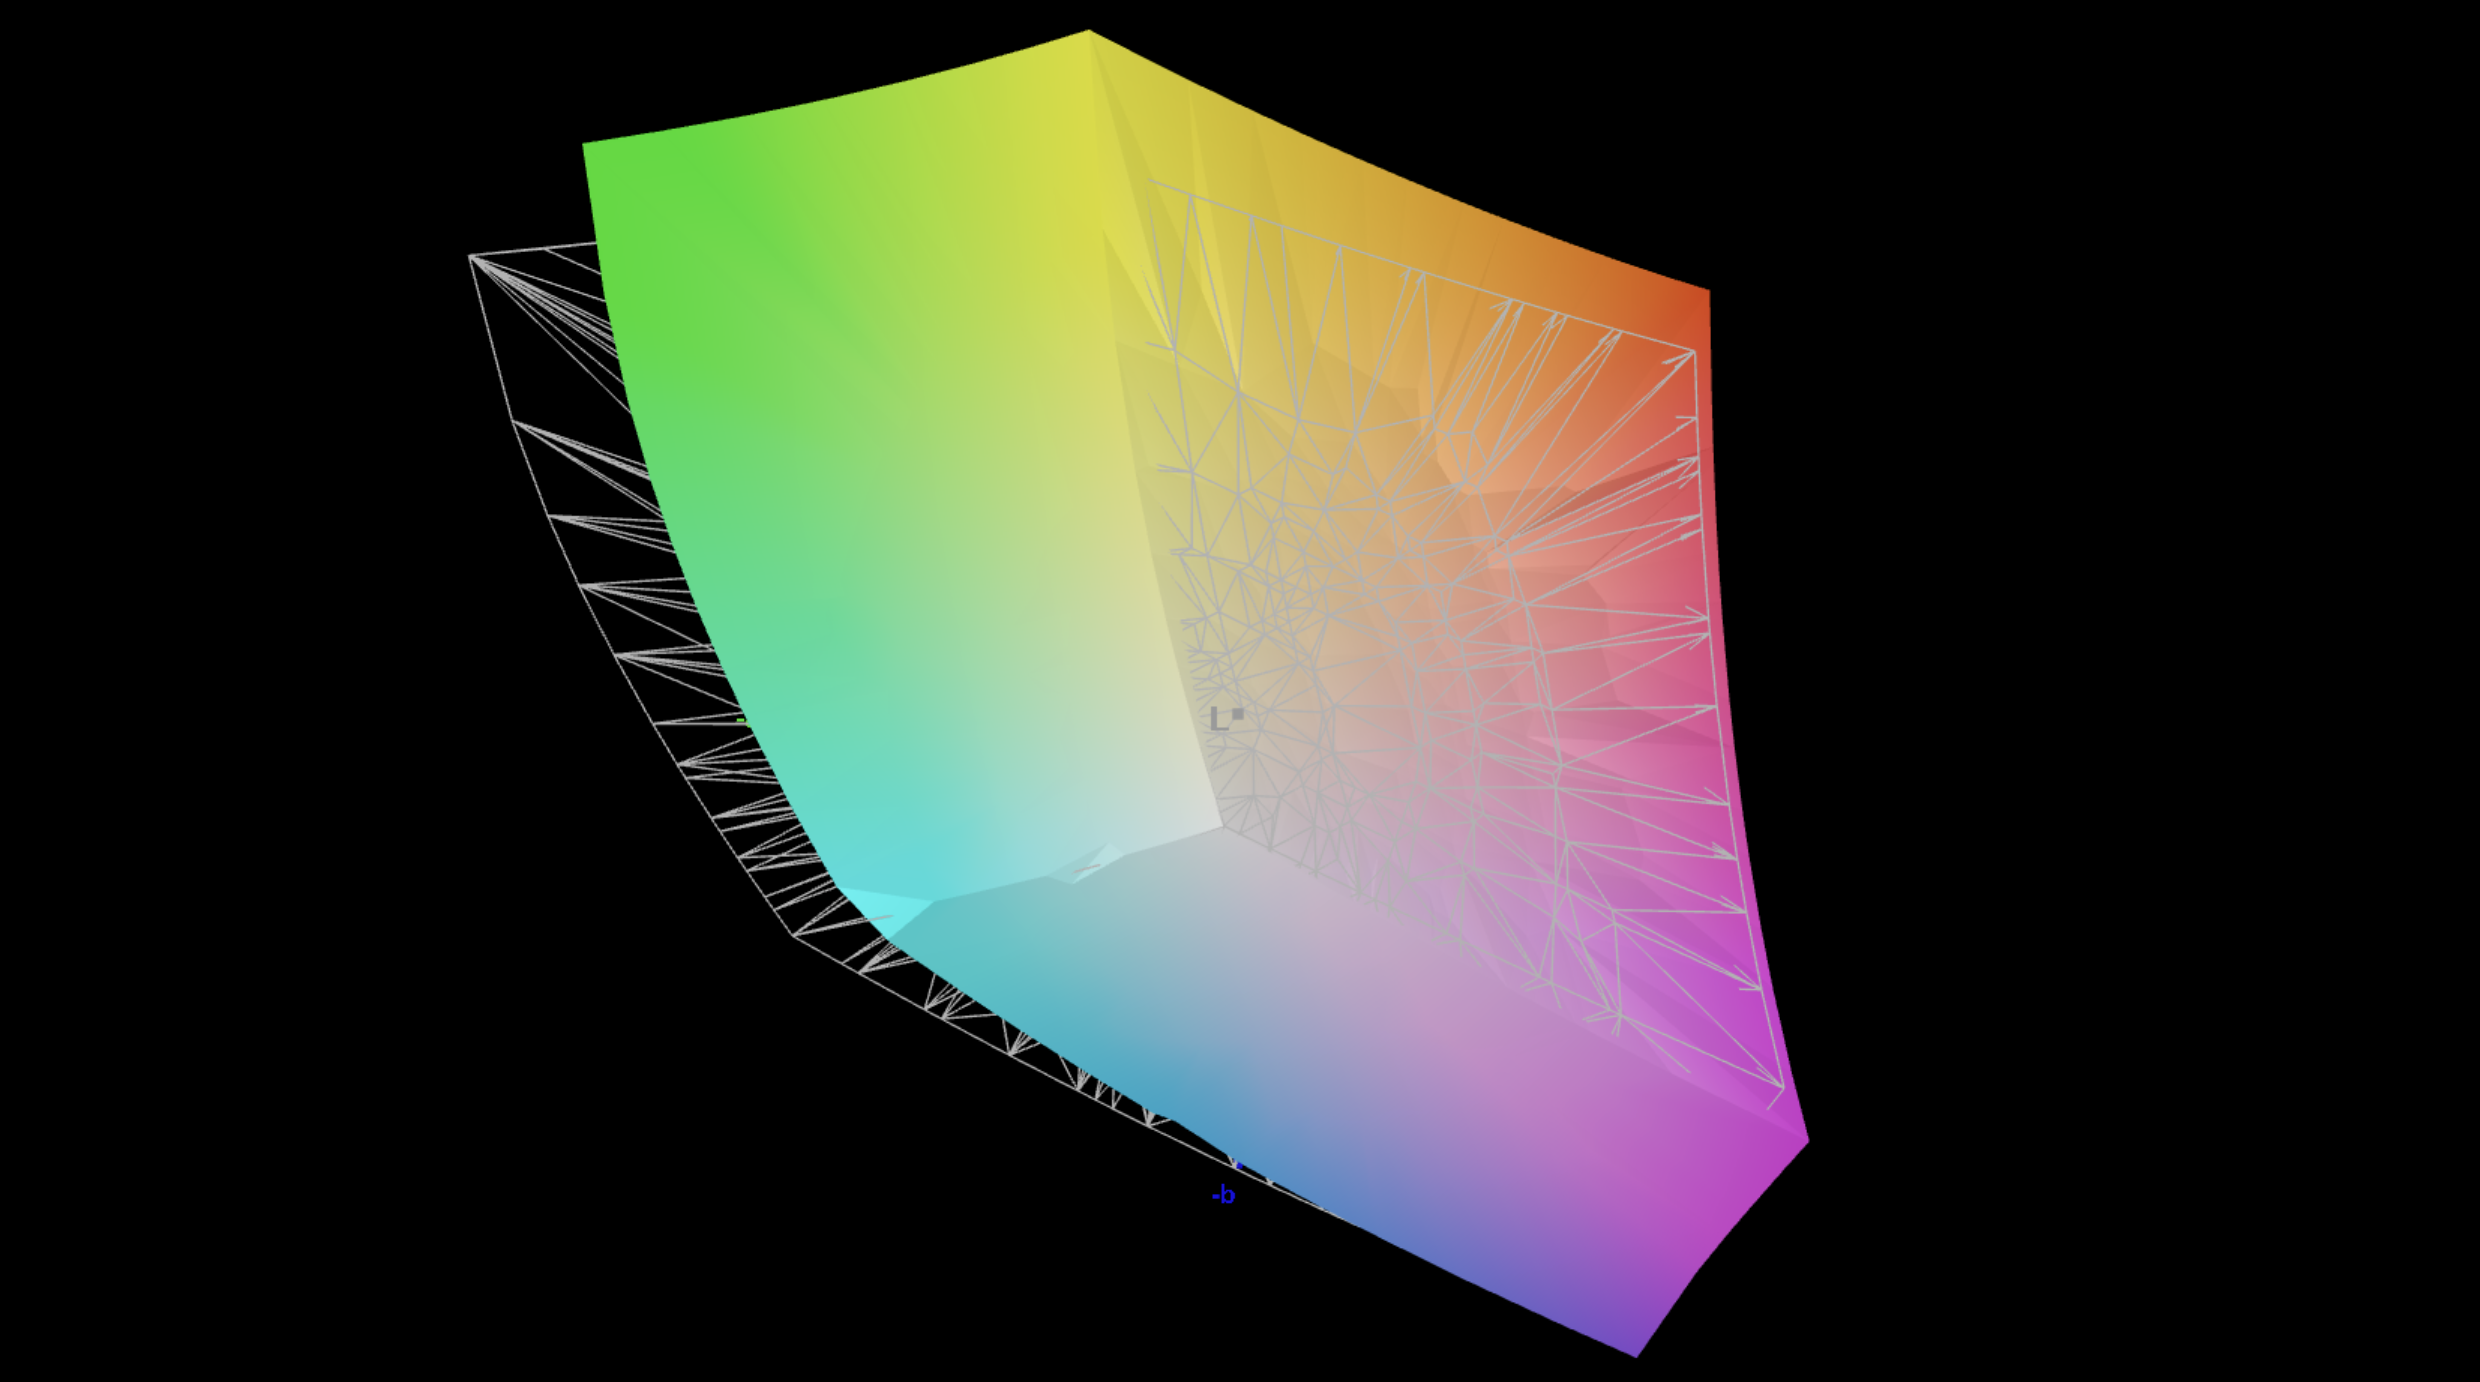
The previous Zephyrus G16 already used a very good 240 Hz OLED panel from Samsung, but the brightness was limited, especially in terms of HDR contents. Asus now fixed this issue and uses a brighter panel from Samsung. The specs are still comparable with the glossy 2.8K panel and 240 Hz, but the SDR brightness in now around 500 nits and we measured up to 1138 nits (~700 nits for a completely white image), so this is a major improvement for HDR gaming. Overall image quality is excellent and thanks to fast response times as well as the high refresh rate, this is a great panel for gaming. The frequency of the PWM flickering was also increased to 1.44 kHz and should not be an issue for most users. Asus once again offers very accurate color profiles for sRGB as well as the P3 color gamut as shown by our analysis with the professional and we could not improve the color accuracy with our own calibration even further.
| |||||||||||||||||||||||||
Brightness Distribution: 98 %
Center on Battery: 512 cd/m²
Contrast: 51200:1 (Black: 0.01 cd/m²)
ΔE ColorChecker Calman: 1.5 | ∀{0.5-29.43 Ø4.7}
ΔE Greyscale Calman: 2.3 | ∀{0.09-98 Ø4.95}
84.8% AdobeRGB 1998 (Argyll 3D)
97.5% sRGB (Argyll 3D)
91.7% Display P3 (Argyll 3D)
Gamma: 2.16
CCT: 6589 K
| Asus ROG Zephyrus G16 GU606AW ATNA60HU06-0, OLED, 2560x1600, 16", 240 Hz | Razer Blade 16 Core Ultra 9 386H Samsung ATNA60HU06-0, OLED, 2560x1600, 16", 240 Hz | Asus ROG Zephyrus G16 GU605CW Samsung ATNA60DL01-0, OLED, 2560x1600, 16", 240 Hz | Aorus Master 16 AM6J Samsung ATNA60HU02-0, OLED, 2560x1600, 16", 240 Hz | Alienware 16 Area-51 Core Ultra 9 290HX Plus Samsung 160HU05, OLED, 2560x1600, 16", 240 Hz | Lenovo Legion 5 Pro 16IAX10H ATNA60HS01-0 (Samsung SDC420A), OLED, 2560x1600, 16", 165 Hz | |
|---|---|---|---|---|---|---|
| Display | 7% | -7% | 4% | 8% | 8% | |
| APL18 Peak Brightness (cd/m²) | 609 | |||||
| HDR Peak Brightness (cd/m²) | 1138 | 609 -46% | ||||
| Display P3 Coverage (%) | 91.7 | 99.7 9% | 96.5 5% | 95.9 5% | 99.6 9% | 99.9 9% |
| sRGB Coverage (%) | 97.5 | 100 3% | 99.2 2% | 100 3% | 100 3% | 100 3% |
| AdobeRGB 1998 Coverage (%) | 84.8 | 93.5 10% | 94.5 11% | 88.2 4% | 95.6 13% | 94.1 11% |
| Response Times | 9% | -834% | 30% | 8% | -204% | |
| Response Time Grey 50% / Grey 80% * (ms) | 0.81 ? | 0.28 ? 65% | 0.32 ? 60% | 0.371 ? 54% | 0.29 ? 64% | 2 ? -147% |
| Response Time Black / White * (ms) | 0.22 ? | 0.4 ? -82% | 6 ? -2627% | 0.206 ? 6% | 0.41 ? -86% | 1.4 ? -536% |
| PWM Frequency (Hz) | 1440 ? | 1441 | 960 | 1158 ? | 1440 ? | 1300 |
| PWM Amplitude * (%) | 56 | 32 43% | 20 64% | 40 29% | 30 46% | 16.7 70% |
| Screen | -20% | -14% | -77% | 15% | -25% | |
| Brightness middle (cd/m²) | 512 | 462.2 -10% | 394 -23% | 468 -9% | 383.3 -25% | 518 1% |
| Brightness (cd/m²) | 515 | 465 -10% | 398 -23% | 467 -9% | 387 -25% | 522 1% |
| Brightness Distribution (%) | 98 | 97 -1% | 98 0% | 96 -2% | 97 -1% | 97 -1% |
| Black Level * (cd/m²) | 0.01 | 0.0084 16% | 0.03 -200% | |||
| Contrast (:1) | 51200 | 46905 -8% | 15600 -70% | |||
| Colorchecker dE 2000 * | 1.5 | 3.03 -102% | 2.41 -61% | 4 -167% | 0.87 42% | 2.49 -66% |
| Colorchecker dE 2000 max. * | 3.4 | 5.84 -72% | 3.82 -12% | 6.59 -94% | 2.23 34% | 5.25 -54% |
| Greyscale dE 2000 * | 2.3 | 0.6 74% | 2.4 -4% | 3.8 -65% | 0.8 65% | 3.02 -31% |
| Gamma | 2.16 102% | 2.2 100% | 2.16 102% | 2.597 85% | 2.19 100% | 2.37 93% |
| CCT | 6589 99% | 6452 101% | 6544 99% | 6626 98% | 6395 102% | 6426 101% |
| Colorchecker dE 2000 calibrated * | 0.6 | 1.41 | 0.61 | 2.15 | ||
| Total Average (Program / Settings) | -1% /
-6% | -285% /
-176% | -14% /
-37% | 10% /
12% | -74% /
-62% |
* ... smaller is better


Display Response Times
| ↔ Response Time Black to White | ||
|---|---|---|
| 0.22 ms ... rise ↗ and fall ↘ combined | ↗ 0.12 ms rise | 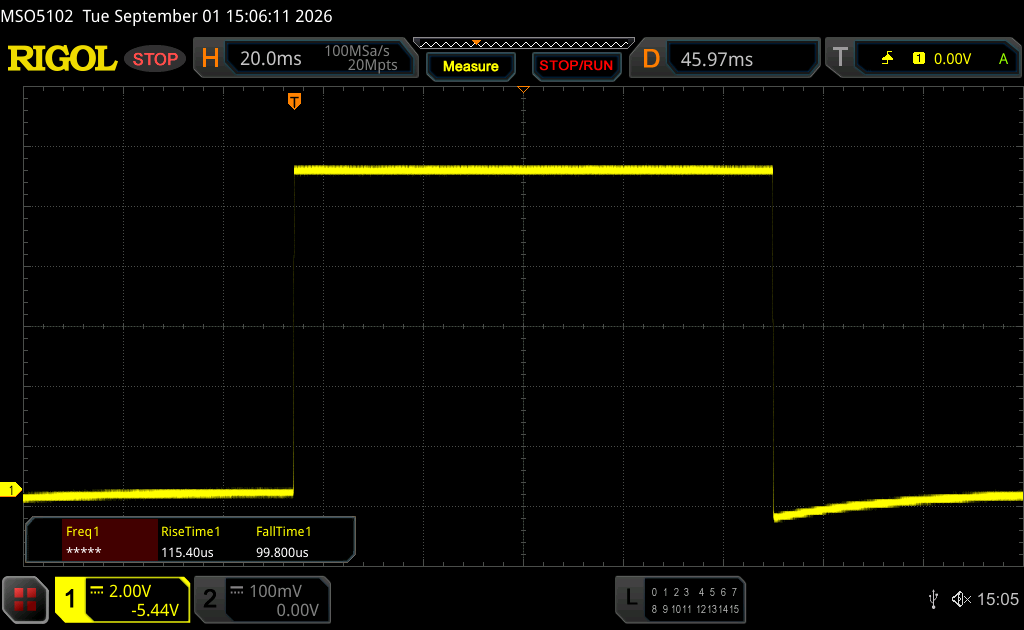 |
| ↘ 0.1 ms fall | ||
| The screen shows very fast response rates in our tests and should be very well suited for fast-paced gaming. In comparison, all tested devices range from 0.1 (minimum) to 240 (maximum) ms. » 0 % of all devices are better. This means that the measured response time is better than the average of all tested devices (19.7 ms). | ||
| ↔ Response Time 50% Grey to 80% Grey | ||
| 0.81 ms ... rise ↗ and fall ↘ combined | ↗ 0.7 ms rise | 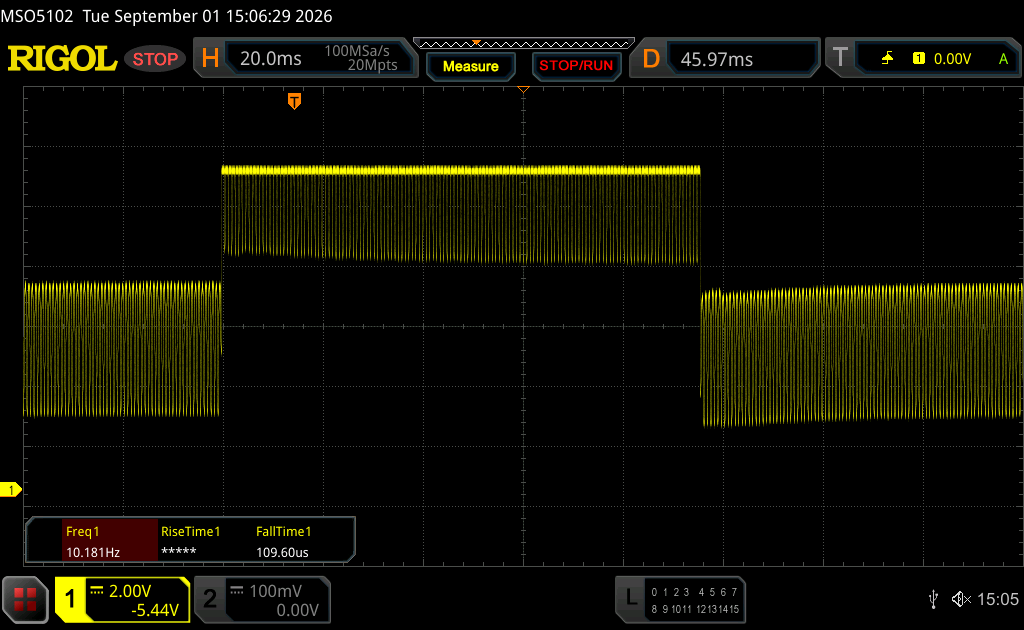 |
| ↘ 0.11 ms fall | ||
| The screen shows very fast response rates in our tests and should be very well suited for fast-paced gaming. In comparison, all tested devices range from 0.13 (minimum) to 636 (maximum) ms. » 3 % of all devices are better. This means that the measured response time is better than the average of all tested devices (30.8 ms). | ||
Screen Flickering / PWM (Pulse-Width Modulation)
| Screen flickering / PWM detected | 1440 Hz Amplitude: 56 % | ≤ 95 % brightness setting | 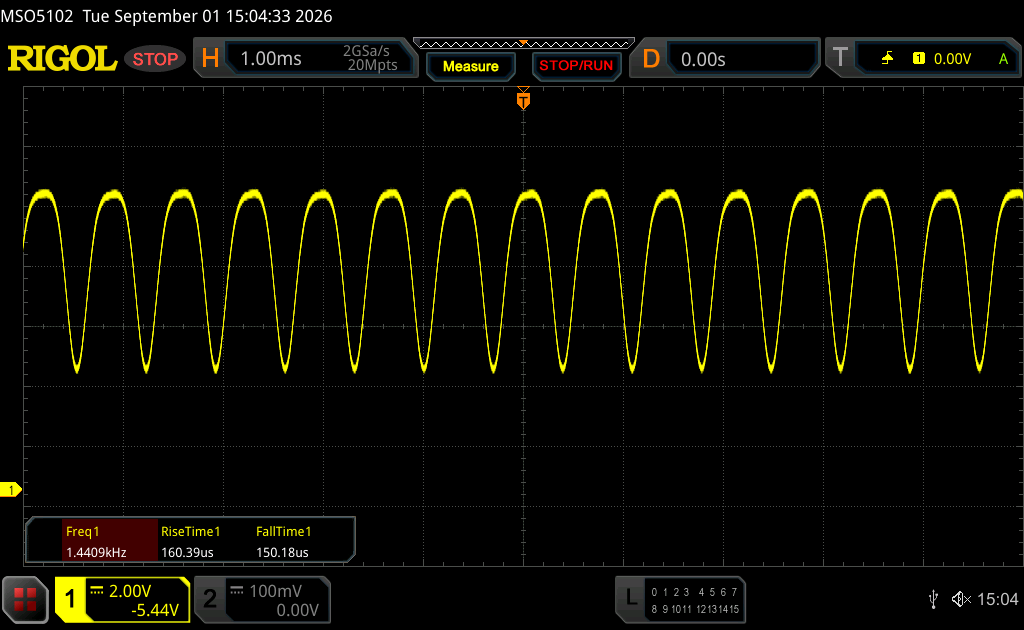 |
The display backlight flickers at 1440 Hz (worst case, e.g., utilizing PWM) Flickering detected at a brightness setting of 95 % and below. There should be no flickering or PWM above this brightness setting. The frequency of 1440 Hz is quite high, so most users sensitive to PWM should not notice any flickering. In comparison: 52 % of all tested devices do not use PWM to dim the display. If PWM was detected, an average of 7665 (minimum: 5 - maximum: 343500) Hz was measured. | |||


Performance - Panther Lake & 64 GB RAM
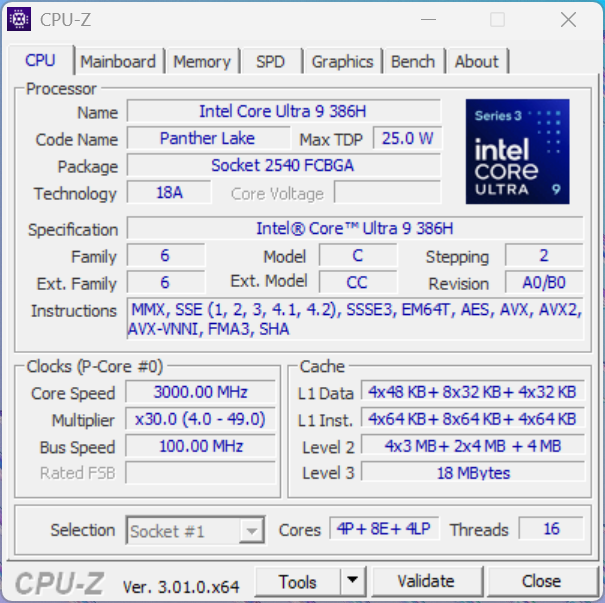
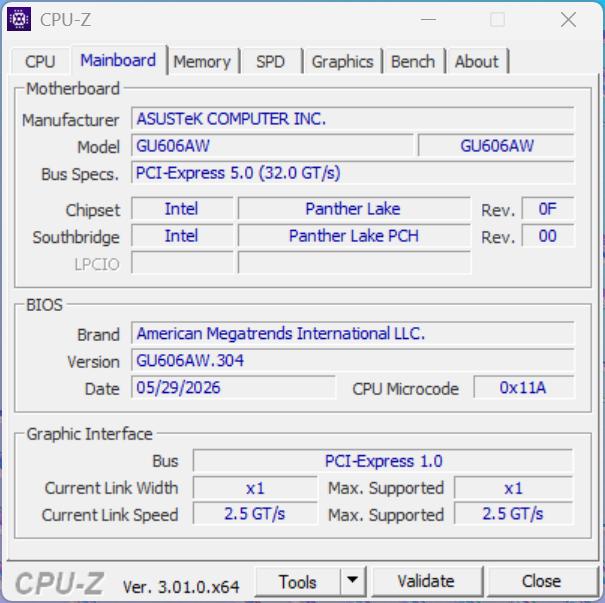
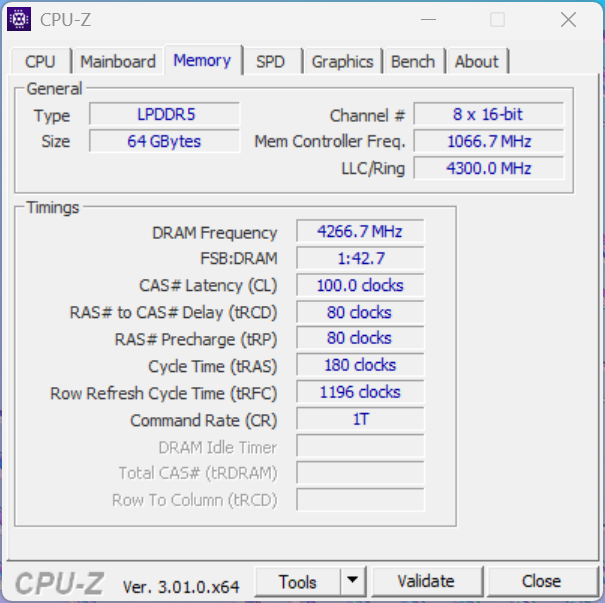
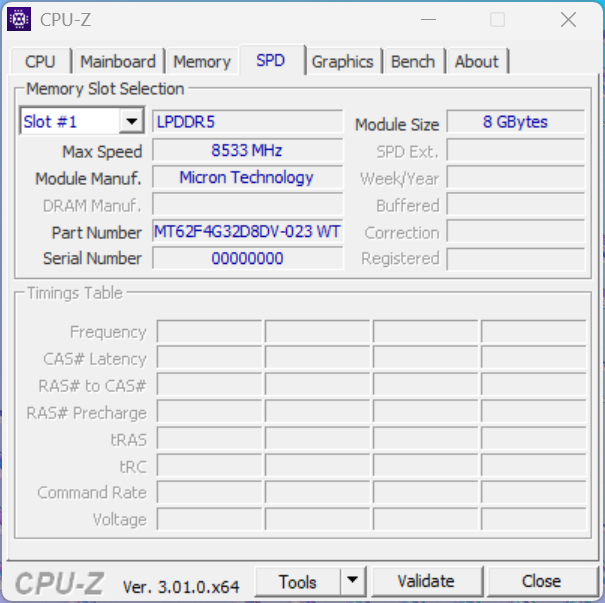
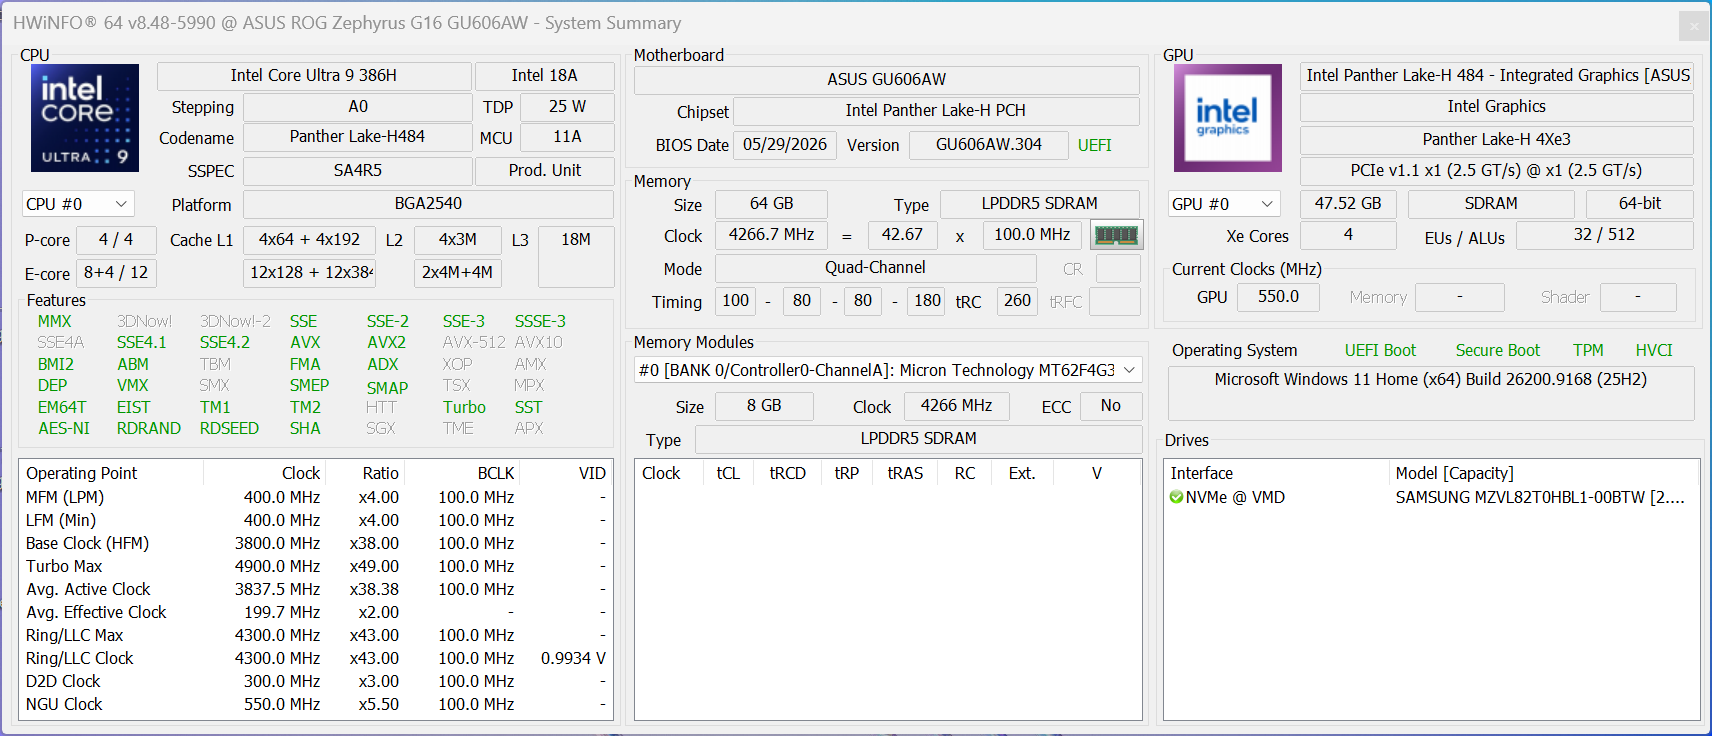
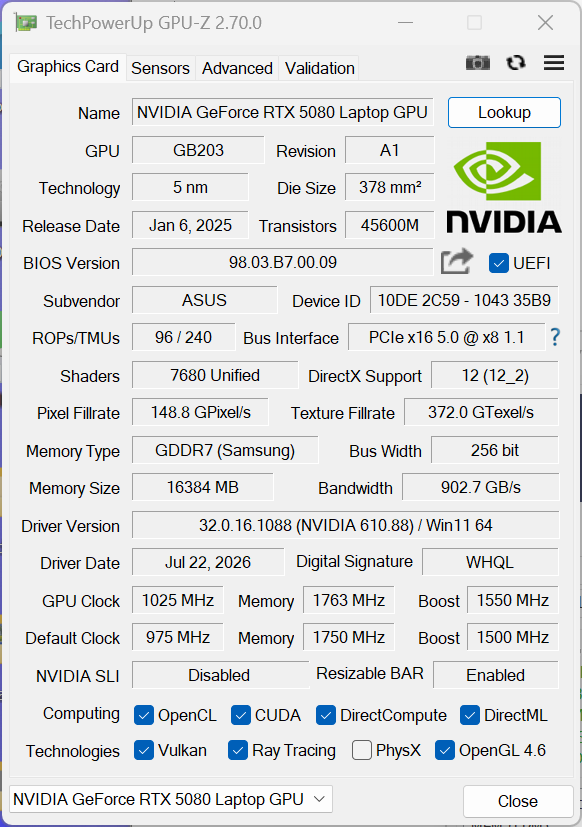
Testing Conditions
Asus offers the usual performance profiles and we used Turbo for our benchmarks and measurements. There is also a manual mode where the TGP of the RTX 5080 can be increased to 160 Watts (135 Watts + 25 Watts Dynamic Boost).
| Energy profile | TDP | Cinebench 2024 Multi | TGP | Time Spy Graphics | CP2077 QHD Ultra | max. fan noise |
|---|---|---|---|---|---|---|
| Whisper | 60/55 W | 1198 points | 80 W | 12302 points | 52.1 fps | 42.6 dB(A) |
| Performance | 70/60 W | 1231 points | 115 W | 17349 points | 77 fps | 50.1 dB(A) |
| Turbo | 70 W | 1271 points | 135 W | 18703 points | 83.4 fps | 54.8 dB(A) |
| Battery (Performance) | 65/60 W | 1235 points | 55 W | 9569 points | 46.2 fps | 42.6 dB(A) |
Processor Performance
The new Intel Core Ultra 9 386H (Panther Lake) is about 20 % faster than the old Core Ultra 9 285H across our CPU benchmarks and the overall performance is good and also very stable, but high-end gaming laptops with HX-CPUs still offer significantly more multi-core performance.
Cinebench R15 Multi Loop
Cinebench 2024: CPU Multi Core | CPU Single Core
Cinebench R23: Multi Core | Single Core
Cinebench R20: CPU (Multi Core) | CPU (Single Core)
Cinebench R15: CPU Multi 64Bit | CPU Single 64Bit
Blender: v2.79 BMW27 CPU
7-Zip 18.03: 7z b 4 | 7z b 4 -mmt1
Geekbench 6.7: Multi-Core | Single-Core
HWBOT x265 Benchmark v2.2: 4k Preset
LibreOffice : 20 Documents To PDF
R Benchmark 2.5: Overall mean
| CPU Performance rating | |
| Alienware 16 Area-51 Core Ultra 9 290HX Plus | |
| Aorus Master 16 AM6J | |
| Lenovo Legion 5 Pro 16IAX10H -2! | |
| Average of class Gaming | |
| Asus ROG Zephyrus G16 GU606AW | |
| Razer Blade 16 Core Ultra 9 386H | |
| Average Intel Core Ultra 9 386H | |
| Asus ROG Zephyrus G16 GU605CW -2! | |
| Cinebench 2024 / CPU Multi Core | |
| Alienware 16 Area-51 Core Ultra 9 290HX Plus | |
| Aorus Master 16 AM6J | |
| Average of class Gaming (486 - 2327, n=87, last 2 years) | |
| Asus ROG Zephyrus G16 GU606AW | |
| Razer Blade 16 Core Ultra 9 386H | |
| Average Intel Core Ultra 9 386H (873 - 1271, n=9) | |
| Cinebench 2024 / CPU Single Core | |
| Alienware 16 Area-51 Core Ultra 9 290HX Plus | |
| Aorus Master 16 AM6J | |
| Razer Blade 16 Core Ultra 9 386H | |
| Average of class Gaming (95 - 141, n=87, last 2 years) | |
| Average Intel Core Ultra 9 386H (118.1 - 126.8, n=9) | |
| Asus ROG Zephyrus G16 GU606AW | |
| Cinebench R23 / Multi Core | |
| Alienware 16 Area-51 Core Ultra 9 290HX Plus | |
| Lenovo Legion 5 Pro 16IAX10H | |
| Aorus Master 16 AM6J | |
| Average of class Gaming (10488 - 42661, n=102, last 2 years) | |
| Asus ROG Zephyrus G16 GU606AW | |
| Razer Blade 16 Core Ultra 9 386H | |
| Average Intel Core Ultra 9 386H (12144 - 21834, n=9) | |
| Asus ROG Zephyrus G16 GU605CW | |
| Cinebench R23 / Single Core | |
| Alienware 16 Area-51 Core Ultra 9 290HX Plus | |
| Lenovo Legion 5 Pro 16IAX10H | |
| Aorus Master 16 AM6J | |
| Asus ROG Zephyrus G16 GU606AW | |
| Razer Blade 16 Core Ultra 9 386H | |
| Average Intel Core Ultra 9 386H (2010 - 2123, n=9) | |
| Average of class Gaming (1601 - 2415, n=102, last 2 years) | |
| Asus ROG Zephyrus G16 GU605CW | |
| Cinebench R20 / CPU (Multi Core) | |
| Alienware 16 Area-51 Core Ultra 9 290HX Plus | |
| Aorus Master 16 AM6J | |
| Lenovo Legion 5 Pro 16IAX10H | |
| Average of class Gaming (4029 - 16433, n=101, last 2 years) | |
| Asus ROG Zephyrus G16 GU606AW | |
| Razer Blade 16 Core Ultra 9 386H | |
| Average Intel Core Ultra 9 386H (4757 - 8444, n=9) | |
| Asus ROG Zephyrus G16 GU605CW | |
| Cinebench R20 / CPU (Single Core) | |
| Alienware 16 Area-51 Core Ultra 9 290HX Plus | |
| Lenovo Legion 5 Pro 16IAX10H | |
| Asus ROG Zephyrus G16 GU606AW | |
| Razer Blade 16 Core Ultra 9 386H | |
| Aorus Master 16 AM6J | |
| Average Intel Core Ultra 9 386H (762 - 805, n=9) | |
| Average of class Gaming (622 - 913, n=101, last 2 years) | |
| Asus ROG Zephyrus G16 GU605CW | |
| Cinebench R15 / CPU Multi 64Bit | |
| Aorus Master 16 AM6J | |
| Alienware 16 Area-51 Core Ultra 9 290HX Plus | |
| Lenovo Legion 5 Pro 16IAX10H | |
| Average of class Gaming (1578 - 6330, n=100, last 2 years) | |
| Asus ROG Zephyrus G16 GU606AW | |
| Razer Blade 16 Core Ultra 9 386H | |
| Average Intel Core Ultra 9 386H (2197 - 3347, n=9) | |
| Asus ROG Zephyrus G16 GU605CW | |
| Cinebench R15 / CPU Single 64Bit | |
| Lenovo Legion 5 Pro 16IAX10H | |
| Aorus Master 16 AM6J | |
| Alienware 16 Area-51 Core Ultra 9 290HX Plus | |
| Asus ROG Zephyrus G16 GU606AW | |
| Razer Blade 16 Core Ultra 9 386H | |
| Average of class Gaming (188.8 - 350, n=101, last 2 years) | |
| Average Intel Core Ultra 9 386H (249 - 318, n=9) | |
| Asus ROG Zephyrus G16 GU605CW | |
| Blender / v2.79 BMW27 CPU | |
| Asus ROG Zephyrus G16 GU605CW | |
| Average Intel Core Ultra 9 386H (156 - 299, n=9) | |
| Razer Blade 16 Core Ultra 9 386H | |
| Asus ROG Zephyrus G16 GU606AW | |
| Average of class Gaming (79 - 330, n=99, last 2 years) | |
| Lenovo Legion 5 Pro 16IAX10H | |
| Alienware 16 Area-51 Core Ultra 9 290HX Plus | |
| Aorus Master 16 AM6J | |
| 7-Zip 18.03 / 7z b 4 | |
| Aorus Master 16 AM6J | |
| Alienware 16 Area-51 Core Ultra 9 290HX Plus | |
| Lenovo Legion 5 Pro 16IAX10H | |
| Average of class Gaming (33491 - 148086, n=99, last 2 years) | |
| Razer Blade 16 Core Ultra 9 386H | |
| Asus ROG Zephyrus G16 GU606AW | |
| Average Intel Core Ultra 9 386H (44980 - 72882, n=9) | |
| Asus ROG Zephyrus G16 GU605CW | |
| 7-Zip 18.03 / 7z b 4 -mmt1 | |
| Aorus Master 16 AM6J | |
| Lenovo Legion 5 Pro 16IAX10H | |
| Alienware 16 Area-51 Core Ultra 9 290HX Plus | |
| Average of class Gaming (4824 - 7436, n=100, last 2 years) | |
| Razer Blade 16 Core Ultra 9 386H | |
| Average Intel Core Ultra 9 386H (5488 - 6493, n=9) | |
| Asus ROG Zephyrus G16 GU606AW | |
| Asus ROG Zephyrus G16 GU605CW | |
| Geekbench 6.7 / Multi-Core | |
| Alienware 16 Area-51 Core Ultra 9 290HX Plus | |
| Aorus Master 16 AM6J | |
| Lenovo Legion 5 Pro 16IAX10H | |
| Asus ROG Zephyrus G16 GU606AW | |
| Razer Blade 16 Core Ultra 9 386H | |
| Average of class Gaming (6625 - 22850, n=101, last 2 years) | |
| Average Intel Core Ultra 9 386H (13776 - 17405, n=11) | |
| Asus ROG Zephyrus G16 GU605CW | |
| Geekbench 6.7 / Single-Core | |
| Aorus Master 16 AM6J | |
| Alienware 16 Area-51 Core Ultra 9 290HX Plus | |
| Lenovo Legion 5 Pro 16IAX10H | |
| Asus ROG Zephyrus G16 GU606AW | |
| Razer Blade 16 Core Ultra 9 386H | |
| Average of class Gaming (1982 - 3259, n=101, last 2 years) | |
| Average Intel Core Ultra 9 386H (2778 - 2947, n=11) | |
| Asus ROG Zephyrus G16 GU605CW | |
| HWBOT x265 Benchmark v2.2 / 4k Preset | |
| Aorus Master 16 AM6J | |
| Alienware 16 Area-51 Core Ultra 9 290HX Plus | |
| Lenovo Legion 5 Pro 16IAX10H | |
| Average of class Gaming (11.5 - 44.4, n=100, last 2 years) | |
| Asus ROG Zephyrus G16 GU606AW | |
| Razer Blade 16 Core Ultra 9 386H | |
| Average Intel Core Ultra 9 386H (13.2 - 25.8, n=9) | |
| Asus ROG Zephyrus G16 GU605CW | |
| LibreOffice / 20 Documents To PDF | |
| Aorus Master 16 AM6J | |
| Average of class Gaming (33.2 - 88.8, n=101, last 2 years) | |
| Asus ROG Zephyrus G16 GU605CW | |
| Average Intel Core Ultra 9 386H (38.5 - 56.1, n=9) | |
| Asus ROG Zephyrus G16 GU606AW | |
| Alienware 16 Area-51 Core Ultra 9 290HX Plus | |
| Razer Blade 16 Core Ultra 9 386H | |
| Lenovo Legion 5 Pro 16IAX10H | |
| R Benchmark 2.5 / Overall mean | |
| Asus ROG Zephyrus G16 GU605CW | |
| Average Intel Core Ultra 9 386H (0.4055 - 0.4384, n=9) | |
| Average of class Gaming (0.3439 - 0.59, n=100, last 2 years) | |
| Razer Blade 16 Core Ultra 9 386H | |
| Lenovo Legion 5 Pro 16IAX10H | |
| Asus ROG Zephyrus G16 GU606AW | |
| Alienware 16 Area-51 Core Ultra 9 290HX Plus | |
| Aorus Master 16 AM6J | |
* ... smaller is better
AIDA64: FP32 Ray-Trace | FPU Julia | CPU SHA3 | CPU Queen | FPU SinJulia | FPU Mandel | CPU AES | CPU ZLib | FP64 Ray-Trace | CPU PhotoWorxx | CPU CheckMate
| Performance rating | |
| Aorus Master 16 AM6J -1! | |
| Lenovo Legion 5 Pro 16IAX10H -1! | |
| Alienware 16 Area-51 Core Ultra 9 290HX Plus -1! | |
| Average of class Gaming | |
| Asus ROG Zephyrus G16 GU606AW -1! | |
| Razer Blade 16 Core Ultra 9 386H -1! | |
| Average Intel Core Ultra 9 386H -1! | |
| Asus ROG Zephyrus G16 GU605CW -1! | |
| AIDA64 / FP32 Ray-Trace | |
| Aorus Master 16 AM6J (v8.20.8100) | |
| Alienware 16 Area-51 Core Ultra 9 290HX Plus (v8.20.8100) | |
| Lenovo Legion 5 Pro 16IAX10H (v6.92.6600) | |
| Average of class Gaming (10227 - 85542, n=100, last 2 years) | |
| Asus ROG Zephyrus G16 GU606AW (v8.20.8100) | |
| Razer Blade 16 Core Ultra 9 386H (v8.20.8100) | |
| Average Intel Core Ultra 9 386H (10001 - 21921, n=9) | |
| Asus ROG Zephyrus G16 GU605CW (v6.92.6600) | |
| AIDA64 / FPU Julia | |
| Aorus Master 16 AM6J (v8.20.8100) | |
| Alienware 16 Area-51 Core Ultra 9 290HX Plus (v8.20.8100) | |
| Lenovo Legion 5 Pro 16IAX10H (v6.92.6600) | |
| Average of class Gaming (51376 - 372155, n=100, last 2 years) | |
| Asus ROG Zephyrus G16 GU606AW (v8.20.8100) | |
| Razer Blade 16 Core Ultra 9 386H (v8.20.8100) | |
| Average Intel Core Ultra 9 386H (53370 - 113595, n=9) | |
| Asus ROG Zephyrus G16 GU605CW (v6.92.6600) | |
| AIDA64 / CPU SHA3 | |
| Aorus Master 16 AM6J (v8.20.8100) | |
| Alienware 16 Area-51 Core Ultra 9 290HX Plus (v8.20.8100) | |
| Lenovo Legion 5 Pro 16IAX10H (v6.92.6600) | |
| Average of class Gaming (2180 - 10115, n=100, last 2 years) | |
| Razer Blade 16 Core Ultra 9 386H (v8.20.8100) | |
| Asus ROG Zephyrus G16 GU606AW (v8.20.8100) | |
| Average Intel Core Ultra 9 386H (2776 - 5604, n=9) | |
| Asus ROG Zephyrus G16 GU605CW (v6.92.6600) | |
| AIDA64 / CPU Queen | |
| Lenovo Legion 5 Pro 16IAX10H (v6.92.6600) | |
| Average of class Gaming (49785 - 173351, n=80, last 2 years) | |
| Asus ROG Zephyrus G16 GU605CW (v6.92.6600) | |
| AIDA64 / FPU SinJulia | |
| Aorus Master 16 AM6J (v8.20.8100) | |
| Average of class Gaming (4424 - 33636, n=100, last 2 years) | |
| Lenovo Legion 5 Pro 16IAX10H (v6.92.6600) | |
| Alienware 16 Area-51 Core Ultra 9 290HX Plus (v8.20.8100) | |
| Asus ROG Zephyrus G16 GU606AW (v8.20.8100) | |
| Razer Blade 16 Core Ultra 9 386H (v8.20.8100) | |
| Asus ROG Zephyrus G16 GU605CW (v6.92.6600) | |
| Average Intel Core Ultra 9 386H (5314 - 7333, n=9) | |
| AIDA64 / FPU Mandel | |
| Aorus Master 16 AM6J (v8.20.8100) | |
| Alienware 16 Area-51 Core Ultra 9 290HX Plus (v8.20.8100) | |
| Lenovo Legion 5 Pro 16IAX10H (v6.92.6600) | |
| Average of class Gaming (25115 - 196829, n=100, last 2 years) | |
| Asus ROG Zephyrus G16 GU606AW (v8.20.8100) | |
| Razer Blade 16 Core Ultra 9 386H (v8.20.8100) | |
| Average Intel Core Ultra 9 386H (28414 - 61578, n=9) | |
| Asus ROG Zephyrus G16 GU605CW (v6.92.6600) | |
| AIDA64 / CPU AES | |
| Aorus Master 16 AM6J (v8.20.8100) | |
| Lenovo Legion 5 Pro 16IAX10H (v6.92.6600) | |
| Alienware 16 Area-51 Core Ultra 9 290HX Plus (v8.20.8100) | |
| Average of class Gaming (39258 - 247074, n=100, last 2 years) | |
| Asus ROG Zephyrus G16 GU606AW (v8.20.8100) | |
| Razer Blade 16 Core Ultra 9 386H (v8.20.8100) | |
| Average Intel Core Ultra 9 386H (46362 - 72112, n=9) | |
| Asus ROG Zephyrus G16 GU605CW (v6.92.6600) | |
| AIDA64 / CPU ZLib | |
| Aorus Master 16 AM6J (v8.20.8100) | |
| Alienware 16 Area-51 Core Ultra 9 290HX Plus (v8.20.8100) | |
| Lenovo Legion 5 Pro 16IAX10H (v6.92.6600) | |
| Average of class Gaming (574 - 2531, n=100, last 2 years) | |
| Razer Blade 16 Core Ultra 9 386H (v8.20.8100) | |
| Asus ROG Zephyrus G16 GU606AW (v8.20.8100) | |
| Average Intel Core Ultra 9 386H (669 - 1271, n=9) | |
| Asus ROG Zephyrus G16 GU605CW (v6.92.6600) | |
| AIDA64 / FP64 Ray-Trace | |
| Aorus Master 16 AM6J (v8.20.8100) | |
| Alienware 16 Area-51 Core Ultra 9 290HX Plus (v8.20.8100) | |
| Lenovo Legion 5 Pro 16IAX10H (v6.92.6600) | |
| Average of class Gaming (5509 - 45446, n=100, last 2 years) | |
| Asus ROG Zephyrus G16 GU606AW (v8.20.8100) | |
| Razer Blade 16 Core Ultra 9 386H (v8.20.8100) | |
| Average Intel Core Ultra 9 386H (5138 - 11672, n=9) | |
| Asus ROG Zephyrus G16 GU605CW (v6.92.6600) | |
| AIDA64 / CPU PhotoWorxx | |
| Razer Blade 16 Core Ultra 9 386H (v8.20.8100) | |
| Asus ROG Zephyrus G16 GU606AW (v8.20.8100) | |
| Average Intel Core Ultra 9 386H (54042 - 89891, n=9) | |
| Asus ROG Zephyrus G16 GU605CW (v6.92.6600) | |
| Alienware 16 Area-51 Core Ultra 9 290HX Plus (v8.20.8100) | |
| Lenovo Legion 5 Pro 16IAX10H (v6.92.6600) | |
| Average of class Gaming (12271 - 89891, n=100, last 2 years) | |
| Aorus Master 16 AM6J (v8.20.8100) | |
| AIDA64 / CPU CheckMate | |
| Aorus Master 16 AM6J (v8.20.8100) | |
| Alienware 16 Area-51 Core Ultra 9 290HX Plus (v8.20.8100) | |
| Average of class Gaming (2930 - 20751, n=19, last 2 years) | |
| Asus ROG Zephyrus G16 GU606AW (v8.20.8100) | |
| Razer Blade 16 Core Ultra 9 386H (v8.20.8100) | |
| Average Intel Core Ultra 9 386H (4051 - 4858, n=8) | |
System and Storage Devices
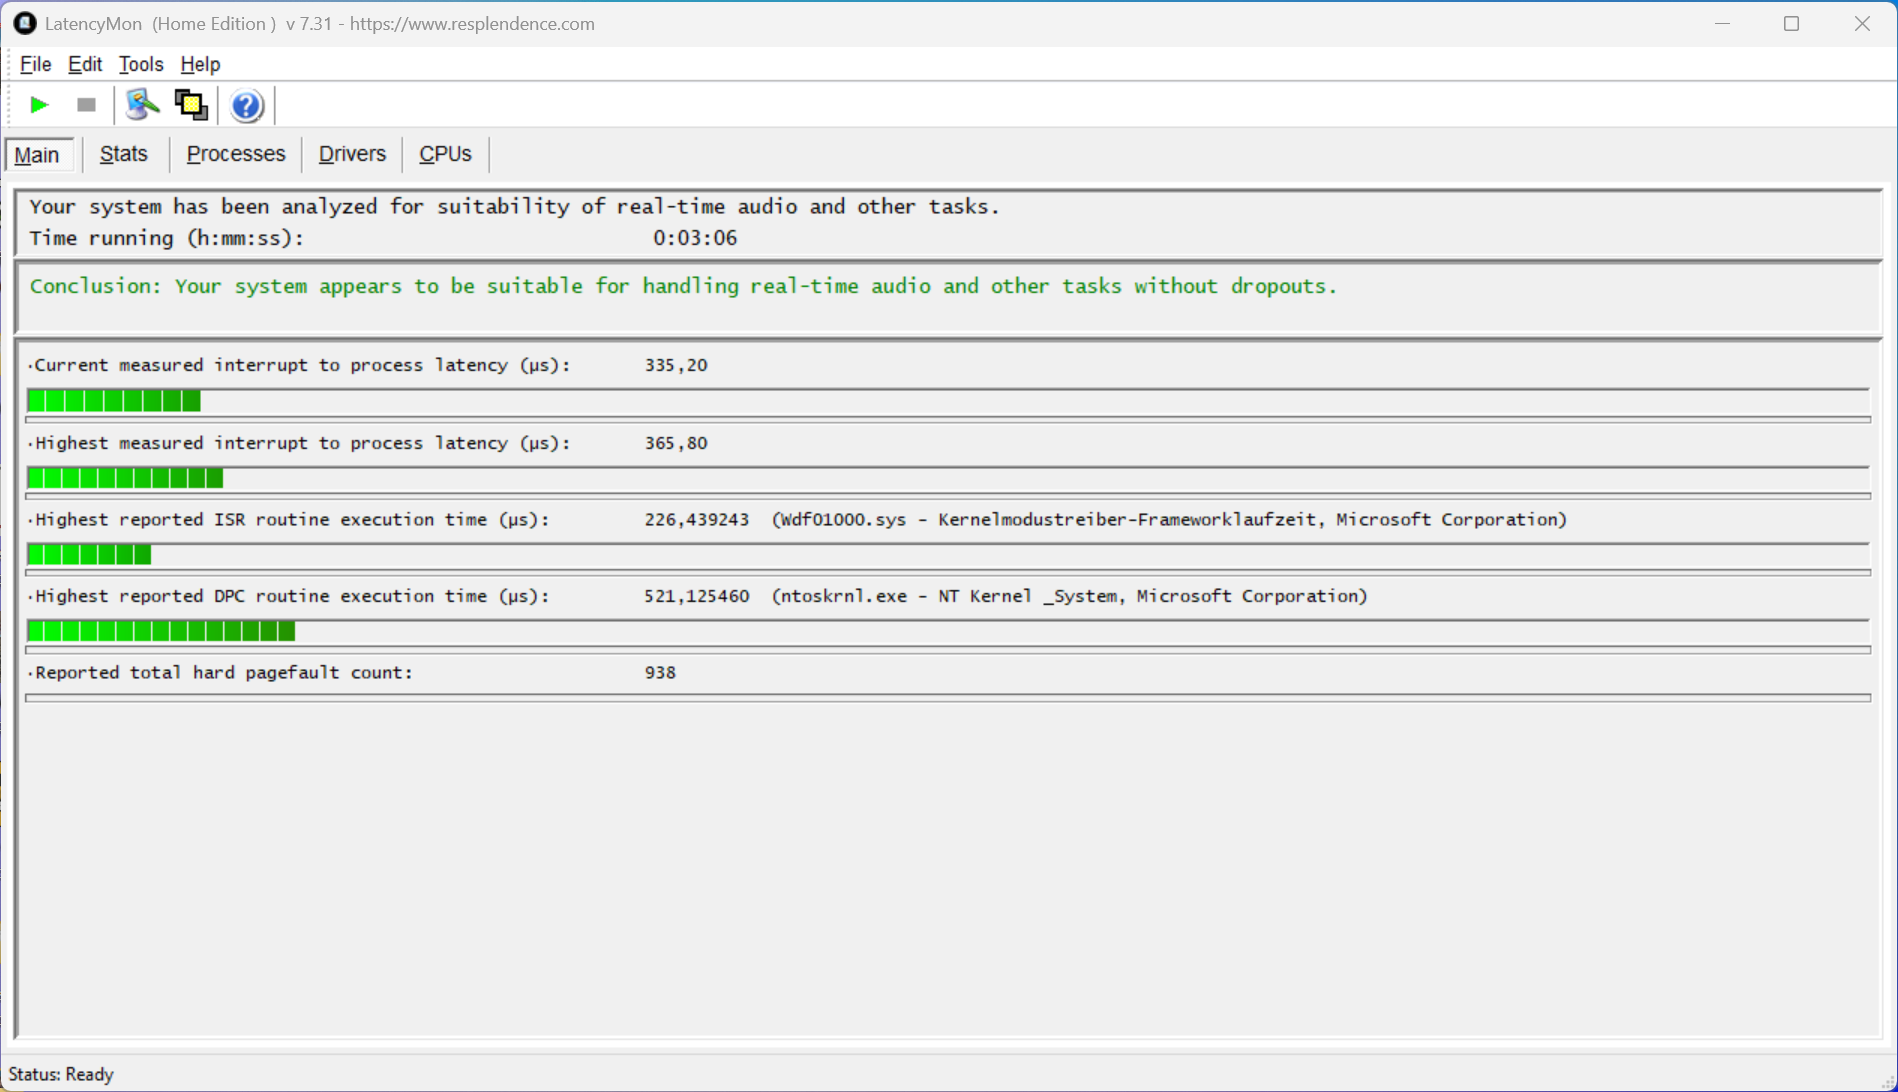
System performance is excellent and the ROG Zephyrus G16 is a very responsive system. There can be a slight delay when the dGPU is activated, but this is completely normal for systems with Advanced Optimus GPU switching. The G16 offers tow SSD slots (M.2-2280), but they are limited to PCIe 4.0 speeds. The 2 TB drive (1.74 TB free) from Samsung in our review unit offers good transfer rates and there is no throttling under sustained workloads. Our standardized latency test does not reveal any issues.
PCMark 10: Score | Essentials | Productivity | Digital Content Creation
CrossMark: Overall | Productivity | Creativity | Responsiveness
WebXPRT 3: Overall
WebXPRT 4: Overall
Mozilla Kraken 1.1: Total
| Performance rating | |
| Alienware 16 Area-51 Core Ultra 9 290HX Plus | |
| Aorus Master 16 AM6J | |
| Razer Blade 16 Core Ultra 9 386H | |
| Lenovo Legion 5 Pro 16IAX10H | |
| Asus ROG Zephyrus G16 GU606AW | |
| Average Intel Core Ultra 9 386H, NVIDIA GeForce RTX 5080 Laptop | |
| Average of class Gaming | |
| Asus ROG Zephyrus G16 GU605CW | |
| PCMark 10 / Score | |
| Alienware 16 Area-51 Core Ultra 9 290HX Plus | |
| Aorus Master 16 AM6J | |
| Razer Blade 16 Core Ultra 9 386H | |
| Asus ROG Zephyrus G16 GU606AW | |
| Average Intel Core Ultra 9 386H, NVIDIA GeForce RTX 5080 Laptop (n=1) | |
| Average of class Gaming (5828 - 12414, n=91, last 2 years) | |
| Lenovo Legion 5 Pro 16IAX10H | |
| Asus ROG Zephyrus G16 GU605CW | |
| PCMark 10 / Essentials | |
| Alienware 16 Area-51 Core Ultra 9 290HX Plus | |
| Aorus Master 16 AM6J | |
| Razer Blade 16 Core Ultra 9 386H | |
| Lenovo Legion 5 Pro 16IAX10H | |
| Average of class Gaming (8810 - 11935, n=95, last 2 years) | |
| Asus ROG Zephyrus G16 GU605CW | |
| Asus ROG Zephyrus G16 GU606AW | |
| Average Intel Core Ultra 9 386H, NVIDIA GeForce RTX 5080 Laptop (n=1) | |
| PCMark 10 / Productivity | |
| Aorus Master 16 AM6J | |
| Alienware 16 Area-51 Core Ultra 9 290HX Plus | |
| Asus ROG Zephyrus G16 GU606AW | |
| Average Intel Core Ultra 9 386H, NVIDIA GeForce RTX 5080 Laptop (n=1) | |
| Razer Blade 16 Core Ultra 9 386H | |
| Average of class Gaming (6845 - 25323, n=93, last 2 years) | |
| Lenovo Legion 5 Pro 16IAX10H | |
| Asus ROG Zephyrus G16 GU605CW | |
| PCMark 10 / Digital Content Creation | |
| Alienware 16 Area-51 Core Ultra 9 290HX Plus | |
| Razer Blade 16 Core Ultra 9 386H | |
| Asus ROG Zephyrus G16 GU606AW | |
| Average Intel Core Ultra 9 386H, NVIDIA GeForce RTX 5080 Laptop (n=1) | |
| Lenovo Legion 5 Pro 16IAX10H | |
| Aorus Master 16 AM6J | |
| Average of class Gaming (7602 - 19954, n=93, last 2 years) | |
| Asus ROG Zephyrus G16 GU605CW | |
| CrossMark / Overall | |
| Alienware 16 Area-51 Core Ultra 9 290HX Plus | |
| Razer Blade 16 Core Ultra 9 386H | |
| Asus ROG Zephyrus G16 GU606AW | |
| Average Intel Core Ultra 9 386H, NVIDIA GeForce RTX 5080 Laptop (n=1) | |
| Lenovo Legion 5 Pro 16IAX10H | |
| Aorus Master 16 AM6J | |
| Average of class Gaming (1366 - 2409, n=93, last 2 years) | |
| Asus ROG Zephyrus G16 GU605CW | |
| CrossMark / Productivity | |
| Alienware 16 Area-51 Core Ultra 9 290HX Plus | |
| Lenovo Legion 5 Pro 16IAX10H | |
| Asus ROG Zephyrus G16 GU606AW | |
| Average Intel Core Ultra 9 386H, NVIDIA GeForce RTX 5080 Laptop (n=1) | |
| Razer Blade 16 Core Ultra 9 386H | |
| Aorus Master 16 AM6J | |
| Average of class Gaming (1386 - 2254, n=93, last 2 years) | |
| Asus ROG Zephyrus G16 GU605CW | |
| CrossMark / Creativity | |
| Alienware 16 Area-51 Core Ultra 9 290HX Plus | |
| Razer Blade 16 Core Ultra 9 386H | |
| Asus ROG Zephyrus G16 GU606AW | |
| Average Intel Core Ultra 9 386H, NVIDIA GeForce RTX 5080 Laptop (n=1) | |
| Aorus Master 16 AM6J | |
| Lenovo Legion 5 Pro 16IAX10H | |
| Average of class Gaming (1343 - 2786, n=93, last 2 years) | |
| Asus ROG Zephyrus G16 GU605CW | |
| CrossMark / Responsiveness | |
| Alienware 16 Area-51 Core Ultra 9 290HX Plus | |
| Razer Blade 16 Core Ultra 9 386H | |
| Lenovo Legion 5 Pro 16IAX10H | |
| Asus ROG Zephyrus G16 GU606AW | |
| Average Intel Core Ultra 9 386H, NVIDIA GeForce RTX 5080 Laptop (n=1) | |
| Average of class Gaming (1241 - 2334, n=93, last 2 years) | |
| Aorus Master 16 AM6J | |
| Asus ROG Zephyrus G16 GU605CW | |
| WebXPRT 3 / Overall | |
| Lenovo Legion 5 Pro 16IAX10H | |
| Alienware 16 Area-51 Core Ultra 9 290HX Plus | |
| Aorus Master 16 AM6J | |
| Razer Blade 16 Core Ultra 9 386H | |
| Average of class Gaming (220 - 532, n=97, last 2 years) | |
| Asus ROG Zephyrus G16 GU606AW | |
| Average Intel Core Ultra 9 386H, NVIDIA GeForce RTX 5080 Laptop (n=1) | |
| Asus ROG Zephyrus G16 GU605CW | |
| WebXPRT 4 / Overall | |
| Alienware 16 Area-51 Core Ultra 9 290HX Plus | |
| Lenovo Legion 5 Pro 16IAX10H | |
| Aorus Master 16 AM6J | |
| Razer Blade 16 Core Ultra 9 386H | |
| Asus ROG Zephyrus G16 GU606AW | |
| Average Intel Core Ultra 9 386H, NVIDIA GeForce RTX 5080 Laptop (n=1) | |
| Asus ROG Zephyrus G16 GU605CW | |
| Average of class Gaming (165 - 354, n=97, last 2 years) | |
| Mozilla Kraken 1.1 / Total | |
| Asus ROG Zephyrus G16 GU605CW | |
| Asus ROG Zephyrus G16 GU606AW | |
| Asus ROG Zephyrus G16 GU606AW | |
| Razer Blade 16 Core Ultra 9 386H | |
| Average of class Gaming (391 - 590, n=100, last 2 years) | |
| Average Intel Core Ultra 9 386H, NVIDIA GeForce RTX 5080 Laptop (442 - 457, n=2) | |
| Lenovo Legion 5 Pro 16IAX10H | |
| Aorus Master 16 AM6J | |
| Alienware 16 Area-51 Core Ultra 9 290HX Plus | |
* ... smaller is better
| PCMark 10 Score | 9827 points | |
Help | ||
| AIDA64 / Memory Copy | |
| Razer Blade 16 Core Ultra 9 386H | |
| Asus ROG Zephyrus G16 GU606AW | |
| Average Intel Core Ultra 9 386H (75437 - 129946, n=9) | |
| Asus ROG Zephyrus G16 GU605CW | |
| Alienware 16 Area-51 Core Ultra 9 290HX Plus | |
| Lenovo Legion 5 Pro 16IAX10H | |
| Average of class Gaming (21750 - 129946, n=100, last 2 years) | |
| Aorus Master 16 AM6J | |
| AIDA64 / Memory Read | |
| Razer Blade 16 Core Ultra 9 386H | |
| Asus ROG Zephyrus G16 GU606AW | |
| Average Intel Core Ultra 9 386H (81021 - 118858, n=9) | |
| Alienware 16 Area-51 Core Ultra 9 290HX Plus | |
| Lenovo Legion 5 Pro 16IAX10H | |
| Asus ROG Zephyrus G16 GU605CW | |
| Average of class Gaming (22956 - 118858, n=100, last 2 years) | |
| Aorus Master 16 AM6J | |
| AIDA64 / Memory Write | |
| Razer Blade 16 Core Ultra 9 386H | |
| Asus ROG Zephyrus G16 GU606AW | |
| Average Intel Core Ultra 9 386H (75959 - 135096, n=9) | |
| Alienware 16 Area-51 Core Ultra 9 290HX Plus | |
| Lenovo Legion 5 Pro 16IAX10H | |
| Average of class Gaming (22297 - 135096, n=100, last 2 years) | |
| Asus ROG Zephyrus G16 GU605CW | |
| Aorus Master 16 AM6J | |
| AIDA64 / Memory Latency | |
| Asus ROG Zephyrus G16 GU605CW | |
| Lenovo Legion 5 Pro 16IAX10H | |
| Alienware 16 Area-51 Core Ultra 9 290HX Plus | |
| Average of class Gaming (75.3 - 151.7, n=100, last 2 years) | |
| Aorus Master 16 AM6J | |
| Average Intel Core Ultra 9 386H (87.2 - 116.9, n=9) | |
| Asus ROG Zephyrus G16 GU606AW | |
| Razer Blade 16 Core Ultra 9 386H | |
* ... smaller is better
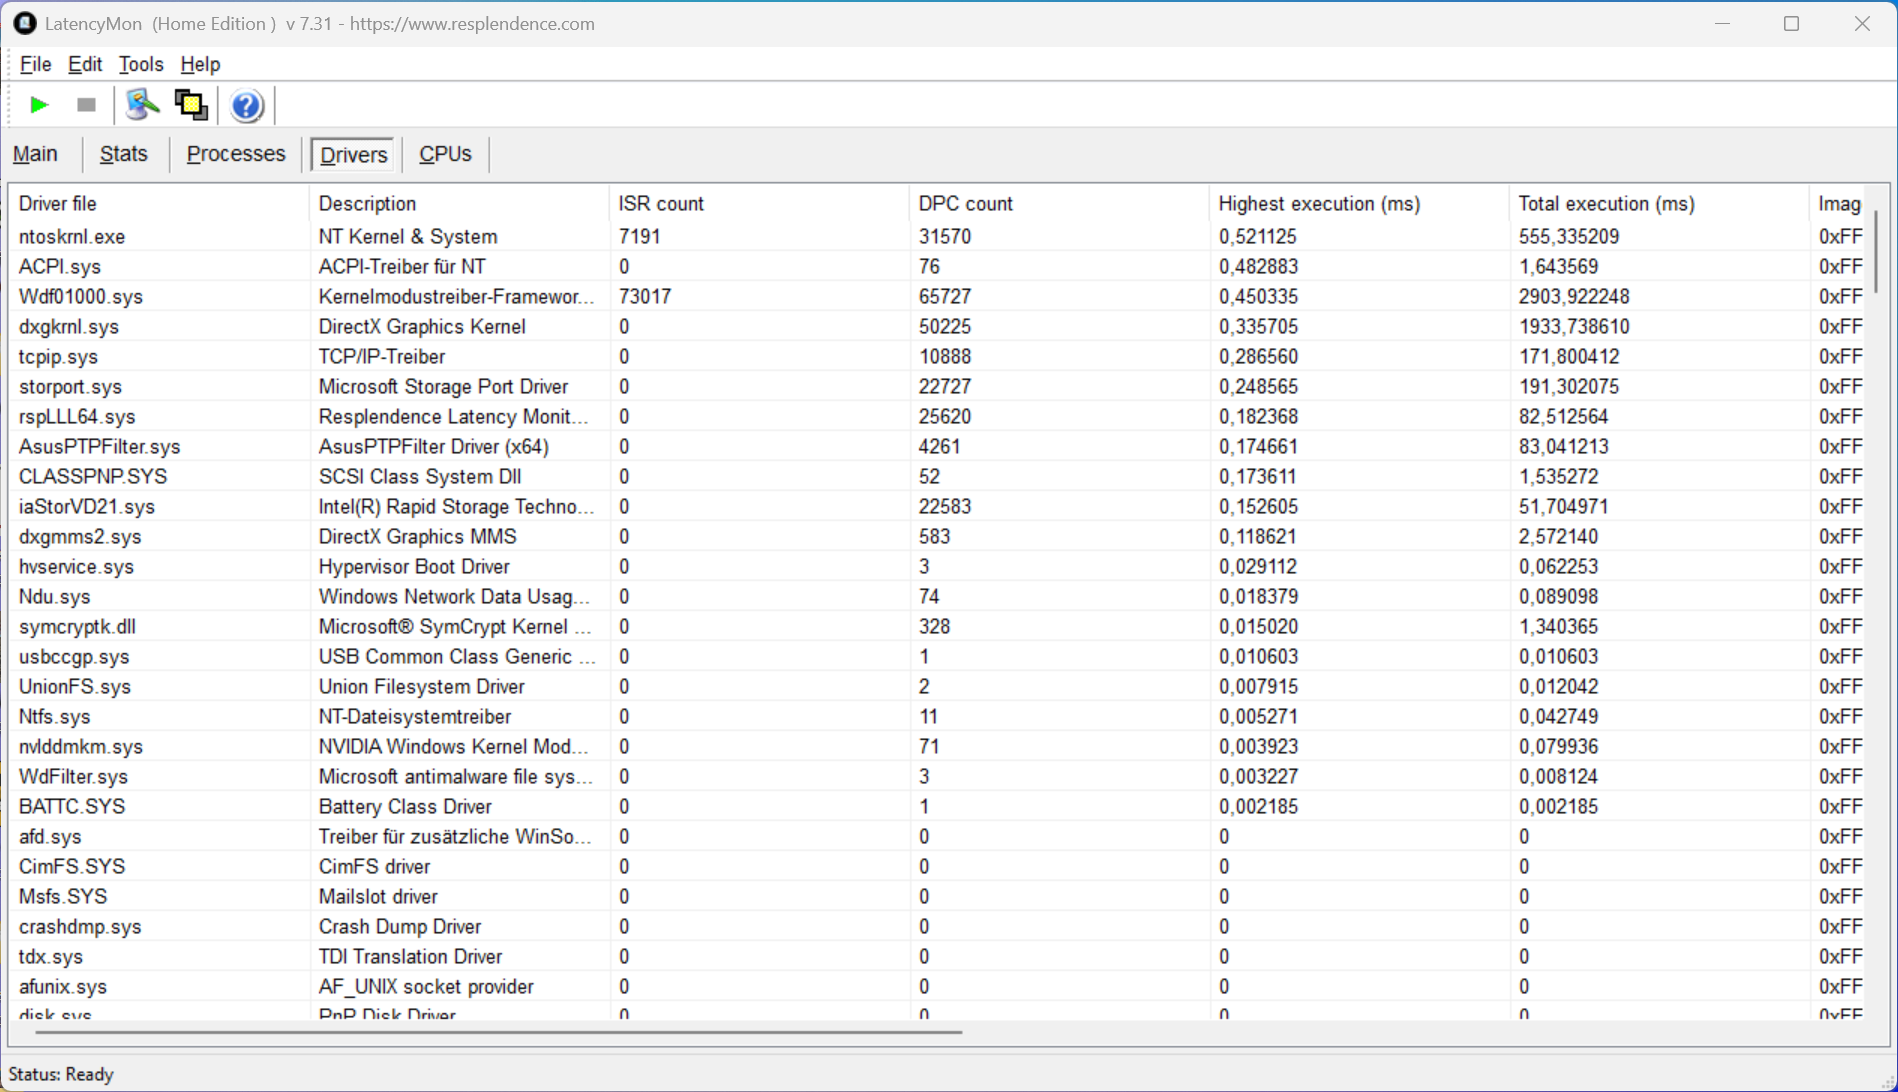
| DPC Latencies / LatencyMon - interrupt to process latency (max), Web, Youtube, Prime95 | |
| Alienware 16 Area-51 Core Ultra 9 290HX Plus | |
| Average of class Gaming (366 - 11799, n=92, last 2 years) | |
| Razer Blade 16 Core Ultra 9 386H | |
| Asus ROG Zephyrus G16 GU605CW | |
| Lenovo Legion 5 Pro 16IAX10H | |
| Asus ROG Zephyrus G16 GU606AW | |
* ... smaller is better

* ... smaller is better
Disk Throttling: DiskSpd Read Loop, Queue Depth 8
GPU and Gaming Performance
Asus increased the maximum TGP of the GeForce RTX 5080 (or RTX 5090) from 120 to 135 Watts, which improves the gaming performance by about 20 % compared to the predecessor. However, it is still a bit slower than its main rival, the Razer Blade 16 with the same Core Ultra 9 386H and the 160W version of the RTX 5080. Overall, the RTX 5080 with 16 GB VRAM can also handle demanding games and only very challenging titles with Raytracing require DLSS upscaling or frame generation for a smooth gaming experience.
| 3DMark 11 Performance | 24951 points | |
| 3DMark Fire Strike Score | 34961 points | |
| 3DMark Time Spy Score | 17840 points | |
| 3DMark Steel Nomad Score | 4484 points | |
| 3DMark Steel Nomad Light Score | 19417 points | |
Help | ||
| Blender / v3.3 Classroom OPTIX/RTX | |
| Average of class Gaming (9 - 32, n=101, last 2 years) | |
| Lenovo Legion 5 Pro 16IAX10H | |
| Aorus Master 16 AM6J | |
| Asus ROG Zephyrus G16 GU606AW | |
| Average NVIDIA GeForce RTX 5080 Laptop (11 - 17, n=16) | |
| Asus ROG Zephyrus G16 GU605CW | |
| Alienware 16 Area-51 Core Ultra 9 290HX Plus | |
| Razer Blade 16 Core Ultra 9 386H | |
| Blender / v3.3 Classroom CUDA | |
| Average of class Gaming (15 - 228, n=101, last 2 years) | |
| Lenovo Legion 5 Pro 16IAX10H | |
| Average NVIDIA GeForce RTX 5080 Laptop (18 - 49, n=18) | |
| Asus ROG Zephyrus G16 GU605CW | |
| Asus ROG Zephyrus G16 GU605CW | |
| Aorus Master 16 AM6J | |
| Asus ROG Zephyrus G16 GU606AW | |
| Alienware 16 Area-51 Core Ultra 9 290HX Plus | |
| Razer Blade 16 Core Ultra 9 386H | |
| Blender / v3.3 Classroom CPU | |
| Razer Blade 16 Core Ultra 9 386H | |
| Asus ROG Zephyrus G16 GU606AW | |
| Average of class Gaming (122 - 565, n=97, last 2 years) | |
| Average NVIDIA GeForce RTX 5080 Laptop (123 - 248, n=17) | |
| Lenovo Legion 5 Pro 16IAX10H | |
| Alienware 16 Area-51 Core Ultra 9 290HX Plus | |
| Aorus Master 16 AM6J | |
* ... smaller is better
| F1 25 - 2560x1440 Ultra Max Preset AA:T AF:16x | |
| Average NVIDIA GeForce RTX 5080 Laptop (23.3 - 30.8, n=6) | |
| Asus ROG Zephyrus G16 GU606AW | |
| Asus ROG Zephyrus G16 GU605CW | |
| Average of class Gaming (5 - 39.1, n=27, last 2 years) | |
| Lenovo Legion 5 Pro 16IAX10H | |
Cyberpunk 2077 ultra FPS Chart
| low | med. | high | ultra | QHD DLSS | QHD | |
|---|---|---|---|---|---|---|
| GTA V (2015) | 141.8 | 138.9 | ||||
| Dota 2 Reborn (2015) | 175.7 | 161 | 154 | 146.4 | ||
| Final Fantasy XV Benchmark (2018) | 213 | 195.4 | 153.9 | 125.6 | ||
| X-Plane 11.11 (2018) | 139.2 | 124.5 | 101.9 | |||
| Strange Brigade (2018) | 446 | 337 | 301 | 300 | 242 | |
| Baldur's Gate 3 (2023) | 203 | 175.9 | 158.2 | 154.7 | 117.4 | |
| Cyberpunk 2077 (2023) | 142.8 | 133.6 | 125 | 114.2 | 83.4 | |
| F1 24 (2024) | 237 | 231 | 107 | 108.9 | 70.6 | |
| F1 25 (2025) | 218 | 209 | 182.2 | 40.4 | 46.8 | 25.2 |
Emissions & Power Consumption
System Noise

If you use Turbo mode for the highest performance, the fans are always active even while idling (32.8 dB(A)), so we recommend Whisper or Performance mode for everyday tasks when you are not playing games. While gaming, the G16 is audible in every mode and you should use headphones both for Turbo (54.8 dB(A)) as well as Performance mode (50.1 dB(A)). We did not notice any other electronic noises from our review unit.
Noise level
| Idle |
| 32.8 / 32.8 / 32.8 dB(A) |
| Load |
| 42.6 / 54.8 dB(A) |
 | ||
30 dB silent 40 dB(A) audible 50 dB(A) loud |
||
min:  , med: , med:  , max: , max:  Earthworks M23R, Arta (15 cm distance) environment noise: 24.4 dB(A) Earthworks M23R, Arta (15 cm distance) environment noise: 24.4 dB(A) | ||
| Asus ROG Zephyrus G16 GU606AW Ultra 9 386H, GeForce RTX 5080 Laptop | Razer Blade 16 Core Ultra 9 386H Ultra 9 386H, GeForce RTX 5090 Laptop | Asus ROG Zephyrus G16 GU605CW Ultra 9 285H, GeForce RTX 5080 Laptop | Aorus Master 16 AM6J R9 9955HX3D, GeForce RTX 5080 Laptop | Alienware 16 Area-51 Core Ultra 9 290HX Plus Ultra 9 290HX Plus, GeForce RTX 5080 Laptop | Lenovo Legion 5 Pro 16IAX10H Ultra 9 275HX, GeForce RTX 5070 Ti Laptop | |
|---|---|---|---|---|---|---|
| Noise | 10% | -0% | -5% | 14% | 3% | |
| off / environment * (dB) | 24.4 | 23.1 5% | 25.56 -5% | 25 -2% | 23.1 5% | 24 2% |
| Idle Minimum * (dB) | 32.8 | 23.4 29% | 30 9% | 28 15% | 23.2 29% | 24 27% |
| Idle Average * (dB) | 32.8 | 25.4 23% | 30 9% | 29 12% | 28.2 14% | 24 27% |
| Idle Maximum * (dB) | 32.8 | 29.3 11% | 30 9% | 35 -7% | 28.3 14% | 30.9 6% |
| Load Average * (dB) | 42.6 | 42.6 -0% | 53.55 -26% | 58 -36% | 28.8 32% | 55.9 -31% |
| Cyberpunk 2077 ultra * (dB) | 54.8 | 53.6 2% | 53.5 2% | 59 -8% | 49 11% | 56.72 -4% |
| Load Maximum * (dB) | 54.8 | 53.7 2% | 54.02 1% | 60 -9% | 57.1 -4% | 56.72 -4% |
* ... smaller is better
Temperature
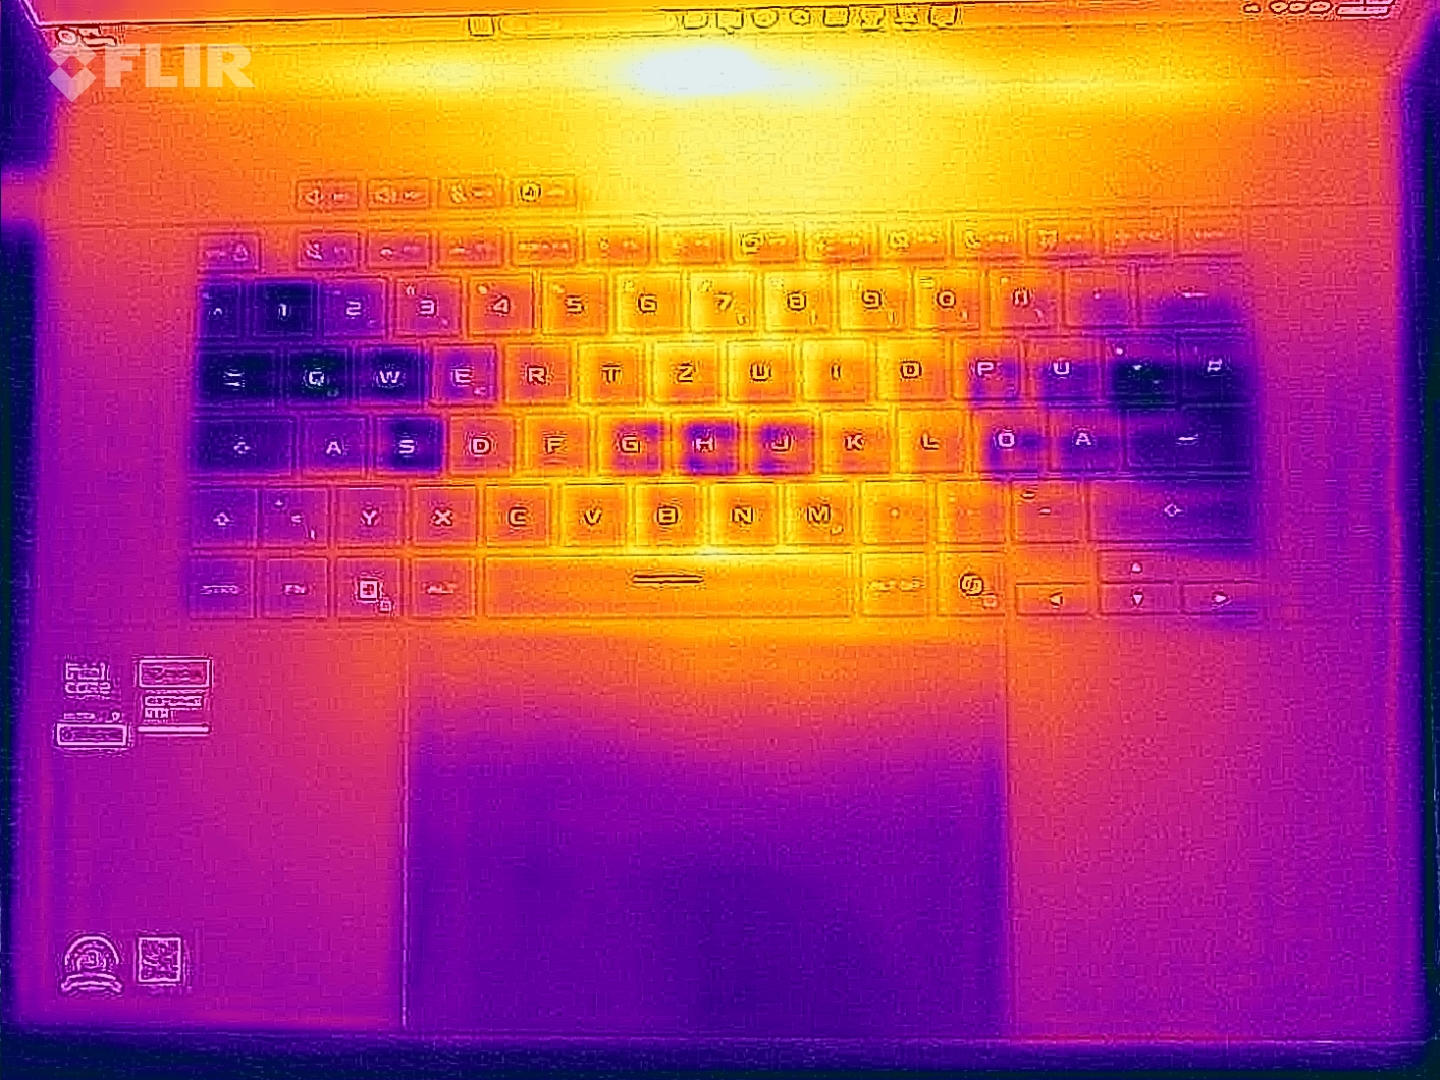
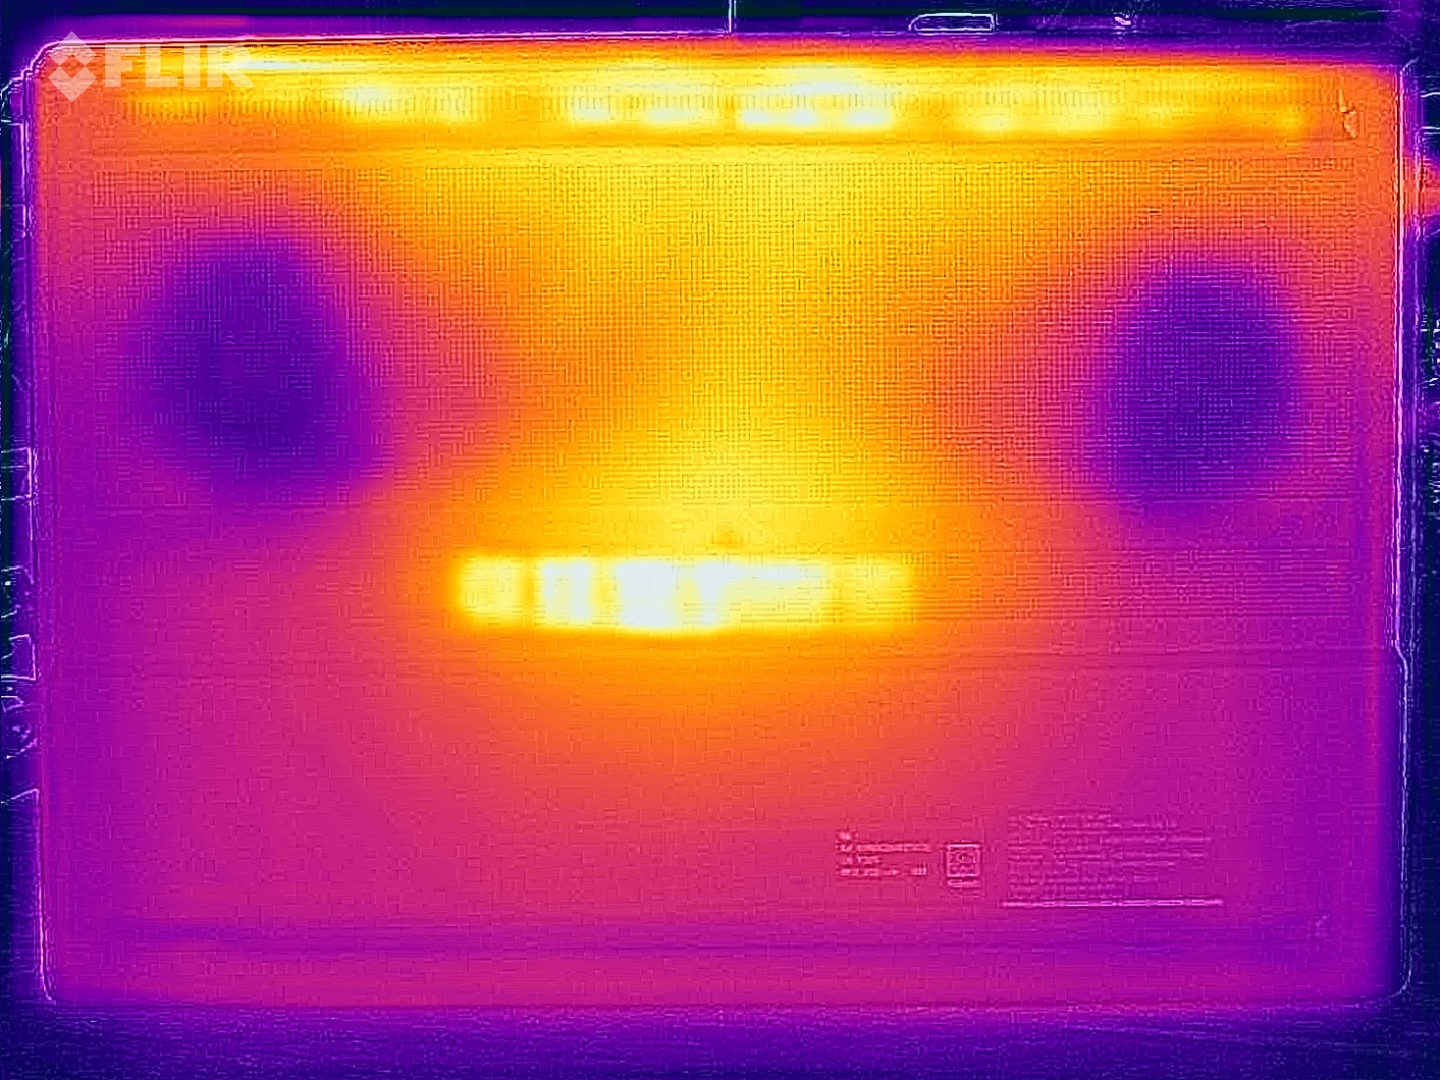
The aluminum chassis can warm up noticeably under high loads, but considering the size, you are probably not using it on you lap while gaming anyway. Temperatures of up to 46 °C are not critical, though. During our stress test, the GPU maintains its rated TGP of 115 Watts (80 °C), while the CPU levels off at 35 Watts (~84 °C).

(-) The maximum temperature on the upper side is 46.3 °C / 115 F, compared to the average of 40.4 °C / 105 F, ranging from 21.2 to 68.8 °C for the class Gaming.
(-) The bottom heats up to a maximum of 45.9 °C / 115 F, compared to the average of 43.2 °C / 110 F
(+) In idle usage, the average temperature for the upper side is 28.9 °C / 84 F, compared to the device average of 33.9 °C / 93 F.
(±) 3: The average temperature for the upper side is 37.8 °C / 100 F, compared to the average of 33.9 °C / 93 F for the class Gaming.
(+) The palmrests and touchpad are reaching skin temperature as a maximum (34.4 °C / 93.9 F) and are therefore not hot.
(-) The average temperature of the palmrest area of similar devices was 28.8 °C / 83.8 F (-5.6 °C / -10.1 F).
| Asus ROG Zephyrus G16 GU606AW Ultra 9 386H, GeForce RTX 5080 Laptop | Razer Blade 16 Core Ultra 9 386H Ultra 9 386H, GeForce RTX 5090 Laptop | Asus ROG Zephyrus G16 GU605CW Ultra 9 285H, GeForce RTX 5080 Laptop | Aorus Master 16 AM6J R9 9955HX3D, GeForce RTX 5080 Laptop | Alienware 16 Area-51 Core Ultra 9 290HX Plus Ultra 9 290HX Plus, GeForce RTX 5080 Laptop | Lenovo Legion 5 Pro 16IAX10H Ultra 9 275HX, GeForce RTX 5070 Ti Laptop | |
|---|---|---|---|---|---|---|
| Heat | -5% | -10% | -11% | 9% | -13% | |
| Maximum Upper Side * (°C) | 46.3 | 45.6 2% | 49.2 -6% | 50 -8% | 45.2 2% | 48 -4% |
| Maximum Bottom * (°C) | 45.9 | 47 -2% | 50.2 -9% | 52 -13% | 37.4 19% | 50 -9% |
| Idle Upper Side * (°C) | 32.1 | 35.2 -10% | 37.2 -16% | 31.6 2% | 38 -18% | |
| Idle Bottom * (°C) | 34.5 | 37.6 -9% | 37.4 -8% | 30.2 12% | 42 -22% |
* ... smaller is better
Speakers
The sound system is once again excellent, but the direct rival Blade 16 is on a similar level.
Asus ROG Zephyrus G16 GU606AW audio analysis
(+) | speakers can play relatively loud (85.9 dB)
Bass 100 - 315 Hz
(+) | good bass - only 4.6% away from median
(±) | linearity of bass is average (7.5% delta to prev. frequency)
Mids 400 - 2000 Hz
(+) | balanced mids - only 4% away from median
(+) | mids are linear (2.3% delta to prev. frequency)
Highs 2 - 16 kHz
(+) | balanced highs - only 3.9% away from median
(+) | highs are linear (5% delta to prev. frequency)
Overall 100 - 16.000 Hz
(+) | overall sound is linear (8.5% difference to median)
Compared to same class
» 2% of all tested devices in this class were better, 1% similar, 97% worse
» The best had a delta of 6%, average was 18%, worst was 132%
Compared to all devices tested
» 2% of all tested devices were better, 1% similar, 97% worse
» The best had a delta of 4%, average was 23%, worst was 136%
Razer Blade 16 Core Ultra 9 386H audio analysis
(±) | speaker loudness is average but good (81.9 dB)
Bass 100 - 315 Hz
(±) | reduced bass - on average 7.8% lower than median
(±) | linearity of bass is average (7% delta to prev. frequency)
Mids 400 - 2000 Hz
(+) | balanced mids - only 2.4% away from median
(+) | mids are linear (2.4% delta to prev. frequency)
Highs 2 - 16 kHz
(+) | balanced highs - only 3.1% away from median
(+) | highs are linear (6% delta to prev. frequency)
Overall 100 - 16.000 Hz
(+) | overall sound is linear (8.7% difference to median)
Compared to same class
» 3% of all tested devices in this class were better, 1% similar, 97% worse
» The best had a delta of 6%, average was 18%, worst was 132%
Compared to all devices tested
» 3% of all tested devices were better, 1% similar, 97% worse
» The best had a delta of 4%, average was 23%, worst was 136%
Asus ROG Zephyrus G16 GU605CW audio analysis
(+) | speakers can play relatively loud (84.6 dB)
Bass 100 - 315 Hz
(+) | good bass - only 4.4% away from median
(±) | linearity of bass is average (8.1% delta to prev. frequency)
Mids 400 - 2000 Hz
(+) | balanced mids - only 2.6% away from median
(+) | mids are linear (4.2% delta to prev. frequency)
Highs 2 - 16 kHz
(+) | balanced highs - only 3.3% away from median
(+) | highs are linear (2.8% delta to prev. frequency)
Overall 100 - 16.000 Hz
(+) | overall sound is linear (6.8% difference to median)
Compared to same class
» 0% of all tested devices in this class were better, 0% similar, 99% worse
» The best had a delta of 6%, average was 18%, worst was 132%
Compared to all devices tested
» 1% of all tested devices were better, 0% similar, 99% worse
» The best had a delta of 4%, average was 23%, worst was 136%
Aorus Master 16 AM6J audio analysis
(+) | speakers can play relatively loud (84 dB)
Bass 100 - 315 Hz
(±) | reduced bass - on average 10.1% lower than median
(±) | linearity of bass is average (9.6% delta to prev. frequency)
Mids 400 - 2000 Hz
(±) | higher mids - on average 7.2% higher than median
(+) | mids are linear (3.2% delta to prev. frequency)
Highs 2 - 16 kHz
(+) | balanced highs - only 4% away from median
(+) | highs are linear (5.1% delta to prev. frequency)
Overall 100 - 16.000 Hz
(+) | overall sound is linear (14.8% difference to median)
Compared to same class
» 30% of all tested devices in this class were better, 7% similar, 63% worse
» The best had a delta of 6%, average was 18%, worst was 132%
Compared to all devices tested
» 20% of all tested devices were better, 4% similar, 76% worse
» The best had a delta of 4%, average was 23%, worst was 136%
Alienware 16 Area-51 Core Ultra 9 290HX Plus audio analysis
(+) | speakers can play relatively loud (84.9 dB)
Bass 100 - 315 Hz
(-) | nearly no bass - on average 18.7% lower than median
(±) | linearity of bass is average (13.9% delta to prev. frequency)
Mids 400 - 2000 Hz
(+) | balanced mids - only 1.8% away from median
(+) | mids are linear (5.1% delta to prev. frequency)
Highs 2 - 16 kHz
(+) | balanced highs - only 2.5% away from median
(+) | highs are linear (3.4% delta to prev. frequency)
Overall 100 - 16.000 Hz
(+) | overall sound is linear (12.6% difference to median)
Compared to same class
» 16% of all tested devices in this class were better, 4% similar, 81% worse
» The best had a delta of 6%, average was 18%, worst was 132%
Compared to all devices tested
» 12% of all tested devices were better, 3% similar, 86% worse
» The best had a delta of 4%, average was 23%, worst was 136%
Lenovo Legion 5 Pro 16IAX10H audio analysis
(±) | speaker loudness is average but good (78.2 dB)
Bass 100 - 315 Hz
(-) | nearly no bass - on average 21.1% lower than median
(±) | linearity of bass is average (8% delta to prev. frequency)
Mids 400 - 2000 Hz
(±) | higher mids - on average 6.3% higher than median
(+) | mids are linear (6.5% delta to prev. frequency)
Highs 2 - 16 kHz
(+) | balanced highs - only 1.6% away from median
(+) | highs are linear (4.9% delta to prev. frequency)
Overall 100 - 16.000 Hz
(±) | linearity of overall sound is average (18.3% difference to median)
Compared to same class
» 58% of all tested devices in this class were better, 9% similar, 33% worse
» The best had a delta of 6%, average was 18%, worst was 132%
Compared to all devices tested
» 40% of all tested devices were better, 8% similar, 52% worse
» The best had a delta of 4%, average was 23%, worst was 136%
Power Consumption and Battery Life
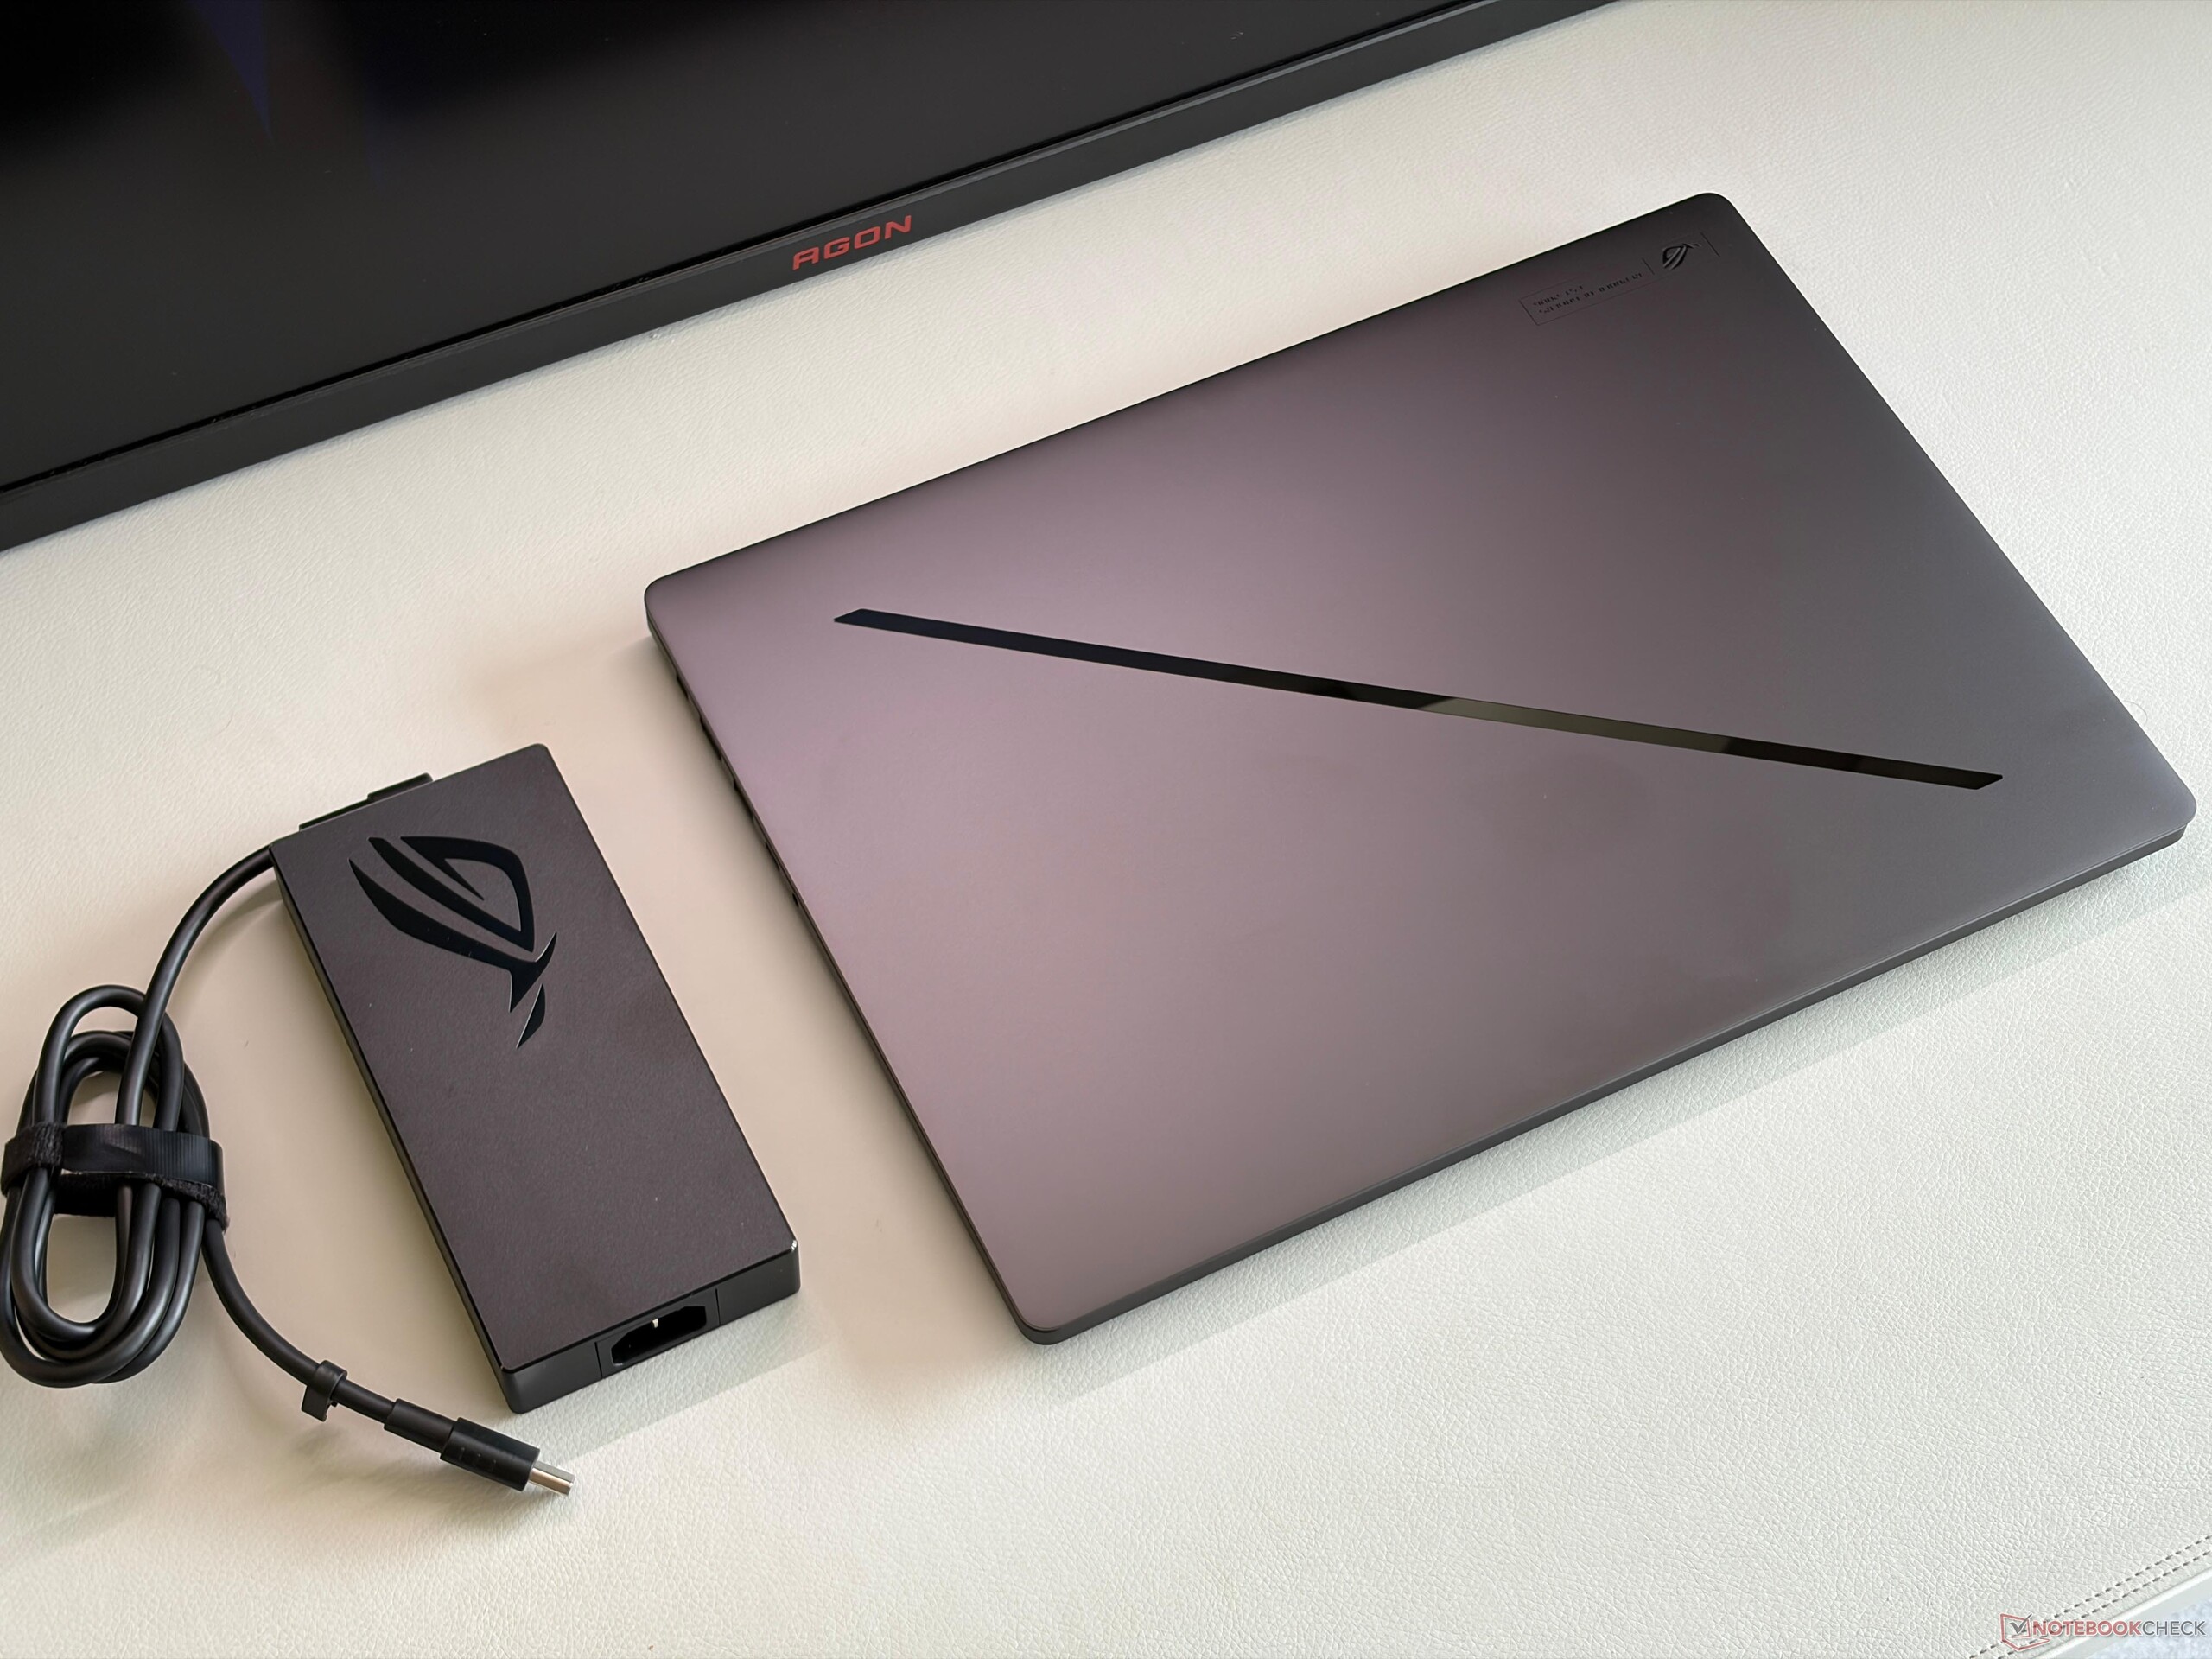
The consumption measurements do not reveal any surprises and the 250W power adapter is sufficient since the consumption levels off at around 190-195 Watts. The 90Wh battery remains unchanged, but thanks to the updated screen and the more efficient Panther Lake processor, the battery runtimes are better than before. At 150 nits, our Wi-Fi tests runs for almost 12.5 hours (38 % longer than before) and therefore also beats the Blade 16 with Panther Lake. At maximum SDR brightness (which is higher than before), the result is also slightly better than before at almost 7.5 hours.
| Off / Standby | 0.12 / 0.54 Watt |
| Idle | 7.8 / 13.3 / 13.6 Watt |
| Load |
122.9 / 245.6 Watt |
   
| |
Key:
min: ,
med: ,
max: Metrahit Energy | |
Power Consumption Cyberpunk / Stress Test
Power Consumption external Monitor
Notebookcheck Rating
Asus ROG Zephyrus G16 GU606AW
- 09/07/2026 v8
Andreas Osthoff
 Total Sustainability Score:
 Potential Competitors in Comparison
Image | Model / Review | Price | Weight | Height | Display |
|---|---|---|---|---|---|
1. 90.4%  | Asus ROG Zephyrus G16 GU606AW Intel Core Ultra 9 386H ⎘ NVIDIA GeForce RTX 5080 Laptop ⎘ 64 GB Memory, 2048 GB SSD | Amazon: List Price: 5400€ | 1.9 kg | 17.9 mm | 16.00" 2560x1600 189 PPI OLED |
2. 87.7%  | Razer Blade 16 Core Ultra 9 386H Intel Core Ultra 9 386H ⎘ NVIDIA GeForce RTX 5090 Laptop ⎘ 32 GB Memory, 2048 GB SSD | Amazon: 1. $3,149.99 Razer Blade 16 (2026) Gaming... 2. $3,999.99 Razer Blade 16 (2026) Gaming... 3. $5,319.99 Razer Blade 16 (2026) Gaming... List Price: 4900 USD | 2.1 kg | 17.4 mm | 16.00" 2560x1600 189 PPI OLED |
3.  | Asus ROG Zephyrus G16 GU605CW Intel Core Ultra 9 285H ⎘ NVIDIA GeForce RTX 5080 Laptop ⎘ 32 GB Memory, 2048 GB SSD | Amazon: List Price: 3800€ | 2 kg | 14.9 mm | 16.00" 2560x1600 189 PPI OLED |
4. 83.5%  | Aorus Master 16 AM6J AMD Ryzen 9 9955HX3D ⎘ NVIDIA GeForce RTX 5080 Laptop ⎘ 32 GB Memory, 1000 GB SSD | Amazon: 1. $4,899.99 GIGABYTE - AORUS Master 16 G... 2. $3,499.99 GIGABYTE - AORUS Master 16 G... 3. $2,789.82 GIGABYTE - AORUS MASTER 16 G... | 2.3 kg | 24.5 mm | 16.00" 2560x1600 189 PPI OLED |
5. 88.2%  | Alienware 16 Area-51 Core Ultra 9 290HX Plus Intel Core Ultra 9 290HX Plus ⎘ NVIDIA GeForce RTX 5080 Laptop ⎘ 32 GB Memory, SSD | Amazon: List Price: 4000 USD | 3.3 kg | 28.5 mm | 16.00" 2560x1600 189 PPI OLED |
6. 84.5%  | Lenovo Legion 5 Pro 16IAX10H Intel Core Ultra 9 275HX ⎘ NVIDIA GeForce RTX 5070 Ti Laptop ⎘ 32 GB Memory, 1024 GB SSD | Amazon: 1. $2,999.00 Lenovo Legion Pro 5i Gen 10 ... 2. $94.98 Lenovo Slim 245W AC Adapter ... 3. $2,069.00 Lenovo Legion 5 Pro Gaming A... List Price: 2500 Euro | 2.4 kg | 25.95 mm | 16.00" 2560x1600 189 PPI OLED |
Transparency
The selection of devices to be reviewed is made by our editorial team. The test sample was provided to the author as a loan by the manufacturer or retailer for the purpose of this review. The lender had no influence on this review, nor did the manufacturer receive a copy of this review before publication. There was no obligation to publish this review. As an independent media company, Notebookcheck is not subjected to the authority of manufacturers, retailers or publishers.
This is how Notebookcheck is testing
Every year, Notebookcheck independently reviews hundreds of laptops and smartphones using standardized procedures to ensure that all results are comparable. We have continuously developed our test methods for around 20 years and set industry standards in the process. In our test labs, high-quality measuring equipment is utilized by experienced technicians and editors. These tests involve a multi-stage validation process. Our complex rating system is based on hundreds of well-founded measurements and benchmarks, which maintains objectivity. Further information on our test methods can be found here.
 Add as a preferred source on Google


No comments for this article
