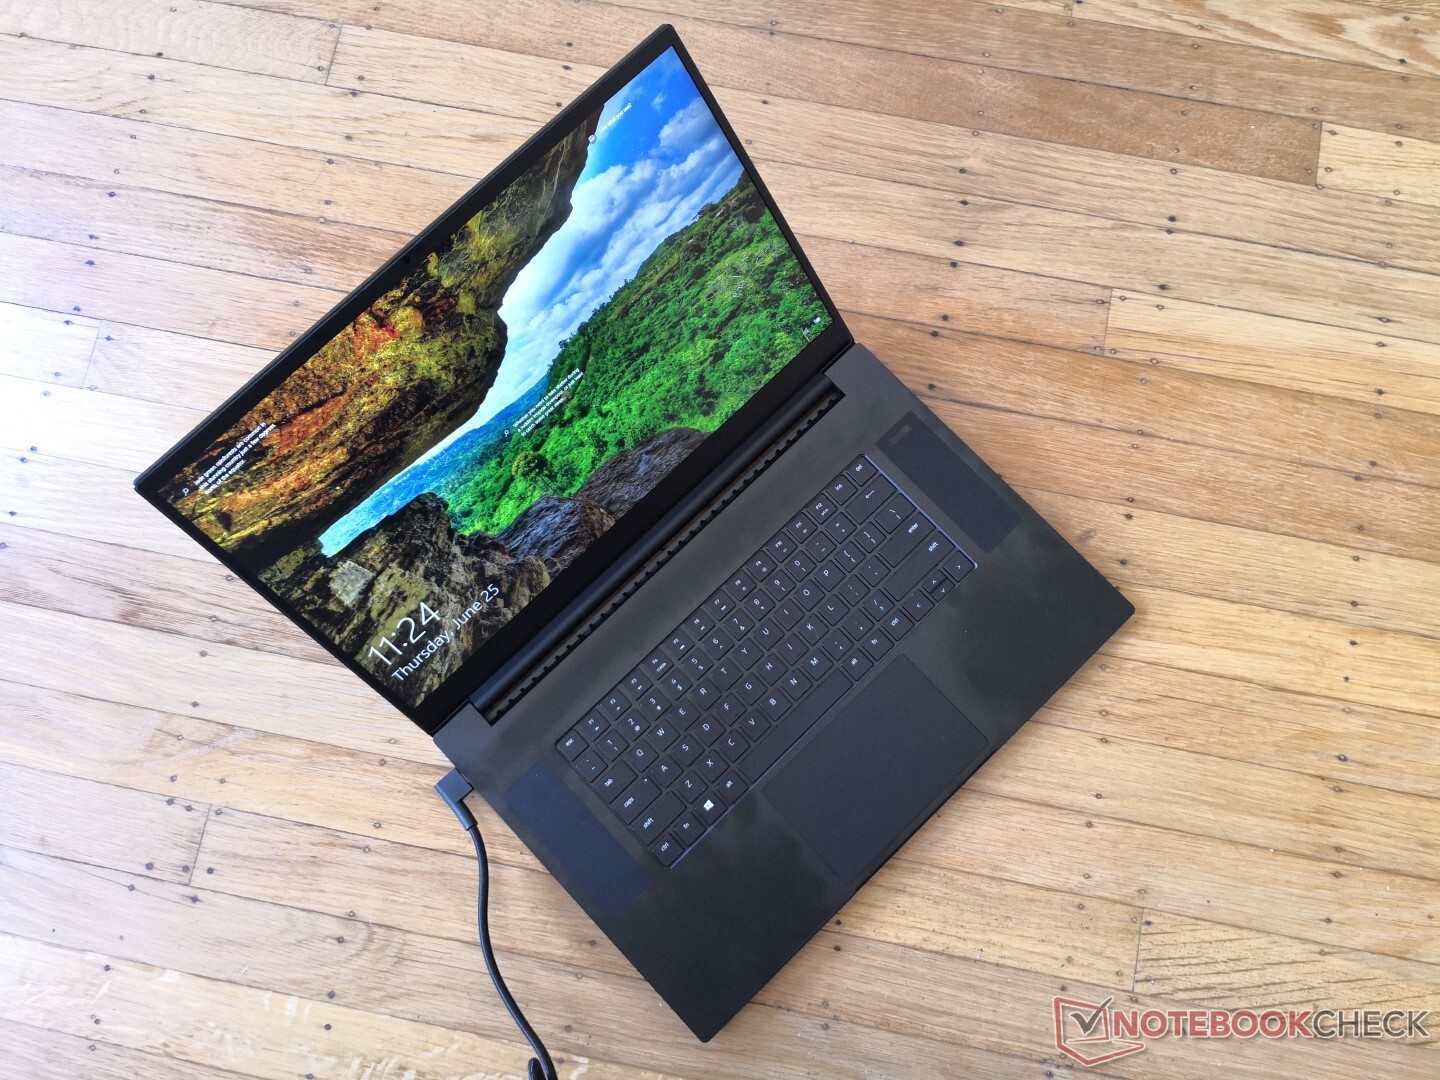
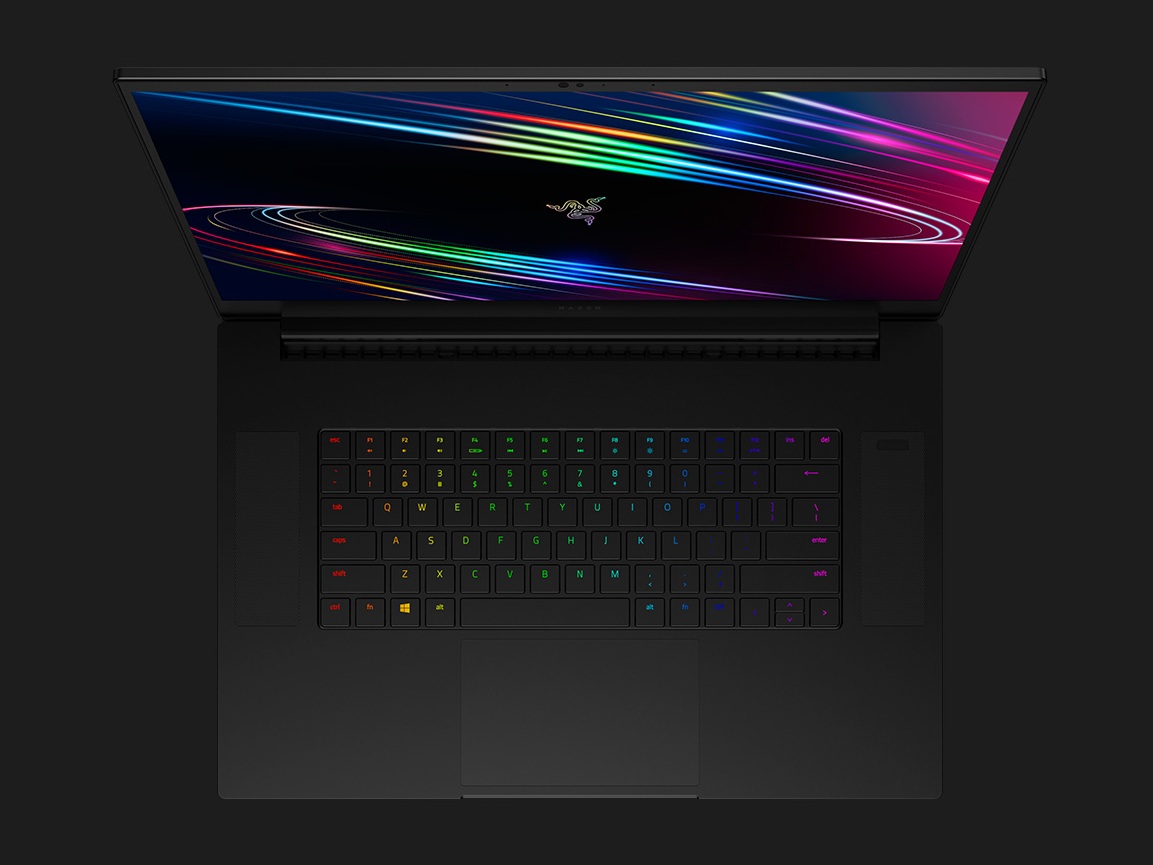
2020 Razer Blade Pro 17 Review: Do you Really Need a 300 Hz Laptop?
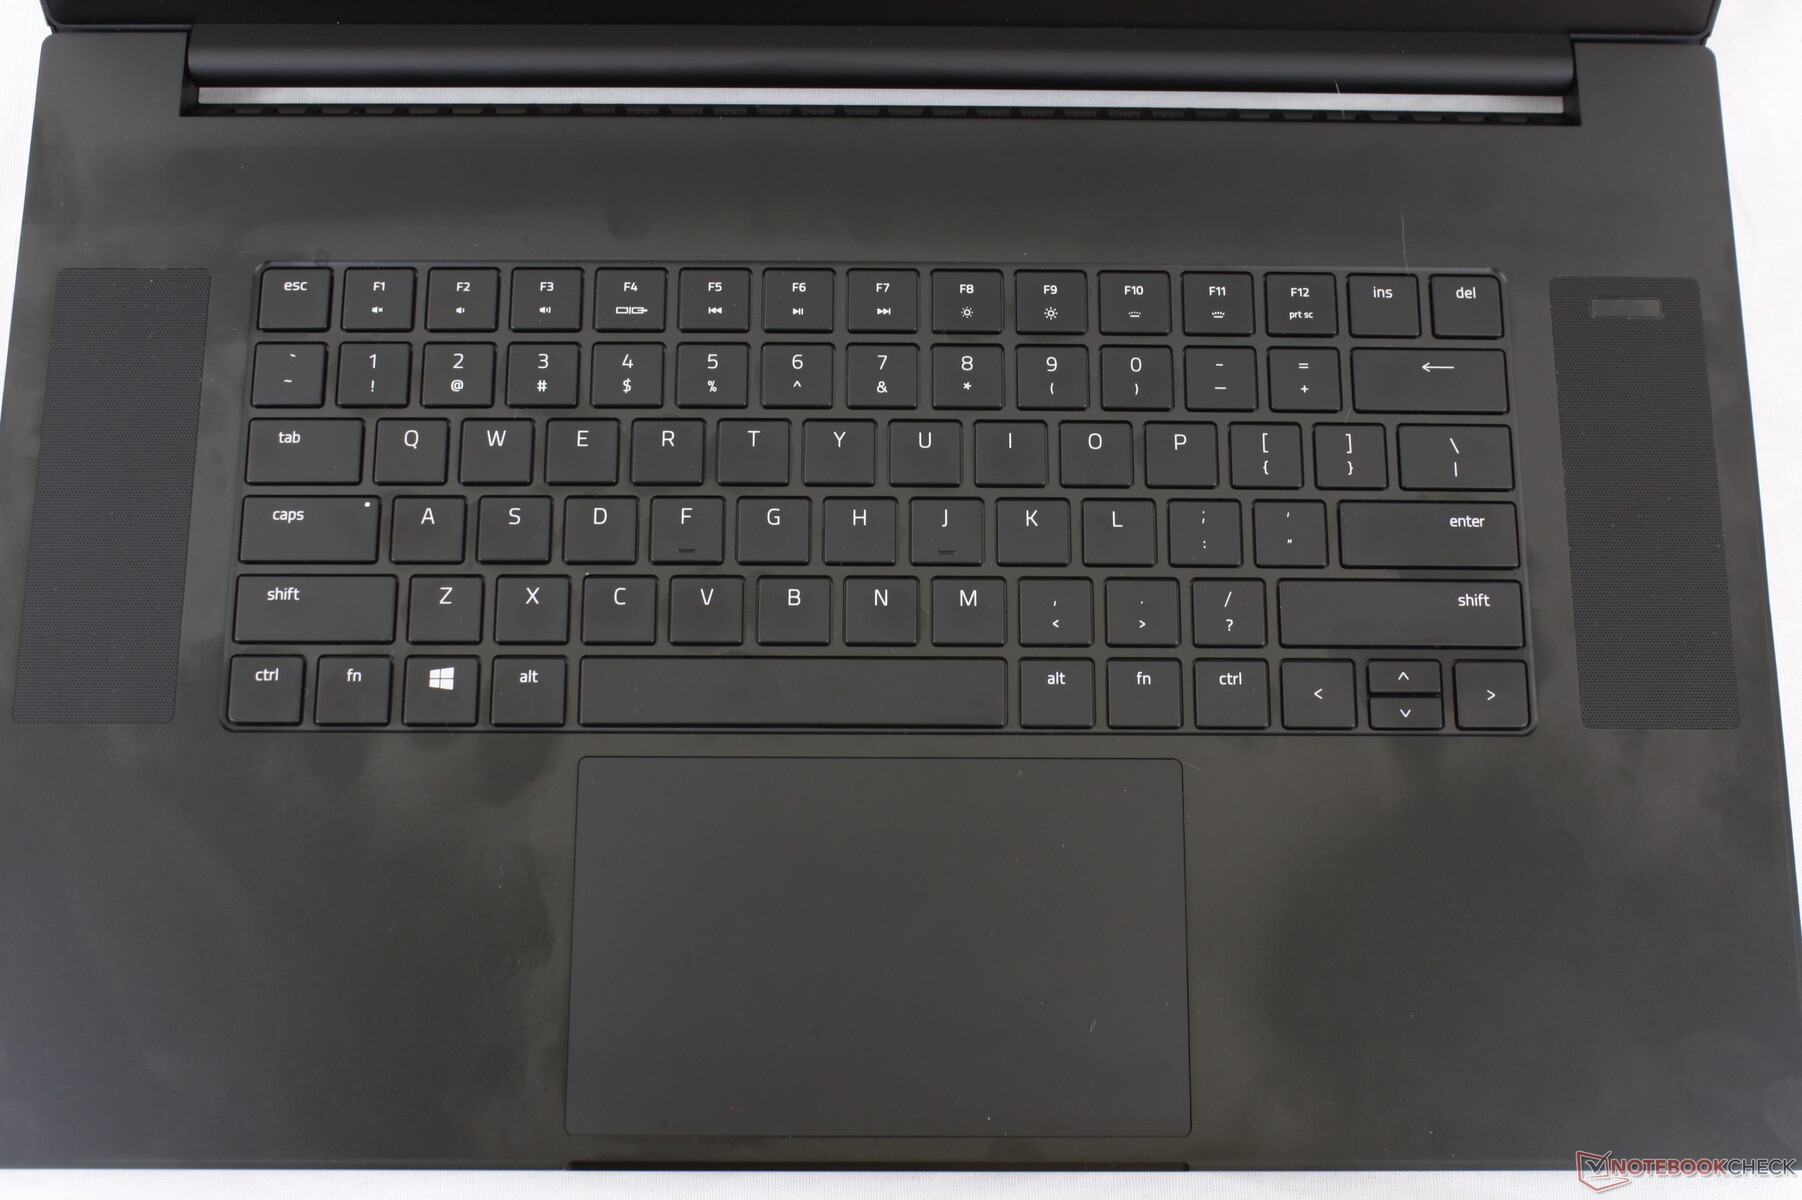
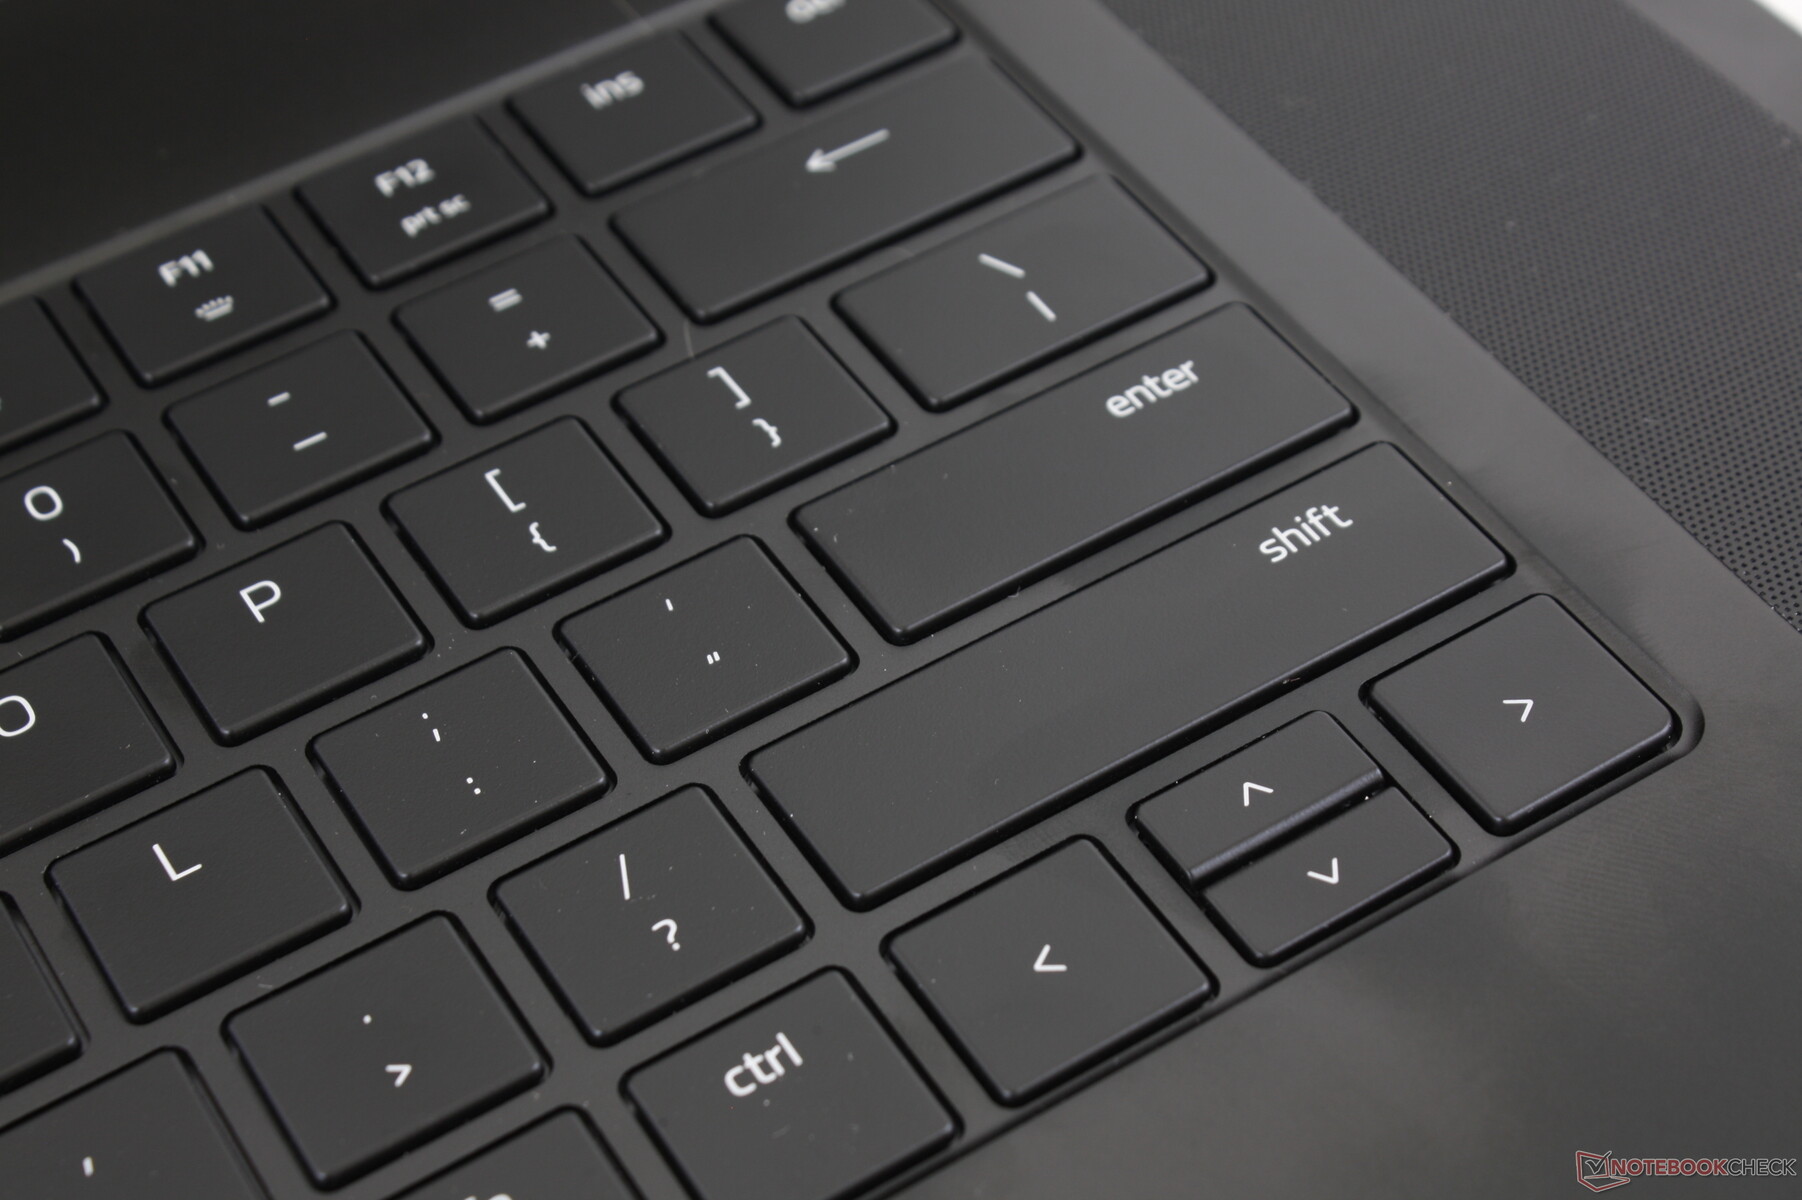
Razer recently refreshed their 17.3-inch Blade Pro 17 series for 2020 with 10th gen Core i7 processors, optional GeForce Super Max-Q GPUs, more display options, and a longer Shift key. Our unit here is the least expensive configuration of the latest model that's notable for its 300 Hz display as opposed to "only" 240 Hz on last year's model.
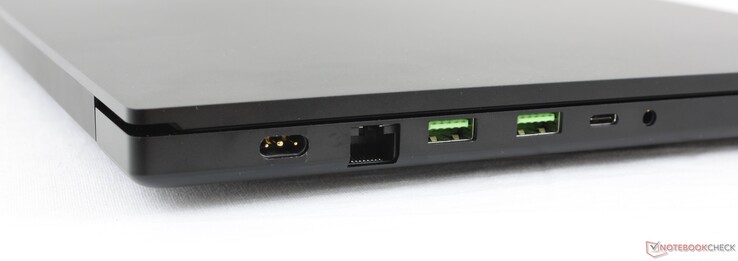
Other than the processor, display, and slight keyboard differences, the 2020 Blade Pro 17 shares essentially the same features and design as the 2019 Blade Pro 17. Thus, we recommend checking out our existing review on the 2019 model to learn more about the chassis, ports, and other physical features of the laptop.
Direct competitors to the Blade Pro 17 include other high-end ultra-thin 17.3-inch gaming laptops like the MSI GS75, Asus Zephyrus S GX701, Dell Alienware m17 R2, or the Eluktronics RP-17.
More Razer reviews:
Rating | Date | Model | Weight | Height | Size | Resolution | Price |
|---|---|---|---|---|---|---|---|
| 87.4 % v7 (old) | 06 / 2020 | Razer Blade Pro 17 RTX 2070 Max-Q 300 Hz i7-10875H, GeForce RTX 2070 Max-Q | 2.7 kg | 19.9 mm | 17.30" | 1920x1080 | |
| 81.2 % v7 (old) | 12 / 2019 | Asus ROG Zephyrus S GX701GXR i7-9750H, GeForce RTX 2080 Max-Q | 2.7 kg | 18.7 mm | 17.30" | 1920x1080 | |
| 82.9 % v7 (old) | 06 / 2019 | MSI GS75 Stealth 9SG i7-9750H, GeForce RTX 2080 Max-Q | 2.3 kg | 18.9 mm | 17.30" | 1920x1080 | |
| 84.2 % v7 (old) | 02 / 2020 | Alienware m17 R2 P41E i9-9980HK, GeForce RTX 2080 Max-Q | 2.6 kg | 20.5 mm | 17.30" | 1920x1080 | |
| 86.5 % v7 (old) | 05 / 2020 | Aorus 17G XB i7-10875H, GeForce RTX 2070 Super Max-Q | 2.7 kg | 26 mm | 17.30" | 1920x1080 |
Case
SD Card Reader
| SD Card Reader | |
| average JPG Copy Test (av. of 3 runs) | |
| Aorus 17G XB (Toshiba Exceria Pro SDXC 64 GB UHS-II) | |
| Razer Blade Pro 17 RTX 2070 Max-Q 300 Hz (Toshiba Exceria Pro SDXC 64 GB UHS-II) | |
| Dell XPS 15 9500 Core i7 4K UHD (Toshiba Exceria Pro SDXC 64 GB UHS-II) | |
| Razer Blade Pro 17 4K UHD 120 Hz (Toshiba Exceria Pro SDXC 64 GB UHS-II) | |
| MSI GS63VR 7RG-005 (Toshiba Exceria Pro SDXC 64 GB UHS-II) | |
| maximum AS SSD Seq Read Test (1GB) | |
| Aorus 17G XB (Toshiba Exceria Pro SDXC 64 GB UHS-II) | |
| Razer Blade Pro 17 RTX 2070 Max-Q 300 Hz (Toshiba Exceria Pro SDXC 64 GB UHS-II) | |
| MSI GS63VR 7RG-005 (Toshiba Exceria Pro SDXC 64 GB UHS-II) | |
| Razer Blade Pro 17 4K UHD 120 Hz (Toshiba Exceria Pro SDXC 64 GB UHS-II) | |
| Dell XPS 15 9500 Core i7 4K UHD (Toshiba Exceria Pro SDXC 64 GB UHS-II) | |
Communication
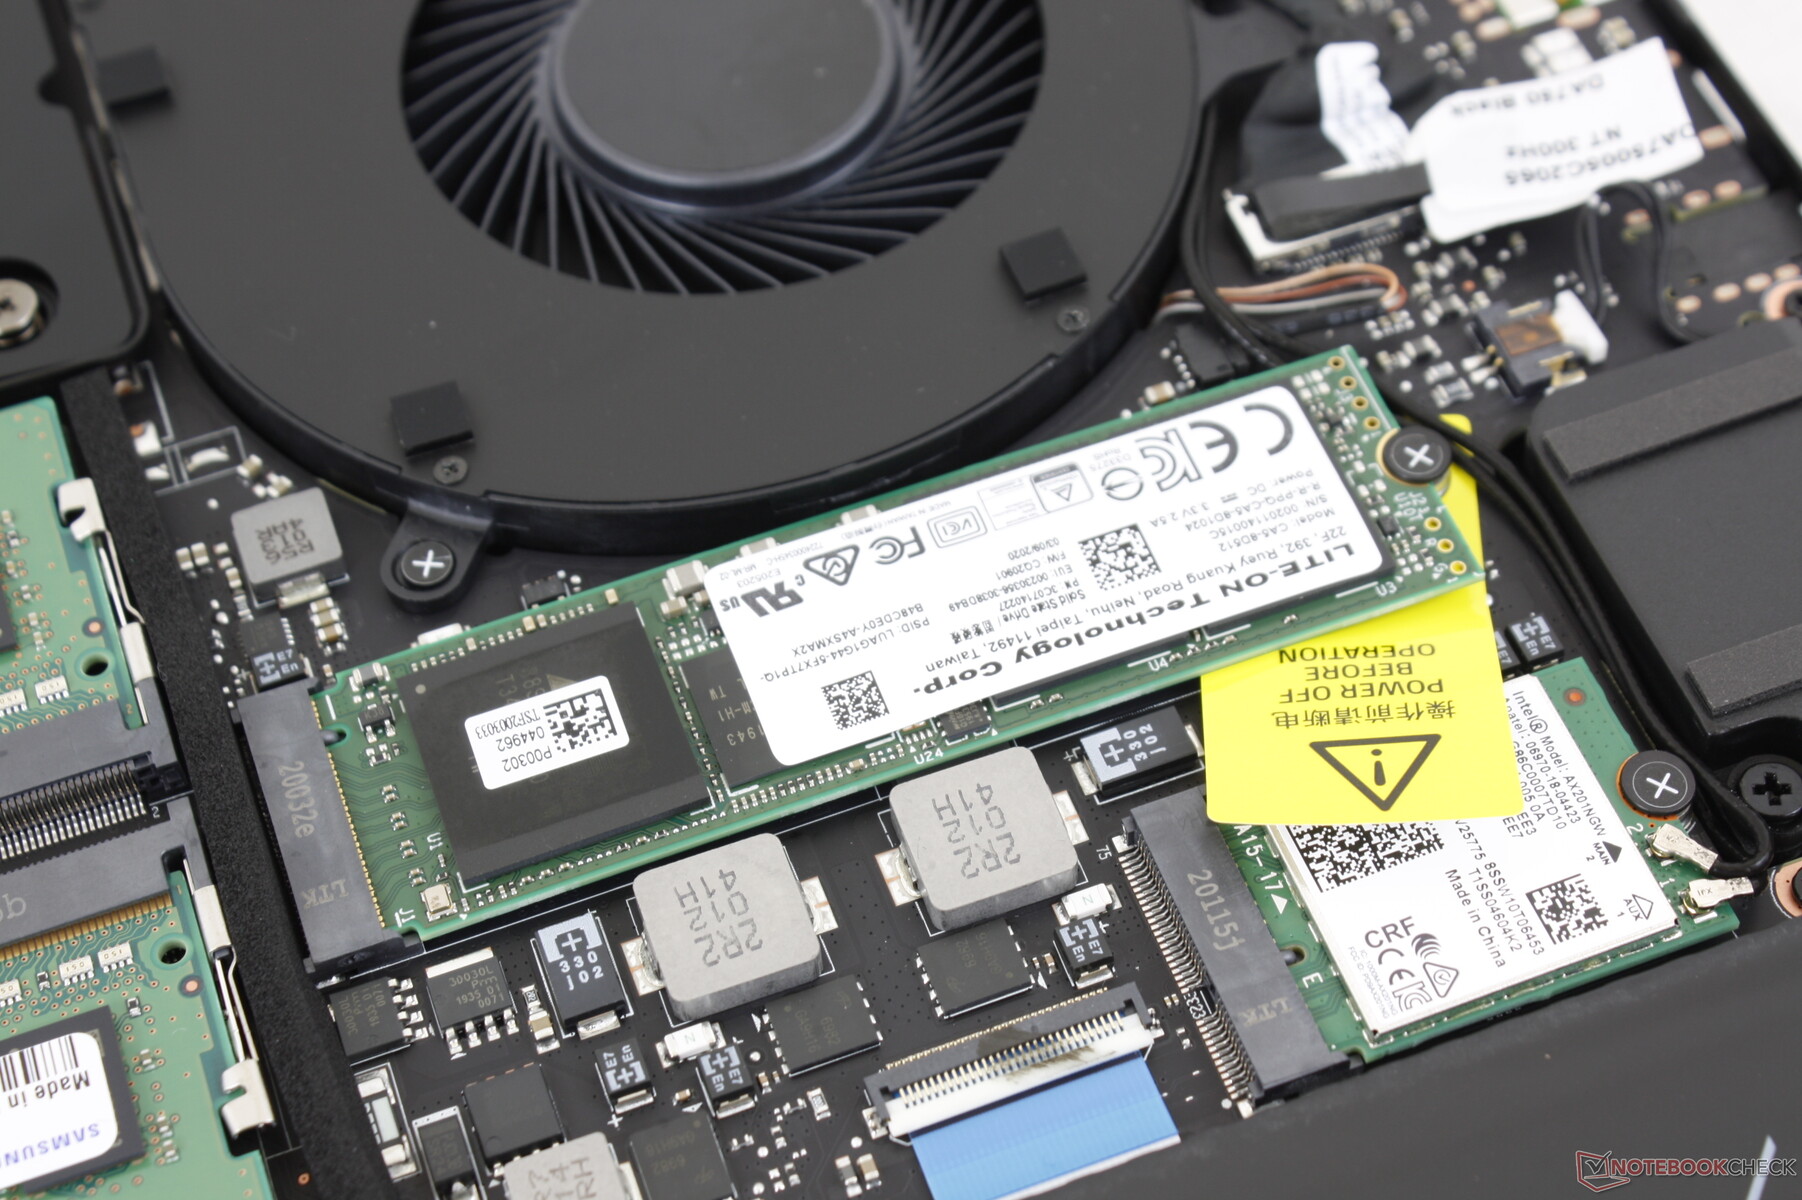
The Intel AX201 comes standard for Bluetooth 5.1 and Wi-Fi 6 connectivity. We experienced no issues when connected to our Netgear RAX200 test router.
Webcam


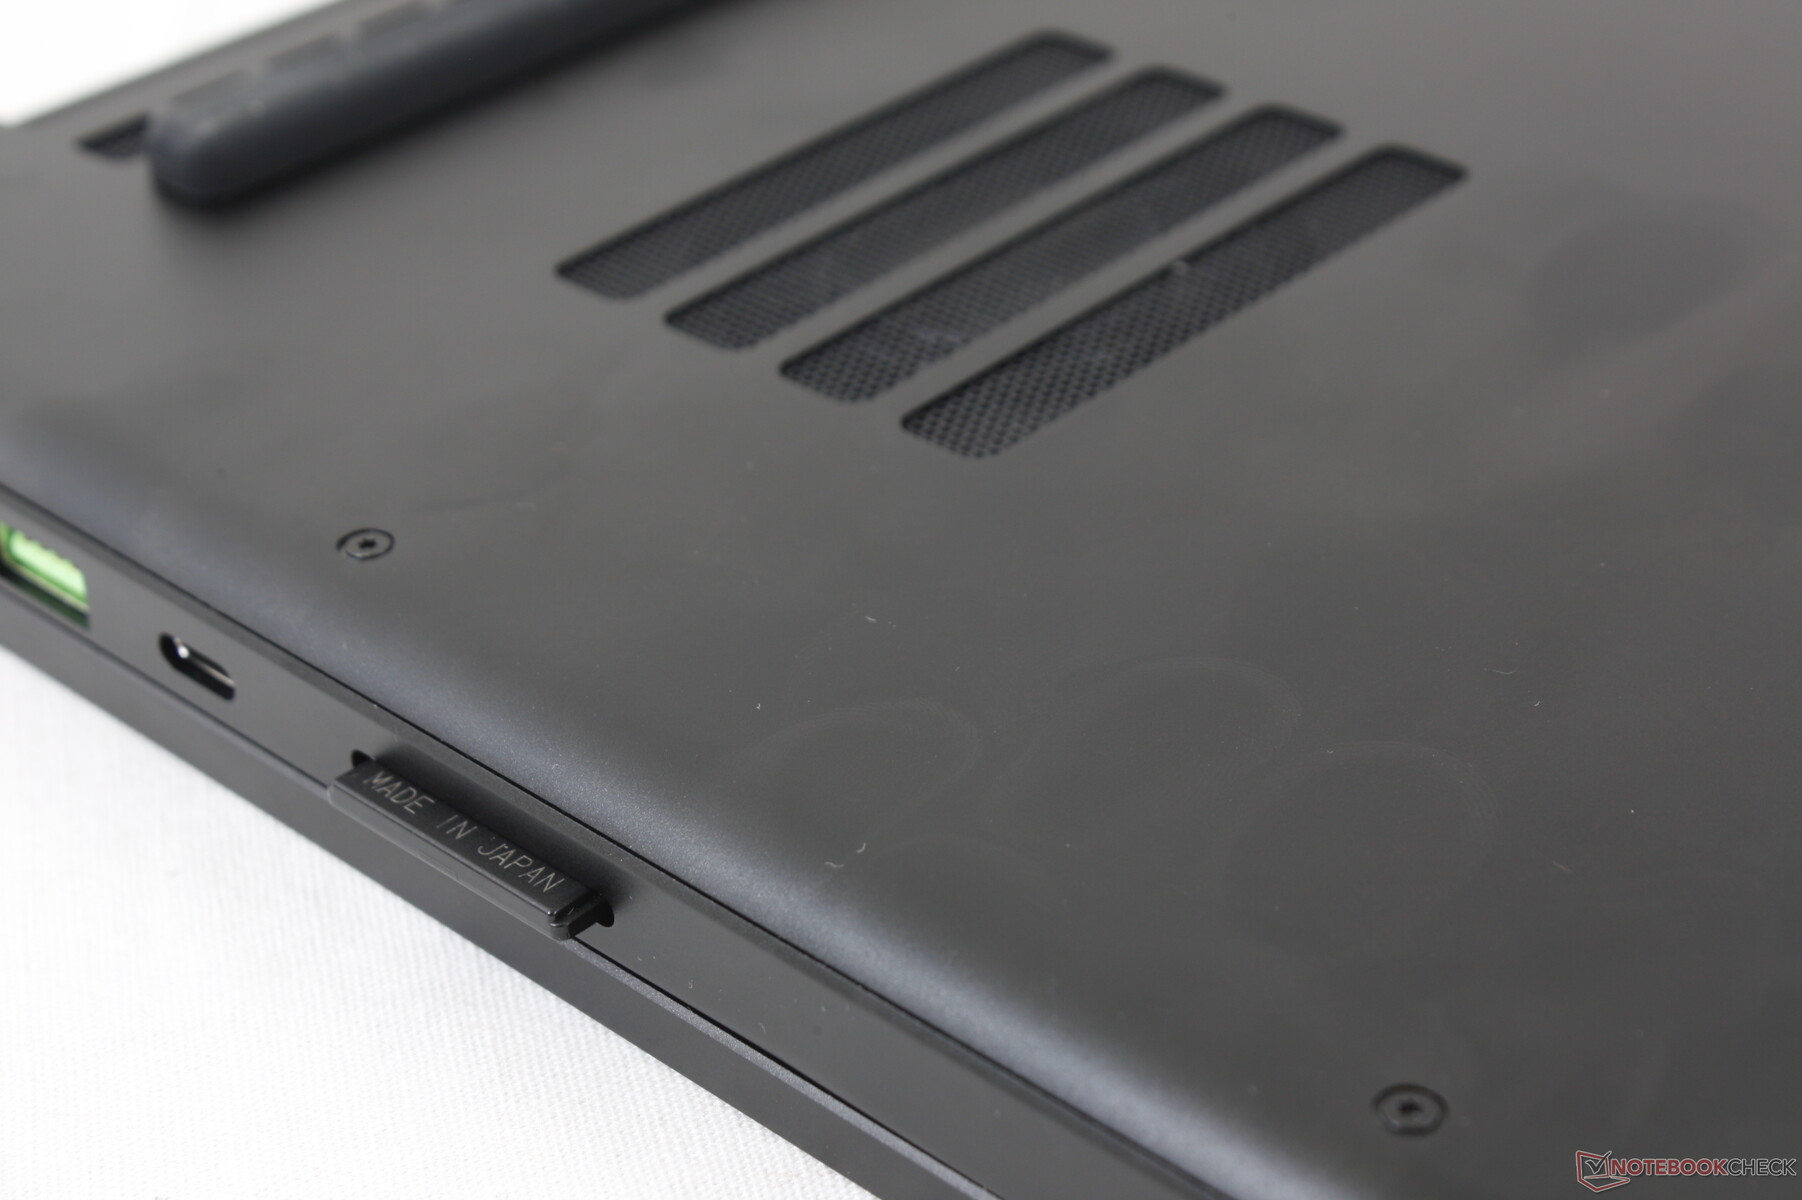
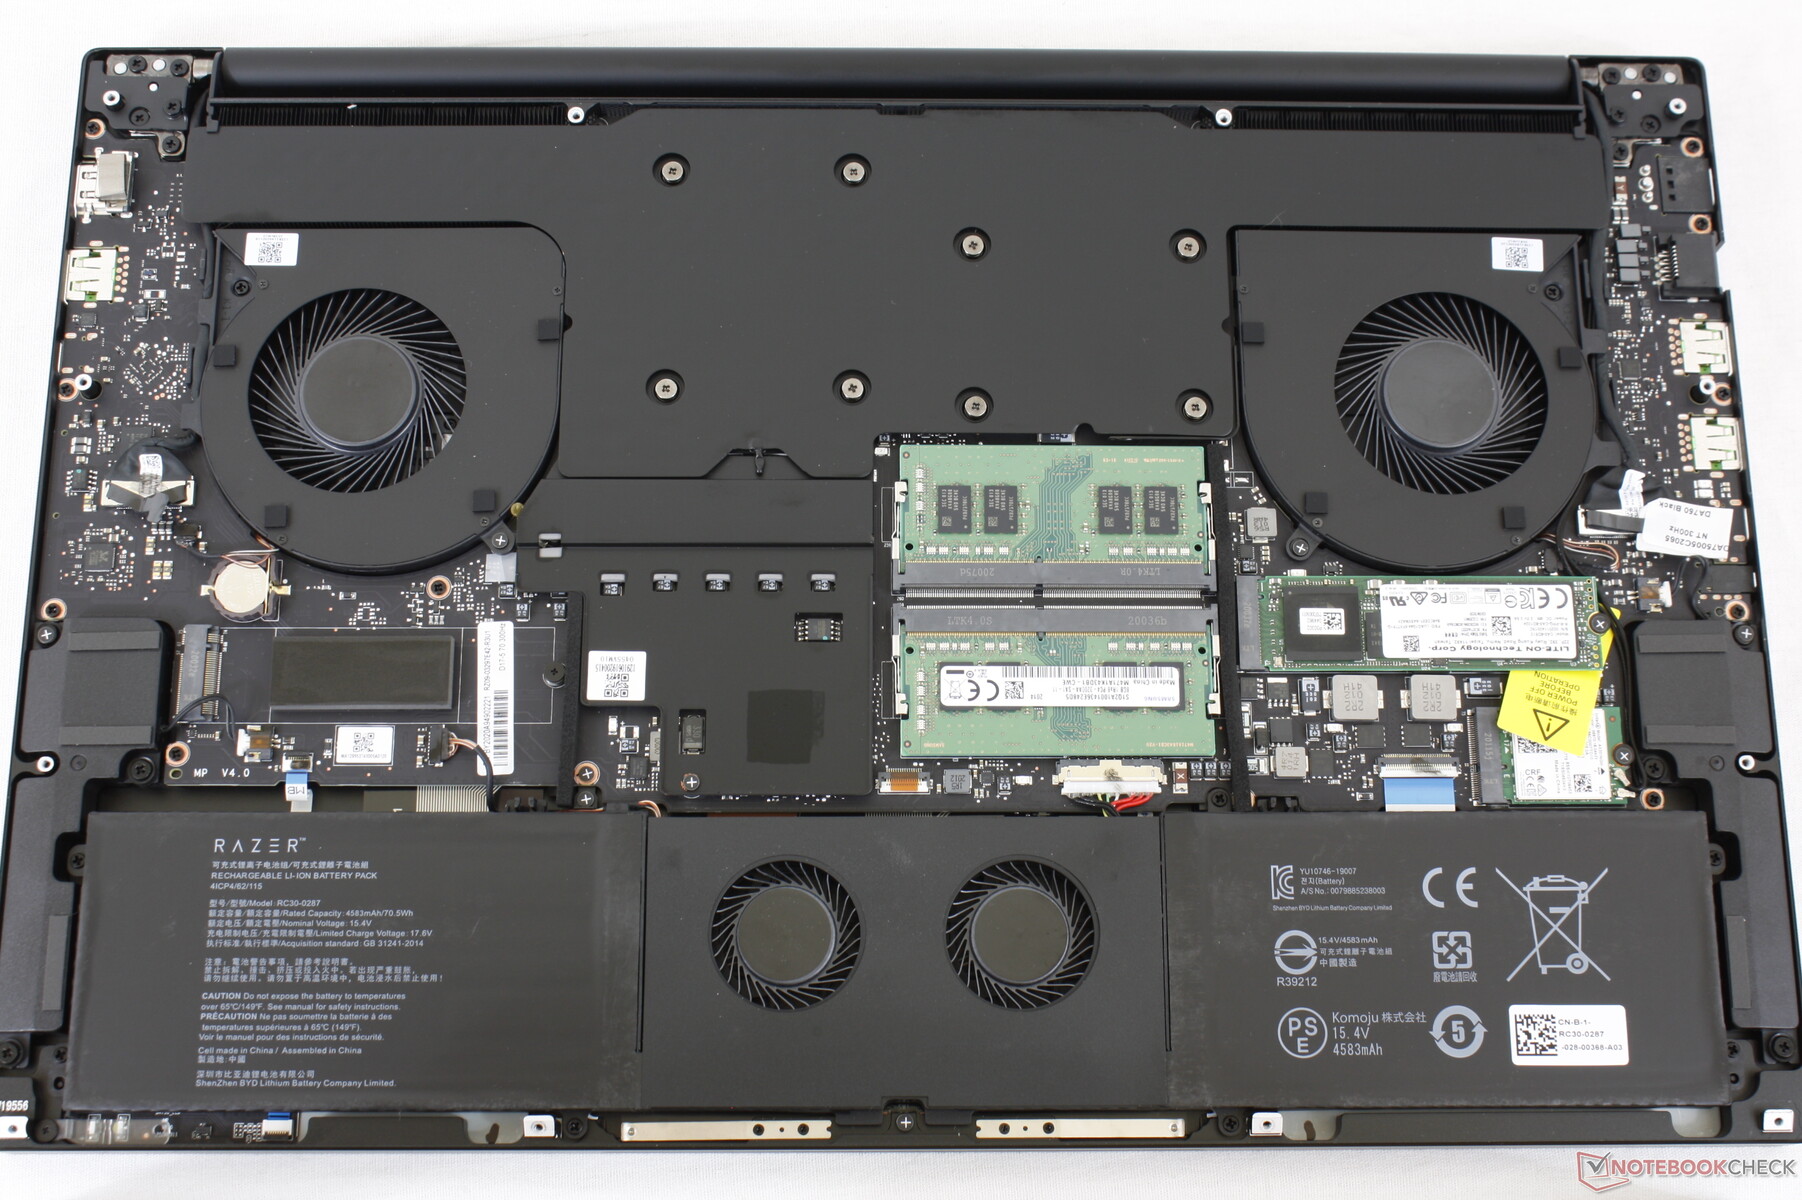
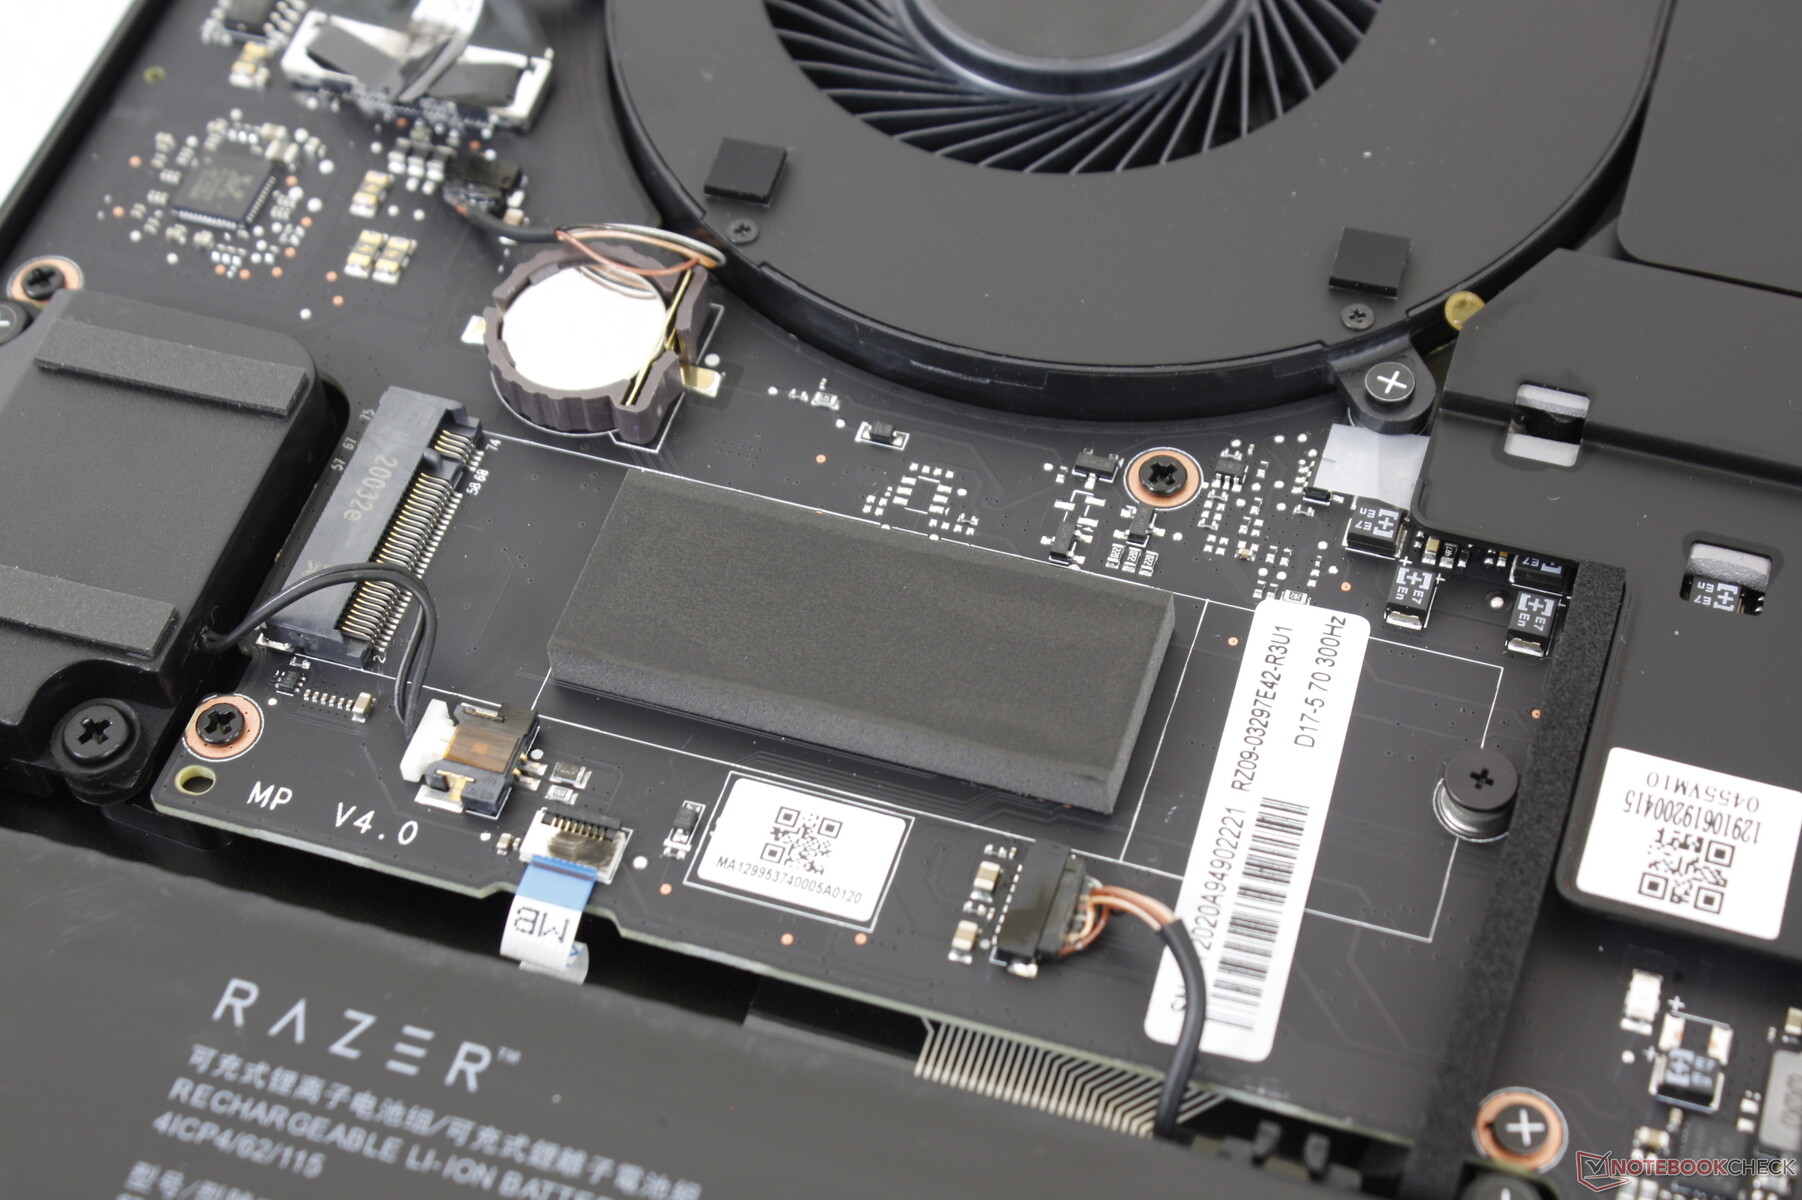
Maintenance
Input Devices
Display
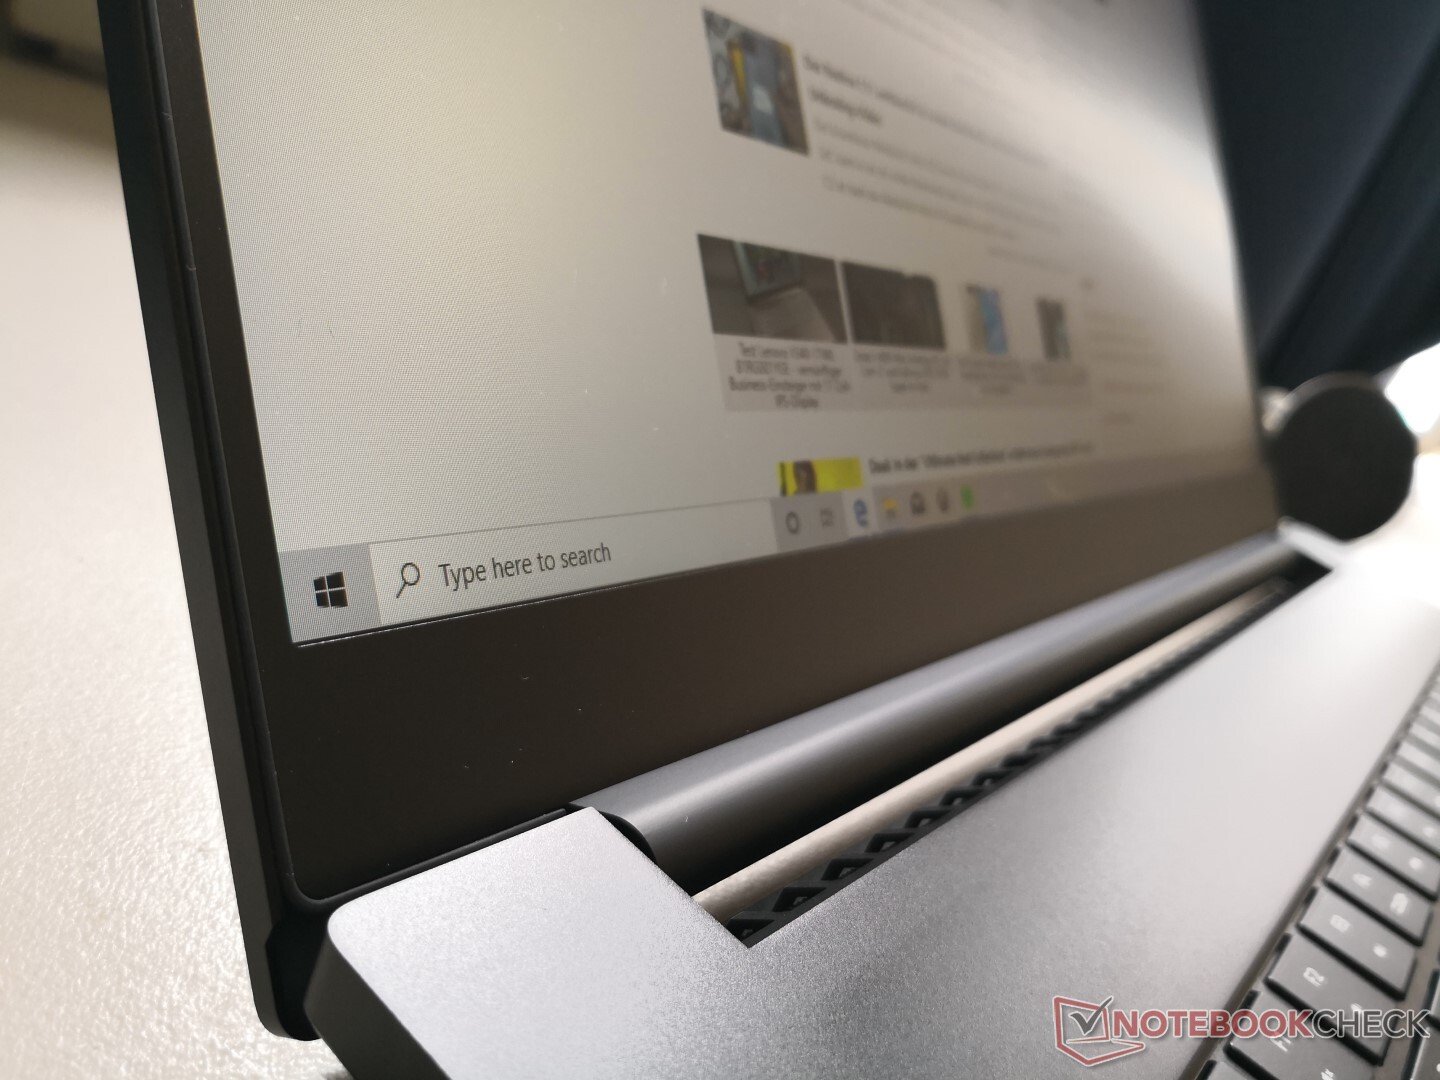
The new 1080p 300 Hz display is a distinguishing factor separating the 2020 Blade Pro 17 from earlier versions. The laptop is the first in our database to come with the Sharp LQ173M1JW02 IPS panel compared to "only" 240 Hz on the Blade 15 or Gigabyte Aero 17. Users who prefer last year's 4K UHD 120 Hz panel instead still have that option on the 2020 series.
The 1080p300 panel has some advantages and disadvantages when compared to the aforementioned glossy 4K120 panel other than the obvious resolution and refresh rate differences. Though brightness is almost the same between them, the 4K panel offers a slightly higher contrast ratio with much wider color coverage for deeper and more accurate colors than our 300 Hz panel. In turn, the 300 Hz panel has faster black-white and gray-gray response times to limit ghosting.
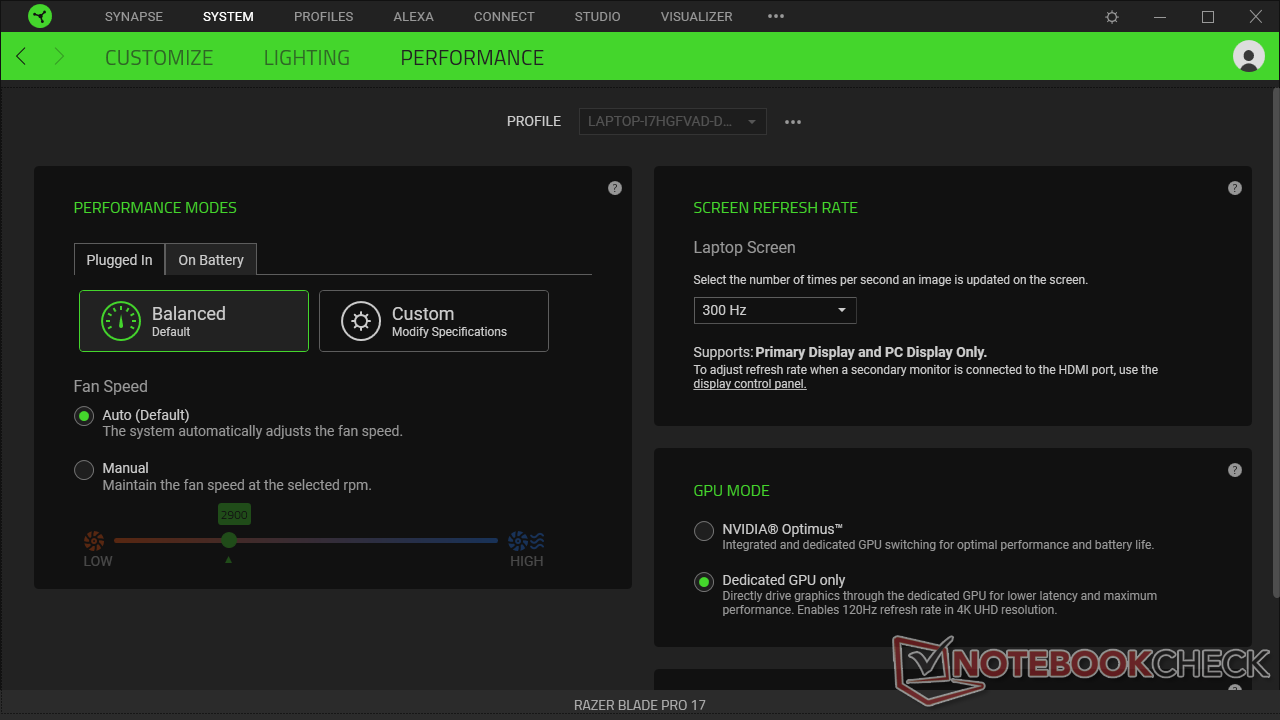
Users can quickly switch between 60 Hz, 240 Hz, or 300 Hz refresh rates via Razer Synapse. Needless to say, the 300 Hz refresh rate feels silky smooth even though the visual experience doesn't feel all that much better than 240 Hz during day-to-day workloads.

| |||||||||||||||||||||||||
Brightness Distribution: 78 %
Center on Battery: 328 cd/m²
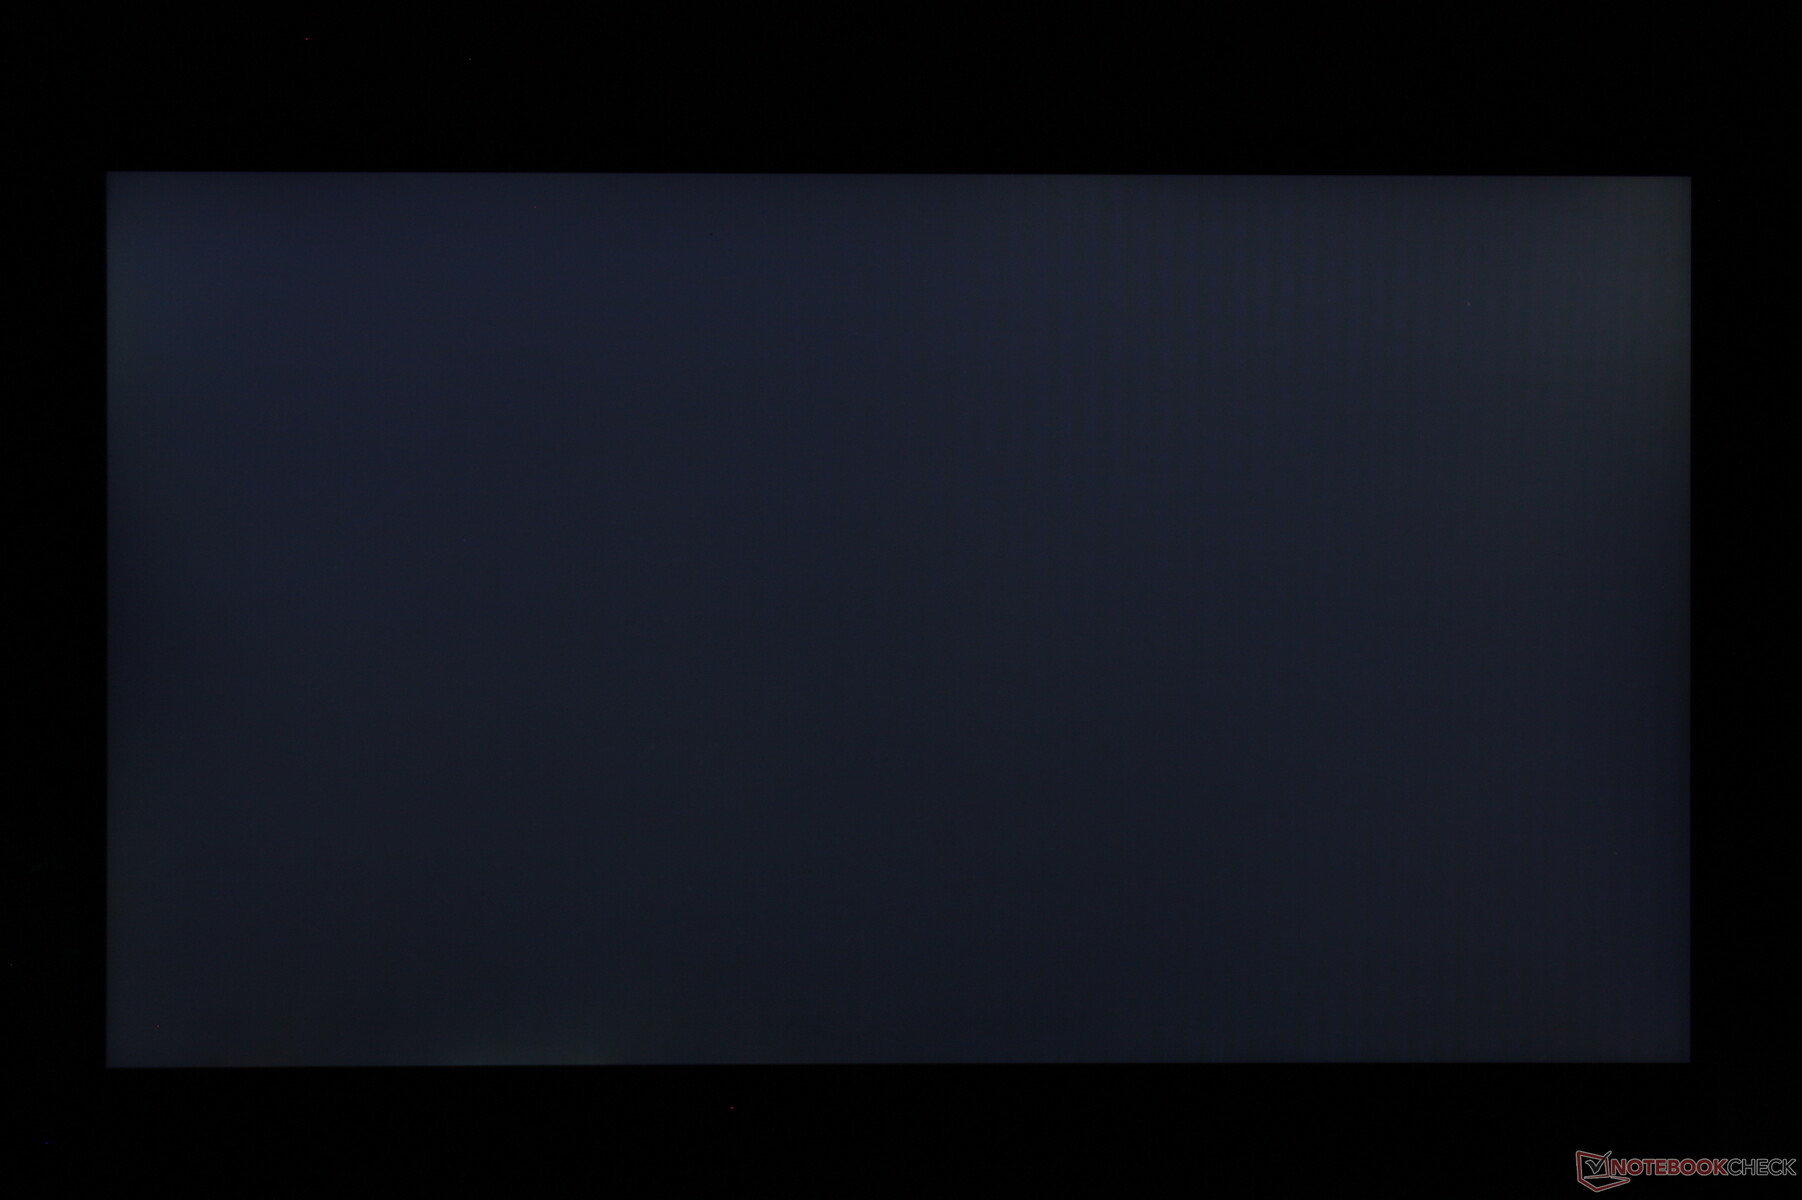
Contrast: 937:1 (Black: 0.35 cd/m²)
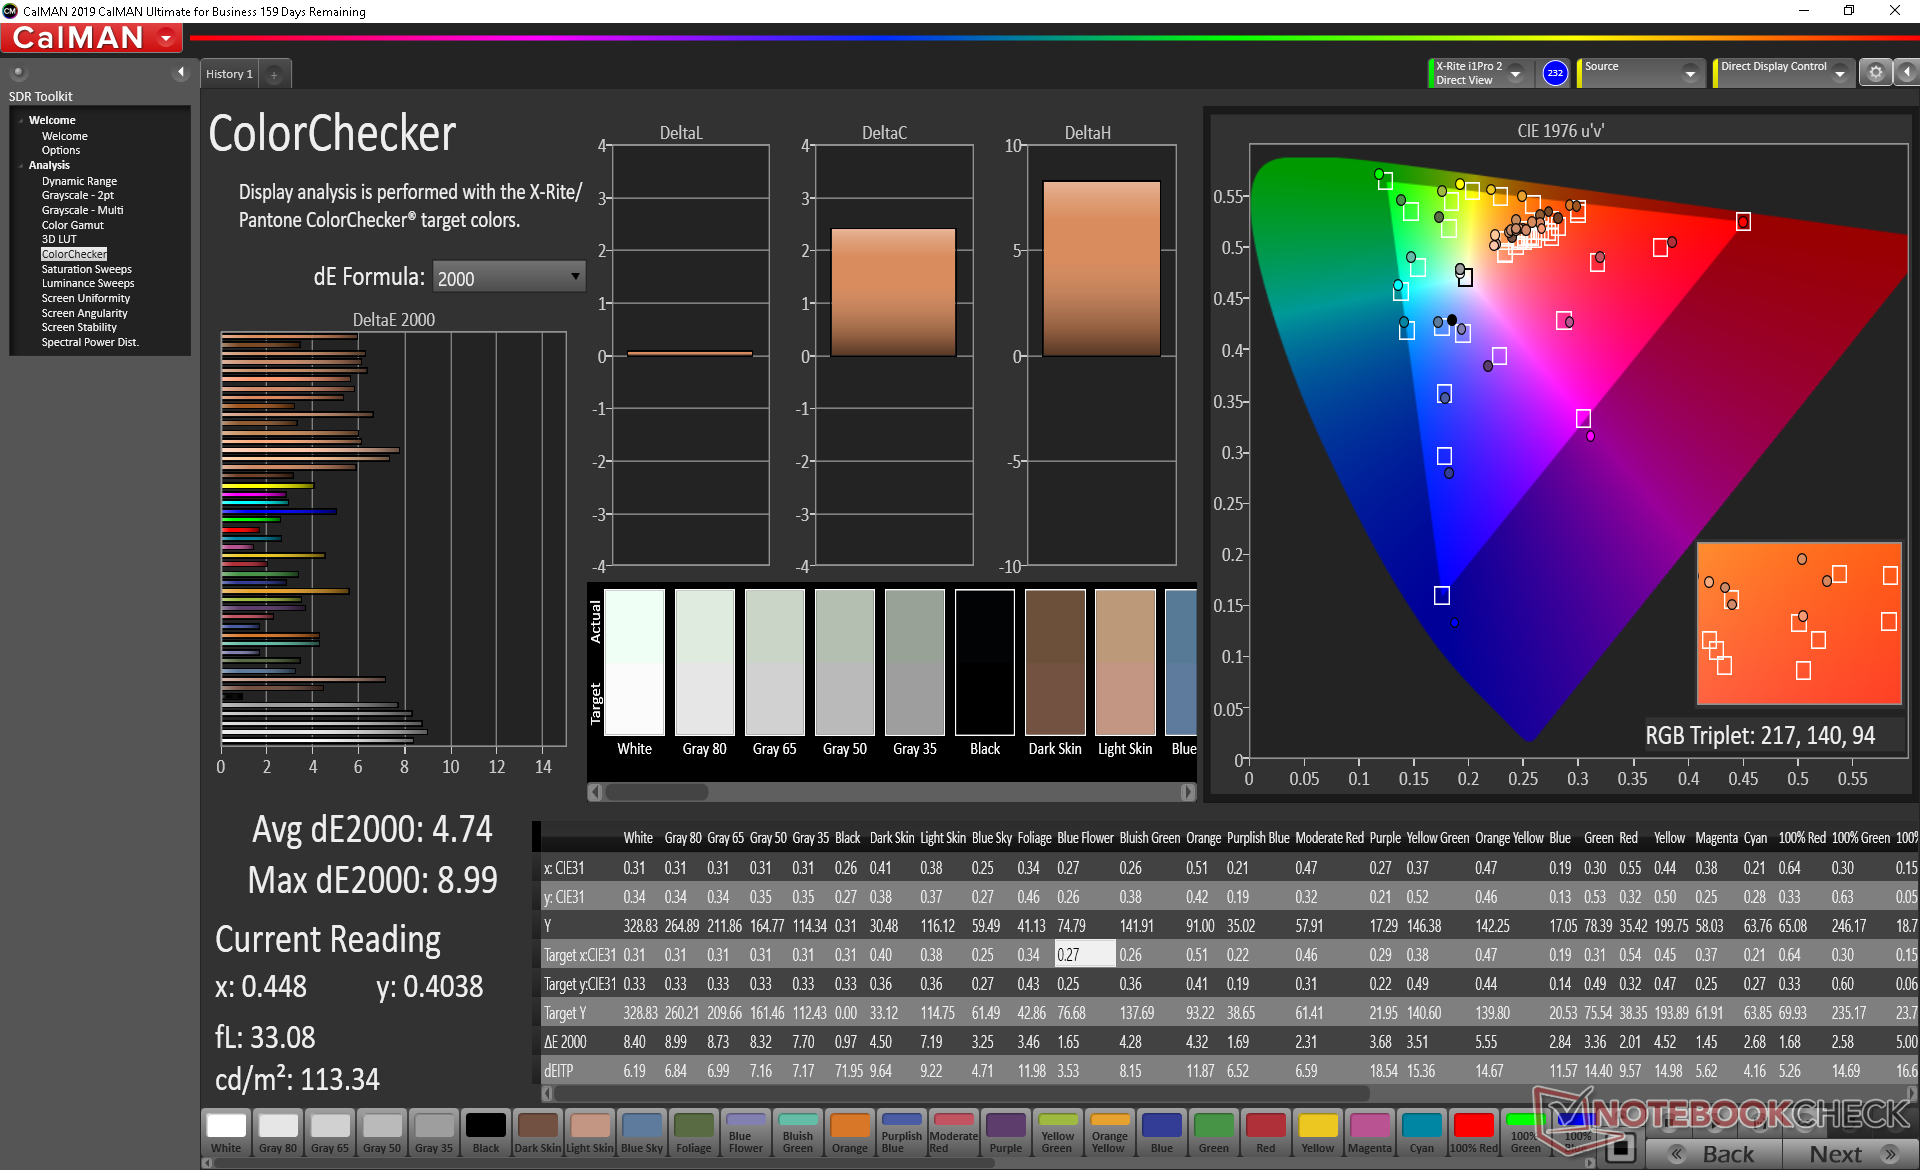
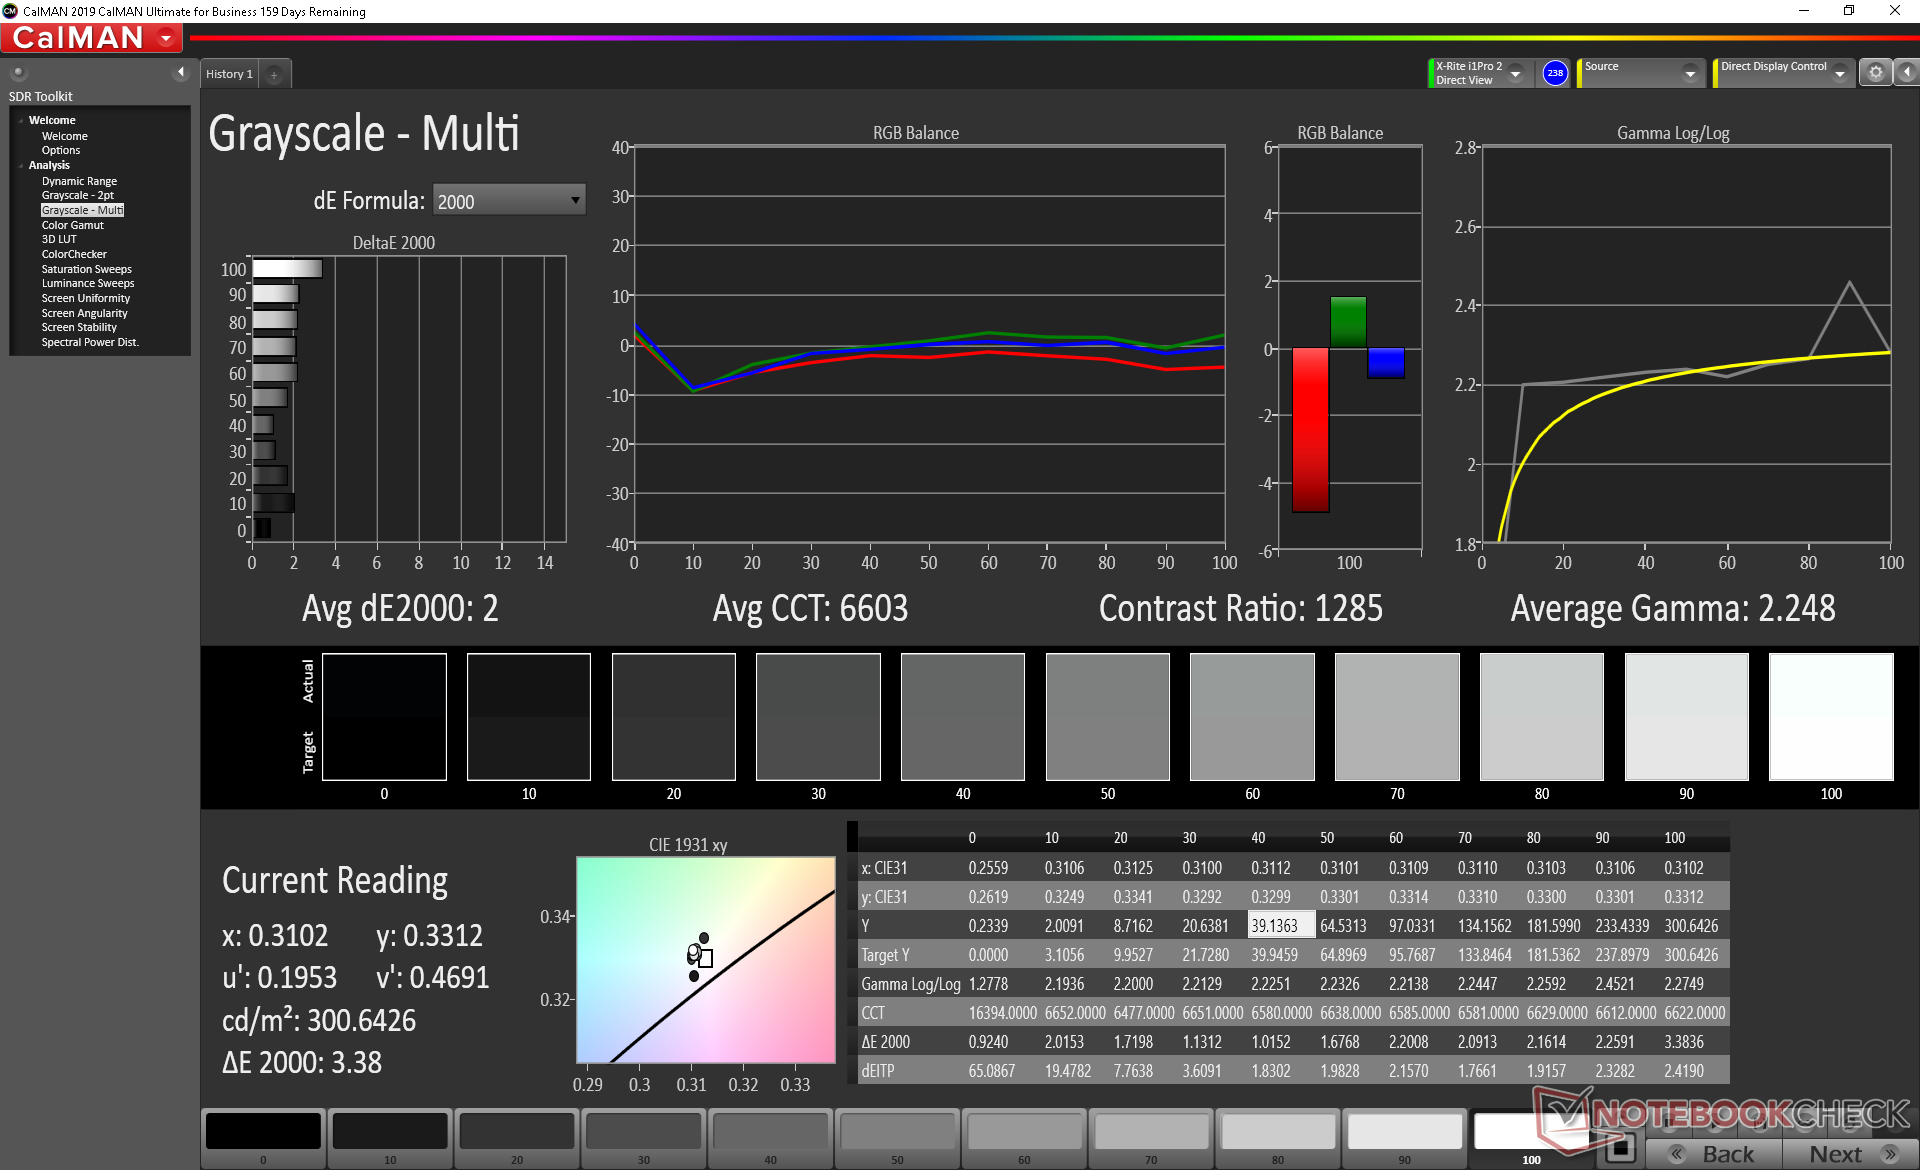
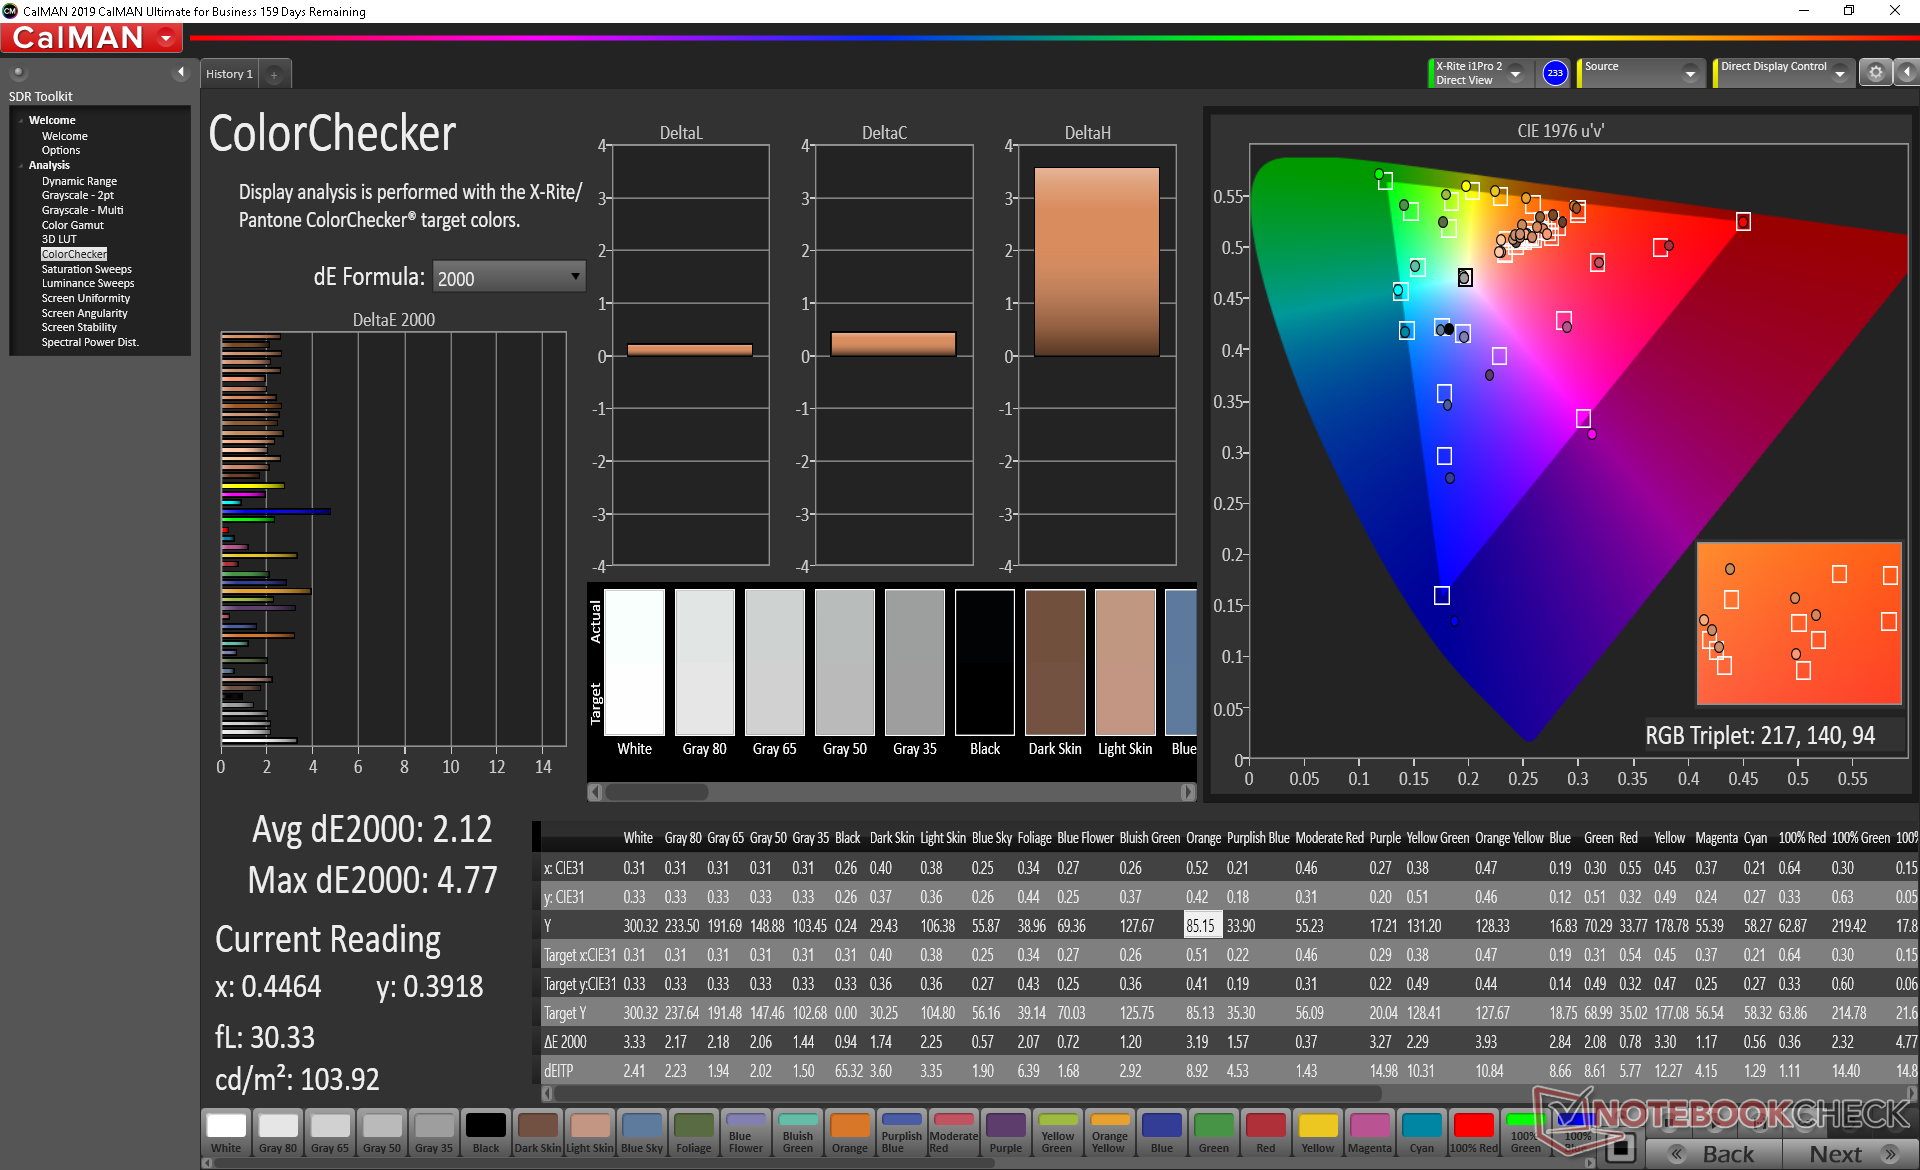
ΔE ColorChecker Calman: 4.74 | ∀{0.5-29.43 Ø4.76}
calibrated: 2.12
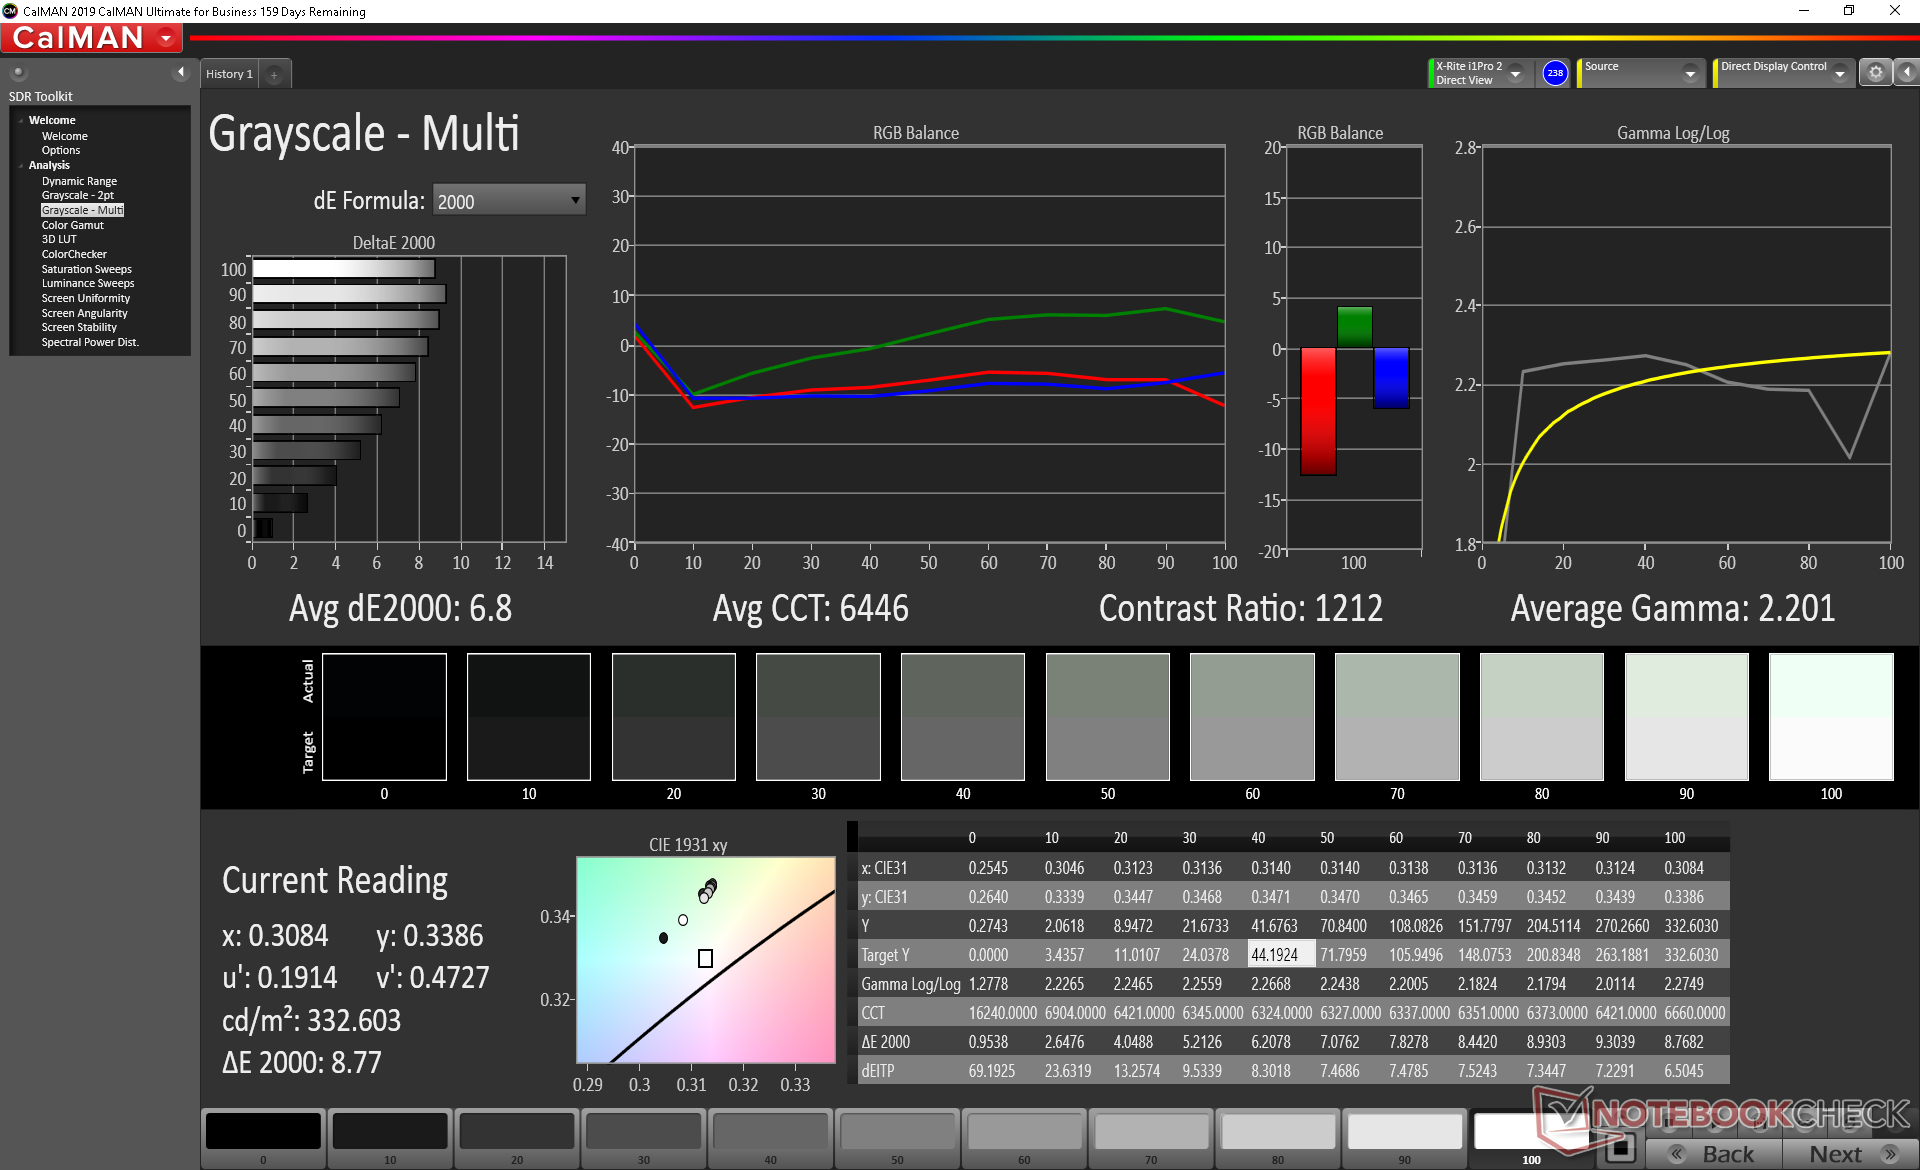
ΔE Greyscale Calman: 6.8 | ∀{0.09-98 Ø5}
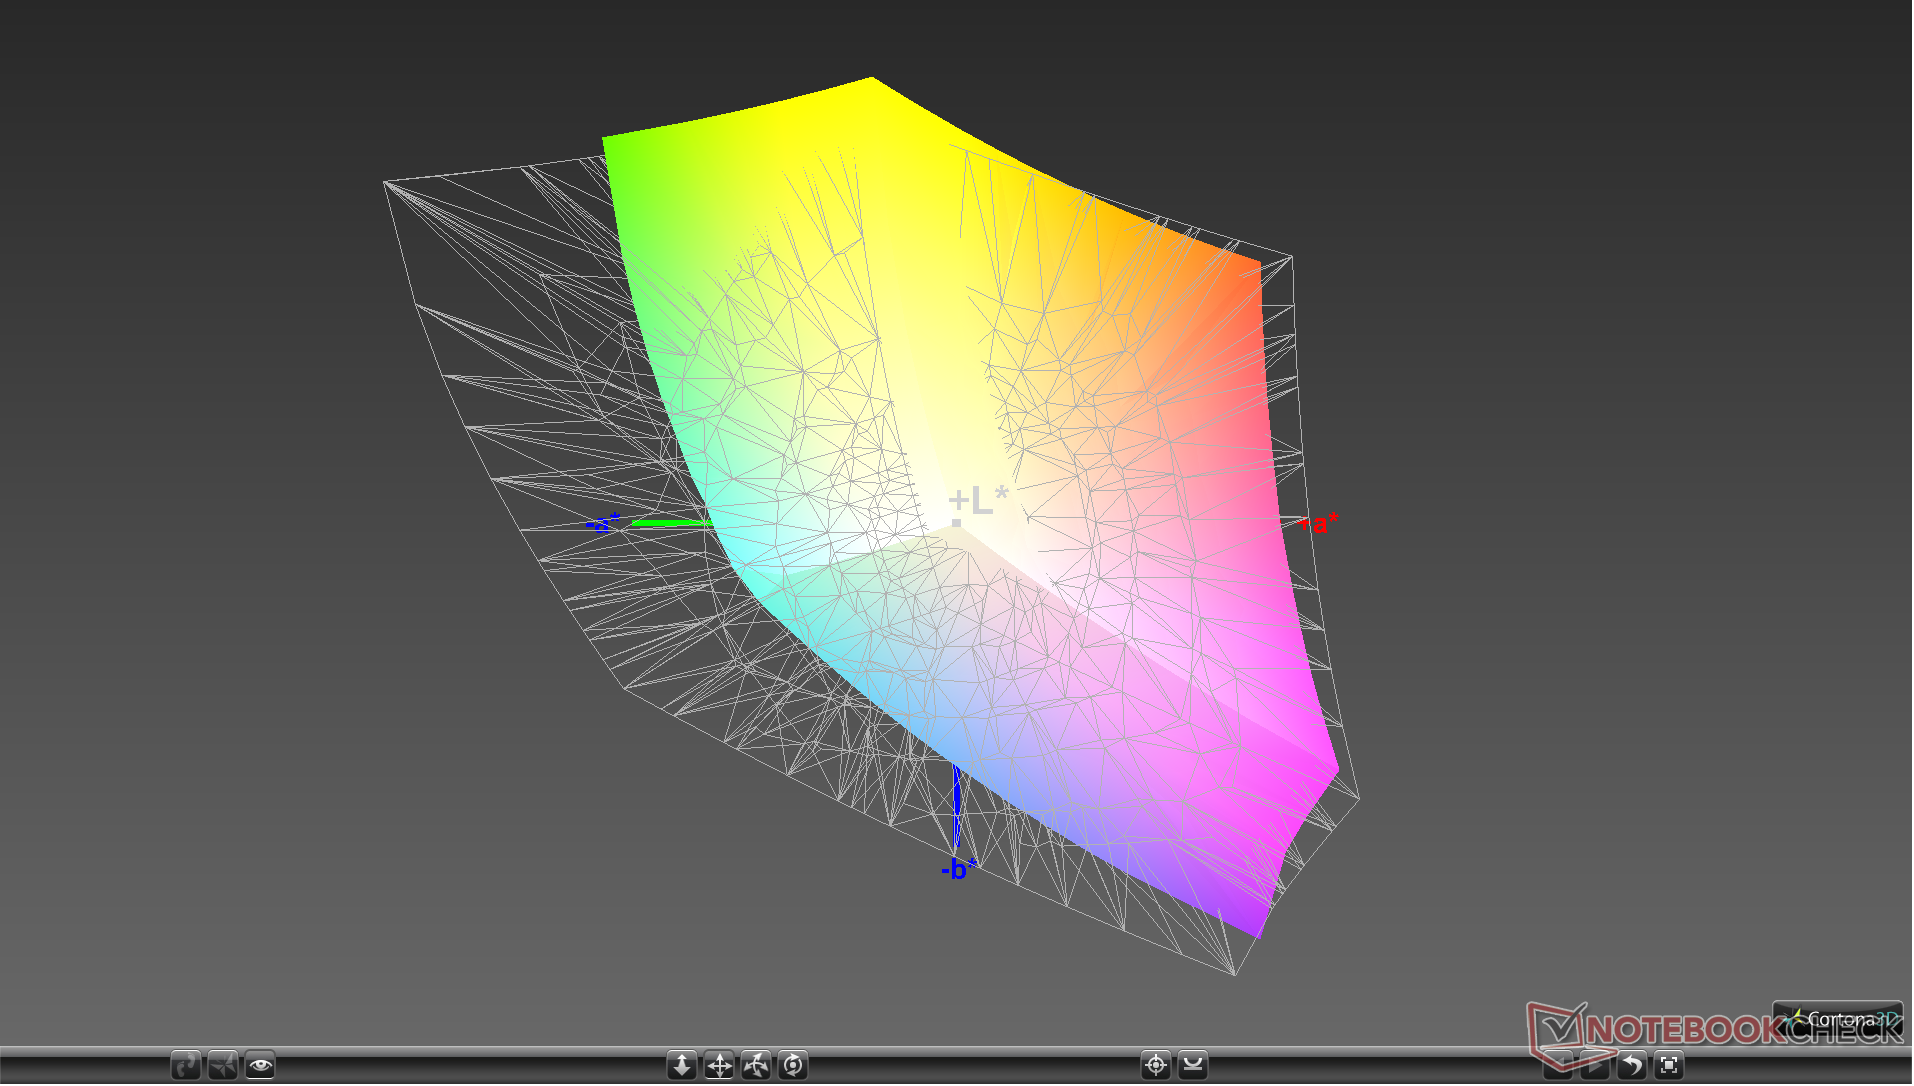
98.6% sRGB (Argyll 1.6.3 3D)
64.8% AdobeRGB 1998 (Argyll 1.6.3 3D)
73% AdobeRGB 1998 (Argyll 3D)
98.5% sRGB (Argyll 3D)
72.2% Display P3 (Argyll 3D)
Gamma: 2.2
CCT: 6446 K
| Razer Blade Pro 17 RTX 2070 Max-Q 300 Hz Sharp LQ173M1JW02, IPS, 17.3", 1920x1080 | Asus ROG Zephyrus S GX701GXR AU Optronics B173HAN05.1, IPS, 17.3", 1920x1080 | MSI GS75 Stealth 9SG Chi Mei N173HCE-G33 (CMN175C), IPS, 17.3", 1920x1080 | Alienware m17 R2 P41E Chi Mei 173HCE, CMN175F, IPS, 17.3", 1920x1080 | Aorus 17G XB AU Optronics B173HAN05.0 (AUO509D), IPS, 17.3", 1920x1080 | Razer Blade Pro 17 4K UHD 120 Hz AU Optronics B173ZAN03.3, IPS, 17.3", 3840x2160 | |
|---|---|---|---|---|---|---|
| Display | -2% | -10% | -1% | -1% | 18% | |
| Display P3 Coverage (%) | 72.2 | 70 -3% | 62.6 -13% | 70.8 -2% | 70.6 -2% | 84.8 17% |
| sRGB Coverage (%) | 98.5 | 96.6 -2% | 93.5 -5% | 98.5 0% | 97.2 -1% | 99.9 1% |
| AdobeRGB 1998 Coverage (%) | 73 | 72.3 -1% | 64.7 -11% | 72.2 -1% | 72.8 0% | 98.6 35% |
| Response Times | 11% | -17% | -110% | -106% | -90% | |
| Response Time Grey 50% / Grey 80% * (ms) | 5.6 ? | 5.6 ? -0% | 7.2 ? -29% | 17.2 ? -207% | 16 ? -186% | 15.2 ? -171% |
| Response Time Black / White * (ms) | 9.6 ? | 7.6 ? 21% | 10 ? -4% | 10.8 ? -13% | 12 ? -25% | 10.4 ? -8% |
| PWM Frequency (Hz) | 25510 ? | 26320 ? | ||||
| Screen | 23% | 31% | 32% | 31% | 3% | |
| Brightness middle (cd/m²) | 328 | 288 -12% | 366 12% | 384.2 17% | 293 -11% | 346.7 6% |
| Brightness (cd/m²) | 329 | 276 -16% | 343 4% | 357 9% | 285 -13% | 332 1% |
| Brightness Distribution (%) | 78 | 93 19% | 91 17% | 90 15% | 95 22% | 91 17% |
| Black Level * (cd/m²) | 0.35 | 0.24 31% | 0.29 17% | 0.29 17% | 0.24 31% | 0.27 23% |
| Contrast (:1) | 937 | 1200 28% | 1262 35% | 1325 41% | 1221 30% | 1284 37% |
| Colorchecker dE 2000 * | 4.74 | 1.92 59% | 1.51 68% | 1.35 72% | 1.27 73% | 5.62 -19% |
| Colorchecker dE 2000 max. * | 8.99 | 4.57 49% | 3.22 64% | 3.45 62% | 2.24 75% | 9.36 -4% |
| Colorchecker dE 2000 calibrated * | 2.12 | 1.14 46% | 0.71 67% | 1.42 33% | 1.06 50% | 3.81 -80% |
| Greyscale dE 2000 * | 6.8 | 3.08 55% | 1.93 72% | 1.2 82% | 1.34 80% | 5.5 19% |
| Gamma | 2.2 100% | 2.42 91% | 2.38 92% | 2.23 99% | 2.38 92% | 2.25 98% |
| CCT | 6446 101% | 7055 92% | 6881 94% | 6580 99% | 6542 99% | 6175 105% |
| Color Space (Percent of AdobeRGB 1998) (%) | 64.8 | 65 0% | 60 -7% | 65.5 1% | 73 13% | 87.2 35% |
| Color Space (Percent of sRGB) (%) | 98.6 | 96 -3% | 94 -5% | 98.5 0% | 94 -5% | 100 1% |
| Total Average (Program / Settings) | 11% /
17% | 1% /
18% | -26% /
8% | -25% /
8% | -23% /
-6% |
* ... smaller is better
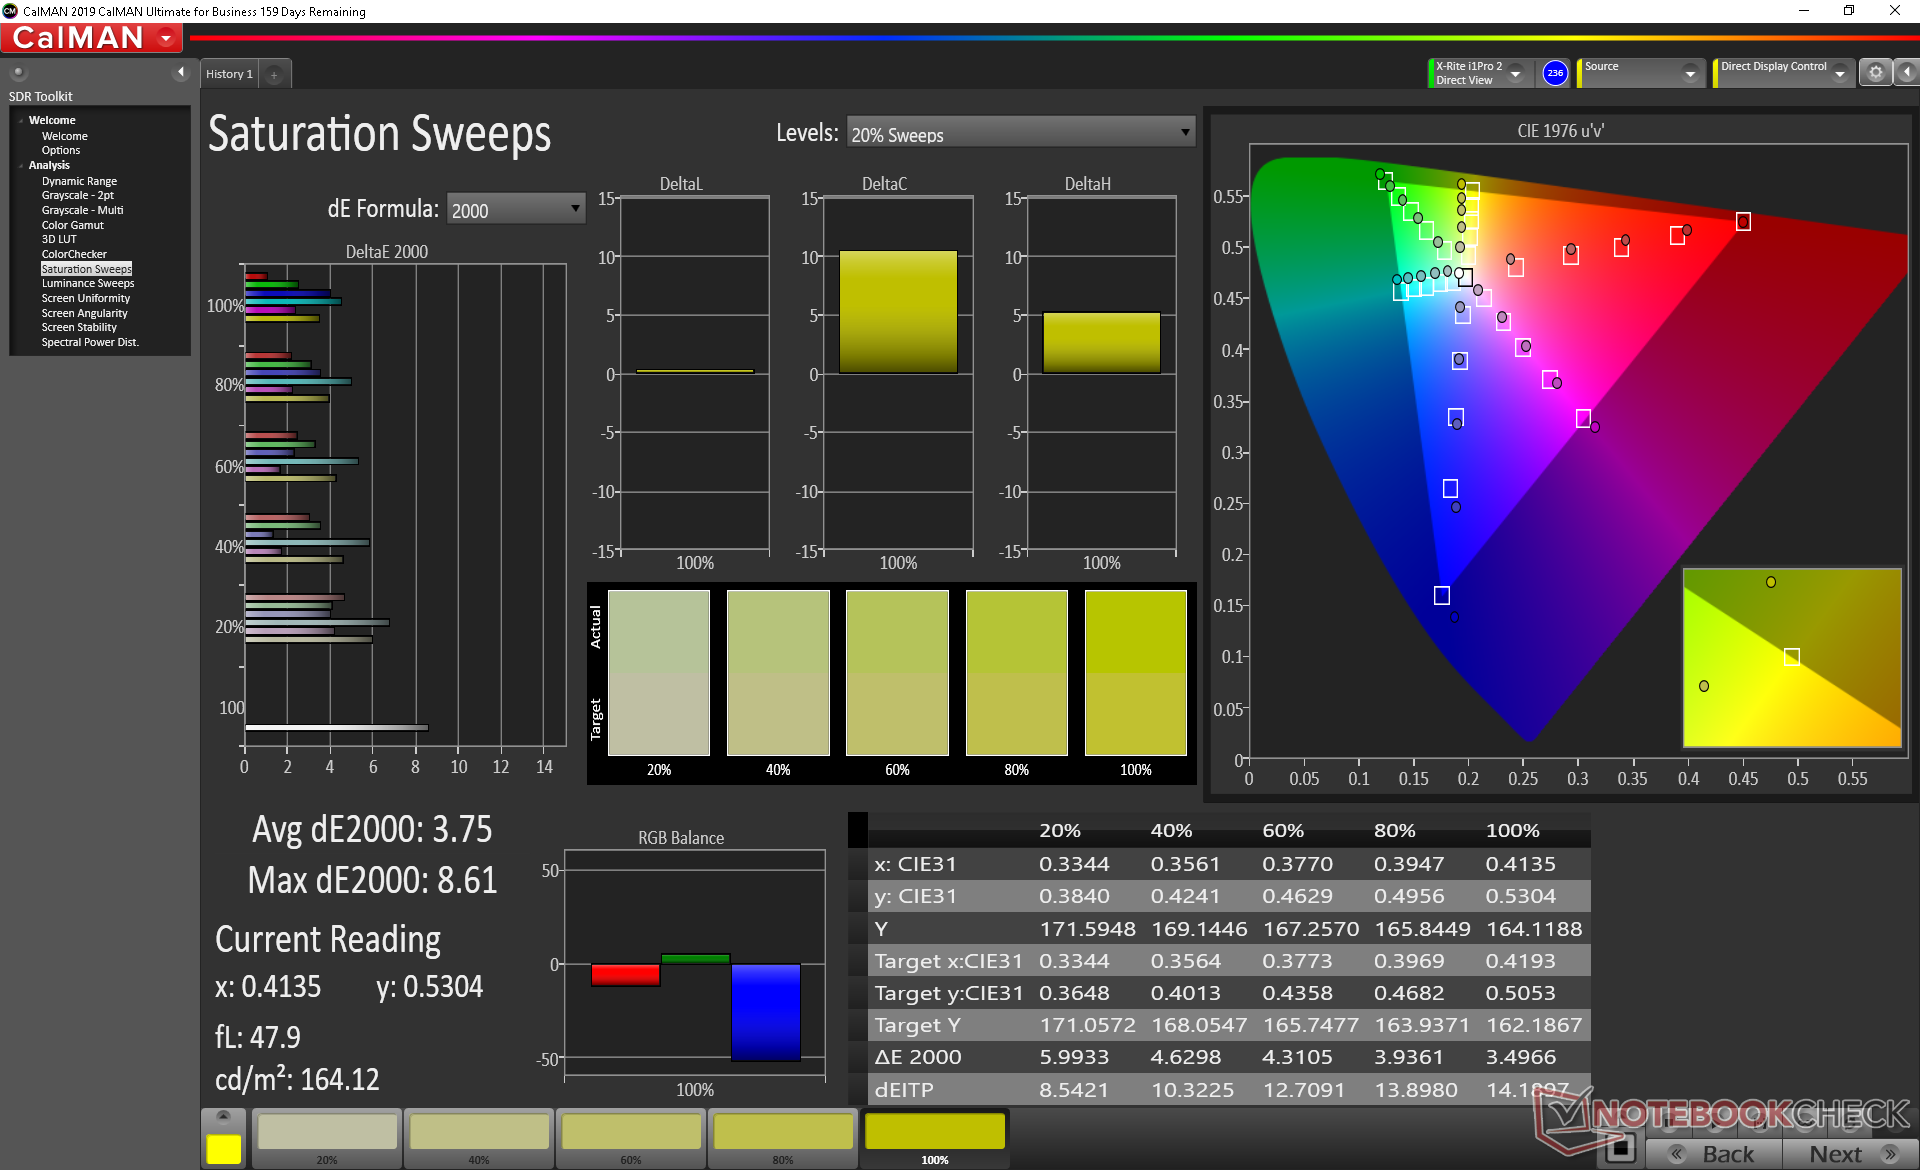
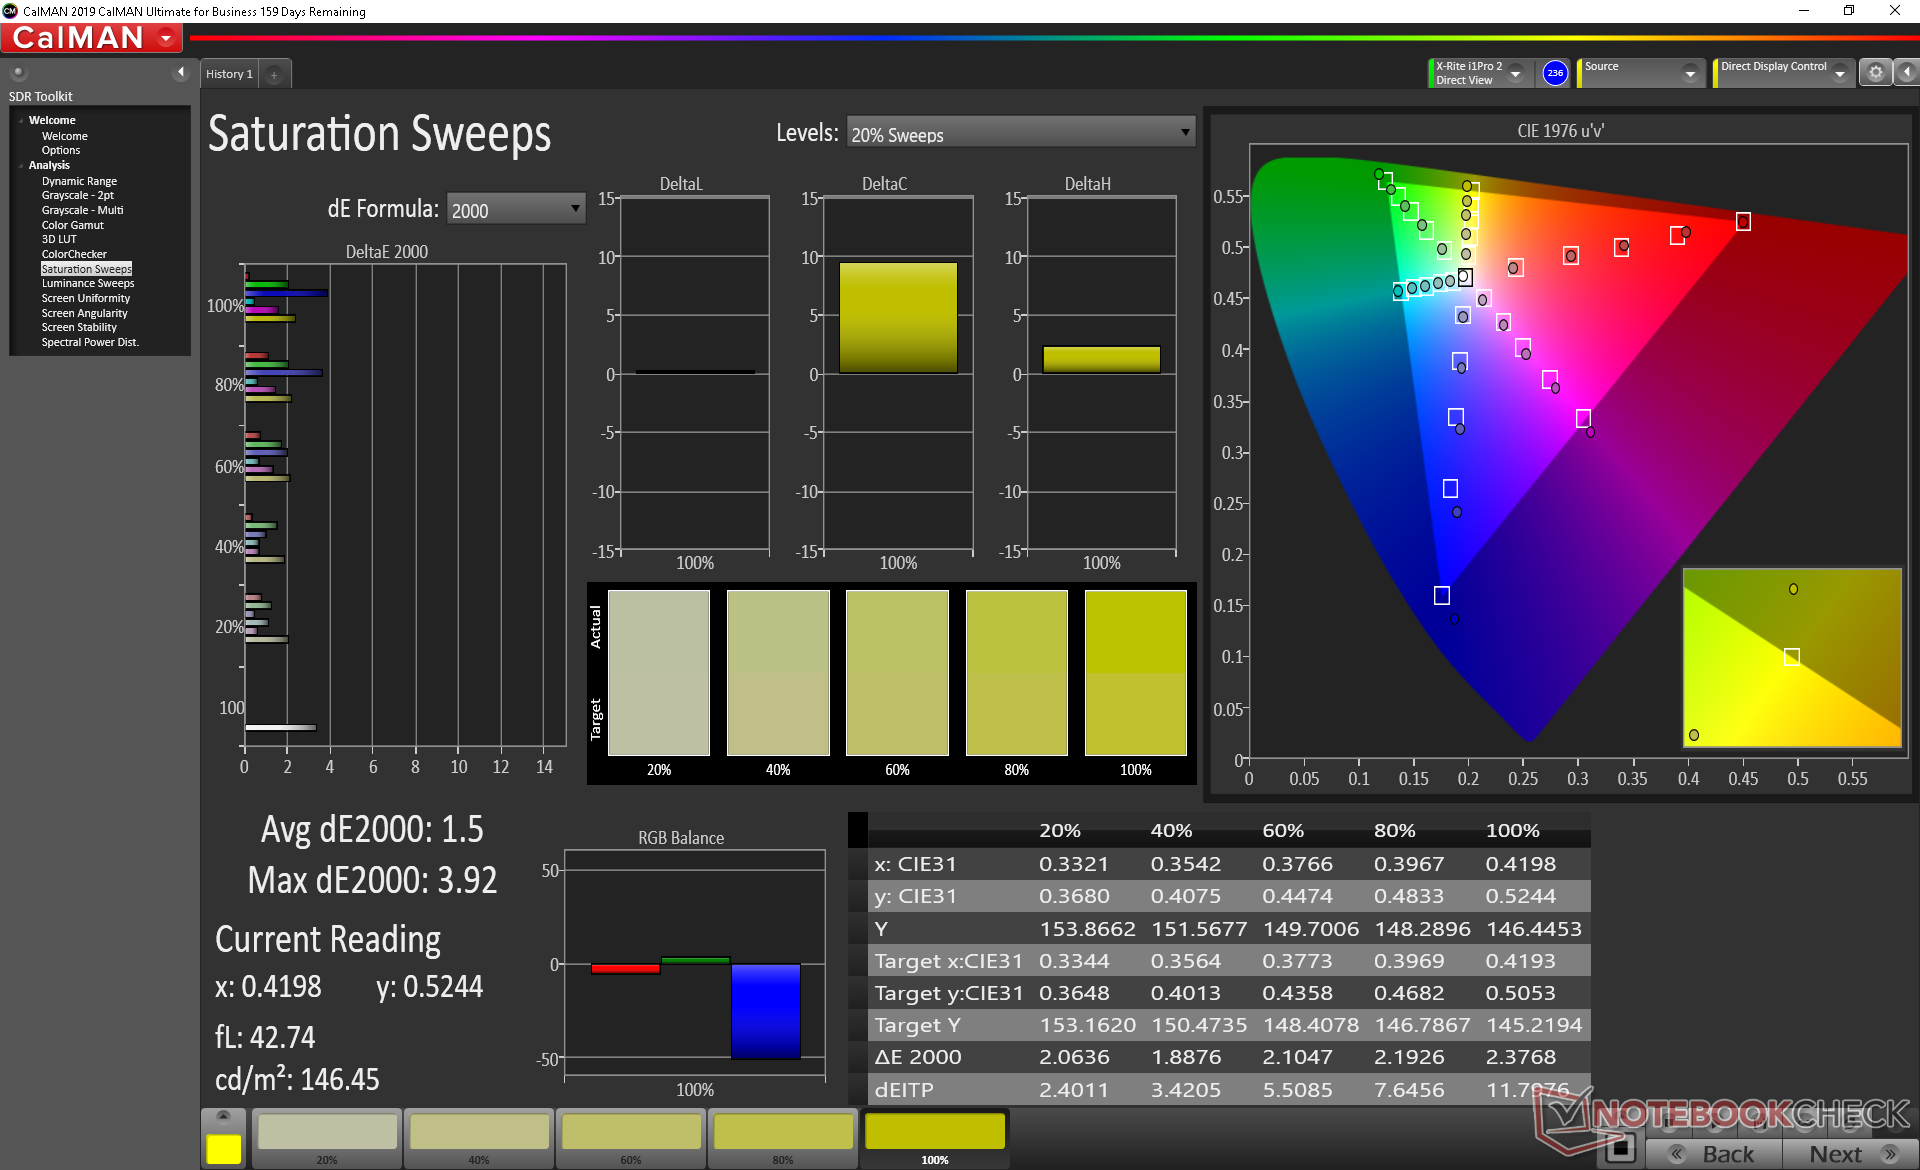
Color space is narrower than on the 4K UHD 120 Hz option. Users can expect full sRGB coverage here as opposed to full AdobeRGB on the 4K alternative. We suspect that this is because there are no widely available 15.6-inch 300 Hz panels in the market at the moment that also have full AdobeRGB coverage.
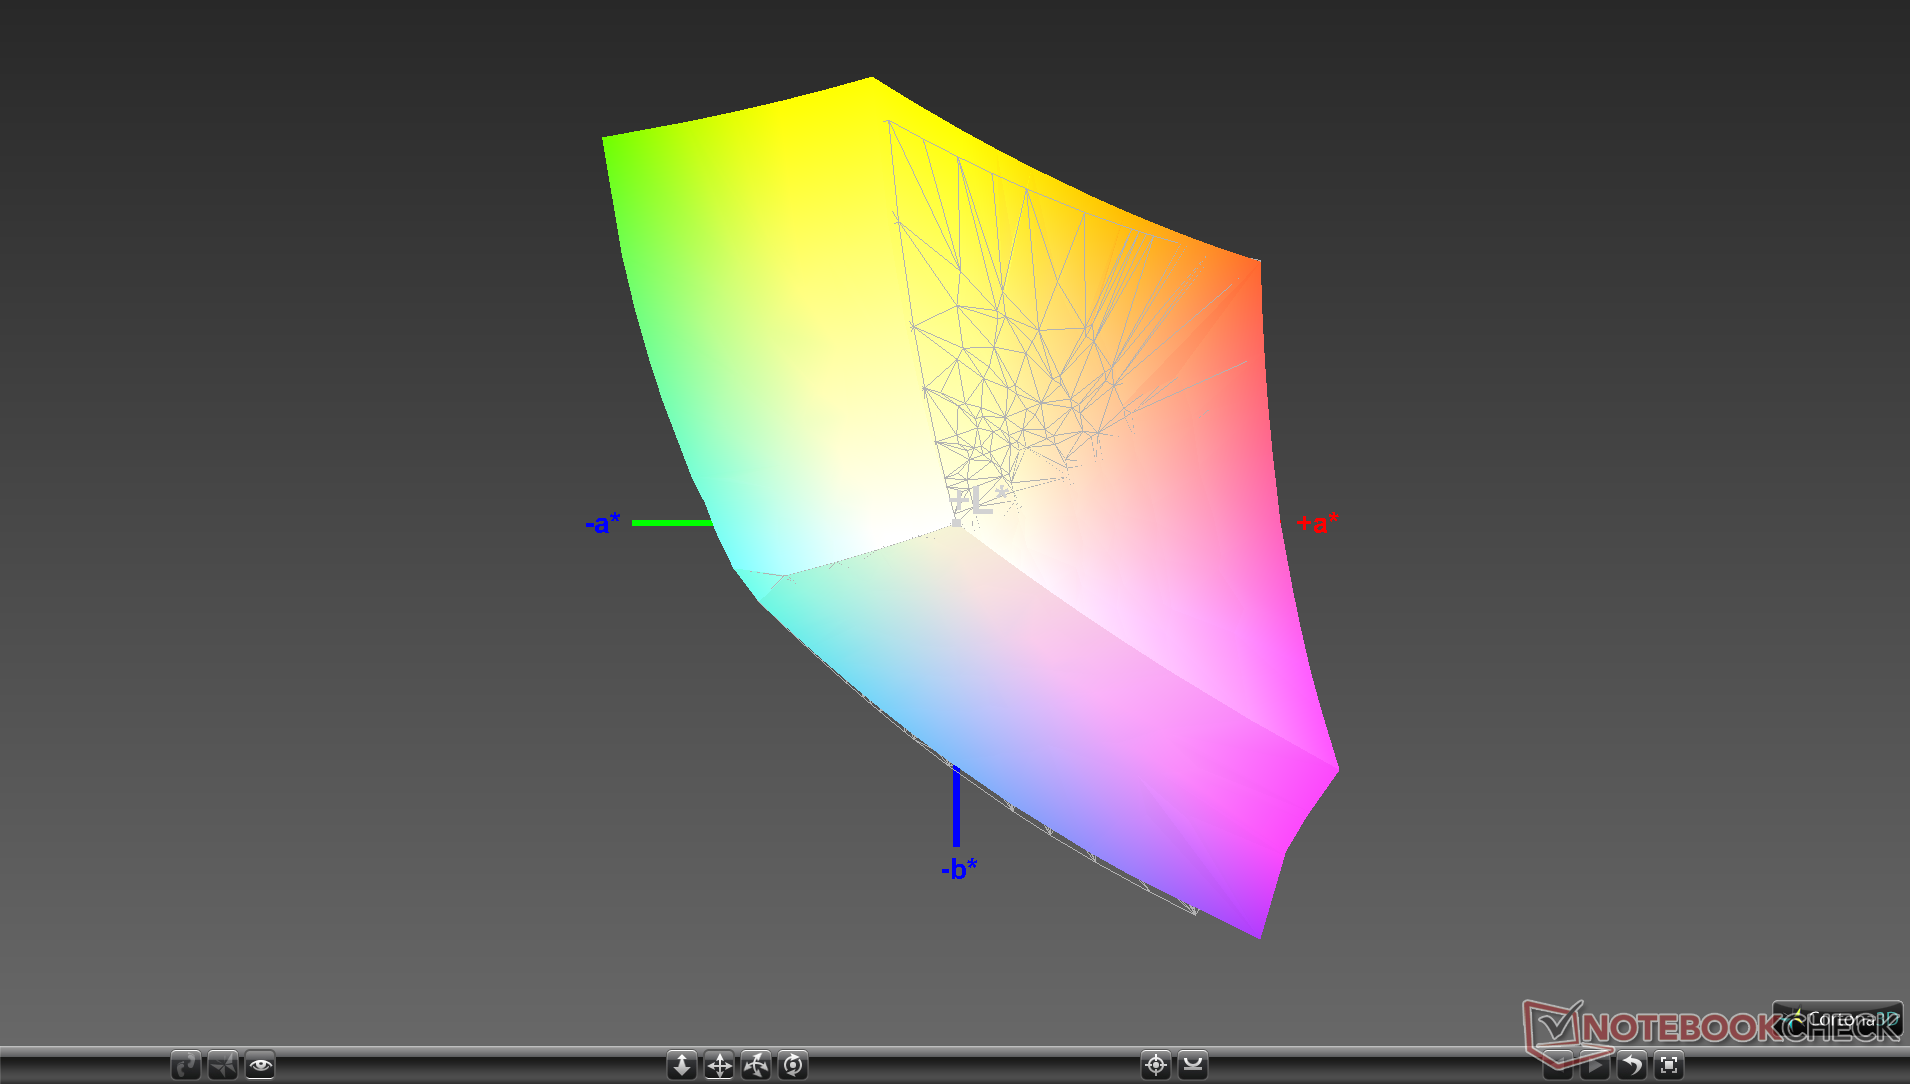
The display could have been better calibrated out of the box. Color temperature is slightly too warm and the average grayscale DeltaE of 6.8 is relatively high for a flagship laptop such as this. Calibrating the panel ourselves addresses the issues for a more color-accurate display.
Display Response Times
| ↔ Response Time Black to White | ||
|---|---|---|
| 9.6 ms ... rise ↗ and fall ↘ combined | ↗ 5.2 ms rise | 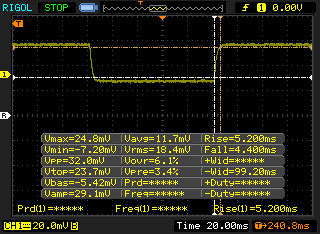 |
| ↘ 4.4 ms fall | ||
| The screen shows fast response rates in our tests and should be suited for gaming. In comparison, all tested devices range from 0.1 (minimum) to 240 (maximum) ms. » 25 % of all devices are better. This means that the measured response time is better than the average of all tested devices (20.1 ms). | ||
| ↔ Response Time 50% Grey to 80% Grey | ||
| 5.6 ms ... rise ↗ and fall ↘ combined | ↗ 2.6 ms rise | 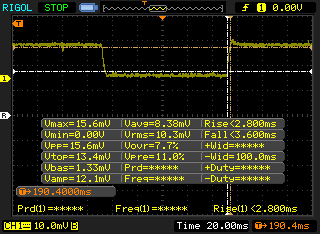 |
| ↘ 3 ms fall | ||
| The screen shows very fast response rates in our tests and should be very well suited for fast-paced gaming. In comparison, all tested devices range from 0.165 (minimum) to 636 (maximum) ms. » 17 % of all devices are better. This means that the measured response time is better than the average of all tested devices (31.5 ms). | ||
Screen Flickering / PWM (Pulse-Width Modulation)
| Screen flickering / PWM not detected | 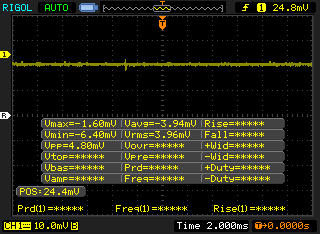 | ||
In comparison: 53 % of all tested devices do not use PWM to dim the display. If PWM was detected, an average of 8039 (minimum: 5 - maximum: 343500) Hz was measured. | |||
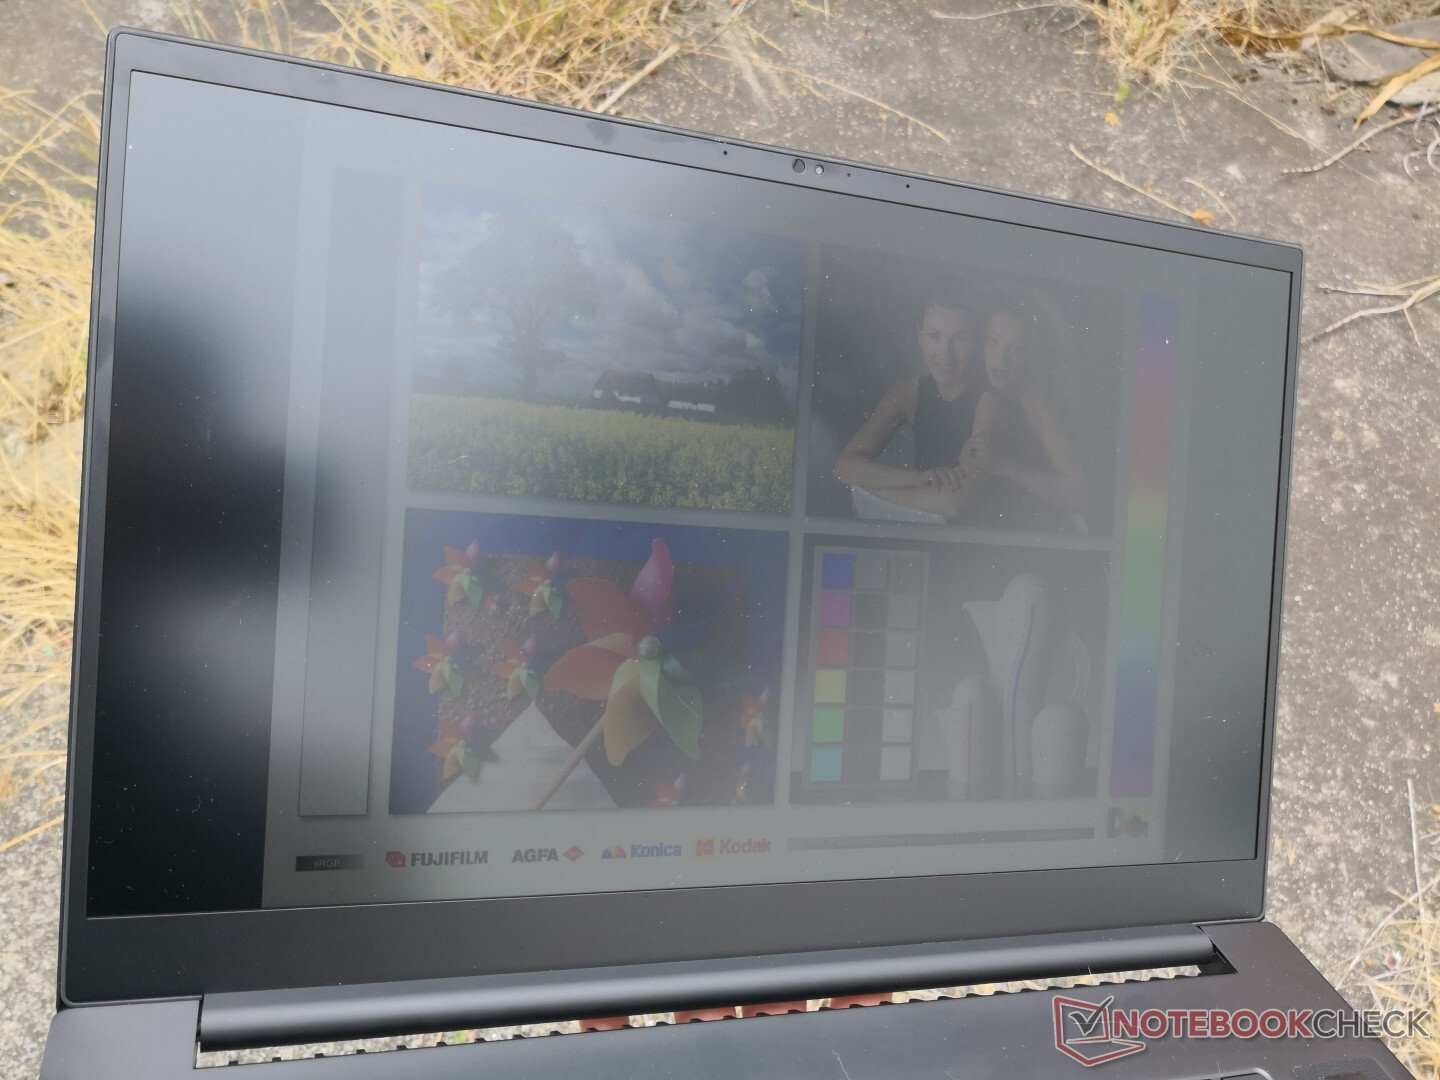
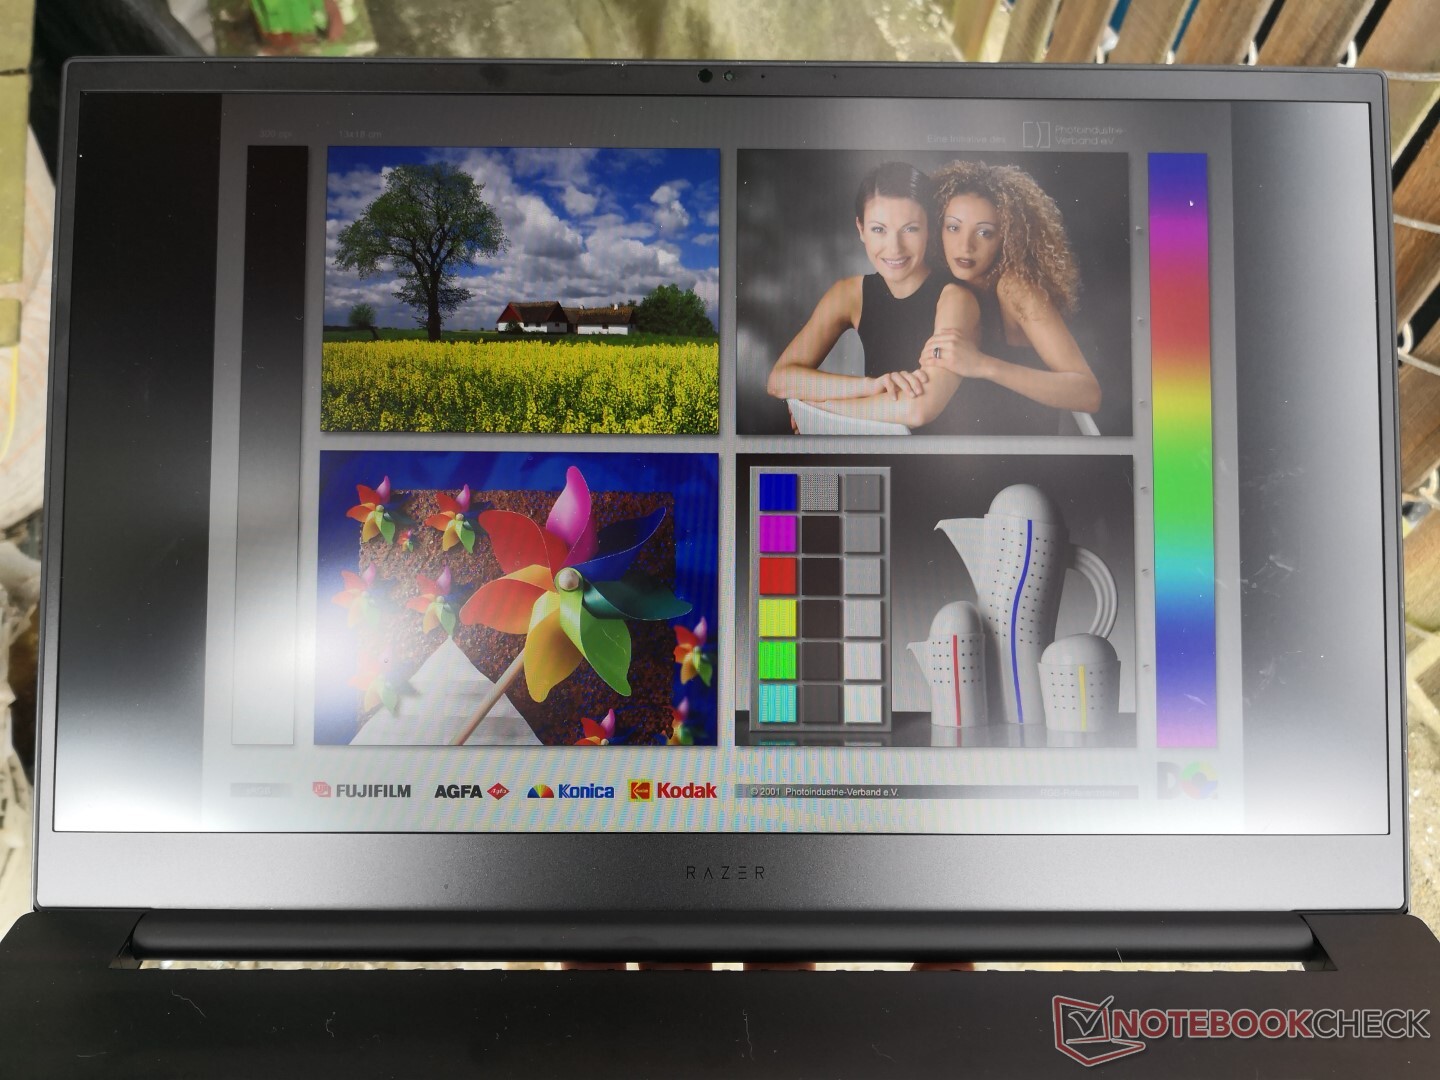
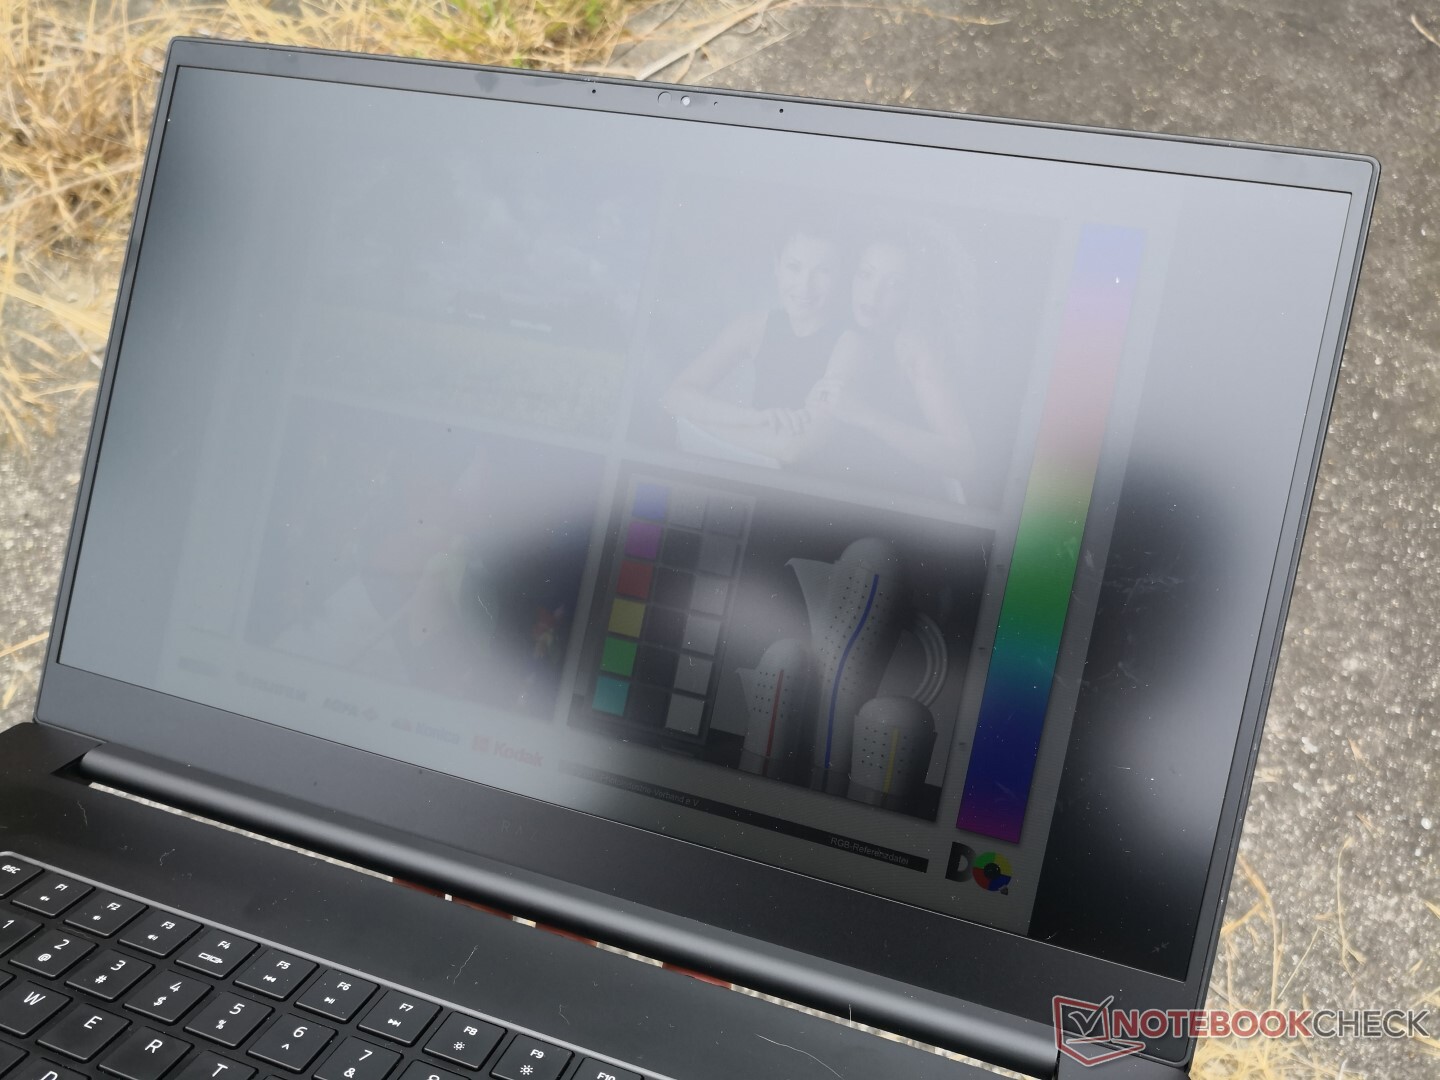
Outdoor visibility isn't noticeably better or worse than on the 2019 model or most other gaming laptops for that matter. The ~300 nit display wasn't designed to be overcome such bright ambient lighting regardless of the matte overlay.

Performance
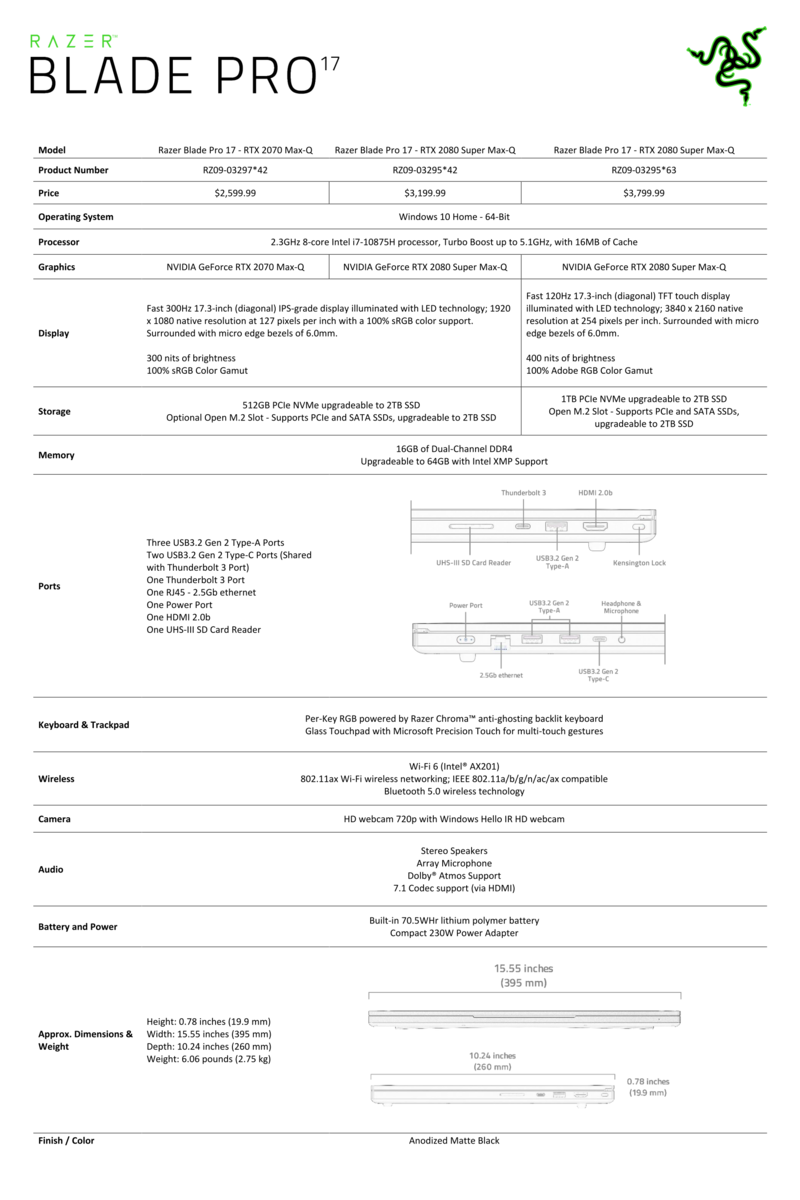
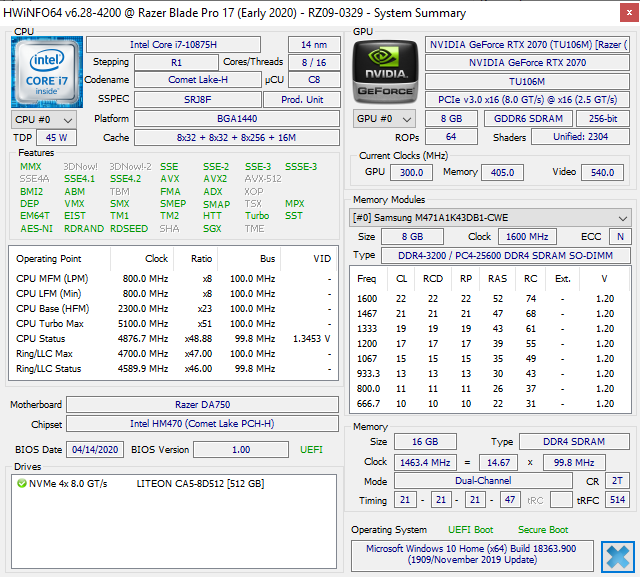
All 2020 options come standard with the 10th gen octa-core Core i7-10875H to succeed last year's 9th gen hexa-core Core i7-9750H. Unlike most other gaming laptops, Razer does not offer the hexa-core Core i7-10750H. Core i9 isn't available here as well, but that is not something we would recommend for thin-and-light gaming laptops based on what we've seen on the MSI GS66.
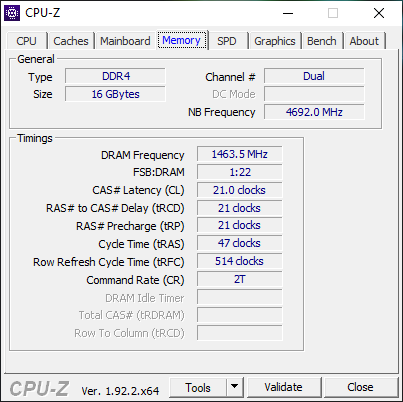
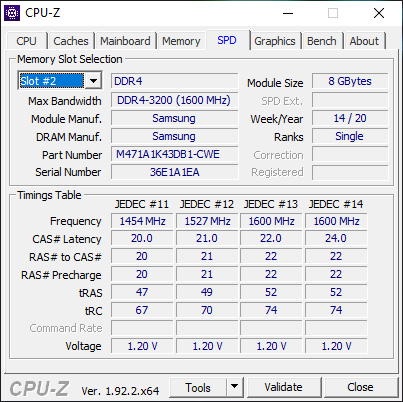
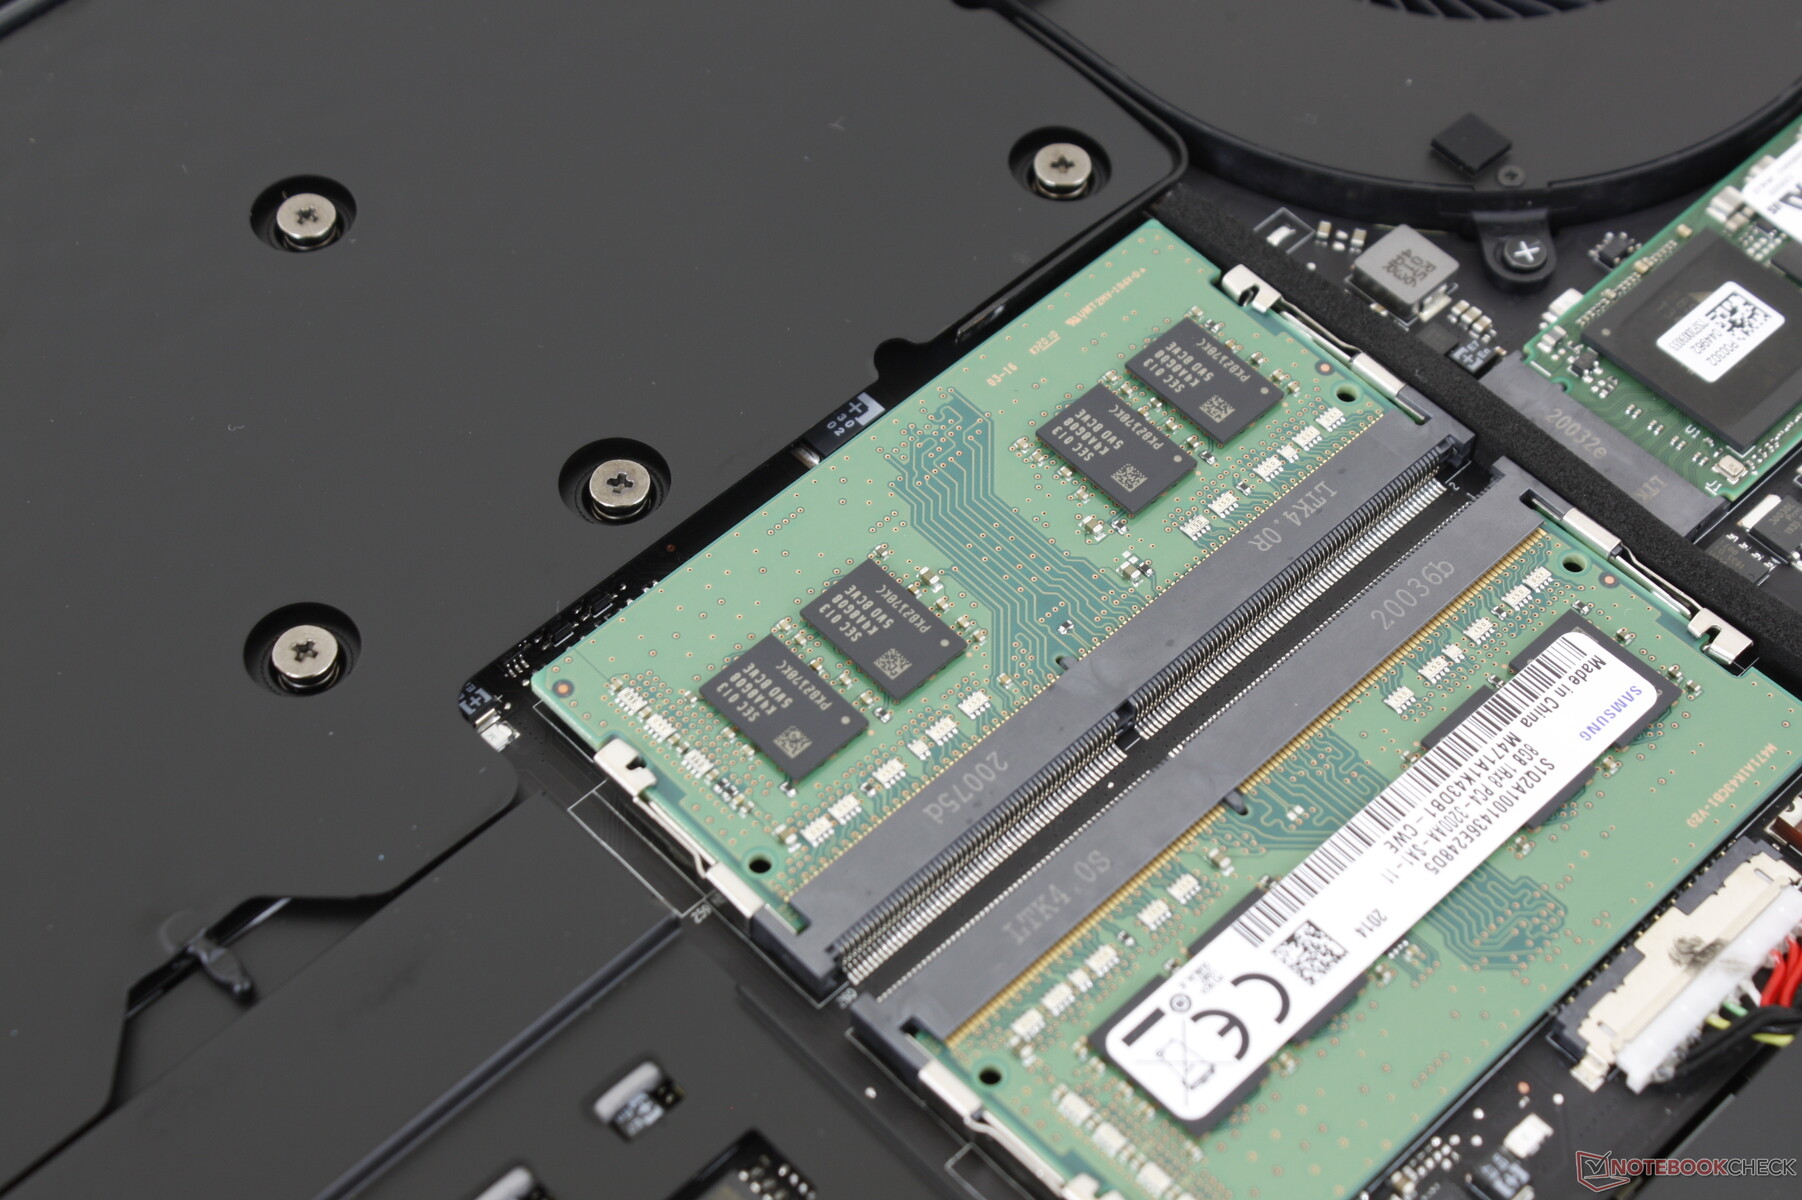
RAM has been upgraded from DDR4-2667 to DDR4-2933. Two accessible SODIMM slots allow for up to 64 GB.
Nvidia Optimus is not included, but users can manually switch between the integrated and discrete GPUs via the Razer Synapse software. A reboot will be required each time. Manual graphics switching usually implies G-Sync support, but that is not available here.
Annoyingly, Razer Synapse will always be stuck on its login screen if booting up the system with wireless disabled. You'll have to re-enable wireless and then completely restart Synapse to get past the login screen.
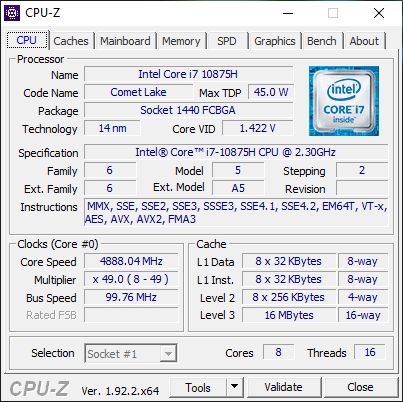
Processor
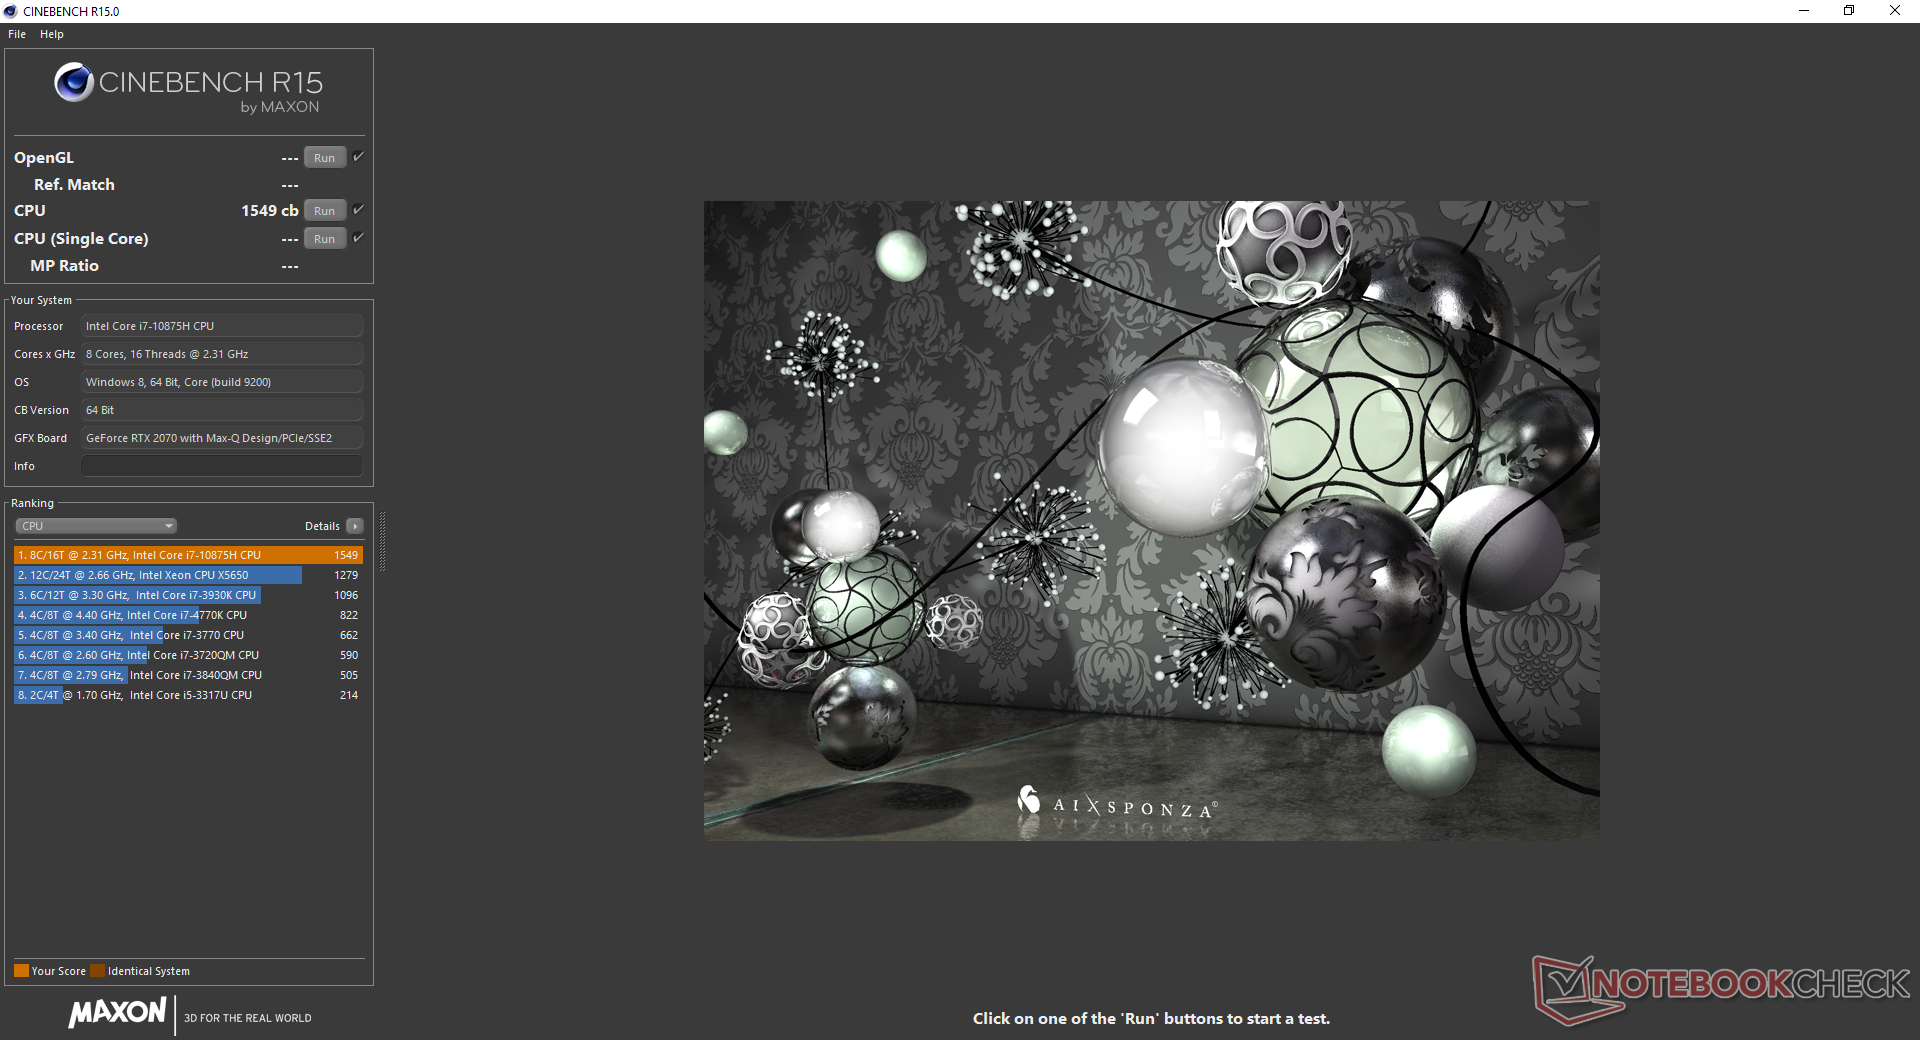
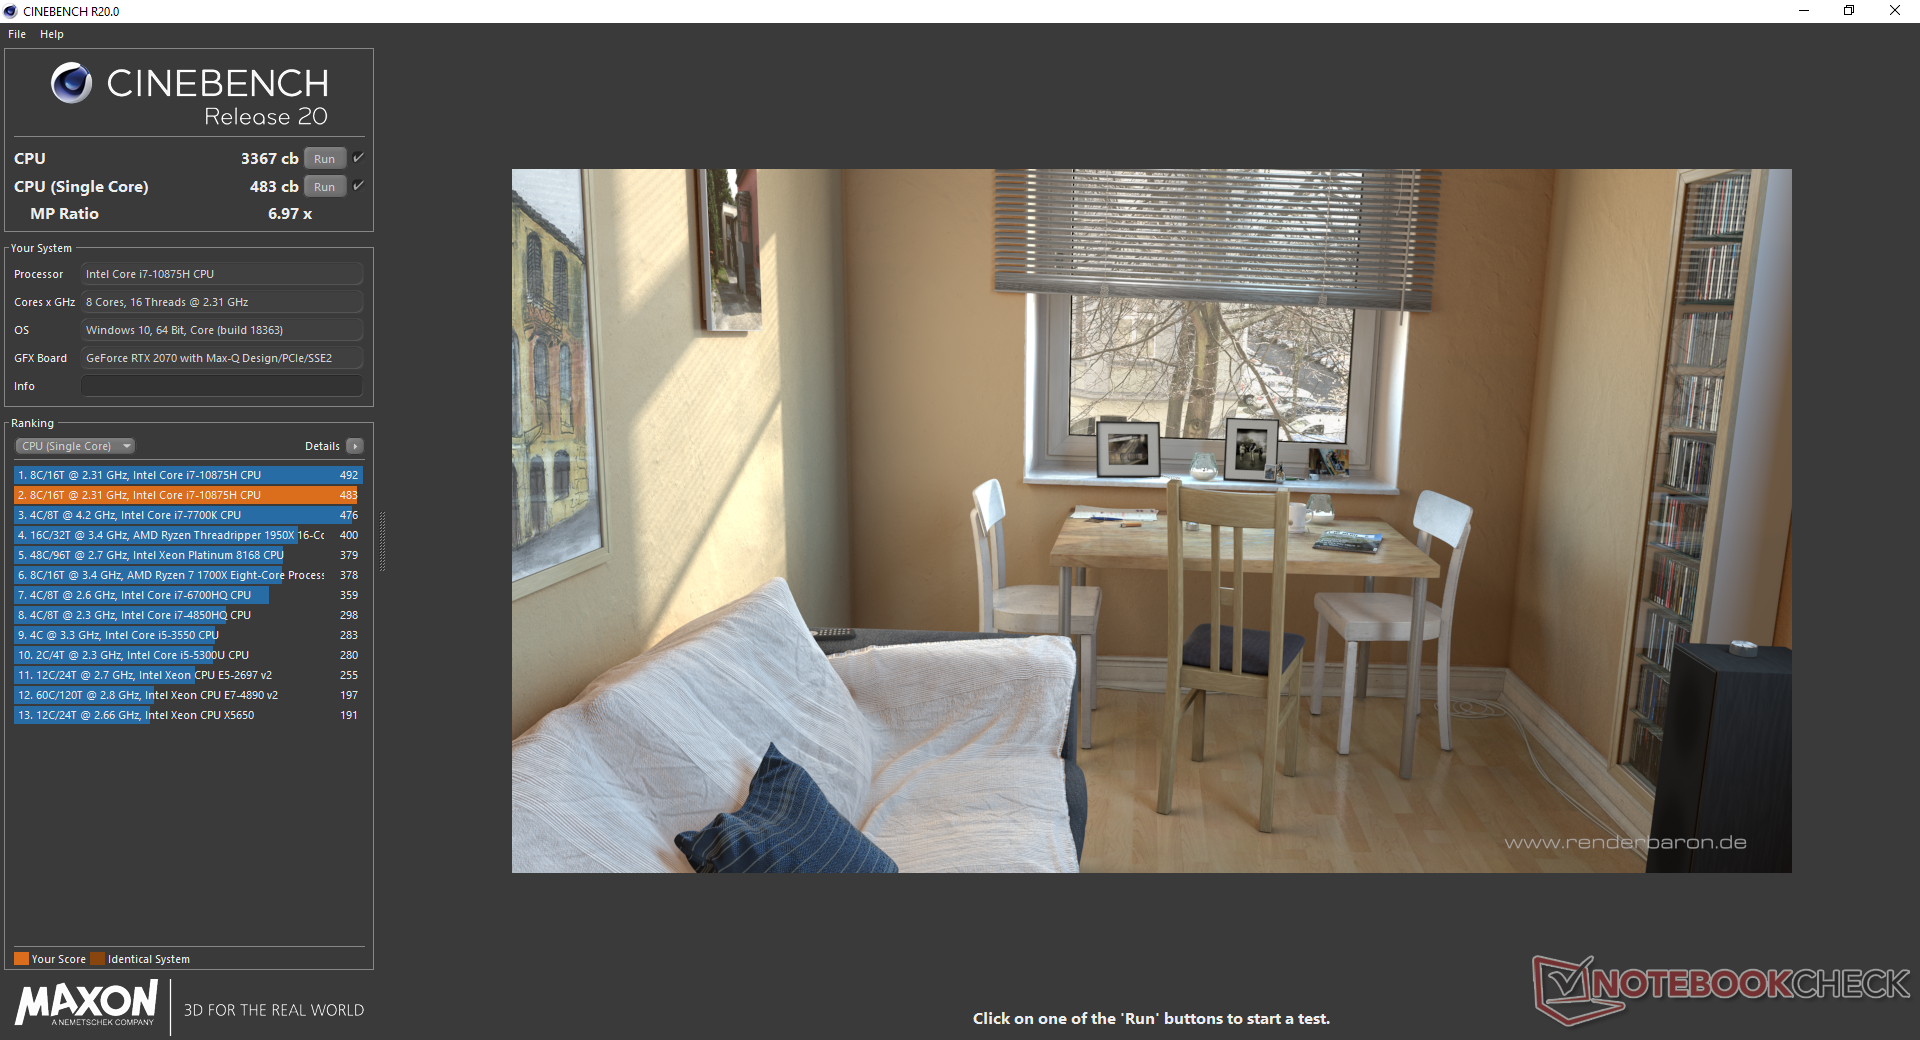
CPU performance is slightly slower than the average Core i7-10875H processor in our database. Even so, raw multi-thread performance is about 45 percent faster than on last year's Blade Pro 17 with the Core i7-9750H. This won't translate to 45 percent faster frame rates, of course, but content creators will almost certainly benefit more from the additional cores. It's too bad that Razer doesn't offer any Ryzen 7 4800H options as AMD has been putting a lot of pressure on Intel with its impressive Ryzen series thus far.
When running CineBench R15 Multi-Thread in a loop, the initial high score of 1494 points would dip to 1360 points by the second loop to represent a performance drop of about 9 percent.
See our dedicated page on the Core i7-10875H for more technical information and benchmark comparisons.
Cinebench R15: CPU Multi 64Bit | CPU Single 64Bit
Blender: v2.79 BMW27 CPU
7-Zip 18.03: 7z b 4 -mmt1 | 7z b 4
Geekbench 5.5: Single-Core | Multi-Core
HWBOT x265 Benchmark v2.2: 4k Preset
LibreOffice : 20 Documents To PDF
R Benchmark 2.5: Overall mean
| Blender / v2.79 BMW27 CPU | |
| MSI GF75 Thin 10SCXR | |
| Acer Nitro 5 AN517-52-77DS | |
| Acer Nitro 5 AN515-44-R5FT | |
| Average Intel Core i7-10875H (259 - 535, n=30) | |
| Razer Blade Pro 17 RTX 2070 Max-Q 300 Hz | |
| Asus Zephyrus G14 GA401IV | |
| MSI GE75 9SG | |
| MSI GE66 Raider 10SFS | |
| Asus TUF A17 FA706IU-AS76 | |
| 7-Zip 18.03 / 7z b 4 -mmt1 | |
| MSI GE66 Raider 10SFS | |
| Average Intel Core i7-10875H (5071 - 5780, n=31) | |
| Razer Blade Pro 17 RTX 2070 Max-Q 300 Hz | |
| Acer Nitro 5 AN517-52-77DS | |
| MSI GE75 9SG | |
| Asus TUF A17 FA706IU-AS76 | |
| MSI GF75 Thin 10SCXR | |
| Asus Zephyrus G14 GA401IV | |
| Acer Nitro 5 AN515-44-R5FT | |
| Geekbench 5.5 / Single-Core | |
| MSI GE66 Raider 10SFS | |
| Average Intel Core i7-10875H (1233 - 1371, n=29) | |
| Razer Blade Pro 17 RTX 2070 Max-Q 300 Hz | |
| Acer Nitro 5 AN517-52-77DS | |
| Asus Zephyrus G14 GA401IV | |
| Asus TUF A17 FA706IU-AS76 | |
| MSI GF75 Thin 10SCXR | |
| Acer Nitro 5 AN515-44-R5FT | |
| Geekbench 5.5 / Multi-Core | |
| MSI GE66 Raider 10SFS | |
| Asus TUF A17 FA706IU-AS76 | |
| Average Intel Core i7-10875H (5715 - 8620, n=29) | |
| Asus Zephyrus G14 GA401IV | |
| Razer Blade Pro 17 RTX 2070 Max-Q 300 Hz | |
| Acer Nitro 5 AN517-52-77DS | |
| Acer Nitro 5 AN515-44-R5FT | |
| MSI GF75 Thin 10SCXR | |
| HWBOT x265 Benchmark v2.2 / 4k Preset | |
| MSI GE66 Raider 10SFS | |
| Asus TUF A17 FA706IU-AS76 | |
| Asus Zephyrus G14 GA401IV | |
| MSI GE75 9SG | |
| Average Intel Core i7-10875H (7.27 - 14.1, n=27) | |
| Acer Nitro 5 AN517-52-77DS | |
| Acer Nitro 5 AN515-44-R5FT | |
| MSI GF75 Thin 10SCXR | |
| LibreOffice / 20 Documents To PDF | |
| Acer Nitro 5 AN515-44-R5FT | |
| Asus TUF A17 FA706IU-AS76 | |
| MSI GF75 Thin 10SCXR | |
| Razer Blade Pro 17 RTX 2070 Max-Q 300 Hz | |
| MSI GE66 Raider 10SFS | |
| Average Intel Core i7-10875H (30.2 - 84.3, n=30) | |
| Acer Nitro 5 AN517-52-77DS | |
| R Benchmark 2.5 / Overall mean | |
| MSI GF75 Thin 10SCXR | |
| Acer Nitro 5 AN517-52-77DS | |
| Acer Nitro 5 AN515-44-R5FT | |
| Asus TUF A17 FA706IU-AS76 | |
| Average Intel Core i7-10875H (0.546 - 0.662, n=29) | |
| MSI GE66 Raider 10SFS | |
* ... smaller is better
System Performance
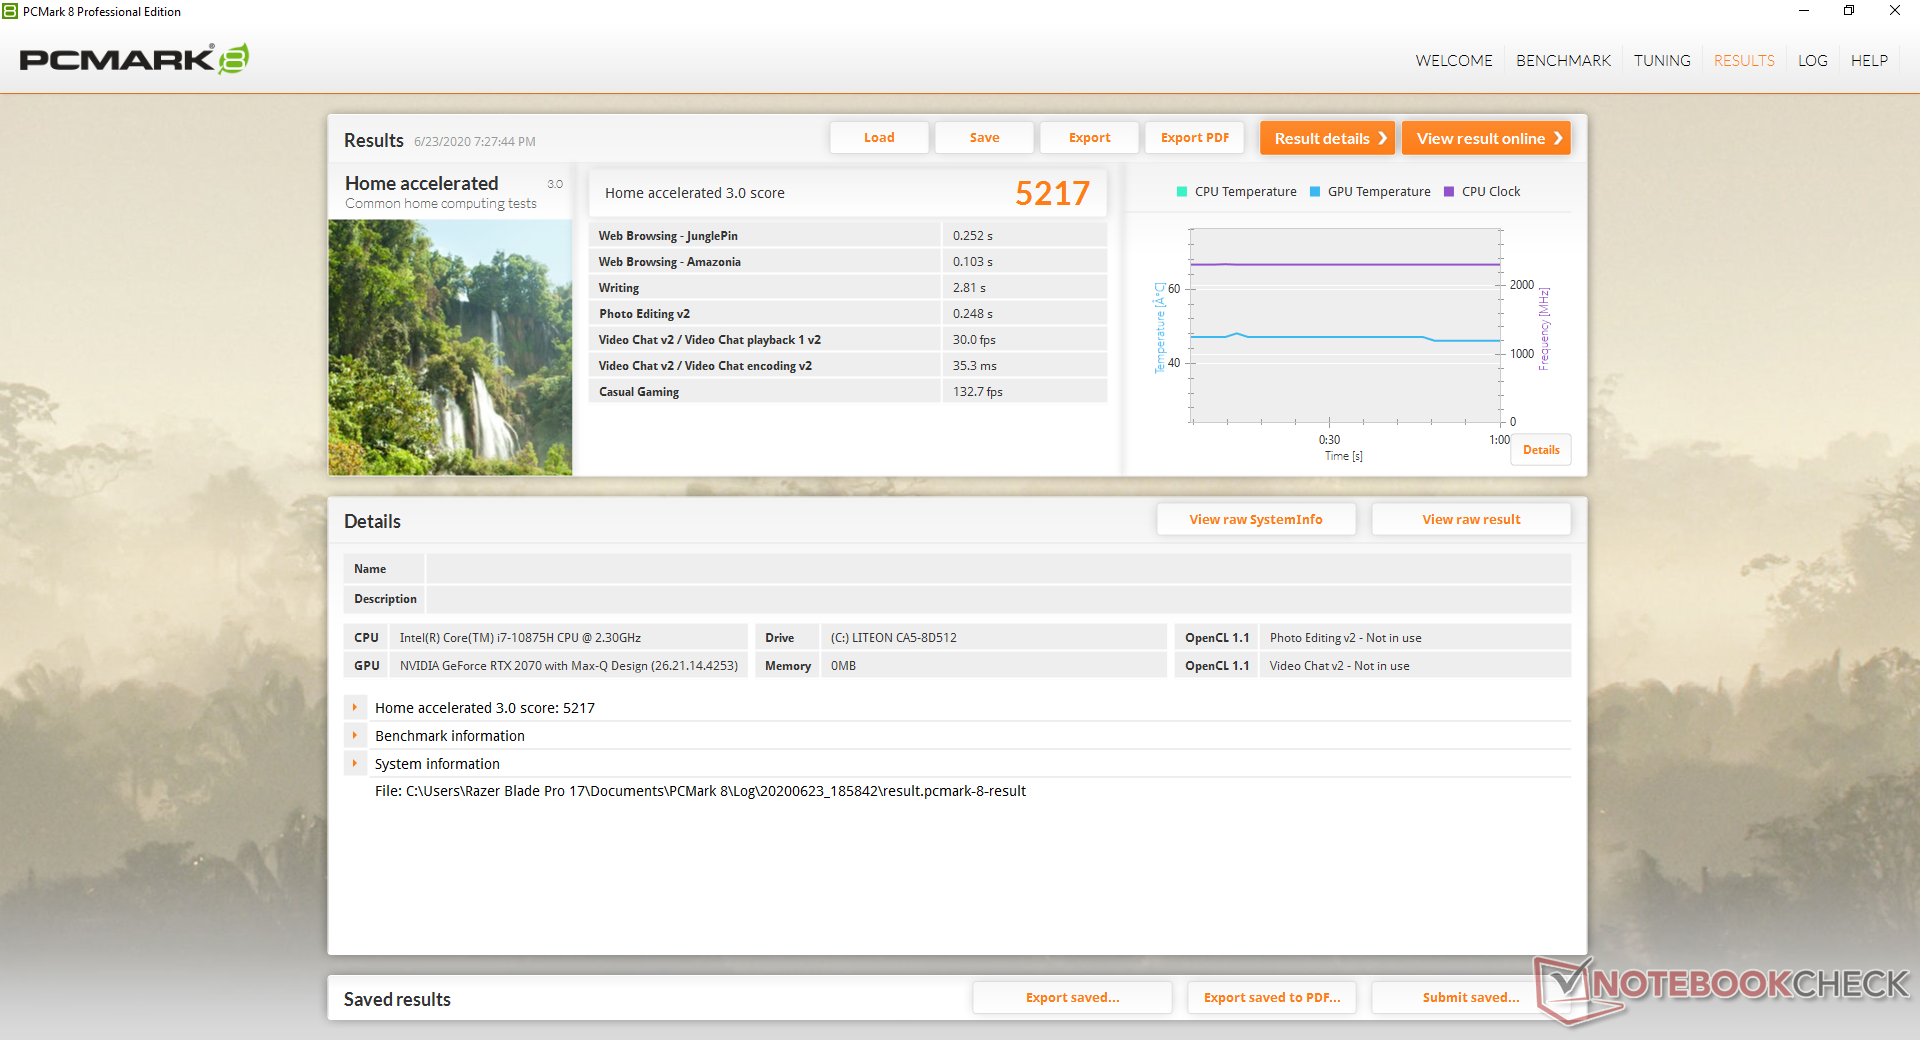
| PCMark 8 Home Score Accelerated v2 | 5217 points | |
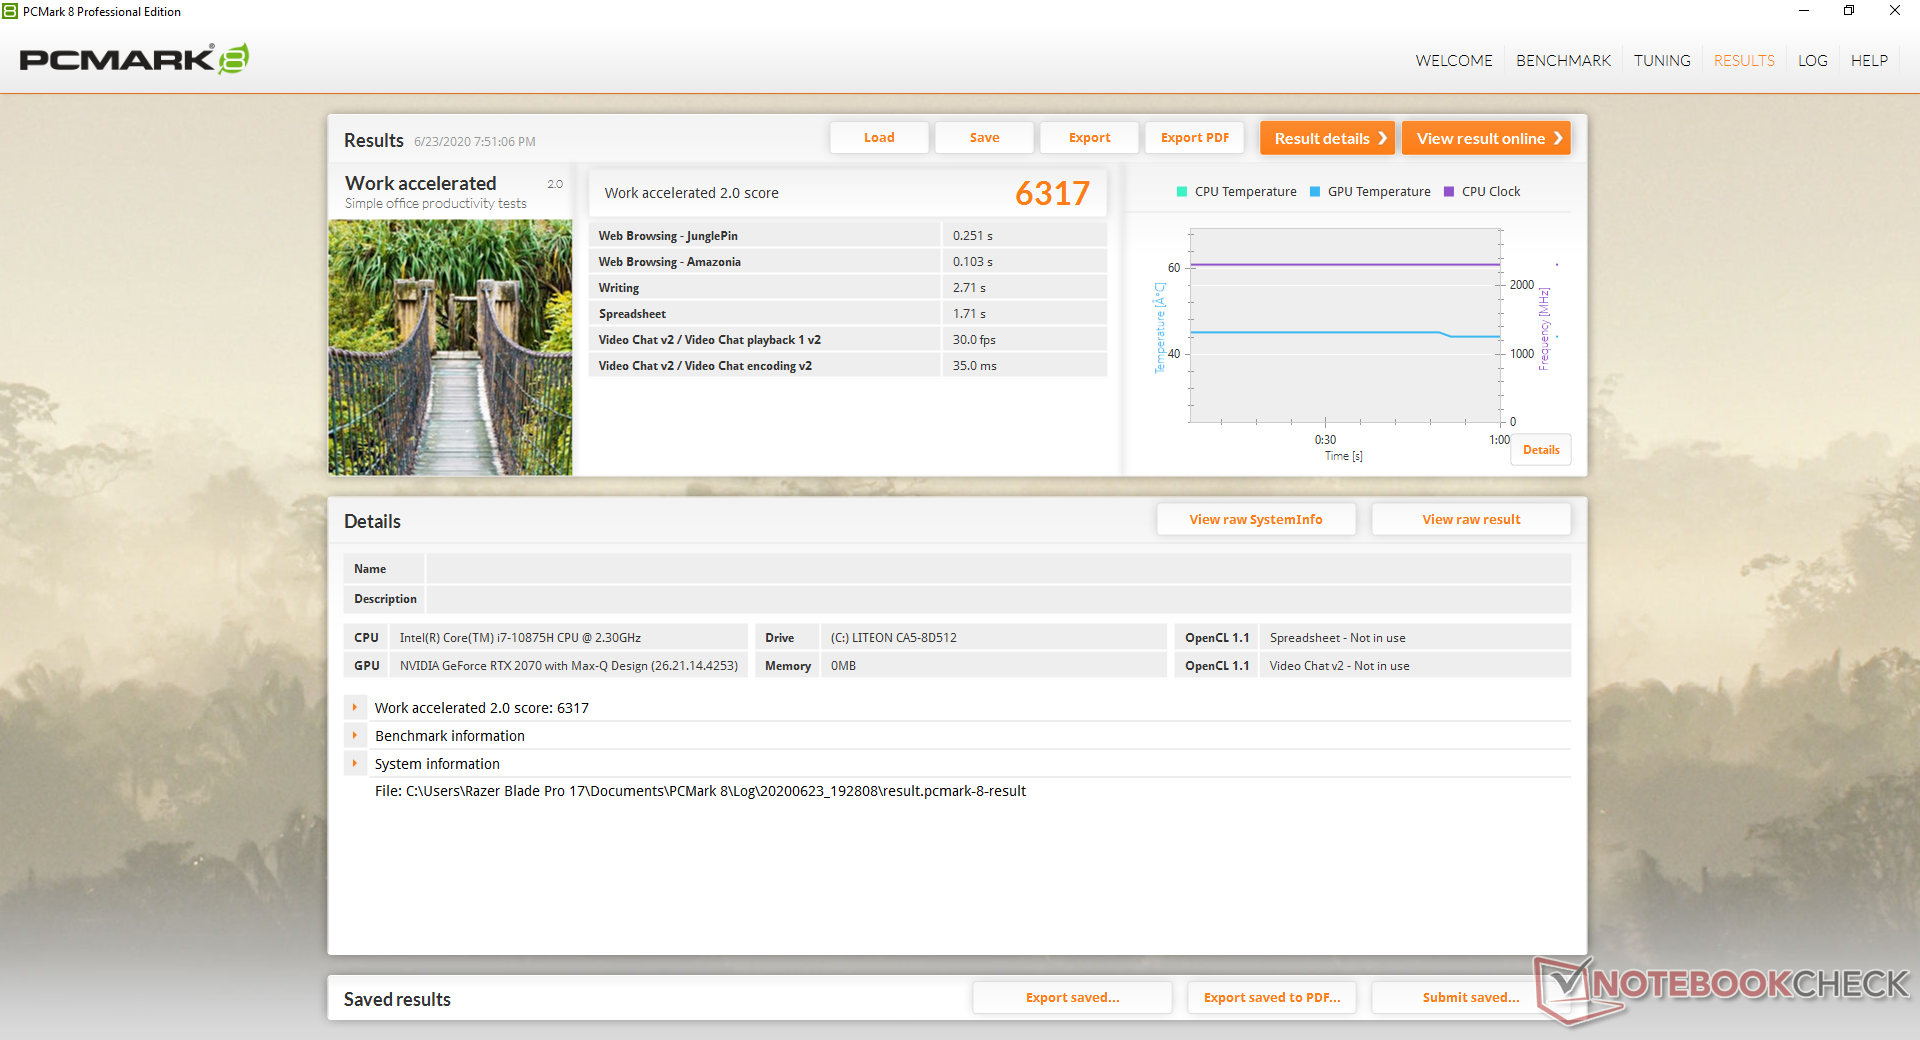
| PCMark 8 Work Score Accelerated v2 | 6317 points | |
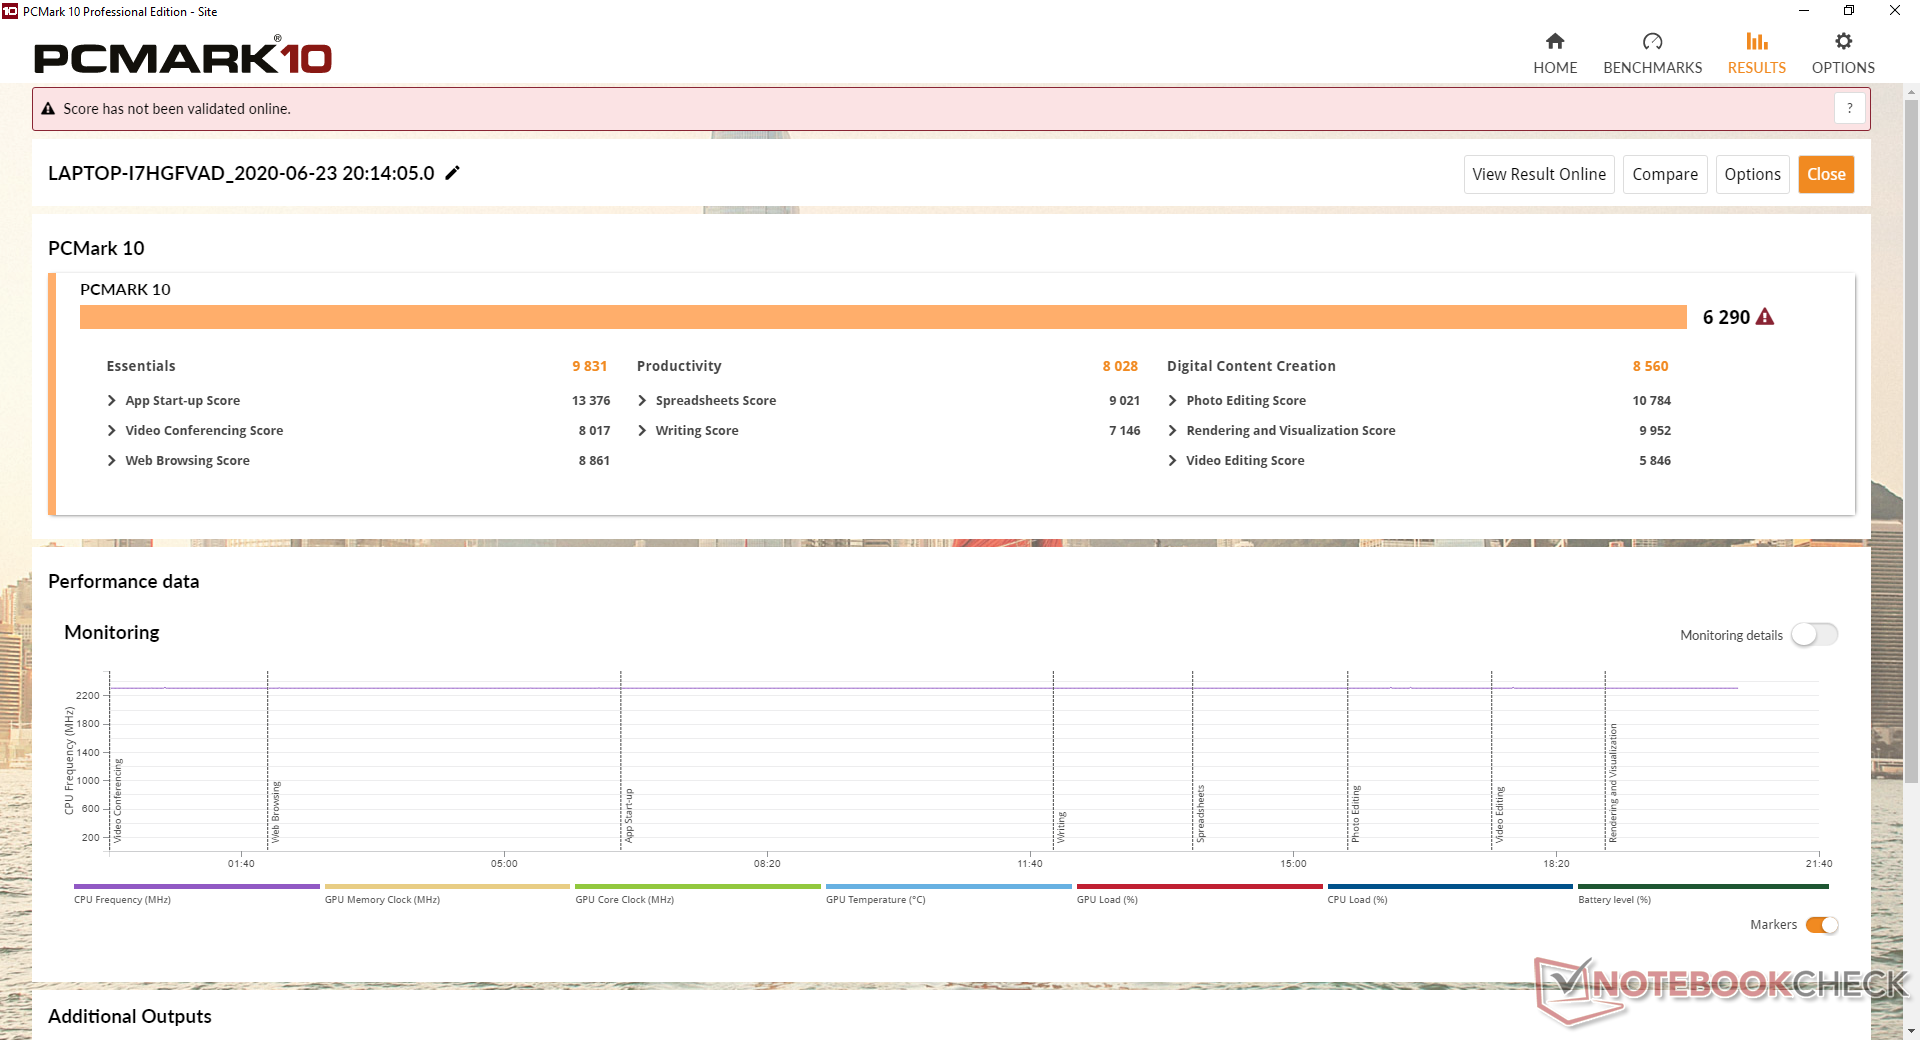
| PCMark 10 Score | 6290 points | |
Help | ||
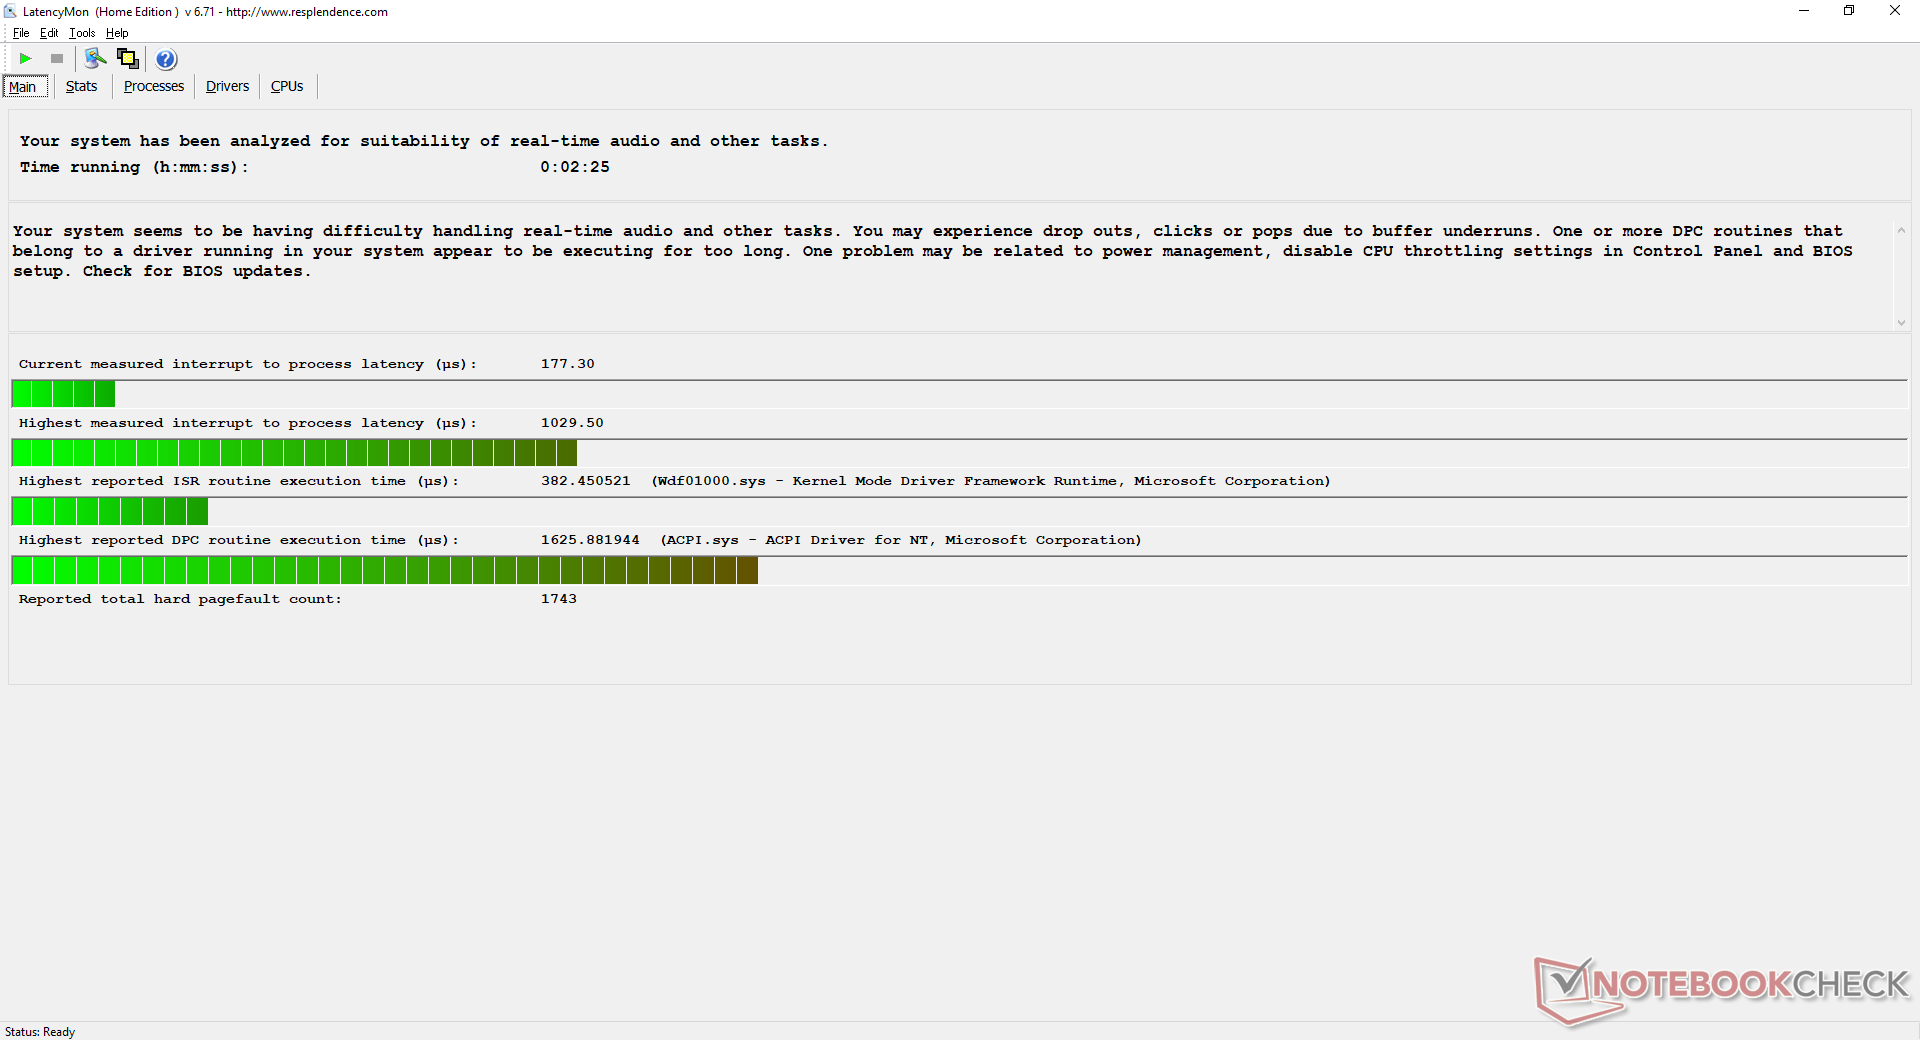
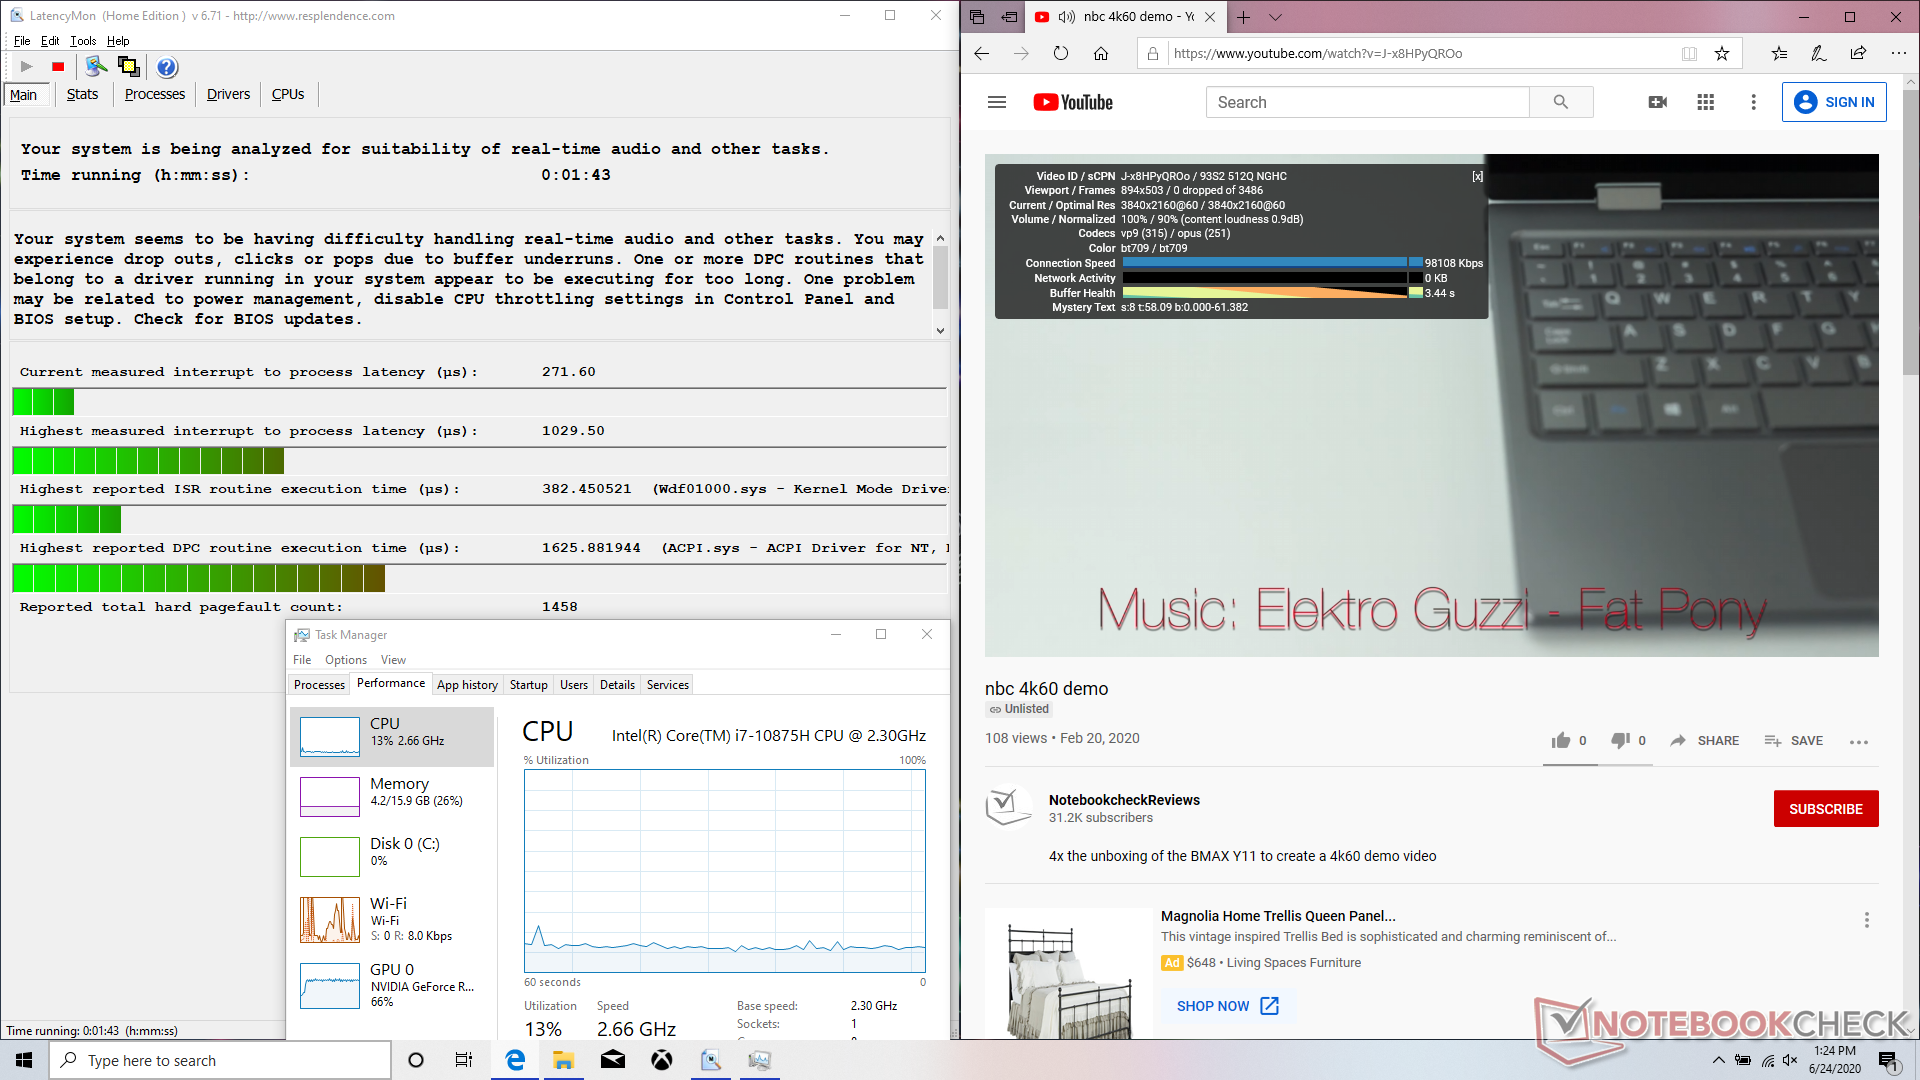
DPC Latency
LatencyMon shows DPC latency issues when opening multiple tabs on our homepage, but the latency isn't as bad as what we recorded on some other gaming laptops from Asus or MSI. 4K video playback on YouTube remains smooth with no dropped frames.
| DPC Latencies / LatencyMon - interrupt to process latency (max), Web, Youtube, Prime95 | |
| Asus TUF A17 FA706IU-AS76 | |
| MSI GF75 Thin 10SCXR | |
| Asus Zephyrus G14 GA401IV | |
| Razer Blade Pro 17 RTX 2070 Max-Q 300 Hz | |
* ... smaller is better
Storage Devices
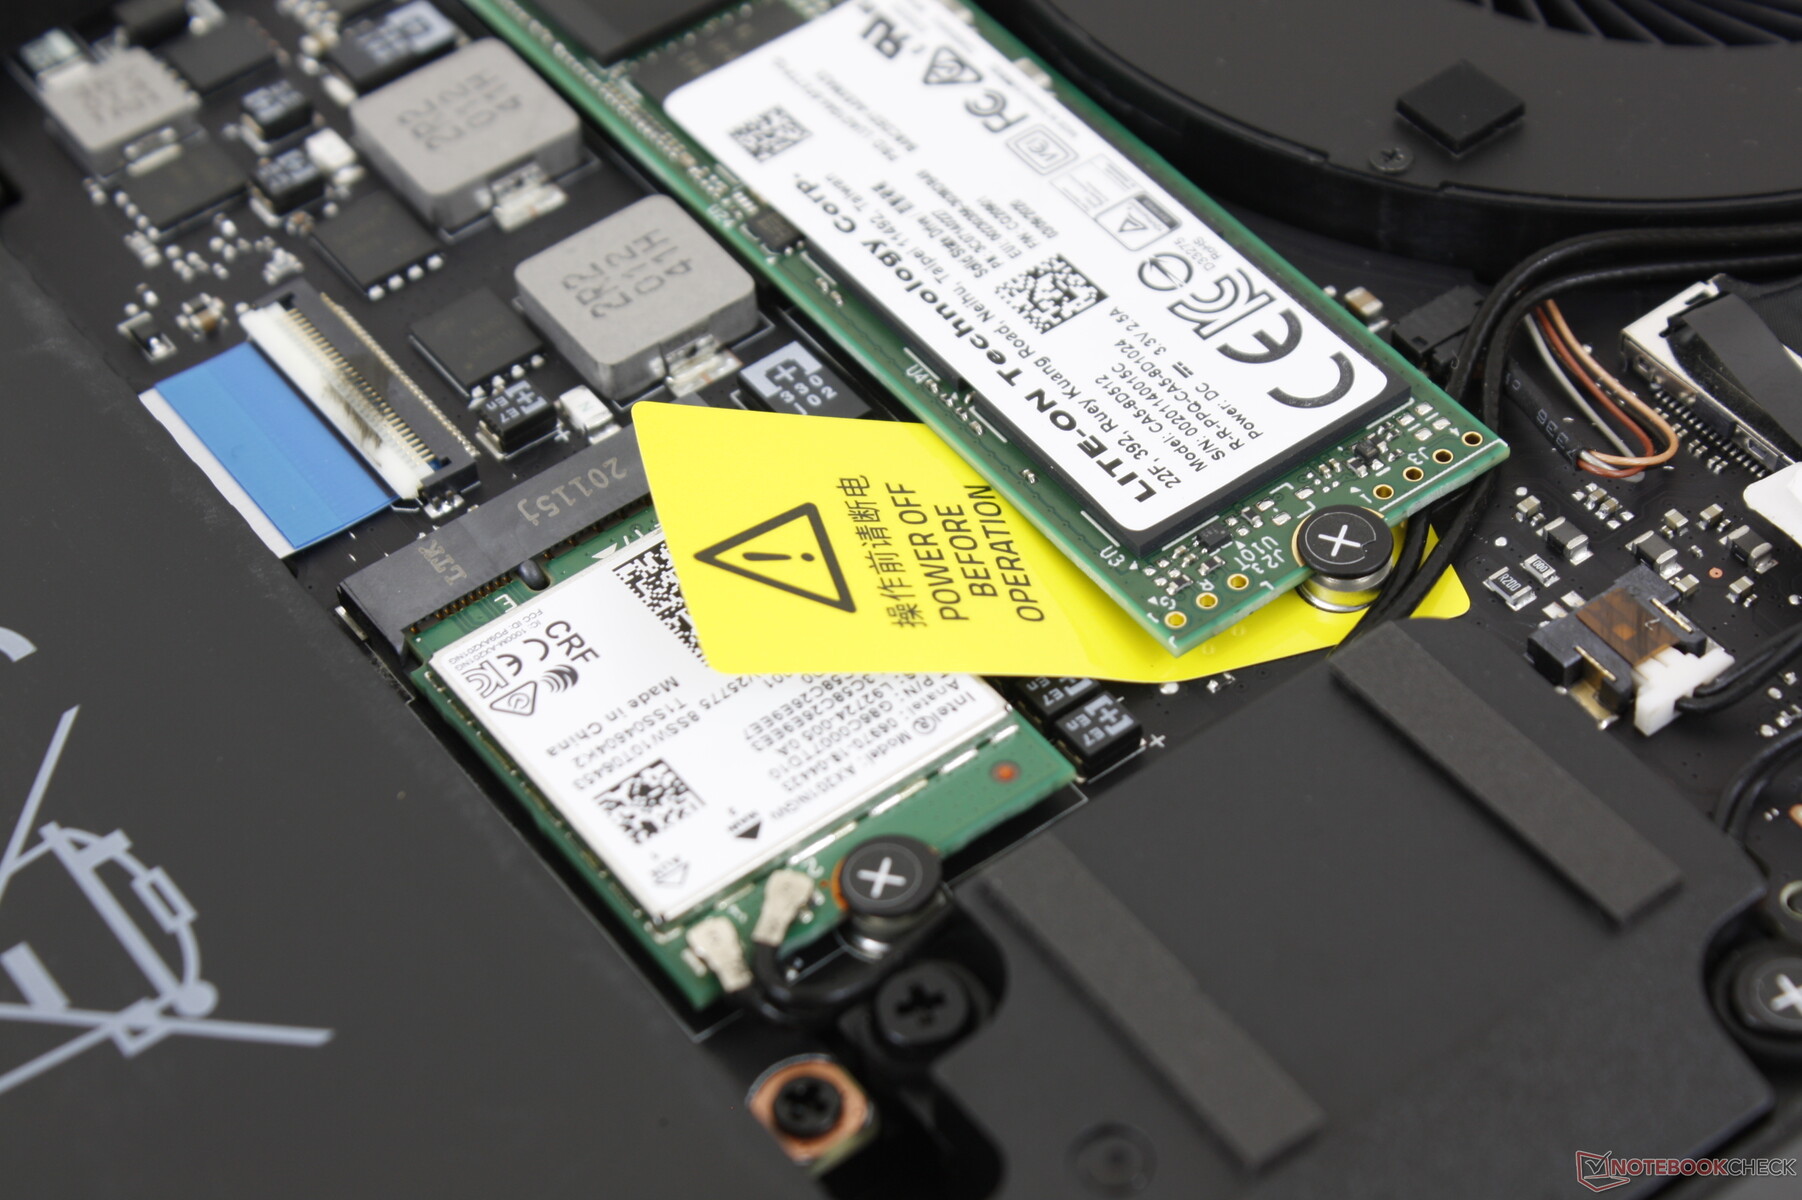
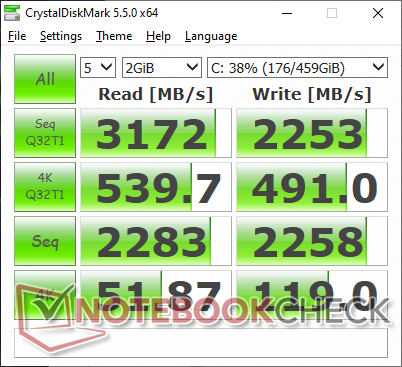
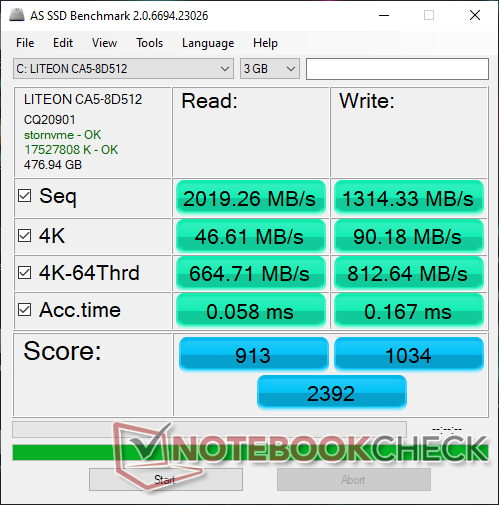
Almost all Razer laptops comes with either a Samsung or Lite-On SSD, but it's difficult to know exactly which one of the two you might be getting. Our particular unit comes equipped with the 512 GB Lite-On CA5-8D512 NVMe drive for generally slower performance than the Samsung SSD PM981a. Unless if you're a content creator working with numerous small files, however, then you're probably not going to notice the difference.
| Razer Blade Pro 17 RTX 2070 Max-Q 300 Hz Lite-On CA5-8D512 | MSI GS75 Stealth 9SG 2x Samsung SSD PM981 MZVLB1T0HALR (RAID 0) | Alienware m17 R2 P41E 2x SK Hynix PC601 NVMe 512 GB (RAID 0) | Aorus 17G XB Samsung SSD PM981a MZVLB512HBJQ | Razer Blade Pro 17 4K UHD 120 Hz Samsung SSD PM981 MZVLB1T0HALR | |
|---|---|---|---|---|---|
| AS SSD | 41% | 26% | 68% | 54% | |
| Seq Read (MB/s) | 2019 | 2855 41% | 1938 -4% | 1791 -11% | 1881 -7% |
| Seq Write (MB/s) | 1314 | 2687 104% | 2094 59% | 2193 67% | 2354 79% |
| 4K Read (MB/s) | 46.61 | 30.31 -35% | 25.88 -44% | 50.7 9% | 43.42 -7% |
| 4K Write (MB/s) | 90.2 | 96.3 7% | 100.8 12% | 116.8 29% | 104.1 15% |
| 4K-64 Read (MB/s) | 665 | 1460 120% | 1217 83% | 1525 129% | 1805 171% |
| 4K-64 Write (MB/s) | 813 | 1224 51% | 1137 40% | 1958 141% | 1775 118% |
| Access Time Read * (ms) | 0.058 | 0.054 7% | 0.051 12% | 0.07 -21% | 0.049 16% |
| Access Time Write * (ms) | 0.167 | 0.038 77% | 0.107 36% | 0.032 81% | 0.106 37% |
| Score Read (Points) | 913 | 1776 95% | 1437 57% | 1755 92% | 2037 123% |
| Score Write (Points) | 1034 | 1589 54% | 1447 40% | 2294 122% | 2115 105% |
| Score Total (Points) | 2392 | 4259 78% | 3624 52% | 4972 108% | 5215 118% |
| Copy ISO MB/s (MB/s) | 1715 | 2226 30% | 1926 12% | 1877 9% | |
| Copy Program MB/s (MB/s) | 622 | 426.4 -31% | 626 1% | 539 -13% | |
| Copy Game MB/s (MB/s) | 1506 | 1152 -24% | 1533 2% | 1368 -9% | |
| CrystalDiskMark 5.2 / 6 | 4% | -3% | 5% | -10% | |
| Write 4K (MB/s) | 119 | 95.5 -20% | 110.6 -7% | 123.4 4% | 121.7 2% |
| Read 4K (MB/s) | 51.9 | 42.59 -18% | 41.46 -20% | 45.02 -13% | 43.81 -16% |
| Write Seq (MB/s) | 2258 | 2851 26% | 2378 5% | 2526 12% | 1276 -43% |
| Read Seq (MB/s) | 2283 | 2696 18% | 2114 -7% | 2062 -10% | 1183 -48% |
| Write 4K Q32T1 (MB/s) | 491 | 402.6 -18% | 445.4 -9% | 497.9 1% | 527 7% |
| Read 4K Q32T1 (MB/s) | 540 | 443.9 -18% | 509 -6% | 579 7% | 592 10% |
| Write Seq Q32T1 (MB/s) | 2253 | 3420 52% | 2735 21% | 2982 32% | 2379 6% |
| Read Seq Q32T1 (MB/s) | 3172 | 3514 11% | 3206 1% | 3440 8% | 3213 1% |
| Total Average (Program / Settings) | 23% /
28% | 12% /
15% | 37% /
41% | 22% /
31% |
* ... smaller is better

Disk Throttling: DiskSpd Read Loop, Queue Depth 8
GPU Performance
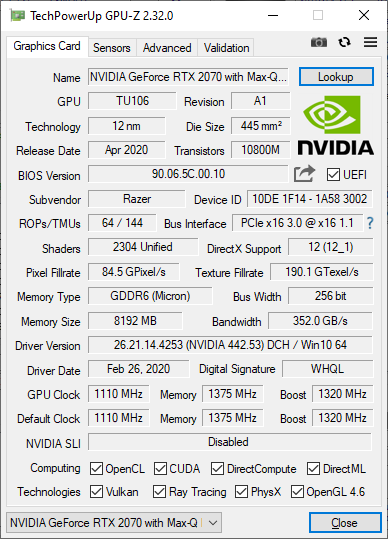
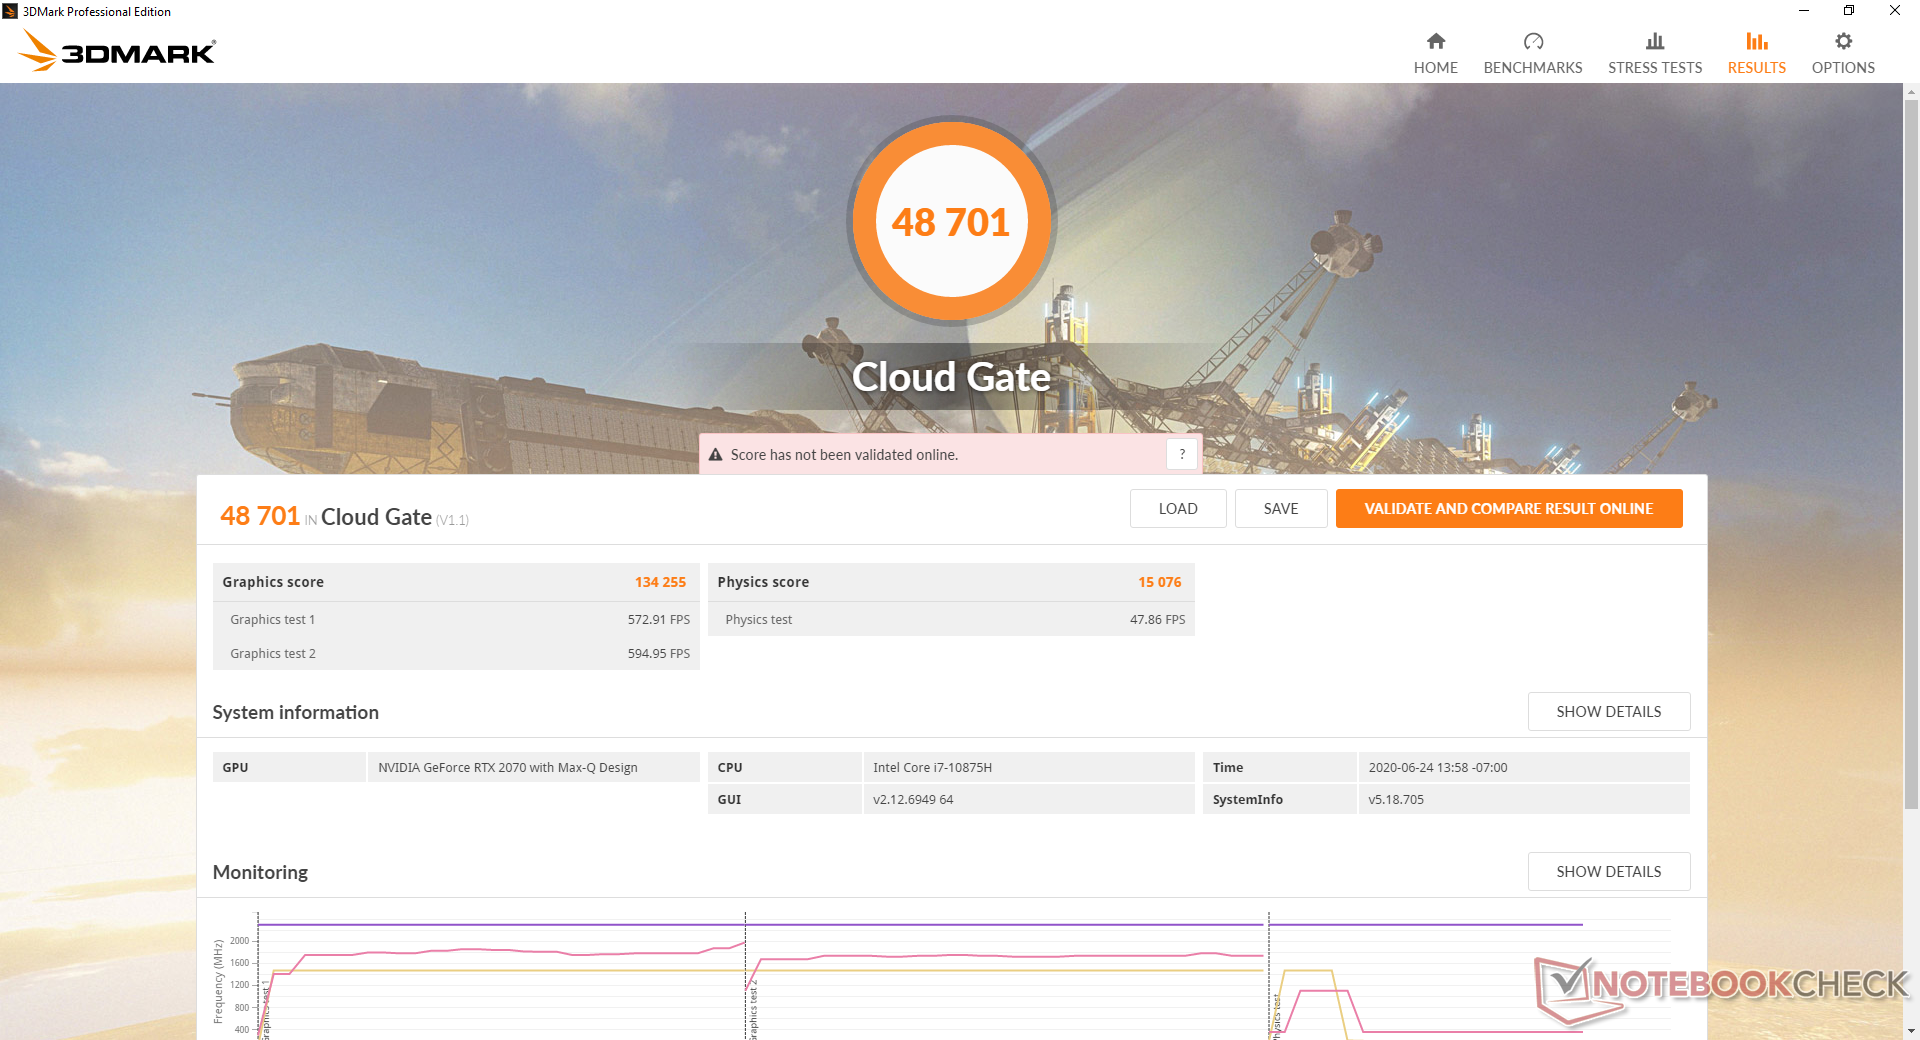
We noted in the past that the performance differences between the older Max-Q and newer Super Max-Q GeForce GPUs can be so narrow that certain laptops with older Max-Q GPUs could sometimes outperform their newer Super Max-Q counterparts. In this case, the RTX 2070 Max-Q in our Razer is able to consistently outscore the newer RTX 2070 Super Max-Q in the Aorus 17G and even the RTX 2080 Super Max-Q in the MSI GS66. Razer offers an RTX 2080 Super Max-Q option as well, but don't feel like you'll be missing much if you decide to "settle" with the RTX 2070 Max-Q.
See our dedicated page on the GeForce RTX 2070 Max-Q for more technical information and gaming benchmarks.
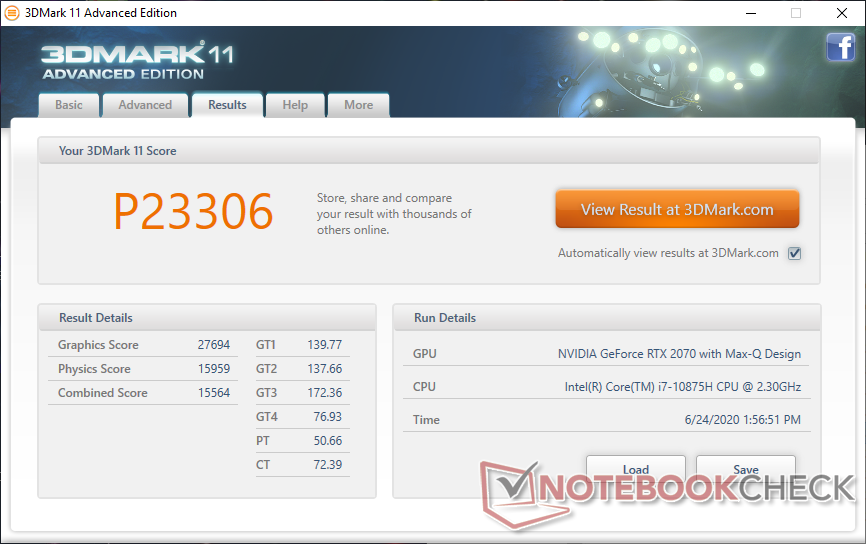
| 3DMark 11 Performance | 23306 points | |
| 3DMark Cloud Gate Standard Score | 48701 points | |
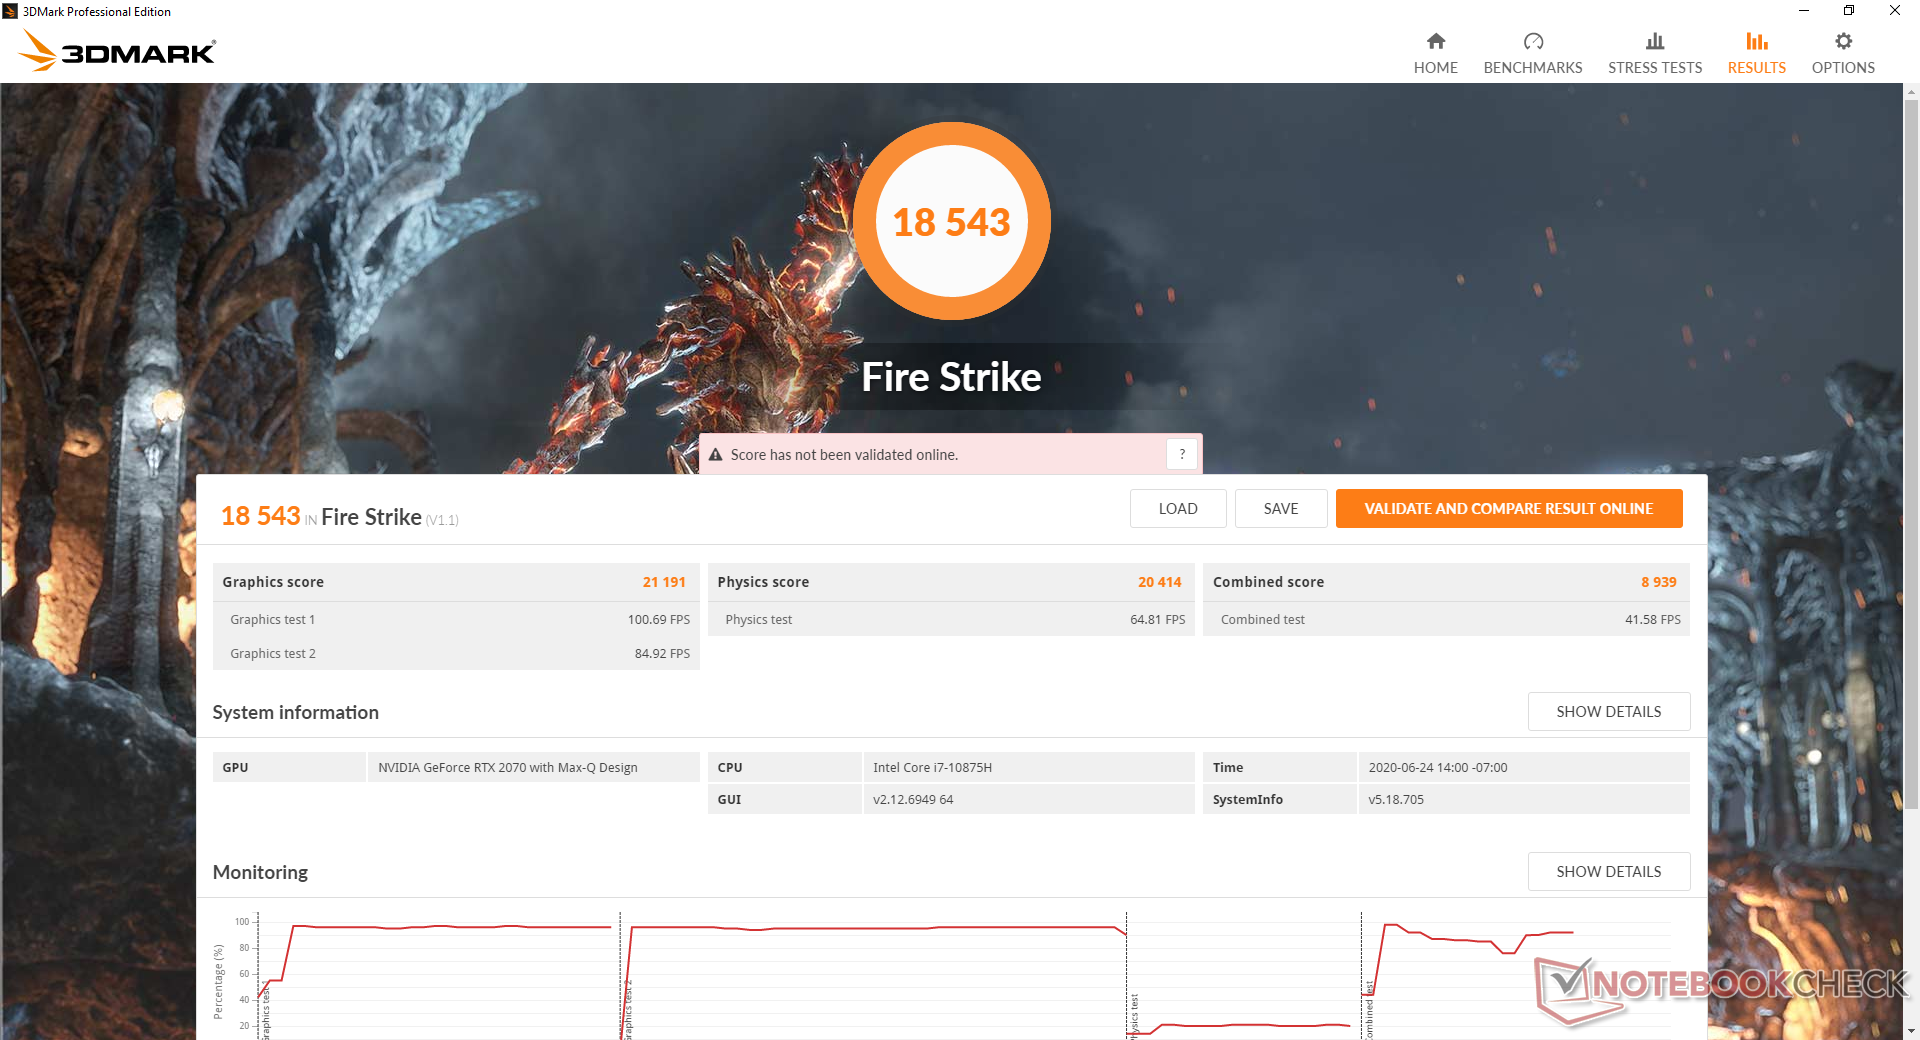
| 3DMark Fire Strike Score | 18543 points | |
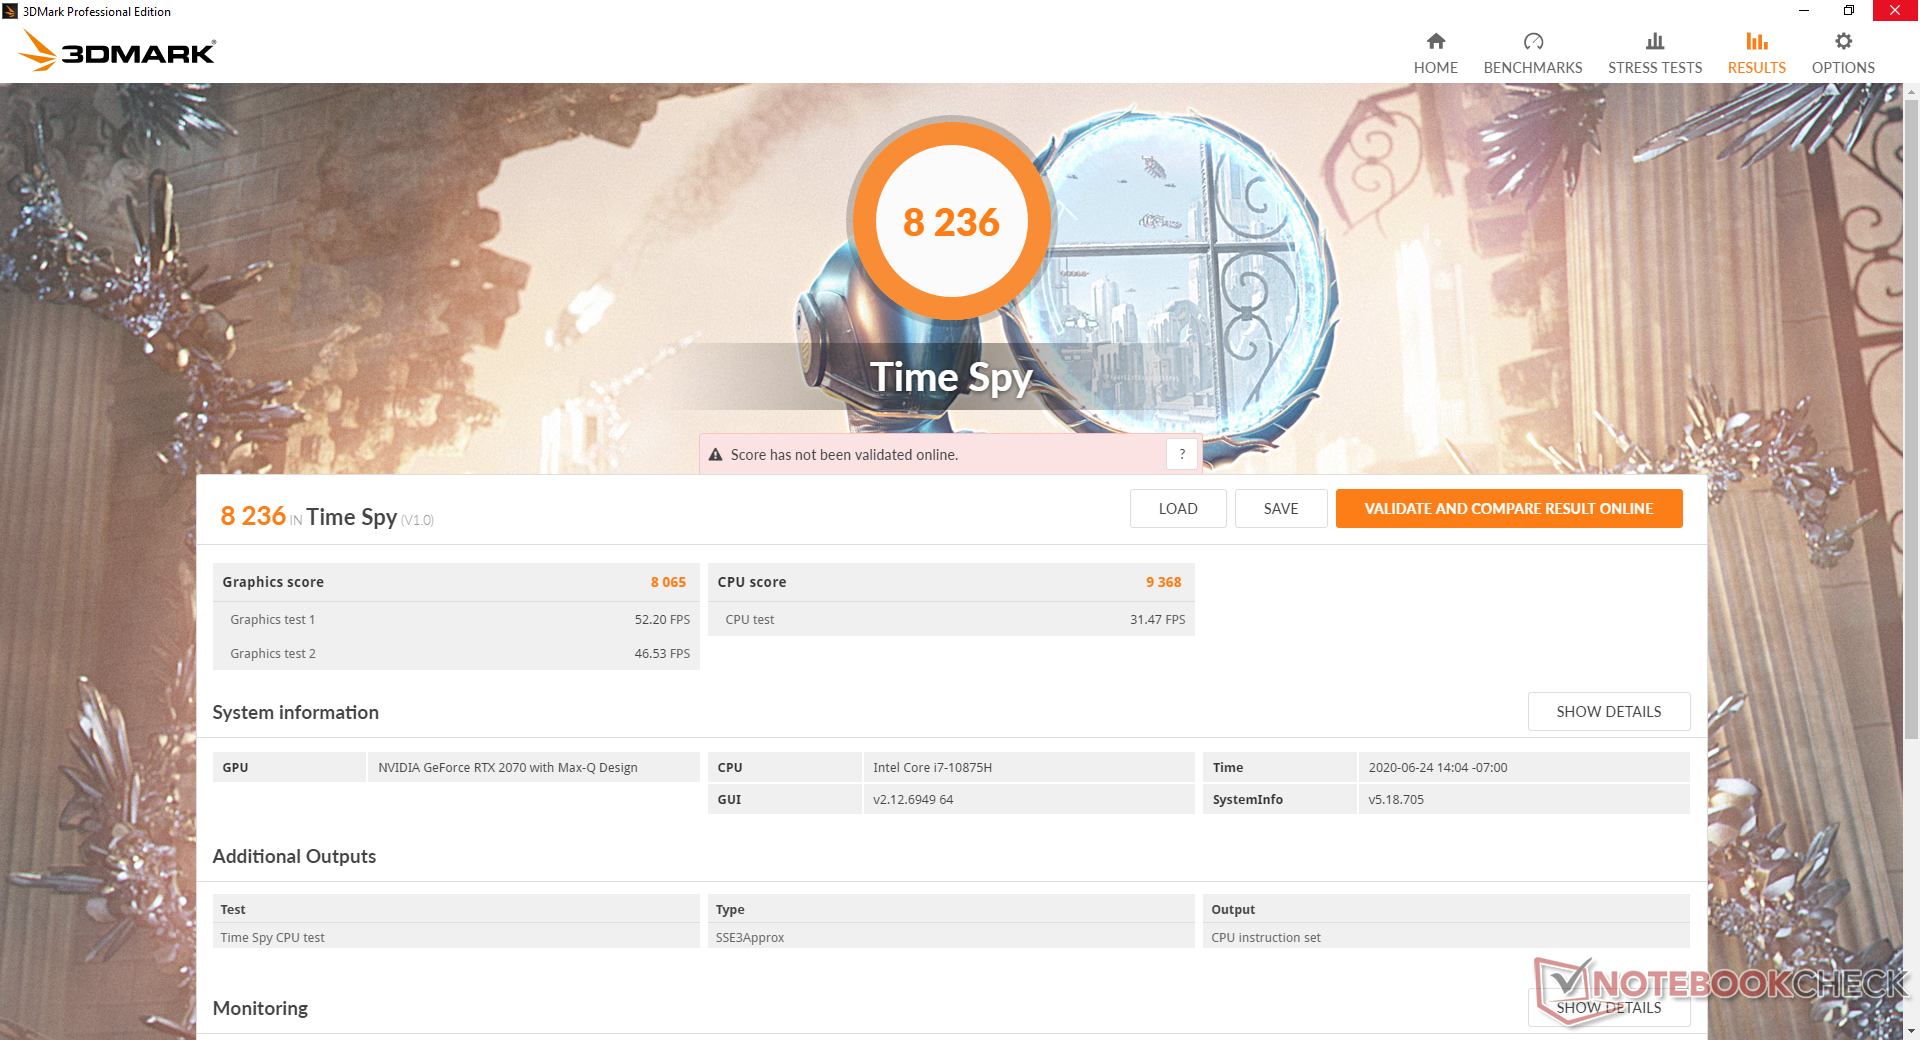
| 3DMark Time Spy Score | 8236 points | |
Help | ||
| low | med. | high | ultra | |
|---|---|---|---|---|
| The Witcher 3 (2015) | 355.6 | 254.3 | 151.4 | 80.9 |
| Dota 2 Reborn (2015) | 143 | 138 | 135 | 126 |
| X-Plane 11.11 (2018) | 112 | 101 | 85.3 |
Emissions
System Noise
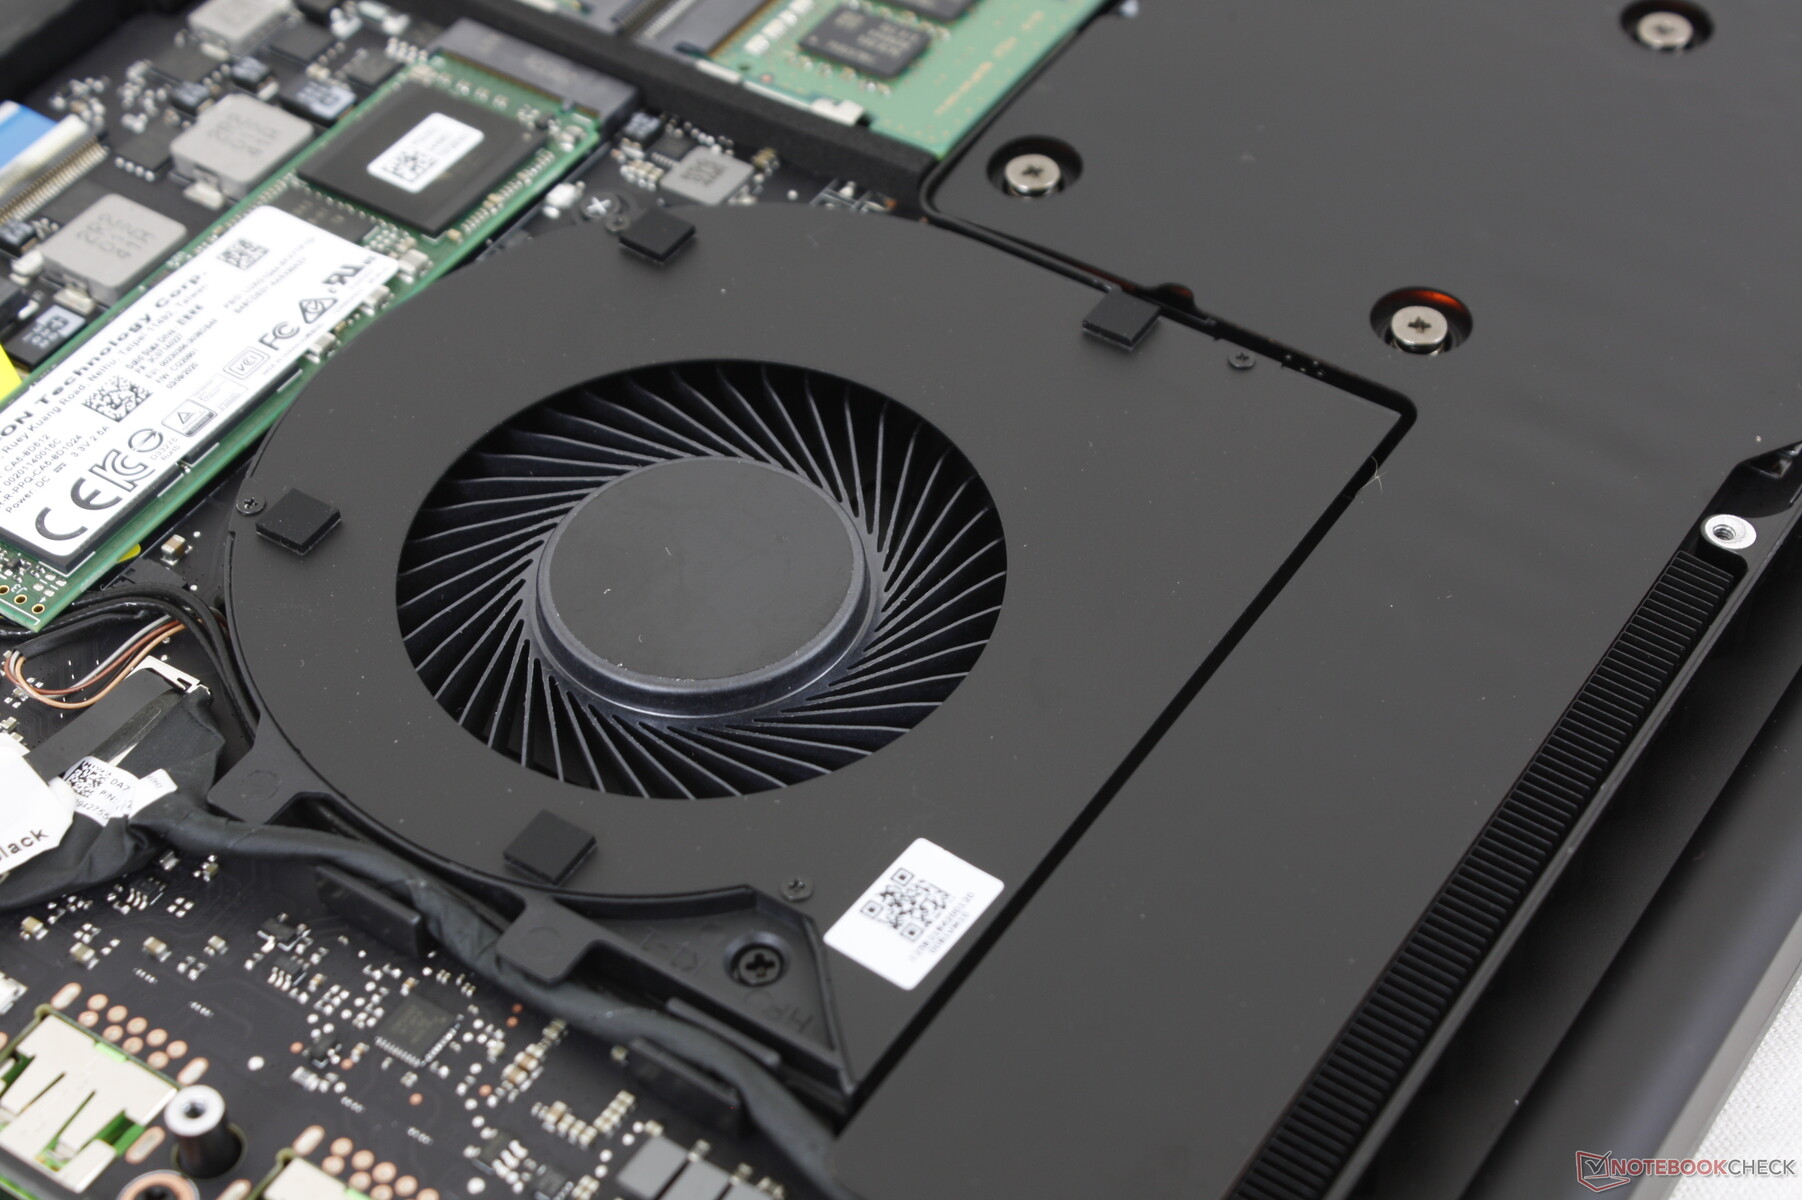
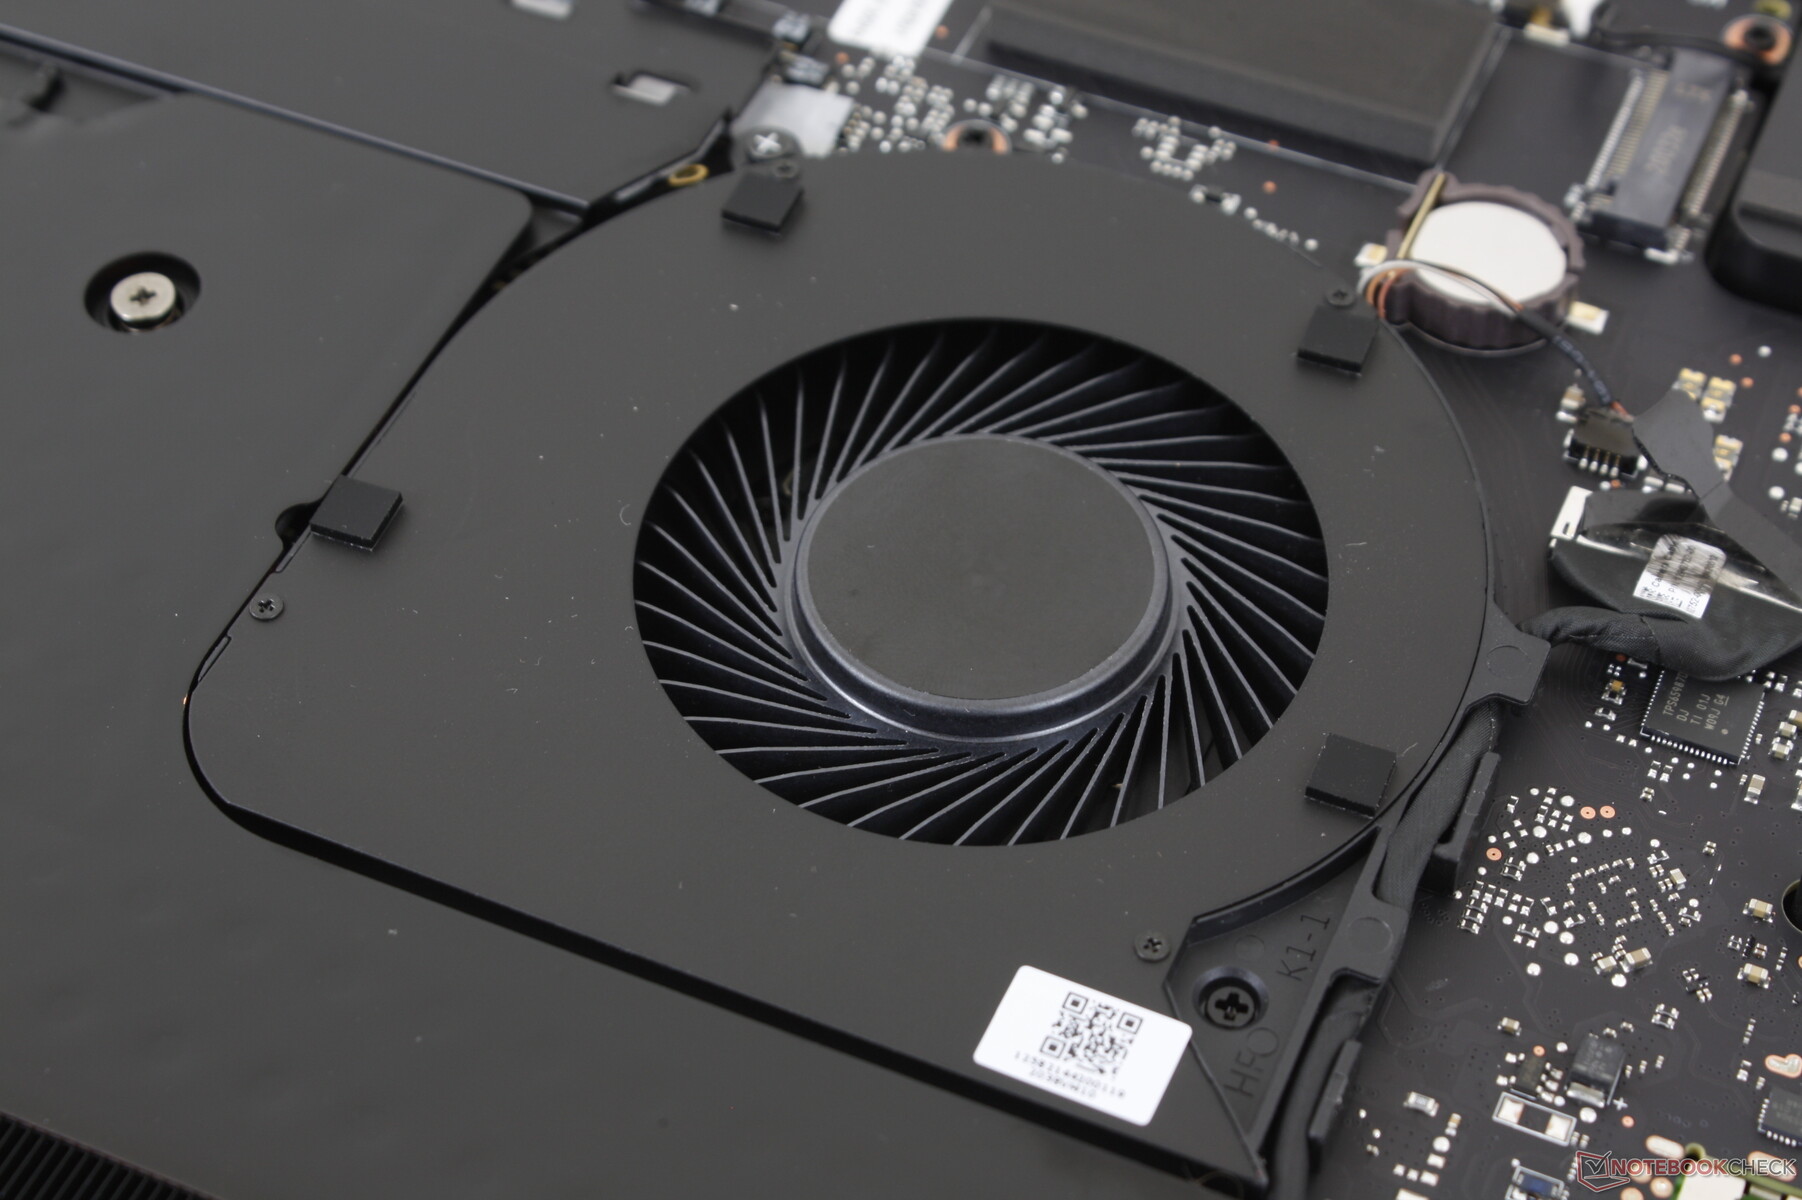
Fan noise and behavior are essentially the same as last year's model since the vapor chamber remains untouched. Fan noise is quiet at just 30.5 dB(A) if only browsing or video streaming on the Balanced profile. Meanwhile, gaming on High Performance mode can be as loud as 45 dB(A) to 53 dB(A) depending on CPU and GPU utilization. The Razer doesn't run all that much quieter or louder than its competitors despite its unique cooling solution.
| Razer Blade Pro 17 RTX 2070 Max-Q 300 Hz GeForce RTX 2070 Max-Q, i7-10875H, Lite-On CA5-8D512 | Asus ROG Zephyrus S GX701GXR GeForce RTX 2080 Max-Q, i7-9750H, Samsung SSD PM981 MZVLB1T0HALR | MSI GS75 Stealth 9SG GeForce RTX 2080 Max-Q, i7-9750H, 2x Samsung SSD PM981 MZVLB1T0HALR (RAID 0) | Alienware m17 R2 P41E GeForce RTX 2080 Max-Q, i9-9980HK, 2x SK Hynix PC601 NVMe 512 GB (RAID 0) | Aorus 17G XB GeForce RTX 2070 Super Max-Q, i7-10875H, Samsung SSD PM981a MZVLB512HBJQ | Razer Blade Pro 17 RTX 2080 Max-Q GeForce RTX 2080 Max-Q, i7-9750H, Samsung SSD PM981 MZVLB512HAJQ | |
|---|---|---|---|---|---|---|
| Noise | -3% | -6% | -3% | -12% | 1% | |
| off / environment * (dB) | 28.2 | 30 -6% | 30 -6% | 29.1 -3% | 30 -6% | 28.2 -0% |
| Idle Minimum * (dB) | 28.2 | 32 -13% | 31 -10% | 29.4 -4% | 35 -24% | 28.2 -0% |
| Idle Average * (dB) | 28.2 | 33 -17% | 32 -13% | 29.4 -4% | 36 -28% | 28.2 -0% |
| Idle Maximum * (dB) | 30.5 | 34 -11% | 38 -25% | 31.5 -3% | 41 -34% | 30.8 -1% |
| Load Average * (dB) | 42.2 | 40 5% | 47 -11% | 49.7 -18% | 47 -11% | 42 -0% |
| Witcher 3 ultra * (dB) | 53 | 49 8% | 48 9% | 49.5 7% | 48 9% | 51 4% |
| Load Maximum * (dB) | 55.5 | 50 10% | 49 12% | 53.3 4% | 49 12% | 53 5% |
* ... smaller is better
Noise level
| Idle |
| 28.2 / 28.2 / 30.5 dB(A) |
| Load |
| 42.2 / 55.5 dB(A) |
 | ||
30 dB silent 40 dB(A) audible 50 dB(A) loud |
||
min: | ||
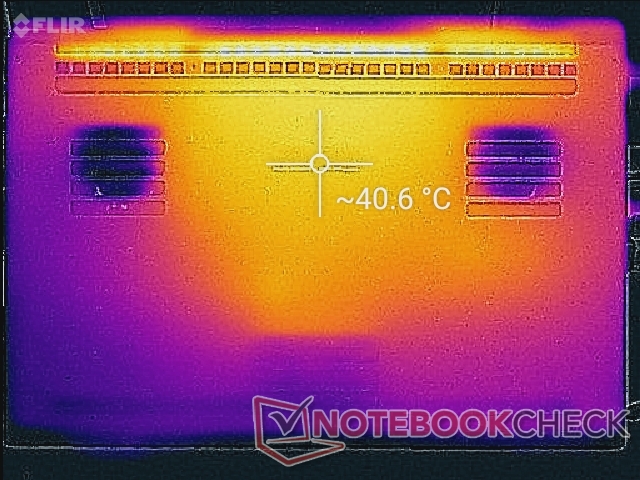
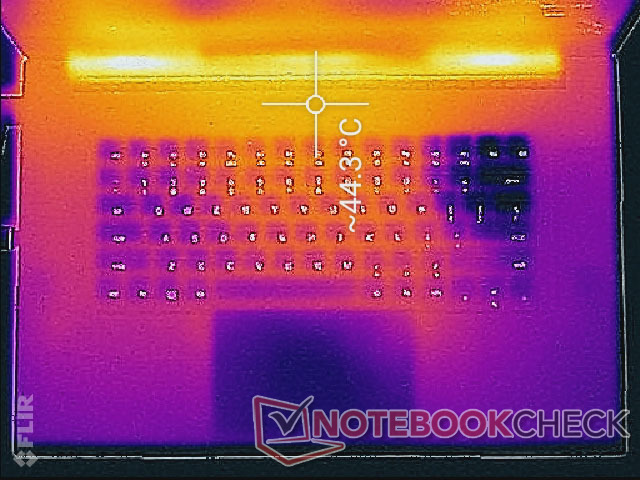
Temperature
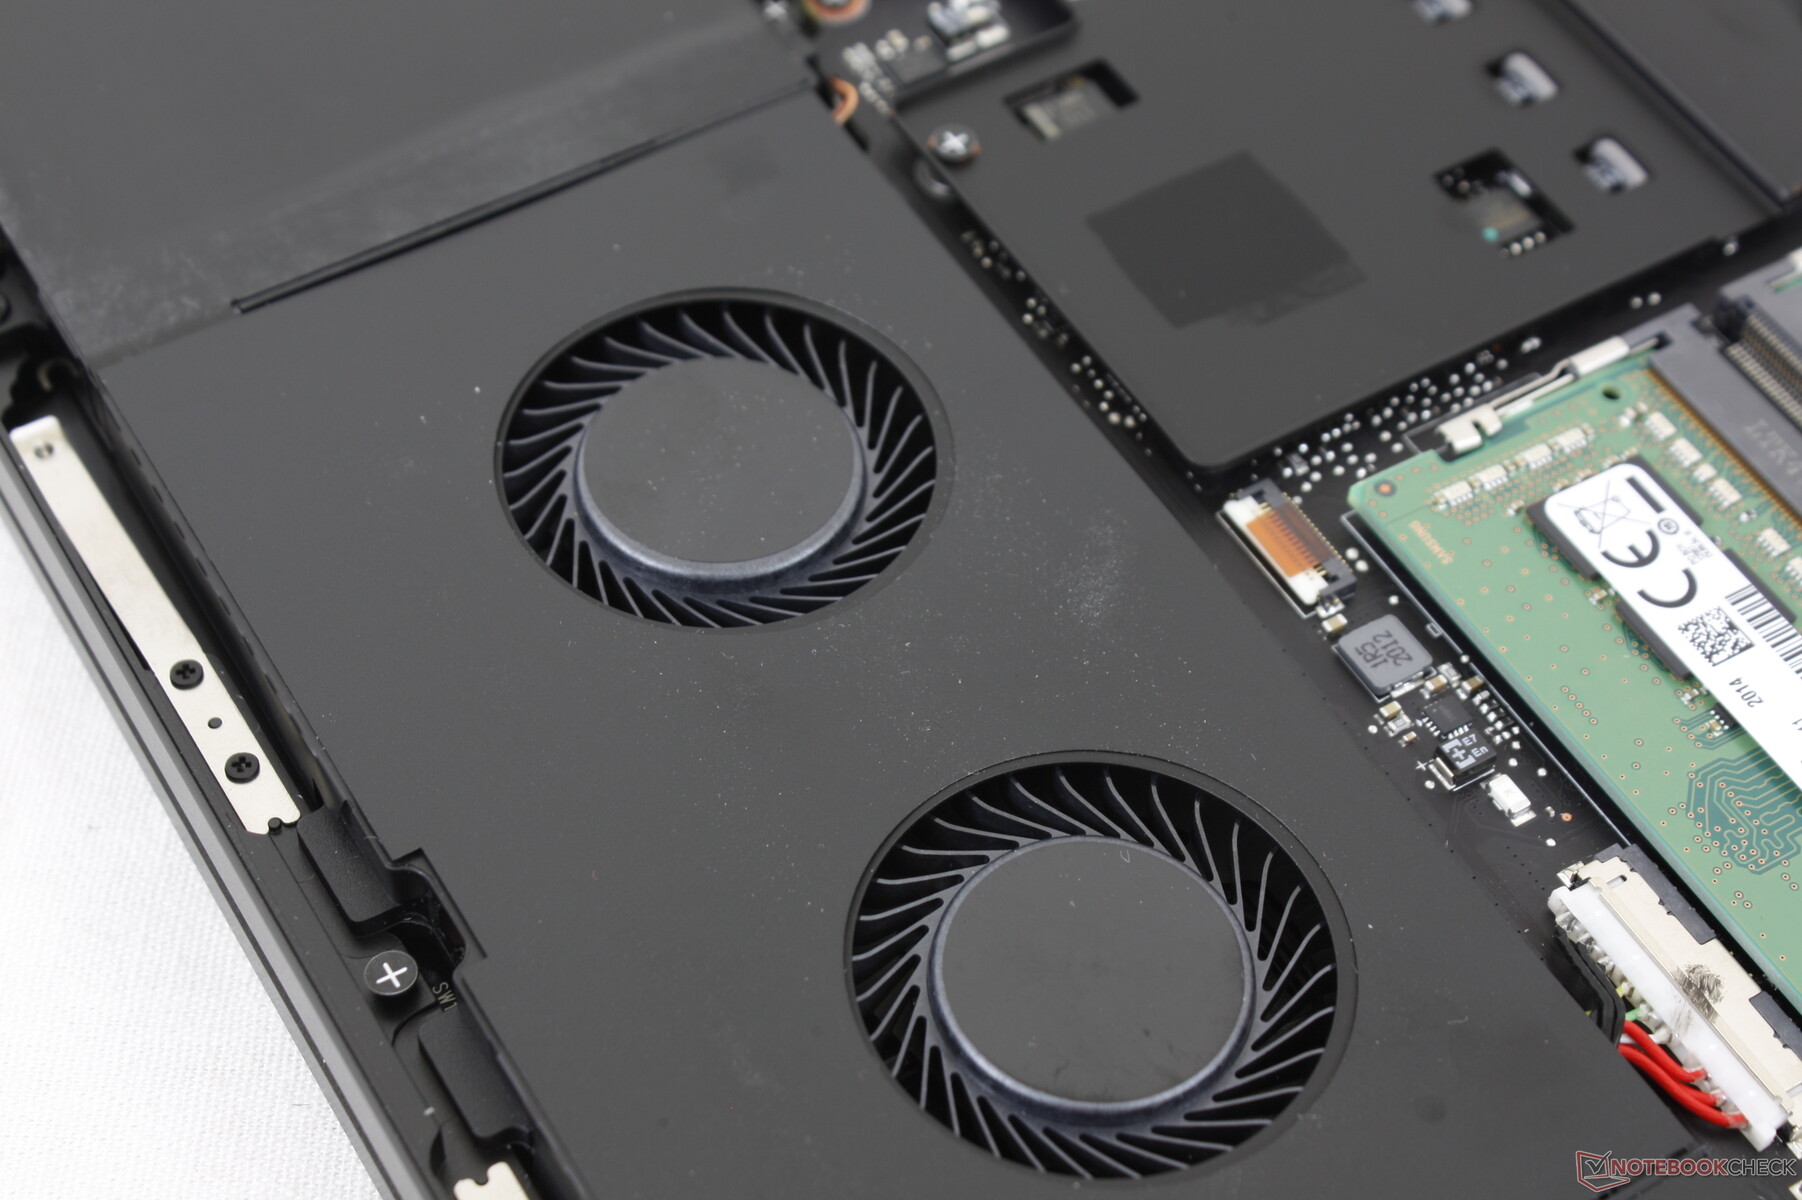
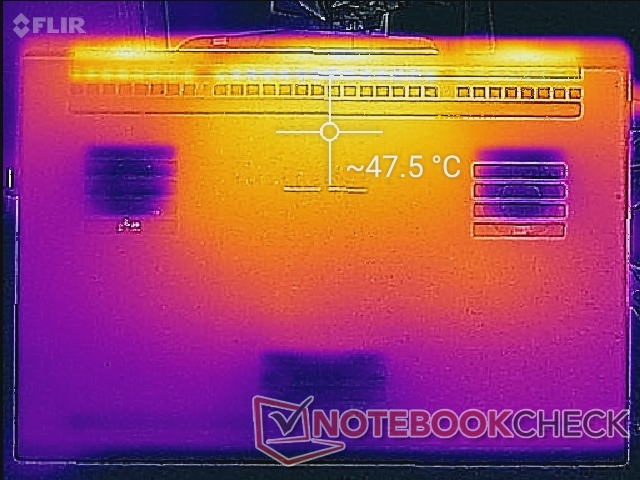
Surface temperatures are warm even when idling on desktop despite having four fans inside. The system is automatically set to run as quietly as possible when there is not much onscreen activity meaning that surface temperatures will be warmer than expected. Thankfully, it's not too warm to be uncomfortable when simply browsing or playing videos. It's possible to turn the fans on high manually during undemanding loads for cooler surface temperatures if desired.
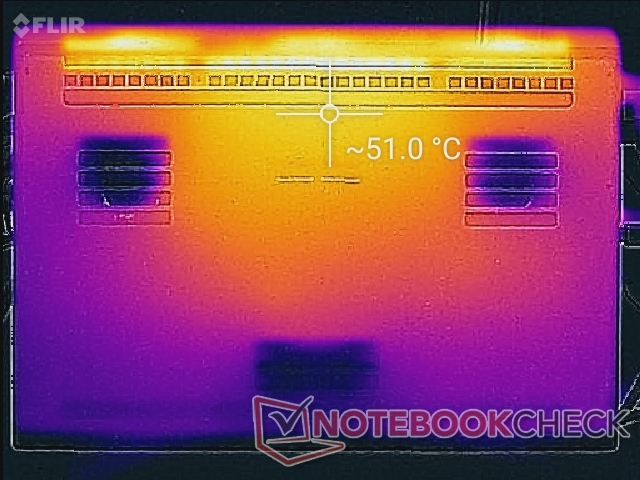
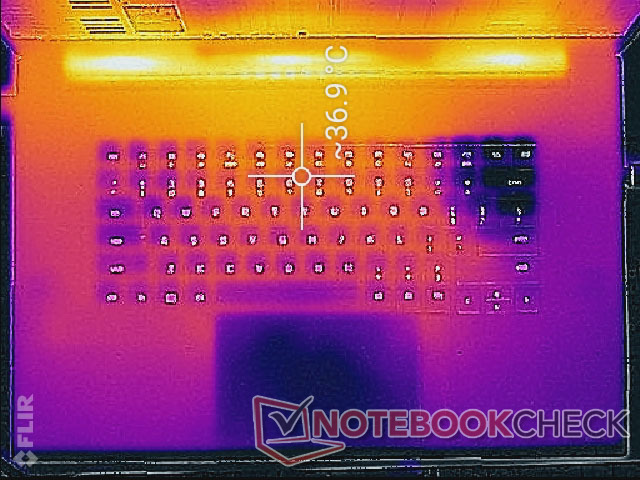
When gaming, hot spots can become as warm as 45 C on both the top and bottom of the laptop. These areas are toward the rear of the chassis away from the palm rests and WASD keys. Interestingly, the larger form factor of the Blade Pro 17 doesn't mean that its hot spots are cooler than on the smaller Blade 15. Rather, its WASD keys and palm rests can be kept cooler instead since these areas are naturally further away from the processors.
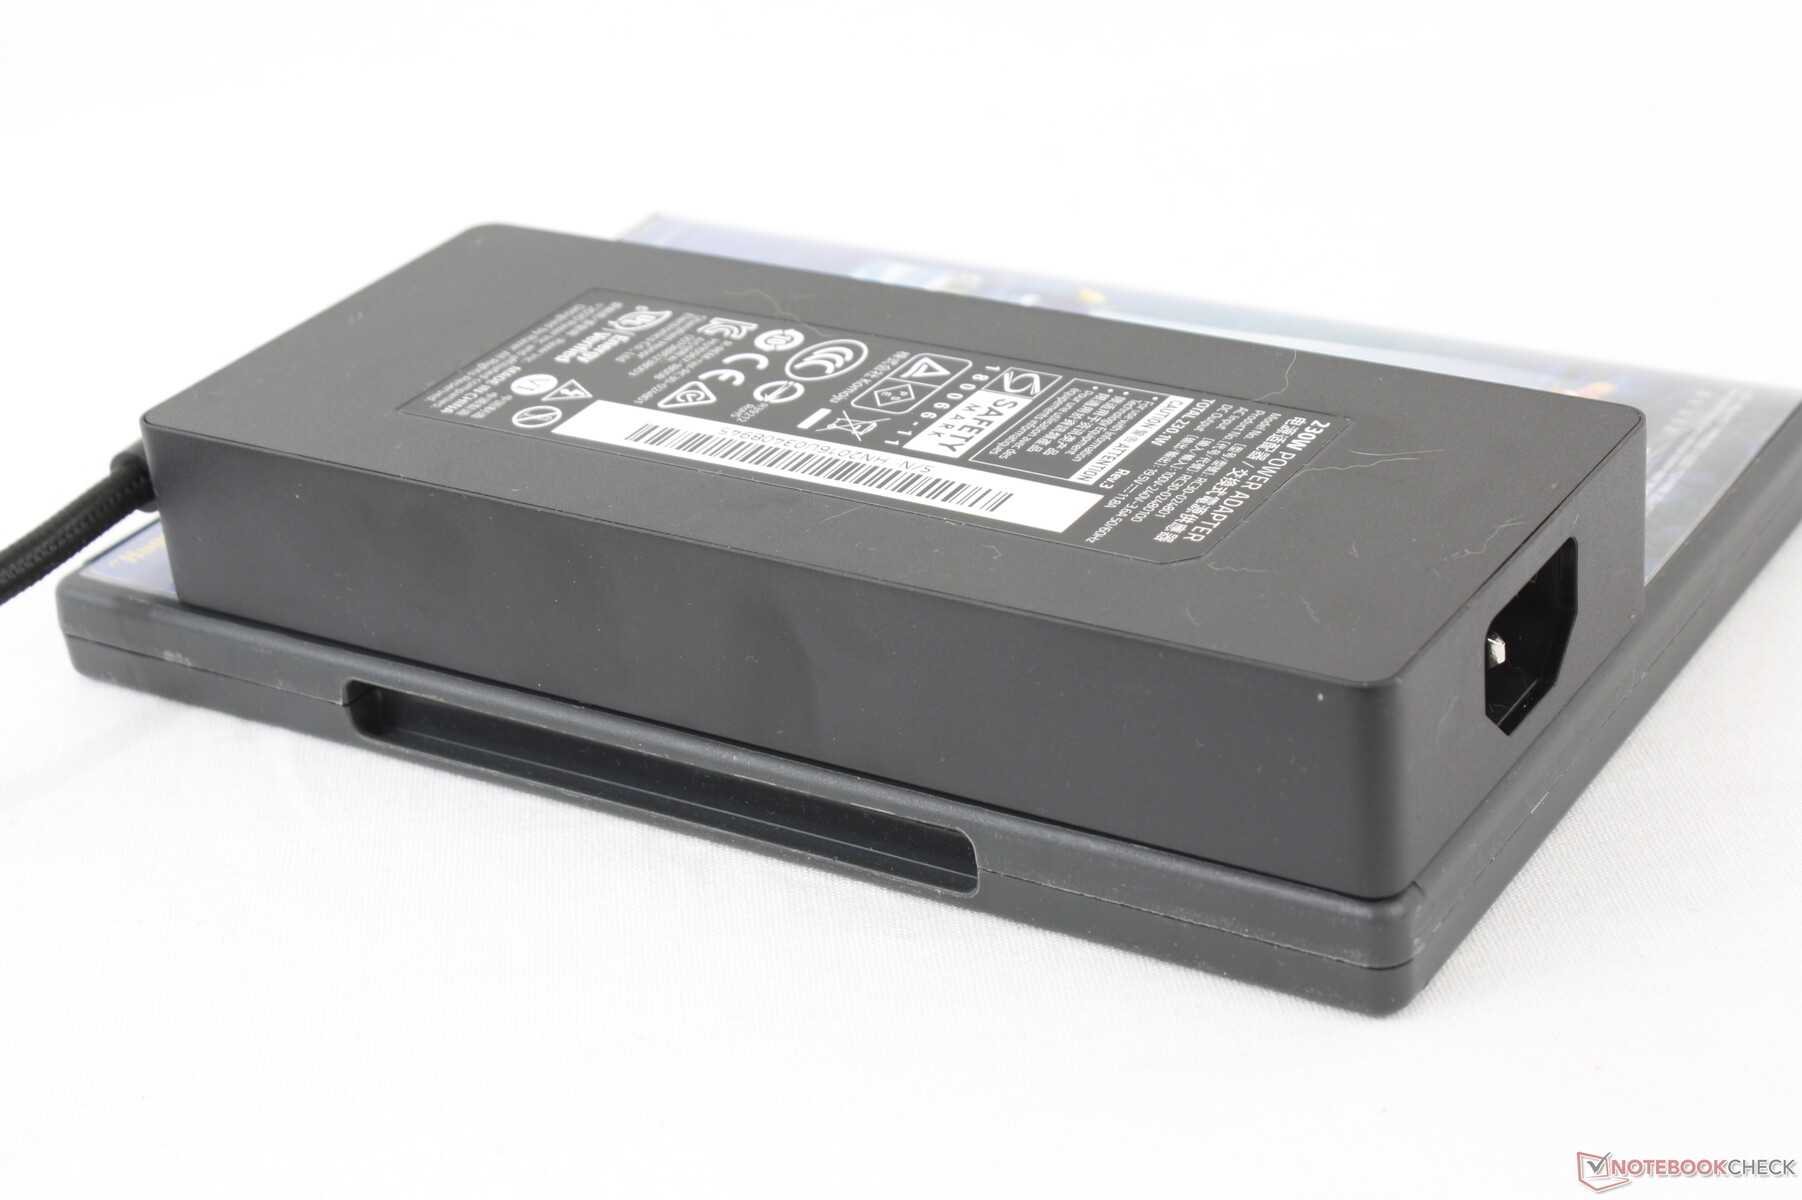
Keep in mind that the AC adapter for the Blade series can run much hotter than most other AC adapters when gaming.
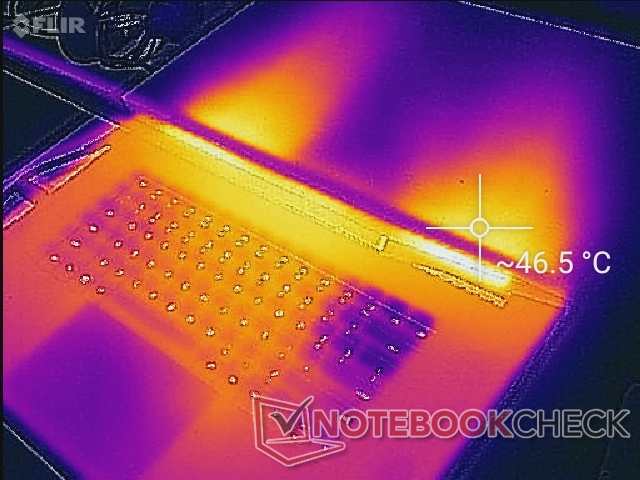

(±) The maximum temperature on the upper side is 40.8 °C / 105 F, compared to the average of 40.4 °C / 105 F, ranging from 21.2 to 68.8 °C for the class Gaming.
(-) The bottom heats up to a maximum of 48.4 °C / 119 F, compared to the average of 43.3 °C / 110 F
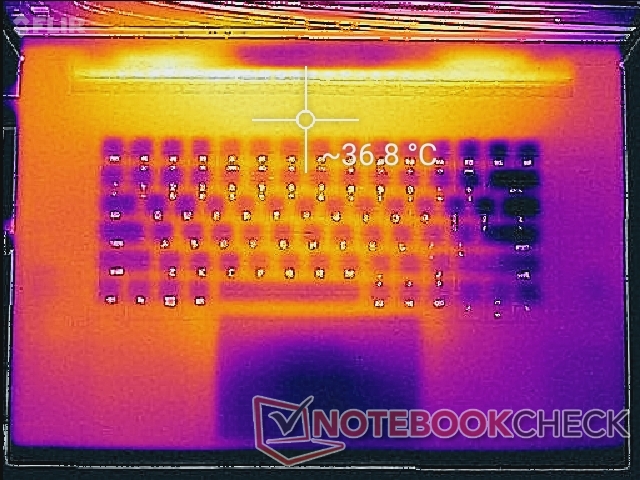
(±) In idle usage, the average temperature for the upper side is 33.3 °C / 92 F, compared to the device average of 33.9 °C / 93 F.
(±) Playing The Witcher 3, the average temperature for the upper side is 35.4 °C / 96 F, compared to the device average of 33.9 °C / 93 F.
(+) The palmrests and touchpad are reaching skin temperature as a maximum (33.2 °C / 91.8 F) and are therefore not hot.
(-) The average temperature of the palmrest area of similar devices was 28.8 °C / 83.8 F (-4.4 °C / -8 F).
Stress Test
When running Prime95, clock rates would boost to 3.8 to 4 GHz for about 20 seconds until hitting a core temperature of 75 C. Afterwards, clock rates would drop to 3.2 GHz in order to maintain a cooler core temperature of 66 C.
Both CPU and GPU temperatures stabilize at only 70 C each when running Witcher 3 to be close to what we recorded on last year's Blade Pro 17 with RTX 2080 Max-Q graphics.
Running on batteries will limit performance. A Fire Strike run on battery power returns Physics and Graphics scores of 10831 and 10128 points, respectively, compared to 20414 and 21191 points when on mains.
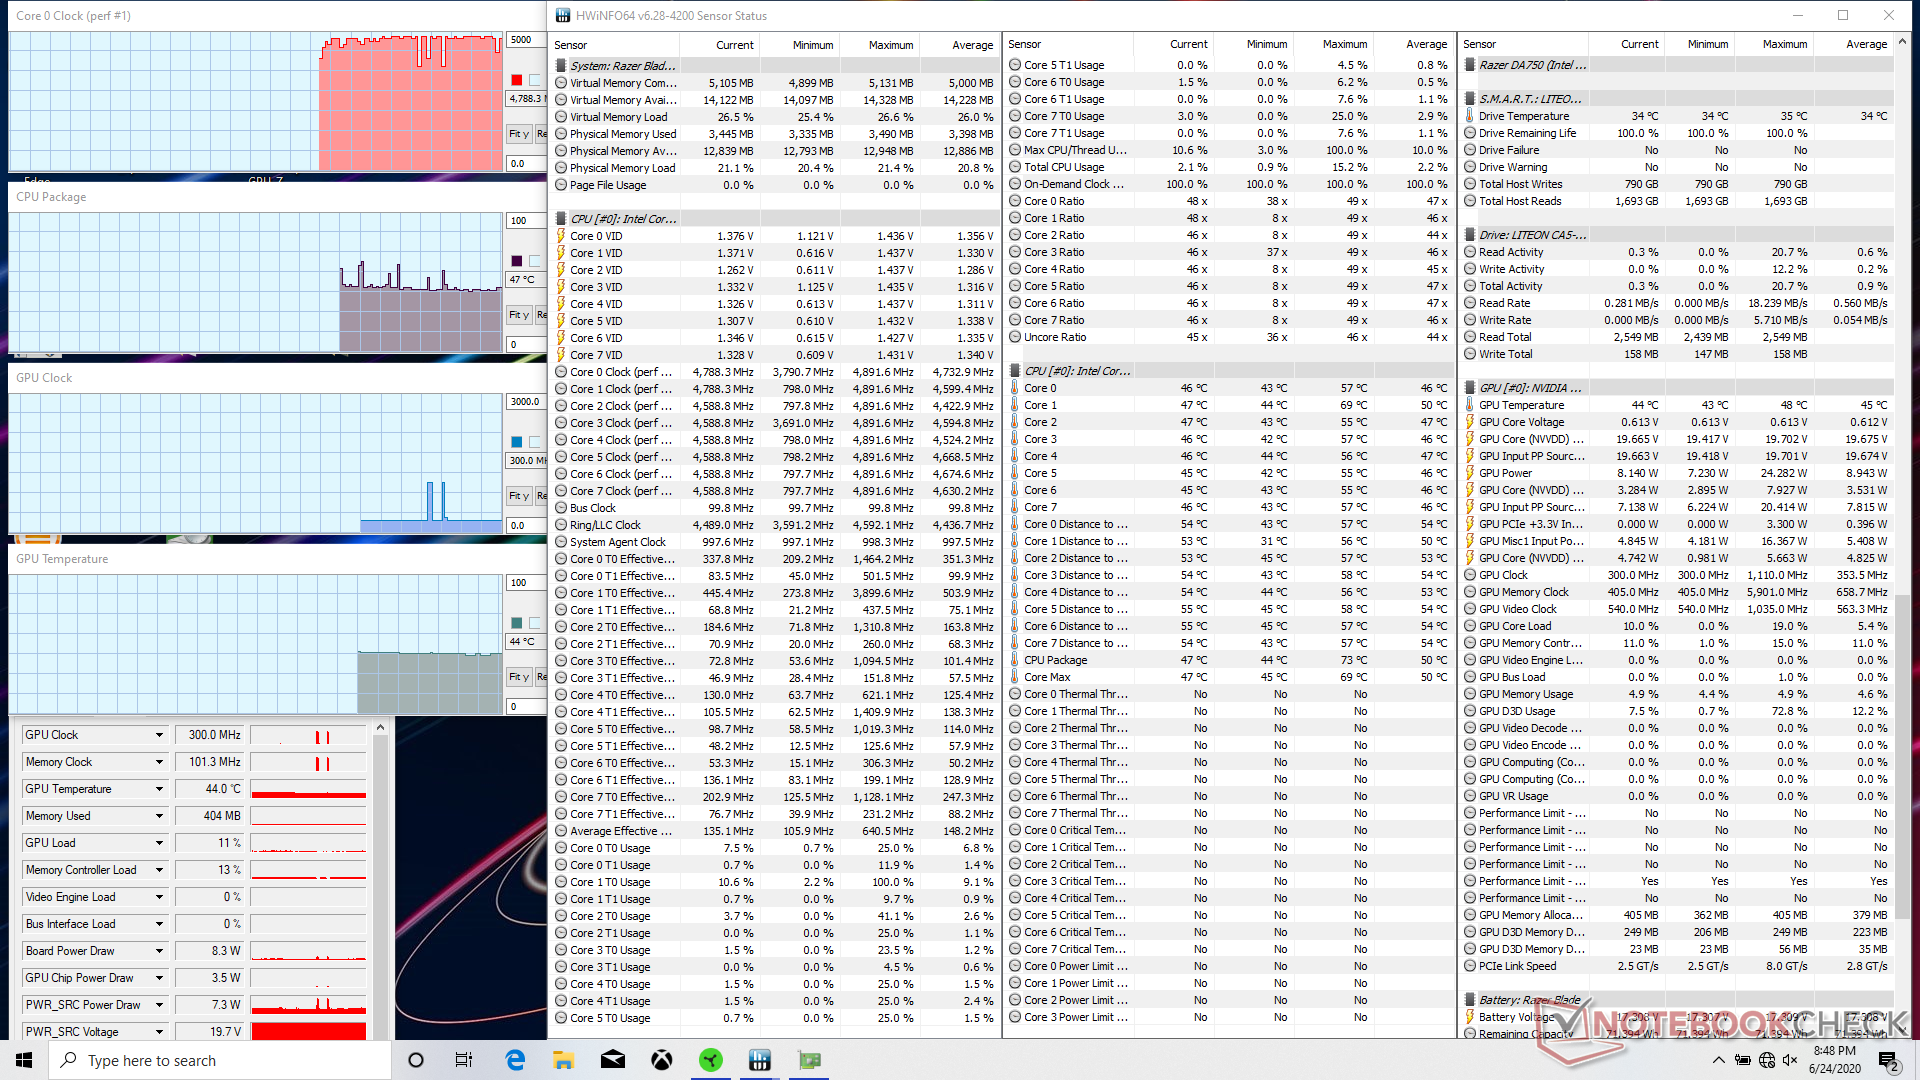
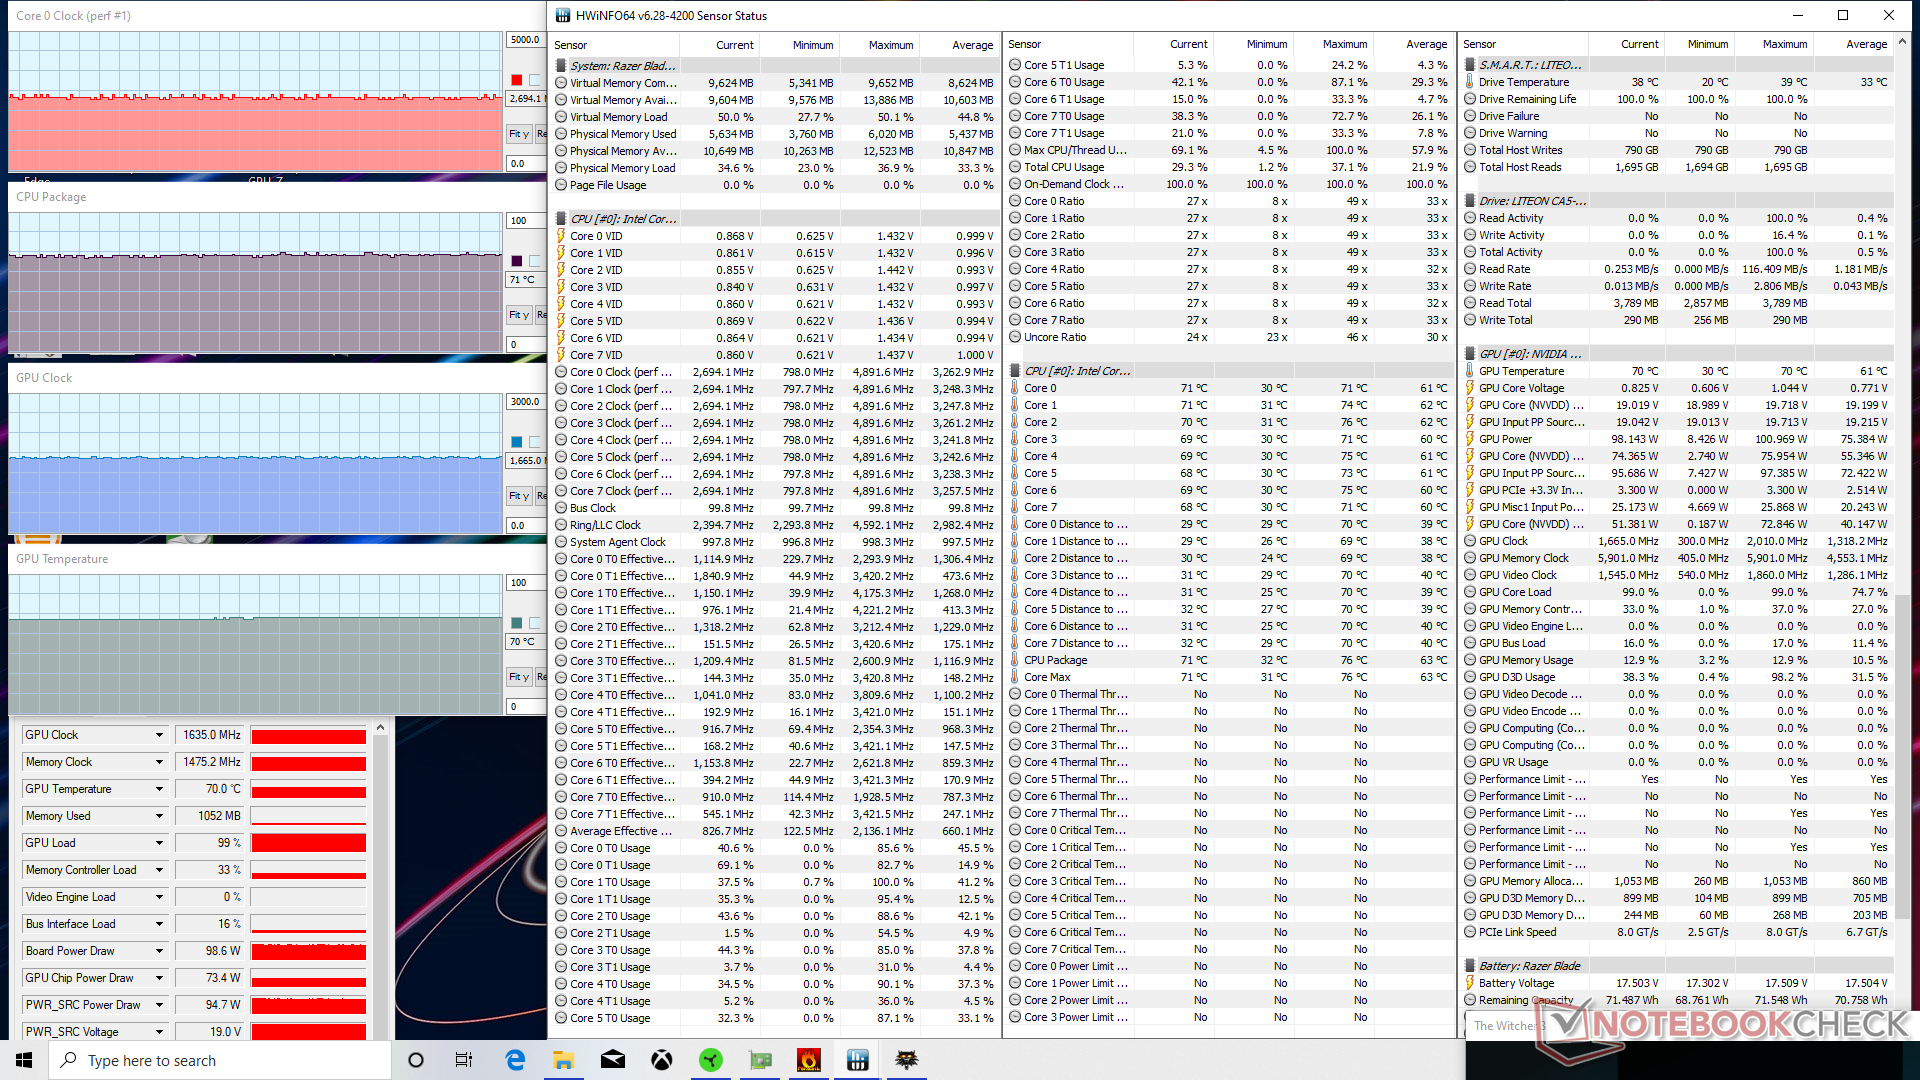
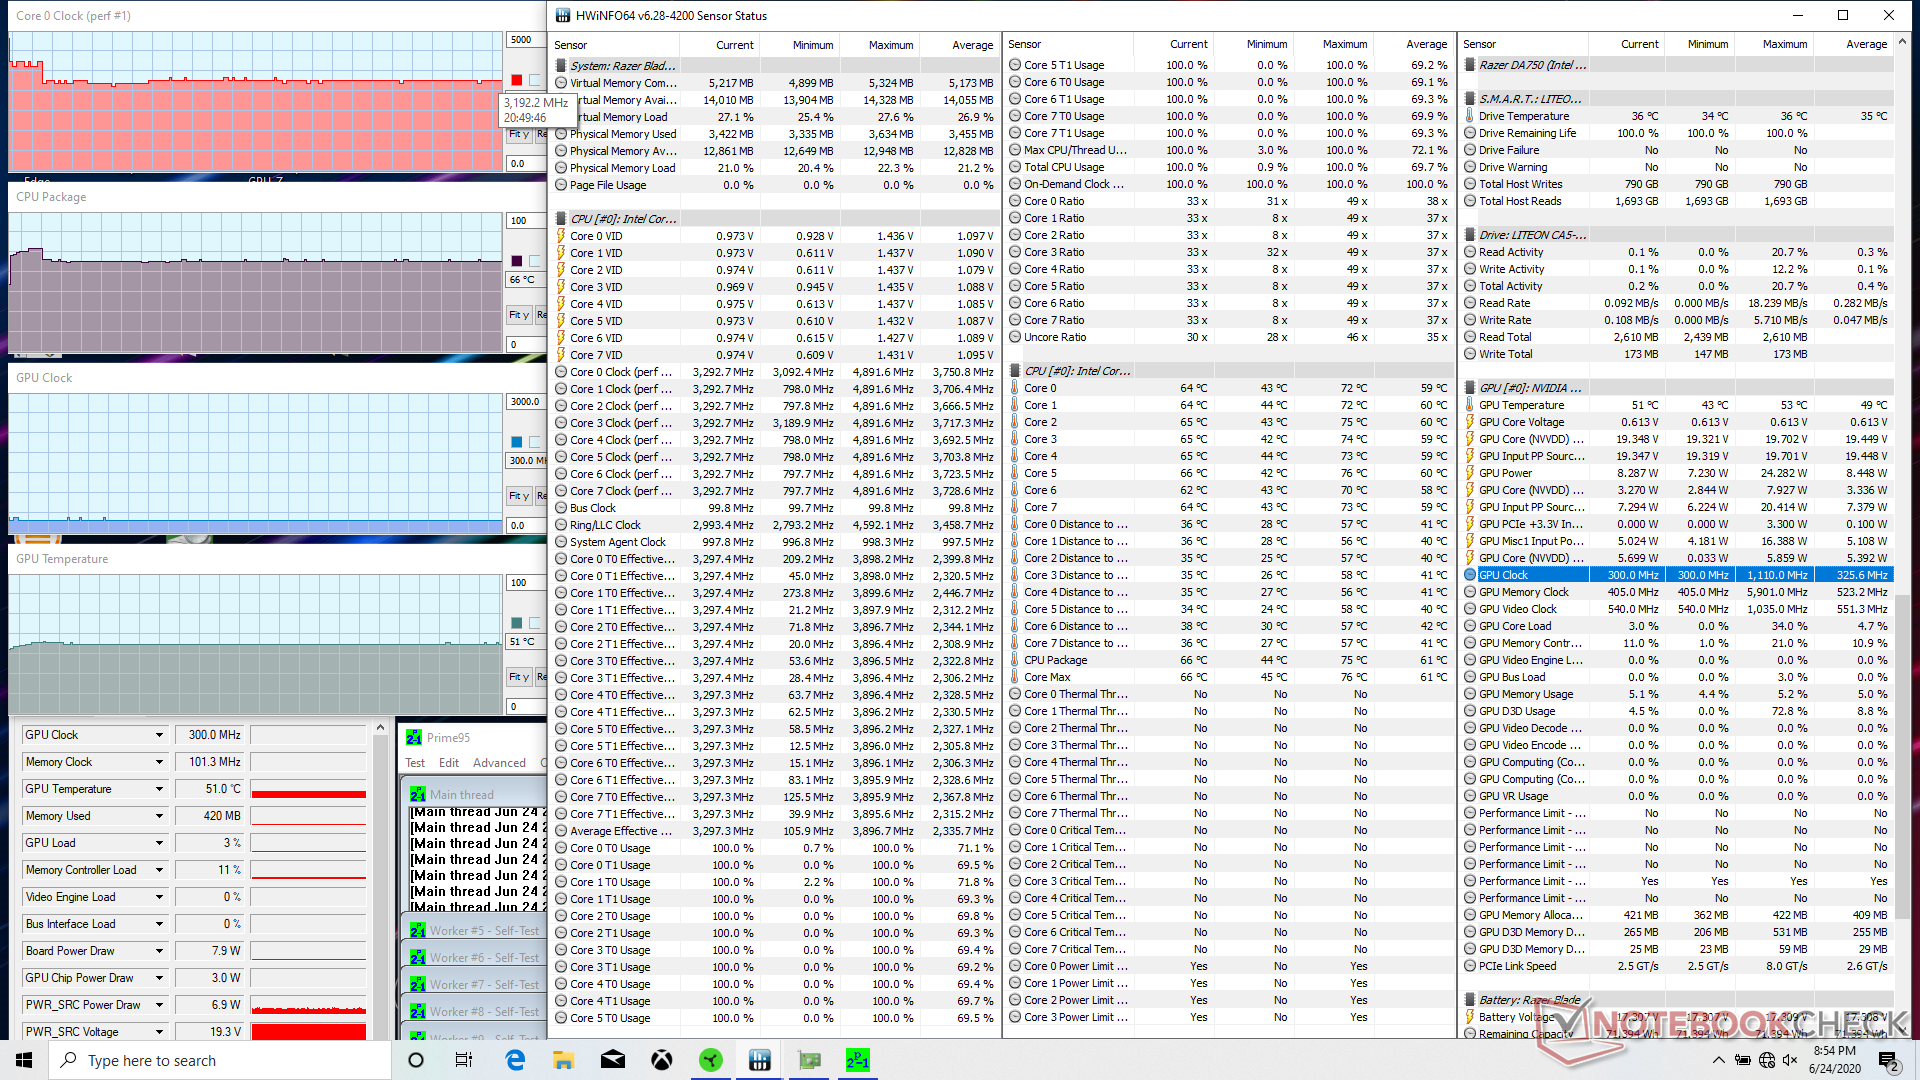
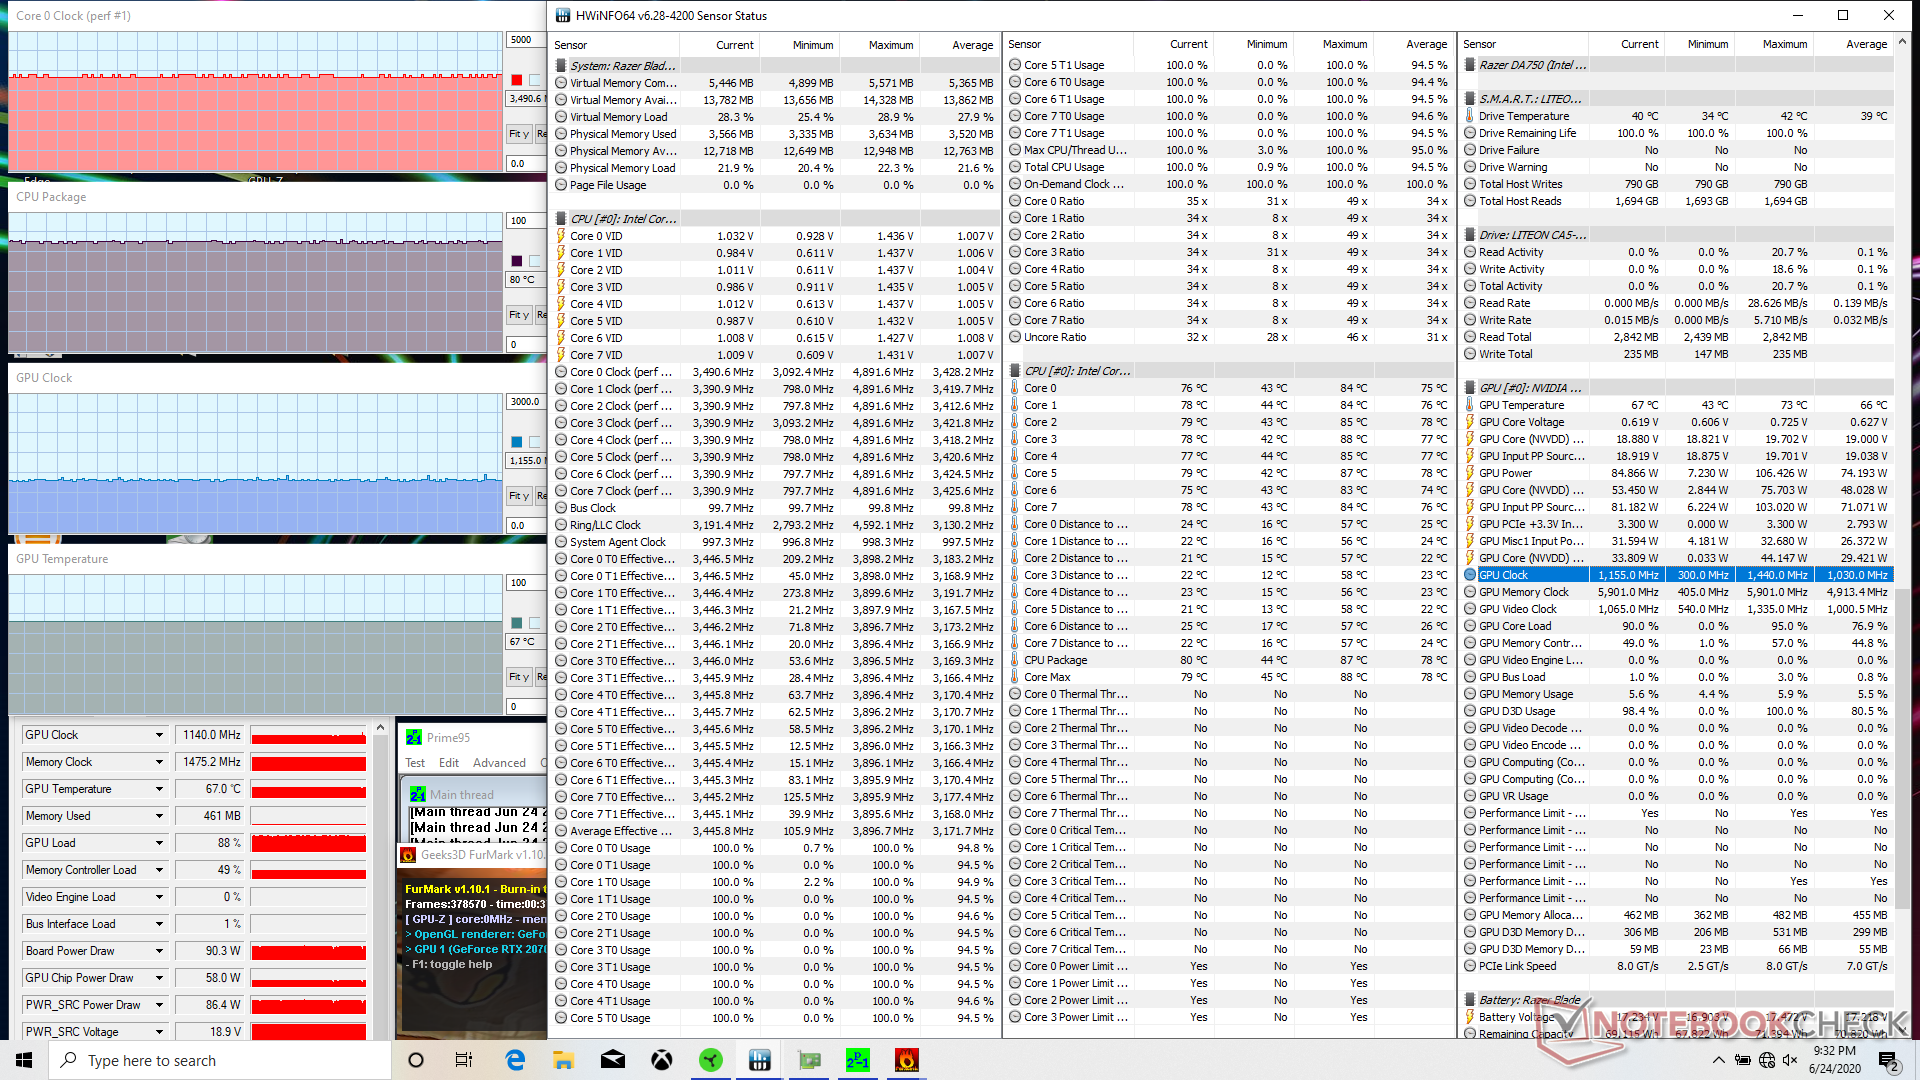
| CPU Clock (GHz) | GPU Clock (MHz) | Average CPU Temperature (°C) | Average GPU Temperature (°C) | |
| System Idle | -- | -- | 47 | 44 |
| Prime95 Stress | 3.2 - 3.3 | -- | 66 | 51 |
| Prime95 + FurMark Stress | 3.4 - 3.5 | 1140 | 80 | 67 |
| Witcher 3 Stress | 2.6 - 2.7 | 1635 | 71 | 70 |
Speakers

Energy Management
Power Consumption
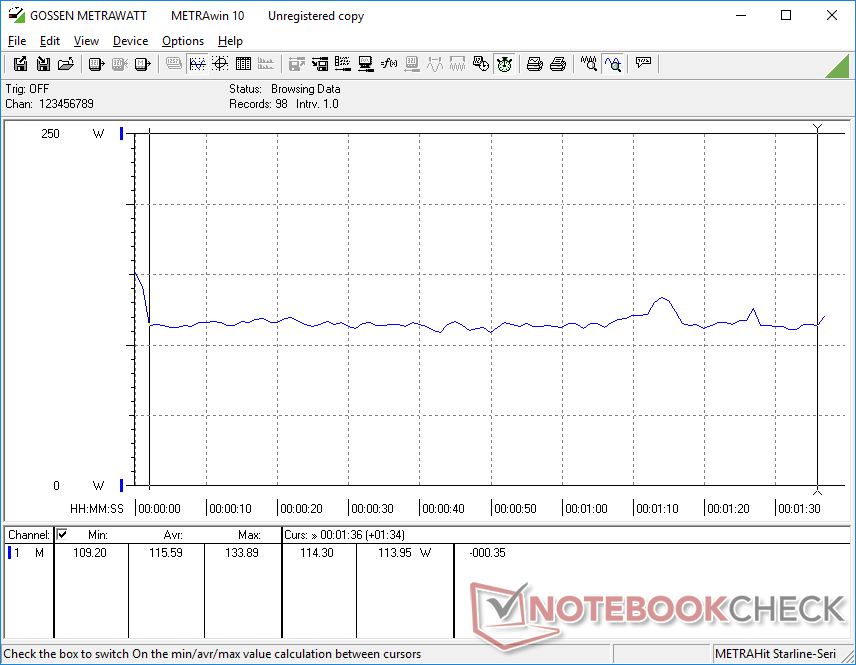
Idling on desktop will consume about 21.7 W when the integrated GPU is active or 38 W when the Nvidia GPU is active. Thus, it's worth manually switching to the iGPU if battery conservation is important.
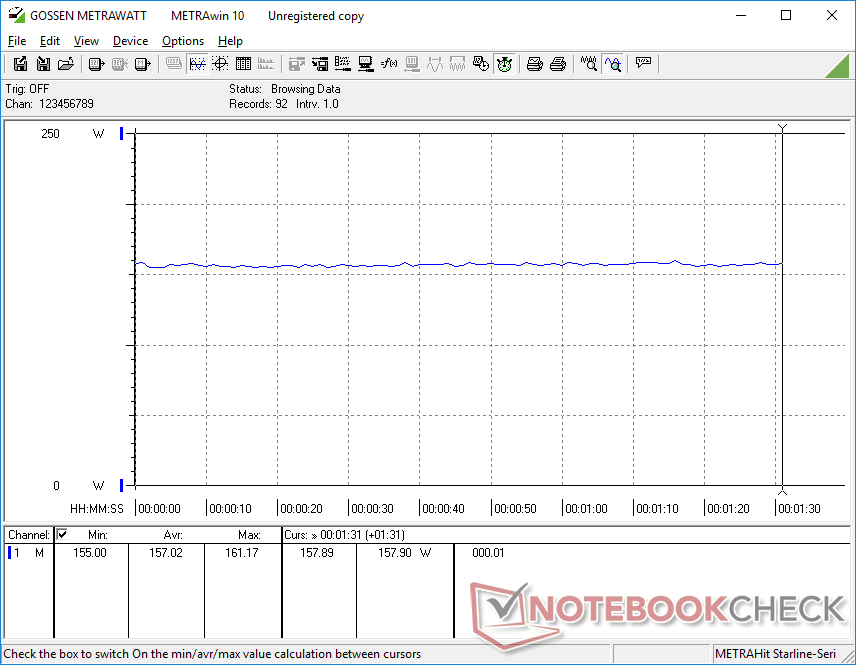
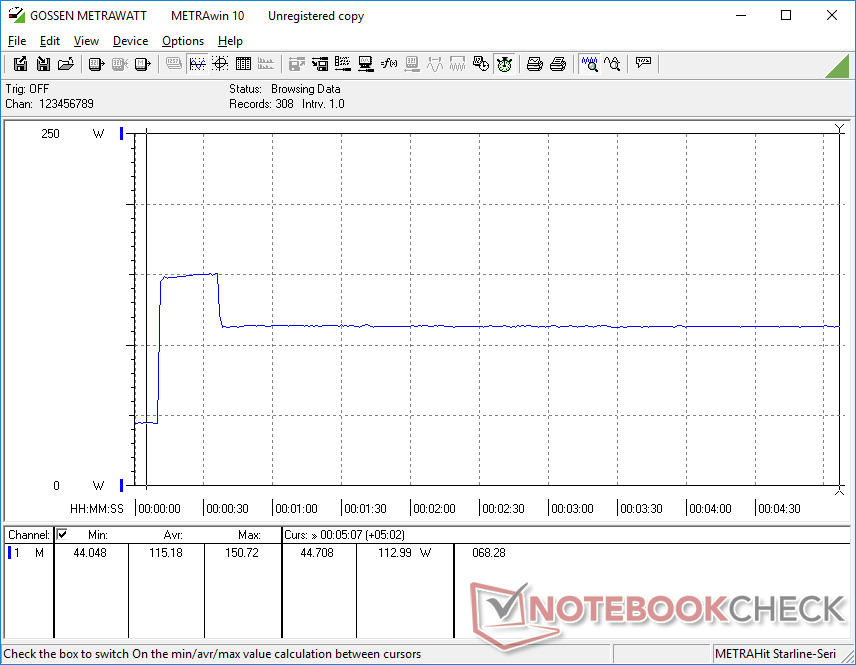
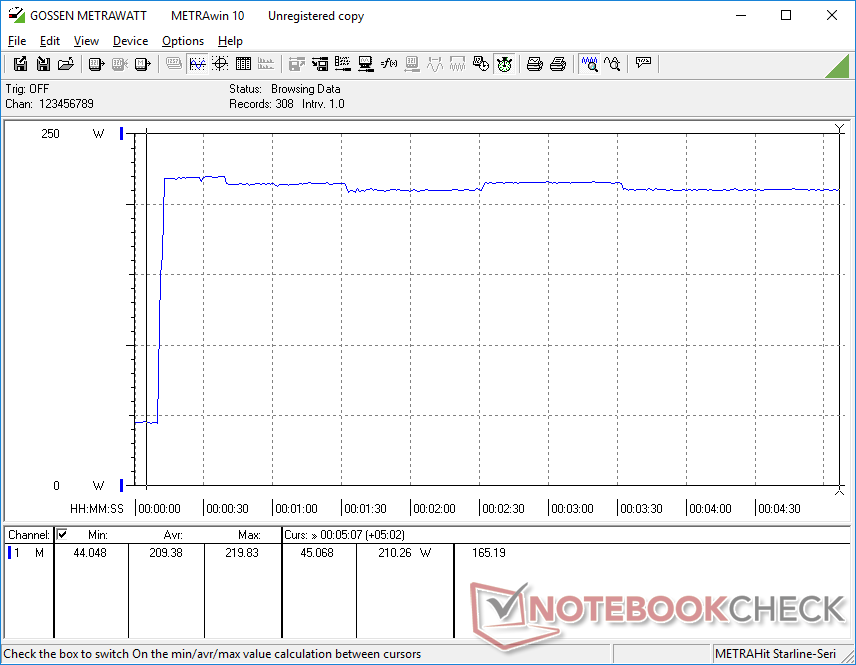
Power consumption when running Witcher 3 is lower than what we recorded on last year's Blade Pro 17 with the more demanding 4K UHD display, but it's otherwise in line with other GeForce RTX-powered 17.3-inch gaming laptops. We're able to measure a maximum draw of 219.9 W from the relatively compact (~17 x 7 x 2.5 cm) 230 W AC adapter.
| Off / Standby | |
| Idle | |
| Load |
|
Key:
min: | |
| Razer Blade Pro 17 RTX 2070 Max-Q 300 Hz i7-10875H, GeForce RTX 2070 Max-Q, Lite-On CA5-8D512, IPS, 1920x1080, 17.3" | Asus ROG Zephyrus S GX701GXR i7-9750H, GeForce RTX 2080 Max-Q, Samsung SSD PM981 MZVLB1T0HALR, IPS, 1920x1080, 17.3" | MSI GS75 Stealth 9SG i7-9750H, GeForce RTX 2080 Max-Q, 2x Samsung SSD PM981 MZVLB1T0HALR (RAID 0), IPS, 1920x1080, 17.3" | Alienware m17 R2 P41E i9-9980HK, GeForce RTX 2080 Max-Q, 2x SK Hynix PC601 NVMe 512 GB (RAID 0), IPS, 1920x1080, 17.3" | Aorus 17G XB i7-10875H, GeForce RTX 2070 Super Max-Q, Samsung SSD PM981a MZVLB512HBJQ, IPS, 1920x1080, 17.3" | Razer Blade Pro 17 4K UHD 120 Hz i7-9750H, GeForce RTX 2080 Max-Q, Samsung SSD PM981 MZVLB1T0HALR, IPS, 3840x2160, 17.3" | |
|---|---|---|---|---|---|---|
| Power Consumption | -14% | 16% | -39% | -3% | -32% | |
| Idle Minimum * (Watt) | 19.6 | 32 -63% | 13 34% | 24.7 -26% | 20 -2% | 34.2 -74% |
| Idle Average * (Watt) | 21.7 | 34 -57% | 17 22% | 35.9 -65% | 23 -6% | 37.2 -71% |
| Idle Maximum * (Watt) | 36.1 | 36 -0% | 25 31% | 69.6 -93% | 38 -5% | 50 -39% |
| Load Average * (Watt) | 115.6 | 95 18% | 96 17% | 141.8 -23% | 105 9% | 106.1 8% |
| Witcher 3 ultra * (Watt) | 157 | 155 1% | 156 1% | 185.8 -18% | 158 -1% | 178.7 -14% |
| Load Maximum * (Watt) | 219.9 | 187 15% | 239 -9% | 235.4 -7% | 243 -11% | 223.6 -2% |
* ... smaller is better
Battery Life
Runtimes are still average at just under 5 hours of real-world WLAN use when set to the Balanced profile with the integrated GPU active. Gaming laptops with larger batteries like the Aorus 17G or MSI GS66 are able to last for much longer.
The system can be recharged via a USB Type-C cable of at least 20 V much like on the Asus Zephyrus G14. Such a feature was not available on previous generation Blade models. Of course, charging this way will be much slower and gaming performance will be impacted.
| Razer Blade Pro 17 RTX 2070 Max-Q 300 Hz i7-10875H, GeForce RTX 2070 Max-Q, 70 Wh | Asus ROG Zephyrus S GX701GXR i7-9750H, GeForce RTX 2080 Max-Q, 76 Wh | MSI GS75 Stealth 9SG i7-9750H, GeForce RTX 2080 Max-Q, 80.25 Wh | Alienware m17 R2 P41E i9-9980HK, GeForce RTX 2080 Max-Q, 76 Wh | Aorus 17G XB i7-10875H, GeForce RTX 2070 Super Max-Q, 94 Wh | Razer Blade Pro 17 4K UHD 120 Hz i7-9750H, GeForce RTX 2080 Max-Q, 70 Wh | |
|---|---|---|---|---|---|---|
| Battery runtime | -39% | 22% | -2% | 53% | -24% | |
| WiFi v1.3 (h) | 4.9 | 3 -39% | 6 22% | 4.8 -2% | 7.5 53% | 3.7 -24% |
| Reader / Idle (h) | 4.1 | 7.7 | 7.1 | 10 | ||
| Load (h) | 1.2 | 1.2 | 0.5 | 2.2 |
Pros
Cons
Verdict
Much like how the 2020 Blade 15 is just a relatively minor update to the 2019 Blade 15, the 2020 Blade Pro 17 is another minor update to the 2019 Blade Pro 17. The new 8-core CPU, Super Max-Q GPUs, and 300 Hz display are the main reasons to own a 2020 model over the 2019 model which comes with a 6-core CPU, Max-Q GPU, and 240 Hz display instead. The internal updates improve the gaming experience only marginally meaning that users won't be missing much by opting for last year's model. Keep in mind that you don't have to reach 300 FPS when gaming to exploit a 300 Hz monitor.
The more surprising aspect of the Blade Pro 17 isn't the 10th gen Core CPU or 300 Hz display, but it's how fast the system can run the GeForce RTX 2070 Max-Q GPU. 3DMark results are about 20 percent faster than the average GeForce RTX 2070 Max-Q in our database. Thus, the RTX 2070 Max-Q in the Blade Pro 17 is able to offer faster graphics performance than even the newer RTX 2070 Super Max-Q or RTX 2080 Super Max-Q on some other gaming laptops. If you're going with this 2020 Blade Pro 17 model, then you can at least rest easy knowing that it is one of the fastest options out there with the GeForce RTX 2070 Max-Q GPU.
The 300 Hz refresh rate is a luxury that only the most hardcore gamers will really want. For everyone else, even 240 Hz will be more than enough. The 2019 Blade Pro series appeals better to wider audiences for this reason especially since the pricier 2020 version doesn't offer that much of a performance advantage year-over-year.
Razer Blade Pro 17 RTX 2070 Max-Q 300 Hz
- 06/27/2020 v7 (old)
Allen Ngo
Price comparison
