NVIDIA Quadro RTX 6000 (Laptop) vs NVIDIA T550 Laptop GPU vs NVIDIA Quadro T1000 (Laptop)
NVIDIA Quadro RTX 6000 (Laptop) ► remove from comparison
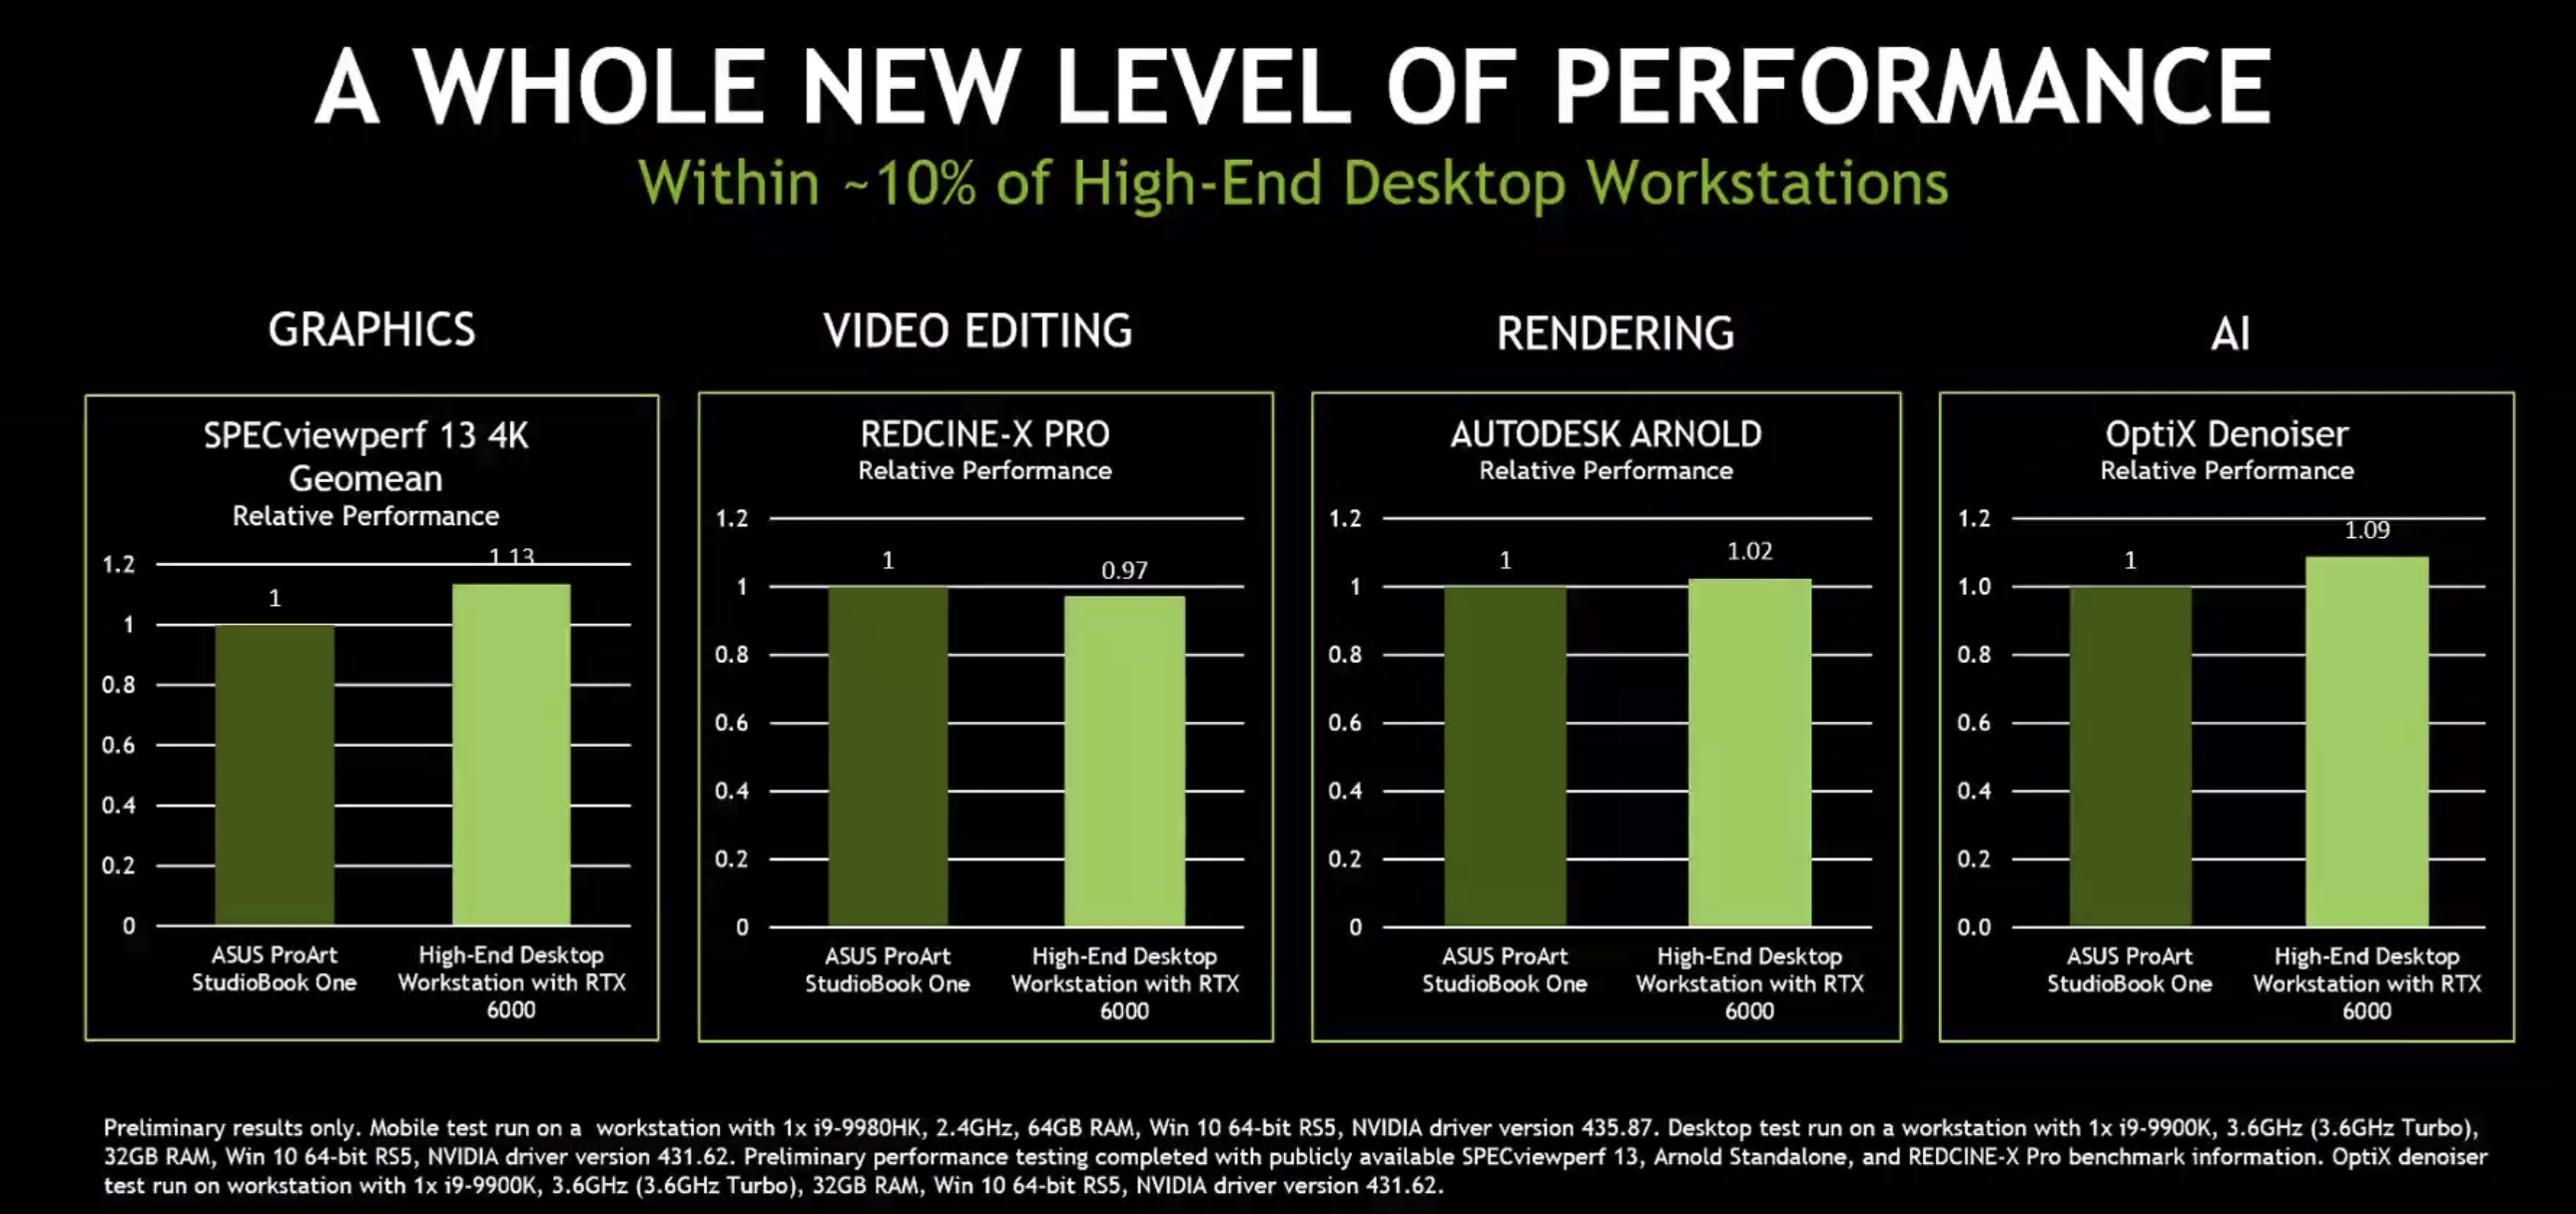
The Nvidia Quadro RTX 6000 for laptops is a professional high-end graphics card for big and powerful laptops and mobile workstations. It is based on the same TU102 chip as the consumer GeForce RTX 2080 Ti . Compared to the desktop RTX 6000, the mobile variant offers lower clock speeds.
The Quadro GPUs offer certified drivers , which are optimized for stability and performance in professional applications (CAD, DCC, medical, prospection, and visualizing applications). The performance in these areas is therefore much better compared to corresponding consumer GPUs.
NVIDIA manufacturers the TU102 chip on a 12 nm FinFET process and includes features like Deep Learning Super Sampling (DLSS) and Real-Time Ray Tracing (RTRT), which should combine to create more realistic lighting effects than older GPUs based on the company's Pascal architecture (if the games support it). The Quadro RTX 6000 is also DisplayPort 1.4 ready, while there is also support for HDMI 2.0b, HDR, Simultaneous Multi-Projection (SMP) and H.265 video en/decoding (PlayReady 3.0).
Performance
Due to the lower clock speeds, the mobile RTX 6000 lags slightly behind the desktop version with the same name. Nvidia states for example that a desktop system using the RTX 6000 is on average 13% faster in the SPECviewperf13 4k benchmark.
Due to the extremely high power consumption of 200 Watt (TDP), the mobile Quadro RTX 6000 needs an excellent cooling solution and will be used only in big laptops.
NVIDIA T550 Laptop GPU ► remove from comparison
The Nvidia T550 Laptop GPU (formerly known as Quadro T550 Mobile) for laptops is a professional mobile graphics card that is based on the Turing architecture (TU117 chip). It is based on the consumer GeForce MX550 and features the same 1024 cores and a 64 Bit memory bus. The card offers 4 GB GDDR6 with a maximum bandwidth of 112 GB/s and no dedicated display outputs (iGPU display outputs used via Optimus). The chip is manufactured in 12nm FinFET at TSMC.
The professional GPUs offer certified drivers , which are optimized for stability and performance in professional applications (CAD, DCC, medical, prospection, and visualizing applications). The performance in these areas is therefore much better compared to corresponding consumer GPUs.
The Turing generation did not only introduce raytracing for the RTX cards, but also optimized the architecture of the cores and caches. According to Nvidia the CUDA cores offer now a concurrent execution of floating point and integer operations for increased performance in compute-heavy workloads of modern games. Furthermore, the caches were reworked (new unified memory architecture with twice the cache compared to Pascal). This leads to up to 50% more instructions per clock and a 40% more power efficient usage compared to Pascal. In contrary to the faster Quadro RTX cards, the T550 does not feature raytracing and Tensor cores.
NVIDIA Quadro T1000 (Laptop) ► remove from comparison
The Nvidia Quadro T1000 for laptops is a professional mobile graphics card that is based on the Turing architecture (TU117 chip). Compared to the consumer GTX 1650 , the Quadro T1000 features less CUDA cores / shaders (768 versus 896). The Quadro T2000 uses the same TU117 chip, but features all 1024 cores (2x to the T1000) and is therefore significantly faster. The chip is manufactured in 12nm FinFET at TSMC.
The Turing generation did not only introduce raytracing for the RTX cards, but also optimized the architecture of the cores and caches. According to Nvidia the CUDA cores offer now a concurrent execution of floating point and integer operations for increased performance in compute-heavy workloads of modern games. Furthermore, the caches were reworked (new unified memory architecture with twice the cache compared to Pascal). This leads to up to 50% more instructions per clock and a 40% more power efficient usage compared to Pascal. In contrary to the faster Quadro RTX cards, the T1000 and T2000 don not feature raytracing and Tensor cores.
NVIDIA Quadro RTX 6000 (Laptop) NVIDIA T550 Laptop GPU NVIDIA Quadro T1000 (Laptop) Quadro Turing Series Codename TU102 TU117 N19P-Q1 Architecture Turing Turing Turing Pipelines 4608 - unified 1024 - unified 768 - unified Core Speed 1275 - 1455 (Boost) MHz 1065 - 1665 (Boost) MHz 1395 - 1455 (Boost) MHz Memory Speed 14000 MHz 12000 effective = 1500 MHz 8000 MHz Memory Bus Width 384 Bit 64 Bit 128 Bit Memory Type GDDR6 GDDR5, GDDR6 GDDR5 Max. Amount of Memory 24 GB 4 GB 4 GB Shared Memory no no no API DirectX 12_1, OpenGL 4.6 DirectX 12_1, Shader 6.7, OpenGL 4.6 DirectX 12_1, OpenGL 4.6 Power Consumption 200 Watt 25 Watt (20 - 60 Watt TGP) 50 Watt Transistors 18.6 Billion technology 12 nm 12 nm 12 nm Features NVLink, DLSS, Raytraycing, VR Ready, G-SYNC, Vulkan, Multi Monitor Notebook Size large medium sized medium sized Date of Announcement 04.09.2019 27.05.2022 27.05.2019 Theoretical Performance 7.2 TFLOPS FP16, 3.7 TFLOPS FP32 Memory Bandwidth 112 GB/s Information Optimus only Link to Manufacturer Page nvdam.widen.net
Benchmarks Performance Rating - 3DMark 11 + Fire Strike + Time Spy - Quadro T1000 (Laptop)
4 pt (12%)
...
NVIDIA Quadro T1000 (Laptop)
...
max:
3DMark - 3DMark Time Spy Score
11084 Points (32%)
min: 2031 avg: 2187 median: 2066 (6%) max: 2465 Points
GPU TDP 20 W TDP 30 W TDP 200 W 18% 22% 100%
min: 3006 avg: 3348 median: 3474 (10%) max: 3565 Points
GPU TDP ? TDP 20 W TDP 30 W TDP 50 W TDP 200 W 29% 18% 22% 32% 100%
3DMark - 3DMark Time Spy Graphics
min: 1882 avg: 2021 median: 1928 (5%) max: 2252 Points
GPU TDP 20 W TDP 30 W 85% 100%
min: 2834 avg: 3123 median: 3261 (9%) max: 3273 Points
GPU TDP ? TDP 20 W TDP 30 W TDP 50 W 93% 58% 69% 100%
3DMark - 3DMark Ice Storm Unlimited Graphics
375510 Points (43%)
3DMark - 3DMark Ice Storm Extreme Graphics
122046 Points (16%)
3DMark - 3DMark Cloud Gate Score
min: 17399 avg: 17614 median: 17614 (19%) max: 17829 Points
min: 23601 avg: 25273 median: 25273 (27%) max: 26945 Points
GPU TDP ? TDP 20 W 100% 70%
3DMark - 3DMark Cloud Gate Graphics
min: 32743 avg: 33219 median: 33218.5 (9%) max: 33694 Points
min: 48965 avg: 53629 median: 53628.5 (14%) max: 58292 Points
GPU TDP ? TDP 20 W 100% 62%
3DMark - 3DMark Fire Strike Standard Score
min: 4559 avg: 4786 median: 4581 (8%) max: 5218 Points
GPU TDP 20 W TDP 30 W 88% 100%
min: 6812 avg: 7589 median: 7783 (14%) max: 8173 Points
GPU TDP ? TDP 20 W TDP 30 W TDP 50 W 89% 56% 64% 100%
3DMark - 3DMark Fire Strike Standard Graphics
min: 4816 avg: 5100 median: 4890 (6%) max: 5593 Points
GPU TDP 20 W TDP 30 W 87% 100%
min: 7558 avg: 8347 median: 8727 (10%) max: 8757 Points
GPU TDP ? TDP 20 W TDP 30 W TDP 50 W 93% 55% 64% 100%
3DMark - 3DMark Ice Storm Graphics
min: 86096 avg: 111211 median: 111211 (13%) max: 136326 Points
3DMark - 3DMark Wild Life Extreme Unlimited
min: 3530 avg: 3590 median: 3589.5 (4%) max: 3649 Points
3DMark 11 - 3DM11 Performance Score
min: 7405 avg: 8160 median: 8160 (11%) max: 8915 Points
GPU TDP 20 W TDP 30 W 83% 100%
min: 10211 avg: 11241 median: 11592 (16%) max: 11919 Points
GPU TDP ? TDP 20 W TDP 30 W TDP 50 W 95% 64% 77% 100%
3DMark 11 - 3DM11 Performance GPU
min: 7432 avg: 8067 median: 8066.5 (7%) max: 8701 Points
GPU TDP 20 W TDP 30 W 85% 100%
min: 10407 avg: 11305 median: 11377 (10%) max: 12132 Points
GPU TDP ? TDP 20 W TDP 30 W TDP 50 W 99% 65% 76% 100%
3DMark Vantage + NVIDIA T550 Laptop GPU 3DMark Vantage - 3DM Vant. Perf. total
25155 Points (7%)
3DM Vant. Perf. total + NVIDIA Quadro T1000 (Laptop)
31509 Points (9%)
GPU TDP ? TDP 20 W 100% 80%
3DM Vant. Perf. GPU no PhysX + NVIDIA T550 Laptop GPU 3DMark Vantage - 3DM Vant. Perf. GPU no PhysX
24697 Points (14%)
3DM Vant. Perf. GPU no PhysX + NVIDIA Quadro T1000 (Laptop)
33740 Points (19%)
GPU TDP ? TDP 20 W 100% 73%
3DMark 06 3DMark 06 - Standard 1280x1024 + NVIDIA T550 Laptop GPU
31003 Points (41%)
3DMark 06 - Standard 1280x1024 + NVIDIA Quadro T1000 (Laptop)
min: 33809 avg: 35034 median: 35033.5 (46%) max: 36258 Points
GPU TDP ? TDP 20 W 100% 88%
Unigine Valley 1.0 - Unigine Valley 1.0 DX
min: 36.7 avg: 39.3 median: 39.3 (13%) max: 41.9 fps
Unigine Heaven 3.0 - Unigine Heaven 3.0 DX 11
110.3 fps (37%)
Unigine Heaven 3.0 - Unigine Heaven 3.0 OpenGL
101.1 fps (45%)
Unigine Heaven 2.1 - Heaven 2.1 high
min: 136.9 avg: 149.7 median: 149.7 (28%) max: 162.4 fps
Blender - Blender 3.3 Classroom CUDA *
min: 278 avg: 282 median: 283 (42%) max: 285 Seconds
GPU TDP 20 W TDP 30 W 100% 102%
Blender - Blender 3.3 Classroom OPTIX *
min: 256 avg: 263.3 median: 265 (99%) max: 269 Seconds
GPU TDP 20 W TDP 30 W 100% 650%
SPECviewperf 12 + NVIDIA Quadro T1000 (Laptop) SPECviewperf 12 - specvp12 sw-03
113.8 fps (28%)
specvp12 snx-02 + NVIDIA Quadro T1000 (Laptop) SPECviewperf 12 - specvp12 snx-02
82.7 fps (12%)
specvp12 showcase-01 + NVIDIA Quadro T1000 (Laptop) SPECviewperf 12 - specvp12 showcase-01
40.3 fps (9%)
specvp12 mediacal-01 + NVIDIA Quadro T1000 (Laptop) SPECviewperf 12 - specvp12 mediacal-01
min: 24.99 avg: 29.9 median: 29.9 (8%) max: 34.8 fps
specvp12 maya-04 + NVIDIA Quadro T1000 (Laptop) SPECviewperf 12 - specvp12 maya-04
min: 47.5 avg: 56.3 median: 56.3 (15%) max: 65.1 fps
specvp12 energy-01 + NVIDIA Quadro T1000 (Laptop) SPECviewperf 12 - specvp12 energy-01
min: 5.79 avg: 6.8 median: 6.8 (6%) max: 7.9 fps
specvp12 creo-01 + NVIDIA Quadro T1000 (Laptop) SPECviewperf 12 - specvp12 creo-01
min: 75 avg: 79.5 median: 79.5 (32%) max: 83.9 fps
specvp12 catia-04 + NVIDIA Quadro T1000 (Laptop) SPECviewperf 12 - specvp12 catia-04
min: 82.4 avg: 87.7 median: 87.7 (14%) max: 93 fps
specvp12 3dsmax-05 + NVIDIA Quadro T1000 (Laptop) SPECviewperf 12 - specvp12 3dsmax-05
min: 85.5 avg: 93.8 median: 93.8 (16%) max: 102.1 fps
SPECviewperf 13 specvp13 sw-04 + NVIDIA Quadro RTX 6000 (Laptop) SPECviewperf 13 - specvp13 sw-04
217 fps (58%)
specvp13 sw-04 + NVIDIA T550 Laptop GPU
min: 95 avg: 98.8 median: 95.8 (26%) max: 105.68 fps
GPU TDP 20 W TDP 30 W TDP 200 W 44% 49% 100%
specvp13 sw-04 + NVIDIA Quadro T1000 (Laptop)
min: 89.2 avg: 99.7 median: 104.4 (28%) max: 105.6 fps
GPU TDP ? TDP 20 W TDP 30 W TDP 50 W TDP 200 W 45% 44% 49% 49% 100%
specvp13 3dsmax-06 + NVIDIA Quadro RTX 6000 (Laptop) SPECviewperf 13 - specvp13 3dsmax-06
217 fps (38%)
specvp13 3dsmax-06 + NVIDIA T550 Laptop GPU
min: 61.6 avg: 63.7 median: 63 (11%) max: 66.38 fps
GPU TDP 20 W TDP 30 W TDP 200 W 29% 31% 100%
specvp13 3dsmax-06 + NVIDIA Quadro T1000 (Laptop)
min: 83.9 avg: 94.8 median: 98.5 (17%) max: 101.9 fps
GPU TDP ? TDP 20 W TDP 30 W TDP 50 W TDP 200 W 43% 29% 31% 45% 100%
specvp13 snx-03 + NVIDIA T550 Laptop GPU SPECviewperf 13 - specvp13 snx-03
min: 95.8 avg: 101.7 median: 99.7 (11%) max: 109.67 fps
GPU TDP 20 W TDP 30 W 89% 100%
specvp13 snx-03 + NVIDIA Quadro T1000 (Laptop)
min: 127.8 avg: 136.4 median: 133.1 (15%) max: 148.4 fps
GPU TDP ? TDP 20 W TDP 30 W TDP 50 W 100% 71% 79% 96%
specvp13 showcase-02 + NVIDIA T550 Laptop GPU SPECviewperf 13 - specvp13 showcase-02
min: 24.8 avg: 26.1 median: 25.3 (6%) max: 28.06 fps
GPU TDP 20 W TDP 30 W 89% 100%
specvp13 showcase-02 + NVIDIA Quadro T1000 (Laptop)
min: 35.27 avg: 40.4 median: 40.2 (9%) max: 45.71 fps
GPU TDP ? TDP 20 W TDP 30 W TDP 50 W 83% 55% 61% 100%
specvp13 medical-02 + NVIDIA T550 Laptop GPU SPECviewperf 13 - specvp13 medical-02
min: 34.5 avg: 37.2 median: 36.2 (8%) max: 40.74 fps
GPU TDP 20 W TDP 30 W 87% 100%
specvp13 medical-02 + NVIDIA Quadro T1000 (Laptop)
min: 33.45 avg: 41.7 median: 41.6 (9%) max: 50.1 fps
GPU TDP ? TDP 20 W TDP 30 W TDP 50 W 100% 85% 98% 100%
specvp13 maya-05 + NVIDIA T550 Laptop GPU SPECviewperf 13 - specvp13 maya-05
min: 77.5 avg: 82 median: 80.9 (9%) max: 87.57 fps
GPU TDP 20 W TDP 30 W 90% 100%
specvp13 maya-05 + NVIDIA Quadro T1000 (Laptop)
min: 101 avg: 109.6 median: 113.3 (13%) max: 114.6 fps
GPU TDP ? TDP 20 W TDP 30 W TDP 50 W 95% 70% 77% 100%
specvp13 energy-02 + NVIDIA T550 Laptop GPU SPECviewperf 13 - specvp13 energy-02
min: 11.7 avg: 12.4 median: 12 (4%) max: 13.37 fps
GPU TDP 20 W TDP 30 W 89% 100%
specvp13 energy-02 + NVIDIA Quadro T1000 (Laptop)
min: 12 avg: 15.1 median: 15.6 (5%) max: 17.8 fps
GPU TDP ? TDP 20 W TDP 30 W TDP 50 W 95% 76% 86% 100%
specvp13 creo-02 + NVIDIA T550 Laptop GPU SPECviewperf 13 - specvp13 creo-02
min: 82.4 avg: 86.2 median: 85.5 (13%) max: 90.66 fps
GPU TDP 20 W TDP 30 W 93% 100%
specvp13 creo-02 + NVIDIA Quadro T1000 (Laptop)
min: 99.9 avg: 108.6 median: 109.5 (16%) max: 116.3 fps
GPU TDP ? TDP 20 W TDP 30 W TDP 50 W 99% 77% 83% 100%
specvp13 catia-05 + NVIDIA T550 Laptop GPU SPECviewperf 13 - specvp13 catia-05
min: 104 avg: 110.4 median: 109 (12%) max: 118.22 fps
GPU TDP 20 W TDP 30 W 90% 100%
specvp13 catia-05 + NVIDIA Quadro T1000 (Laptop)
min: 121.3 avg: 130 median: 130.5 (15%) max: 138.3 fps
GPU TDP ? TDP 20 W TDP 30 W TDP 50 W 99% 82% 91% 100%
SPECviewperf 2020 specvp2020 solidworks-05 1080p + NVIDIA T550 Laptop GPU SPECviewperf 2020 - specvp2020 solidworks-05 1080p
min: 46.3 avg: 54 median: 54.3 (11%) max: 61.38 fps
GPU TDP 20 W TDP 30 W 82% 100%
specvp2020 solidworks-05 1080p + NVIDIA Quadro T1000 (Laptop)
78.8 fps (15%)
GPU TDP 20 W TDP 30 W TDP 50 W 64% 78% 100%
specvp2020 snx-04 1080p + NVIDIA T550 Laptop GPU SPECviewperf 2020 - specvp2020 snx-04 1080p
min: 84 avg: 99.4 median: 99.3 (16%) max: 114.82 fps
GPU TDP 20 W TDP 30 W 80% 100%
specvp2020 snx-04 1080p + NVIDIA Quadro T1000 (Laptop)
132.7 fps (22%)
GPU TDP 20 W TDP 30 W TDP 50 W 69% 87% 100%
specvp2020 medical-03 1080p + NVIDIA T550 Laptop GPU SPECviewperf 2020 - specvp2020 medical-03 1080p
min: 13.5 avg: 15.6 median: 15.4 (11%) max: 17.87 fps
GPU TDP 20 W TDP 30 W 81% 100%
specvp2020 medical-03 1080p + NVIDIA Quadro T1000 (Laptop)
19.2 fps (14%)
GPU TDP 20 W TDP 30 W TDP 50 W 75% 93% 100%
specvp2020 maya-06 1080p + NVIDIA T550 Laptop GPU SPECviewperf 2020 - specvp2020 maya-06 1080p
min: 86.9 avg: 98.2 median: 98.1 (14%) max: 109.68 fps
GPU TDP 20 W TDP 30 W 84% 100%
specvp2020 maya-06 1080p + NVIDIA Quadro T1000 (Laptop)
134.3 fps (20%)
GPU TDP 20 W TDP 30 W TDP 50 W 69% 82% 100%
specvp2020 energy-03 1080p + NVIDIA T550 Laptop GPU SPECviewperf 2020 - specvp2020 energy-03 1080p
min: 10.6 avg: 12.1 median: 12 (10%) max: 13.56 fps
GPU TDP 20 W TDP 30 W 83% 100%
specvp2020 energy-03 1080p + NVIDIA Quadro T1000 (Laptop)
15.6 fps (13%)
GPU TDP 20 W TDP 30 W TDP 50 W 72% 87% 100%
specvp2020 creo-03 1080p + NVIDIA T550 Laptop GPU SPECviewperf 2020 - specvp2020 creo-03 1080p
min: 44.5 avg: 46.2 median: 45.7 (23%) max: 48.5 fps
GPU TDP 20 W TDP 30 W 100% 98%
specvp2020 creo-03 1080p + NVIDIA Quadro T1000 (Laptop)
67.5 fps (33%)
GPU TDP 20 W TDP 30 W TDP 50 W 69% 68% 100%
specvp2020 catia-06 1080p + NVIDIA T550 Laptop GPU SPECviewperf 2020 - specvp2020 catia-06 1080p
min: 22.4 avg: 25.6 median: 24.9 (16%) max: 29.58 fps
GPU TDP 20 W TDP 30 W 80% 100%
specvp2020 catia-06 1080p + NVIDIA Quadro T1000 (Laptop)
33.6 fps (22%)
GPU TDP 20 W TDP 30 W TDP 50 W 70% 88% 100%
specvp2020 3dsmax-07 1080p + NVIDIA T550 Laptop GPU SPECviewperf 2020 - specvp2020 3dsmax-07 1080p
min: 28.3 avg: 30 median: 29.6 (13%) max: 32.03 fps
GPU TDP 20 W TDP 30 W 90% 100%
specvp2020 3dsmax-07 1080p + NVIDIA Quadro T1000 (Laptop)
45.3 fps (21%)
GPU TDP 20 W TDP 30 W TDP 50 W 64% 71% 100%
Cinebench R10 Cinebench R10 Shading (32bit) + NVIDIA Quadro T1000 (Laptop) Cinebench R10 - Cinebench R10 Shading (32bit)
6818 Points (5%)
Cinebench R11.5 Cinebench R11.5 OpenGL 64 Bit + NVIDIA Quadro T1000 (Laptop) Cinebench R11.5 - Cinebench R11.5 OpenGL 64 Bit
124 fps (43%)
Cinebench R15 + NVIDIA T550 Laptop GPU Cinebench R15 - Cinebench R15 OpenGL 64 Bit
min: 184.9 avg: 193 median: 189.2 (11%) max: 205 fps
GPU TDP 20 W TDP 30 W 91% 100%
Cinebench R15 OpenGL 64 Bit + NVIDIA Quadro T1000 (Laptop)
min: 166 avg: 182.6 median: 185.7 (11%) max: 196 fps
GPU TDP ? TDP 20 W TDP 30 W TDP 50 W 86% 91% 100% 96%
Cinebench R15 OpenGL Ref. Match 64 Bit + NVIDIA T550 Laptop GPU Cinebench R15 - Cinebench R15 OpenGL Ref. Match 64 Bit
99.6 % (100%)
GPU TDP 20 W TDP 30 W 100% 100%
Cinebench R15 OpenGL Ref. Match 64 Bit + NVIDIA Quadro T1000 (Laptop)
min: 99.6 avg: 99.7 median: 99.6 (100%) max: 100 %
GPU TDP ? TDP 20 W TDP 30 W TDP 50 W 100% 100% 100% 100%
GFXBench - GFXBench 5.0 Aztec Ruins High Tier Offscreen
19 fps (3%)
89.3 fps (16%)
GPU TDP ? TDP 20 W 100% 21%
GFXBench - GFXBench 5.0 Aztec Ruins Normal Tier Offscreen
43.5 fps (3%)
225.8 fps (17%)
GPU TDP ? TDP 20 W 100% 19%
GFXBench - GFXBench Car Chase Offscreen
118.3 fps (13%)
min: 145.6 avg: 154.9 median: 154.9 (17%) max: 164.2 fps
GPU TDP ? TDP 20 W 100% 76%
GFXBench 3.1 - GFXBench Manhattan ES 3.1 Offscreen
172.6 fps (4%)
min: 220.2 avg: 243.6 median: 243.6 (5%) max: 267 fps
GPU TDP ? TDP 20 W 100% 71%
GFXBench 3.0 - GFXBench 3.0 Manhattan Offscreen
229.9 fps (13%)
min: 269 avg: 315.3 median: 315.3 (18%) max: 361.6 fps
GPU TDP ? TDP 20 W 100% 73%
GFXBench (DX / GLBenchmark) 2.7 + NVIDIA T550 Laptop GPU GFXBench (DX / GLBenchmark) 2.7 - GFXBench T-Rex HD Offscreen C24Z16
449.9 fps (4%)
GFXBench T-Rex HD Offscreen C24Z16 + NVIDIA Quadro T1000 (Laptop)
min: 575 avg: 660 median: 659.5 (5%) max: 744 fps
GPU TDP ? TDP 20 W 100% 68%
LuxMark v2.0 64Bit - LuxMark v2.0 Room GPU
min: 1375 avg: 1410 median: 1409.5 (6%) max: 1444 Samples/s
LuxMark v2.0 64Bit - LuxMark v2.0 Sala GPU
min: 2567 avg: 2768 median: 2768 (5%) max: 2969 Samples/s
ComputeMark v2.1 - ComputeMark v2.1 Result
5190 Points (6%)
min: 5376 avg: 5966 median: 5965.5 (6%) max: 6555 Points
GPU TDP ? TDP 20 W 100% 87%
Power Consumption - Furmark Stress Test Power Consumption - external Monitor *
min: 34.2 avg: 34.7 median: 34.7 (5%) max: 35.1 Watt
88.8 Watt (13%)
GPU TDP ? TDP 20 W 100% 109%
Power Consumption - The Witcher 3 Power Consumption - external Monitor *
min: 41.2 avg: 41.3 median: 41.3 (6%) max: 41.4 Watt
93.8 Watt (13%)
GPU TDP ? TDP 20 W 100% 108%
Power Consumption - Witcher 3 Power Consumption *
min: 42.9 avg: 44.1 median: 44.1 (10%) max: 45.3 Watt
min: 83 avg: 89 median: 89 (20%) max: 95 Watt
GPU TDP ? TDP 20 W TDP 50 W 103% 114% 100%
Power Consumption - Witcher 3 ultra Power Efficiency
min: 0.4393 avg: 0.4 median: 0.4 (44%) max: 0.4569 fps per Watt
min: 0.3684 avg: 0.4 median: 0.4 (41%) max: 0.4566 fps per Watt
GPU TDP ? TDP 20 W TDP 50 W 100% 98% 81%
Power Consumption - Witcher 3 ultra Power Efficiency - external Monitor
min: 0.4734 avg: 0.5 median: 0.5 (40%) max: 0.483 fps per Watt
0.4 fps per Watt (33%)
GPU TDP ? TDP 20 W 85% 100%
Emissions Witcher 3 Fan Noise + NVIDIA T550 Laptop GPU Emissions - Witcher 3 Fan Noise
min: 38.2 avg: 40.4 median: 40.5 (65%) max: 42.5 dB(A)
GPU TDP 20 W TDP 30 W 93% 100%
Witcher 3 Fan Noise + NVIDIA Quadro T1000 (Laptop)
min: 36.9 avg: 37.3 median: 37.3 (60%) max: 37.7 dB(A)
GPU TDP ? TDP 20 W TDP 30 W TDP 50 W 87% 93% 100% 89%
Clock Speed - GPU Clock Witcher 3 ultra
1237 MHz (49%)
Clock Speed - GPU Clock Speed Furmark
1543 MHz (61%)
Average Benchmarks NVIDIA Quadro RTX 6000 (Laptop) → 100% n=3 Average Benchmarks NVIDIA T550 Laptop GPU → 31% n=3 Average Benchmarks NVIDIA Quadro T1000 (Laptop) → 42% n=3
- Range of benchmark values for this graphics card
- Average benchmark values for this graphics card
* Smaller numbers mean a higher performance
1 This benchmark is not used for the average calculation
Game Benchmarks The following benchmarks stem from our benchmarks of review laptops. The performance depends on the used graphics memory, clock rate, processor, system settings, drivers, and operating systems. So the results don't have to be representative for all laptops with this GPU. For detailed information on the benchmark results, click on the fps number.
Quadro T1000 (Laptop):
190.9 fps
Quadro T1000 (Laptop):
91.8 fps
Quadro T1000 (Laptop):
58.4 fps
Quadro T1000 (Laptop):
43.5 fps
Quadro T1000 (Laptop):
150 fps
Quadro T1000 (Laptop):
78 fps
Quadro T1000 (Laptop):
64.3 fps
Quadro T1000 (Laptop):
134.1 fps
Quadro T1000 (Laptop):
51 fps
Quadro T1000 (Laptop):
44.4 fps
Quadro T1000 (Laptop):
121.4 fps
Quadro T1000 (Laptop):
87.9 fps
Quadro T1000 (Laptop):
67.8 fps
Quadro T1000 (Laptop):
56 fps
Quadro T1000 (Laptop):
87.9 fps
Quadro T1000 (Laptop):
46.7 fps
Quadro T1000 (Laptop):
29.9 fps
Quadro T1000 (Laptop):
19.4 fps
Quadro T1000 (Laptop):
67.3 fps
Quadro T1000 (Laptop):
57.6 fps
Quadro T1000 (Laptop):
50.4 fps
Quadro T1000 (Laptop):
86 fps
Quadro T1000 (Laptop):
60.5 fps
Quadro T1000 (Laptop):
51.9 fps
Quadro T1000 (Laptop):
46.9 fps
Quadro T1000 (Laptop):
96.7 fps
Quadro T1000 (Laptop):
61.2 fps
Quadro T1000 (Laptop):
50.8 fps
Quadro T1000 (Laptop):
44 fps
Quadro T1000 (Laptop):
125.4 fps
Quadro T1000 (Laptop):
76.8 fps
Quadro T1000 (Laptop):
65.2 fps
Quadro T1000 (Laptop):
42.8 fps
Quadro T1000 (Laptop):
93 fps
Quadro T1000 (Laptop):
53 fps
Quadro T1000 (Laptop):
47 fps
Quadro T1000 (Laptop):
32 fps
Quadro T1000 (Laptop):
208 fps
Quadro T1000 (Laptop):
171.3 fps
Quadro T1000 (Laptop):
160.3 fps
Quadro T1000 (Laptop):
148.9 fps
Quadro T1000 (Laptop):
117.9 fps
Quadro T1000 (Laptop):
58.7 fps
Quadro T1000 (Laptop):
38 fps
Quadro T1000 (Laptop):
28.5 fps
Quadro T1000 (Laptop):
136.8 fps
Quadro T1000 (Laptop):
42.4 fps
Quadro T1000 (Laptop):
31.2 fps
Quadro T1000 (Laptop):
118 178 ~ 148 fps
Quadro T1000 (Laptop):
73 105 ~ 89 fps
Quadro T1000 (Laptop):
61 92 ~ 77 fps
Quadro T1000 (Laptop):
49 79 ~ 64 fps
Quadro T1000 (Laptop):
182.3 189 ~ 186 fps
Quadro T1000 (Laptop):
60.4 62.5 ~ 61 fps
Quadro T1000 (Laptop):
37.5 39.1 ~ 38 fps
Quadro T1000 (Laptop):
24.7 25.6 ~ 25 fps
Quadro T1000 (Laptop):
123.7 fps
Quadro T1000 (Laptop):
55.2 fps
Quadro T1000 (Laptop):
45.7 fps
Quadro T1000 (Laptop):
45.1 fps
Quadro T1000 (Laptop):
69.6 94.5 ~ 82 fps
Quadro T1000 (Laptop):
52.8 73.4 ~ 63 fps
Quadro T1000 (Laptop):
37.2 45.2 ~ 41 fps
Quadro T1000 (Laptop):
20 23.1 ~ 22 fps
Quadro T1000 (Laptop):
111 fps
Quadro T1000 (Laptop):
39 61 ~ 50 fps
Quadro T1000 (Laptop):
36 48 ~ 42 fps
Quadro T1000 (Laptop):
29 35 ~ 32 fps
Quadro T1000 (Laptop):
63.7 79.4 ~ 72 fps
Quadro T1000 (Laptop):
36.3 42.5 ~ 39 fps
Quadro T1000 (Laptop):
77 fps
Quadro T1000 (Laptop):
48 fps
Quadro T1000 (Laptop):
46 fps
Quadro T1000 (Laptop):
43 fps
Quadro T1000 (Laptop):
93.3 fps
Quadro T1000 (Laptop):
43.4 fps
Quadro T1000 (Laptop):
31.9 fps
Quadro T1000 (Laptop):
25.5 fps
Quadro T1000 (Laptop):
143.7 144 ~ 144 fps
Quadro T1000 (Laptop):
73.8 92.7 ~ 83 fps
Quadro T1000 (Laptop):
57.8 69 ~ 63 fps
Quadro T1000 (Laptop):
55.9 68.7 ~ 62 fps
Quadro T1000 (Laptop):
43.2 76.5 ~ 60 fps
Quadro T1000 (Laptop):
37.8 66.6 ~ 52 fps
Quadro T1000 (Laptop):
35 59.4 ~ 47 fps
Quadro T1000 (Laptop):
182.4 fps
Quadro T1000 (Laptop):
106.7 fps
Quadro T1000 (Laptop):
86.3 fps
Quadro T1000 (Laptop):
66.5 fps
Quadro T1000 (Laptop):
57 82 ~ 70 fps
Quadro T1000 (Laptop):
40 55 ~ 48 fps
Quadro T1000 (Laptop):
35 50 ~ 43 fps
Quadro T1000 (Laptop):
29 29 ~ 29 fps
Quadro T1000 (Laptop):
148 fps
Quadro T1000 (Laptop):
119.2 fps
Quadro T1000 (Laptop):
113.5 fps
Quadro T1000 (Laptop):
110.8 fps
Quadro T1000 (Laptop):
88 101 111 ~ 100 fps
Quadro T1000 (Laptop):
46 56.7 58 ~ 54 fps
Quadro T1000 (Laptop):
40 50 54.1 ~ 48 fps
Quadro T1000 (Laptop):
35 45 46 ~ 42 fps
Quadro T1000 (Laptop):
107 fps
Quadro T1000 (Laptop):
62 fps
Quadro T1000 (Laptop):
57 fps
Quadro T1000 (Laptop):
53 fps
Quadro T1000 (Laptop):
491.9 fps
Quadro T1000 (Laptop):
199.3 fps
Quadro T1000 (Laptop):
77.1 fps
Quadro T1000 (Laptop):
66.2 78 96 ~ 80 fps
Quadro T1000 (Laptop):
93.7 fps
Quadro T1000 (Laptop):
49.3 fps
Quadro T1000 (Laptop):
40.5 fps
Quadro T1000 (Laptop):
30.7 fps
Quadro T1000 (Laptop):
56.1 77.4 ~ 67 fps
Quadro T1000 (Laptop):
41.9 49.2 ~ 46 fps
Quadro T1000 (Laptop):
31.1 34 ~ 33 fps
Quadro T1000 (Laptop):
246.4 fps
Quadro T1000 (Laptop):
150.7 fps
Quadro T1000 (Laptop):
117 fps
Quadro T1000 (Laptop):
94 fps
Quadro T1000 (Laptop):
47.2 fps
Quadro T1000 (Laptop):
43.9 fps
Quadro T1000 (Laptop):
24.2 fps
Quadro T1000 (Laptop):
66.7 77.5 ~ 72 fps
Quadro T1000 (Laptop):
63.9 74.3 ~ 69 fps
Quadro T1000 (Laptop):
48.8 56.7 ~ 53 fps
Quadro T1000 (Laptop):
136.2 fps
Quadro T1000 (Laptop):
86 fps
Quadro T1000 (Laptop):
53.4 fps
Quadro T1000 (Laptop):
43.8 fps
Quadro T1000 (Laptop):
47.9 fps
T550 Laptop GPU:
73 75 78 ~ 75 fps
T550 Laptop GPU:
39 40 43 ~ 41 fps
Quadro T1000 (Laptop):
170.1 fps
Quadro T1000 (Laptop):
153.9 fps
Quadro T1000 (Laptop):
93.8 fps
Quadro T1000 (Laptop):
41.7 fps
Quadro T1000 (Laptop):
210 241 ~ 226 fps
Quadro T1000 (Laptop):
72.9 86.6 ~ 80 fps
NVIDIA T550 Laptop GPU low med. high ultra QHD 4K F1 22 69 62 43 31 F1 2021 153 74 59 37 Strange Brigade 131 52 42 36 Far Cry 5 75 41 38 35 X-Plane 11.11 70 63 57 Final Fantasy XV Benchmark 62 31 22 Dota 2 Reborn 117 105 95 88 The Witcher 3 128 75 41 21 GTA V 116 114 62 29 < 30 fps < 60 fps < 120 fps ≥ 120 fps 6 3 3 6 1 6 2 2 4 1
For more games that might be playable and a list of all games and graphics cards visit our Gaming List
v1.26
log 23. 18:44:27
#0 checking url part for id 9923 +0s ... 0s
#1 checking url part for id 11429 +0s ... 0s
#2 checking url part for id 9860 +0s ... 0s
#3 not redirecting to Ajax server +0s ... 0s
#4 did not recreate cache, as it is less than 5 days old! Created at Wed, 22 May 2024 05:38:57 +0200 +0.001s ... 0.001s
#5 composed specs +0.133s ... 0.134s
#6 did output specs +0s ... 0.134s
#7 start showIntegratedCPUs +0s ... 0.134s
#8 getting avg benchmarks for device 9923 +0.041s ... 0.175s
#9 got single benchmarks 9923 +0.006s ... 0.182s
#10 getting avg benchmarks for device 11429 +0.002s ... 0.183s
#11 got single benchmarks 11429 +0.016s ... 0.199s
#12 getting avg benchmarks for device 9860 +0.017s ... 0.217s
#13 got single benchmarks 9860 +0.019s ... 0.235s
#14 got avg benchmarks for devices +0s ... 0.235s
#15 min, max, avg, median took s +0.32s ... 0.555s
#16 before gaming benchmark output +0s ... 0.555s
#17 Got 327 rows for game benchmarks. +0.033s ... 0.588s
#18 composed SQL query for gamebenchmarks +0s ... 0.588s
#19 got data and put it in $dataArray +0.032s ... 0.62s
#20 benchmarks composed for output. +0.102s ... 0.722s
#21 calculated avg scores. +0s ... 0.722s
#22 return log +0.003s ... 0.725s
Please share our article, every link counts!
Redaktion, 2017-09- 8 (Update: 2023-07- 1)
 Deutsch
 English
 Español
 Français
 Italiano
 Nederlands
 Polski
 Português
 Русский
 Türkçe
 Svenska
 Chinese
 Magyar